UNITED STATES
SECURITIES AND EXCHANGE COMMISSION
Washington, D.C. 20549
FORM N-CSR
CERTIFIED SHAREHOLDER REPORT OF REGISTERED
MANAGEMENT INVESTMENT COMPANIES
Investment Company Act file number: 811-03980
Morgan Stanley Institutional Fund Trust
(Exact name of registrant as specified in charter)
| 522 Fifth Avenue, New York, New York | | 10036 |
| (Address of principal executive offices) | | (Zip code) |
John H. Gernon
522 Fifth Avenue, New York, New York 10036
(Name and address of agent for service)
Registrant's telephone number, including area code: 212-762-1886
Date of fiscal year end: September 30,
Date of reporting period: September 30, 2023
Item 1 - Report to Shareholders

Morgan Stanley Institutional Fund Trust
Core Plus Fixed Income Portfolio
Annual Report
September 30, 2023

Morgan Stanley Institutional Fund Trust
Annual Report — September 30, 2023
Table of Contents (unaudited)
Shareholders' Letter | | | 2 | | |
Expense Example | | | 3 | | |
Investment Overview | | | 4 | | |
Portfolio of Investments | | | 7 | | |
Statement of Assets and Liabilities | | | 16 | | |
Statement of Operations | | | 18 | | |
Statements of Changes in Net Assets | | | 19 | | |
Financial Highlights | | | 21 | | |
Notes to Financial Statements | | | 26 | | |
Report of Independent Registered Public Accounting Firm | | | 38 | | |
Investment Advisory Agreement Approval | | | 39 | | |
Liquidity Risk Management Program | | | 41 | | |
Important Notices | | | 42 | | |
Federal Tax Notice | | | 43 | | |
U.S. Customer Privacy Notice | | | 44 | | |
Trustees and Officers Information | | | 47 | | |
This report is authorized for distribution only when preceded or accompanied by a prospectus or summary prospectus of the applicable Fund of the Morgan Stanley Institutional Fund Trust. To receive a prospectus and/or statement of additional information ("SAI"), which contains more complete information such as investment objectives, charges, expenses, policies for voting proxies, risk considerations and describes in detail each of the Fund's investment policies to the prospective investor, please call toll free 1 (800) 869-6397. Please read the prospectuses carefully before you invest or send money.
Additionally, you can access information about the Fund, including performance, characteristics and investment team commentary through Morgan Stanley Investment Management's website: www.morganstanley.com/im.
Market forecasts provided in this report may not necessarily come to pass. There is no guarantee that any sectors mentioned will continue to perform as discussed herein or that securities in such sectors will be held by the Fund in the future. There is no assurance that a fund will achieve its investment objective. Funds are subject to market risk, which is the possibility that market values of securities owned by the Fund will decline and, therefore, the value of the Fund's shares may be less than what you paid for them. Accordingly, you can lose money investing in this Fund. Please see the prospectus for more complete information on investment risks.
1
Morgan Stanley Institutional Fund Trust
Annual Report — September 30, 2023
Shareholders' Letter (unaudited)
Dear Shareholders,
We are pleased to provide this Annual Report, in which you will learn how your investment in Core Plus Fixed Income Portfolio (the "Fund") performed during the latest twelve-month period.
Morgan Stanley Investment Management is a client-centric, investor-led organization. Our global presence, intellectual capital, and breadth of products and services enable us to partner with investors to meet the evolving challenges of today's financial markets. We aim to deliver superior investment service and to empower our clients to make the informed decisions that help them reach their investment goals.
As always, we thank you for selecting Morgan Stanley Investment Management, and look forward to working with you in the months and years ahead.
Sincerely,

John H. Gernon
President and Principal Executive Officer
October 2023
2
Morgan Stanley Institutional Fund Trust
Annual Report — September 30, 2023
Expense Example (unaudited)
Core Plus Fixed Income Portfolio
As a shareholder of the Fund, you may incur two types of costs: (1) transactional costs, including sales charge (loads) on purchase payments; and (2) ongoing costs, which may include advisory fees, administration fees, distribution and shareholder services fees; and other Fund expenses. This example is intended to help you understand your ongoing costs (in dollars) of investing in the Fund and to compare these costs with the ongoing costs of investing in other mutual funds.
This example is based on an investment of $1,000 invested at the beginning of the six-month period ended September 30, 2023 and held for the entire six-month period.
Actual Expenses
The table below provides information about actual account values and actual expenses. You may use the information in this table, together with the amount you invested, to estimate the expenses that you paid over the period. Simply divide your account value by $1,000 (for example, an $8,600 account value divided by $1,000 = 8.6), then multiply the result by the number in the table under the heading entitled "Actual Expenses Paid During Period" to estimate the expenses you paid on your account during this period.
Hypothetical Example for Comparison Purposes
The table below provides information about hypothetical account values and hypothetical expenses based on the Fund's actual expense ratio and an assumed rate of return of 5% per year before expenses, which is not the Fund's actual return. The hypothetical account values and expenses may not be used to estimate the actual ending account balance or expenses you paid for the period. You may use this information to compare the ongoing costs of investing in the Fund and other funds. To do so, compare this 5% hypothetical example with the 5% hypothetical examples that appear in the shareholder reports of the other funds.
Please note that the expenses shown in the table are meant to highlight your ongoing costs only and do not reflect any transactional costs, such as sales charges (loads, if applicable). Therefore, the information for each class in the table is useful in comparing ongoing costs only, and will not help you determine the relative total costs of owning different funds. In addition, if these transactional costs were included, your costs would have been higher.
| | | Beginning
Account
Value
4/1/23 | | Actual Ending
Account
Value
9/30/23 | | Hypothetical
Ending Account
Value | | Actual
Expenses
Paid
During
Period* | | Hypothetical
Expenses Paid
During Period* | | Net
Expense
Ratio
During
Period** | |
Core Plus Fixed Income Portfolio Class I | | $ | 1,000.00 | | | $ | 968.30 | | | $ | 1,023.06 | | | $ | 1.97 | | | $ | 2.03 | | | | 0.40 | % | |
Core Plus Fixed Income Portfolio Class A | | | 1,000.00 | | | | 965.80 | | | | 1,021.36 | | | | 3.65 | | | | 3.75 | | | | 0.74 | | |
Core Plus Fixed Income Portfolio Class L | | | 1,000.00 | | | | 964.40 | | | | 1,020.06 | | | | 4.92 | | | | 5.06 | | | | 1.00 | | |
Core Plus Fixed Income Portfolio Class C | | | 1,000.00 | | | | 962.90 | | | | 1,017.75 | | | | 7.18 | | | | 7.39 | | | | 1.46 | | |
Core Plus Fixed Income Portfolio Class R6 | | | 1,000.00 | | | | 968.50 | | | | 1,023.31 | | | | 1.73 | | | | 1.78 | | | | 0.35 | | |
* Expenses are calculated using each Fund Class' annualized net expense ratio (as disclosed), multiplied by the average account value over the period and multiplied by 183/365 (to reflect the most recent one-half year period).
** Annualized.
3
Morgan Stanley Institutional Fund Trust
Annual Report — September 30, 2023
Investment Overview (unaudited)
Core Plus Fixed Income Portfolio
The Fund seeks above-average total return over a market cycle of three to five years.
Performance
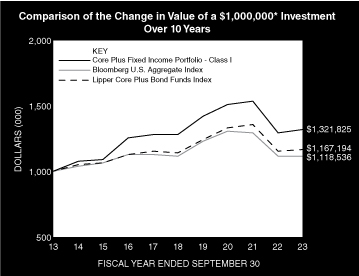
For the fiscal year ended September 30, 2023, the Fund's Class I shares had a total return based on net asset value and reinvestment of distributions per share of 2.03%, net of fees. The Fund's Class I shares outperformed against the Fund's benchmark, the Bloomberg U.S. Aggregate Index(i) (the "Index"), which returned 0.64%.
Factors Affecting Performance
• Government bond yields rose over the period in the U.S. and throughout the world as central banks maintained hawkish positions in their fight against inflation. "Higher for longer" rhetoric was accompanied by recession fears, creating heightened levels of uncertainty in the markets. The portfolio's flat to mildly overweight position in U.S. duration detracted from relative performance, whereas the portfolio's exposure in the euro area, the U.K. and Australia contributed to relative performance. The portfolio's rates positioning in emerging markets (South Africa, Dominican Republic and Indonesia) also contributed to relative performance, as did the portfolio's overweight to emerging markets government-related debt.
• Over the period, the portfolio's investment grade corporate bond positioning contributed to relative performance, as did the convertible bond allocation.
• Overall securitized sector positioning contributed to relative performance during the period amid an increasingly challenging and volatile market. The overweight positioning to asset-backed securities (ABS) was the main contributor. The out-of-Index allocation to non-agency residential mortgage-backed securities (RMBS) and overweight to commercial mortgage-backed securities (CMBS) also contributed to relative performance. The Fund's agency RMBS underweight also helped relative performance as they also underperformed similar-duration Treasuries.
• Currency positioning was mostly flat in terms of relative performance impact, with the long positions in New Zealand dollar and Norwegian krone detracting marginally while the long positions in Mexican peso and Brazilian real contributed on the margin.
Management Strategies
• We believe a reasonable explanation for the market volatility seen in the past few months of the reporting period goes as follows: U.S. economic growth has been accelerating in 2023, which surprised analysts; the U.S. budget situation looks bad, sending more and more U.S. Treasuries into the market at the same time that the Federal Reserve (Fed) is shrinking its balance sheet; and the Fed has been adamant that the inflation game has not been won, so markets should expect the Fed to keep rates unchanged (at the September 2023 Federal Open Market Committee meeting, the Fed eliminated several rate cuts from its 2024 forecasts). In other words, rates would be kept higher for longer; market positioning seems to be skewed toward long interest-rate risk, making bonds vulnerable to disappointing news; and lastly, the coup de grace is that the U.S. yield curve has been highly inverted (meaning that yields on shorter-maturity U.S. Treasury bonds have been higher than yields on longer-maturity U.S. Treasury bonds), making longer-maturity bonds less attractive than shorter-maturity bonds. Add it all up, and you have a good cumulative narrative as to why longer-term yields rose in this period. Importantly, we believe that while the velocity of the Treasury market sell-off looks extreme, the end point — a U.S. Treasury 10-year yield ending September 2023 at 4.57%(ii) — does not.
• One potential casualty of higher yields, wider credit spreads and softer equity prices is the economy, particularly in the U.S. Until September 2023, the probability of a "soft landing" grew as falling inflation, stable unemployment and reasonable growth looked increasingly feasible. However, we believe that the rise in yields on the back of
(i) "Bloomberg®" and the Bloomberg Index/Indices used are service marks of Bloomberg Finance L.P. and its affiliates, and have been licensed for use for certain purposes by Morgan Stanley Investment Management (MSIM). Bloomberg is not affiliated with MSIM, does not approve, endorse, review, or recommend any product, and does not guarantee the timeliness, accurateness, or completeness of any data or information relating to any product.
(ii) Source: Bloomberg L.P. Data as of September 30, 2023.
4
Morgan Stanley Institutional Fund Trust
Annual Report — September 30, 2023
Investment Overview (unaudited) (cont'd)
Core Plus Fixed Income Portfolio
increased confidence the Fed would not lower rates as much and as soon as expected — resulting in a meaningful rise in real interest rates — increases the chances of a harder landing and possibly a recession. While we believe it is far too early to assign this as the most likely scenario given what we currently know about economic activity, credit and equity markets have had to price in this higher probability, resulting in poor performance toward the end of the reporting period. We are also concerned about the ability of higher-risk assets to outperform in an era of inverted yield curves and high cash rates. We believe that the solid fundamentals we have witnessed in the year-to-date through September 2023 (low default rates, more credit rating upgrades than downgrades, etc.) could easily begin to deteriorate over the months ahead. We therefore remain cautious about maintaining anything above a modestly long position in lower-quality fixed income. We believe that selectivity will remain of paramount importance. Avoiding defaults and blow-ups will eventually be key as higher rates and refinancing risks feed into corporate performance and outlooks. The high yields on offer will help blunt underperformance if fundamentals do deteriorate, in our view.
• Within securitized assets, we continue to favor shorter-maturity securitized credit (RMBS, ABS, selected CMBS) as offering the best opportunities in fixed income. That said, the outlook has modestly deteriorated as household balance sheets come under more pressure and excess savings run down. We are trying to take advantage of higher yields on higher quality issuers to achieve our target returns, rather than venturing down the risk/rating spectrum. Our favorite category of securitized credit remains non-agency residential mortgages, despite challenging home affordability. Somewhat surprisingly, U.S. housing looks like it may have bottomed out, with prices rising once again.
• During the period, economic growth outside the U.S. has been much less impressive, with Europe and China flirting with recessionary conditions. However, that did not stop European and emerging markets bond yields from rising over the third quarter of 2023 (China's yields had essentially not moved at all). If growth outside the U.S. had not been so weak, U.S. yields probably would have moved even higher. While non-U.S. bond markets generally outperformed U.S. Treasuries, absolute
yields were driven higher by the surprising strength of the U.S. economy and the doggedness of the Fed in combating inflation with high rates. Therefore, although we believe most central banks are likely finished hiking rates, we expect we are not finished with the era of high rates, the maintenance of which remains critical to win the war against inflation. At period end, although valuations have improved considerably, we are not yet ready to declare they have peaked and remain cautious in interest rate positioning in portfolio. While we believe growth fundamentals are worse outside the U.S. (except ironically perhaps for Japan), we do not think non-U.S. developed market government bonds are much more attractive than U.S. Treasuries. There is a reasonable probability that growth dynamics are in the process of bottoming in Europe and Asia, and could turn up next year at the very time the surge in real yields slows the U.S. economy in our view. As such, at period end, we were fairly neutral on developed market government markets on a relative basis. We did think selective emerging market bond markets look attractive, but that attractiveness has been undermined by the strong U.S. economy, hawkish Fed and rising yields. At period end, we believed that selectivity remains the name of the game and patience is necessary to realize value in many of these markets while the U.S. economy and U.S. dollar outperform.
5
Morgan Stanley Institutional Fund Trust
Annual Report — September 30, 2023
Investment Overview (unaudited) (cont'd)
Core Plus Fixed Income Portfolio
* Minimum Investment
In accordance with SEC regulations, the Fund's performance shown assumes that all recurring fees (including management fees) were deducted and all dividends and distributions were reinvested. The performance of Class A, Class L, Class C and Class R6 shares will vary from the performance of Class I shares based upon their different inception dates and will be negatively impacted by additional fees assessed to those classes (where applicable).
Performance Compared to the Bloomberg U.S. Aggregate Index(1) and the Lipper Core Plus Bond Funds Index(2)
| | | Period Ended September 30, 2023
Total Returns(3) | |
| | | | | Average Annual | |
| | | One
Year | | Five
Years | | Ten
Years | | Since
Inception(9) | |
Fund — Class I Shares
w/o sales charges(4) | | | 2.03 | % | | | 0.61 | % | | | 2.83 | % | | | 6.23 | % | |
Fund — Class A Shares
w/o sales charges(5) | | | 1.59 | | | | 0.26 | | | | 2.47 | | | | 3.83 | | |
Fund — Class A Shares
with maximum 3.25%
sales charges(5) | | | –1.73 | | | | –0.39 | | | | 2.13 | | | | 3.70 | | |
Fund — Class L Shares
w/o sales charges(6) | | | 1.30 | | | | –0.02 | | | | 2.21 | | | | 2.24 | | |
Fund — Class C Shares
w/o sales charges(7) | | | 0.84 | | | | –0.44 | | | | — | | | | 1.07 | | |
Fund — Class C Shares
with maximum 1.00%
deferred sales charges(7) | | | –0.12 | | | | –0.44 | | | | — | | | | 1.07 | | |
Fund — Class R6 Shares
w/o sales charges(8) | | | 1.97 | | | | 0.64 | | | | — | | | | 0.71 | | |
Bloomberg U.S. Aggregate Index | | | 0.64 | | | | 0.10 | | | | 1.13 | | | | 5.91 | | |
Lipper Core Plus Bond Funds Index | | | 1.46 | | | | 0.49 | | | | 1.56 | | | | — | | |
Performance data quoted represents past performance, which is no guarantee of future results, and current performance may be lower or higher than the figures shown. Performance assumes that all dividends and distributions, if any, were reinvested. For the most recent month-end performance figures, please visit www.morganstanley.com/im. Investment returns and principal value will fluctuate so that Fund shares, when redeemed, may be worth more or less than their original cost. Total returns do not reflect the deduction of taxes that a shareholder would pay on Fund distributions or the redemption of Fund shares. Performance of share classes will vary due to differences in sales charges and expenses. The Fund returns are calculated based on the net asset value as of the last business day of the period.
(1) The Bloomberg U.S. Aggregate Index tracks the performance of U.S. government agency and Treasury securities, investment-grade corporate debt securities, agency mortgage-backed securities, asset-backed securities and commercial mortgage-backed securities. The Index is unmanaged and its returns do not include any sales charges or fees. Such costs would lower performance. It is not possible to invest directly in an index.
(2) The Lipper Core Plus Bond Funds Index is an equally weighted performance index of the largest qualifying funds (based on net assets) in the Lipper Core Plus Bond Funds classification. The Index, which is adjusted for capital gains distributions and income dividends, is unmanaged and should not be considered an investment. There are currently 30 funds represented in this Index. As of the date of this report, the Fund was in the Lipper Core Plus Bond Funds classification.
(3) Total returns for the Fund reflect expenses waived and/or reimbursed, if applicable, by the Adviser. Without such waivers and/or reimbursements, total returns would have been lower.
(4) Commenced operations on November 14, 1984.
(5) Commenced offering on November 7, 1996.
(6) Commenced offering on April 27, 2012.
(7) Commenced offering on April 30, 2015. Class C shares will generally convert to Class A shares approximately eight years after the end of the calendar month in which the shares were purchased. Performance for periods greater than eight years reflects this conversion (beginning April 2023).
(8) Commenced offering on June 15, 2018.
(9) For comparative purposes, average annual since inception returns listed for the Indexes refer to the inception date of Class I of the Fund, not the inception of the Indexes.
6
Morgan Stanley Institutional Fund Trust
Annual Report — September 30, 2023
Portfolio of Investments
Core Plus Fixed Income Portfolio
| | | Face
Amount
(000) | | Value
(000) | |
Fixed Income Securities (96.9%) | |
Agency Fixed Rate Mortgages (19.7%) | |
Federal Home Loan Mortgage Corporation, | |
Conventional Pools: | |
3.50%, 8/1/49 | | $ | 151 | | | $ | 130 | | |
4.00%, 4/1/49 - 11/1/49 | | | 488 | | | | 438 | | |
4.50%, 2/1/49 | | | 294 | | | | 274 | | |
Gold Pools: | |
3.50%, 1/1/44 - 4/1/49 | | | 742 | | | | 655 | | |
4.00%, 6/1/44 - 1/1/48 | | | 279 | | | | 255 | | |
5.41%, 7/1/37 - 8/1/37 | | | 10 | | | | 9 | | |
5.44%, 1/1/37 - 2/1/38 | | | 40 | | | | 36 | | |
5.46%, 8/1/37 - 1/1/38 | | | 26 | | | | 25 | | |
5.50%, 8/1/37 - 11/1/37 | | | 39 | | | | 37 | | |
5.62%, 12/1/36 - 8/1/37 | | | 43 | | | | 41 | | |
6.00%, 10/1/36 - 8/1/38 | | | 36 | | | | 37 | | |
6.50%, 12/1/25 - 8/1/33 | | | 45 | | | | 46 | | |
7.00%, 6/1/28 - 11/1/31 | | | 13 | | | | 13 | | |
Federal National Mortgage Association, | |
Conventional Pools: | |
3.00%, 9/1/46 - 1/1/50 | | | 2,646 | | | | 2,206 | | |
3.50%, 8/1/45 - 1/1/50 | | | 2,786 | | | | 2,419 | | |
4.00%, 11/1/41 - 9/1/49 | | | 2,427 | | | | 2,211 | | |
4.50%, 3/1/41 - 8/1/49 | | | 946 | | | | 886 | | |
5.00%, 3/1/41 | | | 76 | | | | 75 | | |
5.50%, 6/1/35 - 1/1/37 | | | 27 | | | | 27 | | |
5.62%, 12/1/36 | | | 17 | | | | 16 | | |
6.50%, 4/1/24 - 1/1/34 | | | 356 | | | | 361 | | |
7.00%, 5/1/28 - 12/1/33 | | | 53 | | | | 53 | | |
9.50%, 4/1/30 | | | 8 | | | | 8 | | |
October TBA | |
3.50%, 10/1/53 (a) | | | 24,675 | | | | 21,224 | | |
4.00%, 10/1/53 (a) | | | 7,350 | | | | 6,548 | | |
4.50%, 10/1/52 (a) | | | 24,850 | | | | 22,828 | | |
5.00%, 10/1/53 (a) | | | 9,050 | | | | 8,543 | | |
5.50%, 10/1/53 (a) | | | 32,700 | | | | 31,617 | | |
6.00%, 10/1/53 (a) | | | 5,550 | | | | 5,480 | | |
Government National Mortgage Association, | |
Various Pools: | |
3.50%, 11/20/40 - 7/20/49 | | | 735 | | | | 658 | | |
4.00%, 8/20/41 - 11/20/49 | | | 1,942 | | | | 1,773 | | |
4.50%, 4/20/49 - 7/20/49 | | | 178 | | | | 164 | | |
5.00%, 12/20/48 | | | 23 | | | | 21 | | |
6.50%, 5/15/40 | | | 187 | | | | 191 | | |
| | | | 109,305 | | |
Asset-Backed Securities (9.4%) | |
AASET U.S. Ltd., | |
4.45%, 11/18/38 (b) | | | 1,893 | | | | 1,686 | | |
ACHV ABS Trust, | |
Series 2023-3PL Class B | |
7.17%, 8/19/30 (b) | | | 200 | | | | 201 | | |
| | | Face
Amount
(000) | | Value
(000) | |
Allegro CLO XI Ltd., | |
3 Month Term SOFR + 1.65%,
6.97%, 1/19/33 (b)(c) | | $ | 2,150 | | | $ | 2,151 | | |
American Homes 4 Rent Trust, | |
6.07%, 10/17/52 (b) | | | 1,001 | | | | 981 | | |
Aqua Finance Trust, | |
3.47%, 7/16/40 (b) | | | 734 | | | | 674 | | |
BCMSC Trust, | |
7.51%, 1/15/29 (c) | | | 1,157 | | | | 1,100 | | |
Blackbird Capital Aircraft, | |
2.44%, 7/15/46 (b) | | | 1,229 | | | | 1,051 | | |
Blackbird Capital Aircraft Lease
Securitization Ltd., | |
5.68%, 12/16/41 (b) | | | 694 | | | | 501 | | |
Cascade MH Asset Trust, | |
4.00%, 11/25/44 (b)(c) | | | 1,036 | | | | 986 | | |
Cologix Data Centers US Issuer LLC, | |
3.30%, 12/26/51 (b) | | CAD | 2,125 | | | | 1,875 | | |
4.94%, 1/25/52 (b) | | $ | 3,600 | | | | 2,385 | | |
Conn's Receivables Funding LLC, | |
9.52%, 12/15/26 (b) | | | 2,654 | | | | 2,665 | | |
Series 2023-A Class B | |
10.00%, 1/17/28 (b) | | | 370 | | | | 371 | | |
ContiMortgage Home Equity Loan Trust, | |
8.10%, 8/15/25 | | | 18 | | | | 14 | | |
Diamond Resorts Owner Trust, | |
4.02%, 2/20/32 (b) | | | 266 | | | | 266 | | |
ELFI Graduate Loan Program LLC, | |
4.51%, 8/26/47 (b) | | | 1,402 | | | | 1,315 | | |
Falcon Aerospace Ltd., | |
3.60%, 9/15/39 (b) | | | 1,378 | | | | 1,254 | | |
FortiFi, | |
Series 2023-1A Class A | |
6.23%, 9/20/59 (b) | | | 3,007 | | | | 2,878 | | |
GAIA Aviation Ltd., | |
7.00%, 12/15/44 (b) | | | 1,558 | | | | 836 | | |
GCI Funding I LLC, | |
2.82%, 10/18/45 (b) | | | 653 | | | | 571 | | |
Golub Capital Partners ABS Funding Ltd., | |
2.77%, 4/20/29 (b) | | | 875 | | | | 816 | | |
Class A2 | |
3.21%, 1/22/29 (b) | | | 2,280 | | | | 2,184 | | |
Goodgreen Trust, | |
5.53%, 4/15/55 (b) | | | 1,738 | | | | 1,427 | | |
5.74%, 10/15/56 (b) | | | 2,521 | | | | 2,113 | | |
JOL Air Ltd., | |
4.95%, 4/15/44 (b) | | | 231 | | | | 179 | | |
LUNAR Aircraft Ltd., | |
3.38%, 2/15/45 (b) | | | 347 | | | | 301 | | |
MACH 1 Cayman Ltd., | |
3.47%, 10/15/39 (b) | | | 756 | | | | 647 | | |
The accompanying notes are an integral part of the financial statements.
7
Morgan Stanley Institutional Fund Trust
Annual Report — September 30, 2023
Portfolio of Investments (cont'd)
Core Plus Fixed Income Portfolio
| | | Face
Amount
(000) | | Value
(000) | |
Asset-Backed Securities (cont'd) | |
MAPS Ltd., | |
4.21%, 5/15/43 (b) | | $ | 276 | | | $ | 248 | | |
Marlette Funding Trust, | |
Series 2023-3A Class B | |
6.71%, 9/15/33 (b) | | | 2,300 | | | | 2,297 | | |
METAL LLC, | |
4.58%, 10/15/42 (b) | | | 540 | | | | 333 | | |
Mosaic Solar Loan Trust, | |
2.10%, 4/20/46 (b) | | | 503 | | | | 425 | | |
Newtek Small Business Loan Trust, | |
Daily U.S. Prime Rate - 0.55%,
7.95%, 2/25/44 (b)(c) | | | 204 | | | | 202 | | |
Daily U.S. Prime Rate - 0.50%,
8.00%, 7/25/50 (b)(c) | | | 1,014 | | | | 1,013 | | |
Oxford Finance Funding LLC, | |
5.44%, 2/15/27 (b) | | | 95 | | | | 94 | | |
PMT Issuer Trust — FMSR, | |
1 Month USD LIBOR + 3.00%,
8.43%, 3/25/26 (b)(c) | | | 3,900 | | | | 3,808 | | |
SOFR30A + 4.19%,
9.51%, 6/25/27 (b)(c) | | | 2,700 | | | | 2,707 | | |
PRET 2021-NPL6 LLC, | |
2.49%, 7/25/51 (b) | | | 1,018 | | | | 971 | | |
Progress Residential Trust, | |
2.31%, 5/17/38 (b) | | | 650 | | | | 577 | | |
Raptor Aircraft Finance I LLC, | |
4.21%, 8/23/44 (b) | | | 1,966 | | | | 1,577 | | |
ReadyCap Lending Small Business Loan Trust, | |
Daily U.S. Prime Rate - 0.50%,
8.00%, 12/27/44 (b)(c) | | | 274 | | | | 264 | | |
Republic Finance Issuance Trust, | |
3.54%, 11/20/30 (b) | | | 1,385 | | | | 1,306 | | |
Retained Vantage Data Centers Issuer LLC, | |
Series 2023-1A Class A2A | |
5.00%, 9/15/48 (b) | | | 2,050 | | | | 1,852 | | |
Start II Ltd., | |
4.09%, 3/15/44 (b) | | | 248 | | | | 220 | | |
Start Ltd., | |
4.09%, 5/15/43 (b) | | | 2,351 | | | | 2,056 | | |
Sunbird Engine Finance LLC, | |
3.67%, 2/15/45 (b) | | | 831 | | | | 702 | | |
| | | | 52,080 | | |
Collateralized Mortgage Obligations — Agency Collateral Series (0.4%) | |
Federal Home Loan Mortgage Corp., Multifamily
Structured Pass-Through Certificates, | |
IO | |
4.48%, 11/25/55 (c) | | | 7,625 | | | | 2,098 | | |
Federal Home Loan Mortgage Corporation, | |
IO REMIC | |
5.89% - SOFR30A, 0.57%, 11/15/43 (d) | | | 375 | | | | 22 | | |
Federal National Mortgage Association, | |
IO PAC REMIC | |
8.00%, 9/18/27 | | | 19 | | | | 2 | | |
| | | Face
Amount
(000) | | Value
(000) | |
IO STRIPS | |
6.50%, 9/25/29 - 12/25/29 | | $ | 102 | | | $ | 11 | | |
8.00%, 4/25/24 | | | — | @ | | | — | @ | |
8.50%, 10/25/25 | | | 3 | | | | — | @ | |
REMIC | |
7.00%, 9/25/32 | | | 83 | | | | 85 | | |
Government National Mortgage Association, | |
IO | |
5.00%, 2/16/41 | | | 80 | | | | 16 | | |
| | | | 2,234 | | |
Commercial Mortgage-Backed Securities (14.6%) | |
BANK 2019-BNK21, | |
IO | |
0.96%, 10/17/52 (c) | | | 14,029 | | | | 538 | | |
BANK 2020-BNK30, | |
3.02%, 12/15/53 (c) | | | 4,200 | | | | 2,214 | | |
Benchmark Mortgage Trust, | |
3.76%, 7/15/53 (b) | | | 2,000 | | | | 1,814 | | |
IO | |
0.99%, 9/15/48 (b)(c) | | | 31,000 | | | | 693 | | |
| BF Mortgage Trust, | |
1 Month Term SOFR + 1.75%,
7.08%, 12/15/35 (b)(c) | | | 2,500 | | | | 1,863 | | |
| BPR Trust, | |
1 Month Term SOFR + 3.00%,
8.33%, 5/15/39 (b)(c) | | | 3,170 | | | | 3,168 | | |
BXP Trust, | |
1 Month Term SOFR + 3.05%,
8.38%, 11/15/34 (b)(c) | | | 1,150 | | | | 804 | | |
CG-CCRE Commercial Mortgage Trust, | |
1 Month Term SOFR + 1.97%,
7.30%, 11/15/31 (b)(c) | | | 528 | | | | 513 | | |
Citigroup Commercial Mortgage Trust, | |
3.62%, 12/10/41 (b)(c) | | | 1,100 | | | | 712 | | |
IO | |
0.86%, 11/10/48 (c) | | | 2,288 | | | | 26 | | |
1.02%, 9/10/58 (c) | | | 4,138 | | | | 53 | | |
COMM Mortgage Trust, | |
3.51%, 8/15/57 (b)(c) | | | 1,400 | | | | 1,268 | | |
IO | |
0.81%, 10/10/47 (c) | | | 2,388 | | | | 10 | | |
1.07%, 7/15/47 (c) | | | 2,105 | | | | 6 | | |
CSMC Trust, | |
1 Month Term SOFR + 3.61%,
8.95%, 12/15/35 (b)(c) | | | 5,275 | | | | 5,274 | | |
1 Month Term SOFR + 4.08%,
9.42%, 4/15/26 (b)(c) | | | 2,590 | | | | 2,538 | | |
CSWF Corp., | |
1 Month Term SOFR + 1.68%,
7.01%, 6/15/34 (b)(c) | | | 2,680 | | | | 2,242 | | |
DROP Mortgage Trust, | |
1 Month Term SOFR + 1.26%,
6.60%, 10/15/43 (b)(c) | | | 3,525 | | | | 3,300 | | |
The accompanying notes are an integral part of the financial statements.
8
Morgan Stanley Institutional Fund Trust
Annual Report — September 30, 2023
Portfolio of Investments (cont'd)
Core Plus Fixed Income Portfolio
| | | Face
Amount
(000) | | Value
(000) | |
Commercial Mortgage-Backed Securities (cont'd) | |
Federal Home Loan Mortgage Corp., Multifamily
Structured Pass-Through Certificates, | |
IO | |
0.45%, 11/25/27 (c) | | $ | 23,042 | | | $ | 268 | | |
2.72%, 1/25/49 (c) | | | 21,292 | | | | 3,088 | | |
2.74%, 2/25/49 (c) | | | 9,522 | | | | 1,368 | | |
2.82%, 9/25/48 (c) | | | 16,800 | | | | 2,407 | | |
2.83%, 8/25/48 (c) | | | 5,484 | | | | 760 | | |
2.98%, 1/25/49 (c) | | | 7,514 | | | | 1,259 | | |
3.08%, 1/25/32 (c) | | | 5,775 | | | | 1,014 | | |
3.17%, 11/25/36 (c) | | | 4,400 | | | | 1,129 | | |
3.20%, 4/25/39 (c) | | | 3,200 | | | | 802 | | |
3.32%, 5/25/32 (c) | | | 11,220 | | | | 2,177 | | |
3.58%, 10/25/38 (c) | | | 3,500 | | | | 950 | | |
3.69%, 6/25/54 (c) | | | 6,549 | | | | 1,483 | | |
3.92%, 6/25/50 (c) | | | 8,000 | | | | 1,903 | | |
4.29%, 8/25/54 (c) | | | 5,300 | | | | 1,367 | | |
FREMF 2016-KF21 Mortgage Trust, | |
SOFR30A + 5.36%, 10.68%, 7/25/26 (b)(c) | | | 45 | | | | 43 | | |
FREMF 2017-KF27 Mortgage Trust, | |
SOFR30A + 4.36%, 9.78%, 12/25/26 (b)(c) | | | 61 | | | | 59 | | |
GS Mortgage Securities Trust, | |
4.40%, 8/10/46 (b)(c) | | | 500 | | | | 426 | | |
IO | |
0.83%, 9/10/47 (c) | | | 4,249 | | | | 17 | | |
1.35%, 10/10/48 (c) | | | 4,421 | | | | 83 | | |
Highways 2021 PLC, | |
3 Month GBP SONIA + 1.35%,
6.57%, 12/18/31 (b)(c) | | GBP | 2,775 | | | | 3,294 | | |
Jackson Park Trust, | |
3.35%, 10/14/39 (b)(c) | | $ | 1,700 | | | | 1,233 | | |
JP Morgan Chase Commercial Mortgage
Securities Trust, | |
1 Month Term SOFR + 2.56%,
7.90%, 4/15/38 (b)(c) | | | 2,400 | | | | 2,321 | | |
IO | |
0.61%, 4/15/46 (c) | | | 6,956 | | | | 19 | | |
0.71%, 12/15/49 (c) | | | 3,552 | | | | 49 | | |
0.86%, 7/15/47 (c) | | | 3,618 | | | | 1 | | |
JPMBB Commercial Mortgage Securities Trust, | |
4.78%, 4/15/47 (b)(c) | | | 775 | | | | 713 | | |
IO | |
1.09%, 8/15/47 (c) | | | 2,814 | | | | 8 | | |
Last Mile Logistics Pan Euro Finance DAC, | |
3 Month EURIBOR + 1.90%,
5.69%, 8/17/33 (b)(c) | | EUR | 736 | | | | 729 | | |
Manhattan West Mortgage Trust, | |
2.41%, 9/10/39 (b)(c) | | $ | 1,500 | | | | 1,222 | | |
MF1 2021-W10X, | |
1 Month Term SOFR + 2.82%,
8.15%, 12/15/34 (b)(c) | | | 4,350 | | | | 4,035 | | |
MFT Mortgage Trust, | |
3.39%, 8/10/40 (b)(c) | | | 1,000 | | | | 644 | | |
3.59%, 2/10/42 (b)(c) | | | 800 | | | | 421 | | |
| | | Face
Amount
(000) | | Value
(000) | |
MKT 2020-525M Mortgage Trust, | |
3.04%, 2/12/40 (b)(c) | | $ | 1,000 | | | $ | 271 | | |
Natixis Commercial Mortgage Securities Trust, | |
4.27%, 5/15/39 (b)(c) | | | 2,300 | | | | 1,813 | | |
4.46%, 1/15/43 (b)(c) | | | 800 | | | | 631 | | |
1 Month Term SOFR + 2.28%,
7.61%, 7/15/36 (b)(c) | | | 2,300 | | | | 2,028 | | |
Olympic Tower Mortgage Trust, | |
3.57%, 5/10/39 (b) | | | 2,900 | | | | 2,430 | | |
Real Estate Asset Liquidity Trust, | |
IO | |
1.16%, 2/12/31 (b)(c) | | CAD | 31,560 | | | | 879 | | |
SG Commercial Mortgage Securities Trust, | |
3.85%, 3/15/37 (b)(c) | | $ | 1,900 | | | | 1,648 | | |
SLG Office Trust, | |
IO | |
0.26%, 7/15/41 (b)(c) | | | 34,800 | | | | 495 | | |
Taubman Centers Commercial Mortgage Trust, | |
1 Month Term SOFR + 2.19%,
7.52%, 5/15/37 (b)(c) | | | 3,950 | | | | 3,862 | | |
Vita Scientia 2022-1 DAC, | |
3 Month EURIBOR + 2.49%,
6.27%, 8/27/25 (b)(c) | | EUR | 2,125 | | | | 1,919 | | |
VMC Finance 2021-HT1 LLC, | |
1 Month Term SOFR + 1.76%,
7.10%, 1/18/37 (b)(c) | | $ | 2,387 | | | | 2,335 | | |
WFRBS Commercial Mortgage Trust, | |
4.18%, 5/15/45 (b)(c) | | | 425 | | | | 390 | | |
| | | | 81,029 | | |
Corporate Bonds (25.7%) | |
Finance (9.9%) | |
AIB GROUP PLC, | |
6.61%, 9/13/29 (b) | | | 1,000 | | | | 996 | | |
American International Group, Inc., | |
5.13%, 3/27/33 | | | 183 | | | | 170 | | |
Aviation Capital Group LLC, | |
6.38%, 7/15/30 (b) | | | 1,425 | | | | 1,381 | | |
Banco de Credito e Inversiones SA, | |
2.88%, 10/14/31 (b) | | | 2,275 | | | | 1,824 | | |
Banco Santander SA, | |
4.18%, 3/24/28 | | | 1,400 | | | | 1,293 | | |
Bank Hapoalim BM, | |
3.26%, 1/21/32 | | | 2,075 | | | | 1,777 | | |
Bank of America Corp., | |
2.69%, 4/22/32 | | | 3,675 | | | | 2,890 | | |
4.57%, 4/27/33 | | | 3,225 | | | | 2,865 | | |
Bank of Ireland Group PLC, | |
2.03%, 9/30/27 (b) | | | 1,425 | | | | 1,250 | | |
Bank of Montreal, | |
3.09%, 1/10/37 | | | 1,725 | | | | 1,287 | | |
BNP Paribas SA, | |
4.40%, 8/14/28 (b) | | | 1,525 | | | | 1,419 | | |
| BPCE SA, | |
5.15%, 7/21/24 (b) | | | 2,750 | | | | 2,707 | | |
The accompanying notes are an integral part of the financial statements.
9
Morgan Stanley Institutional Fund Trust
Annual Report — September 30, 2023
Portfolio of Investments (cont'd)
Core Plus Fixed Income Portfolio
| | | Face
Amount
(000) | | Value
(000) | |
Finance (cont'd) | |
CaixaBank SA, | |
6.21%, 1/18/29 (b) | | $ | 1,400 | | | $ | 1,371 | | |
Capital One Financial Corp., | |
5.82%, 2/1/34 | | | 1,575 | | | | 1,421 | | |
Centene Corp., | |
2.50%, 3/1/31 | | | 3,050 | | | | 2,347 | | |
Charles Schwab Corp., | |
5.85%, 5/19/34 | | | 1,370 | | | | 1,304 | | |
Citigroup, Inc., | |
3.79%, 3/17/33 | | | 1,275 | | | | 1,064 | | |
Deutsche Bank AG, | |
7.15%, 7/13/27 | | | 1,800 | | | | 1,813 | | |
Extra Space Storage LP, | |
2.40%, 10/15/31 | | | 1,825 | | | | 1,398 | | |
Fifth Third Bancorp, | |
6.34%, 7/27/29 | | | 400 | | | | 395 | | |
Global Atlantic Fin Co., | |
4.70%, 10/15/51 (b) | | | 1,320 | | | | 958 | | |
Grupo Aval Ltd., | |
4.38%, 2/4/30 (b) | | | 561 | | | | 428 | | |
Jefferies Finance LLC/JFIN Co.-Issuer Corp., | |
5.00%, 8/15/28 (b) | | | 1,490 | | | | 1,256 | | |
Jefferies Financial Group, Inc., | |
5.88%, 7/21/28 | | | 975 | | | | 955 | | |
JPMorgan Chase & Co., | |
5.35%, 6/1/34 | | | 3,275 | | | | 3,108 | | |
Macquarie Group Ltd., | |
2.87%, 1/14/33 (b) | | | 1,350 | | | | 1,022 | | |
Metropolitan Life Global Funding I, | |
5.15%, 3/28/33 (b) | | | 1,050 | | | | 995 | | |
Nationwide Building Society, | |
4.30%, 3/8/29 (b) | | | 1,550 | | | | 1,424 | | |
Nordea Bank Abp, | |
5.38%, 9/22/27 (b) | | | 1,200 | | | | 1,173 | | |
Oversea-Chinese Banking Corp. Ltd., | |
1.83%, 9/10/30 (b) | | | 970 | | | | 893 | | |
Rocket Mortgage LLC/Rocket
Mortgage Co-Issuer, Inc., | |
3.88%, 3/1/31 (b) | | | 1,475 | | | | 1,178 | | |
Societe Generale SA, | |
2.63%, 1/22/25 (b) | | | 1,625 | | | | 1,545 | | |
Toronto-Dominion Bank, | |
8.13%, 10/31/82 | | | 1,625 | | | | 1,621 | | |
Truist Financial Corp., | |
5.87%, 6/8/34 | | | 2,025 | | | | 1,907 | | |
U.S. Bancorp, | |
5.84%, 6/12/34 | | | 1,200 | | | | 1,133 | | |
5.85%, 10/21/33 | | | 175 | | | | 166 | | |
UBS Group AG, | |
6.54%, 8/12/33 (b) | | | 1,550 | | | | 1,533 | | |
United Overseas Bank Ltd., | |
3.86%, 10/7/32 (b) | | | 2,950 | | | | 2,712 | | |
| | | | 54,979 | | |
| | | Face
Amount
(000) | | Value
(000) | |
Industrials (13.7%) | |
Apple, Inc., | |
2.95%, 9/11/49 | | $ | 2,200 | | | $ | 1,454 | | |
Ashtead Capital, Inc., | |
5.95%, 10/15/33 (b) | | | 1,850 | | | | 1,758 | | |
AT&T, Inc., | |
3.55%, 9/15/55 | | | 1,635 | | | | 1,002 | | |
3.65%, 6/1/51 | | | 605 | | | | 390 | | |
BAT Capital Corp., | |
2.26%, 3/25/28 | | | 2,000 | | | | 1,693 | | |
Boeing Co., | |
3.25%, 2/1/35 | | | 1,775 | | | | 1,366 | | |
BP Capital Markets PLC, | |
4.88%, 3/22/30 (e) | | | 700 | | | | 628 | | |
Celanese U.S. Holdings LLC, | |
6.17%, 7/15/27 | | | 2,150 | | | | 2,121 | | |
Charter Communications Operating LLC/
Charter Communications Operating Capital, | |
3.50%, 3/1/42 | | | 3,050 | | | | 1,887 | | |
Concentrix Corp., | |
6.60%, 8/2/28 | | | 1,165 | | | | 1,125 | | |
6.65%, 8/2/26 | | | 1,275 | | | | 1,268 | | |
Dick's Sporting Goods, Inc., | |
4.10%, 1/15/52 | | | 2,225 | | | | 1,353 | | |
Duke University, | |
Series 2020 | |
2.83%, 10/1/55 | | | 1,600 | | | | 982 | | |
Enterprise Products Operating LLC, | |
3.30%, 2/15/53 | | | 300 | | | | 196 | | |
3.70%, 1/31/51 | | | 375 | | | | 266 | | |
5.35%, 1/31/33 | | | 1,450 | | | | 1,419 | | |
Ford Motor Co., | |
3.25%, 2/12/32 | | | 1,875 | | | | 1,447 | | |
Foundry JV Holdco LLC, | |
5.88%, 1/25/34 (b) | | | 1,525 | | | | 1,458 | | |
Garda World Security Corp., | |
9.50%, 11/1/27 (b) | | | 925 | | | | 885 | | |
General Motors Co., | |
6.75%, 4/1/46 | | | 925 | | | | 865 | | |
General Motors Financial Co., Inc., | |
5.80%, 6/23/28 | | | 2,825 | | | | 2,761 | | |
Global Partners LP/GLP Finance Corp., | |
7.00%, 8/1/27 | | | 715 | | | | 697 | | |
Grifols SA, | |
2.25%, 11/15/27 | | EUR | 630 | | | | 588 | | |
HCA, Inc., | |
4.63%, 3/15/52 | | $ | 1,550 | | | | 1,165 | | |
Hyundai Capital America, | |
1.80%, 1/10/28 (b) | | | 2,650 | | | | 2,222 | | |
6.10%, 9/21/28 (b) | | | 1,700 | | | | 1,689 | | |
Imperial Brands Finance PLC, | |
3.13%, 7/26/24 (b) | | | 1,000 | | | | 975 | | |
The accompanying notes are an integral part of the financial statements.
10
Morgan Stanley Institutional Fund Trust
Annual Report — September 30, 2023
Portfolio of Investments (cont'd)
Core Plus Fixed Income Portfolio
| | | Face
Amount
(000) | | Value
(000) | |
Industrials (cont'd) | |
Intel Corp., | |
5.70%, 2/10/53 | | $ | 1,025 | | | $ | 962 | | |
JBS USA LUX SA/JBS USA Food Co./JBS
USA Finance, Inc., | |
2.50%, 1/15/27 | | | 1,575 | | | | 1,393 | | |
Johns Hopkins University, | |
Series A | |
2.81%, 1/1/60 | | | 1,170 | | | | 684 | | |
Lowe's Cos., Inc., | |
5.80%, 9/15/62 | | | 325 | | | | 297 | | |
5.85%, 4/1/63 | | | 200 | | | | 184 | | |
Macy's Retail Holdings LLC, | |
5.88%, 3/15/30 (b)(f) | | | 690 | | | | 586 | | |
McAfee Corp., | |
7.38%, 2/15/30 (b) | | | 1,075 | | | | 901 | | |
McLaren Health Care Corp., | |
Series A | |
4.39%, 5/15/48 (f) | | | 1,175 | | | | 930 | | |
Medline Borrower LP, | |
3.88%, 4/1/29 (b) | | | 1,410 | | | | 1,193 | | |
NBN Co. Ltd., | |
2.63%, 5/5/31 (b) | | | 2,400 | | | | 1,938 | | |
Newcastle Coal Infrastructure Group Pty Ltd., | |
4.40%, 9/29/27 (b) | | | 2,542 | | | | 2,288 | | |
NOVA Chemicals Corp., | |
4.25%, 5/15/29 (b)(f) | | | 1,510 | | | | 1,177 | | |
ONEOK, Inc., | |
6.05%, 9/1/33 | | | 1,450 | | | | 1,425 | | |
Ooredoo International Finance Ltd., | |
2.63%, 4/8/31 (b) | | | 1,268 | | | | 1,059 | | |
Oracle Corp., | |
3.60%, 4/1/50 | | | 2,300 | | | | 1,489 | | |
Peloton Interactive, Inc., | |
0.00%, 2/15/26 | | | 1,215 | | | | 920 | | |
Petrobras Global Finance BV, | |
6.50%, 7/3/33 (f) | | | 1,379 | | | | 1,318 | | |
Resorts World Las Vegas LLC/RWLV
Capital, Inc., | |
4.63%, 4/16/29 (b) | | | 1,400 | | | | 1,119 | | |
Rockies Express Pipeline LLC, | |
3.60%, 5/15/25 (b) | | | 925 | | | | 874 | | |
Rogers Communications, Inc., | |
4.55%, 3/15/52 | | | 2,550 | | | | 1,862 | | |
S&P Global, Inc., | |
5.25%, 9/15/33 (b) | | | 1,800 | | | | 1,756 | | |
Seattle Children's Hospital, | |
Series 2021 | |
2.72%, 10/1/50 | | | 2,750 | | | | 1,621 | | |
Silgan Holdings, Inc., | |
1.40%, 4/1/26 (b) | | | 2,150 | | | | 1,909 | | |
Sirius XM Radio, Inc., | |
3.88%, 9/1/31 (b) | | | 790 | | | | 599 | | |
| | | Face
Amount
(000) | | Value
(000) | |
Splunk, Inc., | |
1.13%, 6/15/27 | | $ | 1,075 | | | $ | 1,020 | | |
Spotify USA, Inc., | |
0.00%, 3/15/26 | | | 1,190 | | | | 1,016 | | |
Standard Industries, Inc., | |
2.25%, 11/21/26 (b) | | EUR | 575 | | | | 538 | | |
Syngenta Finance NV, | |
4.89%, 4/24/25 (b) | | $ | 975 | | | | 951 | | |
Var Energi ASA, | |
7.50%, 1/15/28 (b) | | | 1,025 | | | | 1,054 | | |
Verizon Communications, Inc., | |
1.75%, 1/20/31 | | | 4,100 | | | | 3,091 | | |
VICI Properties LP/VICI Note Co., Inc., | |
5.75%, 2/1/27 (b) | | | 1,025 | | | | 993 | | |
Vontier Corp., | |
2.40%, 4/1/28 | | | 2,700 | | | | 2,256 | | |
Warnermedia Holdings, Inc., | |
5.05%, 3/15/42 | | | 925 | | | | 716 | | |
5.39%, 3/15/62 | | | 1,390 | | | | 1,028 | | |
Williams Cos., Inc., | |
5.30%, 8/15/28 | | | 1,425 | | | | 1,395 | | |
| | | | 76,202 | | |
Utilities (2.1%) | |
Enel Finance America LLC, | |
2.88%, 7/12/41 (b) | | | 2,307 | | | | 1,378 | | |
Eversource Energy, | |
5.13%, 5/15/33 | | | 1,463 | | | | 1,362 | | |
Fells Point Funding Trust, | |
3.05%, 1/31/27 (b) | | | 2,275 | | | | 2,064 | | |
Jersey Central Power & Light Co., | |
2.75%, 3/1/32 (b) | | | 1,400 | | | | 1,098 | | |
Mississippi Power Co., | |
3.95%, 3/30/28 | | | 2,325 | | | | 2,170 | | |
Northern States Power Co., | |
2.90%, 3/1/50 | | | 1,400 | | | | 860 | | |
Pacific Gas & Electric Co., | |
4.95%, 7/1/50 | | | 1,625 | | | | 1,213 | | |
Virginia Electric & Power Co., | |
2.95%, 11/15/51 | | | 2,275 | | | | 1,356 | | |
| | | | 11,501 | | |
| | | | 142,682 | | |
Mortgages — Other (14.4%) | |
510 Asset Backed 2021-NPL1 Trust, | |
2.24%, 6/25/61 (b) | | | 1,417 | | | | 1,327 | | |
Adjustable Rate Mortgage Trust, | |
5.83%, 6/25/35 (c) | | | 32 | | | | 31 | | |
Ajax Mortgage Loan Trust, | |
1.70%, 5/25/59 (b)(c) | | | 1,274 | | | | 1,139 | | |
2.35%, 9/25/65 (b)(c) | | | 725 | | | | 533 | | |
Banc of America Alternative Loan Trust, | |
1 Month Term SOFR + 0.76%,
6.00%, 7/25/46 (c) | | | 92 | | | | 71 | | |
6.36%, 10/25/36 | | | 392 | | | | 110 | | |
The accompanying notes are an integral part of the financial statements.
11
Morgan Stanley Institutional Fund Trust
Annual Report — September 30, 2023
Portfolio of Investments (cont'd)
Core Plus Fixed Income Portfolio
| | | Face
Amount
(000) | | Value
(000) | |
Mortgages — Other (cont'd) | |
Banc of America Funding Trust, | |
5.25%, 7/25/37 | | $ | 11 | | | $ | 10 | | |
BBCMS Mortgage Trust, | |
IO | |
0.64%, 12/15/55 (c) | | | 18,415 | | | | 673 | | |
Bear Stearns ARM Trust, | |
4.02%, 2/25/34 (c) | | | 372 | | | | 340 | | |
BRAVO Residential Funding Trust, | |
2.00%, 5/25/59 (b)(c) | | | 1,486 | | | | 1,314 | | |
Brean Asset Backed Securities Trust, | |
1.40%, 10/25/63 (b)(c) | | | 2,089 | | | | 1,751 | | |
1.75%, 10/25/61 (b)(c) | | | 2,200 | | | | 1,896 | | |
BX Commercial Mortgage Trust, | |
Class A | |
1 Month Term SOFR + 2.28%,
7.61%, 6/15/40 (b)(c) | | | 2,050 | | | | 2,052 | | |
Cascade Funding Mortgage Trust, | |
3.73%, 6/25/36 (b)(c) | | | 3,825 | | | | 3,538 | | |
4.00%, 10/25/68 (b)(c) | | | 2,057 | | | | 1,957 | | |
| CFMT 2022-HB8 LLC, | |
3.75%, 4/25/25 (b)(c) | | | 2,650 | | | | 2,450 | | |
| CFMT LLC, | |
1.94%, 9/25/50 (b)(c) | | | 2,292 | | | | 2,148 | | |
2.91%, 2/25/31 (b)(c) | | | 3,800 | | | | 3,535 | | |
3.25%, 9/25/37 (b)(c) | | | 1,840 | | | | 1,434 | | |
ChaseFlex Trust, | |
6.00%, 2/25/37 | | | 591 | | | | 232 | | |
COLT 2021-RPL1 Trust, | |
1.67%, 9/25/61 (b)(c) | | | 1,260 | | | | 1,083 | | |
Countrywide Alternative Loan Trust, | |
1 Month Term SOFR + 0.47%,
5.79%, 5/25/47 (c) | | | 65 | | | | 58 | | |
E-MAC NL 2004-I BV, | |
3 Month EURIBOR + 0.18%,
5.97%, 7/25/36 (c) | | EUR | 277 | | | | 270 | | |
Eurosail-NL 2007-2 BV, | |
3 Month EURIBOR + 1.80%,
5.46%, 10/17/40 (c) | | | 700 | | | | 730 | | |
Federal Home Loan Mortgage Corp.
Whole Loan Securities Trust, | |
3.00%, 7/25/46 - 5/25/47 | | $ | 935 | | | | 786 | | |
3.50%, 5/25/45 - 5/25/47 | | | 349 | | | | 295 | | |
4.00%, 5/25/45 | | | 8 | | | | 6 | | |
FMC GMSR Issuer Trust, | |
7.90%, 7/25/27 (b) | | | 2,675 | | | | 2,640 | | |
GCAT 2022-NQM3 Trust, | |
4.35%, 4/25/67 (b)(c) | | | 4,343 | | | | 4,044 | | |
Headlands Residential 2021-RPL1 LLC, | |
2.49%, 9/25/26 (b)(c) | | | 3,320 | | | | 3,190 | | |
IM Pastor 3 FTH, | |
3 Month EURIBOR + 0.14%,
4.07%, 3/22/43 (c) | | EUR | 271 | | | | 251 | | |
| | | Face
Amount
(000) | | Value
(000) | |
Imperial Fund Mortgage Trust, | |
2.49%, 2/25/67 (b)(c) | | $ | 2,403 | | | $ | 2,062 | | |
JP Morgan Mortgage Trust, | |
4.40%, 6/25/37 (c) | | | 50 | | | | 39 | | |
Legacy Mortgage Asset Trust, | |
6.25%, 2/25/60 (b)(c) | | | 1,819 | | | | 1,798 | | |
Lehman Mortgage Trust, | |
6.50%, 9/25/37 | | | 623 | | | | 197 | | |
LHOME Mortgage Trust, | |
Series 2023-RTL2 Class A1 | |
8.00%, 6/25/28 (b)(c) | | | 425 | | | | 425 | | |
NYMT Loan Trust, | |
2.94%, 10/25/60 (b)(c) | | | 2,260 | | | | 2,220 | | |
OBX Trust, | |
3.50%, 2/25/60 (b)(c) | | | 356 | | | | 299 | | |
Pepper Residential Securities Trust, | |
1 Month Term SOFR + 1.04%,
6.37%, 3/12/61 (b)(c) | | | 111 | | | | 111 | | |
PMC PLS ESR Issuer LLC, | |
5.11%, 2/25/27 (b) | | | 1,798 | | | | 1,719 | | |
Preston Ridge Partners Mortgage LLC, | |
1.74%, 9/25/26 (b)(c) | | | 1,766 | | | | 1,627 | | |
2.36%, 10/25/26 (b)(c) | | | 1,935 | | | | 1,812 | | |
PRPM LLC, | |
5.56%, 6/25/27 (b) | | | 2,155 | | | | 2,115 | | |
Sage AR Funding Holdings Ltd., | |
3 Month GBP SONIA + 1.85%,
7.07%, 11/17/51 (b)(c) | | GBP | 3,625 | | | | 4,155 | | |
Seasoned Credit Risk Transfer Trust, | |
3.00%, 9/25/55 - 10/25/58 | | $ | 5,123 | | | | 4,276 | | |
4.00%, 8/25/56 - 2/25/59 (b)(c) | | | 2,187 | | | | 1,955 | | |
4.25%, 8/25/59 - 11/25/60 (b)(c) | | | 6,550 | | | | 5,640 | | |
4.50%, 6/25/57 | | | — | @ | | | — | @ | |
4.75%, 7/25/56 - 10/25/58 (b)(c)(c) | | | 2,682 | | | | 2,461 | | |
Stanwich Mortgage Loan Co. LLC, | |
2.74%, 10/16/26 (b) | | | 1,932 | | | | 1,770 | | |
TDA 27 FTA, | |
3 Month EURIBOR + 0.19%,
4.13%, 12/28/50 (c) | | EUR | 1,114 | | | | 998 | | |
VOLT CV LLC, | |
2.49%, 11/27/51 (b) | | $ | 1,468 | | | | 1,377 | | |
VOLT XCIII LLC, | |
1.89%, 2/27/51 (b) | | | 1,549 | | | | 1,465 | | |
VOLT XCIV LLC, | |
2.24%, 2/27/51 (b) | | | 1,885 | | | | 1,785 | | |
| | | | 80,200 | | |
Municipal Bonds (0.7%) | |
Chicago O'Hare International Airport, IL,
O'Hare International Airport Revenue, | |
Series 2010B | |
6.40%, 1/1/40 | | | 255 | | | | 272 | | |
City of New York, NY, | |
Series G-1 | |
5.97%, 3/1/36 | | | 270 | | | | 279 | | |
The accompanying notes are an integral part of the financial statements.
12
Morgan Stanley Institutional Fund Trust
Annual Report — September 30, 2023
Portfolio of Investments (cont'd)
Core Plus Fixed Income Portfolio
| | | Face
Amount
(000) | | Value
(000) | |
Municipal Bonds (cont'd) | |
Illinois State Toll Highway Authority, IL,
Highway Revenue, Build America Bonds, | |
Series A | |
6.18%, 1/1/34 | | $ | 477 | | | $ | 492 | | |
Onondaga Civic Development Corp., NY, | |
3.07%, 12/1/55 | | | 2,925 | | | | 1,758 | | |
University of Michigan, MI, | |
Series A | |
4.45%, 4/1/2122 | | | 1,645 | | | | 1,260 | | |
| | | | 4,061 | | |
Sovereign (2.8%) | |
Dominican Republic International Bond, | |
5.88%, 1/30/60 (b) | | | 700 | | | | 504 | | |
11.25%, 9/15/35 (b) | | DOP | 109,900 | | | | 2,001 | | |
13.63%, 2/3/33 (b) | | | 117,700 | | | | 2,446 | | |
Export-Import Bank of India, | |
3.25%, 1/15/30 (b) | | $ | 670 | | | | 572 | | |
3.88%, 2/1/28 (b) | | | 505 | | | | 468 | | |
Ivory Coast Government International Bond, | |
4.88%, 1/30/32 (b) | | EUR | 1,360 | | | | 1,098 | | |
Mexico Government International Bond, | |
3.25%, 4/16/30 | | $ | 750 | | | | 640 | | |
3.75%, 4/19/71 | | | 850 | | | | 487 | | |
Petroleos Mexicanos, | |
6.70%, 2/16/32 | | | 2,727 | | | | 2,027 | | |
Philippine Government International Bond, | |
4.20%, 3/29/47 | | | 420 | | | | 327 | | |
Republic of South Africa Government Bond, | |
8.00%, 1/31/30 | | ZAR | 22,750 | | | | 1,049 | | |
8.25%, 3/31/32 | | | 34,230 | | | | 1,476 | | |
Uruguay Government International Bond, | |
9.75%, 7/20/33 | | UYU | 89,340 | | | | 2,344 | | |
| | | | 15,439 | | |
Supranational (0.2%) | |
Banque Ouest Africaine de Developpement, | |
2.75%, 1/22/33 (b) | | EUR | 270 | | | | 204 | | |
4.70%, 10/22/31 (b) | | $ | 1,240 | | | | 989 | | |
| | | | 1,193 | | |
U.S. Treasury Securities (9.0%) | |
U.S. Treasury Note, | |
3.50%, 4/30/28 | | | 29,125 | | | | 27,763 | | |
4.25%, 5/31/25 (f) | | | 22,900 | | | | 22,562 | | |
| | | | 50,325 | | |
Total Fixed Income Securities (Cost $591,157) | | | 538,548 | | |
| | | Shares | | | |
Short-Term Investments (18.5%) | |
Investment Company (9.8%) | |
Morgan Stanley Institutional Liquidity
Funds — Government Portfolio —
Institutional Class (See Note G)
(Cost $54,421) | | | 54,421,134 | | | | 54,421 | | |
| | | Shares | | Value
(000) | |
Securities held as Collateral on Loaned Securities (0.4%) | |
Investment Company (0.4%) | |
Morgan Stanley Institutional Liquidity
Funds — Government Portfolio —
Institutional Class (See Note G)
(Cost $2,451) | | | 2,450,510 | | | $ | 2,451 | | |
| | | Face
Amount
(000) | | | |
U.S. Treasury Securities (8.3%) | |
U.S. Treasury Bill, | |
5.01%, 11/30/23 (g) | | $ | 2,300 | | | | 2,280 | | |
5.32%, 12/14/23 (g) | | | 23,000 | | | | 22,753 | | |
5.40%, 11/30/23 (g) | | | 300 | | | | 297 | | |
U.S. Treasury Note, | |
0.25%, 11/15/23 | | | 20,850 | | | | 20,740 | | |
Total U.S. Treasury Securities (Cost $46,077) | | | 46,070 | | |
Total Short-Term Investments (Cost $102,949) | | | 102,942 | | |
Total Investments (115.4%) (Cost $694,106)
Including $25,307 of Securities Loaned (h)(i) | | | 641,490 | | |
Liabilities in Excess of Other Assets (–15.4%) | | | (85,370 | ) | |
Net Assets (100.0%) | | $ | 556,120 | | |
@ Face Amount/Value is less than $500.
(a) Security is subject to delayed delivery.
(b) 144A security — Certain conditions for public sale may exist. Unless otherwise noted, these securities are deemed to be liquid.
(c) Floating or variable rate securities: The rates disclosed are as of September 30, 2023. For securities based on a published reference rate and spread, the reference rate and spread are indicated in the description in the Portfolio of Investments. Certain variable rate securities may not be based on a published reference rate and spread but are determined by the issuer or agent and are based on current market conditions. These securities do not indicate a reference rate and spread in their description in the Portfolio of Investments.
(d) Inverse Floating Rate Security — Interest rate fluctuates with an inverse relationship to an associated interest rate. Indicated rate is the effective rate at September 30, 2023.
(e) Perpetual — One or more securities do not have a predetermined maturity date. Rates for these securities are fixed for a period of time after which they revert to a floating rate. Interest rates in effect are as of September 30, 2023.
(f) All or a portion of this security was on loan at September 30, 2023.
(g) Rate shown is the yield to maturity at September 30, 2023.
(h) Securities are available for collateral in connection with securities purchased on a forward commitment basis, open foreign currency exchange contracts, futures contracts and swap agreements.
(i) At September 30, 2023, the aggregate cost for federal income tax purposes is approximately $691,085,000. The aggregate gross unrealized appreciation is approximately $5,954,000 and the aggregate gross unrealized depreciation is approximately $58,745,000, resulting in net unrealized depreciation of approximately $52,791,000.
CLO Collateralized Loan Obligation.
DAC Designated Activity Company.
The accompanying notes are an integral part of the financial statements.
13
Morgan Stanley Institutional Fund Trust
Annual Report — September 30, 2023
Portfolio of Investments (cont'd)
Core Plus Fixed Income Portfolio
EURIBOR Euro Interbank Offered Rate.
IO Interest Only Security.
LIBOR London Interbank Offered Rate.
PAC Planned Amortization Class.
REMIC Real Estate Mortgage Investment Conduit.
SOFR Secured Overnight Financing Rate.
SOFR30A 30-Day Average SOFR.
SONIA Sterling Overnight Index Average.
STRIPS Separate Trading of Registered Interest and Principal of Securities.
TBA To Be Announced.
USD United States Dollar.
Foreign Currency Forward Exchange Contracts:
The Fund had the following foreign currency forward exchange contracts open at September 30, 2023:
Counterparty | | Contracts to
Deliver
(000) | | In Exchange
For
(000) | | Delivery
Date | | Unrealized
Appreciation
(Depreciation)
(000) | |
Australia & New Zealand Banking Group Ltd. | | $ | 45 | | | CAD | 60 | | | 11/10/23 | | $ | (— | @) | |
Bank of America NA | | NZD | 4,459 | | | $ | 2,623 | | | 11/10/23 | | | (49 | ) | |
Barclays Bank PLC | | $ | 77 | | | GBP | 60 | | | 11/10/23 | | | (3 | ) | |
BNP Paribas SA | | CNH | 20,105 | | | $ | 2,825 | | | 11/10/23 | | | 67 | | |
BNP Paribas SA | | EUR | 7,014 | | | $ | 7,768 | | | 11/10/23 | | | 341 | | |
BNP Paribas SA | | IDR | 48,716,250 | | | $ | 3,206 | | | 11/10/23 | | | 55 | | |
Citibank NA | | DOP | 31,709 | | | $ | 550 | | | 11/10/23 | | | (3 | ) | |
Citibank NA | | $ | 23 | | | CAD | 31 | | | 11/10/23 | | | (— | @) | |
JPMorgan Chase Bank NA | | CAD | 6,333 | | | $ | 4,744 | | | 11/10/23 | | | 79 | | |
JPMorgan Chase Bank NA | | MXN | 79,486 | | | $ | 4,557 | | | 11/10/23 | | | 25 | | |
JPMorgan Chase Bank NA | | NOK | 28,805 | | | $ | 2,693 | | | 11/10/23 | | | (3 | ) | |
JPMorgan Chase Bank NA | | $ | 2,778 | | | INR | 230,813 | | | 11/10/23 | | | (4 | ) | |
JPMorgan Chase Bank NA | | $ | 4,272 | | | MXN | 76,008 | | | 11/10/23 | | | 62 | | |
JPMorgan Chase Bank NA | | $ | 2,836 | | | NOK | 28,805 | | | 11/10/23 | | | (141 | ) | |
JPMorgan Chase Bank NA | | $ | 2,733 | | | NZD | 4,459 | | | 11/10/23 | | | (60 | ) | |
JPMorgan Chase Bank NA | | ZAR | 51,837 | | | $ | 2,782 | | | 11/10/23 | | | 53 | | |
UBS AG | | GBP | 5,902 | | | $ | 7,530 | | | 11/10/23 | | | 328 | | |
| | | | | | | | | $ | 747 | | |
Futures Contracts:
The Fund had the following futures contracts open at September 30, 2023:
| | | Number
of
Contracts | | Expiration
Date | | Notional
Amount
(000) | | Value
(000) | | Unrealized
Appreciation
(Depreciation)
(000) | |
Long: | |
U.S. Treasury Long Bond (United States) | | | 358 | | | Dec-23 | | $ | 35,800 | | | $ | 40,734 | | | $ | (2,347 | ) | |
U.S. Treasury Ultra Bond (United States) | | | 200 | | | Dec-23 | | | 20,000 | | | | 23,738 | | | | (1,286 | ) | |
U.S. Treasury 2 yr. Note (United States) | | | 281 | | | Dec-23 | | | 56,200 | | | | 56,962 | | | | (29 | ) | |
U.S. Treasury 5 yr. Note (United States) | | | 95 | | | Dec-23 | | | 9,500 | | | | 10,009 | | | | 15 | | |
U.S. Treasury 10 yr. Note (United States) | | | 170 | | | Dec-23 | | | 17,000 | | | | 18,371 | | | | (281 | ) | |
Short: | |
EURO OAT Index (Germany) | | | 11 | | | Dec-23 | | EUR | (1,100 | ) | | | (1,433 | ) | | | 37 | | |
Euro-Buxl 30 yr. Bond (Germany) | | | 3 | | | Dec-23 | | | (300 | ) | | | (388 | ) | | | 33 | | |
U.S. Treasury 10 yr. Ultra Note (United States) | | | 21 | | | Dec-23 | | $ | (2,100 | ) | | | (2,343 | ) | | | (8 | ) | |
| | | | | | | | | | | $ | (3,866 | ) | |
Credit Default Swap Agreement:
The Fund had the following credit default swap agreement open at September 30, 2023:
Swap Counterparty
and Reference Obligation | | Credit
Rating of
Reference
Obligation† | | Buy/Sell
Protection | | Pay/Received
Fixed Rate | | Payment
Frequency | | Maturity
Date | | Notional
Amount
(000) | | Value
(000) | | Upfront
Payment
Received
(000) | | Unrealized
Depreciation
(000) | |
Morgan Stanley & Co. LLC*
CDX.NA.HY.S41 | | NR | | Buy | | | 5.00 | % | | Quarterly | | 12/20/28 | | $ | 11,900 | | | $ | (112 | ) | | $ | (78 | ) | | $ | (34 | ) | |
The accompanying notes are an integral part of the financial statements.
14
Morgan Stanley Institutional Fund Trust
Annual Report — September 30, 2023
Portfolio of Investments (cont'd)
Core Plus Fixed Income Portfolio
† Credit rating as issued by Standard & Poor's.
* Cleared swap agreement, the broker is Morgan Stanley & Co. LLC.
CAD — Canadian Dollar
CNH — Chinese Yuan Renminbi Offshore
DOP — Dominican Peso
EUR — Euro
GBP — British Pound
IDR — Indonesian Rupiah
INR — Indian Rupee
MXN — Mexican Peso
NOK — Norwegian Krone
NZD — New Zealand Dollar
USD — United States Dollar
UYU — Uruguayan Peso
ZAR — South African Rand
Portfolio Composition*
Classification | | Percentage of
Total Investments | |
Agency Fixed Rate Mortgages | | | 17.1 | % | |
Short-Term Investments | | | 15.7 | | |
Commercial Mortgage-Backed Securities | | | 12.7 | | |
Mortgages — Other | | | 12.6 | | |
Industrials | | | 11.9 | | |
Finance | | | 8.6 | | |
Asset-Backed Securities | | | 8.2 | | |
U.S. Treasury Securities | | | 7.9 | | |
Other** | | | 5.3 | | |
Total Investments | | | 100.0 | %*** | |
* Percentages indicated are based upon total investments (excluding Securities held as Collateral on Loaned Securities) as of September 30, 2023.
** Industries and/or investment types representing less than 5% of total investments.
*** Does not include open long/short futures contracts with a value of approximately $153,978,000 and net unrealized depreciation of approximately $3,866,000. Does not include open foreign currency forward exchange contracts with net unrealized appreciation of approximately $747,000. Also does not include an open swap agreement with total unrealized depreciation of approximately $34,000.
The accompanying notes are an integral part of the financial statements.
15
Morgan Stanley Institutional Fund Trust
Annual Report — September 30, 2023
Core Plus Fixed Income Portfolio
Statement of Assets and Liabilities | | September 30, 2023
(000) | |
Assets: | |
Investments in Securities of Unaffiliated Issuers, at Value(1) (Cost $637,234) | | $ | 584,618 | | |
Investment in Security of Affiliated Issuer, at Value (Cost $56,872) | | | 56,872 | | |
Total Investments in Securities, at Value (Cost $694,106) | | | 641,490 | | |
Foreign Currency, at Value (Cost $3,332) | | | 3,296 | | |
Cash | | | 1,999 | | |
Receivable for Variation Margin on Futures Contracts | | | 3,985 | | |
Interest Receivable | | | 3,896 | | |
Receivable for Investments Sold | | | 1,525 | | |
Unrealized Appreciation on Foreign Currency Forward Exchange Contracts | | | 1,010 | | |
Due from Broker | | | 371 | | |
Receivable for Fund Shares Sold | | | 315 | | |
Receivable from Affiliate | | | 280 | | |
Tax Reclaim Receivable | | | 10 | | |
Receivable from Securities Lending Income | | | 4 | | |
Other Assets | | | 79 | | |
Total Assets | | | 658,260 | | |
Liabilities: | |
Payable for Investments Purchased | | | 98,247 | | |
Collateral on Securities Loaned, at Value | | | 2,451 | | |
Payable for Variation Margin on Swap Agreements | | | 341 | | |
Unrealized Depreciation on Foreign Currency Forward Exchange Contracts | | | 263 | | |
Payable for Fund Shares Redeemed | | | 220 | | |
Payable for Advisory Fees | | | 210 | | |
Payable for Professional Fees | | | 84 | | |
Payable for Sub Transfer Agency Fees — Class I | | | 62 | | |
Payable for Sub Transfer Agency Fees — Class A | | | 8 | | |
Payable for Sub Transfer Agency Fees — Class L | | | — | @ | |
Payable for Sub Transfer Agency Fees — Class C | | | 2 | | |
Payable for Administration Fees | | | 37 | | |
Deferred Capital Gain Country Tax | | | 25 | | |
Payable for Custodian Fees | | | 20 | | |
Payable for Shareholder Services Fees — Class A | | | 11 | | |
Payable for Distribution and Shareholder Services Fees — Class L | | | — | @ | |
Payable for Distribution and Shareholder Services Fees — Class C | | | 9 | | |
Payable for Transfer Agency Fees — Class I | | | 3 | | |
Payable for Transfer Agency Fees — Class A | | | 1 | | |
Payable for Transfer Agency Fees — Class L | | | — | @ | |
Payable for Transfer Agency Fees — Class C | | | 1 | | |
Payable for Transfer Agency Fees — Class R6 | | | 1 | | |
Other Liabilities | | | 144 | | |
Total Liabilities | | | 102,140 | | |
Net Assets | | $ | 556,120 | | |
Net Assets Consist of: | |
Paid-in-Capital | | $ | 719,659 | | |
Total Accumulated Loss | | | (163,539 | ) | |
Net Assets | | $ | 556,120 | | |
The accompanying notes are an integral part of the financial statements.
16
Morgan Stanley Institutional Fund Trust
Annual Report — September 30, 2023
Core Plus Fixed Income Portfolio
Statement of Assets and Liabilities (cont'd) | | September 30, 2023
(000) | |
CLASS I: | |
Net Assets | | $ | 423,920 | | |
| Shares Outstanding (unlimited number of shares authorized, no par value) (not in 000's) | | | 46,345,129 | | |
Net Asset Value, Offering and Redemption Price Per Share | | $ | 9.15 | | |
CLASS A: | |
Net Assets | | $ | 54,277 | | |
| Shares Outstanding (unlimited number of shares authorized, no par value) (not in 000's) | | | 5,922,982 | | |
Net Asset Value, Redemption Price Per Share | | $ | 9.16 | | |
Maximum Sales Load | | | 3.25 | % | |
Maximum Sales Charge | | $ | 0.31 | | |
Maximum Offering Price Per Share | | $ | 9.47 | | |
CLASS L: | |
Net Assets | | $ | 704 | | |
| Shares Outstanding (unlimited number of shares authorized, no par value) (not in 000's) | | | 76,712 | | |
Net Asset Value, Offering and Redemption Price Per Share | | $ | 9.17 | | |
CLASS C: | |
Net Assets | | $ | 11,044 | | |
| Shares Outstanding (unlimited number of shares authorized, no par value) (not in 000's) | | | 1,214,845 | | |
Net Asset Value, Offering and Redemption Price Per Share | | $ | 9.09 | | |
CLASS R6: | |
Net Assets | | $ | 66,175 | | |
| Shares Outstanding (unlimited number of shares authorized, no par value) (not in 000's) | | | 7,238,137 | | |
Net Asset Value, Offering and Redemption Price Per Share | | $ | 9.14 | | |
(1) Including:
Securities on Loan, at Value: | | $ | 25,307 | | |
@ Amount is less than $500.
The accompanying notes are an integral part of the financial statements.
17
Morgan Stanley Institutional Fund Trust
Annual Report — September 30, 2023
Core Plus Fixed Income Portfolio
Statement of Operations | | Year Ended
September 30, 2023
(000) | |
Investment Income: | |
Interest from Securities of Unaffiliated Issuers (Net of $4 of Foreign Taxes Withheld) | | $ | 26,893 | | |
Dividends from Security of Affiliated Issuer (Note G) | | | 3,290 | | |
Income from Securities Loaned — Net | | | 88 | | |
Total Investment Income | | | 30,271 | | |
Expenses: | |
Advisory Fees (Note B) | | | 2,181 | | |
Administration Fees (Note C) | | | 465 | | |
Sub Transfer Agency Fees — Class I | | | 361 | | |
Sub Transfer Agency Fees — Class A | | | 66 | | |
Sub Transfer Agency Fees — Class L | | | 1 | | |
Sub Transfer Agency Fees — Class C | | | 8 | | |
Shareholder Services Fees — Class A (Note D) | | | 148 | | |
Distribution and Shareholder Services Fees — Class L (Note D) | | | 4 | | |
Distribution and Shareholder Services Fees — Class C (Note D) | | | 129 | | |
Professional Fees | | | 202 | | |
Registration Fees | | | 90 | | |
Custodian Fees (Note F) | | | 70 | | |
Pricing Fees | | | 61 | | |
Shareholder Reporting Fees | | | 47 | | |
Transfer Agency Fees — Class I (Note E) | | | 20 | | |
Transfer Agency Fees — Class A (Note E) | | | 6 | | |
Transfer Agency Fees — Class L (Note E) | | | 2 | | |
Transfer Agency Fees — Class C (Note E) | | | 6 | | |
Transfer Agency Fees — Class R6 (Note E) | | | 4 | | |
Trustees' Fees and Expenses | | | 15 | | |
Other Expenses | | | 40 | | |
Total Expenses | | | 3,926 | | |
Waiver of Advisory Fees (Note B) | | | (1,019 | ) | |
Reimbursement of Class Specific Expenses — Class I (Note B) | | | (164 | ) | |
Reimbursement of Class Specific Expenses — Class L (Note B) | | | (2 | ) | |
Reimbursement of Class Specific Expenses — Class R6 (Note B) | | | (4 | ) | |
Rebate from Morgan Stanley Affiliate (Note G) | | | (112 | ) | |
Net Expenses | | | 2,625 | | |
Net Investment Income | | | 27,646 | | |
Realized Loss: | |
Investments Sold (Net of $5 of Capital Gain Country Tax) | | | (39,035 | ) | |
Foreign Currency Forward Exchange Contracts | | | (236 | ) | |
Foreign Currency Translation | | | (5 | ) | |
Futures Contracts | | | (15,470 | ) | |
Swap Agreements | | | (1,470 | ) | |
Net Realized Loss | | | (56,216 | ) | |
Change in Unrealized Appreciation (Depreciation): | |
Investments | | | 39,467 | | |
Foreign Currency Forward Exchange Contracts | | | (1,792 | ) | |
Foreign Currency Translation | | | (24 | ) | |
Futures Contracts | | | 3,370 | | |
Swap Agreements | | | 61 | | |
Net Change in Unrealized Appreciation (Depreciation) | | | 41,082 | | |
Net Realized Loss and Change in Unrealized Appreciation (Depreciation) | | | (15,134 | ) | |
Net Increase in Net Assets Resulting from Operations | | $ | 12,512 | | |
The accompanying notes are an integral part of the financial statements.
18
Morgan Stanley Institutional Fund Trust
Annual Report — September 30, 2023
Core Plus Fixed Income Portfolio
Statements of Changes in Net Assets | | Year Ended
September 30, 2023
(000) | | Year Ended
September 30, 2022
(000) | |
Increase (Decrease) in Net Assets: | |
Operations: | |
Net Investment Income | | $ | 27,646 | | | $ | 22,264 | | |
Net Realized Loss | | | (56,216 | ) | | | (52,539 | ) | |
Net Change in Unrealized Appreciation (Depreciation) | | | 41,082 | | | | (103,962 | ) | |
Net Increase (Decrease) in Net Assets Resulting from Operations | | | 12,512 | | | | (134,237 | ) | |
Dividends and Distributions to Shareholders: | |
Class I | | | (22,827 | ) | | | (18,106 | ) | |
Class A | | | (2,906 | ) | | | (2,149 | ) | |
Class L | | | (41 | ) | | | (23 | ) | |
Class C | | | (551 | ) | | | (407 | ) | |
Class R6* | | | (3,945 | ) | | | (3,666 | ) | |
Total Dividends and Distributions to Shareholders | | | (30,270 | ) | | | (24,351 | ) | |
Capital Share Transactions:(1) | |
Class I: | |
Subscribed | | | 160,654 | | | | 196,934 | | |
Distributions Reinvested | | | 22,491 | | | | 17,880 | | |
Redeemed | | | (216,246 | ) | | | (356,596 | ) | |
Class A: | |
Subscribed | | | 7,658 | | | | 11,728 | | |
Distributions Reinvested | | | 2,905 | | | | 2,149 | | |
Redeemed | | | (15,882 | ) | | | (35,681 | ) | |
Class L: | |
Exchanged | | | 100 | | | | 41 | | |
Distributions Reinvested | | | 41 | | | | 23 | | |
Redeemed | | | (270 | ) | | | (99 | ) | |
Class C: | |
Subscribed | | | 1,929 | | | | 1,327 | | |
Distributions Reinvested | | | 547 | | | | 404 | | |
Redeemed | | | (6,012 | ) | | | (8,945 | ) | |
Class R6:* | |
Subscribed | | | 7,701 | | | | 16,068 | | |
Distributions Reinvested | | | 3,621 | | | | 3,243 | | |
Redeemed | | | (46,653 | ) | | | (18,923 | ) | |
Net Decrease in Net Assets Resulting from Capital Share Transactions | | | (77,416 | ) | | | (170,447 | ) | |
Total Decrease in Net Assets | | | (95,174 | ) | | | (329,035 | ) | |
Net Assets: | |
Beginning of Period | | | 651,294 | | | | 980,329 | | |
End of Period | | $ | 556,120 | | | $ | 651,294 | | |
The accompanying notes are an integral part of the financial statements.
19
Morgan Stanley Institutional Fund Trust
Annual Report — September 30, 2023
Core Plus Fixed Income Portfolio
Statements of Changes in Net Assets (cont'd) | | Year Ended
September 30, 2023
(000) | | Year Ended
September 30, 2022
(000) | |
(1) Capital Share Transactions: | |
Class I: | |
Shares Subscribed | | | 16,899 | | | | 18,315 | | |
Shares Issued on Distributions Reinvested | | | 2,365 | | | | 1,657 | | |
Shares Redeemed | | | (22,718 | ) | | | (33,337 | ) | |
Net Decrease in Class I Shares Outstanding | | | (3,454 | ) | | | (13,365 | ) | |
Class A: | |
Shares Subscribed | | | 805 | | | | 1,069 | | |
Shares Issued on Distributions Reinvested | | | 305 | | | | 198 | | |
Shares Redeemed | | | (1,674 | ) | | | (3,299 | ) | |
Net Decrease in Class A Shares Outstanding | | | (564 | ) | | | (2,032 | ) | |
Class L: | |
Shares Exchanged | | | 11 | | | | 4 | | |
Shares Issued on Distributions Reinvested | | | 4 | | | | 2 | | |
Shares Redeemed | | | (29 | ) | | | (9 | ) | |
Net Decrease in Class L Shares Outstanding | | | (14 | ) | | | (3 | ) | |
Class C: | |
Shares Subscribed | | | 203 | | | | 120 | | |
Shares Issued on Distributions Reinvested | | | 58 | | | | 38 | | |
Shares Redeemed | | | (637 | ) | | | (842 | ) | |
Net Decrease in Class C Shares Outstanding | | | (376 | ) | | | (684 | ) | |
Class R6:* | |
Shares Subscribed | | | 819 | | | | 1,486 | | |
Shares Issued on Distributions Reinvested | | | 381 | | | | 302 | | |
Shares Redeemed | | | (4,900 | ) | | | (1,863 | ) | |
Net Decrease in Class R6 Shares Outstanding | | | (3,700 | ) | | | (75 | ) | |
* Effective April 29, 2022, Class IS shares were renamed Class R6 shares.
The accompanying notes are an integral part of the financial statements.
20
Morgan Stanley Institutional Fund Trust
Annual Report — September 30, 2023
Financial Highlights
Core Plus Fixed Income Portfolio
| | | Class I | |
| | | Year Ended September 30, | |
Selected Per Share Data and Ratios | | 2023 | | 2022 | | 2021 | | 2020 | | 2019 | |
Net Asset Value, Beginning of Period | | $ | 9.45 | | | $ | 11.53 | | | $ | 11.91 | | | $ | 11.58 | | | $ | 10.84 | | |
Income (Loss) from Investment Operations: | |
Net Investment Income(1) | | | 0.46 | | | | 0.29 | | | | 0.26 | | | | 0.31 | | | | 0.37 | | |
Net Realized and Unrealized Gain (Loss) | | | (0.26 | ) | | | (2.06 | ) | | | (0.07 | ) | | | 0.40 | | | | 0.78 | | |
Total from Investment Operations | | | 0.20 | | | | (1.77 | ) | | | 0.19 | | | | 0.71 | | | | 1.15 | | |
Distributions from and/or in Excess of: | |
Net Investment Income | | | (0.50 | ) | | | (0.28 | ) | | | (0.26 | ) | | | (0.30 | ) | | | (0.41 | ) | |
Net Realized Gain | | | — | | | | (0.03 | ) | | | (0.31 | ) | | | (0.08 | ) | | | — | | |
Total Distributions | | | (0.50 | ) | | | (0.31 | ) | | | (0.57 | ) | | | (0.38 | ) | | | (0.41 | ) | |
Net Asset Value, End of Period | | $ | 9.15 | | | $ | 9.45 | | | $ | 11.53 | | | $ | 11.91 | | | $ | 11.58 | | |
Total Return(2) | | | 2.03 | % | | | (15.58 | )% | | | 1.61 | % | | | 6.27 | % | | | 10.83 | %(3) | |
Ratios to Average Net Assets and Supplemental Data: | |
Net Assets, End of Period (Thousands) | | $ | 423,920 | | | $ | 470,728 | | | $ | 727,989 | | | $ | 662,724 | | | $ | 457,610 | | |
Ratio of Expenses Before Expense Limitation | | | 0.63 | % | | | 0.63 | % | | | 0.62 | % | | | 0.64 | % | | | 0.67 | % | |
Ratio of Expenses After Expense Limitation | | | 0.40 | %(4) | | | 0.41 | %(4) | | | 0.41 | %(4) | | | 0.40 | %(4) | | | 0.41 | %(4) | |
Ratio of Expenses After Expense Limitation Excluding Interest Expenses | | | N/A | | | | N/A | | | | N/A | | | | 0.40 | %(4) | | | N/A | | |
Ratio of Net Investment Income | | | 4.81 | %(4) | | | 2.74 | %(4) | | | 2.26 | %(4) | | | 2.63 | %(4) | | | 3.29 | %(4) | |
Ratio of Rebate from Morgan Stanley Affiliates | | | 0.02 | % | | | 0.01 | % | | | 0.01 | % | | | 0.02 | % | | | 0.01 | % | |
Portfolio Turnover Rate | | | 431 | % | | | 266 | % | | | 434 | % | | | 287 | % | | | 217 | % | |
(1) Per share amount is based on average shares outstanding.
(2) Calculated based on the net asset value as of the last business day of the period.
(3) Performance was positively impacted by approximately 0.20% due to the receipt of proceeds from the settlement of a class action suit involving the Fund's past holdings. This was a one-time settlement, and as a result, the impact on the NAV and consequently the performance will not likely be repeated in the future. Had this settlement not occurred, the total return for Class I shares would have been approximately 10.63%.
(4) The Ratio of Expenses After Expense Limitation and Ratio of Net Investment Income reflect the rebate of certain Fund expenses in connection with the investments in Morgan Stanley affiliates during the period. The effect of the rebate on the ratios is disclosed in the above table as "Ratio of Rebate from Morgan Stanley Affiliates."
The accompanying notes are an integral part of the financial statements.
21
Morgan Stanley Institutional Fund Trust
Annual Report — September 30, 2023
Financial Highlights
Core Plus Fixed Income Portfolio
| | | Class A | |
| | | Year Ended September 30, | |
Selected Per Share Data and Ratios | | 2023 | | 2022 | | 2021 | | 2020 | | 2019 | |
Net Asset Value, Beginning of Period | | $ | 9.47 | | | $ | 11.54 | | | $ | 11.93 | | | $ | 11.60 | | | $ | 10.85 | | |
Income (Loss) from Investment Operations: | |
Net Investment Income(1) | | | 0.43 | | | | 0.26 | | | | 0.22 | | | | 0.27 | | | | 0.33 | | |
Net Realized and Unrealized Gain (Loss) | | | (0.27 | ) | | | (2.05 | ) | | | (0.09 | ) | | | 0.40 | | | | 0.79 | | |
Total from Investment Operations | | | 0.16 | | | | (1.79 | ) | | | 0.13 | | | | 0.67 | | | | 1.12 | | |
Distributions from and/or in Excess of: | |
Net Investment Income | | | (0.47 | ) | | | (0.25 | ) | | | (0.21 | ) | | | (0.26 | ) | | | (0.37 | ) | |
Net Realized Gain | | | — | | | | (0.03 | ) | | | (0.31 | ) | | | (0.08 | ) | | | — | | |
Total Distributions | | | (0.47 | ) | | | (0.28 | ) | | | (0.52 | ) | | | (0.34 | ) | | | (0.37 | ) | |
Net Asset Value, End of Period | | $ | 9.16 | | | $ | 9.47 | | | $ | 11.54 | | | $ | 11.93 | | | $ | 11.60 | | |
Total Return(2) | | | 1.59 | % | | | (15.75 | )% | | | 1.17 | % | | | 5.91 | % | | | 10.49 | %(3) | |
Ratios to Average Net Assets and Supplemental Data: | |
Net Assets, End of Period (Thousands) | | $ | 54,277 | | | $ | 61,429 | | | $ | 98,339 | | | $ | 114,387 | | | $ | 92,191 | | |
Ratio of Expenses Before Expense Limitation | | | 0.92 | % | | | 0.89 | % | | | 0.90 | % | | | 0.92 | % | | | 0.97 | % | |
Ratio of Expenses After Expense Limitation | | | 0.72 | %(4) | | | 0.73 | %(4) | | | 0.75 | %(4) | | | 0.74 | %(4) | | | 0.75 | %(4) | |
Ratio of Expenses After Expense Limitation Excluding Interest Expenses | | | N/A | | | | N/A | | | | N/A | | | | 0.74 | %(4) | | | N/A | | |
Ratio of Net Investment Income | | | 4.48 | %(4) | | | 2.41 | %(4) | | | 1.92 | %(4) | | | 2.29 | %(4) | | | 2.96 | %(4) | |
Ratio of Rebate from Morgan Stanley Affiliates | | | 0.02 | % | | | 0.01 | % | | | 0.01 | % | | | 0.02 | % | | | 0.01 | % | |
Portfolio Turnover Rate | | | 431 | % | | | 266 | % | | | 434 | % | | | 287 | % | | | 217 | % | |
(1) Per share amount is based on average shares outstanding.
(2) Calculated based on the net asset value which does not reflect sales charges, if applicable, as of the last business day of the period.
(3) Performance was positively impacted by approximately 0.20% due to the receipt of proceeds from the settlement of a class action suit involving the Fund's past holdings. This was a one-time settlement, and as a result, the impact on the NAV and consequently the performance will not likely be repeated in the future. Had this settlement not occurred, the total return for Class A shares would have been approximately 10.29%.
(4) The Ratio of Expenses After Expense Limitation and Ratio of Net Investment Income reflect the rebate of certain Fund expenses in connection with the investments in Morgan Stanley affiliates during the period. The effect of the rebate on the ratios is disclosed in the above table as "Ratio of Rebate from Morgan Stanley Affiliates."
The accompanying notes are an integral part of the financial statements.
22
Morgan Stanley Institutional Fund Trust
Annual Report — September 30, 2023
Financial Highlights
Core Plus Fixed Income Portfolio
| | | Class L | |
| | | Year Ended September 30, | |
Selected Per Share Data and Ratios | | 2023 | | 2022 | | 2021 | | 2020 | | 2019 | |
Net Asset Value, Beginning of Period | | $ | 9.48 | | | $ | 11.56 | | | $ | 11.94 | | | $ | 11.61 | | | $ | 10.86 | | |
Income (Loss) from Investment Operations: | |
Net Investment Income(1) | | | 0.40 | | | | 0.23 | | | | 0.19 | | | | 0.24 | | | | 0.30 | | |
Net Realized and Unrealized Gain (Loss) | | | (0.27 | ) | | | (2.06 | ) | | | (0.07 | ) | | | 0.40 | | | | 0.78 | | |
Total from Investment Operations | | | 0.13 | | | | (1.83 | ) | | | 0.12 | | | | 0.64 | | | | 1.08 | | |
Distributions from and/or in Excess of: | |
Net Investment Income | | | (0.44 | ) | | | (0.22 | ) | | | (0.19 | ) | | | (0.23 | ) | | | (0.33 | ) | |
Net Realized Gain | | | — | | | | (0.03 | ) | | | (0.31 | ) | | | (0.08 | ) | | | — | | |
Total Distributions | | | (0.44 | ) | | | (0.25 | ) | | | (0.50 | ) | | | (0.31 | ) | | | (0.33 | ) | |
Net Asset Value, End of Period | | $ | 9.17 | | | $ | 9.48 | | | $ | 11.56 | | | $ | 11.94 | | | $ | 11.61 | | |
Total Return(2) | | | 1.30 | % | | | (16.05 | )% | | | 1.00 | % | | | 5.63 | % | | | 10.12 | %(3) | |
Ratios to Average Net Assets and Supplemental Data: | |
Net Assets, End of Period (Thousands) | | $ | 704 | | | $ | 859 | | | $ | 1,082 | | | $ | 812 | | | $ | 720 | | |
Ratio of Expenses Before Expense Limitation | | | 1.37 | % | | | 1.31 | % | | | 1.27 | % | | | 1.37 | % | | | 1.45 | % | |
Ratio of Expenses After Expense Limitation | | | 1.00 | %(4) | | | 1.01 | %(4) | | | 1.01 | %(4) | | | 1.00 | %(4) | | | 1.01 | %(4) | |
Ratio of Expenses After Expense Limitation Excluding Interest Expenses | | | N/A | | | | N/A | | | | N/A | | | | 1.00 | %(4) | | | N/A | | |
Ratio of Net Investment Income | | | 4.21 | %(4) | | | 2.17 | %(4) | | | 1.67 | %(4) | | | 2.04 | %(4) | | | 2.70 | %(4) | |
Ratio of Rebate from Morgan Stanley Affiliates | | | 0.02 | % | | | 0.01 | % | | | 0.01 | % | | | 0.02 | % | | | 0.01 | % | |
Portfolio Turnover Rate | | | 431 | % | | | 266 | % | | | 434 | % | | | 287 | % | | | 217 | % | |
(1) Per share amount is based on average shares outstanding.
(2) Calculated based on the net asset value as of the last business day of the period.
(3) Performance was positively impacted by approximately 0.20% due to the receipt of proceeds from the settlement of a class action suit involving the Fund's past holdings. This was a one-time settlement, and as a result, the impact on the NAV and consequently the performance will not likely be repeated in the future. Had this settlement not occurred, the total return for Class L shares would have been approximately 9.92%.
(4) The Ratio of Expenses After Expense Limitation and Ratio of Net Investment Income reflect the rebate of certain Fund expenses in connection with the investments in Morgan Stanley affiliates during the period. The effect of the rebate on the ratios is disclosed in the above table as "Ratio of Rebate from Morgan Stanley Affiliates."
The accompanying notes are an integral part of the financial statements.
23
Morgan Stanley Institutional Fund Trust
Annual Report — September 30, 2023
Financial Highlights
Core Plus Fixed Income Portfolio
| | | Class C | |
| | | Year Ended September 30, | |
Selected Per Share Data and Ratios | | 2023 | | 2022 | | 2021 | | 2020 | | 2019 | |
Net Asset Value, Beginning of Period | | $ | 9.40 | | | $ | 11.45 | | | $ | 11.84 | | | $ | 11.52 | | | $ | 10.77 | | |
Income (Loss) from Investment Operations: | |
Net Investment Income(1) | | | 0.35 | | | | 0.18 | | | | 0.14 | | | | 0.18 | | | | 0.25 | | |
Net Realized and Unrealized Gain (Loss) | | | (0.26 | ) | | | (2.03 | ) | | | (0.08 | ) | | | 0.41 | | | | 0.78 | | |
Total from Investment Operations | | | 0.09 | | | | (1.85 | ) | | | 0.06 | | | | 0.59 | | | | 1.03 | | |
Distributions from and/or in Excess of: | |
Net Investment Income | | | (0.40 | ) | | | (0.17 | ) | | | (0.14 | ) | | | (0.19 | ) | | | (0.28 | ) | |
Net Realized Gain | | | — | | | | (0.03 | ) | | | (0.31 | ) | | | (0.08 | ) | | | — | | |
Total Distributions | | | (0.40 | ) | | | (0.20 | ) | | | (0.45 | ) | | | (0.27 | ) | | | (0.28 | ) | |
Net Asset Value, End of Period | | $ | 9.09 | | | $ | 9.40 | | | $ | 11.45 | | | $ | 11.84 | | | $ | 11.52 | | |
Total Return(2) | | | 0.84 | % | | | (16.32 | )% | | | 0.49 | % | | | 5.16 | % | | | 9.70 | %(3) | |
Ratios to Average Net Assets and Supplemental Data: | |
Net Assets, End of Period (Thousands) | | $ | 11,044 | | | $ | 14,947 | | | $ | 26,063 | | | $ | 25,989 | | | $ | 14,684 | | |
Ratio of Expenses Before Expense Limitation | | | 1.65 | % | | | 1.62 | % | | | 1.60 | % | | | 1.62 | % | | | 1.68 | % | |
Ratio of Expenses After Expense Limitation | | | 1.46 | %(4) | | | 1.45 | %(4) | | | 1.44 | %(4) | | | 1.43 | %(4) | | | 1.46 | %(4) | |
Ratio of Expenses After Expense Limitation Excluding Interest Expenses | | | N/A | | | | N/A | | | | N/A | | | | 1.43 | %(4) | | | N/A | | |
Ratio of Net Investment Income | | | 3.75 | %(4) | | | 1.69 | %(4) | | | 1.23 | %(4) | | | 1.60 | %(4) | | | 2.23 | %(4) | |
Ratio of Rebate from Morgan Stanley Affiliates | | | 0.02 | % | | | 0.01 | % | | | 0.01 | % | | | 0.02 | % | | | 0.01 | % | |
Portfolio Turnover Rate | | | 431 | % | | | 266 | % | | | 434 | % | | | 287 | % | | | 217 | % | |
(1) Per share amount is based on average shares outstanding.
(2) Calculated based on the net asset value which does not reflect sales charges, if applicable, as of the last business day of the period.
(3) Performance was positively impacted by approximately 0.20% due to the receipt of proceeds from the settlement of a class action suit involving the Fund's past holdings. This was a one-time settlement, and as a result, the impact on the NAV and consequently the performance will not likely be repeated in the future. Had this settlement not occurred, the total return for Class C shares would have been approximately 9.50%.
(4) The Ratio of Expenses After Expense Limitation and Ratio of Net Investment Income reflect the rebate of certain Fund expenses in connection with the investments in Morgan Stanley affiliates during the period. The effect of the rebate on the ratios is disclosed in the above table as "Ratio of Rebate from Morgan Stanley Affiliates."
The accompanying notes are an integral part of the financial statements.
24
Morgan Stanley Institutional Fund Trust
Annual Report — September 30, 2023
Financial Highlights
Core Plus Fixed Income Portfolio
| | | Class R6(1) | |
| | | Year Ended September 30, | |
Selected Per Share Data and Ratios | | 2023 | | 2022 | | 2021 | | 2020 | | 2019 | |
Net Asset Value, Beginning of Period | | $ | 9.45 | | | $ | 11.52 | | | $ | 11.91 | | | $ | 11.58 | | | $ | 10.84 | | |
Income (Loss) from Investment Operations: | |
Net Investment Income(2) | | | 0.46 | | | | 0.30 | | | | 0.27 | | | | 0.31 | | | | 0.37 | | |
Net Realized and Unrealized Gain (Loss) | | | (0.27 | ) | | | (2.05 | ) | | | (0.09 | ) | | | 0.41 | | | | 0.78 | | |
Total from Investment Operations | | | 0.19 | | | | (1.75 | ) | | | 0.18 | | | | 0.72 | | | | 1.15 | | |
Distributions from and/or in Excess of: | |
Net Investment Income | | | (0.50 | ) | | | (0.29 | ) | | | (0.26 | ) | | | (0.31 | ) | | | (0.41 | ) | |
Net Realized Gain | | | — | | | | (0.03 | ) | | | (0.31 | ) | | | (0.08 | ) | | | — | | |
Total Distributions | | | (0.50 | ) | | | (0.32 | ) | | | (0.57 | ) | | | (0.39 | ) | | | (0.41 | ) | |
Net Asset Value, End of Period | | $ | 9.14 | | | $ | 9.45 | | | $ | 11.52 | | | $ | 11.91 | | | $ | 11.58 | | |
Total Return(3) | | | 1.97 | % | | | (15.46 | )% | | | 1.66 | % | | | 6.24 | % | | | 10.89 | %(4) | |
Ratios to Average Net Assets and Supplemental Data: | |
Net Assets, End of Period (Thousands) | | $ | 66,175 | | | $ | 103,331 | | | $ | 126,856 | | | $ | 96,251 | | | $ | 11 | | |
Ratio of Expenses Before Expense Limitation | | | 0.55 | % | | | 0.53 | % | | | 0.52 | % | | | 0.54 | % | | | 18.96 | % | |
Ratio of Expenses After Expense Limitation | | | 0.35 | %(5) | | | 0.36 | %(5) | | | 0.36 | %(5) | | | 0.35 | %(5) | | | 0.35 | %(5) | |
Ratio of Expenses After Expense Limitation Excluding Interest Expenses | | | N/A | | | | N/A | | | | N/A | | | | 0.35 | %(5) | | | N/A | | |
Ratio of Net Investment Income | | | 4.86 | %(5) | | | 2.83 | %(5) | | | 2.32 | %(5) | | | 2.67 | %(5) | | | 3.33 | %(5) | |
Ratio of Rebate from Morgan Stanley Affiliates | | | 0.02 | % | | | 0.01 | % | | | 0.01 | % | | | 0.02 | % | | | 0.01 | % | |
Portfolio Turnover Rate | | | 431 | % | | | 266 | % | | | 434 | % | | | 287 | % | | | 217 | % | |
(1) Effective April 29, 2022, Class IS shares were renamed Class R6 shares.
(2) Per share amount is based on average shares outstanding.
(3) Calculated based on the net asset value as of the last business day of the period.
(4) Performance was positively impacted by approximately 0.20% due to the receipt of proceeds from the settlement of a class action suit involving the Fund's past holdings. This was a one-time settlement, and as a result, the impact on the NAV and consequently the performance will not likely be repeated in the future. Had this settlement not occurred, the total return for Class R6 shares would have been approximately 10.69%.
(5) The Ratio of Expenses After Expense Limitation and Ratio of Net Investment Income reflect the rebate of certain Fund expenses in connection with the investments in Morgan Stanley affiliates during the period. The effect of the rebate on the ratios is disclosed in the above table as "Ratio of Rebate from Morgan Stanley Affiliates."
The accompanying notes are an integral part of the financial statements.
25
Morgan Stanley Institutional Fund Trust
Annual Report — September 30, 2023
Notes to Financial Statements
Morgan Stanley Institutional Fund Trust ("Trust") is registered under the Investment Company Act of 1940, as amended (the "Act"), as an open-end management investment company. The Trust is comprised of nine separate, active funds (individually referred to as a "Fund," collectively as the "Funds"). The Trust applies investment company accounting and reporting guidance Accounting Standards Codification ("ASC") Topic 946. All Funds are considered diversified for purposes of the Act.
The accompanying financial statements relate to the Core Plus Fixed Income Portfolio. The Fund seeks above-average total return over a market cycle of three to five years. The Fund has issued five classes of shares — Class I, Class A, Class L, Class C and Class R6. Effective April 29, 2022, Class IS shares were renamed Class R6 shares.
The Fund has suspended offering Class L shares for sale to all investors. Class L shareholders of the Fund do not have the option of purchasing additional Class L shares. However, existing Class L shareholders may invest in additional Class L shares through reinvestment of dividends and distributions. In addition, Class L shares of the Fund may be exchanged for Class L shares of any Morgan Stanley Multi-Class Fund, even though Class L shares are closed to investors.
A. Significant Accounting Policies: The following significant accounting policies are in conformity with U.S. generally accepted accounting principles ("GAAP"). Such policies are consistently followed by the Trust in the preparation of its financial statements. GAAP may require management to make estimates and assumptions that affect the reported amounts and disclosures in the financial statements. Actual results may differ from those estimates.
1. Security Valuation: (1) Fixed income securities may be valued by an outside pricing service/vendor approved by the Trust's Board of Trustees (the "Trustees"). The pricing service/vendor may employ a pricing model that takes into account, among other things, bids, yield spreads and/or other market data and specific security characteristics. If Morgan Stanley Investment Management Inc. (the "Adviser"), a wholly-owned subsidiary of Morgan Stanley, determines that the price provided by the outside pricing service/vendor does not reflect the security's fair value or is unable to provide a price, prices from reputable brokers/dealers may also be utilized. In these circumstances, the value of the security will be the mean of bid and asked prices obtained from brokers/dealers; (2) futures are valued at the settlement price on the exchange on
which they trade or, if a settlement price is unavailable, at the last sale price on the exchange; (3) over-the-counter ("OTC") swaps may be valued by an outside pricing service approved by the Trustees or quotes from a broker/dealer. Swaps cleared on a clearinghouse or exchange may be valued using the closing price provided by the clearinghouse or exchange; (4) when market quotations are not readily available, as defined by Rule 2a-5 under the Act, including circumstances under which the Adviser determines that the closing price, last sale price or the mean between the last reported bid and asked prices are not reflective of a security's market value, portfolio securities are valued at their fair value as determined in good faith under procedures approved by and under the general supervision of the Trustees. Occasionally, developments affecting the closing prices of securities and other assets may occur between the times at which valuations of such securities are determined (that is, close of the foreign market on which the securities trade) and the close of business of the New York Stock Exchange ("NYSE"). If developments occur during such periods that are expected to materially affect the value of such securities, such valuations may be adjusted to reflect the estimated fair value of such securities as of the close of the NYSE, as determined in good faith by the Trustees or by the Adviser using a pricing service and/or procedures approved by the Trustees; (5) foreign exchange transactions ("spot contracts") and foreign exchange forward contracts ("forward contracts") are valued daily using an independent pricing vendor at the spot and forward rates, respectively, as of the close of the NYSE; and (6) investments in mutual funds, including the Morgan Stanley Institutional Liquidity Funds, are valued at the net asset value ("NAV") as of the close of each business day.
In connection with Rule 2a-5 of the Act, the Trustees have designated the Trust's Adviser as its valuation designee. The valuation designee has responsibility for determining fair value and to make the actual calculations pursuant to the fair valuation methodologies previously approved by the Trustees. Under procedures approved by the Trustees, the Trust's Adviser, as valuation designee, has formed a Valuation Committee whose members are approved by the Trustees. The Valuation Committee provides administration and oversight of the Trust's valuation policies and procedures, which are reviewed at least annually by the Trustees. These procedures allow the Trust to utilize independent pricing
26
Morgan Stanley Institutional Fund Trust
Annual Report — September 30, 2023
Notes to Financial Statements (cont'd)
services, quotations from securities and financial instrument dealers and other market sources to determine fair value.
2. Fair Value Measurement: Financial Accounting Standards Board ("FASB") ASC 820, "Fair Value Measurement" ("ASC 820"), defines fair value as the price that would be received to sell an asset or pay to transfer a liability in an orderly transaction between market participants at the measurement date. ASC 820 establishes a three-tier hierarchy to distinguish between (1) inputs that reflect the assumptions market participants would use in valuing an asset or liability developed based on market data obtained from sources independent of the reporting entity (observable inputs) and (2) inputs that reflect the reporting entity's own assumptions about the assumptions market participants would use in valuing an asset or liability developed based on the best information available in the circumstances (unobservable inputs) and to establish classification of fair value measurements for disclosure purposes. Various inputs are used in determining the value of the Fund's investments. The inputs are summarized in the three broad levels listed below:
• Level 1 – unadjusted quoted prices in active markets for identical investments
• Level 2 – other significant observable inputs (including quoted prices for similar investments, interest rates, prepayment speeds, credit risk, etc.)
• Level 3 – significant unobservable inputs including the Fund's own assumptions in determining the fair value of investments. Factors considered in making this determination may include, but are not limited to, information obtained by contacting the issuer, analysts, or the appropriate stock exchange (for exchange-traded securities), analysis of the issuer's financial statements or other available documents and, if necessary, available information concerning other securities in similar circumstances.
The inputs or methodology used for valuing securities are not necessarily an indication of the risk associated with investing in those securities and the determination of the significance of a particular input to the fair value measurement in its entirety requires judgment and considers factors specific to each security.
The following is a summary of the inputs used to value the Fund's investments as of September 30, 2023:
Investment Type | | Level 1
Unadjusted
quoted
prices
(000) | | Level 2
Other
significant
observable
inputs
(000) | | Level 3
Significant
unobservable
inputs
(000) | | Total
(000) | |
Assets: | |
Fixed Income Securities | |
Agency Fixed Rate
Mortgages | | $ | — | | | $ | 109,305 | | | $ | — | | | $ | 109,305 | | |
Asset-Backed Securities | | | — | | | | 52,080 | | | | — | | | | 52,080 | | |
Collateralized Mortgage
Obligations — Agency
Collateral Series | | | — | | | | 2,234 | | | | — | | | | 2,234 | | |
Commercial
Mortgage-Backed
Securities | | | — | | | | 81,029 | | | | — | | | | 81,029 | | |
Corporate Bonds | | | — | | | | 142,682 | | | | — | | | | 142,682 | | |
Mortgages — Other | | | — | | | | 80,200 | | | | — | | | | 80,200 | | |
Municipal Bonds | | | — | | | | 4,061 | | | | — | | | | 4,061 | | |
Sovereign | | | — | | | | 15,439 | | | | — | | | | 15,439 | | |
Supranational | | | — | | | | 1,193 | | | | — | | | | 1,193 | | |
U.S. Treasury Securities | | | — | | | | 50,325 | | | | — | | | | 50,325 | | |
Total Fixed Income
Securities | | | — | | | | 538,548 | | | | — | | | | 538,548 | | |
Short-Term Investments | |
Investment Company | | | 56,872 | | | | — | | | | — | | | | 56,872 | | |
U.S. Treasury Securities | | | — | | | | 46,070 | | | | — | | | | 46,070 | | |
Total Short-Term
Investments | | | 56,872 | | | | 46,070 | | | | — | | | | 102,942 | | |
Foreign Currency
Forward Exchange
Contracts | | | — | | | | 1,010 | | | | — | | | | 1,010 | | |
Futures Contracts | | | 85 | | | | — | | | | — | | | | 85 | | |
Total Assets | | | 56,957 | | | | 585,628 | | | | — | | | | 642,585 | | |
Liabilities: | |
Foreign Currency
Forward Exchange
Contracts | | | — | | | | (263 | ) | | | — | | | | (263 | ) | |
Futures Contracts | | | (3,951 | ) | | | — | | | | — | | | | (3,951 | ) | |
Credit Default Swap
Agreement | | | — | | | | (34 | ) | | | — | | | | (34 | ) | |
Total Liabilities | | | (3,951 | ) | | | (297 | ) | | | — | | | | (4,248 | ) | |
Total | | $ | 53,006 | | | $ | 585,331 | | | $ | — | | | $ | 638,337 | | |
Transfers between investment levels may occur as the markets fluctuate and/or the availability of data used in an investment's valuation changes.
3. Foreign Currency Translation and Foreign Investments: The books and records of the Fund are maintained in U.S. dollars. Foreign currency amounts are translated into U.S. dollars as follows:
– investments, other assets and liabilities at the prevailing rate of exchange on the valuation date;
27
Morgan Stanley Institutional Fund Trust
Annual Report — September 30, 2023
Notes to Financial Statements (cont'd)
– investment transactions and investment income at the prevailing rates of exchange on the dates of such transactions.
Although the net assets of the Fund are presented at the foreign exchange rates and market values at the close of the period, the Fund does not isolate that portion of the results of operations arising as a result of changes in the foreign exchange rates from the fluctuations arising from changes in the market prices of securities held at period end. Similarly, the Fund does not isolate the effect of changes in foreign exchange rates from the fluctuations arising from changes in the market prices of securities sold during the period. Accordingly, realized and unrealized foreign currency gains (losses) on investments in securities are included in the reported net realized and unrealized gains (losses) on investment transactions and balances. However, pursuant to U.S. federal income tax regulations, gains and losses from certain foreign currency transactions and the foreign currency portion of gains and losses realized on sales and maturities of foreign denominated debt securities are treated as ordinary income for U.S. federal income tax purposes.
Net realized gains (losses) on foreign currency transactions represent net foreign exchange gains (losses) from foreign currency forward exchange contracts, disposition of foreign currencies, currency gains (losses) realized between the trade and settlement dates on securities transactions, and the difference between the amount of investment income and foreign withholding taxes recorded on the Fund's books and the U.S. dollar equivalent amounts actually received or paid. The change in unrealized currency gains (losses) on foreign currency transactions for the period is reflected in the Statement of Operations.
Foreign security and currency transactions may involve certain considerations and risks not typically associated with those of U.S. dollar denominated transactions as a result of, among other factors, fluctuations of exchange rates in relation to the U.S. dollar, the possibility of lower levels of governmental supervision and regulation of foreign securities markets and the possibility of political or economic instability.
Governmental approval for foreign investments may be required in advance of making an investment under certain circumstances in some countries, and the extent of
foreign investments in U.S. companies may be subject to limitation in other countries. Foreign ownership limitations also may be imposed by the charters of individual companies to prevent, among other concerns, violations of foreign investment limitations. As a result, an additional class of shares (identified as "Foreign" in the Portfolio of Investments) may be created and offered for investment. The "local" and "foreign shares" market values may differ. In the absence of trading of the foreign shares in such markets, the Fund values the foreign shares at the closing exchange price of the local shares.
4. Derivatives: The Fund may, but is not required to, use derivative instruments for a variety of purposes, including hedging, risk management, portfolio management or to earn income. Derivatives are financial instruments whose value is based, in part, on the value of an underlying asset, interest rate, index or financial instrument. Prevailing interest rates and volatility levels, among other things, also affect the value of derivative instruments. A derivative instrument often has risks similar to its underlying asset and may have additional risks, including imperfect correlation between the value of the derivative and the underlying asset, risks of default by the counterparty to certain transactions, magnification of losses incurred due to changes in the market value of the securities, instruments, indices or interest rates to which the derivative instrument relates, risks that the transactions may not be liquid, risks arising from margin and payment requirements, risks arising from mispricing or valuation complexity and operational and legal risks. The use of derivatives involves risks that are different from, and possibly greater than, the risks associated with other portfolio investments. Derivatives may involve the use of highly specialized instruments that require investment techniques and risk analyses different from those associated with other portfolio investments. All of the Fund's holdings, including derivative instruments, are marked-to-market each day with the change in value reflected in unrealized appreciation (depreciation). Upon disposition, a realized gain or loss is recognized.
Certain derivative transactions may give rise to a form of leverage. Leverage magnifies the potential for gain and the risk of loss. Leverage associated with derivative transactions may cause the Fund to liquidate portfolio positions when it may not be advantageous to do so to satisfy its obligations or may cause the Fund to be more volatile than if the Fund had not been leveraged. Although the Adviser seeks to use derivatives to further the
28
Morgan Stanley Institutional Fund Trust
Annual Report — September 30, 2023
Notes to Financial Statements (cont'd)
Fund's investment objectives, there is no assurance that the use of derivatives will achieve this result.
Following is a description of the derivative instruments and techniques that the Fund used during the period and their associated risks:
Foreign Currency Forward Exchange Contracts: In connection with its investments in foreign securities, the Fund also entered into contracts with banks, brokers/dealers to purchase or sell foreign currencies at a future date. A foreign currency forward exchange contract ("currency contract") is a negotiated agreement between the contracting parties to exchange a specified amount of currency at a specified future time at a specified rate. The rate can be higher or lower than the spot rate between the currencies that are the subject of the contract. Currency contracts may be used to protect against uncertainty in the level of future foreign currency exchange rates or to gain or modify exposure to a particular currency. In addition, the Fund may use cross currency hedging or proxy hedging with respect to currencies in which the Fund has or expects to have portfolio or currency exposure. Cross currency hedges involve the sale of one currency against the positive exposure to a different currency and may be used for hedging purposes or to establish an active exposure to the exchange rate between any two currencies. To the extent hedged by the use of currency contracts, the precise matching of the currency contract amounts and the value of the securities involved will not generally be possible because the future value of such securities in foreign currencies will change as a consequence of market movements in the value of those securities between the date on which the contract is entered into and the date it matures. Furthermore, such transactions may reduce or preclude the opportunity for gain if the value of the currency should move in the direction opposite to the position taken. There is additional risk to the extent that currency contracts create exposure to currencies in which the Fund's securities are not denominated. Unanticipated changes in currency prices may result in poorer overall performance for the Fund than if it had not entered into such contracts. The use of currency contracts involves the risk of loss from the insolvency or bankruptcy of the counterparty to the contract or the failure of the counterparty to make payments or otherwise comply with the terms of the contract. A currency contract is
marked-to-market daily and the change in market value is recorded by the Fund as unrealized gain or loss. The Fund records realized gains (losses) when the currency contract is closed equal to the difference between the value of the currency contract at the time it was opened and the value at the time it was closed.
Futures: A futures contract is a standardized, exchange-traded agreement to buy or sell a specific quantity of an underlying asset, reference rate or index at a specific price at a specific future time. The value of a futures contract tends to increase and decrease in tandem with the value of the underlying instrument. Depending on the terms of the particular contract, futures contracts are settled through either physical delivery of the underlying instrument on the settlement date or by payment of a cash settlement amount on the settlement date. During the period the futures contract is open, payments are received from or made to the broker based upon changes in the value of the contract (the variation margin). A decision as to whether, when and how to use futures contracts involves the exercise of skill and judgment and even a well-conceived futures transaction may be unsuccessful because of market behavior or unexpected events. In addition to the derivatives risks discussed above, the prices of futures contracts can be highly volatile, using futures contracts can lower total return and the potential loss from futures contracts can exceed the Fund's initial investment in such contracts. No assurance can be given that a liquid market will exist for any particular futures contract at any particular time.
Swaps: The Fund may enter into OTC swap contracts or cleared swap transactions. A swap contract is an agreement between two parties pursuant to which the parties exchange payments at specified dates on the basis of a specified notional amount, with the payments calculated by reference to specified securities, indices, reference rates, currencies or other instruments. Typically swap agreements provide that when the period payment dates for both parties are the same, the payments are made on a net basis (i.e., the two payment streams are netted out, with only the net amount paid by one party to the other). The Fund's obligations or rights under a swap contract entered into on a net basis will generally be equal only to the net amount to be paid or received under the agreement, based on the relative values of the positions held by each party. Cleared swap transactions
29
Morgan Stanley Institutional Fund Trust
Annual Report — September 30, 2023
Notes to Financial Statements (cont'd)
may help reduce counterparty credit risk. In a cleared swap, the Fund's ultimate counterparty is a clearinghouse rather than a swap dealer, bank or other financial institution. OTC swap agreements are not entered into or traded on exchanges and often there is no central clearing or guaranty function for OTC swaps. These OTC swaps are often subject to credit risk or the risk of default or non-performance by the counterparty. Both OTC and cleared swaps could result in losses if interest rates, foreign currency exchange rates or other factors are not correctly anticipated by the Fund or if the reference index, security or investments do not perform as expected. During the period swap agreements are open, payments are received from or made to the counterparty or clearing-house based on changes in the value of the contract or variation margin, respectively. The Dodd-Frank Wall Street Reform and Consumer Protection Act and related regulatory developments require the clearing and exchange-trading of certain standardized swap transactions. Mandatory exchange-trading and clearing is occurring on a phased-in basis based on the type of market participant and U.S. Commodities Futures Trading Commission ("CFTC") approval of contracts for central clearing and exchange trading.
The Fund's use of swaps during the period included those based on the credit of an underlying security commonly referred to as "credit default swaps." The Fund may be either the buyer or seller in a credit default swap. Where the Fund is the buyer of a credit default swap contract, it would typically be entitled to receive the par (or other agreed-upon) value of a referenced debt obligation from the counterparty to the contract only in the event of a default or similar event by the issuer of the debt obligation. If no default occurs, the Fund would have paid to the counterparty a periodic stream of payments over the term of the contract and received no benefit from the contract. When the Fund is the seller of a credit default swap contract, it typically receives the stream of payments but is obligated to pay an amount equal to the par (or other agreed-upon) value of a referenced debt obligation upon the default or similar event by the issuer of the referenced debt obligation. The use of credit default swaps could result in losses to the Fund if the Adviser fails to correctly evaluate the creditworthiness of the issuer of the referenced debt obligation.
If the Fund is a seller of protection and a credit event occurs, as defined under the terms of that particular swap agreement, the Fund will either (i) pay to the buyer of protection an amount equal to the notional amount of the swap agreement and take delivery of the referenced obligation, other deliverable obligations or underlying securities comprising the referenced index or (ii) pay a net settlement amount in the form of cash or securities equal to the notional amount of the swap agreement less the recovery value of the referenced obligation or underlying securities comprising the referenced index. If the Fund is a buyer of protection and a credit event occurs, as defined under the terms of that particular swap agreement, the Fund will either (i) receive from the seller of protection an amount equal to the notional amount of the swap agreement and deliver the referenced obligation, other deliverable obligations or underlying securities comprising the referenced index or (ii) receive a net settlement amount in the form of cash or securities equal to the notional amount of the swap agreement less the recovery value of the referenced obligation or underlying securities comprising the referenced index. Recovery values are estimated by market makers considering either industry standard recovery rates or entity specific factors and considerations until a credit event occurs. If a credit event has occurred, the recovery value is determined by a facilitated auction whereby a minimum number of allowable broker bids, together with a specified valuation method, are used to calculate the settlement value. The Fund's maximum risk of loss from counterparty risk, either as the protection seller or as the protection buyer, is the fair value of the swap agreement.
The current credit rating of each individual issuer is listed in the table following the Portfolio of Investments and serves as an indicator of the current status of the payment/performance risk of the credit derivative. Alternatively, for credit default swaps on an index of credits, the quoted market prices and current values serve as an indicator of the current status of the payment/performance risk of the credit derivative. Generally, lower credit ratings and increasing market values, in absolute terms, represent a deterioration of the credit and a greater likelihood of an adverse credit event of the issuer.
30
Morgan Stanley Institutional Fund Trust
Annual Report — September 30, 2023
Notes to Financial Statements (cont'd)
When the Fund has an unrealized loss on a swap agreement, the Fund has instructed the custodian to pledge cash or liquid securities as collateral with a value approximately equal to the amount of the unrealized loss. Collateral pledges are monitored and subsequently adjusted if and when the swap valuations fluctuate. If applicable, cash collateral is included with "Due from (to) Broker" in the Statement of Assets and Liabilities.
Upfront payments paid or received by the Fund will be reflected as an asset or liability, respectively, in the Statement of Assets and Liabilities.
FASB ASC 815, "Derivatives and Hedging" ("ASC 815"), is intended to improve financial reporting about derivative instruments by requiring enhanced disclosures to enable investors to better understand how and why the Fund uses derivative instruments, how these derivative instruments are accounted for and their effects on the Fund's financial position and results of operations.
The following tables set forth the fair value of the Fund's derivative contracts by primary risk exposure as of September 30, 2023:
| | | Asset Derivatives
Statement of Assets and
Liabilities Location | | Primary Risk
Exposure | | Value
(000) | |
Foreign Currency
Forward Exchange
Contracts | | Unrealized Appreciation on
Foreign Currency Forward
Exchange Contracts | |
Currency Risk | | $ | 1,010 | | |
Futures Contracts | | Variation Margin on
Futures Contracts | | Interest Rate Risk | | | 85 | (a) | |
Total | | | | | | $ | 1,095 | | |
| | | Liability Derivatives
Statement of Assets and
Liabilities Location | | Primary Risk
Exposure | | Value
(000) | |
Foreign Currency
Forward Exchange
Contracts | | Unrealized Depreciation on
Foreign Currency Forward
Exchange Contracts | |
Currency Risk | | $ | (263 | ) | |
Futures Contracts | | Variation Margin on
Futures Contracts | | Interest Rate Risk | | | (3,951 | )(a) | |
Swap Agreement | | Variation Margin on
Swap Agreement | | Credit Risk | | | (34 | )(a) | |
Total | | | | | | $ | (4,248 | ) | |
(a) This amount represents the cumulative appreciation (depreciation) as reported in the Portfolio of Investments. The Statement of Assets and Liabilities only reflects the current day's net variation margin.
The following tables set forth by primary risk exposure the Fund's realized gains (losses) and change in unrealized appreciation (depreciation) by type of derivative contract for the year ended September 30, 2023 in accordance with ASC 815:
Realized Gain (Loss) | |
Primary Risk Exposure | | Derivative Type | | Value
(000) | |
Currency Risk | | Foreign Currency Forward
Exchange Contracts | | $ | (236 | ) | |
Interest Rate Risk | | Futures Contracts | | | (15,470 | ) | |
Credit Risk | | Swap Agreement | | | (1,470 | ) | |
Total | | | | $ | (17,176 | ) | |
Change in Unrealized Appreciation (Depreciation) | |
Primary Risk Exposure | | Derivative Type | | Value
(000) | |
Currency Risk | | Foreign Currency Forward
Exchange Contracts | | $ | (1,792 | ) | |
Interest Rate Risk | | Futures Contracts | | | 3,370 | | |
Credit Risk | | Swap Agreement | | | 61 | | |
Total | | | | $ | 1,639 | | |
At September 30, 2023, the Fund's derivative assets and liabilities are as follows:
Gross Amounts of Assets and Liabilities
Presented in the Statement of Assets and Liabilities | |
Derivatives(a) | | Assets(b)
(000) | | Liabilities(b)
(000) | |
Foreign Currency Forward Exchange Contracts | | $ | 1,010 | | | $ | (263 | ) | |
(a) Excludes exchange-traded derivatives.
(b) Absent an event of default or early termination, OTC derivative assets and liabilities are presented gross and not offset in the Statement of Assets and Liabilities.
The Fund typically enters into International Swaps and Derivatives Association, Inc. Master Agreements ("ISDA Master Agreements") or similar master agreements (collectively, "Master Agreements") with its contract counterparties for certain OTC derivatives in order to, among other things, reduce its credit risk to counterparties. ISDA Master Agreements include provisions for general obligations, representations, collateral and events of default or termination. Under an ISDA Master Agreement, the Fund typically may offset with the counterparty certain OTC derivative financial instruments' payables and/or receivables with collateral held and/or posted and create one single net payment (close-out netting) in the event of default, termination and/or potential deterioration in the credit quality of the counterparty. Various Master Agreements govern the terms of certain transactions with counterparties, including transactions such as swap, forward, repurchase and reverse repurchase agreements. These Master Agreements typically attempt to reduce the counterparty risk associated with such transactions by specifying credit protection mechanisms and providing standardization that
31
Morgan Stanley Institutional Fund Trust
Annual Report — September 30, 2023
Notes to Financial Statements (cont'd)
improves legal certainty. Cross-termination provisions under Master Agreements typically provide that a default in connection with one transaction between the Fund and a counterparty gives the non-defaulting party the right to terminate any other transactions in place with the defaulting party to create one single net payment due to/due from the defaulting party and may be a feature in certain Master Agreements. In the event the Fund exercises its right to terminate a Master Agreement after a counterparty experiences a termination event as defined in the Master Agreement, the return of collateral with market value in excess of the Fund's net liability may be delayed or denied.
The following tables present derivative financial instruments that are subject to enforceable netting arrangements as of September 30, 2023:
Gross Amounts Not Offset in the Statement of Assets and Liabilities | |
Counterparty | | Gross Asset
Derivatives
Presented in
the Statement
of Assets and
Liabilities
(000) | | Financial
Instrument
(000) | | Collateral
Received
(000) | | Net Amount
(not less
than $0)
(000) | |
BNP Paribas SA | | $ | 463 | | | $ | — | | | $ | — | | | $ | 463 | | |
JPMorgan Chase Bank NA | | | 219 | | | | (208 | ) | | | — | | | | 11 | | |
UBS AG | | | 328 | | | | — | | | | (271 | ) | | | 57 | | |
Total | | $ | 1,010 | | | $ | (208 | ) | | $ | (271 | ) | | $ | 531 | | |
Gross Amounts Not Offset in the Statement of Assets and Liabilities | |
Counterparty | | Gross Liability
Derivatives
Presented in
the Statement
of Assets and
Liabilities
(000) | | Financial
Instrument
(000) | | Collateral
Pledged
(000) | | Net Amount
(not less
than $0)
(000) | |
Australia & New Zealand
Banking Group Ltd | | $ | — | @ | | $ | — | | | $ | — | | | $ | — | @ | |
Bank of America NA | | | 49 | | | | — | | | | — | | | | 49 | | |
Barclays Bank PLC | | | 3 | | | | — | | | | — | | | | 3 | | |
Citibank NA | | | 3 | | | | — | | | | — | | | | 3 | | |
JPMorgan Chase Bank NA | | | 208 | | | | (208 | ) | | | — | | | | 0 | | |
Total | | $ | 263 | | | $ | (208 | ) | | $ | — | | | $ | 55 | | |
@ Value is less than $500.
For the year ended September 30, 2023, the approximate average monthly amount outstanding for each derivative type is as follows:
Foreign Currency Forward Exchange Contracts: | |
Average monthly principal amount | | $ | 52,889,000 | | |
Futures Contracts: | |
Average monthly notional value | | $ | 207,622,000 | | |
Swap Agreements: | |
Average monthly notional amount | | $ | 12,158,000 | | |
5. Securities Lending: The Fund lends securities to qualified financial institutions, such as broker/dealers, to earn additional income. Any increase or decrease in the fair value of the securities loaned that might occur and any interest earned or dividends declared on those securities during the term of the loan would remain in the Fund. The Fund would receive cash or securities as collateral in an amount equal to or exceeding 100% of the current fair value of the loaned securities. The collateral is marked-to-market daily by State Street Bank and Trust Company ("State Street"), the securities lending agent, to ensure that a minimum of 100% collateral coverage is maintained.
Based on pre-established guidelines, the securities lending agent invests any cash collateral that is received in an affiliated money market portfolio and repurchase agreements. Securities lending income is generated from the earnings on the invested collateral and borrowing fees, less any rebates owed to the borrowers and compensation to the lending agent, and is recorded as "Income from Securities Loaned — Net" in the Fund's Statement of Operations. Risks in securities lending transactions are that a borrower may not provide additional collateral when required or return the securities when due, and that the value of the short-term investments will be less than the amount of cash collateral plus any rebate that is required to be returned to the borrower.
The Fund has the right under the securities lending agreement to recover the securities from the borrower on demand.
The following table presents financial instruments that are subject to enforceable netting arrangements as of September 30, 2023:
Gross Amounts Not Offset in the Statement of Assets and Liabilities | |
Gross Asset
Amount
Presented in
the Statement
of Assets and
Liabilities
(000) | | Financial
Instrument
(000) | | Collateral
Received
(000) | | Net Amount
(not less
than $0)
(000) | |
| $ | 25,307 | (a) | | $ | — | | | $ | (25,307 | )(b)(c) | | $ | 0 | | |
(a) Represents market value of loaned securities at year end.
(b) The Fund received cash collateral of approximately $2,451,000, which was subsequently invested in Morgan Stanley Institutional Liquidity Funds as reported in the Portfolio of Investments. In addition, the Fund received non-cash collateral of approximately $23,338,000 in the form of U.S. Government obligations, which the Fund cannot sell or repledge, and accordingly are not reflected in the Portfolio of Investments.
(c) The actual collateral received is greater than the amount shown here due to overcollateralization.
32
Morgan Stanley Institutional Fund Trust
Annual Report — September 30, 2023
Notes to Financial Statements (cont'd)
FASB ASC 860, "Transfers & Servicing: Repurchase-to-Maturity Transactions, Repurchase Financings, and Disclosures", is intended to provide increased transparency about the types of collateral pledged in securities lending transactions and other similar transactions that are accounted for as secured borrowings.
The following table displays a breakdown of transactions accounted for as secured borrowings, the gross obligations by class of collateral pledged and the remaining contractual maturity of those transactions as of September 30, 2023:
Remaining Contractual Maturity of the Agreements | |
| | | Overnight and
Continuous
(000) | | <30 days
(000) | | Between
30 &
90 days
(000) | | >90 days
(000) | | Total
(000) | |
Securities Lending
Transactions | |
Corporate Bonds | | $ | 2,451 | | | $ | — | | | $ | — | | | $ | — | | | $ | 2,451 | | |
Total Borrowings | | $ | 2,451 | | | $ | — | | | $ | — | | | $ | — | | | $ | 2,451 | | |
Gross amount of
recognized liabilities
for securities lending
transactions | | | | | | | | | | $ | 2,451 | | |
6. When-Issued/Delayed Delivery Securities: The Fund purchases and sells when-issued and delayed delivery securities. Securities purchased on a when-issued or delayed delivery basis are purchased for delivery beyond the normal settlement date at a stated price and yield, and no income accrues to the Fund on such securities prior to delivery date. Payment and delivery for when-issued and delayed delivery securities can take place a month or more after the date of the transaction. When the Fund enters into a purchase transaction on a when-issued or delayed delivery basis, securities are available for collateral in an amount at least equal in value to the Fund's commitments to purchase such securities. Purchasing securities on a when- issued or delayed delivery basis may involve a risk that the market price at the time of delivery may be lower than the agreed upon purchase price, in which case there could be an unrealized loss at the time of delivery. Purchasing investments on a when-issued or delayed delivery basis may be considered a form of leverage which may increase the impact that gains (losses) may have on the Fund.
7. Indemnifications: The Trust enters into contracts that contain a variety of indemnification clauses. The Trust's maximum exposure under these arrangements is unknown as this would involve future claims that may be made against the Fund that have not yet occurred.
8. Dividends and Distributions to Shareholders: Dividends and distributions to shareholders are recorded on the ex-dividend date. Dividends from net investment income, if any, are declared and paid monthly. Net realized capital gains, if any, are distributed at least annually.
9. Security Transactions, Income and Expenses: Security transactions are accounted for on the trade date (date the order to buy or sell is executed). Realized gains and losses on the sale of investment securities are determined on the specific identified cost method. Dividend income and other distributions are recorded on the ex-dividend date (except for certain foreign dividends which may be recorded as soon as the Fund is informed of such dividends) net of applicable withholding taxes. Non-cash dividends received in the form of stock, if any, are recognized on the ex-dividend date and recorded as non-cash dividend income at fair value. Interest income is recognized on the accrual basis (except where collection is in doubt) net of applicable withholding taxes. Discounts are accreted and premiums are amortized over the life of the respective securities. Most expenses of the Trust can be directly attributed to a particular Fund. Expenses which cannot be directly attributed are apportioned among the Funds based upon relative net assets or other appropriate methods. Income, expenses (other than class specific expenses — distribution and shareholder services, transfer agency and sub transfer agency fees) and realized and unrealized gains or losses are allocated to each class of shares based upon their relative net assets.
B. Advisory Fees: The Adviser, a wholly-owned subsidiary of Morgan Stanley, provides the Fund with advisory services under the terms of an Investment Advisory Agreement, paid quarterly, at the annual rate based on the average daily net assets as follows:
First $1
billion | | Over $1
billion | |
| | 0.375 | % | | | 0.300 | % | |
For the year ended September 30, 2023, the advisory fee rate (net of waiver/rebate) was equivalent to an annual effective rate of 0.18% of the Fund's average daily net assets.
The Adviser has agreed to reduce its advisory fee and/or reimburse the Fund so that total annual Fund operating expenses, excluding certain investment related expenses, taxes, interest and other extraordinary expenses (including litigation), will not exceed 0.42% for Class I shares, 0.77% for Class A shares, 1.02% for Class L shares, 1.52% for Class C shares and 0.37%
33
Morgan Stanley Institutional Fund Trust
Annual Report — September 30, 2023
Notes to Financial Statements (cont'd)
for Class R6 shares. The fee waivers and/or expense reimbursements will continue for at least one year from the date of the Fund's prospectus or until such time as the Trustees act to discontinue all or a portion of such waivers and/or reimbursements when they deem such action is appropriate. For the year ended September 30, 2023, approximately $1,019,000 of advisory fees were waived and approximately $170,000 of other expenses were reimbursed by the Adviser pursuant to this arrangement.
C. Administration Fees: The Adviser also serves as Administrator to the Trust and provides administrative services pursuant to an Administration Agreement for an annual fee, accrued daily and paid monthly, of 0.08% of the Fund's average daily net assets.
Under a Sub-Administration Agreement between the Administrator and State Street, State Street provides certain administrative services to the Trust. For such services, the Administrator pays State Street a portion of the fee the Administrator receives from the Fund.
D. Distribution and Shareholder Services Fees: Morgan Stanley Distribution, Inc. ("MSDI" or the "Distributor"), a wholly-owned subsidiary of the Adviser and an indirect subsidiary of Morgan Stanley, serves as the Trust's Distributor of Fund shares pursuant to a Distribution Agreement. The Trust has adopted a Shareholder Services Plan with respect to Class A shares pursuant to Rule 12b-1 under the Act. Under the Shareholder Services Plan, the Fund pays the Distributor a shareholder services fee, accrued daily and paid monthly, at an annual rate of 0.25% of the Fund's average daily net assets attributable to Class A shares.
The Trust has adopted a Distribution and Shareholder Services Plan with respect to Class L shares pursuant to Rule 12b-1 under the Act. Under the Distribution and Shareholder Services Plan, the Fund pays the Distributor a distribution fee, accrued daily and paid monthly, at an annual rate of 0.50% and a shareholder services fee, accrued daily and paid monthly, at an annual rate of 0.25% of the Fund's average daily net assets attributable to Class L shares.
The Trust has adopted a Distribution and Shareholder Services Plan with respect to Class C shares pursuant to Rule 12b-1 under the Act. Under the Distribution and Shareholder Services Plan, the Fund pays the Distributor a distribution fee, accrued daily and paid monthly, at an annual rate of 0.75% and a shareholder services fee, accrued daily and paid monthly, at an
annual rate of 0.25% of the Fund's average daily net assets attributable to Class C shares.
The distribution and shareholder services fees are used to support the expenses associated with servicing and maintaining accounts. The Distributor may compensate other parties for providing distribution-related and/or shareholder support services to investors who purchase Class A, Class L and Class C shares.
E. Dividend Disbursing and Transfer/Co-Transfer Agent: The Trust's dividend disbursing and transfer agent is SS&C Global Investor & Distribution Solutions, Inc. ("SS&C GIDS"). Pursuant to a Transfer Agency Agreement, the Trust pays SS&C GIDS a fee based on the number of classes, accounts and transactions relating to the Funds of the Trust.
Eaton Vance Management ("EVM"), an affiliate of Morgan Stanley, provides co-transfer agency and related services to the Fund pursuant to a Co-Transfer Agency Services Agreement. For the year ended September 30, 2023, co-transfer agency fees and expenses incurred to EVM, included in "Transfer Agency Fees" in the Statement of Operations, amounted to approximately $2,000.
F. Custodian Fees: State Street (the "Custodian") also serves as Custodian for the Trust in accordance with a Custodian Agreement. The Custodian holds cash, securities and other assets of the Trust as required by the Act. Custody fees are payable monthly based on assets held in custody, investment purchases and sales activity and account maintenance fees, plus reimbursement for certain out-of-pocket expenses.
G. Security Transactions and Transactions with Affiliates: For the year ended September 30, 2023, purchases and sales of investment securities for the Fund, other than long-term U.S. Government securities and short-term investments were approximately $149,119,000 and $274,804,000, respectively. For the year ended September 30, 2023, purchases and sales of long-term U.S. Government securities were approximately $2,325,928,000 and $2,305,404,000, respectively.
The Fund invests in the Institutional Class of the Morgan Stanley Institutional Liquidity Funds — Government Portfolio (the "Liquidity Funds"), an open-end management investment company managed by the Adviser, both directly and as a portion of the securities held as collateral on loaned securities. Advisory fees paid by the Fund are reduced by an amount equal to its pro-rata share of the advisory and administration
34
Morgan Stanley Institutional Fund Trust
Annual Report — September 30, 2023
Notes to Financial Statements (cont'd)
fees paid by the Fund due to its investment in the Liquidity Funds. For the year ended September 30, 2023, advisory fees paid were reduced by approximately $112,000 relating to the Fund's investment in the Liquidity Funds.
A summary of the Fund's transactions in shares of affiliated investments during the year ended September 30, 2023 is as follows:
Affiliated
Investment
Company | | Value
September 30,
2022
(000) | | Purchases
at Cost
(000) | | Proceeds
from Sales
(000) | | Dividend
Income
(000) | |
Liquidity Funds | | $ | 87,634 | | | $ | 321,699 | | | $ | 352,461 | | | $ | 3,290 | | |
Affiliated
Investment
Company (cont'd) | | Realized
Gain
(Loss)
(000) | | Change in
Unrealized
Appreciation
(Depreciation)
(000) | | Value
September 30,
2023
(000) | |
Liquidity Funds | | $ | — | | | $ | — | | | $ | 56,872 | | |
The Fund has an unfunded Deferred Compensation Plan (the "Compensation Plan"), which allows each independent Trustee to defer payment of all, or a portion, of the fees he or she receives for serving on the Board of Trustees. Each eligible Trustee generally may elect to have the deferred amounts credited with a return equal to the total return on one or more of the Morgan Stanley funds that are offered as investment options under the Compensation Plan. Appreciation/depreciation and distributions received from these investments are recorded with an offsetting increase/decrease in the deferred compensation obligation and do not affect the NAV of the Fund.
H. Federal Income Taxes: It is the Fund's intention to continue to qualify as a regulated investment company and distribute all of its taxable and tax-exempt income. Accordingly, no provision for federal income taxes is required in the financial statements.
The Fund may be subject to taxes imposed by countries in which it invests. Such taxes are generally based on income and/or capital gains earned or repatriated. Taxes are accrued based on net investment income, net realized gains and net unrealized appreciation as such income and/or gains are earned. Taxes may also be based on transactions in foreign currency and are accrued based on the value of investments denominated in such currency.
FASB ASC 740-10, "Income Taxes — Overall", sets forth a minimum threshold for financial statement recognition of the benefit of a tax position taken or expected to be taken in a tax return. Management has concluded there are no significant uncertain tax positions that would require recognition in the financial statements. If applicable, the Fund recognizes interest
accrued related to unrecognized tax benefits in "Interest Expense" and penalties in "Other Expenses" in the Statement of Operations. The Fund files tax returns with the U.S. Internal Revenue Service, New York and various states. Generally, each of the tax years in the four-year period ended September 30, 2023 remains subject to examination by taxing authorities.
The tax character of distributions paid may differ from the character of distributions shown for GAAP purposes due to short-term capital gains being treated as ordinary income for tax purposes. The tax character of distributions paid during fiscal years 2023 and 2022 was as follows:
2023
Distributions
Paid From: | | 2022
Distributions
Paid From: | |
Ordinary
Income
(000) | | Long-Term
Capital Gain
(000) | | Ordinary
Income
(000) | | Long-Term
Capital Gain
(000) | |
| $ | 30,270 | | | $ | — | | | $ | 21,875 | | | $ | 2,476 | | |
The amount and character of income and gains to be distributed are determined in accordance with income tax regulations which may differ from GAAP. These book/tax differences are either considered temporary or permanent in nature.
Temporary differences are attributable to differing book and tax treatments for the timing of the recognition of gains (losses) on certain investment transactions and the timing of the deductibility of certain expenses.
The Fund had no permanent differences causing reclassifications among the components of net assets for the year ended September 30, 2023.
At September 30, 2023, the components of distributable earnings for the Fund on a tax basis were as follows:
Undistributed
Ordinary
Income
(000) | | Undistributed
Long-Term
Capital Gain
(000) | |
| $ | 3,188 | | | $ | — | | |
At September 30, 2023, the Fund had available for federal income tax purposes unused short-term and long-term capital losses of approximately $47,151,000 and $66,762,000, respectively, that do not have an expiration date.
To the extent that capital loss carryforwards are used to offset any future capital gains realized, no capital gains tax liability will be incurred by the Fund for gains realized and not distributed. To the extent that capital gains are offset, such gains will not be distributed to the shareholders.
I. Credit Facility: The Trust and other Morgan Stanley funds participated in a $300,000,000 committed, unsecured revolving
35
Morgan Stanley Institutional Fund Trust
Annual Report — September 30, 2023
Notes to Financial Statements (cont'd)
line of credit facility (the "Facility") with State Street. Effective April 17, 2023, the committed line amount increased to $500,000,000. This Facility is to be used for temporary emergency purposes or funding of shareholder redemption requests. The interest rate for any funds drawn will be based on the federal funds rate or overnight bank funding rate plus a spread. The Facility also has a commitment fee of 0.25% per annum based on the unused portion of the Facility, which is allocated among participating funds based on relative net assets. During the twelve months ended September 30, 2023, the Fund did not have any borrowings under the Facility.
J. Other: At September 30, 2023, the Fund had record owners of 10% or greater. Investment activities of these shareholders could have a material impact on the Fund. The aggregate percentage of such owners was 51.0%.
K. Market Risk: An investment in the Fund is based on the values of the Fund's investments, which may change due to economic and other events that affect markets generally, as well as those that affect particular regions, countries, industries, companies or governments. The risks associated with these developments may be magnified if social, political, economic and other conditions and events (such as war, natural disasters, health emergencies (e.g., epidemics and pandemics), terrorism, conflicts, social unrest, recessions, inflation, rapid interest rate changes and supply chain disruptions) adversely interrupt the global economy and financial markets. It is difficult to predict when events affecting the U.S. or global financial markets may occur, the effects that such events may have and the duration of those effects (which may last for extended periods). These events may negatively impact broad segments of businesses and populations and have a significant and rapid negative impact on the performance of the Fund's investments, adversely affect and increase the volatility of the Fund's share price and exacerbate pre-existing risks to the Fund. The occurrence, duration and extent of these or other types of adverse economic and market conditions and uncertainty over the long term cannot be reasonably projected or estimated at this time. The ultimate impact of public health emergencies or other adverse economic or market developments and the extent to which the associated conditions impact the Fund and its investments will also depend on other future developments, which are highly uncertain, difficult to accurately predict and subject to change at any time. The financial performance of the Fund's investments (and, in turn, the Fund's investment results) as well as their liquidity may be adversely affected because of these and similar types of factors and developments.
L. LIBOR Discontinuance or Unavailability Risk: The London Interbank Offering Rate ("LIBOR") was a leading floating rate benchmark used in loans, notes, derivatives and other instruments or investments. As a result of benchmark reforms, publication of most LIBOR settings has ceased. Some LIBOR settings continue to be published but only on a temporary, synthetic and non-representative basis. Regulated entities have generally ceased entering into new LIBOR contracts in connection with regulatory guidance or prohibitions. Public and private sector actors have worked to establish new or alternative reference rates to be used in place of LIBOR. There is no assurance that the composition or characteristics of any such new or alternative reference rate will be similar to or produce the same value or economic equivalence as LIBOR or that it will have the same volume or liquidity as did LIBOR , which may affect the value or liquidity or return on certain of the Fund's investments and result in costs incurred in connection with closing out positions and entering into new trades.
Neither the effect of the LIBOR transition process nor its ultimate success can yet be known. The transition process might lead to increased volatility and illiquidity in markets for, and reduce the effectiveness of hedges placed against, instruments whose terms currently include (or previously included) LIBOR. While some LIBOR-based instruments contemplated a scenario where LIBOR is no longer available by providing for an alternative rate-setting methodology, there may be significant uncertainty regarding the effectiveness of any such alternative methodologies to replicate or replace LIBOR. Some of the Fund's investments may be so-called "tough legacy" LIBOR instruments which may not have effective alternative rate-setting provisions or may involve counterparties who are unwilling to add or exercise rights under alternative rate-setting provisions in such instruments. On March 15, 2022, the Adjustable Interest Rate (LIBOR) Act was signed into law. This law provides a statutory fallback mechanism on a nationwide basis to replace U.S. Dollar LIBOR with a benchmark rate that is selected by the Board of Governors of the Federal Reserve System based on the Secured Overnight Financing Rate ("SOFR") for tough legacy contracts. On February 27, 2023, the final rule in connection with this law became effective, establishing benchmark replacements based on SOFR and Term SOFR (a forward-looking measurement of market expectations of SOFR implied from certain derivatives markets) for applicable tough legacy contracts governed by U.S. law. In addition, the FCA has announced that it will require the publication of the one-month, three-month and six-month U.S. Dollar
36
Morgan Stanley Institutional Fund Trust
Annual Report — September 30, 2023
Notes to Financial Statements (cont'd)
LIBOR settings on the basis of a changed methodology (known as "synthetic LIBOR"), after June 30, 2023 through at least September 30, 2024, addressing non-U.S. law governed U.S. Dollar LIBOR instruments, but this synthetic LIBOR will be designated by the FCA as unrepresentative of the underlying market that it seeks to measure and will be solely available for use in legacy transactions. The transition of investments from LIBOR to a new or replacement rate as a result of amendment, application of existing fallbacks, statutory requirements, the application of synthetic LIBOR or otherwise may also result in a reduction in the value of certain instruments held by the Fund or a reduction in the effectiveness of related Fund transactions such as hedges. In addition, a liquid market for newly-issued instruments that use a reference rate other than LIBOR is still developing. There may also be challenges for the Fund to enter into hedging transactions against such newly-issued instruments until a market for such hedging transactions more fully develops. All of the aforementioned may adversely affect the Fund's investments (including their volatility, value and liquidity) and, as a result, the performance or NAV.
M. Subsequent Event: At a meeting held on September 27-28, 2023, the Trustees unanimously approved the reorganization of the Fund into an exchange-traded fund ("ETF"), which will be managed by Morgan Stanley Investment Management Inc. The Trustees, including all of the Trustees who are not "interested persons" (as defined in the Investment Company Act of 1940, as amended) of the Fund, determined that participation in the reorganization is in the best interests of the Fund and the interests of existing shareholders of the Fund will not be diluted as a result of the reorganization. Subject to shareholder approval, the Fund will be reorganized into an ETF through the reorganization of the Fund into a newly-created ETF — Eaton Vance Total Return Bond ETF, which is a series of Morgan Stanley ETF Trust. If approved by shareholders, the reorganization is anticipated to occur (after the close of trading) on or about March 22, 2024 (the "Closing Date").
37
Morgan Stanley Institutional Fund Trust
Annual Report — September 30, 2023
Report of Independent Registered Public Accounting Firm
To the Shareholders and Board of Trustees of
Morgan Stanley Institutional Fund Trust —
Core Plus Fixed Income Portfolio
Opinion on the Financial Statements
We have audited the accompanying statement of assets and liabilities of Core Plus Fixed Income Portfolio (the "Fund") (one of the funds constituting Morgan Stanley Institutional Fund Trust (the "Trust")), including the portfolio of investments, as of September 30, 2023, and the related statement of operations for the year then ended, the statements of changes in net assets for each of the two years in the period then ended, the financial highlights for each of the five years in the period then ended and the related notes (collectively referred to as the "financial statements"). In our opinion, the financial statements present fairly, in all material respects, the financial position of the Fund (one of the funds constituting Morgan Stanley Institutional Fund Trust) at September 30, 2023, the results of its operations for the year then ended, the changes in its net assets for each of the two years in the period then ended and its financial highlights for each of the five years in the period then ended, in conformity with U.S. generally accepted accounting principles.
Basis for Opinion
These financial statements are the responsibility of the Trust's management. Our responsibility is to express an opinion on the Fund's financial statements based on our audits. We are a public accounting firm registered with the Public Company Accounting Oversight Board (United States) ("PCAOB") and are required to be independent with respect to the Trust in accordance with the U.S. federal securities laws and the applicable rules and regulations of the Securities and Exchange Commission and the PCAOB.
We conducted our audits in accordance with the standards of the PCAOB. Those standards require that we plan and perform the audit to obtain reasonable assurance about whether the financial statements are free of material misstatement, whether due to error or fraud. The Trust is not required to have, nor were we engaged to perform, an audit of the Trust's internal control over financial reporting. As part of our audits, we are required to obtain an understanding of internal control over financial reporting but not for the purpose of expressing an opinion on the effectiveness of the Trust's internal control over financial reporting. Accordingly, we express no such opinion.
Our audits included performing procedures to assess the risks of material misstatement of the financial statements, whether due to error or fraud, and performing procedures that respond to those risks. Such procedures included examining, on a test basis, evidence regarding the amounts and disclosures in the financial statements. Our procedures included confirmation of securities owned as of September 30, 2023 by correspondence with the custodian, brokers and others; when replies were not received from brokers and others, we performed other auditing procedures. Our audits also included evaluating the accounting principles used and significant estimates made by management, as well as evaluating the overall presentation of the financial statements. We believe that our audits provide a reasonable basis for our opinion.

We have served as the auditor of one or more Morgan Stanley investment companies since 2000.
Boston, Massachusetts
November 27, 2023
38
Morgan Stanley Institutional Fund Trust
Annual Report — September 30, 2023
Investment Advisory Agreement Approval (unaudited)
Nature, Extent and Quality of Services
The Board reviewed and considered the nature and extent of the investment advisory services provided by the Adviser under the advisory agreement, including portfolio management, investment research and equity and fixed income securities trading. The Board also reviewed and considered the nature and extent of the non-advisory, administrative services provided by the Administrator under the administration agreement, including accounting, operations, clerical, bookkeeping, compliance, business management and planning, legal services and the provision of supplies, office space and utilities at the Adviser's expense. The Board also considered the Adviser's investment in personnel and infrastructure that benefits the Fund. (The Adviser and Administrator together are referred to as the "Adviser" and the advisory and administration agreements together are referred to as the "Management Agreement.") The Board also considered that the Adviser serves a variety of other investment advisory clients and has experience overseeing service providers. The Board also compared the nature of the services provided by the Adviser with similar services provided by non-affiliated advisers as prepared by Broadridge Financial Solutions, Inc. ("Broadridge").
The Board reviewed and considered the qualifications of the portfolio managers, the senior administrative managers and other key personnel of the Adviser who provide the advisory and administrative services to the Fund. The Board determined that the Adviser's portfolio managers and key personnel are well qualified by education and/or training and experience to perform the services in an efficient and professional manner. The Board concluded that the nature and extent of the advisory and administrative services provided were necessary and appropriate for the conduct of the business and investment activities of the Fund and supported its decision to approve the Management Agreement.
Performance, Fees and Expenses of the Fund
The Board reviewed the performance, fees and expenses of the Fund compared to its peers, as prepared by Broadridge, and to appropriate benchmarks where applicable. The Board discussed with the Adviser the performance goals and the actual results achieved in managing the Fund. When considering a fund's performance, the Board and the Adviser place emphasis on trends and longer-term returns (focusing on one-year, three-year and five-year performance, as of December 31, 2022, or since inception, as applicable). When a fund underperforms its benchmark and/or its peer group average, the Board and the Adviser discuss the causes of such underperformance and, where necessary, they discuss specific changes to investment strategy or investment personnel. The Board noted that the Fund's performance was better than its peer group average for the five-year period but below its peer group average for the one- and three-year periods. The Board discussed with the Adviser the level of the advisory and administration fees (together, the "management fee") for this Fund relative to comparable funds and/or other accounts advised by the Adviser and/or compared to its peers as prepared by Broadridge. In addition to the management fee, the Board also reviewed the Fund's total expense ratio. The Board noted that the Fund's management fee and total expense ratio were lower than its peer group averages. After discussion, the Board concluded that the Fund's (i) performance was acceptable and (ii) management fee and total expense ratio were competitive with its peer group averages.
Economies of Scale
The Board considered the size and growth prospects of the Fund and how that relates to the Fund's total expense ratio and particularly the Fund's management fee rate, which includes a breakpoint. In conjunction with its review of the Adviser's profitability, the Board discussed with the Adviser how a change in assets can affect the efficiency or effectiveness of managing the Fund and whether the management fee level is appropriate relative to current and projected asset levels and/or whether the management fee structure reflects economies of scale as asset levels change. The Board has determined that its review of the actual and/or potential economies of scale of the Fund supports its decision to approve the Management Agreement.
Profitability of the Adviser and Affiliates
The Board considered information concerning the costs incurred and profits realized by the Adviser and its affiliates during the last year from their relationship with the Fund and during the last two years from their relationship with the Morgan Stanley Fund Complex and reviewed with the Adviser the cost allocation methodology used to determine the profitability of the Adviser and affiliates. The Board has determined that its review of the analysis of the Adviser's expenses and profitability supports its decision to approve the Management Agreement.
39
Morgan Stanley Institutional Fund Trust
Annual Report — September 30, 2023
Investment Advisory Agreement Approval (unaudited) (cont'd)
Other Benefits of the Relationship
The Board considered other direct and indirect benefits to the Adviser and/or its affiliates derived from their relationship with the Fund and other funds advised by the Adviser. These benefits may include, among other things, fees for trading, distribution and/or shareholder servicing and for transaction processing and reporting platforms used by securities lending agents, and research received by the Adviser generated from commission dollars spent on funds' portfolio trading. The Board reviewed with the Adviser these arrangements and the reasonableness of the Adviser's costs relative to the services performed. The Board has determined that its review of the other benefits received by the Adviser or its affiliates supports its decision to approve the Management Agreement.
Resources of the Adviser and Historical Relationship Between the Fund and the Adviser
The Board considered whether the Adviser is financially sound and has the resources necessary to perform its obligations under the Management Agreement. The Board also reviewed and considered the historical relationship between the Fund and the Adviser, including the organizational structure of the Adviser, the policies and procedures formulated and adopted by the Adviser for managing the Fund's operations and the Board's confidence in the competence and integrity of the senior managers and key personnel of the Adviser. The Board concluded that the Adviser has the financial resources necessary to fulfill its obligations under the Management Agreement and that it is beneficial for the Fund to continue its relationship with the Adviser.
Other Factors and Current Trends
The Board considered the controls and procedures adopted and implemented by the Adviser and monitored by the Fund's Chief Compliance Officer and concluded that the conduct of business by the Adviser indicates a good faith effort on its part to adhere to high ethical standards in the conduct of the Fund's business.
General Conclusion
After considering and weighing all of the above factors, with various written materials and verbal information presented by the Adviser, the Board concluded that it would be in the best interest of the Fund and its shareholders to approve renewal of the Management Agreement for another year. In reaching this conclusion the Board did not give particular weight to any single piece of information or factor referenced above. The Board considered these factors and information over the course of the year and in numerous meetings, some of which were in executive session with only the independent Board members and their counsel present. It is possible that individual Board members may have weighed these factors, and the information presented, differently in reaching their individual decisions to approve the Management Agreement.
40
Morgan Stanley Institutional Fund Trust
Annual Report — September 30, 2023
Liquidity Risk Management Program (unaudited)
In compliance with Rule 22e-4 under the Investment Company Act of 1940, as amended (the "Liquidity Rule"), the Fund has adopted and implemented a liquidity risk management program (the "Program"), which is reasonably designed to assess and manage the risk that the Fund could not meet requests to redeem shares issued by the Fund without significant dilution of remaining investors' interests in the Fund (i.e., liquidity risk). The Fund's Board of Trustees (the "Board") previously approved the designation of the Liquidity Risk Subcommittee (the "LRS") as Program administrator. The LRS is comprised of representatives from various divisions within Morgan Stanley Investment Management.
At a meeting held on March 1-2, 2023, the Board reviewed a written report prepared by the LRS that addressed the Program's operation and assessed its adequacy, and effectiveness of implementation for the period from January 1, 2022, through December 31, 2022, as required under the Liquidity Rule. The report concluded that the Program operated effectively and was adequately and effectively implemented in all material aspects, and that the relevant controls and safeguards were appropriately designed to enable the LRS to administer the Program in compliance with the Liquidity Rule.
In accordance with the Program, the LRS assessed each Fund's liquidity risk no less frequently than annually taking into consideration certain factors, as applicable, such as (i) investment strategy and liquidity of portfolio investments, (ii) short-term and long-term cash flow projections and (iii) holdings of cash and cash equivalents and borrowing arrangements and other funding sources. Certain factors are considered under both normal and reasonably foreseeable stressed conditions.
Each Fund portfolio investment is classified into one of four liquidity categories, which classification is assessed at least monthly by the LRS. The classification is based on a determination of the number of days it is reasonably expected to take to convert the investment into cash, or sell or dispose of the investment, in current market conditions without significantly changing the market value of the investment. Liquidity classification determinations take into account various market, trading and investment-specific considerations, as well as market depth, and in some cases utilize third-party vendor data.
The Liquidity Rule limits a fund's investments in illiquid investments to 15% of its net assets and requires funds that do not primarily hold assets that are highly liquid investments to determine and maintain a minimum percentage of the fund's net assets to be invested in highly liquid investments (highly liquid investment minimum or "HLIM"). The LRS believes that the Program includes provisions reasonably designed to review, monitor and comply with the 15% limit on illiquid investments and for determining, periodically reviewing and complying with the HLIM requirement, as applicable.
There can be no assurance that the Program will achieve its objectives under all circumstances in the future. Please refer to the Fund's prospectus for more information regarding the Fund's exposure to liquidity risk and other risks to which it may be subject.
41
Morgan Stanley Institutional Fund Trust
Annual Report — September 30, 2023
Important Notices (unaudited)
Reporting to Shareholders
Each Morgan Stanley fund provides a complete schedule of portfolio holdings in its Semi-Annual and the Annual Reports within 60 days of the end of the fund's second and fourth fiscal quarters. The Semi-Annual and Annual Reports are filed electronically with the Securities and Exchange Commission ("SEC") on Form N-CSRS and Form N-CSR, respectively. Morgan Stanley makes these reports available on its public website, www.morganstanley.com/im. Each Morgan Stanley non-money market fund also files a complete schedule of portfolio holdings with the SEC for the fund's first and third fiscal quarters as an attachment to Form N-PORT. Morgan Stanley does not deliver the reports for the first and third fiscal quarters to shareholders, but makes the complete schedule of portfolio holdings for the fund's first and third fiscal quarters available on its public website. The holdings for each money market fund are also posted to the Morgan Stanley public website. You may obtain the Form N-PORT filings (as well as the Form N-CSR and N-CSRS filings) by accessing the SEC's website, www.sec.gov. You can also request copies of these materials, upon payment of a duplicating fee, by electronic request at the SEC's email address (publicinfo@sec.gov).
Proxy Voting Policies and Procedures and Proxy Voting Record
You may obtain a copy of the Trust's Proxy Voting Policy and Procedures and information regarding how the Trust voted proxies relating to portfolio securities during the most recent twelve-month period ended June 30, without charge, upon request, by calling toll free 1 (800) 869-6397 or by visiting our website at www.morganstanley.com/im. This information is also available on the SEC's website at www.sec.gov.
This report is authorized for distribution only when preceded or accompanied by a prospectus or summary prospectus of the applicable fund of Morgan Stanley Institutional Fund Trust, which describes in detail the fund's investment policies, risks, fees and expenses. Please read the prospectus carefully before you invest or send money. For additional information, including information regarding the investments comprising the Fund, please visit our website at www.morganstanley.com/im. or call toll free 1 (800) 869-6397.
Householding Notice
To reduce printing and mailing costs, the Fund attempts to eliminate duplicate mailings to the same address. The Fund delivers a single copy of certain shareholder documents, including shareholder reports, prospectuses and proxy materials, to investors with the same last name who reside at the same address. Your participation in this program will continue for an unlimited period of time unless you instruct us otherwise. You can request multiple copies of these documents by calling 1 (800) 869-6397, 8:00 a.m. to 6:00 p.m., ET. Once our Customer Service Center has received your instructions, we will begin sending individual copies for each account within 30 days.
Tailored Shareholder Reports
Effective January 24, 2023, the SEC adopted rule and form amendments to require open-end mutual funds and ETFs to transmit concise and visually engaging streamlined annual and semiannual reports to shareholders that highlight key information. Other information, including financial statements, will no longer appear in a streamlined shareholder report but must be available online, delivered free of charge upon request, and filed on a semiannual basis on Form N-CSR. The rule and form amendments have a compliance date of July 24, 2024. At this time, management is evaluating the impact of these amendments on the shareholder reports for the Morgan Stanley Funds.
42
Morgan Stanley Institutional Fund Trust
Annual Report — September 30, 2023
Federal Tax Notice (unaudited)
For federal income tax purposes, the following information is furnished with respect to the distributions paid by the Fund during its taxable year ended September 30, 2023.
The Fund designated approximately $20,436,000 of its distributions paid as business interest income.
The Fund designated approximately $17,837,000 of its distributions paid as qualified interest income.
In January, the Fund provides tax information to shareholders for the preceding calendar year.
43
Morgan Stanley Institutional Fund Trust
Annual Report — September 30, 2023
U.S. Customer Privacy Notice (unaudited) April 2021
FACTS | | WHAT DOES MSIM DO WITH YOUR PERSONAL INFORMATION? | |
Why? | | Financial companies choose how they share your personal information. Federal law gives consumers the right to limit some but not all sharing. Federal law also requires us to tell you how we collect, share, and protect your personal information. Please read this notice carefully to understand what we do. | |
What? | | The types of personal information we collect and share depend on the product or service you have with us. This information can include:
◼ Social Security number and income
◼ investment experience and risk tolerance
◼ checking account number and wire transfer instructions | |
How? | | All financial companies need to share customers' personal information to run their everyday business. In the section below, we list the reasons financial companies can share their customers' personal information; the reasons MSIM chooses to share; and whether you can limit this sharing. | |
Reasons we can share your personal information | | Does MSIM share? | | Can you limit this sharing? | |
For our everyday business purposes —
such as to process your transactions, maintain your account(s), respond to court orders and legal investigations, or report to credit bureaus | | Yes | | No | |
For our marketing purposes —
to offer our products and services to you | | Yes | | No | |
For joint marketing with other financial companies | | No | | We don't share | |
For our investment management affiliates' everyday business purposes —
information about your transactions, experiences, and creditworthiness | | Yes | | Yes | |
For our affiliates' everyday business purposes —
information about your transactions and experiences | | Yes | | No | |
For our affiliates' everyday business purposes —
information about your creditworthiness | | No | | We don't share | |
For our investment management affiliates to market to you | | Yes | | Yes | |
For our affiliates to market to you | | No | | We don't share | |
For non-affiliates to market to you | | No | | We don't share | |
44
Morgan Stanley Institutional Fund Trust
Annual Report — September 30, 2023
U.S. Customer Privacy Notice (unaudited) (cont'd) April 2021
To limit our sharing | | Call toll-free (844) 312-6327 or email: imprivacyinquiries@morganstanley.com
Please note:
If you are a new customer, we can begin sharing your information 30 days from the date we sent this notice. When you are no longer our customer, we continue to share your information as described in this notice. However, you can contact us at any time to limit our sharing. | |
Questions? | | Call toll-free (844) 312-6327 or email: imprivacyinquiries@morganstanley.com | |
Who we are
Who is providing this notice? | | Morgan Stanley Investment Management Inc. and its investment management affiliates ("MSIM") (see Investment Management Affiliates definition below) | |
What we do
How does MSIM protect my personal information? | | To protect your personal information from unauthorized access and use, we use security measures that comply with federal law. These measures include computer safeguards and secured files and buildings. We have policies governing the proper handling of customer information by personnel and requiring third parties that provide support to adhere to appropriate security standards with respect to such information. | |
How does MSIM collect my personal information? | | We collect your personal information, for example, when you
◼ open an account or make deposits or withdrawals from your account
◼ buy securities from us or make a wire transfer
◼ give us your contact information
We also collect your personal information from others, such as credit bureaus, affiliates, or other companies. | |
Why can't I limit all sharing? | | Federal law gives you the right to limit only
◼ sharing for affiliates' everyday business purposes — information about your creditworthiness
◼ affiliates from using your information to market to you
◼ sharing for non-affiliates to market to you
State laws and individual companies may give you additional rights to limit sharing. See below for more on your rights under state law. | |
45
Morgan Stanley Institutional Fund Trust
Annual Report — September 30, 2023
U.S. Customer Privacy Notice (unaudited) (cont'd) April 2021
Definitions
Investment Management Affiliates | | MSIM Investment Management Affiliates include registered investment advisers, registered broker-dealers, and registered and unregistered funds in the Investment Management Division. Investment Management Affiliates does not include entities associated with Morgan Stanley Wealth Management, such as Morgan Stanley Smith Barney LLC and Morgan Stanley & Co. | |
Affiliates | | Companies related by common ownership or control. They can be financial and non-financial companies.
◼ Our affiliates include companies with a Morgan Stanley name and financial companies such as Morgan Stanley Smith Barney LLC and Morgan Stanley & Co. | |
Non-affiliates | | Companies not related by common ownership or control. They can be financial and non-financial companies.
◼ MSIM does not share with non-affiliates so they can market to you. | |
Joint marketing | | A formal agreement between non-affiliated financial companies that together market financial products or services to you.
◼ MSIM doesn't jointly market | |
Other important information
Vermont: Except as permitted by law, we will not share personal information we collect about Vermont residents with Non-affiliates unless you provide us with your written consent to share such information.
California: Except as permitted by law, we will not share personal information we collect about California residents with Non-affiliates and we will limit sharing such personal information with our Affiliates to comply with California privacy laws that apply to us.
46
Morgan Stanley Institutional Fund Trust
Annual Report — September 30, 2023
Trustees and Officers Information (unaudited)
Independent Trustees:
Name, Address and Birth Year
of Independent Trustee | | Position(s)
Held with
Registrant | | Length of Time
Served* | | Principal Occupation(s) During Past 5 Years
and Other Relevant Professional Experience | | Number of
Funds in
Fund Complex
Overseen by
Independent
Trustee** | | Other Directorships
Held by Independent
Trustee During
Past 5 Years*** | |
Frank L. Bowman
c/o Perkins Coie LLP
Counsel to the Independent Trustees
1155 Avenue of the Americas
22nd Floor
New York, NY 10036
Birth Year: 1944 | | Trustee | | Since
August
2006 | | President, Strategic Decisions, LLC (consulting) (since February 2009); Director or Trustee of various Morgan Stanley Funds (since August 2006); Chairperson of the Compliance and Insurance Committee (since October 2015); formerly, Chairperson of the Insurance Sub-Committee of the Compliance and Insurance Committee (2007-2015); served as President and Chief Executive Officer of the Nuclear Energy Institute (policy organization) (February 2005-November 2008); retired as Admiral, U.S. Navy after serving over 38 years on active duty including 8 years as Director of the Naval Nuclear Propulsion Program in the Department of the Navy and the U.S. Department of Energy (1996-2004); served as Chief of Naval Personnel (July 1994-September 1996) and on the Joint Staff as Director of Political Military Affairs (June 1992-July 1994); knighted as Honorary Knight Commander of the Most Excellent Order of the British Empire; awarded the Officier de l'Orde National du Mèrite by the French Government; elected to the National Academy of Engineering (2009). | | | 86 | | | Director of Naval and Nuclear Technologies LLP; Director Emeritus of the Armed Services YMCA; Member of the National Security Advisory Council of the Center for U.S. Global Engagement and a former member of the CNA Military Advisory Board; Chairman of the Board of Trustees of Fairhaven United Methodist Church; Member of the Board of Advisors of the Dolphin Scholarship Foundation; Director of other various nonprofit organizations; formerly, Director of BP, plc (November 2010-May 2019). | |
Frances L. Cashman
c/o Perkins Coie LLP
Counsel to the Independent
Trustees
1155 Avenue of the Americas
22nd Floor
New York, NY 10036
Birth Year: 1961 | | Trustee | | Since
February
2022 | | Chief Executive Officer, Asset Management Division, Delinian Ltd. (financial information) (May 2021-Present); Executive Vice President and various other roles, Legg Mason & Co. (asset management) (2010-2020); Managing Director, Stifel Nicolaus (2005-2010). | | | 87 | | | Trustee and Investment Committee Member, GeorgiaTech Foundation (since June 2019); Trustee and Chair of Marketing Committee, and Member of Investment Committee, Loyola Blakefield (Since September 2017); Trustee, MMI Gateway Foundation (since September 2017); Director and Investment Committee Member, Catholic Community Foundation Board (2012-2018); Director and Investment Committee Member, St. Ignatius Loyola Academy (2011-2017). | |
Kathleen A. Dennis
c/o Perkins Coie LLP
Counsel to the Independent
Trustees
1155 Avenue of the Americas
22nd Floor
New York, NY 10036
Birth Year: 1953 | | Trustee | | Since
August
2006 | | Chairperson of the Governance Committee (since January 2021), Chairperson of the Liquidity and Alternatives Sub-Committee of the Investment Committee (2006-2020) and Director or Trustee of various Morgan Stanley Funds (since August 2006); President, Cedarwood Associates (mutual fund and investment management consulting) (since July 2006); formerly, Senior Managing Director of Victory Capital Management (1993-2006). | | | 86 | | | Board Member, University of Albany Foundation (2012-present); Board Member, Mutual Funds Directors Forum (2014-present); Director of various non-profit organizations. | |
47
Morgan Stanley Institutional Fund Trust
Annual Report — September 30, 2023
Trustees and Officers Information (unaudited) (cont'd)
Independent Trustees: (cont'd)
Name, Address and Birth Year
of Independent Trustee | | Position(s)
Held with
Registrant | | Length of Time
Served* | | Principal Occupation(s) During Past 5 Years
and Other Relevant Professional Experience | | Number of
Funds in
Fund Complex
Overseen by
Independent
Trustee** | | Other Directorships
Held by Independent
Trustee During
Past 5 Years*** | |
Nancy C. Everett
c/o Perkins Coie LLP
Counsel to the Independent
Trustees
1155 Avenue of the Americas
22nd Floor
New York, NY 10036
Birth Year: 1955 | | Trustee | | Since
January
2015 | | Chairperson of the Equity Investment Committee (since January 2021); Director or Trustee of various Morgan Stanley Funds (since January 2015); Chief Executive Officer, Virginia Commonwealth University Investment Company (since November 2015); Owner, OBIR, LLC (institutional investment management consulting) (since June 2014); formerly, Managing Director, BlackRock, Inc. (February 2011-December 2013) and Chief Executive Officer, General Motors Asset Management (a/k/a Promark Global Advisors, Inc.) (June 2005-May 2010). | | | 87 | | | Formerly, Member of Virginia Commonwealth University School of Business Foundation (2005-2016); Member of Virginia Commonwealth University Board of Visitors (2013-2015); Member of Committee on Directors for Emerging Markets Growth Fund, Inc. (2007-2010); Chairperson of Performance Equity Management, LLC (2006-2010); and Chairperson, GMAM Absolute Return Strategies Fund, LLC (2006-2010). | |
Eddie A. Grier
c/o Perkins Coie LLP
Counsel to the Independent
Trustees
1155 Avenue of the Americas
22nd Floor
New York, NY 10036
Birth Year: 1955 | | Trustee | | Since
February
2022 | | Dean, Santa Clara University Leavey School of Business (since July 2021); Dean, Virginia Commonwealth University School of Business (2010-2021); President and various other roles, Walt Disney Company (entertainment and media) (1981-2010). | | | 87 | | | Director, Witt/Keiffer, Inc. (executive search) (since 2016); Director, NuStar GP, LLC (energy) (since August 2021); Director, Sonida Senior Living, Inc. (residential community operator) (2016-2021); Director, NVR, Inc. (homebuilding) (2013-2020); Director, Middleburg Trust Company (wealth management) (2014-2019); Director, Colonial Williamsburg Company (2012-2021); Regent, University of Massachusetts Global (since 2021); Director and Chair, ChildFund International (2012-2021); Trustee, Brandman University (2010-2021); Director, Richmond Forum (2012-2019). | |
48
Morgan Stanley Institutional Fund Trust
Annual Report — September 30, 2023
Trustees and Officers Information (unaudited) (cont'd)
Independent Trustees: (cont'd)
Name, Address and Birth Year
of Independent Trustee | | Position(s)
Held with
Registrant | | Length of Time
Served* | | Principal Occupation(s) During Past 5 Years
and Other Relevant Professional Experience | | Number of
Funds in
Fund Complex
Overseen by
Independent
Trustee** | | Other Directorships
Held by Independent
Trustee During
Past 5 Years*** | |
Jakki L. Haussler
c/o Perkins Coie LLP
Counsel to the Independent
Trustees
1155 Avenue of the Americas
22nd Floor
New York, NY 10036
Birth Year: 1957 | | Trustee | | Since
January
2015 | | Chairperson of the Audit Committee (since January 2023) and Director or Trustee of various Morgan Stanley Funds (since January 2015); Chairman, Opus Capital Group (since 1996); formerly, Chief Executive Officer, Opus Capital Group (1996-2019); Director, Capvest Venture Fund, LP (May 2000-December 2011); Partner, Adena Ventures, LP (July 1999-December 2010); Director, The Victory Funds (February 2005-July 2008). | | | 87 | | | Director, Vertiv Holdings Co. (VRT) (since August 2022); Director of Cincinnati Bell Inc. and Member, Audit Committee and Chairman, Governance and Nominating Committee (2008-2021); Director of Service Corporation International and Member, Audit Committee and Investment Committee; Director, Barnes Group Inc. (since July 2021); Director of Northern Kentucky University Foundation and Member, Investment Committee; Member of Chase College of Law Center for Law and Entrepreneurship Board of Advisors; Director of Best Transport (2005-2019); Director of Chase College of Law Board of Visitors; formerly, Member, University of Cincinnati Foundation Investment Committee. | |
Dr. Manuel H. Johnson
c/o Johnson Smick
International, Inc.
220 I Street, NE
Suite 200
Washington, D.C. 20002
Birth Year: 1949 | | Trustee | | Since
July
1991 | | Senior Partner, Johnson Smick International, Inc. (consulting firm); Chairperson of the Fixed Income, Liquidity and Alternatives Investment Committee (since January 2021), Chairperson of the Investment Committee (2006-2020) and Director or Trustee of various Morgan Stanley Funds (since July 1991); Co-Chairman and a founder of the Group of Seven Council (G7C) (international economic commission); formerly, Chairperson of the Audit Committee (July 1991-September 2006); Vice Chairman of the Board of Governors of the Federal Reserve System and Assistant Secretary of the U.S. Treasury. | | | 86 | | | Director of NVR, Inc. (home construction). | |
49
Morgan Stanley Institutional Fund Trust
Annual Report — September 30, 2023
Trustees and Officers Information (unaudited) (cont'd)
Independent Trustees: (cont'd)
Name, Address and Birth Year
of Independent Trustee | | Position(s)
Held with
Registrant | | Length of Time
Served* | | Principal Occupation(s) During Past 5 Years
and Other Relevant Professional Experience | | Number of
Funds in
Fund Complex
Overseen by
Independent
Trustee** | | Other Directorships
Held by Independent
Trustee During
Past 5 Years*** | |
Joseph K. Kearns
c/o Perkins Coie LLP
Counsel to the Independent
Trustees
1155 Avenue of the Americas
22nd Floor
New York, NY 10036
Birth Year: 1942 | | Trustee | | Since
August
1994 | | Senior Adviser, Kearns & Associates LLC (investment consulting); Chairperson of the Audit Committee (2006-2022) and Director or Trustee of various Morgan Stanley Funds (since August 1994); formerly, Deputy Chairperson of the Audit Committee (July 2003-September 2006); CFO of the J. Paul Getty Trust (1982-1999). | | | 87 | | | Director, Rubicon Investments (since February 2019); Prior to August 2016, Director of Electro Rent Corporation (equipment leasing); Prior to December 31, 2013, Director of The Ford Family Foundation. | |
Michael F. Klein
c/o Perkins Coie LLP
Counsel to the Independent
Trustees
1155 Avenue of the Americas
22nd Floor
New York, NY 10036
Birth Year: 1958 | | Trustee | | Since
August
2006 | | Chairperson of the Risk Committee (since January 2021); Managing Director, Aetos Alternatives Management, LP (since March 2000); Co-President, Aetos Alternatives Management, LP (since January 2004) and Co-Chief Executive Officer of Aetos Alternatives Management, LP (since August 2013); Chairperson of the Fixed Income Sub-Committee of the Investment Committee (2006-2020) and Director or Trustee of various Morgan Stanley Funds (since August 2006); formerly, Managing Director, Morgan Stanley & Co. Inc. and Morgan Stanley Dean Witter Investment Management and President, various Morgan Stanley Funds (June 1998-March 2000); Principal, Morgan Stanley & Co. Inc. and Morgan Stanley Dean Witter Investment Management (August 1997-December 1999). | | | 86 | | | Director of certain investment funds managed or sponsored by Aetos Alternatives Management, LP; Director of Sanitized AG and Sanitized Marketing AG (specialty chemicals). | |
Patricia A. Maleski
c/o Perkins Coie LLP
Counsel to the Independent
Trustees
1155 Avenue of the Americas
22nd Floor
New York, NY 10036
Birth Year: 1960 | | Trustee | | Since
January
2017 | | Director or Trustee of various Morgan Stanley Funds (since January 2017); Managing Director, JPMorgan Asset Management (2004-2016); Oversight and Control Head of Fiduciary and Conflicts of Interest Program (2015-2016); Chief Control Officer—Global Asset Management (2013-2015); President, JPMorgan Funds (2010-2013); Chief Administrative Officer (2004-2013); various other positions including Treasurer and Board Liaison (since 2001). | | | 87 | | | Trustee (since January 2022) and Treasurer (since January 2023), Nutley Family Service Bureau, Inc. | |
W. Allen Reed
c/o Perkins Coie LLP
Counsel to the Independent
Trustees
1155 Avenue of the Americas
22nd Floor
New York, NY 10036
Birth Year: 1947 | | Chair of the Board and Trustee | | Chair of the Board since August 2020 and Trustee since August 2006 | | Chair of the Boards of various Morgan Stanley Funds (since August 2020); Director or Trustee of various Morgan Stanley Funds (since August 2006); formerly, Vice Chair of the Boards of various Morgan Stanley Funds (January 2020-August 2020); President and Chief Executive Officer of General Motors Asset Management; Chairman and Chief Executive Officer of the GM Trust Bank and Corporate Vice President of General Motors Corporation (August 1994-December 2005). | | | 86 | | | Formerly, Director of Legg Mason, Inc. (2006-2019); and Director of the Auburn University Foundation (2010-2015). | |
* This is the earliest date the Trustee began serving the Morgan Stanley Funds. Each Trustee serves an indefinite term, until his or her successor is elected.
** The Fund Complex includes (as of December 31, 2022) all open-end and closed-end funds (including all of their portfolios) advised by Morgan Stanley Investment Management Inc. (the "Adviser") and any funds that have an adviser that is an affiliated person of the Adviser (including, but not limited to, Morgan Stanley AIP GP LP).
*** This includes any directorships at public companies and registered investment companies held by the Trustees at any time during the past five years.
50
Morgan Stanley Institutional Fund Trust
Annual Report — September 30, 2023
Trustees and Officers Information (unaudited) (cont'd)
Executive Officers:
Name, Address and Birth Year
of Executive Officer | | Position(s) Held
with
Registrant | | Length of
Time Served* | | Principal Occupation(s) During Past 5 Years | |
John H. Gernon
522 Fifth Avenue
New York, NY 10036
Birth Year: 1963 | | President and Principal Executive Officer | | Since
September
2013 | | President and Principal Executive Officer of the Equity and Fixed Income Funds and the Morgan Stanley AIP Funds (since September 2013) and the Liquidity Funds and various money market funds (since May 2014) in the Fund Complex; Managing Director of the Adviser. | |
Deidre A. Downes
1633 Broadway
New York, NY 10019
Birth Year: 1977 | | Chief Compliance Officer | | Since
November
2021 | | Executive Director of the Adviser (since January 2021) and Chief Compliance Officer of various Morgan Stanley Funds (since November 2021). Formerly, Vice President and Corporate Counsel at PGIM and Prudential Financial (October 2016-December 2020). | |
Francis J. Smith
522 Fifth Avenue
New York, NY 10036
Birth Year: 1965 | | Treasurer and Principal Financial Officer | | Treasurer since July 2003 and Principal Financial Officer since September
2002 | | Managing Director of the Adviser and various entities affiliated with the Adviser; Treasurer (since July 2003) and Principal Financial Officer of various Morgan Stanley Funds (since September 2002). | |
Mary E. Mullin
1633 Broadway
New York, NY 10019
Birth Year: 1967 | | Secretary | | Since
June
1999 | | Managing Director of the Adviser; Secretary of various Morgan Stanley Funds (since June 1999). | |
Michael J. Key
522 Fifth Avenue
New York, NY 10036
Birth Year: 1979 | | Vice President | | Since
June
2017 | | Vice President of the Equity and Fixed Income Funds, Liquidity Funds, various money market funds and the Morgan Stanley AIP Funds in the Fund Complex (since June 2017); Managing Director of the Adviser; Head of Product Development for Equity and Fixed Income Funds (since August 2013). | |
The Fund's statement of additional information includes further information about the Fund's Trustees and Officers, and is available without charge by visiting www.morganstanley.com/im or upon request by calling 1 (800) 869-6397.
* This is the earliest date the officer began serving the Morgan Stanley Funds. Each officer serves an indefinite term, until his or her successor is elected.
51
Morgan Stanley Institutional Fund Trust
Annual Report — September 30, 2023
Adviser and Administrator
Morgan Stanley Investment Management Inc.
522 Fifth Avenue
New York, New York 10036
Distributor
Morgan Stanley Distribution, Inc.
522 Fifth Avenue
New York, New York 10036
Dividend Disbursing and Transfer Agent
SS&C Global Investor & Distribution Solutions, Inc.
P.O. Box 219804
Kansas City, Missouri 64121-9804
Co-Transfer Agent
Eaton Vance Management
Two International Place
Boston, Massachusetts 02110
Custodian
State Street Bank and Trust Company
One Congress Street
Boston, Massachusetts 02114
Legal Counsel
Dechert LLP
1095 Avenue of the Americas
New York, New York 10036
Counsel to the Independent Trustees
Perkins Coie LLP
1155 Avenue of the Americas,
22nd Floor
New York, New York 10036
Independent Registered Public Accounting Firm
Ernst & Young LLP
200 Clarendon Street
Boston, Massachusetts 02116
52
Printed in U.S.A.
This Report has been prepared for shareholders and may be distributed to others only if preceded or accompanied by a current prospectus.
Morgan Stanley Investment Management Inc.
522 Fifth Avenue
New York, New York 10036
© 2023 Morgan Stanley. Morgan Stanley Distribution, Inc.

IFTCPFIANN
6045125 EXP 11.30.24

Morgan Stanley Institutional Fund Trust
Corporate Bond Portfolio
Annual Report
September 30, 2023

Morgan Stanley Institutional Fund Trust
Annual Report — September 30, 2023
Table of Contents (unaudited)
Shareholders' Letter | | | 2 | | |
Expense Example | | | 3 | | |
Investment Overview | | | 4 | | |
Portfolio of Investments | | | 7 | | |
Statement of Assets and Liabilities | | | 13 | | |
Statement of Operations | | | 15 | | |
Statements of Changes in Net Assets | | | 16 | | |
Financial Highlights | | | 17 | | |
Notes to Financial Statements | | | 21 | | |
Report of Independent Registered Public Accounting Firm | | | 31 | | |
Investment Advisory Agreement Approval | | | 32 | | |
Liquidity Risk Management Program | | | 34 | | |
Important Notices | | | 35 | | |
Federal Tax Notice | | | 36 | | |
U.S. Customer Privacy Notice | | | 37 | | |
Trustees and Officers Information | | | 40 | | |
This report is authorized for distribution only when preceded or accompanied by a prospectus or summary prospectus of the applicable Fund of the Morgan Stanley Institutional Fund Trust. To receive a prospectus and/or statement of additional information ("SAI"), which contains more complete information such as investment objectives, charges, expenses, policies for voting proxies, risk considerations and describes in detail each of the Fund's investment policies to the prospective investor, please call toll free 1 (800) 869-6397. Please read the prospectuses carefully before you invest or send money.
Additionally, you can access information about the Fund, including performance, characteristics and investment team commentary through Morgan Stanley Investment Management's website: www.morganstanley.com/im.
Market forecasts provided in this report may not necessarily come to pass. There is no guarantee that any sectors mentioned will continue to perform as discussed herein or that securities in such sectors will be held by the Fund in the future. There is no assurance that a fund will achieve its investment objective. Funds are subject to market risk, which is the possibility that market values of securities owned by the Fund will decline and, therefore, the value of the Fund's shares may be less than what you paid for them. Accordingly, you can lose money investing in this Fund. Please see the prospectus for more complete information on investment risks.
1
Morgan Stanley Institutional Fund Trust
Annual Report — September 30, 2023
Shareholders' Letter (unaudited)
Dear Shareholders,
We are pleased to provide this Annual Report, in which you will learn how your investment in Corporate Bond Portfolio (the "Fund") performed during the latest twelve-month period.
Morgan Stanley Investment Management is a client-centric, investor-led organization. Our global presence, intellectual capital, and breadth of products and services enable us to partner with investors to meet the evolving challenges of today's financial markets. We aim to deliver superior investment service and to empower our clients to make the informed decisions that help them reach their investment goals.
As always, we thank you for selecting Morgan Stanley Investment Management, and look forward to working with you in the months and years ahead.
Sincerely,

John H. Gernon
President and Principal Executive Officer
October 2023
2
Morgan Stanley Institutional Fund Trust
Annual Report — September 30, 2023
Expense Example (unaudited)
Corporate Bond Portfolio
As a shareholder of the Fund, you may incur two types of costs: (1) transactional costs, including sales charge (loads) on purchase payments; and (2) ongoing costs, which may include advisory fees, administration fees, distribution and shareholder services fees; and other Fund expenses. This example is intended to help you understand your ongoing costs (in dollars) of investing in the Fund and to compare these costs with the ongoing costs of investing in other mutual funds.
This example is based on an investment of $1,000 invested at the beginning of the six-month period ended September 30, 2023 and held for the entire six-month period.
Actual Expenses
The table below provides information about actual account values and actual expenses. You may use the information in this table, together with the amount you invested, to estimate the expenses that you paid over the period. Simply divide your account value by $1,000 (for example, an $8,600 account value divided by $1,000 = 8.6), then multiply the result by the number in the table under the heading entitled "Actual Expenses Paid During Period" to estimate the expenses you paid on your account during this period.
Hypothetical Example for Comparison Purposes
The table below provides information about hypothetical account values and hypothetical expenses based on the Fund's actual expense ratio and an assumed rate of return of 5% per year before expenses, which is not the Fund's actual return. The hypothetical account values and expenses may not be used to estimate the actual ending account balance or expenses you paid for the period. You may use this information to compare the ongoing costs of investing in the Fund and other funds. To do so, compare this 5% hypothetical example with the 5% hypothetical examples that appear in the shareholder reports of the other funds.
Please note that the expenses shown in the table are meant to highlight your ongoing costs only and do not reflect any transactional costs, such as sales charges (loads, if applicable). Therefore, the information for each class in the table is useful in comparing ongoing costs only, and will not help you determine the relative total costs of owning different funds. In addition, if these transactional costs were included, your costs would have been higher.
| | | Beginning
Account
Value
4/1/23 | | Actual Ending
Account
Value
9/30/23 | | Hypothetical
Ending Account
Value | | Actual
Expenses
Paid
During
Period* | | Hypothetical
Expenses Paid
During Period* | | Net
Expense
Ratio
During
Period** | |
Corporate Bond Portfolio Class I | | $ | 1,000.00 | | | $ | 972.10 | | | $ | 1,021.71 | | | $ | 3.31 | | | $ | 3.40 | | | | 0.67 | % | |
Corporate Bond Portfolio Class A | | | 1,000.00 | | | | 970.60 | | | | 1,020.06 | | | | 4.94 | | | | 5.06 | | | | 1.00 | | |
Corporate Bond Portfolio Class L | | | 1,000.00 | | | | 968.20 | | | | 1,017.65 | | | | 7.30 | | | | 7.49 | | | | 1.48 | | |
Corporate Bond Portfolio Class C | | | 1,000.00 | | | | 966.40 | | | | 1,016.19 | | | | 8.73 | | | | 8.95 | | | | 1.77 | | |
* Expenses are calculated using each Fund Class' annualized net expense ratio (as disclosed), multiplied by the average account value over the period and multiplied by 183/365 (to reflect the most recent one-half year period).
** Annualized.
3
Morgan Stanley Institutional Fund Trust
Annual Report — September 30, 2023
Investment Overview (unaudited)
Corporate Bond Portfolio
The Fund seeks above-average total return over a market cycle of three to five years.
Performance
For the fiscal year ended September 30, 2023, the Fund's Class I shares had a total return based on net asset value and reinvestment of distributions per share of 4.51%, net of fees. The Fund's Class I shares outperformed against the Fund's benchmark, the Bloomberg U.S. Corporate Index(i) (the "Index"), which returned 3.65%.
Factors Affecting Performance
• For the fiscal year, global credit markets could be described as better but far from great. Throughout the period, the market was focused on three key areas: central bank policy, inflation and economic growth. The dynamic between the areas was in constant flux, leading to a relatively uncertain market environment. Alongside this economically uncertain environment there have been several events that caused volatility to spike. Despite this, there have been several consistent fundamental and technical themes. During the period, the asset class was supported by strong demand for "high quality" fixed income while supply issuance was front-loaded earlier in 2023 then expected to taper off, leading to lower liquidity through the remainder of 2023. Corporate earnings, in most cases, have exceeded expectations, with financials companies supported by higher net interest margin and low credit losses. However, non-financials companies have been exceeding expectations to a lesser extent relative to previous quarters.
• The fourth quarter of 2022 saw credit markets rally notably alongside a general rebound in global risk assets, driven by positive sentiment surrounding inflation data and China's economic growth.
• Following a volatile 2022, it's not surprising the first quarter of 2023 was nothing short of a roller coaster. The year started with a strong rally, which came to a sudden halt following rising concerns of a hard landing. Near the end of the quarter, the banking crisis involving the collapse of several U.S. regional banks arose in dramatic fashion. While the
event was viewed as idiosyncratic, markets rationalized that a higher risk premium for uncertainty was warranted.
• The second quarter of 2023 saw credit markets rally driven by a perception that "you don't need good news, just better news than markets expect." There were lingering concerns over the U.S. debt ceiling negotiation, which eventually saw a bipartisan resolution. The stickier-than-expected inflation data was followed by global interest rate hikes by central banks while economic data showed signs of weakness — this supported the narrative of a possible soft landing for the U.S. economy.
• The third quarter of 2023 saw investment grade credit spreads rally, and "risk-free" yield curves steepened. Markets focused on digesting central bank commentary, signaling that rates will be "higher for longer" amid inflation rates that look to have peaked but remain above targets. Investors continued to monitor macroeconomic indicators, as the potential for a soft landing increased. Fundamental economic data continued to characterize a strong labor market, inflation abating, and forward-looking indicators (such as purchasing manager's indexes and business sentiment surveys) signaling weakness. Finally, data and sentiment out of China were disappointing, where structural challenges around the shadow banking sector, property market and high youth unemployment continued to concern the global growth outlook.
• In this reporting period, the portfolio's overall investment grade credit positioning had a positive impact on performance.
• The portfolio is positioned to be overweight financials and underweight industrials when measured on a credit risk basis.
• One of the key strategy positions is the portfolio's overweight to subordinated financials. The financial sector is more sensitive to credit market movements and its skew toward lower quality bonds amplified the positive impact of the risk-on sentiment in the period. Therefore, positions within investment
(i) "Bloomberg®" and the Bloomberg Index/Indices used are service marks of Bloomberg Finance L.P. and its affiliates, and have been licensed for use for certain purposes by Morgan Stanley Investment Management (MSIM). Bloomberg is not affiliated with MSIM, does not approve, endorse, review, or recommend any product, and does not guarantee the timeliness, accurateness, or completeness of any data or information relating to any product.
4
Morgan Stanley Institutional Fund Trust
Annual Report — September 30, 2023
Investment Overview (unaudited) (cont'd)
Corporate Bond Portfolio
grade financials were the main drivers of positive performance, primarily the overweights to banking and insurance.
• Also, within the investment grade position, the portfolio's exposure to the industrials sector was a positive performance driver due to the overweights to energy and consumer cyclical bonds. However, the underweight to consumer non-cyclical bonds was the main detractor.
• The portfolio's overweight to utility bonds was also a positive performance driver within the investment grade position, due to the overweights to the electric sector.
• Elsewhere, the portfolio's key off-benchmark exposures to high yield corporate bonds, commercial mortgage-backed securities (CMBS), government-related debt and convertible bonds all had a positive impact on performance during the period.
• The Fund was positioned with an underweight duration (i.e., with less interest rate sensitivity) relative to the Index. In the rising interest rate environment, this position positively impacted performance.
Management Strategies
• Looking forward, our base case remains unchanged, with credit expected to trade in a range around current levels (having widened from the tight spread levels at the end of July 2023), making carry an attractive return opportunity in our view. We expect supply to slow over the fourth quarter of 2023, reflecting the front-loading of issuance given concerns about the economy in the second half of the year (although we do see risks of companies looking to pre-finance 2024 supply needs given that the inverted yield curve means holding cash is not expensive for them). Finally, there are several factors we are closely watching that could shift the narrative: third quarter 2023 corporate earnings reporting, the potential for economic policy support in China and higher energy prices.
• The Fund remains positioned with an overweight to financials (banks and insurance) and a small overweight to BBB-rated non-financials. We remain underweight A or better non-financial bonds.
The portfolio continues to hold small allocations to off-benchmark sectors such as convertible bonds, emerging market corporate bonds and high yield corporate bonds.
5
Morgan Stanley Institutional Fund Trust
Annual Report — September 30, 2023
Investment Overview (unaudited) (cont'd)
Corporate Bond Portfolio
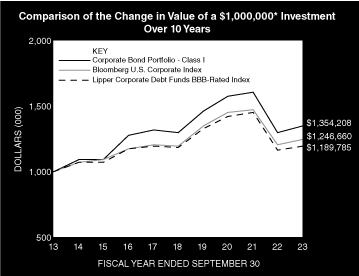
* Minimum Investment
In accordance with SEC regulations, the Fund's performance shown assumes that all recurring fees (including management fees) were deducted and all dividends and distributions were reinvested. The performance of Class A, Class L and Class C shares will vary from the performance of Class I shares based upon their different inception dates and will be negatively impacted by additional fees assessed to those classes.
Performance Compared to the Bloomberg U.S. Corporate Index(1) and the Lipper Corporate Debt Funds BBB-Rated Index(2)
| | | Period Ended September 30, 2023
Total Returns(3) | |
| | | | | Average Annual | |
| | | One
Year | | Five
Years | | Ten
Years | | Since
Inception(8) | |
Fund — Class I Shares
w/o sales charges(4) | | | 4.51 | % | | | 0.86 | % | | | 3.08 | % | | | 5.40 | % | |
Fund — Class A Shares
w/o sales charges(5) | | | 4.18 | | | | 0.57 | | | | 2.76 | | | | 3.37 | | |
Fund — Class A Shares with
maximum 3.25% sales charges(5) | | | 0.84 | | | | –0.10 | | | | 2.42 | | | | 3.21 | | |
Fund — Class L Shares
w/o sales charges(6) | | | 3.68 | | | | 0.13 | | | | 2.39 | | | | 3.02 | | |
Fund — Class C Shares
w/o sales charges(7) | | | 3.28 | | | | –0.25 | | | | — | | | | 1.20 | | |
Fund — Class C Shares with
maximum 1.00% deferred
sales charges(7) | | | 2.28 | | | | –0.25 | | | | — | | | | 1.20 | | |
Bloomberg U.S. Corporate Index | | | 3.65 | | | | 0.93 | | | | 2.23 | | | | 5.76 | | |
Lipper Corporate Debt Funds
BBB-Rated Index | | | 2.08 | | | | 0.15 | | | | 1.75 | | | | 5.31 | | |
Performance data quoted represents past performance, which is no guarantee of future results, and current performance may be lower or higher than the figures shown. Performance assumes that all dividends and distributions, if any, were reinvested. For the most recent month-end performance figures, please visit www.morganstanley.com/im. Investment returns and principal value will fluctuate so that Fund shares, when redeemed, may be worth more or less than their original cost. Total returns do not reflect the deduction of taxes that a shareholder would pay on Fund distributions or the redemption of Fund shares. Performance of share classes will vary due to differences in sales charges and expenses. The Fund returns are calculated based on the net asset value as of the last business day of the period.
(1) The Bloomberg U.S. Corporate Index is a broad-based benchmark that measures the investment grade, U.S. dollar-denominated, fixed rate, taxable corporate bond market. It includes USD-denominated securities publicly issued by U.S. and non-U.S. industrial, utility and financial issuers that meet specified maturity, liquidity and quality requirements.The Index is unmanaged and its returns do not include any sales charges or fees. Such costs would lower performance. It is not possible to invest directly in an index.
(2) The Lipper Corporate Debt Funds BBB-Rated Index is an equally weighted performance index of the largest qualifying funds (based on net assets) in the Lipper Corporate Debt Funds BBB-Rated Funds classification. The Index, which is adjusted for capital gains distributions and income dividends, is unmanaged and should not be considered an investment. There are currently 30 funds represented in this Index. As of the date of this report, the Fund was in the Lipper Corporate Debt Funds BBB-Rated Funds classification.
(3) Total returns for the Fund reflect expenses waived and/or reimbursed, if applicable, by the Adviser and Distributor. Without such waivers and/or reimbursements, total returns would have been lower.
(4) Commenced operations on August 31, 1990.
(5) Commenced offering on May 20, 2002.
(6) Commenced offering on June 16, 2008.
(7) Commenced offering on April 30, 2015. Class C shares will generally convert to Class A shares approximately eight years after the end of the calendar month in which the shares were purchased. Performance for periods greater than eight years reflects this conversion (beginning April 2023).
(8) For comparative purposes, average annual since inception returns listed for the Indexes refer to the inception date of Class I of the Fund, not the inception of the Indexes.
6
Morgan Stanley Institutional Fund Trust
Annual Report — September 30, 2023
Portfolio of Investments
Corporate Bond Portfolio
| | | Face
Amount
(000) | | Value
(000) | |
Fixed Income Securities (89.7%) | |
Commercial Mortgage-Backed Securities (2.1%) | |
Credit Suisse Mortgage Trust, | |
1 Month Term SOFR + 3.14%, 8.48%,
9/9/24 (a)(b) | | $ | 1,100 | | | $ | 1,112 | | |
J.P. Morgan Chase Commercial Mortgage
Securities Trust, | |
1 Month Term SOFR + 2.18%, 7.51%,
9/15/39 (a)(b) | | | 1,300 | | | | 1,307 | | |
| | | | 2,419 | | |
Corporate Bonds (87.4%) | |
Finance (33.3%) | |
AIB GROUP PLC, | |
6.61%, 9/13/29 (a) | | | 400 | | | | 399 | | |
Ally Financial, Inc., | |
4.63%, 3/30/25 | | | 575 | | | | 555 | | |
American International Group, Inc., | |
5.13%, 3/27/33 | | | 55 | | | | 51 | | |
American National Group LLC, | |
6.14%, 6/13/32 (a) | | | 550 | | | | 498 | | |
Assurant, Inc., | |
6.10%, 2/27/26 | | | 300 | | | | 299 | | |
Australia & New Zealand Banking Group Ltd., | |
2.57%, 11/25/35 (a) | | | 300 | | | | 222 | | |
Aviation Capital Group LLC, | |
6.25%, 4/15/28 (a) | | | 375 | | | | 367 | | |
6.38%, 7/15/30 (a) | | | 500 | | | | 485 | | |
Banco de Credito e Inversiones SA, | |
2.88%, 10/14/31 (a) | | | 200 | | | | 160 | | |
Banco Santander SA, | |
1.72%, 9/14/27 | | | 1,000 | | | | 875 | | |
6.92%, 8/8/33 | | | 400 | | | | 383 | | |
Bank Hapoalim BM, | |
3.26%, 1/21/32 | | | 725 | | | | 621 | | |
Bank of America Corp., | |
3.85%, 3/8/37 | | | 373 | | | | 304 | | |
4.57%, 4/27/33 | | | 2,950 | | | | 2,621 | | |
Bank of Ireland Group PLC, | |
2.03%, 9/30/27 (a) | | | 950 | | | | 834 | | |
Bank of New York Mellon Corp.,
Series J | |
4.97%, 4/26/34 | | | 825 | | | | 761 | | |
Banque Federative du Credit Mutuel SA, | |
5.79%, 7/13/28 (a) | | | 850 | | | | 844 | | |
BBVA Bancomer SA, | |
8.45%, 6/29/38 (a) | | | 200 | | | | 197 | | |
| BPCE SA, | |
3.12%, 10/19/32 (a) | | | 375 | | | | 280 | | |
3.65%, 1/14/37 (a) | | | 500 | | | | 385 | | |
CaixaBank SA, | |
6.21%, 1/18/29 (a) | | | 1,075 | | | | 1,053 | | |
Capital One Financial Corp., | |
6.38%, 6/8/34 | | | 650 | | | | 614 | | |
| | | Face
Amount
(000) | | Value
(000) | |
Centene Corp., | |
2.50%, 3/1/31 | | $ | 1,025 | | | $ | 789 | | |
Charles Schwab Corp., | |
6.14%, 8/24/34 | | | 500 | | | | 487 | | |
CI Financial Corp., | |
4.10%, 6/15/51 | | | 950 | | | | 551 | | |
Citigroup, Inc., | |
3.06%, 1/25/33 | | | 1,175 | | | | 929 | | |
3.79%, 3/17/33 | | | 475 | | | | 396 | | |
Corporate Office Properties LP, | |
2.75%, 4/15/31 | | | 850 | | | | 639 | | |
Deutsche Bank AG, | |
7.15%, 7/13/27 | | | 450 | | | | 453 | | |
Extra Space Storage LP, | |
3.90%, 4/1/29 | | | 750 | | | | 674 | | |
5.70%, 4/1/28 | | | 325 | | | | 322 | | |
F&G Annuities & Life, Inc., | |
7.40%, 1/13/28 | | | 1,000 | | | | 999 | | |
Fifth Third Bancorp, | |
6.34%, 7/27/29 | | | 825 | | | | 815 | | |
First-Citizens Bank & Trust Co., | |
2.97%, 9/27/25 | | | 775 | | | | 739 | | |
Global Atlantic Fin Co., | |
4.40%, 10/15/29 (a) | | | 1,100 | | | | 912 | | |
Goldman Sachs Group, Inc., | |
2.62%, 4/22/32 | | | 1,400 | | | | 1,094 | | |
Grupo Aval Ltd., | |
4.38%, 2/4/30 (a) | | | 375 | | | | 286 | | |
High Street Funding Trust I, | |
4.11%, 2/15/28 (a) | | | 850 | | | | 780 | | |
HSBC Holdings PLC, | |
4.04%, 3/13/28 | | | 300 | | | | 278 | | |
6.16%, 3/9/29 | | | 575 | | | | 570 | | |
Intact Financial Corp., | |
5.46%, 9/22/32 (a) | | | 825 | | | | 783 | | |
Intesa Sanpaolo SpA, | |
7.00%, 11/21/25 (a) | | | 850 | | | | 861 | | |
Jefferies Financial Group, Inc., | |
2.63%, 10/15/31 | | | 450 | | | | 342 | | |
5.88%, 7/21/28 | | | 325 | | | | 318 | | |
JPMorgan Chase & Co., | |
5.35%, 6/1/34 | | | 2,300 | | | | 2,182 | | |
KeyBank NA, | |
4.15%, 8/8/25 | | | 700 | | | | 660 | | |
5.85%, 11/15/27 | | | 350 | | | | 333 | | |
Macquarie Group Ltd., | |
2.87%, 1/14/33 (a) | | | 575 | | | | 435 | | |
National Australia Bank Ltd., | |
2.33%, 8/21/30 (a) | | | 375 | | | | 284 | | |
Radian Group, Inc., | |
4.88%, 3/15/27 | | | 525 | | | | 491 | | |
The accompanying notes are an integral part of the financial statements.
7
Morgan Stanley Institutional Fund Trust
Annual Report — September 30, 2023
Portfolio of Investments (cont'd)
Corporate Bond Portfolio
| | | Face
Amount
(000) | | Value
(000) | |
Finance (cont'd) | |
Rocket Mortgage LLC/Rocket Mortgage
Co-Issuer, Inc., | |
3.88%, 3/1/31 (a) | | $ | 545 | | | $ | 435 | | |
Shinhan Bank Co. Ltd., | |
4.00%, 4/23/29 (a) | | | 875 | | | | 782 | | |
SMBC Aviation Capital Finance DAC, | |
5.70%, 7/25/33 (a) | | | 525 | | | | 488 | | |
Stewart Information Services Corp., | |
3.60%, 11/15/31 | | | 500 | | | | 368 | | |
Synchrony Financial, | |
4.50%, 7/23/25 | | | 600 | | | | 572 | | |
Synovus Financial Corp., | |
5.20%, 8/11/25 | | | 475 | | | | 459 | | |
Toronto-Dominion Bank, | |
8.13%, 10/31/82 | | | 1,000 | | | | 997 | | |
Truist Financial Corp., | |
5.87%, 6/8/34 | | | 950 | | | | 895 | | |
U.S. Bancorp, | |
5.84%, 6/12/34 | | | 1,250 | | | | 1,180 | | |
5.85%, 10/21/33 | | | 100 | | | | 95 | | |
UBS Group AG, | |
9.02%, 11/15/33 (a) | | | 550 | | | | 636 | | |
UnitedHealth Group, Inc., | |
4.75%, 5/15/52 | | | 250 | | | | 213 | | |
5.20%, 4/15/63 | | | 225 | | | | 201 | | |
Wells Fargo & Co., | |
MTN | |
2.88%, 10/30/30 | | | 75 | | | | 62 | | |
4.81%, 7/25/28 | | | 200 | | | | 191 | | |
5.57%, 7/25/29 | | | 150 | | | | 146 | | |
Westpac Banking Corp., | |
2.67%, 11/15/35 | | | 225 | | | | 169 | | |
| | | | 39,099 | | |
Industrials (46.3%) | |
AbbVie, Inc., | |
4.05%, 11/21/39 | | | 250 | | | | 205 | | |
Adventist Health System, | |
5.43%, 3/1/32 | | | 700 | | | | 678 | | |
Alaska Airlines 2020-1 Class A Pass-Through
Trust, | |
4.80%, 2/15/29 (a) | | | 383 | | | | 367 | | |
Alibaba Group Holding Ltd., | |
2.70%, 2/9/41 | | | 240 | | | | 144 | | |
Amazon.com, Inc., | |
3.10%, 5/12/51 | | | 425 | | | | 281 | | |
Amgen, Inc., | |
5.75%, 3/2/63 | | | 200 | | | | 185 | | |
Anheuser-Busch Cos. LLC/Anheuser-Busch
InBev Worldwide, Inc., | |
4.90%, 2/1/46 | | | 650 | | | | 567 | | |
AP Moller - Maersk AS, | |
5.88%, 9/14/33 (a) | | | 225 | | | | 219 | | |
| | | Face
Amount
(000) | | Value
(000) | |
Apple, Inc., | |
2.95%, 9/11/49 | | $ | 425 | | | $ | 281 | | |
Arches Buyer, Inc., | |
4.25%, 6/1/28 (a) | | | 325 | | | | 277 | | |
Ashtead Capital, Inc., | |
5.95%, 10/15/33 (a) | | | 700 | | | | 665 | | |
AT&T, Inc., | |
3.65%, 6/1/51 | | | 1,325 | | | | 855 | | |
4.50%, 5/15/35 | | | 725 | | | | 619 | | |
Baidu, Inc., | |
1.72%, 4/9/26 | | | 450 | | | | 406 | | |
BAT Capital Corp., | |
2.26%, 3/25/28 | | | 575 | | | | 487 | | |
3.73%, 9/25/40 | | | 250 | | | | 168 | | |
6.42%, 8/2/33 | | | 325 | | | | 316 | | |
Berry Global, Inc., | |
5.50%, 4/15/28 (a) | | | 250 | | | | 242 | | |
Boeing Co., | |
2.95%, 2/1/30 | | | 675 | | | | 568 | | |
3.25%, 2/1/35 | | | 600 | | | | 462 | | |
BP Capital Markets America, Inc., | |
4.89%, 9/11/33 | | | 300 | | | | 282 | | |
BP Capital Markets PLC, | |
4.88%, 3/22/30 (c) | | | 550 | | | | 493 | | |
Broadcom, Inc., | |
3.19%, 11/15/36 (a) | | | 425 | | | | 305 | | |
Brunswick Corp., | |
5.10%, 4/1/52 | | | 425 | | | | 293 | | |
CBRE Services, Inc., | |
5.95%, 8/15/34 | | | 675 | | | | 637 | | |
Cedars-Sinai Health System, | |
Series 2021 | |
2.29%, 8/15/31 | | | 620 | | | | 489 | | |
Celanese US Holdings LLC, | |
6.35%, 11/15/28 | | | 575 | | | | 568 | | |
6.70%, 11/15/33 | | | 366 | | | | 357 | | |
Charter Communications Operating LLC/Charter
Communications Operating Capital, | |
3.50%, 3/1/42 | | | 225 | | | | 139 | | |
5.13%, 7/1/49 | | | 500 | | | | 365 | | |
6.38%, 10/23/35 | | | 175 | | | | 163 | | |
Columbia Pipelines Holding Co. LLC, | |
6.04%, 8/15/28 (a) | | | 250 | | | | 249 | | |
6.06%, 8/15/26 (a) | | | 50 | | | | 50 | | |
Comcast Corp., | |
2.89%, 11/1/51 | | | 75 | | | | 44 | | |
2.94%, 11/1/56 | | | 250 | | | | 142 | | |
3.75%, 4/1/40 | | | 575 | | | | 446 | | |
CommonSpirit Health, | |
6.07%, 11/1/27 | | | 575 | | | | 580 | | |
Concentrix Corp., | |
6.65%, 8/2/26 | | | 500 | | | | 497 | | |
The accompanying notes are an integral part of the financial statements.
8
Morgan Stanley Institutional Fund Trust
Annual Report — September 30, 2023
Portfolio of Investments (cont'd)
Corporate Bond Portfolio
| | | Face
Amount
(000) | | Value
(000) | |
Industrials (cont'd) | |
Continental Resources, Inc., | |
2.88%, 4/1/32 (a) | | $ | 1,100 | | | $ | 824 | | |
CVS Health Corp., | |
1.88%, 2/28/31 | | | 350 | | | | 267 | | |
5.05%, 3/25/48 | | | 375 | | | | 312 | | |
Delta Air Lines, Inc./SkyMiles IP Ltd., | |
4.75%, 10/20/28 (a) | | | 875 | | | | 832 | | |
Diamondback Energy, Inc., | |
6.25%, 3/15/33 | | | 450 | | | | 450 | | |
Dick's Sporting Goods, Inc., | |
4.10%, 1/15/52 | | | 585 | | | | 356 | | |
DuPont de Nemours, Inc., | |
5.32%, 11/15/38 | | | 225 | | | | 211 | | |
Electricite de France SA, | |
6.25%, 5/23/33 (a) | | | 350 | | | | 351 | | |
Enbridge, Inc., | |
2.50%, 8/1/33 | | | 225 | | | | 167 | | |
5.70%, 3/8/33 | | | 625 | | | | 599 | | |
Enterprise Products Operating LLC, | |
3.30%, 2/15/53 | | | 450 | | | | 293 | | |
3.70%, 1/31/51 | | | 100 | | | | 71 | | |
5.35%, 1/31/33 | | | 175 | | | | 171 | | |
EQT Corp., | |
5.70%, 4/1/28 | | | 575 | | | | 564 | | |
Ferrellgas LP/Ferrellgas Finance Corp., | |
5.88%, 4/1/29 (a) | | | 325 | | | | 293 | | |
Ford Motor Credit Co. LLC, | |
GMTN | |
4.39%, 1/8/26 | | | 315 | | | | 298 | | |
Fortune Brands Innovations, Inc., | |
5.88%, 6/1/33 | | | 625 | | | | 602 | | |
Foundry JV Holdco LLC, | |
5.88%, 1/25/34 (a) | | | 425 | | | | 406 | | |
General Motors Co., | |
6.60%, 4/1/36 | | | 325 | | | | 316 | | |
6.75%, 4/1/46 | | | 125 | | | | 117 | | |
General Motors Financial Co., Inc., | |
5.80%, 6/23/28 | | | 1,175 | | | | 1,149 | | |
Gilead Sciences, Inc., | |
5.55%, 10/15/53 | | | 125 | | | | 120 | | |
Glencore Funding LLC, | |
2.50%, 9/1/30 (a)(d) | | | 600 | | | | 475 | | |
Global Payments, Inc., | |
2.90%, 5/15/30 | | | 650 | | | | 533 | | |
HCA, Inc., | |
3.50%, 7/15/51 | | | 650 | | | | 406 | | |
Hudbay Minerals, Inc., | |
4.50%, 4/1/26 (a) | | | 300 | | | | 281 | | |
Hyundai Capital America, | |
3.00%, 2/10/27 (a) | | | 475 | | | | 431 | | |
Imperial Brands Finance PLC, | |
6.13%, 7/27/27 (a) | | | 400 | | | | 399 | | |
| | | Face
Amount
(000) | | Value
(000) | |
Intel Corp., | |
3.25%, 11/15/49 | | $ | 300 | | | $ | 191 | | |
5.70%, 2/10/53 | | | 350 | | | | 328 | | |
International Business Machines Corp., | |
2.85%, 5/15/40 | | | 275 | | | | 186 | | |
Jabil, Inc., | |
3.00%, 1/15/31 | | | 950 | | | | 771 | | |
JBS USA LUX SA/JBS USA Food Co./JBS USA
Finance, Inc., | |
2.50%, 1/15/27 | | | 550 | | | | 486 | | |
JDE Peet's NV, | |
1.38%, 1/15/27 (a) | | | 875 | | | | 756 | | |
JetBlue Pass Through Trust, | |
Series AA | |
2.75%, 11/15/33 | | | 421 | | | | 354 | | |
Kyndryl Holdings, Inc., | |
2.70%, 10/15/28 | | | 400 | | | | 329 | | |
3.15%, 10/15/31 (d) | | | 575 | | | | 436 | | |
Lithia Motors, Inc., | |
3.88%, 6/1/29 (a) | | | 325 | | | | 274 | | |
Lowe's Cos., Inc., | |
5.80%, 9/15/62 | | | 300 | | | | 274 | | |
5.85%, 4/1/63 | | | 150 | | | | 138 | | |
Marvell Technology, Inc., | |
5.95%, 9/15/33 | | | 350 | | | | 344 | | |
McCormick & Co., Inc., | |
4.95%, 4/15/33 | | | 600 | | | | 559 | | |
Mercedes-Benz Finance North America LLC, | |
5.10%, 8/3/28 (a) | | | 1,275 | | | | 1,250 | | |
Meta Platforms, Inc., | |
5.75%, 5/15/63 | | | 350 | | | | 330 | | |
Midwest Connector Capital Co. LLC, | |
4.63%, 4/1/29 (a) | | | 600 | | | | 549 | | |
National Fuel Gas Co., | |
2.95%, 3/1/31 | | | 1,036 | | | | 816 | | |
Newcastle Coal Infrastructure Group Pty Ltd., | |
4.40%, 9/29/27 (a) | | | 1,121 | | | | 1,010 | | |
Newell Brands, Inc., | |
5.20%, 4/1/26 (e) | | | 700 | | | | 660 | | |
Nissan Motor Acceptance Co. LLC, | |
1.85%, 9/16/26 (a) | | | 650 | | | | 566 | | |
6.95%, 9/15/26 (a) | | | 650 | | | | 655 | | |
NOVA Chemicals Corp., | |
4.88%, 6/1/24 (a) | | | 300 | | | | 295 | | |
NXP BV/NXP Funding LLC/NXP USA, Inc., | |
2.65%, 2/15/32 | | | 650 | | | | 503 | | |
Occidental Petroleum Corp., | |
7.50%, 5/1/31 | | | 600 | | | | 637 | | |
8.50%, 7/15/27 | | | 475 | | | | 509 | | |
ONEOK, Inc., | |
3.10%, 3/15/30 | | | 650 | | | | 544 | | |
3.40%, 9/1/29 | | | 275 | | | | 239 | | |
6.05%, 9/1/33 | | | 25 | | | | 25 | | |
The accompanying notes are an integral part of the financial statements.
9
Morgan Stanley Institutional Fund Trust
Annual Report — September 30, 2023
Portfolio of Investments (cont'd)
Corporate Bond Portfolio
| | | Face
Amount
(000) | | Value
(000) | |
Industrials (cont'd) | |
Oracle Corp., | |
3.60%, 4/1/50 | | $ | 1,150 | | | $ | 745 | | |
3.85%, 7/15/36 | | | 225 | | | | 178 | | |
Peloton Interactive, Inc., | |
0.00%, 2/15/26 | | | 415 | | | | 314 | | |
Penske Truck Leasing Co. LP/PTL Finance Corp., | |
6.20%, 6/15/30 (a) | | | 600 | | | | 592 | | |
Permian Resources Operating LLC, | |
5.88%, 7/1/29 (a) | | | 300 | | | | 283 | | |
Perrigo Finance Unlimited Co., | |
4.65%, 6/15/30 (e) | | | 525 | | | | 448 | | |
Pfizer Investment Enterprises Pte. Ltd., | |
5.30%, 5/19/53 | | | 475 | | | | 442 | | |
Philip Morris International, Inc., | |
5.63%, 9/7/33 | | | 550 | | | | 529 | | |
Resorts World Las Vegas LLC/RWLV Capital, Inc., | |
4.63%, 4/16/29 (a) | | | 300 | | | | 240 | | |
Rogers Communications, Inc., | |
4.55%, 3/15/52 | | | 800 | | | | 584 | | |
S&P Global, Inc., | |
5.25%, 9/15/33 (a) | | | 650 | | | | 634 | | |
Sabine Pass Liquefaction LLC, | |
4.50%, 5/15/30 | | | 575 | | | | 527 | | |
Sigma Alimentos SA de CV, | |
4.13%, 5/2/26 | | | 450 | | | | 428 | | |
Silgan Holdings, Inc., | |
1.40%, 4/1/26 (a) | | | 500 | | | | 444 | | |
Sirius XM Radio, Inc., | |
3.88%, 9/1/31 (a) | | | 326 | | | | 247 | | |
Smithfield Foods, Inc., | |
3.00%, 10/15/30 (a) | | | 850 | | | | 650 | | |
Sodexo, Inc., | |
2.72%, 4/16/31 (a) | | | 675 | | | | 538 | | |
Standard Industries, Inc., | |
2.25%, 11/21/26 (a) | | EUR | 100 | | | | 94 | | |
Syngenta Finance NV, | |
4.89%, 4/24/25 (a) | | $ | 300 | | | | 293 | | |
T-Mobile USA, Inc., | |
2.25%, 11/15/31 | | | 400 | | | | 305 | | |
Tencent Holdings Ltd., | |
2.39%, 6/3/30 (a) | | | 200 | | | | 161 | | |
3.60%, 1/19/28 (a) | | | 500 | | | | 458 | | |
3.98%, 4/11/29 (a) | | | 300 | | | | 272 | | |
Transportadora de Gas Internacional SA ESP, | |
5.55%, 11/1/28 (a) | | | 400 | | | | 377 | | |
United Airlines Pass-Through Trust, | |
Series 2020-1 | |
5.88%, 4/15/29 | | | 580 | | | | 576 | | |
Series 2023-1 | |
5.80%, 7/15/37 | | | 600 | | | | 586 | | |
Var Energi ASA, | |
7.50%, 1/15/28 (a) | | | 600 | | | | 617 | | |
| | | Face
Amount
(000) | | Value
(000) | |
Verizon Communications, Inc., | |
1.75%, 1/20/31 | | $ | 1,025 | | | $ | 773 | | |
3.40%, 3/22/41 | | | 300 | | | | 213 | | |
VICI Properties LP/VICI Note Co., Inc., | |
3.88%, 2/15/29 (a) | | | 1,100 | | | | 952 | | |
Warnermedia Holdings, Inc., | |
5.05%, 3/15/42 | | | 25 | | | | 19 | | |
5.39%, 3/15/62 | | | 675 | | | | 499 | | |
Williams Cos., Inc., | |
5.30%, 8/15/28 - 8/15/52 | | | 1,075 | | | | 976 | | |
| | | | 54,393 | | |
Utilities (7.8%) | |
AEP Transmission Co. LLC, | |
5.40%, 3/15/53 | | | 475 | | | | 443 | | |
Calpine Corp., | |
5.13%, 3/15/28 (a) | | | 300 | | | | 267 | | |
Cleveland Electric Illuminating Co., | |
4.55%, 11/15/30 (a) | | | 250 | | | | 228 | | |
Constellation Energy Generation LLC, | |
6.50%, 10/1/53 | | | 275 | | | | 276 | | |
Dominion Energy, Inc., | |
5.38%, 11/15/32 | | | 400 | | | | 382 | | |
DTE Electric Co., | |
3.95%, 3/1/49 | | | 450 | | | | 335 | | |
Duke Energy Corp., | |
5.00%, 8/15/52 | | | 350 | | | | 292 | | |
Duke Energy Indiana LLC, | |
2.75%, 4/1/50 | | | 330 | | | | 190 | | |
EDP Finance BV, | |
6.30%, 10/11/27 (a) | | | 700 | | | | 710 | | |
Enel Finance America LLC, | |
2.88%, 7/12/41 (a) | | | 500 | | | | 299 | | |
Entergy Texas, Inc., | |
3.55%, 9/30/49 | | | 200 | | | | 135 | | |
Fells Point Funding Trust, | |
3.05%, 1/31/27 (a) | | | 600 | | | | 544 | | |
Georgia Power Co., | |
4.95%, 5/17/33 | | | 550 | | | | 516 | | |
Series A | |
3.25%, 3/15/51 | | | 325 | | | | 206 | | |
Interstate Power and Light Co., | |
2.30%, 6/1/30 | | | 300 | | | | 241 | | |
Jersey Central Power & Light Co., | |
2.75%, 3/1/32 (a) | | | 375 | | | | 294 | | |
Metropolitan Edison Co., | |
5.20%, 4/1/28 (a) | | | 325 | | | | 317 | | |
New England Power Co., | |
5.94%, 11/25/52 (a) | | | 200 | | | | 190 | | |
NextEra Energy Capital Holdings, Inc., | |
3.00%, 1/15/52 | | | 475 | | | | 281 | | |
5.05%, 2/28/33 | | | 400 | | | | 374 | | |
The accompanying notes are an integral part of the financial statements.
10
Morgan Stanley Institutional Fund Trust
Annual Report — September 30, 2023
Portfolio of Investments (cont'd)
Corporate Bond Portfolio
| | | Face
Amount
(000) | | Value
(000) | |
Utilities (cont'd) | |
Northern States Power Co., | |
2.90%, 3/1/50 | | $ | 350 | | | $ | 215 | | |
Pacific Gas & Electric Co., | |
3.30%, 8/1/40 | | | 375 | | | | 241 | | |
4.95%, 7/1/50 | | | 350 | | | | 261 | | |
PacifiCorp, | |
4.15%, 2/15/50 | | | 825 | | | | 581 | | |
PECO Energy Co., | |
3.05%, 3/15/51 | | | 425 | | | | 264 | | |
Pennsylvania Electric Co., | |
5.15%, 3/30/26 (a) | | | 300 | | | | 295 | | |
Public Service Co. of Colorado, | |
5.25%, 4/1/53 | | | 100 | | | | 87 | | |
Public Service Enterprise Group, Inc., | |
2.45%, 11/15/31 | | | 350 | | | | 272 | | |
Southern California Edison Co., | |
5.88%, 12/1/53 | | | 275 | | | | 259 | | |
Virginia Electric & Power Co., | |
2.45%, 12/15/50 | | | 275 | | | | 148 | | |
2.95%, 11/15/51 | | | 150 | | | | 89 | | |
| | | | 9,232 | | |
| | | | 102,724 | | |
Sovereign (0.2%) | |
Petroleos Mexicanos, | |
10.00%, 2/7/33 (a) | | | 298 | | | | 265 | | |
Total Fixed Income Securities (Cost $113,844) | | | 105,408 | | |
| | | Shares | | | |
Short-Term Investments (5.1%) | |
Investment Company (2.8%) | |
Morgan Stanley Institutional Liquidity
Funds — Government Portfolio —
Institutional Class (See Note G)
(Cost $3,323) | | | 3,322,897 | | | | 3,323 | | |
Securities held as Collateral on Loaned Securities (0.7%) | |
Investment Company (0.7%) | |
Morgan Stanley Institutional Liquidity
Funds — Government Portfolio —
Institutional Class (See Note G)
(Cost $840) | | | 840,375 | | | | 840 | | |
| | | Face
Amount
(000) | | Value
(000) | |
U.S. Treasury Security (1.6%) | |
U.S. Treasury Bill,
5.01%, 11/30/23 (f)(g) (Cost $1,850) | | $ | 1,865 | | | $ | 1,849 | | |
Total Short-Term Investments (Cost $6,013) | | | 6,012 | | |
Total Investments (94.8%) (Cost $119,857)
Including $823 of Securities Loaned (h)(i) | | | 111,420 | | |
Other Assets in Excess of Liabilities (5.2%) | | | 6,153 | | |
Net Assets (100.0%) | | $ | 117,573 | | |
(a) 144A security — Certain conditions for public sale may exist. Unless otherwise noted, these securities are deemed to be liquid.
(b) Floating or variable rate securities: The rates disclosed are as of September 30, 2023. For securities based on a published reference rate and spread, the reference rate and spread are indicated in the description in the Portfolio of Investments. Certain variable rate securities may not be based on a published reference rate and spread but are determined by the issuer or agent and are based on current market conditions. These securities do not indicate a reference rate and spread in their description in the Portfolio of Investments.
(c) Perpetual — One or more securities do not have a predetermined maturity date. Rates for these securities are fixed for a period of time after which they revert to a floating rate. Interest rates in effect are as of September 30, 2023.
(d) All or a portion of this security was on loan at September 30, 2023.
(e) Multi-step — Coupon rate changes in predetermined increments to maturity. Rate disclosed is as of September 30, 2023. Maturity date disclosed is the ultimate maturity date.
(f) Rate shown is the yield to maturity at September 30, 2023.
(g) All or a portion of the security was pledged to cover margin requirements for futures contracts.
(h) Securities are available for collateral in connection with, purchase of open foreign currency forward exchange contracts and open futures contracts.
(i) At September 30, 2023, the aggregate cost for federal income tax purposes is approximately $119,802,000. The aggregate gross unrealized appreciation is approximately $1,120,000 and the aggregate gross unrealized depreciation is approximately $9,901,000, resulting in net unrealized depreciation of approximately $8,781,000.
DAC Designated Activity Company.
GMTN Global Medium Term Note.
MTN Medium Term Note.
SOFR Secured Overnight Financing Rate.
Foreign Currency Forward Exchange Contracts:
The Fund had the following foreign currency forward exchange contracts open at September 30, 2023:
Counterparty | | Contracts to
Deliver
(000) | | In Exchange
For
(000) | | Delivery
Date | | Unrealized
Appreciation
(Depreciation)
(000) | |
BNP Paribas SA | | EUR | 158 | | | $ | 175 | | | 11/10/23 | | $ | 8 | | |
UBS AG | | GBP | 580 | | | $ | 740 | | | 11/10/23 | | | 32 | | |
| UBS AG $775 | | GBP | | | | | 611 | | | 11/10/23 | | | (29 | ) | |
| | | | | | | | | $ | 11 | | |
The accompanying notes are an integral part of the financial statements.
11
Morgan Stanley Institutional Fund Trust
Annual Report — September 30, 2023
Portfolio of Investments (cont'd)
Corporate Bond Portfolio
Futures Contracts:
The Fund had the following futures contracts open at September 30, 2023:
| | | Number
of
Contracts | | Expiration
Date | | Notional
Amount
(000) | | Value
(000) | | Unrealized
Appreciation
(Depreciation)
(000) | |
Long: | |
U.S. Treasury Long Bond (United States) | | | 91 | | | Dec-23 | | $ | 9,100 | | | $ | 10,354 | | | $ | (579 | ) | |
U.S. Treasury Ultra Bond (United States) | | | 35 | | | Dec-23 | | | 3,500 | | | | 4,154 | | | | (227 | ) | |
U.S. Treasury 2 yr. Note (United States) | | | 96 | | | Dec-23 | | | 19,200 | | | | 19,460 | | | | (49 | ) | |
Short: | |
German Euro-Bobl Index (Germany) | | | 1 | | | Dec-23 | | EUR | (100 | ) | | | (122 | ) | | | 2 | | |
U.S. Treasury 5 yr. Note (United States) | | | 36 | | | Dec-23 | | $ | (3,600 | ) | | | (3,793 | ) | | | 35 | | |
U.S. Treasury 10 yr. Note (United States) | | | 44 | | | Dec-23 | | | (4,400 | ) | | | (4,755 | ) | | | 83 | | |
U.S. Treasury 10 yr. Ultra Note (United States) | | | 103 | | | Dec-23 | | | (10,300 | ) | | | (11,491 | ) | | | 325 | | |
| | | | | | | | | | | $ | (410 | ) | |
EUR — Euro
GBP — British Pound
USD — United States Dollar
Portfolio Composition*
Classification | | Percentage of
Total Investments | |
Industrials | | | 49.2 | % | |
Finance | | | 35.4 | | |
Utilities | | | 8.3 | | |
Other** | | | 7.1 | | |
Total Investments | | | 100.0 | %*** | |
* Percentages indicated are based upon total investments (excluding Securities held as Collateral on Loaned Securities) as of September 30, 2023.
** Industries and/or investment types representing less than 5% of total investments.
*** Does not include open long/short futures contracts with a value of approximately $54,129,000 and net unrealized depreciation of approximately $410,000. Does not include open foreign currency forward exchange contracts with net unrealized appreciation of approximately $11,000.
The accompanying notes are an integral part of the financial statements.
12
Morgan Stanley Institutional Fund Trust
Annual Report — September 30, 2023
Statement of Assets and Liabilities | | September 30, 2023
(000) | |
Assets: | |
Investments in Securities of Unaffiliated Issuers, at Value(1) (Cost $115,694) | | $ | 107,257 | | |
Investment in Security of Affiliated Issuer, at Value (Cost $4,163) | | | 4,163 | | |
Total Investments in Securities, at Value (Cost $119,857) | | | 111,420 | | |
Cash | | | 4 | | |
Foreign Currency, at Value (Cost $2) | | | 2 | | |
Receivable for Fund Shares Sold | | | 4,694 | | |
Interest Receivable | | | 1,375 | | |
Receivable for Investments Sold | | | 1,077 | | |
Unrealized Appreciation on Foreign Currency Forward Exchange Contracts | | | 40 | | |
Due from Adviser | | | 35 | | |
Receivable from Affiliate | | | 14 | | |
Receivable for Variation Margin on Futures Contracts | | | 7 | | |
Receivable from Securities Lending Income | | | — | @ | |
Other Assets | | | 50 | | |
Total Assets | | | 118,718 | | |
Liabilities: | |
Collateral on Securities Loaned, at Value | | | 840 | | |
Payable for Professional Fees | | | 70 | | |
Payable for Fund Shares Redeemed | | | 40 | | |
Payable for Trustees' Fees and Expenses | | | 38 | | |
Unrealized Depreciation on Foreign Currency Forward Exchange Contracts | | | 29 | | |
Payable for Transfer Agency Fees — Class I | | | 22 | | |
Payable for Transfer Agency Fees — Class A | | | 1 | | |
Payable for Transfer Agency Fees — Class L | | | — | @ | |
Payable for Transfer Agency Fees — Class C | | | 1 | | |
Payable for Sub Transfer Agency Fees — Class I | | | 12 | | |
Payable for Sub Transfer Agency Fees — Class A | | | 7 | | |
Payable for Sub Transfer Agency Fees — Class L | | | — | @ | |
Payable for Sub Transfer Agency Fees — Class C | | | — | @ | |
Payable for Administration Fees | | | 8 | | |
Payable for Custodian Fees | | | 8 | | |
Deferred Capital Gain Country Tax | | | 8 | | |
Payable for Shareholder Services Fees — Class A | | | 2 | | |
Payable for Distribution and Shareholder Services Fees — Class L | | | — | @ | |
Payable for Distribution and Shareholder Services Fees — Class C | | | 1 | | |
Other Liabilities | | | 58 | | |
Total Liabilities | | | 1,145 | | |
Net Assets | | $ | 117,573 | | |
Net Assets Consist of: | |
Paid-in-Capital | | $ | 150,671 | | |
Total Accumulated Loss | | | (33,098 | ) | |
Net Assets | | $ | 117,573 | | |
The accompanying notes are an integral part of the financial statements.
13
Morgan Stanley Institutional Fund Trust
Annual Report — September 30, 2023
Statement of Assets and Liabilities (cont'd) | | September 30, 2023
(000) | |
CLASS I: | |
Net Assets | | $ | 102,560 | | |
| Shares Outstanding (unlimited number of shares authorized, no par value) (not in 000's) | | | 10,289,789 | | |
Net Asset Value, Offering and Redemption Price Per Share | | $ | 9.97 | | |
CLASS A: | |
Net Assets | | $ | 12,849 | | |
| Shares Outstanding (unlimited number of shares authorized, no par value) (not in 000's) | | | 1,287,361 | | |
Net Asset Value, Redemption Price Per Share | | $ | 9.98 | | |
Maximum Sales Load | | | 3.25 | % | |
Maximum Sales Charge | | $ | 0.34 | | |
Maximum Offering Price Per Share | | $ | 10.32 | | |
CLASS L: | |
Net Assets | | $ | 990 | | |
| Shares Outstanding (unlimited number of shares authorized, no par value) (not in 000's) | | | 99,262 | | |
Net Asset Value, Offering and Redemption Price Per Share | | $ | 9.97 | | |
CLASS C: | |
Net Assets | | $ | 1,174 | | |
| Shares Outstanding (unlimited number of shares authorized, no par value) (not in 000's) | | | 118,566 | | |
Net Asset Value, Offering and Redemption Price Per Share | | $ | 9.90 | | |
(1) Including:
Securities on Loan, at Value: | | $ | 823 | | |
@ Amount is less than $500.
The accompanying notes are an integral part of the financial statements.
14
Morgan Stanley Institutional Fund Trust
Annual Report — September 30, 2023
Statement of Operations | | Year Ended
September 30, 2023
(000) | |
Investment Income: | |
Interest from Securities of Unaffiliated Issuers (Net of $—@ of Foreign Taxes Withheld) | | $ | 6,289 | | |
Dividends from Security of Affiliated Issuer (Note G) | | | 92 | | |
Income from Securities Loaned — Net | | | 12 | | |
Total Investment Income | | | 6,393 | | |
Expenses: | |
Advisory Fees (Note B) | | | 472 | | |
Professional Fees | | | 189 | | |
Transfer Agency Fees — Class I (Note E) | | | 158 | | |
Transfer Agency Fees — Class A (Note E) | | | 5 | | |
Transfer Agency Fees — Class L (Note E) | | | 3 | | |
Transfer Agency Fees — Class C (Note E) | | | 3 | | |
Registration Fees | | | 105 | | |
Administration Fees (Note C) | | | 101 | | |
Sub Transfer Agency Fees — Class I | | | 78 | | |
Sub Transfer Agency Fees — Class A | | | 19 | | |
Sub Transfer Agency Fees — Class L | | | — | @ | |
Sub Transfer Agency Fees — Class C | | | 1 | | |
Shareholder Services Fees — Class A (Note D) | | | 34 | | |
Distribution andShareholder Services Fees — Class L (Note D) | | | 5 | | |
Distribution andShareholder Services Fees — Class C (Note D) | | | 14 | | |
Shareholder Reporting Fees | | | 32 | | |
Custodian Fees (Note F) | | | 28 | | |
Pricing Fees | | | 26 | | |
Trustees' Fees and Expenses | | | 10 | | |
Other Expenses | | | 23 | | |
Total Expenses | | | 1,306 | | |
Reimbursement of Class Specific Expenses — Class I (Note B) | | | (236 | ) | |
Reimbursement of Class Specific Expenses — Class A (Note B) | | | (3 | ) | |
Reimbursement of Class Specific Expenses — Class L (Note B) | | | (— | @) | |
Reimbursement of Class Specific Expenses — Class C (Note B) | | | (3 | ) | |
Waiver of Advisory Fees (Note B) | | | (118 | ) | |
Waiver of Shareholder Services Fees — Class A (Note D) | | | (14 | ) | |
Rebate from Morgan Stanley Affiliate (Note G) | | | (3 | ) | |
Net Expenses | | | 929 | | |
Net Investment Income | | | 5,464 | | |
Realized Loss: | |
Investments Sold | | | (12,186 | ) | |
Foreign Currency Forward Exchange Contracts | | | (101 | ) | |
Foreign Currency Translation | | | (1 | ) | |
Futures Contracts | | | (509 | ) | |
Net Realized Loss | | | (12,797 | ) | |
Change in Unrealized Appreciation (Depreciation): | |
Investments | | | 13,687 | | |
Foreign Currency Forward Exchange Contracts | | | (12 | ) | |
Foreign Currency Translation | | | 5 | | |
Futures Contracts | | | (446 | ) | |
Net Change in Unrealized Appreciation (Depreciation) | | | 13,234 | | |
Net Realized Loss and Change in Unrealized Appreciation (Depreciation) | | | 437 | | |
Net Increase in Net Assets Resulting from Operations | | $ | 5,901 | | |
@ Amount is less than $500.
The accompanying notes are an integral part of the financial statements.
15
Morgan Stanley Institutional Fund Trust
Annual Report — September 30, 2023
Statements of Changes in Net Assets | | Year Ended
September 30, 2023
(000) | | Year Ended
September 30, 2022
(000) | |
Increase (Decrease) in Net Assets: | |
Operations: | |
Net Investment Income | | $ | 5,464 | | | $ | 3,880 | | |
Net Realized Loss | | | (12,797 | ) | | | (10,855 | ) | |
Net Change in Unrealized Appreciation (Depreciation) | | | 13,234 | | | | (25,001 | ) | |
Net Increase (Decrease) in Net Assets Resulting from Operations | | | 5,901 | | | | (31,976 | ) | |
Dividends and Distributions to Shareholders: | |
Class I | | | (4,645 | ) | | | (7,373 | ) | |
Class A | | | (532 | ) | | | (866 | ) | |
Class L | | | (35 | ) | | | (56 | ) | |
Class C | | | (43 | ) | | | (91 | ) | |
Total Dividends and Distributions to Shareholders | | | (5,255 | ) | | | (8,386 | ) | |
Capital Share Transactions:(1) | |
Class I: | |
Subscribed | | | 36,169 | | | | 56,097 | | |
Distributions Reinvested | | | 4,457 | | | | 7,055 | | |
Redeemed | | | (53,450 | ) | | | (74,705 | ) | |
Class A: | |
Subscribed | | | 3,457 | | | | 5,672 | | |
Distributions Reinvested | | | 532 | | | | 866 | | |
Redeemed | | | (5,350 | ) | | | (7,599 | ) | |
Class L: | |
Exchanged | | | 12 | | | | — | | |
Distributions Reinvested | | | 35 | | | | 56 | | |
Redeemed | | | (108 | ) | | | (132 | ) | |
Class C: | |
Subscribed | | | 373 | | | | 121 | | |
Distributions Reinvested | | | 43 | | | | 90 | | |
Redeemed | | | (745 | ) | | | (1,310 | ) | |
Net Decrease in Net Assets Resulting from Capital Share Transactions | | | (14,575 | ) | | | (13,789 | ) | |
Total Decrease in Net Assets | | | (13,929 | ) | | | (54,151 | ) | |
Net Assets: | |
Beginning of Period | | | 131,502 | | | | 185,653 | | |
End of Period | | $ | 117,573 | | | $ | 131,502 | | |
(1) Capital Share Transactions: | |
Class I: | |
Shares Subscribed | | | 3,523 | | | | 5,109 | | |
Shares Issued on Distributions Reinvested | | | 433 | | | | 583 | | |
Shares Redeemed | | | (5,203 | ) | | | (6,614 | ) | |
Net Decrease in Class I Shares Outstanding | | | (1,247 | ) | | | (922 | ) | |
Class A: | |
Shares Subscribed | | | 335 | | | | 485 | | |
Shares Issued on Distributions Reinvested | | | 52 | | | | 71 | | |
Shares Redeemed | | | (521 | ) | | | (653 | ) | |
Net Decrease in Class A Shares Outstanding | | | (134 | ) | | | (97 | ) | |
Class L: | |
Shares Exchanged | | | 1 | | | | — | | |
Shares Issued on Distributions Reinvested | | | 3 | | | | 5 | | |
Shares Redeemed | | | (10 | ) | | | (11 | ) | |
Net Decrease in Class L Shares Outstanding | | | (6 | ) | | | (6 | ) | |
Class C: | |
Shares Subscribed | | | 37 | | | | 11 | | |
Shares Issued on Distributions Reinvested | | | 4 | | | | 7 | | |
Shares Redeemed | | | (73 | ) | | | (109 | ) | |
Net Decrease in Class C Shares Outstanding | | | (32 | ) | | | (91 | ) | |
The accompanying notes are an integral part of the financial statements.
16
Morgan Stanley Institutional Fund Trust
Annual Report — September 30, 2023
Financial Highlights
Corporate Bond Portfolio
| | | Class I | |
| | | Year Ended September 30, | |
Selected Per Share Data and Ratios | | 2023 | | 2022 | | 2021 | | 2020 | | 2019 | |
Net Asset Value, Beginning of Period | | $ | 9.95 | | | $ | 12.96 | | | $ | 13.49 | | | $ | 12.78 | | | $ | 11.80 | | |
Income (Loss) from Investment Operations: | |
Net Investment Income(1) | | | 0.45 | | | | 0.30 | | | | 0.25 | | | | 0.32 | | | | 0.40 | | |
Net Realized and Unrealized Gain (Loss) | | | 0.00 | (2) | | | (2.69 | ) | | | (0.05 | ) | | | 0.72 | | | | 1.04 | | |
Total from Investment Operations | | | 0.45 | | | | (2.39 | ) | | | 0.20 | | | | 1.04 | | | | 1.44 | | |
Distributions from and/or in Excess of: | |
Net Investment Income | | | (0.43 | ) | | | (0.27 | ) | | | (0.25 | ) | | | (0.33 | ) | | | (0.46 | ) | |
Net Realized Gain | | | — | | | | (0.35 | ) | | | (0.48 | ) | | | — | | | | — | | |
Total Distributions | | | (0.43 | ) | | | (0.62 | ) | | | (0.73 | ) | | | (0.33 | ) | | | (0.46 | ) | |
Net Asset Value, End of Period | | $ | 9.97 | | | $ | 9.95 | | | $ | 12.96 | | | $ | 13.49 | | | $ | 12.78 | | |
Total Return(3) | | | 4.51 | % | | | (19.23 | )% | | | 1.44 | % | | | 8.19 | % | | | 12.64 | % | |
Ratios to Average Net Assets and Supplemental Data: | |
Net Assets, End of Period (Thousands) | | $ | 102,560 | | | $ | 114,804 | | | $ | 161,409 | | | $ | 182,070 | | | $ | 122,450 | | |
Ratio of Expenses Before Expense Limitation | | | 1.00 | % | | | 0.86 | % | | | 0.79 | % | | | 0.86 | % | | | 1.01 | % | |
Ratio of Expenses After Expense Limitation | | | 0.69 | %(4) | | | 0.70 | %(4) | | | 0.70 | %(4) | | | 0.70 | %(4) | | | 0.70 | %(4) | |
Ratio of Net Investment Income | | | 4.39 | %(4) | | | 2.55 | %(4) | | | 1.90 | %(4) | | | 2.49 | %(4) | | | 3.34 | %(4) | |
Ratio of Rebate from Morgan Stanley Affiliates | | | 0.00 | %(5) | | | 0.00 | %(5) | | | 0.00 | %(5) | | | 0.00 | %(5) | | | 0.00 | %(5) | |
Portfolio Turnover Rate | | | 134 | % | | | 110 | % | | | 125 | % | | | 133 | % | | | 64 | % | |
(1) Per share amount is based on average shares outstanding.
(2) Amount is less than $0.005 per share.
(3) Calculated based on the net asset value as of the last business day of the period.
(4) The Ratio of Expenses After Expense Limitation and Ratio of Net Investment Income reflect the rebate of certain Fund expenses in connection with the investments in Morgan Stanley affiliates during the period. The effect of the rebate on the ratios is disclosed in the above table as "Ratio of Rebate from Morgan Stanley Affiliates."
(5) Amount is less than 0.005%.
The accompanying notes are an integral part of the financial statements.
17
Morgan Stanley Institutional Fund Trust
Annual Report — September 30, 2023
Financial Highlights
Corporate Bond Portfolio
| | | Class A | |
| | | Year Ended September 30, | |
Selected Per Share Data and Ratios | | 2023 | | 2022 | | 2021 | | 2020 | | 2019 | |
Net Asset Value, Beginning of Period | | $ | 9.96 | | | $ | 12.97 | | | $ | 13.50 | | | $ | 12.80 | | | $ | 11.81 | | |
Income (Loss) from Investment Operations: | |
Net Investment Income(1) | | | 0.42 | | | | 0.26 | | | | 0.22 | | | | 0.29 | | | | 0.37 | | |
Net Realized and Unrealized Gain (Loss) | | | 0.00 | (2) | | | (2.68 | ) | | | (0.05 | ) | | | 0.70 | | | | 1.04 | | |
Total from Investment Operations | | | 0.42 | | | | (2.42 | ) | | | 0.17 | | | | 0.99 | | | | 1.41 | | |
Distributions from and/or in Excess of: | |
Net Investment Income | | | (0.40 | ) | | | (0.24 | ) | | | (0.22 | ) | | | (0.29 | ) | | | (0.42 | ) | |
Net Realized Gain | | | — | | | | (0.35 | ) | | | (0.48 | ) | | | — | | | | — | | |
Total Distributions | | | (0.40 | ) | | | (0.59 | ) | | | (0.70 | ) | | | (0.29 | ) | | | (0.42 | ) | |
Net Asset Value, End of Period | | $ | 9.98 | | | $ | 9.96 | | | $ | 12.97 | | | $ | 13.50 | | | $ | 12.80 | | |
Total Return(3) | | | 4.18 | % | | | (19.45 | )% | | | 1.22 | % | | | 7.88 | % | | | 12.25 | % | |
Ratios to Average Net Assets and Supplemental Data: | |
Net Assets, End of Period (Thousands) | | $ | 12,849 | | | $ | 14,158 | | | $ | 19,689 | | | $ | 10,807 | | | $ | 6,400 | | |
Ratio of Expenses Before Expense Limitation | | | 1.21 | % | | | 1.09 | % | | | 1.02 | % | | | 1.10 | % | | | 1.21 | % | |
Ratio of Expenses After Expense Limitation | | | 0.99 | %(4) | | | 0.99 | %(4) | | | 0.92 | %(4) | | | 0.99 | %(4) | | | 0.99 | %(4) | |
Ratio of Net Investment Income | | | 4.08 | %(4) | | | 2.28 | %(4) | | | 1.68 | %(4) | | | 2.20 | %(4) | | | 3.04 | %(4) | |
Ratio of Rebate from Morgan Stanley Affiliates | | | 0.00 | %(5) | | | 0.00 | %(5) | | | 0.00 | %(5) | | | 0.00 | %(5) | | | 0.00 | %(5) | |
Portfolio Turnover Rate | | | 134 | % | | | 110 | % | | | 125 | % | | | 133 | % | | | 64 | % | |
(1) Per share amount is based on average shares outstanding.
(2) Amount is less than $0.005 per share.
(3) Calculated based on the net asset value which does not reflect sales charges, if applicable, as of the last business day of the period.
(4) The Ratio of Expenses After Expense Limitation and Ratio of Net Investment Income reflect the rebate of certain Fund expenses in connection with the investments in Morgan Stanley affiliates during the period. The effect of the rebate on the ratios is disclosed in the above table as "Ratio of Rebate from Morgan Stanley Affiliates."
(5) Amount is less than 0.005%.
The accompanying notes are an integral part of the financial statements.
18
Morgan Stanley Institutional Fund Trust
Annual Report — September 30, 2023
Financial Highlights
Corporate Bond Portfolio
| | | Class L | |
| | | Year Ended September 30, | |
Selected Per Share Data and Ratios | | 2023 | | 2022 | | 2021 | | 2020 | | 2019 | |
Net Asset Value, Beginning of Period | | $ | 9.95 | | | $ | 12.96 | | | $ | 13.49 | | | $ | 12.79 | | | $ | 11.79 | | |
Income (Loss) from Investment Operations: | |
Net Investment Income(1) | | | 0.37 | | | | 0.21 | | | | 0.17 | | | | 0.24 | | | | 0.32 | | |
Net Realized and Unrealized Gain (Loss) | | | 0.00 | (2) | | | (2.69 | ) | | | (0.05 | ) | | | 0.70 | | | | 1.04 | | |
Total from Investment Operations | | | 0.37 | | | | (2.48 | ) | | | 0.12 | | | | 0.94 | | | | 1.36 | | |
Distributions from and/or in Excess of: | |
Net Investment Income | | | (0.35 | ) | | | (0.18 | ) | | | (0.17 | ) | | | (0.24 | ) | | | (0.36 | ) | |
Net Realized Gain | | | — | | | | (0.35 | ) | | | (0.48 | ) | | | — | | | | — | | |
Total Distributions | | | (0.35 | ) | | | (0.53 | ) | | | (0.65 | ) | | | (0.24 | ) | | | (0.36 | ) | |
Net Asset Value, End of Period | | $ | 9.97 | | | $ | 9.95 | | | $ | 12.96 | | | $ | 13.49 | | | $ | 12.79 | | |
Total Return(3) | | | 3.68 | % | | | (19.83 | )% | | | 0.79 | % | | | 7.47 | % | | | 11.82 | % | |
Ratios to Average Net Assets and Supplemental Data: | |
Net Assets, End of Period (Thousands) | | $ | 990 | | | $ | 1,049 | | | $ | 1,444 | | | $ | 1,727 | | | $ | 1,671 | | |
Ratio of Expenses Before Expense Limitation | | | 1.59 | % | | | 1.43 | % | | | N/A | | | | 1.39 | % | | | 1.49 | % | |
Ratio of Expenses After Expense Limitation | | | 1.47 | %(4) | | | 1.43 | %(4) | | | 1.33 | %(4) | | | 1.38 | %(4) | | | 1.38 | %(4) | |
Ratio of Net Investment Income | | | 3.60 | %(4) | | | 1.84 | %(4) | | | 1.27 | %(4) | | | 1.84 | %(4) | | | 2.67 | %(4) | |
Ratio of Rebate from Morgan Stanley Affiliates | | | 0.00 | %(5) | | | 0.00 | %(5) | | | 0.00 | %(5) | | | 0.00 | %(5) | | | 0.00 | %(5) | |
Portfolio Turnover Rate | | | 134 | % | | | 110 | % | | | 125 | % | | | 133 | % | | | 64 | % | |
(1) Per share amount is based on average shares outstanding.
(2) Amount is less than $0.005 per share.
(3) Calculated based on the net asset value as of the last business day of the period.
(4) The Ratio of Expenses After Expense Limitation and Ratio of Net Investment Income reflect the rebate of certain Fund expenses in connection with the investments in Morgan Stanley affiliates during the period. The effect of the rebate on the ratios is disclosed in the above table as "Ratio of Rebate from Morgan Stanley Affiliates."
(5) Amount is less than 0.005%.
The accompanying notes are an integral part of the financial statements.
19
Morgan Stanley Institutional Fund Trust
Annual Report — September 30, 2023
Financial Highlights
Corporate Bond Portfolio
| | | Class C | |
| | | Year Ended September 30, | |
Selected Per Share Data and Ratios | | 2023 | | 2022 | | 2021 | | 2020 | | 2019 | |
Net Asset Value, Beginning of Period | | $ | 9.89 | | | $ | 12.87 | | | $ | 13.41 | | | $ | 12.71 | | | $ | 11.72 | | |
Income (Loss) from Investment Operations: | |
Net Investment Income(1) | | | 0.34 | | | | 0.16 | | | | 0.10 | | | | 0.18 | | | | 0.27 | | |
Net Realized and Unrealized Gain (Loss) | | | (0.01 | ) | | | (2.65 | ) | | | (0.05 | ) | | | 0.71 | | | | 1.03 | | |
Total from Investment Operations | | | 0.33 | | | | (2.49 | ) | | | 0.05 | | | | 0.89 | | | | 1.30 | | |
Distributions from and/or in Excess of: | |
Net Investment Income | | | (0.32 | ) | | | (0.14 | ) | | | (0.11 | ) | | | (0.19 | ) | | | (0.31 | ) | |
Net Realized Gain | | | — | | | | (0.35 | ) | | | (0.48 | ) | | | — | | | | — | | |
Total Distributions | | | (0.32 | ) | | | (0.49 | ) | | | (0.59 | ) | | | (0.19 | ) | | | (0.31 | ) | |
Net Asset Value, End of Period | | $ | 9.90 | | | $ | 9.89 | | | $ | 12.87 | | | $ | 13.41 | | | $ | 12.71 | | |
Total Return(2) | | | 3.28 | % | | | (20.05 | )% | | | 0.28 | % | | | 7.09 | % | | | 11.34 | % | |
Ratios to Average Net Assets and Supplemental Data: | |
Net Assets, End of Period (Thousands) | | $ | 1,174 | | | $ | 1,491 | | | $ | 3,111 | | | $ | 3,222 | | | $ | 2,801 | | |
Ratio of Expenses Before Expense Limitation | | | 2.08 | % | | | 1.92 | % | | | 1.81 | % | | | 1.90 | % | | | 2.01 | % | |
Ratio of Expenses After Expense Limitation | | | 1.79 | %(3) | | | 1.80 | %(3) | | | 1.80 | %(3) | | | 1.80 | %(3) | | | 1.80 | %(3) | |
Ratio of Net Investment Income | | | 3.29 | %(3) | | | 1.40 | %(3) | | | 0.80 | %(3) | | | 1.42 | %(3) | | | 2.24 | %(3) | |
Ratio of Rebate from Morgan Stanley Affiliates | | | 0.00 | %(4) | | | 0.00 | %(4) | | | 0.00 | %(4) | | | 0.00 | %(4) | | | 0.00 | %(4) | |
Portfolio Turnover Rate | | | 134 | % | | | 110 | % | | | 125 | % | | | 133 | % | | | 64 | % | |
(1) Per share amount is based on average shares outstanding.
(2) Calculated based on the net asset value which does not reflect sales charges, if applicable, as of the last business day of the period.
(3) The Ratio of Expenses After Expense Limitation and Ratio of Net Investment Income reflect the rebate of certain Fund expenses in connection with the investments in Morgan Stanley affiliates during the period. The effect of the rebate on the ratios is disclosed in the above table as "Ratio of Rebate from Morgan Stanley Affiliates."
(4) Amount is less than 0.005%.
The accompanying notes are an integral part of the financial statements.
20
Morgan Stanley Institutional Fund Trust
Annual Report — September 30, 2023
Notes to Financial Statements
Morgan Stanley Institutional Fund Trust ("Trust") is registered under the Investment Company Act of 1940, as amended (the "Act"), as an open-end management investment company. The Trust is comprised of nine separate, active funds (individually referred to as a "Fund," collectively as the "Funds"). All Funds are considered diversified for purposes of the Act.
The Trust applies investment company accounting and reporting guidance Accounting Standards Codification ("ASC"). In the preparation of these financial statements, management has evaluated subsequent events occurring after the date of the Fund's Statement of Assets and Liabilities through the date that the financial statements were issued.
The accompanying financial statements relate to the Corporate Bond Portfolio. The Fund seeks above-average total return over a market cycle of three to five years. The Fund has issued four classes of shares — Class I, Class A, Class L and Class C.
The Fund has suspended offering Class L shares for sale to all investors. Class L shareholders of the Fund do not have the option of purchasing additional Class L shares. However, existing Class L shareholders may invest in additional Class L shares through reinvestment of dividends and distributions. In addition, Class L shares of the Fund may be exchanged for Class L shares of any Morgan Stanley Multi-Class Fund, even though Class L shares are closed to investors.
A. Significant Accounting Policies: The following significant accounting policies are in conformity with U.S. generally accepted accounting principles ("GAAP"). Such policies are consistently followed by the Trust in the preparation of its financial statements. GAAP may require management to make estimates and assumptions that affect the reported amounts and disclosures in the financial statements. Actual results may differ from those estimates.
1. Security Valuation: (1) Fixed income securities may be valued by an outside pricing service/vendor approved by the Trust's Board of Trustees (the "Trustees"). The pricing service/vendor may employ a pricing model that takes into account, among other things, bids, yield spreads and/or other market data and specific security characteristics. If Morgan Stanley Investment Management Inc. (the "Adviser") a wholly-owned subsidiary of Morgan Stanley, determines that the price provided by the outside pricing service/vendor does not reflect the security's fair value or is unable to provide a price, prices from reputable brokers/dealers may also be utilized. In these circumstances, the value of the security will be the mean of bid
and asked prices obtained from brokers/dealers; (2) futures are valued at the settlement price on the exchange on which they trade or, if a settlement price is unavailable, at the last sale price on the exchange; (3) when market quotations are not readily available, as defined by Rule 2a-5 under the Act, including circumstances under which the Adviser determines that the closing price, last sale price or the mean between the last reported bid and asked prices are not reflective of a security's market value, portfolio securities are valued at their fair value as determined in good faith under procedures approved by and under the general supervision of the Trustees. Occasionally, developments affecting the closing prices of securities and other assets may occur between the times at which valuations of such securities are determined (that is, close of the foreign market on which the securities trade) and the close of business of the New York Stock Exchange ("NYSE"). If developments occur during such periods that are expected to materially affect the value of such securities, such valuations may be adjusted to reflect the estimated fair value of such securities as of the close of the NYSE, as determined in good faith by the Trustees or by the Adviser using a pricing service and/or procedures approved by the Trustees; (4) foreign exchange transactions ("spot contracts") and foreign exchange forward contracts ("forward contracts") are valued daily using an independent pricing vendor at the spot and forward rates, respectively, as of the close of the NYSE; and (5) investments in mutual funds, including the Morgan Stanley Institutional Liquidity Funds, are valued at the net asset value ("NAV") as of the close of each business day.
In connection with Rule 2a-5 of the Act, the Trustees have designated the Trust's Adviser as its valuation designee. The valuation designee has responsibility for determining fair value and to make the actual calculations pursuant to the fair valuation methodologies previously approved by the Trustees. Under procedures approved by the Trustees, the Trust's Adviser, as valuation designee, has formed a Valuation Committee whose members are approved by the Trustees. The Valuation Committee provides administration and oversight of the Trust's valuation policies and procedures, which are reviewed at least annually by the Trustees. These procedures allow the Trust to utilize independent pricing services, quotations from securities and financial instrument dealers and other market sources to determine fair value.
21
Morgan Stanley Institutional Fund Trust
Annual Report — September 30, 2023
Notes to Financial Statements (cont'd)
2. Fair Value Measurement: Financial Accounting Standards Board ("FASB") ASC 820, "Fair Value Measurement" ("ASC 820"), defines fair value as the price that would be received to sell an asset or pay to transfer a liability in an orderly transaction between market participants at the measurement date. ASC 820 establishes a three-tier hierarchy to distinguish between (1) inputs that reflect the assumptions market participants would use in valuing an asset or liability developed based on market data obtained from sources independent of the reporting entity (observable inputs) and (2) inputs that reflect the reporting entity's own assumptions about the assumptions market participants would use in valuing an asset or liability developed based on the best information available in the circumstances (unobservable inputs) and to establish classification of fair value measurements for disclosure purposes. Various inputs are used in determining the value of the Fund's investments. The inputs are summarized in the three broad levels listed below:
• Level 1 – unadjusted quoted prices in active markets for identical investments
• Level 2 – other significant observable inputs (including quoted prices for similar investments, interest rates, prepayment speeds, credit risk, etc.)
• Level 3 – significant unobservable inputs including the Fund's own assumptions in determining the fair value of investments. Factors considered in making this determination may include, but are not limited to, information obtained by contacting the issuer, analysts, or the appropriate stock exchange (for exchange-traded securities), analysis of the issuer's financial statements or other available documents and, if necessary, available information concerning other securities in similar circumstances.
The inputs or methodology used for valuing securities are not necessarily an indication of the risk associated with investing in those securities and the determination of the significance of a particular input to the fair value measurement in its entirety requires judgment and considers factors specific to each security.
The following is a summary of the inputs used to value the Fund's investments as of September 30, 2023:
Investment Type | | Level 1
Unadjusted
quoted
prices
(000) | | Level 2
Other
significant
observable
inputs
(000) | | Level 3
Significant
unobservable
inputs
(000) | | Total
(000) | |
Assets: | |
Fixed Income Securities | |
Commercial
Mortgage-Backed
Securities | | $ | — | | | $ | 2,419 | | | $ | — | | | $ | 2,419 | | |
Corporate Bonds | | | — | | | | 102,724 | | | | — | | | | 102,724 | | |
Sovereign | | | — | | | | 265 | | | | — | | | | 265 | | |
Total Fixed Income
Securities | | | — | | | | 105,408 | | | | — | | | | 105,408 | | |
Short-Term Investments | |
Investment Company | | | 4,163 | | | | — | | | | — | | | | 4,163 | | |
U.S. Treasury Security | | | — | | | | 1,849 | | | | — | | | | 1,849 | | |
Total Short-Term
Investments | | | 4,163 | | | | 1,849 | | | | — | | | | 6,012 | | |
Foreign Currency
Forward Exchange
Contracts | | | — | | | | 40 | | | | — | | | | 40 | | |
Futures Contracts | | | 445 | | | | — | | | | — | | | | 445 | | |
Total Assets | | | 4,608 | | | | 107,297 | | | | — | | | | 111,905 | | |
Liabilities: | |
Foreign Currency
Forward Exchange
Contract | | | — | | | | (29 | ) | | | — | | | | (29 | ) | |
Futures Contracts | | | (855 | ) | | | — | | | | — | | | | (855 | ) | |
Total Liabilities | | | (855 | ) | | | (29 | ) | | | — | | | | (884 | ) | |
Total | | $ | 3,753 | | | $ | 107,268 | | | $ | — | | | $ | 111,021 | | |
Transfers between investment levels may occur as the markets fluctuate and/or the availability of data used in an investment's valuation changes.
3. Foreign Currency Translation and Foreign Investments: The books and records of the Fund are maintained in U.S. dollars. Foreign currency amounts are translated into U.S. dollars as follows:
– investments, other assets and liabilities at the prevailing rate of exchange on the valuation date;
– investment transactions and investment income at the prevailing rates of exchange on the dates of such transactions.
Although the net assets of the Fund are presented at the foreign exchange rates and market values at the close of the period, the Fund does not isolate that portion of the results of operations arising as a result of changes in the foreign exchange rates from the fluctuations arising from changes in the market prices of securities held at
22
Morgan Stanley Institutional Fund Trust
Annual Report — September 30, 2023
Notes to Financial Statements (cont'd)
period end. Similarly, the Fund does not isolate the effect of changes in foreign exchange rates from the fluctuations arising from changes in the market prices of securities sold during the period. Accordingly, realized and unrealized foreign currency gains (losses) on investments in securities are included in the reported net realized and unrealized gains (losses) on investment transactions and balances.
However, pursuant to U.S. federal income tax regulations, gains and losses from certain foreign currency transactions and the foreign currency portion of gains and losses realized on sales and maturities of foreign denominated debt securities are treated as ordinary income for U.S. federal income tax purposes.
Net realized gains (losses) on foreign currency transactions represent net foreign exchange gains (losses) from foreign currency forward exchange contracts, disposition of foreign currency, currency gains (losses) realized between the trade and settlement dates on securities transactions, and the difference between the amount of investment income and foreign withholding taxes recorded on the Fund's books and the U.S. dollar equivalent amounts actually received or paid. The change in unrealized currency gains (losses) on foreign currency transactions for the period is reflected in the Statement of Operations.
Foreign security and currency transactions may involve certain considerations and risks not typically associated with those of U.S. dollar denominated transactions as a result of, among other factors, fluctuations of exchange rates in relation to the U.S. dollar, the possibility of lower levels of governmental supervision and regulation of foreign securities markets and the possibility of political or economic instability.
Governmental approval for foreign investments may be required in advance of making an investment under certain circumstances in some countries, and the extent of foreign investments in U.S. companies may be subject to limitation in other countries. Foreign ownership limitations also may be imposed by the charters of individual companies to prevent, among other concerns, violations of foreign investment limitations. As a result, an additional class of shares (identified as "Foreign" in the Portfolio of Investments) may be created and offered
for investment. The "local" and "foreign shares" market values may differ. In the absence of trading of the foreign shares in such markets, the Fund values the foreign shares at the closing exchange price of the local shares.
4. Derivatives: The Fund may, but is not required to, use derivative instruments for a variety of purposes, including hedging, risk management, portfolio management or to earn income. Derivatives are financial instruments whose value is based, in part, on the value of an underlying asset, interest rate, index or financial instrument. Prevailing interest rates and volatility levels, among other things, also affect the value of derivative instruments. A derivative instrument often has risks similar to its underlying asset and may have additional risks, including imperfect correlation between the value of the derivative and the underlying asset, risks of default by the counterparty to certain transactions, magnification of losses incurred due to changes in the market value of the securities, instruments, indices or interest rates to which the derivative instrument relates, risks that the transactions may not be liquid, risks arising from margin and payment requirements, risks arising from mispricing or valuation complexity and operational and legal risks. The use of derivatives involves risks that are different from, and possibly greater than, the risks associated with other portfolio investments. Derivatives may involve the use of highly specialized instruments that require investment techniques and risk analyses different from those associated with other portfolio investments. All of the Fund's holdings, including derivative instruments, are marked-to-market each day with the change in value reflected in unrealized appreciation (depreciation). Upon disposition, a realized gain or loss is recognized.
Certain derivative transactions may give rise to a form of leverage. Leverage magnifies the potential for gain and the risk of loss. Leverage associated with derivative transactions may cause the Fund to liquidate portfolio positions when it may not be advantageous to do so to satisfy its obligations or may cause the Fund to be more volatile than if the Fund had not been leveraged. Although the Adviser seeks to use derivatives to further the Fund's investment objectives, there is no assurance that the use of derivatives will achieve this result.
23
Morgan Stanley Institutional Fund Trust
Annual Report — September 30, 2023
Notes to Financial Statements (cont'd)
Following is a description of the derivative instruments and techniques that the Fund used during the period and their associated risks:
Foreign Currency Forward Exchange Contracts: In connection with its investments in foreign securities, the Fund also entered into contracts with banks, brokers/dealers to purchase or sell foreign currencies at a future date. A foreign currency forward exchange contract ("currency contract") is a negotiated agreement between the contracting parties to exchange a specified amount of currency at a specified future time at a specified rate. The rate can be higher or lower than the spot rate between the currencies that are the subject of the contract. Currency contracts may be used to protect against uncertainty in the level of future foreign currency exchange rates or to gain or modify exposure to a particular currency. In addition, the Fund may use cross currency hedging or proxy hedging with respect to currencies in which the Fund has or expects to have portfolio or currency exposure. Cross currency hedges involve the sale of one currency against the positive exposure to a different currency and may be used for hedging purposes or to establish an active exposure to the exchange rate between any two currencies. To the extent hedged by the use of currency contracts, the precise matching of the currency contract amounts and the value of the securities involved will not generally be possible because the future value of such securities in foreign currencies will change as a consequence of market movements in the value of those securities between the date on which the contract is entered into and the date it matures. Furthermore, such transactions may reduce or preclude the opportunity for gain if the value of the currency should move in the direction opposite to the position taken. There is additional risk to the extent that currency contracts create exposure to currencies in which the Fund's securities are not denominated. Unanticipated changes in currency prices may result in poorer overall performance for the Fund than if it had not entered into such contracts. The use of currency contracts involves the risk of loss from the insolvency or bankruptcy of the counterparty to the contract or the failure of the counterparty to make payments or otherwise comply with the
terms of the contract. A currency contract is marked-to-market daily and the change in market value is recorded by the Fund as unrealized gain or loss. The Fund records realized gains (losses) when the currency contract is closed equal to the difference between the value of the currency contract at the time it was opened and the value at the time it was closed.
Futures: A futures contract is a standardized, exchange-traded agreement to buy or sell a specific quantity of an underlying asset, reference rate or index at a specific price at a specific future time. The value of a futures contract tends to increase and decrease in tandem with the value of the underlying instrument. Depending on the terms of the particular contract, futures contracts are settled through either physical delivery of the underlying instrument on the settlement date or by payment of a cash settlement amount on the settlement date. During the period the futures contract is open, payments are received from or made to the broker based upon changes in the value of the contract (the variation margin). A decision as to whether, when and how to use futures contracts involves the exercise of skill and judgment and even a well-conceived futures transaction may be unsuccessful because of market behavior or unexpected events. In addition to the derivatives risks discussed above, the prices of futures contracts can be highly volatile, using futures contracts can lower total return and the potential loss from futures contracts can exceed the Fund's initial investment in such contracts. No assurance can be given that a liquid market will exist for any particular futures contract at any particular time.
FASB ASC 815, "Derivatives and Hedging" ("ASC 815"), is intended to improve financial reporting about derivative instruments by requiring enhanced disclosures to enable investors to better understand how and why the Fund uses derivative instruments, how these derivative instruments are accounted for and their effects on the Fund's financial position and results of operations.
24
Morgan Stanley Institutional Fund Trust
Annual Report — September 30, 2023
Notes to Financial Statements (cont'd)
The following table sets forth the fair value of the Fund's derivative contracts by primary risk exposure as of September 30, 2023:
| | | Asset Derivatives
Statement of Assets and
Liabilities Location | | Primary Risk
Exposure | | Value
(000) | |
Foreign Currency
Forward Exchange
Contracts | | Unrealized Appreciation on
Foreign Currency Forward
Exchange Contracts | |
Currency Risk | | $ | 40 | | |
Futures Contracts | | Variation Margin on
Futures Contracts | |
Interest Rate Risk | | | 445 | (a) | |
Total | | | | | | $ | 485 | | |
| | | Liability Derivatives
Statement of Assets and
Liabilities Location | | Primary Risk
Exposure | | Value
(000) | |
Foreign Currency
Forward Exchange
Contracts | | Unrealized Depreciation on
Foreign Currency Forward
Exchange Contracts | |
Currency Risk | | $ | (29 | ) | |
Futures Contracts | | Variation Margin on
Futures Contracts | |
Interest Rate Risk | | | (855 | )(a) | |
Total | | | | | | $ | (884 | ) | |
(a) This amount represents the cumulative appreciation (depreciation) as reported in the Portfolio of Investments. The Statement of Assets and Liabilities only reflects the current day's net variation margin.
The following tables set forth by primary risk exposure the Fund's realized gains (losses) and change in unrealized appreciation (depreciation) by type of derivative contract for the year ended September 30, 2023 in accordance with ASC 815:
Realized Gain (Loss) | |
Primary Risk Exposure | | Derivative Type | | Value
(000) | |
Currency Risk | | Foreign Currency Forward
Exchange Contracts | | $ | (101 | ) | |
Interest Rate Risk | | Futures Contracts | | | (509 | ) | |
Total | | | | | | $ | (610 | ) | |
Change in Unrealized Appreciation (Depreciation) | |
Primary Risk Exposure | | Derivative Type | | Value
(000) | |
Currency Risk | | Foreign Currency Forward
Exchange Contracts | | $ | (12 | ) | |
Interest Rate Risk | | Futures Contracts | | | (446 | ) | |
Total | | | | | | $ | (458 | ) | |
At September 30, 2023, the Fund's derivative assets and liabilities are as follows:
Gross Amounts of Assets and Liabilities
Presented in the Statement of Assets and Liabilities | |
Derivatives(a) | | Assets(b)
(000) | | Liabilities(b)
(000) | |
Foreign Currency Forward Exchange Contracts | | $ | 40 | | | $ | (29 | ) | |
(a) Excludes exchange-traded derivatives.
(b) Absent an event of default or early termination, OTC derivative assets and liabilities are presented gross and not offset in the Statement of Assets and Liabilities.
The Fund typically enters into International Swaps and Derivatives Association, Inc. Master Agreements ("ISDA
Master Agreements") or similar master agreements (collectively, "Master Agreements") with its contract counterparties for certain OTC derivatives in order to, among other things, reduce its credit risk to counterparties. ISDA Master Agreements include provisions for general obligations, representations, collateral and events of default or termination. Under an ISDA Master Agreement, the Fund typically may offset with the counterparty certain OTC derivative financial instruments' payables and/or receivables with collateral held and/or posted and create one single net payment (close-out netting) in the event of default, termination and/or potential deterioration in the credit quality of the counterparty. Various Master Agreements govern the terms of certain transactions with counterparties, including transactions such as swap, forward, repurchase and reverse repurchase agreements. These Master Agreements typically attempt to reduce the counterparty risk associated with such transactions by specifying credit protection mechanisms and providing standardization that improves legal certainty. Cross-termination provisions under Master Agreements typically provide that a default in connection with one transaction between the Fund and a counterparty gives the non-defaulting party the right to terminate any other transactions in place with the defaulting party to create one single net payment due to/due from the defaulting party and may be a feature in certain Master Agreements. In the event the Fund exercises its right to terminate a Master Agreement after a counterparty experiences a termination event as defined in the Master Agreement, the return of collateral with market value in excess of the Fund's net liability may be delayed or denied.
The following tables present derivative financial instruments that are subject to enforceable netting arrangements as of September 30, 2023:
Gross Amounts Not Offset in the Statement of Assets and Liabilities | |
Counterparty | | Gross Asset
Derivatives
Presented in the
Statement of
Assets and
Liabilities
(000) | | Financial
Instrument
(000) | | Collateral
Received
(000) | | Net Amount
(not less
than $0)
(000) | |
BNP Paribas SA | | $ | 8 | | | $ | — | | | $ | — | | | $ | 8 | | |
UBS AG | | | 32 | | | | (29 | ) | | | — | | | | 3 | | |
Total | | $ | 40 | | | $ | (29 | ) | | $ | — | | | $ | 11 | | |
25
Morgan Stanley Institutional Fund Trust
Annual Report — September 30, 2023
Notes to Financial Statements (cont'd)
Gross Amounts Not Offset in the Statement of Assets and Liabilities | |
Counterparty | | Gross Liability
Derivatives
Presented in the
Statement of
Assets and
Liabilities
(000) | | Financial
Instrument
(000) | | Collateral
Pledged
(000) | | Net Amount
(not less
than $0)
(000) | |
UBS AG | | $ | 29 | | | $ | (29 | ) | | $ | — | | | $ | 0 | | |
For the year ended September 30, 2023, the approximate average monthly amount outstanding for each derivative type is as follows:
Foreign Currency Forward Exchange Contracts: | |
Average monthly principal amount | | $ | 1,490,000 | | |
Futures Contracts: | |
Average monthly notional value | | $ | 65,717,000 | | |
5. Securities Lending: The Fund lends securities to qualified financial institutions, such as broker/dealers, to earn additional income. Any increase or decrease in the fair value of the securities loaned that might occur and any interest earned or dividends declared on those securities during the term of the loan would remain in the Fund. The Fund would receive cash or securities as collateral in an amount equal to or exceeding 100% of the current fair value of the loaned securities. The collateral is marked-to-market daily by State Street Bank and Trust Company ("State Street"), the securities lending agent, to ensure that a minimum of 100% collateral coverage is maintained.
Based on pre-established guidelines, the securities lending agent invests any cash collateral that is received in an affiliated money market portfolio and repurchase agreements. Securities lending income is generated from the earnings on the invested collateral and borrowing fees, less any rebates owed to the borrowers and compensation to the lending agent, and is recorded as "Income from Securities Loaned — Net" in the Fund's Statement of Operations. Risks in securities lending transactions are that a borrower may not provide additional collateral when required or return the securities when due, and that the value of the short-term investments will be less than the amount of cash collateral plus any rebate that is required to be returned to the borrower.
The Fund has the right under the securities lending agreement to recover the securities from the borrower on demand.
The following table presents financial instruments that are subject to enforceable netting arrangements as of September 30, 2023:
Gross Amounts Not Offset in the Statement of Assets and Liabilities | |
Gross Asset
Amount
Presented in the
Statement of
Assets and
Liabilities
(000) | | Financial
Instrument
(000) | | Collateral
Received
(000) | | Net Amount
(not less
than $0)
(000) | |
| $ | 823 | (a) | | $ | — | | | $ | (823 | )(b)(c) | | $ | 0 | | |
(a) Represents market value of loaned securities at year end.
(b) The Fund received cash collateral of approximately $840,000, which was subsequently invested in Morgan Stanley Institutional Liquidity Funds as reported in the Portfolio of Investments.
(c) The actual collateral received is greater than the amount shown here due to overcollateralization.
FASB ASC 860, "Transfers & Servicing: Repurchase-to-Maturity Transactions, Repurchase Financings, and Disclosures", is intended to provide increased transparency about the types of collateral pledged in securities lending transactions and other similar transactions that are accounted for as secured borrowings.
The following table displays a breakdown of transactions accounted for as secured borrowings, the gross obligations by class of collateral pledged and the remaining contractual maturity of those transactions as of September 30, 2023:
Remaining Contractual Maturity of the Agreements | |
| | | Overnight and
Continuous
(000) | | <30 days
(000) | | Between
30 &
90 days
(000) | | >90 Days
(000) | | Total
(000) | |
Securities Lending
Transactions | |
Corporate Bonds | | $ | 840 | | | $ | — | | | $ | — | | | $ | — | | | $ | 840 | | |
Total Borrowings | | $ | 840 | | | $ | — | | | $ | — | | | $ | — | | | $ | 840 | | |
Gross amount of
recognized liabilities
for securities lending
transactions | | | | | | | | | | $ | 840 | | |
6. Indemnifications: The Trust enters into contracts that contain a variety of indemnification clauses. The Trust's maximum exposure under these arrangements is unknown as this would involve future claims that may be made against the Fund that have not yet occurred.
26
Morgan Stanley Institutional Fund Trust
Annual Report — September 30, 2023
Notes to Financial Statements (cont'd)
7. Dividends and Distributions to Shareholders: Dividends and distributions to shareholders are recorded on the ex-dividend date. Dividends from net investment income, if any, are declared and paid monthly. Net realized capital gains, if any, are distributed at least annually.
8. Security Transactions, Income and Expenses: Security transactions are accounted for on the trade date (date the order to buy or sell is executed). Realized gains and losses on the sale of investment securities are determined on the specific identified cost method. Dividend income and other distributions are recorded on the ex-dividend date (except for certain foreign dividends which may be recorded as soon as the Fund is informed of such dividends) net of applicable withholding taxes. Non-cash dividends received in the form of stock, if any, are recognized on the ex-dividend date and recorded as non-cash dividend income at fair value. Interest income is recognized on the accrual basis (except where collection is in doubt) net of applicable withholding taxes. Discounts are accreted and premiums are amortized over the life of the respective securities. Most expenses of the Trust can be directly attributed to a particular Fund. Expenses which cannot be directly attributed are apportioned among the Funds based upon relative net assets or other appropriate methods. Income, expenses (other than class specific expenses — distribution and shareholder services, transfer agency and sub transfer agency fees) and realized and unrealized gains or losses are allocated to each class of shares based upon their relative net assets.
B. Advisory Fees: The Adviser, a wholly-owned subsidiary of Morgan Stanley, provides the Fund with advisory services under the terms of an Investment Advisory Agreement, paid quarterly, at an annual rate of 0.375% of the average daily net assets of the Fund.
The Adviser has agreed to reduce its advisory fee and/or reimburse the Fund so that total annual Fund operating expenses, excluding certain investment related expenses, taxes, interest and other extraordinary expenses (including litigation), will not exceed 0.70% for Class I shares, 1.05% for Class A shares, 1.52% for Class L shares and 1.80% for Class C shares. Effective after close of business on July 1, 2023, the Adviser has agreed to reduce its advisory fee and/or reimburse the Fund so that total annual Fund operating expenses will not exceed 0.65% for Class I shares, 1.00% for Class A shares, 1.47% for Class L shares and 1.75% for Class C shares. The fee waivers and/or expense reimbursements will continue for at least one
year from the date of the Fund's prospectus or until such time as the Trustees act to discontinue all or a portion of such waivers and/or reimbursements when they deem such action is appropriate. For the year ended September 30, 2023, approximately $118,000 of advisory fees were waived and approximately $242,000 of other expenses were reimbursed by the Adviser pursuant to this arrangement.
C. Administration Fees: The Adviser also serves as Administrator to the Trust and provides administrative services pursuant to an Administration Agreement for an annual fee, accrued daily and paid monthly, of 0.08% of the Fund's average daily net assets.
Under a Sub-Administration Agreement between the Administrator and State Street, State Street provides certain administrative services to the Trust. For such services, the Administrator pays State Street a portion of the fee the Administrator receives from the Fund.
D. Distribution and Shareholder Services Fees: Morgan Stanley Distribution, Inc. ("MSDI" or the "Distributor"), a wholly-owned subsidiary of the Adviser and an indirect subsidiary of Morgan Stanley, serves as the Trust's Distributor of Fund shares pursuant to a Distribution Agreement. The Trust has adopted a Shareholder Services Plan with respect to Class A shares pursuant to Rule 12b-1 under the Act. Under the Shareholder Services Plan, the Fund pays the Distributor a shareholder services fee, accrued daily and paid monthly, at an annual rate of 0.25% of the Fund's average daily net assets attributable to Class A shares. The Distributor has agreed to waive the 12b-1 fees on Class A shares of the Fund to the extent it exceeds 0.15% of the average daily net assets of such shares on an annualized basis. For the year ended September 30, 2023, this waiver amounted to approximately $14,000.
The Trust has adopted a Distribution and Shareholder Services Plan with respect to Class L shares pursuant to Rule 12b-1 under the Act. Under the Distribution and Shareholder Services Plan, the Fund pays the Distributor a distribution fee, accrued daily and paid monthly, at an annual rate of 0.25% and a shareholder services fee, accrued daily and paid monthly, at an annual rate of 0.25% of the Fund's average daily net assets attributable to Class L shares.
The Trust has adopted a Distribution and Shareholder Services Plan with respect to Class C shares pursuant to Rule 12b-1 under the Act. Under the Distribution and Shareholder Services Plan, the Fund pays the Distributor a distribution fee, accrued daily and paid monthly, at an annual rate of 0.75% and a
27
Morgan Stanley Institutional Fund Trust
Annual Report — September 30, 2023
Notes to Financial Statements (cont'd)
shareholder services fee, accrued daily and paid monthly, at an annual rate of 0.25% of the Fund's average daily net assets attributable to Class C shares.
The distribution and shareholder services fees are used to support the expenses associated with servicing and maintaining accounts. The Distributor may compensate other parties for providing distribution-related and/or shareholder support services to investors who purchase Class A, Class L and Class C shares.
E. Dividend Disbursing and Transfer/Co-Transfer Agent: The Trust's dividend disbursing and transfer agent is SS&C Global Investor & Distribution Solutions, Inc. ("SS&C GIDS"). Pursuant to a Transfer Agency Agreement, the Trust pays SS&C GIDS a fee based on the number of classes, accounts and transactions relating to the Funds of the Trust.
Eaton Vance Management ("EVM"), an affiliate of Morgan Stanley, provides co-transfer agency and related services to the Fund pursuant to a Co-Transfer Agency Services Agreement. For the year ended September 30, 2023, co-transfer agency fees and expenses incurred to EVM, included in "Transfer Agency Fees" in the Statement of Operations, amounted to approximately $11,000.
F. Custodian Fees: State Street (the "Custodian") also serves as Custodian for the Trust in accordance with a Custodian Agreement. The Custodian holds cash, securities and other assets of the Trust as required by the Act. Custody fees are payable monthly based on assets held in custody, investment purchases and sales activity and account maintenance fees, plus reimbursement for certain out-of-pocket expenses.
G. Security Transactions and Transactions with Affiliates: For the year ended September 30, 2023, purchases and sales of investment securities for the Fund, other than long-term U.S. Government securities and short-term investments were approximately $161,701,000 and $187,086,000, respectively. For the year ended September 30, 2023, purchases and sales of long-term U.S. Government securities were approximately $348,000 and $0, respectively.
The Fund invests in the Institutional Class of the Morgan Stanley Institutional Liquidity Funds — Government Portfolio (the "Liquidity Funds"), an open-end management investment company managed by the Adviser, both directly and as a portion of the securities held as collateral on loaned securities. Advisory fees paid by the Fund are reduced by an amount equal to its pro-rata share of the advisory and administration
fees paid by the Fund due to its investment in the Liquidity Funds. For the year ended September 30, 2023, advisory fees paid were reduced by approximately $3,000 relating to the Fund's investment in the Liquidity Funds.
A summary of the Fund's transactions in shares of affiliated investments during the year ended September 30, 2023 is as follows:
Affiliated
Investment
Company | | Value
September 30,
2022
(000) | | Purchases
at Cost
(000) | | Proceeds
from Sales
(000) | | Dividend
Income
(000) | |
Liquidity Funds | | $ | 2,799 | | | $ | 62,081 | | | $ | 60,717 | | | $ | 92 | | |
Affiliated
Investment
Company (cont'd) | | Realized
Gain
(Loss)
(000) | | Change in
Unrealized
Appreciation
(Depreciation)
(000) | | Value
September 30,
2023
(000) | |
Liquidity Funds | | $ | — | | | $ | — | | | $ | 4,163 | | |
The Fund has an unfunded noncontributory defined benefit pension plan covering certain independent Trustees of the Fund who will have served as independent Trustees for at least five years at the time of retirement. Benefits under this plan are based on factors which include years of service and compensation. The Trustees voted to close the plan to new participants and eliminate the future benefits growth due to increases to compensation after July 31, 2003. Aggregate pension costs for the year ended September 30, 2023, included in "Trustees' Fees and Expenses" in the Statement of Operations amounted to approximately $2,000. At September 30, 2023, the Fund had an accrued pension liability of approximately $38,000, which is reflected as "Payable for Trustees' Fees and Expenses" in the Statement of Assets and Liabilities.
The Fund has an unfunded Deferred Compensation Plan (the "Compensation Plan"), which allows each independent Trustee to defer payment of all, or a portion, of the fees he or she receives for serving on the Board of Trustees. Each eligible Trustee generally may elect to have the deferred amounts credited with a return equal to the total return on one or more of the Morgan Stanley funds that are offered as investment options under the Compensation Plan. Appreciation/depreciation and distributions received from these investments are recorded with an offsetting increase/decrease in the deferred compensation obligation and do not affect the NAV of the Fund.
H. Federal Income Taxes: It is the Fund's intention to continue to qualify as a regulated investment company and distribute all of its taxable and tax-exempt income income. Accordingly, no provision for federal income taxes is required in the financial statements.
28
Morgan Stanley Institutional Fund Trust
Annual Report — September 30, 2023
Notes to Financial Statements (cont'd)
The Fund may be subject to taxes imposed by countries in which it invests. Such taxes are generally based on income and/or capital gains earned or repatriated. Taxes are accrued based on net investment income, net realized gains and net unrealized appreciation as such income and/or gains are earned. Taxes may also be based on transactions in foreign currency and are accrued based on the value of investments denominated in such currency.
FASB ASC 740-10, "Income Taxes — Overall", sets forth a minimum threshold for financial statement recognition of the benefit of a tax position taken or expected to be taken in a tax return. Management has concluded that there are no significant uncertain tax positions that would require recognition in the financial statements. If applicable, the Fund recognizes interest accrued related to unrecognized tax benefits in "Interest Expense" and penalties in "Other Expenses" in the Statement of Operations. The Fund files tax returns with the U.S. Internal Revenue Service, New York and various states. Generally, each of the tax years in the four-year period ended September 30, 2023 remains subject to examination by taxing authorities.
The tax character of distributions paid may differ from the character of distributions shown for GAAP purposes due to short-term capital gains being treated as ordinary income for tax purposes. The tax character of distributions paid during fiscal years 2023 and 2022 was as follows:
| | 2023
Distributions
Paid From: | | 2022
Distributions
Paid From: | |
| | Ordinary
Income
(000) | | Ordinary
Income
(000) | | Long-Term
Capital Gain
(000) | |
| | | | | $ | 5,255 | | | $ | 3,558 | | | $ | 4,828 | | |
The amount and character of income and gains to be distributed are determined in accordance with income tax regulations which may differ from GAAP. These book/tax differences are either considered temporary or permanent in nature.
Temporary differences are attributable to differing book and tax treatments for the timing of the recognition of gains (losses) on certain investment transactions and the timing of the deductibility of certain expenses.
The Fund had no permanent differences causing reclassifications among the components of net assets for the year ended September 30, 2023.
At September 30, 2023, the components of distributable earnings for the Fund on a tax basis were as follows:
Undistributed
Ordinary
Income
(000) | | Undistributed
Long-Term
Capital Gain
(000) | |
| $ | 568 | | | $ | — | | |
At September 30, 2023, the Fund had available for federal income tax purposes unused short-term and long term capital losses of approximately $9,142,000 and $15,700,000 respectively, that do not have an expiration date.
To the extent that capital loss carryforwards are used to offset any future capital gains realized, no capital gains tax liability will be incurred by the Fund for gains realized and not distributed. To the extent that capital gains are offset, such gains will not be distributed to the shareholders.
I. Credit Facility: The Trust and other Morgan Stanley funds participated in a $300,000,000 committed, unsecured revolving line of credit facility (the "Facility") with State Street. Effective April 17, 2023, the committed line amount increased to $500,000,000. This Facility is to be used for temporary emergency purposes or funding of shareholder redemption requests. The interest rate for any funds drawn will be based on the federal funds rate or overnight bank funding rate plus a spread. The Facility also has a commitment fee of 0.25% per annum based on the unused portion of the Facility, which is allocated among participating funds based on relative net assets. During the twelve months ended September 30, 2023, the Fund did not have any borrowings under the Facility.
J. Other: At September 30, 2023, the Fund had record owners of 10% or greater. Investment activities of these shareholders could have a material impact on the Fund. The aggregate percentage of such owners was 58.8%.
K. Market Risk: An investment in the Fund is based on the values of the Fund's investments, which may change due to economic and other events that affect markets generally, as well as those that affect particular regions, countries, industries, companies or governments. The risks associated with these developments may be magnified if social, political, economic and other conditions and events (such as war, natural disasters, health emergencies (e.g., epidemics and pandemics), terrorism, conflicts, social unrest, recessions, inflation, rapid interest rate changes and supply chain disruptions) adversely interrupt the global economy and financial markets. It is difficult to predict when events affecting the U.S. or global financial markets may occur, the effects that such events may have and the duration
29
Morgan Stanley Institutional Fund Trust
Annual Report — September 30, 2023
Notes to Financial Statements (cont'd)
of those effects (which may last for extended periods). These events may negatively impact broad segments of businesses and populations and have a significant and rapid negative impact on the performance of the Fund's investments, adversely affect and increase the volatility of the Fund's share price and exacerbate pre-existing risks to the Fund. The occurrence, duration and extent of these or other types of adverse economic and market conditions and uncertainty over the long term cannot be reasonably projected or estimated at this time. The ultimate impact of public health emergencies or other adverse economic or market developments and the extent to which the associated conditions impact the Fund and its investments will also depend on other future developments, which are highly uncertain, difficult to accurately predict and subject to change at any time. The financial performance of the Fund's investments (and, in turn, the Fund's investment results) as well as their liquidity may be adversely affected because of these and similar types of factors and developments.
30
Morgan Stanley Institutional Fund Trust
Annual Report — September 30, 2023
Report of Independent Registered Public Accounting Firm
To the Shareholders and Board of Trustees of
Morgan Stanley Institutional Fund Trust —
Corporate Bond Portfolio
Opinion on the Financial Statements
We have audited the accompanying statement of assets and liabilities of Corporate Bond Portfolio (the "Fund") (one of the funds constituting Morgan Stanley Institutional Fund Trust (the "Trust")), including the portfolio of investments, as of September 30, 2023, and the related statement of operations for the year then ended, the statements of changes in net assets for each of the two years in the period then ended, the financial highlights for each of the five years in the period then ended and the related notes (collectively referred to as the "financial statements"). In our opinion, the financial statements present fairly, in all material respects, the financial position of the Fund (one of the funds constituting Morgan Stanley Institutional Fund Trust) at September 30, 2023, the results of its operations for the year then ended, the changes in its net assets for each of the two years in the period then ended and its financial highlights for each of the five years in the period then ended, in conformity with U.S. generally accepted accounting principles.
Basis for Opinion
These financial statements are the responsibility of the Trust's management. Our responsibility is to express an opinion on the Fund's financial statements based on our audits. We are a public accounting firm registered with the Public Company Accounting Oversight Board (United States) ("PCAOB") and are required to be independent with respect to the Trust in accordance with the U.S. federal securities laws and the applicable rules and regulations of the Securities and Exchange Commission and the PCAOB.
We conducted our audits in accordance with the standards of the PCAOB. Those standards require that we plan and perform the audit to obtain reasonable assurance about whether the financial statements are free of material misstatement, whether due to error or fraud. The Trust is not required to have, nor were we engaged to perform, an audit of the Trust's internal control over financial reporting. As part of our audits, we are required to obtain an understanding of internal control over financial reporting but not for the purpose of expressing an opinion on the effectiveness of the Trust's internal control over financial reporting. Accordingly, we express no such opinion.
Our audits included performing procedures to assess the risks of material misstatement of the financial statements, whether due to error or fraud, and performing procedures that respond to those risks. Such procedures included examining, on a test basis, evidence regarding the amounts and disclosures in the financial statements. Our procedures included confirmation of securities owned as of September 30, 2023, by correspondence with the custodian, brokers and others; when replies were not received from brokers and others, we performed other auditing procedures. Our audits also included evaluating the accounting principles used and significant estimates made by management, as well as evaluating the overall presentation of the financial statements. We believe that our audits provide a reasonable basis for our opinion.

We have served as the auditor of one or more Morgan Stanley investment companies since 2000.
Boston, Massachusetts
November 27, 2023
31
Morgan Stanley Institutional Fund Trust
Annual Report — September 30, 2023
Investment Advisory Agreement Approval (unaudited)
Nature, Extent and Quality of Services
The Board reviewed and considered the nature and extent of the investment advisory services provided by the Adviser under the advisory agreement, including portfolio management, investment research and equity and fixed income securities trading. The Board also reviewed and considered the nature and extent of the non-advisory, administrative services provided by the Administrator under the administration agreement, including accounting, operations, clerical, bookkeeping, compliance, business management and planning, legal services and the provision of supplies, office space and utilities at the Adviser's expense. The Board also considered the Adviser's investment in personnel and infrastructure that benefits the Fund. (The Adviser and Administrator together are referred to as the "Adviser" and the advisory and administration agreements together are referred to as the "Management Agreement.") The Board also considered that the Adviser serves a variety of other investment advisory clients and has experience overseeing service providers. The Board also compared the nature of the services provided by the Adviser with similar services provided by non-affiliated advisers as prepared by Broadridge Financial Solutions, Inc. ("Broadridge").
The Board reviewed and considered the qualifications of the portfolio managers, the senior administrative managers and other key personnel of the Adviser who provide the advisory and administrative services to the Fund. The Board determined that the Adviser's portfolio managers and key personnel are well qualified by education and/or training and experience to perform the services in an efficient and professional manner. The Board concluded that the nature and extent of the advisory and administrative services provided were necessary and appropriate for the conduct of the business and investment activities of the Fund and supported its decision to approve the Management Agreement.
Performance, Fees and Expenses of the Fund
The Board reviewed the performance, fees and expenses of the Fund compared to its peers, as prepared by Broadridge, and to appropriate benchmarks where applicable. The Board discussed with the Adviser the performance goals and the actual results achieved in managing the Fund. When considering a fund's performance, the Board and the Adviser place emphasis on trends and longer-term returns (focusing on one-year, three-year and five-year performance, as of December 31, 2022, or since inception, as applicable). When a fund underperforms its benchmark and/or its peer group average, the Board and the Adviser discuss the causes of such underperformance and, where necessary, they discuss specific changes to investment strategy or investment personnel. The Board noted that the Fund's performance was below its peer group average for the one-, three- and five-year periods. The Board discussed with the Adviser the level of the advisory and administration fees (together, the "management fee") for this Fund relative to comparable funds and/or other accounts advised by the Adviser and/or compared to its peers as prepared by Broadridge. In addition to the management fee, the Board also reviewed the Fund's total expense ratio. When a fund's management fee and/or its total expense ratio are higher than its peers, the Board and the Adviser discuss the reasons for this and, where appropriate, they discuss possible waivers and/or caps. The Board noted that the Fund's management fee was lower than its peer group average and total expense ratio was higher than its peer group average. After discussion, the Board concluded that the Fund's (i) performance and total expense ratio were acceptable and (ii) management fee was competitive with its peer group average.
Economies of Scale
The Board considered the size and growth prospects of the Fund and how that relates to the Fund's total expense ratio and particularly the Fund's management fee rate, which does not include breakpoints. In conjunction with its review of the Adviser's profitability, the Board discussed with the Adviser how a change in assets can affect the efficiency or effectiveness of managing the Fund and whether the management fee level is appropriate relative to current and projected asset levels and/or whether the management fee structure reflects economies of scale as asset levels change. The Board has determined that its review of the actual and/or potential economies of scale of the Fund supports its decision to approve the Management Agreement.
Profitability of the Adviser and Affiliates
The Board considered information concerning the costs incurred and profits realized by the Adviser and its affiliates during the last year from their relationship with the Fund and during the last two years from their relationship with the Morgan Stanley Fund Complex and reviewed with the Adviser the cost allocation methodology used to determine the profitability of the Adviser and affiliates. The Board has determined that its review of the analysis of the Adviser's expenses and profitability supports its decision to approve the Management Agreement.
32
Morgan Stanley Institutional Fund Trust
Annual Report — September 30, 2023
Investment Advisory Agreement Approval (unaudited) (cont'd)
Other Benefits of the Relationship
The Board considered other direct and indirect benefits to the Adviser and/or its affiliates derived from their relationship with the Fund and other funds advised by the Adviser. These benefits may include, among other things, fees for trading, distribution and/or shareholder servicing and for transaction processing and reporting platforms used by securities lending agents, and research received by the Adviser generated from commission dollars spent on funds' portfolio trading. The Board reviewed with the Adviser these arrangements and the reasonableness of the Adviser's costs relative to the services performed. The Board has determined that its review of the other benefits received by the Adviser or its affiliates supports its decision to approve the Management Agreement.
Resources of the Adviser and Historical Relationship Between the Fund and the Adviser
The Board considered whether the Adviser is financially sound and has the resources necessary to perform its obligations under the Management Agreement. The Board also reviewed and considered the historical relationship between the Fund and the Adviser, including the organizational structure of the Adviser, the policies and procedures formulated and adopted by the Adviser for managing the Fund's operations and the Board's confidence in the competence and integrity of the senior managers and key personnel of the Adviser. The Board concluded that the Adviser has the financial resources necessary to fulfill its obligations under the Management Agreement and that it is beneficial for the Fund to continue its relationship with the Adviser.
Other Factors and Current Trends
The Board considered the controls and procedures adopted and implemented by the Adviser and monitored by the Fund's Chief Compliance Officer and concluded that the conduct of business by the Adviser indicates a good faith effort on its part to adhere to high ethical standards in the conduct of the Fund's business.
General Conclusion
After considering and weighing all of the above factors, with various written materials and verbal information presented by the Adviser, the Board concluded that it would be in the best interest of the Fund and its shareholders to approve renewal of the Management Agreement for another year. In reaching this conclusion the Board did not give particular weight to any single piece of information or factor referenced above. The Board considered these factors and information over the course of the year and in numerous meetings, some of which were in executive session with only the independent Board members and their counsel present. It is possible that individual Board members may have weighed these factors, and the information presented, differently in reaching their individual decisions to approve the Management Agreement.
33
Morgan Stanley Institutional Fund Trust
Annual Report — September 30, 2023
Liquidity Risk Management Program (unaudited)
In compliance with Rule 22e-4 under the Investment Company Act of 1940, as amended (the "Liquidity Rule"), the Fund has adopted and implemented a liquidity risk management program (the "Program"), which is reasonably designed to assess and manage the risk that the Fund could not meet requests to redeem shares issued by the Fund without significant dilution of remaining investors' interests in the Fund (i.e., liquidity risk). The Fund's Board of Trustees (the "Board") previously approved the designation of the Liquidity Risk Subcommittee (the "LRS") as Program administrator. The LRS is comprised of representatives from various divisions within Morgan Stanley Investment Management.
At a meeting held on March 1-2, 2023, the Board reviewed a written report prepared by the LRS that addressed the Program's operation and assessed its adequacy, and effectiveness of implementation for the period from January 1, 2022, through December 31, 2022, as required under the Liquidity Rule. The report concluded that the Program operated effectively and was adequately and effectively implemented in all material aspects, and that the relevant controls and safeguards were appropriately designed to enable the LRS to administer the Program in compliance with the Liquidity Rule.
In accordance with the Program, the LRS assessed each Fund's liquidity risk no less frequently than annually taking into consideration certain factors, as applicable, such as (i) investment strategy and liquidity of portfolio investments, (ii) short-term and long-term cash flow projections and (iii) holdings of cash and cash equivalents and borrowing arrangements and other funding sources. Certain factors are considered under both normal and reasonably foreseeable stressed conditions.
Each Fund portfolio investment is classified into one of four liquidity categories, which classification is assessed at least monthly by the LRS. The classification is based on a determination of the number of days it is reasonably expected to take to convert the investment into cash, or sell or dispose of the investment, in current market conditions without significantly changing the market value of the investment. Liquidity classification determinations take into account various market, trading and investment-specific considerations, as well as market depth, and in some cases utilize third-party vendor data.
The Liquidity Rule limits a fund's investments in illiquid investments to 15% of its net assets and requires funds that do not primarily hold assets that are highly liquid investments to determine and maintain a minimum percentage of the fund's net assets to be invested in highly liquid investments (highly liquid investment minimum or "HLIM"). The LRS believes that the Program includes provisions reasonably designed to review, monitor and comply with the 15% limit on illiquid investments and for determining, periodically reviewing and complying with the HLIM requirement, as applicable.
There can be no assurance that the Program will achieve its objectives under all circumstances in the future. Please refer to the Fund's prospectus for more information regarding the Fund's exposure to liquidity risk and other risks to which it may be subject.
34
Morgan Stanley Institutional Fund Trust
Annual Report — September 30, 2023
Important Notices (unaudited)
Reporting to Shareholders
Each Morgan Stanley fund provides a complete schedule of portfolio holdings in its Semi-Annual and the Annual Reports within 60 days of the end of the fund's second and fourth fiscal quarters. The Semi-Annual and Annual Reports are filed electronically with the Securities and Exchange Commission ("SEC") on Form N-CSRS and Form N-CSR, respectively. Morgan Stanley makes these reports available on its public website, www.morganstanley.com/im. Each Morgan Stanley non-money market fund also files a complete schedule of portfolio holdings with the SEC for the fund's first and third fiscal quarters as an attachment to Form N-PORT. Morgan Stanley does not deliver the reports for the first and third fiscal quarters to shareholders, but makes the complete schedule of portfolio holdings for the fund's first and third fiscal quarters available on its public website. The holdings for each money market fund are also posted to the Morgan Stanley public website. You may obtain the Form N-PORT filings (as well as the Form N-CSR and N-CSRS filings) by accessing the SEC's website, www.sec.gov. You can also request copies of these materials, upon payment of a duplicating fee, by electronic request at the SEC's email address (publicinfo@sec.gov).
Proxy Voting Policies and Procedures and Proxy Voting Record
You may obtain a copy of the Trust's Proxy Voting Policy and Procedures and information regarding how the Trust voted proxies relating to portfolio securities during the most recent twelve-month period ended June 30, without charge, upon request, by calling toll free 1 (800) 869-6397 or by visiting our website at www.morganstanley.com/im. This information is also available on the SEC's website at www.sec.gov.
This report is authorized for distribution only when preceded or accompanied by a prospectus or summary prospectus of the applicable fund of Morgan Stanley Institutional Fund Trust, which describes in detail the fund's investment policies, risks, fees and expenses. Please read the prospectus carefully before you invest or send money. For additional information, including information regarding the investments comprising the Fund, please visit our website at www.morganstanley.com/im. or call toll free 1 (800) 869-6397.
Householding Notice
To reduce printing and mailing costs, the Fund attempts to eliminate duplicate mailings to the same address. The Fund delivers a single copy of certain shareholder documents, including shareholder reports, prospectuses and proxy materials, to investors with the same last name who reside at the same address. Your participation in this program will continue for an unlimited period of time unless you instruct us otherwise. You can request multiple copies of these documents by calling 1 (800) 869-6397, 8:00 a.m. to 6:00 p.m., ET. Once our Customer Service Center has received your instructions, we will begin sending individual copies for each account within 30 days.
Tailored Shareholder Reports
Effective January 24, 2023, the SEC adopted rule and form amendments to require open-end mutual funds and ETFs to transmit concise and visually engaging streamlined annual and semiannual reports to shareholders that highlight key information. Other information, including financial statements, will no longer appear in a streamlined shareholder report but must be available online, delivered free of charge upon request, and filed on a semiannual basis on Form N-CSR. The rule and form amendments have a compliance date of July 24, 2024. At this time, management is evaluating the impact of these amendments on the shareholder reports for the Morgan Stanley Funds.
35
Morgan Stanley Institutional Fund Trust
Annual Report — September 30, 2023
Federal Tax Notice (unaudited)
For federal income tax purposes, the following information is furnished with respect to the distributions paid by the Fund during its taxable year ended September 30, 2023.
The Fund designated approximately $4,795,000 of its distributions paid as business interest income.
The Fund designated approximately $3,604,000 of its distributions paid as qualified interest income.
In January, the Fund provides tax information to shareholders for the preceding calendar year.
36
Morgan Stanley Institutional Fund Trust
Annual Report — September 30, 2023
U.S. Customer Privacy Notice (unaudited) April 2021
FACTS | | WHAT DOES MSIM DO WITH YOUR PERSONAL INFORMATION? | |
Why? | | Financial companies choose how they share your personal information. Federal law gives consumers the right to limit some but not all sharing. Federal law also requires us to tell you how we collect, share, and protect your personal information. Please read this notice carefully to understand what we do. | |
What? | | The types of personal information we collect and share depend on the product or service you have with us. This information can include:
◼ Social Security number and income
◼ investment experience and risk tolerance
◼ checking account number and wire transfer instructions | |
How? | | All financial companies need to share customers' personal information to run their everyday business. In the section below, we list the reasons financial companies can share their customers' personal information; the reasons MSIM chooses to share; and whether you can limit this sharing. | |
Reasons we can share your personal information | | Does MSIM share? | | Can you limit this sharing? | |
For our everyday business purposes —
such as to process your transactions, maintain your account(s), respond to court orders and legal investigations, or report to credit bureaus | | Yes | | No | |
For our marketing purposes —
to offer our products and services to you | | Yes | | No | |
For joint marketing with other financial companies | | No | | We don't share | |
For our investment management affiliates' everyday business purposes —
information about your transactions, experiences, and creditworthiness | | Yes | | Yes | |
For our affiliates' everyday business purposes —
information about your transactions and experiences | | Yes | | No | |
For our affiliates' everyday business purposes —
information about your creditworthiness | | No | | We don't share | |
For our investment management affiliates to market to you | | Yes | | Yes | |
For our affiliates to market to you | | No | | We don't share | |
For non-affiliates to market to you | | No | | We don't share | |
37
Morgan Stanley Institutional Fund Trust
Annual Report — September 30, 2023
U.S. Customer Privacy Notice (unaudited) (cont'd) April 2021
To limit our sharing | | Call toll-free (844) 312-6327 or email: imprivacyinquiries@morganstanley.com
Please note:
If you are a new customer, we can begin sharing your information 30 days from the date we sent this notice. When you are no longer our customer, we continue to share your information as described in this notice. However, you can contact us at any time to limit our sharing. | |
Questions? | | Call toll-free (844) 312-6327 or email: imprivacyinquiries@morganstanley.com | |
Who we are
Who is providing this notice? | | Morgan Stanley Investment Management Inc. and its investment management affiliates ("MSIM") (see Investment Management Affiliates definition below) | |
What we do
How does MSIM protect my personal information? | | To protect your personal information from unauthorized access and use, we use security measures that comply with federal law. These measures include computer safeguards and secured files and buildings. We have policies governing the proper handling of customer information by personnel and requiring third parties that provide support to adhere to appropriate security standards with respect to such information. | |
How does MSIM collect my personal information? | | We collect your personal information, for example, when you
◼ open an account or make deposits or withdrawals from your account
◼ buy securities from us or make a wire transfer
◼ give us your contact information
We also collect your personal information from others, such as credit bureaus, affiliates, or other companies. | |
Why can't I limit all sharing? | | Federal law gives you the right to limit only
◼ sharing for affiliates' everyday business purposes — information about your creditworthiness
◼ affiliates from using your information to market to you
◼ sharing for non-affiliates to market to you
State laws and individual companies may give you additional rights to limit sharing. See below for more on your rights under state law. | |
38
Morgan Stanley Institutional Fund Trust
Annual Report — September 30, 2023
U.S. Customer Privacy Notice (unaudited) (cont'd) April 2021
Definitions
Investment Management Affiliates | | MSIM Investment Management Affiliates include registered investment advisers, registered broker-dealers, and registered and unregistered funds in the Investment Management Division. Investment Management Affiliates does not include entities associated with Morgan Stanley Wealth Management, such as Morgan Stanley Smith Barney LLC and Morgan Stanley & Co. | |
Affiliates | | Companies related by common ownership or control. They can be financial and non-financial companies.
◼ Our affiliates include companies with a Morgan Stanley name and financial companies such as Morgan Stanley Smith Barney LLC and Morgan Stanley & Co. | |
Non-affiliates | | Companies not related by common ownership or control. They can be financial and non-financial companies.
◼ MSIM does not share with non-affiliates so they can market to you. | |
Joint marketing | | A formal agreement between non-affiliated financial companies that together market financial products or services to you.
◼ MSIM doesn't jointly market | |
Other important information
Vermont: Except as permitted by law, we will not share personal information we collect about Vermont residents with Non-affiliates unless you provide us with your written consent to share such information.
California: Except as permitted by law, we will not share personal information we collect about California residents with Non-affiliates and we will limit sharing such personal information with our Affiliates to comply with California privacy laws that apply to us.
39
Morgan Stanley Institutional Fund Trust
Annual Report — September 30, 2023
Trustees and Officers Information (unaudited)
Independent Trustees:
Name, Address and Birth Year
of Independent Trustee | | Position(s)
Held with
Registrant | | Length of Time
Served* | | Principal Occupation(s) During Past 5 Years
and Other Relevant Professional Experience | | Number of
Funds in
Fund Complex
Overseen by
Independent
Trustee** | | Other Directorships
Held by Independent
Trustee During
Past 5 Years*** | |
Frank L. Bowman
c/o Perkins Coie LLP
Counsel to the Independent Trustees
1155 Avenue of the Americas
22nd Floor
New York, NY 10036
Birth Year: 1944 | | Trustee | | Since
August
2006 | | President, Strategic Decisions, LLC (consulting) (since February 2009); Director or Trustee of various Morgan Stanley Funds (since August 2006); Chairperson of the Compliance and Insurance Committee (since October 2015); formerly, Chairperson of the Insurance Sub-Committee of the Compliance and Insurance Committee (2007-2015); served as President and Chief Executive Officer of the Nuclear Energy Institute (policy organization) (February 2005-November 2008); retired as Admiral, U.S. Navy after serving over 38 years on active duty including 8 years as Director of the Naval Nuclear Propulsion Program in the Department of the Navy and the U.S. Department of Energy (1996-2004); served as Chief of Naval Personnel (July 1994-September 1996) and on the Joint Staff as Director of Political Military Affairs (June 1992-July 1994); knighted as Honorary Knight Commander of the Most Excellent Order of the British Empire; awarded the Officier de l'Orde National du Mèrite by the French Government; elected to the National Academy of Engineering (2009). | | | 86 | | | Director of Naval and Nuclear Technologies LLP; Director Emeritus of the Armed Services YMCA; Member of the National Security Advisory Council of the Center for U.S. Global Engagement and a former member of the CNA Military Advisory Board; Chairman of the Board of Trustees of Fairhaven United Methodist Church; Member of the Board of Advisors of the Dolphin Scholarship Foundation; Director of other various nonprofit organizations; formerly, Director of BP, plc (November 2010-May 2019). | |
Frances L. Cashman
c/o Perkins Coie LLP
Counsel to the Independent
Trustees
1155 Avenue of the Americas
22nd Floor
New York, NY 10036
Birth Year: 1961 | | Trustee | | Since
February
2022 | | Chief Executive Officer, Asset Management Division, Delinian Ltd. (financial information) (May 2021-Present); Executive Vice President and various other roles, Legg Mason & Co. (asset management) (2010-2020); Managing Director, Stifel Nicolaus (2005-2010). | | | 87 | | | Trustee and Investment Committee Member, GeorgiaTech Foundation (since June 2019); Trustee and Chair of Marketing Committee, and Member of Investment Committee, Loyola Blakefield (Since September 2017); Trustee, MMI Gateway Foundation (since September 2017); Director and Investment Committee Member, Catholic Community Foundation Board (2012-2018); Director and Investment Committee Member, St. Ignatius Loyola Academy (2011-2017). | |
Kathleen A. Dennis
c/o Perkins Coie LLP
Counsel to the Independent
Trustees
1155 Avenue of the Americas
22nd Floor
New York, NY 10036
Birth Year: 1953 | | Trustee | | Since
August
2006 | | Chairperson of the Governance Committee (since January 2021), Chairperson of the Liquidity and Alternatives Sub-Committee of the Investment Committee (2006-2020) and Director or Trustee of various Morgan Stanley Funds (since August 2006); President, Cedarwood Associates (mutual fund and investment management consulting) (since July 2006); formerly, Senior Managing Director of Victory Capital Management (1993-2006). | | | 86 | | | Board Member, University of Albany Foundation (2012-present); Board Member, Mutual Funds Directors Forum (2014-present); Director of various non-profit organizations. | |
40
Morgan Stanley Institutional Fund Trust
Annual Report — September 30, 2023
Trustees and Officers Information (unaudited) (cont'd)
Independent Trustees: (cont'd)
Name, Address and Birth Year
of Independent Trustee | | Position(s)
Held with
Registrant | | Length of Time
Served* | | Principal Occupation(s) During Past 5 Years
and Other Relevant Professional Experience | | Number of
Funds in
Fund Complex
Overseen by
Independent
Trustee** | | Other Directorships
Held by Independent
Trustee During
Past 5 Years*** | |
Nancy C. Everett
c/o Perkins Coie LLP
Counsel to the Independent
Trustees
1155 Avenue of the Americas
22nd Floor
New York, NY 10036
Birth Year: 1955 | | Trustee | | Since
January
2015 | | Chairperson of the Equity Investment Committee (since January 2021); Director or Trustee of various Morgan Stanley Funds (since January 2015); Chief Executive Officer, Virginia Commonwealth University Investment Company (since November 2015); Owner, OBIR, LLC (institutional investment management consulting) (since June 2014); formerly, Managing Director, BlackRock, Inc. (February 2011-December 2013) and Chief Executive Officer, General Motors Asset Management (a/k/a Promark Global Advisors, Inc.) (June 2005-May 2010). | | | 87 | | | Formerly, Member of Virginia Commonwealth University School of Business Foundation (2005-2016); Member of Virginia Commonwealth University Board of Visitors (2013-2015); Member of Committee on Directors for Emerging Markets Growth Fund, Inc. (2007-2010); Chairperson of Performance Equity Management, LLC (2006-2010); and Chairperson, GMAM Absolute Return Strategies Fund, LLC (2006-2010). | |
Eddie A. Grier
c/o Perkins Coie LLP
Counsel to the Independent
Trustees
1155 Avenue of the Americas
22nd Floor
New York, NY 10036
Birth Year: 1955 | | Trustee | | Since
February
2022 | | Dean, Santa Clara University Leavey School of Business (since July 2021); Dean, Virginia Commonwealth University School of Business (2010-2021); President and various other roles, Walt Disney Company (entertainment and media) (1981-2010). | | | 87 | | | Director, Witt/Keiffer, Inc. (executive search) (since 2016); Director, NuStar GP, LLC (energy) (since August 2021); Director, Sonida Senior Living, Inc. (residential community operator) (2016-2021); Director, NVR, Inc. (homebuilding) (2013-2020); Director, Middleburg Trust Company (wealth management) (2014-2019); Director, Colonial Williamsburg Company (2012-2021); Regent, University of Massachusetts Global (since 2021); Director and Chair, ChildFund International (2012-2021); Trustee, Brandman University (2010-2021); Director, Richmond Forum (2012-2019). | |
41
Morgan Stanley Institutional Fund Trust
Annual Report — September 30, 2023
Trustees and Officers Information (unaudited) (cont'd)
Independent Trustees: (cont'd)
Name, Address and Birth Year
of Independent Trustee | | Position(s)
Held with
Registrant | | Length of Time
Served* | | Principal Occupation(s) During Past 5 Years
and Other Relevant Professional Experience | | Number of
Funds in
Fund Complex
Overseen by
Independent
Trustee** | | Other Directorships
Held by Independent
Trustee During
Past 5 Years*** | |
Jakki L. Haussler
c/o Perkins Coie LLP
Counsel to the Independent
Trustees
1155 Avenue of the Americas
22nd Floor
New York, NY 10036
Birth Year: 1957 | | Trustee | | Since
January
2015 | | Chairperson of the Audit Committee (since January 2023) and Director or Trustee of various Morgan Stanley Funds (since January 2015); Chairman, Opus Capital Group (since 1996); formerly, Chief Executive Officer, Opus Capital Group (1996-2019); Director, Capvest Venture Fund, LP (May 2000-December 2011); Partner, Adena Ventures, LP (July 1999-December 2010); Director, The Victory Funds (February 2005-July 2008). | | | 87 | | | Director, Vertiv Holdings Co. (VRT) (since August 2022); Director of Cincinnati Bell Inc. and Member, Audit Committee and Chairman, Governance and Nominating Committee (2008-2021); Director of Service Corporation International and Member, Audit Committee and Investment Committee; Director, Barnes Group Inc. (since July 2021); Director of Northern Kentucky University Foundation and Member, Investment Committee; Member of Chase College of Law Center for Law and Entrepreneurship Board of Advisors; Director of Best Transport (2005-2019); Director of Chase College of Law Board of Visitors; formerly, Member, University of Cincinnati Foundation Investment Committee. | |
Dr. Manuel H. Johnson
c/o Johnson Smick
International, Inc.
220 I Street, NE
Suite 200
Washington, D.C. 20002
Birth Year: 1949 | | Trustee | | Since
July
1991 | | Senior Partner, Johnson Smick International, Inc. (consulting firm); Chairperson of the Fixed Income, Liquidity and Alternatives Investment Committee (since January 2021), Chairperson of the Investment Committee (2006-2020) and Director or Trustee of various Morgan Stanley Funds (since July 1991); Co-Chairman and a founder of the Group of Seven Council (G7C) (international economic commission); formerly, Chairperson of the Audit Committee (July 1991-September 2006); Vice Chairman of the Board of Governors of the Federal Reserve System and Assistant Secretary of the U.S. Treasury. | | | 86 | | | Director of NVR, Inc. (home construction). | |
42
Morgan Stanley Institutional Fund Trust
Annual Report — September 30, 2023
Trustees and Officers Information (unaudited) (cont'd)
Independent Trustees: (cont'd)
Name, Address and Birth Year
of Independent Trustee | | Position(s)
Held with
Registrant | | Length of Time
Served* | | Principal Occupation(s) During Past 5 Years
and Other Relevant Professional Experience | | Number of
Funds in
Fund Complex
Overseen by
Independent
Trustee** | | Other Directorships
Held by Independent
Trustee During
Past 5 Years*** | |
Joseph K. Kearns
c/o Perkins Coie LLP
Counsel to the Independent
Trustees
1155 Avenue of the Americas
22nd Floor
New York, NY 10036
Birth Year: 1942 | | Trustee | | Since
August
1994 | | Senior Adviser, Kearns & Associates LLC (investment consulting); Chairperson of the Audit Committee (2006-2022) and Director or Trustee of various Morgan Stanley Funds (since August 1994); formerly, Deputy Chairperson of the Audit Committee (July 2003-September 2006); CFO of the J. Paul Getty Trust (1982-1999). | | | 87 | | | Director, Rubicon Investments (since February 2019); Prior to August 2016, Director of Electro Rent Corporation (equipment leasing); Prior to December 31, 2013, Director of The Ford Family Foundation. | |
Michael F. Klein
c/o Perkins Coie LLP
Counsel to the Independent
Trustees
1155 Avenue of the Americas
22nd Floor
New York, NY 10036
Birth Year: 1958 | | Trustee | | Since
August
2006 | | Chairperson of the Risk Committee (since January 2021); Managing Director, Aetos Alternatives Management, LP (since March 2000); Co-President, Aetos Alternatives Management, LP (since January 2004) and Co-Chief Executive Officer of Aetos Alternatives Management, LP (since August 2013); Chairperson of the Fixed Income Sub-Committee of the Investment Committee (2006-2020) and Director or Trustee of various Morgan Stanley Funds (since August 2006); formerly, Managing Director, Morgan Stanley & Co. Inc. and Morgan Stanley Dean Witter Investment Management and President, various Morgan Stanley Funds (June 1998-March 2000); Principal, Morgan Stanley & Co. Inc. and Morgan Stanley Dean Witter Investment Management (August 1997-December 1999). | | | 86 | | | Director of certain investment funds managed or sponsored by Aetos Alternatives Management, LP; Director of Sanitized AG and Sanitized Marketing AG (specialty chemicals). | |
Patricia A. Maleski
c/o Perkins Coie LLP
Counsel to the Independent
Trustees
1155 Avenue of the Americas
22nd Floor
New York, NY 10036
Birth Year: 1960 | | Trustee | | Since
January
2017 | | Director or Trustee of various Morgan Stanley Funds (since January 2017); Managing Director, JPMorgan Asset Management (2004-2016); Oversight and Control Head of Fiduciary and Conflicts of Interest Program (2015-2016); Chief Control Officer—Global Asset Management (2013-2015); President, JPMorgan Funds (2010-2013); Chief Administrative Officer (2004-2013); various other positions including Treasurer and Board Liaison (since 2001). | | | 87 | | | Trustee (since January 2022) and Treasurer (since January 2023), Nutley Family Service Bureau, Inc. | |
W. Allen Reed
c/o Perkins Coie LLP
Counsel to the Independent
Trustees
1155 Avenue of the Americas
22nd Floor
New York, NY 10036
Birth Year: 1947 | | Chair of the Board and Trustee | | Chair of the Board since August 2020 and Trustee since August 2006 | | Chair of the Boards of various Morgan Stanley Funds (since August 2020); Director or Trustee of various Morgan Stanley Funds (since August 2006); formerly, Vice Chair of the Boards of various Morgan Stanley Funds (January 2020-August 2020); President and Chief Executive Officer of General Motors Asset Management; Chairman and Chief Executive Officer of the GM Trust Bank and Corporate Vice President of General Motors Corporation (August 1994-December 2005). | | | 86 | | | Formerly, Director of Legg Mason, Inc. (2006-2019); and Director of the Auburn University Foundation (2010-2015). | |
* This is the earliest date the Trustee began serving the Morgan Stanley Funds. Each Trustee serves an indefinite term, until his or her successor is elected.
** The Fund Complex includes (as of December 31, 2022) all open-end and closed-end funds (including all of their portfolios) advised by Morgan Stanley Investment Management Inc. (the "Adviser") and any funds that have an adviser that is an affiliated person of the Adviser (including, but not limited to, Morgan Stanley AIP GP LP).
*** This includes any directorships at public companies and registered investment companies held by the Trustees at any time during the past five years.
43
Morgan Stanley Institutional Fund Trust
Annual Report — September 30, 2023
Trustees and Officers Information (unaudited) (cont'd)
Executive Officers:
Name, Address and Birth Year
of Executive Officer | | Position(s) Held
with
Registrant | | Length of
Time Served* | | Principal Occupation(s) During Past 5 Years | |
John H. Gernon
522 Fifth Avenue
New York, NY 10036
Birth Year: 1963 | | President and Principal Executive Officer | | Since
September
2013 | | President and Principal Executive Officer of the Equity and Fixed Income Funds and the Morgan Stanley AIP Funds (since September 2013) and the Liquidity Funds and various money market funds (since May 2014) in the Fund Complex; Managing Director of the Adviser. | |
Deidre A. Downes
1633 Broadway
New York, NY 10019
Birth Year: 1977 | | Chief Compliance Officer | | Since
November
2021 | | Executive Director of the Adviser (since January 2021) and Chief Compliance Officer of various Morgan Stanley Funds (since November 2021). Formerly, Vice President and Corporate Counsel at PGIM and Prudential Financial (October 2016-December 2020). | |
Francis J. Smith
522 Fifth Avenue
New York, NY 10036
Birth Year: 1965 | | Treasurer and Principal Financial Officer | | Treasurer since July 2003 and Principal Financial Officer since September
2002 | | Managing Director of the Adviser and various entities affiliated with the Adviser; Treasurer (since July 2003) and Principal Financial Officer of various Morgan Stanley Funds (since September 2002). | |
Mary E. Mullin
1633 Broadway
New York, NY 10019
Birth Year: 1967 | | Secretary | | Since
June
1999 | | Managing Director of the Adviser; Secretary of various Morgan Stanley Funds (since June 1999). | |
Michael J. Key
522 Fifth Avenue
New York, NY 10036
Birth Year: 1979 | | Vice President | | Since
June
2017 | | Vice President of the Equity and Fixed Income Funds, Liquidity Funds, various money market funds and the Morgan Stanley AIP Funds in the Fund Complex (since June 2017); Managing Director of the Adviser; Head of Product Development for Equity and Fixed Income Funds (since August 2013). | |
The Fund's statement of additional information includes further information about the Fund's Trustees and Officers, and is available without charge by visiting www.morganstanley.com/im or upon request by calling 1 (800) 869-6397.
* This is the earliest date the officer began serving the Morgan Stanley Funds. Each officer serves an indefinite term, until his or her successor is elected.
44
Morgan Stanley Institutional Fund Trust
Annual Report — September 30, 2023
Adviser and Administrator
Morgan Stanley Investment Management Inc.
522 Fifth Avenue
New York, New York 10036
Distributor
Morgan Stanley Distribution, Inc.
522 Fifth Avenue
New York, New York 10036
Dividend Disbursing and Transfer Agent
SS&C Global Investor & Distribution Solutions, Inc.
P.O. Box 219804
Kansas City, Missouri 64121-9804
Co-Transfer Agent
Eaton Vance Management
Two International Place
Boston, Massachusetts 02110
Custodian
State Street Bank and Trust Company
One Congress Street
Boston, Massachusetts 02114
Legal Counsel
Dechert LLP
1095 Avenue of the Americas
New York, New York 10036
Counsel to the Independent Trustees
Perkins Coie LLP
1155 Avenue of the Americas,
22nd Floor
New York, New York 10036
Independent Registered Public Accounting Firm
Ernst & Young LLP
200 Clarendon Street
Boston, Massachusetts 02116
45
(This page has been left blank intentionally.)
Printed in U.S.A.
This Report has been prepared for shareholders and may be distributed to others only if preceded or accompanied by a current prospectus.
Morgan Stanley Investment Management Inc.
522 Fifth Avenue
New York, New York 10036
© 2023 Morgan Stanley. Morgan Stanley Distribution, Inc.

IFTCBANN
6045059 EXP 11.30.24

Morgan Stanley Institutional Fund Trust
Discovery Portfolio
Annual Report
September 30, 2023

Morgan Stanley Institutional Fund Trust
Annual Report — September 30, 2023
Table of Contents (unaudited)
Shareholders' Letter | | | 2 | | |
Consolidated Expense Example | | | 3 | | |
Investment Overview | | | 4 | | |
Consolidated Portfolio of Investments | | | 7 | | |
Consolidated Statement of Assets and Liabilities | | | 9 | | |
Consolidated Statement of Operations | | | 11 | | |
Consolidated Statements of Changes in Net Assets | | | 12 | | |
Consolidated Financial Highlights | | | 14 | | |
Notes to Consolidated Financial Statements | | | 19 | | |
Report of Independent Registered Public Accounting Firm | | | 31 | | |
Investment Advisory Agreement Approval | | | 32 | | |
Liquidity Risk Management Program | | | 34 | | |
Important Notices | | | 35 | | |
U.S. Customer Privacy Notice | | | 36 | | |
Trustees and Officers Information | | | 39 | | |
This report is authorized for distribution only when preceded or accompanied by a prospectus or summary prospectus of the applicable Fund of the Morgan Stanley Institutional Fund Trust. To receive a prospectus and/or statement of additional information ("SAI"), which contains more complete information such as investment objectives, charges, expenses, policies for voting proxies, risk considerations and describes in detail each of the Fund's investment policies to the prospective investor, please call toll free 1 (800) 869-6397. Please read the prospectuses carefully before you invest or send money.
Additionally, you can access information about the Fund, including performance, characteristics and investment team commentary through Morgan Stanley Investment Management's website: www.morganstanley.com/im.
Market forecasts provided in this report may not necessarily come to pass. There is no guarantee that any sectors mentioned will continue to perform as discussed herein or that securities in such sectors will be held by the Fund in the future. There is no assurance that a fund will achieve its investment objective. Funds are subject to market risk, which is the possibility that market values of securities owned by the Fund will decline and, therefore, the value of the Fund's shares may be less than what you paid for them. Accordingly, you can lose money investing in this Fund. Please see the prospectus for more complete information on investment risks.
1
Morgan Stanley Institutional Fund Trust
Annual Report — September 30, 2023
Shareholders' Letter (unaudited)
Dear Shareholders,
We are pleased to provide this Annual Report, in which you will learn how your investment in Discovery Portfolio (the "Fund") performed during the latest twelve-month period.
Morgan Stanley Investment Management is a client-centric, investor-led organization. Our global presence, intellectual capital, and breadth of products and services enable us to partner with investors to meet the evolving challenges of today's financial markets. We aim to deliver superior investment service and to empower our clients to make the informed decisions that help them reach their investment goals.
As always, we thank you for selecting Morgan Stanley Investment Management, and look forward to working with you in the months and years ahead.
Sincerely,

John H. Gernon
President and Principal Executive Officer
October 2023
2
Morgan Stanley Institutional Fund Trust
Annual Report — September 30, 2023
Consolidated Expense Example (unaudited)
Discovery Portfolio
As a shareholder of the Fund, you may incur two types of costs: (1) transactional costs, including sales charge (loads) on purchase payments; and (2) ongoing costs, which may include advisory fees, administration fees, distribution and shareholder services fees; and other Fund expenses. This example is intended to help you understand your ongoing costs (in dollars) of investing in the Fund and to compare these costs with the ongoing costs of investing in other mutual funds.
This example is based on an investment of $1,000 invested at the beginning of the six-month period ended September 30, 2023 and held for the entire six-month period.
Actual Expenses
The table below provides information about actual account values and actual expenses. You may use the information in this table, together with the amount you invested, to estimate the expenses that you paid over the period. Simply divide your account value by $1,000 (for example, an $8,600 account value divided by $1,000 = 8.6), then multiply the result by the number in the table under the heading entitled "Actual Expenses Paid During Period" to estimate the expenses you paid on your account during this period.
Hypothetical Example for Comparison Purposes
The table below provides information about hypothetical account values and hypothetical expenses based on the Fund's actual expense ratio and an assumed rate of return of 5% per year before expenses, which is not the Fund's actual return. The hypothetical account values and expenses may not be used to estimate the actual ending account balance or expenses you paid for the period. You may use this information to compare the ongoing costs of investing in the Fund and other funds. To do so, compare this 5% hypothetical example with the 5% hypothetical examples that appear in the shareholder reports of the other funds.
Please note that the expenses shown in the table are meant to highlight your ongoing costs only and do not reflect any transactional costs, such as sales charges (loads, if applicable). Therefore, the information for each class in the table is useful in comparing ongoing costs only, and will not help you determine the relative total costs of owning different funds. In addition, if these transactional costs were included, your costs would have been higher.
| | | Beginning
Account
Value
4/1/23 | | Actual Ending
Account
Value
9/30/23 | | Hypothetical
Ending Account
Value | | Actual
Expenses
Paid
During
Period* | | Hypothetical
Expenses Paid
During Period* | | Net
Expense
Ratio
During
Period** | |
Discovery Portfolio Class I | | $ | 1,000.00 | | | $ | 1,027.40 | | | $ | 1,021.51 | | | $ | 3.61 | | | $ | 3.60 | | | | 0.71 | % | |
Discovery Portfolio Class A | | | 1,000.00 | | | | 1,025.60 | | | | 1,019.95 | | | | 5.18 | | | | 5.17 | | | | 1.02 | | |
Discovery Portfolio Class L | | | 1,000.00 | | | | 1,022.70 | | | | 1,017.30 | | | | 7.86 | | | | 7.84 | | | | 1.55 | | |
Discovery Portfolio Class C | | | 1,000.00 | | | | 1,022.70 | | | | 1,016.29 | | | | 8.87 | | | | 8.85 | | | | 1.75 | | |
Discovery Portfolio Class R6 | | | 1,000.00 | | | | 1,028.40 | | | | 1,021.86 | | | | 3.25 | | | | 3.24 | | | | 0.64 | | |
* Expenses are calculated using each Fund Class' annualized net expense ratio (as disclosed), multiplied by the average account value over the period and multiplied by 183/365 (to reflect the most recent one-half year period).
** Annualized.
3
Morgan Stanley Institutional Fund Trust
Annual Report — September 30, 2023
Investment Overview (unaudited)
Discovery Portfolio
The Fund seeks long-term capital growth.
Performance
For the fiscal year ended September 30, 2023, the Fund's Class I shares had a total return based on net asset value and reinvestment of distributions per share of 2.74%, net of fees. The Fund's Class I shares underperformed against the Fund's benchmark, the Russell Midcap® Growth Index (the "Index"), which returned 17.47%.
Factors Affecting Performance
• Recession fears, downside earnings risks for 2023 and the failure of several U.S. regional banks in March 2023 weighed on market sentiment and contributed to continued volatility in the 12-month reporting period. Against this backdrop, we continued to focus on company-specific fundamentals, which, across portfolio holdings have largely remained healthy and in line with our expectations. We continue to own many high quality companies with attractive end-game potential, strong balance sheets and multiple competitive advantages. We believe today's market offers an attractive opportunity to buy unique companies with strong fundamentals that can be long-term winners over the next three to five years. While we have opportunistically added to some positions and initiated new ones, overall, we have made few changes as we remain confident in the long-term prospects for the businesses we own.
• Counterpoint Global seeks high quality companies, which we define primarily as those with sustainable competitive advantages. We manage concentrated portfolios that are highly differentiated from the benchmark, with securities weighted on our assessment of the quality of the company and our conviction. The value added or detracted in any period of time will result from stock selection, given our philosophy and process.
• The long-term investment horizon and conviction-weighted investment approach embraced by the team since its inception in 1998 can result in periods of performance deviation from the benchmark and peers. The Fund underperformed the Index this reporting period primarily due to adverse stock selection, with sector allocations detracting to a lesser extent.
• Mid-cap growth stocks advanced 17.47% in the 12-month period, as measured by the Index. All sectors in the Index had positive performance in the period, except utilities. Industrials was the Index's best performing sector. Against this backdrop, our team continued to focus on stock selection and the long-term outlook for companies in the portfolio.
• Most of the Fund's relative underperformance was driven by mixed stock selection in health care, information technology, communication services and financials. A company that operates a database of employment and contact information to augment sales prospecting for third parties was the largest detractor across the portfolio. Concerns about slower business growth, longer sales cycles and deal delays weighed on investor sentiment during the reporting period. A holding in one of the largest buyers of biopharmaceutical royalties and a leading funder of innovation across academic institutions, non-profits, biotechnology and pharmaceutical companies was the second greatest detractor across the portfolio. The company reported solid results, but its shares remained pressured due to investors' ongoing concerns around clinical trial results for a few of its partners' new therapies and the impact to potential related royalties. A holding in a software as a service platform that allows customers to monitor their entire IT stack in real-time from a single user interface was the third greatest detractor across the Fund. Although the company reported overall healthy results characterized by product suite expansion and strong customer retention, its shares traded down as investors were disappointed by management's conservative outlook.
• Conversely, the Fund benefited from stock selection in consumer discretionary. A position in one of the world's leading platforms to enable and accelerate direct-to-consumer, cross-border ecommerce, was the top contributor in the sector and across the portfolio. Its shares advanced as the company continued to deliver strong fundamental performance characterized by revenue and profitability growth that outpaced the overall ecommerce industry, and strong traction with new partnership initiatives. Management's continued execution has also buoyed investor confidence in the company's ability to further capitalize on the secular growth in direct-to-consumer, cross-border ecommerce.
4
Morgan Stanley Institutional Fund Trust
Annual Report — September 30, 2023
Investment Overview (unaudited) (cont'd)
Discovery Portfolio
• An average overweight in health care, average underweight in materials, and lack of exposure to consumer staples and real estate were also favorable to relative performance.
Management Strategies
• Counterpoint Global looks to own a portfolio of unique companies with diverse business drivers, strong competitive advantages and positioning, and healthy secular growth prospects whose market value we believe can increase significantly over the long-term for underlying fundamental reasons, independent of the macro or market environment. We find these companies through fundamental research. Our emphasis is on secular growth, and as a result short-term market events are not as meaningful in the stock selection process.
• Counterpoint Global believes having a market outlook can be an anchor. We focus on assessing company prospects over a five-year investment horizon. Current portfolio positioning reflects what we believe are the best long-term investment opportunities.

* Minimum Investment
In accordance with SEC regulations, the Fund's performance shown assumes that all recurring fees (including management fees) were deducted and all dividends and distributions were reinvested. The performance of Class A, Class L, Class C and Class R6 shares will vary from the performance of Class I shares based upon their different inception dates and will be negatively impacted by additional fees assessed to those classes (where applicable).
5
Morgan Stanley Institutional Fund Trust
Annual Report — September 30, 2023
Investment Overview (unaudited) (cont'd)
Discovery Portfolio
Performance Compared to the Russell Midcap® Growth Index(1) and the Lipper Mid-Cap Growth Funds Index(2)
| | | Period Ended September 30, 2023
Total Returns(3) | |
| | | | | Average Annual | |
| | | One
Year | | Five
Years | | Ten
Years | | Since
Inception(9) | |
Fund — Class I Shares
w/o sales charges(4) | | | 2.74 | % | | | 1.21 | % | | | 6.28 | % | | | 11.08 | % | |
Fund — Class A Shares
w/o sales charges(5) | | | 2.44 | | | | 0.95 | | | | 5.99 | | | | 8.78 | | |
Fund — Class A Shares with
maximum 5.25% sales charges(5) | | | –2.89 | | | | –0.14 | | | | 5.42 | | | | 8.56 | | |
Fund — Class L Shares
w/o sales charges(6) | | | 1.77 | | | | 0.43 | | | | 5.42 | | | | 7.48 | | |
Fund — Class C Shares
w/o sales charges(8) | | | 1.73 | | | | 0.18 | | | | — | | | | 6.76 | | |
Fund — Class C Shares with
maximum 1.00% deferred
sales charges(8) | | | 0.73 | | | | 0.18 | | | | — | | | | 6.76 | | |
Fund — Class R6 Shares w/o
sales charges(7) | | | 2.84 | | | | 1.33 | | | | 6.39 | | | | 6.48 | | |
Russell Midcap® Growth Index | | | 17.47 | | | | 6.97 | | | | 9.94 | | | | 10.21 | | |
Lipper Mid-Cap Growth Funds Index | | | 12.61 | | | | 5.12 | | | | 8.69 | | | | 9.52 | | |
Performance data quoted represents past performance, which is no guarantee of future results, and current performance may be lower or higher than the figures shown. Performance assumes that all dividends and distributions, if any, were reinvested. For the most recent month-end performance figures, please visit www.morganstanley.com/im. Investment returns and principal value will fluctuate so that Fund shares, when redeemed, may be worth more or less than their original cost. Total returns do not reflect the deduction of taxes that a shareholder would pay on Fund distributions or the redemption of Fund shares. Performance of share classes will vary due to differences in sales charges and expenses. The Fund returns are calculated based on the net asset value as of the last business day of the period.
(1) The Russell Midcap® Growth Index measures the performance of the mid-cap growth segment of the U.S. equity universe. It includes those Russell Midcap® Index companies with higher price-to-book ratios and higher forecasted growth values. The Russell Midcap® Index is a subset of the Russell 1000® Index and includes approximately 800 of the smallest securities in the Russell 1000® Index, which in turn consists of approximately 1,000 of the largest U.S. securities based on a combination of market capitalization and current index membership. The Index is unmanaged and its returns do not include any sales charges or fees. Such costs would lower performance. It is not possible to invest directly in an index.
(2) The Lipper Mid-Cap Growth Funds Index is an equally weighted performance index of the largest qualifying funds (based on net assets) in the Lipper Mid-Cap Growth Funds classification. The index, which is adjusted for capital gains distributions and income dividends, is unmanaged and should not be considered an investment. There are currently 30 funds represented in this Index. As of the date of this report, the Fund was in the Lipper Mid-Cap Growth Funds classification.
(3) Total returns for the Fund reflect expenses waived and/or reimbursed, if applicable, by the Adviser. Without such waivers and/or reimbursements, total returns would have been lower.
(4) Commenced operations on March 30, 1990.
(5) Commenced offering on January 31, 1997.
(6) Commenced offering on June 14, 2012.
(7) Commenced offering on September 13, 2013.
(8) Commenced offering on May 31, 2017.
(9) For comparative purposes, average annual since inception returns listed for the Indexes refer to the inception date of Class I of the Fund, not the inception of the Indexes.
6
Morgan Stanley Institutional Fund Trust
Annual Report — September 30, 2023
Consolidated Portfolio of Investments
Discovery Portfolio
| | | Shares | | Value
(000) | |
Common Stocks (93.1%) | |
Biotechnology (2.2%) | |
Alnylam Pharmaceuticals, Inc. (a) | | | 4,973 | | | $ | 881 | | |
Intellia Therapeutics, Inc. (a) | | | 109,666 | | | | 3,468 | | |
ProKidney Corp. (a)(b) | | | 509,412 | | | | 2,333 | | |
Roivant Sciences Ltd. (a) | | | 1,089,327 | | | | 12,723 | | |
| | | | 19,405 | | |
Broadline Retail (7.2%) | |
Global-e Online Ltd. (Israel) (a) | | | 1,635,663 | | | | 65,001 | | |
Chemicals (0.4%) | |
Ginkgo Bioworks Holdings, Inc. (a)(b) | | | 2,103,065 | | | | 3,806 | | |
Entertainment (4.6%) | |
ROBLOX Corp., Class A (a) | | | 1,433,611 | | | | 41,517 | | |
Financial Services (12.1%) | |
Adyen NV (Netherlands) (a) | | | 31,180 | | | | 23,118 | | |
Affirm Holdings, Inc. (a)(b) | | | 3,088,146 | | | | 65,685 | | |
Toast, Inc., Class A (a) | | | 1,122,871 | | | | 21,031 | | |
| | | | 109,834 | | |
Ground Transportation (2.1%) | |
Grab Holdings Ltd., Class A (Singapore) (a) | | | 5,301,078 | | | | 18,766 | | |
Health Care Equipment & Supplies (0.8%) | |
Dexcom, Inc. (a) | | | 50,618 | | | | 4,723 | | |
Penumbra, Inc. N (a) | | | 10,239 | | | | 2,477 | | |
| | | | 7,200 | | |
Health Care Providers & Services (5.2%) | |
Agilon health, Inc. (a) | | | 2,653,510 | | | | 47,126 | | |
Health Care Technology (1.4%) | |
Doximity, Inc., Class A (a) | | | 593,353 | | | | 12,591 | | |
Hotels, Restaurants & Leisure (6.4%) | |
DoorDash, Inc., Class A (a) | | | 733,436 | | | | 58,286 | | |
Information Technology Services (10.6%) | |
Cloudflare, Inc., Class A (a) | | | 1,162,522 | | | | 73,286 | | |
MongoDB, Inc. (a) | | | 66,299 | | | | 22,930 | | |
| | | | 96,216 | | |
Interactive Media & Services (0.1%) | |
Snap, Inc., Class A (a) | | | 104,959 | | | | 935 | | |
Leisure Products (1.6%) | |
Peloton Interactive, Inc., Class A (a) | | | 2,833,622 | | | | 14,310 | | |
Life Sciences Tools & Services (1.3%) | |
10X Genomics, Inc., Class A (a) | | | 291,700 | | | | 12,033 | | |
Media (7.4%) | |
Trade Desk, Inc., Class A (a) | | | 853,294 | | | | 66,685 | | |
Pharmaceuticals (4.6%) | |
Royalty Pharma PLC, Class A (United Kingdom) | | | 1,542,355 | | | | 41,859 | | |
Semiconductors & Semiconductor Equipment (0.1%) | |
Enphase Energy, Inc. (a) | | | 7,615 | | | | 915 | | |
| | | Shares | | Value
(000) | |
Software (18.2%) | |
Aurora Innovation, Inc. (a) | | | 5,046,291 | | | $ | 11,859 | | |
Bill Holdings, Inc. (a) | | | 425,078 | | | | 46,151 | | |
Gitlab, Inc., Class A (a) | | | 468,561 | | | | 21,188 | | |
HubSpot, Inc. (a) | | | 18,794 | | | | 9,256 | | |
Klaviyo, Inc., Class A (a)(b) | | | 146,668 | | | | 5,060 | | |
MicroStrategy, Inc., Class A (a) | | | 21,755 | | | | 7,142 | | |
Procore Technologies, Inc. (a) | | | 397,295 | | | | 25,951 | | |
Samsara, Inc., Class A (a) | | | 1,481,885 | | | | 37,358 | | |
Unity Software, Inc. (a) | | | 29,003 | | | | 911 | | |
| | | | 164,876 | | |
Specialty Retail (6.8%) | |
Carvana Co. (a)(b) | | | 944,618 | | | | 39,655 | | |
Wayfair, Inc., Class A (a) | | | 365,844 | | | | 22,159 | | |
| | | | 61,814 | | |
Total Common Stocks (Cost $1,141,886) | | | 843,175 | | |
Preferred Stock (3.5%) | |
Software (3.5%) | |
Databricks, Inc., Series H (a)(c)(d) (acquisition
cost — $31,810; acquired 8/31/21) | | | 432,882 | | | | 31,817 | | |
Investment Company (1.7%) | |
| Grayscale Bitcoin Trust (a) (Cost $27,140) | | | 785,961 | | | | 15,083 | | |
| | | No. of
Warrants | | | |
Warrants (0.0%)‡ | |
Chemicals (0.0%)‡ | |
Ginkgo Bioworks Holdings, Inc. expires
12/31/27 (a) (Cost $655) | | | 196,782 | | | | 44 | | |
| | | Shares | | | |
Short-Term Investments (3.0%) | |
Investment Company (2.1%) | |
Morgan Stanley Institutional Liquidity
Funds — Treasury Securities Portfolio —
Institutional Class (See Note G)
(Cost $18,649) | | | 18,649,466 | | | | 18,649 | | |
Securities held as Collateral on Loaned Securities (0.9%) | |
Investment Company (0.8%) | |
Morgan Stanley Institutional Liquidity
Funds — Treasury Securities Portfolio —
Institutional Class (See Note G) | | | 7,037,983 | | | | 7,038 | | |
| | | Face
Amount
(000) | | | |
Repurchase Agreements (0.1%) | |
Citigroup, Inc., (5.25%, dated 9/29/23,
due 10/2/23; proceeds $487; fully
collateralized by U.S. Government
obligations; 0.13% — 2.88%
due 10/31/23 — 5/15/52; valued
at $496) | | $ | 487 | | | | 487 | | |
The accompanying notes are an integral part of the consolidated financial statements.
7
Morgan Stanley Institutional Fund Trust
Annual Report — September 30, 2023
Consolidated Portfolio of Investments (cont'd)
Discovery Portfolio
| | | Face
Amount
(000) | | Value
(000) | |
Merrill Lynch & Co., Inc., (5.29%, dated
9/29/23, due 10/2/23; proceeds $1,067;
fully collateralized by a U.S. Government
obligation; 2.75% due 5/31/29; valued
at $1,088) | | $ | 1,066 | | | $ | 1,066 | | |
| | | | 1,553 | | |
Total Securities held as Collateral on Loaned
Securities (Cost $8,591) | | | 8,591 | | |
Total Short-Term Investments (Cost $27,240) | | | 27,240 | | |
Total Investments Excluding Purchased
Options (101.3%) (Cost $1,228,731) | | | | | 917,359 | | |
Total Purchased Options Outstanding (0.3%)
(Cost $2,919) | | | 3,037 | | |
Total Investments (101.6%) (Cost $1,231,650)
Including $8,319 of Securities Loaned (e)(f)(g) | | | 920,396 | | |
Liabilities in Excess of Other Assets (–1.6%) | | | (14,693 | ) | |
Net Assets (100.0%) | | $ | 905,703 | | |
‡ Amount is less than 0.05%.
(a) Non-income producing security.
(b) All or a portion of this security was on loan at September 30, 2023.
(c) Security cannot be offered for public resale without first being registered under the Securities Act of 1933 and related rules
("restricted security"). Acquisition date represents the day on which an enforceable right to acquire such security is obtained and is presented along with related cost in the security description. The Trust has registration rights for certain restricted securities. Any costs related to such registration are borne by the issuer. The aggregate value of restricted securities (excluding 144A holdings) at September 30, 2023 amounts to approximately $31,817,000 and represents 3.5% of net assets.
(d) At September 30, 2023, the Fund held a fair valued security at approximately $31,817,000, representing 3.5% of net assets. This security has been fair valued as determined in good faith under procedures established by and under the general supervision of the Trust's (as defined herein) Trustees.
(e) Securities are available for collateral in connection with purchased options.
(f) The approximate fair value and percentage of net assets, $23,118,000 and 2.6%, respectively, represent the securities that have been fair valued under the fair valuation policy for international investments as described in Note A-1 within the Notes to Consolidated Financial Statements.
(g) At September 30, 2023, the aggregate cost for federal income tax purposes is approximately $1,334,025,000. The aggregate gross unrealized appreciation is approximately $100,733,000 and the aggregate gross unrealized depreciation is approximately $514,354,000, resulting in net unrealized depreciation of approximately $413,621,000.
Call Options Purchased:
The Fund had the following call options purchased open at September 30, 2023:
Counterparty | | Description | | Strike
Price | | Expiration
Date | | Number of
Contracts | | Notional
Amount
(000) | | Value
(000) | | Premiums
Paid
(000) | | Unrealized
Appreciation
(Depreciation)
(000) | |
Goldman Sachs International | | USD/CNH | | CNH | 7.87 | | | Oct-23 | | | 2,378,602 | | | $ | 2,379 | | | $ | — | @ | | $ | 11 | | | $ | (11 | ) | |
JPMorgan Chase Bank NA | | USD/CNH | | CNH | 7.43 | | | Jan-24 | | | 202,038,446 | | | | 202,038 | | | | 923 | | | | 951 | | | | (28 | ) | |
Standard Chartered Bank | | USD/CNH | | CNH | 7.57 | | | May-24 | | | 226,694,072 | | | | 226,694 | | | | 1,174 | | | | 959 | | | | 215 | | |
JPMorgan Chase Bank NA | | USD/CNH | | CNH | 7.79 | | | Aug-24 | | | 240,890,554 | | | | 240,891 | | | | 940 | | | | 998 | | | | (58 | ) | |
| | | | | | | | | | | | | $ | 3,037 | | | $ | 2,919 | | | $ | 118 | | |
@ Amount is less than $500.
CNH — Chinese Yuan Renminbi Offshore
USD — United States Dollar
Portfolio Composition*
Classification | | Percentage of
Total Investments | |
Other** | | | 23.8 | % | |
Software | | | 21.4 | | |
Financial Services | | | 11.9 | | |
Information Technology Services | | | 10.5 | | |
Media | | | 7.2 | | |
Broadline Retail | | | 7.1 | | |
Specialty Retail | | | 6.7 | | |
Hotels, Restaurants & Leisure | | | 6.3 | | |
Health Care Providers & Services | | | 5.1 | | |
Total Investments | | | 100.0 | % | |
* Percentages indicated are based upon total investments (excluding Securities held as Collateral on Loaned Securities) as of September 30, 2023
** Industries and/or investment types representing less than 5% of total investments.
The accompanying notes are an integral part of the consolidated financial statements.
8
Morgan Stanley Institutional Fund Trust
Annual Report — September 30, 2023
Consolidated Statement of Assets and Liabilities | | September 30, 2023
(000) | |
Assets: | |
Investments in Securities of Unaffiliated Issuers, at Value(1) (Cost $1,205,963) | | $ | 894,709 | | |
Investment in Security of Affiliated Issuer, at Value (Cost $25,687) | | | 25,687 | | |
Total Investments in Securities, at Value (Cost $1,231,650) | | | 920,396 | | |
Foreign Currency, at Value (Cost $2) | | | 2 | | |
Receivable for Investments Sold | | | 2,761 | | |
Receivable for Fund Shares Sold | | | 198 | | |
Receivable from Affiliate | | | 80 | | |
Receivable from Securities Lending Income | | | 18 | | |
Other Assets | | | 201 | | |
Total Assets | | | 923,656 | | |
Liabilities: | |
Collateral on Securities Loaned, at Value | | | 8,591 | | |
Payable for Investments Purchased | | | 3,428 | | |
Due to Broker | | | 3,263 | | |
Payable for Advisory Fees | | | 1,238 | | |
Payable for Fund Shares Redeemed | | | 816 | | |
Payable for Sub Transfer Agency Fees — Class I | | | 63 | | |
Payable for Sub Transfer Agency Fees — Class A | | | 76 | | |
Payable for Sub Transfer Agency Fees — Class L | | | 1 | | |
Payable for Sub Transfer Agency Fees — Class C | | | 4 | | |
Payable for Shareholder Services Fees — Class A | | | 90 | | |
Payable for Distribution and Shareholder Services Fees — Class L | | | 3 | | |
Payable for Distribution and Shareholder Services Fees — Class C | | | 12 | | |
Payable for Professional Fees | | | 70 | | |
Payable for Administration Fees | | | 62 | | |
Payable for Trustees' Fees and Expenses | | | 37 | | |
Payable for Transfer Agency Fees — Class I | | | 10 | | |
Payable for Transfer Agency Fees — Class A | | | 14 | | |
Payable for Transfer Agency Fees — Class L | | | 1 | | |
Payable for Transfer Agency Fees — Class C | | | 1 | | |
Payable for Transfer Agency Fees — Class R6 | | | 2 | | |
Payable for Custodian Fees | | | 11 | | |
Other Liabilities | | | 160 | | |
Total Liabilities | | | 17,953 | | |
Net Assets | | $ | 905,703 | | |
Net Assets Consist of: | |
Paid-in-Capital | | $ | 2,761,059 | | |
Total Accumulated Loss | | | (1,855,356 | ) | |
Net Assets | | $ | 905,703 | | |
The accompanying notes are an integral part of the consolidated financial statements.
9
Morgan Stanley Institutional Fund Trust
Annual Report — September 30, 2023
Consolidated Statement of Assets and Liabilities (cont'd) | | September 30, 2023
(000) | |
CLASS I: | |
Net Assets | | $ | 294,703 | | |
| Shares Outstanding (unlimited number of shares authorized, no par value) (not in 000's) | | | 23,780,124 | | |
Net Asset Value, Offering and Redemption Price Per Share | | $ | 12.39 | | |
CLASS A: | |
Net Assets | | $ | 422,575 | | |
| Shares Outstanding (unlimited number of shares authorized, no par value) (not in 000's) | | | 50,243,969 | | |
Net Asset Value, Redemption Price Per Share | | $ | 8.41 | | |
Maximum Sales Load | | | 5.25 | % | |
Maximum Sales Charge | | $ | 0.47 | | |
Maximum Offering Price Per Share | | $ | 8.88 | | |
CLASS L: | |
Net Assets | | $ | 4,197 | | |
| Shares Outstanding (unlimited number of shares authorized, no par value) (not in 000's) | | | 664,760 | | |
Net Asset Value, Offering and Redemption Price Per Share | | $ | 6.31 | | |
CLASS C: | |
Net Assets | | $ | 13,434 | | |
| Shares Outstanding (unlimited number of shares authorized, no par value) (not in 000's) | | | 1,756,731 | | |
Net Asset Value, Offering and Redemption Price Per Share | | $ | 7.65 | | |
CLASS R6: | |
Net Assets | | $ | 170,794 | | |
| Shares Outstanding (unlimited number of shares authorized, no par value) (not in 000's) | | | 13,461,197 | | |
Net Asset Value, Offering and Redemption Price Per Share | | $ | 12.69 | | |
(1) Including:
Securities on Loan, at Value: | | $ | 8,319 | | |
The accompanying notes are an integral part of the consolidated financial statements.
10
Morgan Stanley Institutional Fund Trust
Annual Report — September 30, 2023
Consolidated Statement of Operations | | Year Ended
September 30, 2023
(000) | |
Investment Income: | |
Income from Securities Loaned — Net | | $ | 2,522 | | |
Dividends from Securities of Unaffiliated Issuers | | | 1,132 | | |
Dividends from Security of Affiliated Issuer (Note G) | | | 965 | | |
Total Investment Income | | | 4,619 | | |
Expenses: | |
Advisory Fees (Note B) | | | 5,086 | | |
Shareholder Services Fees — Class A (Note D) | | | 1,171 | | |
Distribution and Shareholder Services Fees — Class L (Note D) | | | 33 | | |
Distribution and Shareholder Services Fees — Class C (Note D) | | | 144 | | |
Sub Transfer Agency Fees — Class I | | | 289 | | |
Sub Transfer Agency Fees — Class A | | | 511 | | |
Sub Transfer Agency Fees — Class L | | | 2 | | |
Sub Transfer Agency Fees — Class C | | | 18 | | |
Administration Fees (Note C) | | | 814 | | |
Registration Fees | | | 233 | | |
Professional Fees | | | 189 | | |
Transfer Agency Fees — Class I (Note E) | | | 57 | | |
Transfer Agency Fees — Class A (Note E) | | | 67 | | |
Transfer Agency Fees — Class L (Note E) | | | 5 | | |
Transfer Agency Fees — Class C (Note E) | | | 4 | | |
Transfer Agency Fees — Class R6 (Note E) | | | 5 | | |
Shareholder Reporting Fees | | | 101 | | |
Custodian Fees (Note F) | | | 40 | | |
Trustees' Fees and Expenses | | | 24 | | |
Pricing Fees | | | 2 | | |
Other Expenses | | | 56 | | |
Total Expenses | | | 8,851 | | |
Rebate from Morgan Stanley Affiliate (Note G) | | | (44 | ) | |
Net Expenses | | | 8,807 | | |
Net Investment Loss | | | (4,188 | ) | |
Realized Gain (Loss): | |
Investments Sold | | | (414,552 | ) | |
Foreign Currency Translation | | | 55 | | |
Net Realized Loss | | | (414,497 | ) | |
Change in Unrealized Appreciation (Depreciation): | |
Investments | | | 425,599 | | |
Foreign Currency Translation | | | — | @ | |
Net Change in Unrealized Appreciation (Depreciation) | | | 425,599 | | |
Net Realized Loss and Change in Unrealized Appreciation (Depreciation) | | | 11,102 | | |
Net Increase in Net Assets Resulting from Operations | | $ | 6,914 | | |
@ Amount is less than $500.
The accompanying notes are an integral part of the consolidated financial statements.
11
Morgan Stanley Institutional Fund Trust
Annual Report — September 30, 2023
Consolidated Statements of Changes in Net Assets | | Year Ended
September 30, 2023
(000) | | Year Ended
September 30, 2022
(000) | |
Increase (Decrease) in Net Assets: | |
Operations: | |
Net Investment Loss | | $ | (4,188 | ) | | $ | (16,791 | ) | |
Net Realized Loss | | | (414,497 | ) | | | (1,135,087 | ) | |
Net Change in Unrealized Appreciation (Depreciation) | | | 425,599 | | | | (1,012,312 | ) | |
Net Increase (Decrease) in Net Assets Resulting from Operations | | | 6,914 | | | | (2,164,190 | ) | |
Dividends and Distributions to Shareholders: | |
Class I | | | — | | | | (386,320 | ) | |
Class A | | | — | | | | (575,714 | ) | |
Class L | | | — | | | | (5,061 | ) | |
Class C | | | — | | | | (19,087 | ) | |
Class R6* | | | — | | | | (129,368 | ) | |
Total Dividends and Distributions to Shareholders | | | — | | | | (1,115,550 | ) | |
Capital Share Transactions:(1) | |
Class I: | |
Subscribed | | | 152,228 | | | | 400,574 | | |
Distributions Reinvested | | | — | | | | 377,934 | | |
Redeemed | | | (265,963 | ) | | | (865,913 | ) | |
Class A: | |
Subscribed | | | 49,603 | | | | 203,921 | | |
Distributions Reinvested | | | — | | | | 568,915 | | |
Redeemed | | | (163,974 | ) | | | (639,762 | ) | |
Class L: | |
Exchanged | | | 169 | | | | 59 | | |
Distributions Reinvested | | | — | | | | 4,989 | | |
Redeemed | | | (745 | ) | | | (1,076 | ) | |
Class C: | |
Subscribed | | | 1,835 | | | | 5,755 | | |
Distributions Reinvested | | | — | | | | 17,813 | | |
Redeemed | | | (3,933 | ) | | | (18,434 | ) | |
Class R6:* | |
Subscribed | | | 43,751 | | | | 126,508 | | |
Distributions Reinvested | | | — | | | | 117,594 | | |
Redeemed | | | (73,023 | ) | | | (145,532 | ) | |
Net Increase (Decrease) in Net Assets Resulting from Capital Share Transactions | | | (260,052 | ) | | | 153,345 | | |
Total Decrease in Net Assets | | | (253,138 | ) | | | (3,126,395 | ) | |
Net Assets: | |
Beginning of Period | | | 1,158,841 | | | | 4,285,236 | | |
End of Period | | $ | 905,703 | | | $ | 1,158,841 | | |
The accompanying notes are an integral part of the consolidated financial statements.
12
Morgan Stanley Institutional Fund Trust
Annual Report — September 30, 2023
Consolidated Statements of Changes in Net Assets (cont'd) | | Year Ended
September 30, 2023
(000) | | Year Ended
September 30, 2022
(000) | |
(1) Capital Share Transactions: | |
Class I: | |
Shares Subscribed | | | 12,843 | | | | 19,793 | | |
Shares Issued on Distributions Reinvested | | | — | | | | 13,059 | | |
Shares Redeemed | | | (23,578 | ) | | | (39,274 | ) | |
Net Decrease in Class I Shares Outstanding | | | (10,735 | ) | | | (6,422 | ) | |
Class A: | |
Shares Subscribed | | | 6,070 | | | | 12,433 | | |
Shares Issued on Distributions Reinvested | | | — | | | | 28,820 | | |
Shares Redeemed | | | (20,113 | ) | | | (37,499 | ) | |
Net Increase (Decrease) in Class A Shares Outstanding | | | (14,043 | ) | | | 3,754 | | |
Class L: | |
Shares Exchanged | | | 27 | | | | 5 | | |
Shares Issued on Distributions Reinvested | | | — | | | | 333 | | |
Shares Redeemed | | | (122 | ) | | | (88 | ) | |
Net Increase (Decrease) in Class L Shares Outstanding | | | (95 | ) | | | 250 | | |
Class C: | |
Shares Subscribed | | | 250 | | | | 362 | | |
Shares Issued on Distributions Reinvested | | | — | | | | 979 | | |
Shares Redeemed | | | (536 | ) | | | (1,263 | ) | |
Net Increase (Decrease) in Class C Shares Outstanding | | | (286 | ) | | | 78 | | |
Class R6:* | |
Shares Subscribed | | | 3,573 | | | | 5,864 | | |
Shares Issued on Distributions Reinvested | | | — | | | | 3,977 | | |
Shares Redeemed | | | (5,902 | ) | | | (6,884 | ) | |
Net Increase (Decrease) in Class R6 Shares Outstanding | | | (2,329 | ) | | | 2,957 | | |
* Effective April 29, 2022, Class IS shares were renamed Class R6 shares.
The accompanying notes are an integral part of the consolidated financial statements.
13
Morgan Stanley Institutional Fund Trust
Annual Report — September 30, 2023
Consolidated Financial Highlights
Discovery Portfolio
| | | Class I | |
| | | Year Ended September 30, | |
Selected Per Share Data and Ratios | | 2023 | | 2022 | | 2021 | | 2020(1) | | 2019(1) | |
Net Asset Value, Beginning of Period | | $ | 12.06 | | | $ | 42.00 | | | $ | 38.19 | | | $ | 19.92 | | | $ | 23.30 | | |
Income (Loss) from Investment Operations: | |
Net Investment Loss(2) | | | (0.03 | ) | | | (0.14 | ) | | | (0.24 | ) | | | (0.15 | ) | | | (0.05 | ) | |
Net Realized and Unrealized Gain (Loss) | | | 0.36 | | | | (19.69 | ) | | | 7.35 | | | | 20.73 | | | | 0.35 | | |
Total from Investment Operations | | | 0.33 | | | | (19.83 | ) | | | 7.11 | | | | 20.58 | | | | 0.30 | | |
Distributions from and/or in Excess of: | |
Net Realized Gain | | | — | | | | (10.11 | ) | | | (3.30 | ) | | | (2.31 | ) | | | (3.68 | ) | |
Net Asset Value, End of Period | | $ | 12.39 | | | $ | 12.06 | | | $ | 42.00 | | | $ | 38.19 | | | $ | 19.92 | | |
Total Return(3) | | | 2.74 | % | | | (61.26 | )% | | | 18.36 | % | | | 115.34 | % | | | 4.71 | % | |
Ratios to Average Net Assets and Supplemental Data: | |
Net Assets, End of Period (Thousands) | | $ | 294,703 | | | $ | 416,283 | | | $ | 1,719,520 | | | $ | 1,282,828 | | | $ | 374,736 | | |
Ratio of Expenses Before Expense Limitation | | | 0.74 | % | | | 0.77 | % | | | N/A | | | | 0.74 | % | | | 0.74 | % | |
Ratio of Expenses After Expense Limitation | | | 0.74 | %(4) | | | 0.77 | %(4) | | | 0.72 | %(4) | | | 0.73 | %(4) | | | 0.73 | %(4) | |
Ratio of Expenses After Expense Limitation Excluding Interest Expenses | | | N/A | | | | N/A | | | | 0.72 | %(4) | | | 0.73 | %(4) | | | 0.73 | %(4) | |
Ratio of Net Investment Loss | | | (0.28 | )%(4) | | | (0.58 | )%(4) | | | (0.54 | )%(4) | | | (0.57 | )%(4) | | | (0.27 | )%(4) | |
Ratio of Rebate from Morgan Stanley Affiliates | | | 0.00 | %(5) | | | 0.00 | %(5) | | | 0.00 | %(5) | | | 0.01 | % | | | 0.01 | % | |
Portfolio Turnover Rate | | | 51 | % | | | 67 | % | | | 115 | % | | | 65 | % | | | 116 | % | |
(1) Not consolidated.
(2) Per share amount is based on average shares outstanding.
(3) Calculated based on the net asset value as of the last business day of the period.
(4) The Ratio of Expenses After Expense Limitation and Ratio of Net Investment Loss reflect the rebate of certain Fund expenses in connection with the investments in Morgan Stanley affiliates during the period. The effect of the rebate on the ratios is disclosed in the above table as "Ratio of Rebate from Morgan Stanley Affiliates."
(5) Amount is less than 0.005%.
The accompanying notes are an integral part of the consolidated financial statements.
14
Morgan Stanley Institutional Fund Trust
Annual Report — September 30, 2023
Consolidated Financial Highlights
Discovery Portfolio
| | | Class A | |
| | | Year Ended September 30, | |
Selected Per Share Data and Ratios | | 2023 | | 2022 | | 2021 | | 2020(1) | | 2019(1) | |
Net Asset Value, Beginning of Period | | $ | 8.21 | | | $ | 32.12 | | | $ | 29.92 | | | $ | 16.12 | | | $ | 19.71 | | |
Income (Loss) from Investment Operations: | |
Net Investment Loss(2) | | | (0.05 | ) | | | (0.14 | ) | | | (0.27 | ) | | | (0.17 | ) | | | (0.09 | ) | |
Net Realized and Unrealized Gain (Loss) | | | 0.25 | | | | (13.66 | ) | | | 5.77 | | | | 16.28 | | | | 0.18 | | |
Total from Investment Operations | | | 0.20 | | | | (13.80 | ) | | | 5.50 | | | | 16.11 | | | | 0.09 | | |
Distributions from and/or in Excess of: | |
Net Realized Gain | | | — | | | | (10.11 | ) | | | (3.30 | ) | | | (2.31 | ) | | | (3.68 | ) | |
Net Asset Value, End of Period | | $ | 8.41 | | | $ | 8.21 | | | $ | 32.12 | | | $ | 29.92 | | | $ | 16.12 | | |
Total Return(3) | | | 2.44 | % | | | (61.35 | )% | | | 18.02 | % | | | 114.87 | % | | | 4.40 | % | |
Ratios to Average Net Assets and Supplemental Data: | |
Net Assets, End of Period (Thousands) | | $ | 422,575 | | | $ | 527,685 | | | $ | 1,944,335 | | | $ | 1,403,660 | | | $ | 403,285 | | |
Ratio of Expenses Before Expense Limitation | | | 1.02 | % | | | 1.03 | % | | | N/A | | | | 1.01 | % | | | 1.00 | % | |
Ratio of Expenses After Expense Limitation | | | 1.01 | %(4) | | | 1.03 | %(4) | | | 1.00 | %(4) | | | 1.00 | %(4) | | | 0.99 | %(4) | |
Ratio of Expenses After Expense Limitation Excluding Interest Expenses | | | N/A | | | | N/A | | | | 1.00 | %(4) | | | 1.00 | %(4) | | | 0.99 | %(4) | |
Ratio of Net Investment Loss | | | (0.56 | )%(4) | | | (0.85 | )%(4) | | | (0.81 | )%(4) | | | (0.82 | )%(4) | | | (0.52 | )%(4) | |
Ratio of Rebate from Morgan Stanley Affiliates | | | 0.00 | %(5) | | | 0.00 | %(5) | | | 0.00 | %(5) | | | 0.01 | % | | | 0.01 | % | |
Portfolio Turnover Rate | | | 51 | % | | | 67 | % | | | 115 | % | | | 65 | % | | | 116 | % | |
(1) Not consolidated.
(2) Per share amount is based on average shares outstanding.
(3) Calculated based on the net asset value which does not reflect sales charges, if applicable, as of the last business day of the period.
(4) The Ratio of Expenses After Expense Limitation and Ratio of Net Investment Loss reflect the rebate of certain Fund expenses in connection with the investments in Morgan Stanley affiliates during the period. The effect of the rebate on the ratios is disclosed in the above table as "Ratio of Rebate from Morgan Stanley Affiliates."
(5) Amount is less than 0.005%.
The accompanying notes are an integral part of the consolidated financial statements.
15
Morgan Stanley Institutional Fund Trust
Annual Report — September 30, 2023
Consolidated Financial Highlights
Discovery Portfolio
| | | Class L | |
| | | Year Ended September 30, | |
Selected Per Share Data and Ratios | | 2023 | | 2022 | | 2021 | | 2020(1) | | 2019(1) | |
Net Asset Value, Beginning of Period | | $ | 6.20 | | | $ | 27.00 | | | $ | 25.69 | | | $ | 14.21 | | | $ | 17.96 | | |
Income (Loss) from Investment Operations: | |
Net Investment Loss(2) | | | (0.07 | ) | | | (0.16 | ) | | | (0.36 | ) | | | (0.21 | ) | | | (0.15 | ) | |
Net Realized and Unrealized Gain (Loss) | | | 0.18 | | | | (10.53 | ) | | | 4.97 | | | | 14.00 | | | | 0.08 | | |
Total from Investment Operations | | | 0.11 | | | | (10.69 | ) | | | 4.61 | | | | 13.79 | | | | (0.07 | ) | |
Distributions from and/or in Excess of: | |
Net Realized Gain | | | — | | | | (10.11 | ) | | | (3.30 | ) | | | (2.31 | ) | | | (3.68 | ) | |
Net Asset Value, End of Period | | $ | 6.31 | | | $ | 6.20 | | | $ | 27.00 | | | $ | 25.69 | | | $ | 14.21 | | |
Total Return(3) | | | 1.77 | % | | | (61.52 | )% | | | 17.48 | % | | | 113.70 | % | | | 3.90 | % | |
Ratios to Average Net Assets and Supplemental Data: | |
Net Assets, End of Period (Thousands) | | $ | 4,197 | | | $ | 4,704 | | | $ | 13,762 | | | $ | 14,173 | | | $ | 8,124 | | |
Ratio of Expenses Before Expense Limitation | | | 1.56 | % | | | 1.51 | % | | | N/A | | | | 1.50 | % | | | 1.51 | % | |
Ratio of Expenses After Expense Limitation | | | 1.55 | %(4) | | | 1.51 | %(4) | | | 1.44 | %(4) | | | 1.49 | %(4) | | | 1.50 | %(4) | |
Ratio of Expenses After Expense Limitation Excluding Interest Expenses | | | N/A | | | | N/A | | | | 1.44 | %(4) | | | 1.49 | %(4) | | | 1.50 | %(4) | |
Ratio of Net Investment Loss | | | (1.10 | )%(4) | | | (1.33 | )%(4) | | | (1.26 | )%(4) | | | (1.27 | )%(4) | | | (1.06 | )%(4) | |
Ratio of Rebate from Morgan Stanley Affiliates | | | 0.00 | %(5) | | | 0.00 | %(5) | | | 0.00 | %(5) | | | 0.01 | % | | | 0.01 | % | |
Portfolio Turnover Rate | | | 51 | % | | | 67 | % | | | 115 | % | | | 65 | % | | | 116 | % | |
(1) Not consolidated.
(2) Per share amount is based on average shares outstanding.
(3) Calculated based on the net asset value as of the last business day of the period.
(4) The Ratio of Expenses After Expense Limitation and Ratio of Net Investment Loss reflect the rebate of certain Fund expenses in connection with the investments in Morgan Stanley affiliates during the period. The effect of the rebate on the ratios is disclosed in the above table as "Ratio of Rebate from Morgan Stanley Affiliates."
(5) Amount is less than 0.005%.
The accompanying notes are an integral part of the consolidated financial statements.
16
Morgan Stanley Institutional Fund Trust
Annual Report — September 30, 2023
Consolidated Financial Highlights
Discovery Portfolio
| | | Class C | |
| | | Year Ended September 30, | |
Selected Per Share Data and Ratios | | 2023 | | 2022 | | 2021 | | 2020(1) | | 2019(1) | |
Net Asset Value, Beginning of Period | | $ | 7.52 | | | $ | 30.51 | | | $ | 28.74 | | | $ | 15.67 | | | $ | 19.42 | | |
Income (Loss) from Investment Operations: | |
Net Investment Loss(2) | | | (0.10 | ) | | | (0.24 | ) | | | (0.49 | ) | | | (0.32 | ) | | | (0.22 | ) | |
Net Realized and Unrealized Gain (Loss) | | | 0.23 | | | | (12.64 | ) | | | 5.56 | | | | 15.70 | | | | 0.15 | | |
Total from Investment Operations | | | 0.13 | | | | (12.88 | ) | | | 5.07 | | | | 15.38 | | | | (0.07 | ) | |
Distributions from and/or in Excess of: | |
Net Realized Gain | | | — | | | | (10.11 | ) | | | (3.30 | ) | | | (2.31 | ) | | | (3.68 | ) | |
Net Asset Value, End of Period | | $ | 7.65 | | | $ | 7.52 | | | $ | 30.51 | | | $ | 28.74 | | | $ | 15.67 | | |
Total Return(3) | | | 1.73 | % | | | (61.66 | )% | | | 17.21 | % | | | 113.21 | % | | | 3.55 | % | |
Ratios to Average Net Assets and Supplemental Data: | |
Net Assets, End of Period (Thousands) | | $ | 13,434 | | | $ | 15,363 | | | $ | 59,936 | | | $ | 33,781 | | | $ | 6,518 | | |
Ratio of Expenses Before Expense Limitation | | | 1.80 | % | | | 1.77 | % | | | N/A | | | | 1.75 | % | | | 1.84 | % | |
Ratio of Expenses After Expense Limitation | | | 1.79 | %(4) | | | 1.77 | %(4) | | | 1.71 | %(4) | | | 1.74 | %(4) | | | 1.83 | %(4) | |
Ratio of Expenses After Expense Limitation Excluding Interest Expenses | | | N/A | | | | N/A | | | | 1.71 | %(4) | | | 1.74 | %(4) | | | 1.83 | %(4) | |
Ratio of Net Investment Loss | | | (1.34 | )%(4) | | | (1.59 | )%(4) | | | (1.52 | )%(4) | | | (1.59 | )%(4) | | | (1.32 | )%(4) | |
Ratio of Rebate from Morgan Stanley Affiliates | | | 0.00 | %(5) | | | 0.00 | %(5) | | | 0.00 | %(5) | | | 0.01 | % | | | 0.01 | % | |
Portfolio Turnover Rate | | | 51 | % | | | 67 | % | | | 115 | % | | | 65 | % | | | 116 | % | |
(1) Not consolidated.
(2) Per share amount is based on average shares outstanding.
(3) Calculated based on the net asset value which does not reflect sales charges, if applicable, as of the last business day of the period.
(4) The Ratio of Expenses After Expense Limitation and Ratio of Net Investment Loss reflect the rebate of certain Fund expenses in connection with the investments in Morgan Stanley affiliates during the period. The effect of the rebate on the ratios is disclosed in the above table as "Ratio of Rebate from Morgan Stanley Affiliates."
(5) Amount is less than 0.005%.
The accompanying notes are an integral part of the consolidated financial statements.
17
Morgan Stanley Institutional Fund Trust
Annual Report — September 30, 2023
Consolidated Financial Highlights
Discovery Portfolio
| | | Class R6(1) | |
| | | Year Ended September 30, | |
Selected Per Share Data and Ratios | | 2023 | | 2022 | | 2021 | | 2020(2) | | 2019(2) | |
Net Asset Value, Beginning of Period | | $ | 12.34 | | | $ | 42.67 | | | $ | 38.72 | | | $ | 20.15 | | | $ | 23.50 | | |
Income (Loss) from Investment Operations: | |
Net Investment Loss(3) | | | (0.02 | ) | | | (0.10 | ) | | | (0.19 | ) | | | (0.12 | ) | | | (0.04 | ) | |
Net Realized and Unrealized Gain (Loss) | | | 0.37 | | | | (20.12 | ) | | | 7.44 | | | | 21.00 | | | | 0.37 | | |
Total from Investment Operations | | | 0.35 | | | | (20.22 | ) | | | 7.25 | | | | 20.88 | | | | 0.33 | | |
Distributions from and/or in Excess of: | |
Net Realized Gain | | | — | | | | (10.11 | ) | | | (3.30 | ) | | | (2.31 | ) | | | (3.68 | ) | |
Net Asset Value, End of Period | | $ | 12.69 | | | $ | 12.34 | | | $ | 42.67 | | | $ | 38.72 | | | $ | 20.15 | | |
Total Return(4) | | | 2.84 | % | | | (61.20 | )% | | | 18.47 | % | | | 115.65 | % | | | 4.77 | % | |
Ratios to Average Net Assets and Supplemental Data: | |
Net Assets, End of Period (Thousands) | | $ | 170,794 | | | $ | 194,806 | | | $ | 547,683 | | | $ | 354,067 | | | $ | 130,653 | | |
Ratio of Expenses Before Expense Limitation | | | 0.65 | % | | | 0.64 | % | | | N/A | | | | 0.64 | % | | | 0.64 | % | |
Ratio of Expenses After Expense Limitation | | | 0.64 | %(5) | | | 0.64 | %(5) | | | 0.61 | %(5) | | | 0.63 | %(5) | | | 0.63 | %(5) | |
Ratio of Expenses After Expense Limitation Excluding Interest Expenses | | | N/A | | | | N/A | | | | 0.61 | %(5) | | | 0.63 | %(5) | | | 0.63 | %(5) | |
Ratio of Net Investment Loss | | | (0.19 | )%(5) | | | (0.45 | )%(5) | | | (0.42 | )%(5) | | | (0.44 | )%(5) | | | (0.18 | )%(5) | |
Ratio of Rebate from Morgan Stanley Affiliates | | | 0.00 | %(6) | | | 0.00 | %(6) | | | 0.00 | %(6) | | | 0.01 | % | | | 0.01 | % | |
Portfolio Turnover Rate | | | 51 | % | | | 67 | % | | | 115 | % | | | 65 | % | | | 116 | % | |
(1) Effective April 29, 2022, Class IS shares were renamed Class R6 shares.
(2) Not consolidated.
(3) Per share amount is based on average shares outstanding.
(4) Calculated based on the net asset value as of the last business day of the period.
(5) The Ratio of Expenses After Expense Limitation and Ratio of Net Investment Loss reflect the rebate of certain Fund expenses in connection with the investments in Morgan Stanley affiliates during the period. The effect of the rebate on the ratios is disclosed in the above table as "Ratio of Rebate from Morgan Stanley Affiliates."
(6) Amount is less than 0.005%.
The accompanying notes are an integral part of the consolidated financial statements.
18
Morgan Stanley Institutional Fund Trust
Annual Report — September 30, 2023
Notes to Consolidated Financial Statements
Morgan Stanley Institutional Fund Trust ("Trust") is registered under the Investment Company Act of 1940, as amended (the "Act"), as an open-end management investment company. The Trust is comprised of nine separate, active funds (individually referred to as a "Fund," collectively as the "Funds"). All Funds are considered diversified for purposes of the Act.
The Trust applies investment company accounting and reporting guidance Accounting Standards Codification ("ASC"). In the preparation of these financial statements, management has evaluated subsequent events occurring after the date of the Fund's Consolidated Statement of Assets and Liabilities through the date that the financial statements were issued.
The accompanying consolidated financial statements relate to the Discovery Portfolio. The Fund seeks long-term capital growth. The Fund has issued five classes of shares — Class I, Class A, Class L, Class C and Class R6. Effective April 29, 2022, Class IS shares were renamed Class R6 shares.
The Fund has suspended offering Class L shares for sale to all investors. Class L shareholders of the Fund do not have the option of purchasing additional Class L shares. However, existing Class L shareholders may invest in additional Class L shares through reinvestment of dividends and distributions. In addition, Class L shares of the Fund may be exchanged for Class L shares of any Morgan Stanley Multi-Class Fund, even though Class L shares are closed to investors.
A. Significant Accounting Policies: The following significant accounting policies are in conformity with U.S. generally accepted accounting principles ("GAAP"). Such policies are consistently followed by the Trust in the preparation of its consolidated financial statements. GAAP may require management to make estimates and assumptions that affect the reported amounts and disclosures in the consolidated financial statements. Actual results may differ from those estimates.
The Fund may invest up to 25% of its total assets in a wholly-owned subsidiary of the Fund organized as a company under the laws of the Cayman Islands, Discovery Cayman Portfolio, Ltd. (the "Subsidiary"). The Subsidiary may invest in bitcoin indirectly through cash settled futures or indirectly through investments in Grayscale Bitcoin Trust (BTC) ("GBTC"), a privately offered investment vehicle that invests in bitcoin. The Fund is the sole shareholder of the Subsidiary, and it is not currently expected that shares of the Subsidiary will be sold or offered to other investors. The consolidated portfolio of investments and consolidated financial statements include the positions and accounts of the Fund and the Subsidiary. All
intercompany accounts and transactions of the Fund and the Subsidiary have been eliminated in consolidation and all accounting policies of the Subsidiary are consistent with those of the Fund. As of September 30, 2023, the Subsidiary represented approximately $18,058,000 or approximately 1.99% of the total net assets of the Fund.
Investments in the Subsidiary are expected to provide the Fund with exposure to bitcoin within the limitations of Subchapter M of the Code and recent Internal Revenue Service ("IRS") revenue rulings, which require that a mutual fund receive no more than ten percent of its gross income from such investments in order to receive favorable tax treatment as a regulated investment company ("RIC"). Tax treatment of the income received from the Subsidiary may potentially be affected by changes in legislation, regulations or other legally binding authority, which could affect the character, timing and amount of the Fund's taxable income and distributions. If such changes occur, the Fund may need to significantly change its investment strategy and recognize unrealized gains in order to remain qualified for taxation as a RIC, which could adversely affect the Fund.
In June 2022, the Financial Accounting Standards Board ("FASB") issued Accounting Standards Update (ASU) No. 2022-03, Fair Value Measurement (Topic 820): Fair Value Measurement of Equity Securities Subject to Contractual Sale Restrictions ("ASU 2022-03"), which clarifies the guidance in ASC Topic No. 820 on the fair value measurement of an equity security that is subject to a contractual sale restriction and introduces new disclosures related to such equity security. ASU 2022-03 clarifies that a contractual sale restriction prohibiting the sale of an equity security is a characteristic of the reporting entity holding the equity security and is not included in the equity security's unit of account. Accordingly, an entity should not consider the contractual sale restriction when measuring the equity security's fair value (i.e., the entity should not apply a discount related to the contractual sale restriction, as stated in ASC 820-10-35-36B as amended by ASU 2022-03). In addition, ASU 2022-03 prohibits an entity from recognizing a contractual sale restriction as a separate unit of account. The new guidance is effective for public companies with annual reporting periods in fiscal years beginning after December 15, 2023, and interim periods in the following year, with early adoption permitted. At this time, management is currently evaluating the impact of ASU 2022-03.
19
Morgan Stanley Institutional Fund Trust
Annual Report — September 30, 2023
Notes to Consolidated Financial Statements (cont'd)
1. Security Valuation: (1) An equity portfolio security listed or traded on an exchange is valued at its latest reported sales price (or at the exchange official closing price if such exchange reports an official closing price), and if there were no sales on a given day and if there is no official exchange closing price for that day, the security is valued at the mean between the last reported bid and asked prices if such bid and asked prices are available on the relevant exchanges. If only bid prices are available then the latest bid price may be used. Listed equity securities not traded on the valuation date with no reported bid and asked prices available on the exchange are valued at the mean between the current bid and asked prices obtained from one or more reputable brokers/dealers. In cases where a security is traded on more than one exchange, the security is valued on the exchange designated as the primary market; (2) all other equity portfolio securities for which over-the-counter ("OTC") market quotations are readily available are valued at the latest reported sales price (or at the market official closing price if such market reports an official closing price), and if there was no trading in the security on a given day and if there is no official closing price from relevant markets for that day, the security is valued at the mean between the last reported bid and asked prices if such bid and asked prices are available on the relevant markets. An unlisted equity security that does not trade on the valuation date and for which bid and asked prices from the relevant markets are unavailable is valued at the mean between the current bid and asked prices obtained from one or more reputable brokers/dealers; (3) listed options are valued at the last reported sales price on the exchange on which they are listed (or at the exchange official closing price if such exchange reports an official closing price). If an official closing price or last reported sales price is unavailable, the listed option should be fair valued at the mean between its latest bid and ask prices. Unlisted options are valued at the mean between their latest bid and ask prices from a broker/dealer or valued by a pricing service/vendor; (4) fixed income securities may be valued by an outside pricing service/vendor approved by the Trust's Board of Trustees (the "Trustees"). The pricing service/vendor may employ a pricing model that takes into account, among other things, bids, yield spreads and/or other market data and specific security characteristics. If Morgan Stanley Investment Management Inc. (the "Adviser"), a wholly-owned subsidiary of Morgan Stanley, determines that the price provided by the outside pricing service/vendor does not reflect the security's fair value or is
unable to provide a price, prices from brokers/dealers may also be utilized. In these circumstances, the value of the security will be the mean of bid and asked prices obtained from reputable brokers/dealers; (5) when market quotations are not readily available as defined by Rule 2a-5 under the Act, including circumstances under which the Adviser determines that the closing price, last sale price or the mean between the last reported bid and asked prices are not reflective of a security's market value, portfolio securities are valued at their fair value as determined in good faith under procedures approved by and under the general supervision of the Trustees. Occasionally, developments affecting the closing prices of securities and other assets may occur between the times at which valuations of such securities are determined (that is, close of the foreign market on which the securities trade) and the close of business of the New York Stock Exchange ("NYSE"). If developments occur during such periods that are expected to materially affect the value of such securities, such valuations may be adjusted to reflect the estimated fair value of such securities as of the close of the NYSE, as determined in good faith by the Trustees or by the Adviser using a pricing service and/or procedures approved by the Trustees; (6) foreign exchange transactions ("spot contracts") and foreign exchange forward contracts ("forward contracts") are valued daily using an independent pricing vendor at the spot and forward rates, respectively, as of the close of the NYSE; and (7) investments in mutual funds, including the Morgan Stanley Institutional Liquidity Funds, are valued at the net asset value ("NAV") as of the close of each business day.
In connection with Rule 2a-5 of the Act, the Trustees have designated the Trust's Adviser as its valuation designee. The valuation designee has responsibility for determining fair value and to make the actual calculations pursuant to the fair valuation methodologies previously approved by the Trustees. Under procedures approved by the Trustees, the Trust's Adviser, as valuation designee, has formed a Valuation Committee whose members are approved by the Trustees. The Valuation Committee provides administration and oversight of the Trust's valuation policies and procedures, which are reviewed at least annually by the Trustees. These procedures allow the Trust to utilize independent pricing services, quotations from securities and financial instrument dealers and other market sources to determine fair value.
20
Morgan Stanley Institutional Fund Trust
Annual Report — September 30, 2023
Notes to Consolidated Financial Statements (cont'd)
2. Fair Value Measurement: FASB ASC 820, "Fair Value Measurement" ("ASC 820"), defines fair value as the price that would be received to sell an asset or pay to transfer a liability in an orderly transaction between market participants at the measurement date. ASC 820 establishes a three-tier hierarchy to distinguish between (1) inputs that reflect the assumptions market participants would use in valuing an asset or liability developed based on market data obtained from sources independent of the reporting entity (observable inputs) and (2) inputs that reflect the reporting entity's own assumptions about the assumptions market participants would use in valuing an asset or liability developed based on the best information available in the circumstances (unobservable inputs) and to establish classification of fair value measurements for disclosure purposes. Various inputs are used in determining the value of the Fund's investments. The inputs are summarized in the three broad levels listed below:
• Level 1 – unadjusted quoted prices in active markets for identical investments
• Level 2 – other significant observable inputs (including quoted prices for similar investments, interest rates, prepayment speeds, credit risk, etc.)
• Level 3 – significant unobservable inputs including the Fund's own assumptions in determining the fair value of investments. Factors considered in making this determination may include, but are not limited to, information obtained by contacting the issuer, analysts, or the appropriate stock exchange (for exchange-traded securities), analysis of the issuer's financial statements or other available documents and, if necessary, available information concerning other securities in similar circumstances.
The inputs or methodology used for valuing securities are not necessarily an indication of the risk associated with investing in those securities and the determination of the significance of a particular input to the fair value measurement in its entirety requires judgment and considers factors specific to each security.
The following is a summary of the inputs used to value the Fund's investments as of September 30, 2023:
Investment Type | | Level 1
Unadjusted
quoted
prices
(000) | | Level 2
Other
significant
observable
inputs
(000) | | Level 3
Significant
unobservable
inputs
(000) | | Total
(000) | |
Assets: | |
Common Stocks | |
Biotechnology | | $ | 19,405 | | | $ | — | | | $ | — | | | $ | 19,405 | | |
Broadline Retail | | | 65,001 | | | | — | | | | — | | | | 65,001 | | |
Chemicals | | | 3,806 | | | | — | | | | — | | | | 3,806 | | |
Entertainment | | | 41,517 | | | | — | | | | — | | | | 41,517 | | |
Financial Services | | | 86,716 | | | | 23,118 | | | | — | | | | 109,834 | | |
Ground Transportation | | | 18,766 | | | | — | | | | — | | | | 18,766 | | |
Health Care
Equipment & Supplies | | | 7,200 | | | | — | | | | — | | | | 7,200 | | |
Health Care Providers &
Services | | | 47,126 | | | | — | | | | — | | | | 47,126 | | |
Health Care Technology | | | 12,591 | | | | — | | | | — | | | | 12,591 | | |
Hotels, Restaurants &
Leisure | | | 58,286 | | | | — | | | | — | | | | 58,286 | | |
Information Technology
Services | | | 96,216 | | | | — | | | | — | | | | 96,216 | | |
Interactive Media &
Services | | | 935 | | | | — | | | | — | | | | 935 | | |
Leisure Products | | | 14,310 | | | | — | | | | — | | | | 14,310 | | |
Life Sciences Tools &
Services | | | 12,033 | | | | — | | | | — | | | | 12,033 | | |
Media | | | 66,685 | | | | — | | | | — | | | | 66,685 | | |
Pharmaceuticals | | | 41,859 | | | | — | | | | — | | | | 41,859 | | |
Semiconductors &
Semiconductor
Equipment | | | 915 | | | | — | | | | — | | | | 915 | | |
Software | | | 164,876 | | | | — | | | | — | | | | 164,876 | | |
Specialty Retail | | | 61,814 | | | | — | | | | — | | | | 61,814 | | |
Total Common Stocks | | | 820,057 | | | | 23,118 | | | | — | | | | 843,175 | | |
Preferred Stock | |
Software | | | — | | | | — | | | | 31,817 | | | | 31,817 | | |
Investment Company | | | 15,083 | | | | — | | | | — | | | | 15,083 | | |
Warrants | | | 44 | | | | — | | | | — | | | | 44 | | |
Call Options Purchased | | | — | | | | 3,037 | | | | — | | | | 3,037 | | |
Short-Term Investments | |
Investment Company | | | 25,687 | | | | — | | | | — | | | | 25,687 | | |
Repurchase Agreements | | | — | | | | 1,553 | | | | — | | | | 1,553 | | |
Total Short-Term
Investments | | | 25,687 | | | | 1,553 | | | | — | | | | 27,240 | | |
Total | | $ | 860,871 | | | $ | 27,708 | | | $ | 31,817 | | | $ | 920,396 | | |
Transfers between investment levels may occur as the markets fluctuate and/or the availability of data used in an investment's valuation changes.
21
Morgan Stanley Institutional Fund Trust
Annual Report — September 30, 2023
Notes to Consolidated Financial Statements (cont'd)
Following is a reconciliation of investments in which significant unobservable inputs (Level 3) were used in determining fair value:
| | | Preferred
Stock
(000) | |
Beginning Balance | | $ | 25,782 | | |
Purchases | | | — | | |
Sales | | | — | | |
Transfers in | | | — | | |
Transfers out | | | — | | |
Corporate actions | | | — | | |
Change in unrealized appreciation (depreciation) | | | 6,035 | | |
Realized gains (losses) | | | — | | |
Ending Balance | | $ | 31,817 | | |
Net change in unrealized appreciation (depreciation)
from investments still held as of September 30, 2023 | | $ | 6,035 | | |
The following table presents additional information about valuation techniques and inputs used for investments that are measured at fair value and categorized within Level 3 as of September 30, 2023:
| | Fair Value at
September 30, 2023
(000) | | Valuation
Technique | | Unobservable
Input | | Amount* | | Impact to
Valuation from an
Increase in Input** | |
Preferred Stock | | $ | 31,817 | | | Market Transaction Method | | Precedent Transaction | | $ | 73.50 | | | Increase | |
* Amount is indicative of the weighted average.
** Represents the expected directional change in the fair value of the Level 3 investments that would result from an increase in the corresponding input. A decrease to the unobservable input would have the opposite effect. Significant changes in these inputs could result in significantly higher or lower fair value measurements.
3. Repurchase Agreements: The Fund may enter into repurchase agreements under which the Fund lends cash and takes possession of securities with an agreement that the counterparty will repurchase such securities. In connection with transactions in repurchase agreements, a bank as custodian for the Fund takes possession of the underlying securities which are held as collateral, with a market value at least equal to the amount of the repurchase transaction, including principal and accrued interest. To the extent that any repurchase transaction exceeds one business day, the value of the collateral is marked-to-market on a daily basis to determine that the value of the collateral does not decrease below the repurchase price plus accrued interest as earned. If such a decrease occurs, additional collateral will be requested and, when received, will be added to the account to maintain full collateralization. In the event of default on the obligation to repurchase, the Fund has the right to liquidate the collateral and apply the proceeds in satisfaction of the obligation. In the event of default or bankruptcy by the counterparty to the agreement, realization of the collateral proceeds may be
subject to cost and delays. The Fund, along with other affiliated investment companies, may utilize a joint trading account for the purpose of entering into repurchase agreements.
4. Foreign Currency Translation and Foreign Investments: The books and records of the Fund are maintained in U.S. dollars. Foreign currency amounts are translated into U.S. dollars as follows:
– investments, other assets and liabilities at the prevailing rate of exchange on the valuation date;
– investment transactions and investment income at the prevailing rates of exchange on the dates of such transactions.
Although the net assets of the Fund are presented at the foreign exchange rates and market values at the close of the period, the Fund does not isolate that portion of the results of operations arising as a result of changes in the foreign exchange rates from the fluctuations arising from changes in the market prices of securities held at
22
Morgan Stanley Institutional Fund Trust
Annual Report — September 30, 2023
Notes to Consolidated Financial Statements (cont'd)
period end. Similarly, the Fund does not isolate the effect of changes in foreign exchange rates from the fluctuations arising from changes in the market prices of securities sold during the period. Accordingly, realized and unrealized foreign currency gains (losses) on investments in securities are included in the reported net realized and unrealized gains (losses) on investment transactions and balances.
However, pursuant to U.S. federal income tax regulations, gains and losses from certain foreign currency transactions and the foreign currency portion of gains and losses realized on sales and maturities of foreign denominated debt securities are treated as ordinary income for U.S. federal income tax purposes.
Net realized gains (losses) on foreign currency transactions represent net foreign exchange gains (losses) from foreign currency forward exchange contracts, disposition of foreign currencies, currency gains (losses) realized between the trade and settlement dates on securities transactions, and the difference between the amount of investment income and foreign withholding taxes recorded on the Fund's books and the U.S. dollar equivalent amounts actually received or paid. The change in unrealized currency gains (losses) on foreign currency transactions for the period is reflected in the Consolidated Statement of Operations.
Foreign security and currency transactions may involve certain considerations and risks not typically associated with those of U.S. dollar denominated transactions as a result of, among other factors, fluctuations of exchange rates in relation to the U.S. dollar, the possibility of lower levels of governmental supervision and regulation of foreign securities markets and the possibility of political or economic instability.
Governmental approval for foreign investments may be required in advance of making an investment under certain circumstances in some countries, and the extent of foreign investments in U.S. companies may be subject to limitation in other countries. Foreign ownership limitations also may be imposed by the charters of individual companies to prevent, among other concerns, violations of foreign investment limitations. As a result, an additional class of shares (identified as "Foreign" in
the Consolidated Portfolio of Investments) may be created and offered for investment. The "local" and "foreign shares" market values may differ. In the absence of trading of the foreign shares in such markets, the Fund values the foreign shares at the closing exchange price of the local shares.
5. Derivatives: The Fund may, but is not required to, use derivative instruments for a variety of purposes, including hedging, risk management, portfolio management or to earn income. Derivatives are financial instruments whose value is based, in part, on the value of an underlying asset, interest rate, index or financial instrument. Prevailing interest rates and volatility levels, among other things, also affect the value of derivative instruments. A derivative instrument often has risks similar to its underlying asset and may have additional risks, including imperfect correlation between the value of the derivative and the underlying asset, risks of default by the counterparty to certain transactions, magnification of losses incurred due to changes in the market value of the securities, instruments, indices or interest rates to which the derivative instrument relates, risks that the transactions may not be liquid, risks arising from margin and payment requirements, risks arising from mispricing or valuation complexity and operational and legal risks. The use of derivatives involves risks that are different from, and possibly greater than, the risks associated with other portfolio investments. Derivatives may involve the use of highly specialized instruments that require investment techniques and risk analyses different from those associated with other portfolio investments. All of the Fund's holdings, including derivative instruments, are marked-to-market each day with the change in value reflected in unrealized appreciation (depreciation). Upon disposition, a realized gain or loss is recognized.
Certain derivative transactions may give rise to a form of leverage. Leverage magnifies the potential for gain and the risk of loss. Leverage associated with derivative transactions may cause the Fund to liquidate portfolio positions when it may not be advantageous to do so to satisfy its obligations or may cause the Fund to be more volatile than if the Fund had not been leveraged. Although the Adviser seeks to use derivatives to further the Fund's investment objectives, there is no assurance that the use of derivatives will achieve this result.
23
Morgan Stanley Institutional Fund Trust
Annual Report — September 30, 2023
Notes to Consolidated Financial Statements (cont'd)
Following is a description of the derivative instruments and techniques that the Fund used during the period and their associated risks:
Options: With respect to options, the Fund is subject to equity risk, interest rate risk and foreign currency ex-change risk in the normal course of pursuing its investment objectives. If the Fund buys an option, it buys a legal contract giving it the right to buy or sell a specific amount of the underlying instrument or foreign currency, or futures contract on the underlying instrument or foreign currency, at an agreed-upon price during a period of time or on a specified date typically in exchange for a premium paid by the Fund. The Fund may purchase and/or sell put and call options. Purchasing call options tends to increase the Fund's exposure to the underlying (or similar) instrument. Purchasing put options tends to decrease the Fund's exposure to the underlying (or similar) instrument. When entering into purchased option contracts, the Fund bears the risk of interest or exchange rates or securities prices moving unexpectedly, in which case, the Fund may not achieve the anticipated benefits of the purchased option contracts; however the risk of loss is limited to the premium paid. Purchased options are reported as part of "Total Investments in Securities" in the Consolidated Statement of Assets and Liabilities. Premiums paid for purchasing options which expired are treated as realized losses. If the Fund writes an option, it sells to another party the right to buy from or sell to the Fund a specific amount of the underlying instrument or foreign currency, or futures contract on the underlying instrument or foreign currency, at an agreed-upon price during a period of time or on a specified date typically in exchange for a premium received by the Fund. When options are purchased OTC, the Fund bears the risk that the counterparty that wrote the option will be unable or unwilling to perform its obligations under the option contract. Options may also be illiquid and the Fund may have difficulty closing out its position. A decision as to whether, when and how to use options involves the exercise of skill and judgment and even a well-conceived option transaction may be unsuccessful because of market behavior or unexpected events. The prices of options can be highly volatile and the use of options can lower total returns.
FASB ASC 815, "Derivatives and Hedging" ("ASC 815"), is intended to improve financial reporting about derivative instruments by requiring enhanced disclosures to enable investors to better understand how and why the Fund uses derivative instruments, how these derivative instruments are accounted for and their effects on the Fund's financial position and results of operations.
The following table sets forth the fair value of the Fund's derivative contracts by primary risk exposure as of September 30, 2023:
| | | Asset Derivatives Consolidated
Statement of Assets and
Liabilities Location | | Primary Risk
Exposure | | Value
(000) | |
Purchased Options
| | Investments, at Value
(Purchased Options) | |
Currency Risk | | $ | 3,037 | (a) | |
(a) Amounts are included in Investments in Securities in the Consolidated Statement of Assets and Liabilities.
The following tables set forth by primary risk exposure the Fund's realized gains (losses) and change in unrealized appreciation (depreciation) by type of derivative contract for the year ended September 30, 2023 in accordance with ASC 815:
Realized Gain (Loss) | |
Primary Risk Exposure | | Derivative Type | | Value
(000) | |
Currency Risk
| | Investments
(Purchased Options) | | $ | (5,003 | )(a) | |
(a) Amounts are included in Realized Gain (Loss) on Investments Sold in the Consolidated Statement of Operations.
Change in Unrealized Appreciation (Depreciation) | |
Primary Risk Exposure | | Derivative Type | | Value
(000) | |
Currency Risk
| | Investments
(Purchased Options) | | $ | (2,865 | )(a) | |
(a) Amounts are included in Change in Unrealized Appreciation (Depreciation) on Investments in the Consolidated Statement of Operations.
At September 30, 2023, the Fund's derivative assets and liabilities are as follows:
Gross Amounts of Assets and Liabilities Presented in the Consolidated Statement of Assets and Liabilities | |
Derivatives | | Assets(b)
(000) | | Liabilities(b)
(000) | |
Purchased Options | | $ | 3,037 | (a) | | $ | — | | |
(a) Amounts are included in Investments in Securities in the Consolidated Statement of Assets and Liabilities.
(b) Absent an event of default or early termination, OTC derivative assets and liabilities are presented gross and not offset in the Consolidated Statement of Assets and Liabilities.
The Fund typically enters into International Swaps and Derivatives Association, Inc. Master Agreements ("ISDA
24
Morgan Stanley Institutional Fund Trust
Annual Report — September 30, 2023
Notes to Consolidated Financial Statements (cont'd)
Master Agreements") or similar master agreements (collectively, "Master Agreements") with its contract counterparties for certain OTC derivatives in order to, among other things, reduce its credit risk to counterparties. ISDA Master Agreements include provisions for general obligations, representations, collateral and events of default or termination. Under an ISDA Master Agreement, the Fund typically may offset with the counterparty certain OTC derivative financial instruments' payables and/or receivables with collateral held and/or posted and create one single net payment (close-out netting) in the event of default, termination and/or potential deterioration in the credit quality of the counterparty. Various Master Agreements govern the terms of certain transactions with counterparties, including transactions such as swap, forward, repurchase and reverse repurchase agreements. These Master Agreements typically attempt to reduce the counterparty risk associated with such transactions by specifying credit protection mechanisms and providing standardization that improves legal certainty. Cross-termination provisions under Master Agreements typically provide that a default in connection with one transaction between the Fund and a counterparty gives the non-defaulting party the right to terminate any other transactions in place with the defaulting party to create one single net payment due to/due from the defaulting party and may be a feature in certain Master Agreements. In the event the Fund exercises its right to terminate a Master Agreement after a counterparty experiences a termination event as defined in the Master Agreement, the return of collateral with market value in excess of the Fund's net liability may be delayed or denied.
The following table presents derivative financial instruments that are subject to enforceable netting arrangements as of September 30, 2023:
Gross Amounts Not Offset in the Consolidated Statement of Assets and Liabilities | |
Counterparty | | Gross Asset
Derivatives
Presented in
the Consolidated
Statement of
Assets and
Liabilities(a)
(000) | | Financial
Instrument
(000) | | Collateral
Received(b)
(000) | | Net Amount
(not less
than $0)
(000) | |
Goldman Sachs International | | $ | — | @ | | $ | — | | | $ | (— | @) | | $ | 0 | | |
JPMorgan Chase Bank NA | | | 1,863 | | | | — | | | | (1,863 | ) | | | 0 | | |
Standard Chartered Bank | | | 1,174 | | | | — | | | | (1,174 | ) | | | 0 | | |
Total | | $ | 3,037 | | | $ | — | | | $ | (3,037 | ) | | $ | 0 | | |
@ Value is less than $500.
(a) Amounts are included in Investments in Securities in the Consolidated Statement of Assets and Liabilities.
(b) In some instances, the actual collateral received may be more than the amount shown here due to overcollateralization.
For the year ended September 30, 2023, the approximate average monthly amount outstanding for each derivative type is as follows:
Purchased Options: | |
Average monthly notional amount | | | 804,974,000 | | |
6. Securities Lending: The Fund lends securities to qualified financial institutions, such as broker/dealers, to earn additional income. Any increase or decrease in the fair value of the securities loaned that might occur and any interest earned or dividends declared on those securities during the term of the loan would remain in the Fund. The Fund would receive cash or securities as collateral in an amount equal to or exceeding 100% of the current fair value of the loaned securities. The collateral is marked-to-market daily by State Street Bank and Trust Company ("State Street"), the securities lending agent, to ensure that a minimum of 100% collateral coverage is maintained.
Based on pre-established guidelines, the securities lending agent invests any cash collateral that is received in an affiliated money market portfolio and repurchase agreements. Securities lending income is generated from the earnings on the invested collateral and borrowing fees, less any rebates owed to the borrowers and compensation to the lending agent, and is recorded as "Income from Securities Loaned — Net" in the Fund's Consolidated Statement of Operations. Risks in securities lending transactions are that a borrower may not provide additional collateral when required or return the securities when due, and that the value of the short-term investments will be less than the amount of cash collateral plus any rebate that is required to be returned to the borrower.
The Fund has the right under the securities lending agreement to recover the securities from the borrower on demand.
25
Morgan Stanley Institutional Fund Trust
Annual Report — September 30, 2023
Notes to Consolidated Financial Statements (cont'd)
The following table presents financial instruments that are subject to enforceable netting arrangements as of September 30, 2023:
Gross Amounts Not Offset in the Consolidated Statement of Assets and Liabilities | |
Gross Asset
Amount
Presented in
the Consolidated
Statement of
Assets and
Liabilities
(000) | | Financial
Instrument
(000) | | Collateral
Received
(000) | | Net Amount
(not less
than $0)
(000) | |
| $ | 8,319 | (a) | | $ | — | | | $ | (8,319 | )(b)(c) | | $ | 0 | | |
(a) Represents market value of loaned securities at year end.
(b) The Fund received cash collateral of approximately $8,591,000, which was subsequently invested in Repurchase Agreements and Morgan Stanley Institutional Liquidity Funds as reported in the Consolidated Portfolio of Investments. In addition, the Fund received non-cash collateral of approximately $392,000 in the form of U.S. Government obligations, which the Fund cannot sell or repledge, and accordingly are not reflected in the Consolidated Portfolio of Investments.
(c) The actual collateral received is greater than the amount shown here due to overcollateralization.
FASB ASC 860, "Transfers & Servicing: Repurchase-to-Maturity Transactions, Repurchase Financings, and Disclosures", is intended to provide increased transparency about the types of collateral pledged in securities lending transactions and other similar transactions that are accounted for as secured borrowings.
The following table displays a breakdown of transactions accounted for as secured borrowings, the gross obligations by class of collateral pledged and the remaining contractual maturity of those transactions as of September 30, 2023:
Remaining Contractual Maturity of the Agreements | |
| | | Overnight and
Continuous
(000) | | <30 days
(000) | | Between
30 &
90 days
(000) | | >90 Days
(000) | | Total
(000) | |
Securities Lending
Transactions | |
Common Stocks | | $ | 8,591 | | | $ | — | | | $ | — | | | $ | — | | | $ | 8,591 | | |
Total Borrowings | | $ | 8,591 | | | $ | — | | | $ | — | | | $ | — | | | $ | 8,591 | | |
Gross amount of
recognized liabilities
for securities lending
transactions | | | | | | | | | | $ | 8,591 | | |
7. Restricted Securities: The Fund invests in unregistered or otherwise restricted securities. The term "restricted securities" refers to securities that are unregistered or are held by control persons of the issuer and securities that are subject to contractual restrictions on their resale. As a result, restricted securities may be more difficult to value and the Fund may have difficulty disposing of such
assets either in a timely manner or for a reasonable price. In order to dispose of an unregistered security, the Fund, where it has contractual rights to do so, may have to cause such security to be registered. A considerable period may elapse between the time the decision is made to sell the security and the time the security is registered so that the Fund can sell it. Contractual restrictions on the resale of securities vary in length and scope and are generally the result of a negotiation between the issuer and the acquirer of the securities. The Fund would, in either case, bear market risks during that period. Restricted securities are identified in the Consolidated Portfolio of Investments.
8. Indemnifications: The Trust enters into contracts that contain a variety of indemnification clauses. The Trust's maximum exposure under these arrangements is unknown as this would involve future claims that may be made against the Fund that have not yet occurred.
9. Dividends and Distributions to Shareholders: Dividends and distributions to shareholders are recorded on the ex-dividend date. Dividends from net investment income, if any, are declared and paid annually. Net realized capital gains, if any, are distributed at least annually.
10. Security Transactions, Income and Expenses: Security transactions are accounted for on the trade date (date the order to buy or sell is executed). Realized gains and losses on the sale of investment securities are determined on the specific identified cost method. Dividend income and other distributions are recorded on the ex-dividend date (except for certain foreign dividends which may be recorded as soon as the Fund is informed of such dividends) net of applicable withholding taxes. Non-cash dividends received in the form of stock, if any, are recognized on the ex-dividend date and recorded as non-cash dividend income at fair value. Interest income is recognized on the accrual basis (except where collection is in doubt) net of applicable withholding taxes. Discounts are accreted and premiums are amortized over the life of the respective securities. Most expenses of the Trust can be directly attributed to a particular Fund. Expenses which cannot be directly attributed are apportioned among the Funds based upon relative net assets or other appropriate methods. Income, expenses (other than class specific expenses — distribution and shareholder services, transfer agency and sub transfer agency fees) and realized and unrealized gains or losses are allocated to each class of shares based upon their relative net assets.
26
Morgan Stanley Institutional Fund Trust
Annual Report — September 30, 2023
Notes to Consolidated Financial Statements (cont'd)
B. Advisory Fees: The Adviser, a wholly-owned subsidiary of Morgan Stanley, provides the Fund with advisory services under the terms of an Investment Advisory Agreement, paid quarterly, at an annual rate of 0.50% of the average daily net assets of the Fund.
The Adviser has agreed to reduce its advisory fee and/or reimburse the Fund so that total annual Fund operating expenses, excluding certain investment related expenses, taxes, interest and other extraordinary expenses (including litigation), will not exceed 0.80% for Class I shares, 1.15% for Class A shares, 1.65% for Class L shares, 1.90% for Class C shares and 0.73% for Class R6 shares. The fee waivers and/or expense reimbursements will continue for at least one year from the date of the Fund's prospectus or until such time as the Trustees act to discontinue all or a portion of such waivers and/or reimbursements when they deem such action is appropriate. This arrangement had no effect for the year ended September 30, 2023.
The Adviser provides investment advisory services to the Subsidiary pursuant to the Subsidiary Investment Management Agreement (the "Agreement"). Under the Agreement, the Subsidiary will pay the Adviser at the end of each fiscal quarter, calculated by applying a quarterly rate, based on the annual rate of 0.05%, to the average daily net assets of the Subsidiary.
The Adviser has agreed to waive its advisory fees by the amount of advisory fees it receives from the Subsidiary.
C. Administration Fees: The Adviser also serves as Administrator to the Trust and provides administrative services pursuant to an Administration Agreement for an annual fee, accrued daily and paid monthly, of 0.08% of the Fund's average daily net assets.
Under a Sub-Administration Agreement between the Administrator and State Street, State Street provides certain administrative services to the Trust. For such services, the Administrator pays State Street a portion of the fee the Administrator receives from the Fund.
D. Distribution and Shareholder Services Fees: Morgan Stanley Distribution, Inc. ("MSDI" or the "Distributor"), a wholly-owned subsidiary of the Adviser and an indirect subsidiary of Morgan Stanley, serves as the Trust's Distributor of Fund shares pursuant to a Distribution Agreement. The Trust has adopted a Shareholder Services Plan with respect to Class A shares pursuant to Rule 12b-1 under the Act. Under the Shareholder Services Plan, the Fund pays the Distributor a shareholder services fee, accrued daily and paid monthly, at an
annual rate of 0.25% of the Fund's average daily net assets attributable to Class A shares.
The Trust has adopted a Distribution and Shareholder Services Plan with respect to Class L shares pursuant to Rule 12b-1 under the Act. Under the Distribution and Shareholder Services Plan, the Fund pays the Distributor a distribution fee, accrued daily and paid monthly, at an annual rate of 0.50% and a shareholder services fee, accrued daily and paid monthly, at an annual rate of 0.25% of the Fund's average daily net assets attributable to Class L shares.
The Trust has adopted a Distribution and Shareholder Services Plan with respect to Class C shares pursuant to Rule 12b-1 under the Act. Under the Distribution and Shareholder Services Plan, the Fund pays the Distributor a distribution fee, accrued daily and paid monthly, at an annual rate of 0.75% and a shareholder services fee, accrued daily and paid monthly, at an annual rate of 0.25% of the Fund's average daily net assets attributable to Class C shares.
The distribution and shareholder services fees are used to support the expenses associated with servicing and maintaining accounts. The Distributor may compensate other parties for providing distribution-related and/or shareholder support services to investors who purchase Class A, Class L and Class C shares.
E. Dividend Disbursing and Transfer/Co-Transfer Agent: The Trust's dividend disbursing and transfer agent is SS&C Global Investor & Distribution Solutions, Inc. ("SS&C GIDS"). Pursuant to a Transfer Agency Agreement, the Trust pays SS&C GIDS a fee based on the number of classes, accounts and transactions relating to the Funds of the Trust.
Eaton Vance Management ("EVM"), an affiliate of Morgan Stanley, provides co-transfer agency and related services to the Fund pursuant to a Co-Transfer Agency Services Agreement. For the year ended September 30, 2023, co-transfer agency fees and expenses incurred to EVM, included in "Transfer Agency Fees" in the Statement of Operations, amounted to approximately $8,000.
F. Custodian Fees: State Street (the "Custodian") also serves as Custodian for the Trust in accordance with a Custodian Agreement. The Custodian holds cash, securities and other assets of the Trust as required by the Act. Custody fees are payable monthly based on assets held in custody, investment purchases and sales activity and account maintenance fees, plus reimbursement for certain out-of-pocket expenses.
27
Morgan Stanley Institutional Fund Trust
Annual Report — September 30, 2023
Notes to Consolidated Financial Statements (cont'd)
G. Security Transactions and Transactions with Affiliates: For the year ended September 30, 2023, purchases and sales of investment securities for the Fund, other than long-term U.S. Government securities and short-term investments were approximately $517,777,000 and $786,998,000, respectively. There were no purchases and sales of long-term U.S. Government securities for the year ended ended September 30, 2023.
The Fund invests in the Institutional Class of the Morgan Stanley Institutional Liquidity Funds — Treasury Securities Portfolio (the "Liquidity Funds"), an open-end management investment company managed by the Adviser, both directly and as a portion of the securities held as collateral on loaned securities. Advisory fees paid by the Fund are reduced by an amount equal to its pro-rata share of the advisory and administration fees paid by the Fund due to its investment in the Liquidity Funds. For the year ended September 30, 2023, advisory fees paid were reduced by approximately $44,000 relating to the Fund's investment in the Liquidity Funds.
A summary of the Fund's transactions in shares of affiliated investments during the year ended September 30, 2023 is as follows:
Affiliated
Investment
Company | | Value
September 30,
2022
(000) | | Purchases
at Cost
(000) | | Proceeds
from Sales
(000) | | Dividend
Income
(000) | |
Liquidity Funds | | $ | 55,890 | | | $ | 427,087 | | | $ | 457,290 | | | $ | 965 | | |
Affiliated
Investment
Company (cont'd) | | Realized
Gain
(Loss)
(000) | | Change in
Unrealized
Appreciation
(Depreciation)
(000) | | Value
September 30,
2023
(000) | |
Liquidity Funds | | $ | — | | | $ | — | | | $ | 25,687 | | |
The Fund is permitted to purchase and sell securities ("cross-trade") from and to other Morgan Stanley funds as well as other funds and client accounts for which the Adviser or an affiliate of the Adviser serves as investment adviser, pursuant to procedures approved by the Trustees in compliance with Rule 17a-7 under the Act (the "Rule"). Each cross-trade is executed at the current market price in compliance with provisions of the Rule. For the year ended September 30, 2023, the Fund did not engage in any cross-trade transactions.
The Fund has an unfunded noncontributory defined benefit pension plan covering certain independent Trustees of the Fund who will have served as independent Trustees for at least five years at the time of retirement. Benefits under this plan are based on factors which include years of service and compensation. The Trustees voted to close the plan to new participants
and eliminate the future benefits growth due to increases to compensation after July 31, 2003. Aggregate pension costs for the year ended September 30, 2023, included in "Trustees' Fees and Expenses" in the Consolidated Statement of Operations amounted to approximately $2,000. At September 30, 2023, the Fund had an accrued pension liability of approximately $37,000, which is reflected as "Payable for Trustees' Fees and Expenses" in the Consolidated Statement of Assets and Liabilities.
The Fund has an unfunded Deferred Compensation Plan (the "Compensation Plan"), which allows each independent Trustee to defer payment of all, or a portion, of the fees he or she receives for serving on the Board of Trustees. Each eligible Trustee generally may elect to have the deferred amounts credited with a return equal to the total return on one or more of the Morgan Stanley funds that are offered as investment options under the Compensation Plan. Appreciation/depreciation and distributions received from these investments are recorded with an offsetting increase/decrease in the deferred compensation obligation and do not affect the NAV of the Fund.
H. Federal Income Taxes: It is the Fund's intention to continue to qualify as a RIC and distribute all of its taxable and tax-exempt income. Accordingly, no provision for federal income taxes is required in the consolidated financial statements.
The Fund may be subject to taxes imposed by countries in which it invests. Such taxes are generally based on income and/or capital gains earned or repatriated. Taxes are accrued based on net investment income, net realized gains and net unrealized appreciation as such income and/or gains are earned. Taxes may also be based on transactions in foreign currency and are accrued based on the value of investments denominated in such currency.
FASB ASC 740-10, "Income Taxes — Overall", sets forth a minimum threshold for consolidated financial statement recognition of the benefit of a tax position taken or expected to be taken in a tax return. Management has concluded that there are no significant uncertain tax positions that would require recognition in the consolidated financial statements. If applicable, the Fund recognizes interest accrued related to unrecognized tax benefits in "Interest Expense" and penalties in "Other Expenses" in the Consolidated Statement of Operations. The Fund files tax returns with the U.S. Internal Revenue Service, New York and various states. Generally, each of the tax years in the four-year period ended September 30, 2023 remains subject to examination by taxing authorities.
28
Morgan Stanley Institutional Fund Trust
Annual Report — September 30, 2023
Notes to Consolidated Financial Statements (cont'd)
The tax character of distributions paid may differ from the character of distributions shown for GAAP purposes due to short-term capital gains being treated as ordinary income for tax purposes. The tax character of distributions paid during fiscal years 2023 and 2022 was as follows:
2023
Distributions
Paid From: | | 2022
Distributions
Paid From: | |
Ordinary
Income
(000) | | Long-Term
Capital Gain
(000) | | Ordinary
Income
(000) | | Long-Term
Capital Gain
(000) | |
| $ | — | | | $ | — | | | $ | 354,635 | | | $ | 760,915 | | |
The amount and character of income and gains to be distributed are determined in accordance with income tax regulations which may differ from GAAP. These book/tax differences are either considered temporary or permanent in nature.
Temporary differences are attributable to differing book and tax treatments for the timing of the recognition of gains (losses) on certain investment transactions and the timing of the deductibility of certain expenses.
Permanent differences, due to a net operating loss, resulted in the following reclassifications among the components of net assets at September 30, 2023.
Total
Accumulated
Loss
(000) | | Paid-in-
Capital
(000) | |
| $ | 32,372 | | | $ | (32,372 | ) | |
At September 30, 2023, the Fund had no distributable earnings on a tax basis.
At September 30, 2023, the Fund had available for federal income tax purposes unused short-term and long-term capital losses of approximately $562,626,000 and $867,366,000, respectively, that do not have an expiration date.
To the extent that capital loss carryforwards are used to offset any future capital gains realized, no capital gains tax liability will be incurred by the Fund for gains realized and not distributed. To the extent that capital gains are offset, such gains will not be distributed to the shareholders.
Qualified late year losses are capital losses and specified ordinary losses, including currency losses, incurred after October 31 but within the taxable year that, if elected, are deemed to arise on the first day of the Fund's next taxable year. For the year ended September 30, 2023, the Fund intends to
defer to October 1, 2023 for U.S. federal income tax purposes the following losses:
Qualified
Late Year
Ordinary
Losses
(000) | | Post-October
Capital
Losses
(000) | |
| $ | 8,304 | | | $ | — | | |
I. Credit Facility: The Trust and other Morgan Stanley funds participated in a $300,000,000 committed, unsecured revolving line of credit facility (the "Facility") with State Street. Effective April 17, 2023, the committed line amount increased to $500,000,000. This Facility is to be used for temporary emergency purposes or funding of shareholder redemption requests. The interest rate for any funds drawn will be based on the federal funds rate or overnight bank funding rate plus a spread. The Facility also has a commitment fee of 0.25% per annum based on the unused portion of the Facility, which is allocated among participating funds based on relative net assets. During the twelve months ended September 30, 2023, the Fund did not have any borrowings under the Facility.
J. Other: At September 30, 2023, the Fund had record owners of 10% or greater. Investment activities of these shareholders could have a material impact on the Fund. The aggregate percentage of such owners was 61.0%.
K. Market Risk and Risks Relating to Certain Financial Instruments:
Bitcoin: The Fund may have exposure to cryptocurrencies indirectly through investments in GBTC, a privately offered investment vehicle that invests in bitcoin. Cryptocurrencies (also referred to as "virtual currencies" and "digital currencies") are digital assets designed to act as a medium of exchange. Although cryptocurrency is an emerging asset class, there are thousands of cryptocurrencies, the most well-known of which is bitcoin. Cryptocurrency facilitates decentralized, peer-to-peer financial exchange and value storage that is used like money, without the oversight of a central authority or banks. The value of cryptocurrency is not backed by any government, corporation, or other identified body. Similar to fiat currencies (i.e., a currency that is backed by a central bank or a national, supra-national or quasi-national organization), cryptocurrencies are susceptible to theft, loss and destruction. For example, the bitcoin held by GBTC (and the Fund's indirect exposure to such bitcoin) is also susceptible to these risks. The value of the
29
Morgan Stanley Institutional Fund Trust
Annual Report — September 30, 2023
Notes to Consolidated Financial Statements (cont'd)
GBTC investments in cryptocurrency is subject to fluctuations in the value of the cryptocurrency, which have been and may in the future be highly volatile. The value of cryptocurrencies is determined by the supply and demand for cryptocurrency in the global market for the trading of cryptocurrency, which consists primarily of transactions on electronic exchanges. The price of bitcoin could drop precipitously (including to zero) for a variety of reasons, including, but not limited to, regulatory changes, a crisis of confidence, flaw or operational issue in the bitcoin network or a change in user preference to competing cryptocurrencies. The GBTC exposure to cryptocurrency could result in substantial losses to the Fund.
Market: An investment in the Fund is based on the values of the Fund's investments, which may change due to economic and other events that affect markets generally, as well as those that affect particular regions, countries, industries, companies or governments. The risks associated with these developments may be magnified if social, political, economic and other conditions and events (such as war, natural disasters, health emergencies (e.g., epidemics and pandemics), terrorism, conflicts, social unrest, recessions, inflation, rapid interest rate changes and supply chain disruptions) adversely interrupt the global economy and financial markets. It is difficult to predict when events affecting the U.S. or global financial markets may occur, the effects that such events may have and the duration of those effects (which may last for extended periods). These events may negatively impact broad segments of businesses and populations and have a significant and rapid negative impact on the performance of the Fund's investments, adversely affect and increase the volatility of the Fund's share price and exacerbate pre-existing risks to the Fund. The occurrence, duration and extent of these or other types of adverse economic and market conditions and uncertainty over the long term cannot be reasonably projected or estimated at this time. The ultimate impact of public health emergencies or other adverse economic or market developments and the extent to which the associated conditions impact the Fund and its investments will also depend on other future developments, which are highly uncertain, difficult to accurately predict and subject to change at any time. The financial performance of the Fund's investments (and, in turn, the Fund's investment results) as well as their liquidity may be adversely affected because of these and similar types of factors and developments.
30
Morgan Stanley Institutional Fund Trust
Annual Report — September 30, 2023
Report of Independent Registered Public Accounting Firm
To the Shareholders and Board of Trustees of
Morgan Stanley Institutional Fund Trust —
Discovery Portfolio
Opinion on the Financial Statements
We have audited the accompanying consolidated statement of assets and liabilities of Discovery Portfolio (the "Fund") (one of the funds constituting Morgan Stanley Institutional Fund Trust (the "Trust")), including the consolidated portfolio of investments, as of September 30, 2023, and the related consolidated statement of operations for the year then ended, the consolidated statements of changes in net assets for each of the two years in the period then ended, the consolidated financial highlights for each of the five years in the period then ended and the related notes (collectively referred to as the "financial statements"). In our opinion, the financial statements present fairly, in all material respects, the consolidated financial position of the Fund (one of the funds constituting Morgan Stanley Institutional Fund Trust) at September 30, 2023, the consolidated results of its operations for the year then ended, the consolidated changes in its net assets for each of the two years in the period then ended and its consolidated financial highlights for each of the five years in the period then ended, in conformity with U.S. generally accepted accounting principles.
Basis for Opinion
These financial statements are the responsibility of the Trust's management. Our responsibility is to express an opinion on the Fund's financial statements based on our audits. We are a public accounting firm registered with the Public Company Accounting Oversight Board (United States) ("PCAOB") and are required to be independent with respect to the Trust in accordance with the U.S. federal securities laws and the applicable rules and regulations of the Securities and Exchange Commission and the PCAOB.
We conducted our audits in accordance with the standards of the PCAOB. Those standards require that we plan and perform the audit to obtain reasonable assurance about whether the financial statements are free of material misstatement, whether due to error or fraud. The Trust is not required to have, nor were we engaged to perform, an audit of the Trust's internal control over financial reporting. As part of our audits, we are required to obtain an understanding of internal control over financial reporting but not for the purpose of expressing an opinion on the effectiveness of the Trust's internal control over financial reporting. Accordingly, we express no such opinion.
Our audits included performing procedures to assess the risks of material misstatement of the financial statements, whether due to error or fraud, and performing procedures that respond to those risks. Such procedures included examining, on a test basis, evidence regarding the amounts and disclosures in the financial statements. Our procedures included confirmation of securities owned as of September 30, 2023, by correspondence with the custodian, brokers and others; when replies were not received from brokers and others, we performed other auditing procedures. Our audits also included evaluating the accounting principles used and significant estimates made by management, as well as evaluating the overall presentation of the financial statements. We believe that our audits provide a reasonable basis for our opinion.

We have served as the auditor of one or more Morgan Stanley investment companies since 2000.
Boston, Massachusetts
November 27, 2023
31
Morgan Stanley Institutional Fund Trust
Annual Report — September 30, 2023
Investment Advisory Agreement Approval (unaudited)
Nature, Extent and Quality of Services
The Board reviewed and considered the nature and extent of the investment advisory services provided by the Adviser under the advisory agreement, including portfolio management, investment research and equity and fixed income securities trading. The Board also reviewed and considered the nature and extent of the non-advisory, administrative services provided by the Administrator under the administration agreement, including accounting, operations, clerical, bookkeeping, compliance, business management and planning, legal services and the provision of supplies, office space and utilities at the Adviser's expense. The Board also considered the Adviser's investment in personnel and infrastructure that benefits the Fund. (The Adviser and Administrator together are referred to as the "Adviser" and the advisory and administration agreements together are referred to as the "Management Agreement.") The Board also considered that the Adviser serves a variety of other investment advisory clients and has experience overseeing service providers. The Board also compared the nature of the services provided by the Adviser with similar services provided by non-affiliated advisers as prepared by Broadridge Financial Solutions, Inc. ("Broadridge").
The Board reviewed and considered the qualifications of the portfolio managers, the senior administrative managers and other key personnel of the Adviser who provide the advisory and administrative services to the Fund. The Board determined that the Adviser's portfolio managers and key personnel are well qualified by education and/or training and experience to perform the services in an efficient and professional manner. The Board concluded that the nature and extent of the advisory and administrative services provided were necessary and appropriate for the conduct of the business and investment activities of the Fund and supported its decision to approve the Management Agreement.
Performance, Fees and Expenses of the Fund
The Board reviewed the performance, fees and expenses of the Fund compared to its peers, as prepared by Broadridge, and to appropriate benchmarks where applicable. The Board discussed with the Adviser the performance goals and the actual results achieved in managing the Fund. When considering a fund's performance, the Board and the Adviser place emphasis on trends and longer-term returns (focusing on one-year, three-year and five-year performance, as of December 31, 2022, or since inception, as applicable). When a fund underperforms its benchmark and/or its peer group average, the Board and the Adviser discuss the causes of such underperformance and, where necessary, they discuss specific changes to investment strategy or investment personnel. The Board noted that the Fund's performance was below its peer group average for the one-, three- and five-year periods. The Board discussed with the Adviser the level of the advisory and administration fees (together, the "management fee") for this Fund relative to comparable funds and/or other accounts advised by the Adviser and/or compared to its peers as prepared by Broadridge. In addition to the management fee, the Board also reviewed the Fund's total expense ratio. The Board noted that the Fund's management fee and total expense ratio were lower than its peer group averages. After discussion, the Board concluded that the Fund's (i) performance was acceptable and (ii) management fee and total expense ratio were competitive with its peer group averages.
Economies of Scale
The Board considered the size and growth prospects of the Fund and how that relates to the Fund's total expense ratio and particularly the Fund's management fee rate, which does not include breakpoints. In conjunction with its review of the Adviser's profitability, the Board discussed with the Adviser how a change in assets can affect the efficiency or effectiveness of managing the Fund and whether the management fee level is appropriate relative to current and projected asset levels and/or whether the management fee structure reflects economies of scale as asset levels change. The Board has determined that its review of the actual and/or potential economies of scale of the Fund supports its decision to approve the Management Agreement.
Profitability of the Adviser and Affiliates
The Board considered information concerning the costs incurred and profits realized by the Adviser and its affiliates during the last year from their relationship with the Fund and during the last two years from their relationship with the Morgan Stanley Fund Complex and reviewed with the Adviser the cost allocation methodology used to determine the profitability of the Adviser and affiliates. The Board has determined that its review of the analysis of the Adviser's expenses and profitability supports its decision to approve the Management Agreement.
32
Morgan Stanley Institutional Fund Trust
Annual Report — September 30, 2023
Investment Advisory Agreement Approval (unaudited) (cont'd)
Other Benefits of the Relationship
The Board considered other direct and indirect benefits to the Adviser and/or its affiliates derived from their relationship with the Fund and other funds advised by the Adviser. These benefits may include, among other things, fees for trading, distribution and/or shareholder servicing and for transaction processing and reporting platforms used by securities lending agents, and research received by the Adviser generated from commission dollars spent on funds' portfolio trading. The Board reviewed with the Adviser these arrangements and the reasonableness of the Adviser's costs relative to the services performed. The Board has determined that its review of the other benefits received by the Adviser or its affiliates supports its decision to approve the Management Agreement.
Resources of the Adviser and Historical Relationship Between the Fund and the Adviser
The Board considered whether the Adviser is financially sound and has the resources necessary to perform its obligations under the Management Agreement. The Board also reviewed and considered the historical relationship between the Fund and the Adviser, including the organizational structure of the Adviser, the policies and procedures formulated and adopted by the Adviser for managing the Fund's operations and the Board's confidence in the competence and integrity of the senior managers and key personnel of the Adviser. The Board concluded that the Adviser has the financial resources necessary to fulfill its obligations under the Management Agreement and that it is beneficial for the Fund to continue its relationship with the Adviser.
Other Factors and Current Trends
The Board considered the controls and procedures adopted and implemented by the Adviser and monitored by the Fund's Chief Compliance Officer and concluded that the conduct of business by the Adviser indicates a good faith effort on its part to adhere to high ethical standards in the conduct of the Fund's business.
General Conclusion
After considering and weighing all of the above factors, with various written materials and verbal information presented by the Adviser, the Board concluded that it would be in the best interest of the Fund and its shareholders to approve renewal of the Management Agreement for another year. In reaching this conclusion the Board did not give particular weight to any single piece of information or factor referenced above. The Board considered these factors and information over the course of the year and in numerous meetings, some of which were in executive session with only the independent Board members and their counsel present. It is possible that individual Board members may have weighed these factors, and the information presented, differently in reaching their individual decisions to approve the Management Agreement.
33
Morgan Stanley Institutional Fund Trust
Annual Report — September 30, 2023
Liquidity Risk Management Program (unaudited)
In compliance with Rule 22e-4 under the Investment Company Act of 1940, as amended (the "Liquidity Rule"), the Fund has adopted and implemented a liquidity risk management program (the "Program"), which is reasonably designed to assess and manage the risk that the Fund could not meet requests to redeem shares issued by the Fund without significant dilution of remaining investors' interests in the Fund (i.e., liquidity risk). The Fund's Board of Trustees (the "Board") previously approved the designation of the Liquidity Risk Subcommittee (the "LRS") as Program administrator. The LRS is comprised of representatives from various divisions within Morgan Stanley Investment Management.
At a meeting held on March 1-2, 2023, the Board reviewed a written report prepared by the LRS that addressed the Program's operation and assessed its adequacy, and effectiveness of implementation for the period from January 1, 2022, through December 31, 2022, as required under the Liquidity Rule. The report concluded that the Program operated effectively and was adequately and effectively implemented in all material aspects, and that the relevant controls and safeguards were appropriately designed to enable the LRS to administer the Program in compliance with the Liquidity Rule.
In accordance with the Program, the LRS assessed each Fund's liquidity risk no less frequently than annually taking into consideration certain factors, as applicable, such as (i) investment strategy and liquidity of portfolio investments, (ii) short-term and long-term cash flow projections and (iii) holdings of cash and cash equivalents and borrowing arrangements and other funding sources. Certain factors are considered under both normal and reasonably foreseeable stressed conditions.
Each Fund portfolio investment is classified into one of four liquidity categories, which classification is assessed at least monthly by the LRS. The classification is based on a determination of the number of days it is reasonably expected to take to convert the investment into cash, or sell or dispose of the investment, in current market conditions without significantly changing the market value of the investment. Liquidity classification determinations take into account various market, trading and investment-specific considerations, as well as market depth, and in some cases utilize third-party vendor data.
The Liquidity Rule limits a fund's investments in illiquid investments to 15% of its net assets and requires funds that do not primarily hold assets that are highly liquid investments to determine and maintain a minimum percentage of the fund's net assets to be invested in highly liquid investments (highly liquid investment minimum or "HLIM"). The LRS believes that the Program includes provisions reasonably designed to review, monitor and comply with the 15% limit on illiquid investments and for determining, periodically reviewing and complying with the HLIM requirement, as applicable.
There can be no assurance that the Program will achieve its objectives under all circumstances in the future. Please refer to the Fund's prospectus for more information regarding the Fund's exposure to liquidity risk and other risks to which it may be subject.
34
Morgan Stanley Institutional Fund Trust
Annual Report — September 30, 2023
Important Notices (unaudited)
Reporting to Shareholders
Each Morgan Stanley fund provides a complete schedule of portfolio holdings in its Semi-Annual and the Annual Reports within 60 days of the end of the fund's second and fourth fiscal quarters. The Semi-Annual and Annual Reports are filed electronically with the Securities and Exchange Commission ("SEC") on Form N-CSRS and Form N-CSR, respectively. Morgan Stanley makes these reports available on its public website, www.morganstanley.com/im. Each Morgan Stanley non-money market fund also files a complete schedule of portfolio holdings with the SEC for the fund's first and third fiscal quarters as an attachment to Form N-PORT. Morgan Stanley does not deliver the reports for the first and third fiscal quarters to shareholders, but makes the complete schedule of portfolio holdings for the fund's first and third fiscal quarters available on its public website. The holdings for each money market fund are also posted to the Morgan Stanley public website. You may obtain the Form N-PORT filings (as well as the Form N-CSR and N-CSRS filings) by accessing the SEC's website, www.sec.gov. You can also request copies of these materials, upon payment of a duplicating fee, by electronic request at the SEC's email address (publicinfo@sec.gov).
Proxy Voting Policies and Procedures and Proxy Voting Record
You may obtain a copy of the Trust's Proxy Voting Policy and Procedures and information regarding how the Trust voted proxies relating to portfolio securities during the most recent twelve-month period ended June 30, without charge, upon request, by calling toll free 1 (800) 869-6397 or by visiting our website at www.morganstanley.com/im. This information is also available on the SEC's website at www.sec.gov.
This report is authorized for distribution only when preceded or accompanied by a prospectus or summary prospectus of the applicable fund of Morgan Stanley Institutional Fund Trust, which describes in detail the fund's investment policies, risks, fees and expenses. Please read the prospectus carefully before you invest or send money. For additional information, including information regarding the investments comprising the Fund, please visit our website at www.morganstanley.com/im. or call toll free 1 (800) 869-6397.
Householding Notice
To reduce printing and mailing costs, the Fund attempts to eliminate duplicate mailings to the same address. The Fund delivers a single copy of certain shareholder documents, including shareholder reports, prospectuses and proxy materials, to investors with the same last name who reside at the same address. Your participation in this program will continue for an unlimited period of time unless you instruct us otherwise. You can request multiple copies of these documents by calling 1 (800) 869-6397, 8:00 a.m. to 6:00 p.m., ET. Once our Customer Service Center has received your instructions, we will begin sending individual copies for each account within 30 days.
Tailored Shareholder Reports
Effective January 24, 2023, the SEC adopted rule and form amendments to require open-end mutual funds and ETFs to transmit concise and visually engaging streamlined annual and semiannual reports to shareholders that highlight key information. Other information, including financial statements, will no longer appear in a streamlined shareholder report but must be available online, delivered free of charge upon request, and filed on a semiannual basis on Form N-CSR. The rule and form amendments have a compliance date of July 24, 2024. At this time, management is evaluating the impact of these amendments on the shareholder reports for the Morgan Stanley Funds.
35
Morgan Stanley Institutional Fund Trust
Annual Report — September 30, 2023
U.S. Customer Privacy Notice (unaudited) April 2021
FACTS | | WHAT DOES MSIM DO WITH YOUR PERSONAL INFORMATION? | |
Why? | | Financial companies choose how they share your personal information. Federal law gives consumers the right to limit some but not all sharing. Federal law also requires us to tell you how we collect, share, and protect your personal information. Please read this notice carefully to understand what we do. | |
What? | | The types of personal information we collect and share depend on the product or service you have with us. This information can include:
◼ Social Security number and income
◼ investment experience and risk tolerance
◼ checking account number and wire transfer instructions | |
How? | | All financial companies need to share customers' personal information to run their everyday business. In the section below, we list the reasons financial companies can share their customers' personal information; the reasons MSIM chooses to share; and whether you can limit this sharing. | |
Reasons we can share your personal information | | Does MSIM share? | | Can you limit this sharing? | |
For our everyday business purposes —
such as to process your transactions, maintain your account(s), respond to court orders and legal investigations, or report to credit bureaus | | Yes | | No | |
For our marketing purposes —
to offer our products and services to you | | Yes | | No | |
For joint marketing with other financial companies | | No | | We don't share | |
For our investment management affiliates' everyday business purposes —
information about your transactions, experiences, and creditworthiness | | Yes | | Yes | |
For our affiliates' everyday business purposes —
information about your transactions and experiences | | Yes | | No | |
For our affiliates' everyday business purposes —
information about your creditworthiness | | No | | We don't share | |
For our investment management affiliates to market to you | | Yes | | Yes | |
For our affiliates to market to you | | No | | We don't share | |
For non-affiliates to market to you | | No | | We don't share | |
36
Morgan Stanley Institutional Fund Trust
Annual Report — September 30, 2023
U.S. Customer Privacy Notice (unaudited) (cont'd) April 2021
To limit our sharing | | Call toll-free (844) 312-6327 or email: imprivacyinquiries@morganstanley.com
Please note:
If you are a new customer, we can begin sharing your information 30 days from the date we sent this notice. When you are no longer our customer, we continue to share your information as described in this notice. However, you can contact us at any time to limit our sharing. | |
Questions? | | Call toll-free (844) 312-6327 or email: imprivacyinquiries@morganstanley.com | |
Who we are
Who is providing this notice? | | Morgan Stanley Investment Management Inc. and its investment management affiliates ("MSIM") (see Investment Management Affiliates definition below) | |
What we do
How does MSIM protect my personal information? | | To protect your personal information from unauthorized access and use, we use security measures that comply with federal law. These measures include computer safeguards and secured files and buildings. We have policies governing the proper handling of customer information by personnel and requiring third parties that provide support to adhere to appropriate security standards with respect to such information. | |
How does MSIM collect my personal information? | | We collect your personal information, for example, when you
◼ open an account or make deposits or withdrawals from your account
◼ buy securities from us or make a wire transfer
◼ give us your contact information
We also collect your personal information from others, such as credit bureaus, affiliates, or other companies. | |
Why can't I limit all sharing? | | Federal law gives you the right to limit only
◼ sharing for affiliates' everyday business purposes — information about your creditworthiness
◼ affiliates from using your information to market to you
◼ sharing for non-affiliates to market to you
State laws and individual companies may give you additional rights to limit sharing. See below for more on your rights under state law. | |
37
Morgan Stanley Institutional Fund Trust
Annual Report — September 30, 2023
U.S. Customer Privacy Notice (unaudited) (cont'd) April 2021
Definitions
Investment Management Affiliates | | MSIM Investment Management Affiliates include registered investment advisers, registered broker-dealers, and registered and unregistered funds in the Investment Management Division. Investment Management Affiliates does not include entities associated with Morgan Stanley Wealth Management, such as Morgan Stanley Smith Barney LLC and Morgan Stanley & Co. | |
Affiliates | | Companies related by common ownership or control. They can be financial and non-financial companies.
◼ Our affiliates include companies with a Morgan Stanley name and financial companies such as Morgan Stanley Smith Barney LLC and Morgan Stanley & Co. | |
Non-affiliates | | Companies not related by common ownership or control. They can be financial and non-financial companies.
◼ MSIM does not share with non-affiliates so they can market to you. | |
Joint marketing | | A formal agreement between non-affiliated financial companies that together market financial products or services to you.
◼ MSIM doesn't jointly market | |
Other important information
Vermont: Except as permitted by law, we will not share personal information we collect about Vermont residents with Non-affiliates unless you provide us with your written consent to share such information.
California: Except as permitted by law, we will not share personal information we collect about California residents with Non-affiliates and we will limit sharing such personal information with our Affiliates to comply with California privacy laws that apply to us.
38
Morgan Stanley Institutional Fund Trust
Annual Report — September 30, 2023
Trustees and Officers Information (unaudited)
Independent Trustees:
Name, Address and Birth Year
of Independent Trustee | | Position(s)
Held with
Registrant | | Length of Time
Served* | | Principal Occupation(s) During Past 5 Years
and Other Relevant Professional Experience | | Number of
Funds in
Fund Complex
Overseen by
Independent
Trustee** | | Other Directorships
Held by Independent
Trustee During
Past 5 Years*** | |
Frank L. Bowman
c/o Perkins Coie LLP
Counsel to the Independent Trustees
1155 Avenue of the Americas
22nd Floor
New York, NY 10036
Birth Year: 1944 | | Trustee | | Since
August
2006 | | President, Strategic Decisions, LLC (consulting) (since February 2009); Director or Trustee of various Morgan Stanley Funds (since August 2006); Chairperson of the Compliance and Insurance Committee (since October 2015); formerly, Chairperson of the Insurance Sub-Committee of the Compliance and Insurance Committee (2007-2015); served as President and Chief Executive Officer of the Nuclear Energy Institute (policy organization) (February 2005-November 2008); retired as Admiral, U.S. Navy after serving over 38 years on active duty including 8 years as Director of the Naval Nuclear Propulsion Program in the Department of the Navy and the U.S. Department of Energy (1996-2004); served as Chief of Naval Personnel (July 1994-September 1996) and on the Joint Staff as Director of Political Military Affairs (June 1992-July 1994); knighted as Honorary Knight Commander of the Most Excellent Order of the British Empire; awarded the Officier de l'Orde National du Mèrite by the French Government; elected to the National Academy of Engineering (2009). | | | 86 | | | Director of Naval and Nuclear Technologies LLP; Director Emeritus of the Armed Services YMCA; Member of the National Security Advisory Council of the Center for U.S. Global Engagement and a former member of the CNA Military Advisory Board; Chairman of the Board of Trustees of Fairhaven United Methodist Church; Member of the Board of Advisors of the Dolphin Scholarship Foundation; Director of other various nonprofit organizations; formerly, Director of BP, plc (November 2010-May 2019). | |
Frances L. Cashman
c/o Perkins Coie LLP
Counsel to the Independent
Trustees
1155 Avenue of the Americas
22nd Floor
New York, NY 10036
Birth Year: 1961 | | Trustee | | Since
February
2022 | | Chief Executive Officer, Asset Management Division, Delinian Ltd. (financial information) (May 2021-Present); Executive Vice President and various other roles, Legg Mason & Co. (asset management) (2010-2020); Managing Director, Stifel Nicolaus (2005-2010). | | | 87 | | | Trustee and Investment Committee Member, GeorgiaTech Foundation (since June 2019); Trustee and Chair of Marketing Committee, and Member of Investment Committee, Loyola Blakefield (Since September 2017); Trustee, MMI Gateway Foundation (since September 2017); Director and Investment Committee Member, Catholic Community Foundation Board (2012-2018); Director and Investment Committee Member, St. Ignatius Loyola Academy (2011-2017). | |
Kathleen A. Dennis
c/o Perkins Coie LLP
Counsel to the Independent
Trustees
1155 Avenue of the Americas
22nd Floor
New York, NY 10036
Birth Year: 1953 | | Trustee | | Since
August
2006 | | Chairperson of the Governance Committee (since January 2021), Chairperson of the Liquidity and Alternatives Sub-Committee of the Investment Committee (2006-2020) and Director or Trustee of various Morgan Stanley Funds (since August 2006); President, Cedarwood Associates (mutual fund and investment management consulting) (since July 2006); formerly, Senior Managing Director of Victory Capital Management (1993-2006). | | | 86 | | | Board Member, University of Albany Foundation (2012-present); Board Member, Mutual Funds Directors Forum (2014-present); Director of various non-profit organizations. | |
39
Morgan Stanley Institutional Fund Trust
Annual Report — September 30, 2023
Trustees and Officers Information (unaudited) (cont'd)
Independent Trustees: (cont'd)
Name, Address and Birth Year
of Independent Trustee | | Position(s)
Held with
Registrant | | Length of Time
Served* | | Principal Occupation(s) During Past 5 Years
and Other Relevant Professional Experience | | Number of
Funds in
Fund Complex
Overseen by
Independent
Trustee** | | Other Directorships
Held by Independent
Trustee During
Past 5 Years*** | |
Nancy C. Everett
c/o Perkins Coie LLP
Counsel to the Independent
Trustees
1155 Avenue of the Americas
22nd Floor
New York, NY 10036
Birth Year: 1955 | | Trustee | | Since
January
2015 | | Chairperson of the Equity Investment Committee (since January 2021); Director or Trustee of various Morgan Stanley Funds (since January 2015); Chief Executive Officer, Virginia Commonwealth University Investment Company (since November 2015); Owner, OBIR, LLC (institutional investment management consulting) (since June 2014); formerly, Managing Director, BlackRock, Inc. (February 2011-December 2013) and Chief Executive Officer, General Motors Asset Management (a/k/a Promark Global Advisors, Inc.) (June 2005-May 2010). | | | 87 | | | Formerly, Member of Virginia Commonwealth University School of Business Foundation (2005-2016); Member of Virginia Commonwealth University Board of Visitors (2013-2015); Member of Committee on Directors for Emerging Markets Growth Fund, Inc. (2007-2010); Chairperson of Performance Equity Management, LLC (2006-2010); and Chairperson, GMAM Absolute Return Strategies Fund, LLC (2006-2010). | |
Eddie A. Grier
c/o Perkins Coie LLP
Counsel to the Independent
Trustees
1155 Avenue of the Americas
22nd Floor
New York, NY 10036
Birth Year: 1955 | | Trustee | | Since
February
2022 | | Dean, Santa Clara University Leavey School of Business (since July 2021); Dean, Virginia Commonwealth University School of Business (2010-2021); President and various other roles, Walt Disney Company (entertainment and media) (1981-2010). | | | 87 | | | Director, Witt/Keiffer, Inc. (executive search) (since 2016); Director, NuStar GP, LLC (energy) (since August 2021); Director, Sonida Senior Living, Inc. (residential community operator) (2016-2021); Director, NVR, Inc. (homebuilding) (2013-2020); Director, Middleburg Trust Company (wealth management) (2014-2019); Director, Colonial Williamsburg Company (2012-2021); Regent, University of Massachusetts Global (since 2021); Director and Chair, ChildFund International (2012-2021); Trustee, Brandman University (2010-2021); Director, Richmond Forum (2012-2019). | |
40
Morgan Stanley Institutional Fund Trust
Annual Report — September 30, 2023
Trustees and Officers Information (unaudited) (cont'd)
Independent Trustees: (cont'd)
Name, Address and Birth Year
of Independent Trustee | | Position(s)
Held with
Registrant | | Length of Time
Served* | | Principal Occupation(s) During Past 5 Years
and Other Relevant Professional Experience | | Number of
Funds in
Fund Complex
Overseen by
Independent
Trustee** | | Other Directorships
Held by Independent
Trustee During
Past 5 Years*** | |
Jakki L. Haussler
c/o Perkins Coie LLP
Counsel to the Independent
Trustees
1155 Avenue of the Americas
22nd Floor
New York, NY 10036
Birth Year: 1957 | | Trustee | | Since
January
2015 | | Chairperson of the Audit Committee (since January 2023) and Director or Trustee of various Morgan Stanley Funds (since January 2015); Chairman, Opus Capital Group (since 1996); formerly, Chief Executive Officer, Opus Capital Group (1996-2019); Director, Capvest Venture Fund, LP (May 2000-December 2011); Partner, Adena Ventures, LP (July 1999-December 2010); Director, The Victory Funds (February 2005-July 2008). | | | 87 | | | Director, Vertiv Holdings Co. (VRT) (since August 2022); Director of Cincinnati Bell Inc. and Member, Audit Committee and Chairman, Governance and Nominating Committee (2008-2021); Director of Service Corporation International and Member, Audit Committee and Investment Committee; Director, Barnes Group Inc. (since July 2021); Director of Northern Kentucky University Foundation and Member, Investment Committee; Member of Chase College of Law Center for Law and Entrepreneurship Board of Advisors; Director of Best Transport (2005-2019); Director of Chase College of Law Board of Visitors; formerly, Member, University of Cincinnati Foundation Investment Committee. | |
Dr. Manuel H. Johnson
c/o Johnson Smick
International, Inc.
220 I Street, NE
Suite 200
Washington, D.C. 20002
Birth Year: 1949 | | Trustee | | Since
July
1991 | | Senior Partner, Johnson Smick International, Inc. (consulting firm); Chairperson of the Fixed Income, Liquidity and Alternatives Investment Committee (since January 2021), Chairperson of the Investment Committee (2006-2020) and Director or Trustee of various Morgan Stanley Funds (since July 1991); Co-Chairman and a founder of the Group of Seven Council (G7C) (international economic commission); formerly, Chairperson of the Audit Committee (July 1991-September 2006); Vice Chairman of the Board of Governors of the Federal Reserve System and Assistant Secretary of the U.S. Treasury. | | | 86 | | | Director of NVR, Inc. (home construction). | |
41
Morgan Stanley Institutional Fund Trust
Annual Report — September 30, 2023
Trustees and Officers Information (unaudited) (cont'd)
Independent Trustees: (cont'd)
Name, Address and Birth Year
of Independent Trustee | | Position(s)
Held with
Registrant | | Length of Time
Served* | | Principal Occupation(s) During Past 5 Years
and Other Relevant Professional Experience | | Number of
Funds in
Fund Complex
Overseen by
Independent
Trustee** | | Other Directorships
Held by Independent
Trustee During
Past 5 Years*** | |
Joseph K. Kearns
c/o Perkins Coie LLP
Counsel to the Independent
Trustees
1155 Avenue of the Americas
22nd Floor
New York, NY 10036
Birth Year: 1942 | | Trustee | | Since
August
1994 | | Senior Adviser, Kearns & Associates LLC (investment consulting); Chairperson of the Audit Committee (2006-2022) and Director or Trustee of various Morgan Stanley Funds (since August 1994); formerly, Deputy Chairperson of the Audit Committee (July 2003-September 2006); CFO of the J. Paul Getty Trust (1982-1999). | | | 87 | | | Director, Rubicon Investments (since February 2019); Prior to August 2016, Director of Electro Rent Corporation (equipment leasing); Prior to December 31, 2013, Director of The Ford Family Foundation. | |
Michael F. Klein
c/o Perkins Coie LLP
Counsel to the Independent
Trustees
1155 Avenue of the Americas
22nd Floor
New York, NY 10036
Birth Year: 1958 | | Trustee | | Since
August
2006 | | Chairperson of the Risk Committee (since January 2021); Managing Director, Aetos Alternatives Management, LP (since March 2000); Co-President, Aetos Alternatives Management, LP (since January 2004) and Co-Chief Executive Officer of Aetos Alternatives Management, LP (since August 2013); Chairperson of the Fixed Income Sub-Committee of the Investment Committee (2006-2020) and Director or Trustee of various Morgan Stanley Funds (since August 2006); formerly, Managing Director, Morgan Stanley & Co. Inc. and Morgan Stanley Dean Witter Investment Management and President, various Morgan Stanley Funds (June 1998-March 2000); Principal, Morgan Stanley & Co. Inc. and Morgan Stanley Dean Witter Investment Management (August 1997-December 1999). | | | 86 | | | Director of certain investment funds managed or sponsored by Aetos Alternatives Management, LP; Director of Sanitized AG and Sanitized Marketing AG (specialty chemicals). | |
Patricia A. Maleski
c/o Perkins Coie LLP
Counsel to the Independent
Trustees
1155 Avenue of the Americas
22nd Floor
New York, NY 10036
Birth Year: 1960 | | Trustee | | Since
January
2017 | | Director or Trustee of various Morgan Stanley Funds (since January 2017); Managing Director, JPMorgan Asset Management (2004-2016); Oversight and Control Head of Fiduciary and Conflicts of Interest Program (2015-2016); Chief Control Officer—Global Asset Management (2013-2015); President, JPMorgan Funds (2010-2013); Chief Administrative Officer (2004-2013); various other positions including Treasurer and Board Liaison (since 2001). | | | 87 | | | Trustee (since January 2022) and Treasurer (since January 2023), Nutley Family Service Bureau, Inc. | |
W. Allen Reed
c/o Perkins Coie LLP
Counsel to the Independent
Trustees
1155 Avenue of the Americas
22nd Floor
New York, NY 10036
Birth Year: 1947 | | Chair of the Board and Trustee | | Chair of the Board since August 2020 and Trustee since August 2006 | | Chair of the Boards of various Morgan Stanley Funds (since August 2020); Director or Trustee of various Morgan Stanley Funds (since August 2006); formerly, Vice Chair of the Boards of various Morgan Stanley Funds (January 2020-August 2020); President and Chief Executive Officer of General Motors Asset Management; Chairman and Chief Executive Officer of the GM Trust Bank and Corporate Vice President of General Motors Corporation (August 1994-December 2005). | | | 86 | | | Formerly, Director of Legg Mason, Inc. (2006-2019); and Director of the Auburn University Foundation (2010-2015). | |
* This is the earliest date the Trustee began serving the Morgan Stanley Funds. Each Trustee serves an indefinite term, until his or her successor is elected.
** The Fund Complex includes (as of December 31, 2022) all open-end and closed-end funds (including all of their portfolios) advised by Morgan Stanley Investment Management Inc. (the "Adviser") and any funds that have an adviser that is an affiliated person of the Adviser (including, but not limited to, Morgan Stanley AIP GP LP).
*** This includes any directorships at public companies and registered investment companies held by the Trustees at any time during the past five years.
42
Morgan Stanley Institutional Fund Trust
Annual Report — September 30, 2023
Trustees and Officers Information (unaudited) (cont'd)
Executive Officers:
Name, Address and Birth Year
of Executive Officer | | Position(s) Held
with
Registrant | | Length of
Time Served* | | Principal Occupation(s) During Past 5 Years | |
John H. Gernon
522 Fifth Avenue
New York, NY 10036
Birth Year: 1963 | | President and Principal Executive Officer | | Since
September
2013 | | President and Principal Executive Officer of the Equity and Fixed Income Funds and the Morgan Stanley AIP Funds (since September 2013) and the Liquidity Funds and various money market funds (since May 2014) in the Fund Complex; Managing Director of the Adviser. | |
Deidre A. Downes
1633 Broadway
New York, NY 10019
Birth Year: 1977 | | Chief Compliance Officer | | Since
November
2021 | | Executive Director of the Adviser (since January 2021) and Chief Compliance Officer of various Morgan Stanley Funds (since November 2021). Formerly, Vice President and Corporate Counsel at PGIM and Prudential Financial (October 2016-December 2020). | |
Francis J. Smith
522 Fifth Avenue
New York, NY 10036
Birth Year: 1965 | | Treasurer and Principal Financial Officer | | Treasurer since July 2003 and Principal Financial Officer since September
2002 | | Managing Director of the Adviser and various entities affiliated with the Adviser; Treasurer (since July 2003) and Principal Financial Officer of various Morgan Stanley Funds (since September 2002). | |
Mary E. Mullin
1633 Broadway
New York, NY 10019
Birth Year: 1967 | | Secretary | | Since
June
1999 | | Managing Director of the Adviser; Secretary of various Morgan Stanley Funds (since June 1999). | |
Michael J. Key
522 Fifth Avenue
New York, NY 10036
Birth Year: 1979 | | Vice President | | Since
June
2017 | | Vice President of the Equity and Fixed Income Funds, Liquidity Funds, various money market funds and the Morgan Stanley AIP Funds in the Fund Complex (since June 2017); Managing Director of the Adviser; Head of Product Development for Equity and Fixed Income Funds (since August 2013). | |
The Fund's statement of additional information includes further information about the Fund's Trustees and Officers, and is available without charge by visiting www.morganstanley.com/im or upon request by calling 1 (800) 869-6397.
* This is the earliest date the officer began serving the Morgan Stanley Funds. Each officer serves an indefinite term, until his or her successor is elected.
43
Morgan Stanley Institutional Fund Trust
Annual Report — September 30, 2023
Adviser and Administrator
Morgan Stanley Investment Management Inc.
522 Fifth Avenue
New York, New York 10036
Distributor
Morgan Stanley Distribution, Inc.
522 Fifth Avenue
New York, New York 10036
Dividend Disbursing and Transfer Agent
SS&C Global Investor & Distribution Solutions, Inc.
P.O. Box 219804
Kansas City, Missouri 64121-9804
Co-Transfer Agent
Eaton Vance Management
Two International Place
Boston, Massachusetts 02110
Custodian
State Street Bank and Trust Company
One Congress Street
Boston, Massachusetts 02114
Legal Counsel
Dechert LLP
1095 Avenue of the Americas
New York, New York 10036
Counsel to the Independent Trustees
Perkins Coie LLP
1155 Avenue of the Americas,
22nd Floor
New York, New York 10036
Independent Registered Public Accounting Firm
Ernst & Young LLP
200 Clarendon Street
Boston, Massachusetts 02116
44
(This page has been left blank intentionally.)
Printed in U.S.A.
This Report has been prepared for shareholders and may be distributed to others only if preceded or accompanied by a current prospectus.
Morgan Stanley Investment Management Inc.
522 Fifth Avenue
New York, New York 10036
© 2023 Morgan Stanley. Morgan Stanley Distribution, Inc.

IFTMCGANN
6045085 EXP 11.30.24

Morgan Stanley Institutional Fund Trust
Dynamic Value Portfolio
Annual Report
September 30, 2023

Morgan Stanley Institutional Fund Trust
Annual Report — September 30, 2023
Table of Contents (unaudited)
Shareholders' Letter | | | 2 | | |
Expense Example | | | 3 | | |
Investment Overview | | | 4 | | |
Portfolio of Investments | | | 7 | | |
Statement of Assets and Liabilities | | | 12 | | |
Statement of Operations | | | 13 | | |
Statements of Changes in Net Assets | | | 14 | | |
Financial Highlights | | | 15 | | |
Notes to Financial Statements | | | 19 | | |
Report of Independent Registered Public Accounting Firm | | | 27 | | |
Investment Advisory Agreement Approval | | | 28 | | |
Liquidity Risk Management Program | | | 30 | | |
Federal Income Tax | | | 31 | | |
Important Notices | | | 32 | | |
U.S. Customer Privacy Notice | | | 33 | | |
Trustees and Officers Information | | | 36 | | |
This report is authorized for distribution only when preceded or accompanied by a prospectus or summary prospectus of the applicable Fund of the Morgan Stanley Institutional Fund Trust. To receive a prospectus and/or statement of additional information ("SAI"), which contains more complete information such as investment objectives, charges, expenses, policies for voting proxies, risk considerations and describes in detail each of the Fund's investment policies to the prospective investor, please call toll free 1 (800) 869-6397. Please read the prospectuses carefully before you invest or send money.
Additionally, you can access information about the Fund, including performance, characteristics and investment team commentary through Morgan Stanley Investment Management's website: www.morganstanley.com/im.
Market forecasts provided in this report may not necessarily come to pass. There is no guarantee that any sectors mentioned will continue to perform as discussed herein or that securities in such sectors will be held by the Fund in the future. There is no assurance that a fund will achieve its investment objective. Funds are subject to market risk, which is the possibility that market values of securities owned by the Fund will decline and, therefore, the value of the Fund's shares may be less than what you paid for them. Accordingly, you can lose money investing in this Fund. Please see the prospectus for more complete information on investment risks.
1
Morgan Stanley Institutional Fund Trust
Annual Report — September 30, 2023
Shareholders' Letter (unaudited)
Dear Shareholders,
We are pleased to provide this Annual Report, in which you will learn how your investment in Dynamic Value Portfolio (the "Fund") performed during the latest twelve-month period.
Morgan Stanley Investment Management is a client-centric, investor-led organization. Our global presence, intellectual capital, and breadth of products and services enable us to partner with investors to meet the evolving challenges of today's financial markets. We aim to deliver superior investment service and to empower our clients to make the informed decisions that help them reach their investment goals.
As always, we thank you for selecting Morgan Stanley Investment Management, and look forward to working with you in the months and years ahead.
Sincerely,

John H. Gernon
President and Principal Executive Officer
October 2023
2
Morgan Stanley Institutional Fund Trust
Annual Report — September 30, 2023
Expense Example (unaudited)
Dynamic Value Portfolio
As a shareholder of the Fund, you may incur two types of costs: (1) transactional costs, including sales charge (loads) on purchase payments; and (2) ongoing costs, which may include advisory fees, administration fees, distribution and shareholder services fees; and other Fund expenses. This example is intended to help you understand your ongoing costs (in dollars) of investing in the Fund and to compare these costs with the ongoing costs of investing in other mutual funds.
This example is based on an investment of $1,000 invested at the beginning of the six-month period ended September 30, 2023 and held for the entire six-month period.
Actual Expenses
The table below provides information about actual account values and actual expenses. You may use the information in this table, together with the amount you invested, to estimate the expenses that you paid over the period. Simply divide your account value by $1,000 (for example, an $8,600 account value divided by $1,000 = 8.6), then multiply the result by the number in the table under the heading entitled "Actual Expenses Paid During Period" to estimate the expenses you paid on your account during this period.
Hypothetical Example for Comparison Purposes
The table below provides information about hypothetical account values and hypothetical expenses based on the Fund's actual expense ratio and an assumed rate of return of 5% per year before expenses, which is not the Fund's actual return. The hypothetical account values and expenses may not be used to estimate the actual ending account balance or expenses you paid for the period. You may use this information to compare the ongoing costs of investing in the Fund and other funds. To do so, compare this 5% hypothetical example with the 5% hypothetical examples that appear in the shareholder reports of the other funds.
Please note that the expenses shown in the table are meant to highlight your ongoing costs only and do not reflect any transactional costs, such as sales charges (loads, if applicable). Therefore, the information for each class in the table is useful in comparing ongoing costs only, and will not help you determine the relative total costs of owning different funds. In addition, if these transactional costs were included, your costs would have been higher.
| | | Beginning
Account
Value
4/1/23 | | Actual Ending
Account
Value
9/30/23 | | Hypothetical
Ending Account
Value | | Actual
Expenses
Paid
During
Period* | | Hypothetical
Expenses Paid
During Period* | | Net
Expense
Ratio
During
Period** | |
Dynamic Value Portfolio Class I | | $ | 1,000.00 | | | $ | 1,020.90 | | | $ | 1,022.21 | | | $ | 2.89 | | | $ | 2.89 | | | | 0.57 | % | |
Dynamic Value Portfolio Class A | | | 1,000.00 | | | | 1,019.00 | | | | 1,020.51 | | | | 4.61 | | | | 4.61 | | | | 0.91 | | |
Dynamic Value Portfolio Class C | | | 1,000.00 | | | | 1,015.10 | | | | 1,016.80 | | | | 8.34 | | | | 8.34 | | | | 1.65 | | |
Dynamic Value Portfolio Class R6 | | | 1,000.00 | | | | 1,020.90 | | | | 1,022.61 | | | | 2.48 | | | | 2.48 | | | | 0.49 | | |
* Expenses are calculated using each Fund Class' annualized net expense ratio (as disclosed), multiplied by the average account value over the period and multiplied by 183/365 (to reflect the most recent one-half year period).
** Annualized.
3
Morgan Stanley Institutional Fund Trust
Annual Report — September 30, 2023
Investment Overview (unaudited)
Dynamic Value Portfolio
The Fund seeks capital appreciation.
Performance
For the fiscal year ended September 30, 2023, the Fund's Class I shares had a total return based on net asset value and reinvestment of distributions per share of 14.30%, net of fees. The Fund's Class I shares underperformed the Fund's benchmark, the Russell 1000® Value Index (the "Index"), which returned 14.44%.
Factors Affecting Performance
• During the period under review, the portfolio held an average overweight in a basket of Value stocks and underweight in a basket of Anti-Value stocks.(i) Value underperformed Growth (which shares characteristics with our Anti-Value portfolio of stocks) over this time period, with the Russell 1000® Value Index increasing +14.4%, and the Russell 1000® Growth Index returning +27.7%.(ii)
• The portfolio's dynamic overweight in a portfolio of Value stocks and underweight in a portfolio of Anti-Value stocks contributed to performance during the period whereas security selection versus the benchmark detracted from performance.
• Increasingly oversold sentiment and extremely bearish positioning caused markets to bottom at the start of the period, setting equity markets up for a reversal of the preceding bear market. As several economic reports highlighted a more resilient economy than expected, investors started to abandon their expectations of an inevitable recession and turned optimistic that a soft landing might still be achieved in the U.S. and globally. Although significant turmoil in the U.S. regional banking sector caused the equity market to give back some its gains in March 2023, the rally resumed in May 2023 after reports of soaring demand for artificial intelligence (AI)
semiconductors, which sparked investors' excitement surrounding AI's potential to increase economic productivity. The market rally cooled off again over the summer through the end of the reporting period as investors worried that central banks might be forced to keep policy rates higher for longer in response to a stronger-than-expected economy, thereby increasing the odds of tipping the economy into recession.
• Within equities (MSCI All Country World Index), technology-heavy sectors such as information technology (+34.7%), communication services (+27.6%) and consumer discretionary (+15.4%) saw the biggest gains, while defensive sectors such as utilities (–2.7%) and staples (+5.9%) lagged. Within developed markets, the U.S. (S&P 500 Index +21.6%) underperformed Europe and Japan (MSCI Europe Index +28.8%, MSCI Japan Index +25.9%), supported by a weaker U.S. dollar, falling energy prices helping to avert a recession in Europe, and the era of deflation coming to an end in Japan.(iii)
• In light of stickier-than-expected core inflation readings across developed market countries, investors increased their bets that the Federal Reserve (Fed) and the European Central Bank (ECB) would be forced to raise rates higher and keep them there for longer. After completing 225 basis points (bps)(iv) and 325 bps of rate hikes, respectively, during the 12-month period, both the Fed and the ECB signaled a likely pause at current levels but left the door open for potential further rate hikes should inflation not progress toward target (2%) as planned.
Management Strategies
• Following the recent signals of a more resilient economy, the consensus has shifted toward accepting a soft-landing scenario as its new base case, suggesting hopes for the start of a new bull
(i) The Global Multi-Asset (GMA) Team identifies Value as the cheapest 20% and Anti-Value as the most expensive 20% of stocks for each industry group within the Russell 1000® Index universe based on six valuation metrics, including forward price-to-earnings (P/E) ratio and free cash flow yield.
(ii) The Russell 1000® Growth Index is an index that measures the performance of those Russell 1000 companies with higher price-to-book ratios and higher forecasted growth values. The index is unmanaged and does not include any expenses, fees or sales charges. It is not possible to invest directly in an index.
(iii) The MSCI All Country World Index (ACWI) is a free float-adjusted market capitalization weighted index designed to measure the equity market performance of developed and emerging markets. The S&P 500® Index measures the performance of the large-cap segment of the U.S. equities market,
covering approximately 80% of the U.S. equities market. The Index includes 500 leading companies in leading industries of the U.S. economy. The S&P Index is one of the most widely used benchmarks of U.S. equity performance. The MSCI Europe Index is a free float-adjusted market capitalization index that is designed to measure developed market equity performance in Europe. The MSCI Japan Index is a free-floated adjusted market capitalization weighted index that is designed to track the equity market performance of Japanese securities listed on the Tokyo Stock Exchange, Osaka Stock Exchange, JASDAQ and Nagoya Stock Exchange. The term "free float" represents the portion of shares outstanding that are deemed to be available for purchase in the public equity markets by investors. The performance of the MSCI indexes are listed in U.S. dollars and assume reinvestment of net dividends.
(iv) One basis point = 0.01%
4
Morgan Stanley Institutional Fund Trust
Annual Report — September 30, 2023
Investment Overview (unaudited) (cont'd)
Dynamic Value Portfolio
market. We disagree with this narrative and continue to anticipate a near-term recession. We believe that the Fed has only recently achieved a tight monetary policy setting, which will take a few more months to impact the real economy. Additionally, household excess savings have fallen from a high of $2.1 trillion during the pandemic to just $0.7 trillion and are likely to run out by year-end.(v) These factors in combination with extreme valuations in U.S. markets make it unlikely, in our view, that a new bull market is underway as bull markets generally start at the beginning of economic expansions at depressed valuations.
• However, we do believe that Value's structural bull market remains intact and are convinced that Value is likely to outperform Anti-Value over the next several years. Recently, positive trends have been re-established, and we are maintaining trading discipline in a theme we believe has very attractive return potential. In the U.S., Value has outperformed Anti-Value (i.e., the most expensive quintile of stocks) by +71% since its low in April 2020.(vi) Nonetheless, Value remains nearly as cheap as in late 2000 and continues to look attractive relative to Anti-Value. On our composite measure of valuation, relative to Anti-Value, Value stocks trade at a 74% discount to fair value compared to a 58% discount historically.(vii) Despite the recent outperformance, Value stocks still trade at only 9x forward earnings, with Anti-Value stocks at 31x.(vii) The likely drivers toward normalization continue to be above-target inflation and higher interest rates, which we believe could be favorable for Value stocks' fundamentals as well as their valuations relative to longer-duration Anti-Value stocks.
(v) Source: MSIM Global Multi-Asset Team analysis, FactSet, Haver Analytics as of August 25, 2023.
(vi) The index performance is provided for illustrative purposes only and is not meant to depict the performance of a specific investment. Past performance is no guarantee of future results.
(vii) Source: FactSet, MSIM Global Multi-Asset Team analysis.
5
Morgan Stanley Institutional Fund Trust
Annual Report — September 30, 2023
Investment Overview (unaudited) (cont'd)
Dynamic Value Portfolio

* Minimum Investment
** Commenced operations on March 19, 2021.
In accordance with SEC regulations, the Fund's performance shown assumes that all recurring fees (including management fees) were deducted and all dividends and distributions were reinvested. The performance of Class A, Class C and Class R6 shares will vary from the performance of Class I shares and will be negatively impacted and will be negatively impacted by additional fees assessed to those classes (where applicable).
Performance Compared to the Russell 1000® Value Index(1) and the Lipper Mid-Cap Value Funds Index(2)
| | | Period Ended September 30, 2023
Total Returns(3) | |
| | | One
Year | | Five
Years | | Ten
Years | | Since
Inception(5) | |
Fund — Class I Shares
w/o sales charges(4) | | | 14.30 | % | | | — | | | | — | | | | 4.08 | % | |
Fund — Class A Shares
w/o sales charges(4) | | | 13.96 | | | | — | | | | — | | | | 3.68 | | |
Fund — Class A Shares with
maximum 5.25% sales charges(4) | | | 7.98 | | | | — | | | | — | | | | 1.52 | | |
Fund — Class C Shares
w/o sales charges(4) | | | 13.31 | | | | — | | | | — | | | | 3.02 | | |
Fund — Class C Shares with
maximum 1.00% deferred
sales charges(4) | | | 12.31 | | | | — | | | | — | | | | 3.02 | | |
Fund — Class R6 Shares
w/o sales charges(4) | | | 14.43 | | | | — | | | | — | | | | 4.09 | | |
Russell 1000® Value Index | | | 14.44 | | | | — | | | | — | | | | 2.56 | | |
Lipper Mid-Cap Value Funds Index | | | 15.32 | | | | — | | | | — | | | | 2.14 | | |
Performance data quoted represents past performance, which is no guarantee of future results, and current performance may be lower or higher than the figures shown. Performance assumes that all dividends and distributions, if any, were reinvested. For the most recent month-end performance figures, please visit www.morganstanley.com/im. Investment returns and principal value will fluctuate so that Fund shares, when redeemed, may be worth more or less than their original cost. Total returns do not reflect the deduction of taxes that a shareholder would pay on Fund distributions or the redemption of Fund shares. Performance of share classes will vary due to differences in sales charges and expenses. The Fund returns are calculated based on the net asset value as of the last business day of the period.
(1) The Russell 1000® Value Index measures the performance of the large-cap value segment of the U.S. equity universe. It includes those Russell 1000 companies with lower price-to-book ratios and lower expected and historical growth rates. The Russell 1000® Index measures the performance of the largest 1000 U.S. companies representing approximately 98% of the investable U.S. equity market. The Index is unmanaged and its returns do not include any sales charges or fees. Such costs would lower performance. It is not possible to invest directly in an index.
(2) The Lipper Mid-Cap Value Funds Index is an equally weighted performance index of the largest qualifying funds (based on net assets) in the Lipper Mid-Cap Value Funds classification. The Index, which is adjusted for capital gains distributions and income dividends, is unmanaged and should not be considered an investment. There are currently 30 funds represented in this Index. As of the date of this report, the Fund was in the Lipper Mid-Cap Value Funds classification.
(3) Total returns for the Fund reflect expenses waived and/or reimbursed, if applicable, by the Adviser. Without such waivers and/or reimbursements, total returns would have been lower.
(4) Commenced operations on March 19, 2021.
(5) For comparative purposes, average annual since inception returns listed for the Indexes refer to the inception date of the Fund, not the inception of the Indexes.
6
Morgan Stanley Institutional Fund Trust
Annual Report — September 30, 2023
Portfolio of Investments
Dynamic Value Portfolio
| | | Shares | | Value
(000) | |
Common Stocks (95.1%) | |
Aerospace & Defense (1.0%) | |
Huntington Ingalls Industries, Inc. | | | 2,549 | | | $ | 521 | | |
Textron, Inc. | | | 8,675 | | | | 678 | | |
| | | | 1,199 | | |
Automobile Components (0.4%) | |
Phinia, Inc. (a) | | | 16,370 | | | | 439 | | |
Automobiles (0.7%) | |
Ford Motor Co. | | | 34,588 | | | | 429 | | |
General Motors Co. | | | 12,609 | | | | 416 | | |
| | | | 845 | | |
Banks (5.1%) | |
Citizens Financial Group, Inc. | | | 30,843 | | | | 827 | | |
Comerica, Inc. | | | 19,051 | | | | 792 | | |
KeyCorp | | | 82,662 | | | | 889 | | |
New York Community Bancorp, Inc. | | | 82,323 | | | | 933 | | |
Popular, Inc. | | | 14,482 | | | | 912 | | |
Western Alliance Bancorp | | | 19,906 | | | | 915 | | |
Zions Bancorp NA | | | 27,044 | | | | 944 | | |
| | | | 6,212 | | |
Biotechnology (2.0%) | |
Biogen, Inc. (a) | | | 3,156 | | | | 811 | | |
Gilead Sciences, Inc. | | | 10,791 | | | | 809 | | |
United Therapeutics Corp. (a) | | | 3,418 | | | | 772 | | |
| | | | 2,392 | | |
Broadline Retail (0.4%) | |
Macy's, Inc. | | | 19,397 | | | | 225 | | |
Nordstrom, Inc. | | | 14,760 | | | | 221 | | |
| | | | 446 | | |
Building Products (0.9%) | |
Builders FirstSource, Inc. (a) | | | 4,120 | | | | 513 | | |
Owens Corning | | | 4,460 | | | | 608 | | |
| | | | 1,121 | | |
Capital Markets (3.3%) | |
Affiliated Managers Group, Inc. | | | 4,583 | | | | 597 | | |
Bank of New York Mellon Corp. | | | 16,405 | | | | 700 | | |
Invesco Ltd. | | | 43,998 | | | | 639 | | |
State Street Corp. | | | 10,446 | | | | 699 | | |
Stifel Financial Corp. | | | 11,412 | | | | 701 | | |
Virtu Financial, Inc., Class A | | | 40,125 | | | | 693 | | |
| | | | 4,029 | | |
Chemicals (1.7%) | |
LyondellBasell Industries NV, Class A | | | 5,976 | | | | 566 | | |
Mosaic Co. | | | 14,067 | | | | 501 | | |
Olin Corp. | | | 10,034 | | | | 502 | | |
Westlake Corp. | | | 4,238 | | | | 528 | | |
| | | | 2,097 | | |
Construction & Engineering (0.4%) | |
MDU Resources Group, Inc. | | | 26,614 | | | | 521 | | |
| | | Shares | | Value
(000) | |
Consumer Finance (3.1%) | |
Ally Financial, Inc. | | | 25,370 | | | $ | 677 | | |
Capital One Financial Corp. | | | 6,436 | | | | 624 | | |
Discover Financial Services | | | 6,854 | | | | 594 | | |
OneMain Holdings, Inc. | | | 15,359 | | | | 616 | | |
SLM Corp. (a) | | | 44,626 | | | | 608 | | |
Synchrony Financial | | | 20,921 | | | | 639 | | |
| | | | 3,758 | | |
Consumer Staples Distribution & Retail (1.5%) | |
Kroger Co. | | | 14,327 | | | | 641 | | |
Performance Food Group Co. (a) | | | 11,266 | | | | 663 | | |
Walgreens Boots Alliance, Inc. | | | 22,687 | | | | 505 | | |
| | | | 1,809 | | |
Containers & Packaging (1.9%) | |
Berry Global Group, Inc. | | | 8,341 | | | | 517 | | |
Graphic Packaging Holding Co. | | | 23,176 | | | | 516 | | |
International Paper Co. | | | 16,666 | | | | 591 | | |
Westrock Co. | | | 17,486 | | | | 626 | | |
| | | | 2,250 | | |
Diversified Consumer Services (0.7%) | |
ADT, Inc. | | | 57,288 | | | | 344 | | |
H&R Block, Inc. | | | 10,917 | | | | 470 | | |
| | | | 814 | | |
Diversified REITs (0.9%) | |
Starwood Property Trust, Inc. REIT | | | 36,233 | | | | 701 | | |
WP Carey, Inc. REIT | | | 7,608 | | | | 412 | | |
| | | | 1,113 | | |
Diversified Telecommunication Services (1.3%) | |
AT&T, Inc. | | | 108,044 | | | | 1,623 | | |
Electric Utilities (2.9%) | |
Evergy, Inc. | | | 12,282 | | | | 623 | | |
Hawaiian Electric Industries, Inc. | | | 19,135 | | | | 236 | | |
OGE Energy Corp. (a) | | | 20,524 | | | | 684 | | |
PG&E Corp. (a) | | | 42,107 | | | | 679 | | |
Pinnacle West Capital Corp. | | | 8,795 | | | | 648 | | |
PPL Corp. | | | 26,960 | | | | 635 | | |
| | | | 3,505 | | |
Electrical Equipment (1.4%) | |
Acuity Brands, Inc. | | | 3,625 | | | | 617 | | |
Regal Beloit Corp. (a) | | | 3,814 | | | | 545 | | |
Sensata Technologies Holding PLC | | | 13,612 | | | | 515 | | |
| | | | 1,677 | | |
Electronic Equipment, Instruments & Components (1.8%) | |
Arrow Electronics, Inc. (a) | | | 3,859 | | | | 483 | | |
Avnet, Inc. | | | 11,271 | | | | 543 | | |
Jabil, Inc. | | | 4,814 | | | | 611 | | |
TD Synnex Corp. | | | 5,475 | | | | 547 | | |
| | | | 2,184 | | |
The accompanying notes are an integral part of the financial statements.
7
Morgan Stanley Institutional Fund Trust
Annual Report — September 30, 2023
Portfolio of Investments (cont'd)
Dynamic Value Portfolio
| | | Shares | | Value
(000) | |
Entertainment (0.2%) | |
Liberty Media Corp.-Liberty Live, Class A (a) | | | 3,961 | | | $ | 126 | | |
Liberty Media Corp.-Liberty Live, Class C (a) | | | 3,976 | | | | 128 | | |
| | | | 254 | | |
Financial Services (1.8%) | |
Corebridge Financial, Inc. | | | 38,546 | | | | 761 | | |
MGIC Investment Corp. | | | 44,180 | | | | 738 | | |
New Residential Investment Corp. REIT | | | 72,435 | | | | 673 | | |
| | | | 2,172 | | |
Food Products (4.1%) | |
Archer-Daniels-Midland Co. | | | 8,810 | | | | 664 | | |
Bunge Ltd. | | | 6,879 | | | | 745 | | |
Conagra Brands, Inc. | | | 22,373 | | | | 613 | | |
Kraft Heinz Co. | | | 20,427 | | | | 687 | | |
Post Holdings, Inc. (a) | | | 8,631 | | | | 740 | | |
Seaboard Corp. | | | 208 | | | | 781 | | |
Tyson Foods, Inc., Class A | | | 13,856 | | | | 700 | | |
| | | | 4,930 | | |
Gas Utilities (0.6%) | |
National Fuel Gas Co. (a) | | | 14,519 | | | | 754 | | |
Ground Transportation (1.7%) | |
Hertz Global Holdings, Inc. (a) | | | 31,164 | | | | 382 | | |
Ryder System, Inc. | | | 6,155 | | | | 658 | | |
U-Haul Holding Co. | | | 18,636 | | | | 996 | | |
| | | | 2,036 | | |
Health Care REITs (0.2%) | |
Medical Properties Trust, Inc. REIT | | | 53,224 | | | | 290 | | |
Health Care Equipment & Supplies (0.9%) | |
Integra LifeSciences Holdings Corp. (a) | | | 14,777 | | | | 564 | | |
QuidelOrtho Corp. (a) | | | 7,610 | | | | 556 | | |
| | | | 1,120 | | |
Health Care Providers & Services (5.0%) | |
Centene Corp. (a) | | | 9,562 | | | | 658 | | |
Cigna Group | | | 2,293 | | | | 656 | | |
CVS Health Corp. | | | 8,851 | | | | 618 | | |
DaVita, Inc. (a) | | | 6,566 | | | | 621 | | |
Elevance Health, Inc. | | | 1,409 | | | | 613 | | |
Henry Schein, Inc. (a) | | | 8,401 | | | | 624 | | |
Laboratory Corp. of America Holdings | | | 3,048 | | | | 613 | | |
Premier, Inc., Class A | | | 24,418 | | | | 525 | | |
Tenet Healthcare Corp. (a) | | | 8,724 | | | | 575 | | |
Universal Health Services, Inc., Class B | | | 4,500 | | | | 566 | | |
| | | | 6,069 | | |
Hotel & Resort REITs (0.9%) | |
Host Hotels & Resorts, Inc. REIT | | | 31,666 | | | | 509 | | |
Park Hotels & Resorts, Inc. REIT | | | 42,592 | | | | 525 | | |
| | | | 1,034 | | |
Hotels, Restaurants & Leisure (1.4%) | |
Boyd Gaming Corp. (a) | | | 5,050 | | | | 307 | | |
Caesars Entertainment, Inc. (a) | | | 6,228 | | | | 289 | | |
Marriott Vacations Worldwide Corp. | | | 2,819 | | | | 284 | | |
| | | Shares | | Value
(000) | |
MGM Resorts International | | | 7,342 | | | $ | 270 | | |
Penn Entertainment, Inc. (a) | | | 11,700 | | | | 268 | | |
Travel & Leisure Co. | | | 8,778 | | | | 322 | | |
| | | | 1,740 | | |
Household Durables (1.4%) | |
Lennar Corp., Class B | | | 3,250 | | | | 332 | | |
Mohawk Industries, Inc. (a) | | | 3,344 | | | | 287 | | |
Newell Brands, Inc. | | | 37,615 | | | | 340 | | |
PulteGroup, Inc. | | | 4,539 | | | | 336 | | |
Toll Brothers, Inc. | | | 4,697 | | | | 347 | | |
| | | | 1,642 | | |
Household Products (0.8%) | |
Reynolds Consumer Products, Inc. | | | 37,566 | | | | 963 | | |
Independent Power & Renewable Electricity Producers (0.7%) | |
Vistra Corp. | | | 26,586 | | | | 882 | | |
Industrial Conglomerates (0.4%) | |
3M Co. | | | 5,313 | | | | 497 | | |
Information Technology Services (2.6%) | |
Accenture PLC, Class A | | | 1,126 | | | | 346 | | |
Akamai Technologies, Inc. (a) | | | 3,809 | | | | 406 | | |
Amdocs Ltd. | | | 3,729 | | | | 315 | | |
Cognizant Technology Solutions Corp., Class A | | | 5,245 | | | | 355 | | |
DXC Technology Co. (a) | | | 12,526 | | | | 261 | | |
EPAM Systems, Inc. (a) | | | 1,494 | | | | 382 | | |
GoDaddy, Inc., Class A (a) | | | 4,728 | | | | 352 | | |
International Business Machines Corp. | | | 2,543 | | | | 357 | | |
Kyndryl Holdings, Inc. (a) | | | 27,309 | | | | 412 | | |
| | | | 3,186 | | |
Insurance (3.9%) | |
American International Group, Inc. | | | 9,812 | | | | 595 | | |
CNA Financial Corp. | | | 15,145 | | | | 596 | | |
Fidelity National Financial, Inc. | | | 15,517 | | | | 641 | | |
Hartford Financial Services Group, Inc. | | | 7,920 | | | | 562 | | |
Loews Corp. | | | 9,667 | | | | 612 | | |
Principal Financial Group, Inc. | | | 7,079 | | | | 510 | | |
Reinsurance Group of America, Inc. (a) | | | 4,133 | | | | 600 | | |
Unum Group | | | 12,084 | | | | 594 | | |
| | | | 4,710 | | |
Life Sciences Tools & Services (0.6%) | |
Fortrea Holdings, Inc. (a) | | | 24,604 | | | | 703 | | |
Machinery (3.4%) | |
Agco Corp. | | | 4,259 | | | | 504 | | |
Allison Transmission Holdings, Inc. | | | 10,073 | | | | 595 | | |
| CNH Industrial NV | | | 37,481 | | | | 453 | | |
Cummins, Inc. | | | 2,281 | | | | 521 | | |
Gates Industrial Corp. PLC (a) | | | 43,659 | | | | 507 | | |
PACCAR, Inc. | | | 6,926 | | | | 589 | | |
The Middleby Corp. (a) | | | 4,014 | | | | 514 | | |
Timken Co. | | | 6,411 | | | | 471 | | |
| | | | 4,154 | | |
The accompanying notes are an integral part of the financial statements.
8
Morgan Stanley Institutional Fund Trust
Annual Report — September 30, 2023
Portfolio of Investments (cont'd)
Dynamic Value Portfolio
| | | Shares | | Value
(000) | |
Media (3.3%) | |
Charter Communications, Inc., Class A (a) | | | 1,259 | | | $ | 554 | | |
Comcast Corp., Class A | | | 11,603 | | | | 514 | | |
DISH Network Corp., Class A (a) | | | 65,758 | | | | 385 | | |
Fox Corp., Class A | | | 15,246 | | | | 476 | | |
Fox Corp., Class B | | | 16,241 | | | | 469 | | |
Interpublic Group of Cos., Inc. | | | 15,580 | | | | 447 | | |
Liberty Media Corp.-Liberty SiriusXM, Class A (a) | | | 15,850 | | | | 403 | | |
Liberty Media Corp.-Liberty SiriusXM, Class C (a) | | | 15,911 | | | | 405 | | |
Nexstar Media Group, Inc., Class A | | | 2,768 | | | | 397 | | |
| | | | 4,050 | | |
Metals & Mining (1.5%) | |
Cleveland-Cliffs, Inc. (a) | | | 32,178 | | | | 503 | | |
Steel Dynamics, Inc. | | | 5,367 | | | | 576 | | |
United States Steel Corp. | | | 22,205 | | | | 721 | | |
| | | | 1,800 | | |
Office REITs (1.6%) | |
Boston Properties, Inc. REIT | | | 8,616 | | | | 512 | | |
Cousins Properties, Inc. REIT | | | 23,030 | | | | 469 | | |
Highwoods Properties, Inc. REIT | | | 21,648 | | | | 446 | | |
Kilroy Realty Corp. REIT | | | 16,252 | | | | 514 | | |
| | | | 1,941 | | |
Oil, Gas & Consumable Fuels (7.4%) | |
EQT Corp. | | | 29,649 | | | | 1,203 | | |
HF Sinclair Corp. | | | 23,150 | | | | 1,318 | | |
Marathon Oil Corp. | | | 45,000 | | | | 1,204 | | |
Marathon Petroleum Corp. | | | 9,036 | | | | 1,367 | | |
Ovintiv, Inc. | | | 27,341 | | | | 1,301 | | |
Phillips 66 | | | 10,878 | | | | 1,307 | | |
Valero Energy Corp. | | | 9,244 | | | | 1,310 | | |
| | | | 9,010 | | |
Passenger Airlines (0.7%) | |
American Airlines Group, Inc. (a) | | | 33,107 | | | | 424 | | |
Delta Air Lines, Inc. | | | 12,210 | | | | 452 | | |
| | | | 876 | | |
Personal Care Products (0.4%) | |
Olaplex Holdings, Inc. (a) | | | 266,567 | | | | 520 | | |
Pharmaceuticals (5.0%) | |
Bristol-Myers Squibb Co. | | | 12,995 | | | | 754 | | |
Elanco Animal Health, Inc. (a) | | | 69,871 | | | | 785 | | |
Jazz Pharmaceuticals PLC (a) | | | 6,346 | | | | 822 | | |
Organon & Co. | | | 39,017 | | | | 677 | | |
Perrigo Co. PLC | | | 23,658 | | | | 756 | | |
Pfizer, Inc. | | | 22,261 | | | | 739 | | |
Royalty Pharma PLC, Class A (United Kingdom) | | | 27,021 | | | | 733 | | |
Viatris, Inc. | | | 79,707 | | | | 786 | | |
| | | | 6,052 | | |
Professional Services (1.8%) | |
Concentrix Corp. | | | 3,868 | | | | 310 | | |
Dun & Bradstreet Holdings, Inc. | | | 27,292 | | | | 273 | | |
Jacobs Solutions, Inc. | | | 2,603 | | | | 355 | | |
Leidos Holdings, Inc. | | | 3,584 | | | | 330 | | |
| | | Shares | | Value
(000) | |
ManpowerGroup, Inc. | | | 4,079 | | | $ | 299 | | |
Science Applications International Corp. | | | 2,794 | | | | 295 | | |
SS&C Technologies Holdings, Inc. | | | 5,292 | | | | 278 | | |
| | | | 2,140 | | |
Real Estate Management & Development (0.4%) | |
Jones Lang LaSalle, Inc. (a) | | | 2,924 | | | | 413 | | |
Residential REITs (0.4%) | |
Apartment Income Corp. REIT | | | 15,455 | | | | 474 | | |
Retail REITs (0.4%) | |
Spirit Realty Capital, Inc. REIT | | | 13,274 | | | | 445 | | |
Semiconductors & Semiconductor Equipment (3.1%) | |
Analog Devices, Inc. | | | 3,650 | | | | 639 | | |
Cirrus Logic, Inc. (a) | | | 9,119 | | | | 674 | | |
Microchip Technology, Inc. | | | 7,859 | | | | 613 | | |
MKS Instruments, Inc. | | | 6,904 | | | | 598 | | |
QUALCOMM, Inc. | | | 5,708 | | | | 634 | | |
Skyworks Solutions, Inc. | | | 6,324 | | | | 624 | | |
| | | | 3,782 | | |
Software (1.9%) | |
AppLovin Corp., Class A (a) | | | 12,394 | | | | 495 | | |
Dropbox, Inc., Class A (a) | | | 13,291 | | | | 362 | | |
Gen Digital, Inc. | | | 18,309 | | | | 324 | | |
Informatica, Inc. (a) | | | 19,037 | | | | 401 | | |
NCR Corp. (a) | | | 13,208 | | | | 356 | | |
Zoom Video Communications, Inc., Class A (a) | | | 5,082 | | | | 356 | | |
| | | | 2,294 | | |
Specialized REITs (0.4%) | |
EPR Properties REIT | | | 12,412 | | | | 516 | | |
Specialty Retail (1.5%) | |
Advance Auto Parts, Inc. | | | 4,427 | | | | 248 | | |
AutoNation, Inc. (a) | | | 2,087 | | | | 316 | | |
Lithia Motors, Inc., Class A | | | 1,070 | | | | 316 | | |
Penske Automotive Group, Inc. | | | 1,906 | | | | 319 | | |
Victoria's Secret & Co. (a) | | | 16,448 | | | | 274 | | |
Williams-Sonoma, Inc. (a) | | | 2,427 | | | | 377 | | |
| | | | 1,850 | | |
Tech Hardware, Storage & Peripherals (0.8%) | |
Hewlett Packard Enterprise Co. | | | 30,920 | | | | 537 | | �� |
HP, Inc. | | | 16,465 | | | | 423 | | |
| | | | 960 | | |
Textiles, Apparel & Luxury Goods (0.7%) | |
Capri Holdings, Ltd. (Virgin Islands, British) (a) | | | 10,465 | | | | 550 | | |
PVH Corp. | | | 4,440 | | | | 340 | | |
| | | | 890 | | |
Trading Companies & Distributors (1.8%) | |
Air Lease Corp. | | | 13,890 | | | | 547 | | |
Core & Main, Inc., Class A (a) | | | 18,669 | | | | 539 | | |
United Rentals, Inc. | | | 1,297 | | | | 577 | | |
WESCO International, Inc. | | | 3,390 | | | | 487 | | |
| | | | 2,150 | | |
Total Common Stocks (Cost $117,958) | | | 115,333 | | |
The accompanying notes are an integral part of the financial statements.
9
Morgan Stanley Institutional Fund Trust
Annual Report — September 30, 2023
Portfolio of Investments (cont'd)
Dynamic Value Portfolio
| | | Shares | | Value
(000) | |
Short-Term Investment (5.3%) | |
Investment Company (5.3%) | |
Morgan Stanley Institutional Liquidity
Funds — Government Portfolio —
Institutional Class (See Note G)
(Cost $6,500) | | | 6,500,414 | | | $ | 6,500 | | |
Total Investments (100.4%) (Cost $124,458) (b)(c) | | | 121,833 | | |
Liabilities in Excess of Other Assets (–0.4%) | | | (506 | ) | |
Net Assets (100.0%) | | $ | 121,327 | | |
(a) Non-income producing security.
(b) Securities are available for collateral in connection with purchase of swap agreements.
(c) At September 30, 2023, the aggregate cost for federal income tax purposes is approximately $127,784,000. The aggregate gross unrealized appreciation is approximately $8,116,000 and the aggregate gross unrealized depreciation is approximately $15,032,000, resulting in net unrealized depreciation of approximately $6,916,000.
REIT Real Estate Investment Trust.
Total Return Swap Agreements:
The Fund had the following total return swap agreements open at September 30, 2023:
Swap Counterparty | | Index | | Pay/Receive
Total Return
of Reference
Index | | Floating
Rate | | Payment
Frequency | | Maturity
Date | | Notional
Amount
(000) | | Value
(000) | | Upfront
Payment
Paid
(Received)
(000) | | Unrealized
Appreciation
(Depreciation)
(000) | |
JPMorgan Chase
Bank NA | | JPM
Russell 1000
Anti-Value
Index†† | | Receive | | SOFR + 0.15% | | Quarterly | | 7/29/24 | | $ | 19,184 | | | $ | 1,203 | | | $ | — | | | $ | 1,203 | | |
JPMorgan Chase
Bank NA | | JPM
Russell 1000
Anti-Value
Index†† | | Receive | | SOFR + 0.15% | | Quarterly | | 7/29/24 | | | 18,593 | | | | (57 | ) | | | — | | | | (57 | ) | |
JPMorgan Chase
Bank NA | | JPM
Russell 1000
Value
Index†† | | Pay | | SOFR + 0.15% | | Quarterly | | 7/29/24 | | | (6,459 | ) | | | (532 | ) | | | — | | | | (532 | ) | |
JPMorgan Chase
Bank NA | | JPM
Russell 1000
Value
Index†† | | Pay | | SOFR + 0.15% | | Quarterly | | 7/29/24 | | | (19,624 | ) | | | (1,461 | ) | | | — | | | | (1,461 | ) | |
JPMorgan Chase
Bank NA | | JPM
Russell 1000
Value
Index†† | | Pay | | SOFR + 0.15% | | Quarterly | | 7/29/24 | | | (18,425 | ) | | | (118 | ) | | | — | | | | (118 | ) | |
| | | | | | | | | | | | | | | $ | (965 | ) | | $ | — | | | $ | (965 | ) | |
†† See tables below for details of the equity basket holdings underlying the swap.
The following table represents the equity basket holdings underlying the total return swap with JPM Russell 1000 Anti-Value Index as of September 30, 2023:
Security Description | | Shares | | Value
(000) | | Index Weight | |
JPM Russell 1000 Anti-Value Index | |
Affirm Holdings, Inc. | | | 2,371 | | | $ | 50 | | | | 0.65 | % | |
Allstate Corp. | | | 384 | | | | 43 | | | | 0.55 | | |
Amazon.com, Inc. | | | 329 | | | | 42 | | | | 0.54 | | |
Apellis Pharmaceuticals, Inc. | | | 1,391 | | | | 53 | | | | 0.68 | | |
Aptargroup, Inc. | | | 352 | | | | 44 | | | | 0.57 | | |
Arista Networks, Inc. | | | 244 | | | | 45 | | | | 0.58 | | |
Arthur J Gallagher & Co. | | | 193 | | | | 44 | | | | 0.57 | | |
Atlassian Corp., Class A | | | 239 | | | | 48 | | | | 0.62 | | |
Axon Enterprise, Inc. | | | 238 | | | | 47 | | | | 0.61 | | |
Baker Hughes Co. | | | 1,189 | | | | 42 | | | | 0.54 | | |
Blackstone, Inc. | | | 406 | | | | 43 | | | | 0.56 | | |
Celsius Holdings, Inc. | | | 291 | | | | 50 | | | | 0.64 | | |
Security Description | | Shares | | Value
(000) | | Index Weight | |
JPM Russell 1000 Anti-Value Index (cont'd) | |
Ceridian Hcm Holding, Inc. | | | 619 | | | $ | 42 | | | | 0.54 | % | |
Costco Wholesale Corp. | | | 75 | | | | 42 | | | | 0.55 | | |
Coupang, Inc. | | | 2,503 | | | | 43 | | | | 0.55 | | |
Crowdstrike Holdings, Inc., Class A | | | 280 | | | | 47 | | | | 0.60 | | |
Eli Lilly & Co. | | | 93 | | | | 50 | | | | 0.64 | | |
Factset Research Systems, Inc. | | | 97 | | | | 42 | | | | 0.55 | | |
First Citizens BancShares, Inc.,
Class A | | | 31 | | | | 42 | | | | 0.54 | | |
Garmin Ltd. | | | 400 | | | | 42 | | | | 0.54 | | |
Hess Corp. | | | 288 | | | | 44 | | | | 0.57 | | |
Ionis Pharmaceuticals, Inc. | | | 1,066 | | | | 48 | | | | 0.62 | | |
Kinsale Capital Group, Inc. | | | 111 | | | | 46 | | | | 0.59 | | |
Lululemon Athletica, Inc. | | | 112 | | | | 43 | | | | 0.56 | | |
Manhattan Associates, Inc. | | | 220 | | | | 43 | | | | 0.56 | | |
Marsh & McLennan Companies, Inc. | | | 220 | | | | 42 | | | | 0.54 | | |
The accompanying notes are an integral part of the financial statements.
10
Morgan Stanley Institutional Fund Trust
Annual Report — September 30, 2023
Portfolio of Investments (cont'd)
Dynamic Value Portfolio
Security Description | | Shares | | Value
(000) | | Index Weight | |
JPM Russell 1000 Anti-Value Index (cont'd) | |
Mastercard, Inc., Class A | | | 106 | | | $ | 42 | | | | 0.54 | % | |
Mirati Therapeutics, Inc. | | | 1,384 | | | | 60 | | | | 0.78 | | |
New Fortress Energy, Inc. | | | 1,485 | | | | 49 | | | | 0.63 | | |
Old Dominion Freight Line | | | 107 | | | | 44 | | | | 0.57 | | |
Pinterest, Inc., Class A | | | 1,559 | | | | 42 | | | | 0.54 | | |
Roivant Sciences Ltd. | | | 3,946 | | | | 46 | | | | 0.59 | | |
Ryan Specialty Holdings, Inc. | | | 939 | | | | 45 | | | | 0.59 | | |
Saia, Inc. | | | 106 | | | | 42 | | | | 0.55 | | |
Sarepta Therapeutics, Inc. | | | 408 | | | | 49 | | | | 0.64 | | |
Schlumberger Ltd. | | | 736 | | | | 43 | | | | 0.55 | | |
Siteone Landscape Supply, Inc. | | | 255 | | | | 42 | | | | 0.54 | | |
Spotify Technology SA | | | 302 | | | | 47 | | | | 0.60 | | |
Targa Resources Corp. | | | 521 | | | | 45 | | | | 0.58 | | |
Technipfmc PLC | | | 2,334 | | | | 47 | | | | 0.61 | | |
Texas Pacific Land Corp. | | | 28 | | | | 51 | | | | 0.66 | | |
Tradeweb Markets, Inc., Class A | | | 573 | | | | 46 | | | | 0.59 | | |
Veeva Systems, Inc., Class A | | | 217 | | | | 44 | | | | 0.57 | | |
Verisk Analytics, Inc. | | | 179 | | | | 42 | | | | 0.55 | | |
Vornado Realty Trust | | | 2,043 | | | | 46 | | | | 0.60 | | |
Walmart, Inc. | | | 267 | | | | 43 | | | | 0.55 | | |
Welltower, Inc. | | | 512 | | | | 42 | | | | 0.54 | | |
Wingstop, Inc. | | | 231 | | | | 42 | | | | 0.54 | | |
Yeti Holdings, Inc. | | | 1,024 | | | | 49 | | | | 0.64 | | |
Zscaler, Inc. | | | 274 | | | | 43 | | | | 0.55 | | |
The following table represents the equity basket holdings underlying the total return swap with JPM Russell 1000 Value Index as of September 30, 2023:
Security Description | | Shares | | Value
(000) | | Index Weight | |
JPM Russell 1000 Value Index | |
Ally Financial, Inc. | | | 2,321 | | | $ | 62 | | | | 0.64 | % | |
Archer-Daniels-Midland Co. | | | 786 | | | | 59 | | | | 0.61 | | |
AT&T, Inc. | | | 11,639 | | | | 175 | | | | 1.80 | | |
Bank Of New York Mellon Corp. | | | 1,498 | | | | 64 | | | | 0.66 | | |
Biogen, Inc. | | | 293 | | | | 75 | | | | 0.78 | | |
Bristol-Myers Squibb Co. | | | 1,232 | | | | 72 | | | | 0.74 | | |
Bunge Ltd. | | | 623 | | | | 67 | | | | 0.70 | | |
Cirrus Logic, Inc. | | | 812 | | | | 60 | | | | 0.62 | | |
Citizens Financial Group, Inc. | | | 3,129 | | | | 84 | | | | 0.87 | | |
Comerica, Inc. | | | 1,934 | | | | 80 | | | | 0.83 | | |
Corebridge Financial, Inc. | | | 3,500 | | | | 69 | | | | 0.71 | | |
Elanco Animal Health, Inc. | | | 6,647 | | | | 75 | | | | 0.77 | | |
EQT Corp. | | | 3,002 | | | | 122 | | | | 1.26 | | |
Fortrea Holdings, Inc. | | | 2,327 | | | | 67 | | | | 0.69 | | |
Gilead Sciences, Inc. | | | 1,016 | | | | 76 | | | | 0.79 | | |
HF Sinclair Corp. | | | 2,374 | | | | 135 | | | | 1.39 | | |
Invesco Ltd. | | | 4,034 | | | | 59 | | | | 0.60 | | |
Jazz Pharmaceuticals PLC | | | 596 | | | | 77 | | | | 0.80 | | |
KeyCorp | | | 8,382 | | | | 90 | | | | 0.93 | | |
Kraft Heinz Co. | | | 1,843 | | | | 62 | | | | 0.64 | | |
Marathon Oil Corp. | | | 4,575 | | | | 122 | | | | 1.26 | | |
Marathon Petroleum Corp. | | | 923 | | | | 140 | | | | 1.44 | | |
MGIC Investment Corp. | | | 4,020 | | | | 67 | | | | 0.69 | | |
National Fuel Gas Co. | | | 1,311 | | | | 68 | | | | 0.70 | | |
New York Community Bancorp, Inc. | | | 8,130 | | | | 92 | | | | 0.95 | | |
OGE Energy Corp. | | | 1,866 | | | | 62 | | | | 0.64 | | |
Organon & Co. | | | 3,629 | | | | 63 | | | | 0.65 | | |
Security Description | | Shares | | Value
(000) | | Index Weight | |
JPM Russell 1000 Value Index (cont'd) | |
Ovintiv, Inc. | | | 2,787 | | | $ | 133 | | | | 1.37 | % | |
P G & E Corp. | | | 3,813 | | | | 62 | | | | 0.63 | | |
Perrigo Co. PLC | | | 2,216 | | | | 71 | | | | 0.73 | | |
Pfizer, Inc. | | | 2,115 | | | | 70 | | | | 0.72 | | |
Phillips 66 | | | 1,105 | | | | 133 | | | | 1.37 | | |
Pinnacle West Capital | | | 802 | | | | 59 | | | | 0.61 | | |
Popular, Inc. | | | 1,453 | | | | 92 | | | | 0.94 | | |
Post Holdings, Inc. | | | 780 | | | | 67 | | | | 0.69 | | |
Reynolds Consumer Products, Inc. | | | 3,746 | | | | 96 | | | | 0.99 | | |
Rithm Capital Corp. | | | 6,612 | | | | 61 | | | | 0.63 | | |
Royalty Pharma PLC, Class A | | | 2,522 | | | | 68 | | | | 0.71 | | |
Seaboard Corp. | | | 19 | | | | 71 | | | | 0.73 | | |
Starwood Property Trust, Inc. | | | 3,299 | | | | 64 | | | | 0.66 | | |
State Street Corp. | | | 951 | | | | 64 | | | | 0.66 | | |
Stifel Financial Corp. | | | 1,038 | | | | 64 | | | | 0.66 | | |
Tyson Foods, Inc., Class A | | | 1,246 | | | | 63 | | | | 0.65 | | |
United Therapeutics Corp. | | | 321 | | | | 73 | | | | 0.75 | | |
Valero Energy Corp. | | | 950 | | | | 135 | | | | 1.39 | | |
Viatris, Inc. | | | 7,552 | | | | 74 | | | | 0.77 | | |
Virtu Financial, Inc., Class A | | | 3,633 | | | | 63 | | | | 0.65 | | |
Vistra Corp. | | | 2,428 | | | | 81 | | | | 0.83 | | |
Western Alliance Bancorp | | | 2,034 | | | | 94 | | | | 0.96 | | |
Zions Bancorp | | | 2,719 | | | | 95 | | | | 0.98 | | |
USD — United States Dollar
Portfolio Composition
Classification | | Percentage of
Total Investments | |
Other* | | | 72.2 | % | |
Oil, Gas & Consumable Fuels | | | 7.4 | | |
Investment Company | | | 5.3 | | |
Banks | | | 5.1 | | |
Health Care Providers & Services | | | 5.0 | | |
Pharmaceuticals | | | 5.0 | | |
Total Investments | | | 100.0 | %** | |
* Industries and/or investment types representing less than 5% of total investments.
** Does not include open swap agreements with net unrealized depreciation of approximately $965,000.
The accompanying notes are an integral part of the financial statements.
11
Morgan Stanley Institutional Fund Trust
Annual Report — September 30, 2023
Statement of Assets and Liabilities | | September 30, 2023
(000) | |
Assets: | |
Investments in Securities of Unaffiliated Issuers, at Value (Cost $117,958) | | $ | 115,333 | | |
Investment in Security of Affiliated Issuer, at Value (Cost $6,500) | | | 6,500 | | |
Total Investments in Securities, at Value (Cost $124,458) | | | 121,833 | | |
Unrealized Appreciation on Swap Agreements | | | 1,203 | | |
Due from Broker | | | 780 | | |
Dividends Receivable | | | 171 | | |
Receivable from Affiliate | | | 33 | | |
Other Assets | | | 44 | | |
Total Assets | | | 124,064 | | |
Liabilities: | |
Unrealized Depreciation on Swap Agreements | | | 2,168 | | |
Payable to Bank | | | 441 | | |
Payable for Professional Fees | | | 66 | | |
Payable for Advisory Fees | | | 15 | | |
Payable for Administration Fees | | | 8 | | |
Payable for Custodian Fees | | | 8 | | |
Payable for Sub Transfer Agency Fees — Class I | | | 1 | | |
Payable for Sub Transfer Agency Fees — Class A | | | — | @ | |
Payable for Sub Transfer Agency Fees — Class C | | | — | @ | |
Payable for Transfer Agency Fees — Class I | | | — | @ | |
Payable for Transfer Agency Fees — Class A | | | — | @ | |
Payable for Transfer Agency Fees — Class C | | | — | @ | |
Payable for Transfer Agency Fees — Class R6 | | | — | @ | |
Payable for Shareholder Services Fees — Class A | | | — | @ | |
Payable for Distribution and Shareholder Services Fees — Class C | | | — | @ | |
Other Liabilities | | | 30 | | |
Total Liabilities | | | 2,737 | | |
Net Assets | | $ | 121,327 | | |
Net Assets Consist of: | |
Paid-in-Capital | | $ | 127,760 | | |
Total Accumulated Loss | | | (6,433 | ) | |
Net Assets | | $ | 121,327 | | |
CLASS I: | |
Net Assets | | $ | 9,387 | | |
| Shares Outstanding (unlimited number of shares authorized, no par value) (not in 000's) | | | 913,183 | | |
Net Asset Value, Offering and Redemption Price Per Share | | $ | 10.28 | | |
CLASS A: | |
Net Assets | | $ | 2,329 | | |
| Shares Outstanding (unlimited number of shares authorized, no par value) (not in 000's) | | | 228,071 | | |
Net Asset Value, Redemption Price Per Share | | $ | 10.21 | | |
Maximum Sales Load | | | 5.25 | % | |
Maximum Sales Charge | | $ | 0.57 | | |
Maximum Offering Price Per Share | | $ | 10.78 | | |
CLASS C: | |
Net Assets | | $ | 247 | | |
| Shares Outstanding (unlimited number of shares authorized, no par value) (not in 000's) | | | 24,464 | | |
Net Asset Value, Offering and Redemption Price Per Share | | $ | 10.08 | | |
CLASS R6: | |
Net Assets | | $ | 109,364 | | |
| Shares Outstanding (unlimited number of shares authorized, no par value) (not in 000's) | | | 10,635,735 | | |
Net Asset Value, Offering and Redemption Price Per Share | | $ | 10.28 | | |
@ Amount is less than $500.
The accompanying notes are an integral part of the financial statements.
12
Morgan Stanley Institutional Fund Trust
Annual Report — September 30, 2023
Statement of Operations | | Year Ended
September 30, 2023
(000) | |
Investment Income: | |
Dividends from Securities of Unaffiliated Issuers (Net of $3 of Foreign Taxes Withheld) | | $ | 3,254 | | |
Dividends from Security of Affiliated Issuer (Note G) | | | 342 | | |
Total Investment Income | | | 3,596 | | |
Expenses: | |
Advisory Fees (Note B) | | | 423 | | |
Professional Fees | | | 204 | | |
Administration Fees (Note C) | | | 97 | | |
Registration Fees | | | 73 | | |
Custodian Fees (Note F) | | | 43 | | |
Shareholder Services Fees — Class A (Note D) | | | 7 | | |
Distribution and Shareholder Services Fees — Class C (Note D) | | | 12 | | |
Shareholder Reporting Fees | | | 18 | | |
Pricing Fees | | | 14 | | |
Transfer Agency Fees — Class I (Note E) | | | 3 | | |
Transfer Agency Fees — Class A (Note E) | | | 3 | | |
Transfer Agency Fees — Class C (Note E) | | | 3 | | |
Transfer Agency Fees — Class R6 (Note E) | | | 3 | | |
Sub Transfer Agency Fees — Class I | | | 4 | | |
Sub Transfer Agency Fees — Class A | | | 3 | | |
Sub Transfer Agency Fees — Class C | | | 1 | | |
Trustees' Fees and Expenses | | | 8 | | |
Other Expenses | | | 25 | | |
Total Expenses | | | 944 | | |
Waiver of Advisory Fees (Note B) | | | (301 | ) | |
Rebate from Morgan Stanley Affiliate (Note G) | | | (13 | ) | |
Reimbursement of Class Specific Expenses — Class I (Note B) | | | (2 | ) | |
Reimbursement of Class Specific Expenses — Class A (Note B) | | | (1 | ) | |
Reimbursement of Class Specific Expenses — Class C (Note B) | | | (1 | ) | |
Reimbursement of Class Specific Expenses — Class R6 (Note B) | | | (3 | ) | |
Net Expenses | | | 623 | | |
Net Investment Income | | | 2,973 | | |
Realized Loss: | |
Investments Sold | | | (2,742 | ) | |
Swap Agreements | | | (972 | ) | |
Net Realized Loss | | | (3,714 | ) | |
Change in Unrealized Appreciation (Depreciation): | |
Investments | | | 14,695 | | |
Swap Agreements | | | 775 | | |
Net Change in Unrealized Appreciation (Depreciation) | | | 15,470 | | |
Net Realized Loss and Change in Unrealized Appreciation (Depreciation) | | | 11,756 | | |
Net Increase in Net Assets Resulting from Operations | | $ | 14,729 | | |
The accompanying notes are an integral part of the financial statements.
13
Morgan Stanley Institutional Fund Trust
Annual Report — September 30, 2023
Statements of Changes in Net Assets | | Year Ended
September 30, 2023
(000) | | Year Ended
September 30, 2022
(000) | |
Increase (Decrease) in Net Assets: | |
Operations: | |
Net Investment Income | | $ | 2,973 | | | $ | 731 | | |
Net Realized Gain (Loss) | | | (3,714 | ) | | | 851 | | |
Net Change in Unrealized Appreciation (Depreciation) | | | 15,470 | | | | (19,110 | ) | |
Net Increase (Decrease) in Net Assets Resulting from Operations | | | 14,729 | | | | (17,528 | ) | |
Dividends and Distributions to Shareholders: | |
Class I | | | (269 | ) | | | (457 | ) | |
Class A | | | (89 | ) | | | (1 | ) | |
Class C | | | (76 | ) | | | (2 | ) | |
Class R6* | | | (3,015 | ) | | | (— | @) | |
Total Dividends and Distributions to Shareholders | | | (3,449 | ) | | | (460 | ) | |
Capital Share Transactions:(1) | |
Class I: | |
Subscribed | | | 2,201 | | | | 292 | | |
Distributions Reinvested | | | 269 | | | | 457 | | |
Redeemed | | | (3,914 | ) | | | (28 | ) | |
Class A: | |
Subscribed | | | 3,200 | | | | 1,928 | | |
Distributions Reinvested | | | 89 | | | | 1 | | |
Redeemed | | | (2,328 | ) | | | (338 | ) | |
Class C: | |
Subscribed | | | 935 | | | | 3,417 | | |
Distributions Reinvested | | | 76 | | | | 2 | | |
Redeemed | | | (2,639 | ) | | | (1,332 | ) | |
Class R6:* | |
Subscribed | | | 7,364 | | | | 105,023 | | |
Distributions Reinvested | | | 3,015 | | | | — | @ | |
Redeemed | | | (20 | ) | | | (1 | ) | |
Net Increase in Net Assets Resulting from Capital Share Transactions | | | 8,248 | | | | 109,421 | | |
Total Increase in Net Assets | | | 19,528 | | | | 91,433 | | |
Net Assets: | |
Beginning of Period | | | 101,799 | | | | 10,366 | | |
End of Period | | $ | 121,327 | | | $ | 101,799 | | |
(1) Capital Share Transactions: | |
Class I: | |
Shares Subscribed | | | 202 | | | | 27 | | |
Shares Issued on Distributions Reinvested | | | 25 | | | | 45 | | |
Shares Redeemed | | | (369 | ) | | | (3 | ) | |
Net Increase (Decrease) in Class I Shares Outstanding | | | (142 | ) | | | 69 | | |
Class A: | |
Shares Subscribed | | | 301 | | | | 180 | | |
Shares Issued on Distributions Reinvested | | | 8 | | | | — | @@ | |
Shares Redeemed | | | (230 | ) | | | (33 | ) | |
Net Increase in Class A Shares Outstanding | | | 79 | | | | 147 | | |
Class C: | |
Shares Subscribed | | | 92 | | | | 318 | | |
Shares Issued on Distributions Reinvested | | | 7 | | | | — | @@ | |
Shares Redeemed | | | (265 | ) | | | (131 | ) | |
Net Increase (Decrease) in Class C Shares Outstanding | | | (166 | ) | | | 187 | | |
Class R6:* | |
Shares Subscribed | | | 743 | | | | 9,609 | | |
Shares Issued on Distributions Reinvested | | | 285 | | | | — | @@ | |
Shares Redeemed | | | (2 | ) | | | (— | @@) | |
Net Increase in Class R6 Shares Outstanding | | | 1,026 | | | | 9,609 | | |
* Effective April 29, 2022, Class IS shares were renamed Class R6 shares.
@ Amount is less than $500.
@@ Amount is less than 500 shares.
The accompanying notes are an integral part of the financial statements.
14
Morgan Stanley Institutional Fund Trust
Annual Report — September 30, 2023
Financial Highlights
Dynamic Value Portfolio
| | | Class I | |
| | | Year Ended September 30, | | Period from
March 19, 2021(1) to | |
Selected Per Share Data and Ratios | | 2023 | | 2022 | | September 30, 2021 | |
Net Asset Value, Beginning of Period | | $ | 9.26 | | | $ | 10.44 | | | $ | 10.00 | | |
Income (Loss) from Investment Operations: | |
Net Investment Income(2) | | | 0.26 | | | | 0.22 | | | | 0.11 | | |
Net Realized and Unrealized Gain (Loss) | | | 1.07 | | | | (0.94 | ) | | | 0.33 | | |
Total from Investment Operations | | | 1.33 | | | | (0.72 | ) | | | 0.44 | | |
Distributions from and/or in Excess of: | |
Net Investment Income | | | (0.30 | ) | | | (0.17 | ) | | | — | | |
Net Realized Gain | | | (0.01 | ) | | | (0.29 | ) | | | — | | |
Total Distributions | | | (0.31 | ) | | | (0.46 | ) | | | — | | |
Net Asset Value, End of Period | | $ | 10.28 | | | $ | 9.26 | | | $ | 10.44 | | |
Total Return(3) | | | 14.30 | % | | | (7.26 | )% | | | 4.40 | %(4) | |
Ratios to Average Net Assets and Supplemental Data: | |
Net Assets, End of Period (Thousands) | | $ | 9,387 | | | $ | 9,763 | | | $ | 10,295 | | |
Ratio of Expenses Before Expense Limitation | | | 0.82 | % | | | 1.51 | % | | | 6.44 | %(5) | |
Ratio of Expenses After Expense Limitation | | | 0.54 | %(6) | | | 0.51 | %(6) | | | 0.53 | %(5)(6) | |
Ratio of Net Investment Income | | | 2.44 | %(6) | | | 2.00 | %(6) | | | 1.95 | %(5)(6) | |
Ratio of Rebate from Morgan Stanley Affiliates | | | 0.01 | % | | | 0.01 | % | | | 0.00 | %(5)(7) | |
Portfolio Turnover Rate | | | 178 | % | | | 125 | % | | | 82 | %(4) | |
(1) Commencement of Operations.
(2) Per share amount is based on average shares outstanding.
(3) Calculated based on the net asset value as of the last business day of the period.
(4) Not annualized.
(5) Annualized.
(6) The Ratio of Expenses After Expense Limitation and Ratio of Net Investment Income reflect the rebate of certain Fund expenses in connection with the investments in Morgan Stanley affiliates during the period. The effect of the rebate on the ratios is disclosed in the above table as "Ratio of Rebate from Morgan Stanley Affiliates."
(7) Amount is less than 0.005%.
The accompanying notes are an integral part of the financial statements.
15
Morgan Stanley Institutional Fund Trust
Annual Report — September 30, 2023
Financial Highlights
Dynamic Value Portfolio
| | | Class A | |
| | | Year Ended September 30, | | Period from
March 19, 2021(1) to | |
Selected Per Share Data and Ratios | | 2023 | | 2022 | | September 30, 2021 | |
Net Asset Value, Beginning of Period | | $ | 9.22 | | | $ | 10.42 | | | $ | 10.00 | | |
Income (Loss) from Investment Operations: | |
Net Investment Income(2) | | | 0.22 | | | | 0.19 | | | | 0.10 | | |
Net Realized and Unrealized Gain (Loss) | | | 1.08 | | | | (0.95 | ) | | | 0.32 | | |
Total from Investment Operations | | | 1.30 | | | | (0.76 | ) | | | 0.42 | | |
Distributions from and/or in Excess of: | |
Net Investment Income | | | (0.30 | ) | | | (0.15 | ) | | | — | | |
Net Realized Gain | | | (0.01 | ) | | | (0.29 | ) | | | — | | |
Total Distributions | | | (0.31 | ) | | | (0.44 | ) | | | — | | |
Net Asset Value, End of Period | | $ | 10.21 | | | $ | 9.22 | | | $ | 10.42 | | |
Total Return(3) | | | 13.96 | % | | | (7.70 | )% | | | 4.20 | %(4) | |
Ratios to Average Net Assets and Supplemental Data: | |
Net Assets, End of Period (Thousands) | | $ | 2,329 | | | $ | 1,379 | | | $ | 27 | | |
Ratio of Expenses Before Expense Limitation | | | 1.20 | % | | | 2.18 | % | | | 13.65 | %(5) | |
Ratio of Expenses After Expense Limitation | | | 0.89 | %(6) | | | 0.89 | %(6) | | | 0.90 | %(5)(6) | |
Ratio of Net Investment Income | | | 2.09 | %(6) | | | 1.81 | %(6) | | | 1.84 | %(5)(6) | |
Ratio of Rebate from Morgan Stanley Affiliates | | | 0.01 | % | | | 0.01 | % | | | 0.00 | %(5)(7) | |
Portfolio Turnover Rate | | | 178 | % | | | 125 | % | | | 82 | %(4) | |
(1) Commencement of Operations.
(2) Per share amount is based on average shares outstanding.
(3) Calculated based on the net asset value which does not reflect sales charges, if applicable, as of the last business day of the period.
(4) Not annualized.
(5) Annualized.
(6) The Ratio of Expenses After Expense Limitation and Ratio of Net Investment Income reflect the rebate of certain Fund expenses in connection with the investments in Morgan Stanley affiliates during the period. The effect of the rebate on the ratios is disclosed in the above table as "Ratio of Rebate from Morgan Stanley Affiliates."
(7) Amount is less than 0.005%.
The accompanying notes are an integral part of the financial statements.
16
Morgan Stanley Institutional Fund Trust
Annual Report — September 30, 2023
Financial Highlights
Dynamic Value Portfolio
| | | Class C | |
| | | Year Ended September 30, | | Period from
March 19, 2021(1) to | |
Selected Per Share Data and Ratios | | 2023 | | 2022 | | September 30, 2021 | |
Net Asset Value, Beginning of Period | | $ | 9.14 | | | $ | 10.38 | | | $ | 10.00 | | |
Income (Loss) from Investment Operations: | |
Net Investment Income(2) | | | 0.14 | | | | 0.11 | | | | 0.06 | | |
Net Realized and Unrealized Gain (Loss) | | | 1.09 | | | | (0.93 | ) | | | 0.32 | | |
Total from Investment Operations | | | 1.23 | | | | (0.82 | ) | | | 0.38 | | |
Distributions from and/or in Excess of: | |
Net Investment Income | | | (0.28 | ) | | | (0.13 | ) | | | — | | |
Net Realized Gain | | | (0.01 | ) | | | (0.29 | ) | | | — | | |
Total Distributions | | | (0.29 | ) | | | (0.42 | ) | | | — | | |
Net Asset Value, End of Period | | $ | 10.08 | | | $ | 9.14 | | | $ | 10.38 | | |
Total Return(3) | | | 13.31 | % | | | (8.32 | )% | | | 3.80 | %(4) | |
Ratios to Average Net Assets and Supplemental Data: | |
Net Assets, End of Period (Thousands) | | $ | 247 | | | $ | 1,736 | | | $ | 34 | | |
Ratio of Expenses Before Expense Limitation | | | 2.02 | % | | | 2.77 | % | | | 15.35 | %(5) | |
Ratio of Expenses After Expense Limitation | | | 1.64 | %(6) | | | 1.64 | %(6) | | | 1.65 | %(5)(6) | |
Ratio of Net Investment Income | | | 1.34 | %(6) | | | 1.06 | %(6) | | | 1.04 | %(5)(6) | |
Ratio of Rebate from Morgan Stanley Affiliates | | | 0.01 | % | | | 0.01 | % | | | 0.00 | %(5)(7) | |
Portfolio Turnover Rate | | | 178 | % | | | 125 | % | | | 82 | %(4) | |
(1) Commencement of Operations.
(2) Per share amount is based on average shares outstanding.
(3) Calculated based on the net asset value which does not reflect sales charges, if applicable, as of the last business day of the period.
(4) Not annualized.
(5) Annualized.
(6) The Ratio of Expenses After Expense Limitation and Ratio of Net Investment Income reflect the rebate of certain Fund expenses in connection with the investments in Morgan Stanley affiliates during the period. The effect of the rebate on the ratios is disclosed in the above table as "Ratio of Rebate from Morgan Stanley Affiliates."
(7) Amount is less than 0.005%.
The accompanying notes are an integral part of the financial statements.
17
Morgan Stanley Institutional Fund Trust
Annual Report — September 30, 2023
Financial Highlights
Dynamic Value Portfolio
| | | Class R6(1) | |
| | | Year Ended September 30, | | Period from
March 19, 2021(2) to | |
Selected Per Share Data and Ratios | | 2023 | | 2022 | | September 30, 2021 | |
Net Asset Value, Beginning of Period | | $ | 9.25 | | | $ | 10.44 | | | $ | 10.00 | | |
Income (Loss) from Investment Operations: | |
Net Investment Income(3) | | | 0.26 | | | | 0.29 | | | | 0.11 | | |
Net Realized and Unrealized Gain (Loss) | | | 1.09 | | | | (1.02 | ) | | | 0.33 | | |
Total from Investment Operations | | | 1.35 | | | | (0.73 | ) | | | 0.44 | | |
Distributions from and/or in Excess of: | |
Net Investment Income | | | (0.31 | ) | | | (0.17 | ) | | | — | | |
Net Realized Gain | | | (0.01 | ) | | | (0.29 | ) | | | — | | |
Total Distributions | | | (0.32 | ) | | | (0.46 | ) | | | — | | |
Net Asset Value, End of Period | | $ | 10.28 | | | $ | 9.25 | | | $ | 10.44 | | |
Total Return(4) | | | 14.43 | % | | | (7.35 | )% | | | 4.40 | %(5) | |
Ratios to Average Net Assets and Supplemental Data: | |
Net Assets, End of Period (Thousands) | | $ | 109,364 | | | $ | 88,921 | | | $ | 10 | | |
Ratio of Expenses Before Expense Limitation | | | 0.75 | % | | | 1.49 | % | | | 25.05 | %(6) | |
Ratio of Expenses After Expense Limitation | | | 0.49 | %(7) | | | 0.49 | %(7) | | | 0.50 | %(6)(7) | |
Ratio of Net Investment Income | | | 2.49 | %(7) | | | 2.85 | %(7) | | | 1.98 | %(6)(7) | |
Ratio of Rebate from Morgan Stanley Affiliates | | | 0.01 | % | | | 0.01 | % | | | 0.00 | %(6)(8) | |
Portfolio Turnover Rate | | | 178 | % | | | 125 | % | | | 82 | %(5) | |
(1) Effective April 29, 2022, Class IS shares were renamed Class R6 shares.
(2) Commencement of Operations.
(3) Per share amount is based on average shares outstanding.
(4) Calculated based on the net asset value as of the last business day of the period.
(5) Not annualized.
(6) Annualized.
(7) The Ratio of Expenses After Expense Limitation and Ratio of Net Investment Income reflect the rebate of certain Fund expenses in connection with the investments in Morgan Stanley affiliates during the period. The effect of the rebate on the ratios is disclosed in the above table as "Ratio of Rebate from Morgan Stanley Affiliates."
(8) Amount is less than 0.005%.
The accompanying notes are an integral part of the financial statements.
18
Morgan Stanley Institutional Fund Trust
Annual Report — September 30, 2023
Notes to Financial Statements
Morgan Stanley Institutional Fund Trust ("Trust") is registered under the Investment Company Act of 1940, as amended (the "Act"), as an open-end management investment company. The Trust is comprised of nine separate, active funds (individually referred to as a "Fund," collectively as the "Funds"). All Funds are considered diversified for purposes of the Act.
The Trust applies investment company accounting and reporting guidance Accounting Standards Codification ("ASC"). In the preparation of these financial statements, management has evaluated subsequent events occurring after the date of the Fund's Statement of Assets and Liabilities through the date that the financial statements were issued.
The accompanying financial statements relate to the Dynamic Value Portfolio. The Fund seeks capital appreciation. The Fund offers four classes of shares — Class I, Class A, Class C and Class R6. Effective April 29, 2022, Class IS shares were renamed Class R6 shares.
A. Significant Accounting Policies: The following significant accounting policies are in conformity with U.S. generally accepted accounting principles ("GAAP"). Such policies are consistently followed by the Trust in the preparation of its financial statements. GAAP may require management to make estimates and assumptions that affect the reported amounts and disclosures in the financial statements. Actual results may differ from those estimates.
1. Security Valuation: (1) An equity portfolio security listed or traded on an exchange is valued at its latest reported sales price (or at the exchange official closing price if such exchange reports an official closing price), and if there were no sales on a given day and if there is no official exchange closing price for that day, the security is valued at the mean between the last reported bid and asked prices if such bid and asked prices are available on the relevant exchanges. If only bid prices are available then the latest bid price may be used. Listed equity securities not traded on the valuation date with no reported bid and asked prices available on the exchange are valued at the mean between the current bid and asked prices obtained from one or more reputable brokers/dealers. In cases where a security is traded on more than one exchange, the security is valued on the exchange designated as the primary market; (2) all other equity portfolio securities for which over-thecounter ("OTC") market quotations are readily available are valued at the latest reported sales price (or at the market official closing price if such market reports an official closing price), and if there was no trading in the security on a given day and if there is no official closing price from
relevant markets for that day, the security is valued at the mean between the last reported bid and asked prices if such bid and asked prices are available on the relevant markets. An unlisted equity security that does not trade on the valuation date and for which bid and asked prices from the relevant markets are unavailable is valued at the mean between the current bid and asked prices obtained from one or more reputable brokers/dealers; (3) fixed income securities may be valued by an outside pricing service/vendor approved by the Trust's Board of Trustees (the "Trustees"). The pricing service/vendor may employ a pricing model that takes into account, among other things, bids, yield spreads and/or other market data and specific security characteristics. If Morgan Stanley Investment Management Inc. (the "Adviser"), a wholly-owned subsidiary of Morgan Stanley, determines that the price provided by the outside pricing service/vendor does not reflect the security's fair value or is unable to provide a price, prices from brokers/dealers may also be utilized. In these circumstances, the value of the security will be the mean of bid and asked prices obtained from reputable brokers/dealers; (4) OTC swaps may be valued by an outside pricing service approved by the Trustees or quotes from a broker/dealer. Swaps cleared on a clearinghouse or exchange may be valued using the closing price provided by the clearinghouse or exchange. Total return swaps may also be fair valued using direct accrual/return calculations if prices on the reference asset on the total return leg of the swap are available from a pricing service/vendor for such instrument. In the event that the reference asset on the total return leg of the swap is a benchmark index, then price of such reference asset may be obtained from a pricing service provider or from the benchmark index sponsor; (5) when market quotations are not readily available, as defined by Rule 2a-5 under the Act, including circumstances under which the Adviser determines that the closing price, last sale price or the mean between the last reported bid and asked prices are not reflective of a security's market value, portfolio securities are valued at their fair value as determined in good faith under procedures approved by and under the general supervision of the Trustees. Occasionally, developments affecting the closing prices of securities and other assets may occur between the times at which valuations of such securities are determined (that is, close of the foreign market on which the securities trade) and the close of business of the New York Stock Exchange ("NYSE"). If developments occur during such periods that are expected to materially affect the value of such securities, such valuations may be adjusted to reflect the estimated fair value of such securities as of the close of
19
Morgan Stanley Institutional Fund Trust
Annual Report — September 30, 2023
Notes to Financial Statements (cont'd)
the NYSE, as determined in good faith by the Trustees or by the Adviser using a pricing service and/or procedures approved by the Trustees; and (6) investments in mutual funds, including the Morgan Stanley Institutional Liquidity Funds, are valued at the net asset value ("NAV") as of the close of each business day.
In connection with Rule 2a-5 of the Act, the Trustees have designated the Trust's Adviser as its valuation designee. The valuation designee has responsibility for determining fair value and to make the actual calculations pursuant to the fair valuation methodologies previously approved by the Trustees. Under procedures approved by the Trustees, the Trust's Adviser, as valuation designee, has formed a Valuation Committee whose members are approved by the Trustees. The Valuation Committee provides administration and oversight of the Trust's valuation policies and procedures, which are reviewed at least annually by the Trustees. These procedures allow the Trust to utilize independent pricing services, quotations from securities and financial instrument dealers and other market sources to determine fair value.
2. Fair Value Measurement: Financial Accounting Standards Board ("FASB") ASC 820, "Fair Value Measurement" ("ASC 820"), defines fair value as the price that would be received to sell an asset or pay to transfer a liability in an orderly transaction between market participants at the measurement date. ASC 820 establishes a three-tier hierarchy to distinguish between (1) inputs that reflect the assumptions market participants would use in valuing an asset or liability developed based on market data obtained from sources independent of the reporting entity (observable inputs) and (2) inputs that reflect the reporting entity's own assumptions about the assumptions market participants would use in valuing an asset or liability developed based on the best information available in the circumstances (unobservable inputs) and to establish classification of fair value measurements for disclosure purposes. Various inputs are used in determining the value of the Fund's investments. The inputs are summarized in the three broad levels listed below:
• Level 1 – unadjusted quoted prices in active markets for identical investments
• Level 2 – other significant observable inputs (including quoted prices for similar investments, interest rates, prepayment speeds, credit risk, etc.)
• Level 3 – significant unobservable inputs including the Fund's own assumptions in determining the fair value of investments. Factors considered in making this determination may include, but are not limited to, information obtained by contacting the issuer, analysts, or the appropriate stock exchange (for exchange-traded securities), analysis of the issuer's financial statements or other available documents and, if necessary, available information concerning other securities in similar circumstances.
The inputs or methodology used for valuing securities are not necessarily an indication of the risk associated with investing in those securities and the determination of the significance of a particular input to the fair value measurement in its entirety requires judgment and considers factors specific to each security.
The following is a summary of the inputs used to value the Fund's investments as of September 30, 2023:
Investment Type | | Level 1
Unadjusted
quoted
prices
(000) | | Level 2
Other
significant
observable
inputs
(000) | | Level 3
Significant
unobservable
inputs
(000) | | Total
(000) | |
Assets: | |
Common Stocks | | $ | 115,333 | (1) | | $ | — | | | $ | — | | | $ | 115,333 | | |
Short-Term Investment | |
Investment Company | | | 6,500 | | | | — | | | | — | | | | 6,500 | | |
Total Return Swap
Agreement | | | — | | | | 1,203 | | | | — | | | | 1,203 | | |
Total Assets | | | 121,833 | | | | 1,203 | | | | — | | | | 123,036 | | |
Liabilities: | |
Total Return Swap
Agreements | | | — | | | | (2,168 | ) | | | — | | | | (2,168 | ) | |
Total | | $ | 121,833 | | | $ | (965 | ) | | $ | — | | | $ | 120,868 | | |
(1) The level classification by major category of investments is the same as the category presentation in the Portfolio of Investments.
Transfers between investment levels may occur as the markets fluctuate and/or the availability of data used in an investment's valuation changes.
3. Derivatives: The Fund may, but is not required to, use derivative instruments for a variety of purposes, including hedging, risk management, portfolio management or to earn income. Derivatives are financial instruments whose value is based, in part, on the value of an underlying asset, interest rate, index or financial instrument. Prevailing interest rates and volatility levels, among other things, also
20
Morgan Stanley Institutional Fund Trust
Annual Report — September 30, 2023
Notes to Financial Statements (cont'd)
affect the value of derivative instruments. A derivative instrument often has risks similar to its underlying asset and may have additional risks, including imperfect correlation between the value of the derivative and the underlying asset, risks of default by the counterparty to certain transactions, magnification of losses incurred due to changes in the market value of the securities, instruments, indices or interest rates to which the derivative instrument relates, risks that the transactions may not be liquid, risks arising from margin and payment requirements, risks arising from mispricing or valuation complexity and operational and legal risks. The use of derivatives involves risks that are different from, and possibly greater than, the risks associated with other portfolio investments. Derivatives may involve the use of highly specialized instruments that require investment techniques and risk analyses different from those associated with other portfolio investments. All of the Fund's holdings, including derivative instruments, are marked-to-market each day with the change in value reflected in unrealized appreciation (depreciation). Upon disposition, a realized gain or loss is recognized.
Certain derivative transactions may give rise to a form of leverage. Leverage magnifies the potential for gain and the risk of loss. Leverage associated with derivative transactions may cause the Fund to liquidate portfolio positions when it may not be advantageous to do so to satisfy its obligations or may cause the Fund to be more volatile than if the Fund had not been leveraged. Although the Adviser seeks to use derivatives to further the Fund's investment objectives, there is no assurance that the use of derivatives will achieve this result.
Following is a description of the derivative instruments and techniques that the Fund used during the period and their associated risks:
Swaps: The Fund may enter into OTC swap contracts or cleared swap transactions. A swap contract is an agreement between two parties pursuant to which the parties exchange payments at specified dates on the basis of a specified notional amount, with the payments calculated by reference to specified securities, indices, reference rates, currencies or other instruments. Typically swap agreements provide that when the period payment dates for both parties are the same, the payments are made on a net basis (i.e., the two payment streams are netted out, with only the net amount paid by one party to the
other). The Fund's obligations or rights under a swap contract entered into on a net basis will generally be equal only to the net amount to be paid or received under the agreement, based on the relative values of the positions held by each party. Cleared swap transactions may help reduce counterparty credit risk. In a cleared swap, the Fund's ultimate counterparty is a clearinghouse rather than a swap dealer, bank or other financial institution. OTC swap agreements are not entered into or traded on exchanges and often there is no central clearing or guaranty function for OTC swaps. These OTC swaps are often subject to credit risk or the risk of default or non-performance by the counterparty. Both OTC and cleared swaps could result in losses if interest rates, foreign currency exchange rates or other factors are not correctly anticipated by the Fund or if the reference index, security or investments do not perform as expected. During the period swap agreements are open, payments are received from or made to the counterparty or clearing-house based on changes in the value of the contract or variation margin, respectively. The Dodd-Frank Wall Street Reform and Consumer Protection Act and related regulatory developments require the clearing and exchange-trading of certain standardized swap transactions. Mandatory exchange-trading and clearing is occurring on a phased-in basis based on the type of market participant and U.S. Commodities Futures Trading Commission ("CFTC") approval of contracts for central clearing and exchange trading.
The Fund may enter into total return swaps in which one party agrees to make periodic payments to another party based on the change in market value of the assets underlying the contract, which may include, but not be limited to, a specified security, basket of securities or securities indices during the specified period, in return for periodic payments based on a fixed or variable interest rate or the total return from other underlying assets. Total return swaps may be used to obtain long or short exposure to a security or market without owning or taking physical custody of such security or investing directly in such market. Total return swaps may effectively add leverage to the Fund's portfolio because, in addition to its total net assets, the Fund would be subject to investment exposure on the notional amount of the swap. Total return swaps are subject to the risk that a counterparty will default on its payment obligations to
21
Morgan Stanley Institutional Fund Trust
Annual Report — September 30, 2023
Notes to Financial Statements (cont'd)
the Fund thereunder, and conversely, that the Fund will not be able to meet its obligation to the counterparty.
When the Fund has an unrealized loss on a swap agreement, the Fund has instructed the custodian to pledge cash or liquid securities as collateral with a value approximately equal to the amount of the unrealized loss. Collateral pledges are monitored and subsequently adjusted if and when the swap valuations fluctuate. If applicable, cash collateral is included with "Due from (to) Broker" in the Statement of Assets and Liabilities.
Upfront payments paid or received by the Fund will be reflected as an asset or liability, respectively, in the Statement of Assets and Liabilities.
FASB ASC 815, "Derivatives and Hedging" ("ASC 815"), is intended to improve financial reporting about derivative instruments by requiring enhanced disclosures to enable investors to better understand how and why the Fund uses derivative instruments, how these derivative instruments are accounted for and their effects on the Fund's financial position and results of operations.
The following tables set forth the fair value of the Fund's derivative contracts by primary risk exposure as of September 30, 2023:
| | | Asset Derivatives
Statement of Assets and
Liabilities Location | | Primary Risk
Exposure | | Value
(000) | |
Swap Agreement
| | Unrealized Appreciation on
Swap Agreement | | Equity Risk | | $ | 1,203 | | |
| | | Liability Derivatives
Statement of Assets and
Liabilities Location | | Primary Risk
Exposure | | Value
(000) | |
Swap Agreements | | Unrealized Depreciation on
Swap Agreements | | Equity Risk | | $ | (2,168 | ) | |
The following tables set forth by primary risk exposure the Fund's realized gains (losses) and change in unrealized appreciation (depreciation) by type of derivative contract for the year ended September 30, 2023 in accordance with ASC 815:
Realized Gain (Loss) | |
Primary Risk Exposure | | Derivative Type | | Value
(000) | |
Equity Risk | | Swap Agreements | | $ | (972 | ) | |
Change in Unrealized Appreciation (Depreciation) | |
Primary Risk Exposure | | Derivative Type | | Value
(000) | |
Equity Risk | | Swap Agreements | | $ | 775 | | |
At September 30, 2023, the Fund's derivative assets and liabilities are as follows:
Gross Amounts of Assets and Liabilities
Presented in the Statement of Assets and Liabilities | |
Derivatives(a) | | Assets(b)
(000) | | Liabilities(b)
(000) | |
Swap Agreements | | $ | 1,203 | | | $ | (2,168 | ) | |
(a) Excludes exchange-traded derivatives.
(b) Absent an event of default or early termination, OTC derivative assets and liabilities are presented gross and not offset in the Statement of Assets and Liabilities.
The Fund typically enters into International Swaps and Derivatives Association, Inc. Master Agreements ("ISDA Master Agreements") or similar master agreements (collectively, "Master Agreements") with its contract counterparties for certain OTC derivatives in order to, among other things, reduce its credit risk to counterparties. ISDA Master Agreements include provisions for general obligations, representations, collateral and events of default or termination. Under an ISDA Master Agreement, the Fund typically may offset with the counterparty certain OTC derivative financial instruments' payables and/or receivables with collateral held and/or posted and create one single net payment (close-out netting) in the event of default, termination and/or potential deterioration in the credit quality of the counterparty. Various Master Agreements govern the terms of certain transactions with counterparties, including transactions such as swap, forward, repurchase and reverse repurchase agreements. These Master Agreements typically attempt to reduce the counterparty risk associated with such transactions by specifying credit protection mechanisms and providing standardization that improves legal certainty. Cross-termination provisions under Master Agreements typically provide that a default in connection with one transaction between the Fund and a counterparty gives the non-defaulting party the right to terminate any other transactions in place with the defaulting party to create one single net payment due to/due from the defaulting party and may be a feature in certain Master Agreements. In the event the Fund exercises its right to terminate a Master Agreement after a counterparty experiences a termination event as defined in the Master Agreement, the return of collateral with market value in excess of the Fund's net liability may be delayed or denied.
22
Morgan Stanley Institutional Fund Trust
Annual Report — September 30, 2023
Notes to Financial Statements (cont'd)
The following tables present derivative financial instruments that are subject to enforceable netting arrangements as of September 30, 2023:
Gross Amounts Not Offset in the Statement of Assets and Liabilities | |
Counterparty | | Gross Asset
Derivatives
Presented in the
Statement of
Assets and
Liabilities
(000) | | Financial
Instrument
(000) | | Collateral
Received
(000) | | Net Amount
(not less
than $0)
(000) | |
JPMorgan Chase Bank NA | | $ | 1,203 | | | $ | (1,203 | ) | | $ | — | | | $ | 0 | | |
Gross Amounts Not Offset in the Statement of Assets and Liabilities | |
Counterparty | | Gross Asset
Derivatives
Presented in the
Statement of
Assets and
Liabilities
(000) | | Financial
Instrument
(000) | | Collateral
Pledged
(000) | | Net Amount
(not less
than $0)
(000) | |
JPMorgan Chase Bank NA | | $ | 2,168 | | | $ | (1,203 | ) | | $ | (780 | ) | | $ | 185 | | |
For the year ended September 30, 2023, the approximate average monthly amount outstanding for each derivative type is as follows:
Swap Agreements: | |
Average monthly notional amount | | $ | 28,032,000 | | |
4. Indemnifications: The Trust enters into contracts that contain a variety of indemnification clauses. The Trust's maximum exposure under these arrangements is unknown as this would involve future claims that may be made against the Fund that have not yet occurred.
5. Dividends and Distributions to Shareholders: Dividend income and distributions to shareholders are recorded on the ex-dividend date. Dividends from net investment income, if any, are declared and paid annually. Net realized capital gains, if any, are distributed at least annually.
6. Security Transactions, Income and Expenses: Security transactions are accounted for on the trade date (date the order to buy or sell is executed). Realized gains and losses on the sale of investment securities are determined on the specific identified cost method. Dividend income and other distributions are recorded on the ex-dividend date (except for certain foreign dividends which may be recorded as soon as the Fund is informed of such dividends) net of applicable withholding taxes. Non-cash dividends received in the form of stock, if any, are recognized on the ex-dividend date and recorded as non-cash dividend income at fair value. Interest income is
recognized on the accrual basis (except where collection is in doubt) net of applicable withholding taxes. Discounts are accreted and premiums are amortized over the life of the respective securities. Most expenses of the Trust can be directly attributed to a particular Fund. Expenses which cannot be directly attributed are apportioned among the Funds based upon relative net assets or other appropriate methods. Income, expenses (other than class specific expenses — distribution and shareholder services, transfer agency and sub transfer agency fees) and realized and unrealized gains or losses are allocated to each class of shares based upon their relative net assets.
B. Advisory Fees: The Adviser, a wholly-owned subsidiary of Morgan Stanley, provides the Fund with advisory services under the terms of an Investment Advisory Agreement, paid quarterly, at an annual rate of 0.35% of the average daily net assets of the Fund.
The Adviser has agreed to reduce its advisory fee and/or reimburse the Fund so that total annual Fund operating expenses, excluding certain investment related expenses, taxes, interest and other extraordinary expenses (including litigation), will not exceed 0.55% for Class I shares, 0.90% for Class A shares, 1.65% for Class C shares and 0.50% for Class R6 shares. The fee waivers and/or expense reimbursements will continue for at least one year from the date of the Fund's prospectus or until such time as the Trustees act to discontinue all or a portion of such waivers and/or reimbursements when they deem such action is appropriate. For the year ended September 30, 2023, approximately $301,000 of advisory fees were waived and approximately $7,000 of other expenses were reimbursed by the Adviser pursuant to this arrangement.
C. Administration Fees: The Adviser also serves as Administrator to the Trust and provides administrative services pursuant to an Administration Agreement for an annual fee, accrued daily and paid monthly, of 0.08% of the Fund's average daily net assets.
Under a Sub-Administration Agreement between the Administrator and State Street Bank and Trust Company ("State Street"), State Street provides certain administrative services to the Trust. For such services, the Administrator pays State Street a portion of the fee the Administrator receives from the Fund.
D. Distribution and Shareholder Services Fees: Morgan Stanley Distribution, Inc. ("MSDI" or the "Distributor"), a wholly-owned subsidiary of the Adviser and an indirect subsidiary of Morgan Stanley, serves as the Trust's Distributor
23
Morgan Stanley Institutional Fund Trust
Annual Report — September 30, 2023
Notes to Financial Statements (cont'd)
of Fund shares pursuant to a Distribution Agreement. The Trust has adopted a Shareholder Services Plan with respect to Class A shares pursuant to Rule 12b-1 under the Act. Under the Shareholder Services Plan, the Fund pays the Distributor a shareholder services fee, accrued daily and paid monthly, at an annual rate of 0.25% of the Fund's average daily net assets attributable to Class A shares.
The Trust has adopted a Distribution and Shareholder Services Plan with respect to Class C shares pursuant to Rule 12b-1 under the Act. Under the Distribution and Shareholder Services Plan, the Fund pays the Distributor a distribution fee, accrued daily and paid monthly, at an annual rate of 0.75% and a shareholder services fee, accrued daily and paid monthly, at an annual rate of 0.25% of the Fund's average daily net assets attributable to Class C shares.
The distribution and shareholder services fees are used to support the expenses associated with servicing and maintaining accounts. The Distributor may compensate other parties for providing distribution-related and/or shareholder support services to investors who purchase Class A and Class C shares.
E. Dividend Disbursing and Transfer/Co-Transfer Agent: The Trust's dividend disbursing and transfer agent is SS&C Global Investor & Distribution Solutions, Inc. ("SS&C GIDS"). Pursuant to a Transfer Agency Agreement, the Trust pays SS&C GIDS a fee based on the number of classes, accounts and transactions relating to the Funds of the Trust.
Eaton Vance Management ("EVM"), an affiliate of Morgan Stanley, provides co-transfer agency and related services to the Fund pursuant to a Co-Transfer Agency Services Agreement. For the year ended September 30, 2023, co-transfer agency fees and expenses incurred to EVM, included in "Transfer Agency Fees" in the Statement of Operations, amounted to less than $500.
F. Custodian Fees: State Street (the "Custodian") also serves as Custodian for the Trust in accordance with a Custodian Agreement. The Custodian holds cash, securities and other assets of the Trust as required by the Act. Custody fees are payable monthly based on assets held in custody, investment purchases and sales activity and account maintenance fees, plus reimbursement for certain out-of-pocket expenses.
G. Security Transactions and Transactions with Affiliates: For the year ended September 30, 2023, purchases and sales of investment securities for the Fund, other than long-term U.S. Government securities and short-term investments
were approximately $210,556,000 and $202,676,000, respectively. There were no purchases and sales of long-term U.S. Government securities for the year ended September 30, 2023.
The Fund invests in the Institutional Class of the Morgan Stanley Institutional Liquidity Funds — Government Portfolio (the "Liquidity Funds"), an open-end management investment company managed by the Adviser. Advisory fees paid by the Fund are reduced by an amount equal to its pro-rata share of the advisory and administration fees paid by the Fund due to its investment in the Liquidity Funds. For the year ended September 30, 2023, advisory fees paid were reduced by approximately $13,000 relating to the Fund's investment in the Liquidity Funds.
A summary of the Fund's transactions in shares of affiliated investments during the year ended September 30, 2023 is as follows:
Affiliated
Investment
Company | | Value
September 30,
2022
(000) | | Purchases
at Cost
(000) | | Proceeds
from Sales
(000) | | Dividend
Income
(000) | |
Liquidity Funds | | $ | 5,171 | | | $ | 200,377 | | | $ | 199,048 | | | $ | 342 | | |
Affiliated
Investment
Company (cont'd) | | Realized
Gain
(Loss)
(000) | | Change in
Unrealized
Appreciation
(Depreciation)
(000) | | Value
September 30,
2023
(000) | |
Liquidity Funds | | $ | — | | | $ | — | | | $ | 6,500 | | |
The Fund is permitted to purchase and sell securities ("cross-trade") from and to other Morgan Stanley funds as well as other funds and client accounts for which the Adviser or an affiliate of the Adviser serves as investment adviser, pursuant to procedures approved by the Trustees in compliance with Rule 17a-7 under the Act (the "Rule"). Each cross-trade is executed at the current market price in compliance with provisions of the Rule. For the year ended September 30, 2023, the Fund did not engage in any cross-trade transactions.
The Fund has an unfunded Deferred Compensation Plan (the "Compensation Plan"), which allows each independent Trustee to defer payment of all, or a portion, of the fees he or she receives for serving on the Board of Trustees. Each eligible Trustee generally may elect to have the deferred amounts credited with a return equal to the total return on one or more of the Morgan Stanley funds that are offered as investment options under the Compensation Plan. Appreciation/depreciation and distributions received from these investments are recorded with an offsetting increase/decrease in the deferred compensation obligation and do not affect the NAV of the Fund.
24
Morgan Stanley Institutional Fund Trust
Annual Report — September 30, 2023
Notes to Financial Statements (cont'd)
H. Federal Income Taxes: It is the Fund's intention to continue to qualify as a regulated investment company and distribute all of its taxable and tax-exempt income. Accordingly, no provision for federal income taxes is required in the financial statements.
The Fund may be subject to taxes imposed by countries in which it invests. Such taxes are generally based on income and/or capital gains earned or repatriated. Taxes are accrued based on net investment income, net realized gains and net unrealized appreciation as such income and/or gains are earned. Taxes may also be based on transactions in foreign currency and are accrued based on the value of investments denominated in such currency.
FASB ASC 740-10, "Income Taxes — Overall", sets forth a minimum threshold for financial statement recognition of the benefit of a tax position taken or expected to be taken in a tax return. Management has concluded there are no significant uncertain tax positions that would require recognition in the financial statements. If applicable, the Fund recognizes interest accrued related to unrecognized tax benefits in "Interest Expense" and penalties in "Other Expenses" in the Statement of Operations. The Fund files tax returns with the U.S. Internal Revenue Service, New York and various states. Each of the tax years in the three-year period ended September 30, 2023, remains subject to examination by taxing authorities.
The tax character of distributions paid may differ from the character of distributions shown for GAAP purposes due to short-term capital gains being treated as ordinary income for tax purposes. The tax character of distributions paid during fiscal years 2023 and 2022 was as follows:
2023
Distributions
Paid From: | | 2022
Distributions
Paid From: | |
Ordinary
Income
(000) | | Long-Term
Capital Gain
(000) | | Ordinary
Income
(000) | | Long-Term
Capital Gain
(000) | |
| $ | 3,400 | | | $ | 49 | | | $ | 456 | | | $ | 4 | | |
The amount and character of income and gains to be distributed are determined in accordance with income tax regulations which may differ from GAAP. These book/tax differences are either considered temporary or permanent in nature.
Temporary differences are attributable to differing book and tax treatments for the timing of the recognition of gains (losses) on certain investment transactions and the timing of the deductibility of certain expenses.
Permanent differences, due to a nondeductible expense, resulted in the following reclassifications among the components of net assets at September 30, 2023:
Total
Accumulated
Loss
(000) | | Paid-in-
Capital
(000) | |
| $ | 2 | | | $ | (2 | ) | |
At September 30, 2023, the components of distributable earnings for the Fund on a tax basis were as follows:
Undistributed
Ordinary
Income
(000) | | Undistributed
Long-Term
Capital Gain
(000) | |
| $ | 1,307 | | | $ | — | | |
At September 30, 2023, the Fund had available for federal income tax purposes unused short-term capital losses of approximately $796,000 that do not have an expiration date.
To the extent that capital loss carryforwards are used to offset any future capital gains realized, no capital gains tax liability will be incurred by the Fund for gains realized and not distributed. To the extent that capital gains are offset, such gains will not be distributed to the shareholders.
I. Credit Facility: The Trust and other Morgan Stanley funds participated in a $300,000,000 committed, unsecured revolving line of credit facility (the "Facility") with State Street. Effective April 17, 2023, the committed line amount increased to $500,000,000. This Facility is to be used for temporary emergency purposes or funding of shareholder redemption requests. The interest rate for any funds drawn will be based on the federal funds rate or overnight bank funding rate plus a spread. The Facility also has a commitment fee of 0.25% per annum based on the unused portion of the Facility, which is allocated among participating funds based on relative net assets. During the twelve months ended September 30, 2023, the Fund did not have any borrowings under the Facility.
J. Other: At September 30, 2023, the Fund had record owners of 10% or greater. Investment activities of these shareholders could have a material impact on the Fund. The aggregate percentage of such owners was 90.1%.
K. Market Risk: An investment in the Fund is based on the values of the Fund's investments, which may change due to economic and other events that affect markets generally, as well as those that affect particular regions, countries, industries,
25
Morgan Stanley Institutional Fund Trust
Annual Report — September 30, 2023
Notes to Financial Statements (cont'd)
companies or governments. The risks associated with these developments may be magnified if social, political, economic and other conditions and events (such as war, natural disasters, health emergencies (e.g., epidemics and pandemics), terrorism, conflicts, social unrest, recessions, inflation, rapid interest rate changes and supply chain disruptions) adversely interrupt the global economy and financial markets. It is difficult to predict when events affecting the U.S. or global financial markets may occur, the effects that such events may have and the duration of those effects (which may last for extended periods). These events may negatively impact broad segments of businesses and populations and have a significant and rapid negative impact on the performance of the Fund's investments, adversely affect and increase the volatility of the Fund's share price and exacerbate pre-existing risks to the Fund. The occurrence, duration and extent of these or other types of adverse economic and market conditions and uncertainty over the long term cannot be reasonably projected or estimated at this time. The ultimate impact of public health emergencies or other adverse economic or market developments and the extent to which the associated conditions impact the Fund and its investments will also depend on other future developments, which are highly uncertain, difficult to accurately predict and subject to change at any time. The financial performance of the Fund's investments (and, in turn, the Fund's investment results) as well as their liquidity may be adversely affected because of these and similar types of factors and developments.
26
Morgan Stanley Institutional Fund Trust
Annual Report — September 30, 2023
Report of Independent Registered Public Accounting Firm
To the Shareholders and Board of Trustees of
Morgan Stanley Institutional Fund Trust —
Dynamic Value Portfolio
Opinion on the Financial Statements
We have audited the accompanying statement of assets and liabilities of Dynamic Value Portfolio (the "Fund") (one of the funds constituting Morgan Stanley Institutional Fund Trust (the "Trust")), including the portfolio of investments, as of September 30, 2023, and the related statement of operations for the year then ended, the statements of changes in net assets and the financial highlights for each of the two years in the period then ended, and for the period from March 19, 2021 (commencement of operations) through September 20, 2021 and the related notes (collectively referred to as the "financial statements"). In our opinion, the financial statements present fairly, in all material respects, the financial position of the Fund (one of the funds constituting Morgan Stanley Institutional Fund Trust) at September 30, 2023, the results of its operations for the year then ended, the changes in its net assets and its financial highlights for each of the two years in the period then ended, and for the period from March 19, 2021 (commencement of operations) through September 20, 2021, in conformity with U.S. generally accepted accounting principles.
Basis for Opinion
These financial statements are the responsibility of the Trust's management. Our responsibility is to express an opinion on the Fund's financial statements based on our audits. We are a public accounting firm registered with the Public Company Accounting Oversight Board (United States) ("PCAOB") and are required to be independent with respect to the Trust in accordance with the U.S. federal securities laws and the applicable rules and regulations of the Securities and Exchange Commission and the PCAOB.
We conducted our audits in accordance with the standards of the PCAOB. Those standards require that we plan and perform the audit to obtain reasonable assurance about whether the financial statements are free of material misstatement, whether due to error or fraud. The Trust is not required to have, nor were we engaged to perform, an audit of the Trust's internal control over financial reporting. As part of our audits, we are required to obtain an understanding of internal control over financial reporting, but not for the purpose of expressing an opinion on the effectiveness of the Trust's internal control over financial reporting. Accordingly, we express no such opinion.
Our audits included performing procedures to assess the risks of material misstatement of the financial statements, whether due to error or fraud, and performing procedures that respond to those risks. Such procedures included examining, on a test basis, evidence regarding the amounts and disclosures in the financial statements. Our procedures included confirmation of securities owned as of September 30, 2023, by correspondence with the custodian, brokers and others; when replies were not received from brokers and others, we performed other auditing procedures. Our audits also included evaluating the accounting principles used and significant estimates made by management, as well as evaluating the overall presentation of the financial statements. We believe that our audits provide a reasonable basis for our opinion.

We have served as the auditor of one or more Morgan Stanley investment companies since 2000.
Boston, Massachusetts
November 27, 2023
27
Morgan Stanley Institutional Fund Trust
Annual Report — September 30, 2023
Investment Advisory Agreement Approval (unaudited)
Nature, Extent and Quality of Services
The Board reviewed and considered the nature and extent of the investment advisory services provided by the Adviser under the advisory agreement, including portfolio management, investment research and equity and fixed income securities trading. The Board also reviewed and considered the nature and extent of the non-advisory, administrative services provided by the Administrator under the administration agreement, including accounting, operations, clerical, bookkeeping, compliance, business management and planning, legal services and the provision of supplies, office space and utilities at the Adviser's expense. The Board also considered the Adviser's investment in personnel and infrastructure that benefits the Fund. (The Adviser and Administrator together are referred to as the "Adviser" and the advisory and administration agreements together are referred to as the "Management Agreement.") The Board also considered that the Adviser serves a variety of other investment advisory clients and has experience overseeing service providers. The Board also compared the nature of the services provided by the Adviser with similar services provided by non-affiliated advisers as prepared by Broadridge Financial Solutions, Inc. ("Broadridge").
The Board reviewed and considered the qualifications of the portfolio managers, the senior administrative managers and other key personnel of the Adviser who provide the advisory and administrative services to the Fund. The Board determined that the Adviser's portfolio managers and key personnel are well qualified by education and/or training and experience to perform the services in an efficient and professional manner. The Board concluded that the nature and extent of the advisory and administrative services provided were necessary and appropriate for the conduct of the business and investment activities of the Fund and supported its decision to approve the Management Agreement.
Performance, Fees and Expenses of the Fund
The Board reviewed the performance, fees and expenses of the Fund compared to its peers, as prepared by Broadridge, and to appropriate benchmarks where applicable. The Board discussed with the Adviser the performance goals and the actual results achieved in managing the Fund. When considering a fund's performance, the Board and the Adviser place emphasis on trends and longer-term returns (focusing on one-year, three-year and five-year performance, as of December 31, 2022, or since inception, as applicable). When a fund underperforms its benchmark and/or its peer group average, the Board and the Adviser discuss the causes of such underperformance and, where necessary, they discuss specific changes to investment strategy or investment personnel. The Board noted that the Fund's performance was better than its peer group average for the one-year period and the period since the end of March 2021, the month of the Fund's inception. The Board discussed with the Adviser the level of the advisory and administration fees (together, the "management fee") for this Fund relative to comparable funds and/or other accounts advised by the Adviser and/or compared to its peers as prepared by Broadridge. In addition to the management fee, the Board also reviewed the Fund's total expense ratio. The Board noted that the Fund's management fee and total expense ratio were lower than its peer group averages. After discussion, the Board concluded that the Fund's performance, management fee and total expense ratio were competitive with its peer group averages.
Economies of Scale
The Board considered the size and growth prospects of the Fund and how that relates to the Fund's total expense ratio and particularly the Fund's management fee rate, which does not include breakpoints. In conjunction with its review of the Adviser's profitability, the Board discussed with the Adviser how a change in assets can affect the efficiency or effectiveness of managing the Fund and whether the management fee level is appropriate relative to current and projected asset levels and/or whether the management fee structure reflects economies of scale as asset levels change. The Board has determined that its review of the actual and/or potential economies of scale of the Fund supports its decision to approve the Management Agreement.
Profitability of the Adviser and Affiliates
The Board considered information concerning the costs incurred and profits realized by the Adviser and its affiliates during the last year from their relationship with the Fund and during the last two years from their relationship with the Morgan Stanley Fund Complex and reviewed with the Adviser the cost allocation methodology used to determine the profitability of the Adviser and affiliates. The Board has determined that its review of the analysis of the Adviser's expenses and profitability supports its decision to approve the Management Agreement.
28
Morgan Stanley Institutional Fund Trust
Annual Report — September 30, 2023
Investment Advisory Agreement Approval (unaudited) (cont'd)
Other Benefits of the Relationship
The Board considered other direct and indirect benefits to the Adviser and/or its affiliates derived from their relationship with the Fund and other funds advised by the Adviser. These benefits may include, among other things, fees for trading, distribution and/or shareholder servicing and for transaction processing and reporting platforms used by securities lending agents, and research received by the Adviser generated from commission dollars spent on funds' portfolio trading. The Board reviewed with the Adviser these arrangements and the reasonableness of the Adviser's costs relative to the services performed. The Board has determined that its review of the other benefits received by the Adviser or its affiliates supports its decision to approve the Management Agreement.
Resources of the Adviser and Historical Relationship Between the Fund and the Adviser
The Board considered whether the Adviser is financially sound and has the resources necessary to perform its obligations under the Management Agreement. The Board also reviewed and considered the historical relationship between the Fund and the Adviser, including the organizational structure of the Adviser, the policies and procedures formulated and adopted by the Adviser for managing the Fund's operations and the Board's confidence in the competence and integrity of the senior managers and key personnel of the Adviser. The Board concluded that the Adviser has the financial resources necessary to fulfill its obligations under the Management Agreement and that it is beneficial for the Fund to continue its relationship with the Adviser.
Other Factors and Current Trends
The Board considered the controls and procedures adopted and implemented by the Adviser and monitored by the Fund's Chief Compliance Officer and concluded that the conduct of business by the Adviser indicates a good faith effort on its part to adhere to high ethical standards in the conduct of the Fund's business.
General Conclusion
After considering and weighing all of the above factors, with various written materials and verbal information presented by the Adviser, the Board concluded that it would be in the best interest of the Fund and its shareholders to approve renewal of the Management Agreement for another year. In reaching this conclusion the Board did not give particular weight to any single piece of information or factor referenced above. The Board considered these factors and information over the course of the year and in numerous meetings, some of which were in executive session with only the independent Board members and their counsel present. It is possible that individual Board members may have weighed these factors, and the information presented, differently in reaching their individual decisions to approve the Management Agreement.
29
Morgan Stanley Institutional Fund Trust
Annual Report — September 30, 2023
Liquidity Risk Management Program (unaudited)
In compliance with Rule 22e-4 under the Investment Company Act of 1940, as amended (the "Liquidity Rule"), the Fund has adopted and implemented a liquidity risk management program (the "Program"), which is reasonably designed to assess and manage the risk that the Fund could not meet requests to redeem shares issued by the Fund without significant dilution of remaining investors' interests in the Fund (i.e., liquidity risk). The Fund's Board of Trustees (the "Board") previously approved the designation of the Liquidity Risk Subcommittee (the "LRS") as Program administrator. The LRS is comprised of representatives from various divisions within Morgan Stanley Investment Management.
At a meeting held on March 1-2, 2023, the Board reviewed a written report prepared by the LRS that addressed the Program's operation and assessed its adequacy, and effectiveness of implementation for the period from January 1, 2022, through December 31, 2022, as required under the Liquidity Rule. The report concluded that the Program operated effectively and was adequately and effectively implemented in all material aspects, and that the relevant controls and safeguards were appropriately designed to enable the LRS to administer the Program in compliance with the Liquidity Rule.
In accordance with the Program, the LRS assessed each Fund's liquidity risk no less frequently than annually taking into consideration certain factors, as applicable, such as (i) investment strategy and liquidity of portfolio investments, (ii) short-term and long-term cash flow projections and (iii) holdings of cash and cash equivalents and borrowing arrangements and other funding sources. Certain factors are considered under both normal and reasonably foreseeable stressed conditions.
Each Fund portfolio investment is classified into one of four liquidity categories, which classification is assessed at least monthly by the LRS. The classification is based on a determination of the number of days it is reasonably expected to take to convert the investment into cash, or sell or dispose of the investment, in current market conditions without significantly changing the market value of the investment. Liquidity classification determinations take into account various market, trading and investment-specific considerations, as well as market depth, and in some cases utilize third-party vendor data.
The Liquidity Rule limits a fund's investments in illiquid investments to 15% of its net assets and requires funds that do not primarily hold assets that are highly liquid investments to determine and maintain a minimum percentage of the fund's net assets to be invested in highly liquid investments (highly liquid investment minimum or "HLIM"). The LRS believes that the Program includes provisions reasonably designed to review, monitor and comply with the 15% limit on illiquid investments and for determining, periodically reviewing and complying with the HLIM requirement, as applicable.
There can be no assurance that the Program will achieve its objectives under all circumstances in the future. Please refer to the Fund's prospectus for more information regarding the Fund's exposure to liquidity risk and other risks to which it may be subject.
30
Morgan Stanley Institutional Fund Trust
Annual Report — September 30, 2023
Federal Tax Notice (unaudited)
For federal income tax purposes, the following information is furnished with respect to the distributions paid by the Fund during its taxable year ended September 30, 2023. For corporate shareholders 55.02% of the dividends qualified for the dividends received deduction.
The Fund designated and paid approximately $49,000 as a long-term capital gain distribution.
The Fund designated approximately $187,000 of its distributions paid as qualified business income.
For federal income tax purposes, the following information is furnished with respect to the Fund's earnings for its taxable year ended September 30, 2023. When distributed, certain earnings may be subject to a maximum tax rate of 15% as provided for by the Jobs and Growth Tax Relief Reconciliation Act of 2003. The Fund designated up to a maximum of approximately $1,873,000 as taxable at this lower rate.
In January, the Fund provides tax information to shareholders for the preceding calendar year.
31
Morgan Stanley Institutional Fund Trust
Annual Report — September 30, 2023
Important Notices (unaudited)
Reporting to Shareholders
Each Morgan Stanley fund provides a complete schedule of portfolio holdings in its Semi-Annual and the Annual Reports within 60 days of the end of the fund's second and fourth fiscal quarters. The Semi-Annual and Annual Reports are filed electronically with the Securities and Exchange Commission ("SEC") on Form N-CSRS and Form N-CSR, respectively. Morgan Stanley makes these reports available on its public website, www.morganstanley.com/im. Each Morgan Stanley non-money market fund also files a complete schedule of portfolio holdings with the SEC for the fund's first and third fiscal quarters as an attachment to Form N-PORT. Morgan Stanley does not deliver the reports for the first and third fiscal quarters to shareholders, but makes the complete schedule of portfolio holdings for the fund's first and third fiscal quarters available on its public website. The holdings for each money market fund are also posted to the Morgan Stanley public website. You may obtain the Form N-PORT filings (as well as the Form N-CSR and N-CSRS filings) by accessing the SEC's website, www.sec.gov. You can also request copies of these materials, upon payment of a duplicating fee, by electronic request at the SEC's email address (publicinfo@sec.gov).
Proxy Voting Policies and Procedures and Proxy Voting Record
You may obtain a copy of the Trust's Proxy Voting Policy and Procedures and information regarding how the Trust voted proxies relating to portfolio securities during the most recent twelve-month period ended June 30, without charge, upon request, by calling toll free 1 (800) 869-6397 or by visiting our website at www.morganstanley.com/im. This information is also available on the SEC's website at www.sec.gov.
This report is authorized for distribution only when preceded or accompanied by a prospectus or summary prospectus of the applicable fund of Morgan Stanley Institutional Fund Trust, which describes in detail the fund's investment policies, risks, fees and expenses. Please read the prospectus carefully before you invest or send money. For additional information, including information regarding the investments comprising the Fund, please visit our website at www.morganstanley.com/im. or call toll free 1 (800) 869-6397.
Householding Notice
To reduce printing and mailing costs, the Fund attempts to eliminate duplicate mailings to the same address. The Fund delivers a single copy of certain shareholder documents, including shareholder reports, prospectuses and proxy materials, to investors with the same last name who reside at the same address. Your participation in this program will continue for an unlimited period of time unless you instruct us otherwise. You can request multiple copies of these documents by calling 1 (800) 869-6397, 8:00 a.m. to 6:00 p.m., ET. Once our Customer Service Center has received your instructions, we will begin sending individual copies for each account within 30 days.
Tailored Shareholder Reports
Effective January 24, 2023, the SEC adopted rule and form amendments to require open-end mutual funds and ETFs to transmit concise and visually engaging streamlined annual and semiannual reports to shareholders that highlight key information. Other information, including financial statements, will no longer appear in a streamlined shareholder report but must be available online, delivered free of charge upon request, and filed on a semiannual basis on Form N-CSR. The rule and form amendments have a compliance date of July 24, 2024. At this time, management is evaluating the impact of these amendments on the shareholder reports for the Morgan Stanley Funds.
32
Morgan Stanley Institutional Fund Trust
Annual Report — September 30, 2023
U.S. Customer Privacy Notice (unaudited) April 2021
FACTS | | WHAT DOES MSIM DO WITH YOUR PERSONAL INFORMATION? | |
Why? | | Financial companies choose how they share your personal information. Federal law gives consumers the right to limit some but not all sharing. Federal law also requires us to tell you how we collect, share, and protect your personal information. Please read this notice carefully to understand what we do. | |
What? | | The types of personal information we collect and share depend on the product or service you have with us. This information can include:
◼ Social Security number and income
◼ investment experience and risk tolerance
◼ checking account number and wire transfer instructions | |
How? | | All financial companies need to share customers' personal information to run their everyday business. In the section below, we list the reasons financial companies can share their customers' personal information; the reasons MSIM chooses to share; and whether you can limit this sharing. | |
Reasons we can share your personal information | | Does MSIM share? | | Can you limit this sharing? | |
For our everyday business purposes —
such as to process your transactions, maintain your account(s), respond to court orders and legal investigations, or report to credit bureaus | | Yes | | No | |
For our marketing purposes —
to offer our products and services to you | | Yes | | No | |
For joint marketing with other financial companies | | No | | We don't share | |
For our investment management affiliates' everyday business purposes —
information about your transactions, experiences, and creditworthiness | | Yes | | Yes | |
For our affiliates' everyday business purposes —
information about your transactions and experiences | | Yes | | No | |
For our affiliates' everyday business purposes —
information about your creditworthiness | | No | | We don't share | |
For our investment management affiliates to market to you | | Yes | | Yes | |
For our affiliates to market to you | | No | | We don't share | |
For non-affiliates to market to you | | No | | We don't share | |
33
Morgan Stanley Institutional Fund Trust
Annual Report — September 30, 2023
U.S. Customer Privacy Notice (unaudited) (cont'd) April 2021
To limit our sharing | | Call toll-free (844) 312-6327 or email: imprivacyinquiries@morganstanley.com
Please note:
If you are a new customer, we can begin sharing your information 30 days from the date we sent this notice. When you are no longer our customer, we continue to share your information as described in this notice. However, you can contact us at any time to limit our sharing. | |
Questions? | | Call toll-free (844) 312-6327 or email: imprivacyinquiries@morganstanley.com | |
Who we are
Who is providing this notice? | | Morgan Stanley Investment Management Inc. and its investment management affiliates ("MSIM") (see Investment Management Affiliates definition below) | |
What we do
How does MSIM protect my personal information? | | To protect your personal information from unauthorized access and use, we use security measures that comply with federal law. These measures include computer safeguards and secured files and buildings. We have policies governing the proper handling of customer information by personnel and requiring third parties that provide support to adhere to appropriate security standards with respect to such information. | |
How does MSIM collect my personal information? | | We collect your personal information, for example, when you
◼ open an account or make deposits or withdrawals from your account
◼ buy securities from us or make a wire transfer
◼ give us your contact information
We also collect your personal information from others, such as credit bureaus, affiliates, or other companies. | |
Why can't I limit all sharing? | | Federal law gives you the right to limit only
◼ sharing for affiliates' everyday business purposes — information about your creditworthiness
◼ affiliates from using your information to market to you
◼ sharing for non-affiliates to market to you
State laws and individual companies may give you additional rights to limit sharing. See below for more on your rights under state law. | |
34
Morgan Stanley Institutional Fund Trust
Annual Report — September 30, 2023
U.S. Customer Privacy Notice (unaudited) (cont'd) April 2021
Definitions
Investment Management Affiliates | | MSIM Investment Management Affiliates include registered investment advisers, registered broker-dealers, and registered and unregistered funds in the Investment Management Division. Investment Management Affiliates does not include entities associated with Morgan Stanley Wealth Management, such as Morgan Stanley Smith Barney LLC and Morgan Stanley & Co. | |
Affiliates | | Companies related by common ownership or control. They can be financial and non-financial companies.
◼ Our affiliates include companies with a Morgan Stanley name and financial companies such as Morgan Stanley Smith Barney LLC and Morgan Stanley & Co. | |
Non-affiliates | | Companies not related by common ownership or control. They can be financial and non-financial companies.
◼ MSIM does not share with non-affiliates so they can market to you. | |
Joint marketing | | A formal agreement between non-affiliated financial companies that together market financial products or services to you.
◼ MSIM doesn't jointly market | |
Other important information
Vermont: Except as permitted by law, we will not share personal information we collect about Vermont residents with Non-affiliates unless you provide us with your written consent to share such information.
California: Except as permitted by law, we will not share personal information we collect about California residents with Non-affiliates and we will limit sharing such personal information with our Affiliates to comply with California privacy laws that apply to us.
35
Morgan Stanley Institutional Fund Trust
Annual Report — September 30, 2023
Trustees and Officers Information (unaudited)
Independent Trustees:
Name, Address and Birth Year
of Independent Trustee | | Position(s)
Held with
Registrant | | Length of Time
Served* | | Principal Occupation(s) During Past 5 Years
and Other Relevant Professional Experience | | Number of
Funds in
Fund Complex
Overseen by
Independent
Trustee** | | Other Directorships
Held by Independent
Trustee During
Past 5 Years*** | |
Frank L. Bowman
c/o Perkins Coie LLP
Counsel to the Independent Trustees
1155 Avenue of the Americas
22nd Floor
New York, NY 10036
Birth Year: 1944 | | Trustee | | Since
August
2006 | | President, Strategic Decisions, LLC (consulting) (since February 2009); Director or Trustee of various Morgan Stanley Funds (since August 2006); Chairperson of the Compliance and Insurance Committee (since October 2015); formerly, Chairperson of the Insurance Sub-Committee of the Compliance and Insurance Committee (2007-2015); served as President and Chief Executive Officer of the Nuclear Energy Institute (policy organization) (February 2005-November 2008); retired as Admiral, U.S. Navy after serving over 38 years on active duty including 8 years as Director of the Naval Nuclear Propulsion Program in the Department of the Navy and the U.S. Department of Energy (1996-2004); served as Chief of Naval Personnel (July 1994-September 1996) and on the Joint Staff as Director of Political Military Affairs (June 1992-July 1994); knighted as Honorary Knight Commander of the Most Excellent Order of the British Empire; awarded the Officier de l'Orde National du Mèrite by the French Government; elected to the National Academy of Engineering (2009). | | | 86 | | | Director of Naval and Nuclear Technologies LLP; Director Emeritus of the Armed Services YMCA; Member of the National Security Advisory Council of the Center for U.S. Global Engagement and a former member of the CNA Military Advisory Board; Chairman of the Board of Trustees of Fairhaven United Methodist Church; Member of the Board of Advisors of the Dolphin Scholarship Foundation; Director of other various nonprofit organizations; formerly, Director of BP, plc (November 2010-May 2019). | |
Frances L. Cashman
c/o Perkins Coie LLP
Counsel to the Independent
Trustees
1155 Avenue of the Americas
22nd Floor
New York, NY 10036
Birth Year: 1961 | | Trustee | | Since
February
2022 | | Chief Executive Officer, Asset Management Division, Delinian Ltd. (financial information) (May 2021-Present); Executive Vice President and various other roles, Legg Mason & Co. (asset management) (2010-2020); Managing Director, Stifel Nicolaus (2005-2010). | | | 87 | | | Trustee and Investment Committee Member, GeorgiaTech Foundation (since June 2019); Trustee and Chair of Marketing Committee, and Member of Investment Committee, Loyola Blakefield (Since September 2017); Trustee, MMI Gateway Foundation (since September 2017); Director and Investment Committee Member, Catholic Community Foundation Board (2012-2018); Director and Investment Committee Member, St. Ignatius Loyola Academy (2011-2017). | |
Kathleen A. Dennis
c/o Perkins Coie LLP
Counsel to the Independent
Trustees
1155 Avenue of the Americas
22nd Floor
New York, NY 10036
Birth Year: 1953 | | Trustee | | Since
August
2006 | | Chairperson of the Governance Committee (since January 2021), Chairperson of the Liquidity and Alternatives Sub-Committee of the Investment Committee (2006-2020) and Director or Trustee of various Morgan Stanley Funds (since August 2006); President, Cedarwood Associates (mutual fund and investment management consulting) (since July 2006); formerly, Senior Managing Director of Victory Capital Management (1993-2006). | | | 86 | | | Board Member, University of Albany Foundation (2012-present); Board Member, Mutual Funds Directors Forum (2014-present); Director of various non-profit organizations. | |
36
Morgan Stanley Institutional Fund Trust
Annual Report — September 30, 2023
Trustees and Officers Information (unaudited) (cont'd)
Independent Trustees: (cont'd)
Name, Address and Birth Year
of Independent Trustee | | Position(s)
Held with
Registrant | | Length of Time
Served* | | Principal Occupation(s) During Past 5 Years
and Other Relevant Professional Experience | | Number of
Funds in
Fund Complex
Overseen by
Independent
Trustee** | | Other Directorships
Held by Independent
Trustee During
Past 5 Years*** | |
Nancy C. Everett
c/o Perkins Coie LLP
Counsel to the Independent
Trustees
1155 Avenue of the Americas
22nd Floor
New York, NY 10036
Birth Year: 1955 | | Trustee | | Since
January
2015 | | Chairperson of the Equity Investment Committee (since January 2021); Director or Trustee of various Morgan Stanley Funds (since January 2015); Chief Executive Officer, Virginia Commonwealth University Investment Company (since November 2015); Owner, OBIR, LLC (institutional investment management consulting) (since June 2014); formerly, Managing Director, BlackRock, Inc. (February 2011-December 2013) and Chief Executive Officer, General Motors Asset Management (a/k/a Promark Global Advisors, Inc.) (June 2005-May 2010). | | | 87 | | | Formerly, Member of Virginia Commonwealth University School of Business Foundation (2005-2016); Member of Virginia Commonwealth University Board of Visitors (2013-2015); Member of Committee on Directors for Emerging Markets Growth Fund, Inc. (2007-2010); Chairperson of Performance Equity Management, LLC (2006-2010); and Chairperson, GMAM Absolute Return Strategies Fund, LLC (2006-2010). | |
Eddie A. Grier
c/o Perkins Coie LLP
Counsel to the Independent
Trustees
1155 Avenue of the Americas
22nd Floor
New York, NY 10036
Birth Year: 1955 | | Trustee | | Since
February
2022 | | Dean, Santa Clara University Leavey School of Business (since July 2021); Dean, Virginia Commonwealth University School of Business (2010-2021); President and various other roles, Walt Disney Company (entertainment and media) (1981-2010). | | | 87 | | | Director, Witt/Keiffer, Inc. (executive search) (since 2016); Director, NuStar GP, LLC (energy) (since August 2021); Director, Sonida Senior Living, Inc. (residential community operator) (2016-2021); Director, NVR, Inc. (homebuilding) (2013-2020); Director, Middleburg Trust Company (wealth management) (2014-2019); Director, Colonial Williamsburg Company (2012-2021); Regent, University of Massachusetts Global (since 2021); Director and Chair, ChildFund International (2012-2021); Trustee, Brandman University (2010-2021); Director, Richmond Forum (2012-2019). | |
37
Morgan Stanley Institutional Fund Trust
Annual Report — September 30, 2023
Trustees and Officers Information (unaudited) (cont'd)
Independent Trustees: (cont'd)
Name, Address and Birth Year
of Independent Trustee | | Position(s)
Held with
Registrant | | Length of Time
Served* | | Principal Occupation(s) During Past 5 Years
and Other Relevant Professional Experience | | Number of
Funds in
Fund Complex
Overseen by
Independent
Trustee** | | Other Directorships
Held by Independent
Trustee During
Past 5 Years*** | |
Jakki L. Haussler
c/o Perkins Coie LLP
Counsel to the Independent
Trustees
1155 Avenue of the Americas
22nd Floor
New York, NY 10036
Birth Year: 1957 | | Trustee | | Since
January
2015 | | Chairperson of the Audit Committee (since January 2023) and Director or Trustee of various Morgan Stanley Funds (since January 2015); Chairman, Opus Capital Group (since 1996); formerly, Chief Executive Officer, Opus Capital Group (1996-2019); Director, Capvest Venture Fund, LP (May 2000-December 2011); Partner, Adena Ventures, LP (July 1999-December 2010); Director, The Victory Funds (February 2005-July 2008). | | | 87 | | | Director, Vertiv Holdings Co. (VRT) (since August 2022); Director of Cincinnati Bell Inc. and Member, Audit Committee and Chairman, Governance and Nominating Committee (2008-2021); Director of Service Corporation International and Member, Audit Committee and Investment Committee; Director, Barnes Group Inc. (since July 2021); Director of Northern Kentucky University Foundation and Member, Investment Committee; Member of Chase College of Law Center for Law and Entrepreneurship Board of Advisors; Director of Best Transport (2005-2019); Director of Chase College of Law Board of Visitors; formerly, Member, University of Cincinnati Foundation Investment Committee. | |
Dr. Manuel H. Johnson
c/o Johnson Smick
International, Inc.
220 I Street, NE
Suite 200
Washington, D.C. 20002
Birth Year: 1949 | | Trustee | | Since
July
1991 | | Senior Partner, Johnson Smick International, Inc. (consulting firm); Chairperson of the Fixed Income, Liquidity and Alternatives Investment Committee (since January 2021), Chairperson of the Investment Committee (2006-2020) and Director or Trustee of various Morgan Stanley Funds (since July 1991); Co-Chairman and a founder of the Group of Seven Council (G7C) (international economic commission); formerly, Chairperson of the Audit Committee (July 1991-September 2006); Vice Chairman of the Board of Governors of the Federal Reserve System and Assistant Secretary of the U.S. Treasury. | | | 86 | | | Director of NVR, Inc. (home construction). | |
38
Morgan Stanley Institutional Fund Trust
Annual Report — September 30, 2023
Trustees and Officers Information (unaudited) (cont'd)
Independent Trustees: (cont'd)
Name, Address and Birth Year
of Independent Trustee | | Position(s)
Held with
Registrant | | Length of Time
Served* | | Principal Occupation(s) During Past 5 Years
and Other Relevant Professional Experience | | Number of
Funds in
Fund Complex
Overseen by
Independent
Trustee** | | Other Directorships
Held by Independent
Trustee During
Past 5 Years*** | |
Joseph K. Kearns
c/o Perkins Coie LLP
Counsel to the Independent
Trustees
1155 Avenue of the Americas
22nd Floor
New York, NY 10036
Birth Year: 1942 | | Trustee | | Since
August
1994 | | Senior Adviser, Kearns & Associates LLC (investment consulting); Chairperson of the Audit Committee (2006-2022) and Director or Trustee of various Morgan Stanley Funds (since August 1994); formerly, Deputy Chairperson of the Audit Committee (July 2003-September 2006); CFO of the J. Paul Getty Trust (1982-1999). | | | 87 | | | Director, Rubicon Investments (since February 2019); Prior to August 2016, Director of Electro Rent Corporation (equipment leasing); Prior to December 31, 2013, Director of The Ford Family Foundation. | |
Michael F. Klein
c/o Perkins Coie LLP
Counsel to the Independent
Trustees
1155 Avenue of the Americas
22nd Floor
New York, NY 10036
Birth Year: 1958 | | Trustee | | Since
August
2006 | | Chairperson of the Risk Committee (since January 2021); Managing Director, Aetos Alternatives Management, LP (since March 2000); Co-President, Aetos Alternatives Management, LP (since January 2004) and Co-Chief Executive Officer of Aetos Alternatives Management, LP (since August 2013); Chairperson of the Fixed Income Sub-Committee of the Investment Committee (2006-2020) and Director or Trustee of various Morgan Stanley Funds (since August 2006); formerly, Managing Director, Morgan Stanley & Co. Inc. and Morgan Stanley Dean Witter Investment Management and President, various Morgan Stanley Funds (June 1998-March 2000); Principal, Morgan Stanley & Co. Inc. and Morgan Stanley Dean Witter Investment Management (August 1997-December 1999). | | | 86 | | | Director of certain investment funds managed or sponsored by Aetos Alternatives Management, LP; Director of Sanitized AG and Sanitized Marketing AG (specialty chemicals). | |
Patricia A. Maleski
c/o Perkins Coie LLP
Counsel to the Independent
Trustees
1155 Avenue of the Americas
22nd Floor
New York, NY 10036
Birth Year: 1960 | | Trustee | | Since
January
2017 | | Director or Trustee of various Morgan Stanley Funds (since January 2017); Managing Director, JPMorgan Asset Management (2004-2016); Oversight and Control Head of Fiduciary and Conflicts of Interest Program (2015-2016); Chief Control Officer—Global Asset Management (2013-2015); President, JPMorgan Funds (2010-2013); Chief Administrative Officer (2004-2013); various other positions including Treasurer and Board Liaison (since 2001). | | | 87 | | | Trustee (since January 2022) and Treasurer (since January 2023), Nutley Family Service Bureau, Inc. | |
W. Allen Reed
c/o Perkins Coie LLP
Counsel to the Independent
Trustees
1155 Avenue of the Americas
22nd Floor
New York, NY 10036
Birth Year: 1947 | | Chair of the Board and Trustee | | Chair of the Board since August 2020 and Trustee since August 2006 | | Chair of the Boards of various Morgan Stanley Funds (since August 2020); Director or Trustee of various Morgan Stanley Funds (since August 2006); formerly, Vice Chair of the Boards of various Morgan Stanley Funds (January 2020-August 2020); President and Chief Executive Officer of General Motors Asset Management; Chairman and Chief Executive Officer of the GM Trust Bank and Corporate Vice President of General Motors Corporation (August 1994-December 2005). | | | 86 | | | Formerly, Director of Legg Mason, Inc. (2006-2019); and Director of the Auburn University Foundation (2010-2015). | |
* This is the earliest date the Trustee began serving the Morgan Stanley Funds. Each Trustee serves an indefinite term, until his or her successor is elected.
** The Fund Complex includes (as of December 31, 2022) all open-end and closed-end funds (including all of their portfolios) advised by Morgan Stanley Investment Management Inc. (the "Adviser") and any funds that have an adviser that is an affiliated person of the Adviser (including, but not limited to, Morgan Stanley AIP GP LP).
*** This includes any directorships at public companies and registered investment companies held by the Trustees at any time during the past five years.
39
Morgan Stanley Institutional Fund Trust
Annual Report — September 30, 2023
Trustees and Officers Information (unaudited) (cont'd)
Executive Officers:
Name, Address and Birth Year
of Executive Officer | | Position(s) Held
with
Registrant | | Length of
Time Served* | | Principal Occupation(s) During Past 5 Years | |
John H. Gernon
522 Fifth Avenue
New York, NY 10036
Birth Year: 1963 | | President and Principal Executive Officer | | Since
September
2013 | | President and Principal Executive Officer of the Equity and Fixed Income Funds and the Morgan Stanley AIP Funds (since September 2013) and the Liquidity Funds and various money market funds (since May 2014) in the Fund Complex; Managing Director of the Adviser. | |
Deidre A. Downes
1633 Broadway
New York, NY 10019
Birth Year: 1977 | | Chief Compliance Officer | | Since
November
2021 | | Executive Director of the Adviser (since January 2021) and Chief Compliance Officer of various Morgan Stanley Funds (since November 2021). Formerly, Vice President and Corporate Counsel at PGIM and Prudential Financial (October 2016-December 2020). | |
Francis J. Smith
522 Fifth Avenue
New York, NY 10036
Birth Year: 1965 | | Treasurer and Principal Financial Officer | | Treasurer since July 2003 and Principal Financial Officer since September
2002 | | Managing Director of the Adviser and various entities affiliated with the Adviser; Treasurer (since July 2003) and Principal Financial Officer of various Morgan Stanley Funds (since September 2002). | |
Mary E. Mullin
1633 Broadway
New York, NY 10019
Birth Year: 1967 | | Secretary | | Since
June
1999 | | Managing Director of the Adviser; Secretary of various Morgan Stanley Funds (since June 1999). | |
Michael J. Key
522 Fifth Avenue
New York, NY 10036
Birth Year: 1979 | | Vice President | | Since
June
2017 | | Vice President of the Equity and Fixed Income Funds, Liquidity Funds, various money market funds and the Morgan Stanley AIP Funds in the Fund Complex (since June 2017); Managing Director of the Adviser; Head of Product Development for Equity and Fixed Income Funds (since August 2013). | |
The Fund's statement of additional information includes further information about the Fund's Trustees and Officers, and is available without charge by visiting www.morganstanley.com/im or upon request by calling 1 (800) 869-6397.
* This is the earliest date the officer began serving the Morgan Stanley Funds. Each officer serves an indefinite term, until his or her successor is elected.
40
Morgan Stanley Institutional Fund Trust
Annual Report — September 30, 2023
Adviser and Administrator
Morgan Stanley Investment Management Inc.
522 Fifth Avenue
New York, New York 10036
Distributor
Morgan Stanley Distribution, Inc.
522 Fifth Avenue
New York, New York 10036
Dividend Disbursing and Transfer Agent
SS&C Global Investor & Distribution Solutions, Inc.
P.O. Box 219804
Kansas City, Missouri 64121-9804
Co-Transfer Agent
Eaton Vance Management
Two International Place
Boston, Massachusetts 02110
Custodian
State Street Bank and Trust Company
One Congress Street
Boston, Massachusetts 02114
Legal Counsel
Dechert LLP
1095 Avenue of the Americas
New York, New York 10036
Counsel to the Independent Trustees
Perkins Coie LLP
1155 Avenue of the Americas,
22nd Floor
New York, New York 10036
Independent Registered Public Accounting Firm
Ernst & Young LLP
200 Clarendon Street
Boston, Massachusetts 02116
41
Printed in U.S.A.
This Report has been prepared for shareholders and may be distributed to others only if preceded or accompanied by a current prospectus.
Morgan Stanley Investment Management Inc.
522 Fifth Avenue
New York, New York 10036
© 2023 Morgan Stanley. Morgan Stanley Distribution, Inc.

IFTDYVANN
6045098 EXP 11.30.24

Morgan Stanley Institutional Fund Trust
Global Strategist
Portfolio
Annual Report
September 30, 2023

Morgan Stanley Institutional Fund Trust
Annual Report — September 30, 2023
Table of Contents (unaudited)
Shareholders' Letter | | | 2 | | |
Consolidated Expense Example | | | 3 | | |
Investment Overview | | | 4 | | |
Consolidated Portfolio of Investments | | | 9 | | |
Consolidated Statement of Assets and Liabilities | | | 40 | | |
Consolidated Statement of Operations | | | 42 | | |
Consolidated Statements of Changes in Net Assets | | | 43 | | |
Consolidated Financial Highlights | | | 45 | | |
Notes to Consolidated Financial Statements | | | 50 | | |
Report of Independent Registered Public Accounting Firm | | | 63 | | |
Investment Advisory Agreement Approval | | | 64 | | |
Liquidity Risk Management Program | | | 66 | | |
Federal Tax Notice | | | 67 | | |
Important Notices | | | 68 | | |
U.S. Customer Privacy Notice | | | 69 | | |
Trustees and Officers Information | | | 72 | | |
This report is authorized for distribution only when preceded or accompanied by a prospectus or summary prospectus of the applicable Fund of the Morgan Stanley Institutional Fund Trust. To receive a prospectus and/or statement of additional information ("SAI"), which contains more complete information such as investment objectives, charges, expenses, policies for voting proxies, risk considerations and describes in detail each of the Fund's investment policies to the prospective investor, please call toll free 1 (800) 869-6397. Please read the prospectuses carefully before you invest or send money.
Additionally, you can access information about the Fund, including performance, characteristics and investment team commentary through Morgan Stanley Investment Management's website: www.morganstanley.com/im.
Market forecasts provided in this report may not necessarily come to pass. There is no guarantee that any sectors mentioned will continue to perform as discussed herein or that securities in such sectors will be held by the Fund in the future. There is no assurance that a fund will achieve its investment objective. Funds are subject to market risk, which is the possibility that market values of securities owned by the Fund will decline and, therefore, the value of the Fund's shares may be less than what you paid for them. Accordingly, you can lose money investing in this Fund. Please see the prospectus for more complete information on investment risks.
1
Morgan Stanley Institutional Fund Trust
Annual Report — September 30, 2023
Shareholders' Letter (unaudited)
Dear Shareholders,
We are pleased to provide this Annual Report, in which you will learn how your investment in Global Strategist Portfolio (the "Fund") performed during the latest twelve-month period.
Morgan Stanley Investment Management is a client-centric, investor-led organization. Our global presence, intellectual capital, and breadth of products and services enable us to partner with investors to meet the evolving challenges of today's financial markets. We aim to deliver superior investment service and to empower our clients to make the informed decisions that help them reach their investment goals.
As always, we thank you for selecting Morgan Stanley Investment Management, and look forward to working with you in the months and years ahead.
Sincerely,

John H. Gernon
President and Principal Executive Officer
October 2023
2
Morgan Stanley Institutional Fund Trust
Annual Report — September 30, 2023
Consolidated Expense Example (unaudited)
Global Strategist Portfolio
As a shareholder of the Fund, you may incur two types of costs: (1) transactional costs, including sales charge (loads) on purchase payments; and (2) ongoing costs, which may include advisory fees, administration fees, distribution and shareholder services fees; and other Fund expenses. This example is intended to help you understand your ongoing costs (in dollars) of investing in the Fund and to compare these costs with the ongoing costs of investing in other mutual funds.
This example is based on an investment of $1,000 invested at the beginning of the six-month period ended September 30, 2023 and held for the entire six-month period.
Actual Expenses
The table below provides information about actual account values and actual expenses. You may use the information in this table, together with the amount you invested, to estimate the expenses that you paid over the period. Simply divide your account value by $1,000 (for example, an $8,600 account value divided by $1,000 = 8.6), then multiply the result by the number in the table under the heading entitled "Actual Expenses Paid During Period" to estimate the expenses you paid on your account during this period.
Hypothetical Example for Comparison Purposes
The table below provides information about hypothetical account values and hypothetical expenses based on the Fund's actual expense ratio and an assumed rate of return of 5% per year before expenses, which is not the Fund's actual return. The hypothetical account values and expenses may not be used to estimate the actual ending account balance or expenses you paid for the period. You may use this information to compare the ongoing costs of investing in the Fund and other funds. To do so, compare this 5% hypothetical example with the 5% hypothetical examples that appear in the shareholder reports of the other funds.
Please note that the expenses shown in the table are meant to highlight your ongoing costs only and do not reflect any transactional costs, such as sales charges (loads, if applicable). Therefore, the information for each class in the table is useful in comparing ongoing costs only, and will not help you determine the relative total costs of owning different funds. In addition, if these transactional costs were included, your costs would have been higher.
| | | Beginning
Account
Value
4/1/23 | | Actual Ending
Account
Value
9/30/23 | | Hypothetical
Ending Account
Value | | Actual
Expenses
Paid
During
Period* | | Hypothetical
Expenses Paid
During Period* | | Net
Expense
Ratio
During
Period** | |
Global Strategist Portfolio Class I | | $ | 1,000.00 | | | $ | 990.30 | | | $ | 1,021.46 | | | $ | 3.59 | | | $ | 3.65 | | | | 0.72 | % | |
Global Strategist Portfolio Class A | | | 1,000.00 | | | | 988.90 | | | | 1,020.01 | | | | 5.04 | | | | 5.11 | | | | 1.01 | | |
Global Strategist Portfolio Class L | | | 1,000.00 | | | | 986.00 | | | | 1,017.35 | | | | 7.67 | | | | 7.79 | | | | 1.54 | | |
Global Strategist Portfolio Class C | | | 1,000.00 | | | | 984.40 | | | | 1,015.94 | | | | 9.05 | | | | 9.20 | | | | 1.82 | | |
Global Strategist Portfolio Class R6 | | | 1,000.00 | | | | 989.70 | | | | 1,021.61 | | | | 3.44 | | | | 3.50 | | | | 0.69 | | |
* Expenses are calculated using each Fund Class' annualized net expense ratio (as disclosed), multiplied by the average account value over the period and multiplied by 183/365 (to reflect the most recent one-half year period).
** Annualized.
3
Morgan Stanley Institutional Fund Trust
Annual Report — September 30, 2023
Investment Overview (unaudited)
Global Strategist Portfolio
The Fund seeks above-average total return over a market cycle of three to five years.
Performance
For the fiscal year ended September 30, 2023, the Fund's Class I shares had a total return based on net asset value and reinvestment of distributions per share of 13.72%, net of fees. The Fund's Class I shares underperformed the Fund's primary benchmark, the MSCI All Country World Index (ACWI), which returned 20.80%, but outperformed the Customized MSIM Global Allocation Index (the "Customized Index"), which returned 13.18%.
Factors Affecting Performance(i)
• During the 12-month period under review, global equities rallied +20.8% (MSCI ACWI) and commodities gained +10.9% (S&P GSCI Index) while bonds were flat (J.P. Morgan Global Government Bond Index +0.2%).(ii) Increasingly oversold sentiment and extremely bearish positioning caused markets to bottom at the start of the period, setting equity markets up for a reversal of the preceding bear market. As several economic reports revealed a more resilient economy than expected, investors started to abandon their expectations of an inevitable recession and turned optimistic that a soft landing might still be achieved in the U.S. and globally. Although significant turmoil in the U.S. regional banking sector caused the equity market to give back some of its gains in
March 2023, the rally resumed in May 2023 after reports of soaring demand for artificial intelligence (AI) semiconductors, which sparked investors' excitement surrounding AI's potential to increase economic productivity. The market rally cooled off again over the summer through the end of the reporting period as investors worried that central banks might be forced to keep policy rates higher for longer in response to a stronger-than-expected economy, thereby increasing the odds of tipping the economy into recession.
• Within equities (MSCI ACWI), technology-heavy sectors such as information technology (+34.7%), communication services (+27.6%) and consumer discretionary (+15.4%) saw the biggest gains, while defensive sectors such as utilities (-2.7%) and staples lagged (+5.9%). Developed markets outperformed, with the MSCI World Index returning +22.0% and the MSCI Emerging Markets Index returning +11.7%. Within developed markets, the U.S. (S&P 500 Index +21.6%) underperformed Europe and Japan (MSCI Europe Index +28.8%, MSCI Japan Index +25.9%), supported by a weaker U.S. dollar, falling energy prices helping to avert a recession in Europe, and the era of deflation coming to an end in Japan. Emerging markets were held back by a weaker-than-expected post-COVID recovery in China and persistent headwinds from the country's real estate sector.
(i) Certain of the Fund's investment themes may, in whole or part, be implemented through the use of derivatives, including the purchase and sale of futures, options, swaps, structured investments (including commodity-linked notes) and other related instruments and techniques. The Fund may also invest in foreign currency forward exchange contracts, which are also derivatives, in connection with its investments in foreign securities. The Fund may use derivative instruments for a variety of purposes, including hedging, risk management, portfolio management or to earn income. As a result, the use of derivatives had a material effect on the Fund's performance during the period.
(ii) Except where noted, equity market returns are represented by the MSCI regional, sector, or country index and are calculated in U.S. dollars USD. Data sources used in preparation of this commentary include FactSet and Bloomberg LP. data as of September 30, 2023. The following indexes are used in this report: The J.P. Morgan Global Government Bond Index is a market value weighted fixed income index comprised of government bonds in developed countries. The S&P GSCI Commodity Index is a composite index of commodity sector returns, representing an unleveraged, long only investment in commodity futures that is broadly diversified across the spectrum of commodities. The MSCI World Net Index is a free float-adjusted market capitalization weighted index that is designed to measure the global equity market performance of developed markets. The term "free float" represents the portion of shares outstanding that are deemed to be available for purchase in the public equity markets by investors. The MSCI Emerging Markets Net Index is a free float-adjusted market capitalization weighted index that is designed to measure equity market performance of emerging markets. The MSCI Emerging Markets Index currently consists of 23 emerging-market country indices. The Standard & Poor's 500® Index (S&P 500®) measures the performance of the large cap segment of
the U.S. equities market, covering approximately 80% of the U.S. equities market. The index includes 500 leading companies in leading industries of the U.S. economy. The MSCI Europe Index is a free float-adjusted market capitalization index that is designed to measure developed market equity performance in Europe. The MSCI Japan Index is a free float-adjusted market capitalization weighted index that is designed to track the equity market performance of Japanese securities listed on the Tokyo Stock Exchange, Osaka Stock Exchange, JASDAQ and Nagoya Stock Exchange. The U.S. Dollar Index (DXY) is an index of the value of the United States dollar relative to a basket of foreign currencies, often referred to as a basket of U.S. trade partners' currencies. "Bloomberg®" and the Bloomberg Index/Indices used are service marks of Bloomberg Finance L.P. and its affiliates, and have been licensed for use for certain purposes by Morgan Stanley Investment Management (MSIM). Bloomberg is not affiliated with MSIM, does not approve, endorse, review, or recommend any product, and does not guarantee the timeliness, accurateness, or completeness of any data or information relating to any product. The J.P. Morgan Emerging Market Currency Index (EMCI) is a fixed weight tradable version of the Emerging Local Market Index (ELMI+ index), tracking 10 liquid currencies across Latin America, Asia and Central & Eastern Europe, Middle East, Africa (CEEMEA) vs. USD. The ELMI+ tracks total returns for local-currency denominated money market instruments in 23 emerging market countries. The ELMI+ employs a liquidity-sensitive weighting system, which uses exports plus imports as a base. The Russell 1000® Index measures the performance of the large-cap segment of the U.S. equity universe. The indexes do not include any expenses, fees or sales charges, which would have lower performance. The indexes are unmanaged and should not be considered an investment. It is not possible to invest directly in an index.
4
Morgan Stanley Institutional Fund Trust
Annual Report — September 30, 2023
Investment Overview (unaudited) (cont'd)
Global Strategist Portfolio
• Government bonds returned +0.2% (J.P. Morgan Global Government Bond Index), giving up most of their gains following a series of economic reports indicating insufficient progress in the fight against inflation in several developed market countries. With stickier-than-expected core inflation readings, investors increased their bets that the Federal Reserve (Fed) and the European Central Bank (ECB) would be forced to raise rates higher and keep them there for longer. After completing 225 basis points (bps) and 325 bps of rate hikes, respectively, during the period, both the Fed and the ECB signaled a likely pause at current levels but left the door open for potential further rate hikes depending on incoming economic data.(iii) The U.S. yield curve remained inverted for the entire period, its longest inversion since 1981. The 2-year Treasury yield rose 76 bps to 5.04% while the 10-year Treasury yield rose 74 bps to 4.57%. German bund yields also rose, with the 2-year yield rising 144 bps to 3.20% and the 10-year yield rising 73 bps to 2.84%.
• Commodity prices rose +10.9% (S&P GSCI Index), driven entirely by a recovery in the last four months of the period. Oil prices peaked early in the period at $98.6 per barrel (Brent) and fell –27.1% to $71.8 per barrel on reports of weakening demand in several developed market countries and China. In response to collapsing oil prices, Saudi Arabia implemented steep cuts to its oil production over the summer, pushing prices back up to $95.3 per barrel by the end of the period as the supply-demand balance shifted into deficit.
• The U.S. dollar fell –5.3% (DXY Index) as decreasing policy rate differentials between the Fed and other central banks worked against the greenback. All major currencies, with exception of the yen (–3.1%), gained versus the dollar, with the British pound rising 9.2% and the euro +7.9%. Emerging market currencies declined –3.8% (J.P. Morgan Emerging Market Currency Index), pulled lower by the Turkish lira (–32.5%) and the Argentine peso (–57.4%).
• Regarding the Fund's overall performance relative to the Customized Index, the Fund's asset allocation mix of an average overweight to fixed income and equities had a positive impact on performance.
• Active positions within equities contributed positively to performance. The main contributors were in our Value Recovery theme, including overweights in Value stocks in Japan, Korea and the eurozone, vs. Anti-Value stocks in those regions.(iv) Other significant contributors included a directional overweight in eurozone equities and an underweight in global luxury stocks vs. global equities. Detractors from performance included overweights in iron ore miners vs. global equities, and in U.S. exploration and producer stocks vs. U.S. equities.
• Active positions within fixed income contributed negatively to performance. Directional overweights in U.S. 10-year Treasury inflation-protected securities (TIPS); in Brazil 2-, 3- and 5-year bonds; and in Australia 10-year bonds were the largest detractors. Contributors included overweights in Brazil 2-, 3- and 4-year bonds vs. U.S. 5-year Treasuries, and in Greece 10-year bonds vs. Italy 10-year bonds.
• Active positions within commodities had a positive impact on performance as directional overweights in crude oil and gold contributed to performance while an underweight in Bitcoin detracted.(v) Bitcoin is considered a commodity by the Commodity Futures Trading Commission and Securities and Exchange Commission.
• Active currency positions (implemented via currency forwards and futures) negatively impacted performance. The main detractors from performance were an overweight in the Japanese yen vs. the U.S. dollar and an underweight in the New Zealand dollar vs. a developed market currency basket. Contributors to performance included an overweight in developed market
(iii) One basis point = 0.01%
(iv) The Global Multi-Asset (GMA) Team identifies Value as the cheapest 20% and Anti-Value as the most expensive 20% of stocks for each industry group within the Russell 1000® Index universe based on six valuation metrics, including forward price-to-earnings (P/E) ratio and free cash flow yield.
(v) Cryptocurrency (notably, Bitcoin) operates as a decentralized, peer-to-peer financial exchange and value storage that is used like money. It is not backed by any government. Federal, state or foreign governments may restrict the use and exchange of cryptocurrency. Cryptocurrency may experience very high volatility.
5
Morgan Stanley Institutional Fund Trust
Annual Report — September 30, 2023
Investment Overview (unaudited) (cont'd)
Global Strategist Portfolio
currencies vs. the U.S. dollar and in the Chinese yuan vs. a trade-weighted currency basket.
Management Strategies
• Following the recent signals of a more resilient economy, the consensus has shifted toward accepting a soft-landing scenario as its new base case, suggesting hopes for the start of a new bull market. We disagree with this narrative and continue to anticipate a near-term recession. We believe that the Fed has only recently achieved a tight monetary policy setting, which will take a few more months to impact the real economy. Additionally, household excess savings have fallen from a high of $2.1 trillion during the pandemic to just $0.7 trillion and are likely to run out by year-end.(vi) These factors in combination with extreme valuations in U.S. markets make it unlikely, in our view, that a new bull market is underway as bull markets generally start at the beginning of economic expansions at depressed valuations.
• At the asset class level, we are overweight commodities (gold) and fixed income (TIPS) based on our expectations of outperformance over the next 6 to 12 months, as U.S. growth slows and real rates decline. Since the price of gold last peaked in May 2023, U.S. 10-year TIPS yields have increased by 115 bps, the sharpest increase in real yields since 2022. This contributed to gold significantly underperforming over the past six months as the precious metal is sensitive to higher real rates. We believe TIPS yields have risen too far, however, and real rates are now too high relative to our fundamental expectations for U.S. gross domestic product (GDP) growth and monetary policy. If we're correct that the U.S. economy will likely enter a recession in the next 12 months, we would expect the U.S. Fed to cut interest rates aggressively later in 2024, and for TIPS yields to decline by 100 to 200 bps. If TIPS yields decline, speculative demand for gold should increase, driving prices higher in the short term. Historically, the gold spot price has increased by roughly 10% for every 100 bps of lower TIPS yields (all else equal). Furthermore, the U.S. dollar has historically been negatively correlated with gold, with dollar depreciation leading to gold simultaneously outperforming.
With the dollar now very expensive on a real effective exchange rate (REER) basis, and the economic growth slowdown likely to be larger in the U.S. versus other global economies, we see significant downside to the dollar from current levels which would likely benefit gold.
• Within the U.S., we are underweight cyclical stocks relative to defensives. After significant outperformance by cyclicals year-to-date through September 2023, we now see meaningful downside to the basket in both the short and medium term. Cyclical equities typically track absolute growth trends, demonstrating a strong positive correlation to U.S. and global purchasing manager's indexes (PMIs) in the short term. Although PMIs have been declining for several months, cyclicals have continued to outperform defensive equities. This has created a short-term gap between performance and macro fundamentals, increasing the likelihood of cyclical equities underperforming in the near term all else equal. We estimate an approximate 10% drawdown in cyclicals relative to defensive equities is necessary to properly factor in current PMI levels. If we're correct in our recession view, we would also expect PMIs to continue declining over the next 6 to 12 months, leading to more than 25% underperformance of cyclical equities over that period. Lastly, cyclicals are also very expensive compared to defensives as we are near all-time high relative multiples, excluding recessionary periods.
• The largest theme in our portfolio continues to be our Value Recovery theme, with overweight positions in U.S., European Union, Japan and Korea Value stocks vs. Anti-Value stocks. Recently, positive trends have been re-established, and we are maintaining trading discipline in a theme we believe has very attractive return potential. From a valuation perspective, Value continues to look attractive relative to Anti Value globally, with U.S. Value extremely cheap on a relative basis. On our composite measure of valuation, relative to Anti-Value, Value stocks trade at a 26% discount to fair value, only cheaper 10% of the time in the past 50 years, and one that historically has led to outsized returns.(vii) Especially in Europe, Value stocks are cheaper (relative to Anti-Value) than they were at the peak of the tech bubble in 2000.(vii)
(vi) Source: MSIM Global Multi-Asset Team analysis, FactSet, Haver Analytics as of August 25, 2023.
(vii) Source: FactSet, MSIM Global Multi-Asset Team anaylsis.
6
Morgan Stanley Institutional Fund Trust
Annual Report — September 30, 2023
Investment Overview (unaudited) (cont'd)
Global Strategist Portfolio
• In addition to our Value Recovery theme, we maintain high conviction in our Weak China Growth theme as we continue to believe that China has likely entered a balance sheet recession due to massive debt build-up over the past two decades. Overall debt-to-GDP has risen 160% since 2009 to 297% in 2022, causing the private non-financial debt service ratio to rise to 21%, to the detriment of the consumer. As a result, a radical shift in government policy and disciplined deleveraging will be required to lift the Chinese economy out of its growth slump. Consensus is expecting government stimulus to save the economy via traditional fiscal and monetary stimulus. So far, these hopes have been consistently disappointed, with the latest Politburo messaging lacking any prospects of strong stimulus in the near term. With the official policy goals shifting from GDP growth to security and reduction of financial risks, we believe that non-traditional stimulus measures such as renminbi depreciation or recapitalizations and restructurings will need to be considered to alleviate the country's debt problem.

* Minimum Investment
In accordance with SEC regulations, the Fund's performance shown assumes that all recurring fees (including management fees) were deducted and all dividends and distributions were reinvested. The performance of Class A, Class L, Class C and Class R6 shares will vary from the performance of Class I shares based upon their different inception dates and will be negatively impacted by additional fees assessed to those classes (where applicable).
7
Morgan Stanley Institutional Fund Trust
Annual Report — September 30, 2023
Investment Overview (unaudited) (cont'd)
Global Strategist Portfolio
Performance Compared to the MSCI All Country World Index(1), the Customized MSIM Global Allocation Index(2) and the Lipper Flexible Portfolio Funds Index(3)
| | | Period Ended September 30, 2023
Total Returns(4) | |
| | | | | Average Annual | |
| | | One
Year | | Five
Years | | Ten
Years | | Since
Inception(10) | |
Fund — Class I Shares
w/o sales charges(5) | | | 13.72 | % | | | 2.93 | % | | | 3.81 | % | | | 6.54 | % | |
Fund — Class A Shares
w/o sales charges(6) | | | 13.35 | | | | 2.60 | | | | 3.48 | | | | 5.51 | | |
Fund — Class A Shares
with maximum 5.25%
sales charges(6) | | | 7.43 | | | | 1.50 | | | | 2.92 | | | | 5.29 | | |
Fund — Class L Shares
w/o sales charges(7) | | | 12.69 | | | | 2.07 | | | | 2.95 | | | | 3.98 | | |
Fund — Class C Shares
w/o sales charges(8) | | | 12.45 | | | | 1.78 | | | | — | | | | 2.21 | | |
Fund — Class C Shares
with maximum 1.00%
deferred sales charges(8) | | | 11.45 | | | | 1.78 | | | | — | | | | 2.21 | | |
Fund — Class R6 Shares
w/o sales charges(9) | | | 13.64 | | | | 2.95 | | | | — | | | | 3.51 | | |
MSCI All Country World Index | | | 20.80 | | | | 6.46 | | | | 7.56 | | | | 7.59 | | |
Customized MSIM Global
Allocation Index | | | 13.18 | | | | 3.44 | | | | 4.21 | | | | 6.05 | | |
Lipper Flexible Portfolio Funds
Index | | | 13.11 | | | | 5.02 | | | | 5.68 | | | | 6.58 | | |
Performance data quoted represents past performance, which is no guarantee of future results, and current performance may be lower or higher than the figures shown. Performance assumes that all dividends and distributions, if any, were reinvested. For the most recent month-end performance figures, please visit www.morganstanley.com/im. Investment returns and principal value will fluctuate so that Fund shares, when redeemed, may be worth more or less than their original cost. Total returns do not reflect the deduction of taxes that a shareholder would pay on Fund distributions or the redemption of Fund shares. Performance of share classes will vary due to differences in sales charges and expenses. The Fund returns are calculated based on the net asset value as of the last business day of the period.
(1) The MSCI All Country World Index (ACWI) is a free float-adjusted market capitalization weighted index designed to measure the equity market performance of developed and emerging markets. The term "free float" represents the portion of shares outstanding that are deemed to be available for purchase in the public equity markets by investors. The performance of the Index is listed in U.S. dollars and assumes reinvestment of net dividends. Net total return indices reinvest dividends after the deduction of withholding taxes, using (for international indices) a tax rate applicable to non-resident institutional investors who do not benefit from double taxation treaties. Returns, including periods prior to January 1, 2001, are calculated using the return data of the MSCI All Country World Index (gross dividends) through December 31, 2000 and the return data of the MSCI All Country World Index (net dividends) after December 31, 2000. The Index is unmanaged and its returns do not include any sales charges or fees. Such costs would lower performance. It is not possible to invest directly in an index.
(2) The Customized MSIM Global Allocation Index is a performance linked benchmark comprised of 60% MSCI All Country World Index and 40% Bloomberg Global Aggregate Index for periods after May 31, 2017. Prior to May 31, 2017, the Customized MSIM Global Allocation Index consisted of 60% MSCI All Country World Index (benchmark that measures the equity market performance of developed and emerging markets), 30% Bloomberg Global Aggregate Index (benchmark that provides a broadbased measure of the global investment grade fixed-rate debt markets), 5% S&P GSCI Light Energy Index (benchmark for investment performance in the energy commodity market) and 5% ICE BofA U.S. Dollar 1-Month LIBID Average Index (benchmark that tracks the performance of a basket of synthetic assets paying LIBID to a stated maturity). The Customized MSIM Global Allocation Index was added as the Fund benchmark on October 2, 2013 and is provided for comparative purposes only. The Index is unmanaged and its returns do not include any sales charges or fees. Such costs would lower performance. It is not possible to invest directly in an index.
(3) The Lipper Flexible Portfolio Funds Index is an equally weighted performance index of the largest qualifying funds (based on net assets) in the Lipper Flexible Portfolio Funds classification. The Index, which is adjusted for capital gains distributions and income dividends, is unmanaged and should not be considered an investment. There are currently 30 funds represented in this Index. As of the date of this report, the Fund was in the Lipper Flexible Portfolio Funds classification.
(4) Total returns for the Fund reflect expenses waived and/or reimbursed, if applicable, by the Adviser. Without such waivers and/or reimbursements, total returns would have been lower.
(5) Commenced operations on December 31, 1992.
(6) Commenced offering on November 1, 1996.
(7) Commenced offering on April 27, 2012.
(8) Commenced offering on April 30, 2015. Class C shares will generally convert to Class A shares approximately eight years after the end of the calendar month in which the shares were purchased. Performance for periods greater than eight years reflects this conversion (beginning April 2023).
(9) Commenced offering on May 29, 2015.
(10) For comparative purposes, average annual since inception returns listed for the Indexes refer to the inception date of Class I of the Fund, not the inception of the Indexes.
8
Morgan Stanley Institutional Fund Trust
Annual Report — September 30, 2023
Consolidated Portfolio of Investments
Global Strategist Portfolio
| | | Face
Amount
(000) | | Value
(000) | |
Fixed Income Securities (43.9%) | |
Agency Fixed Rate Mortgages (3.6%) | |
United States (3.6%) | |
Federal Home Loan Mortgage Corporation,
Conventional Pools: | |
2.50%, 4/1/52 | | $ | 2,480 | | | $ | 1,892 | | |
4.50%, 1/1/49 | | | 59 | | | | 55 | | |
Gold Pools: | |
3.50%, 1/1/44 - 6/1/45 | | | 461 | | | | 407 | | |
4.50%, 1/1/49 | | | 15 | | | | 14 | | |
6.50%, 5/1/32 | | | 20 | | | | 21 | | |
7.50%, 5/1/35 | | | 1 | | | | 2 | | |
Federal National Mortgage Association, | |
Conventional Pools: | |
2.00%, 3/1/52 | | | 1,837 | | | | 1,399 | | |
2.50%, 9/1/52 | | | 2,908 | | | | 2,310 | | |
3.00%, 7/1/49 - 6/1/52 | | | 5,097 | | | | 4,236 | | |
3.50%, 3/1/47 - 1/1/51 | | | 993 | | | | 867 | | |
4.00%, 4/1/45 - 9/1/45 | | | 491 | | | | 447 | | |
4.50%, 3/1/41 - 11/1/44 | | | 76 | | | | 72 | | |
5.00%, 1/1/41 - 3/1/41 | | | 207 | | | | 204 | | |
6.00%, 1/1/38 | | | 2 | | | | 2 | | |
6.50%, 12/1/29 | | | 4 | | | | 4 | | |
7.50%, 8/1/37 | | | 3 | | | | 3 | | |
October TBA | |
3.00%, 10/1/53 (a) | | | 300 | | | | 248 | | |
4.00%, 10/1/53 (a) | | | 300 | | | | 267 | | |
5.00%, 10/1/53 (a) | | | 2,850 | | | | 2,690 | | |
5.50%, 10/1/53 (a) | | | 575 | | | | 556 | | |
6.00%, 10/1/53 (a) | | | 2,450 | | | | 2,419 | | |
Government National Mortgage Association, | |
Various Pools: | |
4.00%, 8/20/41 - 11/20/42 | | | 122 | | | | 112 | | |
4.50%, 6/20/49 | | | 25 | | | | 23 | | |
5.00%, 2/20/49 - 6/20/49 | | | 59 | | | | 55 | | |
5.50%, 8/15/39 | | | 15 | | | | 15 | | |
| | | | 18,320 | | |
Asset-Backed Securities (0.2%) | |
United States (0.2%) | |
HGI CRE CLO Ltd., | |
1 Month Term SOFR + 1.11%,
6.45%, 9/17/36 (b)(c) | | | 336 | | | | 331 | | |
Renaissance Home Equity Loan Trust, | |
1 Month Term SOFR + 0.87%,
6.19%, 12/25/32 (c) | | | 490 | | | | 444 | | |
SASCO Mortgage Loan Trust, | |
1 Month Term SOFR + 2.29%,
4.64%, 5/25/34 (c) | | | 94 | | | | 92 | | |
SLM Student Loan Trust, | |
3 Month EURIBOR + 0.55%,
4.27%, 7/25/39 (c) | | EUR | 287 | | | | 289 | | |
| | | | 1,156 | | |
| | | Face
Amount
(000) | | Value
(000) | |
Commercial Mortgage-Backed Securities (0.4%) | |
United States (0.4%) | |
Ashford Hospitality Trust, | |
1 Month Term SOFR + 2.02%,
7.36%, 6/15/35 (b)(c) | | $ | 250 | | | $ | 240 | | |
Commercial Mortgage Trust, | |
4.89%, 7/15/47 (b)(c) | | | 152 | | | | 133 | | |
Credit Suisse Mortgage Trust, | |
1 Month Term SOFR + 3.14%,
8.48%, 9/9/24 (b)(c) | | | 500 | | | | 505 | | |
Life Mortgage Trust, | |
1 Month Term SOFR + 1.30%,
6.63%, 5/15/39 (b)(c) | | | 500 | | | | 493 | | |
Taubman Centers Commercial Mortgage Trust, | |
1 Month Term SOFR + 2.19%,
7.52%, 5/15/37 (b)(c) | | | 500 | | | | 489 | | |
WFRBS Commercial Mortgage Trust, | |
4.15%, 10/15/57 (b)(c) | | | 200 | | | | 134 | | |
5.17%, 9/15/46 (b)(c) | | | 297 | | | | 267 | | |
| | | | 2,261 | | |
Corporate Bonds (7.8%) | |
Australia (0.4%) | |
Australia & New Zealand Banking Group Ltd., | |
2.57%, 11/25/35 (b) | | | 600 | | | | 445 | | |
Commonwealth Bank of Australia, | |
1.94%, 10/3/29 | | EUR | 400 | | | | 407 | | |
NBN Co. Ltd., | |
2.63%, 5/5/31 (b) | | $ | 575 | | | | 464 | | |
Transurban Finance Co. Pty Ltd., | |
2.00%, 8/28/25 | | EUR | 350 | | | | 356 | | |
Westpac Banking Corp., | |
2.67%, 11/15/35 | | $ | 650 | | | | 488 | | |
| | | | 2,160 | | |
Brazil (0.0%)‡ | |
JBS USA LUX SA/JBS USA Food Co./
JBS USA Finance, Inc., | |
2.50%, 1/15/27 | | | 350 | | | | 309 | | |
Canada (0.6%) | |
Province of Ontario Canada, | |
2.30%, 6/15/26 | | | 970 | | | | 903 | | |
Province of Quebec Canada, | |
0.00%, 10/29/30 | | EUR | 1,390 | | | | 1,145 | | |
Rogers Communications, Inc., | |
3.80%, 3/15/32 | | $ | 1,025 | | | | 852 | | |
| | | | 2,900 | | |
China (0.1%) | |
Alibaba Group Holding Ltd., | |
2.13%, 2/9/31 | | | 400 | | | | 312 | | |
France (0.8%) | |
AXA SA, | |
3.25%, 5/28/49 | | EUR | 500 | | | | 475 | | |
The accompanying notes are an integral part of the consolidated financial statements.
9
Morgan Stanley Institutional Fund Trust
Annual Report — September 30, 2023
Consolidated Portfolio of Investments (cont'd)
Global Strategist Portfolio
| | | Face
Amount
(000) | | Value
(000) | |
France (cont'd) | |
Banque Federative du Credit Mutuel SA, | |
0.75%, 7/17/25 | | EUR | 400 | | | $ | 399 | | |
3.75%, 2/1/33 | | | 600 | | | | 605 | | |
BNP Paribas SA, | |
1.13%, 6/11/26 | | | 485 | | | | 475 | | |
1.25%, 7/13/31 | | GBP | 200 | | | | 173 | | |
4.38%, 1/13/29 | | EUR | 400 | | | | 420 | | |
| BPCE SA, | |
4.00%, 11/29/32 | | | 200 | | | | 206 | | |
5.15%, 7/21/24 (b) | | $ | 925 | | | | 910 | | |
Credit Agricole SA, | |
3.88%, 11/28/34 | | EUR | 300 | | | | 302 | | |
Orange SA, | |
5.00%, 10/1/26 (d) | | | 250 | | | | 264 | | |
| | | | 4,229 | | |
Germany (0.3%) | |
Deutsche Bank AG, | |
Series E
0.96%, 11/8/23 | | $ | 375 | | | | 373 | | |
Kreditanstalt fuer Wiederaufbau, | |
1.13%, 9/15/32 | | EUR | 920 | | | | 808 | | |
Volkswagen International Finance NV,
Series 10Y | |
1.88%, 3/30/27 | | | 500 | | | | 484 | | |
| | | | 1,665 | | |
Ireland (0.1%) | |
AerCap Ireland Capital DAC/AerCap Global
Aviation Trust, | |
2.45%, 10/29/26 | | $ | 425 | | | | 381 | | |
Italy (0.1%) | |
Assicurazioni Generali SpA, | |
5.50%, 10/27/47 | | EUR | 400 | | | | 424 | | |
Japan (0.1%) | |
NTT Finance Corp., | |
1.59%, 4/3/28 (b) | | $ | 800 | | | | 678 | | |
Korea, Republic of (0.3%) | |
Korea Electric Power Corp., | |
2.50%, 6/24/24 (b) | | | 810 | | | | 790 | | |
Korea Southern Power Co. Ltd., | |
0.75%, 1/27/26 (b) | | | 730 | | | | 652 | | |
| | | | 1,442 | | |
Luxembourg (0.1%) | |
Blackstone Property Partners Europe
Holdings Sarl, | |
1.25%, 4/26/27 | | EUR | 400 | | | | 355 | | |
Logicor Financing Sarl, | |
1.50%, 7/13/26 | | | 300 | | | | 285 | | |
| | | | 640 | | |
Netherlands (0.1%) | |
| ASR Nederland NV, | |
5.00%, 9/30/24 (d) | | | 425 | | | | 443 | | |
| | | Face
Amount
(000) | | Value
(000) | |
Spain (0.2%) | |
Banco Santander SA, | |
3.13%, 1/19/27 | | EUR | 400 | | | $ | 405 | | |
5.18%, 11/19/25 | | $ | 800 | | | | 779 | | |
| | | | 1,184 | | |
Sweden (0.1%) | |
Akelius Residential Property Financing BV, | |
1.13%, 1/11/29 | | EUR | 400 | | | | 334 | | |
United Arab Emirates (0.1%) | |
Galaxy Pipeline Assets Bidco Ltd., | |
2.63%, 3/31/36 (b) | | $ | 650 | | | | 504 | | |
United Kingdom (0.5%) | |
BAT Capital Corp., | |
3.56%, 8/15/27 | | | 178 | | | | 163 | | |
HSBC Holdings PLC, | |
2.26%, 11/13/26 | | GBP | 300 | | | | 337 | | |
2.63%, 11/7/25 | | $ | 525 | | | | 503 | | |
6.16%, 3/9/29 | | | 525 | | | | 520 | | |
Lloyds Banking Group PLC, | |
2.25%, 10/16/24 | | GBP | 400 | | | | 470 | | |
National Grid Electricity Distribution West
Midlands PLC, | |
5.75%, 4/16/32 | | | 200 | | | | 240 | | |
NGG Finance PLC, | |
5.63%, 6/18/73 | | | 350 | | | | 409 | | |
| | | | 2,642 | | |
United States (3.9%) | |
Amazon.com, Inc., | |
2.10%, 5/12/31 | | $ | 500 | | | | 401 | | |
3.10%, 5/12/51 | | | 250 | | | | 165 | | |
AT&T, Inc., | |
1.80%, 9/5/26 | | EUR | 400 | | | | 396 | | |
2.90%, 12/4/26 | | GBP | 350 | | | | 391 | | |
3.65%, 6/1/51 | | $ | 325 | | | | 210 | | |
Bank of America Corp., | |
2.69%, 4/22/32 | | | 325 | | | | 256 | | |
3.85%, 3/8/37 | | | 100 | | | | 81 | | |
4.38%, 4/27/28 | | | 575 | | | | 543 | | |
4.57%, 4/27/33 | | | 625 | | | | 555 | | |
CDW LLC/CDW Finance Corp., | |
2.67%, 12/1/26 | | | 100 | | | | 90 | | |
Celanese U.S. Holdings LLC, | |
6.17%, 7/15/27 | | | 750 | | | | 740 | | |
Centene Corp., | |
2.50%, 3/1/31 | | | 1,050 | | | | 808 | | |
Charles Schwab Corp., | |
5.85%, 5/19/34 | | | 485 | | | | 462 | | |
Charter Communications Operating
LLC/Charter Communications
Operating Capital, 6.38%, 10/23/35 | | | 325 | | | | 303 | | |
Chubb INA Holdings, Inc., | |
0.88%, 6/15/27 | | EUR | 400 | | | | 378 | | |
The accompanying notes are an integral part of the consolidated financial statements.
10
Morgan Stanley Institutional Fund Trust
Annual Report — September 30, 2023
Consolidated Portfolio of Investments (cont'd)
Global Strategist Portfolio
| | | Face
Amount
(000) | | Value
(000) | |
United States (cont'd) | |
Citigroup, Inc., | |
3.06%, 1/25/33 | | $ | 300 | | | $ | 237 | | |
3.79%, 3/17/33 | | | 975 | | | | 814 | | |
Comcast Corp., | |
1.95%, 1/15/31 | | | 675 | | | | 528 | | |
Dick's Sporting Goods, Inc., | |
4.10%, 1/15/52 | | | 360 | | | | 219 | | |
Enterprise Products Operating LLC, | |
3.95%, 1/31/60 | | | 275 | | | | 193 | | |
5.35%, 1/31/33 | | | 200 | | | | 196 | | |
Foundry JV Holdco LLC, | |
5.88%, 1/25/34 (b) | | | 275 | | | | 263 | | |
Georgia-Pacific LLC, | |
2.30%, 4/30/30 (b) | | | 950 | | | | 774 | | |
Global Payments, Inc., | |
4.45%, 6/1/28 | | | 625 | | | | 580 | | |
Goldman Sachs Group, Inc., | |
2.62%, 4/22/32 | | | 775 | | | | 606 | | |
HCA, Inc., | |
4.63%, 3/15/52 | | | 400 | | | | 301 | | |
Intel Corp., | |
5.70%, 2/10/53 | | | 375 | | | | 352 | | |
Jersey Central Power & Light Co., | |
2.75%, 3/1/32 (b) | | | 500 | | | | 392 | | |
JPMorgan Chase & Co., | |
2.55%, 11/8/32 | | | 1,150 | | | | 890 | | |
Lowe's Cos., Inc., | |
1.30%, 4/15/28 | | | 425 | | | | 354 | | |
1.70%, 10/15/30 | | | 475 | | | | 365 | | |
Marriott International, Inc., | |
4.90%, 4/15/29 | | | 200 | | | | 191 | | |
Medtronic Global Holdings SCA, | |
1.00%, 7/2/31 | | EUR | 250 | | | | 214 | | |
Metropolitan Life Global Funding I, | |
2.95%, 4/9/30 (b) | | $ | 575 | | | | 488 | | |
5.15%, 3/28/33 (b) | | | 300 | | | | 284 | | |
NextEra Energy Capital Holdings, Inc., | |
2.75%, 11/1/29 | | | 1,225 | | | | 1,041 | | |
ONEOK, Inc., | |
6.10%, 11/15/32 | | | 475 | | | | 469 | | |
Prologis Euro Finance LLC, | |
1.88%, 1/5/29 | | EUR | 300 | | | | 277 | | |
Republic Services, Inc., | |
5.00%, 4/1/34 | | $ | 275 | | | | 261 | | |
Thermo Fisher Scientific Finance I BV, | |
2.00%, 10/18/51 | | EUR | 100 | | | | 63 | | |
Thermo Fisher Scientific, Inc., | |
0.88%, 10/1/31 | | | 650 | | | | 542 | | |
1.88%, 10/1/49 | | | 100 | | | | 62 | | |
Truist Financial Corp., | |
5.87%, 6/8/34 | | $ | 575 | | | | 542 | | |
| | | Face
Amount
(000) | | Value
(000) | |
U.S. Bancorp, | |
5.84%, 6/12/34 | | $ | 400 | | | $ | 378 | | |
Upjohn Finance BV, | |
1.91%, 6/23/32 | | EUR | 550 | | | | 450 | | |
Verizon Communications, Inc., | |
1.13%, 11/3/28 | | GBP | 300 | | | | 294 | | |
3.40%, 3/22/41 | | $ | 375 | | | | 266 | | |
Vontier Corp., | |
2.40%, 4/1/28 | | | 250 | | | | 209 | | |
Warnermedia Holdings, Inc., | |
4.28%, 3/15/32 | | | 775 | | | | 658 | | |
5.05%, 3/15/42 | | | 125 | | | | 97 | | |
Wells Fargo & Co.,
MTN | |
2.88%, 10/30/30 | | | 375 | | | | 312 | | |
| | | | 19,941 | | |
| | | | 40,188 | | |
Mortgages — Other (1.2%) | |
Germany (0.0%)‡ | |
Berg Finance DAC, | |
3 Month EURIBOR + 1.05%,
4.75%, 4/22/33 (c) | | EUR | 77 | | | | 77 | | |
Ireland (0.1%) | |
Glenbeigh 2 Issuer 2021-2 DAC, | |
3 Month EURIBOR + 0.75%,
4.71%, 6/24/50 (b)(c) | | | 312 | | | | 329 | | |
Netherlands (0.0%)‡ | |
E-MAC NL 2006-II BV, | |
3 Month EURIBOR + 0.13%,
4.93%, 1/25/39 (c) | | | 125 | | | | 122 | | |
United Kingdom (0.1%) | |
Great Hall Mortgages No. 1 PLC, | |
3 Month EURIBOR + 0.25%,
4.12%, 6/18/38 (c) | | | 200 | | | | 204 | | |
Landmark Mortgage Securities No. 3 PLC, | |
3 Month GBP SONIA + 2.22%,
7.37%, 4/17/44 (c) | | GBP | 167 | | | | 188 | | |
| | | | 392 | | |
United States (1.0%) | |
Banc of America Alternative Loan Trust, | |
6.36%, 10/25/36 | | $ | 22 | | | | 6 | | |
Bayview Opportunity Master Fund VIA Trust, | |
3.00%, 1/25/52 (b)(c) | | | 634 | | | | 502 | | |
BX Commercial Mortgage Trust, | |
1 Month Term SOFR + 2.28%,
7.61%, 6/15/40 (b)(c) | | | 400 | | | | 400 | | |
ChaseFlex Trust, | |
6.00%, 2/25/37 | | | 20 | | | | 8 | | |
Federal Home Loan Mortgage Corp.
Whole Loan Securities Trust, | |
3.00%, 9/25/45 | | | 48 | | | | 41 | | |
3.00%, 7/25/46 | | | 17 | | | | 14 | | |
3.00%, 12/25/46 | | | 59 | | | | 50 | | |
The accompanying notes are an integral part of the consolidated financial statements.
11
Morgan Stanley Institutional Fund Trust
Annual Report — September 30, 2023
Consolidated Portfolio of Investments (cont'd)
Global Strategist Portfolio
| | | Face
Amount
(000) | | Value
(000) | |
United States (cont'd) | |
3.00%, 5/25/47 | | $ | 110 | | | $ | 92 | | |
3.50%, 5/25/45 | | | 18 | | | | 16 | | |
3.50%, 9/25/45 | | | 39 | | | | 34 | | |
3.50%, 7/25/46 | | | 24 | | | | 21 | | |
4.00%, 5/25/45 | | | 5 | | | | 4 | | |
GS Mortgage-Backed Securities Trust, | |
2.50%, 1/25/52 (b)(c) | | | 507 | | | | 387 | | |
GSR Mortgage Loan Trust, | |
5.75%, 1/25/37 | | | 7 | | | | 4 | | |
Hundred Acre Wood Trust, | |
2.50%, 12/25/51 (b)(c) | | | 440 | | | | 334 | | |
JP Morgan Mortgage Trust, | |
3.00%, 4/25/52 (b)(c) | | | 487 | | | | 387 | | |
3.00%, 9/25/52 (b)(c) | | | 529 | | | | 421 | | |
3.25%, 7/25/52 (b)(c) | | | 616 | | | | 495 | | |
Lehman Mortgage Trust, | |
6.50%, 9/25/37 | | | 17 | | | | 5 | | |
Mello Mortgage Capital Acceptance, | |
2.50%, 8/25/51 (b)(c) | | | 510 | | | | 387 | | |
Onslow Bay Financial LLC, Class A1 | |
3.00%, 1/25/52 (b)(c) | | | 490 | | | | 388 | | |
PRKCM 2023-AFC1 Trust, Class A1 | |
6.60%, 2/25/58 (b) | | | 353 | | | | 356 | | |
PRMI Securitization Trust, | |
2.50%, 4/25/51 (b)(c) | | | 588 | | | | 443 | | |
Seasoned Credit Risk Transfer Trust, | |
3.00%, 7/25/58 | | | 226 | | | | 190 | | |
3.00%, 10/25/58 | | | 26 | | | | 22 | | |
4.00%, 10/25/58 | | | 25 | | | | 22 | | |
| | | | 5,029 | | |
| | | | 5,949 | | |
Municipal Bond (0.1%) | |
Michigan (0.1%) | |
University of Michigan, MI, | |
Series A
4.45%, 4/1/2122
(Cost $300) | | | 300 | | | | 230 | | |
Sovereign (24.6%) | |
Australia (0.3%) | |
Australia Government Bond, | |
1.25%, 5/21/32 | | AUD | 3,320 | | | | 1,651 | | |
Austria (0.1%) | |
Republic of Austria Government Bond, | |
0.00%, 2/20/30 | | EUR | 360 | | | | 310 | | |
Belgium (0.2%) | |
Kingdom of Belgium Government Bond, | |
0.90%, 6/22/29 | | | 170 | | | | 159 | | |
1.70%, 6/22/50 | | | 480 | | | | 323 | | |
Series 99 | |
3.45%, 6/22/43 | | | 650 | | | | 646 | | |
| | | | 1,128 | | |
| | | Face
Amount
(000) | | Value
(000) | |
Brazil (1.9%) | |
Brazil Notas do Tesouro Nacional, | |
10.00%, 1/1/27 | | BRL | 49,889 | | | $ | 9,701 | | |
Canada (0.7%) | |
Canadian Government Bond, | |
1.25%, 6/1/30 | | CAD | 1,410 | | | | 867 | | |
2.00%, 12/1/51 | | | 100 | | | | 50 | | |
2.25%, 6/1/29 | | | 2,290 | | | | 1,532 | | |
2.50%, 12/1/32 | | | 1,960 | | | | 1,273 | | |
| | | | 3,722 | | |
China (7.0%) | |
Agricultural Development Bank of China, | |
2.25%, 4/22/25 | | CNY | 3,600 | | | | 491 | | |
3.79%, 10/26/30 | | | 3,430 | | | | 499 | | |
China Development Bank, | |
3.07%, 3/10/30 | | | 7,380 | | | | 1,024 | | |
3.34%, 7/14/25 | | | 3,430 | | | | 476 | | |
China Government Bond, | |
2.37%, 1/20/27 | | | 16,900 | | | | 2,306 | | |
2.76%, 5/15/32 | | | 155,500 | | | | 21,306 | | |
2.80%, 11/15/32 | | | 9,800 | | | | 1,348 | | |
3.12%, 10/25/52 | | | 720 | | | | 100 | | |
3.13%, 11/21/29 | | | 20,150 | | | | 2,841 | | |
3.27%, 11/19/30 | | | 21,260 | | | | 3,036 | | |
3.52%, 4/25/46 | | | 1,430 | | | | 212 | | |
3.53%, 10/18/51 | | | 1,300 | | | | 193 | | |
3.81%, 9/14/50 | | | 4,070 | | | | 632 | | |
3.86%, 7/22/49 | | | 6,000 | | | | 937 | | |
Export-Import Bank of China, | |
2.93%, 3/2/25 | | | 3,470 | | | | 478 | | |
| | | | 35,879 | | |
Colombia (0.1%) | |
Colombian TES, | |
Series B
7.00%, 3/26/31 | | COP | 1,634,000 | | | | 314 | | |
Czech Republic (0.0%)‡ | |
Czech Republic Government Bond, | |
1.20%, 3/13/31 | | CZK | 6,000 | | | | 204 | | |
Denmark (0.1%) | |
Denmark Government Bond, | |
0.50%, 11/15/27 | | DKK | 3,000 | | | | 386 | | |
Finland (0.1%) | |
Finland Government Bond, | |
1.13%, 4/15/34 | | EUR | 370 | | | | 312 | | |
France (1.6%) | |
Agence Francaise de Developpement EPIC, | |
1.50%, 10/31/34 | | | 500 | | | | 423 | | |
Banque Federative du Credit Mutuel SA, | |
1.25%, 12/5/25 | | GBP | 400 | | | | 443 | | |
French Republic Government Bond OAT, | |
0.00%, 11/25/29 | | EUR | 7,130 | | | | 6,229 | | |
2.00%, 5/25/48 | | | 930 | | | | 703 | | |
The accompanying notes are an integral part of the consolidated financial statements.
12
Morgan Stanley Institutional Fund Trust
Annual Report — September 30, 2023
Consolidated Portfolio of Investments (cont'd)
Global Strategist Portfolio
| | | Face
Amount
(000) | | Value
(000) | |
France (cont'd) | |
SNCF Reseau, | |
1.88%, 3/30/34 | | EUR | 400 | | | $ | 352 | | |
| | | | 8,150 | | |
Germany (1.5%) | |
Bundesrepublik Deutschland Bundesanleihe, | |
0.00%, 8/15/31 - 5/15/36 | | | 4,240 | | | | 3,614 | | |
0.25%, 2/15/29 | | | 1,630 | | | | 1,514 | | |
4.25%, 7/4/39 | | | 1,230 | | | | 1,501 | | |
State of North Rhine-Westphalia Germany, | |
1.65%, 2/22/38 | | | 1,500 | | | | 1,238 | | |
| | | | 7,867 | | |
Greece (2.3%) | |
Hellenic Republic Government Bonds, | |
4.25%, 6/15/33 | | | 11,431 | | | | 12,010 | | |
Hong Kong (0.0%)‡ | |
Hong Kong Government International Bond, | |
2.50%, 5/28/24 (b) | | $ | 250 | | | | 245 | | |
Hungary (0.1%) | |
Hungary Government Bond, | |
Series 30/A
3.00%, 8/21/30 | | HUF | 51,360 | | | | 108 | | |
Series 32/A
4.75%, 11/24/32 | | | 109,610 | | | | 247 | | |
Series 32/G
4.50%, 5/27/32 | | | 63,030 | | | | 141 | | |
| | | | 496 | | |
Indonesia (0.3%) | |
Indonesia Treasury Bond, | |
6.50%, 2/15/31 | | IDR | 4,104,000 | | | | 261 | | |
8.25%, 5/15/29 | | | 1,408,000 | | | | 98 | | |
8.38%, 3/15/34 | | | 14,072,000 | | | | 1,016 | | |
| | | | 1,375 | | |
Ireland (0.1%) | |
Ireland Government Bond, | |
0.20%, 10/18/30 | | EUR | 410 | | | | 354 | | |
Italy (0.6%) | |
Italy Buoni Poliennali Del Tesoro, | |
0.45%, 2/15/29 | | | 160 | | | | 139 | | |
2.50%, 12/1/32 | | | 1,070 | | | | 957 | | |
4.45%, 9/1/43 | | | 1,052 | | | | 1,024 | | |
Republic of Italy Government International
Bond, | |
0.88%, 5/6/24 | | $ | 745 | | | | 723 | | |
| | | | 2,843 | | |
Japan (3.6%) | |
Japan Government Five Year Bond, | |
0.10%, 6/20/24 | | JPY | 605,000 | | | | 4,054 | | |
Japan Government Ten Year Bond, | |
0.10%, 6/20/26 - 6/20/31 | | | 744,000 | | | | 4,856 | | |
| | | Face
Amount
(000) | | Value
(000) | |
Japan Government Thirty Year Bond, | |
0.30%, 6/20/46 | | JPY | 224,000 | | | $ | 1,150 | | |
0.40%, 9/20/49 | | | 131,000 | | | | 653 | | |
0.60%, 6/20/50 | | | 165,300 | | | | 863 | | |
1.70%, 6/20/33 | | | 544,800 | | | | 3,969 | | |
Japan Government Twenty Year Bond, | |
0.40%, 6/20/41 | | | 466,000 | | | | 2,659 | | |
| | | | 18,204 | | |
Korea, Republic of (0.3%) | |
Export-Import Bank of Korea, | |
0.63%, 2/9/26 | | $ | 640 | | | | 571 | | |
2.38%, 6/25/24 | | | 510 | | | | 498 | | |
Korea Development Bank, | |
0.80%, 7/19/26 | | | 590 | | | | 518 | | |
| | | | 1,587 | | |
Malaysia (0.3%) | |
Malaysia Government Bond, | |
Series 0219
3.89%, 8/15/29 | | MYR | 2,330 | | | | 495 | | |
Series 0122
3.58%, 7/15/32 | | | 1,200 | | | | 247 | | |
Petronas Capital Ltd., | |
3.50%, 3/18/25 (b) | | $ | 875 | | | | 848 | | |
| | | | 1,590 | | |
Mexico (0.2%) | |
Mexican Bonos, | |
Series M
7.50%, 6/3/27 | | MXN | 6,000 | | | | 314 | | |
7.75%, 5/29/31 | | | 5,000 | | | | 253 | | |
8.50%, 5/31/29 | | | 5,900 | | | | 317 | | |
| | | | 884 | | |
Netherlands (0.2%) | |
Nederlandse Waterschapsbank NV, | |
1.00%, 5/28/30 (b) | | $ | 376 | | | | 294 | | |
Netherlands Government Bond, | |
0.00%, 7/15/30 | | EUR | 970 | | | | 838 | | |
2.75%, 1/15/47 | | | 90 | | | | 88 | | |
| | | | 1,220 | | |
New Zealand (0.3%) | |
New Zealand Government Bond, | |
Series 0530
4.50%, 5/15/30 | | NZD | 1,880 | | | | 1,078 | | |
Series 0534
4.25%, 5/15/34 | | | 900 | | | | 491 | | |
| | | | 1,569 | | |
Nigeria (0.0%)‡ | |
Africa Finance Corp., | |
4.38%, 4/17/26 (b) | | $ | 200 | | | | 185 | | |
Norway (0.0%)‡ | |
Norway Government Bond, | |
2.13%, 5/18/32 | | NOK | 790 | | | | 64 | | |
The accompanying notes are an integral part of the consolidated financial statements.
13
Morgan Stanley Institutional Fund Trust
Annual Report — September 30, 2023
Consolidated Portfolio of Investments (cont'd)
Global Strategist Portfolio
| | | Face
Amount
(000) | | Value
(000) | |
Poland (0.0%)‡ | |
Republic of Poland Government Bond, | |
Series 0432
1.75%, 4/25/32 | | PLN | 1,300 | | | $ | 217 | | |
Singapore (0.1%) | |
Singapore Government Bond, | |
2.63%, 8/1/32 | | SGD | 430 | | | | 297 | | |
Slovenia (0.1%) | |
Slovenia Government International Bond, | |
5.00%, 9/19/33 (b) | | $ | 700 | | | | 680 | | |
Spain (0.8%) | |
Spain Government Bond, | |
0.00%, 5/31/25 - 1/31/28 | | EUR | 2,460 | | | | 2,408 | | |
2.70%, 10/31/48 | | | 410 | | | | 322 | | |
3.45%, 7/30/66 | | | 120 | | | | 101 | | |
3.55%, 10/31/33 | | | 1,375 | | | | 1,410 | | |
| | | | 4,241 | | |
Sweden (0.1%) | |
Sweden Government Bond, | |
Series 1065
1.75%, 11/11/33 | | SEK | 5,100 | | | | 420 | | |
Thailand (0.1%) | |
Thailand Government Bond, | |
2.00%, 12/17/31 | | THB | 27,000 | | | | 683 | | |
United Kingdom (1.5%) | |
United Kingdom Gilt, | |
0.38%, 10/22/30 | | GBP | 820 | | | | 764 | | |
0.63%, 10/22/50 | | | 930 | | | | 419 | | |
0.88%, 7/31/33 | | | 870 | | | | 764 | | |
1.25%, 10/22/41 | | | 310 | | | | 218 | | |
1.63%, 10/22/28 | | | 4,980 | | | | 5,356 | | |
| | | | 7,521 | | |
| | | | 126,309 | | |
Supranational (1.1%) | |
Asian Development Bank, | |
2.13%, 5/19/31 | | NZD | 300 | | | | 141 | | |
Banque Ouest Africaine de Developpement, | |
4.70%, 10/22/31 | | $ | 240 | | | | 191 | | |
European Investment Bank, | |
0.00%, 1/14/31 | | EUR | 1,135 | | | | 944 | | |
0.20%, 7/15/24 | | | 970 | | | | 998 | | |
International Bank for Reconstruction &
Development, | |
2.20%, 2/27/24 | | AUD | 3,040 | | | | 1,939 | | |
4.25%, 9/18/30 | | CAD | 2,080 | | | | 1,500 | | |
| | | | 5,713 | | |
U.S. Treasury Securities (4.9%) | |
United States (4.9%) | |
U.S. Treasury Bonds, | |
1.13%, 5/15/40 | | $ | 5,330 | | | | 3,062 | | |
1.75%, 8/15/41 | | | 600 | | | | 374 | | |
2.50%, 2/15/45 | | | 410 | | | | 279 | | |
| | | Face
Amount
(000) | | Value
(000) | |
2.75%, 8/15/47 | | $ | 920 | | | $ | 643 | | |
2.88%, 5/15/49 | | | 44 | | | | 32 | | |
U.S. Treasury Inflation-Indexed Bonds, | |
1.13%, 1/15/33 | | | — | @ | | | — | @ | |
U.S. Treasury Notes, | |
0.38%, 12/31/25 | | | 8,300 | | | | 7,505 | | |
0.50%, 4/30/27 | | | 530 | | | | 457 | | |
1.13%, 10/31/26 | | | 2,210 | | | | 1,980 | | |
1.38%, 11/15/31 | | | 2,220 | | | | 1,740 | | |
1.88%, 6/30/26 | | | 1,950 | | | | 1,804 | | |
2.13%, 5/15/25 | | | 1,390 | | | | 1,324 | | |
3.38%, 5/15/33 | | | 5,690 | | | | 5,161 | | |
4.13%, 9/30/27 | | | 760 | | | | 744 | | |
| | | | 25,105 | | |
Total Fixed Income Securities (Cost $255,275) | | | 225,231 | | |
| | | Shares | | | |
Common Stocks (34.2%) | |
Australia (1.0%) | |
Ampol Ltd. | | | 1,131 | | | | 24 | | |
ANZ Group Holdings Ltd. | | | 13,867 | | | | 227 | | |
APA Group | | | 5,572 | | | | 30 | | |
Aristocrat Leisure Ltd. | | | 2,848 | | | | 74 | | |
ASX Ltd. | | | 911 | | | | 33 | | |
Aurizon Holdings Ltd. | | | 9,095 | | | | 20 | | |
BHP Group Ltd. | | | 24,014 | | | | 675 | | |
BlueScope Steel Ltd. | | | 2,152 | | | | 27 | | |
Brambles Ltd. | | | 6,597 | | | | 61 | | |
Cochlear Ltd. | | | 309 | | | | 51 | | |
Coles Group Ltd. | | | 6,320 | | | | 63 | | |
Commonwealth Bank of Australia | | | 7,871 | | | | 503 | | |
Computershare Ltd. | | | 2,708 | | | | 45 | | |
CSL Ltd. | | | 2,215 | | | | 357 | | |
Dexus REIT | | | 5,131 | | | | 24 | | |
Endeavour Group Ltd. (Australia) | | | 6,667 | | | | 22 | | |
Fortescue Metals Group Ltd. | | | 7,871 | | | | 105 | | |
Goodman Group REIT | | | 8,034 | | | | 110 | | |
GPT Group REIT | | | 9,121 | | | | 23 | | |
IDP Education Ltd. | | | 1,182 | | | | 16 | | |
IGO Ltd. | | | 3,325 | | | | 27 | | |
Insurance Australia Group Ltd. | | | 11,302 | | | | 41 | | |
James Hardie Industries PLC (e) | | | 2,085 | | | | 54 | | |
Lendlease Corp. Ltd. REIT | | | 3,403 | | | | 16 | | |
Lottery Corp. Ltd. | | | 10,550 | | | | 32 | | |
Macquarie Group Ltd. | | | 1,736 | | | | 186 | | |
Medibank Pvt Ltd. | | | 12,709 | | | | 28 | | |
Mineral Resources Ltd. | | | 816 | | | | 35 | | |
Mirvac Group REIT | | | 18,762 | | | | 25 | | |
National Australia Bank Ltd. | | | 14,440 | | | | 268 | | |
Newcrest Mining Ltd. | | | 4,199 | | | | 66 | | |
Northern Star Resources Ltd. | | | 5,414 | | | | 36 | | |
Orica Ltd. | | | 2,132 | | | | 21 | | |
Origin Energy Ltd. | | | 8,087 | | | | 45 | | |
The accompanying notes are an integral part of the consolidated financial statements.
14
Morgan Stanley Institutional Fund Trust
Annual Report — September 30, 2023
Consolidated Portfolio of Investments (cont'd)
Global Strategist Portfolio
| | | Shares | | Value
(000) | |
Australia (cont'd) | |
Pilbara Minerals Ltd. | | | 12,513 | | | $ | 34 | | |
Qantas Airways Ltd. (e) | | | 4,211 | | | | 14 | | |
QBE Insurance Group Ltd. | | | 6,960 | | | | 70 | | |
Ramsay Health Care Ltd. | | | 867 | | | | 29 | | |
REA Group Ltd. | | | 249 | | | | 25 | | |
Reece Ltd. | | | 1,060 | | | | 13 | | |
Rio Tinto Ltd. | | | 1,757 | | | | 127 | | |
Santos Ltd. | | | 15,560 | | | | 78 | | |
Scentre Group REIT | | | 24,722 | | | | 39 | | |
SEEK Ltd. | | | 1,574 | | | | 22 | | |
Sonic Healthcare Ltd. | | | 2,120 | | | | 40 | | |
South32 Ltd. | | | 21,631 | | | | 47 | | |
Stockland REIT | | | 11,481 | | | | 29 | | |
Suncorp Group Ltd. | | | 5,941 | | | | 53 | | |
Telstra Group Ltd. | | | 19,342 | | | | 48 | | |
Transurban Group (Units) | | | 14,721 | | | | 120 | | |
Treasury Wine Estates Ltd. | | | 3,426 | | | | 27 | | |
Vicinity Ltd. REIT | | | 18,451 | | | | 20 | | |
Washington H Soul Pattinson & Co. Ltd. | | | 1,112 | | | | 23 | | |
Wesfarmers Ltd. | | | 5,340 | | | | 181 | | |
Westpac Banking Corp. | | | 16,342 | | | | 221 | | |
WiseTech Global Ltd. | | | 774 | | | | 32 | | |
Woodside Energy Group Ltd. | | | 9,011 | | | | 209 | | |
Woolworths Group Ltd. | | | 5,776 | | | | 138 | | |
Xero Ltd. (e) | | | 670 | | | | 48 | | |
| | | | 5,057 | | |
Austria (0.0%)‡ | |
Erste Group Bank AG | | | 5,572 | | | | 192 | | |
OMV AG | | | 770 | | | | 37 | | |
Verbund AG | | | 343 | | | | 28 | | |
Voestalpine AG | | | 617 | | | | 17 | | |
| | | | 274 | | |
Belgium (0.2%) | |
Ageas SA | | | 749 | | | | 31 | | |
Anheuser-Busch InBev SA | | | 4,040 | | | | 224 | | |
Argenx SE (e) | | | 252 | | | | 123 | | |
D'ieteren Group | | | 100 | | | | 17 | | |
Elia Group SA | | | 134 | | | | 13 | | |
Groupe Bruxelles Lambert NV | | | 459 | | | | 34 | | |
KBC Group NV | | | 3,966 | | | | 247 | | |
Sofina SA | | | 70 | | | | 14 | | |
Solvay SA | | | 346 | | | | 38 | | |
UCB SA | | | 582 | | | | 48 | | |
Umicore SA | | | 966 | | | | 23 | | |
Warehouses De Pauw CVA REIT | | | 731 | | | | 18 | | |
| | | | 830 | | |
Canada (1.6%) | |
Agnico Eagle Mines Ltd. | | | 2,332 | | | | 106 | | |
Air Canada (e) | | | 822 | | | | 12 | | |
Algonquin Power & Utilities Corp. | | | 3,152 | | | | 19 | | |
Alimentation Couche-Tard, Inc. | | | 3,704 | | | | 188 | | |
| | | Shares | | Value
(000) | |
AltaGas Ltd. | | | 1,323 | | | $ | 25 | | |
ARC Resources Ltd. | | | 2,832 | | | | 45 | | |
Bank of Montreal | | | 3,328 | | | | 281 | | |
Bank of Nova Scotia | | | 5,568 | | | | 250 | | |
Barrick Gold Corp. (LSE) | | | 6,412 | | | | 93 | | |
Barrick Gold Corp. (NYSE) | | | 1,893 | | | | 27 | | |
BCE, Inc. | | | 341 | | | | 13 | | |
Brookfield Asset Management Ltd., Class A | | | 1,641 | | | | 55 | | |
Brookfield Corp. | | | 6,545 | | | | 205 | | |
Brookfield Renewable Corp., Class A | | | 604 | | | | 14 | | |
BRP, Inc. | | | 171 | | | | 13 | | |
CAE, Inc. (e) | | | 1,511 | | | | 35 | | |
Cameco Corp. | | | 2,033 | | | | 81 | | |
Canadian Apartment Properties REIT | | | 390 | | | | 13 | | |
Canadian Imperial Bank of Commerce | | | 4,251 | | | | 164 | | |
Canadian National Railway Co. | | | 2,681 | | | | 290 | | |
Canadian Natural Resources Ltd. | | | 5,196 | | | | 336 | | |
Canadian Pacific Kansas City Ltd. | | | 4,352 | | | | 323 | | |
Canadian Tire Corp. Ltd., Class A | | | 252 | | | | 27 | | |
Canadian Utilities Ltd., Class A | | | 613 | | | | 13 | | |
CCL Industries, Inc., Class B | | | 705 | | | | 30 | | |
Cenovus Energy, Inc. | | | 6,785 | | | | 141 | | |
CGI, Inc. (e) | | | 1,000 | | | | 99 | | |
Constellation Software, Inc. | | | 95 | | | | 196 | | |
Descartes Systems Group, Inc. (e) | | | 404 | | | | 30 | | |
Dollarama, Inc. | | | 1,343 | | | | 92 | | |
Element Fleet Management Corp. | | | 1,856 | | | | 27 | | |
Emera, Inc. | | | 1,263 | | | | 44 | | |
Empire Co. Ltd., Class A | | | 732 | | | | 20 | | |
Enbridge, Inc. | | | 9,472 | | | | 314 | | |
Fairfax Financial Holdings Ltd. | | | 105 | | | | 86 | | |
First Quantum Minerals Ltd. | | | 2,748 | | | | 65 | | |
FirstService Corp. | | | 188 | | | | 27 | | |
Fortis, Inc. | | | 2,252 | | | | 85 | | |
Franco-Nevada Corp. | | | 904 | | | | 121 | | |
George Weston Ltd. | | | 296 | | | | 33 | | |
GFL Environmental, Inc. | | | 1,095 | | | | 35 | | |
Gildan Activewear, Inc. | | | 843 | | | | 24 | | |
Great-West Lifeco, Inc. | | | 1,321 | | | | 38 | | |
Hydro One Ltd. | | | 1,538 | | | | 39 | | |
IA Financial Corp., Inc. | | | 484 | | | | 30 | | |
IGM Financial, Inc. | | | 392 | | | | 10 | | |
Imperial Oil Ltd. | | | 972 | | | | 60 | | |
Intact Financial Corp. | | | 826 | | | | 120 | | |
Ivanhoe Mines Ltd., Class A (e) | | | 2,847 | | | | 24 | | |
Keyera Corp. | | | 1,065 | | | | 25 | | |
Kinross Gold Corp. | | | 5,973 | | | | 27 | | |
Loblaw Cos. Ltd. | | | 757 | | | | 64 | | |
Lundin Mining Corp. | | | 3,040 | | | | 23 | | |
Magna International, Inc. | | | 1,261 | | | | 68 | | |
Manulife Financial Corp. | | | 8,729 | | | | 159 | | |
Metro, Inc. | | | 1,099 | | | | 57 | | |
National Bank of Canada | | | 1,588 | | | | 105 | | |
The accompanying notes are an integral part of the consolidated financial statements.
15
Morgan Stanley Institutional Fund Trust
Annual Report — September 30, 2023
Consolidated Portfolio of Investments (cont'd)
Global Strategist Portfolio
| | | Shares | | Value
(000) | |
Canada (cont'd) | |
Northland Power, Inc. | | | 1,163 | | | $ | 19 | | |
Nutrien Ltd. | | | 2,280 | | | | 141 | | |
Nuvei Corp. | | | 299 | | | | 4 | | |
Onex Corp. | | | 320 | | | | 19 | | |
Open Text Corp. | | | 1,265 | | | | 44 | | |
Pan American Silver Corp. | | | 1,704 | | | | 25 | | |
Parkland Corp. | | | 654 | | | | 19 | | |
Pembina Pipeline Corp. | | | 2,578 | | | | 77 | | |
Power Corp. of Canada | | | 2,761 | | | | 70 | | |
Quebecor, Inc., Class B | | | 719 | | | | 15 | | |
RB Global, Inc. | | | 860 | | | | 54 | | |
Restaurant Brands International, Inc. | | | 1,401 | | | | 93 | | |
RioCan Real Estate Investment Trust REIT | | | 689 | | | | 9 | | |
Rogers Communications, Inc., Class B | | | 1,656 | | | | 64 | | |
Royal Bank of Canada | | | 6,522 | | | | 570 | | |
Saputo, Inc. | | | 1,191 | | | | 25 | | |
Shopify, Inc., Class A (e) | | | 5,550 | | | | 303 | | |
Sun Life Financial, Inc. | | | 2,772 | | | | 135 | | |
Suncor Energy, Inc. | | | 6,298 | | | | 217 | | |
TC Energy Corp. | | | 4,759 | | | | 164 | | |
Teck Resources Ltd., Class B | | | 2,150 | | | | 93 | | |
TELUS Corp. | | | 2,183 | | | | 36 | | |
TFI International, Inc. | | | 356 | | | | 46 | | |
Thomson Reuters Corp. | | | 760 | | | | 93 | | |
TMX Group Ltd. | | | 1,312 | | | | 28 | | |
Toromont Industries Ltd. | | | 389 | | | | 32 | | |
Toronto-Dominion Bank | | | 8,529 | | | | 514 | | |
Tourmaline Oil Corp. | | | 1,496 | | | | 75 | | |
West Fraser Timber Co. Ltd. | | | 273 | | | | 20 | | |
Wheaton Precious Metals Corp. | | | 2,142 | | | | 87 | | |
WSP Global, Inc. | | | 592 | | | | 84 | | |
| | | | 8,121 | | |
China (0.0%) | |
China Common Rich Renewable Energy
Investments Ltd. (e) | | | 42,000 | | | | — | | |
Denmark (0.4%) | |
AP Moller — Maersk AS Series B | | | 38 | | | | 67 | | |
Carlsberg AS Series B | | | 457 | | | | 58 | | |
Chr Hansen Holding AS | | | 484 | | | | 29 | | |
Coloplast AS Series B | | | 549 | | | | 58 | | |
Danske Bank AS | | | 3,220 | | | | 75 | | |
Demant AS (e) | | | 431 | | | | 18 | | |
DSV AS | | | 863 | | | | 161 | | |
Genmab AS (e) | | | 304 | | | | 108 | | |
Novo Nordisk AS, Class B | | | 15,306 | | | | 1,394 | | |
Novozymes AS Series B | | | 937 | | | | 38 | | |
Orsted AS | | | 883 | | | | 48 | | |
Pandora AS | | | 428 | | | | 44 | | |
ROCKWOOL AS, Class B | | | 42 | | | | 10 | | |
Tryg AS | | | 1,654 | | | | 30 | | |
Vestas Wind Systems AS (e) | | | 4,620 | | | | 99 | | |
| | | | 2,237 | | |
| | | Shares | | Value
(000) | |
Finland (0.1%) | |
Elisa Oyj | | | 684 | | | $ | 32 | | |
Fortum Oyj | | | 2,135 | | | | 25 | | |
Kesko Oyj, Class B | | | 1,287 | | | | 23 | | |
Kone Oyj, Class B | | | 1,629 | | | | 68 | | |
Metso Oyj | | | 3,232 | | | | 34 | | |
Neste Oyj | | | 2,004 | | | | 68 | | |
Nokia Oyj | | | 25,631 | | | | 96 | | |
Orion Oyj, Class B | | | 510 | | | | 20 | | |
Sampo Oyj, Class A | | | 2,221 | | | | 96 | | |
Stora Enso Oyj, Class R | | | 2,779 | | | | 35 | | |
UPM-Kymmene Oyj | | | 2,533 | | | | 87 | | |
Wartsila Oyj Abp | | | 2,271 | | | | 26 | | |
| | | | 610 | | |
France (1.9%) | |
Accor SA | | | 860 | | | | 29 | | |
Aeroports de Paris SA | | | 140 | | | | 16 | | |
Air Liquide SA | | | 2,462 | | | | 415 | | |
Airbus SE | | | 2,765 | | | | 370 | | |
Alstom SA | | | 1,504 | | | | 36 | | |
Amundi SA | | | 283 | | | | 16 | | |
ArcelorMittal SA | | | 2,302 | | | | 58 | | |
Arkema SA | | | 263 | | | | 26 | | |
AXA SA | | | 8,619 | | | | 256 | | |
BioMerieux | | | 194 | | | | 19 | | |
BNP Paribas SA | | | 17,496 | | | | 1,112 | | |
Bollore SE | | | 4,148 | | | | 22 | | |
Bouygues SA | | | 955 | | | | 33 | | |
Bureau Veritas SA | | | 1,361 | | | | 34 | | |
Capgemini SE | | | 767 | | | | 134 | | |
Carrefour SA | | | 2,764 | | | | 47 | | |
Cie de Saint-Gobain SA | | | 2,302 | | | | 138 | | |
Cie Generale des Etablissements Michelin SCA | | | 3,140 | | | | 96 | | |
Covivio SA REIT | | | 217 | | | | 10 | | |
Credit Agricole SA | | | 19,020 | | | | 234 | | |
Danone SA | | | 3,008 | | | | 166 | | |
Dassault Aviation SA | | | 117 | | | | 22 | | |
Dassault Systemes SE | | | 3,088 | | | | 115 | | |
Edenred SE | | | 1,170 | | | | 73 | | |
Eiffage SA | | | 343 | | | | 33 | | |
Engie SA | | | 8,565 | | | | 131 | | |
EssilorLuxottica SA | | | 1,357 | | | | 236 | | |
Eurazeo SE | | | 203 | | | | 12 | | |
Eurofins Scientific SE | | | 621 | | | | 35 | | |
Euronext NV | | | 400 | | | | 28 | | |
Gecina SA REIT | | | 210 | | | | 21 | | |
Getlink SE | | | 1,684 | | | | 27 | | |
Hermes International | | | 148 | | | | 270 | | |
Ipsen SA | | | 178 | | | | 23 | | |
Kering SA | | | 332 | | | | 151 | | |
Klepierre SA REIT | | | 1,001 | | | | 24 | | |
L'Oreal SA | | | 1,139 | | | | 472 | | |
The accompanying notes are an integral part of the consolidated financial statements.
16
Morgan Stanley Institutional Fund Trust
Annual Report — September 30, 2023
Consolidated Portfolio of Investments (cont'd)
Global Strategist Portfolio
| | | Shares | | Value
(000) | |
France (cont'd) | |
La Francaise des Jeux SAEM | | | 492 | | | $ | 16 | | |
Legrand SA | | | 1,266 | | | | 116 | | |
LVMH Moet Hennessy Louis Vuitton SE | | | 1,298 | | | | 980 | | |
Orange SA | | | 8,645 | | | | 99 | | |
Pernod Ricard SA | | | 966 | | | | 161 | | |
Publicis Groupe SA | | | 1,094 | | | | 83 | | |
Remy Cointreau SA | | | 106 | | | | 13 | | |
Renault SA | | | 897 | | | | 37 | | |
Safran SA | | | 1,592 | | | | 249 | | |
Sanofi | | | 5,352 | | | | 575 | | |
Sartorius Stedim Biotech | | | 128 | | | | 30 | | |
Schneider Electric SE | | | 2,577 | | | | 425 | | |
SEB SA | | | 116 | | | | 11 | | |
Societe Generale SA | | | 12,214 | | | | 296 | | |
Sodexo SA | | | 413 | | | | 42 | | |
STMicroelectronics NV | | | 3,201 | | | | 138 | | |
Teleperformance SE | | | 274 | | | | 34 | | |
Thales SA | | | 493 | | | | 69 | | |
TotalEnergies SE | | | 11,077 | | | | 728 | | |
Unibail-Rodamco-Westfield REIT (e) | | | 546 | | | | 27 | | |
Valeo SE | | | 970 | | | | 17 | | |
Veolia Environnement SA | | | 3,175 | | | | 92 | | |
Vinci SA | | | 2,467 | | | | 273 | | |
Vivendi SE | | | 3,336 | | | | 29 | | |
Wendel SE | | | 123 | | | | 10 | | |
Worldline SA (e) | | | 1,082 | | | | 30 | | |
| | | | 9,520 | | |
Germany (1.2%) | |
Adidas AG | | | 763 | | | | 134 | | |
Allianz SE (Registered) | | | 1,897 | | | | 451 | | |
BASF SE | | | 4,178 | | | | 189 | | |
Bayer AG (Registered) | | | 4,645 | | | | 223 | | |
Bayerische Motoren Werke AG | | | 1,564 | | | | 159 | | |
Bayerische Motoren Werke AG (Preference) | | | 280 | | | | 26 | | |
Bechtle AG | | | 375 | | | | 17 | | |
Beiersdorf AG | | | 476 | | | | 61 | | |
Brenntag SE | | | 734 | | | | 57 | | |
Carl Zeiss Meditec AG | | | 186 | | | | 16 | | |
Commerzbank AG | | | 16,892 | | | | 192 | | |
Continental AG | | | 511 | | | | 36 | | |
Covestro AG (e) | | | 928 | | | | 50 | | |
Daimler Truck Holding AG | | | 2,371 | | | | 82 | | |
Delivery Hero SE (e) | | | 797 | | | | 23 | | |
Deutsche Bank AG (Registered) | | | 9,047 | | | | 99 | | |
Deutsche Boerse AG | | | 888 | | | | 153 | | |
Deutsche Lufthansa AG (Registered) (e) | | | 2,775 | | | | 22 | | |
Deutsche Post AG (Registered) | | | 4,736 | | | | 192 | | |
Deutsche Telekom AG (Registered) | | | 15,229 | | | | 319 | | |
Dr Ing hc F Porsche AG (Preference) | | | 531 | | | | 50 | | |
E.ON SE | | | 10,595 | | | | 125 | | |
Evonik Industries AG | | | 994 | | | | 18 | | |
| | | Shares | | Value
(000) | |
Fresenius Medical Care AG & Co. KGaA | | | 964 | | | $ | 41 | | |
Fresenius SE & Co. KGaA | | | 1,994 | | | | 62 | | |
GEA Group AG | | | 708 | | | | 26 | | |
Hannover Rueck SE (Registered) | | | 286 | | | | 63 | | |
Heidelberg Materials AG | | | 679 | | | | 53 | | |
HelloFresh SE (e) | | | 747 | | | | 22 | | |
Henkel AG & Co. KGaA | | | 487 | | | | 31 | | |
Henkel AG & Co. KGaA (Preference) | | | 795 | | | | 57 | | |
Infineon Technologies AG | | | 6,185 | | | | 205 | | |
Knorr-Bremse AG | | | 342 | | | | 22 | | |
LEG Immobilien SE (e) | | | 329 | | | | 23 | | |
Mercedes-Benz Group AG (Registered) | | | 4,076 | | | | 284 | | |
Merck KGaA | | | 604 | | | | 101 | | |
MTU Aero Engines AG | | | 252 | | | | 46 | | |
Muenchener Rueckversicherungs-Gesellschaft
AG in Muenchen (Registered) | | | 666 | | | | 259 | | |
Nemetschek SE | | | 265 | | | | 16 | | |
Porsche Automobil Holding SE (Preference) | | | 717 | | | | 35 | | |
Puma SE | | | 486 | | | | 30 | | |
QIAGEN NV (e) | | | 1,068 | | | | 43 | | |
Rational AG | | | 24 | | | | 15 | | |
Rheinmetall AG | | | 206 | | | | 53 | | |
RWE AG | | | 2,975 | | | | 110 | | |
SAP SE | | | 4,894 | | | | 634 | | |
Sartorius AG (Preference) | | | 120 | | | | 41 | | |
Scout24 SE | | | 349 | | | | 24 | | |
Siemens AG (Registered) | | | 3,597 | | | | 514 | | |
Siemens Energy AG (e) | | | 2,449 | | | | 32 | | |
Siemens Healthineers AG | | | 1,314 | | | | 67 | | |
Symrise AG | | | 616 | | | | 59 | | |
Talanx AG | | | 299 | | | | 19 | | |
Telefonica Deutschland Holding AG | | | 4,207 | | | | 8 | | |
Volkswagen AG | | | 140 | | | | 18 | | |
Volkswagen AG (Preference) | | | 968 | | | | 111 | | |
Vonovia SE | | | 3,136 | | | | 75 | | |
Wacker Chemie AG | | | 86 | | | | 12 | | |
Zalando SE (e) | | | 1,033 | | | | 23 | | |
| | | | 5,928 | | |
Hong Kong (0.3%) | |
AIA Group Ltd. | | | 54,678 | | | | 442 | | |
BOC Hong Kong Holdings Ltd. | | | 17,531 | | | | 48 | | |
Budweiser Brewing Co. APAC Ltd. | | | 8,252 | | | | 16 | | |
CK Asset Holdings Ltd. | | | 9,306 | | | | 49 | | |
CK Hutchison Holdings Ltd. | | | 12,587 | | | | 67 | | |
CK Infrastructure Holdings Ltd. | | | 2,963 | | | | 14 | | |
CLP Holdings Ltd. | | | 7,673 | | | | 57 | | |
ESR Group Ltd. | | | 9,447 | | | | 13 | | |
Futu Holdings Ltd. ADR (e) | | | 265 | | | | 15 | | |
Galaxy Entertainment Group Ltd. | | | 10,262 | | | | 61 | | |
Hang Lung Properties Ltd. | | | 8,612 | | | | 12 | | |
Hang Seng Bank Ltd. | | | 3,601 | | | | 45 | | |
Henderson Land Development Co. Ltd. | | | 6,865 | | | | 18 | | |
HKT Trust & HKT Ltd. | | | 17,645 | | | | 18 | | |
The accompanying notes are an integral part of the consolidated financial statements.
17
Morgan Stanley Institutional Fund Trust
Annual Report — September 30, 2023
Consolidated Portfolio of Investments (cont'd)
Global Strategist Portfolio
| | | Shares | | Value
(000) | |
Hong Kong (cont'd) | |
Hong Kong & China Gas Co. Ltd. | | | 52,823 | | | $ | 37 | | |
Hong Kong Exchanges & Clearing Ltd. | | | 5,713 | | | | 212 | | |
Hongkong Land Holdings Ltd. | | | 5,263 | | | | 19 | | |
Jardine Matheson Holdings Ltd. | | | 739 | | | | 34 | | |
Link REIT | | | 12,241 | | | | 60 | | |
MTR Corp. Ltd. | | | 7,545 | | | | 30 | | |
New World Development Co. Ltd. | | | 7,206 | | | | 14 | | |
Power Assets Holdings Ltd. | | | 6,435 | | | | 31 | | |
Sands China Ltd. (e) | | | 11,439 | | | | 35 | | |
Sino Land Co. Ltd. | | | 17,302 | | | | 19 | | |
SITC International Holdings Co. Ltd. | | | 6,397 | | | | 11 | | |
Sun Hung Kai Properties Ltd. | | | 6,843 | | | | 73 | | |
Swire Pacific Ltd., Class A | | | 2,034 | | | | 14 | | |
Swire Properties Ltd. | | | 5,464 | | | | 11 | | |
Techtronic Industries Co. Ltd. | | | 6,249 | | | | 60 | | |
WH Group Ltd. | | | 39,509 | | | | 21 | | |
Wharf Real Estate Investment Co. Ltd. | | | 7,758 | | | | 30 | | |
Xinyi Glass Holdings Ltd. | | | 8,136 | | | | 10 | | |
| | | | 1,596 | | |
Ireland (0.1%) | |
AIB Group PLC | | | 6,152 | | | | 28 | | |
Bank of Ireland Group PLC | | | 4,845 | | | | 47 | | |
CRH PLC | | | 3,347 | | | | 183 | | |
Flutter Entertainment PLC (e) | | | 801 | | | | 131 | | |
Kerry Group PLC, Class A | | | 719 | | | | 60 | | |
Kingspan Group PLC | | | 698 | | | | 52 | | |
Smurfit Kappa Group PLC | | | 1,178 | | | | 39 | | |
| | | | 540 | | |
Israel (0.1%) | |
Azrieli Group Ltd. | | | 207 | | | | 11 | | |
Bank Hapoalim BM | | | 6,204 | | | | 55 | | |
Bank Leumi Le-Israel BM | | | 7,542 | | | | 62 | | |
Check Point Software Technologies Ltd. (e) | | | 472 | | | | 63 | | |
CyberArk Software Ltd. (e) | | | 200 | | | | 33 | | |
Elbit Systems Ltd. | | | 130 | | | | 26 | | |
ICL Group Ltd. | | | 3,779 | | | | 21 | | |
Israel Discount Bank Ltd., Class A | | | 6,043 | | | | 33 | | |
Mizrahi Tefahot Bank Ltd. | | | 754 | | | | 27 | | |
Monday.com Ltd. (e) | | | 93 | | | | 15 | | |
Nice Ltd. (e) | | | 310 | | | | 53 | | |
Teva Pharmaceutical Industries Ltd. ADR (e) | | | 5,423 | | | | 55 | | |
Tower Semiconductor Ltd. (e) | | | 537 | | | | 13 | | |
Wix.com Ltd. (e) | | | 264 | | | | 24 | | |
| | | | 491 | | |
Italy (0.6%) | |
Amplifon SpA | | | 592 | | | | 17 | | |
Assicurazioni Generali SpA | | | 4,768 | | | | 97 | | |
| CNH Industrial NV | | | 4,809 | | | | 58 | | |
Davide Campari-Milano NV | | | 2,468 | | | | 29 | | |
DiaSorin SpA | | | 118 | | | | 11 | | |
Enel SpA | | | 38,406 | | | | 235 | | |
| | | Shares | | Value
(000) | |
Eni SpA | | | 10,959 | | | $ | 176 | | |
EXOR NV | | | 1,013 | | | | 90 | | |
Ferrari NV | | | 590 | | | | 174 | | |
FinecoBank Banca Fineco SpA | | | 9,499 | | | | 115 | | |
Infrastrutture Wireless Italiane SpA | | | 1,597 | | | | 19 | | |
Intesa Sanpaolo SpA | | | 257,300 | | | | 659 | | |
Mediobanca Banca di Credito Finanziario SpA | | | 9,309 | | | | 123 | | |
Moncler SpA | | | 976 | | | | 57 | | |
Nexi SpA (e) | | | 2,730 | | | | 17 | | |
Poste Italiane SpA | | | 2,448 | | | | 26 | | |
Prysmian SpA | | | 1,199 | | | | 48 | | |
Recordati Industria Chimica e Farmaceutica SpA | | | 490 | | | | 23 | | |
Snam SpA | | | 9,366 | | | | 44 | | |
Stellantis NV | | | 10,583 | | | | 203 | | |
Telecom Italia SpA (Milano) (e) | | | 46,527 | | | | 14 | | |
Tenaris SA | | | 2,220 | | | | 35 | | |
Terna — Rete Elettrica Nazionale | | | 6,531 | | | | 49 | | |
UniCredit SpA | | | 31,711 | | | | 756 | | |
| | | | 3,075 | | |
Netherlands (0.7%) | |
ABN AMRO Bank NV CVA | | | 6,579 | | | | 93 | | |
Adyen NV (e) | | | 101 | | | | 75 | | |
Aegon NV | | | 7,994 | | | | 39 | | |
AerCap Holdings NV (e) | | | 777 | | | | 49 | | |
Akzo Nobel NV | | | 790 | | | | 57 | | |
ASM International NV | | | 218 | | | | 91 | | |
| ASML Holding NV | | | 1,873 | | | | 1,103 | | |
Coca-Cola Europacific Partners PLC | | | 963 | | | | 60 | | |
DSM BV (e) | | | 890 | | | | 88 | | |
DSM-Firmenich AG | | | 810 | | | | 68 | | |
Heineken Holding NV | | | 537 | | | | 40 | | |
Heineken NV | | | 1,214 | | | | 107 | | |
IMCD NV | | | 263 | | | | 33 | | |
ING Groep NV | | | 59,960 | | | | 790 | | |
JDE Peet's NV | | | 587 | | | | 16 | | |
Just Eat Takeaway.com NV (e) | | | 938 | | | | 12 | | |
Koninklijke Ahold Delhaize NV | | | 4,560 | | | | 137 | | |
Koninklijke KPN NV | | | 15,067 | | | | 50 | | |
Koninklijke Philips NV | | | 4,351 | | | | 87 | | |
NN Group NV | | | 1,189 | | | | 38 | | |
OCI NV (e) | | | 488 | | | | 14 | | |
Prosus NV (e) | | | 8,127 | | | | 239 | | |
Randstad NV | | | 516 | | | | 29 | | |
Universal Music Group NV | | | 3,833 | | | | 100 | | |
Wolters Kluwer NV | | | 1,194 | | | | 145 | | |
| | | | 3,560 | | |
New Zealand (0.0%)‡ | |
Auckland International Airport Ltd. | | | 5,954 | | | | 28 | | |
EBOS Group Ltd. | | | 727 | | | | 15 | | |
Fisher & Paykel Healthcare Corp. Ltd. | | | 2,785 | | | | 36 | | |
Mercury NZ Ltd. | | | 3,401 | | | | 12 | | |
Meridian Energy Ltd. | | | 6,046 | | | | 19 | | |
The accompanying notes are an integral part of the consolidated financial statements.
18
Morgan Stanley Institutional Fund Trust
Annual Report — September 30, 2023
Consolidated Portfolio of Investments (cont'd)
Global Strategist Portfolio
| | | Shares | | Value
(000) | |
New Zealand (cont'd) | |
Spark New Zealand Ltd. | | | 8,796 | | | $ | 25 | | |
| | | | 135 | | |
Norway (0.1%) | |
Adevinta ASA (e) | | | 1,252 | | | | 12 | | |
Aker BP ASA | | | 1,398 | | | | 39 | | |
DNB Bank ASA | | | 4,136 | | | | 83 | | |
Equinor ASA | | | 4,275 | | | | 140 | | |
Gjensidige Forsikring ASA | | | 880 | | | | 13 | | |
Kongsberg Gruppen ASA | | | 396 | | | | 16 | | |
Mowi ASA | | | 1,911 | | | | 34 | | |
Norsk Hydro ASA | | | 6,153 | | | | 39 | | |
Orkla ASA | | | 3,345 | | | | 25 | | |
Salmar ASA | | | 314 | | | | 16 | | |
Telenor ASA | | | 3,124 | | | | 35 | | |
Yara International ASA | | | 769 | | | | 29 | | |
| | | | 481 | | |
Portugal (0.0%)‡ | |
EDP — Energias de Portugal SA | | | 13,295 | | | | 55 | | |
EDP Renovaveis SA | | | 1,155 | | | | 19 | | |
Galp Energia SGPS SA | | | 2,241 | | | | 33 | | |
Jeronimo Martins SGPS SA | | | 1,291 | | | | 29 | | |
| | | | 136 | | |
Singapore (0.2%) | |
CapitaLand Ascendas REIT | | | 15,023 | | | | 30 | | |
CapitaLand Integrated Commercial Trust REIT | | | 23,671 | | | | 32 | | |
CapitaLand Investment Ltd. | | | 11,589 | | | | 26 | | |
City Developments Ltd. | | | 2,250 | | | | 11 | | |
DBS Group Holdings Ltd. | | | 8,046 | | | | 198 | | |
Genting Singapore Ltd. | | | 26,760 | | | | 17 | | |
Grab Holdings Ltd., Class A (e) | | | 8,197 | | | | 29 | | |
Jardine Cycle & Carriage Ltd. | | | 462 | | | | 11 | | |
Keppel Corp. Ltd. | | | 6,494 | | | | 32 | | |
Mapletree Logistics Trust REIT | | | 15,535 | | | | 19 | | |
Mapletree Pan Asia Commercial Trust REIT | | | 10,414 | | | | 11 | | |
Oversea-Chinese Banking Corp. Ltd. | | | 14,992 | | | | 140 | | |
Sea Ltd. ADR (e) | | | 1,618 | | | | 71 | | |
Seatrium Ltd. (e) | | | 179,082 | | | | 17 | | |
Singapore Airlines Ltd. | | | 5,926 | | | | 28 | | |
Singapore Exchange Ltd. | | | 3,848 | | | | 27 | | |
Singapore Technologies Engineering Ltd. | | | 6,893 | | | | 20 | | |
Singapore Telecommunications Ltd. | | | 36,874 | | | | 65 | | |
United Overseas Bank Ltd. | | | 5,611 | | | | 117 | | |
UOL Group Ltd. | | | 2,071 | | | | 10 | | |
Venture Corp. Ltd. | | | 1,207 | | | | 11 | | |
Wilmar International Ltd. | | | 8,457 | | | | 23 | | |
| | | | 945 | | |
Spain (0.7%) | |
Acciona SA | | | 116 | | | | 15 | | |
ACS Actividades de Construccion y Servicios SA | | | 1,004 | | | | 36 | | |
Aena SME SA | | | 351 | | | | 53 | | |
Amadeus IT Group SA | | | 2,082 | | | | 126 | | |
| | | Shares | | Value
(000) | |
Banco Bilbao Vizcaya Argentaria SA | | | 102,594 | | | $ | 830 | | |
Banco Santander SA | | | 269,645 | | | | 1,027 | | |
CaixaBank SA | | | 69,810 | | | | 278 | | |
Cellnex Telecom SA (e) | | | 2,615 | | | | 91 | | |
Corp. ACCIONA Energias Renovables SA | | | 303 | | | | 8 | | |
Enagas SA | | | 1,153 | | | | 19 | | |
Endesa SA | | | 1,496 | | | | 30 | | |
Ferrovial SE | | | 2,352 | | | | 72 | | |
Food Delivery Brands Group SA (e) | | | 156 | | | | — | | |
Grifols SA (e) | | | 1,339 | | | | 17 | | |
Iberdrola SA | | | 27,950 | | | | 313 | | |
Industria de Diseno Textil SA | | | 5,125 | | | | 191 | | |
Naturgy Energy Group SA | | | 584 | | | | 16 | | |
Redeia Corp. SA | | | 1,868 | | | | 29 | | |
Repsol SA | | | 6,216 | | | | 102 | | |
Telefonica SA | | | 24,250 | | | | 99 | | |
| | | | 3,352 | | |
Sweden (0.4%) | |
Alfa Laval AB | | | 1,334 | | | | 46 | | |
Assa Abloy AB, Class B | | | 4,600 | | | | 100 | | |
Atlas Copco AB, Class A | | | 19,927 | | | | 255 | | |
Beijer Ref AB | | | 1,787 | | | | 19 | | |
Boliden AB (e) | | | 1,264 | | | | 36 | | |
Embracer Group AB (e) | | | 3,250 | | | | 6 | | |
Epiroc AB, Class A | | | 4,938 | | | | 88 | | |
EQT AB | | | 1,600 | | | | 32 | | |
Essity AB, Class B | | | 2,777 | | | | 60 | | |
Evolution AB | | | 837 | | | | 84 | | |
Fastighets AB Balder, Class B (e) | | | 2,805 | | | | 13 | | |
Getinge AB, Class B | | | 1,052 | | | | 19 | | |
H & M Hennes & Mauritz AB, Class B | | | 3,008 | | | | 43 | | |
Hexagon AB, Class B | | | 9,172 | | | | 78 | | |
Holmen AB, Class B | | | 423 | | | | 16 | | |
Husqvarna AB, Class B | | | 1,889 | | | | 14 | | |
Industrivarden AB, Class A | | | 1,289 | | | | 34 | | |
Indutrade AB | | | 1,240 | | | | 23 | | |
Investment AB Latour, Class B | | | 663 | | | | 12 | | |
Investor AB, Class A | | | 9,771 | | | | 186 | | |
Kinnevik AB, Class B (e) | | | 1,070 | | | | 11 | | |
L E Lundbergforetagen AB, Class B | | | 342 | | | | 14 | | |
Lifco AB, Class B | | | 1,047 | | | | 18 | | |
Nibe Industrier AB, Class B | | | 6,829 | | | | 45 | | |
Nordea Bank Abp | | | 14,720 | | | | 161 | | |
Saab AB, Class B | | | 368 | | | | 19 | | |
Sagax AB, Class B | | | 822 | | | | 16 | | |
Sandvik AB | | | 4,958 | | | | 91 | | |
Securitas AB, Class B | | | 2,184 | | | | 17 | | |
Skandinaviska Enskilda Banken AB, Class A | | | 7,334 | | | | 87 | | |
Skanska AB, Class B | | | 1,508 | | | | 25 | | |
| SKF AB, Class B | | | 1,558 | | | | 26 | | |
Svenska Cellulosa AB SCA, Class B | | | 2,741 | | | | 38 | | |
Svenska Handelsbanken AB, Class A | | | 6,714 | | | | 60 | | |
The accompanying notes are an integral part of the consolidated financial statements.
19
Morgan Stanley Institutional Fund Trust
Annual Report — September 30, 2023
Consolidated Portfolio of Investments (cont'd)
Global Strategist Portfolio
| | | Shares | | Value
(000) | |
Sweden (cont'd) | |
Swedbank AB, Class A | | | 3,919 | | | $ | 72 | | |
Swedish Orphan Biovitrum AB (e) | | | 827 | | | | 17 | | |
Tele2 AB, Class B | | | 2,392 | | | | 18 | | |
Telefonaktiebolaget LM Ericsson, Class B | | | 13,189 | | | | 64 | | |
Telia Co. AB | | | 11,019 | | | | 23 | | |
Volvo AB, Class A | | | 7,824 | | | | 161 | | |
Volvo Car AB, Class B (e) | | | 2,736 | | | | 11 | | |
| | | | 2,158 | | |
Switzerland (1.3%) | |
ABB Ltd. (Registered) | | | 7,339 | | | | 262 | | |
Adecco Group AG (Registered) | | | 737 | | | | 30 | | |
Alcon, Inc. | | | 2,297 | | | | 177 | | |
Bachem Holding AG | | | 156 | | | | 12 | | |
Baloise Holding AG (Registered) | | | 210 | | | | 30 | | |
Banque Cantonale Vaudoise (Registered) | | | 139 | | | | 15 | | |
Barry Callebaut AG (Registered) | | | 16 | | | | 25 | | |
BKW AG | | | 97 | | | | 17 | | |
Chocoladefabriken Lindt & Spruengli AG | | | 5 | | | | 56 | | |
Chocoladefabriken Lindt & Spruengli AG (Registered) | | | 1 | | | | 109 | | |
Cie Financiere Richemont SA (Registered) | | | 2,466 | | | | 300 | | |
Clariant AG (Registered) (e) | | | 993 | | | | 16 | | |
Dufry AG (Registered) (e) | | | 462 | | | | 18 | | |
EMS-Chemie Holding AG (Registered) | | | 32 | | | | 22 | | |
Geberit AG (Registered) | | | 155 | | | | 77 | | |
Givaudan SA (Registered) | | | 42 | | | | 137 | | |
Helvetia Holding AG (Registered) | | | 171 | | | | 24 | | |
Holcim AG (e) | | | 2,559 | | | | 164 | | |
Julius Baer Group Ltd. | | | 985 | | | | 63 | | |
Kuehne & Nagel International AG (Registered) | | | 253 | | | | 72 | | |
Logitech International SA (Registered) | | | 761 | | | | 52 | | |
Lonza Group AG (Registered) | | | 342 | | | | 158 | | |
Nestle SA (Registered) | | | 12,614 | | | | 1,428 | | |
Novartis AG (Registered) | | | 9,417 | | | | 962 | | |
Partners Group Holding AG | | | 102 | | | | 114 | | |
Roche Holding AG | | | 147 | | | | 43 | | |
Roche Holding AG (Genusschein) | | | 3,215 | | | | 878 | | |
Schindler Holding AG | | | 189 | | | | 38 | | |
Schindler Holding AG (Registered) | | | 109 | | | | 21 | | |
SGS SA (Registered) | | | 685 | | | | 57 | | |
SIG Group AG (e) | | | 1,397 | | | | 34 | | |
Sika AG (Registered) | | | 664 | | | | 168 | | |
Sonova Holding AG (Registered) | | | 237 | | | | 56 | | |
Straumann Holding AG (Registered) | | | 515 | | | | 66 | | |
Swatch Group AG | | | 136 | | | | 35 | | |
Swatch Group AG (Registered) | | | 250 | | | | 12 | | |
Swiss Life Holding AG (Registered) | | | 141 | | | | 88 | | |
Swiss Prime Site AG (Registered) | | | 351 | | | | 32 | | |
Swiss Re AG | | | 1,401 | | | | 144 | | |
Swisscom AG (Registered) | | | 119 | | | | 71 | | |
Temenos AG (Registered) | | | 289 | | | | 20 | | |
UBS Group AG (Registered) (e) | | | 15,111 | | | | 372 | | |
| | | Shares | | Value
(000) | |
VAT Group AG | | | 124 | | | $ | 44 | | |
Zurich Insurance Group AG | | | 690 | | | | 316 | | |
| | | | 6,835 | | |
United Kingdom (2.1%) | |
| 3i Group PLC | | | 4,679 | | | | 118 | | |
abrdn PLC | | | 9,557 | | | | 18 | | |
Admiral Group PLC | | | 992 | | | | 29 | | |
Anglo American PLC | | | 6,253 | | | | 172 | | |
Antofagasta PLC | | | 1,963 | | | | 34 | | |
Ashtead Group PLC | | | 2,102 | | | | 128 | | |
Associated British Foods PLC | | | 1,700 | | | | 43 | | |
AstraZeneca PLC | | | 7,363 | | | | 993 | | |
Auto Trader Group PLC | | | 4,332 | | | | 33 | | |
Aviva PLC | | | 13,334 | | | | 63 | | |
BAE Systems PLC | | | 14,610 | | | | 178 | | |
Barclays PLC | | | 74,290 | | | | 143 | | |
Barratt Developments PLC | | | 4,523 | | | | 24 | | |
Berkeley Group Holdings PLC | | | 504 | | | | 25 | | |
| BP PLC | | | 84,646 | | | | 546 | | |
British American Tobacco PLC | | | 10,089 | | | | 317 | | |
British Land Co. PLC REIT | | | 3,950 | | | | 15 | | |
BT Group PLC | | | 32,821 | | | | 47 | | |
Bunzl PLC | | | 1,606 | | | | 57 | | |
Burberry Group PLC | | | 1,779 | | | | 41 | | |
Centrica PLC | | | 27,694 | | | | 52 | | |
Coca-Cola HBC AG (e) | | | 1,064 | | | | 29 | | |
Compass Group PLC | | | 8,354 | | | | 203 | | |
Croda International PLC | | | 661 | | | | 40 | | |
DCC PLC | | | 471 | | | | 26 | | |
Diageo PLC | | | 10,692 | | | | 394 | | |
Endeavour Mining PLC | | | 883 | | | | 17 | | |
Entain PLC | | | 3,016 | | | | 34 | | |
Evraz PLC (e) | | | 2,495 | | | | — | | |
Experian PLC | | | 4,391 | | | | 144 | | |
G4S Ltd. (e) | | | 6,437 | | | | 19 | | |
Glencore PLC | | | 52,209 | | | | 297 | | |
GSK PLC | | | 19,504 | | | | 353 | | |
Haleon PLC | | | 23,823 | | | | 99 | | |
Halma PLC | | | 1,791 | | | | 42 | | |
Hargreaves Lansdown PLC | | | 1,608 | | | | 15 | | |
Hikma Pharmaceuticals PLC | | | 784 | | | | 20 | | |
HSBC Holdings PLC | | | 96,567 | | | | 756 | | |
Imperial Brands PLC | | | 4,196 | | | | 85 | | |
Informa PLC | | | 6,687 | | | | 61 | | |
InterContinental Hotels Group PLC | | | 816 | | | | 60 | | |
Intertek Group PLC | | | 761 | | | | 38 | | |
J Sainsbury PLC | | | 7,858 | | | | 24 | | |
JD Sports Fashion PLC | | | 12,240 | | | | 22 | | |
Johnson Matthey PLC | | | 882 | | | | 17 | | |
Kingfisher PLC | | | 9,094 | | | | 25 | | |
Land Securities Group PLC REIT | | | 3,218 | | | | 23 | | |
Legal & General Group PLC | | | 28,105 | | | | 76 | | |
The accompanying notes are an integral part of the consolidated financial statements.
20
Morgan Stanley Institutional Fund Trust
Annual Report — September 30, 2023
Consolidated Portfolio of Investments (cont'd)
Global Strategist Portfolio
| | | Shares | | Value
(000) | |
United Kingdom (cont'd) | |
Lloyds Banking Group PLC | | | 315,491 | | | $ | 170 | | |
London Stock Exchange Group PLC | | | 1,927 | | | | 193 | | |
M&G PLC | | | 10,567 | | | | 25 | | |
Mondi PLC | | | 2,325 | | | | 39 | | |
National Grid PLC | | | 17,511 | | | | 209 | | |
NatWest Group PLC | | | 27,168 | | | | 78 | | |
Next PLC | | | 579 | | | | 51 | | |
Ocado Group PLC (e) | | | 2,854 | | | | 21 | | |
Paragon Offshore PLC (e)(f) | | | 303 | | | | — | | |
Pearson PLC | | | 3,085 | | | | 33 | | |
Persimmon PLC | | | 1,440 | | | | 19 | | |
Phoenix Group Holdings PLC | | | 3,579 | | | | 21 | | |
Prudential PLC | | | 13,340 | | | | 143 | | |
Reckitt Benckiser Group PLC | | | 3,435 | | | | 242 | | |
RELX PLC (LSE) | | | 9,103 | | | | 307 | | |
Rentokil Initial PLC | | | 11,948 | | | | 89 | | |
Rio Tinto PLC | | | 5,516 | | | | 346 | | |
Rolls-Royce Holdings PLC (e) | | | 39,362 | | | | 106 | | |
Royalty Pharma PLC, Class A | | | 1,070 | | | | 29 | | |
Sage Group PLC | | | 4,881 | | | | 59 | | |
Schroders PLC | | | 3,828 | | | | 19 | | |
Segro PLC REIT | | | 5,525 | | | | 48 | | |
Severn Trent PLC | | | 1,177 | | | | 34 | | |
Shell PLC | | | 32,876 | | | | 1,042 | | |
Smith & Nephew PLC | | | 4,184 | | | | 52 | | |
Smiths Group PLC | | | 1,690 | | | | 33 | | |
Spirax-Sarco Engineering PLC | | | 349 | | | | 40 | | |
SSE PLC | | | 5,199 | | | | 102 | | |
St. James's Place PLC | | | 2,575 | | | | 26 | | |
Standard Chartered PLC | | | 11,679 | | | | 107 | | |
Taylor Wimpey PLC | | | 16,230 | | | | 23 | | |
Tesco PLC | | | 34,728 | | | | 112 | | |
Unilever PLC CVA | | | 12,092 | | | | 598 | | |
United Utilities Group PLC | | | 3,187 | | | | 37 | | |
Vodafone Group PLC | | | 109,169 | | | | 102 | | |
Whitbread PLC | | | 957 | | | | 40 | | |
Wise PLC Class A (e) | | | 2,858 | | | | 24 | | |
WPP PLC | | | 5,229 | | | | 47 | | |
| | | | 10,661 | | |
United States (21.2%) | |
3M Co. | | | 1,566 | | | | 147 | | |
A O Smith Corp. | | | 356 | | | | 24 | | |
Abbott Laboratories | | | 5,024 | | | | 487 | | |
AbbVie, Inc. | | | 5,094 | | | | 759 | | |
Accenture PLC, Class A | | | 1,814 | | | | 557 | | |
Activision Blizzard, Inc. | | | 2,142 | | | | 201 | | |
Adobe, Inc. (e) | | | 1,312 | | | | 669 | | |
Advance Auto Parts, Inc. | | | 164 | | | | 9 | | |
Advanced Micro Devices, Inc. (e) | | | 4,757 | | | | 489 | | |
AECOM | | | 376 | | | | 31 | | |
AES Corp. | | | 1,879 | | | | 29 | | |
| | | Shares | | Value
(000) | |
Aflac, Inc. | | | 1,650 | | | $ | 127 | | |
Agilent Technologies, Inc. | | | 821 | | | | 92 | | |
Air Products & Chemicals, Inc. | | | 636 | | | | 180 | | |
Airbnb, Inc., Class A (e) | | | 1,185 | | | | 163 | | |
Akamai Technologies, Inc. (e) | | | 444 | | | | 47 | | |
Albemarle Corp. | | | 340 | | | | 58 | | |
Albertsons Cos., Inc., Class A | | | 818 | | | | 19 | | |
Alcoa Corp. | | | 514 | | | | 15 | | |
Alexandria Real Estate Equities, Inc. REIT | | | 456 | | | | 46 | | |
Align Technology, Inc. (e) | | | 219 | | | | 67 | | |
Allegion PLC | | | 250 | | | | 26 | | |
Alliant Energy Corp. | | | 709 | | | | 34 | | |
Allstate Corp. | | | 738 | | | | 82 | | |
Ally Financial, Inc. | | | 738 | | | | 20 | | |
Alnylam Pharmaceuticals, Inc. (e) | | | 356 | | | | 63 | | |
Alphabet, Inc., Class A (e) | | | 33,251 | | | | 4,366 | | |
Altria Group, Inc. | | | 5,172 | | | | 217 | | |
Amazon.com, Inc. (e) | | | 26,331 | | | | 3,347 | | |
Amcor PLC | | | 4,230 | | | | 39 | | |
Ameren Corp. | | | 742 | | | | 56 | | |
American Electric Power Co., Inc. | | | 1,448 | | | | 109 | | |
American Express Co. | | | 1,820 | | | | 272 | | |
American Financial Group, Inc. | | | 205 | | | | 23 | | |
American Homes 4 Rent, Class A REIT | | | 929 | | | | 31 | | |
American International Group, Inc. | | | 2,097 | | | | 127 | | |
American Tower Corp. REIT | | | 1,302 | | | | 214 | | |
American Water Works Co., Inc. | | | 550 | | | | 68 | | |
Ameriprise Financial, Inc. | | | 300 | | | | 99 | | |
AMETEK, Inc. | | | 664 | | | | 98 | | |
Amgen, Inc. | | | 1,516 | | | | 407 | | |
Amphenol Corp., Class A | | | 1,708 | | | | 143 | | |
Analog Devices, Inc. | | | 1,443 | | | | 253 | | |
Annaly Capital Management, Inc. REIT | | | 1,397 | | | | 26 | | |
ANSYS, Inc. (e) | | | 249 | | | | 74 | | |
Aon PLC, Class A | | | 588 | | | | 191 | | |
APA Corp. | | | 885 | | | | 36 | | |
Apollo Global Management, Inc. | | | 1,145 | | | | 103 | | |
Apple, Inc. | | | 45,808 | | | | 7,843 | | |
Applied Materials, Inc. | | | 2,459 | | | | 340 | | |
Aptiv PLC (e) | | | 767 | | | | 76 | | |
Aramark | | | 667 | | | | 23 | | |
Arch Capital Group Ltd. (e) | | | 1,070 | | | | 85 | | |
Archer-Daniels-Midland Co. | | | 1,554 | | | | 117 | | |
Ares Management Corp., Class A | | | 451 | | | | 46 | | |
Arista Networks, Inc. (e) | | | 735 | | | | 135 | | |
Arrow Electronics, Inc. (e) | | | 166 | | | | 21 | | |
Arthur J Gallagher & Co. | | | 616 | | | | 140 | | |
Aspen Technology, Inc. (e) | | | 83 | | | | 17 | | |
Assurant, Inc. | | | 150 | | | | 22 | | |
AT&T, Inc. | | | 19,222 | | | | 289 | | |
Atlanta Braves Holdings, Inc., Class C (e) | | | 17 | | | | 1 | | |
Atlassian Corp., Class A (e) | | | 425 | | | | 86 | | |
Atmos Energy Corp. | | | 408 | | | | 43 | | |
The accompanying notes are an integral part of the consolidated financial statements.
21
Morgan Stanley Institutional Fund Trust
Annual Report — September 30, 2023
Consolidated Portfolio of Investments (cont'd)
Global Strategist Portfolio
| | | Shares | | Value
(000) | |
United States (cont'd) | |
Autodesk, Inc. (e) | | | 607 | | | $ | 126 | | |
Automatic Data Processing, Inc. | | | 1,174 | | | | 282 | | |
AutoZone, Inc. (e) | | | 53 | | | | 135 | | |
AvalonBay Communities, Inc. REIT | | | 400 | | | | 69 | | |
Avantor, Inc. (e) | | | 1,859 | | | | 39 | | |
Avery Dennison Corp. | | | 232 | | | | 42 | | |
Axon Enterprise, Inc. (e) | | | 202 | | | | 40 | | |
Baker Hughes Co. | | | 2,885 | | | | 102 | | |
Ball Corp. | | | 891 | | | | 44 | | |
Bank of America Corp. | | | 20,322 | | | | 556 | | |
Bank of New York Mellon Corp. | | | 2,281 | | | | 97 | | |
Bath & Body Works, Inc. | | | 620 | | | | 21 | | |
Baxter International, Inc. | | | 1,420 | | | | 54 | | |
Becton Dickinson & Co. | | | 812 | | | | 210 | | |
Bentley Systems, Inc., Class B | | | 647 | | | | 32 | | |
Berkshire Hathaway, Inc., Class B (e) | | | 3,831 | | | | 1,342 | | |
Best Buy Co., Inc. | | | 563 | | | | 39 | | |
Bill Holdings, Inc. (e) | | | 276 | | | | 30 | | |
Biogen, Inc. (e) | | | 412 | | | | 106 | | |
BioMarin Pharmaceutical, Inc. (e) | | | 529 | | | | 47 | | |
Bio-Rad Laboratories, Inc., Class A (e) | | | 62 | | | | 22 | | |
Bio-Techne Corp. | | | 443 | | | | 30 | | |
BlackRock, Inc. | | | 425 | | | | 275 | | |
Blackstone, Inc. | | | 1,986 | | | | 213 | | |
Block, Inc., Class A (e) | | | 1,546 | | | | 68 | | |
Boeing Co. (e) | | | 1,648 | | | | 316 | | |
Booking Holdings, Inc. (e) | | | 108 | | | | 333 | | |
Booz Allen Hamilton Holding Corp. | | | 377 | | | | 41 | | |
BorgWarner, Inc. | | | 664 | | | | 27 | | |
Boston Properties, Inc. REIT | | | 412 | | | | 25 | | |
Boston Scientific Corp. (e) | | | 4,232 | | | | 223 | | |
Bristol-Myers Squibb Co. | | | 6,048 | | | | 351 | | |
Broadcom, Inc. | | | 1,196 | | | | 993 | | |
Broadridge Financial Solutions, Inc. | | | 331 | | | | 59 | | |
Brown & Brown, Inc. | | | 692 | | | | 48 | | |
Brown-Forman Corp., Class B | | | 872 | | | | 50 | | |
Builders FirstSource, Inc. (e) | | | 399 | | | | 50 | | |
Bunge Ltd. | | | 425 | | | | 46 | | |
Burlington Stores, Inc. (e) | | | 184 | | | | 25 | | |
Cadence Design Systems, Inc. (e) | | | 784 | | | | 184 | | |
Caesars Entertainment, Inc. (e) | | | 607 | | | | 28 | | |
Camden Property Trust REIT | | | 303 | | | | 29 | | |
Campbell Soup Co. | | | 547 | | | | 22 | | |
Capital One Financial Corp. | | | 1,076 | | | | 104 | | |
Cardinal Health, Inc. | | | 745 | | | | 65 | | |
Carlisle Cos., Inc. | | | 146 | | | | 38 | | |
Carlyle Group, Inc. | | | 607 | | | | 18 | | |
CarMax, Inc. (e) | | | 453 | | | | 32 | | |
Carnival Corp. (e) | | | 2,903 | | | | 40 | | |
Carrier Global Corp. | | | 2,395 | | | | 132 | | |
Catalent, Inc. (e) | | | 509 | | | | 23 | | |
Caterpillar, Inc. | | | 1,488 | | | | 406 | | |
| | | Shares | | Value
(000) | |
Cboe Global Markets, Inc. | | | 303 | | | $ | 47 | | |
CBRE Group, Inc., Class A (e) | | | 885 | | | | 65 | | |
CDW Corp. | | | 382 | | | | 77 | | |
Celanese Corp. | | | 301 | | | | 38 | | |
Cencora, Inc. | | | 496 | | | | 89 | | |
Centene Corp. (e) | | | 1,517 | | | | 104 | | |
CenterPoint Energy, Inc. | | | 1,778 | | | | 48 | | |
Ceridian HCM Holding, Inc. (e) | | | 419 | | | | 28 | | |
CF Industries Holdings, Inc. | | | 543 | | | | 47 | | |
CH Robinson Worldwide, Inc. | | | 328 | | | | 28 | | |
Charles River Laboratories International, Inc. (e) | | | 145 | | | | 28 | | |
Charles Schwab Corp. | | | 4,308 | | | | 237 | | |
Charter Communications, Inc., Class A (e) | | | 278 | | | | 122 | | |
Cheniere Energy, Inc. | | | 704 | | | | 117 | | |
Chesapeake Energy Corp. | | | 323 | | | | 28 | | |
Chevron Corp. | | | 5,097 | | | | 859 | | |
Chewy, Inc., Class A (e) | | | 282 | | | | 5 | | |
Chipotle Mexican Grill, Inc. (e) | | | 79 | | | | 145 | | |
Chubb Ltd. | | | 1,177 | | | | 245 | | |
Church & Dwight Co., Inc. | | | 699 | | | | 64 | | |
Cigna Group | | | 822 | | | | 235 | | |
Cincinnati Financial Corp. | | | 447 | | | | 46 | | |
Cintas Corp. | | | 263 | | | | 127 | | |
Cisco Systems, Inc. | | | 11,702 | | | | 629 | | |
Citigroup, Inc. | | | 5,603 | | | | 230 | | |
Citizens Financial Group, Inc. | | | 1,298 | | | | 35 | | |
Clarivate PLC (e) | | | 1,065 | | | | 7 | | |
Cleveland-Cliffs, Inc. (e) | | | 1,475 | | | | 23 | | |
Clorox Co. | | | 350 | | | | 46 | | |
Cloudflare, Inc., Class A (e) | | | 777 | | | | 49 | | |
CME Group, Inc. | | | 1,024 | | | | 205 | | |
CMS Energy Corp. | | | 817 | | | | 43 | | |
Coca-Cola Co. | | | 11,747 | | | | 658 | | |
Cognex Corp. | | | 492 | | | | 21 | | �� |
Cognizant Technology Solutions Corp., Class A | | | 1,462 | | | | 99 | | |
Coinbase Global, Inc., Class A (e) | | | 463 | | | | 35 | | |
Colgate-Palmolive Co. | | | 2,242 | | | | 159 | | |
Comcast Corp., Class A | | | 12,133 | | | | 538 | | |
Conagra Brands, Inc. | | | 1,340 | | | | 37 | | |
ConocoPhillips | | | 3,424 | | | | 410 | | |
Consolidated Edison, Inc. | | | 977 | | | | 84 | | |
Constellation Brands, Inc., Class A | | | 452 | | | | 114 | | |
Constellation Energy Corp. | | | 945 | | | | 103 | | |
Contra Abiomed, Inc. (e) | | | 90 | | | | — | @ | |
Cooper Cos., Inc. | | | 142 | | | | 45 | | |
Copart, Inc. (e) | | | 2,482 | | | | 107 | | |
Corning, Inc. | | | 2,300 | | | | 70 | | |
Corteva, Inc. | | | 2,002 | | | | 102 | | |
CoStar Group, Inc. (e) | | | 1,154 | | | | 89 | | |
Costco Wholesale Corp. | | | 1,265 | | | | 715 | | |
Coterra Energy, Inc. | | | 2,188 | | | | 59 | | |
Crowdstrike Holdings, Inc., Class A (e) | | | 619 | | | | 104 | | |
Crown Castle, Inc. REIT | | | 1,205 | | | | 111 | | |
The accompanying notes are an integral part of the consolidated financial statements.
22
Morgan Stanley Institutional Fund Trust
Annual Report — September 30, 2023
Consolidated Portfolio of Investments (cont'd)
Global Strategist Portfolio
| | | Shares | | Value
(000) | |
United States (cont'd) | |
Crown Holdings, Inc. | | | 342 | | | $ | 30 | | |
CSX Corp. | | | 5,928 | | | | 182 | | |
Cummins, Inc. | | | 404 | | | | 92 | | |
CVS Health Corp. | | | 3,580 | | | | 250 | | |
Danaher Corp. | | | 1,956 | | | | 485 | | |
Darden Restaurants, Inc. | | | 343 | | | | 49 | | |
Darling Ingredients, Inc. (e) | | | 457 | | | | 24 | | |
Datadog, Inc., Class A (e) | | | 709 | | | | 65 | | |
DaVita, Inc. (e) | | | 157 | | | | 15 | | |
Deckers Outdoor Corp. (e) | | | 75 | | | | 39 | | |
Deere & Co. | | | 796 | | | | 300 | | |
Dell Technologies, Inc., Class C | | | 729 | | | | 50 | | |
Delta Air Lines, Inc. | | | 459 | | | | 17 | | |
Dentsply Sirona, Inc. | | | 607 | | | | 21 | | |
Devon Energy Corp. | | | 1,865 | | | | 89 | | |
Dexcom, Inc. (e) | | | 1,145 | | | | 107 | | |
Diamondback Energy, Inc. | | | 491 | | | | 76 | | |
Dick's Sporting Goods, Inc. | | | 176 | | | | 19 | | |
Digital Realty Trust, Inc. REIT | | | 816 | | | | 99 | | |
Discover Financial Services | | | 740 | | | | 64 | | |
DocuSign, Inc. (e) | | | 575 | | | | 24 | | |
Dollar General Corp. | | | 621 | | | | 66 | | |
Dollar Tree, Inc. (e) | | | 625 | | | | 67 | | |
Dominion Energy, Inc. | | | 2,338 | | | | 104 | | |
Domino's Pizza, Inc. | | | 101 | | | | 38 | | |
DoorDash, Inc., Class A (e) | | | 732 | | | | 58 | | |
Dover Corp. | | | 400 | | | | 56 | | |
Dow, Inc. | | | 2,025 | | | | 104 | | |
DR Horton, Inc. | | | 885 | | | | 95 | | |
Dropbox, Inc., Class A (e) | | | 737 | | | | 20 | | |
DTE Energy Co. | | | 582 | | | | 58 | | |
Duke Energy Corp. | | | 2,176 | | | | 192 | | |
DuPont de Nemours, Inc. | | | 1,296 | | | | 97 | | |
Dynatrace, Inc. (e) | | | 627 | | | | 29 | | |
Eastman Chemical Co. | | | 338 | | | | 26 | | |
Eaton Corp. PLC | | | 1,139 | | | | 243 | | |
eBay, Inc. | | | 1,511 | | | | 67 | | |
Ecolab, Inc. | | | 738 | | | | 125 | | |
Edison International | | | 1,076 | | | | 68 | | |
Edwards Lifesciences Corp. (e) | | | 1,740 | | | | 121 | | |
Electronic Arts, Inc. | | | 786 | | | | 95 | | |
Elevance Health, Inc. | | | 640 | | | | 279 | | |
Eli Lilly & Co. | | | 2,297 | | | | 1,234 | | |
Emerson Electric Co. | | | 1,641 | | | | 158 | | |
Enphase Energy, Inc. (e) | | | 388 | | | | 47 | | |
Entegris, Inc. | | | 435 | | | | 41 | | |
Entergy Corp. | | | 593 | | | | 55 | | |
EOG Resources, Inc. | | | 1,674 | | | | 212 | | |
EPAM Systems, Inc. (e) | | | 162 | | | | 41 | | |
EQT Corp. | | | 1,034 | | | | 42 | | |
Equifax, Inc. | | | 349 | | | | 64 | | |
Equinix, Inc. REIT | | | 261 | | | | 190 | | |
| | | Shares | | Value
(000) | |
Equitable Holdings, Inc. | | | 1,017 | | | $ | 29 | | |
Equity Lifestyle Properties, Inc. REIT | | | 498 | | | | 32 | | |
Equity Residential REIT | | | 1,022 | | | | 60 | | |
Erie Indemnity Co., Class A | | | 73 | | | | 21 | | |
Essential Utilities, Inc. | | | 707 | | | | 24 | | |
Essex Property Trust, Inc. REIT | | | 182 | | | | 39 | | |
Estee Lauder Cos., Inc., Class A | | | 656 | | | | 95 | | |
Etsy, Inc. (e) | | | 346 | | | | 22 | | |
Everest Group Ltd. | | | 123 | | | | 46 | | |
Evergy, Inc. | | | 648 | | | | 33 | | |
Eversource Energy | | | 982 | | | | 57 | | |
Exact Sciences Corp. (e) | | | 502 | | | | 34 | | |
Exelon Corp. | | | 2,818 | | | | 106 | | |
Expedia Group, Inc. (e) | | | 430 | | | | 44 | | |
Expeditors International of Washington, Inc. | | | 438 | | | | 50 | | |
Extra Space Storage, Inc. REIT | | | 384 | | | | 47 | | |
Exxon Mobil Corp. | | | 11,695 | | | | 1,375 | | |
F5, Inc. (e) | | | 171 | | | | 28 | | |
FactSet Research Systems, Inc. | | | 108 | | | | 47 | | |
Fair Isaac Corp. (e) | | | 73 | | | | 63 | | |
Fastenal Co. | | | 1,614 | | | | 88 | | |
FedEx Corp. | | | 688 | | | | 182 | | |
Ferguson PLC | | | 588 | | | | 97 | | |
Fidelity National Financial, Inc. | | | 732 | | | | 30 | | |
Fidelity National Information Services, Inc. | | | 1,663 | | | | 92 | | |
Fifth Third Bancorp | | | 1,907 | | | | 48 | | |
First Citizens BancShares, Inc., Class A | | | 32 | | | | 44 | | |
First Horizon Corp. | | | 1,512 | | | | 17 | | |
First Republic Bank | | | 501 | | | | — | @ | |
First Solar, Inc. (e) | | | 294 | | | | 48 | | |
FirstEnergy Corp. | | | 1,543 | | | | 53 | | |
Fiserv, Inc. (e) | | | 1,794 | | | | 203 | | |
FleetCor Technologies, Inc. (e) | | | 201 | | | | 51 | | |
FMC Corp. | | | 356 | | | | 24 | | |
Ford Motor Co. | | | 11,430 | | | | 142 | | |
Fortinet, Inc. (e) | | | 1,941 | | | | 114 | | |
Fortive Corp. | | | 1,009 | | | | 75 | | |
Fortune Brands Innovations, Inc. | | | 365 | | | | 23 | | |
Fox Corp., Class A | | | 1,266 | | | | 39 | | |
Franklin Resources, Inc. | | | 844 | | | | 21 | | |
Freeport-McMoRan, Inc. | | | 4,103 | | | | 153 | | |
Gaming and Leisure Properties, Inc. REIT | | | 742 | | | | 34 | | |
Garmin Ltd. | | | 438 | | | | 46 | | |
Gartner, Inc. (e) | | | 230 | | | | 79 | | |
GE HealthCare Technologies, Inc. | | | 1,171 | | | | 80 | | |
Gen Digital, Inc. | | | 1,634 | | | | 29 | | |
Generac Holdings, Inc. (e) | | | 174 | | | | 19 | | |
General Dynamics Corp. | | | 665 | | | | 147 | | |
General Electric Co. | | | 3,158 | | | | 349 | | |
General Mills, Inc. | | | 1,665 | | | | 107 | | |
General Motors Co. | | | 3,957 | | | | 130 | | |
Genuine Parts Co. | | | 400 | | | | 58 | | |
Gilead Sciences, Inc. | | | 3,608 | | | | 270 | | |
The accompanying notes are an integral part of the consolidated financial statements.
23
Morgan Stanley Institutional Fund Trust
Annual Report — September 30, 2023
Consolidated Portfolio of Investments (cont'd)
Global Strategist Portfolio
| | | Shares | | Value
(000) | |
United States (cont'd) | |
Global Payments, Inc. | | | 755 | | | $ | 87 | | |
Globe Life, Inc. | | | 261 | | | | 28 | | |
GoDaddy, Inc., Class A (e) | | | 419 | | | | 31 | | |
Goldman Sachs Group, Inc. | | | 938 | | | | 304 | | |
Graco, Inc. | | | 481 | | | | 35 | | |
Halliburton Co. | | | 2,651 | | | | 107 | | |
Hartford Financial Services Group, Inc. | | | 891 | | | | 63 | | |
Hasbro, Inc. | | | 372 | | | | 25 | | |
HCA Healthcare, Inc. | | | 604 | | | | 149 | | |
Healthcare Realty Trust, Inc. REIT | | | 1,059 | | | | 16 | | |
Healthpeak Properties, Inc. REIT | | | 1,528 | | | | 28 | | |
HEICO Corp. | | | 338 | | | | 48 | | |
Henry Schein, Inc. (e) | | | 377 | | | | 28 | | |
Hershey Co. | | | 417 | | | | 83 | | |
Hess Corp. | | | 789 | | | | 121 | | |
Hewlett Packard Enterprise Co. | | | 3,714 | | | | 65 | | |
HF Sinclair Corp. | | | 433 | | | | 25 | | |
Hilton Worldwide Holdings, Inc. | | | 763 | | | | 115 | | |
Hologic, Inc. (e) | | | 700 | | | | 49 | | |
Home Depot, Inc. | | | 2,971 | | | | 898 | | |
Honeywell International, Inc. | | | 1,896 | | | | 350 | | |
Horizon Therapeutics PLC (e) | | | 537 | | | | 62 | | |
Hormel Foods Corp. | | | 853 | | | | 32 | | |
Host Hotels & Resorts, Inc. REIT | | | 2,026 | | | | 33 | | |
Howmet Aerospace, Inc. | | | 1,128 | | | | 52 | | |
HP, Inc. | | | 2,503 | | | | 64 | | |
Hubbell, Inc. | | | 153 | | | | 48 | | |
HubSpot, Inc. (e) | | | 134 | | | | 66 | | |
Humana, Inc. | | | 351 | | | | 171 | | |
Huntington Bancshares, Inc. | | | 4,163 | | | | 43 | | |
Huntington Ingalls Industries, Inc. | | | 114 | | | | 23 | | |
Hyatt Hotels Corp., Class A | | | 136 | | | | 14 | | |
IDEX Corp. | | | 214 | | | | 45 | | |
IDEXX Laboratories, Inc. (e) | | | 236 | | | | 103 | | |
Illinois Tool Works, Inc. | | | 868 | | | | 200 | | |
Illumina, Inc. (e) | | | 445 | | | | 61 | | |
Incyte Corp. (e) | | | 535 | | | | 31 | | |
Ingersoll Rand, Inc. | | | 1,183 | | | | 75 | | |
Insulet Corp. (e) | | | 197 | | | | 31 | | |
Intel Corp. | | | 12,101 | | | | 430 | | |
Intercontinental Exchange, Inc. | | | 1,601 | | | | 176 | | |
International Business Machines Corp. | | | 2,582 | | | | 362 | | |
International Flavors & Fragrances, Inc. | | | 712 | | | | 49 | | |
International Paper Co. | | | 942 | | | | 33 | | |
Interpublic Group of Cos., Inc. | | | 1,189 | | | | 34 | | |
Intuit, Inc. | | | 791 | | | | 404 | | |
Intuitive Surgical, Inc. (e) | | | 1,015 | | | | 297 | | |
Invesco Ltd. | | | 977 | | | | 14 | | |
Invitation Homes, Inc. REIT | | | 1,737 | | | | 55 | | |
IQVIA Holdings, Inc. (e) | | | 529 | | | | 104 | | |
Iron Mountain, Inc. REIT | | | 830 | | | | 49 | | |
J M Smucker Co. | | | 301 | | | | 37 | | |
| | | Shares | | Value
(000) | |
Jack Henry & Associates, Inc. | | | 205 | | | $ | 31 | | |
Jacobs Solutions, Inc. | | | 363 | | | | 50 | | |
Jazz Pharmaceuticals PLC (e) | | | 176 | | | | 23 | | |
JB Hunt Transport Services, Inc. | | | 231 | | | | 44 | | |
Johnson & Johnson | | | 7,495 | | | | 1,167 | | |
Johnson Controls International PLC | | | 1,972 | | | | 105 | | |
JPMorgan Chase & Co. | | | 8,516 | | | | 1,235 | | |
Juniper Networks, Inc. | | | 918 | | | | 26 | | |
Kellogg Co. | | | 778 | | | | 46 | | |
Keurig Dr Pepper, Inc. | | | 2,571 | | | | 81 | | |
KeyCorp | | | 2,499 | | | | 27 | | |
Keysight Technologies, Inc. (e) | | | 505 | | | | 67 | | |
Kimberly-Clark Corp. | | | 954 | | | | 115 | | |
Kimco Realty Corp. REIT | | | 1,747 | | | | 31 | | |
Kinder Morgan, Inc. | | | 5,853 | | | | 97 | | |
KKR & Co., Inc. | | | 1,721 | | | | 106 | | |
KLA Corp. | | | 406 | | | | 186 | | |
Knight-Swift Transportation Holdings, Inc. | | | 451 | | | | 23 | | |
Kraft Heinz Co. | | | 2,238 | | | | 75 | | |
Kroger Co. | | | 1,927 | | | | 86 | | |
L3Harris Technologies, Inc. | | | 540 | | | | 94 | | |
Laboratory Corp. of America Holdings | | | 250 | | | | 50 | | |
Lam Research Corp. | | | 393 | | | | 246 | | |
Lamb Weston Holdings, Inc. | | | 415 | | | | 38 | | |
Las Vegas Sands Corp. | | | 999 | | | | 46 | | |
Lattice Semiconductor Corp. (e) | | | 404 | | | | 35 | | |
Lear Corp. | | | 168 | | | | 23 | | |
Leidos Holdings, Inc. | | | 371 | | | | 34 | | |
Lennar Corp., Class A | | | 728 | | | | 82 | | |
Lennox International, Inc. | | | 92 | | | | 34 | | |
Liberty Broadband Corp., Class C (e) | | | 334 | | | | 30 | | |
Liberty Global PLC Series C (e) | | | 1,177 | | | | 21 | | |
Liberty Media Corp.-Liberty Formula One, Class C (e) | | | 564 | | | | 35 | | |
Liberty Media Corp.-Liberty Live, Class C (e) | | | 141 | | | | 5 | | |
Liberty Media Corp.-Liberty SiriusXM, Class C (e) | | | 474 | | | | 12 | | |
Linde PLC | | | 1,426 | | | | 531 | | |
Live Nation Entertainment, Inc. (e) | | | 469 | | | | 39 | | |
LKQ Corp. | | | 761 | | | | 38 | | |
Lockheed Martin Corp. | | | 659 | | | | 270 | | |
Loews Corp. | | | 559 | | | | 35 | | |
Lowe's Cos., Inc. | | | 1,697 | | | | 353 | | |
LPL Financial Holdings, Inc. | | | 227 | | | | 54 | | |
Lucid Group, Inc. (e) | | | 2,488 | | | | 14 | | |
Lululemon Athletica, Inc. (e) | | | 326 | | | | 126 | | |
LyondellBasell Industries NV, Class A | | | 738 | | | | 70 | | |
M&T Bank Corp. | | | 469 | | | | 59 | | |
Marathon Oil Corp. | | | 1,774 | | | | 47 | | |
Marathon Petroleum Corp. | | | 1,241 | | | | 188 | | |
Markel Group, Inc. (e) | | | 35 | | | | 52 | | |
MarketAxess Holdings, Inc. | | | 106 | | | | 23 | | |
Marriott International, Inc., Class A | | | 761 | | | | 150 | | |
Marsh & McLennan Cos., Inc. | | | 1,416 | | | | 269 | | |
Martin Marietta Materials, Inc. | | | 180 | | | | 74 | | |
The accompanying notes are an integral part of the consolidated financial statements.
24
Morgan Stanley Institutional Fund Trust
Annual Report — September 30, 2023
Consolidated Portfolio of Investments (cont'd)
Global Strategist Portfolio
| | | Shares | | Value
(000) | |
United States (cont'd) | |
Marvell Technology, Inc. | | | 2,432 | | | $ | 132 | | |
Masco Corp. | | | 647 | | | | 35 | | |
Masimo Corp. (e) | | | 133 | | | | 12 | | |
Mastercard, Inc., Class A | | | 2,431 | | | | 962 | | |
Match Group, Inc. (e) | | | 793 | | | | 31 | | |
McCormick & Co., Inc. | | | 715 | | | | 54 | | |
McDonald's Corp. | | | 2,082 | | | | 548 | | |
McKesson Corp. | | | 394 | | | | 171 | | |
Medtronic PLC | | | 3,898 | | | | 305 | | |
MercadoLibre, Inc. (e) | | | 128 | | | | 162 | | |
Merck & Co., Inc. | | | 7,305 | | | | 752 | | |
Meta Platforms, Inc., Class A (e) | | | 6,328 | | | | 1,900 | | |
MetLife, Inc. | | | 1,856 | | | | 117 | | |
Mettler-Toledo International, Inc. (e) | | | 63 | | | | 70 | | |
MGM Resorts International (e) | | | 855 | | | | 31 | | |
Microchip Technology, Inc. | | | 1,583 | | | | 124 | | |
Micron Technology, Inc. | | | 3,102 | | | | 211 | | |
Microsoft Corp. | | | 20,867 | | | | 6,589 | | |
Mid-America Apartment Communities, Inc. REIT | | | 331 | | | | 43 | | |
Moderna, Inc. (e) | | | 914 | | | | 94 | | |
Mohawk Industries, Inc. (e) | | | 153 | | | | 13 | | |
Molina Healthcare, Inc. (e) | | | 160 | | | | 52 | | |
Molson Coors Beverage Co., Class B | | | 534 | | | | 34 | | |
Mondelez International, Inc., Class A | | | 3,850 | | | | 267 | | |
MongoDB, Inc. (e) | | | 199 | | | | 69 | | |
Monolithic Power Systems, Inc. | | | 130 | | | | 60 | | |
Monster Beverage Corp. (e) | | | 2,213 | | | | 117 | | |
Moody's Corp. | | | 472 | | | | 149 | | |
Mosaic Co. | | | 931 | | | | 33 | | |
Motorola Solutions, Inc. | | | 478 | | | | 130 | | |
MSCI, Inc. | | | 227 | | | | 116 | | |
Nasdaq, Inc. | | | 981 | | | | 48 | | |
NetApp, Inc. | | | 609 | | | | 46 | | |
Netflix, Inc. (e) | | | 1,268 | | | | 479 | | |
Neurocrine Biosciences, Inc. (e) | | | 277 | | | | 31 | | |
Newmont Corp. | | | 2,270 | | | | 84 | | |
News Corp., Class A | | | 1,111 | | | | 22 | | |
NextEra Energy, Inc. | | | 5,872 | | | | 336 | | |
NIKE, Inc., Class B | | | 3,524 | | | | 337 | | |
NiSource, Inc. | | | 1,161 | | | | 29 | | |
Nordson Corp. | | | 146 | | | | 33 | | |
Norfolk Southern Corp. | | | 643 | | | | 127 | | |
Northern Trust Corp. | | | 519 | | | | 36 | | |
Northrop Grumman Corp. | | | 413 | | | | 182 | | |
Novocure Ltd. (e) | | | 272 | | | | 4 | | |
NRG Energy, Inc. | | | 655 | | | | 25 | | |
Nucor Corp. | | | 734 | | | | 115 | | |
NVIDIA Corp. | | | 7,214 | | | | 3,138 | | |
NVR, Inc. (e) | | | 10 | | | | 60 | | |
NXP Semiconductors NV | | | 746 | | | | 149 | | |
Occidental Petroleum Corp. | | | 2,046 | | | | 133 | | |
Okta, Inc. (e) | | | 443 | | | | 36 | | |
| | | Shares | | Value
(000) | |
Old Dominion Freight Line, Inc. | | | 281 | | | $ | 115 | | |
Omnicom Group, Inc. | | | 648 | | | | 48 | | |
ON Semiconductor Corp. (e) | | | 1,255 | | | | 117 | | |
ONEOK, Inc. | | | 1,270 | | | | 81 | | |
Oracle Corp. | | | 4,800 | | | | 508 | | |
O'Reilly Automotive, Inc. (e) | | | 174 | | | | 158 | | |
Otis Worldwide Corp. | | | 1,183 | | | | 95 | | |
Ovintiv, Inc. | | | 692 | | | | 33 | | |
Owens Corning | | | 260 | | | | 35 | | |
PACCAR, Inc. | | | 1,496 | | | | 127 | | |
Packaging Corp. of America | | | 256 | | | | 39 | | |
Palantir Technologies, Inc., Class A (e) | | | 5,158 | | | | 83 | | |
Palo Alto Networks, Inc. (e) | | | 872 | | | | 204 | | |
Paramount Global, Class B | | | 1,344 | | | | 17 | | |
Parker-Hannifin Corp. | | | 372 | | | | 145 | | |
Paychex, Inc. | | | 920 | | | | 106 | | |
Paycom Software, Inc. | | | 154 | | | | 40 | | |
Paylocity Holding Corp. (e) | | | 120 | | | | 22 | | |
PayPal Holdings, Inc. (e) | | | 3,050 | | | | 178 | | |
Pentair PLC | | | 467 | | | | 30 | | |
PepsiCo, Inc. | | | 3,895 | | | | 660 | | |
Pfizer, Inc. | | | 16,223 | | | | 538 | | |
PG&E Corp. (e) | | | 5,133 | | | | 83 | | |
Philip Morris International, Inc. | | | 4,496 | | | | 416 | | |
Phillips 66 | | | 1,295 | | | | 156 | | |
Pinterest, Inc., Class A (e) | | | 1,715 | | | | 46 | | |
Pioneer Natural Resources Co. | | | 667 | | | | 153 | | |
PNC Financial Services Group, Inc. | | | 1,128 | | | | 138 | | |
Pool Corp. | | | 111 | | | | 40 | | |
PPG Industries, Inc. | | | 676 | | | | 88 | | |
PPL Corp. | | | 2,073 | | | | 49 | | |
Principal Financial Group, Inc. | | | 685 | | | | 49 | | |
Procter & Gamble Co. | | | 6,793 | | | | 991 | | |
Progressive Corp. | | | 1,695 | | | | 236 | | |
Prologis, Inc. REIT | | | 2,645 | | | | 297 | | |
Prudential Financial, Inc. | | | 1,040 | | | | 99 | | |
PTC, Inc. (e) | | | 322 | | | | 46 | | |
Public Service Enterprise Group, Inc. | | | 1,407 | | | | 80 | | |
Public Storage REIT | | | 451 | | | | 119 | | |
PulteGroup, Inc. | | | 640 | | | | 47 | | |
Qorvo, Inc. (e) | | | 285 | | | | 27 | | |
QUALCOMM, Inc. | | | 3,122 | | | | 347 | | |
Quanta Services, Inc. | | | 415 | | | | 78 | | |
Quest Diagnostics, Inc. | | | 316 | | | | 39 | | |
Raymond James Financial, Inc. | | | 585 | | | | 59 | | |
Realty Income Corp. REIT | | | 1,861 | | | | 93 | | |
Regency Centers Corp. REIT | | | 435 | | | | 26 | | |
Regeneron Pharmaceuticals, Inc. (e) | | | 306 | | | | 252 | | |
Regions Financial Corp. | | | 2,642 | | | | 45 | | |
Reliance Steel & Aluminum Co. | | | 170 | | | | 45 | | |
Repligen Corp. (e) | | | 150 | | | | 24 | | |
Republic Services, Inc. | | | 631 | | | | 90 | | |
ResMed, Inc. | | | 422 | | | | 62 | | |
The accompanying notes are an integral part of the consolidated financial statements.
25
Morgan Stanley Institutional Fund Trust
Annual Report — September 30, 2023
Consolidated Portfolio of Investments (cont'd)
Global Strategist Portfolio
| | | Shares | | Value
(000) | |
United States (cont'd) | |
Revvity, Inc. | | | 349 | | | $ | 39 | | |
Rivian Automotive, Inc., Class A (e) | | | 1,823 | | | | 44 | | |
Robert Half, Inc. | | | 308 | | | | 23 | | |
ROBLOX Corp., Class A (e) | | | 1,220 | | | | 35 | | |
Rockwell Automation, Inc. | | | 333 | | | | 95 | | |
Roku, Inc. (e) | | | 350 | | | | 25 | | |
Rollins, Inc. | | | 706 | | | | 26 | | |
Roper Technologies, Inc. | | | 303 | | | | 147 | | |
Ross Stores, Inc. | | | 974 | | | | 110 | | |
Royal Caribbean Cruises Ltd. (e) | | | 662 | | | | 61 | | |
RPM International, Inc. | | | 365 | | | | 35 | | |
RTX Corp. | | | 4,184 | | | | 301 | | |
S&P Global, Inc. | | | 935 | | | | 342 | | |
Salesforce, Inc. (e) | | | 2,772 | | | | 562 | | |
SBA Communications Corp. REIT | | | 299 | | | | 60 | | |
Schlumberger NV | | | 4,059 | | | | 237 | | |
Seagate Technology Holdings PLC | | | 535 | | | | 35 | | |
Seagen, Inc. (e) | | | 401 | | | | 85 | | |
Sealed Air Corp. | | | 402 | | | | 13 | | |
SEI Investments Co. | | | 268 | | | | 16 | | |
Sempra | | | 1,782 | | | | 121 | | |
Sensata Technologies Holding PLC | | | 438 | | | | 17 | | |
ServiceNow, Inc. (e) | | | 576 | | | | 322 | | |
Sherwin-Williams Co. | | | 698 | | | | 178 | | |
Simon Property Group, Inc. REIT | | | 921 | | | | 99 | | |
Sirius XM Holdings, Inc. | | | 2,183 | | | | 10 | | |
Skyworks Solutions, Inc. | | | 455 | | | | 45 | | |
Snap, Inc., Class A (e) | | | 2,874 | | | | 26 | | |
Snap-on, Inc. | | | 152 | | | | 39 | | |
Snowflake, Inc., Class A (e) | | | 750 | | | | 115 | | |
SolarEdge Technologies, Inc. (e) | | | 160 | | | | 21 | | |
Southern Co. | | | 3,082 | | | | 199 | | |
Southwest Airlines Co. | | | 418 | | | | 11 | | |
Splunk, Inc. (e) | | | 456 | | | | 67 | | |
SS&C Technologies Holdings, Inc. | | | 632 | | | | 33 | | |
Stanley Black & Decker, Inc. | | | 438 | | | | 37 | | |
Starbucks Corp. | | | 3,269 | | | | 298 | | |
State Street Corp. | | | 938 | | | | 63 | | |
Steel Dynamics, Inc. | | | 478 | | | | 51 | | |
Steris PLC | | | 282 | | | | 62 | | |
Stryker Corp. | | | 982 | | | | 268 | | |
Sun Communities, Inc. REIT | | | 349 | | | | 41 | | |
Synchrony Financial | | | 1,225 | | | | 37 | | |
Synopsys, Inc. (e) | | | 439 | | | | 201 | | |
Sysco Corp. | | | 1,421 | | | | 94 | | |
T Rowe Price Group, Inc. | | | 631 | | | | 66 | | |
Take-Two Interactive Software, Inc. (e) | | | 488 | | | | 69 | | |
Targa Resources Corp. | | | 611 | | | | 52 | | |
Target Corp. | | | 1,300 | | | | 144 | | |
TE Connectivity Ltd. | | | 904 | | | | 112 | | |
Teledyne Technologies, Inc. (e) | | | 135 | | | | 55 | | |
Teleflex, Inc. | | | 134 | | | | 26 | | |
| | | Shares | | Value
(000) | |
Teradyne, Inc. | | | 450 | | | $ | 45 | | |
Tesla, Inc. (e) | | | 8,301 | | | | 2,077 | | |
Texas Instruments, Inc. | | | 2,588 | | | | 412 | | |
Texas Pacific Land Corp. | | | 17 | | | | 31 | | |
Textron, Inc. | | | 591 | | | | 46 | | |
Thermo Fisher Scientific, Inc. | | | 1,071 | | | | 542 | | |
TJX Cos., Inc. | | | 3,376 | | | | 300 | | |
T-Mobile US, Inc. (e) | | | 1,727 | | | | 242 | | |
Toast, Inc., Class A (e) | | | 1,040 | | | | 19 | | |
Toro Co. | | | 297 | | | | 25 | | |
Tractor Supply Co. | | | 314 | | | | 64 | | |
Trade Desk, Inc., Class A (e) | | | 1,274 | | | | 100 | | |
Tradeweb Markets, Inc., Class A | | | 311 | | | | 25 | | |
Trane Technologies PLC | | | 664 | | | | 135 | | |
TransDigm Group, Inc. (e) | | | 158 | | | | 133 | | |
TransUnion | | | 548 | | | | 39 | | |
Travelers Cos., Inc. | | | 660 | | | | 108 | | |
Trimble, Inc. (e) | | | 700 | | | | 38 | | |
Truist Financial Corp. | | | 3,692 | | | | 106 | | |
Twilio, Inc., Class A (e) | | | 496 | | | | 29 | | |
Tyler Technologies, Inc. (e) | | | 121 | | | | 47 | | |
Tyson Foods, Inc., Class A | | | 799 | | | | 40 | | |
Uber Technologies, Inc. (e) | | | 5,291 | | | | 243 | | |
UDR, Inc. REIT | | | 887 | | | | 32 | | |
UGI Corp. | | | 591 | | | | 14 | | |
U-Haul Holding Co. | | | 273 | | | | 14 | | |
UiPath, Inc., Class A (e) | | | 1,013 | | | | 17 | | |
Ulta Beauty, Inc. (e) | | | 145 | | | | 58 | | |
Union Pacific Corp. | | | 1,724 | | | | 351 | | |
United Parcel Service, Inc., Class B | | | 2,049 | | | | 319 | | |
United Rentals, Inc. | | | 199 | | | | 88 | | |
United Therapeutics Corp. (e) | | | 130 | | | | 29 | | |
UnitedHealth Group, Inc. | | | 2,634 | | | | 1,328 | | |
Unity Software, Inc. (e) | | | 639 | | | | 20 | | |
Universal Health Services, Inc., Class B | | | 182 | | | | 23 | | |
US Bancorp | | | 4,229 | | | | 140 | | |
Vail Resorts, Inc. | | | 117 | | | | 26 | | |
Valero Energy Corp. | | | 1,031 | | | | 146 | | |
Veeva Systems, Inc., Class A (e) | | | 421 | | | | 86 | | |
Ventas, Inc. REIT | | | 1,133 | | | | 48 | | |
VeriSign, Inc. (e) | | | 269 | | | | 54 | | |
Verisk Analytics, Inc. | | | 414 | | | | 98 | | |
Verizon Communications, Inc. | | | 11,566 | | | | 375 | | |
Vertex Pharmaceuticals, Inc. (e) | | | 731 | | | | 254 | | |
VF Corp. | | | 906 | | | | 16 | | |
Viatris, Inc. | | | 3,315 | | | | 33 | | |
VICI Properties, Inc. REIT | | | 2,830 | | | | 82 | | |
Visa, Inc., Class A | | | 4,628 | | | | 1,064 | | |
Vistra Corp. | | | 960 | | | | 32 | | |
VMware, Inc., Class A (e) | | | 640 | | | | 107 | | |
Vulcan Materials Co. | | | 385 | | | | 78 | | |
W R Berkley Corp. | | | 601 | | | | 38 | | |
Walgreens Boots Alliance, Inc. | | | 2,075 | | | | 46 | | |
The accompanying notes are an integral part of the consolidated financial statements.
26
Morgan Stanley Institutional Fund Trust
Annual Report — September 30, 2023
Consolidated Portfolio of Investments (cont'd)
Global Strategist Portfolio
| | | Shares | | Value
(000) | |
United States (cont'd) | |
Walmart, Inc. | | | 4,243 | | | $ | 679 | | |
Walt Disney Co. (e) | | | 5,234 | | | | 424 | | |
Warner Bros Discovery, Inc. (e) | | | 6,486 | | | | 70 | | |
Waste Connections, Inc. | | | 733 | | | | 98 | | |
Waste Management, Inc. | | | 1,160 | | | | 177 | | |
Waters Corp. (e) | | | 163 | | | | 45 | | |
Watsco, Inc. | | | 96 | | | | 36 | | |
Webster Financial Corp. | | | 488 | | | | 20 | | |
WEC Energy Group, Inc. | | | 887 | | | | 71 | | |
Wells Fargo & Co. | | | 10,808 | | | | 442 | | |
Welltower, Inc. REIT | | | 1,403 | | | | 115 | | |
West Pharmaceutical Services, Inc. | | | 213 | | | | 80 | | |
Western Digital Corp. (e) | | | 891 | | | | 41 | | |
Westinghouse Air Brake Technologies Corp. | | | 518 | | | | 55 | | |
Westlake Corp. | | | 109 | | | | 14 | | |
Westrock Co. | | | 720 | | | | 26 | | |
Weyerhaeuser Co. REIT | | | 2,103 | | | | 64 | | |
Whirlpool Corp. | | | 154 | | | | 21 | | |
Williams Cos., Inc. | | | 3,484 | | | | 117 | | |
Willis Towers Watson PLC | | | 304 | | | | 64 | | |
Wolfspeed, Inc. (e) | | | 348 | | | | 13 | | |
Workday, Inc., Class A (e) | | | 575 | | | | 124 | | |
WP Carey, Inc. REIT | | | 605 | | | | 33 | | |
WW Grainger, Inc. | | | 128 | | | | 89 | | |
Wynn Resorts Ltd. | | | 295 | | | | 27 | | |
Xcel Energy, Inc. | | | 1,550 | | | | 89 | | |
Xylem, Inc. | | | 681 | | | | 62 | | |
Yum! Brands, Inc. | | | 791 | | | | 99 | | |
Zebra Technologies Corp., Class A (e) | | | 145 | | | | 34 | | |
Zillow Group, Inc., Class C (e) | | | 438 | | | | 20 | | |
Zimmer Biomet Holdings, Inc. | | | 598 | | | | 67 | | |
Zoetis, Inc. | | | 1,313 | | | | 228 | | |
Zoom Video Communications, Inc., Class A (e) | | | 661 | | | | 46 | | |
ZoomInfo Technologies, Inc., Class A (e) | | | 789 | | | | 13 | | |
Zscaler, Inc. (e) | | | 240 | | | | 37 | | |
| | | | 108,797 | | |
Total Common Stocks (Cost $120,147) | | | 175,339 | | |
| | | No. of
Warrants | | | |
Warrants (0.0%)‡ | |
Canada (0.0%)‡ | |
Constellation Software, Inc. expires 03/31/40 (e)
(Cost $—) | | | 95 | | | | 1 | | |
| | | Shares | | Value
(000) | |
Short-Term Investments (15.1%) | |
Investment Company (14.5%) | |
Morgan Stanley Institutional Liquidity
Funds — Government Portfolio —
Institutional Class (See Note G)
(Cost $74,041) | | | 74,040,625 | | | $ | 74,041 | | |
| | | Face
Amount
(000) | | | |
U.S. Treasury Securities (0.6%) | |
U.S. Treasury Bill, | |
5.01%, 11/30/23 (g) | | $ | 2,291 | | | | 2,271 | | |
5.33%, 11/30/23 (g) | | | 550 | | | | 545 | | |
5.38%, 11/30/23 (g) | | | 150 | | | | 148 | | |
5.43%, 11/30/23 (g) | | | 150 | | | | 149 | | |
Total U.S. Treasury Securities (Cost $3,115) | | | 3,113 | | |
Total Short-Term Investments (Cost $77,156) | | | 77,154 | | |
Total Investments (93.2%) (Cost $452,578) (h)(i)(j) | | | 477,725 | | |
Other Assets in Excess of Liabilities 6.8% | | | 35,128 | | |
Net Assets (100.0%) | | $ | 512,853 | | |
Country assignments and aggregations are based generally on third party vendor classifications and information, and may be different from the assignments and aggregations under the policies set forth in the Fund's prospectus and/or statement of additional information relating to geographic classifications.
‡ Amount is less than 0.05%.
@ Face Amount/Value is less than $500.
(a) Security is subject to delayed delivery.
(b) 144A security — Certain conditions for public sale may exist. Unless otherwise noted, these securities are deemed to be liquid.
(c) Floating or variable rate securities: The rates disclosed are as of September 30, 2023. For securities based on a published reference rate and spread, the reference rate and spread are indicated in the description in the Consolidated Portfolio of Investments. Certain variable rate securities may not be based on a published reference rate and spread but are determined by the issuer or agent and are based on current market conditions. These securities do not indicate a reference rate and spread in their description in the Consolidated Portfolio of Investments.
(d) Perpetual — One or more securities do not have a predetermined maturity date. Rates for these securities are fixed for a period of time after which they revert to a floating rate. Interest rates in effect are as of September 30, 2023.
(e) Non-income producing security.
(f) At September 30, 2023, the Fund held a fair valued security at $0, representing 0.0% of net assets. This security has been fair valued as determined in good faith under procedures established by and under the general supervision of the Company's (as defined herein) Trustees.
(g) Rate shown is the yield to maturity at September 30, 2023.
(h) The approximate fair value and percentage of net assets, $57,715,000 and 11.3%, respectively, represent the securities that have been fair valued under the fair valuation policy for international investments as described in Note A-1 within the Notes to Consolidated Financial Statements.
(i) Securities are available for collateral in connection with securities purchased on a forward commitment basis, open foreign currency exchange contracts, futures contracts and swap agreements.
The accompanying notes are an integral part of the consolidated financial statements.
27
Morgan Stanley Institutional Fund Trust
Annual Report — September 30, 2023
Consolidated Portfolio of Investments (cont'd)
Global Strategist Portfolio
(j) At September 30, 2023, the aggregate cost for federal income tax purposes is approximately $472,181,000. The aggregate gross unrealized appreciation is approximately $74,428,000 and the aggregate gross unrealized depreciation is approximately $70,344,000, resulting in net unrealized appreciation of approximately $4,084,000.
ADR American Depositary Receipt.
CLO Collateralized Loan Obligation.
CVA Certificaten Van Aandelen.
DAC Designated Activity Company.
EURIBOR Euro Interbank Offered Rate.
LSE London Stock Exchange.
MTN Medium Term Note.
NYSE New York Stock Exchange.
OAT Obligations Assimilables du Trésor (French Treasury Obligation).
REIT Real Estate Investment Trust.
SOFR Secured Overnight Financing Rate.
SONIA Sterling Overnight Index Average.
TBA To Be Announced.
Foreign Currency Forward Exchange Contracts:
The Fund had the following foreign currency forward exchange contracts open at September 30, 2023:
Counterparty | | Contracts to
Deliver
(000) | | In Exchange
For
(000) | | Delivery
Date | | Unrealized
Appreciation
(Depreciation)
(000) | |
Australia & New Zealand Banking Group Ltd. | | TRY | 457,638 | | | $ | 15,700 | | | 12/14/23 | | $ | — | @ | |
Australia & New Zealand Banking Group Ltd. | | $ | 368,800 | | | EUR | 342,975 | | | 11/10/23 | | | (6 | ) | |
Australia & New Zealand Banking Group Ltd. | | $ | 8,298 | | | JPY | 1,190,691 | | | 11/10/23 | | | (— | @) | |
Bank of America NA | | CNH | 3,537,979 | | | $ | 486,003 | | | 12/14/23 | | | (— | @) | |
Bank of America NA | | CNY | 10,000,000 | | | $ | 1,384,083 | | | 11/10/23 | | | 11 | | |
Bank of America NA | | PLN | 251,986 | | | $ | 57,625 | | | 12/14/23 | | | — | @ | |
Bank of America NA | | $ | 130,868 | | | ILS | 495,760 | | | 12/14/23 | | | (— | @) | |
Bank of America NA | | $ | 645,165 | | | JPY | 93,607,001 | | | 12/14/23 | | | (11 | ) | |
Bank of America NA | | $ | 1,945,325 | | | KRW | 2,515,849,394 | | | 11/10/23 | | | (77 | ) | |
Bank of America NA | | $ | 54,786 | | | SEK | 606,847 | | | 12/14/23 | | | 1 | | |
Bank of New York Mellon | | $ | 64,342 | | | DKK | 445,639 | | | 12/14/23 | | | (1 | ) | |
Barclays Bank PLC | | CNY | 4,300,000 | | | $ | 593,349 | | | 11/10/23 | | | 3 | | |
Barclays Bank PLC | | EUR | 1,358,786 | | | $ | 1,461,911 | | | 12/14/23 | | | 21 | | |
Barclays Bank PLC | | HKD | 4,413 | | | $ | 565 | | | 12/14/23 | | | — | @ | |
Barclays Bank PLC | | $ | 1,037,913 | | | CHF | 900,097 | | | 11/10/23 | | | (51 | ) | |
Barclays Bank PLC | | $ | 1,380,089 | | | JPY | 200,237,152 | | | 12/14/23 | | | (24 | ) | |
Barclays Bank PLC | | $ | 332,022 | | | MXN | 5,830,466 | | | 12/14/23 | | | (2 | ) | |
Barclays Bank PLC | | $ | 1,731,031 | | | SEK | 19,174,027 | | | 12/14/23 | | | 30 | | |
BNP Paribas SA | | BRL | 1,120,304 | | | $ | 221,408 | | | 12/14/23 | | | 1 | | |
BNP Paribas SA | | CAD | 487,487 | | | $ | 359,989 | | | 12/14/23 | | | 1 | | |
BNP Paribas SA | | CHF | 120,619 | | | $ | 132,948 | | | 12/14/23 | | | — | @ | |
BNP Paribas SA | | CNH | 1,335,590 | | | $ | 183,459 | | | 12/14/23 | | | (— | @) | |
BNP Paribas SA | | CNY | 134,683,820 | | | $ | 18,524,877 | | | 12/14/23 | | | (31 | ) | |
BNP Paribas SA | | COP | 1,494,960,000 | | | $ | 358,160 | | | 11/10/23 | | | (4 | ) | |
BNP Paribas SA | | EUR | 735,550 | | | $ | 800,524 | | | 11/10/23 | | | 22 | | |
BNP Paribas SA | | EUR | 10,000 | | | $ | 10,777 | | | 11/10/23 | | | — | @ | |
BNP Paribas SA | | EUR | 1,503,015 | | | $ | 1,617,101 | | | 12/14/23 | | | 23 | | |
BNP Paribas SA | | HKD | 298,632 | | | $ | 38,222 | | | 12/14/23 | | | — | @ | |
BNP Paribas SA | | IDR | 17,038,139,154 | | | $ | 1,121,447 | | | 11/10/23 | | | 19 | | |
BNP Paribas SA | | INR | 6,879,651 | | | $ | 82,374 | | | 12/14/23 | | | (— | @) | |
BNP Paribas SA | | JPY | 60,747,000 | | | $ | 409,807 | | | 11/10/23 | | | 1 | | |
BNP Paribas SA | | THB | 4,257,197 | | | $ | 123,960 | | | 11/10/23 | | | 7 | | |
BNP Paribas SA | | $ | 479,370 | | | AUD | 744,664 | | | 12/14/23 | | | 1 | | |
BNP Paribas SA | | $ | 252,368 | | | AUD | 390,724 | | | 12/14/23 | | | (1 | ) | |
BNP Paribas SA | | $ | 272,824 | | | CAD | 369,155 | | | 12/14/23 | | | (1 | ) | |
BNP Paribas SA | | $ | 82,659 | | | CLP | 74,030,514 | | | 12/14/23 | | | — | @ | |
BNP Paribas SA | | $ | 4,325,414 | | | CNY | 30,731,204 | | | 11/10/23 | | | (107 | ) | |
BNP Paribas SA | | $ | 58,734 | | | COP | 242,881,489 | | | 12/14/23 | | | (— | @) | |
BNP Paribas SA | | $ | 1,927,203 | | | EUR | 1,740,071 | | | 11/10/23 | | | (85 | ) | |
BNP Paribas SA | | $ | 634,663 | | | JPY | 91,467,160 | | | 11/10/23 | | | (19 | ) | |
BNP Paribas SA | | $ | 2,855,746 | | | MXN | 50,138,331 | | | 12/14/23 | | | (13 | ) | |
BNP Paribas SA | | $ | 52,335 | | | TWD | 1,669,157 | | | 12/14/23 | | | (— | @) | |
Citibank NA | | $ | 233,698 | | | CAD | 316,295 | | | 11/10/23 | | | (1 | ) | |
Citibank NA | | $ | 9,953 | | | CZK | 228,953 | | | 12/14/23 | | | (— | @) | |
Citibank NA | | $ | 60,283 | | | ILS | 228,491 | | | 12/14/23 | | | (— | @) | |
Citibank NA | | $ | 661,738 | | | SEK | 6,998,986 | | | 11/10/23 | | | (20 | ) | |
The accompanying notes are an integral part of the consolidated financial statements.
28
Morgan Stanley Institutional Fund Trust
Annual Report — September 30, 2023
Consolidated Portfolio of Investments (cont'd)
Global Strategist Portfolio
Foreign Currency Forward Exchange Contracts (cont'd):
Counterparty | | Contracts to
Deliver
(000) | | In Exchange
For
(000) | | Delivery
Date | | Unrealized
Appreciation
(Depreciation)
(000) | |
Goldman Sachs International | | BRL | 35,175,046 | | | $ | 6,958,741 | | | 12/14/23 | | $ | 24 | | |
Goldman Sachs International | | HKD | 168 | | | $ | 21 | | | 12/14/23 | | | — | @ | |
Goldman Sachs International | | HUF | 138,628,068 | | | $ | 382,273 | | | 11/10/23 | | | 8 | | |
Goldman Sachs International | | NOK | 583,174 | | | $ | 54,626 | | | 12/14/23 | | | (— | @) | |
Goldman Sachs International | | NZD | 494,475 | | | $ | 291,690 | | | 12/14/23 | | | (5 | ) | |
Goldman Sachs International | | SGD | 83,242 | | | $ | 61,322 | | | 12/14/23 | | | — | @ | |
Goldman Sachs International | | $ | 1,511,551 | | | CHF | 1,336,466 | | | 12/14/23 | | | (40 | ) | |
Goldman Sachs International | | $ | 110,997 | | | CLP | 96,240,000 | | | 11/10/23 | | | (3 | ) | |
Goldman Sachs International | | $ | 12,078 | | | CZK | 277,842 | | | 12/14/23 | | | (— | @) | |
Goldman Sachs International | | $ | 2,268,898 | | | JPY | 329,194,114 | | | 12/14/23 | | | (40 | ) | |
Goldman Sachs International | | $ | 1,499 | | | JPY | 221,875 | | | 11/10/23 | | | (— | @) | |
Goldman Sachs International | | $ | 104,790 | | | MXN | 1,813,003 | | | 11/10/23 | | | (1 | ) | |
Goldman Sachs International | | $ | 243,044 | | | MXN | 4,197,330 | | | 11/10/23 | | | (4 | ) | |
Goldman Sachs International | | $ | 1,445,741 | | | MXN | 25,388,215 | | | 12/14/23 | | | (6 | ) | |
Goldman Sachs International | | $ | 110,490 | | | PEN | 411,443 | | | 11/10/23 | | | (2 | ) | |
Goldman Sachs International | | $ | 126,545 | | | PLN | 512,541 | | | 11/10/23 | | | (9 | ) | |
Goldman Sachs International | | $ | 139,923 | | | RON | 631,531 | | | 11/10/23 | | | (6 | ) | |
Goldman Sachs International | | $ | 463,941 | | | SEK | 5,138,543 | | | 12/14/23 | | | 8 | | |
JPMorgan Chase Bank NA | | CAD | 936,223 | | | $ | 701,361 | | | 11/10/23 | | | 12 | | |
JPMorgan Chase Bank NA | | CAD | 127,003 | | | $ | 93,786 | | | 12/14/23 | | | — | @ | |
JPMorgan Chase Bank NA | | DKK | 493,419 | | | $ | 73,152 | | | 11/10/23 | | | 3 | | |
JPMorgan Chase Bank NA | | EUR | 7,058,640 | | | $ | 7,594,042 | | | 12/14/23 | | | 107 | | |
JPMorgan Chase Bank NA | | EUR | 1,172,882 | | | $ | 1,244,258 | | | 12/14/23 | | | — | @ | |
JPMorgan Chase Bank NA | | MXN | 17,595,132 | | | $ | 1,008,751 | | | 11/10/23 | | | 6 | | |
JPMorgan Chase Bank NA | | NOK | 448,866 | | | $ | 42,047 | | | 12/14/23 | | | — | @ | |
JPMorgan Chase Bank NA | | NZD | 1,671,025 | | | $ | 1,024,204 | | | 11/10/23 | | | 23 | | |
JPMorgan Chase Bank NA | | NZD | 4,429,549 | | | $ | 2,612,959 | | | 12/14/23 | | | (42 | ) | |
JPMorgan Chase Bank NA | | SGD | 131,289 | | | $ | 96,720 | | | 12/14/23 | | | — | @ | |
JPMorgan Chase Bank NA | | $ | 1,693,680 | | | AUD | 2,630,966 | | | 12/14/23 | | | 2 | | |
JPMorgan Chase Bank NA | | $ | 1,269,423 | | | CHF | 1,122,393 | | | 12/14/23 | | | (33 | ) | |
JPMorgan Chase Bank NA | | $ | 208,990 | | | COP | 892,795,000 | | | 11/10/23 | | | 7 | | |
JPMorgan Chase Bank NA | | $ | 660,864 | | | EUR | 623,233 | | | 12/14/23 | | | — | @ | |
JPMorgan Chase Bank NA | | $ | 1,846 | | | GBP | 1,480 | | | 12/14/23 | | | (— | @) | |
JPMorgan Chase Bank NA | | $ | 1,139,018 | | | JPY | 165,260,675 | | | 12/14/23 | | | (20 | ) | |
JPMorgan Chase Bank NA | | $ | 348,286 | | | MXN | 6,025,316 | | | 11/10/23 | | | (5 | ) | |
JPMorgan Chase Bank NA | | $ | 680,374 | | | MXN | 11,948,026 | | | 12/14/23 | | | (3 | ) | |
JPMorgan Chase Bank NA | | $ | 674,994 | | | MXN | 11,876,480 | | | 12/14/23 | | | (2 | ) | |
JPMorgan Chase Bank NA | | $ | 94,542 | | | NOK | 960,145 | | | 11/10/23 | | | (5 | ) | |
JPMorgan Chase Bank NA | | $ | 156,971 | | | SEK | 1,738,749 | | | 12/14/23 | | | 3 | | |
JPMorgan Chase Bank NA | | $ | 109,741 | | | SGD | 146,026 | | | 11/10/23 | | | (3 | ) | |
Standard Chartered Bank | | NZD | 319,906 | | | $ | 188,702 | | | 12/14/23 | | | (3 | ) | |
Standard Chartered Bank | | $ | 1,999,457 | | | CAD | 2,725,396 | | | 11/10/23 | | | 8 | | |
State Street Bank and Trust Co. | | EUR | 229,704 | | | $ | 247,141 | | | 12/14/23 | | | 3 | | |
UBS AG | | AUD | 2,090,886 | | | $ | 1,379,562 | | | 11/10/23 | | | 34 | | |
UBS AG | | AUD | 151,566 | | | $ | 98,268 | | | 11/10/23 | | | 1 | | |
UBS AG | | CAD | 230,411 | | | $ | 170,569 | | | 11/10/23 | | | 1 | | |
UBS AG | | CAD | 191,730 | | | $ | 141,587 | | | 12/14/23 | | | — | @ | |
UBS AG | | EUR | 2,334,850 | | | $ | 2,512,065 | | | 12/14/23 | | | 35 | | |
UBS AG | | GBP | 1,491,303 | | | $ | 1,902,821 | | | 11/10/23 | | | 83 | | |
UBS AG | | GBP | 69,598 | | | $ | 88,185 | | | 11/10/23 | | | 3 | | |
UBS AG | | GBP | 1,234,123 | | | $ | 1,500,887 | | | 11/10/23 | | | (5 | ) | |
UBS AG | | HKD | 4,325 | | | $ | 554 | | | 12/14/23 | | | — | @ | |
UBS AG | | HKD | 1,699,294 | | | $ | 217,368 | | | 12/14/23 | | | — | @ | |
UBS AG | | IDR | 419,891,537 | | | $ | 27,331 | | | 12/14/23 | | | — | @ | |
UBS AG | | JPY | 111,978,232 | | | $ | 758,157 | | | 12/14/23 | | | — | @ | |
UBS AG | | NZD | 576,639 | | | $ | 342,854 | | | 11/10/23 | | | (3 | ) | |
UBS AG | | NZD | 13,134,328 | | | $ | 7,748,006 | | | 12/14/23 | | | (124 | ) | |
UBS AG | | SEK | 4,708,477 | | | $ | 421,939 | | | 11/10/23 | | | (10 | ) | |
The accompanying notes are an integral part of the consolidated financial statements.
29
Morgan Stanley Institutional Fund Trust
Annual Report — September 30, 2023
Consolidated Portfolio of Investments (cont'd)
Global Strategist Portfolio
Foreign Currency Forward Exchange Contracts (cont'd):
Counterparty | | Contracts to
Deliver
(000) | | In Exchange
For
(000) | | Delivery
Date | | Unrealized
Appreciation
(Depreciation)
(000) | |
UBS AG | | THB | 548,547 | | | $ | 15,473 | | | 12/14/23 | | $ | — | @ | |
UBS AG | | $ | 198,481 | | | AUD | 308,171 | | | 12/14/23 | | | — | @ | |
UBS AG | | $ | 931,461 | | | CNY | 6,700,000 | | | 11/10/23 | | | (12 | ) | |
UBS AG | | $ | 134,507 | | | GBP | 110,174 | | | 12/14/23 | | | (— | @) | |
UBS AG | | $ | 4,294 | | | HUF | 1,540,800 | | | 11/10/23 | | | (— | @) | |
UBS AG | | $ | 13,017 | | | HUF | 4,751,041 | | | 12/14/23 | | | (— | @) | |
UBS AG | | $ | 1,612,013 | | | JPY | 225,292,504 | | | 11/10/23 | | | (95 | ) | |
UBS AG | | $ | 400,544 | | | JPY | 58,574,000 | | | 11/10/23 | | | (6 | ) | |
UBS AG | | $ | 191,471 | | | KRW | 254,842,004 | | | 12/14/23 | | | (2 | ) | |
UBS AG | | $ | 120,326 | | | KRW | 161,645,919 | | | 12/14/23 | | | (— | @) | |
UBS AG | | $ | 1,371,840 | | | MXN | 24,089,517 | | | 12/14/23 | | | (6 | ) | |
UBS AG | | $ | 364,083 | | | NZD | 606,410 | | | 12/14/23 | | | (1 | ) | |
UBS AG | | $ | 179,232 | | | SEK | 1,985,363 | | | 12/14/23 | | | 3 | | |
UBS AG | | ZAR | 1,081,726 | | | $ | 56,649 | | | 12/14/23 | | | (— | @) | |
Westpac Banking Corp. | | CAD | 2,076,755 | | | $ | 1,537,934 | | | 11/10/23 | | | 8 | | |
| | | | | | | | | $ | (427 | ) | |
Futures Contracts:
The Fund had the following futures contracts open at September 30, 2023:
| | | Number of
Contracts | | Expiration
Date | | Notional
Amount
(000) | | Value
(000) | | Unrealized
Appreciation
(Depreciation)
(000) | |
Long: | |
German Euro-Bobl Index (Germany) | | | 17 | | | Dec-23 | | EUR | 1,700 | | | $ | 2,080 | | | $ | (29 | ) | |
German Euro-BTP Index (Germany) | | | 8 | | | Dec-23 | | | 800 | | | | 928 | | | | (38 | ) | |
German Euro-Schatz Index (Germany) | | | 118 | | | Dec-23 | | | 11,800 | | | | 13,098 | | | | (56 | ) | |
Montreal Exchange 10 yr. Canadian Bond Index
(Canada) | | | 1 | | | Dec-23 | | CAD | 100 | | | | 85 | | | | (2 | ) | |
MSCI Emerging Market Index (United States) | | | 57 | | | Dec-23 | | $ | 3 | | | | 2,723 | | | | (81 | ) | |
Nikkei 225 Index (United States) | | | 24 | | | Dec-23 | | JPY | 12 | | | | 2,556 | | | | (59 | ) | |
S&P 500 E Mini Index (United States) | | | 2 | | | Dec-23 | | $ | — | @ | | | 433 | | | | (19 | ) | |
SFE 10 yr. Australian Bond (Australia) | | | 157 | | | Dec-23 | | AUD | 15,700 | | | | 11,303 | | | | (300 | ) | |
SGX MSCI Singapore Index (Singapore) | | | 2 | | | Oct-23 | | SGD | — | @ | | | 42 | | | | — | @ | |
U.S. Treasury Long Bond (United States) | | | 20 | | | Dec-23 | | $ | 2,000 | | | | 2,276 | | | | (135 | ) | |
U.S. Treasury Ultra Bond (United States) | | | 33 | | | Dec-23 | | | 3,300 | | | | 3,917 | | | | (289 | ) | |
U.S. Treasury 2 yr. Note (United States) | | | 29 | | | Dec-23 | | | 5,800 | | | | 5,879 | | | | (11 | ) | |
U.S. Treasury 5 yr. Note (United States) | | | 121 | | | Dec-23 | | | 12,100 | | | | 12,748 | | | | (118 | ) | |
U.S. Treasury 10 yr. Note (United States) | | | 42 | | | Dec-23 | | | 4,200 | | | | 4,539 | | | | (79 | ) | |
KFE 10 yr. Treasury Bond Index
(Korea, Republic of) | | | 24 | | | Dec-23 | | KRW | 2,400,000 | | | | 1,919 | | | | (12 | ) | |
U.S. Treasury 10 yr. Ultra Note (United States) | | | 80 | | | Dec-23 | | $ | 8,000 | | | | 8,925 | | | | (360 | ) | |
ICE Brent Crude Oil Index (United States) | | | 60 | | | Oct-23 | | | 60 | | | | 5,532 | | | | 751 | | |
Short: | |
Euro Stoxx 50 Index (Germany) | | | 38 | | | Dec-23 | | EUR | (— | @) | | | (1,689 | ) | | | 23 | | |
FTSE 100 Index (United Kingdom) | | | 1 | | | Dec-23 | | GBP | (— | @) | | | (94 | ) | | | (1 | ) | |
German Euro-BTP Index (Germany) | | | 102 | | | Dec-23 | | EUR | (10,200 | ) | | | (11,833 | ) | | | 403 | | |
German Euro-Bund Index (Germany) | | | 51 | | | Dec-23 | | | (5,100 | ) | | | (6,936 | ) | | | 213 | | |
TSE Japanese 10 yr. Bond index (Japan) | | | 54 | | | Dec-23 | | JPY | (5,400,000 | ) | | | (52,381 | ) | | | 352 | | |
U.S. Treasury 5 yr. Note (United States) | | | 47 | | | Dec-23 | | $ | (4,700 | ) | | | (4,952 | ) | | | 44 | | |
U.S. Treasury 10 yr. Ultra Note (United States) | | | 87 | | | Dec-23 | | | (8,700 | ) | | | (9,706 | ) | | | 287 | | |
| | | | | | | | | | | $ | 484 | | |
The accompanying notes are an integral part of the consolidated financial statements.
30
Morgan Stanley Institutional Fund Trust
Annual Report — September 30, 2023
Consolidated Portfolio of Investments (cont'd)
Global Strategist Portfolio
Interest Rate Swap Agreements:
The Fund had the following interest rate swap agreements open at September 30, 2023:
Swap Counterparty | | Floating Rate
Index | | Pay/
Receive
Floating
Rate | | Fixed
Rate | | Payment
Frequency
Paid/
Received | | Maturity
Date | | Notional
Amount
(000) | | Value
(000) | | Upfront
Payment
Paid
(Received)
(000) | | Unrealized
Appreciation
(000) | |
Morgan Stanley &
Co. LLC* | | | 1 | Week CNY | | Pay | | | 2.56 | % | | Quarterly/
Quarterly | | 5/16/28 | | CNY | 70,937 | | | $ | 83 | | | $ | — | | | $ | 83 | | |
Morgan Stanley &
Co. LLC* | | | 1 | Week CNY | | Pay | | | 2.56 | | | Quarterly/
Quarterly | | 5/16/28 | | | 70,937 | | | | 82 | | | | — | | | | 82 | | |
| | | | | | | | | | | | | | | $ | 165 | | | $ | — | | | $ | 165 | | |
Total Return Swap Agreements:
The Fund had the following total return swap agreements open at September 30, 2023:
Swap Counterparty | | Index | | Pay/Receive
Total Return of
Reference
Index | | Floating
Rate | | Payment
Frequency | | Maturity
Date | | Notional
Amount
(000) | | Value
(000) | | Upfront
Payment
Paid
(Received)
(000) | | Unrealized
Appreciation
(Depreciation)
(000) | |
Bank of America NA | | MSCI USA Index | | Pay | | SOFR + 0.45% | | Quarterly | | 7/16/24 | | $ | (21,469 | ) | | $ | (1,039 | ) | | $ | — | | | $ | (1,039 | ) | |
Barclays Bank PLC | | Barclays Macau
Custom Basket
Index | | Receive | | SOFR + 0.90% | | Quarterly | | 9/9/24 | | | 968 | | | | 53 | | | | — | | | | 53 | | |
Barclays Bank PLC | | Barclays Macau
Custom Basket
Index | | Receive | | SOFR + 0.90% | | Quarterly | | 9/9/24 | | | 645 | | | | 29 | | | | — | | | | 29 | | |
Barclays Bank PLC | | Barclays Macau
Custom Basket
Index | | Receive | | SOFR + 0.90% | | Quarterly | | 9/9/24 | | | 645 | | | | 19 | | | | — | | | | 19 | | |
Barclays Bank PLC | | Barclays Macau
Custom Basket
Index | | Receive | | SOFR + 0.90% | | Quarterly | | 9/9/24 | | | 645 | | | | 10 | | | | — | | | | 10 | | |
Barclays Bank PLC | | Barclays U.S. Cyclicals
Custom Basket
Index†† | | Receive | | SOFR + 0.00% | | Quarterly | | 7/24/24 | | | 4,552 | | | | 336 | | | | — | | | | 336 | | |
Barclays Bank PLC | | Barclays U.S. Cyclicals
Custom Basket
Index†† | | Receive | | SOFR + 0.00% | | Quarterly | | 7/24/24 | | | 4,566 | | | | 346 | | | | — | | | | 346 | | |
Barclays Bank PLC | | Barclays U.S. Cyclicals
Custom Basket
Index†† | | Receive | | SOFR + 0.03% | | Quarterly | | 7/24/24 | | | 4,511 | | | | 351 | | | | — | | | | 351 | | |
Barclays Bank PLC | | Barclays U.S. Cyclicals
Custom Basket
Index†† | | Receive | | SOFR + 0.03% | | Quarterly | | 7/24/24 | | | 4,426 | | | | 220 | | | | — | | | | 220 | | |
| Barclays Bank PLC | | Barclays
U.S. Defensives
Custom Basket
Index†† | | Pay | | SOFR + 0.00% | | Quarterly | | 7/24/24 | | | (4,579 | ) | | | (333 | ) | | | — | | | | (333 | ) | |
| Barclays Bank PLC | | Barclays
U.S. Defensives
Custom Basket
Index†† | | Pay | | SOFR + 0.00% | | Quarterly | | 7/24/24 | | | (4,557 | ) | | | (369 | ) | | | — | | | | (369 | ) | |
| Barclays Bank PLC | | Barclays
U.S. Defensives
Custom Basket
Index†† | | Pay | | SOFR + 0.00% | | Quarterly | | 7/24/24 | | | (4,543 | ) | | | (365 | ) | | | — | | | | (365 | ) | |
| Barclays Bank PLC | | Barclays
U.S. Defensives
Custom Basket
Index†† | | Pay | | SOFR + 0.03% | | Quarterly | | 7/24/24 | | | (4,600 | ) | | | (193 | ) | | | — | | | | (193 | ) | |
The accompanying notes are an integral part of the consolidated financial statements.
31
Morgan Stanley Institutional Fund Trust
Annual Report — September 30, 2023
Consolidated Portfolio of Investments (cont'd)
Global Strategist Portfolio
Total Return Swap Agreements: (cont'd)
Swap Counterparty | | Index | | Pay/Receive
Total Return of
Reference
Index | | Floating
Rate | | Payment
Frequency | | Maturity
Date | | Notional
Amount
(000) | | Value
(000) | | Upfront
Payment
Paid
(Received)
(000) | | Unrealized
Appreciation
(Depreciation)
(000) | |
Barclays Bank PLC | | E&P Index | | Pay | | SOFR + 0.20% | | Quarterly | | 4/10/24 | | $ | (922 | ) | | $ | 128 | | | $ | — | | | $ | 128 | | |
Barclays Bank PLC | | E&P Index | | Pay | | SOFR + 0.20% | | Quarterly | | 4/10/24 | | | (2,117 | ) | | | 295 | | | | — | | | | 295 | | |
Barclays Bank PLC | | MSCI Daily
Total Return World
Gross Consumer
Staples Index | | Receive | | SOFR + 0.10% | | Quarterly | | 5/20/24 | | | 5,078 | | | | 297 | | | | — | | | | 297 | | |
Barclays Bank PLC | | MSCI World
Tobacco Index | | Pay | | SOFR + 0.25% | | Quarterly | | 5/20/24 | | | (5,092 | ) | | | (94 | ) | | | — | | | | (94 | ) | |
BNP Paribas SA | | BNP EU Luxury
Index†† | | Receive | | SOFR + 0.24% | | Quarterly | | 6/5/24 | | | 2,596 | | | | 284 | | | | — | | | | 284 | | |
BNP Paribas SA | | BNP EU Luxury
Index†† | | Receive | | SOFR + 0.24% | | Quarterly | | 6/5/24 | | | 4,771 | | | | 523 | | | | — | | | | 523 | | |
BNP Paribas SA | | BNP EU Luxury
Index†† | | Receive | | SOFR + 0.24% | | Quarterly | | 6/5/24 | | | 2,686 | | | | 294 | | | | — | | | | 294 | | |
BNP Paribas SA | | BNP EU Luxury
Index†† | | Receive | | SOFR + 0.24% | | Quarterly | | 6/5/24 | | | 905 | | | | 124 | | | | — | | | | 124 | | |
BNP Paribas SA | | BNP EU Luxury
Index†† | | Receive | | SOFR + 0.24% | | Quarterly | | 6/5/24 | | | 2,920 | | | | 283 | | | | — | | | | 283 | | |
BNP Paribas SA | | EMU IMI Anti Value
Custom Basket
Index†† | | Receive | | SOFR + 0.02% | | Quarterly | | 9/18/24 | | EUR | 2,290 | | | | 106 | | | | — | | | | 106 | | |
BNP Paribas SA | | EMU IMI Anti Value
Custom Basket
Index†† | | Receive | | SOFR + 0.02% | | Quarterly | | 9/18/24 | | | 4,148 | | | | 151 | | | | — | | | | 151 | | |
BNP Paribas SA | | EMU IMI Anti Value
Custom Basket
Index†† | | Receive | | SOFR + 0.02% | | Quarterly | | 9/18/24 | | | 4,186 | | | | 126 | | | | — | | | | 126 | | |
BNP Paribas SA | | EMU IMI Anti Value
Custom Basket
Index†† | | Receive | | SOFR + 0.02% | | Quarterly | | 9/18/24 | | | 4,226 | | | | 155 | | | | — | | | | 155 | | |
BNP Paribas SA | | EMU IMI Anti Value
Custom Basket
Index†† | | Receive | | SOFR + 0.02% | | Quarterly | | 9/18/24 | | | 4,144 | | | | 83 | | | | — | | | | 83 | | |
BNP Paribas SA | | EMU IMI Value
Custom Basket
Index†† | | Pay | | SOFR + 0.35% | | Quarterly | | 9/18/24 | | | (2,287 | ) | | | (64 | ) | | | — | | | | (64 | ) | |
BNP Paribas SA | | EMU IMI Value
Custom Basket
Index†† | | Pay | | SOFR + 0.35% | | Quarterly | | 9/18/24 | | | (4,162 | ) | | | (91 | ) | | | — | | | | (91 | ) | |
BNP Paribas SA | | EMU IMI Value
Custom Basket
Index†† | | Pay | | SOFR + 0.35% | | Quarterly | | 9/18/24 | | | (4,202 | ) | | | (84 | ) | | | — | | | | (84 | ) | |
BNP Paribas SA | | EMU IMI Value
Custom Basket
Index†† | | Pay | | SOFR + 0.35% | | Quarterly | | 9/18/24 | | | (4,234 | ) | | | (122 | ) | | | — | | | | (122 | ) | |
BNP Paribas SA | | EMU IMI Value
Custom Basket
Index†† | | Pay | | SOFR + 0.35% | | Quarterly | | 9/18/24 | | | (4,073 | ) | | | (76 | ) | | | — | | | | (76 | ) | |
BNP Paribas SA | | MSCI Japan Net
Total Return USD | | Pay | | SOFR + 0.01% | | Quarterly | | 2/12/24 | | $ | (16,233 | ) | | | (516 | ) | | | — | | | | (516 | ) | |
The accompanying notes are an integral part of the consolidated financial statements.
32
Morgan Stanley Institutional Fund Trust
Annual Report — September 30, 2023
Consolidated Portfolio of Investments (cont'd)
Global Strategist Portfolio
Total Return Swap Agreements: (cont'd)
Swap Counterparty | | Index | | Pay/Receive
Total Return of
Reference
Index | | Floating
Rate | | Payment
Frequency | | Maturity
Date | | Notional
Amount
(000) | | Value
(000) | | Upfront
Payment
Paid
(Received)
(000) | | Unrealized
Appreciation
(Depreciation)
(000) | |
Goldman Sachs
International | | MSCI Emerging
Markets Net Total
Return Index | | Pay | | SOFR + 0.21% | | Quarterly | | 1/26/24 | | $ | (31,556 | ) | | $ | (2,077 | ) | | $ | — | | | $ | (2,077 | ) | |
JPMorgan Chase
Bank NA | | Japan Growth Index†† | | Receive | | SOFR + 0.19% | | Quarterly | | 9/17/24 | | | 7,641 | | | | 305 | | | | — | | | | 305 | | |
JPMorgan Chase
Bank NA | | Japan Value Index†† | | Pay | | SOFR + 0.00% | | Quarterly | | 9/17/24 | | | (7,698 | ) | | | (108 | ) | | | — | | | | (108 | ) | |
JPMorgan Chase
Bank NA | | JPM Russell SPX
Broad Growth Custom
Basket Index†† | | Receive | | SOFR + 0.40% | | Quarterly | | 9/20/24 | | | 8,259 | | | | 313 | | | | — | | | | 313 | | |
JPMorgan Chase
Bank NA | | JPM Russell SPX
Broad Growth Custom
Basket Index†† | | Receive | | SOFR + 0.40% | | Quarterly | | 9/20/24 | | | 16,412 | | | | 45 | | | | — | | | | 45 | | |
JPMorgan Chase
Bank NA | | JPM Russell SPX
Broad Value Custom
Basket Index†† | | Pay | | SOFR + 0.40% | | Quarterly | | 9/20/24 | | | (8,306 | ) | | | (153 | ) | | | — | | | | (153 | ) | |
JPMorgan Chase
Bank NA | | JPM Russell SPX
Broad Value Custom
Basket Index†† | | Pay | | SOFR + 0.40% | | Quarterly | | 9/20/24 | | | (16,592 | ) | | | (105 | ) | | | — | | | | (105 | ) | |
JPMorgan Chase
Bank NA | | JPM SPX1500 Growth
Custom Basket
Index†† | | Receive | | SOFR + 0.05% | | Quarterly | | 9/16/24 | | | 3,560 | | | | 178 | | | | — | | | | 178 | | |
JPMorgan Chase
Bank NA | | JPM SPX1500 Growth
Custom Basket
Index†† | | Receive | | SOFR + 0.05% | | Quarterly | | 9/16/24 | | | 5,338 | | | | 242 | | | | — | | | | 242 | | |
JPMorgan Chase
Bank NA | | JPM SPX1500 Value
Custom Basket
Index†† | | Pay | | SOFR + 0.05% | | Quarterly | | 9/16/24 | | | (3,574 | ) | | | (57 | ) | | | — | | | | (57 | ) | |
JPMorgan Chase
Bank NA | | JPM SPX1500 Value
Custom Basket
Index†† | | Pay | | SOFR + 0.05% | | Quarterly | | 9/16/24 | | | (5,318 | ) | | | (59 | ) | | | — | | | | (59 | ) | |
JPMorgan Chase
Bank NA | | Korea Growth Index | | Receive | | SOFR + 0.30% | | Quarterly | | 9/17/24 | | | 1,910 | | | | 103 | | | | — | | | | 103 | | |
JPMorgan Chase
Bank NA | | Korea Value Index | | Pay | | SOFR + 0.16% | | Quarterly | | 9/17/24 | | | (1,920 | ) | | | (43 | ) | | | — | | | | (43 | ) | |
UBS AG | | MSCI USA Index | | Pay | | SOFR + 0.46% | | Quarterly | | 9/24/24 | | | (50,006 | ) | | | (1,301 | ) | | | — | | | | (1,301 | ) | |
| | | | | | | | | | | | | | | $ | (1,850 | ) | | $ | — | | | $ | (1,850 | ) | |
†† See tables below for details of the equity basket holdings underlying the swaps.
The accompanying notes are an integral part of the consolidated financial statements.
33
Morgan Stanley Institutional Fund Trust
Annual Report — September 30, 2023
Consolidated Portfolio of Investments (cont'd)
Global Strategist Portfolio
The following table represents the equity basket holdings underlying the total return swap with Barclays U.S. Cyclicals Custom Basket Index as of September 30, 2023:
Security Description | | Shares | | Value
(000) | | Index Weight | |
Barclays U.S. Cyclicals Custom Basket Index | |
3M Co. | | | 3,766 | | | $ | 353 | | | | 0.66 | % | |
Activision Blizzard, Inc. | | | 5,135 | | | | 481 | | | | 0.90 | | |
Air Products & Chemicals, Inc. | | | 1,528 | | | | 433 | | | | 0.81 | | |
Airbnb, Inc., Class A | | | 2,840 | | | | 390 | | | | 0.73 | | |
Automatic Data Processing | | | 2,848 | | | | 685 | | | | 1.28 | | |
Autozone, Inc. | | | 128 | | | | 325 | | | | 0.61 | | |
Boeing Co. | | | 3,881 | | | | 744 | | | | 1.39 | | |
Booking Holdings, Inc. | | | 259 | | | | 799 | | | | 1.50 | | |
Carrier Global Corp. | | | 5,759 | | | | 318 | | | | 0.60 | | |
Caterpillar, Inc. | | | 3,576 | | | | 976 | | | | 1.83 | | |
Chipotle Mexican Grill, Inc. | | | 192 | | | | 352 | | | | 0.66 | | |
Cintas Corp. | | | 631 | | | | 304 | | | | 0.57 | | |
Comcast Corp., Class A | | | 28,954 | | | | 1,284 | | | | 2.40 | | |
CSX Corp. | | | 14,189 | | | | 436 | | | | 0.82 | | |
Deere & Co. | | | 1,931 | | | | 729 | | | | 1.36 | | |
Eaton Corp. PLC | | | 2,737 | | | | 584 | | | | 1.09 | | |
Ecolab, Inc. | | | 1,765 | | | | 299 | | | | 0.56 | | |
Emerson Electric Co. | | | 3,939 | | | | 380 | | | | 0.71 | | |
FedEx Corp. | | | 1,647 | | | | 436 | | | | 0.82 | | |
Ford Motor Co. | | | 26,855 | | | | 334 | | | | 0.62 | | |
Freeport-Mcmoran, Inc. | | | 9,787 | | | | 365 | | | | 0.68 | | |
General Dynamics Corp. | | | 1,607 | | | | 355 | | | | 0.66 | | |
General Electric Co. | | | 7,452 | | | | 824 | | | | 1.54 | | |
General Motors Co. | | | 9,525 | | | | 314 | | | | 0.59 | | |
Home Depot, Inc. | | | 6,981 | | | | 2,109 | | | | 3.95 | | |
Honeywell International, Inc. | | | 4,578 | | | | 846 | | | | 1.58 | | |
Illinois Tool Works, Inc. | | | 2,089 | | | | 481 | | | | 0.90 | | |
Linde PLC | | | 3,361 | | | | 1,251 | | | | 2.34 | | |
Lowe's Cos, Inc. | | | 4,087 | | | | 849 | | | | 1.59 | | |
Lululemon Athletica, Inc. | | | 807 | | | | 311 | | | | 0.58 | | |
Marriott International, Class A | | | 1,812 | | | | 356 | | | | 0.67 | | |
Mcdonald's Corp. | | | 5,018 | | | | 1,322 | | | | 2.48 | | |
Netflix, Inc. | | | 3,069 | | | | 1,159 | | | | 2.17 | | |
Nike, Inc., Class B | | | 8,603 | | | | 823 | | | | 1.54 | | |
Norfolk Southern Corp. | | | 1,570 | | | | 309 | | | | 0.58 | | |
Northrop Grumman Corp. | | | 983 | | | | 433 | | | | 0.81 | | |
O'Reilly Automotive, Inc. | | | 426 | | | | 387 | | | | 0.72 | | |
Paccar, Inc. | | | 3,605 | | | | 307 | | | | 0.57 | | |
Parker Hannifin Corp. | | | 875 | | | | 341 | | | | 0.64 | | |
Sherwin-Williams Co. | | | 1,703 | | | | 434 | | | | 0.81 | | |
Starbucks Corp. | | | 7,910 | | | | 722 | | | | 1.35 | | |
Tesla, Inc. | | | 20,206 | | | | 5,056 | | | | 9.47 | | |
TJX Companies, Inc. | | | 7,955 | | | | 707 | | | | 1.32 | | |
Trane Technologies PLC | | | 1,579 | | | | 320 | | | | 0.60 | | |
Transdigm Group, Inc. | | | 376 | | | | 317 | | | | 0.59 | | |
Uber Technologies, Inc. | | | 12,509 | | | | 575 | | | | 1.08 | | |
Union Pacific Corp. | | | 4,215 | | | | 858 | | | | 1.61 | | |
United Parcel Service, Class B | | | 4,975 | | | | 775 | | | | 1.45 | | |
Walt Disney Co. | | | 12,555 | | | | 1,018 | | | | 1.91 | | |
Waste Management, Inc. | | | 2,776 | | | | 423 | | | | 0.79 | | |
The following table represents the equity basket holdings underlying the total return swap with Barclays U.S. Defensives Custom Basket Index as of September 30, 2023:
Security Description | | Shares | | Value
(000) | | Index Weight | |
Barclays U.S. Defensives Custom Basket Index | |
Abbott Laboratories | | | 11,273 | | | $ | 1,092 | | | | 2.03 | % | |
Abbvie, Inc. | | | 11,323 | | | | 1,688 | | | | 3.14 | | |
American Electric Power | | | 3,293 | | | | 248 | | | | 0.46 | | |
Amgen, Inc. | | | 3,483 | | | | 936 | | | | 1.74 | | |
Archer-Daniels-Midland Co. | | | 3,488 | | | | 263 | | | | 0.49 | | |
AT&T, Inc. | | | 46,068 | | | | 692 | | | | 1.29 | | |
Becton Dickinson and Co. | | | 1,796 | | | | 464 | | | | 0.86 | | |
Biogen, Inc. | | | 938 | | | | 241 | | | | 0.45 | | |
Boston Scientific Corp. | | | 9,220 | | | | 487 | | | | 0.91 | | |
Bristol-Myers Squibb Co. | | | 13,540 | | | | 786 | | | | 1.46 | | |
Centene Corp. | | | 3,497 | | | | 241 | | | | 0.45 | | |
Coca-Cola Co. | | | 26,512 | | | | 1,484 | | | | 2.76 | | |
Colgate-Palmolive Co. | | | 5,063 | | | | 360 | | | | 0.67 | | |
Costco Wholesale Corp. | | | 2,849 | | | | 1,610 | | | | 3.00 | | |
Cvs Health Corp. | | | 8,196 | | | | 572 | | | | 1.07 | | |
Danaher Corp. | | | 4,456 | | | | 1,106 | | | | 2.06 | | |
Duke Energy Corp. | | | 4,938 | | | | 436 | | | | 0.81 | | |
Edwards Lifesciences Corp. | | | 3,878 | | | | 269 | | | | 0.50 | | |
Elevance Health, Inc. | | | 1,517 | | | | 661 | | | | 1.23 | | |
Eli Lilly & Co. | | | 5,181 | | | | 2,783 | | | | 5.18 | | |
Exelon Corp. | | | 6,349 | | | | 240 | | | | 0.45 | | |
General Mills, Inc. | | | 3,772 | | | | 241 | | | | 0.45 | | |
Gilead Sciences, Inc. | | | 8,087 | | | | 606 | | | | 1.13 | | |
Hca Healthcare, Inc. | | | 1,332 | | | | 328 | | | | 0.61 | | |
Humana, Inc. | | | 808 | | | | 393 | | | | 0.73 | | |
Intuitive Surgical, Inc. | | | 2,264 | | | | 662 | | | | 1.23 | | |
Johnson & Johnson | | | 16,810 | | | | 2,618 | | | | 4.87 | | |
Kimberly-Clark Corp. | | | 2,161 | | | | 261 | | | | 0.49 | | |
Mckesson Corp. | | | 873 | | | | 380 | | | | 0.71 | | |
Medtronic PLC | | | 8,520 | | | | 668 | | | | 1.24 | | |
Merck & Co., Inc. | | | 16,323 | | | | 1,680 | | | | 3.13 | | |
Mondelez International, Inc.,
Class A | | | 8,806 | | | | 611 | | | | 1.14 | | |
Monster Beverage Corp. | | | 5,047 | | | | 267 | | | | 0.50 | | |
Nextera Energy, Inc. | | | 12,912 | | | | 740 | | | | 1.38 | | |
Pepsico, Inc. | | | 8,858 | | | | 1,501 | | | | 2.79 | | |
Pfizer, Inc. | | | 36,258 | | | | 1,203 | | | | 2.24 | | |
Procter & Gamble Co. | | | 15,152 | | | | 2,210 | | | | 4.11 | | |
Regeneron Pharmaceuticals | | | 697 | | | | 574 | | | | 1.07 | | |
Sempra | | | 4,018 | | | | 273 | | | | 0.51 | | |
Southern Co. | | | 7,004 | | | | 453 | | | | 0.84 | | |
Stryker Corp. | | | 2,206 | | | | 603 | | | | 1.12 | | |
Target Corp. | | | 2,938 | | | | 325 | | | | 0.60 | | |
The Cigna Group | | | 1,899 | | | | 543 | | | | 1.01 | | |
Thermo Fisher Scientific, Inc. | | | 2,469 | | | | 1,250 | | | | 2.33 | | |
T-Mobile US, Inc. | | | 3,889 | | | | 545 | | | | 1.01 | | |
Unitedhealth Group, Inc. | | | 5,994 | | | | 3,022 | | | | 5.63 | | |
Verizon Communications, Inc. | | | 27,295 | | | | 885 | | | | 1.65 | | |
Vertex Pharmaceuticals, Inc. | | | 1,667 | | | | 580 | | | | 1.08 | | |
Walmart, Inc. | | | 9,515 | | | | 1,522 | | | | 2.83 | | |
Zoetis, Inc. | | | 2,985 | | | | 519 | | | | 0.97 | | |
The accompanying notes are an integral part of the consolidated financial statements.
34
Morgan Stanley Institutional Fund Trust
Annual Report — September 30, 2023
Consolidated Portfolio of Investments (cont'd)
Global Strategist Portfolio
The following table represents the equity basket holdings underlying the total return swap with BNP EU Luxury Index as of September 30, 2023:
Security Description | | Shares | | Value
(000) | | Index Weight | |
BNP EU Luxury Index | |
Brunello Cucinelli SpA | | | 199 | | | $ | 15 | | | | 1.80 | % | |
Burberry Group PLC | | | 1,109 | | | | 26 | | | | 3.07 | | |
Cie Financiere Richemo, Class A
Reg | | | 1,319 | | | | 162 | | | | 19.22 | | |
Hermes International | | | 93 | | | | 170 | | | | 20.28 | | |
Hugo Boss AG | | | 210 | | | | 13 | | | | 1.58 | | |
Kering | | | 342 | | | | 156 | | | | 18.60 | | |
LVMH Moet Hennessy Louis
Vuitton SE | | | 239 | | | | 181 | | | | 21.54 | | |
Moncler SpA | | | 813 | | | | 47 | | | | 5.64 | | |
Salvatore Ferragamo SpA | | | 530 | | | | 7 | | | | 0.84 | | |
Swatch Group AG | | | 150 | | | | 39 | | | | 4.59 | | |
Tapestry, Inc. | | | 693 | | | | 20 | | | | 2.37 | | |
Tod's SpA | | | 104 | | | | 4 | | | | 0.45 | | |
The following table represents the equity basket holdings underlying the total return swap with EMU IMI Anti Value Custom Basket Index as of September 30, 2023:
Security Description | | Shares | | Value
(000) | | Index Weight | |
EMU IMI Anti Value Custom Basket Index | |
Adyen NV | | | 12 | | | $ | 9 | | | | 0.90 | % | |
Air Liquide SA | | | 50 | | | | 8 | | | | 0.84 | | |
Akzo Nobel NV | | | 118 | | | | 8 | | | | 0.84 | | |
Allfunds Group PLC | | | 1,664 | | | | 9 | | | | 0.91 | | |
Amplifon SpA | | | 290 | | | | 8 | | | | 0.85 | | |
Arcadis NV | | | 192 | | | | 8 | | | | 0.85 | | |
Bawag Group AG | | | 206 | | | | 9 | | | | 0.93 | | |
Bureau Veritas SA | | | 342 | | | | 8 | | | | 0.84 | | |
Ca Immobilien Anlagen AG | | | 273 | | | | 9 | | | | 0.90 | | |
Carl Zeiss Meditec AG | | | 104 | | | | 9 | | | | 0.90 | | |
Cellnex Telecom SA | | | 269 | | | | 9 | | | | 0.93 | | |
Covestro AG | | | 158 | | | | 8 | | | | 0.84 | | |
Credit Agricole SA | | | 756 | | | | 9 | | | | 0.92 | | |
CTS Eventim AG & Co. KGaA | | | 177 | | | | 10 | | | | 1.00 | | |
Dassault Systemes SE | | | 263 | | | | 9 | | | | 0.97 | | |
Deutsche Boerse AG | | | 52 | | | | 9 | | | | 0.90 | | |
Dsm-Firmenich AG | | | 108 | | | | 9 | | | | 0.90 | | |
Eckert & Ziegler Strahlen und
Medizintechnik AG | | | 286 | | | | 9 | | | | 0.96 | | |
Edenred | | | 145 | | | | 9 | | | | 0.90 | | |
Edp Renovaveis SA | | | 529 | | | | 8 | | | | 0.86 | | |
Finecobank SpA | | | 745 | | | | 9 | | | | 0.90 | | |
Fuchs SE — Pref | | | 224 | | | | 8 | | | | 0.86 | | |
Gecina SA | | | 90 | | | | 9 | | | | 0.91 | | |
Groupe Bruxelles Lambert NV | | | 117 | | | | 8 | | | | 0.86 | | |
Hannover Rueck SE | | | 43 | | | | 9 | | | | 0.94 | | |
Imcd NV | | | 67 | | | | 8 | | | | 0.84 | | |
Infrastrutture Wireless Italiane SpA | | | 827 | | | | 9 | | | | 0.97 | | |
Inmobiliaria Colonial Socimi SA | | | 1,545 | | | | 8 | | | | 0.87 | | |
KBC Group NV | | | 149 | | | | 9 | | | | 0.92 | | |
Kingspan Group PLC | | | 114 | | | | 8 | | | | 0.84 | | |
Legrand SA | | | 93 | | | | 8 | | | | 0.85 | | |
Lotus Bakeries | | | 1 | | | | 8 | | | | 0.84 | | |
Mediobanca SpA | | | 722 | | | | 9 | | | | 0.94 | | |
Merlin Properties Socimi SA | | | 1,056 | | | | 8 | | | | 0.88 | | |
Security Description | | Shares | | Value
(000) | | Index Weight | |
EMU IMI Anti Value Custom Basket Index (cont'd) | |
Nemetschek SE | | | 158 | | | $ | 9 | | | | 0.96 | % | |
Neoen SA | | | 312 | | | | 9 | | | | 0.90 | | |
OCI NV | | | 317 | | | | 8 | | | | 0.87 | | |
Qt Group Oyj | | | 171 | | | | 9 | | | | 0.93 | | |
Sampo Oyj — A Shares | | | 220 | | | | 9 | | | | 0.94 | | |
SAP SE | | | 73 | | | | 9 | | | | 0.93 | | |
Schneider Electric SE | | | 52 | | | | 8 | | | | 0.85 | | |
Scout24 SE | | | 151 | | | | 10 | | | | 1.04 | | |
Solaria Energía y Medio
Ambiente SA | | | 598 | | | | 9 | | | | 0.92 | | |
Symrise AG | | | 91 | | | | 8 | | | | 0.86 | | |
Talanx AG | | | 144 | | | | 9 | | | | 0.91 | | |
Universal Music Group NV | | | 410 | | | | 10 | | | | 1.06 | | |
VGP | | | 91 | | | | 8 | | | | 0.83 | | |
Vidrala SA | | | 99 | | | | 8 | | | | 0.85 | | |
Warehouses De Pauw SCA | | | 346 | | | | 8 | | | | 0.85 | | |
Wolters Kluwer | | | 71 | | | | 8 | | | | 0.85 | | |
The following table represents the equity basket holdings underlying the total return swap with EMU IMI Value Custom Basket Index as of September 30, 2023:
Security Description | | Shares | | Value
(000) | | Index Weight | |
EMU IMI Value Custom Basket Index | |
Acerinox SA | | | 1,029 | | | $ | 9 | | | | 0.97 | % | |
Anheuser-Busch Inbev SA | | | 169 | | | | 9 | | | | 0.91 | | |
Anima Holding SpA | | | 2,353 | | | | 9 | | | | 0.96 | | |
Aperam | | | 340 | | | | 9 | | | | 0.96 | | |
Arcelormittal | | | 391 | | | | 9 | | | | 0.96 | | |
Aroundtown SA | | | 5,496 | | | | 11 | | | | 1.11 | | |
Azimut Holding SpA | | | 431 | | | | 9 | | | | 0.92 | | |
Bollore SE | | | 1,663 | | | | 8 | | | | 0.87 | | |
Bouygues SA | | | 292 | | | | 10 | | | | 0.99 | | |
Cargotec Oyj — B Share | | | 235 | | | | 9 | | | | 0.96 | | |
Clariane SE | | | 1,521 | | | | 9 | | | | 0.89 | | |
Cnh Industrial NV | | | 761 | | | | 9 | | | | 0.90 | | |
Compagnie De Saint Gobain | | | 170 | | | | 10 | | | | 0.99 | | |
Daimler Truck Holding AG | | | 289 | | | | 9 | | | | 0.97 | | |
Deutsche Bank AG-Registered | | | 885 | | | | 9 | | | | 0.95 | | |
Deutsche Pfandbriefbank AG | | | 1,257 | | | | 8 | | | | 0.87 | | |
D'Ieteren Group | | | 72 | | | | 12 | | | | 1.19 | | |
Eiffage | | | 104 | | | | 9 | | | | 0.96 | | |
Flow Traders Ltd. | | | 509 | | | | 9 | | | | 0.92 | | |
Fresenius Medical Care AG & Co. | | | 223 | | | | 9 | | | | 0.93 | | |
Fresenius Se & Co. KGaA | | | 315 | | | | 9 | | | | 0.95 | | |
Glanbia PLC | | | 563 | | | | 9 | | | | 0.90 | | |
Heidelberg Materials AG | | | 129 | | | | 10 | | | | 0.98 | | |
Ipsos Group SA | | | 191 | | | | 8 | | | | 0.86 | | |
Iveco Group NV | | | 1,066 | | | | 9 | | | | 0.97 | | |
JDE Peet's NV | | | 356 | | | | 9 | | | | 0.97 | | |
Jungheinrich — Prfd | | | 331 | | | | 9 | | | | 0.97 | | |
Kion Group AG | | | 253 | | | | 9 | | | | 0.95 | | |
Konecranes Oyj | | | 308 | | | | 10 | | | | 1.00 | | |
Leonardo SpA | | | 698 | | | | 10 | | | | 0.98 | | |
Mapfre SA | | | 4,449 | | | | 9 | | | | 0.88 | | |
Mercedes-Benz Group AG | | | 130 | | | | 9 | | | | 0.88 | | |
Nexity | | | 611 | | | | 9 | | | | 0.88 | | |
Outokumpu Oyj | | | 2,273 | | | | 9 | | | | 0.93 | | |
The accompanying notes are an integral part of the consolidated financial statements.
35
Morgan Stanley Institutional Fund Trust
Annual Report — September 30, 2023
Consolidated Portfolio of Investments (cont'd)
Global Strategist Portfolio
Security Description | | Shares | | Value
(000) | | Index Weight | |
EMU IMI Value Custom Basket Index (cont'd) | |
Rexel SA | | | 427 | | | $ | 9 | | | | 0.94 | % | |
Salzgitter AG | | | 374 | | | | 9 | | | | 0.97 | | |
Sanofi | | | 82 | | | | 8 | | | | 0.86 | | |
Saras SpA | | | 6,307 | | | | 9 | | | | 0.88 | | |
Schaeffler AG — Pref | | | 1,606 | | | | 9 | | | | 0.90 | | |
Seb SA | | | 96 | | | | 9 | | | | 0.87 | | |
Signify NV | | | 389 | | | | 10 | | | | 1.02 | | |
Siltronic AG | | | 117 | | | | 9 | | | | 0.97 | | |
Stellantis NV | | | 491 | | | | 9 | | | | 0.92 | | |
Stmicroelectronics NV | | | 207 | | | | 8 | | | | 0.87 | | |
Unipol Gruppo SpA | | | 1,694 | | | | 9 | | | | 0.89 | | |
Voestalpine AG | | | 347 | | | | 9 | | | | 0.92 | | |
Volkswagen AG — Pref | | | 69 | | | | 9 | | | | 0.89 | | |
Volkswagen AG — Pref | | | 79 | | | | 9 | | | | 0.89 | | |
Vonovia SE | | | 384 | | | | 9 | | | | 0.90 | | |
Wienerberger AG | | | 384 | | | | 9 | | | | 0.95 | | |
The following table represents the equity basket holdings underlying the total return swap with Japan Growth Index as of September 30, 2023:
Security Description | | Shares | | Value
(000) | | Index Weight | |
Japan Growth Index | |
Advantest Corp. | | | 7,449 | | | $ | 208 | | | | 2.22 | % | |
Asahi Intecc Co. Ltd. | | | 10,118 | | | | 182 | | | | 1.94 | | |
Bandai Namco Holdings, Inc. | | | 9,521 | | | | 194 | | | | 2.07 | | |
Baycurrent Consulting, Inc. | | | 6,076 | | | | 203 | | | | 2.17 | | |
Capcom Co. Ltd. | | | 5,061 | | | | 182 | | | | 1.94 | | |
Daifuku Co. Ltd. | | | 11,352 | | | | 215 | | | | 2.29 | | |
Daiichi Sankyo Co. Ltd. | | | 7,355 | | | | 202 | | | | 2.15 | | |
Daikin Industries Ltd. | | | 1,233 | | | | 194 | | | | 2.06 | | |
Disco Corp. | | | 1,180 | | | | 218 | | | | 2.32 | | |
Fanuc Corp. | | | 7,540 | | | | 196 | | | | 2.09 | | |
Fast Retailing Co. Ltd. | | | 905 | | | | 197 | | | | 2.10 | | |
Gmo Payment Gateway, Inc. | | | 3,516 | | | | 192 | | | | 2.05 | | |
Hoshizaki Corp. | | | 5,405 | | | | 188 | | | | 2.00 | | |
Japan Exchange Group, Inc. | | | 11,867 | | | | 220 | | | | 2.35 | | |
Japan Real Estate Investment | | | 52 | | | | 203 | | | | 2.16 | | |
JSR Corp | | | 7,622 | | | | 205 | | | | 2.18 | | |
Keio Corp. | | | 5,926 | | | | 204 | | | | 2.17 | | |
Keisei Electric Railway Co. | | | 5,439 | | | | 189 | | | | 2.01 | | |
Keyence Corp. | | | 525 | | | | 195 | | | | 2.08 | | |
Kikkoman Corp. | | | 3,687 | | | | 194 | | | | 2.06 | | |
Kobe Bussan Co. Ltd. | | | 8,713 | | | | 204 | | | | 2.18 | | |
Lasertec Corp. | | | 1,457 | | | | 227 | | | | 2.42 | | |
M3, Inc. | | | 11,029 | | | | 200 | | | | 2.14 | | |
Mcdonald's Holdings Co. | | | 5,345 | | | | 204 | | | | 2.18 | | |
Monotaro Co. Ltd. | | | 19,657 | | | | 211 | | | | 2.24 | | |
MS&AD Insurance Group
Holdings, Inc. | | | 5,557 | | | | 204 | | | | 2.18 | | |
Nidec Corp. | | | 4,170 | | | | 193 | | | | 2.06 | | |
Nippon Paint Holdings Co. Ltd. | | | 26,388 | | | | 178 | | | | 1.89 | | |
Nippon Prologis REIT, Inc. | | | 108 | | | | 202 | | | | 2.15 | | |
Nissan Chemical Corp. | | | 4,788 | | | | 204 | | | | 2.17 | | |
Nomura Real Estate Master
Fund, Inc | | | 181 | | | | 203 | | | | 2.16 | | |
Nomura Research Institute Ltd. | | | 7,270 | | | | 189 | | | | 2.02 | | |
OBIC Co. Ltd. | | | 1,239 | | | | 188 | | | | 2.00 | | |
Oracle Corp. | | | 3,003 | | | | 223 | | | | 2.38 | | |
Security Description | | Shares | | Value
(000) | | Index Weight | |
Japan Growth Index (cont'd) | |
Oriental Land Co. Ltd. | | | 5,894 | | | $ | 194 | | | | 2.06 | % | |
Rakuten Group, Inc. | | | 51,454 | | | | 211 | | | | 2.25 | | |
Recruit Holdings Co. Ltd. | | | 5,994 | | | | 185 | | | | 1.97 | | |
Shiseido Co. Ltd. | | | 5,451 | | | | 192 | | | | 2.04 | | |
SMC Corp. | | | 441 | | | | 198 | | | | 2.11 | | |
Softbank Group Corp. | | | 4,576 | | | | 194 | | | | 2.07 | | |
T&D Holdings, Inc. | | | 12,442 | | | | 206 | | | | 2.19 | | |
Toho Co. Ltd. | | | 5,429 | | | | 185 | | | | 1.98 | | |
Tokio Marine Holdings, Inc. | | | 9,029 | | | | 209 | | | | 2.23 | | |
Tokyo Electric Power Co. | | | 48,039 | | | | 215 | | | | 2.29 | | |
Unicharm Corp. | | | 5,429 | | | | 192 | | | | 2.05 | | |
Yaskawa Electric Corp. | | | 5,367 | | | | 194 | | | | 2.06 | | |
Zensho Holdings Co. Ltd. | | | 4,565 | | | | 199 | | | | 2.12 | | |
The following table represents the equity basket holdings underlying the total return swap with Japan Value Index as of September 30, 2023:
Security Description | | Shares | | Value
(000) | | Index Weight | |
Japan Value Index | |
AGC, Inc. | | | 6,545 | | | $ | 230 | | | | 2.16 | % | |
Aisin Corp. | | | 6,781 | | | | 256 | | | | 2.41 | | |
Asahi Group Holdings Ltd. | | | 5,838 | | | | 218 | | | | 2.05 | | |
Brother Industries Ltd. | | | 13,827 | | | | 223 | | | | 2.10 | | |
Canon, Inc. | | | 9,464 | | | | 228 | | | | 2.15 | | |
Daiwa House Industry Co. Ltd. | | | 8,337 | | | | 224 | | | | 2.11 | | |
Dentsu Group, Inc. | | | 7,668 | | | | 226 | | | | 2.12 | | |
Hitachi Construction Machinery | | | 7,133 | | | | 217 | | | | 2.04 | | |
Honda Motor Co. Ltd. | | | 20,263 | | | | 228 | | | | 2.14 | | |
Isuzu Motors Ltd. | | | 17,757 | | | | 224 | | | | 2.10 | | |
Japan Post Insurance Co. Ltd. | | | 13,649 | | | | 230 | | | | 2.16 | | �� |
JFE Holdings, Inc. | | | 15,489 | | | | 227 | | | | 2.14 | | |
Kajima Corp. | | | 13,324 | | | | 217 | | | | 2.04 | | |
Kansai Electric Power Co., Inc. | | | 15,008 | | | | 209 | | | | 1.96 | | |
Kawasaki Kisen Kaisha Ltd. | | | 6,456 | | | | 221 | | | | 2.07 | | |
Kddi Corp. | | | 7,555 | | | | 231 | | | | 2.18 | | |
Kirin Holdings Co. Ltd. | | | 16,283 | | | | 228 | | | | 2.14 | | |
Mazda Motor Corp. | | | 20,025 | | | | 227 | | | | 2.14 | | |
Mitsubishi Corp. | | | 4,581 | | | | 219 | | | | 2.05 | | |
Mitsui & Co. Ltd. | | | 6,091 | | | | 221 | | | | 2.08 | | |
Mitsui Osk Lines Ltd. | | | 8,085 | | | | 222 | | | | 2.09 | | |
Mizuho Financial Group, Inc. | | | 13,073 | | | | 222 | | | | 2.09 | | |
NEC Corp. | | | 4,137 | | | | 229 | | | | 2.15 | | |
NGK Insulators Ltd. | | | 17,428 | | | | 231 | | | | 2.17 | | |
Nippon Express Holdings, Inc. | | | 4,514 | | | | 236 | | | | 2.22 | | |
Nippon Steel Corp. | | | 9,678 | | | | 227 | | | | 2.13 | | |
Nippon Telegraph & Telephone | | | 196,702 | | | | 233 | | | | 2.19 | | |
Nippon Yusen Kabushiki Kaisha | | | 8,638 | | | | 225 | | | | 2.11 | | |
Nissan Motor Co. Ltd. | | | 52,589 | | | | 232 | | | | 2.19 | | |
Nomura Real Estate Holdings, Inc. | | | 9,199 | | | | 231 | | | | 2.17 | | |
OJI Holdings Corp. | | | 53,517 | | | | 225 | | | | 2.12 | | |
ONO Pharmaceutical Co. Ltd. | | | 11,785 | | | | 226 | | | | 2.13 | | |
ORIX Corp. | | | 12,086 | | | | 226 | | | | 2.12 | | |
Otsuka Holdings Co. Ltd. | | | 6,235 | | | | 222 | | | | 2.08 | | |
Ricoh Co. Ltd. | | | 26,959 | | | | 233 | | | | 2.19 | | |
Sbi Holdings, Inc. | | | 10,626 | | | | 224 | | | | 2.10 | | |
Seiko Epson Corp. | | | 14,951 | | | | 235 | | | | 2.21 | | |
Seven & I Holdings Co. Ltd. | | | 5,647 | | | | 221 | | | | 2.08 | | |
The accompanying notes are an integral part of the consolidated financial statements.
36
Morgan Stanley Institutional Fund Trust
Annual Report — September 30, 2023
Consolidated Portfolio of Investments (cont'd)
Global Strategist Portfolio
Security Description | | Shares | | Value
(000) | | Index Weight | |
Japan Value Index (cont'd) | |
Shionogi & Co. Ltd. | | | 5,128 | | | $ | 229 | | | | 2.16 | % | |
Subaru Corp. | | | 11,592 | | | | 225 | | | | 2.12 | | |
Sumco Corp. | | | 17,534 | | | | 229 | | | | 2.15 | | |
Sumitomo Corp. | | | 11,103 | | | | 222 | | | | 2.08 | | |
Sumitomo Mitsui Financial Group | | | 4,608 | | | | 227 | | | | 2.13 | | |
Sumitomo Realty & Development
Co. Ltd. | | | 8,435 | | | | 219 | | | | 2.06 | | |
Suntory Beverage & Food Ltd. | | | 7,134 | | | | 217 | | | | 2.04 | | |
TDK Corp. | | | 6,381 | | | | 237 | | | | 2.23 | | |
Toyota Tsusho Corp. | | | 3,834 | | | | 226 | | | | 2.12 | | |
The following table represents the equity basket holdings underlying the total return swap with JPM Russell SPX Broad Growth Custom Basket Index as of September 30, 2023:
Security Description | | Shares | | Value
(000) | | Index Weight | |
JPM Russell SPX Broad Growth Custom Basket Index | |
Aerovironment, Inc. | | | 371 | | | $ | 41 | | | | 0.43 | % | |
Aptargroup, Inc. | | | 328 | | | | 41 | | | | 0.43 | | |
Arista Networks, Inc. | | | 224 | | | | 41 | | | | 0.43 | | |
Atlassian Corp., Class A | | | 204 | | | | 41 | | | | 0.43 | | |
Avery Dennison Corp. | | | 229 | | | | 42 | | | | 0.44 | | |
City Holding Co. | | | 458 | | | | 41 | | | | 0.43 | | |
Cloudflare, Inc., Class A | | | 658 | | | | 42 | | | | 0.43 | | |
Constellation Energy | | | 376 | | | | 41 | | | | 0.43 | | |
Costco Wholesale Corp. | | | 74 | | | | 42 | | | | 0.44 | | |
Crowdstrike Holdings, Inc., Class A | | | 250 | | | | 42 | | | | 0.44 | | |
Elastic NV | | | 528 | | | | 43 | | | | 0.45 | | |
Erie Indemnity Company, Class A | | | 145 | | | | 43 | | | | 0.44 | | |
Factset Research Systems, Inc. | | | 97 | | | | 42 | | | | 0.44 | | |
Five Below | | | 260 | | | | 42 | | | | 0.44 | | |
Garmin Ltd. | | | 389 | | | | 41 | | | | 0.43 | | |
Glaukos Corp. | | | 550 | | | | 41 | | | | 0.43 | | |
Goosehead Insurance, Inc., Class A | | | 572 | | | | 43 | | | | 0.45 | | |
Healthequity, Inc. | | | 599 | | | | 44 | | | | 0.46 | | |
Ionis Pharmaceuticals, Inc. | | | 963 | | | | 44 | | | | 0.46 | | |
Kinsale Capital Group, Inc. | | | 101 | | | | 42 | | | | 0.44 | | |
Lennox International, Inc. | | | 110 | | | | 41 | | | | 0.43 | | |
Manhattan Associates, Inc. | | | 208 | | | | 41 | | | | 0.43 | | |
Monolithic Power Systems, Inc. | | | 89 | | | | 41 | | | | 0.43 | | |
New Fortress Energy, Inc. | | | 1,312 | | | | 43 | | | | 0.45 | | |
Nike, Inc., Class B | | | 429 | | | | 41 | | | | 0.43 | | |
Nvidia Corp. | | | 94 | | | | 41 | | | | 0.43 | | |
Old Dominion Freight Line | | | 101 | | | | 41 | | | | 0.43 | | |
Palantir Technologies, Inc., Class A | | | 2,696 | | | | 43 | | | | 0.45 | | |
Paycor HCM, Inc. | | | 1,812 | | | | 41 | | | | 0.43 | | |
PDF Solutions, Inc. | | | 1,305 | | | | 42 | | | | 0.44 | | |
Peloton Interactive, Inc., Class A | | | 8,199 | | | | 41 | | | | 0.43 | | |
Pinterest, Inc., Class A | | | 1,607 | | | | 43 | | | | 0.45 | | |
Procore Technologies, Inc. | | | 646 | | | | 42 | | | | 0.44 | | |
Progyny, Inc. | | | 1,208 | | | | 41 | | | | 0.43 | | |
Quinstreet, Inc. | | | 4,607 | | | | 41 | | | | 0.43 | | |
Roblox Corp., Class A | | | 1,481 | | | | 43 | | | | 0.45 | | |
Roivant Sciences Ltd. | | | 3,660 | | | | 43 | | | | 0.45 | | |
Rollins, Inc. | | | 1,116 | | | | 42 | | | | 0.44 | | |
Seagate Technology Holdings | | | 648 | | | | 43 | | | | 0.45 | | |
Servisfirst Bancshares, Inc. | | | 804 | | | | 42 | | | | 0.44 | | |
Siteone Landscape Supply, Inc. | | | 259 | | | | 42 | | | | 0.44 | | |
Security Description | | Shares | | Value
(000) | | Index Weight | |
JPM Russell SPX Broad Growth Custom Basket Index (cont'd) | |
Targa Resources Corp. | | | 488 | | | $ | 42 | | | | 0.44 | % | |
Techtarget | | | 1,413 | | | | 43 | | | | 0.45 | | |
Texas Pacific Land Corp. | | | 23 | | | | 43 | | | | 0.44 | | |
Universal Display Corp. | | | 262 | | | | 41 | | | | 0.43 | | |
Valvoline, Inc. | | | 1,289 | | | | 42 | | | | 0.43 | | |
Vicor Corp. | | | 706 | | | | 42 | | | | 0.43 | | |
Wingstop, Inc. | | | 243 | | | | 44 | | | | 0.46 | | |
Xpel, Inc. | | | 531 | | | | 41 | | | | 0.43 | | |
Zscaler, Inc. | | | 265 | | | | 41 | | | | 0.43 | | |
The following table represents the equity basket holdings underlying the total return swap with JPM Russell SPX Broad Value Custom Basket Index as of September 30, 2023:
Security Description | | Shares | | Value
(000) | | Index Weight | |
JPM Russell SPX Broad Value Custom Basket Index | |
Aaron's Co., Inc. | | | 4,238 | | | $ | 44 | | | | 0.45 | % | |
Acuity Brands, Inc. | | | 259 | | | | 44 | | | | 0.45 | | |
Adeia, Inc. | | | 4,153 | | | | 44 | | | | 0.45 | | |
Amgen, Inc. | | | 158 | | | | 43 | | | | 0.43 | | |
Amkor Technology, Inc. | | | 1,857 | | | | 42 | | | | 0.43 | | |
Andersons, Inc. | | | 818 | | | | 42 | | | | 0.43 | | |
Asbury Automotive Group | | | 184 | | | | 42 | | | | 0.43 | | |
Avanos Medical, Inc. | | | 2,073 | | | | 42 | | | | 0.43 | | |
Boise Cascade Co. | | | 413 | | | | 43 | | | | 0.43 | | |
Callon Petroleum Co. | | | 1,071 | | | | 42 | | | | 0.43 | | |
Cal-Maine Foods, Inc. | | | 897 | | | | 43 | | | | 0.44 | | |
Centene Corp. | | | 609 | | | | 42 | | | | 0.43 | | |
Chico's Fas, Inc. | | | 9,003 | | | | 67 | | | | 0.69 | | |
Cinemark Holdings, Inc. | | | 2,464 | | | | 45 | | | | 0.46 | | |
Cleveland-Cliffs, Inc. | | | 2,892 | | | | 45 | | | | 0.46 | | |
Concentrix Corp. | | | 559 | | | | 45 | | | | 0.46 | | |
Corebridge Financial, Inc. | | | 2,203 | | | | 44 | | | | 0.44 | | |
Cross Country Healthcare, Inc. | | | 1,713 | | | | 42 | | | | 0.43 | | |
Designer Brands, Inc., Class A | | | 3,429 | | | | 43 | | | | 0.44 | | |
Diodes, Inc. | | | 536 | | | | 42 | | | | 0.43 | | |
Encore Wire Corp. | | | 239 | | | | 44 | | | | 0.45 | | |
Fresh Del Monte Produce, Inc. | | | 1,624 | | | | 42 | | | | 0.43 | | |
Geo Group, Inc. | | | 5,459 | | | | 45 | | | | 0.46 | | |
GMS, Inc. | | | 657 | | | | 42 | | | | 0.43 | | |
Group 1 Automotive, Inc. | | | 157 | | | | 42 | | | | 0.43 | | |
Hewlett Packard Enterprise | | | 2,421 | | | | 42 | | | | 0.43 | | |
Hibbett, Inc. | | | 917 | | | | 44 | | | | 0.44 | | |
Koppers Holdings, Inc. | | | 1,066 | | | | 42 | | | | 0.43 | | |
Macy's, Inc. | | | 3,709 | | | | 43 | | | | 0.44 | | |
Millerknoll, Inc. | | | 2,273 | | | | 56 | | | | 0.57 | | |
Movado Group, Inc. | | | 1,541 | | | | 42 | | | | 0.43 | | |
Mueller Industries, Inc. | | | 559 | | | | 42 | | | | 0.43 | | |
Olympic Steel, Inc. | | | 823 | | | | 46 | | | | 0.47 | | |
Orasure Technologies, Inc. | | | 7,472 | | | | 44 | | | | 0.45 | | |
Photronics, Inc. | | | 2,122 | | | | 43 | | | | 0.44 | | |
Pnm Resources, Inc. | | | 944 | | | | 42 | | | | 0.43 | | |
RPC, Inc. | | | 4,717 | | | | 42 | | | | 0.43 | | |
Ryder System, Inc. | | | 405 | | | | 43 | | | | 0.44 | | |
Sanmina Corp. | | | 791 | | | | 43 | | | | 0.44 | | |
Shoe Carnival, Inc. | | | 1,861 | | | | 45 | | | | 0.46 | | |
Stonex Group, Inc. | | | 443 | | | | 43 | | | | 0.44 | | |
Suncoke Energy, Inc. | | | 4,309 | | | | 44 | | | | 0.45 | | |
The accompanying notes are an integral part of the consolidated financial statements.
37
Morgan Stanley Institutional Fund Trust
Annual Report — September 30, 2023
Consolidated Portfolio of Investments (cont'd)
Global Strategist Portfolio
Security Description | | Shares | | Value
(000) | | Index Weight | |
JPM Russell SPX Broad Value Custom Basket Index (cont'd) | |
Textron, Inc. | | | 542 | | | $ | 42 | | | | 0.43 | % | |
Titan International, Inc. | | | 3,306 | | | | 44 | | | | 0.45 | | |
Trueblue, Inc. | | | 2,956 | | | | 43 | | | | 0.44 | | |
United Therapeutics Corp. | | | 188 | | | | 42 | | | | 0.43 | | |
Universal Insurance Holdings | | | 3,188 | | | | 45 | | | | 0.46 | | |
Vista Outdoor, Inc. | | | 1,401 | | | | 46 | | | | 0.47 | | |
Vital Energy, Inc. | | | 770 | | | | 43 | | | | 0.44 | | |
Warrior Met Coal, Inc. | | | 875 | | | | 45 | | | | 0.46 | | |
The following table represents the equity basket holdings underlying the total return swap with JPM SPX1500 Growth Custom Basket Index as of September 30, 2023:
Security Description | | Shares | | Value
(000) | | Index Weight | |
JPM SPX1500 Growth Custom Basket Index | |
Aerovironment, Inc. | | | 430 | | | $ | 48 | | | | 0.50 | % | |
Agilysys, Inc. | | | 727 | | | | 48 | | | | 0.51 | | |
Antero Midstream Corp. | | | 4,212 | | | | 50 | | | | 0.53 | | |
Aptargroup, Inc. | | | 384 | | | | 48 | | | | 0.50 | | |
Arthur J Gallagher & Co. | | | 213 | | | | 49 | | | | 0.51 | | |
Avery Dennison Corp. | | | 269 | | | | 49 | | | | 0.52 | | |
Bancfirst Corp. | | | 556 | | | | 48 | | | | 0.51 | | |
Bank Of Hawaii Corp. | | | 999 | | | | 50 | | | | 0.52 | | |
Calix, Inc. | | | 1,052 | | | | 48 | | | | 0.51 | | |
City Holding Co. | | | 543 | | | | 49 | | | | 0.52 | | |
Cognex Corp. | | | 1,128 | | | | 48 | | | | 0.50 | | |
Commerce Bancshares, Inc. | | | 1,044 | | | | 50 | | | | 0.53 | | |
Constellation Energy | | | 444 | | | | 48 | | | | 0.51 | | |
Costco Wholesale Corp. | | | 87 | | | | 49 | | | | 0.52 | | |
Equitrans Midstream Corp. | | | 5,245 | | | | 49 | | | | 0.52 | | |
Erie Indemnity Company, Class A | | | 172 | | | | 51 | | | | 0.53 | | |
Expeditors Intl Wash, Inc. | | | 420 | | | | 48 | | | | 0.51 | | |
Factset Research Systems, Inc. | | | 114 | | | | 50 | | | | 0.53 | | |
Fastenal Co. | | | 893 | | | | 49 | | | | 0.51 | | |
Five Below | | | 305 | | | | 49 | | | | 0.52 | | |
Garmin Ltd. | | | 462 | | | | 49 | | | | 0.51 | | |
Glacier Bancorp, Inc. | | | 1,701 | | | | 48 | | | | 0.51 | | |
Glaukos Corp. | | | 642 | | | | 48 | | | | 0.51 | | |
Goosehead Insurance, Inc., Class A | | | 669 | | | | 50 | | | | 0.52 | | |
Healthequity, Inc. | | | 696 | | | | 51 | | | | 0.53 | | |
Ironwood Pharmaceuticals, Inc. | | | 5,906 | | | | 57 | | | | 0.60 | | |
Kinsale Capital Group, Inc. | | | 118 | | | | 49 | | | | 0.51 | | |
Lancaster Colony Corp. | | | 301 | | | | 50 | | | | 0.52 | | |
Madison Square Garden Sports | | | 284 | | | | 50 | | | | 0.53 | | |
Nike, Inc., Class B | | | 504 | | | | 48 | | | | 0.51 | | |
Oneok, Inc. | | | 756 | | | | 48 | | | | 0.50 | | |
PDF Solutions, Inc. | | | 1,504 | | | | 49 | | | | 0.51 | | |
PRA Group, Inc. | | | 2,511 | | | | 48 | | | | 0.51 | | |
Progressive Corp. | | | 355 | | | | 50 | | | | 0.52 | | |
Rollins, Inc. | | | 1,351 | | | | 50 | | | | 0.53 | | |
Seagate Technology Holdings | | | 759 | | | | 50 | | | | 0.53 | | |
Servisfirst Bancshares, Inc. | | | 934 | | | | 49 | | | | 0.51 | | |
Simulations Plus, Inc. | | | 1,165 | | | | 49 | | | | 0.51 | | |
Sitime Corp. | | | 442 | | | | 50 | | | | 0.53 | | |
Targa Resources Corp. | | | 582 | | | | 50 | | | | 0.52 | | |
Triumph Financial, Inc. | | | 748 | | | | 48 | | | | 0.51 | | |
Trupanion, Inc. | | | 1,712 | | | | 48 | | | | 0.51 | | |
Valaris Ltd. | | | 677 | | | | 51 | | | | 0.53 | | |
Security Description | | Shares | | Value
(000) | | Index Weight | |
JPM SPX1500 Growth Custom Basket Index (cont'd) | |
Verisign, Inc. | | | 241 | | | $ | 49 | | | | 0.51 | % | |
Watsco, Inc. | | | 139 | | | | 52 | | | | 0.55 | | |
WD-40 Co. | | | 239 | | | | 49 | | | | 0.51 | | |
Williams Cos, Inc. | | | 1,448 | | | | 49 | | | | 0.51 | | |
Wingstop, Inc. | | | 294 | | | | 53 | | | | 0.56 | | |
Xpel, Inc. | | | 657 | | | | 51 | | | | 0.53 | | |
Yeti Holdings, Inc. | | | 1,040 | | | | 50 | | | | 0.53 | | |
The following table represents the equity basket holdings underlying the total return swap with JPM SPX1500 Value Custom Basket Index as of September 30, 2023:
Security Description | | Shares | | Value
(000) | | Index Weight | |
JPM SPX1500 Value Custom Basket Index | |
Aaron's Co., Inc. | | | 4,754 | | | $ | 50 | | | | 0.50 | % | |
Acuity Brands, Inc. | | | 309 | | | | 53 | | | | 0.53 | | |
Adeia, Inc. | | | 5,240 | | | | 56 | | | | 0.57 | | |
Advansix, Inc. | | | 1,604 | | | | 50 | | | | 0.50 | | |
Amc Networks, Inc., Class A | | | 4,475 | | | | 53 | | | | 0.53 | | |
Amkor Technology, Inc. | | | 2,228 | | | | 50 | | | | 0.51 | | |
Andersons, Inc. | | | 976 | | | | 50 | | | | 0.51 | | |
Associated Banc-Corp | | | 2,914 | | | | 50 | | | | 0.50 | | |
AT&T, Inc. | | | 3,360 | | | | 50 | | | | 0.51 | | |
Brinker International, Inc. | | | 1,597 | | | | 50 | | | | 0.51 | | |
Callon Petroleum Co. | | | 1,272 | | | | 50 | | | | 0.50 | | |
Centene Corp. | | | 734 | | | | 51 | | | | 0.51 | | |
Chico's FAS, Inc. | | | 10,768 | | | | 81 | | | | 0.81 | | |
Cinemark Holdings, Inc. | | | 3,030 | | | | 56 | | | | 0.56 | | |
Cleveland-Cliffs, Inc. | | | 3,462 | | | | 54 | | | | 0.55 | | |
Cno Financial Group, Inc. | | | 2,104 | | | | 50 | | | | 0.50 | | |
Computer Programs & Systems | | | 3,330 | | | | 53 | | | | 0.54 | | |
Concentrix Corp. | | | 675 | | | | 54 | | | | 0.55 | | |
Cross Country Healthcare, Inc. | | | 2,057 | | | | 51 | | | | 0.52 | | |
Designer Brands, Inc., Class A | | | 3,972 | | | | 50 | | | | 0.51 | | |
Dxc Technology Co. | | | 2,389 | | | | 50 | | | | 0.50 | | |
Encore Wire Corp. | | | 292 | | | | 53 | | | | 0.54 | | |
Fortrea Holdings, Inc. | | | 1,841 | | | | 53 | | | | 0.53 | | |
Fresh Del Monte Produce, Inc. | | | 1,948 | | | | 50 | | | | 0.51 | | |
Futurefuel Corp. | | | 6,979 | | | | 50 | | | | 0.51 | | |
Genworth Financial, Inc., Class A | | | 8,680 | | | | 51 | | | | 0.51 | | |
Geo Group, Inc. | | | 6,756 | | | | 55 | | | | 0.56 | | |
G-Iii Apparel Group Ltd. | | | 2,012 | | | | 50 | | | | 0.51 | | |
Group 1 Automotive, Inc. | | | 187 | | | | 50 | | | | 0.51 | | |
Heidrick & Struggles International,
Inc. | | | 1,994 | | | | 50 | | | | 0.50 | | |
Hibbett, Inc. | | | 1,118 | | | | 53 | | | | 0.54 | | |
Koppers Holdings, Inc. | | | 1,297 | | | | 51 | | | | 0.52 | | |
Millerknoll, Inc. | | | 2,921 | | | | 71 | | | | 0.72 | | |
Mueller Industries, Inc. | | | 675 | | | | 51 | | | | 0.51 | | |
Ovintiv, Inc. | | | 1,069 | | | | 51 | | | | 0.51 | | |
Penn Entertainment, Inc. | | | 2,248 | | | | 52 | | | | 0.52 | | |
Propetro Holding Corp. | | | 4,811 | | | | 51 | | | | 0.52 | | |
Revvity, Inc. | | | 453 | | | | 50 | | | | 0.51 | | |
RPC, Inc. | | | 5,835 | | | | 52 | | | | 0.53 | | |
Ryder System, Inc. | | | 503 | | | | 54 | | | | 0.54 | | |
Sanmina Corp. | | | 917 | | | | 50 | | | | 0.50 | | |
Shoe Carnival, Inc. | | | 2,332 | | | | 56 | | | | 0.57 | | |
Stonex Group, Inc. | | | 535 | | | | 52 | | | | 0.52 | | |
The accompanying notes are an integral part of the consolidated financial statements.
38
Morgan Stanley Institutional Fund Trust
Annual Report — September 30, 2023
Consolidated Portfolio of Investments (cont'd)
Global Strategist Portfolio
Security Description | | Shares | | Value
(000) | | Index Weight | |
JPM SPX1500 Value Custom Basket Index (cont'd) | |
Suncoke Energy, Inc. | | | 5,337 | | | $ | 54 | | | | 0.55 | % | |
Titan International, Inc. | | | 4,194 | | | | 56 | | | | 0.57 | | |
Us Silica Holdings, Inc. | | | 3,649 | | | | 51 | | | | 0.52 | | |
Vista Outdoor, Inc. | | | 1,752 | | | | 58 | | | | 0.59 | | |
Walgreens Boots Alliance, Inc. | | | 2,276 | | | | 51 | | | | 0.51 | | |
Warrior Met Coal, Inc. | | | 1,143 | | | | 58 | | | | 0.59 | | |
Westrock Co. | | | 1,432 | | | | 51 | | | | 0.52 | | |
@ Value/Notional amount is less than $500.
* Cleared swap agreement, the broker is Morgan Stanley & Co. LLC.
AGC Assured Guaranty Corporation.
EMU European Economic and Monetary Union.
FTSE Financial Times Stock Exchange.
ICE Intercontinental Exchange.
IMI Investable Market Index.
KFE Korean Futures Exchange.
MSCI Morgan Stanley Capital International.
REIT Real Estate Investment Trust.
SFE Sydney Futures Exchange.
SGX Singapore Exchange Ltd.
SOFR Secured Overnight Financing Rate.
TSE Toronto Stock Exchange.
AUD — Australian Dollar
BRL — Brazilian Real
CAD — Canadian Dollar
CHF — Swiss Franc
CLP — Chilean Peso
CNH — Chinese Yuan Renminbi Offshore
CNY — Chinese Yuan Renminbi
COP — Colombian Peso
CZK — Czech Koruna
DKK — Danish Krone
EUR — Euro
GBP — British Pound
HKD — Hong Kong Dollar
HUF — Hungarian Forint
IDR — Indonesian Rupiah
ILS — Israeli Shekel
INR — Indian Rupee
JPY — Japanese Yen
KRW — South Korean Won
MXN — Mexican Peso
MYR — Malaysian Ringgit
NOK — Norwegian Krone
NZD — New Zealand Dollar
PEN — Peruvian Nuevo Sol
PLN — Polish Zloty
RON — Romanian New Leu
SEK — Swedish Krona
SGD — Singapore Dollar
THB — Thai Baht
TRY — Turkish Lira
TWD — Taiwan Dollar
USD — United States Dollar
ZAR — South African Rand
Portfolio Composition
Classification | | Percentage of
Total Investments | |
Fixed Income Securities | | | 47.1 | % | |
Common Stocks | | | 36.7 | | |
Short-Term Investments | | | 16.2 | | |
Total Investments | | | 100.0 | %** | |
** Does not include open long/short futures contracts with a value of approximately $166,574,000 and net unrealized appreciation of approximately $484,000. Does not include open foreign currency forward exchange contracts with net unrealized depreciation of approximately $427,000. Also does not include open swap agreements with net unrealized depreciation of approximately $1,685,000.
The accompanying notes are an integral part of the consolidated financial statements.
39
Morgan Stanley Institutional Fund Trust
Annual Report — September 30, 2023
Global Strategist Portfolio
Consolidated Statement of Assets and Liabilities | | September 30, 2023
(000) | |
Assets: | |
Investments in Securities of Unaffiliated Issuers, at Value (Cost $378,537) | | $ | 403,684 | | |
Investment in Security of Affiliated Issuer, at Value (Cost $74,041) | | | 74,041 | | |
Total Investments in Securities, at Value (Cost $452,578) | | | 477,725 | | |
Foreign Currency, at Value (Cost $2,720) | | | 2,487 | | |
Receivable for Fund Shares Sold | | | 35,024 | | |
Unrealized Appreciation on Swap Agreements | | | 5,399 | | |
Due from Broker | | | 4,687 | | |
Receivable for Variation Margin on Futures Contracts | | | 2,588 | | |
Receivable for Investments Sold | | | 1,931 | | |
Interest Receivable | | | 1,929 | | |
Unrealized Appreciation on Foreign Currency Forward Exchange Contracts | | | 523 | | |
Receivable from Affiliate | | | 234 | | |
Tax Reclaim Receivable | | | 224 | | |
Dividends Receivable | | | 142 | | |
Receivable for Variation Margin on Swap Agreements | | | 115 | | |
Other Assets | | | 59 | | |
Total Assets | | | 533,067 | | |
Liabilities: | |
Unrealized Depreciation on Swap Agreements | | | 7,249 | | |
Payable for Investments Purchased | | | 7,207 | | |
Due to Broker | | | 3,252 | | |
Unrealized Depreciation on Foreign Currency Forward Exchange Contracts | | | 950 | | |
Payable for Advisory Fees | | | 535 | | |
Payable to Bank | | | 449 | | |
Payable for Professional Fees | | | 100 | | |
Payable for Custodian Fees | | | 79 | | |
Payable for Fund Shares Redeemed | | | 47 | | |
Payable for Trustees' Fees and Expenses | | | 37 | | |
Payable for Shareholder Services Fees — Class A | | | 28 | | |
Payable for Distribution and Shareholder Services Fees — Class L | | | 6 | | |
Payable for Distribution and Shareholder Services Fees — Class C | | | 1 | | |
Payable for Administration Fees | | | 32 | | |
Payable for Sub Transfer Agency Fees — Class I | | | 2 | | |
Payable for Sub Transfer Agency Fees — Class A | | | 21 | | |
Payable for Sub Transfer Agency Fees — Class L | | | 1 | | |
Payable for Sub Transfer Agency Fees — Class C | | | — | @ | |
Payable for Transfer Agency Fees — Class I | | | 3 | | |
Payable for Transfer Agency Fees — Class A | | | 5 | | |
Payable for Transfer Agency Fees — Class L | | | 1 | | |
Payable for Transfer Agency Fees — Class C | | | 1 | | |
Payable for Transfer Agency Fees — Class R6 | | | 1 | | |
Deferred Capital Gain Country Tax | | | 1 | | |
Other Liabilities | | | 206 | | |
Total Liabilities | | | 20,214 | | |
Net Assets | | $ | 512,853 | | |
Net Assets Consist of: | |
Paid-in-Capital | | $ | 514,204 | | |
| Total Accumulated Loss | | | (1,351 | ) | |
Net Assets | | $ | 512,853 | | |
The accompanying notes are an integral part of the consolidated financial statements.
40
Morgan Stanley Institutional Fund Trust
Annual Report — September 30, 2023
Global Strategist Portfolio
Consolidated Statement of Assets and Liabilities (cont'd) | | September 30, 2023
(000) | |
CLASS I: | |
Net Assets | | $ | 16,888 | | |
| Shares Outstanding (unlimited number of shares authorized, no par value) (not in 000's) | | | 1,100,609 | | |
Net Asset Value, Offering and Redemption Price Per Share | | $ | 15.34 | | |
CLASS A: | |
Net Assets | | $ | 134,213 | | |
| Shares Outstanding (unlimited number of shares authorized, no par value) (not in 000's) | | | 8,878,802 | | |
Net Asset Value, Redemption Price Per Share | | $ | 15.12 | | |
Maximum Sales Load | | | 5.25 | % | |
Maximum Sales Charge | | $ | 0.84 | | |
Maximum Offering Price Per Share | | $ | 15.96 | | |
CLASS L: | |
Net Assets | | $ | 9,768 | | |
| Shares Outstanding (unlimited number of shares authorized, no par value) (not in 000's) | | | 660,480 | | |
Net Asset Value, Offering and Redemption Price Per Share | | $ | 14.79 | | |
CLASS C: | |
Net Assets | | $ | 1,457 | | |
| Shares Outstanding (unlimited number of shares authorized, no par value) (not in 000's) | | | 100,331 | | |
Net Asset Value, Offering and Redemption Price Per Share | | $ | 14.52 | | |
CLASS R6: | |
Net Assets | | $ | 350,527 | | |
| Shares Outstanding (unlimited number of shares authorized, no par value) (not in 000's) | | | 22,830,412 | | |
Net Asset Value, Offering and Redemption Price Per Share | | $ | 15.35 | | |
@ Amount is less than $500.
The accompanying notes are an integral part of the consolidated financial statements.
41
Morgan Stanley Institutional Fund Trust
Annual Report — September 30, 2023
Global Strategist Portfolio
Consolidated Statement of Operations | | Year Ended
September 30, 2023
(000) | |
Investment Income: | |
Interest from Securities of Unaffiliated Issuers (Net of $63 of Foreign Taxes Withheld) | | $ | 7,152 | | |
Dividends from Securities of Unaffiliated Issuers (Net of $292 of Foreign Taxes Withheld) | | | 3,973 | | |
Dividends from Security of Affiliated Issuer (Note G) | | | 2,814 | | |
Total Investment Income | | | 13,939 | | |
Expenses: | |
Advisory Fees (Note B) | | | 2,130 | | |
Shareholder Services Fees — Class A (Note D) | | | 356 | | |
Distribution and Shareholder Services Fees — Class L (Note D) | | | 77 | | |
Distribution and Shareholder Services Fees — Class C (Note D) | | | 18 | | |
Administration Fees (Note C) | | | 379 | | |
Custodian Fees (Note F) | | | 341 | | |
Professional Fees | | | 173 | | |
Pricing Fees | | | 136 | | |
Sub Transfer Agency Fees — Class I | | | 10 | | |
Sub Transfer Agency Fees — Class A | | | 88 | | |
Sub Transfer Agency Fees — Class L | | | 6 | | |
Sub Transfer Agency Fees — Class C | | | 1 | | |
Registration Fees | | | 85 | | |
Transfer Agency Fees — Class I (Note E) | | | 17 | | |
Transfer Agency Fees — Class A (Note E) | | | 29 | | |
Transfer Agency Fees — Class L (Note E) | | | 5 | | |
Transfer Agency Fees — Class C (Note E) | | | 3 | | |
Transfer Agency Fees — Class R6 (Note E) | | | 3 | | |
Shareholder Reporting Fees | | | 36 | | |
Trustees' Fees and Expenses | | | 16 | | |
Other Expenses | | | 37 | | |
Total Expenses | | | 3,946 | | |
Rebate from Morgan Stanley Affiliate (Note G) | | | (108 | ) | |
Reimbursement of Class Specific Expenses — Class I (Note B) | | | (21 | ) | |
Reimbursement of Class Specific Expenses — Class C (Note B) | | | (2 | ) | |
Net Expenses | | | 3,815 | | |
Net Investment Income | | | 10,124 | | |
Realized Gain (Loss): | |
Investments Sold | | | (17,276 | ) | |
Foreign Currency Forward Exchange Contracts | | | (2,210 | ) | |
Foreign Currency Translation | | | (187 | ) | |
Futures Contracts | | | 1,051 | | |
Swap Agreements | | | 11,073 | | |
Net Realized Loss | | | (7,549 | ) | |
Change in Unrealized Appreciation (Depreciation): | |
Investments (Net of Increase in Deferred Capital Gain Country Tax of $1) | | | 45,199 | | |
Foreign Currency Forward Exchange Contracts | | | (1,213 | ) | |
Foreign Currency Translation | | | (123 | ) | |
Futures Contracts | | | (1,030 | ) | |
Swap Agreements | | | 10,357 | | |
Net Change in Unrealized Appreciation (Depreciation) | | | 53,190 | | |
Net Realized Loss and Change in Unrealized Appreciation (Depreciation) | | | 45,641 | | |
Net Increase in Net Assets Resulting from Operations | | $ | 55,765 | | |
The accompanying notes are an integral part of the consolidated financial statements.
42
Morgan Stanley Institutional Fund Trust
Annual Report — September 30, 2023
Global Strategist Portfolio
Consolidated Statements of Changes in Net Assets | | Year Ended
September 30, 2023
(000) | | Year Ended
September 30, 2022
(000) | |
Increase (Decrease) in Net Assets: | |
Operations: | |
Net Investment Income | | $ | 10,124 | | | $ | 5,349 | | |
Net Realized Loss | | | (7,549 | ) | | | (16,648 | ) | |
Net Change in Unrealized Appreciation (Depreciation) | | | 53,190 | | | | (104,098 | ) | |
Net Increase (Decrease) in Net Assets Resulting from Operations | | | 55,765 | | | | (115,397 | ) | |
Dividends and Distributions to Shareholders: | |
Class I | | | (112 | ) | | | (2,005 | ) | |
Class A | | | (771 | ) | | | (13,571 | ) | |
Class L | | | (44 | ) | | | (926 | ) | |
Class C | | | (7 | ) | | | (150 | ) | |
Class R6* | | | (1,669 | ) | | | (23,348 | ) | |
Total Dividends and Distributions to Shareholders | | | (2,603 | ) | | | (40,000 | ) | |
Capital Share Transactions:(1) | |
Class I: | |
Subscribed | | | 2,442 | | | | 7,959 | | |
Distributions Reinvested | | | 111 | | | | 1,989 | | |
Redeemed | | | (5,813 | ) | | | (11,328 | ) | |
Class A: | |
Subscribed | | | 2,101 | | | | 6,232 | | |
Distributions Reinvested | | | 760 | | | | 13,341 | | |
Redeemed | | | (20,524 | ) | | | (20,802 | ) | |
Class L: | |
Exchanged | | | 92 | | | | 155 | | |
Distributions Reinvested | | | 43 | | | | 906 | | |
Redeemed | | | (1,225 | ) | | | (1,016 | ) | |
Class C: | |
Subscribed | | | 132 | | | | 668 | | |
Distributions Reinvested | | | 7 | | | | 150 | | |
Redeemed | | | (660 | ) | | | (608 | ) | |
Class R6:* | |
Subscribed | | | 70,059 | | | | 7,154 | | |
Distributions Reinvested | | | 1,669 | | | | 23,348 | | |
Redeemed | | | (567 | ) | | | (127 | ) | |
Net Increase in Net Assets Resulting from Capital Share Transactions | | | 48,627 | | | | 28,021 | | |
Total Increase (Decrease) in Net Assets | | | 101,789 | | | | (127,376 | ) | |
Net Assets: | |
Beginning of Period | | | 411,064 | | | | 538,440 | | |
End of Period | | $ | 512,853 | | | $ | 411,064 | | |
The accompanying notes are an integral part of the consolidated financial statements.
43
Morgan Stanley Institutional Fund Trust
Annual Report — September 30, 2023
Global Strategist Portfolio
Consolidated Statements of Changes in Net Assets (cont'd) | | Year Ended
September 30, 2023
(000) | | Year Ended
September 30, 2022
(000) | |
(1) Capital Share Transactions: | |
Class I: | |
Shares Subscribed | | | 160 | | | | 461 | | |
Shares Issued on Distributions Reinvested | | | 7 | | | | 113 | | |
Shares Redeemed | | | (383 | ) | | | (684 | ) | |
Net Decrease in Class I Shares Outstanding | | | (216 | ) | | | (110 | ) | |
Class A: | |
Shares Subscribed | | | 141 | | | | 379 | | |
Shares Issued on Distributions Reinvested | | | 51 | | | | 764 | | |
Shares Redeemed | | | (1,366 | ) | | | (1,256 | ) | |
Net Decrease in Class A Shares Outstanding | | | (1,174 | ) | | | (113 | ) | |
Class L: | |
Shares Exchanged | | | 6 | | | | 10 | | |
Shares Issued on Distributions Reinvested | | | 3 | | | | 53 | | |
Shares Redeemed | | | (83 | ) | | | (61 | ) | |
Net Increase (Decrease) in Class L Shares Outstanding | | | (74 | ) | | | 2 | | |
Class C: | |
Shares Subscribed | | | 9 | | | | 41 | | |
Shares Issued on Distributions Reinvested | | | 1 | | | | 9 | | |
Shares Redeemed | | | (46 | ) | | | (37 | ) | |
Net Increase (Decrease) in Class C Shares Outstanding | | | (36 | ) | | | 13 | | |
Class R6:* | |
Shares Subscribed | | | 4,585 | | | | 445 | | |
Shares Issued on Distributions Reinvested | | | 111 | | | | 1,324 | | |
Shares Redeemed | | | (38 | ) | | | (8 | ) | |
Net Increase in Class R6 Shares Outstanding | | | 4,658 | | | | 1,761 | | |
* Effective April 29, 2022, Class IS shares were renamed Class R6 shares.
The accompanying notes are an integral part of the consolidated financial statements.
44
Morgan Stanley Institutional Fund Trust
Annual Report — September 30, 2023
Consolidated Financial Highlights
Global Strategist Portfolio
| | | Class I | |
| | | Year Ended September 30, | |
Selected Per Share Data and Ratios | | 2023 | | 2022 | | 2021 | | 2020 | | 2019 | |
Net Asset Value, Beginning of Period | | $ | 13.58 | | | $ | 18.74 | | | $ | 16.08 | | | $ | 15.45 | | | $ | 17.05 | | |
Income (Loss) from Investment Operations: | |
Net Investment Income(1) | | | 0.34 | | | | 0.19 | | | | 0.16 | | | | 0.17 | | | | 0.27 | | |
Net Realized and Unrealized Gain (Loss) | | | 1.51 | | | | (3.94 | ) | | | 2.73 | | | | 0.74 | | | | 0.17 | | |
Total from Investment Operations | | | 1.85 | | | | (3.75 | ) | | | 2.89 | | | | 0.91 | | | | 0.44 | | |
Distributions from and/or in Excess of: | |
Net Investment Income | | | (0.09 | ) | | | (0.12 | ) | | | (0.22 | ) | | | (0.03 | ) | | | (0.58 | ) | |
Net Realized Gain | | | — | | | | (1.29 | ) | | | (0.01 | ) | | | (0.25 | ) | | | (1.46 | ) | |
Total Distributions | | | (0.09 | ) | | | (1.41 | ) | | | (0.23 | ) | | | (0.28 | ) | | | (2.04 | ) | |
Net Asset Value, End of Period | | $ | 15.34 | | | $ | 13.58 | | | $ | 18.74 | | | $ | 16.08 | | | $ | 15.45 | | |
Total Return(2) | | | 13.72 | % | | | (21.73 | )% | | | 18.10 | % | | | 5.93 | % | | | 3.74 | % | |
Ratios to Average Net Assets and Supplemental Data: | |
Net Assets, End of Period (Thousands) | | $ | 16,888 | | | $ | 17,886 | | | $ | 26,745 | | | $ | 34,031 | | | $ | 57,532 | | |
Ratio of Expenses Before Expense Limitation | | | 0.85 | % | | | 0.83 | % | | | 0.76 | % | | | 0.84 | % | | | 0.84 | % | |
Ratio of Expenses After Expense Limitation | | | 0.72 | %(3) | | | 0.72 | %(3) | | | 0.73 | %(3) | | | 0.72 | %(3) | | | 0.72 | %(3) | |
Ratio of Expenses After Expense Limitation Excluding Interest Expenses | | | N/A | | | | N/A | | | | 0.73 | %(3) | | | N/A | | | | N/A | | |
Ratio of Net Investment Income | | | 2.23 | %(3) | | | 1.13 | %(3) | | | 0.90 | %(3) | | | 1.14 | %(3) | | | 1.80 | %(3) | |
Ratio of Rebate from Morgan Stanley Affiliates | | | 0.02 | % | | | 0.02 | % | | | 0.01 | % | | | 0.02 | % | | | 0.02 | % | |
Portfolio Turnover Rate | | | 91 | % | | | 93 | % | | | 115 | % | | | 109 | % | | | 117 | % | |
(1) Per share amount is based on average shares outstanding.
(2) Calculated based on the net asset value as of the last business day of the period.
(3) The Ratio of Expenses After Expense Limitation and Ratio of Net Investment Income reflect the rebate of certain Fund expenses in connection with the investments in Morgan Stanley affiliates during the period. The effect of the rebate on the ratios is disclosed in the above table as "Ratio of Rebate from Morgan Stanley Affiliates."
The accompanying notes are an integral part of the consolidated financial statements.
45
Morgan Stanley Institutional Fund Trust
Annual Report — September 30, 2023
Consolidated Financial Highlights
Global Strategist Portfolio
| | | Class A | |
| | | Year Ended September 30, | |
Selected Per Share Data and Ratios | | 2023 | | 2022 | | 2021 | | 2020 | | 2019 | |
Net Asset Value, Beginning of Period | | $ | 13.41 | | | $ | 18.53 | | | $ | 15.91 | | | $ | 15.30 | | | $ | 16.90 | | |
Income (Loss) from Investment Operations: | |
Net Investment Income(1) | | | 0.29 | | | | 0.14 | | | | 0.12 | | | | 0.13 | | | | 0.23 | | |
Net Realized and Unrealized Gain (Loss) | | | 1.50 | | | | (3.90 | ) | | | 2.68 | | | | 0.73 | | | | 0.15 | | |
Total from Investment Operations | | | 1.79 | | | | (3.76 | ) | | | 2.80 | | | | 0.86 | | | | 0.38 | | |
Distributions from and/or in Excess of: | |
Net Investment Income | | | (0.08 | ) | | | (0.07 | ) | | | (0.17 | ) | | | — | | | | (0.52 | ) | |
Net Realized Gain | | | — | | | | (1.29 | ) | | | (0.01 | ) | | | (0.25 | ) | | | (1.46 | ) | |
Total Distributions | | | (0.08 | ) | | | (1.36 | ) | | | (0.18 | ) | | | (0.25 | ) | | | (1.98 | ) | |
Net Asset Value, End of Period | | $ | 15.12 | | | $ | 13.41 | | | $ | 18.53 | | | $ | 15.91 | | | $ | 15.30 | | |
Total Return(2) | | | 13.35 | % | | | (21.99 | )% | | | 17.72 | % | | | 5.65 | % | | | 3.38 | % | |
Ratios to Average Net Assets and Supplemental Data: | |
Net Assets, End of Period (Thousands) | | $ | 134,213 | | | $ | 134,814 | | | $ | 188,317 | | | $ | 170,643 | | | $ | 197,271 | | |
Ratio of Expenses Before Expense Limitation | | | 1.04 | % | | | 1.05 | % | | | 1.02 | % | | | 1.08 | % | | | 1.09 | % | |
Ratio of Expenses After Expense Limitation | | | 1.01 | %(3) | | | 1.04 | %(3) | | | 1.01 | %(3) | | | 1.02 | %(3) | | | 1.03 | %(3) | |
Ratio of Expenses After Expense Limitation Excluding Interest Expenses | | | N/A | | | | N/A | | | | 1.01 | %(3) | | | N/A | | | | N/A | | |
Ratio of Net Investment Income | | | 1.93 | %(3) | | | 0.84 | %(3) | | | 0.67 | %(3) | | | 0.87 | %(3) | | | 1.49 | %(3) | |
Ratio of Rebate from Morgan Stanley Affiliates | | | 0.02 | % | | | 0.02 | % | | | 0.01 | % | | | 0.02 | % | | | 0.02 | % | |
Portfolio Turnover Rate | | | 91 | % | | | 93 | % | | | 115 | % | | | 109 | % | | | 117 | % | |
(1) Per share amount is based on average shares outstanding.
(2) Calculated based on the net asset value which does not reflect sales charges, if applicable, as of the last business day of the period.
(3) The Ratio of Expenses After Expense Limitation and Ratio of Net Investment Income reflect the rebate of certain Fund expenses in connection with the investments in Morgan Stanley affiliates during the period. The effect of the rebate on the ratios is disclosed in the above table as "Ratio of Rebate from Morgan Stanley Affiliates."
The accompanying notes are an integral part of the consolidated financial statements.
46
Morgan Stanley Institutional Fund Trust
Annual Report — September 30, 2023
Consolidated Financial Highlights
Global Strategist Portfolio
| | | Class L | |
| | | Year Ended September 30, | |
Selected Per Share Data and Ratios | | 2023 | | 2022 | | 2021 | | 2020 | | 2019 | |
Net Asset Value, Beginning of Period | | $ | 13.17 | | | $ | 18.24 | | | $ | 15.67 | | | $ | 15.15 | | | $ | 16.73 | | |
Income (Loss) from Investment Operations: | |
Net Investment Income(1) | | | 0.21 | | | | 0.05 | | | | 0.03 | | | | 0.05 | | | | 0.15 | | |
Net Realized and Unrealized Gain (Loss) | | | 1.47 | | | | (3.83 | ) | | | 2.64 | | | | 0.72 | | | | 0.16 | | |
Total from Investment Operations | | | 1.68 | | | | (3.78 | ) | | | 2.67 | | | | 0.77 | | | | 0.31 | | |
Distributions from and/or in Excess of: | |
Net Investment Income | | | (0.06 | ) | | | — | | | | (0.09 | ) | | | — | | | | (0.43 | ) | |
Net Realized Gain | | | — | | | | (1.29 | ) | | | (0.01 | ) | | | (0.25 | ) | | | (1.46 | ) | |
Total Distributions | | | (0.06 | ) | | | (1.29 | ) | | | (0.10 | ) | | | (0.25 | ) | | | (1.89 | ) | |
Net Asset Value, End of Period | | $ | 14.79 | | | $ | 13.17 | | | $ | 18.24 | | | $ | 15.67 | | | $ | 15.15 | | |
Total Return(2) | | | 12.69 | % | | | (22.33 | )% | | | 17.09 | % | | | 5.10 | % | | | 2.87 | % | |
Ratios to Average Net Assets and Supplemental Data: | |
Net Assets, End of Period (Thousands) | | $ | 9,768 | | | $ | 9,674 | | | $ | 13,359 | | | $ | 12,773 | | | $ | 13,356 | | |
Ratio of Expenses Before Expense Limitation | | | 1.56 | % | | | 1.56 | % | | | 1.53 | % | | | 1.60 | % | | | 1.58 | % | |
Ratio of Expenses After Expense Limitation | | | 1.54 | %(3) | | | 1.55 | %(3) | | | 1.52 | %(3) | | | 1.54 | %(3) | | | 1.53 | %(3) | |
Ratio of Expenses After Expense Limitation Excluding Interest Expenses | | | N/A | | | | N/A | | | | 1.52 | %(3) | | | N/A | | | | N/A | | |
Ratio of Net Investment Income | | | 1.40 | %(3) | | | 0.34 | %(3) | | | 0.16 | %(3) | | | 0.36 | %(3) | | | 0.97 | %(3) | |
Ratio of Rebate from Morgan Stanley Affiliates | | | 0.02 | % | | | 0.02 | % | | | 0.01 | % | | | 0.02 | % | | | 0.02 | % | |
Portfolio Turnover Rate | | | 91 | % | | | 93 | % | | | 115 | % | | | 109 | % | | | 117 | % | |
(1) Per share amount is based on average shares outstanding.
(2) Calculated based on the net asset value as of the last business day of the period.
(3) The Ratio of Expenses After Expense Limitation and Ratio of Net Investment Income reflect the rebate of certain Fund expenses in connection with the investments in Morgan Stanley affiliates during the period. The effect of the rebate on the ratios is disclosed in the above table as "Ratio of Rebate from Morgan Stanley Affiliates."
The accompanying notes are an integral part of the consolidated financial statements.
47
Morgan Stanley Institutional Fund Trust
Annual Report — September 30, 2023
Consolidated Financial Highlights
Global Strategist Portfolio
| | | Class C | |
| | | Year Ended September 30, | |
Selected Per Share Data and Ratios | | 2023 | | 2022 | | 2021 | | 2020 | | 2019 | |
Net Asset Value, Beginning of Period | | $ | 12.96 | | | $ | 18.02 | | | $ | 15.49 | | | $ | 15.02 | | | $ | 16.65 | | |
Income (Loss) from Investment Operations: | |
Net Investment Income (Loss)(1) | | | 0.16 | | | | 0.02 | | | | (0.02 | ) | | | 0.01 | | | | 0.11 | | |
Net Realized and Unrealized Gain (Loss) | | | 1.45 | | | | (3.79 | ) | | | 2.61 | | | | 0.71 | | | | 0.15 | | |
Total from Investment Operations | | | 1.61 | | | | (3.77 | ) | | | 2.59 | | | | 0.72 | | | | 0.26 | | |
Distributions from and/or in Excess of: | |
Net Investment Income | | | (0.05 | ) | | | — | | | | (0.05 | ) | | | — | | | | (0.43 | ) | |
Net Realized Gain | | | — | | | | (1.29 | ) | | | (0.01 | ) | | | (0.25 | ) | | | (1.46 | ) | |
Total Distributions | | | (0.05 | ) | | | (1.29 | ) | | | (0.06 | ) | | | (0.25 | ) | | | (1.89 | ) | |
Net Asset Value, End of Period | | $ | 14.52 | | | $ | 12.96 | | | $ | 18.02 | | | $ | 15.49 | | | $ | 15.02 | | |
Total Return(2) | | | 12.45 | % | | | (22.62 | )% | | | 16.79 | % | | | 4.81 | % | | | 2.55 | % | |
Ratios to Average Net Assets and Supplemental Data: | |
Net Assets, End of Period (Thousands) | | $ | 1,457 | | | $ | 1,771 | | | $ | 2,236 | | | $ | 1,435 | | | $ | 1,906 | | |
Ratio of Expenses Before Expense Limitation | | | 1.97 | % | | | 1.92 | % | | | 1.90 | % | | | 1.98 | % | | | 1.93 | % | |
Ratio of Expenses After Expense Limitation | | | 1.82 | %(3) | | | 1.82 | %(3) | | | 1.83 | %(3) | | | 1.82 | %(3) | | | 1.82 | %(3) | |
Ratio of Expenses After Expense Limitation Excluding Interest Expenses | | | N/A | | | | N/A | | | | 1.83 | %(3) | | | N/A | | | | N/A | | |
Ratio of Net Investment Income (Loss) | | | 1.13 | %(3) | | | 0.11 | %(3) | | | (0.11 | )%(3) | | | 0.07 | %(3) | | | 0.73 | %(3) | |
Ratio of Rebate from Morgan Stanley Affiliates | | | 0.02 | % | | | 0.02 | % | | | 0.01 | % | | | 0.02 | % | | | 0.02 | % | |
Portfolio Turnover Rate | | | 91 | % | | | 93 | % | | | 115 | % | | | 109 | % | | | 117 | % | |
(1) Per share amount is based on average shares outstanding.
(2) Calculated based on the net asset value which does not reflect sales charges, if applicable, as of the last business day of the period.
(3) The Ratio of Expenses After Expense Limitation and Ratio of Net Investment Income (Loss) reflect the rebate of certain Fund expenses in connection with the investments in Morgan Stanley affiliates during the period. The effect of the rebate on the ratios is disclosed in the above table as "Ratio of Rebate from Morgan Stanley Affiliates."
The accompanying notes are an integral part of the consolidated financial statements.
48
Morgan Stanley Institutional Fund Trust
Annual Report — September 30, 2023
Consolidated Financial Highlights
Global Strategist Portfolio
| | | Class R6(1) | |
| | | Year Ended September 30, | |
Selected Per Share Data and Ratios | | 2023 | | 2022 | | 2021 | | 2020 | | 2019 | |
Net Asset Value, Beginning of Period | | $ | 13.59 | | | $ | 18.75 | | | $ | 16.10 | | | $ | 15.46 | | | $ | 17.06 | | |
Income (Loss) from Investment Operations: | |
Net Investment Income(2) | | | 0.35 | | | | 0.20 | | | | 0.20 | | | | 0.19 | | | | 0.27 | | |
Net Realized and Unrealized Gain (Loss) | | | 1.50 | | | | (3.94 | ) | | | 2.69 | | | | 0.74 | | | | 0.17 | | |
Total from Investment Operations | | | 1.85 | | | | (3.74 | ) | | | 2.89 | | | | 0.93 | | | | 0.44 | | |
Distributions from and/or in Excess of: | |
Net Investment Income | | | (0.09 | ) | | | (0.13 | ) | | | (0.23 | ) | | | (0.04 | ) | | | (0.58 | ) | |
Net Realized Gain | | | — | | | | (1.29 | ) | | | (0.01 | ) | | | (0.25 | ) | | | (1.46 | ) | |
Total Distributions | | | (0.09 | ) | | | (1.42 | ) | | | (0.24 | ) | | | (0.29 | ) | | | (2.04 | ) | |
Net Asset Value, End of Period | | $ | 15.35 | | | $ | 13.59 | | | $ | 18.75 | | | $ | 16.10 | | | $ | 15.46 | | |
Total Return(3) | | | 13.64 | % | | | (21.67 | )% | | | 18.07 | % | | | 6.02 | % | | | 3.77 | % | |
Ratios to Average Net Assets and Supplemental Data: | |
Net Assets, End of Period (Thousands) | | $ | 350,527 | | | $ | 246,919 | | | $ | 307,783 | | | $ | 159,238 | | | $ | 151,242 | | |
Ratio of Expenses Before Expense Limitation | | | 0.70 | % | | | 0.71 | % | | | N/A | | | | 0.75 | % | | | 0.75 | % | |
Ratio of Expenses After Expense Limitation | | | 0.68 | %(4) | | | 0.69 | %(4) | | | 0.68 | %(4) | | | 0.69 | %(4) | | | 0.69 | %(4) | |
Ratio of Expenses After Expense Limitation Excluding Interest Expenses | | | N/A | | | | N/A | | | | 0.68 | %(4) | | | N/A | | | | N/A | | |
Ratio of Net Investment Income | | | 2.26 | %(4) | | | 1.22 | %(4) | | | 1.06 | %(4) | | | 1.21 | %(4) | | | 1.76 | %(4) | |
Ratio of Rebate from Morgan Stanley Affiliates | | | 0.02 | % | | | 0.02 | % | | | 0.01 | % | | | 0.02 | % | | | 0.02 | % | |
Portfolio Turnover Rate | | | 91 | % | | | 93 | % | | | 115 | % | | | 109 | % | | | 117 | % | |
(1) Effective April 29, 2022, Class IS shares were renamed Class R6 shares.
(2) Per share amount is based on average shares outstanding.
(3) Calculated based on the net asset value as of the last business day of the period.
(4) The Ratio of Expenses After Expense Limitation and Ratio of Net Investment Income reflect the rebate of certain Fund expenses in connection with the investments in Morgan Stanley affiliates during the period. The effect of the rebate on the ratios is disclosed in the above table as "Ratio of Rebate from Morgan Stanley Affiliates."
The accompanying notes are an integral part of the consolidated financial statements.
49
Morgan Stanley Institutional Fund Trust
Annual Report — September 30, 2023
Notes to Consolidated Financial Statements
Morgan Stanley Institutional Fund Trust ("Trust") is registered under the Investment Company Act of 1940, as amended (the "Act"), as an open-end management investment company. The Trust is comprised of nine separate, active funds (individually referred to as a "Fund," collectively as the "Funds"). All Funds are considered diversified for purposes of the Act.
The Trust applies investment company accounting and reporting guidance Accounting Standards Codification ("ASC"). In the preparation of these financial statements, management has evaluated subsequent events occurring after the date of the Fund's Consolidated Statement of Assets and Liabilities through the date that the financial statements were issued.
The accompanying consolidated financial statements relate to the Global Strategist Portfolio. The Fund seeks above-average total return over a market cycle of three to five years. The Fund has issued five classes of shares — Class I, Class A, Class L, Class C and Class R6. Effective April 29, 2022, Class IS shares were renamed Class R6 shares.
The Fund has suspended offering Class L shares for sale to all investors. Class L shareholders of the Fund do not have the option of purchasing additional Class L shares. However, existing Class L shareholders may invest in additional Class L shares through reinvestment of dividends and distributions. In addition, Class L shares of the Fund may be exchanged for Class L shares of any Morgan Stanley Multi-Class Fund, even though Class L shares are closed to investors.
A. Significant Accounting Policies: The following significant accounting policies are in conformity with U.S. generally accepted accounting principles ("GAAP"). Such policies are consistently followed by the Trust in the preparation of its consolidated financial statements. GAAP may require management to make estimates and assumptions that affect the reported amounts and disclosures in the consolidated financial statements. Actual results may differ from those estimates.
The Fund may invest up to 25% of its total assets in a wholly-owned subsidiary of the Fund organized as a company under the laws of the Cayman Islands, Global Strategist Cayman Portfolio, Ltd. (the "Subsidiary"). The Subsidiary may invest, directly or indirectly through the use of derivatives, in securities, commodities, commodity related instruments and other investments, primarily futures, swaps and notes. The Fund is the sole shareholder of the Subsidiary, and it is not currently expected that shares of the Subsidiary will be sold or offered to other investors. The consolidated portfolio of investments and
consolidated financial statements include the positions and accounts of the Fund and the Subsidiary. All intercompany accounts and transactions of the Fund and the Subsidiary have been eliminated in consolidation and all accounting policies of the Subsidiary are consistent with those of the Fund. As of September 30, 2023, the Subsidiary represented approximately $50,117,000 or approximately 9.77% of the total net assets of the Fund.
Investments in the Subsidiary are expected to provide the Fund with exposure to the commodity markets within the limitations of Subchapter M of the Code and recent Internal Revenue Service ("IRS") revenue rulings, which require that a mutual fund receive no more than ten percent of its gross income from such investments in order to receive favorable tax treatment as a regulated investment company ("RIC"). Tax treatment of the income received from the Subsidiary may potentially be affected by changes in legislation, regulations or other legally binding authority, which could affect the character, timing and amount of the Fund's taxable income and distributions. If such changes occur, the Fund may need to significantly change its investment strategy and recognize unrealized gains in order to remain qualified for taxation as a RIC, which could adversely affect the Fund.
1. Security Valuation: (1) Fixed income securities may be valued by an outside pricing service/vendor approved by the Trust's Board of Trustees (the "Trustees"). The pricing service/vendor may employ a pricing model that takes into account, among other things, bids, yield spreads and/or other market data and specific security characteristics. If Morgan Stanley Investment Management Inc. (the "Adviser") or Morgan Stanley Investment Management Limited ("MSIM Limited") (the "Sub-Adviser"), each a wholly-owned subsidiary of Morgan Stanley, determines that the price provided by the outside pricing service/vendor does not reflect the security's fair value or is unable to provide a price, prices from brokers/dealers may also be utilized. In these circumstances, the value of the security will be the mean of bid and asked prices obtained from reputable brokers/dealers; (2) an equity portfolio security listed or traded on an exchange is valued at its latest reported sales price (or at the exchange official closing price if such exchange reports an official closing price), and if there were no sales on a given day and if there is no official exchange closing price for that day, the security is valued at the mean between the last reported bid and asked prices if such bid and asked prices are available on the relevant exchanges. If only bid prices are available then the latest bid
50
Morgan Stanley Institutional Fund Trust
Annual Report — September 30, 2023
Notes to Consolidated Financial Statements (cont'd)
price may be used. Listed equity securities not traded on the valuation date with no reported bid and asked prices available on the exchange are valued at the mean between the current bid and asked prices obtained from one or more reputable brokers/dealers. In cases where a security is traded on more than one exchange, the security is valued on the exchange designated as the primary market; (3) all other equity portfolio securities for which over-thecounter ("OTC") market quotations are readily available are valued at the latest reported sales price (or at the market official closing price if such market reports an official closing price), and if there was no trading in the security on a given day and if there is no official closing price from relevant markets for that day, the security is valued at the mean between the last reported bid and asked prices if such bid and asked prices are available on the relevant markets. An unlisted equity security that does not trade on the valuation date and for which bid and asked prices from the relevant markets are unavailable is valued at the mean between the current bid and asked prices obtained from one or more reputable brokers/dealers; (4) futures are valued at the settlement price on the exchange on which they trade or, if a settlement price is unavailable, at the last sale price on the exchange; (5) OTC swaps may be valued by an outside pricing service approved by the Trustees or quotes from a broker/dealer. Swaps cleared on a clearinghouse or exchange may be valued using the closing price provided by the clearinghouse or exchange. Total return swaps may also be fair valued using direct accrual/return calculations if prices on the reference asset on the total return leg of the swap are available from a pricing service/vendor for such instrument. In the event that the reference asset on the total return leg of the swap is a benchmark index, then price of such reference asset may be obtained from a pricing service provider or from the benchmark index sponsor; (6) when market quotations are not readily available, as defined by Rule 2a-5 under the Act, including circumstances under which the Adviser or the Sub-Adviser determines that the closing price, last sale price or the mean between the last reported bid and asked prices are not reflective of a security's market value, portfolio securities are valued at their fair value as determined in good faith under procedures approved by and under the general supervision of the Trustees. Occasionally, developments affecting the closing prices of securities and other assets may occur between the times at which valuations of such securities are determined (that is, close of the foreign
market on which the securities trade) and the close of business of the New York Stock Exchange ("NYSE"). If developments occur during such periods that are expected to materially affect the value of such securities, such valuations may be adjusted to reflect the estimated fair value of such securities as of the close of the NYSE, as determined in good faith by the Trustees or by the Adviser using a pricing service and/or procedures approved by the Trustees; (7) foreign exchange transactions ("spot contracts") and foreign exchange forward contracts ("forward contracts") are valued daily using an independent pricing vendor at the spot and forward rates, respectively, as of the close of the NYSE; and (8) investments in mutual funds, including the Morgan Stanley Institutional Liquidity Funds, are valued at the net asset value ("NAV") as of the close of each business day.
In connection with Rule 2a-5 of the Act, the Trustees have designated the Trust's Adviser as its valuation designee. The valuation designee has responsibility for determining fair value and to make the actual calculations pursuant to the fair valuation methodologies previously approved by the Trustees. Under procedures approved by the Trustees, the Trust's Adviser, as valuation designee, has formed a Valuation Committee whose members are approved by the Trustees. The Valuation Committee provides administration and oversight of the Trust's valuation policies and procedures, which are reviewed at least annually by the Trustees. These procedures allow the Trust to utilize independent pricing services, quotations from securities and financial instrument dealers and other market sources to determine fair value.
2. Fair Value Measurement: Financial Accounting Standards Board ("FASB") ASC 820, "Fair Value Measurement" ("ASC 820"), defines fair value as the price that would be received to sell an asset or pay to transfer a liability in an orderly transaction between market participants at the measurement date. ASC 820 establishes a three-tier hierarchy to distinguish between (1) inputs that reflect the assumptions market participants would use in valuing an asset or liability developed based on market data obtained from sources independent of the reporting entity (observable inputs) and (2) inputs that reflect the reporting entity's own assumptions about the assumptions market participants would use in valuing an asset or liability developed based on the best information available in the circumstances (unobservable inputs) and to establish classification of fair value measurements for disclosure
51
Morgan Stanley Institutional Fund Trust
Annual Report — September 30, 2023
Notes to Consolidated Financial Statements (cont'd)
purposes. Various inputs are used in determining the value of the Fund's investments. The inputs are summarized in the three broad levels listed below:
• Level 1 – unadjusted quoted prices in active markets for identical investments
• Level 2 – other significant observable inputs (including quoted prices for similar investments, interest rates, prepayment speeds, credit risk, etc.)
• Level 3 – significant unobservable inputs including the Fund's own assumptions in determining the fair value of investments. Factors considered in making this determination may include, but are not limited to, information obtained by contacting the issuer, analysts, or the appropriate stock exchange (for exchange-traded securities), analysis of the issuer's financial statements or other available documents and, if necessary, available information concerning other securities in similar circumstances.
The inputs or methodology used for valuing securities are not necessarily an indication of the risk associated with investing in those securities and the determination of the significance of a particular input to the fair value measurement in its entirety requires judgment and considers factors specific to each security.
The following is a summary of the inputs used to value the Fund's investments as of September 30, 2023:
Investment Type | | Level 1
Unadjusted
quoted
prices
(000) | | Level 2
Other
significant
observable
inputs
(000) | | Level 3
Significant
unobservable
inputs
(000) | | Total
(000) | |
Assets: | |
Fixed Income Securities | |
Agency Fixed Rate
Mortgages | | $ | — | | | $ | 18,320 | | | $ | — | | | $ | 18,320 | | |
Asset-Backed Securities | | | — | | | | 1,156 | | | | — | | | | 1,156 | | |
Commercial
Mortgage-Backed
Securities | | | — | | | | 2,261 | | | | — | | | | 2,261 | | |
Corporate Bonds | | | — | | | | 40,188 | | | | — | | | | 40,188 | | |
Mortgages — Other | | | — | | | | 5,949 | | | | — | | | | 5,949 | | |
Municipal Bond | | | — | | | | 230 | | | | — | | | | 230 | | |
Sovereign | | | — | | | | 126,309 | | | | — | | | | 126,309 | | |
Supranational | | | — | | | | 5,713 | | | | — | | | | 5,713 | | |
U.S. Treasury Securities | | | — | | | | 25,105 | | | | — | | | | 25,105 | | |
Total Fixed Income
Securities | | | — | | | | 225,231 | | | | — | | | | 225,231 | | |
Investment Type | | Level 1
Unadjusted
quoted
prices
(000) | | Level 2
Other
significant
observable
inputs
(000) | | Level 3
Significant
unobservable
inputs
(000) | | Total
(000) | |
Common Stocks | |
Aerospace & Defense | | $ | 1,687 | | | $ | 1,174 | | | $ | — | | | $ | 2,861 | | |
Air Freight & Logistics | | | 579 | | | | 353 | | | | — | | | | 932 | | |
Automobile Components | | | 194 | | | | 149 | | | | — | | | | 343 | | |
Automobiles | | | 2,407 | | | | 1,108 | | | | — | | | | 3,515 | | |
Banks | | | 5,069 | | | | 10,770 | | | | — | | | | 15,839 | | |
Beverages | | | 1,774 | | | | 1,098 | | | | — | | | | 2,872 | | |
Biotechnology | | | 2,524 | | | | 622 | | | | — | | | | 3,146 | | |
Broadline Retail | | | 3,717 | | | | 471 | | | | — | | | | 4,188 | | |
Building Products | | | 637 | | | | 432 | | | | — | | | | 1,069 | | |
Capital Markets | | | 3,269 | | | | 1,724 | | | | — | | | | 4,993 | | |
Chemicals | | | 1,940 | | | | 1,595 | | | | — | | | | 3,535 | | |
Commercial Services &
Supplies | | | 714 | | | | 186 | | | | — | | | | 900 | | |
Communications
Equipment | | | 948 | | | | 160 | | | | — | | | | 1,108 | | |
Construction &
Engineering | | | 193 | | | | 472 | | | | — | | | | 665 | | |
Construction Materials | | | 335 | | | | 271 | | | | — | | | | 606 | | |
Consumer Finance | | | 497 | | | | — | | | | — | | | | 497 | | |
Consumer Staples
Distribution & Retail | | | 2,278 | | | | 638 | | | | — | | | | 2,916 | | |
Containers & Packaging | | | 296 | | | | 73 | | | | — | | | | 369 | | |
Distributors | | | 136 | | | | 17 | | | | — | | | | 153 | | |
Diversified Consumer
Services | | | — | | | | 49 | | | | — | | | | 49 | | |
Diversified REITs | | | 198 | | | | 428 | | | | — | | | | 626 | | |
Diversified
Telecommunication
Services | | | 749 | | | | 1,063 | | | | — | | | | 1,812 | | |
Electric Utilities | | | 1,650 | | | | 805 | | | | — | | | | 2,455 | | |
Electrical Equipment | | | 678 | | | | 982 | | | | — | | | | 1,660 | | |
Electronic Equipment,
Instruments &
Components | | | 638 | | | | 131 | | | | — | | | | 769 | | |
Energy Equipment &
Services | | | 446 | | | | 35 | | | | — | † | | | 481 | † | |
Entertainment | | | 1,549 | | | | 128 | | | | — | | | | 1,677 | | |
Financial Services | | | 4,286 | | | | 672 | | | | — | | | | 4,958 | | |
Food Products | | | 1,050 | | | | 2,022 | | | | — | | | | 3,072 | | |
Gas Utilities | | | 82 | | | | 146 | | | | — | | | | 228 | | |
Ground Transportation | | | 1,787 | | | | 50 | | | | — | | | | 1,837 | | |
Health Care | | | 207 | | | | — | | | | — | | | | 207 | | |
Health Care Equipment &
Supplies | | | 2,701 | | | | 969 | | | | — | | | | 3,670 | | |
Health Care Providers &
Services | | | 3,048 | | | | 204 | | | | — | | | | 3,252 | | |
Health Care Technology | | | 86 | | | | — | | | | — | | | | 86 | | |
Hotel & Resort REITs | | | 33 | | | | — | | | | — | | | | 33 | | |
Hotels, Restaurants &
Leisure | | | 2,429 | | | | 1,019 | † | | | — | | | | 3,448 | † | |
Household Durables | | | 364 | | | | 102 | | | | — | | | | 466 | | |
Household Products | | | 1,375 | | | | 390 | | | | — | | | | 1,765 | | |
Independent Power &
Renewable Electricity
Producers | | | 94 | | | | 148 | | | | — | | | | 242 | | |
Independent Power
Producers & Energy
Traders | | | — | | | | 8 | | | | — | | | | 8 | | |
Industrial Conglomerates | | | 846 | | | | 747 | | | | — | | | | 1,593 | | |
Industrial REITs | | | 297 | | | | 225 | | | | — | | | | 522 | | |
52
Morgan Stanley Institutional Fund Trust
Annual Report — September 30, 2023
Notes to Consolidated Financial Statements (cont'd)
Investment Type | | Level 1
Unadjusted
quoted
prices
(000) | | Level 2
Other
significant
observable
inputs
(000) | | Level 3
Significant
unobservable
inputs
(000) | | Total
(000) | |
Common Stocks (cont'd) | |
Information Technology
Services | | $ | 1,994 | | | $ | 151 | | | $ | — | | | $ | 2,145 | | |
Insurance | | | 3,029 | | | | 2,986 | | | | — | | | | 6,015 | | |
Interactive Media &
Services | | | 6,382 | | | | 116 | | | | — | | | | 6,498 | | |
Investment Company | | | — | | | | — | † | | | — | | | | — | † | |
Leisure Products | | | 38 | | | | — | | | | — | | | | 38 | | |
Life Sciences Tools &
Services | | | 1,661 | | | | 319 | | | | — | | | | 1,980 | | |
Machinery | | | 1,932 | | | | 1,291 | | | | — | | | | 3,223 | | |
Marine Transportation | | | — | | | | 150 | | | | — | | | | 150 | | |
Media | | | 972 | | | | 220 | | | | — | | | | 1,192 | | |
Metals & Mining | | | 1,150 | | | | 2,222 | † | | | — | | | | 3,372 | † | |
Multi-Utilities | | | 670 | | | | 609 | | | | — | | | | 1,279 | | |
Office REITs | | | 71 | | | | 55 | | | | — | | | | 126 | | |
Oil, Gas & Consumable
Fuels | | | 6,237 | | | | 3,222 | | | | — | | | | 9,459 | | |
Paper & Forest Products | | | 20 | | | | 215 | | | | — | | | | 235 | | |
Passenger Airlines | | | 40 | | | | 64 | | | | — | | | | 104 | | |
Personal Care Products | | | 95 | | | | 1,230 | | | | — | | | | 1,325 | | |
Pharmaceuticals | | | 4,433 | | | | 5,656 | | | | — | | | | 10,089 | | |
Professional Services | | | 1,108 | | | | 863 | | | | — | | | | 1,971 | | |
Real Estate Management &
Development | | | 112 | | | | 505 | | | | — | | | | 617 | | |
Residential REITs | | | 444 | | | | — | | | | — | | | | 444 | | |
Retail | | | 258 | | | | 213 | | | | — | | | | 471 | | |
Semiconductors &
Semiconductor
Equipment | | | 7,949 | | | | 1,550 | | | | — | | | | 9,499 | | |
Software | | | 11,644 | | | | 977 | | | | — | | | | 12,621 | | |
Specialized REITs | | | 938 | | | | — | | | | — | | | | 938 | | |
Specialty Retail | | | 2,357 | | | | 322 | | | | — | | | | 2,679 | | |
Tech Hardware, Storage &
Peripherals | | | 8,144 | | | | 52 | | | | — | | | | 8,196 | | |
Textiles, Apparel & Luxury
Goods | | | 542 | | | | 2,054 | | | | — | | | | 2,596 | | |
Tobacco | | | 633 | | | | 402 | | | | — | | | | 1,035 | | |
Trading Companies &
Distributors | | | 479 | | | | 307 | | | | — | | | | 786 | | |
Transportation
Infrastructure | | | — | | | | 244 | | | | — | | | | 244 | | |
Water Utilities | | | 92 | | | | 71 | | | | — | | | | 163 | | |
Wireless
Telecommunication
Services | | | 306 | | | | 120 | | | | — | | | | 426 | | |
Total Common Stocks | | | 117,517 | | | | 57,822 | † | | | — | † | | | 175,339 | † | |
Warrants | | | 1 | | | | — | | | | — | | | | 1 | | |
Short-Term Investments | |
Investment Company | | | 74,041 | | | | — | | | | — | | | | 74,041 | | |
U.S. Treasury Securities | | | — | | | | 3,113 | | | | — | | | | 3,113 | | |
Total Short-Term
Investments | | | 74,041 | | | | 3,113 | | | | — | | | | 77,154 | | |
Foreign Currency
Forward Exchange
Contracts | | | — | | | | 523 | | | | — | | | | 523 | | |
Futures Contracts | | | 2,073 | | | | — | | | | — | | | | 2,073 | | |
Interest Rate Swap
Agreements | | | — | | | | 165 | | | | — | | | | 165 | | |
Total Return Swap
Agreements | | | — | | | | 5,399 | | | | — | | | | 5,399 | | |
Total Assets | | | 193,632 | | | | 292,253 | † | | | — | † | | | 485,885 | † | |
Investment Type | | Level 1
Unadjusted
quoted
prices
(000) | | Level 2
Other
significant
observable
inputs
(000) | | Level 3
Significant
unobservable
inputs
(000) | | Total
(000) | |
Liabilities: | |
Foreign Currency Forward
Exchange
Contracts | | $ | — | | | $ | (950 | ) | | $ | — | | | $ | (950 | ) | |
Futures Contracts | | | (1,589 | ) | | | — | | | | — | | | | (1,589 | ) | |
Total Return Swap
Agreements | | | — | | | | (7,249 | ) | | | — | | | | (7,249 | ) | |
Total Liabilities | | | (1,589 | ) | | | (8,199 | ) | | | — | | | | (9,788 | ) | |
Total | | $ | 192,043 | | | $ | 284,054 | † | | $ | — | † | | $ | 476,097 | † | |
† Includes one or more securities valued at zero.
Transfers between investment levels may occur as the markets fluctuate and/or the availability of data used in an investment's valuation changes.
Following is a reconciliation of investments in which significant unobservable inputs (Level 3) were used in determining fair value:
| | | Fixed
Income
(000) | | Common
Stock
(000) | |
Beginning Balance | | $ | 59 | | | $ | — | † | |
Purchases | | | — | | | | — | | |
Sales | | | (59 | ) | | | — | | |
Transfers in | | | — | | | | — | | |
Transfers out | | | — | | | | — | | |
Corporate actions | | | — | | | | — | | |
Change in unrealized appreciation (depreciation) | | | — | | | | — | | |
Realized gains (losses) | | | — | | | | — | | |
Ending Balance | | $ | — | | | $ | — | † | |
Net change in unrealized appreciation
(depreciation) from investments still
held as of September 30, 2023 | | $ | — | | | $ | — | | |
† Includes a security valued at zero.
3. Foreign Currency Translation and Foreign Investments: The books and records of the Fund are maintained in U.S. dollars. Foreign currency amounts are translated into U.S. dollars as follows:
– investments, other assets and liabilities at the prevailing rate of exchange on the valuation date;
– investment transactions and investment income at the prevailing rates of exchange on the dates of such transactions.
Although the net assets of the Fund are presented at the foreign exchange rates and market values at the close of
53
Morgan Stanley Institutional Fund Trust
Annual Report — September 30, 2023
Notes to Consolidated Financial Statements (cont'd)
the period, the Fund does not isolate that portion of the results of operations arising as a result of changes in the foreign exchange rates from the fluctuations arising from changes in the market prices of securities held at period end. Similarly, the Fund does not isolate the effect of changes in foreign exchange rates from the fluctuations arising from changes in the market prices of securities sold during the period. Accordingly, realized and unrealized foreign currency gains (losses) on investments in securities are included in the reported net realized and unrealized gains (losses) on investment transactions and balances. However, pursuant to U.S. federal income tax regulations, gains and losses from certain foreign currency transactions and the foreign currency portion of gains and losses realized on sales and maturities of foreign denominated debt securities are treated as ordinary income for U.S. federal income tax purposes.
Net realized gains (losses) on foreign currency transactions represent net foreign exchange gains (losses) from foreign currency forward exchange contracts, disposition of foreign currencies, currency gains (losses) realized between the trade and settlement dates on securities transactions, and the difference between the amount of investment income and foreign withholding taxes recorded on the Fund's books and the U.S. dollar equivalent amounts actually received or paid. The change in unrealized currency gains (losses) on foreign currency transactions for the period is reflected in the Consolidated Statement of Operations.
Foreign security and currency transactions may involve certain considerations and risks not typically associated with those of U.S. dollar denominated transactions as a result of, among other factors, fluctuations of exchange rates in relation to the U.S. dollar, the possibility of lower levels of governmental supervision and regulation of foreign securities markets and the possibility of political or economic instability.
Governmental approval for foreign investments may be required in advance of making an investment under certain circumstances in some countries, and the extent of foreign investments in U.S. companies may be subject to limitation in other countries. Foreign ownership limitations also may be imposed by the charters of individual companies to prevent, among other concerns, violations of foreign investment limitations. As a result,
an additional class of shares (identified as "Foreign" in the Consolidated Portfolio of Investments) may be created and offered for investment. The "local" and "foreign shares" market values may differ. In the absence of trading of the foreign shares in such markets, the Fund values the foreign shares at the closing exchange price of the local shares.
4. Derivatives: The Fund may, but is not required to, use derivative instruments for a variety of purposes, including hedging, risk management, portfolio management or to earn income. Derivatives are financial instruments whose value is based, in part, on the value of an underlying asset, interest rate, index or financial instrument. Prevailing interest rates and volatility levels, among other things, also affect the value of derivative instruments. A derivative instrument often has risks similar to its underlying asset and may have additional risks, including imperfect correlation between the value of the derivative and the underlying asset, risks of default by the counterparty to certain transactions, magnification of losses incurred due to changes in the market value of the securities, instruments, indices or interest rates to which the derivative instrument relates, risks that the transactions may not be liquid, risks arising from margin and payment requirements, risks arising from mispricing or valuation complexity and operational and legal risks. The use of derivatives involves risks that are different from, and possibly greater than, the risks associated with other portfolio investments. Derivatives may involve the use of highly specialized instruments that require investment techniques and risk analyses different from those associated with other portfolio investments. All of the Fund's holdings, including derivative instruments, are marked-to-market each day with the change in value reflected in unrealized appreciation (depreciation). Upon disposition, a realized gain or loss is recognized.
Certain derivative transactions may give rise to a form of leverage. Leverage magnifies the potential for gain and the risk of loss. Leverage associated with derivative transactions may cause the Fund to liquidate portfolio positions when it may not be advantageous to do so to satisfy its obligations or may cause the Fund to be more volatile than if the Fund had not been leveraged. Although the Adviser seeks to use derivatives to further the Fund's investment objectives, there is no assurance that the use of derivatives will achieve this result.
54
Morgan Stanley Institutional Fund Trust
Annual Report — September 30, 2023
Notes to Consolidated Financial Statements (cont'd)
Following is a description of the derivative instruments and techniques that the Fund used during the period and their associated risks:
Foreign Currency Forward Exchange Contracts: In connection with its investments in foreign securities, the Fund also entered into contracts with banks, brokers/dealers to purchase or sell foreign currencies at a future date. A foreign currency forward exchange contract ("currency contract") is a negotiated agreement between the contracting parties to exchange a specified amount of currency at a specified future time at a specified rate. The rate can be higher or lower than the spot rate between the currencies that are the subject of the contract. Currency contracts may be used to protect against uncertainty in the level of future foreign currency exchange rates or to gain or modify exposure to a particular currency. In addition, the Fund may use cross currency hedging or proxy hedging with respect to currencies in which the Fund has or expects to have portfolio or currency exposure. Cross currency hedges involve the sale of one currency against the positive exposure to a different currency and may be used for hedging purposes or to establish an active exposure to the exchange rate between any two currencies. To the extent hedged by the use of currency contracts, the precise matching of the currency contract amounts and the value of the securities involved will not generally be possible because the future value of such securities in foreign currencies will change as a consequence of market movements in the value of those securities between the date on which the contract is entered into and the date it matures. Furthermore, such transactions may reduce or preclude the opportunity for gain if the value of the currency should move in the direction opposite to the position taken. There is additional risk to the extent that currency contracts create exposure to currencies in which the Fund's securities are not denominated. Unanticipated changes in currency prices may result in poorer overall performance for the Fund than if it had not entered into such contracts. The use of currency contracts involves the risk of loss from the insolvency or bankruptcy of the counterparty to the contract or the failure of the counterparty to make payments or otherwise comply with the terms of the contract. A currency contract is marked-to-market daily and the change in market value is recorded by the Fund as unrealized gain or loss. The Fund records realized gains (losses) when the currency contract is closed equal to the difference between the
value of the currency contract at the time it was opened and the value at the time it was closed.
Futures: A futures contract is a standardized, exchange-traded agreement to buy or sell a specific quantity of an underlying asset, reference rate or index at a specific price at a specific future time. The value of a futures contract tends to increase and decrease in tandem with the value of the underlying instrument. Depending on the terms of the particular contract, futures contracts are settled through either physical delivery of the underlying instrument on the settlement date or by payment of a cash settlement amount on the settlement date. During the period the futures contract is open, payments are received from or made to the broker based upon changes in the value of the contract (the variation margin). A decision as to whether, when and how to use futures contracts involves the exercise of skill and judgment and even a well-conceived futures transaction may be unsuccessful because of market behavior or unexpected events. In addition to the derivatives risks discussed above, the prices of futures contracts can be highly volatile, using futures contracts can lower total return and the potential loss from futures contracts can exceed the Fund's initial investment in such contracts. No assurance can be given that a liquid market will exist for any particular futures contract at any particular time.
Swaps: The Fund may enter into OTC swap contracts or cleared swap transactions. A swap contract is an agreement between two parties pursuant to which the parties exchange payments at specified dates on the basis of a specified notional amount, with the payments calculated by reference to specified securities, indices, reference rates, currencies or other instruments. Typically swap agreements provide that when the period payment dates for both parties are the same, the payments are made on a net basis (i.e., the two payment streams are netted out, with only the net amount paid by one party to the other). The Fund's obligations or rights under a swap contract entered into on a net basis will generally be equal only to the net amount to be paid or received under the agreement, based on the relative values of the positions held by each party. Cleared swap transactions may help reduce counterparty credit risk. In a cleared swap, the Fund's ultimate counterparty is a clearinghouse rather than a swap dealer, bank or other financial institution. OTC swap agreements are not entered into or traded on exchanges and often there is no central clearing or guaranty function for OTC swaps. These
55
Morgan Stanley Institutional Fund Trust
Annual Report — September 30, 2023
Notes to Consolidated Financial Statements (cont'd)
OTC swaps are often subject to credit risk or the risk of default or non-performance by the counterparty. Both OTC and cleared swaps could result in losses if interest rates, foreign currency exchange rates or other factors are not correctly anticipated by the Fund or if the reference index, security or investments do not perform as expected. During the period swap agreements are open, payments are received from or made to the counterparty or clearing-house based on changes in the value of the contract or variation margin, respectively. The Dodd-Frank Wall Street Reform and Consumer Protection Act and related regulatory developments require the clearing and exchange-trading of certain standardized swap transactions. Mandatory exchange-trading and clearing is occurring on a phased-in basis based on the type of market participant and U.S. Commodities Futures Trading Commission ("CFTC") approval of contracts for central clearing and exchange trading.
The Fund may enter into total return swaps in which one party agrees to make periodic payments to another party based on the change in market value of the assets underlying the contract, which may include, but not be limited to, a specified security, basket of securities or securities indices during the specified period, in return for periodic payments based on a fixed or variable interest rate or the total return from other underlying assets. Total return swaps may be used to obtain long or short exposure to a security or market without owning or taking physical custody of such security or investing directly in such market. Total return swaps may effectively add leverage to the Fund's portfolio because, in addition to its total net assets, the Fund would be subject to investment exposure on the notional amount of the swap. Total return swaps are subject to the risk that a counterparty will default on its payment obligations to the Fund thereunder, and conversely, that the Fund will not be able to meet its obligation to the counterparty.
The Fund may enter into interest rate swaps which is an agreement between two parties to exchange their respective commitments to pay or receive interest. Interest rate swaps are generally entered into on a net basis. Interest rate swaps do not involve the delivery of securities, other underlying assets, or principal. Accordingly, the risk of market loss with respect to interest rate swaps is typically limited to the net amount of interest payments that the Fund is contractually obligated to make.
When the Fund has an unrealized loss on a swap agreement, the Fund has instructed the custodian to pledge
cash or liquid securities as collateral with a value approximately equal to the amount of the unrealized loss. Collateral pledges are monitored and subsequently adjusted if and when the swap valuations fluctuate. If applicable, cash collateral is included with "Due from (to) Broker" in the Consolidated Statement of Assets and Liabilities.
Upfront payments paid or received by the Fund will be reflected as an asset or liability, respectively, in the Consolidated Statement of Assets and Liabilities.
FASB ASC 815, "Derivatives and Hedging" ("ASC 815"), is intended to improve financial reporting about derivative instruments by requiring enhanced disclosures to enable investors to better understand how and why the Fund uses derivative instruments, how these derivative instruments are accounted for and their effects on the Fund's financial position and results of operations.
The following tables set forth the fair value of the Fund's derivative contracts by primary risk exposure as of September 30, 2023:
| | | Asset Derivatives
Consolidated Statement of
Assets and
Liabilities Location | | Primary Risk
Exposure | | Value
(000) | |
Foreign Currency
Forward Exchange
Contracts | | Unrealized Appreciation on
Foreign Currency Forward
Exchange Contracts | |
Currency Risk | | $ | 523 | | |
Futures Contracts
| | Variation Margin on
Futures Contracts | | Commodity Risk | | | 751 | (a) | |
Futures Contracts
| | Variation Margin on
Futures Contracts | | Equity Risk | | | 23 | (a) | |
Futures Contracts
| | Variation Margin on
Futures Contracts | | Interest Rate Risk | | | 1,299 | (a) | |
Swap Agreements
| | Variation Margin on
Swap Agreements | | Interest Rate Risk | | | 165 | (a) | |
Swap Agreements
| | Unrealized Appreciation on
Swap Agreements | | Equity Risk | | | 5,399 | | |
Total | | | | | | $ | 8,160 | | |
| | | Liability Derivatives
Consolidated Statement of
Assets and
Liabilities Location | | Primary Risk
Exposure | | Value
(000) | |
Foreign Currency
Forward Exchange
Contracts | | Unrealized Depreciation on
Foreign Currency Forward
Exchange Contracts | |
Currency Risk | | $ | (950 | ) | |
Futures Contracts
| | Variation Margin on
Futures Contracts | | Equity Risk | | | (160 | )(a) | |
Futures Contracts
| | Variation Margin on
Futures Contracts | | Interest Rate Risk | | | (1,429 | )(a) | |
Swap Agreements
| | Unrealized Depreciation on
Swap Agreements | | Equity Risk | | | (7,249 | ) | |
Total | | | | | | $ | (9,788 | ) | |
(a) This amount represents the cumulative appreciation (depreciation) as reported in the Consolidated Portfolio of Investments. The Consolidated Statement of Assets and Liabilities only reflects the current day's net variation margin.
56
Morgan Stanley Institutional Fund Trust
Annual Report — September 30, 2023
Notes to Consolidated Financial Statements (cont'd)
The following tables set forth by primary risk exposure the Fund's realized gains (losses) and change in unrealized appreciation (depreciation) by type of derivative contract for the year ended September 30, 2023 in accordance with ASC 815:
Realized Gain (Loss) | |
Primary Risk Exposure | | Derivative Type | | Value
(000) | |
Currency Risk | | Foreign Currency Forward
Exchange Contracts | | $ | (2,210 | ) | |
Commodity Risk | | Futures Contracts | | | (87 | ) | |
Equity Risk | | Futures Contracts | | | 706 | | |
Interest Rate Risk | | Futures Contracts | | | 582 | | |
Currency Risk | | Futures Contracts | | | (150 | ) | |
Equity Risk | | Swap Agreements | | | 14,506 | | |
Interest Rate Risk | | Swap Agreements | | | (3,433 | ) | |
Total | | | | $ | 9,914 | | |
Change in Unrealized Appreciation (Depreciation) | |
Primary Risk Exposure | | Derivative Type | | Value
(000) | |
Currency Risk | | Foreign Currency Forward
Exchange Contracts | | $ | (1,213 | ) | |
Commodity Risk | | Futures Contracts | | | 751 | | |
Equity Risk | | Futures Contracts | | | (757 | ) | |
Interest Rate Risk | | Futures Contracts | | | (1,048 | ) | |
Currency Risk | | Futures Contracts | | | 24 | | |
Equity Risk | | Swap Agreements | | | 8,155 | | |
Interest Rate Risk | | Swap Agreements | | | 2,202 | | |
Total | | | | $ | 8,114 | | |
At September 30, 2023, the Fund's derivative assets and liabilities are as follows:
Gross Amounts of Assets and Liabilities
Presented in the Consolidated Statement of Assets and Liabilities | |
Derivatives(a) | | Assets(b)
(000) | | Liabilities(b)
(000) | |
Foreign Currency Forward Exchange Contracts | | $ | 523 | | | $ | (950 | ) | |
Swap Agreements | | | 5,399 | | | | (7,249 | ) | |
Total | | $ | 5,922 | | | $ | (8,199 | ) | |
(a) Excludes exchange-traded derivatives.
(b) Absent an event of default or early termination, OTC derivative assets and liabilities are presented gross and not offset in the Consolidated Statement of Assets and Liabilities.
The Fund typically enters into International Swaps and Derivatives Association, Inc. Master Agreements ("ISDA Master Agreements") or similar master agreements (collectively, "Master Agreements") with its contract counterparties for certain OTC derivatives in order to, among other things, reduce its credit risk to counterparties. ISDA Master Agreements include provisions for general obligations, representations, collateral and events of default or termination. Under an ISDA Master Agreement, the Fund typically may offset with the counterparty certain OTC
derivative financial instruments' payables and/or receivables with collateral held and/or posted and create one single net payment (close-out netting) in the event of default, termination and/or potential deterioration in the credit quality of the counterparty. Various Master Agreements govern the terms of certain transactions with counterparties, including transactions such as swap, forward, repurchase and reverse repurchase agreements. These Master Agreements typically attempt to reduce the counterparty risk associated with such transactions by specifying credit protection mechanisms and providing standardization that improves legal certainty. Cross-termination provisions under Master Agreements typically provide that a default in connection with one transaction between the Fund and a counterparty gives the non-defaulting party the right to terminate any other transactions in place with the defaulting party to create one single net payment due to/due from the defaulting party and may be a feature in certain Master Agreements. In the event the Fund exercises its right to terminate a Master Agreement after a counterparty experiences a termination event as defined in the Master Agreement, the return of collateral with market value in excess of the Fund's net liability may be delayed or denied.
The following tables present derivative financial instruments that are subject to enforceable netting arrangements as of September 30, 2023:
Gross Amounts Not Offset in the Consolidated Statement of Assets and Liabilities | |
Counterparty | | Gross Asset
Derivatives
Presented in the
Consolidated
Statement of
Assets and
Liabilities
(000) | | Financial
Instrument
(000) | | Collateral
Received(a)
(000) | | Net Amount
(not less
than $0)
(000) | |
Australia & New Zealand
Banking Group Ltd. | | $ | — | @ | | $ | — | | | $ | — | | | $ | — | @ | |
Bank of America NA | | | 12 | | | | (12 | ) | | | — | | | | 0 | | |
Barclays Bank PLC | | | 2,138 | | | | (1,408 | ) | | | (730 | ) | | | 0 | | |
BNP Paribas SA | | | 2,204 | | | | (1,028 | ) | | | (1,176 | ) | | | 0 | | |
Goldman Sachs International | | | 40 | | | | (40 | ) | | | — | | | | 0 | | |
JPMorgan Chase Bank NA | | | 1,349 | | | | (638 | ) | | | (711 | ) | | | 0 | | |
Standard Chartered Bank | | | 8 | | | | (3 | ) | | | — | | | | 5 | | |
State Street Bank and Trust Co. | | | 3 | | | | — | | | | — | | | | 3 | | |
UBS AG | | | 160 | | | | (160 | ) | | | — | | | | 0 | | |
Westpac Banking Corp. | | | 8 | | | | — | | | | — | | | | 8 | | |
Total | | $ | 5,922 | | | $ | (3,289 | ) | | $ | (2,617 | ) | | $ | 16 | | |
57
Morgan Stanley Institutional Fund Trust
Annual Report — September 30, 2023
Notes to Consolidated Financial Statements (cont'd)
Gross Amounts Not Offset in the Consolidated Statement of Assets and Liabilities | |
Counterparty | | Gross Liability
Derivatives
Presented in the
Consolidated
Statement of
Assets and
Liabilities
(000) | | Financial
Instrument
(000) | | Collateral
Pledged(a)
(000) | | Net Amount
(not less
than $0)
(000) | |
Australia & New Zealand
Banking Group Ltd. | | $ | 6 | | | $ | — | | | $ | — | | | $ | 6 | | |
Bank of America NA | | | 1,127 | | | | (12 | ) | | | — | | | | 1,115 | | |
Bank of New York Mellon | | | 1 | | | | — | | | | — | | | | 1 | | |
Barclays Bank PLC | | | 1,431 | | | | (1,408 | ) | | | — | | | | 23 | | |
BNP Paribas SA | | | 1,214 | | | | (1,028 | ) | | | — | | | | 186 | | |
Citibank NA | | | 21 | | | | — | | | | — | | | | 21 | | |
Goldman Sachs International | | | 2,193 | | | | (40 | ) | | | (2,153 | ) | | | 0 | | |
JPMorgan Chase Bank NA | | | 638 | | | | (638 | ) | | | — | | | | 0 | | |
Standard Chartered Bank | | | 3 | | | | (3 | ) | | | — | | | | 0 | | |
UBS AG | | | 1,565 | | | | (160 | ) | | | (1,170 | ) | | | 235 | | |
Total | | $ | 8,199 | | | $ | (3,289 | ) | | $ | (3,323 | ) | | $ | 1,587 | | |
@ Value is less than $500.
(a) In some instances, the actual collateral received or pledged may be more than the amount shown here due to overcollateralization.
For the year ended September 30, 2023, the approximate average monthly amount outstanding for each derivative type is as follows:
Foreign Currency Forward Exchange Contracts: | |
Average monthly principal amount | | $ | 189,518,000 | | |
Futures Contracts: | |
Average monthly notional value | | $ | 184,354,000 | | |
Swap Agreements: | |
Average monthly notional amount | | $ | 130,087,000 | | |
5. When-Issued/Delayed Delivery Securities: The Fund purchases and sells when-issued and delayed delivery securities. Securities purchased on a when-issued or delayed delivery basis are purchased for delivery beyond the normal settlement date at a stated price and yield, and no income accrues to the Fund on such securities prior to delivery date. Payment and delivery for when-issued and delayed delivery securities can take place a month or more after the date of the transaction. When the Fund enters into a purchase transaction on a when-issued or delayed delivery basis, securities are available for collateral in an amount at least equal in value to the Fund's commitments to purchase such securities. Purchasing securities on a when- issued or delayed delivery basis may involve a risk that the market price at the time of delivery may be lower than the agreed upon purchase price, in which case there could be an unrealized loss at the time of delivery. Purchasing investments on a when-issued or delayed delivery
basis may be considered a form of leverage which may increase the impact that gains (losses) may have on the Fund.
6. Indemnifications: The Trust enters into contracts that contain a variety of indemnification clauses. The Trust's maximum exposure under these arrangements is unknown as this would involve future claims that may be made against the Fund that have not yet occurred.
7. Dividends and Distributions to Shareholders: Dividends and distributions to shareholders are recorded on the ex-dividend date. Dividends from net investment income, if any, are declared and paid annually. Net realized capital gains, if any, are distributed at least annually.
8. Security Transactions, Income and Expenses: Security transactions are accounted for on the trade date (date the order to buy or sell is executed). Realized gains and losses on the sale of investment securities are determined on the specific identified cost method. Dividend income and other distributions are recorded on the ex-dividend date (except for certain foreign dividends which may be recorded as soon as the Fund is informed of such dividends) net of applicable withholding taxes. Non-cash dividends received in the form of stock, if any, are recognized on the ex-dividend date and recorded as non-cash dividend income at fair value. Interest income is recognized on the accrual basis (except where collection is in doubt) net of applicable withholding taxes. Discounts are accreted and premiums are amortized over the life of the respective securities. Most expenses of the Trust can be directly attributed to a particular Fund. Expenses which cannot be directly attributed are apportioned among the Funds based upon relative net assets or other appropriate methods. Income, expenses (other than class specific expenses — distribution and shareholder services, transfer agency and sub transfer agency fees) and realized and unrealized gains or losses are allocated to each class of shares based upon their relative net assets.
The Fund owns shares of REITs which report information on the source of their distributions annually in the following calendar year. A portion of distributions received from REITs during the year is estimated to be a return of capital and is recorded as a reduction of their cost.
B. Advisory/Sub-Advisory Fees: The Adviser, a wholly-owned subsidiary of Morgan Stanley, provides the Fund with advisory services under the terms of an Investment Advisory
58
Morgan Stanley Institutional Fund Trust
Annual Report — September 30, 2023
Notes to Consolidated Financial Statements (cont'd)
Agreement, paid quarterly, at an annual rate of 0.45% of the average daily net assets of the Fund.
The Adviser has agreed to reduce its advisory fee and/or reimburse the Fund so that total annual Fund operating expenses, excluding certain investment related expenses, taxes, interest and other extraordinary expenses (including litigation), will not exceed 0.74% for Class I shares, 1.09% for Class A shares, 1.59% for Class L shares, 1.84% for Class C shares and 0.71% for Class R6 shares. The fee waivers and/or expense reimbursements will continue for at least one year from the date of the Fund's prospectus or until such time as the Trustees act to discontinue all or a portion of such waivers and/or reimbursements when they deem such action is appropriate. For the year ended September 30, 2023, approximately $23,000 of other expenses were reimbursed by the Adviser pursuant to this arrangement.
The Adviser has entered into a Sub-Advisory Agreement with the Sub-Adviser, a wholly-owned subsidiary of Morgan Stanley. The Sub-Adviser provides the Fund with advisory services subject to the overall supervision of the Adviser and the Fund's Officers and Trustees. The Adviser pays the Sub-Adviser on a monthly basis a portion of the net advisory fees the Adviser receives from the Fund.
The Adviser provides investment advisory services to the Subsidiary pursuant to the Subsidiary Investment Management Agreement (the "Agreement"). Under the Agreement, the Subsidiary will pay the Adviser at the end of each fiscal quarter, calculated by applying a quarterly rate, based on the annual rate of 0.05%, to the average daily net assets of the Subsidiary.
The Adviser has agreed to waive its advisory fees by the amount of advisory fees it receives from the Subsidiary.
C. Administration Fees: The Adviser also serves as Administrator to the Trust and provides administrative services pursuant to an Administration Agreement for an annual fee, accrued daily and paid monthly, of 0.08% of the Fund's average daily net assets.
Under a Sub-Administration Agreement between the Administrator and State Street Bank and Trust Company ("State Street"), State Street provides certain administrative services to the Trust. For such services, the Administrator pays State Street a portion of the fee the Administrator receives from the Fund.
D. Distribution and Shareholder Services Fees: Morgan Stanley Distribution, Inc. ("MSDI" or the "Distributor"), a wholly-owned subsidiary of the Adviser and an indirect subsidiary of Morgan Stanley, serves as the Trust's Distributor of Fund shares pursuant to a Distribution Agreement. The Trust has adopted a Shareholder Services Plan with respect to Class A shares pursuant to Rule 12b-1 under the Act. Under the Shareholder Services Plan, the Fund pays the Distributor a shareholder services fee, accrued daily and paid monthly, at an annual rate of 0.25% of the Fund's average daily net assets attributable to Class A shares.
The Trust has adopted a Distribution and Shareholder Services Plan with respect to Class L shares pursuant to Rule 12b-1 under the Act. Under the Distribution and Shareholder Services Plan, the Fund pays the Distributor a distribution fee, accrued daily and paid monthly, at an annual rate of 0.50% and a shareholder services fee, accrued daily and paid monthly, at an annual rate of 0.25% of the Fund's average daily net assets attributable to Class L shares.
The Trust has adopted a Distribution and Shareholder Services Plan with respect to Class C shares pursuant to Rule 12b-1 under the Act. Under the Distribution and Shareholder Services Plan, the Fund pays the Distributor a distribution fee, accrued daily and paid monthly, at an annual rate of 0.75% and a shareholder services fee, accrued daily and paid monthly, at an annual rate of 0.25% of the Fund's average daily net assets attributable to Class C shares.
The distribution and shareholder services fees are used to support the expenses associated with servicing and maintaining accounts. The Distributor may compensate other parties for providing distribution-related and/or shareholder support services to investors who purchase Class A, Class L and Class C shares.
E. Dividend Disbursing and Transfer/Co-Transfer Agent: The Trust's dividend disbursing and transfer agent is SS&C Global Investor & Distribution Solutions, Inc. ("SS&C GIDS"). Pursuant to a Transfer Agency Agreement, the Trust pays SS&C GIDS a fee based on the number of classes, accounts and transactions relating to the Funds of the Trust.
Eaton Vance Management ("EVM"), an affiliate of Morgan Stanley, provides co-transfer agency and related services to the Fund pursuant to a Co-Transfer Agency Services Agreement. For the year ended September 30, 2023, co-transfer agency fees and expenses incurred to EVM, included in "Transfer
59
Morgan Stanley Institutional Fund Trust
Annual Report — September 30, 2023
Notes to Consolidated Financial Statements (cont'd)
Agency Fees" in the Statement of Operations, amounted to approximately $3,000.
F. Custodian Fees: State Street (the "Custodian") also serves as Custodian for the Trust in accordance with a Custodian Agreement. The Custodian holds cash, securities and other assets of the Trust as required by the Act. Custody fees are payable monthly based on assets held in custody, investment purchases and sales activity and account maintenance fees, plus reimbursement for certain out-of-pocket expenses.
G. Security Transactions and Transactions with Affiliates: For the year ended September 30, 2023, purchases and sales of investment securities for the Fund, other than long-term U.S. Government securities and short-term investments were approximately $192,974,000 and $169,168,000, respectively. For the year ended September 30, 2023, purchases and sales of long-term U.S. Government securities were approximately $245,664,000 and $235,564,000, respectively.
The Fund invests in the Institutional Class of the Morgan Stanley Institutional Liquidity Funds — Government Portfolio (the "Liquidity Funds"), an open-end management investment company managed by the Adviser. Advisory fees paid by the Fund are reduced by an amount equal to its pro-rata share of the advisory and administration fees paid by the Fund due to its investment in the Liquidity Funds. For the year ended September 30, 2023, advisory fees paid were reduced by approximately $108,000 relating to the Fund's investment in the Liquidity Funds.
A summary of the Fund's transactions in shares of affiliated investments during the year ended September 30, 2023 is as follows:
Affiliated
Investment
Company | | Value
September 30,
2022
(000) | | Purchases
at Cost
(000) | | Proceeds
from Sales
(000) | | Dividend
Income
(000) | |
Liquidity Funds | | $ | 75,502 | | | $ | 296,548 | | | $ | 298,009 | | | $ | 2,814 | | |
Affiliated
Investment
Company (cont'd) | | Realized
Gain
(Loss)
(000) | | Change in
Unrealized
Appreciation
(Depreciation)
(000) | | Value
September 30,
2023
(000) | |
Liquidity Funds | | $ | — | | | $ | — | | | $ | 74,041 | | |
The Fund is permitted to purchase and sell securities ("cross-trade") from and to other Morgan Stanley funds as well as other funds and client accounts for which the Adviser or an affiliate of the Adviser serves as investment adviser, pursuant to procedures approved by the Trustees in compliance with Rule 17a-7 under the Act (the "Rule"). Each cross-trade is executed at the current market price in compliance with
provisions of the Rule. For the year ended September 30, 2023, the Fund did not engage in any cross-trade transactions.
The Fund has an unfunded noncontributory defined benefit pension plan covering certain independent Trustees of the Fund who will have served as independent Trustees for at least five years at the time of retirement. Benefits under this plan are based on factors which include years of service and compensation. The Trustees voted to close the plan to new participants and eliminate the future benefits growth due to increases to compensation after July 31, 2003. Aggregate pension costs for the year ended September 30, 2023, included in "Trustees' Fees and Expenses" in the Consolidated Statement of Operations amounted to approximately $2,000. At September 30, 2023, the Fund had an accrued pension liability of approximately $37,000, which is reflected as "Payable for Trustees' Fees and Expenses" in the Consolidated Statement of Assets and Liabilities.
The Fund has an unfunded Deferred Compensation Plan (the "Compensation Plan"), which allows each independent Trustee to defer payment of all, or a portion, of the fees he or she receives for serving on the Board of Trustees. Each eligible Trustee generally may elect to have the deferred amounts credited with a return equal to the total return on one or more of the Morgan Stanley funds that are offered as investment options under the Compensation Plan. Appreciation/depreciation and distributions received from these investments are recorded with an offsetting increase/decrease in the deferred compensation obligation and do not affect the NAV of the Fund.
H. Federal Income Taxes: It is the Fund's intention to continue to qualify as a RIC and distribute all of its taxable and tax-exempt income. Accordingly, no provision for federal income taxes is required in the consolidated financial statements.
The Fund may be subject to taxes imposed by countries in which it invests. Such taxes are generally based on income and/or capital gains earned or repatriated. Taxes are accrued based on net investment income, net realized gains and net unrealized appreciation as such income and/or gains are earned. Taxes may also be based on transactions in foreign currency and are accrued based on the value of investments denominated in such currency.
FASB ASC 740-10, "Income Taxes — Overall", sets forth a minimum threshold for consolidated financial statement recognition of the benefit of a tax position taken or expected to be taken in a tax return. Management has concluded that there
60
Morgan Stanley Institutional Fund Trust
Annual Report — September 30, 2023
Notes to Consolidated Financial Statements (cont'd)
are no significant uncertain tax positions that would require recognition in the consolidated financial statements. If applicable, the Fund recognizes interest accrued related to unrecognized tax benefits in "Interest Expense" and penalties in "Other Expenses" in the Consolidated Statement of Operations. The Fund files tax returns with the U.S. Internal Revenue Service, New York and various states. Generally, each of the tax years in the four-year period ended September 30, 2023 remains subject to examination by taxing authorities.
The tax character of distributions paid may differ from the character of distributions shown for GAAP purposes due to short-term capital gains being treated as ordinary income for tax purposes. The tax character of distributions paid during fiscal years 2023 and 2022 was as follows:
2023
Distributions
Paid From: | | 2022
Distributions
Paid From: | |
Ordinary
Income
(000) | | Long-Term
Capital Gain
(000) | | Ordinary
Income
(000) | | Long-Term
Capital Gain
(000) | |
| $ | 2,603 | | | $ | — | | | $ | 35,063 | | | $ | 4,937 | | |
The amount and character of income and gains to be distributed are determined in accordance with income tax regulations which may differ from GAAP. These book/tax differences are either considered temporary or permanent in nature.
Temporary differences are attributable to differing book and tax treatments for the timing of the recognition of gains (losses) on certain investment transactions and the timing of the deductibility of certain expenses.
The Fund had no permanent differences causing reclassifications among the components of net assets for the year ended September 30, 2023.
At September 30, 2023, the Fund had no distributable earnings on a tax basis.
At September 30, 2023, the Fund had available for federal income tax purposes unused long-term capital losses of approximately $7,270,000, that do not have an expiration date.
To the extent that capital loss carryforwards are used to offset any future capital gains realized, no capital gains tax liability will be incurred by the Fund for gains realized and not distributed. To the extent that capital gains are offset, such gains will not be distributed to the shareholders. During the year ended September 30, 2023, the Fund utilized capital loss carryforwards for U.S. federal income tax purposes of approximately $8,545,000.
Qualified late year losses are capital losses and specified ordinary losses, including currency losses, incurred after October 31 but within the taxable year that, if elected, are deemed to arise on the first day of the Fund's next taxable year. For the year ended September 30, 2023, the Fund intends to defer to October 1, 2023 for U.S. federal income tax purposes the following losses:
Qualified
Late Year
Ordinary
Losses
(000) | | Post-October
Capital
Losses
(000) | |
| $ | 5,367 | | | $ | — | | |
I. Credit Facility: The Trust and other Morgan Stanley funds participated in a $300,000,000 committed, unsecured revolving line of credit facility (the "Facility") with State Street. Effective April 17, 2023, the committed line amount increased to $500,000,000. This Facility is to be used for temporary emergency purposes or funding of shareholder redemption requests. The interest rate for any funds drawn will be based on the federal funds rate or overnight bank funding rate plus a spread. The Facility also has a commitment fee of 0.25% per annum based on the unused portion of the Facility, which is allocated among participating funds based on relative net assets. During the twelve months ended September 30, 2023, the Fund did not have any borrowings under the Facility.
J. Other: At September 30, 2023, the Fund had record owners of 10% or greater. Investment activities of these shareholders could have a material impact on the Fund. The aggregate percentage of such owners was 89.8%.
K. Market Risk and Risks Relating to Certain Financial Instruments
Market: An investment in the Fund is based on the values of the Fund's investments, which may change due to economic and other events that affect markets generally, as well as those that affect particular regions, countries, industries, companies or governments. The risks associated with these developments may be magnified if social, political, economic and other conditions and events (such as war, natural disasters, health emergencies (e.g., epidemics and pandemics), terrorism, conflicts, social unrest, recessions, inflation, rapid interest rate changes and supply chain disruptions) adversely interrupt the global economy and financial markets. It is difficult to predict when events affecting the U.S. or global financial markets may occur, the effects that such events may have and the duration of those effects (which may last for extended periods). These events may negatively impact broad segments of businesses and populations and have a significant and rapid negative impact on the
61
Morgan Stanley Institutional Fund Trust
Annual Report — September 30, 2023
Notes to Consolidated Financial Statements (cont'd)
performance of the Fund's investments, adversely affect and increase the volatility of the Fund's share price and exacerbate pre-existing risks to the Fund. The occurrence, duration and extent of these or other types of adverse economic and market conditions and uncertainty over the long term cannot be reasonably projected or estimated at this time. The ultimate impact of public health emergencies or other adverse economic or market developments and the extent to which the associated conditions impact the Fund and its investments will also depend on other future developments, which are highly uncertain, difficult to accurately predict and subject to change at any time. The financial performance of the Fund's investments (and, in turn, the Fund's investment results) as well as their liquidity may be adversely affected because of these and similar types of factors and developments.
Bitcoin: The Fund may gain exposure to cryptocurrencies by investing in the Subsidiary. Cryptocurrencies (also referred to as "virtual currencies" and "digital currencies") are digital assets designed to act as a medium of exchange. Although cryptocurrency is an emerging asset class, there are thousands of cryptocurrencies, the most well-known of which is bitcoin. Cryptocurrency facilitates decentralized, peer-to-peer financial exchange and value storage that is used like money, without the oversight of a central authority or banks. The value of cryptocurrency is not backed by any government, corporation, or other identified body. Similar to fiat currencies (i.e., a currency that is backed by a central bank or a national, supra-national or quasi-national organization), cryptocurrencies are susceptible to theft, loss and destruction. The value of Fund's investments in cryptocurrency is subject to fluctuations in the value of the cryptocurrency, which have been and may in the future be highly volatile. The value of cryptocurrencies is determined by the supply and demand for cryptocurrency in the global market for the trading of cryptocurrency, which consists primarily of transactions on electronic exchanges. The price of bitcoin could drop precipitously (including to zero) for a variety of reasons, including, but not limited to, regulatory changes, a crisis of confidence, flaw or operational issue in the bitcoin network or a change in user preference to competing cryptocurrencies. The Fund's exposure to cryptocurrency could result in substantial losses to the Fund.
62
Morgan Stanley Institutional Fund Trust
Annual Report — September 30, 2023
Report of Independent Registered Public Accounting Firm
To the Shareholders and Board of Trustees of
Morgan Stanley Institutional Fund Trust —
Global Strategist Portfolio
Opinion on the Financial Statements
We have audited the accompanying consolidated statement of assets and liabilities of Global Strategist Portfolio (the "Fund") (one of the funds constituting Morgan Stanley Institutional Fund Trust (the "Trust")), including the consolidated portfolio of investments, as of September 30, 2023, and the related consolidated statement of operations for the year then ended, the consolidated statements of changes in net assets for each of the two years in the period then ended, the consolidated financial highlights for each of the five years in the period then ended and the related notes (collectively referred to as the "financial statements"). In our opinion, the financial statements present fairly, in all material respects, the consolidated financial position of the Fund (one of the funds constituting Morgan Stanley Institutional Fund Trust) at September 30, 2023, the consolidated results of its operations for the year then ended, the consolidated changes in its net assets for each of the two years in the period then ended and its consolidated financial highlights for each of the five years in the period then ended, in conformity with U.S. generally accepted accounting principles.
Basis for Opinion
These financial statements are the responsibility of the Trust's management. Our responsibility is to express an opinion on the Fund's consolidated financial statements based on our audits. We are a public accounting firm registered with the Public Company Accounting Oversight Board (United States) ("PCAOB") and are required to be independent with respect to the Trust in accordance with the U.S. federal securities laws and the applicable rules and regulations of the Securities and Exchange Commission and the PCAOB.
We conducted our audits in accordance with the standards of the PCAOB. Those standards require that we plan and perform the audit to obtain reasonable assurance about whether the financial statements are free of material misstatement, whether due to error or fraud. The Trust is not required to have, nor were we engaged to perform, an audit of the Trust's internal control over financial reporting. As part of our audits, we are required to obtain an understanding of internal control over financial reporting but not for the purpose of expressing an opinion on the effectiveness of the Trust's internal control over financial reporting. Accordingly, we express no such opinion.
Our audits included performing procedures to assess the risks of material misstatement of the financial statements, whether due to error or fraud, and performing procedures that respond to those risks. Such procedures included examining, on a test basis, evidence regarding the amounts and disclosures in the financial statements. Our procedures included confirmation of securities owned as of September 30, 2023, by correspondence with the custodian, brokers and others; when replies were not received from brokers and others, we performed other auditing procedures. Our audits also included evaluating the accounting principles used and significant estimates made by management, as well as evaluating the overall presentation of the financial statements. We believe that our audits provide a reasonable basis for our opinion.

We have served as the auditor of one or more Morgan Stanley investment companies since 2000.
Boston, Massachusetts
November 27, 2023
63
Morgan Stanley Institutional Fund Trust
Annual Report — September 30, 2023
Investment Advisory Agreement Approval (unaudited)
Nature, Extent and Quality of Services
The Board reviewed and considered the nature and extent of the investment advisory services provided by the Adviser under the advisory agreement, including portfolio management, investment research and equity and fixed income securities trading. The Board reviewed similar information and factors regarding the Sub-Adviser, to the extent applicable. The Board also reviewed and considered the nature and extent of the non-advisory, administrative services provided by the Administrator under the administration agreement, including accounting, operations, clerical, bookkeeping, compliance, business management and planning, legal services and the provision of supplies, office space and utilities at the Adviser's expense. The Board also considered the Adviser's investment in personnel and infrastructure that benefits the Fund. (The Adviser, Sub-Adviser and Administrator together are referred to as the "Adviser" and the advisory, sub-advisory and administration agreements together are referred to as the "Management Agreement.") The Board also considered that the Adviser serves a variety of other investment advisory clients and has experience overseeing service providers. The Board also compared the nature of the services provided by the Adviser with similar services provided by non-affiliated advisers as prepared by Broadridge Financial Solutions, Inc. ("Broadridge").
The Board reviewed and considered the qualifications of the portfolio managers, the senior administrative managers and other key personnel of the Adviser who provide the advisory and administrative services to the Fund. The Board determined that the Adviser's portfolio managers and key personnel are well qualified by education and/or training and experience to perform the services in an efficient and professional manner. The Board concluded that the nature and extent of the advisory and administrative services provided were necessary and appropriate for the conduct of the business and investment activities of the Fund and supported its decision to approve the Management Agreement.
Performance, Fees and Expenses of the Fund
The Board reviewed the performance, fees and expenses of the Fund compared to its peers, as prepared by Broadridge, and to appropriate benchmarks where applicable. The Board discussed with the Adviser the performance goals and the actual results achieved in managing the Fund. When considering a fund's performance, the Board and the Adviser place emphasis on trends and longer-term returns (focusing on one-year, three-year and five-year performance, as of December 31, 2022, or since inception, as applicable). When a fund underperforms its benchmark and/or its peer group average, the Board and the Adviser discuss the causes of such underperformance and, where necessary, they discuss specific changes to investment strategy or investment personnel. The Board noted that the Fund's performance was below its peer group average for the one-, three- and five-year periods. The Board discussed with the Adviser the level of the advisory and administration fees (together, the "management fee") for this Fund relative to comparable funds and/or other accounts advised by the Adviser and/or compared to its peers as prepared by Broadridge. In addition to the management fee, the Board also reviewed the Fund's total expense ratio. The Board noted that the Fund's management fee and total expense ratio were lower than its peer group averages. After discussion, the Board concluded that the Fund's (i) performance was acceptable and (ii) management fee and total expense ratio were competitive with its peer group averages.
Economies of Scale
The Board considered the size and growth prospects of the Fund and how that relates to the Fund's total expense ratio and particularly the Fund's management fee rate, which does not include breakpoints. In conjunction with its review of the Adviser's profitability, the Board discussed with the Adviser how a change in assets can affect the efficiency or effectiveness of managing the Fund and whether the management fee level is appropriate relative to current and projected asset levels and/or whether the management fee structure reflects economies of scale as asset levels change. The Board has determined that its review of the actual and/or potential economies of scale of the Fund supports its decision to approve the Management Agreement.
Profitability of the Adviser and Affiliates
The Board considered information concerning the costs incurred and profits realized by the Adviser and its affiliates during the last year from their relationship with the Fund and during the last two years from their relationship with the Morgan Stanley Fund Complex and reviewed with the Adviser the cost allocation methodology used to determine the profitability of the Adviser and affiliates. The Board has determined that its review of the analysis of the Adviser's expenses and profitability supports its decision to approve the Management Agreement.
64
Morgan Stanley Institutional Fund Trust
Annual Report — September 30, 2023
Investment Advisory Agreement Approval (unaudited) (cont'd)
Other Benefits of the Relationship
The Board considered other direct and indirect benefits to the Adviser and/or its affiliates derived from their relationship with the Fund and other funds advised by the Adviser. These benefits may include, among other things, fees for trading, distribution and/or shareholder servicing and for transaction processing and reporting platforms used by securities lending agents, and research received by the Adviser generated from commission dollars spent on funds' portfolio trading. The Board reviewed with the Adviser these arrangements and the reasonableness of the Adviser's costs relative to the services performed. The Board has determined that its review of the other benefits received by the Adviser or its affiliates supports its decision to approve the Management Agreement.
Resources of the Adviser and Historical Relationship Between the Fund and the Adviser
The Board considered whether the Adviser is financially sound and has the resources necessary to perform its obligations under the Management Agreement. The Board also reviewed and considered the historical relationship between the Fund and the Adviser, including the organizational structure of the Adviser, the policies and procedures formulated and adopted by the Adviser for managing the Fund's operations and the Board's confidence in the competence and integrity of the senior managers and key personnel of the Adviser. The Board concluded that the Adviser has the financial resources necessary to fulfill its obligations under the Management Agreement and that it is beneficial for the Fund to continue its relationship with the Adviser.
Other Factors and Current Trends
The Board considered the controls and procedures adopted and implemented by the Adviser and monitored by the Fund's Chief Compliance Officer and concluded that the conduct of business by the Adviser indicates a good faith effort on its part to adhere to high ethical standards in the conduct of the Fund's business.
General Conclusion
After considering and weighing all of the above factors, with various written materials and verbal information presented by the Adviser, the Board concluded that it would be in the best interest of the Fund and its shareholders to approve renewal of the Management Agreement for another year. In reaching this conclusion the Board did not give particular weight to any single piece of information or factor referenced above. The Board considered these factors and information over the course of the year and in numerous meetings, some of which were in executive session with only the independent Board members and their counsel present. It is possible that individual Board members may have weighed these factors, and the information presented, differently in reaching their individual decisions to approve the Management Agreement.
65
Morgan Stanley Institutional Fund Trust
Annual Report — September 30, 2023
Liquidity Risk Management Program (unaudited)
In compliance with Rule 22e-4 under the Investment Company Act of 1940, as amended (the "Liquidity Rule"), the Fund has adopted and implemented a liquidity risk management program (the "Program"), which is reasonably designed to assess and manage the risk that the Fund could not meet requests to redeem shares issued by the Fund without significant dilution of remaining investors' interests in the Fund (i.e., liquidity risk). The Fund's Board of Trustees (the "Board") previously approved the designation of the Liquidity Risk Subcommittee (the "LRS") as Program administrator. The LRS is comprised of representatives from various divisions within Morgan Stanley Investment Management.
At a meeting held on March 1-2, 2023, the Board reviewed a written report prepared by the LRS that addressed the Program's operation and assessed its adequacy, and effectiveness of implementation for the period from January 1, 2022, through December 31, 2022, as required under the Liquidity Rule. The report concluded that the Program operated effectively and was adequately and effectively implemented in all material aspects, and that the relevant controls and safeguards were appropriately designed to enable the LRS to administer the Program in compliance with the Liquidity Rule.
In accordance with the Program, the LRS assessed each Fund's liquidity risk no less frequently than annually taking into consideration certain factors, as applicable, such as (i) investment strategy and liquidity of portfolio investments, (ii) short-term and long-term cash flow projections and (iii) holdings of cash and cash equivalents and borrowing arrangements and other funding sources. Certain factors are considered under both normal and reasonably foreseeable stressed conditions.
Each Fund portfolio investment is classified into one of four liquidity categories, which classification is assessed at least monthly by the LRS. The classification is based on a determination of the number of days it is reasonably expected to take to convert the investment into cash, or sell or dispose of the investment, in current market conditions without significantly changing the market value of the investment. Liquidity classification determinations take into account various market, trading and investment-specific considerations, as well as market depth, and in some cases utilize third-party vendor data.
The Liquidity Rule limits a fund's investments in illiquid investments to 15% of its net assets and requires funds that do not primarily hold assets that are highly liquid investments to determine and maintain a minimum percentage of the fund's net assets to be invested in highly liquid investments (highly liquid investment minimum or "HLIM"). The LRS believes that the Program includes provisions reasonably designed to review, monitor and comply with the 15% limit on illiquid investments and for determining, periodically reviewing and complying with the HLIM requirement, as applicable.
There can be no assurance that the Program will achieve its objectives under all circumstances in the future. Please refer to the Fund's prospectus for more information regarding the Fund's exposure to liquidity risk and other risks to which it may be subject.
66
Morgan Stanley Institutional Fund Trust
Annual Report — September 30, 2023
Federal Tax Notice (unaudited)
For federal income tax purposes, the following information is furnished with respect to the distributions paid by the Fund during its taxable year ended September 30, 2023. For corporate shareholders, 52.02% of the dividends qualified for the dividends received deduction.
The Fund designated approximately $1,249,000 of its distributions paid as business interest income.
The Fund designated approximately $809,000 of its distributions paid as qualified interest income.
For federal income tax purposes, the following information is furnished with respect to the Fund's earnings for its taxable year ended September 30, 2023. When distributed, certain earnings may be subject to a maximum tax rate of 15% as provided for by the Jobs and Growth Tax Relief Reconciliation Act of 2003. The Fund designated up to a maximum of approximately $2,603,000 as taxable at this lower rate.
In January, the Fund provides tax information to shareholders for the preceding calendar year.
67
Morgan Stanley Institutional Fund Trust
Annual Report — September 30, 2023
Important Notices (unaudited)
Reporting to Shareholders
Each Morgan Stanley fund provides a complete schedule of portfolio holdings in its Semi-Annual and the Annual Reports within 60 days of the end of the fund's second and fourth fiscal quarters. The Semi-Annual and Annual Reports are filed electronically with the Securities and Exchange Commission ("SEC") on Form N-CSRS and Form N-CSR, respectively. Morgan Stanley makes these reports available on its public website, www.morganstanley.com/im. Each Morgan Stanley non-money market fund also files a complete schedule of portfolio holdings with the SEC for the fund's first and third fiscal quarters as an attachment to Form N-PORT. Morgan Stanley does not deliver the reports for the first and third fiscal quarters to shareholders, but makes the complete schedule of portfolio holdings for the fund's first and third fiscal quarters available on its public website. The holdings for each money market fund are also posted to the Morgan Stanley public website. You may obtain the Form N-PORT filings (as well as the Form N-CSR and N-CSRS filings) by accessing the SEC's website, www.sec.gov. You can also request copies of these materials, upon payment of a duplicating fee, by electronic request at the SEC's email address (publicinfo@sec.gov).
Proxy Voting Policies and Procedures and Proxy Voting Record
You may obtain a copy of the Trust's Proxy Voting Policy and Procedures and information regarding how the Trust voted proxies relating to portfolio securities during the most recent twelve-month period ended June 30, without charge, upon request, by calling toll free 1 (800) 869-6397 or by visiting our website at www.morganstanley.com/im. This information is also available on the SEC's website at www.sec.gov.
This report is authorized for distribution only when preceded or accompanied by a prospectus or summary prospectus of the applicable fund of Morgan Stanley Institutional Fund Trust, which describes in detail the fund's investment policies, risks, fees and expenses. Please read the prospectus carefully before you invest or send money. For additional information, including information regarding the investments comprising the Fund, please visit our website at www.morganstanley.com/im. or call toll free 1 (800) 869-6397.
Householding Notice
To reduce printing and mailing costs, the Fund attempts to eliminate duplicate mailings to the same address. The Fund delivers a single copy of certain shareholder documents, including shareholder reports, prospectuses and proxy materials, to investors with the same last name who reside at the same address. Your participation in this program will continue for an unlimited period of time unless you instruct us otherwise. You can request multiple copies of these documents by calling 1 (800) 869-6397, 8:00 a.m. to 6:00 p.m., ET. Once our Customer Service Center has received your instructions, we will begin sending individual copies for each account within 30 days.
Tailored Shareholder Reports
Effective January 24, 2023, the SEC adopted rule and form amendments to require open-end mutual funds and ETFs to transmit concise and visually engaging streamlined annual and semiannual reports to shareholders that highlight key information. Other information, including financial statements, will no longer appear in a streamlined shareholder report but must be available online, delivered free of charge upon request, and filed on a semiannual basis on Form N-CSR. The rule and form amendments have a compliance date of July 24, 2024. At this time, management is evaluating the impact of these amendments on the shareholder reports for the Morgan Stanley Funds.
68
Morgan Stanley Institutional Fund Trust
Annual Report — September 30, 2023
U.S. Customer Privacy Notice (unaudited) April 2021
FACTS | | WHAT DOES MSIM DO WITH YOUR PERSONAL INFORMATION? | |
Why? | | Financial companies choose how they share your personal information. Federal law gives consumers the right to limit some but not all sharing. Federal law also requires us to tell you how we collect, share, and protect your personal information. Please read this notice carefully to understand what we do. | |
What? | | The types of personal information we collect and share depend on the product or service you have with us. This information can include:
◼ Social Security number and income
◼ investment experience and risk tolerance
◼ checking account number and wire transfer instructions | |
How? | | All financial companies need to share customers' personal information to run their everyday business. In the section below, we list the reasons financial companies can share their customers' personal information; the reasons MSIM chooses to share; and whether you can limit this sharing. | |
Reasons we can share your personal information | | Does MSIM share? | | Can you limit this sharing? | |
For our everyday business purposes —
such as to process your transactions, maintain your account(s), respond to court orders and legal investigations, or report to credit bureaus | | Yes | | No | |
For our marketing purposes —
to offer our products and services to you | | Yes | | No | |
For joint marketing with other financial companies | | No | | We don't share | |
For our investment management affiliates' everyday business purposes —
information about your transactions, experiences, and creditworthiness | | Yes | | Yes | |
For our affiliates' everyday business purposes —
information about your transactions and experiences | | Yes | | No | |
For our affiliates' everyday business purposes —
information about your creditworthiness | | No | | We don't share | |
For our investment management affiliates to market to you | | Yes | | Yes | |
For our affiliates to market to you | | No | | We don't share | |
For non-affiliates to market to you | | No | | We don't share | |
69
Morgan Stanley Institutional Fund Trust
Annual Report — September 30, 2023
U.S. Customer Privacy Notice (unaudited) (cont'd) April 2021
To limit our sharing | | Call toll-free (844) 312-6327 or email: imprivacyinquiries@morganstanley.com
Please note:
If you are a new customer, we can begin sharing your information 30 days from the date we sent this notice. When you are no longer our customer, we continue to share your information as described in this notice. However, you can contact us at any time to limit our sharing. | |
Questions? | | Call toll-free (844) 312-6327 or email: imprivacyinquiries@morganstanley.com | |
Who we are
Who is providing this notice? | | Morgan Stanley Investment Management Inc. and its investment management affiliates ("MSIM") (see Investment Management Affiliates definition below) | |
What we do
How does MSIM protect my personal information? | | To protect your personal information from unauthorized access and use, we use security measures that comply with federal law. These measures include computer safeguards and secured files and buildings. We have policies governing the proper handling of customer information by personnel and requiring third parties that provide support to adhere to appropriate security standards with respect to such information. | |
How does MSIM collect my personal information? | | We collect your personal information, for example, when you
◼ open an account or make deposits or withdrawals from your account
◼ buy securities from us or make a wire transfer
◼ give us your contact information
We also collect your personal information from others, such as credit bureaus, affiliates, or other companies. | |
Why can't I limit all sharing? | | Federal law gives you the right to limit only
◼ sharing for affiliates' everyday business purposes — information about your creditworthiness
◼ affiliates from using your information to market to you
◼ sharing for non-affiliates to market to you
State laws and individual companies may give you additional rights to limit sharing. See below for more on your rights under state law. | |
70
Morgan Stanley Institutional Fund Trust
Annual Report — September 30, 2023
U.S. Customer Privacy Notice (unaudited) (cont'd) April 2021
Definitions
Investment Management Affiliates | | MSIM Investment Management Affiliates include registered investment advisers, registered broker-dealers, and registered and unregistered funds in the Investment Management Division. Investment Management Affiliates does not include entities associated with Morgan Stanley Wealth Management, such as Morgan Stanley Smith Barney LLC and Morgan Stanley & Co. | |
Affiliates | | Companies related by common ownership or control. They can be financial and non-financial companies.
◼ Our affiliates include companies with a Morgan Stanley name and financial companies such as Morgan Stanley Smith Barney LLC and Morgan Stanley & Co. | |
Non-affiliates | | Companies not related by common ownership or control. They can be financial and non-financial companies.
◼ MSIM does not share with non-affiliates so they can market to you. | |
Joint marketing | | A formal agreement between non-affiliated financial companies that together market financial products or services to you.
◼ MSIM doesn't jointly market | |
Other important information
Vermont: Except as permitted by law, we will not share personal information we collect about Vermont residents with Non-affiliates unless you provide us with your written consent to share such information.
California: Except as permitted by law, we will not share personal information we collect about California residents with Non-affiliates and we will limit sharing such personal information with our Affiliates to comply with California privacy laws that apply to us.
71
Morgan Stanley Institutional Fund Trust
Annual Report — September 30, 2023
Trustees and Officers Information (unaudited)
Independent Trustees:
Name, Address and Birth Year
of Independent Trustee | | Position(s)
Held with
Registrant | | Length of Time
Served* | | Principal Occupation(s) During Past 5 Years
and Other Relevant Professional Experience | | Number of
Funds in
Fund Complex
Overseen by
Independent
Trustee** | | Other Directorships
Held by Independent
Trustee During
Past 5 Years*** | |
Frank L. Bowman
c/o Perkins Coie LLP
Counsel to the Independent Trustees
1155 Avenue of the Americas
22nd Floor
New York, NY 10036
Birth Year: 1944 | | Trustee | | Since
August
2006 | | President, Strategic Decisions, LLC (consulting) (since February 2009); Director or Trustee of various Morgan Stanley Funds (since August 2006); Chairperson of the Compliance and Insurance Committee (since October 2015); formerly, Chairperson of the Insurance Sub-Committee of the Compliance and Insurance Committee (2007-2015); served as President and Chief Executive Officer of the Nuclear Energy Institute (policy organization) (February 2005-November 2008); retired as Admiral, U.S. Navy after serving over 38 years on active duty including 8 years as Director of the Naval Nuclear Propulsion Program in the Department of the Navy and the U.S. Department of Energy (1996-2004); served as Chief of Naval Personnel (July 1994-September 1996) and on the Joint Staff as Director of Political Military Affairs (June 1992-July 1994); knighted as Honorary Knight Commander of the Most Excellent Order of the British Empire; awarded the Officier de l'Orde National du Mèrite by the French Government; elected to the National Academy of Engineering (2009). | | | 86 | | | Director of Naval and Nuclear Technologies LLP; Director Emeritus of the Armed Services YMCA; Member of the National Security Advisory Council of the Center for U.S. Global Engagement and a former member of the CNA Military Advisory Board; Chairman of the Board of Trustees of Fairhaven United Methodist Church; Member of the Board of Advisors of the Dolphin Scholarship Foundation; Director of other various nonprofit organizations; formerly, Director of BP, plc (November 2010-May 2019). | |
Frances L. Cashman
c/o Perkins Coie LLP
Counsel to the Independent
Trustees
1155 Avenue of the Americas
22nd Floor
New York, NY 10036
Birth Year: 1961 | | Trustee | | Since
February
2022 | | Chief Executive Officer, Asset Management Division, Delinian Ltd. (financial information) (May 2021-Present); Executive Vice President and various other roles, Legg Mason & Co. (asset management) (2010-2020); Managing Director, Stifel Nicolaus (2005-2010). | | | 87 | | | Trustee and Investment Committee Member, GeorgiaTech Foundation (since June 2019); Trustee and Chair of Marketing Committee, and Member of Investment Committee, Loyola Blakefield (Since September 2017); Trustee, MMI Gateway Foundation (since September 2017); Director and Investment Committee Member, Catholic Community Foundation Board (2012-2018); Director and Investment Committee Member, St. Ignatius Loyola Academy (2011-2017). | |
Kathleen A. Dennis
c/o Perkins Coie LLP
Counsel to the Independent
Trustees
1155 Avenue of the Americas
22nd Floor
New York, NY 10036
Birth Year: 1953 | | Trustee | | Since
August
2006 | | Chairperson of the Governance Committee (since January 2021), Chairperson of the Liquidity and Alternatives Sub-Committee of the Investment Committee (2006-2020) and Director or Trustee of various Morgan Stanley Funds (since August 2006); President, Cedarwood Associates (mutual fund and investment management consulting) (since July 2006); formerly, Senior Managing Director of Victory Capital Management (1993-2006). | | | 86 | | | Board Member, University of Albany Foundation (2012-present); Board Member, Mutual Funds Directors Forum (2014-present); Director of various non-profit organizations. | |
72
Morgan Stanley Institutional Fund Trust
Annual Report — September 30, 2023
Trustees and Officers Information (unaudited) (cont'd)
Independent Trustees: (cont'd)
Name, Address and Birth Year
of Independent Trustee | | Position(s)
Held with
Registrant | | Length of Time
Served* | | Principal Occupation(s) During Past 5 Years
and Other Relevant Professional Experience | | Number of
Funds in
Fund Complex
Overseen by
Independent
Trustee** | | Other Directorships
Held by Independent
Trustee During
Past 5 Years*** | |
Nancy C. Everett
c/o Perkins Coie LLP
Counsel to the Independent
Trustees
1155 Avenue of the Americas
22nd Floor
New York, NY 10036
Birth Year: 1955 | | Trustee | | Since
January
2015 | | Chairperson of the Equity Investment Committee (since January 2021); Director or Trustee of various Morgan Stanley Funds (since January 2015); Chief Executive Officer, Virginia Commonwealth University Investment Company (since November 2015); Owner, OBIR, LLC (institutional investment management consulting) (since June 2014); formerly, Managing Director, BlackRock, Inc. (February 2011-December 2013) and Chief Executive Officer, General Motors Asset Management (a/k/a Promark Global Advisors, Inc.) (June 2005-May 2010). | | | 87 | | | Formerly, Member of Virginia Commonwealth University School of Business Foundation (2005-2016); Member of Virginia Commonwealth University Board of Visitors (2013-2015); Member of Committee on Directors for Emerging Markets Growth Fund, Inc. (2007-2010); Chairperson of Performance Equity Management, LLC (2006-2010); and Chairperson, GMAM Absolute Return Strategies Fund, LLC (2006-2010). | |
Eddie A. Grier
c/o Perkins Coie LLP
Counsel to the Independent
Trustees
1155 Avenue of the Americas
22nd Floor
New York, NY 10036
Birth Year: 1955 | | Trustee | | Since
February
2022 | | Dean, Santa Clara University Leavey School of Business (since July 2021); Dean, Virginia Commonwealth University School of Business (2010-2021); President and various other roles, Walt Disney Company (entertainment and media) (1981-2010). | | | 87 | | | Director, Witt/Keiffer, Inc. (executive search) (since 2016); Director, NuStar GP, LLC (energy) (since August 2021); Director, Sonida Senior Living, Inc. (residential community operator) (2016-2021); Director, NVR, Inc. (homebuilding) (2013-2020); Director, Middleburg Trust Company (wealth management) (2014-2019); Director, Colonial Williamsburg Company (2012-2021); Regent, University of Massachusetts Global (since 2021); Director and Chair, ChildFund International (2012-2021); Trustee, Brandman University (2010-2021); Director, Richmond Forum (2012-2019). | |
73
Morgan Stanley Institutional Fund Trust
Annual Report — September 30, 2023
Trustees and Officers Information (unaudited) (cont'd)
Independent Trustees: (cont'd)
Name, Address and Birth Year
of Independent Trustee | | Position(s)
Held with
Registrant | | Length of Time
Served* | | Principal Occupation(s) During Past 5 Years
and Other Relevant Professional Experience | | Number of
Funds in
Fund Complex
Overseen by
Independent
Trustee** | | Other Directorships
Held by Independent
Trustee During
Past 5 Years*** | |
Jakki L. Haussler
c/o Perkins Coie LLP
Counsel to the Independent
Trustees
1155 Avenue of the Americas
22nd Floor
New York, NY 10036
Birth Year: 1957 | | Trustee | | Since
January
2015 | | Chairperson of the Audit Committee (since January 2023) and Director or Trustee of various Morgan Stanley Funds (since January 2015); Chairman, Opus Capital Group (since 1996); formerly, Chief Executive Officer, Opus Capital Group (1996-2019); Director, Capvest Venture Fund, LP (May 2000-December 2011); Partner, Adena Ventures, LP (July 1999-December 2010); Director, The Victory Funds (February 2005-July 2008). | | | 87 | | | Director, Vertiv Holdings Co. (VRT) (since August 2022); Director of Cincinnati Bell Inc. and Member, Audit Committee and Chairman, Governance and Nominating Committee (2008-2021); Director of Service Corporation International and Member, Audit Committee and Investment Committee; Director, Barnes Group Inc. (since July 2021); Director of Northern Kentucky University Foundation and Member, Investment Committee; Member of Chase College of Law Center for Law and Entrepreneurship Board of Advisors; Director of Best Transport (2005-2019); Director of Chase College of Law Board of Visitors; formerly, Member, University of Cincinnati Foundation Investment Committee. | |
Dr. Manuel H. Johnson
c/o Johnson Smick
International, Inc.
220 I Street, NE
Suite 200
Washington, D.C. 20002
Birth Year: 1949 | | Trustee | | Since
July
1991 | | Senior Partner, Johnson Smick International, Inc. (consulting firm); Chairperson of the Fixed Income, Liquidity and Alternatives Investment Committee (since January 2021), Chairperson of the Investment Committee (2006-2020) and Director or Trustee of various Morgan Stanley Funds (since July 1991); Co-Chairman and a founder of the Group of Seven Council (G7C) (international economic commission); formerly, Chairperson of the Audit Committee (July 1991-September 2006); Vice Chairman of the Board of Governors of the Federal Reserve System and Assistant Secretary of the U.S. Treasury. | | | 86 | | | Director of NVR, Inc. (home construction). | |
74
Morgan Stanley Institutional Fund Trust
Annual Report — September 30, 2023
Trustees and Officers Information (unaudited) (cont'd)
Independent Trustees: (cont'd)
Name, Address and Birth Year
of Independent Trustee | | Position(s)
Held with
Registrant | | Length of Time
Served* | | Principal Occupation(s) During Past 5 Years
and Other Relevant Professional Experience | | Number of
Funds in
Fund Complex
Overseen by
Independent
Trustee** | | Other Directorships
Held by Independent
Trustee During
Past 5 Years*** | |
Joseph K. Kearns
c/o Perkins Coie LLP
Counsel to the Independent
Trustees
1155 Avenue of the Americas
22nd Floor
New York, NY 10036
Birth Year: 1942 | | Trustee | | Since
August
1994 | | Senior Adviser, Kearns & Associates LLC (investment consulting); Chairperson of the Audit Committee (2006-2022) and Director or Trustee of various Morgan Stanley Funds (since August 1994); formerly, Deputy Chairperson of the Audit Committee (July 2003-September 2006); CFO of the J. Paul Getty Trust (1982-1999). | | | 87 | | | Director, Rubicon Investments (since February 2019); Prior to August 2016, Director of Electro Rent Corporation (equipment leasing); Prior to December 31, 2013, Director of The Ford Family Foundation. | |
Michael F. Klein
c/o Perkins Coie LLP
Counsel to the Independent
Trustees
1155 Avenue of the Americas
22nd Floor
New York, NY 10036
Birth Year: 1958 | | Trustee | | Since
August
2006 | | Chairperson of the Risk Committee (since January 2021); Managing Director, Aetos Alternatives Management, LP (since March 2000); Co-President, Aetos Alternatives Management, LP (since January 2004) and Co-Chief Executive Officer of Aetos Alternatives Management, LP (since August 2013); Chairperson of the Fixed Income Sub-Committee of the Investment Committee (2006-2020) and Director or Trustee of various Morgan Stanley Funds (since August 2006); formerly, Managing Director, Morgan Stanley & Co. Inc. and Morgan Stanley Dean Witter Investment Management and President, various Morgan Stanley Funds (June 1998-March 2000); Principal, Morgan Stanley & Co. Inc. and Morgan Stanley Dean Witter Investment Management (August 1997-December 1999). | | | 86 | | | Director of certain investment funds managed or sponsored by Aetos Alternatives Management, LP; Director of Sanitized AG and Sanitized Marketing AG (specialty chemicals). | |
Patricia A. Maleski
c/o Perkins Coie LLP
Counsel to the Independent
Trustees
1155 Avenue of the Americas
22nd Floor
New York, NY 10036
Birth Year: 1960 | | Trustee | | Since
January
2017 | | Director or Trustee of various Morgan Stanley Funds (since January 2017); Managing Director, JPMorgan Asset Management (2004-2016); Oversight and Control Head of Fiduciary and Conflicts of Interest Program (2015-2016); Chief Control Officer—Global Asset Management (2013-2015); President, JPMorgan Funds (2010-2013); Chief Administrative Officer (2004-2013); various other positions including Treasurer and Board Liaison (since 2001). | | | 87 | | | Trustee (since January 2022) and Treasurer (since January 2023), Nutley Family Service Bureau, Inc. | |
W. Allen Reed
c/o Perkins Coie LLP
Counsel to the Independent
Trustees
1155 Avenue of the Americas
22nd Floor
New York, NY 10036
Birth Year: 1947 | | Chair of the Board and Trustee | | Chair of the Board since August 2020 and Trustee since August 2006 | | Chair of the Boards of various Morgan Stanley Funds (since August 2020); Director or Trustee of various Morgan Stanley Funds (since August 2006); formerly, Vice Chair of the Boards of various Morgan Stanley Funds (January 2020-August 2020); President and Chief Executive Officer of General Motors Asset Management; Chairman and Chief Executive Officer of the GM Trust Bank and Corporate Vice President of General Motors Corporation (August 1994-December 2005). | | | 86 | | | Formerly, Director of Legg Mason, Inc. (2006-2019); and Director of the Auburn University Foundation (2010-2015). | |
* This is the earliest date the Trustee began serving the Morgan Stanley Funds. Each Trustee serves an indefinite term, until his or her successor is elected.
** The Fund Complex includes (as of December 31, 2022) all open-end and closed-end funds (including all of their portfolios) advised by Morgan Stanley Investment Management Inc. (the "Adviser") and any funds that have an adviser that is an affiliated person of the Adviser (including, but not limited to, Morgan Stanley AIP GP LP).
*** This includes any directorships at public companies and registered investment companies held by the Trustees at any time during the past five years.
75
Morgan Stanley Institutional Fund Trust
Annual Report — September 30, 2023
Trustees and Officers Information (unaudited) (cont'd)
Executive Officers:
Name, Address and Birth Year
of Executive Officer | | Position(s) Held
with
Registrant | | Length of
Time Served* | | Principal Occupation(s) During Past 5 Years | |
John H. Gernon
522 Fifth Avenue
New York, NY 10036
Birth Year: 1963 | | President and Principal Executive Officer | | Since
September
2013 | | President and Principal Executive Officer of the Equity and Fixed Income Funds and the Morgan Stanley AIP Funds (since September 2013) and the Liquidity Funds and various money market funds (since May 2014) in the Fund Complex; Managing Director of the Adviser. | |
Deidre A. Downes
1633 Broadway
New York, NY 10019
Birth Year: 1977 | | Chief Compliance Officer | | Since
November
2021 | | Executive Director of the Adviser (since January 2021) and Chief Compliance Officer of various Morgan Stanley Funds (since November 2021). Formerly, Vice President and Corporate Counsel at PGIM and Prudential Financial (October 2016-December 2020). | |
Francis J. Smith
522 Fifth Avenue
New York, NY 10036
Birth Year: 1965 | | Treasurer and Principal Financial Officer | | Treasurer since July 2003 and Principal Financial Officer since September
2002 | | Managing Director of the Adviser and various entities affiliated with the Adviser; Treasurer (since July 2003) and Principal Financial Officer of various Morgan Stanley Funds (since September 2002). | |
Mary E. Mullin
1633 Broadway
New York, NY 10019
Birth Year: 1967 | | Secretary | | Since
June
1999 | | Managing Director of the Adviser; Secretary of various Morgan Stanley Funds (since June 1999). | |
Michael J. Key
522 Fifth Avenue
New York, NY 10036
Birth Year: 1979 | | Vice President | | Since
June
2017 | | Vice President of the Equity and Fixed Income Funds, Liquidity Funds, various money market funds and the Morgan Stanley AIP Funds in the Fund Complex (since June 2017); Managing Director of the Adviser; Head of Product Development for Equity and Fixed Income Funds (since August 2013). | |
The Fund's statement of additional information includes further information about the Fund's Trustees and Officers, and is available without charge by visiting www.morganstanley.com/im or upon request by calling 1 (800) 869-6397.
* This is the earliest date the officer began serving the Morgan Stanley Funds. Each officer serves an indefinite term, until his or her successor is elected.
76
Morgan Stanley Institutional Fund Trust
Annual Report — September 30, 2023
Adviser and Administrator
Morgan Stanley Investment Management Inc.
522 Fifth Avenue
New York, New York 10036
Sub-Adviser
Morgan Stanley Investment Management Limited
25 Cabot Square, Canary Wharf
London, E14 4QA, England
Distributor
Morgan Stanley Distribution, Inc.
522 Fifth Avenue
New York, New York 10036
Dividend Disbursing and Transfer Agent
SS&C Global Investor & Distribution Solutions, Inc.
P.O. Box 219804
Kansas City, Missouri 64121-9804
Co-Transfer Agent
Eaton Vance Management
Two International Place
Boston, Massachusetts 02110
Custodian
State Street Bank and Trust Company
One Congress Street
Boston, Massachusetts 02114
Legal Counsel
Dechert LLP
1095 Avenue of the Americas
New York, New York 10036
Counsel to the Independent Trustees
Perkins Coie LLP
1155 Avenue of the Americas,
22nd Floor
New York, New York 10036
Independent Registered Public Accounting Firm
Ernst & Young LLP
200 Clarendon Street
Boston, Massachusetts 02116
77
Printed in U.S.A.
This Report has been prepared for shareholders and may be distributed to others only if preceded or accompanied by a current prospectus.
Morgan Stanley Investment Management Inc.
522 Fifth Avenue
New York, New York 10036
© 2023 Morgan Stanley. Morgan Stanley Distribution, Inc.

IFTGSANN
6048652 EXP 11.30.24

Morgan Stanley Institutional Fund Trust
High Yield Portfolio
Annual Report
September 30, 2023

Morgan Stanley Institutional Fund Trust
Annual Report — September 30, 2023
Table of Contents (unaudited)
Shareholders' Letter | | | 2 | | |
Expense Example | | | 3 | | |
Investment Overview | | | 4 | | |
Portfolio of Investments | | | 7 | | |
Statement of Assets and Liabilities | | | 13 | | |
Statement of Operations | | | 15 | | |
Statements of Changes in Net Assets | | | 16 | | |
Financial Highlights | | | 18 | | |
Notes to Financial Statements | | | 24 | | |
Report of Independent Registered Public Accounting Firm | | | 31 | | |
Investment Advisory Agreement Approval | | | 32 | | |
Liquidity Risk Management Program | | | 34 | | |
Important Notices | | | 35 | | |
Federal Tax Notice | | | 36 | | |
U.S. Customer Privacy Notice | | | 37 | | |
Trustees and Officers Information | | | 40 | | |
This report is authorized for distribution only when preceded or accompanied by a prospectus or summary prospectus of the applicable Fund of the Morgan Stanley Institutional Fund Trust. To receive a prospectus and/or statement of additional information ("SAI"), which contains more complete information such as investment objectives, charges, expenses, policies for voting proxies, risk considerations and describes in detail each of the Fund's investment policies to the prospective investor, please call toll free 1 (800) 869-6397. Please read the prospectuses carefully before you invest or send money.
Additionally, you can access information about the Fund, including performance, characteristics and investment team commentary through Morgan Stanley Investment Management's website: www.morganstanley.com/im.
Market forecasts provided in this report may not necessarily come to pass. There is no guarantee that any sectors mentioned will continue to perform as discussed herein or that securities in such sectors will be held by the Fund in the future. There is no assurance that a fund will achieve its investment objective. Funds are subject to market risk, which is the possibility that market values of securities owned by the Fund will decline and, therefore, the value of the Fund's shares may be less than what you paid for them. Accordingly, you can lose money investing in this Fund. Please see the prospectus for more complete information on investment risks.
1
Morgan Stanley Institutional Fund Trust
Annual Report — September 30, 2023
Shareholders' Letter (unaudited)
Dear Shareholders,
We are pleased to provide this Annual Report, in which you will learn how your investment in High Yield Portfolio (the "Fund") performed during the latest twelve-month period.
Morgan Stanley Investment Management is a client-centric, investor-led organization. Our global presence, intellectual capital, and breadth of products and services enable us to partner with investors to meet the evolving challenges of today's financial markets. We aim to deliver superior investment service and to empower our clients to make the informed decisions that help them reach their investment goals.
As always, we thank you for selecting Morgan Stanley Investment Management, and look forward to working with you in the months and years ahead.
Sincerely,

John H. Gernon
President and Principal Executive Officer
October 2023
2
Morgan Stanley Institutional Fund Trust
Annual Report — September 30, 2023
Expense Example (unaudited)
High Yield Portfolio
As a shareholder of the Fund, you may incur two types of costs: (1) transactional costs, including sales charge (loads) on purchase payments; and (2) ongoing costs, which may include advisory fees, administration fees, distribution and shareholder services fees; and other Fund expenses. This example is intended to help you understand your ongoing costs (in dollars) of investing in the Fund and to compare these costs with the ongoing costs of investing in other mutual funds.
This example is based on an investment of $1,000 invested at the beginning of the six-month period ended September 30, 2023 and held for the entire six-month period.
Actual Expenses
The table below provides information about actual account values and actual expenses. You may use the information in this table, together with the amount you invested, to estimate the expenses that you paid over the period. Simply divide your account value by $1,000 (for example, an $8,600 account value divided by $1,000 = 8.6), then multiply the result by the number in the table under the heading entitled "Actual Expenses Paid During Period" to estimate the expenses you paid on your account during this period.
Hypothetical Example for Comparison Purposes
The table below provides information about hypothetical account values and hypothetical expenses based on the Fund's actual expense ratio and an assumed rate of return of 5% per year before expenses, which is not the Fund's actual return. The hypothetical account values and expenses may not be used to estimate the actual ending account balance or expenses you paid for the period. You may use this information to compare the ongoing costs of investing in the Fund and other funds. To do so, compare this 5% hypothetical example with the 5% hypothetical examples that appear in the shareholder reports of the other funds.
Please note that the expenses shown in the table are meant to highlight your ongoing costs only and do not reflect any transactional costs, such as sales charges (loads, if applicable). Therefore, the information for each class in the table is useful in comparing ongoing costs only, and will not help you determine the relative total costs of owning different funds. In addition, if these transactional costs were included, your costs would have been higher.
| | | Beginning
Account
Value
4/1/23 | | Actual Ending
Account
Value
9/30/23 | | Hypothetical
Ending Account
Value | | Actual
Expenses
Paid
During
Period* | | Hypothetical
Expenses Paid
During Period* | | Net
Expense
Ratio
During
Period** | |
High Yield Portfolio Class I | | $ | 1,000.00 | | | $ | 1,024.10 | | | $ | 1,021.81 | | | $ | 3.30 | | | $ | 3.29 | | | | 0.65 | % | |
High Yield Portfolio Class A | | | 1,000.00 | | | | 1,021.10 | | | | 1,020.05 | | | | 5.07 | | | | 5.06 | | | | 1.00 | | |
High Yield Portfolio Class L | | | 1,000.00 | | | | 1,019.80 | | | | 1,018.80 | | | | 6.33 | | | | 6.33 | | | | 1.25 | | |
High Yield Portfolio Class C | | | 1,000.00 | | | | 1,018.50 | | | | 1,016.29 | | | | 8.86 | | | | 8.85 | | | | 1.75 | | |
High Yield Portfolio Class R6 | | | 1,000.00 | | | | 1,022.90 | | | | 1,021.96 | | | | 3.14 | | | | 3.14 | | | | 0.62 | | |
High Yield Portfolio Class IR | | | 1,000.00 | | | | 1,024.20 | | | | 1,021.96 | | | | 3.15 | �� | | | 3.14 | | | | 0.62 | | |
* Expenses are calculated using each Fund Class' annualized net expense ratio (as disclosed), multiplied by the average account value over the period and multiplied by 183/365 (to reflect the most recent one-half year period).
** Annualized.
3
Morgan Stanley Institutional Fund Trust
Annual Report — September 30, 2023
Investment Overview (unaudited)
High Yield Portfolio
The Fund seeks total return.
Performance
For the fiscal year ended September 30, 2023, the Fund's Class I shares had a total return based on net asset value and reinvestment of distributions per share of 10.34%, net of fees. The Fund's Class I shares outperformed against the Fund's benchmark, the Bloomberg U.S. Corporate High Yield Index(i) (the "Index"), which returned 10.28%.
Please keep in mind that double-digit returns are highly unusual and cannot be sustained. Investors should also be aware that these returns were primarily achieved during favorable market conditions.
Factors Affecting Performance
• As of September 30, 2023, the Index returned 10.28% during the one-year period. The yield-to-worst and spread-to-worst both decreased during the period, falling by 80 basis points (bps) and 150 bps to 8.88% and 412 bps, respectively.(ii)
• U.S. and global high yield markets got off to a strong start to the period and largely sustained the positive momentum until the Federal Reserve (Fed) meeting in December 2022. The yield on the 10-year U.S. Treasury fell more than 75 bps between mid-October and mid-December 2022 amid rising expectations that a modest softening in inflation readings would prompt a dovish softening in monetary policy from the Fed.(iii) Fed Chairman Powell's guidance effectively threw cold water on the fire at the conclusion of the December 2022 meeting, setting higher expectations for the terminal fed funds rate.
• High yield markets kicked off 2023 with a strong opening act in January, as investors put cash to work and risk assets broadly rallied. However, volatility returned in the following two months amid a string of stronger-than-expected macroeconomic readings and a focus on the vulnerability of U.S. regional banks. U.S. high yield markets reversed course briefly as volatility receded,
but volatility returned due to concerns around the U.S. debt ceiling and hawkish rhetoric from global central banks. High yield markets were able to regain their footing for most of the summer of 2023 amid the perception of an increased likelihood of a soft economic landing. However, the period ended with a softer tone as global rates moved sharply higher on the back of hawkish rhetoric from the Fed and the European Central Bank.
• For the Fund, from a sector perspective, an underweight position and favorable credit selection in the wirelines sector was the primary contributor to relative performance during the period. Relative outperformance in the sector was driven by an underweight position in a legacy wireline operator that is facing significant long-term secular challenges. Favorable credit selection in the restaurants sector also helped relative performance but was offset by challenging credit selection in the health care sector.
• From a ratings perspective, favorable credit selection and an underweight position in BB-rated bonds helped performance during the period. One of the primary contributors in the ratings segment was an overweight position in an oil field services company that reported strong third quarter 2023 earnings. Positioning within the B-rated segments also contributed positively to relative performance; however, this was offset by the Fund's credit selection in bonds rated CCC or below. A modest allocation to cash also hurt relative performance in a strong period for U.S. high yield markets.
Management Strategies
• The high yield market ended the reporting period with a historically attractive yield; however, our outlook and positioning remain somewhat cautious. The need for caution is predicated on prevailing catalysts that include restrictive monetary policy, near-term headwinds facing the U.S. consumer and high yield issuers, and valuations that trade inside historical norms. Supportive credit quality and
(i) "Bloomberg®" and the Bloomberg Index/Indices used are service marks of Bloomberg Finance L.P. and its affiliates, and have been licensed for use for certain purposes by Morgan Stanley Investment Management (MSIM). Bloomberg is not affiliated with MSIM, does not approve, endorse, review, or recommend any product, and. does not guarantee the timeliness, accurateness, or completeness of any data or information relating to any product.
(ii) Source: Bloomberg L.P. Data based on the Bloomberg U.S. Corporate High Yield Index as of September 30, 2023. One basis point = 0.01%
(iii) Source: Bloomberg L.P.
4
Morgan Stanley Institutional Fund Trust
Annual Report — September 30, 2023
Investment Overview (unaudited) (cont'd)
High Yield Portfolio
seniority will likely provide mitigating buoyancy over the near term. However, market participants should resist stretching for yield and instead focus on fundamentals and value with the expectation for an eventual — inevitable — return of volatility.
• Sector biases at the end of the period included overweight positions in defensive sectors trading with what we assess to be attractive long-term value, and underweight positions in cyclical sectors with asymmetric risk/return characteristics. We are also mindful of avoiding value traps in historically defensive sectors such as cable & satellite TV and telecommunications, where historically wide valuations come with deep secular headwinds laden with idiosyncratic fundamental pitfalls.
• Wider peak spreads in coming quarters seem inevitable, particularly moving into an election year in 2024, with ongoing war in Europe and declining relations coupled with increasingly aggressive overtures between Western allies and China. Risk and volatility, however, also represent the opportunity for attractive entry points that will likely reward disciplined long-term investors.

* Minimum Investment
In accordance with SEC regulations, the Fund's performance shown assumes that all recurring fees (including management fees) were deducted and all dividends and distributions were reinvested. The performance of Class A, Class L, Class C, Class R6 and Class IR shares will vary from the performance of Class I shares based upon their different inception dates and will be negatively impacted by additional fees assessed to those classes (where applicable).
5
Morgan Stanley Institutional Fund Trust
Annual Report — September 30, 2023
Investment Overview (unaudited) (cont'd)
High Yield Portfolio
Performance Compared to the Bloomberg U.S. Corporate High Yield Index(1) and the Lipper High Current Yield Bond Funds Index(2)
| | | Period Ended September 30, 2023
Total Returns(3) | |
| | | | | Average Annual | |
| | | One
Year | | Five
Years | | Ten
Years | | Since
Inception(8) | |
Fund — Class I Shares
w/o sales charges(4) | | | 10.34 | % | | | 2.01 | % | | | 3.99 | % | | | 5.48 | % | |
Fund — Class A Shares
w/o sales charges(4) | | | 9.98 | | | | 1.64 | | | | 3.62 | | | | 5.12 | | |
Fund — Class A Shares with
maximum 3.25% sales charges(4) | | | 6.45 | | | | 0.98 | | | | 3.28 | | | | 4.82 | | |
Fund — Class L Shares
w/o sales charges(4) | | | 9.76 | | | | 1.40 | | | | 3.36 | | | | 4.86 | | |
Fund — Class C Shares
w/o sales charges(6) | | | 9.16 | | | | 0.90 | | | | — | | | | 2.39 | | |
Fund — Class C Shares with
maximum 1.00% deferred
sales charges(6) | | | 8.16 | | | | 0.90 | | | | — | | | | 2.39 | | |
Fund — Class R6 Shares
w/o sales charges(5) | | | 10.35 | | | | 2.03 | | | | — | | | | 3.32 | | |
Fund — Class IR Shares
w/o sales charges(7) | | | 10.36 | | | | 2.04 | | | | — | | | | 2.29 | | |
Bloomberg U.S. Corporate
High Yield Index | | | 10.28 | | | | 2.96 | | | | 4.24 | | | | 4.94 | | |
Lipper High Current Yield Bond
Funds Index | | | 9.76 | | | | 2.69 | | | | 3.75 | | | | 4.48 | | |
Performance data quoted represents past performance, which is no guarantee of future results, and current performance may be lower or higher than the figures shown. Performance assumes that all dividends and distributions, if any, were reinvested. For the most recent month-end performance figures, please visit www.morganstanley.com/im. Investment returns and principal value will fluctuate so that Fund shares, when redeemed, may be worth more or less than their original cost. Total returns do not reflect the deduction of taxes that a shareholder would pay on Fund distributions or the redemption of Fund shares. Performance of share classes will vary due to differences in sales charges and expenses. The Fund returns are calculated based on the net asset value as of the last business day of the period.
(1) The Bloomberg U.S. Corporate High Yield Index measures the market of USD-denominated, non-investment grade, fixed-rate, taxable corporate bonds. Securities are classified as high yield if the middle rating of Moody's, Fitch, and S&P is Ba1/BB+/BB+ or below. The index excludes emerging market debt. The Index is unmanaged and its returns do not include any sales charges or fees. Such costs would lower performance. It is not possible to invest directly in an index.
(2) The Lipper High Current Yield Bond Funds Index is an equally weighted performance index of the largest qualifying funds (based on net assets) in the Lipper High Current Yield Bond Funds classification. The Index, which is adjusted for capital gains distributions and income dividends, is unmanaged and should not be considered an investment. There are currently 30 funds represented in this Index. As of the date of this report, the Fund was in the Lipper High Current Yield Bond Funds classification.
(3) Total returns for the Fund reflect expenses waived and/or reimbursed, if applicable, by the Adviser. Without such waivers and/or reimbursements, total returns would have been lower.
(4) Commenced operations on February 7, 2012.
(5) Commenced offering on March 28, 2014.
(6) Commenced offering on April 30, 2015. Class C shares will generally convert to Class A shares approximately eight years after the end of the calendar month in which the shares were purchased. Performance for periods greater than eight years reflects this conversion (beginning April 2023).
(7) Commenced offering on June 15, 2018.
(8) For comparative purposes, average annual since inception returns listed for the Indexes refer to the inception date of Class I of the Fund, not the inception of the Indexes.
6
Morgan Stanley Institutional Fund Trust
Annual Report — September 30, 2023
Portfolio of Investments
High Yield Portfolio
| | | Face
Amount
(000) | | Value
(000) | |
Fixed Income Securities (99.0%) | |
Corporate Bonds (96.4%) | |
Basic Materials (5.7%) | |
ASP Unifrax Holdings, Inc. | |
5.25%, 9/30/28 (a) | | $ | 735 | | | $ | 525 | | |
Eldorado Gold Corp. | |
6.25%, 9/1/29 (a) | | | 500 | | | | 432 | | |
HB Fuller Co. | |
4.25%, 10/15/28 | | | 515 | | | | 455 | | |
Herens Holdco Sarl | |
4.75%, 5/15/28 (a) | | | 600 | | | | 467 | | |
Hudbay Minerals, Inc. | |
4.50%, 4/1/26 (a) | | | 359 | | | | 336 | | |
IAMGOLD Corp. | |
5.75%, 10/15/28 (a) | | | 574 | | | | 450 | | |
International Flavors & Fragrances, Inc. | |
1.23%, 10/1/25 (a) | | | 300 | | | | 269 | | |
Iris Holding, Inc. | |
10.00%, 12/15/28 (a) | | | 600 | | | | 473 | | |
Kaiser Aluminum Corp. | |
4.50%, 6/1/31 (a) | | | 250 | | | | 198 | | |
4.63%, 3/1/28 (a) | | | 175 | | | | 153 | | |
Minerals Technologies, Inc. | |
5.00%, 7/1/28 (a) | | | 500 | | | | 459 | | |
NOVA Chemicals Corp. | |
4.25%, 5/15/29 (a) | | | 300 | | | | 234 | | |
Novelis Corp. | |
4.75%, 1/30/30 (a) | | | 375 | | | | 325 | | |
Nufarm Australia Ltd./Nufarm Americas, Inc. | |
5.00%, 1/27/30 (a) | | | 500 | | | | 442 | | |
TMS International Corp. | |
6.25%, 4/15/29 (a) | | | 525 | | | | 435 | | |
Trinseo Materials Operating SCA/Trinseo
Materials Finance, Inc. | |
5.13%, 4/1/29 (a) | | | 525 | | | | 274 | | |
5.38%, 9/1/25 (a) | | | 80 | | | | 74 | | |
| | | | 6,001 | | |
Communications (8.6%) | |
Altice France SA | |
5.13%, 7/15/29 (a) | | | 325 | | | | 232 | | |
Arches Buyer, Inc. | |
6.13%, 12/1/28 (a) | | | 310 | | | | 252 | | |
Audacy Capital Corp. | |
6.50%, 5/1/27 (a) | | | 900 | | | | 19 | | |
Block Communications, Inc. | |
4.88%, 3/1/28 (a) | | | 693 | | | | 574 | | |
C&W Senior Financing DAC | |
6.88%, 9/15/27 (a) | | | 250 | | | | 220 | | |
CCO Holdings LLC/CCO Holdings Capital Corp. | |
5.00%, 2/1/28 (a) | | | 450 | | | | 409 | | |
Charter Communications Operating LLC/Charter
Communications Operating Capital | |
3.85%, 4/1/61 | | | 460 | | | | 257 | | |
| | | Face
Amount
(000) | | Value
(000) | |
Ciena Corp. | |
4.00%, 1/31/30 (a) | | $ | 785 | | | $ | 665 | | |
Clear Channel Outdoor Holdings, Inc. | |
7.75%, 4/15/28 (a) | | | 510 | | | | 408 | | |
CSC Holdings LLC | |
11.25%, 5/15/28 (a) | | | 680 | | | | 678 | | |
EquipmentShare.com, Inc. | |
9.00%, 5/15/28 (a) | | | 725 | | | | 698 | | |
GCI LLC | |
4.75%, 10/15/28 (a) | | | 300 | | | | 259 | | |
Gray Escrow II, Inc. | |
5.38%, 11/15/31 (a) | | | 500 | | | | 328 | | |
Gray Television, Inc. | |
4.75%, 10/15/30 (a) | | | 25 | | | | 17 | | |
Iliad Holding SASU | |
7.00%, 10/15/28 (a) | | | 200 | | | | 182 | | |
Lamar Media Corp. | |
4.00%, 2/15/30 | | | 200 | | | | 170 | | |
LCPR Senior Secured Financing DAC | |
6.75%, 10/15/27 (a) | | | 520 | | | | 478 | | |
Midcontinent Communications/Midcontinent
Finance Corp. | |
5.38%, 8/15/27 (a) | | | 576 | | | | 534 | | |
Outfront Media Capital LLC/Outfront Media
Capital Corp. | |
4.63%, 3/15/30 (a) | | | 350 | | | | 276 | | |
Radiate Holdco LLC/Radiate Finance, Inc. | |
6.50%, 9/15/28 (a) | | | 525 | | | | 277 | | |
Sable International Finance Ltd. | |
5.75%, 9/7/27 (a) | | | 249 | | | | 226 | | |
Spotify USA, Inc. | |
0.00%, 3/15/26 | | | 500 | | | | 427 | | |
TEGNA, Inc. | |
5.00%, 9/15/29 | | | 300 | | | | 252 | | |
Townsquare Media, Inc. | |
6.88%, 2/1/26 (a) | | | 100 | | | | 95 | | |
Viavi Solutions, Inc. | |
3.75%, 10/1/29 (a) | | | 650 | | | | 529 | | |
Virgin Media Finance PLC | |
5.00%, 7/15/30 (a) | | | 400 | | | | 315 | | |
Ziggo BV | |
4.88%, 1/15/30 (a) | | | 350 | | | | 286 | | |
| | | | 9,063 | | |
Consumer, Cyclical (24.4%) | |
Acushnet Co. | |
7.38%, 10/15/28 (a) | | | 80 | | | | 81 | | |
Air Canada | |
3.88%, 8/15/26 (a) | | | 300 | | | | 272 | | |
Allwyn Entertainment Financing UK PLC | |
7.88%, 4/30/29 (a) | | | 245 | | | | 248 | | |
American Airlines, Inc. | |
7.25%, 2/15/28 (a) | | | 117 | | | | 112 | | |
The accompanying notes are an integral part of the financial statements.
7
Morgan Stanley Institutional Fund Trust
Annual Report — September 30, 2023
Portfolio of Investments (cont'd)
High Yield Portfolio
| | | Face
Amount
(000) | | Value
(000) | |
Consumer, Cyclical (cont'd) | |
American Airlines, Inc./AAdvantage Loyalty IP Ltd. | |
5.50%, 4/20/26 (a) | | $ | 182 | | | $ | 177 | | |
5.75%, 4/20/29 (a) | | | 403 | | | | 375 | | |
Arko Corp. | |
5.13%, 11/15/29 (a) | | | 675 | | | | 545 | | |
Ashton Woods USA LLC/Ashton Woods Finance Co. | |
4.63%, 4/1/30 (a) | | | 500 | | | | 410 | | |
At Home Group, Inc. | |
4.88%, 7/15/28 (a) | | | 255 | | | | 109 | | |
BCPE Empire Holdings, Inc. | |
7.63%, 5/1/27 (a) | | | 280 | | | | 266 | | |
Boyne USA, Inc. | |
4.75%, 5/15/29 (a) | | | 490 | | | | 429 | | |
Brinker International, Inc. | |
8.25%, 7/15/30 (a) | | | 280 | | | | 270 | | |
Carrols Restaurant Group, Inc. | |
5.88%, 7/1/29 (a) | | | 1,010 | | | | 849 | | |
Cars.com, Inc. | |
6.38%, 11/1/28 (a) | | | 695 | | | | 632 | | |
CCM Merger, Inc. | |
6.38%, 5/1/26 (a) | | | 550 | | | | 527 | | |
CD&R Smokey Buyer, Inc. | |
6.75%, 7/15/25 (a) | | | 885 | | | | 854 | | |
Cushman & Wakefield U.S. Borrower LLC | |
6.75%, 5/15/28 (a) | | | 250 | | | | 231 | | |
Dealer Tire LLC/DT Issuer LLC | |
8.00%, 2/1/28 (a) | | | 950 | | | | 892 | | |
DraftKings Holdings, Inc. | |
0.00%, 3/15/28 | | | 465 | | | | 356 | | |
Dream Finders Homes, Inc. | |
8.25%, 8/15/28 (a) | | | 500 | | | | 504 | | |
Evergreen Acqco 1 LP/TVI, Inc. | |
9.75%, 4/26/28 (a) | | | 325 | | | | 335 | | |
Everi Holdings, Inc. | |
5.00%, 7/15/29 (a) | | | 300 | | | | 259 | | |
Ferrellgas LP/Ferrellgas Finance Corp. | |
5.88%, 4/1/29 (a) | | | 1,075 | | | | 968 | | |
Ford Motor Co. | |
0.00%, 3/15/26 | | | 275 | | | | 272 | | |
3.25%, 2/12/32 | | | 1,090 | | | | 841 | | |
GYP Holdings III Corp. | |
4.63%, 5/1/29 (a) | | | 260 | | | | 224 | | |
Hanesbrands, Inc. | |
4.88%, 5/15/26 (a) | | | 320 | | | | 294 | | |
Hawaiian Brand Intellectual Property Ltd./
HawaiianMiles Loyalty Ltd. | |
5.75%, 1/20/26 (a) | | | 300 | | | | 270 | | |
Hilton Domestic Operating Co., Inc. | |
3.63%, 2/15/32 (a) | | | 250 | | | | 202 | | |
Jacobs Entertainment, Inc. | |
6.75%, 2/15/29 (a) | | | 620 | | | | 536 | | |
| | | Face
Amount
(000) | | Value
(000) | |
JB Poindexter & Co., Inc. | |
7.13%, 4/15/26 (a) | | $ | 850 | | | $ | 828 | | |
Ken Garff Automotive LLC | |
4.88%, 9/15/28 (a) | | | 275 | | | | 235 | | |
Kohl's Corp. | |
4.63%, 5/1/31 (b) | | | 307 | | | | 207 | | |
LCM Investments Holdings II LLC | |
4.88%, 5/1/29 (a) | | | 275 | | | | 234 | | |
LGI Homes, Inc. | |
4.00%, 7/15/29 (a) | | | 330 | | | | 264 | | |
Lindblad Expeditions Holdings, Inc. | |
9.00%, 5/15/28 (a) | | | 199 | | | | 199 | | |
Lindblad Expeditions LLC | |
6.75%, 2/15/27 (a) | | | 395 | | | | 370 | | |
Lithia Motors, Inc. | |
3.88%, 6/1/29 (a) | | | 400 | | | | 337 | | |
Macy's Retail Holdings LLC | |
5.88%, 3/15/30 (a) | | | 500 | | | | 424 | | |
Mclaren Finance PLC | |
7.50%, 8/1/26 (a) | | | 450 | | | | 393 | | |
Michaels Cos., Inc. | |
7.88%, 5/1/29 (a) | | | 520 | | | | 340 | | |
Midwest Gaming Borrower LLC/Midwest Gaming
Finance Corp. | |
4.88%, 5/1/29 (a) | | | 400 | | | | 341 | | |
New Home Co., Inc. | |
8.25%, 10/15/27 (a)(b) | | | 1,058 | | | | 984 | | |
Newell Brands, Inc. | |
5.20%, 4/1/26 (b) | | | 320 | | | | 302 | | |
Patrick Industries, Inc. | |
4.75%, 5/1/29 (a) | | | 150 | | | | 125 | | |
Peloton Interactive, Inc. | |
0.00%, 2/15/26 | | | 595 | | | | 451 | | |
PetSmart, Inc./PetSmart Finance Corp. | |
4.75%, 2/15/28 (a) | | | 275 | | | | 241 | | |
Premier Entertainment Sub LLC/Premier
Entertainment Finance Corp. | |
5.88%, 9/1/31 (a) | | | 520 | | | | 384 | | |
Raptor Acquisition Corp./Raptor Co.-Issuer LLC | |
4.88%, 11/1/26 (a) | | | 175 | | | | 164 | | |
Real Hero Merger Sub 2, Inc. | |
6.25%, 2/1/29 (a) | | | 745 | | | | 576 | | |
Resorts World Las Vegas LLC/RWLV Capital, Inc. | |
4.63%, 4/16/29 | | | 600 | | | | 480 | | |
Rivian Holdings LLC/Rivian LLC/Rivian Automotive LLC | |
6 Month USD LIBOR + 5.63%, 10.93%,
10/15/26 (a)(c) | | | 730 | | | | 735 | | |
Speedway Motorsports LLC/Speedway Funding II, Inc. | |
4.88%, 11/1/27 (a) | | | 900 | | | | 818 | | |
Station Casinos LLC | |
4.50%, 2/15/28 (a) | | | 200 | | | | 175 | | |
The accompanying notes are an integral part of the financial statements.
8
Morgan Stanley Institutional Fund Trust
Annual Report — September 30, 2023
Portfolio of Investments (cont'd)
High Yield Portfolio
| | | Face
Amount
(000) | | Value
(000) | |
Consumer, Cyclical (cont'd) | |
Sugarhouse HSP Gaming Prop Mezz LP/Sugarhouse
HSP Gaming Finance Corp. | |
5.88%, 5/15/25 (a) | | $ | 660 | | | $ | 637 | | |
Tenneco, Inc. | |
8.00%, 11/17/28 (a) | | | 430 | | | | 350 | | |
Thor Industries, Inc. | |
4.00%, 10/15/29 (a) | | | 275 | | | | 227 | | |
Titan International, Inc. | |
7.00%, 4/30/28 | | | 285 | | | | 267 | | |
United Airlines, Inc. | |
4.63%, 4/15/29 (a) | | | 475 | | | | 409 | | |
Viking Cruises Ltd. | |
5.88%, 9/15/27 (a) | | | 630 | | | | 576 | | |
VistaJet Malta Finance PLC/Vista Management
Holding, Inc. | |
9.50%, 6/1/28 (a) | | | 165 | | | | 145 | | |
Wheel Pros, Inc. | |
6.50%, 5/15/29 (a) | | | 600 | | | | 202 | | |
White Cap Buyer LLC | |
6.88%, 10/15/28 (a) | | | 400 | | | | 354 | | |
Wolverine World Wide, Inc. | |
4.00%, 8/15/29 (a) | | | 350 | | | | 260 | | |
ZF North America Capital, Inc. | |
6.88%, 4/14/28 (a) | | | 385 | | | | 377 | | |
| | | | 25,751 | | |
Consumer, Non-Cyclical (14.5%) | |
AHP Health Partners, Inc. | |
5.75%, 7/15/29 (a) | | | 860 | | | | 727 | | |
Alta Equipment Group, Inc. | |
5.63%, 4/15/26 (a) | | | 610 | | | | 563 | | |
AMN Healthcare, Inc. | |
4.00%, 4/15/29 (a) | | | 450 | | | | 382 | | |
APi Group DE, Inc. | |
4.13%, 7/15/29 (a) | | | 350 | | | | 295 | | |
Bausch & Lomb Escrow Corp. | |
8.38%, 10/1/28 (a) | | | 270 | | | | 271 | | |
Block, Inc. | |
0.25%, 11/1/27 | | | 275 | | | | 208 | | |
Carriage Services, Inc. | |
4.25%, 5/15/29 (a) | | | 250 | | | | 214 | | |
Chobani LLC/Chobani Finance Corp., Inc. | |
4.63%, 11/15/28 (a) | | | 425 | | | | 375 | | |
CoreLogic, Inc. | |
4.50%, 5/1/28 (a) | | | 250 | | | | 190 | | |
CPI CG, Inc. | |
8.63%, 3/15/26 (a) | | | 448 | | | | 442 | | |
Darling Ingredients, Inc. | |
6.00%, 6/15/30 (a) | | | 200 | | | | 190 | | |
Edgewell Personal Care Co. | |
5.50%, 6/1/28 (a) | | | 250 | | | | 231 | | |
Esc Cb National Cineme | |
0.00%, 8/15/26 (d)(e) | | | 600 | | | | — | | |
| | | Face
Amount
(000) | | Value
(000) | |
Fortrea Holdings, Inc. | |
7.50%, 7/1/30 (a) | | $ | 425 | | | $ | 414 | | |
Garda World Security Corp. | |
9.50%, 11/1/27 (a) | | | 250 | | | | 239 | | |
Grifols SA | |
4.75%, 10/15/28 (a) | | | 625 | | | | 534 | | |
GXO Logistics, Inc. | |
1.65%, 7/15/26 | | | 325 | | | | 286 | | |
Heartland Dental LLC/Heartland Dental Finance Corp. | |
8.50%, 5/1/26 (a) | | | 491 | | | | 463 | | |
10.50%, 4/30/28 (a) | | | 460 | | | | 463 | | |
H-Food Holdings LLC/Hearthside Finance Co., Inc. | |
8.50%, 6/1/26 (a) | | | 400 | | | | 100 | | |
Ingles Markets, Inc. | |
4.00%, 6/15/31 (a) | | | 500 | | | | 411 | | |
Legends Hospitality Holding Co. LLC/Legends
Hospitality Co-Issuer, Inc. | |
5.00%, 2/1/26 (a) | | | 500 | | | | 491 | | |
LifePoint Health, Inc. | |
5.38%, 1/15/29 (a) | | | 550 | | | | 385 | | |
9.88%, 8/15/30 (a) | | | 285 | | | | 276 | | |
Medline Borrower LP | |
3.88%, 4/1/29 (a) | | | 500 | | | | 423 | | |
Metis Merger Sub LLC | |
6.50%, 5/15/29 (a) | | | 400 | | | | 338 | | |
ModivCare Escrow Issuer, Inc. | |
5.00%, 10/1/29 (a) | | | 600 | | | | 431 | | |
ModivCare, Inc. | |
5.88%, 11/15/25 (a) | | | 250 | | | | 238 | | |
Nathan's Famous, Inc. | |
6.63%, 11/1/25 (a) | | | 359 | | | | 358 | | |
Option Care Health, Inc. | |
4.38%, 10/31/29 (a) | | | 380 | | | | 329 | | |
P&L Development LLC/PLD Finance Corp. | |
7.75%, 11/15/25 (a) | | | 1,085 | | | | 794 | | |
Performance Food Group, Inc. | |
4.25%, 8/1/29 (a) | | | 300 | | | | 260 | | |
Perrigo Finance Unlimited Co. | |
4.90%, 12/15/44 | | | 325 | | | | 241 | | |
PROG Holdings, Inc. | |
6.00%, 11/15/29 (a) | | | 325 | | | | 284 | | |
Signal Parent, Inc. | |
6.13%, 4/1/29 (a) | | | 1,070 | | | | 654 | | |
Sotheby's | |
7.38%, 10/15/27 (a) | | | 450 | | | | 415 | | |
TriNet Group, Inc. | |
3.50%, 3/1/29 (a) | | | 340 | | | | 287 | | |
U.S. Acute Care Solutions LLC | |
6.38%, 3/1/26 (a) | | | 825 | | | | 711 | | |
VT Topco, Inc. | |
8.50%, 8/15/30 (a) | | | 255 | | | | 253 | | |
WASH Multifamily Acquisition, Inc. | |
5.75%, 4/15/26 (a) | | | 500 | | | | 467 | | |
The accompanying notes are an integral part of the financial statements.
9
Morgan Stanley Institutional Fund Trust
Annual Report — September 30, 2023
Portfolio of Investments (cont'd)
High Yield Portfolio
| | | Face
Amount
(000) | | Value
(000) | |
Consumer, Non-Cyclical (cont'd) | |
ZipRecruiter, Inc. | |
5.00%, 1/15/30 (a) | | $ | 835 | | | $ | 656 | | |
| | | | 15,289 | | |
Energy (9.7%) | |
Archrock Partners LP/Archrock Partners Finance Corp. | |
6.25%, 4/1/28 (a) | | | 200 | | | | 187 | | |
6.88%, 4/1/27 (a) | | | 300 | | | | 291 | | |
Baytex Energy Corp. | |
8.50%, 4/30/30 (a) | | | 105 | | | | 106 | | |
8.75%, 4/1/27 (a) | | | 556 | | | | 565 | | |
CITGO Petroleum Corp. | |
6.38%, 6/15/26 (a) | | | 610 | | | | 603 | | |
CNX Midstream Partners LP | |
4.75%, 4/15/30 (a) | | | 450 | | | | 375 | | |
Continental Resources, Inc. | |
2.88%, 4/1/32 (a) | | | 825 | | | | 618 | | |
CQP Holdco LP/BIP-V Chinook Holdco LLC | |
5.50%, 6/15/31 (a) | | | 575 | | | | 510 | | |
Diamondback Energy, Inc. | |
4.25%, 3/15/52 | | | 300 | | | | 213 | | |
Global Partners LP/GLP Finance Corp. | |
7.00%, 8/1/27 | | | 690 | | | | 673 | | |
ITT Holdings LLC | |
6.50%, 8/1/29 (a) | | | 295 | | | | 250 | | |
Magnolia Oil & Gas Operating LLC/Magnolia
Oil & Gas Finance Corp. | |
6.00%, 8/1/26 (a) | | | 550 | | | | 532 | | |
Martin Midstream Partners LP/Martin
Midstream Finance Corp. | |
11.50%, 2/15/28 (a) | | | 545 | | | | 554 | | |
Matador Resources Co. | |
5.88%, 9/15/26 | | | 274 | | | | 265 | | |
6.88%, 4/15/28 (a) | | | 390 | | | | 383 | | |
NextEra Energy Partners LP | |
2.50%, 6/15/26 (a) | | | 715 | | | | 610 | | |
Oceaneering International, Inc. | |
6.00%, 2/1/28 (a)(f) | | | 925 | | | | 872 | | |
ONEOK, Inc. | |
3.10%, 3/15/30 | | | 225 | | | | 188 | | |
Rockies Express Pipeline LLC | |
3.60%, 5/15/25 (a) | | | 300 | | | | 284 | | |
Sitio Royalties Operating Partnership LP/Sitio
Finance Corp. | |
7.88%, 11/1/28 (a) | | | 470 | | | | 472 | | |
Southwestern Energy Co. | |
4.75%, 2/1/32 | | | 300 | | | | 258 | | |
Tallgrass Energy Partners LP/Tallgrass Energy
Finance Corp. | |
6.00%, 12/31/30 (a) | | | 500 | | | | 442 | | |
Targa Resources Partners LP/Targa Resources
Partners Finance Corp. | |
4.00%, 1/15/32 | | | 600 | | | | 506 | | |
| | | Face
Amount
(000) | | Value
(000) | |
Vermilion Energy, Inc. | |
5.63%, 3/15/25 (a) | | $ | 575 | | | $ | 561 | | |
| | | | 10,318 | | |
Finance (8.7%) | |
AG TTMT Escrow Issuer LLC | |
8.63%, 9/30/27 (a) | | | 200 | | | | 201 | | |
AmWINS Group, Inc. | |
4.88%, 6/30/29 (a) | | | 350 | | | | 307 | | |
BroadStreet Partners, Inc. | |
5.88%, 4/15/29 (a) | | | 425 | | | | 375 | | |
Castlelake Aviation Finance DAC | |
5.00%, 4/15/27 (a) | | | 370 | | | | 338 | | |
Compass Group Diversified Holdings LLC | |
5.25%, 4/15/29 (a) | | | 685 | | | | 600 | | |
CTR Partnership LP/CareTrust Capital Corp. | |
3.88%, 6/30/28 (a) | | | 900 | | | | 771 | | |
Global Net Lease, Inc./Global Net Lease Operating
Partnership LP | |
3.75%, 12/15/27 (a) | | | 300 | | | | 233 | | |
Howard Hughes Corp. | |
4.13%, 2/1/29 (a) | | | 200 | | | | 160 | | |
Icahn Enterprises LP/Icahn Enterprises Finance Corp. | |
4.75%, 9/15/24 | | | 245 | | | | 236 | | |
6.25%, 5/15/26 | | | 475 | | | | 442 | | |
6.38%, 12/15/25 | | | 60 | | | | 57 | | |
Iron Mountain, Inc. | |
5.25%, 7/15/30 (a) | | | 300 | | | | 263 | | |
Jane Street Group/JSG Finance, Inc. | |
4.50%, 11/15/29 (a) | | | 775 | | | | 667 | | |
Jefferies Finance LLC/JFIN Co.-Issuer Corp. | |
5.00%, 8/15/28 (a) | | | 500 | | | | 422 | | |
Jefferson Capital Holdings LLC | |
6.00%, 8/15/26 (a) | | | 731 | | | | 647 | | |
LPL Holdings, Inc. | |
4.00%, 3/15/29 (a) | | | 655 | | | | 572 | | |
Macquarie Airfinance Holdings Ltd. | |
8.38%, 5/1/28 (a) | | | 320 | | | | 325 | | |
MGIC Investment Corp. | |
5.25%, 8/15/28 | | | 275 | | | | 256 | | |
Oxford Finance LLC/Oxford Finance Co-Issuer II Inc. | |
6.38%, 2/1/27 (a) | | | 750 | | | | 698 | | |
RHP Hotel Properties LP/RHP Finance Corp. | |
4.75%, 10/15/27 | | | 250 | | | | 228 | | |
RLJ Lodging Trust LP | |
3.75%, 7/1/26 (a) | | | 250 | | | | 226 | | |
Rocket Mortgage LLC/Rocket Mortgage
Co.-Issuer, Inc. | |
2.88%, 10/15/26 (a) | | | 370 | | | | 326 | | |
VistaJet Malta Finance PLC/Vista Management
Holding, Inc. | |
6.38%, 2/1/30 (a) | | | 1,075 | | | | 832 | | |
| | | | 9,182 | | |
The accompanying notes are an integral part of the financial statements.
10
Morgan Stanley Institutional Fund Trust
Annual Report — September 30, 2023
Portfolio of Investments (cont'd)
High Yield Portfolio
| | | Face
Amount
(000) | | Value
(000) | |
Industrials (18.5%) | |
ACProducts Holdings, Inc. | |
6.38%, 5/15/29 (a) | | $ | 625 | | | $ | 413 | | |
AmeriTex HoldCo Intermediate LLC | |
10.25%, 10/15/28 (a) | | | 370 | | | | 366 | | |
Ball Corp. | |
3.13%, 9/15/31 | | | 400 | | | | 314 | | |
Bombardier, Inc. | |
6.00%, 2/15/28 (a) | | | 525 | | | | 477 | | |
Brundage-Bone Concrete Pumping Holdings, Inc. | |
6.00%, 2/1/26 (a) | | | 400 | | | | 381 | | |
Cargo Aircraft Management, Inc. | |
4.75%, 2/1/28 (a) | | | 500 | | | | 447 | | |
Carriage Purchaser, Inc. | |
7.88%, 10/15/29 (a) | | | 1,010 | | | | 768 | | |
Coherent Corp. | |
5.00%, 12/15/29 (a) | | | 500 | | | | 434 | | |
Covanta Holding Corp. | |
4.88%, 12/1/29 (a) | | | 485 | | | | 399 | | |
5.00%, 9/1/30 | | | 130 | | | | 104 | | |
CP Atlas Buyer, Inc. | |
7.00%, 12/1/28 (a) | | | 399 | | | | 313 | | |
CryoPort, Inc. | |
0.75%, 12/1/26 (a) | | | 680 | | | | 541 | | |
Dycom Industries, Inc. | |
4.50%, 4/15/29 (a) | | | 960 | | | | 831 | | |
Emerald Debt Merger Sub LLC | |
6.63%, 12/15/30 (a) | | | 375 | | | | 361 | | |
EnerSys | |
4.38%, 12/15/27 (a) | | | 455 | | | | 414 | | |
EnPro Industries, Inc. | |
5.75%, 10/15/26 | | | 500 | | | | 480 | | |
Enviri Corp. | |
5.75%, 7/31/27 (a) | | | 1,167 | | | | 1,028 | | |
Fly Leasing Ltd. | |
7.00%, 10/15/24 (a) | | | 1,645 | | | | 1,512 | | |
Great Lakes Dredge & Dock Corp. | |
5.25%, 6/1/29 (a) | | | 880 | | | | 723 | | |
Hillenbrand, Inc. | |
3.75%, 3/1/31 | | | 250 | | | | 201 | | |
JPW Industries Holding Corp. | |
9.00%, 10/1/24 (a) | | | 950 | | | | 911 | | |
Madison IAQ LLC | |
5.88%, 6/30/29 (a) | | | 750 | | | | 605 | | |
Manitowoc Co., Inc. | |
9.00%, 4/1/26 (a) | | | 530 | | | | 529 | | |
Moog, Inc. | |
4.25%, 12/15/27 (a) | | | 500 | | | | 452 | | |
Mueller Water Products, Inc. | |
4.00%, 6/15/29 (a) | | | 450 | | | | 392 | | |
New Enterprise Stone & Lime Co., Inc. | |
5.25%, 7/15/28 (a) | | | 450 | | | | 404 | | |
| | | Face
Amount
(000) | | Value
(000) | |
OI European Group BV | |
4.75%, 2/15/30 (a) | | $ | 250 | | | $ | 218 | | |
PGT Innovations, Inc. | |
4.38%, 10/1/29 (a) | | | 635 | | | | 586 | | |
Seaspan Corp. | |
5.50%, 8/1/29 (a) | | | 650 | | | | 522 | | |
Smyrna Ready Mix Concrete LLC | |
6.00%, 11/1/28 (a) | | | 300 | | | | 277 | | |
TK Elevator U.S. Newco, Inc. | |
5.25%, 7/15/27 (a) | | | 325 | | | | 298 | | |
TopBuild Corp. | |
3.63%, 3/15/29 (a) | | | 250 | | | | 213 | | |
TransDigm, Inc. | |
5.50%, 11/15/27 | | | 300 | | | | 281 | | |
Trident TPI Holdings, Inc. | |
12.75%, 12/31/28 (a) | | | 270 | | | | 283 | | |
TriMas Corp. | |
4.13%, 4/15/29 (a) | | | 400 | | | | 343 | | |
Trivium Packaging Finance BV | |
8.50%, 8/15/27 (a) | | | 300 | | | | 275 | | |
TTM Technologies, Inc. | |
4.00%, 3/1/29 (a) | | | 450 | | | | 374 | | |
VM Consolidated, Inc. | |
5.50%, 4/15/29 (a) | | | 545 | | | | 491 | | |
Vontier Corp. | |
2.95%, 4/1/31 | | | 675 | | | | 521 | | |
Waste Pro USA, Inc. | |
5.50%, 2/15/26 (a) | | | 475 | | | | 444 | | |
Watco Cos. LLC/Watco Finance Corp. | |
6.50%, 6/15/27 (a) | | | 425 | | | | 404 | | |
XPO Escrow Sub LLC | |
7.50%, 11/15/27 (a) | | | 200 | | | | 203 | | |
| | | | 19,533 | | |
Technology (4.7%) | |
AthenaHealth Group, Inc. | |
6.50%, 2/15/30 (a) | | | 650 | | | | 545 | | |
Clarivate Science Holdings Corp. | |
4.88%, 7/1/29 (a) | | | 450 | | | | 384 | | |
Cloud Software Group, Inc. | |
9.00%, 9/30/29 (a) | | | 238 | | | | 207 | | |
Concentrix Corp. | |
6.60%, 8/2/28 | | | 350 | | | | 338 | | |
Crowdstrike Holdings, Inc. | |
3.00%, 2/15/29 | | | 495 | | | | 417 | | |
KBR, Inc. | |
4.75%, 9/30/28 (a) | | | 430 | | | | 379 | | |
Kyndryl Holdings, Inc. | |
2.70%, 10/15/28 | | | 590 | | | | 485 | | |
McAfee Corp. | |
7.38%, 2/15/30 (a) | | | 65 | | | | 55 | | |
Playtika Holding Corp. | |
4.25%, 3/15/29 (a) | | | 640 | | | | 535 | | |
The accompanying notes are an integral part of the financial statements.
11
Morgan Stanley Institutional Fund Trust
Annual Report — September 30, 2023
Portfolio of Investments (cont'd)
High Yield Portfolio
| | | Face
Amount
(000) | | Value
(000) | |
Technology (cont'd) | |
Rackspace Technology Global, Inc. | |
5.38%, 12/1/28 (a) | | $ | 625 | | | $ | 210 | | |
ROBLOX Corp. | |
3.88%, 5/1/30 (a) | | | 600 | | | | 482 | | |
Rocket Software, Inc. | |
6.50%, 2/15/29 (a) | | | 745 | | | | 616 | | |
Unisys Corp. | |
6.88%, 11/1/27 (a) | | | 375 | | | | 281 | | |
| | | | 4,934 | | |
Utilities (1.6%) | |
Leeward Renewable Energy Operations LLC | |
4.25%, 7/1/29 (a) | | | 910 | | | | 749 | | |
Pike Corp. | |
5.50%, 9/1/28 (a) | | | 545 | | | | 478 | | |
TransAlta Corp. | |
7.75%, 11/15/29 | | | 525 | | | | 532 | | |
| | | | 1,759 | | |
| | | | 101,830 | | |
Variable Rate Senior Loan Interests (2.6%) | |
Consumer, Cyclical (0.4%) | |
Peloton Interactive, Inc.
Term Loan
6 Month USD SOFR + 6.50%, 12.26%, 5/25/27 (c) | | | 395 | | | | 397 | | |
Consumer, Non-Cyclical (1.6%) | |
AlixPartners LLP | |
2021 Term Loan B
1 Month USD SOFR + 2.75%, 8.18%, 2/4/28 (c) | | | 193 | | | | 193 | | |
Pearl Intermediate Parent LLC | |
2018 2nd Lien Term Loan
1 Month USD SOFR + 6.25%, 11.68%, 2/13/26 (c) | | | 500 | | | | 495 | | |
Pluto Acquisition I, Inc. | |
2021 1st Lien Term Loan
3 Month USD SOFR + 4.00%, 9.32%, 6/22/26 (c) | | | 480 | | | | 421 | | |
Surgery Center Holdings, Inc. | |
2021 Term Loan
1 Month USD SOFR + 3.75%, 9.18%, 8/31/26 (c) | | | 550 | | | | 551 | | |
| | | 1,660 | | |
Industrials (0.6%) | |
Grinding Media, Inc. | |
2021 Term Loan B
3 Month USD SOFR + 4.00%, 9.53%, 10/12/28 (c) | | | 696 | | | | 692 | | |
| | | | 2,749 | | |
Total Fixed Income Securities (Cost $114,311) | | | 104,579 | | |
| | | Shares | | | |
Common Stocks (0.1%) | |
Automobile Components (0.0%) | |
Exide Technologies (g) | | | 592 | | | | — | | |
Diversified REITs (0.0%)‡ | |
American Gilsonite Co. (g) | | | 500 | | | | 3 | | |
Machinery (0.1%) | |
Iracore Investment Holdings, Inc., Class A (g)(h) | | | 470 | | | | 72 | | |
| | | Shares | | Value
(000) | |
Semiconductors & Semiconductor Equipment (0.0%)‡ | |
UC Holdings, Inc. (e) | | | 2,826 | | | $ | 13 | | |
Total Common Stocks (Cost $151) | | | 88 | | |
Total Investments (99.1%) (Cost $114,462) (i)(j) | | | 104,667 | | |
Other Assets in Excess of Liabilities (0.9%) | | | 921 | | |
Net Assets (100.0%) | | $ | 105,588 | | |
‡ Amount is less than 0.05%.
(a) 144A security — Certain conditions for public sale may exist. Unless otherwise noted, these securities are deemed to be liquid.
(b) Multi-step — Coupon rate changes in predetermined increments to maturity. Rate disclosed is as of September 30, 2023. Maturity date disclosed is the ultimate maturity date.
(c) Floating or variable rate securities: The rates disclosed are as of September 30, 2023. For securities based on a published reference rate and spread, the reference rate and spread are indicated in the description in the Portfolio of Investments. Certain variable rate securities may not be based on a published reference rate and spread but are determined by the issuer or agent and are based on current market conditions. These securities do not indicate a reference rate and spread in their description in the Portfolio of Investments.
(d) Non-income producing security; bond in default.
(e) Issuer in bankruptcy.
(f) When-issued security.
(g) Non-income producing security.
(h) At September 30, 2023, the Trust held a fair valued security valued at approximately $72,000, representing 0.1% of net assets. This security has been fair valued as determined in good faith under procedures established by and under the general supervision of the Trust's (as defined herein) Trustees.
(i) Securities are available as collateral in connection with securities purchased on a forward commitment basis.
(j) At September 30, 2023, the aggregate cost for federal income tax purposes is approximately $114,640,000. The aggregate gross unrealized appreciation is approximately $484,000 and the aggregate gross unrealized depreciation is approximately $9,460,000, resulting in net unrealized depreciation of approximately $8,976,000.
DAC Designated Activity Company.
LIBOR London Interbank Offered Rate.
SOFR Secured Overnight Financing Rate.
USD United States Dollar.
Portfolio Composition
Classification | | Percentage of
Total Investments | |
Consumer, Cyclical | | | 25.0 | % | |
Industrials | | | 19.3 | | |
Consumer, Non-Cyclical | | | 16.2 | | |
Energy | | | 9.8 | | |
Finance | | | 8.8 | | |
Communications | | | 8.7 | | |
Other* | | | 6.5 | | |
Basic Materials | | | 5.7 | | |
Total Investments | | | 100.0 | % | |
* Industries and/or investment types representing less than 5% of total investments.
The accompanying notes are an integral part of the financial statements.
12
Morgan Stanley Institutional Fund Trust
Annual Report — September 30, 2023
Statement of Assets and Liabilities | | September 30, 2023
(000) | |
Assets: | |
Investments in Securities of Unaffiliated Issuers, at Value (Cost $114,462) | | $ | 104,667 | | |
Interest Receivable | | | 2,078 | | |
Receivable for Investments Sold | | | 679 | | |
Receivable for Fund Shares Sold | | | 119 | | |
Due from Adviser | | | 11 | | |
Receivable from Affiliate | | | 1 | | |
Other Assets | | | 64 | | |
Total Assets | | | 107,619 | | |
Liabilities: | |
Payable for Investments Purchased | | | 1,375 | | |
Payable to Bank | | | 442 | | |
Payable for Professional Fees | | | 63 | | |
Payable for Fund Shares Redeemed | | | 43 | | |
Payable for Sub Transfer Agency Fees — Class I | | | 13 | | |
Payable for Sub Transfer Agency Fees — Class A | | | 2 | | |
Payable for Sub Transfer Agency Fees — Class L | | | — | @ | |
Payable for Sub Transfer Agency Fees — Class C | | | 1 | | |
Payable for Administration Fees | | | 7 | | |
Payable for Transfer Agency Fees — Class I | | | 3 | | |
Payable for Transfer Agency Fees — Class A | | | 1 | | |
Payable for Transfer Agency Fees — Class L | | | — | @ | |
Payable for Transfer Agency Fees — Class C | | | 1 | | |
Payable for Transfer Agency Fees — Class R6 | | | — | @ | |
Payable for Transfer Agency Fees — Class IR | | | — | @ | |
Payable for Shareholder Services Fees — Class A | | | 2 | | |
Payable for Distribution and Shareholder Services Fees — Class L | | | — | @ | |
Payable for Distribution and Shareholder Services Fees — Class C | | | 3 | | |
Payable for Custodian Fees | | | 4 | | |
Other Liabilities | | | 71 | | |
Total Liabilities | | | 2,031 | | |
Net Assets | | $ | 105,588 | | |
Net Assets Consist of: | |
Paid-in-Capital | | $ | 143,355 | | |
Total Accumulated Loss | | | (37,767 | ) | |
Net Assets | | $ | 105,588 | | |
The accompanying notes are an integral part of the financial statements.
13
Morgan Stanley Institutional Fund Trust
Annual Report — September 30, 2023
Statement of Assets and Liabilities (cont'd) | | September 30, 2023
(000) | |
CLASS I: | |
Net Assets | | $ | 85,713 | | |
| Shares Outstanding (unlimited number of shares authorized, no par value) (not in 000's) | | | 10,597,163 | | |
Net Asset Value, Offering and Redemption Price Per Share | | $ | 8.09 | | |
CLASS A: | |
Net Assets | | $ | 11,192 | | |
| Shares Outstanding (unlimited number of shares authorized, no par value) (not in 000's) | | | 1,386,477 | | |
Net Asset Value, Redemption Price Per Share | | $ | 8.07 | | |
Maximum Sales Load | | | 3.25 | % | |
Maximum Sales Charge | | $ | 0.27 | | |
Maximum Offering Price Per Share | | $ | 8.34 | | |
CLASS L: | |
Net Assets | | $ | 166 | | |
| Shares Outstanding (unlimited number of shares authorized, no par value) (not in 000's) | | | 20,555 | | |
Net Asset Value, Offering and Redemption Price Per Share | | $ | 8.08 | | |
CLASS C: | |
Net Assets | | $ | 3,539 | | |
| Shares Outstanding (unlimited number of shares authorized, no par value) (not in 000's) | | | 439,081 | | |
Net Asset Value, Offering and Redemption Price Per Share | | $ | 8.06 | | |
CLASS R6: | |
Net Assets | | $ | 4,967 | | |
| Shares Outstanding (unlimited number of shares authorized, no par value) (not in 000's) | | | 613,622 | | |
Net Asset Value, Offering and Redemption Price Per Share | | $ | 8.09 | | |
CLASS IR: | |
Net Assets | | $ | 11 | | |
| Shares Outstanding (unlimited number of shares authorized, no par value) (not in 000's) | | | 1,327 | | |
Net Asset Value, Offering and Redemption Price Per Share | | $ | 8.09 | | |
@ Amount is less than $500.
The accompanying notes are an integral part of the financial statements.
14
Morgan Stanley Institutional Fund Trust
Annual Report — September 30, 2023
Statement of Operations | | Year Ended
September 30, 2023
(000) | |
Investment Income: | |
Interest from Securities of Unaffiliated Issuers | | $ | 8,973 | | |
Dividends from Security of Affiliated Issuer (Note G) | | | 39 | | |
Total Investment Income | | | 9,012 | | |
Expenses: | |
Advisory Fees (Note B) | | | 740 | | |
Professional Fees | | | 224 | | |
Sub Transfer Agency Fees — Class I | | | 125 | | |
Sub Transfer Agency Fees — Class A | | | 11 | | |
Sub Transfer Agency Fees — Class L | | | — | @ | |
Sub Transfer Agency Fees — Class C | | | 3 | | |
Registration Fees | | | 112 | | |
Administration Fees (Note C) | | | 99 | | |
Shareholder Services Fees — Class A (Note D) | | | 29 | | |
Distribution and Shareholder Services Fees — Class L (Note D) | | | 1 | | |
Distribution and Shareholder Services Fees — Class C (Note D) | | | 38 | | |
Pricing Fees | | | 45 | | |
Transfer Agency Fees — Class I (Note E) | | | 15 | | |
Transfer Agency Fees — Class A (Note E) | | | 5 | | |
Transfer Agency Fees — Class L (Note E) | | | 3 | | |
Transfer Agency Fees — Class C (Note E) | | | 3 | | |
Transfer Agency Fees — Class R6 (Note E) | | | 3 | | |
Transfer Agency Fees — Class IR (Note E) | | | 2 | | |
Transfer Agency Fees — Class W* (Note E) | | | 2 | | |
Shareholder Reporting Fees | | | 30 | | |
Custodian Fees (Note F) | | | 15 | | |
Trustees' Fees and Expenses | | | 8 | | |
Other Expenses | | | 24 | | |
Total Expenses | | | 1,537 | | |
Waiver of Advisory Fees (Note B) | | | (534 | ) | |
Reimbursement of Class Specific Expenses — Class I (Note B) | | | (110 | ) | |
Reimbursement of Class Specific Expenses — Class A (Note B) | | | (1 | ) | |
Reimbursement of Class Specific Expenses — Class L (Note B) | | | (3 | ) | |
Reimbursement of Class Specific Expenses — Class C (Note B) | | | (1 | ) | |
Reimbursement of Class Specific Expenses — Class R6 (Note B) | | | (3 | ) | |
Reimbursement of Class Specific Expenses — Class IR (Note B) | | | (2 | ) | |
Reimbursement of Class Specific Expenses — Class W* (Note B) | | | (2 | ) | |
Rebate from Morgan Stanley Affiliate (Note G) | | | (1 | ) | |
Net Expenses | | | 880 | | |
Net Investment Income | | | 8,132 | | |
Realized Loss: | |
Investments Sold | | | (12,076 | ) | |
Change in Unrealized Appreciation (Depreciation): | |
Investments | | | 17,068 | | |
Net Realized Loss and Change in Unrealized Appreciation (Depreciation) | | | 4,992 | | |
Net Increase in Net Assets Resulting from Operations | | $ | 13,124 | | |
@ Amount is less than $500.
* Effective June 28, 2023, Class W shares were liquidated.
The accompanying notes are an integral part of the financial statements.
15
Morgan Stanley Institutional Fund Trust
Annual Report — September 30, 2023
Statements of Changes in Net Assets | | Year Ended
September 30, 2023
(000) | | Year Ended
September 30, 2022
(000) | |
Increase (Decrease) in Net Assets: | |
Operations: | |
Net Investment Income | | $ | 8,132 | | | $ | 9,621 | | |
Net Realized Loss | | | (12,076 | ) | | | (5,151 | ) | |
Net Change in Unrealized Appreciation (Depreciation) | | | 17,068 | | | | (30,555 | ) | |
Net Increase (Decrease) in Net Assets Resulting from Operations | | | 13,124 | | | | (26,085 | ) | |
Dividends and Distributions to Shareholders: | |
Class I | | | (6,936 | ) | | | (8,231 | ) | |
Class A | | | (752 | ) | | | (784 | ) | |
Class L | | | (10 | ) | | | (17 | ) | |
Class C | | | (214 | ) | | | (258 | ) | |
Class R6* | | | (389 | ) | | | (455 | ) | |
Class IR | | | (1 | ) | | | (1 | ) | |
Class W** | | | (1 | ) | | | (1 | ) | |
Total Dividends and Distributions to Shareholders | | | (8,303 | ) | | | (9,747 | ) | |
Capital Share Transactions:(1) | |
Class I: | |
Subscribed | | | 28,162 | | | | 43,321 | | |
Distributions Reinvested | | | 6,642 | | | | 8,101 | | |
Redeemed | | | (71,061 | ) | | | (64,717 | ) | |
Class A: | |
Subscribed | | | 7,175 | | | | 12,087 | | |
Distributions Reinvested | | | 752 | | | | 784 | | |
Redeemed | | | (8,669 | ) | | | (15,535 | ) | |
Class L: | |
Exchanged | | | 37 | | | | — | | |
Distributions Reinvested | | | 10 | | | | 17 | | |
Redeemed | | | (110 | ) | | | (110 | ) | |
Class C: | |
Subscribed | | | 537 | | | | 608 | | |
Distributions Reinvested | | | 214 | | | | 258 | | |
Redeemed | | | (1,466 | ) | | | (2,039 | ) | |
Class R6:* | |
Subscribed | | | 13 | | | | 9,619 | | |
Distributions Reinvested | | | 389 | | | | 455 | | |
Redeemed | | | (3,832 | ) | | | (3,540 | ) | |
Class IR: | |
Distributions Reinvested | | | 1 | | | | 1 | | |
Class W:** | |
Distributions Reinvested | | | 1 | | | | 1 | | |
Redeemed | | | (10 | ) | | | — | | |
Net Decrease in Net Assets Resulting from Capital Share Transactions | | | (41,215 | ) | | | (10,689 | ) | |
Total Decrease in Net Assets | | | (36,394 | ) | | | (46,521 | ) | |
Net Assets: | |
Beginning of Period | | | 141,982 | | | | 188,503 | | |
End of Period | | $ | 105,588 | | | $ | 141,982 | | |
The accompanying notes are an integral part of the financial statements.
16
Morgan Stanley Institutional Fund Trust
Annual Report — September 30, 2023
Statements of Changes in Net Assets (cont'd) | | Year Ended
September 30, 2023
(000) | | Year Ended
September 30, 2022
(000) | |
(1) Capital Share Transactions: | |
Class I: | |
Shares Subscribed | | | 3,470 | | | | 4,876 | | |
Shares Issued on Distributions Reinvested | | | 819 | | | | 906 | | |
Shares Redeemed | | | (8,737 | ) | | | (7,365 | ) | |
Net Decrease in Class I Shares Outstanding | | | (4,448 | ) | | | (1,583 | ) | |
Class A: | |
Shares Subscribed | | | 882 | | | | 1,381 | | |
Shares Issued on Distributions Reinvested | | | 93 | | | | 88 | | |
Shares Redeemed | | | (1,068 | ) | | | (1,760 | ) | |
Net Decrease in Class A Shares Outstanding | | | (93 | ) | | | (291 | ) | |
Class L: | |
Shares Exchanged | | | 5 | | | | — | | |
Shares Issued on Distributions Reinvested | | | 1 | | | | 2 | | |
Shares Redeemed | | | (14 | ) | | | (13 | ) | |
Net Decrease in Class L Shares Outstanding | | | (8 | ) | | | (11 | ) | |
Class C: | |
Shares Subscribed | | | 65 | | | | 65 | | |
Shares Issued on Distributions Reinvested | | | 27 | | | | 29 | | |
Shares Redeemed | | | (181 | ) | | | (231 | ) | |
Net Decrease in Class C Shares Outstanding | | | (89 | ) | | | (137 | ) | |
Class R6:* | |
Shares Subscribed | | | 1 | | | | 1,056 | | |
Shares Issued on Distributions Reinvested | | | 48 | | | | 52 | | |
Shares Redeemed | | | (475 | ) | | | (432 | ) | |
Net Increase (Decrease) in Class R6 Shares Outstanding | | | (426 | ) | | | 676 | | |
Class IR: | |
Shares Issued on Distributions Reinvested | | | — | @@ | | | — | @@ | |
Class W:** | |
Shares Issued on Distributions Reinvested | | | — | @@ | | | — | @@ | |
Shares Redeemed | | | (1 | ) | | | — | | |
Net Increase (Decrease) in Class W Shares Outstanding | | | (1 | ) | | | — | @@ | |
* Effective April 29, 2022, Class IS shares were renamed Class R6 shares.
** Effective June 28, 2023, Class W shares were liquidated.
@@ Amount is less than 500 shares.
The accompanying notes are an integral part of the financial statements.
17
Morgan Stanley Institutional Fund Trust
Annual Report — September 30, 2023
Financial Highlights
High Yield Portfolio
| | | Class I | |
| | | Year Ended September 30, | |
Selected Per Share Data and Ratios | | 2023 | | 2022 | | 2021 | | 2020 | | 2019 | |
Net Asset Value, Beginning of Period | | $ | 7.84 | | | $ | 9.68 | | | $ | 9.19 | | | $ | 9.78 | | | $ | 9.96 | | |
Income (Loss) from Investment Operations: | |
Net Investment Income(1) | | | 0.54 | | | | 0.50 | | | | 0.53 | | | | 0.57 | | | | 0.63 | | |
Net Realized and Unrealized Gain (Loss) | | | 0.26 | | | | (1.83 | ) | | | 0.49 | | | | (0.57 | ) | | | (0.19 | ) | |
Total from Investment Operations | | | 0.80 | | | | (1.33 | ) | | | 1.02 | | | | 0.00 | | | | 0.44 | | |
Distributions from and/or in Excess of: | |
Net Investment Income | | | (0.55 | ) | | | (0.51 | ) | | | (0.53 | ) | | | (0.59 | ) | | | (0.62 | ) | |
Net Asset Value, End of Period | | $ | 8.09 | | | $ | 7.84 | | | $ | 9.68 | | | $ | 9.19 | | | $ | 9.78 | | |
Total Return(2) | | | 10.34 | % | | | (14.27 | )% | | | 11.38 | % | | | 0.15 | % | | | 4.68 | % | |
Ratios to Average Net Assets and Supplemental Data: | |
Net Assets, End of Period (Thousands) | | $ | 85,713 | | | $ | 117,898 | | | $ | 161,038 | | | $ | 155,539 | | | $ | 176,483 | | |
Ratio of Expenses Before Expense Limitation | | | 1.19 | % | | | 1.04 | % | | | 1.03 | % | | | 1.02 | % | | | 0.98 | % | |
Ratio of Expenses After Expense Limitation | | | 0.65 | %(3) | | | 0.65 | %(3) | | | 0.65 | %(3) | | | 0.65 | %(3) | | | 0.65 | %(3) | |
Ratio of Expenses After Expense Limitation Excluding Interest Expenses | | | N/A | | | | N/A | | | | 0.65 | %(3) | | | 0.65 | %(3) | | | 0.65 | %(3) | |
Ratio of Net Investment Income | | | 6.66 | %(3) | | | 5.64 | %(3) | | | 5.50 | %(3) | | | 6.20 | %(3) | | | 6.51 | %(3) | |
Ratio of Rebate from Morgan Stanley Affiliates | | | 0.00 | %(4) | | | 0.00 | %(4) | | | 0.00 | %(4) | | | 0.00 | %(4) | | | 0.00 | %(4) | |
Portfolio Turnover Rate | | | 57 | % | | | 28 | % | | | 54 | % | | | 69 | % | | | 42 | % | |
(1) Per share amount is based on average shares outstanding.
(2) Calculated based on the net asset value as of the last business day of the period.
(3) The Ratio of Expenses After Expense Limitation and Ratio of Net Investment Income reflect the rebate of certain Fund expenses in connection with the investments in Morgan Stanley affiliates during the period. The effect of the rebate on the ratios is disclosed in the above table as "Ratio of Rebate from Morgan Stanley Affiliates."
(4) Amount is less than 0.005%.
The accompanying notes are an integral part of the financial statements.
18
Morgan Stanley Institutional Fund Trust
Annual Report — September 30, 2023
Financial Highlights
High Yield Portfolio
| | | Class A | |
| | | Year Ended September 30, | |
Selected Per Share Data and Ratios | | 2023 | | 2022 | | 2021 | | 2020 | | 2019 | |
Net Asset Value, Beginning of Period | | $ | 7.82 | | | $ | 9.67 | | | $ | 9.17 | | | $ | 9.76 | | | $ | 9.94 | | |
Income (Loss) from Investment Operations: | |
Net Investment Income(1) | | | 0.51 | | | | 0.47 | | | | 0.49 | | | | 0.55 | | | | 0.60 | | |
Net Realized and Unrealized Gain (Loss) | | | 0.26 | | | | (1.84 | ) | | | 0.51 | | | | (0.58 | ) | | | (0.20 | ) | |
Total from Investment Operations | | | 0.77 | | | | (1.37 | ) | | | 1.00 | | | | (0.03 | ) | | | 0.40 | | |
Distributions from and/or in Excess of: | |
Net Investment Income | | | (0.52 | ) | | | (0.48 | ) | | | (0.50 | ) | | | (0.56 | ) | | | (0.58 | ) | |
Net Asset Value, End of Period | | $ | 8.07 | | | $ | 7.82 | | | $ | 9.67 | | | $ | 9.17 | | | $ | 9.76 | | |
Total Return(2) | | | 9.98 | % | | | (14.69 | )% | | | 11.14 | % | | | (0.22 | )% | | | 4.28 | % | |
Ratios to Average Net Assets and Supplemental Data: | |
Net Assets, End of Period (Thousands) | | $ | 11,192 | | | $ | 11,573 | | | $ | 17,116 | | | $ | 14,595 | | | $ | 24,401 | | |
Ratio of Expenses Before Expense Limitation | | | 1.45 | % | | | 1.29 | % | | | 1.27 | % | | | 1.31 | % | | | 1.23 | % | |
Ratio of Expenses After Expense Limitation | | | 1.00 | %(3) | | | 1.00 | %(3) | | | 0.99 | %(3) | | | 1.00 | %(3) | | | 0.99 | %(3) | |
Ratio of Expenses After Expense Limitation Excluding Interest Expenses | | | N/A | | | | N/A | | | | 0.99 | %(3) | | | 1.00 | %(3) | | | 0.99 | %(3) | |
Ratio of Net Investment Income | | | 6.31 | %(3) | | | 5.27 | %(3) | | | 5.16 | %(3) | | | 5.87 | %(3) | | | 6.17 | %(3) | |
Ratio of Rebate from Morgan Stanley Affiliates | | | 0.00 | %(4) | | | 0.00 | %(4) | | | 0.00 | %(4) | | | 0.00 | %(4) | | | 0.00 | %(4) | |
Portfolio Turnover Rate | | | 57 | % | | | 28 | % | | | 54 | % | | | 69 | % | | | 42 | % | |
(1) Per share amount is based on average shares outstanding.
(2) Calculated based on the net asset value which does not reflect sales charges, if applicable, as of the last business day of the period.
(3) The Ratio of Expenses After Expense Limitation and Ratio of Net Investment Income reflect the rebate of certain Fund expenses in connection with the investments in Morgan Stanley affiliates during the period. The effect of the rebate on the ratios is disclosed in the above table as "Ratio of Rebate from Morgan Stanley Affiliates."
(4) Amount is less than 0.005%.
The accompanying notes are an integral part of the financial statements.
19
Morgan Stanley Institutional Fund Trust
Annual Report — September 30, 2023
Financial Highlights
High Yield Portfolio
| | | Class L | |
| | | Year Ended September 30, | |
Selected Per Share Data and Ratios | | 2023 | | 2022 | | 2021 | | 2020 | | 2019 | |
Net Asset Value, Beginning of Period | | $ | 7.83 | | | $ | 9.67 | | | $ | 9.17 | | | $ | 9.76 | | | $ | 9.94 | | |
Income (Loss) from Investment Operations: | |
Net Investment Income(1) | | | 0.49 | | | | 0.45 | | | | 0.47 | | | | 0.52 | | | | 0.57 | | |
Net Realized and Unrealized Gain (Loss) | | | 0.25 | | | | (1.84 | ) | | | 0.51 | | | | (0.58 | ) | | | (0.19 | ) | |
Total from Investment Operations | | | 0.74 | | | | (1.39 | ) | | | 0.98 | | | | (0.06 | ) | | | 0.38 | | |
Distributions from and/or in Excess of: | |
Net Investment Income | | | (0.49 | ) | | | (0.45 | ) | | | (0.48 | ) | | | (0.53 | ) | | | (0.56 | ) | |
Net Asset Value, End of Period | | $ | 8.08 | | | $ | 7.83 | | | $ | 9.67 | | | $ | 9.17 | | | $ | 9.76 | | |
Total Return(2) | | | 9.76 | % | | | (14.92 | )% | | | 10.84 | % | | | (0.46 | )% | | | 4.06 | % | |
Ratios to Average Net Assets and Supplemental Data: | |
Net Assets, End of Period (Thousands) | | $ | 166 | | | $ | 222 | | | $ | 383 | | | $ | 425 | | | $ | 468 | | |
Ratio of Expenses Before Expense Limitation | | | 3.18 | % | | | 2.16 | % | | | 1.98 | % | | | 1.91 | % | | | 1.86 | % | |
Ratio of Expenses After Expense Limitation | | | 1.25 | %(3) | | | 1.25 | %(3) | | | 1.25 | %(3) | | | 1.25 | %(3) | | | 1.25 | %(3) | |
Ratio of Expenses After Expense Limitation Excluding Interest Expenses | | | N/A | | | | N/A | | | | 1.25 | %(3) | | | 1.25 | %(3) | | | 1.25 | %(3) | |
Ratio of Net Investment Income | | | 6.05 | %(3) | | | 5.02 | %(3) | | | 4.90 | %(3) | | | 5.60 | %(3) | | | 5.93 | %(3) | |
Ratio of Rebate from Morgan Stanley Affiliates | | | 0.00 | %(4) | | | 0.00 | %(4) | | | 0.00 | %(4) | | | 0.00 | %(4) | | | 0.00 | %(4) | |
Portfolio Turnover Rate | | | 57 | % | | | 28 | % | | | 54 | % | | | 69 | % | | | 42 | % | |
(1) Per share amount is based on average shares outstanding.
(2) Calculated based on the net asset value as of the last business day of the period.
(3) The Ratio of Expenses After Expense Limitation and Ratio of Net Investment Income reflect the rebate of certain Fund expenses in connection with the investments in Morgan Stanley affiliates during the period. The effect of the rebate on the ratios is disclosed in the above table as "Ratio of Rebate from Morgan Stanley Affiliates."
(4) Amount is less than 0.005%.
The accompanying notes are an integral part of the financial statements.
20
Morgan Stanley Institutional Fund Trust
Annual Report — September 30, 2023
Financial Highlights
High Yield Portfolio
| | | Class C | |
| | | Year Ended September 30, | |
Selected Per Share Data and Ratios | | 2023 | | 2022 | | 2021 | | 2020 | | 2019 | |
Net Asset Value, Beginning of Period | | $ | 7.81 | | | $ | 9.65 | | | $ | 9.16 | | | $ | 9.75 | | | $ | 9.93 | | |
Income (Loss) from Investment Operations: | |
Net Investment Income(1) | | | 0.45 | | | | 0.40 | | | | 0.42 | | | | 0.46 | | | | 0.52 | | |
Net Realized and Unrealized Gain (Loss) | | | 0.26 | | | | (1.83 | ) | | | 0.50 | | | | (0.56 | ) | | | (0.19 | ) | |
Total from Investment Operations | | | 0.71 | | | | (1.43 | ) | | | 0.92 | | | | (0.10 | ) | | | 0.33 | | |
Distributions from and/or in Excess of: | |
Net Investment Income | | | (0.46 | ) | | | (0.41 | ) | | | (0.43 | ) | | | (0.49 | ) | | | (0.51 | ) | |
Net Asset Value, End of Period | | $ | 8.06 | | | $ | 7.81 | | | $ | 9.65 | | | $ | 9.16 | | | $ | 9.75 | | |
Total Return(2) | | | 9.16 | % | | | (15.27 | )% | | | 10.20 | % | | | (0.93 | )% | | | 3.55 | % | |
Ratios to Average Net Assets and Supplemental Data: | |
Net Assets, End of Period (Thousands) | | $ | 3,539 | | | $ | 4,121 | | | $ | 6,418 | | | $ | 7,633 | | | $ | 5,226 | | |
Ratio of Expenses Before Expense Limitation | | | 2.22 | % | | | 2.05 | % | | | 2.01 | % | | | 2.02 | % | | | 1.98 | % | |
Ratio of Expenses After Expense Limitation | | | 1.75 | %(3) | | | 1.75 | %(3) | | | 1.74 | %(3) | | | 1.74 | %(3) | | | 1.74 | %(3) | |
Ratio of Expenses After Expense Limitation Excluding Interest Expenses | | | N/A | | | | N/A | | | | 1.74 | %(3) | | | 1.74 | %(3) | | | 1.74 | %(3) | |
Ratio of Net Investment Income | | | 5.56 | %(3) | | | 4.51 | %(3) | | | 4.41 | %(3) | | | 5.06 | %(3) | | | 5.43 | %(3) | |
Ratio of Rebate from Morgan Stanley Affiliates | | | 0.00 | %(4) | | | 0.00 | %(4) | | | 0.00 | %(4) | | | 0.00 | %(4) | | | 0.00 | %(4) | |
Portfolio Turnover Rate | | | 57 | % | | | 28 | % | | | 54 | % | | | 69 | % | | | 42 | % | |
(1) Per share amount is based on average shares outstanding.
(2) Calculated based on the net asset value which does not reflect sales charges, if applicable, as of the last business day of the period.
(3) The Ratio of Expenses After Expense Limitation and Ratio of Net Investment Income reflect the rebate of certain Fund expenses in connection with the investments in Morgan Stanley affiliates during the period. The effect of the rebate on the ratios is disclosed in the above table as "Ratio of Rebate from Morgan Stanley Affiliates."
(4) Amount is less than 0.005%.
The accompanying notes are an integral part of the financial statements.
21
Morgan Stanley Institutional Fund Trust
Annual Report — September 30, 2023
Financial Highlights
High Yield Portfolio
| | | Class R6(1) | |
| | | Year Ended September 30, | |
Selected Per Share Data and Ratios | | 2023 | | 2022 | | 2021 | | 2020 | | 2019 | |
Net Asset Value, Beginning of Period | | $ | 7.84 | | | $ | 9.69 | | | $ | 9.19 | | | $ | 9.78 | | | $ | 9.96 | | |
Income (Loss) from Investment Operations: | |
Net Investment Income(2) | | | 0.54 | | | | 0.51 | | | | 0.53 | | | | 0.55 | | | | 0.64 | | |
Net Realized and Unrealized Gain (Loss) | | | 0.26 | | | | (1.84 | ) | | | 0.50 | | | | (0.55 | ) | | | (0.20 | ) | |
Total from Investment Operations | | | 0.80 | | | | (1.33 | ) | | | 1.03 | | | | 0.00 | | | | 0.44 | | |
Distributions from and/or in Excess of: | |
Net Investment Income | | | (0.55 | ) | | | (0.52 | ) | | | (0.53 | ) | | | (0.59 | ) | | | (0.62 | ) | |
Net Asset Value, End of Period | | $ | 8.09 | | | $ | 7.84 | | | $ | 9.69 | | | $ | 9.19 | | | $ | 9.78 | | |
Total Return(3) | | | 10.35 | % | | | (14.30 | )% | | | 11.49 | % | | | 0.18 | % | | | 4.71 | % | |
Ratios to Average Net Assets and Supplemental Data: | |
Net Assets, End of Period (Thousands) | | $ | 4,967 | | | $ | 8,149 | | | $ | 3,526 | | | $ | 5,471 | | | $ | 301 | | |
Ratio of Expenses Before Expense Limitation | | | 1.10 | % | | | 0.94 | % | | | 0.94 | % | | | 0.94 | % | | | 1.11 | % | |
Ratio of Expenses After Expense Limitation | | | 0.62 | %(4) | | | 0.62 | %(4) | | | 0.62 | %(4) | | | 0.62 | %(4) | | | 0.62 | %(4) | |
Ratio of Expenses After Expense Limitation Excluding Interest Expenses | | | N/A | | | | N/A | | | | 0.62 | %(4) | | | 0.62 | %(4) | | | 0.62 | %(4) | |
Ratio of Net Investment Income | | | 6.69 | %(4) | | | 5.82 | %(4) | | | 5.54 | %(4) | | | 6.20 | %(4) | | | 6.55 | %(4) | |
Ratio of Rebate from Morgan Stanley Affiliates | | | 0.00 | %(5) | | | 0.00 | %(5) | | | 0.00 | %(5) | | | 0.00 | %(5) | | | 0.00 | %(5) | |
Portfolio Turnover Rate | | | 57 | % | | | 28 | % | | | 54 | % | | | 69 | % | | | 42 | % | |
(1) Effective April 29, 2022, Class IS shares were renamed Class R6 shares.
(2) Per share amount is based on average shares outstanding.
(3) Calculated based on the net asset value as of the last business day of the period.
(4) The Ratio of Expenses After Expense Limitation and Ratio of Net Investment Income reflect the rebate of certain Fund expenses in connection with the investments in Morgan Stanley affiliates during the period. The effect of the rebate on the ratios is disclosed in the above table as "Ratio of Rebate from Morgan Stanley Affiliates."
(5) Amount is less than 0.005%.
The accompanying notes are an integral part of the financial statements.
22
Morgan Stanley Institutional Fund Trust
Annual Report — September 30, 2023
Financial Highlights
High Yield Portfolio
| | | Class IR | |
| | | Year Ended September 30, | |
Selected Per Share Data and Ratios | | 2023 | | 2022 | | 2021 | | 2020 | | 2019 | |
Net Asset Value, Beginning of Period | | $ | 7.84 | | | $ | 9.69 | | | $ | 9.19 | | | $ | 9.78 | | | $ | 9.96 | | |
Income (Loss) from Investment Operations: | |
Net Investment Income(1) | | | 0.54 | | | | 0.48 | | | | 0.50 | | | | 0.52 | | | | 0.56 | | |
Net Realized and Unrealized Gain (Loss) | | | 0.26 | | | | (1.81 | ) | | | 0.53 | | | | (0.52 | ) | | | (0.12 | ) | |
Total from Investment Operations | | | 0.80 | | | | (1.33 | ) | | | 1.03 | | | | 0.00 | | | | 0.44 | | |
Distributions from and/or in Excess of: | |
Net Investment Income | | | (0.55 | ) | | | (0.52 | ) | | | (0.53 | ) | | | (0.59 | ) | | | (0.62 | ) | |
Net Asset Value, End of Period | | $ | 8.09 | | | $ | 7.84 | | | $ | 9.69 | | | $ | 9.19 | | | $ | 9.78 | | |
Total Return(2) | | | 10.36 | % | | | (14.30 | )% | | | 11.49 | % | | | 0.18 | % | | | 4.71 | % | |
Ratios to Average Net Assets and Supplemental Data: | |
Net Assets, End of Period (Thousands) | | $ | 11 | | | $ | 10 | | | $ | 11 | | | $ | 10 | | | $ | 10 | | |
Ratio of Expenses Before Expense Limitation | | | 21.53 | % | | | 19.61 | % | | | 18.97 | % | | | 20.43 | % | | | 20.17 | % | |
Ratio of Expenses After Expense Limitation | | | 0.62 | %(3) | | | 0.62 | %(3) | | | 0.62 | %(3) | | | 0.62 | %(3) | | | 0.62 | %(3) | |
Ratio of Expenses After Expense Limitation Excluding Interest Expenses | | | N/A | | | | N/A | | | | 0.62 | %(3) | | | 0.62 | %(3) | | | 0.62 | %(3) | |
Ratio of Net Investment Income | | | 6.69 | %(3) | | | 5.38 | %(3) | | | 5.26 | %(3) | | | 5.70 | %(3) | | | 5.80 | %(3) | |
Ratio of Rebate from Morgan Stanley Affiliates | | | 0.00 | %(4) | | | 0.00 | %(4) | | | 0.00 | %(4) | | | 0.00 | %(4) | | | 0.00 | %(4) | |
Portfolio Turnover Rate | | | 57 | % | | | 28 | % | | | 54 | % | | | 69 | % | | | 42 | % | |
(1) Per share amount is based on average shares outstanding.
(2) Calculated based on the net asset value as of the last business day of the period.
(3) The Ratio of Expenses After Expense Limitation and Ratio of Net Investment Income reflect the rebate of certain Fund expenses in connection with the investments in Morgan Stanley affiliates during the period. The effect of the rebate on the ratios is disclosed in the above table as "Ratio of Rebate from Morgan Stanley Affiliates."
(4) Amount is less than 0.005%.
The accompanying notes are an integral part of the financial statements.
23
Morgan Stanley Institutional Fund Trust
Annual Report — September 30, 2023
Notes to Financial Statements
Morgan Stanley Institutional Fund Trust ("Trust") is registered under the Investment Company Act of 1940, as amended (the "Act"), as an open-end management investment company. The Trust is comprised of nine separate, active funds (individually referred to as a "Fund," collectively as the "Funds"). All Funds are considered diversified for purposes of the Act.
The Trust applies investment company accounting and reporting guidance Accounting Standards Codification ("ASC"). In the preparation of these financial statements, management has evaluated subsequent events occurring after the date of the Fund's Statement of Assets and Liabilities through the date that the financial statements were issued.
The accompanying financial statements relate to the High Yield Portfolio. The Fund seeks total return. The Fund has issued six classes of shares — Class I, Class A, Class L, Class C, Class R6 and Class IR. Effective April 29, 2022, Class IS shares were renamed Class R6 shares. On June 28, 2023, Class W shares were liquidated as a share class of the Fund and there were no shares outstanding as of September 30, 2023. Accordingly, no financial highlights have been presented for Class W.
The Fund has suspended offering Class L shares for sale to all investors. Class L shareholders of the Fund do not have the option of purchasing additional Class L shares. However, existing Class L shareholders may invest in additional Class L shares through reinvestment of dividends and distributions. In addition, Class L shares of the Fund may be exchanged for Class L shares of any Morgan Stanley Multi-Class Fund, even though Class L shares are closed to investors.
A. Significant Accounting Policies: The following significant accounting policies are in conformity with U.S. generally accepted accounting principles ("GAAP"). Such policies are consistently followed by the Trust in the preparation of its financial statements. GAAP may require management to make estimates and assumptions that affect the reported amounts and disclosures in the financial statements. Actual results may differ from those estimates.
1. Security Valuation: (1) Fixed income securities may be valued by an outside pricing service/vendor approved by the Trust's Board of Trustees (the "Trustees"). The pricing service/vendor may employ a pricing model that takes into account, among other things, bids, yield spreads and/or other market data and specific security characteristics. If Morgan Stanley Investment Management Inc. (the "Adviser"), a wholly-owned subsidiary of Morgan Stanley, determines that the price provided by the outside pricing
service/vendor does not reflect the security's fair value or is unable to provide a price, prices from brokers/dealers may also be utilized. In these circumstances, the value of the security will be the mean of bid and asked prices obtained from reputable brokers/dealers; (2) an equity portfolio security listed or traded on an exchange is valued at its latest reported sales price (or at the exchange official closing price if such exchange reports an official closing price), and if there were no sales on a given day and if there is no official exchange closing price for that day, the security is valued at the mean between the last reported bid and asked prices if such bid and asked prices are available on the relevant exchanges. If only bid prices are available then the latest bid price may be used. Listed equity securities not traded on the valuation date with no reported bid and asked prices available on the exchange are valued at the mean between the current bid and asked prices obtained from one or more reputable brokers/dealers. In cases where a security is traded on more than one exchange, the security is valued on the exchange designated as the primary market; (3) all other equity portfolio securities for which over-thecounter ("OTC") market quotations are readily available are valued at the latest reported sales price (or at the market official closing price if such market reports an official closing price), and if there was no trading in the security on a given day and if there is no official closing price from relevant markets for that day, the security is valued at the mean between the last reported bid and asked prices if such bid and asked prices are available on the relevant markets. An unlisted equity security that does not trade on the valuation date and for which bid and asked prices from the relevant markets are unavailable is valued at the mean between the current bid and asked prices obtained from one or more reputable brokers/dealers; (4) certain senior collateralized loans ("Senior Loans") are valued based on quotations received from an independent pricing service; (5) when market quotations are not readily available, as defined by Rule 2a-5 under the Act, including circumstances under which the Adviser determines that the closing price, last sale price or the mean between the last reported bid and asked prices are not reflective of a security's market value, portfolio securities are valued at their fair value as determined in good faith under procedures approved by and under the general supervision of the Trustees. Occasionally, developments affecting the closing prices of securities and other assets may occur between the times at which valuations of such securities are determined (that is, close of the foreign market on which
24
Morgan Stanley Institutional Fund Trust
Annual Report — September 30, 2023
Notes to Financial Statements (cont'd)
the securities trade) and the close of business of the New York Stock Exchange ("NYSE"). If developments occur during such periods that are expected to materially affect the value of such securities, such valuations may be adjusted to reflect the estimated fair value of such securities as of the close of the NYSE, as determined in good faith by the Trustees or by the Adviser using a pricing service and/or procedures approved by the Trustees; and (6) investments in mutual funds, including the Morgan Stanley Institutional Liquidity Funds, are valued at the net asset value ("NAV") as of the close of each business day.
In connection with Rule 2a-5 of the Act, the Trustees have designated the Trust's Adviser as its valuation designee. The valuation designee has responsibility for determining fair value and to make the actual calculations pursuant to the fair valuation methodologies previously approved by the Trustees. Under procedures approved by the Trustees, the Trust's Adviser, as valuation designee, has formed a Valuation Committee whose members are approved by the Trustees. The Valuation Committee provides administration and oversight of the Trust's valuation policies and procedures, which are reviewed at least annually by the Trustees. These procedures allow the Trust to utilize independent pricing services, quotations from securities and financial instrument dealers and other market sources to determine fair value.
2. Fair Value Measurement: Financial Accounting Standards Board ("FASB") ASC 820, "Fair Value Measurement" ("ASC 820"), defines fair value as the price that would be received to sell an asset or pay to transfer a liability in an orderly transaction between market participants at the measurement date. ASC 820 establishes a three-tier hierarchy to distinguish between (1) inputs that reflect the assumptions market participants would use in valuing an asset or liability developed based on market data obtained from sources independent of the reporting entity (observable inputs) and (2) inputs that reflect the reporting entity's own assumptions about the assumptions market participants would use in valuing an asset or liability developed based on the best information available in the circumstances (unobservable inputs) and to establish classification of fair value measurements for disclosure purposes. Various inputs are used in determining the value of the Fund's investments. The inputs are summarized in the three broad levels listed below:
• Level 1 – unadjusted quoted prices in active markets for identical investments
• Level 2 – other significant observable inputs (including quoted prices for similar investments, interest rates, prepayment speeds, credit risk, etc.)
• Level 3 – significant unobservable inputs including the Fund's own assumptions in determining the fair value of investments. Factors considered in making this determination may include, but are not limited to, information obtained by contacting the issuer, analysts, or the appropriate stock exchange (for exchange-traded securities), analysis of the issuer's financial statements or other available documents and, if necessary, available information concerning other securities in similar circumstances.
The inputs or methodology used for valuing securities are not necessarily an indication of the risk associated with investing in those securities and the determination of the significance of a particular input to the fair value measurement in its entirety requires judgment and considers factors specific to each security.
The following is a summary of the inputs used to value the Fund's investments as of September 30, 2023:
Investment Type | | Level 1
Unadjusted
quoted
prices
(000) | | Level 2
Other
significant
observable
inputs
(000) | | Level 3
Significant
unobservable
inputs
(000) | | Total
(000) | |
Assets: | |
Fixed Income Securities | |
Corporate Bonds | | $ | — | | | $ | 101,830 | | | $ | — | | | $ | 101,830 | | |
Variable Rate Senior
Loan Interests | | | — | | | | 2,749 | | | | — | | | | 2,749 | | |
Total Fixed Income
Securities | | | — | | | | 104,579 | | | | — | | | | 104,579 | | |
Common Stocks | |
Automobile Components | | | — | | | | — | † | | | — | | | | — | † | |
Diversified REITs | | | — | | | | 3 | | | | — | | | | 3 | | |
Machinery | | | — | | | | — | | | | 72 | | | | 72 | | |
Semiconductors &
Semiconductor
Equipment | | | — | | | | 13 | | | | — | | | | 13 | | |
Total Common Stocks | | | — | | | | 16 | † | | | 72 | | | | 88 | † | |
Total Assets | | $ | — | | | $ | 104,595 | † | | $ | 72 | | | $ | 104,667 | † | |
† Includes a security valued at zero.
Transfers between investment levels may occur as the markets fluctuate and/or the availability of data used in an investment's valuation changes.
25
Morgan Stanley Institutional Fund Trust
Annual Report — September 30, 2023
Notes to Financial Statements (cont'd)
Following is a reconciliation of investments in which significant unobservable inputs (Level 3) were used in determining fair value:
| | | Common
Stock
(000) | |
Beginning Balance | | $ | 11 | | |
Purchases | | | — | | |
Sales | | | — | | |
Transfers in | | | — | | |
Transfers out | | | — | | |
Corporate actions | | | — | | |
Change in unrealized appreciation (depreciation) | | | 61 | | |
Realized gains (losses) | | | — | | |
Ending Balance | | $ | 72 | | |
Net change in unrealized appreciation (depreciation) from investments
still held as of September 30, 2023 | | $ | 61 | | |
The following table presents additional information about valuation techniques and inputs used for investments that are measured at fair value and categorized within Level 3 as of September 30, 2023:
| | | Fair Value at
September 30, 2023
(000) | | Valuation
Technique | | Unobservable
Input | | Amount* | | Impact to
Valuation from an
Increase in Input** | |
Common Stock | | $ | 72 | | | Market Comparable
Companies | | Enterprise Value/
EBITDA | | | 3.0 | x | |
Increase | |
| | | | | | | Enterprise Value/
Revenue | | | 0.34 | x | |
Increase | |
| | | | | | | Discount for Lack
of Marketability | | | 30.0 | % | |
Decrease | |
* Amount is indicative of the weighted average.
** Represents the expected directional change in the fair value of the Level 3 investments that would result from an increase in the corresponding input. A decrease to the unobservable input would have the opposite effect. Significant changes in these inputs could result in significantly higher or lower fair value measurements.
3. Senior Loans: Senior Loans are typically structured by a syndicate of lenders ("Lenders"), one or more of which administers the Senior Loan on behalf of the Lenders ("Agent"). Lenders may sell interests in Senior Loans to third parties ("Participations") or may assign all or a portion of their interest in a Senior Loan to third parties ("Assignments"). Senior Loans are exempt from registration under the Securities Act of 1933. Presently, Senior Loans are not readily marketable and are often subject to restrictions on resale.
4. Structured Investments: The Fund invested a portion of its assets in structured investments. A structured investment is a derivative security designed to offer a return linked to a particular underlying security, currency, commodity or market. Structured investments may come in various forms including notes (such as exchange-traded
notes), warrants and options to purchase securities. The Fund will typically use structured investments to gain exposure to a permitted underlying security, currency, commodity or market when direct access to a market is limited or inefficient from a tax or cost standpoint. There can be no assurance that structured investments will trade at the same price or have the same value as the underlying security, currency, commodity or market. Investments in structured investments involve risks including issuer risk, counterparty risk and market risk. Holders of structured investments bear risks of the underlying investment and are subject to issuer or counterparty risk because the Fund is relying on the creditworthiness of such issuer or counterparty and has no rights with respect to the underlying investment. Certain structured investments may be thinly traded or have a limited trading market and may have the
26
Morgan Stanley Institutional Fund Trust
Annual Report — September 30, 2023
Notes to Financial Statements (cont'd)
effect of increasing the Fund's illiquidity to the extent that the Fund, at a particular time, may be unable to find qualified buyers for these securities.
5. Indemnifications: The Trust enters into contracts that contain a variety of indemnification clauses. The Trust's maximum exposure under these arrangements is unknown as this would involve future claims that may be made against the Fund that have not yet occurred.
6. Dividends and Distributions to Shareholders: Dividends and distributions to shareholders are recorded on the ex-dividend date. Dividends from net investment income, if any, are declared and paid monthly. Net realized capital gains, if any, are distributed at least annually.
7. Security Transactions, Income and Expenses: Security transactions are accounted for on the trade date (date the order to buy or sell is executed). Realized gains and losses on the sale of investment securities are determined on the specific identified cost method. When the Fund buys an interest in a Senior Loan, it may receive a commitment fee which is paid to lenders on an ongoing basis based upon the undrawn portion committed by the lenders of the underlying Senior Loan. The Fund accrues the commitment fee over the expected term of the loan. When the Fund sells an interest in a Senior Loan, it may be required to pay fees or commissions to the purchaser of the interest. Fees received in connection with loan amendments are accrued as earned. Dividend income and other distributions are recorded on the ex-dividend date (except for certain foreign dividends which may be recorded as soon as the Fund is informed of such dividends) net of applicable withholding taxes. Non-cash dividends received in the form of stock, if any, are recognized on the ex-dividend date and recorded as non-cash dividend income at fair value. Interest income is recognized on the accrual basis (except where collection is in doubt) net of applicable withholding taxes. Discounts are accreted and premiums are amortized over the life of the respective securities. Most expenses of the Fund can be directly attributed to a particular Fund. Expenses which cannot be directly attributed are apportioned among the Funds based upon relative net assets or other appropriate methods. Income, expenses (other than class specific expenses — distribution and shareholder services, transfer agency and sub transfer agency fees) and realized and
unrealized gains or losses are allocated to each class of shares based upon their relative net assets.
The Fund owns shares of real estate investment trusts ("REITs") which report information on the source of their distributions annually in the following calendar year. A portion of distributions received from REITs during the year is estimated to be a return of capital and is recorded as a reduction of their cost.
B. Advisory Fees: The Adviser, a wholly-owned subsidiary of Morgan Stanley, provides the Fund with advisory services under the terms of an Investment Advisory Agreement, paid quarterly, at an annual rate of 0.60% of the average daily net assets of the Fund.
The Adviser has agreed to reduce its advisory fee and/or reimburse the Fund so that total annual Fund operating expenses, excluding certain investment related expenses, taxes, interest and other extraordinary expenses (including litigation), will not exceed 0.65% for Class I shares, 1.00% for Class A shares, 1.25% for Class L shares, 1.75% for Class C shares, 0.62% for Class R6 shares and 0.62% for Class IR shares. The fee waivers and/or expense reimbursements will continue for at least one year from the date of the Fund's prospectus or until such time as the Trustees act to discontinue all or a portion of such waivers and/or reimbursements when they deem such action is appropriate. For the year ended September 30, 2023, approximately $534,000 of advisory fees were waived and approximately $122,000 of other expenses were reimbursed by the Adviser pursuant to this arrangement.
C. Administration Fees: The Adviser also serves as Administrator to the Trust and provides administrative services pursuant to an Administration Agreement for an annual fee, accrued daily and paid monthly, of 0.08% of the Fund's average daily net assets.
Under a Sub-Administration Agreement between the Administrator and State Street Bank and Trust Company ("State Street"), State Street provides certain administrative services to the Trust. For such services, the Administrator pays State Street a portion of the fee the Administrator receives from the Fund.
D. Distribution and Shareholder Services Fees: Morgan Stanley Distribution, Inc. ("MSDI" or the "Distributor"), a wholly-owned subsidiary of the Adviser and an indirect subsidiary of Morgan Stanley, serves as the Trust's Distributor of Fund shares pursuant to a Distribution Agreement. The Trust has adopted a Shareholder Services Plan with respect to
27
Morgan Stanley Institutional Fund Trust
Annual Report — September 30, 2023
Notes to Financial Statements (cont'd)
Class A shares pursuant to Rule 12b-1 under the Act. Under the Shareholder Services Plan, the Fund pays the Distributor a shareholder services fee, accrued daily and paid monthly, at an annual rate of 0.25% of the Fund's average daily net assets attributable to Class A shares.
The Trust has adopted a Distribution and Shareholder Services Plan with respect to Class L shares pursuant to Rule 12b-1 under the Act. Under the Distribution and Shareholder Services Plan, the Fund pays the Distributor a distribution fee, accrued daily and paid monthly, at an annual rate of 0.25% and a shareholder services fee, accrued daily and paid monthly, at an annual rate of 0.25% of the Fund's average daily net assets attributable to Class L shares.
The Trust has adopted a Distribution and Shareholder Services Plan with respect to Class C shares pursuant to Rule 12b-1 under the Act. Under the Distribution and Shareholder Services Plan, the Fund pays the Distributor a distribution fee, accrued daily and paid monthly, at an annual rate of 0.75% and a shareholder services fee, accrued daily and paid monthly, at an annual rate of 0.25% of the Fund's average daily net assets attributable to Class C shares.
The distribution and shareholder services fees are used to support the expenses associated with servicing and maintaining accounts. The Distributor may compensate other parties for providing distribution-related and/or shareholder support services to investors who purchase Class A, Class L and Class C shares.
E. Dividend Disbursing and Transfer/Co-Transfer Agent: The Trust's dividend disbursing and transfer agent is SS&C Global Investor & Distribution Solutions, Inc. ("SS&C GIDS"). Pursuant to a Transfer Agency Agreement, the Trust pays SS&C GIDS a fee based on the number of classes, accounts and transactions relating to the Funds of the Trust.
Eaton Vance Management ("EVM"), an affiliate of Morgan Stanley, provides co-transfer agency and related services to the Fund pursuant to a Co-Transfer Agency Services Agreement. For the year ended September 30, 2023, co-transfer agency fees and expenses incurred to EVM, included in "Transfer Agency Fees" in the Statement of Operations, amounted to approximately $1,000.
F. Custodian Fees: State Street (the "Custodian") also serves as Custodian for the Trust in accordance with a Custodian Agreement. The Custodian holds cash, securities and other assets of the Trust as required by the Act. Custody fees
are payable monthly based on assets held in custody, investment purchases and sales activity and account maintenance fees, plus reimbursement for certain out-of-pocket expenses.
G. Security Transactions and Transactions with Affiliates: For the year ended September 30, 2023, purchases and sales of investment securities for the Fund, other than long-term U.S. Government securities and short-term investments were approximately $68,839,000 and $107,927,000, respectively. There were no purchases and sales of long-term U.S. Government securities for the year ended ended September 30, 2023.
The Fund invests in the Institutional Class of the Morgan Stanley Institutional Liquidity Funds — Government Portfolio (the "Liquidity Funds"), an open-end management investment company managed by the Adviser. Advisory fees paid by the Fund are reduced by an amount equal to its pro-rata share of the advisory and administration fees paid by the Fund due to its investment in the Liquidity Funds. For the year ended September 30, 2023, advisory fees paid were reduced by approximately $1,000 relating to the Fund's investment in the Liquidity Funds.
A summary of the Fund's transactions in shares of affiliated investments during the year ended September 30, 2023 is as follows:
Affiliated
Investment
Company | | Value
September 30,
2022
(000) | | Purchases
at Cost
(000) | | Proceeds
from Sales
(000) | | Dividend
Income
(000) | |
Liquidity Funds | | $ | 740 | | | $ | 42,137 | | | $ | 42,877 | | | $ | 39 | | |
Affiliated
Investment
Company (cont'd) | | Realized
Gain
(Loss)
(000) | | Change in
Unrealized
Appreciation
(Depreciation)
(000) | | Value
September 30,
2023
(000) | |
Liquidity Funds | | $ | — | | | $ | — | | | $ | — | | |
The Fund has an unfunded Deferred Compensation Plan (the "Compensation Plan"), which allows each independent Trustee to defer payment of all, or a portion, of the fees he or she receives for serving on the Board of Trustees. Each eligible Trustee generally may elect to have the deferred amounts credited with a return equal to the total return on one or more of the Morgan Stanley funds that are offered as investment options under the Compensation Plan. Appreciation/depreciation and distributions received from these investments are recorded with an offsetting increase/decrease in the deferred compensation obligation and do not affect the NAV of the Fund.
28
Morgan Stanley Institutional Fund Trust
Annual Report — September 30, 2023
Notes to Financial Statements (cont'd)
H. Federal Income Taxes: It is the Fund's intention to continue to qualify as a regulated investment company ("RIC") and distribute all of its taxable and tax-exempt income. Accordingly, no provision for federal income taxes is required in the financial statements.
The Fund may be subject to taxes imposed by countries in which it invests. Such taxes are generally based on income and/or capital gains earned or repatriated. Taxes are accrued based on net investment income, net realized gains and net unrealized appreciation as such income and/or gains are earned. Taxes may also be based on transactions in foreign currency and are accrued based on the value of investments denominated in such currency.
FASB ASC 740-10, "Income Taxes — Overall", sets forth a minimum threshold for financial statement recognition of the benefit of a tax position taken or expected to be taken in a tax return. Management has concluded there are no significant uncertain tax positions that would require recognition in the financial statements. If applicable, the Fund recognizes interest accrued related to unrecognized tax benefits in "Interest Expense" and penalties in "Other Expenses" in the Statement of Operations. The Fund files tax returns with the U.S. Internal Revenue Service, New York and various states. Generally, each of the tax years in the four-year period ended September 30, 2023 remains subject to examination by taxing authorities.
The tax character of distributions paid may differ from the character of distributions shown for GAAP purposes due to short-term capital gains being treated as ordinary income for tax purposes. The tax character of distributions paid during fiscal years 2023 and 2022 was as follows:
2023 Distributions
Paid From:
Ordinary Income
(000) | | 2022 Distributions
Paid From:
Ordinary Income
(000) | |
| $ | 8,303 | | | $ | 9,747 | | |
The amount and character of income and gains to be distributed are determined in accordance with income tax regulations which may differ from GAAP. These book/tax differences are either considered temporary or permanent in nature.
Temporary differences are attributable to differing book and tax treatments for the timing of the recognition of gains (losses) on certain investment transactions and the timing of the deductibility of certain expenses.
The Fund had no permanent differences causing reclassifications among the components of net assets for the year ended September 30, 2023.
At September 30, 2023, the components of distributable earnings for the Fund on a tax basis were as follows:
Undistributed
Ordinary
Income
(000) | | Undistributed
Long-Term
Capital Gain
(000) | |
| $ | 769 | | | $ | — | | |
At September 30, 2023, the Fund had available for federal income tax purposes unused short-term and long-term capital losses of approximately $2,257,000 and $27,298,000, respectively, that do not have an expiration date.
To the extent that capital loss carryforwards are used to offset any future capital gains realized, no capital gains tax liability will be incurred by the Fund for gains realized and not distributed. To the extent that capital gains are offset, such gains will not be distributed to the shareholders.
I. Credit Facility: The Trust and other Morgan Stanley funds participated in a $300,000,000 committed, unsecured revolving line of credit facility (the "Facility") with State Street. Effective April 17, 2023, the committed line amount increased to $500,000,000. This Facility is to be used for temporary emergency purposes or funding of shareholder redemption requests. The interest rate for any funds drawn will be based on the federal funds rate or overnight bank funding rate plus a spread. The Facility also has a commitment fee of 0.25% per annum based on the unused portion of the Facility, which is allocated among participating funds based on relative net assets. During the twelve months ended September 30, 2023, the Fund did not have any borrowings under the Facility.
J. Other: At September 30, 2023, the Fund had record owners of 10% or greater. Investment activities of these shareholders could have a material impact on the Fund. The aggregate percentage of such owners was 75.0%.
K. Market Risk: An investment in the Fund is based on the values of the Fund's investments, which may change due to economic and other events that affect markets generally, as well as those that affect particular regions, countries, industries, companies or governments. The risks associated with these developments may be magnified if social, political, economic and other conditions and events (such as war, natural disasters, health emergencies (e.g., epidemics and pandemics), terrorism, conflicts, social unrest, recessions, inflation, rapid interest rate changes and supply chain disruptions) adversely interrupt the global economy and financial markets. It is difficult to predict when events affecting the U.S. or global financial markets may occur, the effects that such events may have and the duration
29
Morgan Stanley Institutional Fund Trust
Annual Report — September 30, 2023
Notes to Financial Statements (cont'd)
of those effects (which may last for extended periods). These events may negatively impact broad segments of businesses and populations and have a significant and rapid negative impact on the performance of the Fund's investments, adversely affect and increase the volatility of the Fund's share price and exacerbate pre-existing risks to the Fund. The occurrence, duration and extent of these or other types of adverse economic and market conditions and uncertainty over the long term cannot be reasonably projected or estimated at this time. The ultimate impact of public health emergencies or other adverse economic or market developments and the extent to which the associated conditions impact the Fund and its investments will also depend on other future developments, which are highly uncertain, difficult to accurately predict and subject to change at any time. The financial performance of the Fund's investments (and, in turn, the Fund's investment results) as well as their liquidity may be adversely affected because of these and similar types of factors and developments.
L. LIBOR Discontinuance or Unavailability Risk: The London Interbank Offering Rate ("LIBOR") was a leading floating rate benchmark used in loans, notes, derivatives and other instruments or investments. As a result of benchmark reforms, publication of most LIBOR settings has ceased. Some LIBOR settings continue to be published but only on a temporary, synthetic and non-representative basis. Regulated entities have generally ceased entering into new LIBOR contracts in connection with regulatory guidance or prohibitions. Public and private sector actors have worked to establish new or alternative reference rates to be used in place of LIBOR. There is no assurance that the composition or characteristics of any such new or alternative reference rate will be similar to or produce the same value or economic equivalence as LIBOR or that it will have the same volume or liquidity as did LIBOR , which may affect the value or liquidity or return on certain of the Fund's investments and result in costs incurred in connection with closing out positions and entering into new trades.
Neither the effect of the LIBOR transition process nor its ultimate success can yet be known. The transition process might lead to increased volatility and illiquidity in markets for, and reduce the effectiveness of hedges placed against, instruments whose terms currently include (or previously included) LIBOR. While some LIBOR-based instruments contemplated a scenario where LIBOR is no longer available by providing for an alternative rate-setting methodology, there may be significant uncertainty regarding the effectiveness of any such alternative methodologies to replicate or replace LIBOR. Some
of the Fund's investments may be so-called "tough legacy" LIBOR instruments which may not have effective alternative rate-setting provisions or may involve counterparties who are unwilling to add or exercise rights under alternative rate-setting provisions in such instruments. On March 15, 2022, the Adjustable Interest Rate (LIBOR) Act was signed into law. This law provides a statutory fallback mechanism on a nationwide basis to replace U.S. Dollar LIBOR with a benchmark rate that is selected by the Board of Governors of the Federal Reserve System based on the Secured Overnight Financing Rate ("SOFR") for tough legacy contracts. On February 27, 2023, the final rule in connection with this law became effective, establishing benchmark replacements based on SOFR and Term SOFR (a forward-looking measurement of market expectations of SOFR implied from certain derivatives markets) for applicable tough legacy contracts governed by U.S. law. In addition, the FCA has announced that it will require the publication of the one-month, three-month and six-month U.S. Dollar LIBOR settings on the basis of a changed methodology (known as "synthetic LIBOR"), after June 30, 2023 through at least September 30, 2024, addressing non-U.S. law governed U.S. Dollar LIBOR instruments, but this synthetic LIBOR will be designated by the FCA as unrepresentative of the underlying market that it seeks to measure and will be solely available for use in legacy transactions. The transition of investments from LIBOR to a new or replacement rate as a result of amendment, application of existing fallbacks, statutory requirements, the application of synthetic LIBOR or otherwise may also result in a reduction in the value of certain instruments held by the Fund or a reduction in the effectiveness of related Fund transactions such as hedges. In addition, a liquid market for newly-issued instruments that use a reference rate other than LIBOR is still developing. There may also be challenges for the Fund to enter into hedging transactions against such newly-issued instruments until a market for such hedging transactions more fully develops. All of the aforementioned may adversely affect the Fund's investments (including their volatility, value and liquidity) and, as a result, the performance or NAV.
30
Morgan Stanley Institutional Fund Trust
Annual Report — September 30, 2023
Report of Independent Registered Public Accounting Firm
To the Shareholders and Board of Trustees of
Morgan Stanley Institutional Fund Trust —
High Yield Portfolio
Opinion on the Financial Statements
We have audited the accompanying statement of assets and liabilities of High Yield Portfolio (the "Fund") (one of the funds constituting Morgan Stanley Institutional Fund Trust (the "Trust")), including the portfolio of investments, as of September 30, 2023, and the related statement of operations for the year then ended, the statements of changes in net assets for each of the two years in the period then ended, the financial highlights for each of the five years in the period then ended and the related notes (collectively referred to as the "financial statements"). In our opinion, the financial statements present fairly, in all material respects, the financial position of the Fund (one of the funds constituting Morgan Stanley Institutional Fund Trust) at September 30, 2023, the results of its operations for the year then ended, the changes in its net assets for each of the two years in the period then ended and its financial highlights for each of the five years in the period then ended, in conformity with U.S. generally accepted accounting principles.
Basis for Opinion
These financial statements are the responsibility of the Trust's management. Our responsibility is to express an opinion on the Fund's financial statements based on our audits. We are a public accounting firm registered with the Public Company Accounting Oversight Board (United States) ("PCAOB") and are required to be independent with respect to the Trust in accordance with the U.S. federal securities laws and the applicable rules and regulations of the Securities and Exchange Commission and the PCAOB.
We conducted our audits in accordance with the standards of the PCAOB. Those standards require that we plan and perform the audit to obtain reasonable assurance about whether the financial statements are free of material misstatement, whether due to error or fraud. The Trust is not required to have, nor were we engaged to perform, an audit of the Trust's internal control over financial reporting. As part of our audits, we are required to obtain an understanding of internal control over financial reporting but not for the purpose of expressing an opinion on the effectiveness of the Trust's internal control over financial reporting. Accordingly, we express no such opinion.
Our audits included performing procedures to assess the risks of material misstatement of the financial statements, whether due to error or fraud, and performing procedures that respond to those risks. Such procedures included examining, on a test basis, evidence regarding the amounts and disclosures in the financial statements. Our procedures included confirmation of securities owned as of September 30, 2023, by correspondence with the custodian, brokers and others; when replies were not received from brokers and others, we performed other auditing procedures. Our audits also included evaluating the accounting principles used and significant estimates made by management, as well as evaluating the overall presentation of the financial statements. We believe that our audits provide a reasonable basis for our opinion.

We have served as the auditor of one or more Morgan Stanley investment companies since 2000.
Boston, Massachusetts
November 27, 2023
31
Morgan Stanley Institutional Fund Trust
Annual Report — September 30, 2023
Investment Advisory Agreement Approval (unaudited)
Nature, Extent and Quality of Services
The Board reviewed and considered the nature and extent of the investment advisory services provided by the Adviser under the advisory agreement, including portfolio management, investment research and equity and fixed income securities trading. The Board also reviewed and considered the nature and extent of the non-advisory, administrative services provided by the Administrator under the administration agreement, including accounting, operations, clerical, bookkeeping, compliance, business management and planning, legal services and the provision of supplies, office space and utilities at the Adviser's expense. The Board also considered the Adviser's investment in personnel and infrastructure that benefits the Fund. (The Adviser and Administrator together are referred to as the "Adviser" and the advisory and administration agreements together are referred to as the "Management Agreement.") The Board also considered that the Adviser serves a variety of other investment advisory clients and has experience overseeing service providers. The Board also compared the nature of the services provided by the Adviser with similar services provided by non-affiliated advisers as prepared by Broadridge Financial Solutions, Inc. ("Broadridge").
The Board reviewed and considered the qualifications of the portfolio managers, the senior administrative managers and other key personnel of the Adviser who provide the advisory and administrative services to the Fund. The Board determined that the Adviser's portfolio managers and key personnel are well qualified by education and/or training and experience to perform the services in an efficient and professional manner. The Board concluded that the nature and extent of the advisory and administrative services provided were necessary and appropriate for the conduct of the business and investment activities of the Fund and supported its decision to approve the Management Agreement.
Performance, Fees and Expenses of the Fund
The Board reviewed the performance, fees and expenses of the Fund compared to its peers, as prepared by Broadridge, and to appropriate benchmarks where applicable. The Board discussed with the Adviser the performance goals and the actual results achieved in managing the Fund. When considering a fund's performance, the Board and the Adviser place emphasis on trends and longer-term returns (focusing on one-year, three-year and five-year performance, as of December 31, 2022, or since inception, as applicable). When a fund underperforms its benchmark and/or its peer group average, the Board and the Adviser discuss the causes of such underperformance and, where necessary, they discuss specific changes to investment strategy or investment personnel. The Board noted that the Fund's performance was below its peer group average for the one-, three- and five-year periods. The Board discussed with the Adviser the level of the advisory and administration fees (together, the "management fee") for this Fund relative to comparable funds and/or other accounts advised by the Adviser and/or compared to its peers as prepared by Broadridge. In addition to the management fee, the Board also reviewed the Fund's total expense ratio. The Board noted that the Fund's contractual management fee was higher than but close to its peer group average and the actual management fee and total expense ratio were lower than its peer group averages. After discussion, the Board concluded that the Fund's (i) performance was acceptable and (ii) management fee and total expense ratio were competitive with its peer group averages.
Economies of Scale
The Board considered the size and growth prospects of the Fund and how that relates to the Fund's total expense ratio and particularly the Fund's management fee rate, which does not include breakpoints. In conjunction with its review of the Adviser's profitability, the Board discussed with the Adviser how a change in assets can affect the efficiency or effectiveness of managing the Fund and whether the management fee level is appropriate relative to current and projected asset levels and/or whether the management fee structure reflects economies of scale as asset levels change. The Board has determined that its review of the actual and/or potential economies of scale of the Fund supports its decision to approve the Management Agreement.
Profitability of the Adviser and Affiliates
The Board considered information concerning the costs incurred and profits realized by the Adviser and its affiliates during the last year from their relationship with the Fund and during the last two years from their relationship with the Morgan Stanley Fund Complex and reviewed with the Adviser the cost allocation methodology used to determine the profitability of the Adviser and affiliates. The Board has determined that its review of the analysis of the Adviser's expenses and profitability supports its decision to approve the Management Agreement.
32
Morgan Stanley Institutional Fund Trust
Annual Report — September 30, 2023
Investment Advisory Agreement Approval (unaudited) (cont'd)
Other Benefits of the Relationship
The Board considered other direct and indirect benefits to the Adviser and/or its affiliates derived from their relationship with the Fund and other funds advised by the Adviser. These benefits may include, among other things, fees for trading, distribution and/or shareholder servicing and for transaction processing and reporting platforms used by securities lending agents, and research received by the Adviser generated from commission dollars spent on funds' portfolio trading. The Board reviewed with the Adviser these arrangements and the reasonableness of the Adviser's costs relative to the services performed. The Board has determined that its review of the other benefits received by the Adviser or its affiliates supports its decision to approve the Management Agreement.
Resources of the Adviser and Historical Relationship Between the Fund and the Adviser
The Board considered whether the Adviser is financially sound and has the resources necessary to perform its obligations under the Management Agreement. The Board also reviewed and considered the historical relationship between the Fund and the Adviser, including the organizational structure of the Adviser, the policies and procedures formulated and adopted by the Adviser for managing the Fund's operations and the Board's confidence in the competence and integrity of the senior managers and key personnel of the Adviser. The Board concluded that the Adviser has the financial resources necessary to fulfill its obligations under the Management Agreement and that it is beneficial for the Fund to continue its relationship with the Adviser.
Other Factors and Current Trends
The Board considered the controls and procedures adopted and implemented by the Adviser and monitored by the Fund's Chief Compliance Officer and concluded that the conduct of business by the Adviser indicates a good faith effort on its part to adhere to high ethical standards in the conduct of the Fund's business.
General Conclusion
After considering and weighing all of the above factors, with various written materials and verbal information presented by the Adviser, the Board concluded that it would be in the best interest of the Fund and its shareholders to approve renewal of the Management Agreement for another year. In reaching this conclusion the Board did not give particular weight to any single piece of information or factor referenced above. The Board considered these factors and information over the course of the year and in numerous meetings, some of which were in executive session with only the independent Board members and their counsel present. It is possible that individual Board members may have weighed these factors, and the information presented, differently in reaching their individual decisions to approve the Management Agreement.
33
Morgan Stanley Institutional Fund Trust
Annual Report — September 30, 2023
Liquidity Risk Management Program (unaudited)
In compliance with Rule 22e-4 under the Investment Company Act of 1940, as amended (the "Liquidity Rule"), the Fund has adopted and implemented a liquidity risk management program (the "Program"), which is reasonably designed to assess and manage the risk that the Fund could not meet requests to redeem shares issued by the Fund without significant dilution of remaining investors' interests in the Fund (i.e., liquidity risk). The Fund's Board of Trustees (the "Board") previously approved the designation of the Liquidity Risk Subcommittee (the "LRS") as Program administrator. The LRS is comprised of representatives from various divisions within Morgan Stanley Investment Management.
At a meeting held on March 1-2, 2023, the Board reviewed a written report prepared by the LRS that addressed the Program's operation and assessed its adequacy, and effectiveness of implementation for the period from January 1, 2022, through December 31, 2022, as required under the Liquidity Rule. The report concluded that the Program operated effectively and was adequately and effectively implemented in all material aspects, and that the relevant controls and safeguards were appropriately designed to enable the LRS to administer the Program in compliance with the Liquidity Rule.
In accordance with the Program, the LRS assessed each Fund's liquidity risk no less frequently than annually taking into consideration certain factors, as applicable, such as (i) investment strategy and liquidity of portfolio investments, (ii) short-term and long-term cash flow projections and (iii) holdings of cash and cash equivalents and borrowing arrangements and other funding sources. Certain factors are considered under both normal and reasonably foreseeable stressed conditions.
Each Fund portfolio investment is classified into one of four liquidity categories, which classification is assessed at least monthly by the LRS. The classification is based on a determination of the number of days it is reasonably expected to take to convert the investment into cash, or sell or dispose of the investment, in current market conditions without significantly changing the market value of the investment. Liquidity classification determinations take into account various market, trading and investment-specific considerations, as well as market depth, and in some cases utilize third-party vendor data.
The Liquidity Rule limits a fund's investments in illiquid investments to 15% of its net assets and requires funds that do not primarily hold assets that are highly liquid investments to determine and maintain a minimum percentage of the fund's net assets to be invested in highly liquid investments (highly liquid investment minimum or "HLIM"). The LRS believes that the Program includes provisions reasonably designed to review, monitor and comply with the 15% limit on illiquid investments and for determining, periodically reviewing and complying with the HLIM requirement, as applicable.
There can be no assurance that the Program will achieve its objectives under all circumstances in the future. Please refer to the Fund's prospectus for more information regarding the Fund's exposure to liquidity risk and other risks to which it may be subject.
34
Morgan Stanley Institutional Fund Trust
Annual Report — September 30, 2023
Important Notices (unaudited)
Reporting to Shareholders
Each Morgan Stanley fund provides a complete schedule of portfolio holdings in its Semi-Annual and the Annual Reports within 60 days of the end of the fund's second and fourth fiscal quarters. The Semi-Annual and Annual Reports are filed electronically with the Securities and Exchange Commission ("SEC") on Form N-CSRS and Form N-CSR, respectively. Morgan Stanley makes these reports available on its public website, www.morganstanley.com/im. Each Morgan Stanley non-money market fund also files a complete schedule of portfolio holdings with the SEC for the fund's first and third fiscal quarters as an attachment to Form N-PORT. Morgan Stanley does not deliver the reports for the first and third fiscal quarters to shareholders, but makes the complete schedule of portfolio holdings for the fund's first and third fiscal quarters available on its public website. The holdings for each money market fund are also posted to the Morgan Stanley public website. You may obtain the Form N-PORT filings (as well as the Form N-CSR and N-CSRS filings) by accessing the SEC's website, www.sec.gov. You can also request copies of these materials, upon payment of a duplicating fee, by electronic request at the SEC's email address (publicinfo@sec.gov).
Proxy Voting Policies and Procedures and Proxy Voting Record
You may obtain a copy of the Trust's Proxy Voting Policy and Procedures and information regarding how the Trust voted proxies relating to portfolio securities during the most recent twelve-month period ended June 30, without charge, upon request, by calling toll free 1 (800) 869-6397 or by visiting our website at www.morganstanley.com/im. This information is also available on the SEC's website at www.sec.gov.
This report is authorized for distribution only when preceded or accompanied by a prospectus or summary prospectus of the applicable fund of Morgan Stanley Institutional Fund Trust, which describes in detail the fund's investment policies, risks, fees and expenses. Please read the prospectus carefully before you invest or send money. For additional information, including information regarding the investments comprising the Fund, please visit our website at www.morganstanley.com/im. or call toll free 1 (800) 869-6397.
Householding Notice
To reduce printing and mailing costs, the Fund attempts to eliminate duplicate mailings to the same address. The Fund delivers a single copy of certain shareholder documents, including shareholder reports, prospectuses and proxy materials, to investors with the same last name who reside at the same address. Your participation in this program will continue for an unlimited period of time unless you instruct us otherwise. You can request multiple copies of these documents by calling 1 (800) 869-6397, 8:00 a.m. to 6:00 p.m., ET. Once our Customer Service Center has received your instructions, we will begin sending individual copies for each account within 30 days.
Tailored Shareholder Reports
Effective January 24, 2023, the SEC adopted rule and form amendments to require open-end mutual funds and ETFs to transmit concise and visually engaging streamlined annual and semiannual reports to shareholders that highlight key information. Other information, including financial statements, will no longer appear in a streamlined shareholder report but must be available online, delivered free of charge upon request, and filed on a semiannual basis on Form N-CSR. The rule and form amendments have a compliance date of July 24, 2024. At this time, management is evaluating the impact of these amendments on the shareholder reports for the Morgan Stanley Funds.
35
Morgan Stanley Institutional Fund Trust
Annual Report — September 30, 2023
Federal Tax Notice (unaudited)
For federal income tax purposes, the following information is furnished with respect to the distributions paid by the Fund during its taxable year ended September 30, 2023.
The Fund designated approximately $7,260,000 of its distributions paid as business interest income.
The Fund designated approximately $6,287,000 of its distributions paid as qualified interest income.
In January, the Fund provides tax information to shareholders for the calendar year.
36
Morgan Stanley Institutional Fund Trust
Annual Report — September 30, 2023
U.S. Customer Privacy Notice (unaudited) April 2021
FACTS | | WHAT DOES MSIM DO WITH YOUR PERSONAL INFORMATION? | |
Why? | | Financial companies choose how they share your personal information. Federal law gives consumers the right to limit some but not all sharing. Federal law also requires us to tell you how we collect, share, and protect your personal information. Please read this notice carefully to understand what we do. | |
What? | | The types of personal information we collect and share depend on the product or service you have with us. This information can include:
◼ Social Security number and income
◼ investment experience and risk tolerance
◼ checking account number and wire transfer instructions | |
How? | | All financial companies need to share customers' personal information to run their everyday business. In the section below, we list the reasons financial companies can share their customers' personal information; the reasons MSIM chooses to share; and whether you can limit this sharing. | |
Reasons we can share your personal information | | Does MSIM share? | | Can you limit this sharing? | |
For our everyday business purposes —
such as to process your transactions, maintain your account(s), respond to court orders and legal investigations, or report to credit bureaus | | Yes | | No | |
For our marketing purposes —
to offer our products and services to you | | Yes | | No | |
For joint marketing with other financial companies | | No | | We don't share | |
For our investment management affiliates' everyday business purposes —
information about your transactions, experiences, and creditworthiness | | Yes | | Yes | |
For our affiliates' everyday business purposes —
information about your transactions and experiences | | Yes | | No | |
For our affiliates' everyday business purposes —
information about your creditworthiness | | No | | We don't share | |
For our investment management affiliates to market to you | | Yes | | Yes | |
For our affiliates to market to you | | No | | We don't share | |
For non-affiliates to market to you | | No | | We don't share | |
37
Morgan Stanley Institutional Fund Trust
Annual Report — September 30, 2023
U.S. Customer Privacy Notice (unaudited) (cont'd) April 2021
To limit our sharing | | Call toll-free (844) 312-6327 or email: imprivacyinquiries@morganstanley.com
Please note:
If you are a new customer, we can begin sharing your information 30 days from the date we sent this notice. When you are no longer our customer, we continue to share your information as described in this notice. However, you can contact us at any time to limit our sharing. | |
Questions? | | Call toll-free (844) 312-6327 or email: imprivacyinquiries@morganstanley.com | |
Who we are
Who is providing this notice? | | Morgan Stanley Investment Management Inc. and its investment management affiliates ("MSIM") (see Investment Management Affiliates definition below) | |
What we do
How does MSIM protect my personal information? | | To protect your personal information from unauthorized access and use, we use security measures that comply with federal law. These measures include computer safeguards and secured files and buildings. We have policies governing the proper handling of customer information by personnel and requiring third parties that provide support to adhere to appropriate security standards with respect to such information. | |
How does MSIM collect my personal information? | | We collect your personal information, for example, when you
◼ open an account or make deposits or withdrawals from your account
◼ buy securities from us or make a wire transfer
◼ give us your contact information
We also collect your personal information from others, such as credit bureaus, affiliates, or other companies. | |
Why can't I limit all sharing? | | Federal law gives you the right to limit only
◼ sharing for affiliates' everyday business purposes — information about your creditworthiness
◼ affiliates from using your information to market to you
◼ sharing for non-affiliates to market to you
State laws and individual companies may give you additional rights to limit sharing. See below for more on your rights under state law. | |
38
Morgan Stanley Institutional Fund Trust
Annual Report — September 30, 2023
U.S. Customer Privacy Notice (unaudited) (cont'd) April 2021
Definitions
Investment Management Affiliates | | MSIM Investment Management Affiliates include registered investment advisers, registered broker-dealers, and registered and unregistered funds in the Investment Management Division. Investment Management Affiliates does not include entities associated with Morgan Stanley Wealth Management, such as Morgan Stanley Smith Barney LLC and Morgan Stanley & Co. | |
Affiliates | | Companies related by common ownership or control. They can be financial and non-financial companies.
◼ Our affiliates include companies with a Morgan Stanley name and financial companies such as Morgan Stanley Smith Barney LLC and Morgan Stanley & Co. | |
Non-affiliates | | Companies not related by common ownership or control. They can be financial and non-financial companies.
◼ MSIM does not share with non-affiliates so they can market to you. | |
Joint marketing | | A formal agreement between non-affiliated financial companies that together market financial products or services to you.
◼ MSIM doesn't jointly market | |
Other important information
Vermont: Except as permitted by law, we will not share personal information we collect about Vermont residents with Non-affiliates unless you provide us with your written consent to share such information.
California: Except as permitted by law, we will not share personal information we collect about California residents with Non-affiliates and we will limit sharing such personal information with our Affiliates to comply with California privacy laws that apply to us.
39
Morgan Stanley Institutional Fund Trust
Annual Report — September 30, 2023
Trustees and Officers Information (unaudited)
Independent Trustees:
Name, Address and Birth Year
of Independent Trustee | | Position(s)
Held with
Registrant | | Length of Time
Served* | | Principal Occupation(s) During Past 5 Years
and Other Relevant Professional Experience | | Number of
Funds in
Fund Complex
Overseen by
Independent
Trustee** | | Other Directorships
Held by Independent
Trustee During
Past 5 Years*** | |
Frank L. Bowman
c/o Perkins Coie LLP
Counsel to the Independent Trustees
1155 Avenue of the Americas
22nd Floor
New York, NY 10036
Birth Year: 1944 | | Trustee | | Since
August
2006 | | President, Strategic Decisions, LLC (consulting) (since February 2009); Director or Trustee of various Morgan Stanley Funds (since August 2006); Chairperson of the Compliance and Insurance Committee (since October 2015); formerly, Chairperson of the Insurance Sub-Committee of the Compliance and Insurance Committee (2007-2015); served as President and Chief Executive Officer of the Nuclear Energy Institute (policy organization) (February 2005-November 2008); retired as Admiral, U.S. Navy after serving over 38 years on active duty including 8 years as Director of the Naval Nuclear Propulsion Program in the Department of the Navy and the U.S. Department of Energy (1996-2004); served as Chief of Naval Personnel (July 1994-September 1996) and on the Joint Staff as Director of Political Military Affairs (June 1992-July 1994); knighted as Honorary Knight Commander of the Most Excellent Order of the British Empire; awarded the Officier de l'Orde National du Mèrite by the French Government; elected to the National Academy of Engineering (2009). | | | 86 | | | Director of Naval and Nuclear Technologies LLP; Director Emeritus of the Armed Services YMCA; Member of the National Security Advisory Council of the Center for U.S. Global Engagement and a former member of the CNA Military Advisory Board; Chairman of the Board of Trustees of Fairhaven United Methodist Church; Member of the Board of Advisors of the Dolphin Scholarship Foundation; Director of other various nonprofit organizations; formerly, Director of BP, plc (November 2010-May 2019). | |
Frances L. Cashman
c/o Perkins Coie LLP
Counsel to the Independent
Trustees
1155 Avenue of the Americas
22nd Floor
New York, NY 10036
Birth Year: 1961 | | Trustee | | Since
February
2022 | | Chief Executive Officer, Asset Management Division, Delinian Ltd. (financial information) (May 2021-Present); Executive Vice President and various other roles, Legg Mason & Co. (asset management) (2010-2020); Managing Director, Stifel Nicolaus (2005-2010). | | | 87 | | | Trustee and Investment Committee Member, GeorgiaTech Foundation (since June 2019); Trustee and Chair of Marketing Committee, and Member of Investment Committee, Loyola Blakefield (Since September 2017); Trustee, MMI Gateway Foundation (since September 2017); Director and Investment Committee Member, Catholic Community Foundation Board (2012-2018); Director and Investment Committee Member, St. Ignatius Loyola Academy (2011-2017). | |
Kathleen A. Dennis
c/o Perkins Coie LLP
Counsel to the Independent
Trustees
1155 Avenue of the Americas
22nd Floor
New York, NY 10036
Birth Year: 1953 | | Trustee | | Since
August
2006 | | Chairperson of the Governance Committee (since January 2021), Chairperson of the Liquidity and Alternatives Sub-Committee of the Investment Committee (2006-2020) and Director or Trustee of various Morgan Stanley Funds (since August 2006); President, Cedarwood Associates (mutual fund and investment management consulting) (since July 2006); formerly, Senior Managing Director of Victory Capital Management (1993-2006). | | | 86 | | | Board Member, University of Albany Foundation (2012-present); Board Member, Mutual Funds Directors Forum (2014-present); Director of various non-profit organizations. | |
40
Morgan Stanley Institutional Fund Trust
Annual Report — September 30, 2023
Trustees and Officers Information (unaudited) (cont'd)
Independent Trustees: (cont'd)
Name, Address and Birth Year
of Independent Trustee | | Position(s)
Held with
Registrant | | Length of Time
Served* | | Principal Occupation(s) During Past 5 Years
and Other Relevant Professional Experience | | Number of
Funds in
Fund Complex
Overseen by
Independent
Trustee** | | Other Directorships
Held by Independent
Trustee During
Past 5 Years*** | |
Nancy C. Everett
c/o Perkins Coie LLP
Counsel to the Independent
Trustees
1155 Avenue of the Americas
22nd Floor
New York, NY 10036
Birth Year: 1955 | | Trustee | | Since
January
2015 | | Chairperson of the Equity Investment Committee (since January 2021); Director or Trustee of various Morgan Stanley Funds (since January 2015); Chief Executive Officer, Virginia Commonwealth University Investment Company (since November 2015); Owner, OBIR, LLC (institutional investment management consulting) (since June 2014); formerly, Managing Director, BlackRock, Inc. (February 2011-December 2013) and Chief Executive Officer, General Motors Asset Management (a/k/a Promark Global Advisors, Inc.) (June 2005-May 2010). | | | 87 | | | Formerly, Member of Virginia Commonwealth University School of Business Foundation (2005-2016); Member of Virginia Commonwealth University Board of Visitors (2013-2015); Member of Committee on Directors for Emerging Markets Growth Fund, Inc. (2007-2010); Chairperson of Performance Equity Management, LLC (2006-2010); and Chairperson, GMAM Absolute Return Strategies Fund, LLC (2006-2010). | |
Eddie A. Grier
c/o Perkins Coie LLP
Counsel to the Independent
Trustees
1155 Avenue of the Americas
22nd Floor
New York, NY 10036
Birth Year: 1955 | | Trustee | | Since
February
2022 | | Dean, Santa Clara University Leavey School of Business (since July 2021); Dean, Virginia Commonwealth University School of Business (2010-2021); President and various other roles, Walt Disney Company (entertainment and media) (1981-2010). | | | 87 | | | Director, Witt/Keiffer, Inc. (executive search) (since 2016); Director, NuStar GP, LLC (energy) (since August 2021); Director, Sonida Senior Living, Inc. (residential community operator) (2016-2021); Director, NVR, Inc. (homebuilding) (2013-2020); Director, Middleburg Trust Company (wealth management) (2014-2019); Director, Colonial Williamsburg Company (2012-2021); Regent, University of Massachusetts Global (since 2021); Director and Chair, ChildFund International (2012-2021); Trustee, Brandman University (2010-2021); Director, Richmond Forum (2012-2019). | |
41
Morgan Stanley Institutional Fund Trust
Annual Report — September 30, 2023
Trustees and Officers Information (unaudited) (cont'd)
Independent Trustees: (cont'd)
Name, Address and Birth Year
of Independent Trustee | | Position(s)
Held with
Registrant | | Length of Time
Served* | | Principal Occupation(s) During Past 5 Years
and Other Relevant Professional Experience | | Number of
Funds in
Fund Complex
Overseen by
Independent
Trustee** | | Other Directorships
Held by Independent
Trustee During
Past 5 Years*** | |
Jakki L. Haussler
c/o Perkins Coie LLP
Counsel to the Independent
Trustees
1155 Avenue of the Americas
22nd Floor
New York, NY 10036
Birth Year: 1957 | | Trustee | | Since
January
2015 | | Chairperson of the Audit Committee (since January 2023) and Director or Trustee of various Morgan Stanley Funds (since January 2015); Chairman, Opus Capital Group (since 1996); formerly, Chief Executive Officer, Opus Capital Group (1996-2019); Director, Capvest Venture Fund, LP (May 2000-December 2011); Partner, Adena Ventures, LP (July 1999-December 2010); Director, The Victory Funds (February 2005-July 2008). | | | 87 | | | Director, Vertiv Holdings Co. (VRT) (since August 2022); Director of Cincinnati Bell Inc. and Member, Audit Committee and Chairman, Governance and Nominating Committee (2008-2021); Director of Service Corporation International and Member, Audit Committee and Investment Committee; Director, Barnes Group Inc. (since July 2021); Director of Northern Kentucky University Foundation and Member, Investment Committee; Member of Chase College of Law Center for Law and Entrepreneurship Board of Advisors; Director of Best Transport (2005-2019); Director of Chase College of Law Board of Visitors; formerly, Member, University of Cincinnati Foundation Investment Committee. | |
Dr. Manuel H. Johnson
c/o Johnson Smick
International, Inc.
220 I Street, NE
Suite 200
Washington, D.C. 20002
Birth Year: 1949 | | Trustee | | Since
July
1991 | | Senior Partner, Johnson Smick International, Inc. (consulting firm); Chairperson of the Fixed Income, Liquidity and Alternatives Investment Committee (since January 2021), Chairperson of the Investment Committee (2006-2020) and Director or Trustee of various Morgan Stanley Funds (since July 1991); Co-Chairman and a founder of the Group of Seven Council (G7C) (international economic commission); formerly, Chairperson of the Audit Committee (July 1991-September 2006); Vice Chairman of the Board of Governors of the Federal Reserve System and Assistant Secretary of the U.S. Treasury. | | | 86 | | | Director of NVR, Inc. (home construction). | |
42
Morgan Stanley Institutional Fund Trust
Annual Report — September 30, 2023
Trustees and Officers Information (unaudited) (cont'd)
Independent Trustees: (cont'd)
Name, Address and Birth Year
of Independent Trustee | | Position(s)
Held with
Registrant | | Length of Time
Served* | | Principal Occupation(s) During Past 5 Years
and Other Relevant Professional Experience | | Number of
Funds in
Fund Complex
Overseen by
Independent
Trustee** | | Other Directorships
Held by Independent
Trustee During
Past 5 Years*** | |
Joseph K. Kearns
c/o Perkins Coie LLP
Counsel to the Independent
Trustees
1155 Avenue of the Americas
22nd Floor
New York, NY 10036
Birth Year: 1942 | | Trustee | | Since
August
1994 | | Senior Adviser, Kearns & Associates LLC (investment consulting); Chairperson of the Audit Committee (2006-2022) and Director or Trustee of various Morgan Stanley Funds (since August 1994); formerly, Deputy Chairperson of the Audit Committee (July 2003-September 2006); CFO of the J. Paul Getty Trust (1982-1999). | | | 87 | | | Director, Rubicon Investments (since February 2019); Prior to August 2016, Director of Electro Rent Corporation (equipment leasing); Prior to December 31, 2013, Director of The Ford Family Foundation. | |
Michael F. Klein
c/o Perkins Coie LLP
Counsel to the Independent
Trustees
1155 Avenue of the Americas
22nd Floor
New York, NY 10036
Birth Year: 1958 | | Trustee | | Since
August
2006 | | Chairperson of the Risk Committee (since January 2021); Managing Director, Aetos Alternatives Management, LP (since March 2000); Co-President, Aetos Alternatives Management, LP (since January 2004) and Co-Chief Executive Officer of Aetos Alternatives Management, LP (since August 2013); Chairperson of the Fixed Income Sub-Committee of the Investment Committee (2006-2020) and Director or Trustee of various Morgan Stanley Funds (since August 2006); formerly, Managing Director, Morgan Stanley & Co. Inc. and Morgan Stanley Dean Witter Investment Management and President, various Morgan Stanley Funds (June 1998-March 2000); Principal, Morgan Stanley & Co. Inc. and Morgan Stanley Dean Witter Investment Management (August 1997-December 1999). | | | 86 | | | Director of certain investment funds managed or sponsored by Aetos Alternatives Management, LP; Director of Sanitized AG and Sanitized Marketing AG (specialty chemicals). | |
Patricia A. Maleski
c/o Perkins Coie LLP
Counsel to the Independent
Trustees
1155 Avenue of the Americas
22nd Floor
New York, NY 10036
Birth Year: 1960 | | Trustee | | Since
January
2017 | | Director or Trustee of various Morgan Stanley Funds (since January 2017); Managing Director, JPMorgan Asset Management (2004-2016); Oversight and Control Head of Fiduciary and Conflicts of Interest Program (2015-2016); Chief Control Officer—Global Asset Management (2013-2015); President, JPMorgan Funds (2010-2013); Chief Administrative Officer (2004-2013); various other positions including Treasurer and Board Liaison (since 2001). | | | 87 | | | Trustee (since January 2022) and Treasurer (since January 2023), Nutley Family Service Bureau, Inc. | |
W. Allen Reed
c/o Perkins Coie LLP
Counsel to the Independent
Trustees
1155 Avenue of the Americas
22nd Floor
New York, NY 10036
Birth Year: 1947 | | Chair of the Board and Trustee | | Chair of the Board since August 2020 and Trustee since August 2006 | | Chair of the Boards of various Morgan Stanley Funds (since August 2020); Director or Trustee of various Morgan Stanley Funds (since August 2006); formerly, Vice Chair of the Boards of various Morgan Stanley Funds (January 2020-August 2020); President and Chief Executive Officer of General Motors Asset Management; Chairman and Chief Executive Officer of the GM Trust Bank and Corporate Vice President of General Motors Corporation (August 1994-December 2005). | | | 86 | | | Formerly, Director of Legg Mason, Inc. (2006-2019); and Director of the Auburn University Foundation (2010-2015). | |
* This is the earliest date the Trustee began serving the Morgan Stanley Funds. Each Trustee serves an indefinite term, until his or her successor is elected.
** The Fund Complex includes (as of December 31, 2022) all open-end and closed-end funds (including all of their portfolios) advised by Morgan Stanley Investment Management Inc. (the "Adviser") and any funds that have an adviser that is an affiliated person of the Adviser (including, but not limited to, Morgan Stanley AIP GP LP).
*** This includes any directorships at public companies and registered investment companies held by the Trustees at any time during the past five years.
43
Morgan Stanley Institutional Fund Trust
Annual Report — September 30, 2023
Trustees and Officers Information (unaudited) (cont'd)
Executive Officers:
Name, Address and Birth Year
of Executive Officer | | Position(s) Held
with
Registrant | | Length of
Time Served* | | Principal Occupation(s) During Past 5 Years | |
John H. Gernon
522 Fifth Avenue
New York, NY 10036
Birth Year: 1963 | | President and Principal Executive Officer | | Since
September
2013 | | President and Principal Executive Officer of the Equity and Fixed Income Funds and the Morgan Stanley AIP Funds (since September 2013) and the Liquidity Funds and various money market funds (since May 2014) in the Fund Complex; Managing Director of the Adviser. | |
Deidre A. Downes
1633 Broadway
New York, NY 10019
Birth Year: 1977 | | Chief Compliance Officer | | Since
November
2021 | | Executive Director of the Adviser (since January 2021) and Chief Compliance Officer of various Morgan Stanley Funds (since November 2021). Formerly, Vice President and Corporate Counsel at PGIM and Prudential Financial (October 2016-December 2020). | |
Francis J. Smith
522 Fifth Avenue
New York, NY 10036
Birth Year: 1965 | | Treasurer and Principal Financial Officer | | Treasurer since July 2003 and Principal Financial Officer since September
2002 | | Managing Director of the Adviser and various entities affiliated with the Adviser; Treasurer (since July 2003) and Principal Financial Officer of various Morgan Stanley Funds (since September 2002). | |
Mary E. Mullin
1633 Broadway
New York, NY 10019
Birth Year: 1967 | | Secretary | | Since
June
1999 | | Managing Director of the Adviser; Secretary of various Morgan Stanley Funds (since June 1999). | |
Michael J. Key
522 Fifth Avenue
New York, NY 10036
Birth Year: 1979 | | Vice President | | Since
June
2017 | | Vice President of the Equity and Fixed Income Funds, Liquidity Funds, various money market funds and the Morgan Stanley AIP Funds in the Fund Complex (since June 2017); Managing Director of the Adviser; Head of Product Development for Equity and Fixed Income Funds (since August 2013). | |
The Fund's statement of additional information includes further information about the Fund's Trustees and Officers, and is available without charge by visiting www.morganstanley.com/im or upon request by calling 1 (800) 869-6397.
* This is the earliest date the officer began serving the Morgan Stanley Funds. Each officer serves an indefinite term, until his or her successor is elected.
44
Morgan Stanley Institutional Fund Trust
Annual Report — September 30, 2023
Adviser and Administrator
Morgan Stanley Investment Management Inc.
522 Fifth Avenue
New York, New York 10036
Distributor
Morgan Stanley Distribution, Inc.
522 Fifth Avenue
New York, New York 10036
Dividend Disbursing and Transfer Agent
SS&C Global Investor & Distribution Solutions, Inc.
P.O. Box 219804
Kansas City, Missouri 64121-9804
Co-Transfer Agent
Eaton Vance Management
Two International Place
Boston, Massachusetts 02110
Custodian
State Street Bank and Trust Company
One Congress Street
Boston, Massachusetts 02114
Legal Counsel
Dechert LLP
1095 Avenue of the Americas
New York, New York 10036
Counsel to the Independent Trustees
Perkins Coie LLP
1155 Avenue of the Americas,
22nd Floor
New York, New York 10036
Independent Registered Public Accounting Firm
Ernst & Young LLP
200 Clarendon Street
Boston, Massachusetts 02116
45
Printed in U.S.A.
This Report has been prepared for shareholders and may be distributed to others only if preceded or accompanied by a current prospectus.
Morgan Stanley Investment Management Inc.
522 Fifth Avenue
New York, New York 10036
© 2023 Morgan Stanley. Morgan Stanley Distribution, Inc.

IFTHYANN
6045112 EXP 11.30.24

Morgan Stanley Institutional Fund Trust
Short Duration Income Portfolio
Annual Report
September 30, 2023

Morgan Stanley Institutional Fund Trust
Annual Report — September 30, 2023
Table of Contents (unaudited)
Shareholders' Letter | | | 2 | | |
Expense Example | | | 3 | | |
Investment Overview | | | 4 | | |
Portfolio of Investments | | | 7 | | |
Statement of Assets and Liabilities | | | 14 | | |
Statement of Operations | | | 16 | | |
Statements of Changes in Net Assets | | | 17 | | |
Financial Highlights | | | 19 | | |
Notes to Financial Statements | | | 24 | | |
Report of Independent Registered Public Accounting Firm | | | 31 | | |
Investment Advisory Agreement Approval | | | 32 | | |
Liquidity Risk Management Program | | | 34 | | |
Federal Tax Notice | | | 35 | | |
Important Notices | | | 36 | | |
U.S. Customer Privacy Notice | | | 37 | | |
Trustees and Officers Information | | | 40 | | |
This report is authorized for distribution only when preceded or accompanied by a prospectus or summary prospectus of the applicable Fund of the Morgan Stanley Institutional Fund Trust. To receive a prospectus and/or statement of additional information ("SAI"), which contains more complete information such as investment objectives, charges, expenses, policies for voting proxies, risk considerations and describes in detail each of the Fund's investment policies to the prospective investor, please call toll free 1 (800) 869-6397. Please read the prospectuses carefully before you invest or send money.
Additionally, you can access information about the Fund, including performance, characteristics and investment team commentary through Morgan Stanley Investment Management's website: www.morganstanley.com/im.
Market forecasts provided in this report may not necessarily come to pass. There is no guarantee that any sectors mentioned will continue to perform as discussed herein or that securities in such sectors will be held by the Fund in the future. There is no assurance that a fund will achieve its investment objective. Funds are subject to market risk, which is the possibility that market values of securities owned by the Fund will decline and, therefore, the value of the Fund's shares may be less than what you paid for them. Accordingly, you can lose money investing in this Fund. Please see the prospectus for more complete information on investment risks.
1
Morgan Stanley Institutional Fund Trust
Annual Report — September 30, 2023
Shareholders' Letter (unaudited)
Dear Shareholders,
We are pleased to provide this Annual Report, in which you will learn how your investment in Short Duration Income Portfolio (the "Fund") performed during the latest twelve-month period.
Morgan Stanley Investment Management is a client-centric, investor-led organization. Our global presence, intellectual capital, and breadth of products and services enable us to partner with investors to meet the evolving challenges of today's financial markets. We aim to deliver superior investment service and to empower our clients to make the informed decisions that help them reach their investment goals.
As always, we thank you for selecting Morgan Stanley Investment Management, and look forward to working with you in the months and years ahead.
Sincerely,

John H. Gernon
President and Principal Executive Officer
October 2023
2
Morgan Stanley Institutional Fund Trust
Annual Report — September 30, 2023
Expense Example (unaudited)
Short Duration Income Portfolio
As a shareholder of the Fund, you may incur two types of costs: (1) transactional costs, including sales charge (loads) on purchase payments; and (2) ongoing costs, which may include advisory fees, administration fees, distribution and shareholder services fees; and other Fund expenses. This example is intended to help you understand your ongoing costs (in dollars) of investing in the Fund and to compare these costs with the ongoing costs of investing in other mutual funds.
This example is based on an investment of $1,000 invested at the beginning of the six-month period ended September 30, 2023 and held for the entire six-month period.
Actual Expenses
The table below provides information about actual account values and actual expenses. You may use the information in this table, together with the amount you invested, to estimate the expenses that you paid over the period. Simply divide your account value by $1,000 (for example, an $8,600 account value divided by $1,000 = 8.6), then multiply the result by the number in the table under the heading entitled "Actual Expenses Paid During Period" to estimate the expenses you paid on your account during this period.
Hypothetical Example for Comparison Purposes
The table below provides information about hypothetical account values and hypothetical expenses based on the Fund's actual expense ratio and an assumed rate of return of 5% per year before expenses, which is not the Fund's actual return. The hypothetical account values and expenses may not be used to estimate the actual ending account balance or expenses you paid for the period. You may use this information to compare the ongoing costs of investing in the Fund and other funds. To do so, compare this 5% hypothetical example with the 5% hypothetical examples that appear in the shareholder reports of the other funds.
Please note that the expenses shown in the table are meant to highlight your ongoing costs only and do not reflect any transactional costs, such as sales charges (loads, if applicable). Therefore, the information for each class in the table is useful in comparing ongoing costs only, and will not help you determine the relative total costs of owning different funds. In addition, if these transactional costs were included, your costs would have been higher.
| | | Beginning
Account
Value
4/1/23 | | Actual Ending
Account
Value
9/30/23 | | Hypothetical
Ending Account
Value | | Actual
Expenses
Paid
During
Period* | | Hypothetical
Expenses Paid
During Period* | | Net
Expense
Ratio
During
Period** | |
Short Duration Income Portfolio Class I | | $ | 1,000.00 | | | $ | 1,013.50 | | | $ | 1,023.56 | | | $ | 1.51 | | | $ | 1.52 | | | | 0.30 | % | |
Short Duration Income Portfolio Class A | | | 1,000.00 | | | | 1,010.90 | | | | 1,022.31 | | | | 2.77 | | | | 2.79 | | | | 0.55 | | |
Short Duration Income Portfolio Class L | | | 1,000.00 | | | | 1,009.60 | | | | 1,021.06 | | | | 4.03 | | | | 4.05 | | | | 0.80 | | |
Short Duration Income Portfolio Class C | | | 1,000.00 | | | | 1,007.00 | | | | 1,018.55 | | | | 6.54 | | | | 6.58 | | | | 1.30 | | |
Short Duration Income Portfolio Class R6 | | | 1,000.00 | | | | 1,012.40 | | | | 1,023.82 | | | | 1.26 | | | | 1.27 | | | | 0.25 | | |
* Expenses are calculated using each Fund Class' annualized net expense ratio (as disclosed), multiplied by the average account value over the period and multiplied by 183/365 (to reflect the most recent one-half year period).
** Annualized.
3
Morgan Stanley Institutional Fund Trust
Annual Report — September 30, 2023
Investment Overview (unaudited)
Short Duration Income Portfolio
The Fund seeks above-average total return over a market cycle of three to five years.
Performance
For the fiscal year ended September 30, 2023, the Fund's Class I shares had a total return based on net asset value and reinvestment of distributions per share of 4.19%, net of fees. The Fund's Class I shares outperformed against the Fund's benchmark, the Bloomberg 1-3 Year U.S. Government/Credit Index(i) (the "Index"), which returned 2.77%.
Factors Affecting Performance
• Over the fiscal year, government bond yields rose in the U.S. and throughout the world as central banks maintained hawkish positions in their fight against inflation. "Higher for longer" rhetoric was accompanied by recession fears, creating heightened levels of uncertainty in the markets. Against this backdrop, the Fund's mildly short to neutral duration position (i.e., less sensitivity to interest rate movements) versus the Index helped relative performance.
• The portfolio's overweight to investment grade corporate bonds contributed to relative performance as the market perceived a decline in credit risk for these types of bonds.
• The portfolio's exposure to securitized credit contributed to relative performance, particularly the allocation to asset-backed securities (ABS).
• There were no material detractors from relative performance in the period.
Management Strategies
• We believe a reasonable explanation for the market volatility seen in the past few months of the reporting period goes as follows: U.S. economic growth has been accelerating in 2023, which surprised analysts; the U.S. budget situation looks bad, sending more and more U.S. Treasuries into the market at the same time that the Federal Reserve (Fed) is shrinking its balance sheet; and the
Fed has been adamant that the inflation game has not been won, so markets should expect the Fed to keep rates unchanged (at the September 2023 Federal Open Market Committee meeting, the Fed eliminated several rate cuts from its 2024 forecasts). In other words, rates would be kept higher for longer; market positioning seems to be skewed toward long interest-rate risk, making bonds vulnerable to disappointing news; and lastly, the coup de grace is that the U.S. yield curve has been highly inverted (meaning that yields on shorter-maturity U.S. Treasury bonds have been higher than yields on longer-maturity U.S. Treasury bonds), making longer-maturity bonds less attractive than shorter-maturity bonds. Add it all up, and you have a good cumulative narrative as to why longer-term yields rose in this period. Importantly, we believe that while the velocity of the Treasury market sell-off looks extreme, the end point — a U.S. Treasury 10-year yield ending September 2023 at 4.57%(ii) — does not.
• One potential casualty of higher yields, wider credit spreads and softer equity prices is the economy, particularly in the U.S. Until September 2023, the probability of a "soft landing" grew as falling inflation, stable unemployment and reasonable growth looked increasingly feasible. However, we believe that the rise in yields on the back of increased confidence the Fed would not lower rates as much and as soon as expected — resulting in a meaningful rise in real interest rates — increases the chances of a harder landing and possibly a recession. While we believe it is far too early to assign this as the most likely scenario given what we currently know about economic activity, credit and equity markets have had to price in this higher probability, resulting in poor performance toward the end of the reporting period. We are also concerned about the ability of higher-risk assets to outperform in an era of inverted yield curves and high cash rates. We believe that the solid fundamentals we have witnessed in the year-to-date through September 2023 (low default rates, more credit
(i) "Bloomberg®" and the Bloomberg Index/Indices used are service marks of Bloomberg Finance L.P. and its affiliates, and have been licensed for use for certain purposes by Morgan Stanley Investment Management (MSIM). Bloomberg is not affiliated with MSIM, does not approve, endorse, review, or recommend any product, and does not guarantee the timeliness, accurateness, or completeness of any data or information relating to any product.
(ii) Source: Bloomberg L.P. Data as of September 30, 2023.
4
Morgan Stanley Institutional Fund Trust
Annual Report — September 30, 2023
Investment Overview (unaudited) (cont'd)
Short Duration Income Portfolio
rating upgrades than downgrades, etc.) could easily begin to deteriorate over the months ahead. As of period end, we therefore remained cautious about maintaining anything above a modestly long position in lower-quality fixed income. We believe that selectivity will remain of paramount importance. We also believe that avoiding defaults and blow-ups will eventually be key as higher rates and refinancing risks feed into corporate performance and outlooks. The high yields on offer will help blunt underperformance if fundamentals do deteriorate, in our view.
• Within securitized assets, at period end, we continued to favor shorter-maturity securitized credit — residential mortgage-backed securities (RMBS), ABS and selected commercial mortgage-backed securities (CMBS) — as offering the best opportunities in fixed income. That said, our outlook had modestly deteriorated as household balance sheets come under more pressure and excess savings run down. At period end, we were trying to take advantage of higher yields on higher quality issuers to achieve our target returns, rather than venturing down the risk/rating spectrum. Our favorite category of securitized credit remained non-agency residential mortgages, despite challenging home affordability. Somewhat surprisingly, we believe that U.S. housing looks like it may have bottomed out, with prices rising once again.
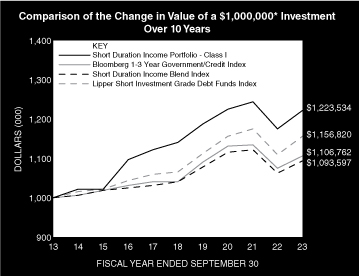
* Minimum Investment
In accordance with SEC regulations, the Fund's performance shown assumes that all recurring fees (including management fees) were deducted and all dividends and distributions were reinvested. The performance of Class A, Class L, Class C and Class R6 shares will vary from the performance of Class I shares based upon their different inception dates and will be negatively impacted by additional fees assessed to those classes (where applicable).
5
Morgan Stanley Institutional Fund Trust
Annual Report — September 30, 2023
Investment Overview (unaudited) (cont'd)
Short Duration Income Portfolio
Performance Compared to the Bloomberg 1-3 Year U.S. Government/Credit Index(1), the Short Duration Income Blend Index(2) and the Lipper Short Investment Grade Debt Funds Index(3)
| | | Period Ended September 30, 2023
Total Returns(4) | |
| | | | | Average Annual | |
| | | One
Year | | Five
Years | | Ten
Years | | Since
Inception(10) | |
Fund — Class I Shares
w/o sales charges(5) | | | 4.19 | % | | | 1.38 | % | | | 2.04 | % | | | 2.81 | % | |
Fund — Class A Shares
w/o sales charges(6) | | | 3.92 | | | | 1.13 | | | | 1.77 | | | | 0.46 | | |
Fund — Class A Shares with
maximum 2.25% sales charges(6) | | | 1.57 | | | | 0.67 | | | | 1.53 | | | | 0.31 | | |
Fund — Class L Shares
w/o sales charges(7) | | | 3.68 | | | | 0.88 | | | | 1.47 | | | | 1.43 | | |
Fund — Class C Shares
w/o sales charges(8) | | | 3.02 | | | | 0.36 | | | | — | | | | 1.10 | | |
Fund — Class C Shares with
maximum 1.00% deferred
sales charges(8) | | | 2.02 | | | | 0.36 | | | | — | | | | 1.10 | | |
Fund — Class R6 Shares
w/o sales charges(9) | | | 4.24 | | | | 1.43 | | | | — | | | | 2.43 | | |
Bloomberg 1-3 Year U.S.
Government/Credit Index | | | 2.77 | | | | 1.21 | | | | 1.02 | | | | 3.47 | | |
Short Duration Income Blend Index | | | 2.77 | | | | 0.97 | | | | 0.90 | | | | 3.43 | | |
Lipper Short Investment
Grade Debt Funds Index | | | 4.15 | | | | 1.64 | | | | 1.47 | | | | 3.40 | | |
Performance data quoted represents past performance, which is no guarantee of future results, and current performance may be lower or higher than the figures shown. Performance assumes that all dividends and distributions, if any, were reinvested. For the most recent month-end performance figures, please visit www.morganstanley.com/im. Investment returns and principal value will fluctuate so that Fund shares, when redeemed, may be worth more or less than their original cost. Total returns do not reflect the deduction of taxes that a shareholder would pay on Fund distributions or the redemption of Fund shares. Performance of share classes will vary due to differences in sales charges and expenses. The Fund returns are calculated based on the net asset value as of the last business day of the period.
(1) The Bloomberg 1-3 Year U.S. Government/Credit Index tracks the securities in the 1-3 year maturity range of the Bloomberg U.S. Government/Credit Index which tracks investment-grade (BBB-/Baa3) or higher publicly traded fixed rate U.S. government, U.S. agency, and corporate issues. The Index is unmanaged and its returns do not include any sales charges or fees. Such costs would lower performance. It is not possible to invest directly in an index.
(2) The Short Duration Income Blend Index is a performance linked benchmark of the old benchmarks represented by Bloomberg 1-3 Year U.S. Government/Credit Index for periods from the Fund's inception to January 8, 2016, the ICE BofA 1-Year U.S. Treasury Note Index (benchmark that tracks one-year U.S. government securities) from January 9, 2016 to July 31, 2019 and the new benchmark represented by Bloomberg 1-3 Year U.S. Government/Credit index for periods thereafter. The Index is unmanaged and its returns do not include any sales charges or fees. Such costs would lower performance. It is not possible to invest directly in an index.
(3) The Lipper Short Investment Grade Debt Funds Index is an equally weighted performance index of the largest qualifying funds (based on net assets) in the Lipper Short Investment Grade Debt Funds classification. The Index, which is adjusted for capital gains distributions and income dividends, is unmanaged and should not be considered an investment. There are currently 30 funds represented in this Index. As of the date of this report, the Fund was in the Lipper Short Investment Grade Debt Funds classification.
(4) Total returns for the Fund reflect expenses waived and/or reimbursed, if applicable, by the Adviser. Without such waivers and/or reimbursements, total returns would have been lower.
(5) Commenced operations on March 31, 1992.
(6) Commenced offering on September 28, 2007.
(7) Commenced offering on April 27, 2012.
(8) Commenced offering on April 30, 2015. Class C shares will generally convert to Class A shares approximately eight years after the end of the calendar month in which the shares were purchased. Performance for periods greater than eight years reflects this conversion (beginning April 2023).
(9) Commenced offering on January 11, 2016.
(10) For comparative purposes, average annual since inception returns listed for the Indexes refer to the inception date of Class I of the Fund, not the inception of the Indexes.
6
Morgan Stanley Institutional Fund Trust
Annual Report — September 30, 2023
Portfolio of Investments
Short Duration Income Portfolio
| | | Face
Amount
(000) | | Value
(000) | |
Fixed Income Securities (96.4%) | |
Agency Adjustable Rate Mortgages (0.1%) | |
Federal Home Loan Mortgage Corporation, | |
Conventional Pools: | |
1 Year CMT + 2.18%, 4.89%, 6/1/38 (a) | | $ | 48 | | | $ | 49 | | |
1 Year CMT + 2.31%, 5.25%, 3/1/37 (a) | | | 136 | | | | 138 | | |
1 Year CMT + 2.33%, 4.87%, 1/1/36 (a) | | | 116 | | | | 117 | | |
1 Year CMT + 2.34%, 5.00%, 7/1/38 (a) | | | 115 | | | | 116 | | |
| | | | 420 | | |
Agency Fixed Rate Mortgages (0.1%) | |
Federal Home Loan Mortgage Corporation, | |
Gold Pools: | |
4.50%, 12/1/24 | | | 17 | | | | 17 | | |
7.50%, 5/1/35 | | | 9 | | | | 9 | | |
8.00%, 8/1/32 | | | 4 | | | | 5 | | |
8.50%, 8/1/31 | | | 6 | | | | 6 | | |
Federal National Mortgage Association, | |
Conventional Pools: | |
4.50%, 6/1/24 - 7/1/24 | | | 24 | | | | 24 | | |
5.00%, 12/1/24 | | | 16 | | | | 16 | | |
6.00%, 9/1/37 | | | 24 | | | | 24 | | |
6.50%, 2/1/28 - 10/1/32 | | | 78 | | | | 79 | | |
7.00%, 7/1/29 - 3/1/37 | | | 89 | | | | 91 | | |
7.50%, 8/1/37 | | | 11 | | | | 12 | | |
8.00%, 4/1/33 | | | 19 | | | | 20 | | |
8.50%, 10/1/32 | | | 10 | | | | 11 | | |
Government National Mortgage Association, | |
Various Pools: | |
6.00%, 11/15/38 | | | 44 | | | | 45 | | |
8.50%, 7/15/30 | | | 2 | | | | 2 | | |
| | | | 361 | | |
Asset-Backed Securities (15.8%) | |
Affirm Asset Securitization Trust, | |
4.55%, 6/15/27 (b) | | | 469 | | | | 463 | | |
AMSR Trust, | |
2.11%, 9/17/37 (b) | | | 975 | | | | 891 | | |
Amur Equipment Finance Receivables XII LLC, | |
Series 2023-1A Class A2 | |
6.09%, 12/20/29 (b) | | | 570 | | | | 571 | | |
Aqua Finance Trust, | |
1.54%, 7/17/46 (b) | | | 465 | | | | 409 | | |
Arbor Realty Commercial Real Estate Notes
2021-FL3 Ltd., | |
1 Month Term SOFR + 1.18%, | |
6.52%, 8/15/34 (a)(b) | | | 1,200 | | | | 1,184 | | |
BHG Securitization Trust, | |
Series 2023-A Class A | |
5.55%, 4/17/36 (b) | | | 1,382 | | | | 1,363 | | |
Blackbird Capital Aircraft, | |
2.44%, 7/15/46 (b) | | | 650 | | | | 556 | | |
Carlyle U.S. CLO Ltd., | |
3 Month Term SOFR + 1.31%, | |
6.64%, 7/20/31 (a)(b) | | | 2,225 | | | | 2,223 | | |
| | | Face
Amount
(000) | | Value
(000) | |
Cartiga Asset Finance Trust LLC, | |
Series 2023-1 Class A | |
7.00%, 3/15/35 (b) | | $ | 843 | | | $ | 837 | | |
Cascade MH Asset Trust, | |
4.25%, 8/25/54 (b) | | | 1,512 | | | | 1,330 | | |
Cologix Data Centers US Issuer LLC, | |
3.30%, 12/26/51 (b) | | | 1,225 | | | | 1,081 | | |
Commonbond Student Loan Trust, | |
1.20%, 3/25/52 (b) | | | 930 | | | | 750 | | |
Dryden 58 CLO Ltd., | |
3 Month Term SOFR + 1.26%, | |
6.57%, 7/17/31 (a)(b) | | | 750 | | | | 749 | | |
ECMC Group Student Loan Trust, | |
Class A1B | |
SOFR30A + 1.11%, | |
6.43%, 1/27/70 (a)(b) | | | 577 | | | | 569 | | |
ELFI Graduate Loan Program 2021-A LLC, | |
1.53%, 12/26/46 (b) | | | 1,327 | | | | 1,123 | | |
Falcon Aerospace Ltd., | |
3.60%, 9/15/39 (b) | | | 214 | | | | 194 | | |
FCI Funding LLC, | |
1.13%, 4/15/33 (b) | | | 110 | | | | 107 | | |
FHF Trust, | |
1.27%, 3/15/27 (b) | | | 153 | | | | 147 | | |
Finance of America HECM Buyout, | |
4.00%, 8/1/32 (a)(b) | | | 1,462 | | | | 1,419 | | |
GAIA Aviation Ltd., | |
3.97%, 12/15/44 (b) | | | 424 | | | | 383 | | |
GCI Funding I LLC, | |
2.82%, 10/18/45 (b) | | | 915 | | | | 799 | | |
Golub Capital Partners ABS Funding Ltd., | |
2.77%, 4/20/29 (b) | | | 1,725 | | | | 1,608 | | |
Class A2 | |
3.21%, 1/22/29 (b) | | | 942 | | | | 903 | | |
Kubota Credit Owner Trust, | |
0.59%, 10/15/24 (b) | | | 84 | | | | 83 | | |
Loanpal Solar Loan Ltd., | |
2.22%, 3/20/48 (b) | | | 1,248 | | | | 902 | | |
2.29%, 1/20/48 (b) | | | 960 | | | | 723 | | |
Lunar 2021-1 Structured Aircraft Portfolio Notes, | |
2.64%, 10/15/46 (b) | | | 1,550 | | | | 1,331 | | |
MACH 1 Cayman Ltd., | |
3.47%, 10/15/39 (b) | | | 347 | | | | 296 | | |
Madison Park Funding XXIV Ltd., | |
3 Month Term SOFR + 1.42%, | |
6.75%, 10/20/29 (a)(b) | | | 2,168 | | | | 2,164 | | |
MAPS Trust, | |
2.52%, 6/15/46 (b) | | | 524 | | | | 456 | | |
Marlette Funding Trust, | |
Series 2023-1A Class A | |
6.07%, 4/15/33 (b) | | | 1,395 | | | | 1,393 | | |
Mercedes-Benz Auto Receivables Trust, | |
0.55%, 2/18/25 | | | 17 | | | | 17 | | |
The accompanying notes are an integral part of the financial statements.
7
Morgan Stanley Institutional Fund Trust
Annual Report — September 30, 2023
Portfolio of Investments (cont'd)
Short Duration Income Portfolio
| | | Face
Amount
(000) | | Value
(000) | |
Asset-Backed Securities (cont'd) | |
MFA 2021-NPL1 LLC, | |
2.36%, 3/25/60 (b) | | $ | 639 | | | $ | 616 | | |
Monroe Capital ABS Funding 2021-1 Ltd., | |
2.82%, 4/22/31 (b) | | | 1,625 | | | | 1,545 | | |
Mosaic Solar Loan Trust, | |
2.05%, 12/20/46 (b) | | | 857 | | | | 650 | | |
2.10%, 4/20/46 (b) | | | 183 | | | | 154 | | |
Navient Private Education Refi Loan Trust, | |
0.94%, 7/15/69 (b) | | | 892 | | | | 769 | | |
Nelnet Student Loan Trust, | |
1.32%, 4/20/62 (b) | | | 787 | | | | 705 | | |
Newday Funding Master Issuer PLC, | |
SOFR + 0.95%, 6.27%, 7/15/29 (a)(b) | | | 1,175 | | | | 1,166 | | |
SOFR + 1.10%, 6.42%, 3/15/29 (a)(b) | | | 1,760 | | | | 1,756 | | |
Newtek Small Business Loan Trust, | |
Daily U.S. Prime Rate – 0.50%, | |
8.00%, 7/25/50 (a)(b) | | | 708 | | | | 707 | | |
NRZ Excess Spread-Collateralized Notes, | |
Class A | |
2.98%, 3/25/26 (b) | | | 904 | | | | 825 | | |
3.10%, 7/25/26 (b) | | | 675 | | | | 604 | | |
3.23%, 5/25/26 (b) | | | 1,146 | | | | 1,043 | | |
3.47%, 11/25/26 (b) | | | 1,037 | | | | 936 | | |
NRZ FHT Excess LLC, | |
Class A | |
4.21%, 11/25/25 (b) | | | 303 | | | | 281 | | |
Octane Receivables Trust, | |
1.21%, 9/20/28 (b) | | | 187 | | | | 181 | | |
Series 2023-1A Class A | |
5.87%, 5/21/29 (b) | | | 676 | | | | 674 | | |
Option One Mortgage Loan Trust Asset-Backed
Certificates, | |
1 Month Term SOFR + 0.61%, 5.94%,
8/20/30 (a) | | | 26 | | | | 26 | | |
Oscar U.S. Funding XV LLC, | |
Series 2023-1A Class A3 | |
5.81%, 12/10/27 (b) | | | 1,875 | | | | 1,864 | | |
Oxford Finance Funding LLC, | |
3.10%, 2/15/28 (b) | | | 93 | | | | 89 | | |
Palmer Square CLO Ltd., | |
3 Month Term SOFR + 1.36%, 6.67%,
7/16/31 (a)(b) | | | 1,225 | | | | 1,223 | | |
PFS Financing Corp., | |
0.77%, 8/15/26 (b) | | | 1,310 | | | | 1,250 | | |
0.97%, 2/15/26 (b) | | | 960 | | | | 942 | | |
4.27%, 8/15/27 (b) | | | 2,225 | | | | 2,158 | | |
PRET 2021-NPL6 LLC, | |
2.49%, 7/25/51 (b) | | | 592 | | | | 565 | | |
| | | Face
Amount
(000) | | Value
(000) | |
Pretium Mortgage Credit Partners I LLC, | |
2.24%, 9/27/60 (b) | | $ | 445 | | | $ | 423 | | |
ReadyCap Lending Small Business Loan Trust, | |
Daily U.S. Prime Rate – 0.50%, 8.00%,
12/27/44 (a)(b) | | | 82 | | | | 79 | | |
Republic Finance Issuance Trust, | |
2.47%, 11/20/30 (b) | | | 500 | | | | 486 | | |
SMB Private Education Loan Trust, | |
1.34%, 3/17/53 (b) | | | 522 | | | | 458 | | |
1.68%, 2/15/51 (b) | | | 602 | | | | 536 | | |
Southwick Park CLO LLC, | |
3 Month Term SOFR + 1.32%, 6.65%,
7/20/32 (a)(b) | | | 2,000 | | | | 1,993 | | |
SPS Servicer Advance Receivables Trust, | |
1.83%, 11/15/55 (b) | | | 2,100 | | | | 1,894 | | |
Start II Ltd., | |
4.09%, 3/15/44 (b) | | | 586 | | | | 521 | | |
Start Ltd., | |
4.09%, 5/15/43 (b) | | | 1,128 | | | | 987 | | |
Theorem Funding Trust, | |
7.60%, 4/15/29 (b) | | | 282 | | | | 284 | | |
Series 2023-1A Class A | |
7.58%, 4/15/29 (b) | | | 333 | | | | 334 | | |
Towd Point HE Trust, | |
0.92%, 2/25/63 (a)(b) | | | 700 | | | | 657 | | |
VCP RRL ABS I Ltd., | |
Class A | |
2.15%, 10/20/31 (b) | | | 365 | | | | 332 | | |
VOLT XCIX LLC, | |
2.12%, 4/25/51 (b) | | | 1,038 | | | | 970 | | |
VOLT XCVI LLC, | |
2.12%, 3/27/51 (b) | | | 702 | | | | 668 | | |
| | | | 58,375 | | |
Collateralized Mortgage Obligations — Agency Collateral Series (0.2%) | |
Federal Home Loan Mortgage Corporation, | |
REMIC | |
7.50%, 9/15/29 | | | 121 | | | | 122 | | |
Government National Mortgage Association, | |
1 Month Term SOFR + 0.56%, 5.50%,
5/20/62 (a) | | | — | @ | | | — | @ | |
1 Month Term SOFR + 0.71%, 6.03%,
1/20/64 (a) | | | 38 | | | | 38 | | |
REMIC | |
1 Month Term SOFR + 0.61%, 5.93%,
3/20/61 (a) | | | 54 | | | | 54 | | |
1 Month Term SOFR + 0.67%, 5.99%,
9/20/62 (a) | | | 104 | | | | 104 | | |
Seasoned Credit Risk Transfer Trust, | |
3.00%, 2/25/59 | | | 529 | | | | 450 | | |
| | | | 768 | | |
The accompanying notes are an integral part of the financial statements.
8
Morgan Stanley Institutional Fund Trust
Annual Report — September 30, 2023
Portfolio of Investments (cont'd)
Short Duration Income Portfolio
| | | Face
Amount
(000) | | Value
(000) | |
Commercial Mortgage-Backed Securities (5.9%) | |
ALEN Mortgage Trust, | |
1 Month Term SOFR + 1.26%, 6.60%,
4/15/34 (a)(b) | | $ | 1,200 | | | $ | 1,091 | | |
Angel Oak SB Commercial Mortgage Trust, | |
2.07%, 5/25/50 (a)(b) | | | 598 | | | | 532 | | |
BX Commercial Mortgage Trust, | |
Class A | |
1 Month Term SOFR + 0.81%, 6.15%,
4/15/34 (a)(b) | | | 2,100 | | | | 1,990 | | |
BX Trust, | |
1 Month Term SOFR + 1.58%, 6.91%,
1/15/39 (a)(b) | | | 820 | | | | 802 | | |
CSMC 2022-MARK, | |
1 Month Term SOFR + 2.70%, 8.03%,
6/15/39 (a)(b) | | | 1,570 | | | | 1,563 | | |
CSMC Trust, | |
3.53%, 8/15/37 (b) | | | 575 | | | | 508 | | |
1 Month Term SOFR + 3.61%, 8.95%,
12/15/35 (a)(b) | | | 2,125 | | | | 2,124 | | |
CSWF Corp., | |
1 Month Term SOFR + 1.08%, 6.41%,
6/15/34 (a)(b) | | | 1,787 | | | | 1,640 | | |
DROP Mortgage Trust, | |
1 Month Term SOFR + 1.26%, 6.60%,
10/15/43 (a)(b) | | | 1,700 | | | | 1,592 | | |
HPLY Trust, | |
1 Month Term SOFR + 2.46%, 7.79%,
11/15/36 (a)(b) | | | 383 | | | | 370 | | |
J.P. Morgan Chase Commercial Mortgage
Securities Trust, | |
4.13%, 7/5/31 (b) | | | 1,100 | | | | 996 | | |
Class A | |
1 Month Term SOFR + 1.23%, 6.56%,
11/15/38 (a)(b) | | | 2,450 | | | | 2,413 | | |
Natixis Commercial Mortgage Securities Trust, | |
1 Month Term SOFR + 1.06%, 6.40%,
8/15/38 (a)(b) | | | 2,080 | | | | 1,955 | | |
1 Month Term SOFR + 2.28%, 7.61%,
7/15/36 (a)(b) | | | 850 | | | | 749 | | |
Silver Hill Trust, | |
3.10%, 11/25/49 (a)(b) | | | 319 | | | | 311 | | |
TPGI Trust, | |
Class A | |
1 Month Term SOFR + 0.81%, 6.15%,
6/15/26 (a)(b) | | | 986 | | | | 971 | | |
TTAN 2021-MHC, | |
Class A | |
1 Month Term SOFR + 0.96%, 6.30%,
3/15/38 (a)(b) | | | 730 | | | | 722 | | |
VMC Finance 2021-HT1 LLC, | |
1 Month Term SOFR + 1.76%, 7.10%,
1/18/37 (a)(b) | | | 1,380 | | | | 1,350 | | |
| | | | 21,679 | | |
| | | Face
Amount
(000) | | Value
(000) | |
Corporate Bonds (62.0%) | |
Finance (32.2%) | |
AerCap Ireland Capital DAC/AerCap Global
Aviation Trust, | |
1.65%, 10/29/24 | | $ | 2,000 | | | $ | 1,903 | | |
2.45%, 10/29/26 | | | 850 | | | | 762 | | |
Air Lease Corp., | |
0.80%, 8/18/24 | | | 2,895 | | | | 2,761 | | |
Assurant, Inc., | |
6.10%, 2/27/26 | | | 925 | | | | 921 | | |
Athene Global Funding, | |
2.75%, 6/25/24 (b) | | | 2,280 | | | | 2,220 | | |
Australia & New Zealand Banking Group Ltd., | |
4.40%, 5/19/26 (b) | | | 2,500 | | | | 2,385 | | |
Banco Santander Chile, | |
2.70%, 1/10/25 (b) | | | 800 | | | | 768 | | |
Bank of America Corp., | |
3.38%, 4/2/26 | | | 2,310 | | | | 2,211 | | |
5.08%, 1/20/27 | | | 2,000 | | | | 1,955 | | |
Bank of Nova Scotia, | |
1.05%, 3/2/26 | | | 5,050 | | | | 4,510 | | |
Banque Federative du Credit Mutuel SA, | |
2.38%, 11/21/24 (b) | | | 3,480 | | | | 3,339 | | |
4.52%, 7/13/25 (b) | | | 3,210 | | | | 3,123 | | |
Barclays PLC, | |
5.30%, 8/9/26 | | | 2,000 | | | | 1,960 | | |
BNP Paribas SA, | |
2.22%, 6/9/26 (b) | | | 3,150 | | | | 2,940 | | |
| BPCE SA, | |
2.38%, 1/14/25 (b) | | | 2,635 | | | | 2,498 | | |
Canadian Imperial Bank of Commerce, | |
3.30%, 4/7/25 | | | 2,270 | | | | 2,183 | | |
Charles Schwab Corp., | |
5.88%, 8/24/26 | | | 1,675 | | | | 1,670 | | |
Citigroup, Inc., | |
3.11%, 4/8/26 | | | 2,000 | | | | 1,909 | | |
3.35%, 4/24/25 | | | 3,770 | | | | 3,704 | | |
Corebridge Financial, Inc., | |
3.50%, 4/4/25 | | | 2,280 | | | | 2,188 | | |
Deutsche Bank AG, | |
Series E | |
0.96%, 11/8/23 | | | 3,950 | | | | 3,927 | | |
Elevance Health, Inc., | |
1.50%, 3/15/26 | | | 2,830 | | | | 2,564 | | |
Equitable Financial Life Global Funding, | |
1.40%, 7/7/25 (b) | | | 3,300 | | | | 3,033 | | |
F&G Annuities & Life, Inc., | |
7.40%, 1/13/28 | | | 1,650 | | | | 1,648 | | |
GA Global Funding Trust, | |
1.63%, 1/15/26 (b) | | | 4,070 | | | | 3,636 | | |
The accompanying notes are an integral part of the financial statements.
9
Morgan Stanley Institutional Fund Trust
Annual Report — September 30, 2023
Portfolio of Investments (cont'd)
Short Duration Income Portfolio
| | | Face
Amount
(000) | | Value
(000) | |
Finance (cont'd) | |
Goldman Sachs Group, Inc., | |
3.50%, 1/23/25 | | $ | 1,750 | | | $ | 1,693 | | |
Guardian Life Global Funding, | |
0.88%, 12/10/25 (b) | | | 2,450 | | | | 2,201 | | |
HSBC Holdings PLC, | |
3.80%, 3/11/25 | | | 3,350 | | | | 3,309 | | |
2.63%, 11/7/25 | | | 1,850 | | | | 1,773 | | |
JPMorgan Chase & Co., | |
2.01%, 3/13/26 | | | 2,000 | | | | 1,884 | | |
2.08%, 4/22/26 | | | 4,500 | | | | 4,225 | | |
5.55%, 12/15/25 | | | 2,120 | | | | 2,106 | | |
LeasePlan Corp. NV, | |
2.88%, 10/24/24 (b) | | | 1,275 | | | | 1,227 | | |
Macquarie Group Ltd., | |
1.34%, 1/12/27 (b) | | | 3,060 | | | | 2,739 | | |
Nordea Bank Abp, | |
1.50%, 9/30/26 (b) | | | 5,075 | | | | 4,459 | | |
Royal Bank of Canada, | |
1.20%, 4/27/26 | | | 4,370 | | | | 3,899 | | |
Safina Ltd., | |
2.00%, 12/30/23 | | | 23 | | | | 23 | | |
Santander UK Group Holdings PLC, | |
4.80%, 11/15/24 | | | 5,510 | | | | 5,500 | | |
SMBC Aviation Capital Finance DAC, | |
5.45%, 5/3/28 (b) | | | 1,775 | | | | 1,717 | | |
Societe Generale SA, | |
2.63%, 1/22/25 (b) | | | 1,175 | | | | 1,117 | | |
Standard Chartered PLC, | |
0.99%, 1/12/25 (b) | | | 4,795 | | | | 4,717 | | |
Sumitomo Mitsui Financial Group, Inc., | |
2.35%, 1/15/25 | | | 6,480 | | | | 6,188 | | |
Suncorp-Metway Ltd., | |
3.30%, 4/15/24 (b) | | | 1,980 | | | | 1,948 | | |
Swedbank AB, | |
6.14%, 9/12/26 (b) | | | 1,330 | | | | 1,325 | | |
Synchrony Bank, | |
5.40%, 8/22/25 | | | 1,480 | | | | 1,427 | | |
Truist Financial Corp., | |
6.05%, 6/8/27 | | | 985 | | | | 975 | | |
Wells Fargo & Co., | |
3.91%, 4/25/26 | | | 1,975 | | | | 1,904 | | |
Woori Bank, | |
4.88%, 1/26/28 (b) | | | 2,165 | | | | 2,114 | | |
| | | | 119,188 | | |
Industrials (26.2%) | |
Altria Group, Inc., | |
2.35%, 5/6/25 | | | 1,500 | | | | 1,419 | | |
American Tower Corp., | |
1.60%, 4/15/26 | | | 450 | | | | 404 | | |
AT&T, Inc., | |
1.65%, 2/1/28 | | | 2,210 | | | | 1,866 | | |
| | | Face
Amount
(000) | | Value
(000) | |
Bayer US Finance LLC, | |
3.38%, 10/8/24 (b) | | $ | 1,740 | | | $ | 1,694 | | |
Boeing Co., | |
5.04%, 5/1/27 | | | 1,475 | | | | 1,441 | | |
CDW LLC/CDW Finance Corp., | |
2.67%, 12/1/26 | | | 250 | | | | 226 | | |
Celanese U.S. Holdings LLC, | |
6.17%, 7/15/27 | | | 1,110 | | | | 1,095 | | |
Charter Communications Operating LLC/Charter
Communications Operating Capital, | |
4.91%, 7/23/25 | | | 850 | | | | 831 | | |
Cigna Group, | |
4.50%, 2/25/26 | | | 3,025 | | | | 2,942 | | |
Columbia Pipelines Holding Co. LLC, | |
6.04%, 8/15/28 (b) | | | 800 | | | | 796 | | |
6.06%, 8/15/26 (b) | | | 195 | | | | 196 | | |
Concentrix Corp., | |
6.65%, 8/2/26 | | | 1,200 | | | | 1,193 | | |
Continental Resources, Inc., | |
2.27%, 11/15/26 (b) | | | 1,000 | | | | 887 | | |
Daimler Truck Finance North America LLC, | |
2.00%, 12/14/26 (b) | | | 2,025 | | | | 1,810 | | |
DuPont de Nemours, Inc., | |
4.49%, 11/15/25 | | | 875 | | | | 855 | | |
Eastern Energy Gas Holdings LLC, | |
3.55%, 11/1/23 | | | 2,050 | | | | 2,048 | | |
Energy Transfer LP, | |
2.90%, 5/15/25 | | | 4,130 | | | | 3,925 | | |
4.75%, 1/15/26 | | | 325 | | | | 316 | | |
Enterprise Products Operating LLC, | |
3.90%, 2/15/24 | | | 1,200 | | | | 1,191 | | |
Fox Corp., | |
4.03%, 1/25/24 | | | 1,200 | | | | 1,192 | | |
General Motors Financial Co., Inc., | |
1.50%, 6/10/26 | | | 2,890 | | | | 2,555 | | |
3.95%, 4/13/24 | | | 1,250 | | | | 1,234 | | |
Genuine Parts Co., | |
1.75%, 2/1/25 | | | 740 | | | | 698 | | |
Georgia-Pacific LLC, | |
1.75%, 9/30/25 (b) | | | 4,080 | | | | 3,773 | | |
Global Payments, Inc., | |
4.95%, 8/15/27 | | | 1,250 | | | | 1,202 | | |
Haleon U.S. Capital LLC, | |
3.02%, 3/24/24 | | | 750 | | | | 739 | | |
HCA, Inc., | |
5.00%, 3/15/24 | | | 1,600 | | | | 1,592 | | |
Hyatt Hotels Corp., | |
5.75%, 1/30/27 | | | 1,275 | | | | 1,267 | | |
Hyundai Capital America, | |
1.30%, 1/8/26 (b) | | | 2,780 | | | | 2,504 | | |
5.50%, 3/30/26 (b) | | | 675 | | | | 666 | | |
Hyundai Capital Services, Inc., | |
2.13%, 4/24/25 (b) | | | 1,000 | | | | 942 | | |
The accompanying notes are an integral part of the financial statements.
10
Morgan Stanley Institutional Fund Trust
Annual Report — September 30, 2023
Portfolio of Investments (cont'd)
Short Duration Income Portfolio
| | | Face
Amount
(000) | | Value
(000) | |
Industrials (cont'd) | |
Imperial Brands Finance PLC, | |
3.13%, 7/26/24 (b) | | $ | 2,015 | | | $ | 1,964 | | |
JDE Peet's NV, | |
0.80%, 9/24/24 (b) | | | 3,025 | | | | 2,872 | | |
Kinder Morgan, Inc., | |
1.75%, 11/15/26 | | | 2,640 | | | | 2,349 | | |
Marriott International, Inc., | |
5.45%, 9/15/26 | | | 710 | | | | 704 | | |
Mitsubishi Corp., | |
1.13%, 7/15/26 (b) | | | 2,610 | | | | 2,315 | | |
Mondelez International Holdings Netherlands BV, | |
1.25%, 9/24/26 (b) | | | 2,910 | | | | 2,571 | | |
2.25%, 9/19/24 (b) | | | 550 | | | | 531 | | |
National Fuel Gas Co., | |
5.50%, 10/1/26 | | | 1,565 | | | | 1,544 | | |
NBN Co. Ltd., | |
1.45%, 5/5/26 (b) | | | 2,770 | | | | 2,490 | | |
NTT Finance Corp., | |
1.16%, 4/3/26 (b) | | | 6,790 | | | | 6,096 | | |
Nucor Corp., | |
2.00%, 6/1/25 | | | 975 | | | | 916 | | |
NXP BV/NXP Funding LLC/NXP USA, Inc., | |
2.70%, 5/1/25 | | | 1,540 | | | | 1,463 | | |
ONEOK, Inc., | |
5.55%, 11/1/26 | | | 630 | | | | 626 | | |
Penske Truck Leasing Co. LP/PTL Finance
Corp., | |
5.75%, 5/24/26 (b) | | | 1,825 | | | | 1,799 | | |
Pfizer Investment Enterprises Pte. Ltd., | |
4.45%, 5/19/26 | | | 1,705 | | | | 1,666 | | |
Pioneer Natural Resources Co., | |
1.13%, 1/15/26 | | | 4,490 | | | | 4,060 | | |
Revvity, Inc., | |
0.85%, 9/15/24 | | | 3,440 | | | | 3,270 | | |
Royalty Pharma PLC, | |
1.20%, 9/2/25 | | | 1,475 | | | | 1,341 | | |
Silgan Holdings, Inc., | |
1.40%, 4/1/26 (b) | | | 1,875 | | | | 1,665 | | |
Sonoco Products Co., | |
1.80%, 2/1/25 | | | 1,460 | | | | 1,378 | | |
TD SYNNEX Corp., | |
1.25%, 8/9/24 | | | 5,815 | | | | 5,557 | | |
VICI Properties LP, | |
4.38%, 5/15/25 | | | 1,880 | | | | 1,819 | | |
Vontier Corp., | |
1.80%, 4/1/26 | | | 2,375 | | | | 2,133 | | |
Zimmer Biomet Holdings, Inc., | |
1.45%, 11/22/24 | | | 2,400 | | | | 2,280 | | |
| | | | 96,908 | | |
| | | Face
Amount
(000) | | Value
(000) | |
Utilities (3.6%) | |
Ameren Corp., | |
2.50%, 9/15/24 | | $ | 2,510 | | | $ | 2,428 | | |
American Electric Power Co., Inc., | |
Series N | |
1.00%, 11/1/25 | | | 1,500 | | | | 1,360 | | |
Dominion Energy, Inc., | |
Series A | |
1.45%, 4/15/26 | | | 2,355 | | | | 2,120 | | |
Eversource Energy, | |
4.75%, 5/15/26 | | | 1,410 | | | | 1,379 | | |
ITC Holdings Corp., | |
4.95%, 9/22/27 (b) | | | 1,970 | | | | 1,921 | | |
NextEra Energy Capital Holdings, Inc., | |
1.88%, 1/15/27 | | | 2,825 | | | | 2,503 | | |
6.05%, 3/1/25 | | | 360 | | | | 361 | | |
Southern Co., | |
4.48%, 8/1/24 (c) | | | 1,175 | | | | 1,158 | | |
| | | | 13,230 | | |
| | | | 229,326 | | |
Mortgages — Other (11.5%) | |
Ajax Mortgage Loan Trust, | |
1.07%, 9/25/65 (a)(b) | | | 668 | | | | 565 | | |
1.70%, 5/25/59 (b) | | | 485 | | | | 434 | | |
BRAVO Residential Funding Trust, | |
2.00%, 5/25/59 (a)(b) | | | 620 | | | | 549 | | |
Brean Asset Backed Securities Trust, | |
1.40%, 10/25/63 (a)(b) | | | 1,729 | | | | 1,449 | | |
1.75%, 10/25/61 (a)(b) | | | 1,811 | | | | 1,561 | | |
Brean Asset-Backed Securities Trust, | |
Series 2023-RM6 Class A1 | |
5.25%, 1/25/63 (b) | | | 1,849 | | | | 1,707 | | |
Bunker Hill Loan Depositary Trust, | |
1.72%, 2/25/55 (a)(b) | | | 176 | | | | 166 | | |
BX Commercial Mortgage Trust, | |
Class A | |
1 Month Term SOFR + 2.28%, | |
7.61%, 6/15/40 (a)(b) | | | 1,450 | | | | 1,451 | | |
Cascade Funding Mortgage Trust, | |
0.90%, 6/25/36 (a)(b) | | | 984 | | | | 956 | | |
2.80%, 6/25/69 (a)(b) | | | 169 | | | | 164 | | |
4.00%, 10/25/68 (a)(b) | | | 205 | | | | 202 | | |
| CFMT LLC, | |
1.37%, 2/25/31 (a)(b) | | | 1,600 | | | | 1,522 | | |
1.94%, 9/25/50 (a)(b) | | | 914 | | | | 857 | | |
Series 2023-HB12 Class M1 | |
4.25%, 4/25/33 (a)(b) | | | 2,025 | | | | 1,805 | | |
CHL Mortgage Pass-Through Trust, | |
5.50%, 5/25/34 | | | 36 | | | | 34 | | |
The accompanying notes are an integral part of the financial statements.
11
Morgan Stanley Institutional Fund Trust
Annual Report — September 30, 2023
Portfolio of Investments (cont'd)
Short Duration Income Portfolio
| | | Face
Amount
(000) | | Value
(000) | |
Mortgages — Other (cont'd) | |
CIM Trust, | |
2.57%, 7/25/59 (b) | | $ | 788 | | | $ | 761 | | |
CSMC Trust, | |
0.94%, 5/25/66 (a)(b) | | | 836 | | | | 625 | | |
1.18%, 2/25/66 (a)(b) | | | 730 | | | | 604 | | |
Series 2022-RPL4 Class A1 | |
3.90%, 4/25/62 (a)(b) | | | 1,463 | | | | 1,343 | | |
FMC GMSR Issuer Trust, | |
3.85%, 10/25/26 (a)(b) | | | 1,700 | | | | 1,399 | | |
4.45%, 1/25/26 (a)(b) | | | 1,500 | | | | 1,302 | | |
7.90%, 7/25/27 (b) | | | 1,600 | | | | 1,579 | | |
Class A | |
3.62%, 7/25/26 (a)(b) | | | 1,550 | | | | 1,275 | | |
Headlands Residential 2021-RPL1 LLC, | |
2.49%, 9/25/26 (a)(b) | | | 1,940 | | | | 1,864 | | |
Homeward Opportunities Fund Trust, | |
6.23%, 8/25/25 (b) | | | 68 | | | | 68 | | |
Imperial Fund Mortgage Trust, | |
1.38%, 10/25/55 (a)(b) | | | 389 | | | | 341 | | |
1.60%, 11/25/56 (a)(b) | | | 844 | | | | 673 | | |
2.49%, 2/25/67 (a)(b) | | | 1,260 | | | | 1,081 | | |
J.P. Morgan Mortgage Trust, | |
Series 2023-4 Class 1A4 | |
6.00%, 11/25/53 (a)(b) | | | 1,831 | | | | 1,797 | | |
Legacy Mortgage Asset Trust, | |
6.25%, 2/25/60 (b) | | | 773 | | | | 764 | | |
LHOME Mortgage Trust, | |
2.09%, 2/25/26 (a)(b) | | | 162 | | | | 162 | | |
New Residential Mortgage Loan Trust, | |
3.75%, 5/28/52 - 8/25/55 (a)(b) | | | 104 | | | | 96 | | |
3.88%, 9/25/57 (a)(b) | | | 193 | | | | 176 | | |
NewRez Warehouse Securitization Trust, | |
1 Month Term SOFR + 0.86%, 6.18%,
5/25/55 (a)(b) | | | 1,105 | | | | 1,104 | | |
NYMT Loan Trust, | |
2.94%, 10/25/60 (a)(b) | | | 1,412 | | | | 1,387 | | |
Oceanview Mortgage Loan Trust, | |
1.73%, 5/28/50 (a)(b) | | | 246 | | | | 220 | | |
Pepper Residential Securities Trust, | |
1 Month Term SOFR + 1.04%, | |
6.37%, 3/12/61 (a)(b) | | | 43 | | | | 43 | | |
SOFR + 1.06%, | |
6.38%, 8/18/60 (a)(b) | | | 19 | | | | 19 | | |
SOFR + 1.11%, | |
6.43%, 6/20/60 (a)(b) | | | 9 | | | | 9 | | |
Preston Ridge Partners Mortgage LLC, | |
1.74%, 9/25/26 (a)(b) | | | 921 | | | | 849 | | |
2.12%, 1/25/26 - 3/25/26 (a)(b) | | | 997 | | | | 952 | | |
2.36%, 10/25/26 (b) | | | 1,161 | | | | 1,087 | | |
Residential Mortgage Loan Trust, | |
1.65%, 5/25/60 (a)(b) | | | 131 | | | | 129 | | |
| | | Face
Amount
(000) | | Value
(000) | |
RESIMAC Bastille Trust, | |
1 Month Term SOFR + 1.04%, 6.37%,
9/5/57 (a)(b) | | $ | 38 | | | $ | 38 | | |
RMF Buyout Issuance Trust, 1.72%,
10/25/50 (a)(b) | | | 987 | | | | 911 | | |
RMF Proprietary Issuance Trust, | |
2.13%, 9/25/61 (a)(b) | | | 1,546 | | | | 1,108 | | |
4.00%, 8/25/62 (a)(b) | | | 2,225 | | | | 1,804 | | |
Sequoia Mortgage Trust, | |
1 Month Term SOFR + 0.73%, 6.06%,
8/20/34 (a) | | | 73 | | | | 67 | | |
Stanwich Mortgage Loan Co. LLC, | |
2.74%, 10/16/26 (b) | | | 1,239 | | | | 1,135 | | |
Towd Point Mortgage Trust, | |
1.75%, 10/25/60 (b) | | | 498 | | | | 427 | | |
2.75%, 4/25/57 (a)(b) | | | 3 | | | | 3 | | |
1 Month Term SOFR + 0.71%, 5.28%,
2/25/57 (a)(b) | | | 48 | | | | 48 | | |
Verus Securitization Trust, | |
1.03%, 2/25/66 (a)(b) | | | 578 | | | | 476 | | |
VOLT XCIII LLC, | |
1.89%, 2/27/51 (b) | | | 681 | | | | 644 | | |
VOLT XCIV LLC, | |
2.24%, 2/27/51 (b) | | | 786 | | | | 744 | | |
| | | | 42,536 | | |
Sovereign (0.8%) | |
Corp. Andina de Fomento, | |
1.63%, 9/23/25 | | | 1,750 | | | | 1,616 | | |
Korea National Oil Corp., | |
0.88%, 10/5/25 (b) | | | 1,680 | | | | 1,526 | | |
| | | | 3,142 | | |
Total Fixed Income Securities (Cost $378,583) | | | 356,607 | | |
| | | Shares | | | |
Short-Term Investments (3.1%) | |
Investment Company (2.7%) | |
Morgan Stanley Institutional Liquidity
Funds — Government Portfolio —
Institutional Class (See Note G)
(Cost $9,819) | | | 9,819,256 | | | | 9,819 | | |
| | | Face
Amount
(000) | | | |
U.S. Treasury Security (0.4%) | |
U.S. Treasury Bill,
5.01%, 11/30/23 (d)(e) (Cost $1,518) | | $ | 1,530 | | | | 1,517 | | |
Total Short-Term Investments (Cost $11,337) | | | 11,336 | | |
Total Investments (99.5%) (Cost $389,920) (f)(g) | | | 367,943 | | |
Other Assets in Excess of Liabilities (0.5%) | | | 1,848 | | |
Net Assets (100.0%) | | $ | 369,791 | | |
The accompanying notes are an integral part of the financial statements.
12
Morgan Stanley Institutional Fund Trust
Annual Report — September 30, 2023
Portfolio of Investments (cont'd)
Short Duration Income Portfolio
(a) Floating or variable rate securities: The rates disclosed are as of September 30, 2023. For securities based on a published reference rate and spread, the reference rate and spread are indicated in the description in the Portfolio of Investments. Certain variable rate securities may not be based on a published reference rate and spread but are determined by the issuer or agent and are based on current market conditions. These securities do not indicate a reference rate and spread in their description in the Portfolio of Investments.
(b) 144A security — Certain conditions for public sale may exist. Unless otherwise noted, these securities are deemed to be liquid.
(c) Multi-step — Coupon rate changes in predetermined increments to maturity. Rate disclosed is as of September 30, 2023. Maturity date disclosed is the ultimate maturity date.
(d) Rate shown is the yield to maturity at September 30, 2023.
(e) All or a portion of the security was pledged to cover margin requirements for futures contracts.
(f) Securities are available for collateral in connection with open futures contracts.
(g) At September 30, 2023, the aggregate cost for federal income tax purposes is approximately $390,048,000. The aggregate gross unrealized appreciation is approximately $485,000 and the aggregate gross unrealized depreciation is approximately $22,490,000, resulting in net unrealized depreciation of approximately $22,005,000.
CLO Collateralized Loan Obligation.
CMT Constant Maturity Treasury Note Rate.
DAC Designated Activity Company.
HECM Home Equity Conversion Mortgage
REMIC Real Estate Mortgage Investment Conduit.
SOFR Secured Overnight Financing Rate.
SOFR30A 30-Day Average SOFR.
Futures Contracts:
The Fund had the following futures contracts open at September 30, 2023:
| | | Number
of
Contracts | | Expiration
Date | | Notional
Amount
(000) | | Value
(000) | | Unrealized
Appreciation
(Depreciation)
(000) | |
Long: | |
U.S. Treasury 2 yr. Note (United States) | | | 525 | | | Dec-23 | | $ | 105,000 | | | $ | 106,423 | | | $ | (267 | ) | |
Short: | |
U.S. Treasury 5 yr. Note (United States) | | | 231 | | | Dec-23 | | | (23,100 | ) | | | (24,338 | ) | | | 226 | | |
U.S. Treasury 10 yr. Note (United States) | | | 74 | | | Dec-23 | | | (7,400 | ) | | | (7,996 | ) | | | 142 | | |
| | | | | | | | | | | $ | 101 | | |
Portfolio Composition
Classification | | Percentage of
Total Investments | |
Finance | | | 32.4 | % | |
Industrials | | | 26.3 | | |
Asset-Backed Securities | | | 15.9 | | |
Mortgages — Other | | | 11.6 | | |
Other* | | | 7.9 | | |
Commercial Mortgage-Backed Securities | | | 5.9 | | |
Total Investments | | | 100.0 | %** | |
* Industries and/or investment types representing less than 5% of total investments.
** Does not include open long/short futures contracts with a value of approximately $138,757,000 and net unrealized appreciation of approximately $101,000.
The accompanying notes are an integral part of the financial statements.
13
Morgan Stanley Institutional Fund Trust
Annual Report — September 30, 2023
Short Duration Income Portfolio
Statement of Assets and Liabilities | | September 30, 2023
(000) | |
Assets: | |
Investments in Securities of Unaffiliated Issuers, at Value (Cost $380,101) | | $ | 358,124 | | |
Investment in Security of Affiliated Issuer, at Value (Cost $9,819) | | | 9,819 | | |
Total Investments in Securities, at Value (Cost $389,920) | | | 367,943 | | |
Interest Receivable | | | 2,203 | | |
Receivable from Affiliate | | | 26 | | |
Receivable for Variation Margin on Futures Contracts | | | 2 | | |
Other Assets | | | 84 | | |
Total Assets | | | 370,258 | | |
Liabilities: | |
Payable for Fund Shares Redeemed | | | 132 | | |
Payable for Professional Fees | | | 77 | | |
Payable for Sub Transfer Agency Fees — Class I | | | 27 | | |
Payable for Sub Transfer Agency Fees — Class A | | | 31 | | |
Payable for Sub Transfer Agency Fees — Class L | | | — | @ | |
Payable for Sub Transfer Agency Fees — Class C | | | 1 | | |
Payable for Shareholder Services Fees — Class A | | | 43 | | |
Payable for Distribution and Shareholder Services Fees — Class L | | | — | @ | |
Payable for Distribution and Shareholder Services Fees — Class C | | | 2 | | |
Payable for Trustees' Fees and Expenses | | | 37 | | |
Payable for Administration Fees | | | 25 | | |
Payable for Advisory Fees | | | 11 | | |
Payable for Custodian Fees | | | 7 | | |
Payable for Transfer Agency Fees — Class I | | | 1 | | |
Payable for Transfer Agency Fees — Class A | | | — | @ | |
Payable for Transfer Agency Fees — Class L | | | — | @ | |
Payable for Transfer Agency Fees — Class C | | | 1 | | |
Payable for Transfer Agency Fees — Class R6 | | | — | @ | |
Payable to Bank | | | 1 | | |
Other Liabilities | | | 71 | | |
Total Liabilities | | | 467 | | |
Net Assets | | $ | 369,791 | | |
Net Assets Consist of: | |
Paid-in-Capital | | $ | 396,689 | | |
Total Accumulated Loss | | | (26,898 | ) | |
Net Assets | | $ | 369,791 | | |
The accompanying notes are an integral part of the financial statements.
14
Morgan Stanley Institutional Fund Trust
Annual Report — September 30, 2023
Short Duration Income Portfolio
Statement of Assets and Liabilities (cont'd) | | September 30, 2023
(000) | |
CLASS I: | |
Net Assets | | $ | 160,099 | | |
| Shares Outstanding (unlimited number of shares authorized, no par value) (not in 000's) | | | 20,405,434 | | |
Net Asset Value, Offering and Redemption Price Per Share | | $ | 7.85 | | |
CLASS A: | |
Net Assets | | $ | 206,286 | | |
| Shares Outstanding (unlimited number of shares authorized, no par value) (not in 000's) | | | 26,217,438 | | |
Net Asset Value, Redemption Price Per Share | | $ | 7.87 | | |
Maximum Sales Load | | | 2.25 | % | |
Maximum Sales Charge | | $ | 0.18 | | |
Maximum Offering Price Per Share | | $ | 8.05 | | |
CLASS L: | |
Net Assets | | $ | 959 | | |
| Shares Outstanding (unlimited number of shares authorized, no par value) (not in 000's) | | | 122,259 | | |
Net Asset Value, Offering and Redemption Price Per Share | | $ | 7.84 | | |
CLASS C: | |
Net Assets | | $ | 2,436 | | |
| Shares Outstanding (unlimited number of shares authorized, no par value) (not in 000's) | | | 311,762 | | |
Net Asset Value, Offering and Redemption Price Per Share | | $ | 7.81 | | |
CLASS R6: | |
Net Assets | | $ | 11 | | |
| Shares Outstanding (unlimited number of shares authorized, no par value) (not in 000's) | | | 1,435 | | |
Net Asset Value, Offering and Redemption Price Per Share | | $ | 7.85 | | |
@ Amount is less than $500.
The accompanying notes are an integral part of the financial statements.
15
Morgan Stanley Institutional Fund Trust
Annual Report — September 30, 2023
Short Duration Income Portfolio
Statement of Operations | | Year Ended
September 30, 2023
(000) | |
Investment Income: | |
Interest from Securities of Unaffiliated Issuers | | $ | 11,884 | | |
Dividends from Security of Affiliated Issuer (Note G) | | | 281 | | |
Total Investment Income | | | 12,165 | | |
Expenses: | |
Advisory Fees (Note B) | | | 797 | | |
Shareholder Services Fees — Class A (Note D) | | | 544 | | |
Distribution and Shareholder Services Fees — Class L (Note D) | | | 5 | | |
Distribution and Shareholder Services Fees — Class C (Note D) | | | 35 | | |
Administration Fees (Note C) | | | 319 | | |
Sub Transfer Agency Fees — Class I | | | 135 | | |
Sub Transfer Agency Fees — Class A | | | 143 | | |
Sub Transfer Agency Fees — Class L | | | — | @ | |
Sub Transfer Agency Fees — Class C | | | 3 | | |
Professional Fees | | | 178 | | |
Registration Fees | | | 122 | | |
Pricing Fees | | | 30 | | |
Custodian Fees (Note F) | | | 28 | | |
Shareholder Reporting Fees | | | 26 | | |
Transfer Agency Fees — Class I (Note E) | | | 6 | | |
Transfer Agency Fees — Class A (Note E) | | | 7 | | |
Transfer Agency Fees — Class L (Note E) | | | 3 | | |
Transfer Agency Fees — Class C (Note E) | | | 3 | | |
Transfer Agency Fees — Class R6 (Note E) | | | 2 | | |
Trustees' Fees and Expenses | | | 14 | | |
Other Expenses | | | 34 | | |
Total Expenses | | | 2,434 | | |
Waiver of Advisory Fees (Note B) | | | (551 | ) | |
Reimbursement of Class Specific Expenses — Class I (Note B) | | | (53 | ) | |
Reimbursement of Class Specific Expenses — Class A (Note B) | | | (41 | ) | |
Reimbursement of Class Specific Expenses — Class L (Note B) | | | (3 | ) | |
Reimbursement of Class Specific Expenses — Class C (Note B) | | | (4 | ) | |
Reimbursement of Class Specific Expenses — Class R6 (Note B) | | | (2 | ) | |
Rebate from Morgan Stanley Affiliate (Note G) | | | (9 | ) | |
Net Expenses | | | 1,771 | | |
Net Investment Income | | | 10,394 | | |
Realized Loss: | |
Investments Sold | | | (3,985 | ) | |
Futures Contracts | | | (709 | ) | |
Net Realized Loss | | | (4,694 | ) | |
Change in Unrealized Appreciation (Depreciation): | |
Investments | | | 11,389 | | |
Futures Contracts | | | (1,555 | ) | |
Net Change in Unrealized Appreciation (Depreciation) | | | 9,834 | | |
Net Realized Loss and Change in Unrealized Appreciation (Depreciation) | | | 5,140 | | |
Net Increase in Net Assets Resulting from Operations | | $ | 15,534 | | |
@ Amount is less than $500.
The accompanying notes are an integral part of the financial statements.
16
Morgan Stanley Institutional Fund Trust
Annual Report — September 30, 2023
Short Duration Income Portfolio
Statements of Changes in Net Assets | | Year Ended
September 30, 2023
(000) | | Year Ended
September 30, 2022
(000) | |
Increase (Decrease) in Net Assets: | |
Operations: | |
Net Investment Income | | $ | 10,394 | | | $ | 6,204 | | |
Net Realized Gain (Loss) | | | (4,694 | ) | | | 524 | | |
Net Change in Unrealized Appreciation (Depreciation) | | | 9,834 | | | | (33,697 | ) | |
Net Increase (Decrease) in Net Assets Resulting from Operations | | | 15,534 | | | | (26,969 | ) | |
Dividends and Distributions to Shareholders: | |
Class I | | | (4,978 | ) | | | (2,861 | ) | |
Class A | | | (5,619 | ) | | | (3,120 | ) | |
Class L | | | (23 | ) | | | (9 | ) | |
Class C | | | (64 | ) | | | (16 | ) | |
Class R6* | | | (— | @) | | | (— | @) | |
Total Dividends and Distributions to Shareholders | | | (10,684 | ) | | | (6,006 | ) | |
Capital Share Transactions:(1) | |
Class I: | |
Subscribed | | | 63,693 | | | | 103,422 | | |
Distributions Reinvested | | | 4,976 | | | | 2,861 | | |
Redeemed | | | (88,761 | ) | | | (169,590 | ) | |
Class A: | |
Subscribed | | | 30,157 | | | | 138,289 | | |
Distributions Reinvested | | | 5,587 | | | | 3,110 | | |
Redeemed | | | (62,014 | ) | | | (213,622 | ) | |
Class L: | |
Exchanged | | | 29 | | | | 343 | | |
Distributions Reinvested | | | 23 | | | | 9 | | |
Redeemed | | | (78 | ) | | | (117 | ) | |
Class C: | |
Subscribed | | | 1,062 | | | | 6,127 | | |
Distributions Reinvested | | | 64 | | | | 16 | | |
Redeemed | | | (2,377 | ) | | | (4,918 | ) | |
Class R6:* | |
Distributions Reinvested | | | — | @ | | | — | @ | |
Net Decrease in Net Assets Resulting from Capital Share Transactions | | | (47,639 | ) | | | (134,070 | ) | |
Total Decrease in Net Assets | | | (42,789 | ) | | | (167,045 | ) | |
Net Assets: | |
Beginning of Period | | | 412,580 | | | | 579,625 | | |
End of Period | | $ | 369,791 | | | $ | 412,580 | | |
The accompanying notes are an integral part of the financial statements.
17
Morgan Stanley Institutional Fund Trust
Annual Report — September 30, 2023
Short Duration Income Portfolio
Statements of Changes in Net Assets (cont'd) | | Year Ended
September 30, 2023
(000) | | Year Ended
September 30, 2022
(000) | |
(1) Capital Share Transactions: | |
Class I: | |
Shares Subscribed | | | 8,164 | | | | 12,879 | | |
Shares Issued on Distributions Reinvested | | | 638 | | | | 355 | | |
Shares Redeemed | | | (11,396 | ) | | | (20,928 | ) | |
Net Decrease in Class I Shares Outstanding | | | (2,594 | ) | | | (7,694 | ) | |
Class A: | |
Shares Subscribed | | | 3,867 | | | | 17,097 | | |
Shares Issued on Distributions Reinvested | | | 715 | | | | 385 | | |
Shares Redeemed | | | (7,944 | ) | | | (26,278 | ) | |
Net Decrease in Class A Shares Outstanding | | | (3,362 | ) | | | (8,796 | ) | |
Class L: | |
Shares Exchanged | | | 4 | | | | 42 | | |
Shares Issued on Distributions Reinvested | | | 3 | | | | 1 | | |
Shares Redeemed | | | (10 | ) | | | (14 | ) | |
Net Increase (Decrease) in Class L Shares Outstanding | | | (3 | ) | | | 29 | | |
Class C: | |
Shares Subscribed | | | 137 | | | | 753 | | |
Shares Issued on Distributions Reinvested | | | 8 | | | | 2 | | |
Shares Redeemed | | | (305 | ) | | | (605 | ) | |
Net Increase (Decrease) in Class C Shares Outstanding | | | (160 | ) | | | 150 | | |
Class R6:* | |
Shares Issued on Distributions Reinvested | | | — | @@ | | | — | @@ | |
* Effective April 29, 2022, Class IS shares were renamed Class R6 shares.
@ Amount is less than $500.
@@ Amount is less than 500 shares.
The accompanying notes are an integral part of the financial statements.
18
Morgan Stanley Institutional Fund Trust
Annual Report — September 30, 2023
Financial Highlights
Short Duration Income Portfolio
| | | Class I | |
| | | Year Ended September 30, | |
Selected Per Share Data and Ratios | | 2023 | | 2022 | | 2021 | | 2020 | | 2019 | |
Net Asset Value, Beginning of Period | | $ | 7.75 | | | $ | 8.33 | | | $ | 8.31 | | | $ | 8.24 | | | $ | 8.13 | | |
Income (Loss) from Investment Operations: | |
Net Investment Income(1) | | | 0.22 | | | | 0.12 | | | | 0.10 | | | | 0.17 | | | | 0.21 | | |
Net Realized and Unrealized Gain (Loss) | | | 0.10 | | | | (0.58 | ) | | | 0.03 | | | | 0.09 | | | | 0.10 | | |
Total from Investment Operations | | | 0.32 | | | | (0.46 | ) | | | 0.13 | | | | 0.26 | | | | 0.31 | | |
Distributions from and/or in Excess of: | |
Net Investment Income | | | (0.21 | ) | | | (0.12 | ) | | | (0.11 | ) | | | (0.19 | ) | | | (0.20 | ) | |
Net Realized Gain | | | (0.01 | ) | | | — | | | | — | | | | — | | | | — | | |
Total Distributions | | | (0.22 | ) | | | (0.12 | ) | | | (0.11 | ) | | | (0.19 | ) | | | (0.20 | ) | |
Net Asset Value, End of Period | | $ | 7.85 | | | $ | 7.75 | | | $ | 8.33 | | | $ | 8.31 | | | $ | 8.24 | | |
Total Return(2) | | | 4.19 | % | | | (5.62 | )% | | | 1.57 | % | | | 3.20 | % | | | 3.93 | %(3) | |
Ratios to Average Net Assets and Supplemental Data: | |
Net Assets, End of Period (Thousands) | | $ | 160,099 | | | $ | 178,175 | | | $ | 255,659 | | | $ | 233,816 | | | $ | 174,909 | | |
Ratio of Expenses Before Expense Limitation | | | 0.47 | % | | | 0.44 | % | | | 0.45 | % | | | 0.53 | % | | | 0.49 | % | |
Ratio of Expenses After Expense Limitation | | | 0.30 | %(4) | | | 0.30 | %(4) | | | 0.30 | %(4) | | | 0.29 | %(4) | | | 0.30 | %(4) | |
Ratio of Net Investment Income | | | 2.76 | %(4) | | | 1.48 | %(4) | | | 1.25 | %(4) | | | 2.12 | %(4) | | | 2.55 | %(4) | |
Ratio of Rebate from Morgan Stanley Affiliates | | | 0.00 | %(5) | | | 0.00 | %(5) | | | 0.00 | %(5) | | | 0.01 | % | | | 0.00 | %(5) | |
Portfolio Turnover Rate | | | 26 | % | | | 53 | % | | | 53 | % | | | 74 | % | | | 64 | % | |
(1) Per share amount is based on average shares outstanding.
(2) Calculated based on the net asset value as of the last business day of the period.
(3) Performance was positively impacted by approximately 0.13% due to the receipt of proceeds from the settlement of a class action suit involving the Fund's past holdings. This was a one-time settlement, and as a result, the impact on the NAV and consequently the performance will not likely be repeated in the future. Had this settlement not occurred, the total return for Class I shares would have been approximately 3.80%.
(4) The Ratio of Expenses After Expense Limitation and Ratio of Net Investment Income reflect the rebate of certain Fund expenses in connection with the investments in Morgan Stanley affiliates during the period. The effect of the rebate on the ratios is disclosed in the above table as "Ratio of Rebate from Morgan Stanley Affiliates."
(5) Amount is less than 0.005%.
The accompanying notes are an integral part of the financial statements.
19
Morgan Stanley Institutional Fund Trust
Annual Report — September 30, 2023
Financial Highlights
Short Duration Income Portfolio
| | | Class A | |
| | | Year Ended September 30, | |
Selected Per Share Data and Ratios | | 2023 | | 2022 | | 2021 | | 2020 | | 2019 | |
Net Asset Value, Beginning of Period | | $ | 7.77 | | | $ | 8.35 | | | $ | 8.34 | | | $ | 8.26 | | | $ | 8.15 | | |
Income (Loss) from Investment Operations: | |
Net Investment Income(1) | | | 0.20 | | | | 0.10 | | | | 0.08 | | | | 0.15 | | | | 0.19 | | |
Net Realized and Unrealized Gain (Loss) | | | 0.10 | | | | (0.59 | ) | | | 0.02 | | | | 0.10 | | | | 0.10 | | |
Total from Investment Operations | | | 0.30 | | | | (0.49 | ) | | | 0.10 | | | | 0.25 | | | | 0.29 | | |
Distributions from and/or in Excess of: | |
Net Investment Income | | | (0.19 | ) | | | (0.09 | ) | | | (0.09 | ) | | | (0.17 | ) | | | (0.18 | ) | |
Net Realized Gain | | | (0.01 | ) | | | — | | | | — | | | | — | | | | — | | |
Total Distributions | | | (0.20 | ) | | | (0.09 | ) | | | (0.09 | ) | | | (0.17 | ) | | | (0.18 | ) | |
Net Asset Value, End of Period | | $ | 7.87 | | | $ | 7.77 | | | $ | 8.35 | | | $ | 8.34 | | | $ | 8.26 | | |
Total Return(2) | | | 3.92 | % | | | (5.85 | )% | | | 1.20 | % | | | 3.06 | % | | | 3.66 | %(3) | |
Ratios to Average Net Assets and Supplemental Data: | |
Net Assets, End of Period (Thousands) | | $ | 206,286 | | | $ | 229,782 | | | $ | 320,477 | | | $ | 148,771 | | | $ | 83,111 | | |
Ratio of Expenses Before Expense Limitation | | | 0.71 | % | | | 0.68 | % | | | 0.69 | % | | | 0.77 | % | | | 0.76 | % | |
Ratio of Expenses After Expense Limitation | | | 0.55 | %(4) | | | 0.55 | %(4) | | | 0.55 | %(4) | | | 0.54 | %(4) | | | 0.55 | %(4) | |
Ratio of Net Investment Income | | | 2.51 | %(4) | | | 1.22 | %(4) | | | 0.98 | %(4) | | | 1.84 | %(4) | | | 2.30 | %(4) | |
Ratio of Rebate from Morgan Stanley Affiliates | | | 0.00 | %(5) | | | 0.00 | %(5) | | | 0.00 | %(5) | | | 0.01 | % | | | 0.00 | %(5) | |
Portfolio Turnover Rate | | | 26 | % | | | 53 | % | | | 53 | % | | | 74 | % | | | 64 | % | |
(1) Per share amount is based on average shares outstanding.
(2) Calculated based on the net asset value which does not reflect sales charges, if applicable, as of the last business day of the period.
(3) Performance was positively impacted by approximately 0.13% due to the receipt of proceeds from the settlement of a class action suit involving the Fund's past holdings. This was a one-time settlement, and as a result, the impact on the NAV and consequently the performance will not likely be repeated in the future. Had this settlement not occurred, the total return for Class A shares would have been approximately 3.53%.
(4) The Ratio of Expenses After Expense Limitation and Ratio of Net Investment Income reflect the rebate of certain Fund expenses in connection with the investments in Morgan Stanley affiliates during the period. The effect of the rebate on the ratios is disclosed in the above table as "Ratio of Rebate from Morgan Stanley Affiliates."
(5) Amount is less than 0.005%.
The accompanying notes are an integral part of the financial statements.
20
Morgan Stanley Institutional Fund Trust
Annual Report — September 30, 2023
Financial Highlights
Short Duration Income Portfolio
| | | Class L | |
| | | Year Ended September 30, | |
Selected Per Share Data and Ratios | | 2023 | | 2022 | | 2021 | | 2020 | | 2019 | |
Net Asset Value, Beginning of Period | | $ | 7.74 | | | $ | 8.33 | | | $ | 8.31 | | | $ | 8.24 | | | $ | 8.12 | | |
Income (Loss) from Investment Operations: | |
Net Investment Income(1) | | | 0.18 | | | | 0.08 | | | | 0.06 | | | | 0.13 | | | | 0.17 | | |
Net Realized and Unrealized Gain (Loss) | | | 0.10 | | | | (0.59 | ) | | | 0.03 | | | | 0.09 | | | | 0.11 | | |
Total from Investment Operations | | | 0.28 | | | | (0.51 | ) | | | 0.09 | | | | 0.22 | | | | 0.28 | | |
Distributions from and/or in Excess of: | |
Net Investment Income | | | (0.17 | ) | | | (0.08 | ) | | | (0.07 | ) | | | (0.15 | ) | | | (0.16 | ) | |
Net Realized Gain | | | (0.01 | ) | | | — | | | | — | | | | — | | | | — | | |
Total Distributions | | | (0.18 | ) | | | (0.08 | ) | | | (0.07 | ) | | | (0.15 | ) | | | (0.16 | ) | |
Net Asset Value, End of Period | | $ | 7.84 | | | $ | 7.74 | | | $ | 8.33 | | | $ | 8.31 | | | $ | 8.24 | | |
Total Return(2) | | | 3.68 | % | | | (6.21 | )% | | | 1.06 | % | | | 2.69 | % | | | 3.52 | %(3) | |
Ratios to Average Net Assets and Supplemental Data: | |
Net Assets, End of Period (Thousands) | | $ | 959 | | | $ | 973 | | | $ | 808 | | | $ | 829 | | | $ | 795 | | |
Ratio of Expenses Before Expense Limitation | | | 1.22 | % | | | 1.15 | % | | | 1.17 | % | | | 1.26 | % | | | 1.25 | % | |
Ratio of Expenses After Expense Limitation | | | 0.80 | %(4) | | | 0.80 | %(4) | | | 0.80 | %(4) | | | 0.79 | %(4) | | | 0.80 | %(4) | |
Ratio of Net Investment Income | | | 2.26 | %(4) | | | 1.00 | %(4) | | | 0.76 | %(4) | | | 1.64 | %(4) | | | 2.07 | %(4) | |
Ratio of Rebate from Morgan Stanley Affiliates | | | 0.00 | %(5) | | | 0.00 | %(5) | | | 0.00 | %(5) | | | 0.01 | % | | | 0.00 | %(5) | |
Portfolio Turnover Rate | | | 26 | % | | | 53 | % | | | 53 | % | | | 74 | % | | | 64 | % | |
(1) Per share amount is based on average shares outstanding.
(2) Calculated based on the net asset value as of the last business day of the period.
(3) Performance was positively impacted by approximately 0.13% due to the receipt of proceeds from the settlement of a class action suit involving the Fund's past holdings. This was a one-time settlement, and as a result, the impact on the NAV and consequently the performance will not likely be repeated in the future. Had this settlement not occurred, the total return for Class L shares would have been approximately 3.39%.
(4) The Ratio of Expenses After Expense Limitation and Ratio of Net Investment Income reflect the rebate of certain Fund expenses in connection with the investments in Morgan Stanley affiliates during the period. The effect of the rebate on the ratios is disclosed in the above table as "Ratio of Rebate from Morgan Stanley Affiliates."
(5) Amount is less than 0.005%.
The accompanying notes are an integral part of the financial statements.
21
Morgan Stanley Institutional Fund Trust
Annual Report — September 30, 2023
Financial Highlights
Short Duration Income Portfolio
| | | Class C | |
| | | Year Ended September 30, | |
Selected Per Share Data and Ratios | | 2023 | | 2022 | | 2021 | | 2020 | | 2019 | |
Net Asset Value, Beginning of Period | | $ | 7.72 | | | $ | 8.29 | | | $ | 8.29 | | | $ | 8.22 | | | $ | 8.10 | | |
Income (Loss) from Investment Operations: | |
Net Investment Income(1) | | | 0.14 | | | | 0.04 | | | | 0.01 | | | | 0.09 | | | | 0.13 | | |
Net Realized and Unrealized Gain (Loss) | | | 0.09 | | | | (0.57 | ) | | | 0.02 | | | | 0.09 | | | | 0.11 | | |
Total from Investment Operations | | | 0.23 | | | | (0.53 | ) | | | 0.03 | | | | 0.18 | | | | 0.24 | | |
Distributions from and/or in Excess of: | |
Net Investment Income | | | (0.13 | ) | | | (0.04 | ) | | | (0.03 | ) | | | (0.11 | ) | | | (0.12 | ) | |
Net Realized Gain | | | (0.01 | ) | | | — | | | | — | | | | — | | | | — | | |
Total Distributions | | | (0.14 | ) | | | (0.04 | ) | | | (0.03 | ) | | | (0.11 | ) | | | (0.12 | ) | |
Net Asset Value, End of Period | | $ | 7.81 | | | $ | 7.72 | | | $ | 8.29 | | | $ | 8.29 | | | $ | 8.22 | | |
Total Return(2) | | | 3.02 | % | | | (6.46 | )% | | | 0.41 | % | | | 2.16 | % | | | 3.01 | %(3) | |
Ratios to Average Net Assets and Supplemental Data: | |
Net Assets, End of Period (Thousands) | | $ | 2,436 | | | $ | 3,639 | | | $ | 2,670 | | | $ | 37 | | | $ | 36 | | |
Ratio of Expenses Before Expense Limitation | | | 1.56 | % | | | 1.52 | % | | | 1.72 | % | | | 7.65 | % | | | 6.34 | % | |
Ratio of Expenses After Expense Limitation | | | 1.30 | %(4) | | | 1.30 | %(4) | | | 1.30 | %(4) | | | 1.29 | %(4) | | | 1.30 | %(4) | |
Ratio of Net Investment Income | | | 1.76 | %(4) | | | 0.53 | %(4) | | | 0.17 | %(4) | | | 1.14 | %(4) | | | 1.55 | %(4) | |
Ratio of Rebate from Morgan Stanley Affiliates | | | 0.00 | %(5) | | | 0.00 | %(5) | | | 0.00 | %(5) | | | 0.01 | % | | | 0.00 | %(5) | |
Portfolio Turnover Rate | | | 26 | % | | | 53 | % | | | 53 | % | | | 74 | % | | | 64 | % | |
(1) Per share amount is based on average shares outstanding.
(2) Calculated based on the net asset value which does not reflect sales charges, if applicable, as of the last business day of the period.
(3) Performance was positively impacted by approximately 0.13% due to the receipt of proceeds from the settlement of a class action suit involving the Fund's past holdings. This was a one-time settlement, and as a result, the impact on the NAV and consequently the performance will not likely be repeated in the future. Had this settlement not occurred, the total return for Class C shares would have been approximately 2.88%.
(4) The Ratio of Expenses After Expense Limitation and Ratio of Net Investment Income reflect the rebate of certain Fund expenses in connection with the investments in Morgan Stanley affiliates during the period. The effect of the rebate on the ratios is disclosed in the above table as "Ratio of Rebate from Morgan Stanley Affiliates."
(5) Amount is less than 0.005%.
The accompanying notes are an integral part of the financial statements.
22
Morgan Stanley Institutional Fund Trust
Annual Report — September 30, 2023
Financial Highlights
Short Duration Income Portfolio
| | | Class R6(1) | |
| | | Year Ended September 30, | |
Selected Per Share Data and Ratios | | 2023 | | 2022 | | 2021 | | 2020 | | 2019 | |
Net Asset Value, Beginning of Period | | $ | 7.75 | | | $ | 8.34 | | | $ | 8.32 | | | $ | 8.24 | | | $ | 8.13 | | |
Income (Loss) from Investment Operations: | |
Net Investment Income(2) | | | 0.22 | | | | 0.12 | | | | 0.11 | | | | 0.18 | | | | 0.21 | | |
Net Realized and Unrealized Gain (Loss) | | | 0.11 | | | | (0.59 | ) | | | 0.02 | | | | 0.09 | | | | 0.11 | | |
Total from Investment Operations | | | 0.33 | | | | (0.47 | ) | | | 0.13 | | | | 0.27 | | | | 0.32 | | |
Distributions from and/or in Excess of: | |
Net Investment Income | | | (0.22 | ) | | | (0.12 | ) | | | (0.11 | ) | | | (0.19 | ) | | | (0.21 | ) | |
Net Realized Gain | | | (0.01 | ) | | | — | | | | — | | | | — | | | | — | | |
Total Distributions | | | (0.23 | ) | | | (0.12 | ) | | | (0.11 | ) | | | (0.19 | ) | | | (0.21 | ) | |
Net Asset Value, End of Period | | $ | 7.85 | | | $ | 7.75 | | | $ | 8.34 | | | $ | 8.32 | | | $ | 8.24 | | |
Total Return(3) | | | 4.24 | % | | | (5.69 | )% | | | 1.62 | % | | | 3.37 | % | | | 3.98 | %(4) | |
Ratios to Average Net Assets and Supplemental Data: | |
Net Assets, End of Period (Thousands) | | $ | 11 | | | $ | 11 | | | $ | 11 | | | $ | 14 | | | $ | 16 | | |
Ratio of Expenses Before Expense Limitation | | | 22.60 | % | | | 19.49 | % | | | 19.98 | % | | | 12.15 | % | | | 17.44 | % | |
Ratio of Expenses After Expense Limitation | | | 0.25 | %(5) | | | 0.25 | %(5) | | | 0.24 | %(5) | | | 0.24 | %(5) | | | 0.24 | %(5) | |
Ratio of Net Investment Income | | | 2.80 | %(5) | | | 1.54 | %(5) | | | 1.32 | %(5) | | | 2.21 | %(5) | | | 2.61 | %(5) | |
Ratio of Rebate from Morgan Stanley Affiliates | | | 0.00 | %(6) | | | 0.00 | %(6) | | | 0.00 | %(6) | | | 0.01 | % | | | 0.00 | %(6) | |
Portfolio Turnover Rate | | | 26 | % | | | 53 | % | | | 53 | % | | | 74 | % | | | 64 | % | |
(1) Effective April 29, 2022, Class IS shares were renamed Class R6 shares.
(2) Per share amount is based on average shares outstanding.
(3) Calculated based on the net asset value as of the last business day of the period.
(4) Performance was positively impacted by approximately 0.13% due to the receipt of proceeds from the settlement of a class action suit involving the Fund's past holdings. This was a one-time settlement, and as a result, the impact on the NAV and consequently the performance will not likely be repeated in the future. Had this settlement not occurred, the total return for Class R6 shares would have been approximately 3.85%.
(5) The Ratio of Expenses After Expense Limitation and Ratio of Net Investment Income reflect the rebate of certain Fund expenses in connection with the investments in Morgan Stanley affiliates during the period. The effect of the rebate on the ratios is disclosed in the above table as "Ratio of Rebate from Morgan Stanley Affiliates."
(6) Amount is less than 0.005%.
The accompanying notes are an integral part of the financial statements.
23
Morgan Stanley Institutional Fund Trust
Annual Report — September 30, 2023
Notes to Financial Statements
Morgan Stanley Institutional Fund Trust ("Trust") is registered under the Investment Company Act of 1940, as amended (the "Act"), as an open-end management investment company. The Trust is comprised of nine separate, active funds (individually referred to as a "Fund," collectively as the "Funds"). All Funds are considered diversified for purposes of the Act.
The Trust applies investment company accounting and reporting guidance Accounting Standards Codification ("ASC"). In the preparation of these financial statements, management has evaluated subsequent events occurring after the date of the Fund's Statement of Assets and Liabilities through the date that the financial statements were issued.
The accompanying financial statements relate to the Short Duration Income Portfolio. The Fund seeks above-average total return over a market cycle of three to five years. The Fund has issued five classes of shares — Class I, Class A, Class L, Class C and Class R6. Effective April 29, 2022, Class IS shares were renamed Class R6 shares.
The Fund has suspended offering Class L shares to all investors. Class L shareholders of the Fund do not have the option of purchasing additional Class L shares. However, existing Class L shareholders may invest in additional Class L shares through reinvestment of dividends and distributions. In addition, Class L shares of the Fund may be exchanged for Class L shares of any Morgan Stanley Multi-Class Fund, even though Class L shares are closed to investors.
A. Significant Accounting Policies: The following significant accounting policies are in conformity with U.S. generally accepted accounting principles ("GAAP"). Such policies are consistently followed by the Trust in the preparation of its financial statements. GAAP may require management to make estimates and assumptions that affect the reported amounts and disclosures in the financial statements. Actual results may differ from those estimates.
1. Security Valuation: (1) Fixed income securities may be valued by an outside pricing service/vendor approved by the Trust's Board of Trustees (the "Trustees"). The pricing service/vendor may employ a pricing model that takes into account, among other things, bids, yield spreads and/or other market data and specific security characteristics. If Morgan Stanley Investment Management Inc. (the "Adviser"), a wholly-owned subsidiary of Morgan Stanley, determines that the price provided by the outside pricing service/vendor does not reflect the security's fair value or is unable to provide a price, prices from brokers/dealers may
also be utilized. In these circumstances, the value of the security will be the mean of bid and asked prices obtained from reputable brokers/dealers; (2) futures are valued at the settlement price on the exchange on which they trade or, if a settlement price is unavailable, at the last sale price on the exchange; (3) when market quotations are not readily available, as defined by Rule 2a-5 under the Act, including circumstances under which the Adviser determines that the closing price, last sale price or the mean between the last reported bid and asked prices are not reflective of a security's market value, portfolio securities are valued at their fair value as determined in good faith under procedures approved by and under the general supervision of the Trustees. Occasionally, developments affecting the closing prices of securities and other assets may occur between the times at which valuations of such securities are determined (that is, close of the foreign market on which the securities trade) and the close of business of the New York Stock Exchange ("NYSE"). If developments occur during such periods that are expected to materially affect the value of such securities, such valuations may be adjusted to reflect the estimated fair value of such securities as of the close of the NYSE, as determined in good faith by the Trustees or by the Adviser using a pricing service and/or procedures approved by the Trustees; (4) foreign exchange transactions ("spot contracts") and foreign exchange forward contracts ("forward contracts") are valued daily using an independent pricing vendor at the spot and forward rates, respectively, as of the close of the NYSE; and (5) investments in mutual funds, including the Morgan Stanley Institutional Liquidity Funds, are valued at the net asset value ("NAV") as of the close of each business day.
In connection with Rule 2a-5 of the Act, the Trustees have designated the Trust's Adviser as its valuation designee. The valuation designee has responsibility for determining fair value and to make the actual calculations pursuant to the fair valuation methodologies previously approved by the Trustees. Under procedures approved by the Trustees, the Trust's Adviser, as valuation designee, has formed a Valuation Committee whose members are approved by the Trustees. The Valuation Committee provides administration and oversight of the Trust's valuation policies and procedures, which are reviewed at least annually by the Trustees. These procedures allow the Trust to utilize independent pricing services, quotations from securities and financial instrument dealers and other market sources to determine fair value.
24
Morgan Stanley Institutional Fund Trust
Annual Report — September 30, 2023
Notes to Financial Statements (cont'd)
2. Fair Value Measurement: Financial Accounting Standards Board ("FASB") ASC 820, "Fair Value Measurement" ("ASC 820"), defines fair value as the price that would be received to sell an asset or pay to transfer a liability in an orderly transaction between market participants at the measurement date. ASC 820 establishes a three-tier hierarchy to distinguish between (1) inputs that reflect the assumptions market participants would use in valuing an asset or liability developed based on market data obtained from sources independent of the reporting entity (observable inputs) and (2) inputs that reflect the reporting entity's own assumptions about the assumptions market participants would use in valuing an asset or liability developed based on the best information available in the circumstances (unobservable inputs) and to establish classification of fair value measurements for disclosure purposes. Various inputs are used in determining the value of the Fund's investments. The inputs are summarized in the three broad levels listed below:
• Level 1 – unadjusted quoted prices in active markets for identical investments
• Level 2 – other significant observable inputs (including quoted prices for similar investments, interest rates, prepayment speeds, credit risk, etc.)
• Level 3 – significant unobservable inputs including the Fund's own assumptions in determining the fair value of investments. Factors considered in making this determination may include, but are not limited to, information obtained by contacting the issuer, analysts, or the appropriate stock exchange (for exchange-traded securities), analysis of the issuer's financial statements or other available documents and, if necessary, available information concerning other securities in similar circumstances.
The inputs or methodology used for valuing securities are not necessarily an indication of the risk associated with investing in those securities and the determination of the significance of a particular input to the fair value measurement in its entirety requires judgment and considers factors specific to each security.
The following is a summary of the inputs used to value the Fund's investments as of September 30, 2023:
Investment Type | | Level 1
Unadjusted
quoted
prices
(000) | | Level 2
Other
significant
observable
inputs
(000) | | Level 3
Significant
unobservable
inputs
(000) | | Total
(000) | |
Assets: | |
Fixed Income Securities | |
Agency Adjustable Rate
Mortgages | | $ | — | | | $ | 420 | | | $ | — | | | $ | 420 | | |
Agency Fixed Rate
Mortgages | | | — | | | | 361 | | | | — | | | | 361 | | |
Asset-Backed Securities | | | — | | | | 58,375 | | | | — | | | | 58,375 | | |
Collateralized Mortgage
Obligations — Agency
Collateral Series | | | — | | | | 768 | | | | — | | | | 768 | | |
Commercial Mortgage-
Backed Securities | | | — | | | | 21,679 | | | | — | | | | 21,679 | | |
Corporate Bonds | | | — | | | | 229,326 | | | | — | | | | 229,326 | | |
Mortgages — Other | | | — | | | | 42,536 | | | | — | | | | 42,536 | | |
Sovereign | | | — | | | | 3,142 | | | | — | | | | 3,142 | | |
Total Fixed Income
Securities | | | — | | | | 356,607 | | | | — | | | | 356,607 | | |
Short-Term Investments | |
Investment Company | | | 9,819 | | | | — | | | | — | | | | 9,819 | | |
U.S. Treasury Security | | | — | | | | 1,517 | | | | — | | | | 1,517 | | |
Total Short-Term
Investments | | | 9,819 | | | | 1,517 | | | | — | | | | 11,336 | | |
Futures Contracts | | | 368 | | | | — | | | | — | | | | 368 | | |
Total Assets | | | 10,187 | | | | 358,124 | | | | — | | | | 368,311 | | |
Liabilities: | |
Future Contract | | | (267 | ) | | | — | | | | — | | | | (267 | ) | |
Total | | $ | 9,920 | | | $ | 358,124 | | | $ | — | | | $ | 368,044 | | |
Transfers between investment levels may occur as the markets fluctuate and/or the availability of data used in an investment's valuation changes.
3. Foreign Currency Translation and Foreign Investments: The books and records of the Fund are maintained in U.S. dollars. Foreign currency amounts are translated into U.S. dollars as follows:
– investments, other assets and liabilities at the prevailing rate of exchange on the valuation date;
– investment transactions and investment income at the prevailing rates of exchange on the dates of such transactions.
Although the net assets of the Fund are presented at the foreign exchange rates and market values at the close of the period, the Fund does not isolate that portion of the results of operations arising as a result of changes in the foreign exchange rates from the fluctuations arising from changes in the market prices of securities held at
25
Morgan Stanley Institutional Fund Trust
Annual Report — September 30, 2023
Notes to Financial Statements (cont'd)
period end. Similarly, the Fund does not isolate the effect of changes in foreign exchange rates from the fluctuations arising from changes in the market prices of securities sold during the period. Accordingly, realized and unrealized foreign currency gains (losses) on investments in securities are included in the reported net realized and unrealized gains (losses) on investment transactions and balances.
However, pursuant to U.S. federal income tax regulations, gains and losses from certain foreign currency transactions and the foreign currency portion of gains and losses realized on sales and maturities of foreign denominated debt securities are treated as ordinary income for U.S. federal income tax purposes.
Net realized gains (losses) on foreign currency transactions represent net foreign exchange gains (losses) from currency gains (losses) realized between the trade and settlement dates on securities transactions, and the difference between the amount of investment income and foreign withholding taxes recorded on the Fund's books and the U.S. dollar equivalent amounts actually received or paid. The change in unrealized currency gains (losses) on foreign currency transactions for the period is reflected in the Statement of Operations.
Foreign security and currency transactions may involve certain considerations and risks not typically associated with those of U.S. dollar denominated transactions as a result of, among other factors, fluctuations of exchange rates in relation to the U.S. dollar, the possibility of lower levels of governmental supervision and regulation of foreign securities markets and the possibility of political or economic instability.
Governmental approval for foreign investments may be required in advance of making an investment under certain circumstances in some countries, and the extent of foreign investments in U.S. companies may be subject to limitation in other countries. Foreign ownership limitations also may be imposed by the charters of individual companies to prevent, among other concerns, violations of foreign investment limitations. As a result, an additional class of shares (identified as "Foreign" in the Portfolio of Investments) may be created and offered for investment. The "local" and "foreign shares" market values may differ. In the absence of trading of the foreign shares in such markets, the Fund values the foreign shares at the closing exchange price of the local shares.
4. Derivatives: The Fund may, but is not required to, use derivative instruments for a variety of purposes, including hedging, risk management, portfolio management or to earn income. Derivatives are financial instruments whose value is based, in part, on the value of an underlying asset, interest rate, index or financial instrument. Prevailing interest rates and volatility levels, among other things, also affect the value of derivative instruments. A derivative instrument often has risks similar to its underlying asset and may have additional risks, including imperfect correlation between the value of the derivative and the underlying asset, risks of default by the counterparty to certain transactions, magnification of losses incurred due to changes in the market value of the securities, instruments, indices or interest rates to which the derivative instrument relates, risks that the transactions may not be liquid, risks arising from margin and payment requirements, risks arising from mispricing or valuation complexity and operational and legal risks. The use of derivatives involves risks that are different from, and possibly greater than, the risks associated with other portfolio investments. Derivatives may involve the use of highly specialized instruments that require investment techniques and risk analyses different from those associated with other portfolio investments. All of the Fund's holdings, including derivative instruments, are marked-to-market each day with the change in value reflected in unrealized appreciation (depreciation). Upon disposition, a realized gain or loss is recognized.
Certain derivative transactions may give rise to a form of leverage. Leverage magnifies the potential for gain and the risk of loss. Leverage associated with derivative transactions may cause the Fund to liquidate portfolio positions when it may not be advantageous to do so to satisfy its obligations or may cause the Fund to be more volatile than if the Fund had not been leveraged. Although the Adviser seeks to use derivatives to further the Fund's investment objectives, there is no assurance that the use of derivatives will achieve this result.
Following is a description of the derivative instruments and techniques that the Fund used during the period and their associated risks:
Futures: A futures contract is a standardized, exchange-traded agreement to buy or sell a specific quantity of an underlying asset, reference rate or index at a specific price at a specific future time. The value of a futures
26
Morgan Stanley Institutional Fund Trust
Annual Report — September 30, 2023
Notes to Financial Statements (cont'd)
contract tends to increase and decrease in tandem with the value of the underlying instrument. Depending on the terms of the particular contract, futures contracts are settled through either physical delivery of the underlying instrument on the settlement date or by payment of a cash settlement amount on the settlement date. During the period the futures contract is open, payments are received from or made to the broker based upon changes in the value of the contract (the variation margin). A decision as to whether, when and how to use futures contracts involves the exercise of skill and judgment and even a well-conceived futures transaction may be unsuccessful because of market behavior or unexpected events. In addition to the derivatives risks discussed above, the prices of futures contracts can be highly volatile, using futures contracts can lower total return and the potential loss from futures contracts can exceed the Fund's initial investment in such contracts. No assurance can be given that a liquid market will exist for any particular futures contract at any particular time.
FASB ASC 815, "Derivatives and Hedging" ("ASC 815"), is intended to improve financial reporting about derivative instruments by requiring enhanced disclosures to enable investors to better understand how and why the Fund uses derivative instruments, how these derivative instruments are accounted for and their effects on the Fund's financial position and results of operations.
The following table sets forth the fair value of the Fund's derivative contracts by primary risk exposure as of September 30, 2023:
| | | Asset Derivatives
Statement of Assets and
Liabilities Location | | Primary Risk
Exposure | | Value
(000) | |
Futures Contracts | | Variation Margin on
Futures Contracts | |
Interest Rate Risk | | $ | 368 | (a) | |
| | | Liability Derivatives
Statement of Assets and
Liabilities Location | | Primary Risk
Exposure | | Value
(000) | |
Futures Contracts | | Variation Margin on
Futures Contracts | |
Interest Rate Risk | | $ | (267 | )(a) | |
(a) This amount represents the cumulative appreciation (depreciation) as reported in the Portfolio of Investments. The Statement of Assets and Liabilities only reflects the current day's net variation margin.
The following tables set forth by primary risk exposure the Fund's realized gains (losses) and change in unrealized appreciation (depreciation) by type of derivative contract for
the year ended September 30, 2023 in accordance with ASC 815:
Realized Gain (Loss) | |
Primary Risk Exposure | | Derivative Type | | Value
(000) | |
Interest Rate Risk | | Futures Contracts | | $ | (709 | ) | |
Change in Unrealized Appreciation (Depreciation) | |
Primary Risk Exposure | | Derivative Type | | Value
(000) | |
Interest Rate Risk | | Futures Contracts | | $ | (1,555 | ) | |
For the year ended September 30, 2023, the approximate average monthly amount outstanding for each derivative type is as follows:
Futures Contracts: | |
Average monthly notional value | | $ | 120,130,000 | | |
5. Indemnifications: The Trust enters into contracts that contain a variety of indemnification clauses. The Trust's maximum exposure under these arrangements is unknown as this would involve future claims that may be made against the Fund that have not yet occurred.
6. Dividends and Distributions to Shareholders: Dividends and distributions to shareholders are recorded on the ex-dividend date. Dividends from net investment income, if any, are declared and paid monthly. Net realized capital gains, if any, are distributed at least annually.
7. Security Transactions, Income and Expenses: Security transactions are accounted for on the trade date (date the order to buy or sell is executed). Realized gains and losses on the sale of investment securities are determined on the specific identified cost method. Dividend income and other distributions are recorded on the ex-dividend date (except for certain foreign dividends which may be recorded as soon as the Fund is informed of such dividends) net of applicable withholding taxes. Non-cash dividends received in the form of stock, if any, are recognized on the ex-dividend date and recorded as non-cash dividend income at fair value. Interest income is recognized on the accrual basis (except where collection is in doubt) net of applicable withholding taxes. Discounts are accreted and premiums are amortized over the life of the respective securities. Most expenses of the Trust can be directly attributed to a particular Fund. Expenses which cannot be directly attributed are apportioned among the Funds based upon relative net assets or other appropriate methods. Income, expenses (other than class specific expenses — distribution and shareholder services, transfer agency and sub transfer agency fees) and realized and
27
Morgan Stanley Institutional Fund Trust
Annual Report — September 30, 2023
Notes to Financial Statements (cont'd)
unrealized gains or losses are allocated to each class of shares based upon their relative net assets.
B. Advisory Fees: The Adviser, a wholly-owned subsidiary of Morgan Stanley, provides the Fund with advisory services under the terms of an Investment Advisory Agreement, paid quarterly, at an annual rate of 0.20% of the average daily net assets of the Fund.
The Adviser has agreed to reduce its advisory fee and/or reimburse the Fund so that total annual Fund operating expenses, excluding certain investment related expenses, taxes, interest and other extraordinary expenses (including litigation), will not exceed 0.30% for Class I shares, 0.55% for Class A shares, 0.80% for Class L shares, 1.30% for Class C shares and 0.25% for Class R6 shares. The fee waivers and/or expense reimbursements will continue for at least one year until such time as the Trustees act to discontinue all or a portion of such waivers and/or reimbursements when they deem such action is appropriate. For the year ended September 30, 2023, approximately $551,000 of advisory fees were waived and approximately $103,000 of other expenses were reimbursed by the Adviser pursuant to this arrangement.
C. Administration Fees: The Adviser also serves as Administrator to the Trust and provides administrative services pursuant to an Administration Agreement for an annual fee, accrued daily and paid monthly, of 0.08% of the Fund's average daily net assets.
Under a Sub-Administration Agreement between the Administrator and State Street Bank and Trust Company ("State Street"), State Street provides certain administrative services to the Trust. For such services, the Administrator pays State Street a portion of the fee the Administrator receives from the Fund.
D. Distribution and Shareholder Services Fees: Morgan Stanley Distribution, Inc. ("MSDI" or the "Distributor"), a wholly-owned subsidiary of the Adviser and an indirect subsidiary of Morgan Stanley, serves as the Trust's Distributor of Fund shares pursuant to a Distribution Agreement. The Trust has adopted a Shareholder Services Plan with respect to Class A shares pursuant to Rule 12b-1 under the Act. Under the Shareholder Services Plan, the Fund pays the Distributor a shareholder services fee, accrued daily and paid monthly, at an annual rate of 0.25% of the Fund's average daily net assets attributable to Class A shares.
The Trust has adopted a Distribution and Shareholder Services Plan with respect to Class L shares pursuant to Rule 12b-1
under the Act. Under the Distribution and Shareholder Services Plan, the Fund pays the Distributor a distribution fee, accrued daily and paid monthly, at an annual rate of 0.25% and a shareholder services fee, accrued daily and paid monthly, at an annual rate of 0.25% of the Fund's average daily net assets attributable to Class L shares.
The Trust has adopted a Distribution and Shareholder Services Plan with respect to Class C shares pursuant to Rule 12b-1 under the Act. Under the Distribution and Shareholder Services Plan, the Fund pays the Distributor a distribution fee, accrued daily and paid monthly, at an annual rate of 0.75% and a shareholder services fee, accrued daily and paid monthly, at an annual rate of 0.25% of the Fund's average daily net assets attributable to Class C shares.
The distribution and shareholder services fees are used to support the expenses associated with servicing and maintaining accounts. The Distributor may compensate other parties for providing distribution-related and/or shareholder support services to investors who purchase Class A, Class L and Class C shares.
E. Dividend Disbursing and Transfer/Co-Transfer Agent: The Trust's dividend disbursing and transfer agent is SS&C Global Investor & Distribution Solutions, Inc. ("SS&C GIDS"). Pursuant to a Transfer Agency Agreement, the Trust pays SS&C GIDS a fee based on the number of classes, accounts and transactions relating to the Funds of the Trust.
Eaton Vance Management ("EVM"), an affiliate of Morgan Stanley, provides co-transfer agency and related services to the Fund pursuant to a Co-Transfer Agency Services Agreement. For the year ended September 30, 2023, co-transfer agency fees and expenses incurred to EVM, included in "Transfer Agency Fees" in the Statement of Operations, amounted to approximately $1,000.
F. Custodian Fees: State Street (the "Custodian") also serves as Custodian for the Trust in accordance with a Custodian Agreement. The Custodian holds cash, securities and other assets of the Trust as required by the Act. Custody fees are payable monthly based on assets held in custody, investment purchases and sales activity and account maintenance fees, plus reimbursement for certain out-of-pocket expenses.
G. Security Transactions and Transactions with Affiliates: For the year ended September 30, 2023, purchases and sales of investment securities for the Fund, other than long-term U.S. Government securities and short-term investments were approximately $68,840,000 and $121,025,000,
28
Morgan Stanley Institutional Fund Trust
Annual Report — September 30, 2023
Notes to Financial Statements (cont'd)
respectively. For the year ended September 30, 2023, purchases and sales of long-term U.S. Government securities were approximately $30,597,000 and $31,641,000, respectively.
The Fund invests in the Institutional Class of the Morgan Stanley Institutional Liquidity Funds — Government Portfolio (the "Liquidity Funds"), an open-end management investment company managed by the Adviser. Advisory fees paid by the Fund are reduced by an amount equal to its pro-rata share of the advisory and administration fees paid by the Fund due to its investment in the Liquidity Funds. For the year ended September 30, 2023, advisory fees paid were reduced by approximately $9,000 relating to the Fund's investment in the Liquidity Funds.
A summary of the Fund's transactions in shares of affiliated investments during the year ended September 30, 2023 is as follows:
Affiliated
Investment
Company | | Value
September 30,
2022
(000) | | Purchases
at Cost
(000) | | Proceeds
from Sales
(000) | | Dividend
Income
(000) | |
Liquidity Funds | | $ | 9,373 | | | $ | 132,159 | | | $ | 131,713 | | | $ | 281 | | |
Affiliated
Investment
Company (cont'd) | | Realized
Gain
(Loss)
(000) | | Change in
Unrealized
Appreciation
(Depreciation)
(000) | | Value
September 30,
2023
(000) | |
Liquidity Funds | | $ | — | | | $ | — | | | $ | 9,819 | | |
The Fund has an unfunded noncontributory defined benefit pension plan covering certain independent Trustees of the Fund who will have served as independent Trustees for at least five years at the time of retirement. Benefits under this plan are based on factors which include years of service and compensation. The Trustees voted to close the plan to new participants and eliminate the future benefits growth due to increases to compensation after July 31, 2003. Aggregate pension costs for the year ended September 30, 2023, included in "Trustees' Fees and Expenses" in the Statement of Operations amounted to approximately $2,000. At September 30, 2023, the Fund had an accrued pension liability of approximately $37,000, which is reflected as "Payable for Trustees' Fees and Expenses" in the Statement of Assets and Liabilities.
The Fund has an unfunded Deferred Compensation Plan (the "Compensation Plan"), which allows each independent Trustee to defer payment of all, or a portion, of the fees he or she receives for serving on the Board of Trustees. Each eligible Trustee generally may elect to have the deferred amounts credited with a return equal to the total return on one or more of
the Morgan Stanley funds that are offered as investment options under the Compensation Plan. Appreciation/depreciation and distributions received from these investments are recorded with an offsetting increase/decrease in the deferred compensation obligation and do not affect the NAV of the Fund.
H. Federal Income Taxes: It is the Fund's intention to continue to qualify as a regulated investment company and distribute all of its taxable and tax-exempt income. Accordingly, no provision for federal income taxes is required in the financial statements.
The Fund may be subject to taxes imposed by countries in which it invests. Such taxes are generally based on income and/or capital gains earned or repatriated. Taxes are accrued based on net investment income, net realized gains and net unrealized appreciation as such income and/or gains are earned. Taxes may also be based on transactions in foreign currency and are accrued based on the value of investments denominated in such currency.
FASB ASC 740-10, "Income Taxes — Overall", sets forth a minimum threshold for financial statement recognition of the benefit of a tax position taken or expected to be taken in a tax return. Management has concluded that there are no significant uncertain tax positions that would require recognition in the financial statements. If applicable, the Fund recognizes interest accrued related to unrecognized tax benefits in "Interest Expense" and penalties in "Other Expenses" in the Statement of Operations. The Fund files tax returns with the U.S. Internal Revenue Service, New York and various states. Generally, each of the tax years in the four-year period ended September 30, 2023 remains subject to examination by taxing authorities.
The tax character of distributions paid may differ from the character of distributions shown for GAAP purposes due to short-term capital gains being treated as ordinary income for tax purposes. The tax character of distributions paid during fiscal years 2023 and 2022 was as follows:
2023
Distributions
Paid From: | | 2022
Distributions
Paid From: | |
Ordinary
Income
(000) | | Long Term
Capital Gain
(000) | | Ordinary
Income
(000) | |
| $ | 10,235 | | | $ | 449 | | | $ | 6,006 | | |
The amount and character of income and gains to be distributed are determined in accordance with income tax regulations
29
Morgan Stanley Institutional Fund Trust
Annual Report — September 30, 2023
Notes to Financial Statements (cont'd)
which may differ from GAAP. These book/tax differences are either considered temporary or permanent in nature.
Temporary differences are attributable to differing book and tax treatments for the timing of the recognition of gains (losses) on certain investment transactions and the timing of the deductibility of certain expenses.
The Fund had no permanent differences causing reclassifications among the components of net assets for the year ended September 30, 2023.
At September 30, 2023, the components of distributable earnings for the Fund on a tax basis were as follows:
Undistributed
Ordinary
Income
(000) | | Undistributed
Long-Term
Capital Gain
(000) | |
| $ | 1,467 | | | $ | — | | |
At September 30, 2023, the Fund had available for federal income tax purposes unused short-term and long-term capital losses of approximately $1,148,000 and $5,161,000, respectively, that do not have an expiration date.
To the extent that capital loss carryforwards are used to offset any future capital gains realized, no capital gains tax liability will be incurred by the Fund for gains realized and not distributed. To the extent that capital gains are offset, such gains will not be distributed to the shareholders.
I. Credit Facility: The Trust and other Morgan Stanley funds participated in a $300,000,000 committed, unsecured revolving line of credit facility (the "Facility") with State Street. Effective April 17, 2023, the committed line amount increased to $500,000,000. This Facility is to be used for temporary emergency purposes or funding of shareholder redemption requests. The interest rate for any funds drawn will be based on the federal funds rate or overnight bank funding rate plus a spread. The Facility also has a commitment fee of 0.25% per annum based on the unused portion of the Facility, which is allocated among participating funds based on relative net assets. During the twelve months ended September 30, 2023, the Fund did not have any borrowings under the Facility.
J. Other: At September 30, 2023, the Fund had record owners of 10% or greater. Investment activities of these shareholders could have a material impact on the Fund. The aggregate percentage of such owners was 76.8%.
K. Market Risk: An investment in the Fund is based on the values of the Fund's investments, which may change due to
economic and other events that affect markets generally, as well as those that affect particular regions, countries, industries, companies or governments. The risks associated with these developments may be magnified if social, political, economic and other conditions and events (such as war, natural disasters, health emergencies (e.g., epidemics and pandemics), terrorism, conflicts, social unrest, recessions, inflation, rapid interest rate changes and supply chain disruptions) adversely interrupt the global economy and financial markets. It is difficult to predict when events affecting the U.S. or global financial markets may occur, the effects that such events may have and the duration of those effects (which may last for extended periods). These events may negatively impact broad segments of businesses and populations and have a significant and rapid negative impact on the performance of the Fund's investments, adversely affect and increase the volatility of the Fund's share price and exacerbate pre-existing risks to the Fund. The occurrence, duration and extent of these or other types of adverse economic and market conditions and uncertainty over the long term cannot be reasonably projected or estimated at this time. The ultimate impact of public health emergencies or other adverse economic or market developments and the extent to which the associated conditions impact the Fund and its investments will also depend on other future developments, which are highly uncertain, difficult to accurately predict and subject to change at any time. The financial performance of the Fund's investments (and, in turn, the Fund's investment results) as well as their liquidity may be adversely affected because of these and similar types of factors and developments.
30
Morgan Stanley Institutional Fund Trust
Annual Report — September 30, 2023
Report of Independent Registered Public Accounting Firm
To the Shareholders and Board of Trustees of
Morgan Stanley Institutional Fund Trust —
Short Duration Income Portfolio
Opinion on the Financial Statements
We have audited the accompanying statement of assets and liabilities of Short Duration Income Portfolio (the "Fund") (one of the funds constituting Morgan Stanley Institutional Fund Trust (the "Trust")), including the portfolio of investments, as of September 30, 2023, and the related statement of operations for the year then ended, the statements of changes in net assets for each of the two years in the period then ended, the financial highlights for each of the five years in the period then ended and the related notes (collectively referred to as the "financial statements"). In our opinion, the financial statements present fairly, in all material respects, the financial position of the Fund (one of the funds constituting Morgan Stanley Institutional Fund Trust) at September 30, 2023, the results of its operations for the year then ended, the changes in its net assets for each of the two years in the period then ended and its financial highlights for each of the five years in the period then ended, in conformity with U.S. generally accepted accounting principles.
Basis for Opinion
These financial statements are the responsibility of the Trust's management. Our responsibility is to express an opinion on the Fund's financial statements based on our audits. We are a public accounting firm registered with the Public Company Accounting Oversight Board (United States) ("PCAOB") and are required to be independent with respect to the Trust in accordance with the U.S. federal securities laws and the applicable rules and regulations of the Securities and Exchange Commission and the PCAOB.
We conducted our audits in accordance with the standards of the PCAOB. Those standards require that we plan and perform the audit to obtain reasonable assurance about whether the financial statements are free of material misstatement, whether due to error or fraud. The Trust is not required to have, nor were we engaged to perform, an audit of the Trust's internal control over financial reporting. As part of our audits, we are required to obtain an understanding of internal control over financial reporting but not for the purpose of expressing an opinion on the effectiveness of the Trust's internal control over financial reporting. Accordingly, we express no such opinion.
Our audits included performing procedures to assess the risks of material misstatement of the financial statements, whether due to error or fraud, and performing procedures that respond to those risks. Such procedures included examining, on a test basis, evidence regarding the amounts and disclosures in the financial statements. Our procedures included confirmation of securities owned as of September 30, 2023, by correspondence with the custodian, brokers and others; when replies were not received from brokers and others, we performed other auditing procedures. Our audits also included evaluating the accounting principles used and significant estimates made by management, as well as evaluating the overall presentation of the financial statements. We believe that our audits provide a reasonable basis for our opinion.

We have served as the auditor of one or more Morgan Stanley investment companies since 2000.
Boston, Massachusetts
November 27, 2023
31
Morgan Stanley Institutional Fund Trust
Annual Report — September 30, 2023
Investment Advisory Agreement Approval (unaudited)
Nature, Extent and Quality of Services
The Board reviewed and considered the nature and extent of the investment advisory services provided by the Adviser under the advisory agreement, including portfolio management, investment research and equity and fixed income securities trading. The Board also reviewed and considered the nature and extent of the non-advisory, administrative services provided by the Administrator under the administration agreement, including accounting, operations, clerical, bookkeeping, compliance, business management and planning, legal services and the provision of supplies, office space and utilities at the Adviser's expense. The Board also considered the Adviser's investment in personnel and infrastructure that benefits the Fund. (The Adviser and Administrator together are referred to as the "Adviser" and the advisory and administration agreements together are referred to as the "Management Agreement.") The Board also considered that the Adviser serves a variety of other investment advisory clients and has experience overseeing service providers. The Board also compared the nature of the services provided by the Adviser with similar services provided by non-affiliated advisers as prepared by Broadridge Financial Solutions, Inc. ("Broadridge").
The Board reviewed and considered the qualifications of the portfolio managers, the senior administrative managers and other key personnel of the Adviser who provide the advisory and administrative services to the Fund. The Board determined that the Adviser's portfolio managers and key personnel are well qualified by education and/or training and experience to perform the services in an efficient and professional manner. The Board concluded that the nature and extent of the advisory and administrative services provided were necessary and appropriate for the conduct of the business and investment activities of the Fund and supported its decision to approve the Management Agreement.
Performance, Fees and Expenses of the Fund
The Board reviewed the performance, fees and expenses of the Fund compared to its peers, as prepared by Broadridge, and to appropriate benchmarks where applicable. The Board discussed with the Adviser the performance goals and the actual results achieved in managing the Fund. When considering a fund's performance, the Board and the Adviser place emphasis on trends and longer-term returns (focusing on one-year, three-year and five-year performance, as of December 31, 2022, or since inception, as applicable). When a fund underperforms its benchmark and/or its peer group average, the Board and the Adviser discuss the causes of such underperformance and, where necessary, they discuss specific changes to investment strategy or investment personnel. The Board noted that the Fund's performance was better than its peer group average for the one- and five-year periods and below its peer group average for the three-year period. The Board discussed with the Adviser the level of the advisory and administration fees (together, the "management fee") for this Fund relative to comparable funds and/or other accounts advised by the Adviser and/or compared to its peers as prepared by Broadridge. In addition to the management fee, the Board also reviewed the Fund's total expense ratio. The Board noted that the Fund's management fee and total expense ratio were lower than its peer group averages. After discussion, the Board concluded that the Fund's performance, management fee and total expense ratio were competitive with its peer group averages.
Economies of Scale
The Board considered the size and growth prospects of the Fund and how that relates to the Fund's total expense ratio and particularly the Fund's management fee rate, which does not include breakpoints. In conjunction with its review of the Adviser's profitability, the Board discussed with the Adviser how a change in assets can affect the efficiency or effectiveness of managing the Fund and whether the management fee level is appropriate relative to current and projected asset levels and/or whether the management fee structure reflects economies of scale as asset levels change. The Board has determined that its review of the actual and/or potential economies of scale of the Fund supports its decision to approve the Management Agreement.
Profitability of the Adviser and Affiliates
The Board considered information concerning the costs incurred and profits realized by the Adviser and its affiliates during the last year from their relationship with the Fund and during the last two years from their relationship with the Morgan Stanley Fund Complex and reviewed with the Adviser the cost allocation methodology used to determine the profitability of the Adviser and affiliates. The Board has determined that its review of the analysis of the Adviser's expenses and profitability supports its decision to approve the Management Agreement.
32
Morgan Stanley Institutional Fund Trust
Annual Report — September 30, 2023
Investment Advisory Agreement Approval (unaudited) (cont'd)
Other Benefits of the Relationship
The Board considered other direct and indirect benefits to the Adviser and/or its affiliates derived from their relationship with the Fund and other funds advised by the Adviser. These benefits may include, among other things, fees for trading, distribution and/or shareholder servicing and for transaction processing and reporting platforms used by securities lending agents, and research received by the Adviser generated from commission dollars spent on funds' portfolio trading. The Board reviewed with the Adviser these arrangements and the reasonableness of the Adviser's costs relative to the services performed. The Board has determined that its review of the other benefits received by the Adviser or its affiliates supports its decision to approve the Management Agreement.
Resources of the Adviser and Historical Relationship Between the Fund and the Adviser
The Board considered whether the Adviser is financially sound and has the resources necessary to perform its obligations under the Management Agreement. The Board also reviewed and considered the historical relationship between the Fund and the Adviser, including the organizational structure of the Adviser, the policies and procedures formulated and adopted by the Adviser for managing the Fund's operations and the Board's confidence in the competence and integrity of the senior managers and key personnel of the Adviser. The Board concluded that the Adviser has the financial resources necessary to fulfill its obligations under the Management Agreement and that it is beneficial for the Fund to continue its relationship with the Adviser.
Other Factors and Current Trends
The Board considered the controls and procedures adopted and implemented by the Adviser and monitored by the Fund's Chief Compliance Officer and concluded that the conduct of business by the Adviser indicates a good faith effort on its part to adhere to high ethical standards in the conduct of the Fund's business.
General Conclusion
After considering and weighing all of the above factors, with various written materials and verbal information presented by the Adviser, the Board concluded that it would be in the best interest of the Fund and its shareholders to approve renewal of the Management Agreement for another year. In reaching this conclusion the Board did not give particular weight to any single piece of information or factor referenced above. The Board considered these factors and information over the course of the year and in numerous meetings, some of which were in executive session with only the independent Board members and their counsel present. It is possible that individual Board members may have weighed these factors, and the information presented, differently in reaching their individual decisions to approve the Management Agreement.
33
Morgan Stanley Institutional Fund Trust
Annual Report — September 30, 2023
Liquidity Risk Management Program (unaudited)
In compliance with Rule 22e-4 under the Investment Company Act of 1940, as amended (the "Liquidity Rule"), the Fund has adopted and implemented a liquidity risk management program (the "Program"), which is reasonably designed to assess and manage the risk that the Fund could not meet requests to redeem shares issued by the Fund without significant dilution of remaining investors' interests in the Fund (i.e., liquidity risk). The Fund's Board of Trustees (the "Board") previously approved the designation of the Liquidity Risk Subcommittee (the "LRS") as Program administrator. The LRS is comprised of representatives from various divisions within Morgan Stanley Investment Management.
At a meeting held on March 1-2, 2023, the Board reviewed a written report prepared by the LRS that addressed the Program's operation and assessed its adequacy, and effectiveness of implementation for the period from January 1, 2022, through December 31, 2022, as required under the Liquidity Rule. The report concluded that the Program operated effectively and was adequately and effectively implemented in all material aspects, and that the relevant controls and safeguards were appropriately designed to enable the LRS to administer the Program in compliance with the Liquidity Rule.
In accordance with the Program, the LRS assessed each Fund's liquidity risk no less frequently than annually taking into consideration certain factors, as applicable, such as (i) investment strategy and liquidity of portfolio investments, (ii) short-term and long-term cash flow projections and (iii) holdings of cash and cash equivalents and borrowing arrangements and other funding sources. Certain factors are considered under both normal and reasonably foreseeable stressed conditions.
Each Fund portfolio investment is classified into one of four liquidity categories, which classification is assessed at least monthly by the LRS. The classification is based on a determination of the number of days it is reasonably expected to take to convert the investment into cash, or sell or dispose of the investment, in current market conditions without significantly changing the market value of the investment. Liquidity classification determinations take into account various market, trading and investment-specific considerations, as well as market depth, and in some cases utilize third-party vendor data.
The Liquidity Rule limits a fund's investments in illiquid investments to 15% of its net assets and requires funds that do not primarily hold assets that are highly liquid investments to determine and maintain a minimum percentage of the fund's net assets to be invested in highly liquid investments (highly liquid investment minimum or "HLIM"). The LRS believes that the Program includes provisions reasonably designed to review, monitor and comply with the 15% limit on illiquid investments and for determining, periodically reviewing and complying with the HLIM requirement, as applicable.
There can be no assurance that the Program will achieve its objectives under all circumstances in the future. Please refer to the Fund's prospectus for more information regarding the Fund's exposure to liquidity risk and other risks to which it may be subject.
34
Morgan Stanley Institutional Fund Trust
Annual Report — September 30, 2023
Federal Tax Notice (unaudited)
For federal income tax purposes, the following information is furnished with respect to the distributions paid by the Fund during its taxable year ended September 30, 2023.
The Fund designated and paid approximately $449,000 as a long-term capital gain distribution.
The Fund designated approximately $8,836,000 of its distributions paid as business interest income.
The Fund designated approximately $6,715,000 of its distributions paid as qualified interest income.
In January, the Fund provides tax information to shareholders for the preceding calendar year.
35
Morgan Stanley Institutional Fund Trust
Annual Report — September 30, 2023
Important Notices (unaudited)
Reporting to Shareholders
Each Morgan Stanley fund provides a complete schedule of portfolio holdings in its Semi-Annual and the Annual Reports within 60 days of the end of the fund's second and fourth fiscal quarters. The Semi-Annual and Annual Reports are filed electronically with the Securities and Exchange Commission ("SEC") on Form N-CSRS and Form N-CSR, respectively. Morgan Stanley makes these reports available on its public website, www.morganstanley.com/im. Each Morgan Stanley non-money market fund also files a complete schedule of portfolio holdings with the SEC for the fund's first and third fiscal quarters as an attachment to Form N-PORT. Morgan Stanley does not deliver the reports for the first and third fiscal quarters to shareholders, but makes the complete schedule of portfolio holdings for the fund's first and third fiscal quarters available on its public website. The holdings for each money market fund are also posted to the Morgan Stanley public website. You may obtain the Form N-PORT filings (as well as the Form N-CSR and N-CSRS filings) by accessing the SEC's website, www.sec.gov. You can also request copies of these materials, upon payment of a duplicating fee, by electronic request at the SEC's email address (publicinfo@sec.gov).
Proxy Voting Policies and Procedures and Proxy Voting Record
You may obtain a copy of the Trust's Proxy Voting Policy and Procedures and information regarding how the Trust voted proxies relating to portfolio securities during the most recent twelve-month period ended June 30, without charge, upon request, by calling toll free 1 (800) 869-6397 or by visiting our website at www.morganstanley.com/im. This information is also available on the SEC's website at www.sec.gov.
This report is authorized for distribution only when preceded or accompanied by a prospectus or summary prospectus of the applicable fund of Morgan Stanley Institutional Fund Trust, which describes in detail the fund's investment policies, risks, fees and expenses. Please read the prospectus carefully before you invest or send money. For additional information, including information regarding the investments comprising the Fund, please visit our website at www.morganstanley.com/im. or call toll free 1 (800) 869-6397.
Householding Notice
To reduce printing and mailing costs, the Fund attempts to eliminate duplicate mailings to the same address. The Fund delivers a single copy of certain shareholder documents, including shareholder reports, prospectuses and proxy materials, to investors with the same last name who reside at the same address. Your participation in this program will continue for an unlimited period of time unless you instruct us otherwise. You can request multiple copies of these documents by calling 1 (800) 869-6397, 8:00 a.m. to 6:00 p.m., ET. Once our Customer Service Center has received your instructions, we will begin sending individual copies for each account within 30 days.
Tailored Shareholder Reports
Effective January 24, 2023, the SEC adopted rule and form amendments to require open-end mutual funds and ETFs to transmit concise and visually engaging streamlined annual and semiannual reports to shareholders that highlight key information. Other information, including financial statements, will no longer appear in a streamlined shareholder report but must be available online, delivered free of charge upon request, and filed on a semiannual basis on Form N-CSR. The rule and form amendments have a compliance date of July 24, 2024. At this time, management is evaluating the impact of these amendments on the shareholder reports for the Morgan Stanley Funds.
36
Morgan Stanley Institutional Fund Trust
Annual Report — September 30, 2023
U.S. Customer Privacy Notice (unaudited) April 2021
FACTS | | WHAT DOES MSIM DO WITH YOUR PERSONAL INFORMATION? | |
Why? | | Financial companies choose how they share your personal information. Federal law gives consumers the right to limit some but not all sharing. Federal law also requires us to tell you how we collect, share, and protect your personal information. Please read this notice carefully to understand what we do. | |
What? | | The types of personal information we collect and share depend on the product or service you have with us. This information can include:
◼ Social Security number and income
◼ investment experience and risk tolerance
◼ checking account number and wire transfer instructions | |
How? | | All financial companies need to share customers' personal information to run their everyday business. In the section below, we list the reasons financial companies can share their customers' personal information; the reasons MSIM chooses to share; and whether you can limit this sharing. | |
Reasons we can share your personal information | | Does MSIM share? | | Can you limit this sharing? | |
For our everyday business purposes —
such as to process your transactions, maintain your account(s), respond to court orders and legal investigations, or report to credit bureaus | | Yes | | No | |
For our marketing purposes —
to offer our products and services to you | | Yes | | No | |
For joint marketing with other financial companies | | No | | We don't share | |
For our investment management affiliates' everyday business purposes —
information about your transactions, experiences, and creditworthiness | | Yes | | Yes | |
For our affiliates' everyday business purposes —
information about your transactions and experiences | | Yes | | No | |
| For our affiliates' everyday business purposes — information about your creditworthiness | | No | | We don't share | |
For our investment management affiliates to market to you | | Yes | | Yes | |
For our affiliates to market to you | | No | | We don't share | |
For non-affiliates to market to you | | No | | We don't share | |
37
Morgan Stanley Institutional Fund Trust
Annual Report — September 30, 2023
U.S. Customer Privacy Notice (unaudited) (cont'd) April 2021
To limit our sharing | | Call toll-free (844) 312-6327 or email: imprivacyinquiries@morganstanley.com
Please note:
If you are a new customer, we can begin sharing your information 30 days from the date we sent this notice. When you are no longer our customer, we continue to share your information as described in this notice. However, you can contact us at any time to limit our sharing. | |
Questions? | | Call toll-free (844) 312-6327 or email: imprivacyinquiries@morganstanley.com | |
Who we are
Who is providing this notice? | | Morgan Stanley Investment Management Inc. and its investment management affiliates ("MSIM") (see Investment Management Affiliates definition below) | |
What we do
How does MSIM protect my personal information? | | To protect your personal information from unauthorized access and use, we use security measures that comply with federal law. These measures include computer safeguards and secured files and buildings. We have policies governing the proper handling of customer information by personnel and requiring third parties that provide support to adhere to appropriate security standards with respect to such information. | |
How does MSIM collect my personal information? | | We collect your personal information, for example, when you
◼ open an account or make deposits or withdrawals from your account
◼ buy securities from us or make a wire transfer
◼ give us your contact information
We also collect your personal information from others, such as credit bureaus, affiliates, or other companies. | |
Why can't I limit all sharing? | | Federal law gives you the right to limit only
◼ sharing for affiliates' everyday business purposes — information about your creditworthiness
◼ affiliates from using your information to market to you
◼ sharing for non-affiliates to market to you
State laws and individual companies may give you additional rights to limit sharing. See below for more on your rights under state law. | |
38
Morgan Stanley Institutional Fund Trust
Annual Report — September 30, 2023
U.S. Customer Privacy Notice (unaudited) (cont'd) April 2021
Definitions
Investment Management Affiliates | | MSIM Investment Management Affiliates include registered investment advisers, registered broker-dealers, and registered and unregistered funds in the Investment Management Division. Investment Management Affiliates does not include entities associated with Morgan Stanley Wealth Management, such as Morgan Stanley Smith Barney LLC and Morgan Stanley & Co. | |
Affiliates | | Companies related by common ownership or control. They can be financial and non-financial companies.
◼ Our affiliates include companies with a Morgan Stanley name and financial companies such as Morgan Stanley Smith Barney LLC and Morgan Stanley & Co. | |
Non-affiliates | | Companies not related by common ownership or control. They can be financial and non-financial companies.
◼ MSIM does not share with non-affiliates so they can market to you. | |
Joint marketing | | A formal agreement between non-affiliated financial companies that together market financial products or services to you.
◼ MSIM doesn't jointly market | |
Other important information
Vermont: Except as permitted by law, we will not share personal information we collect about Vermont residents with Non-affiliates unless you provide us with your written consent to share such information.
California: Except as permitted by law, we will not share personal information we collect about California residents with Non-affiliates and we will limit sharing such personal information with our Affiliates to comply with California privacy laws that apply to us.
39
Morgan Stanley Institutional Fund Trust
Annual Report — September 30, 2023
Trustees and Officers Information (unaudited)
Independent Trustees:
Name, Address and Birth Year
of Independent Trustee | | Position(s)
Held with
Registrant | | Length of Time
Served* | | Principal Occupation(s) During Past 5 Years
and Other Relevant Professional Experience | | Number of
Funds in
Fund Complex
Overseen by
Independent
Trustee** | | Other Directorships
Held by Independent
Trustee During
Past 5 Years*** | |
Frank L. Bowman
c/o Perkins Coie LLP
Counsel to the Independent Trustees
1155 Avenue of the Americas
22nd Floor
New York, NY 10036
Birth Year: 1944 | | Trustee | | Since
August
2006 | | President, Strategic Decisions, LLC (consulting) (since February 2009); Director or Trustee of various Morgan Stanley Funds (since August 2006); Chairperson of the Compliance and Insurance Committee (since October 2015); formerly, Chairperson of the Insurance Sub-Committee of the Compliance and Insurance Committee (2007-2015); served as President and Chief Executive Officer of the Nuclear Energy Institute (policy organization) (February 2005-November 2008); retired as Admiral, U.S. Navy after serving over 38 years on active duty including 8 years as Director of the Naval Nuclear Propulsion Program in the Department of the Navy and the U.S. Department of Energy (1996-2004); served as Chief of Naval Personnel (July 1994-September 1996) and on the Joint Staff as Director of Political Military Affairs (June 1992-July 1994); knighted as Honorary Knight Commander of the Most Excellent Order of the British Empire; awarded the Officier de l'Orde National du Mèrite by the French Government; elected to the National Academy of Engineering (2009). | | | 86 | | | Director of Naval and Nuclear Technologies LLP; Director Emeritus of the Armed Services YMCA; Member of the National Security Advisory Council of the Center for U.S. Global Engagement and a former member of the CNA Military Advisory Board; Chairman of the Board of Trustees of Fairhaven United Methodist Church; Member of the Board of Advisors of the Dolphin Scholarship Foundation; Director of other various nonprofit organizations; formerly, Director of BP, plc (November 2010-May 2019). | |
Frances L. Cashman
c/o Perkins Coie LLP
Counsel to the Independent Trustees
1155 Avenue of the Americas
22nd Floor
New York, NY 10036
Birth Year: 1961 | | Trustee | | Since
February
2022 | | Chief Executive Officer, Asset Management Division, Delinian Ltd. (financial information) (May 2021-Present); Executive Vice President and various other roles, Legg Mason & Co. (asset management) (2010-2020); Managing Director, Stifel Nicolaus (2005-2010). | | | 87 | | | Trustee and Investment Committee Member, GeorgiaTech Foundation (since June 2019); Trustee and Chair of Marketing Committee, and Member of Investment Committee, Loyola Blakefield (Since September 2017); Trustee, MMI Gateway Foundation (since September 2017); Director and Investment Committee Member, Catholic Community Foundation Board (2012-2018); Director and Investment Committee Member, St. Ignatius Loyola Academy (2011-2017). | |
Kathleen A. Dennis
c/o Perkins Coie LLP
Counsel to the Independent Trustees
1155 Avenue of the Americas
22nd Floor
New York, NY 10036
Birth Year: 1953 | | Trustee | | Since
August
2006 | | Chairperson of the Governance Committee (since January 2021), Chairperson of the Liquidity and Alternatives Sub-Committee of the Investment Committee (2006-2020) and Director or Trustee of various Morgan Stanley Funds (since August 2006); President, Cedarwood Associates (mutual fund and investment management consulting) (since July 2006); formerly, Senior Managing Director of Victory Capital Management (1993-2006). | | | 86 | | | Board Member, University of Albany Foundation (2012-present); Board Member, Mutual Funds Directors Forum (2014-present); Director of various non-profit organizations. | |
40
Morgan Stanley Institutional Fund Trust
Annual Report — September 30, 2023
Trustees and Officers Information (unaudited) (cont'd)
Independent Trustees: (cont'd)
Name, Address and Birth Year
of Independent Trustee | | Position(s)
Held with
Registrant | | Length of Time
Served* | | Principal Occupation(s) During Past 5 Years
and Other Relevant Professional Experience | | Number of
Funds in
Fund Complex
Overseen by
Independent
Trustee** | | Other Directorships
Held by Independent
Trustee During
Past 5 Years*** | |
Nancy C. Everett
c/o Perkins Coie LLP
Counsel to the Independent Trustees
1155 Avenue of the Americas
22nd Floor
New York, NY 10036
Birth Year: 1955 | | Trustee | | Since
January
2015 | | Chairperson of the Equity Investment Committee (since January 2021); Director or Trustee of various Morgan Stanley Funds (since January 2015); Chief Executive Officer, Virginia Commonwealth University Investment Company (since November 2015); Owner, OBIR, LLC (institutional investment management consulting) (since June 2014); formerly, Managing Director, BlackRock, Inc. (February 2011-December 2013) and Chief Executive Officer, General Motors Asset Management (a/k/a Promark Global Advisors, Inc.) (June 2005-May 2010). | | | 87 | | | Formerly, Member of Virginia Commonwealth University School of Business Foundation (2005-2016); Member of Virginia Commonwealth University Board of Visitors (2013-2015); Member of Committee on Directors for Emerging Markets Growth Fund, Inc. (2007-2010); Chairperson of Performance Equity Management, LLC (2006-2010); and Chairperson, GMAM Absolute Return Strategies Fund, LLC (2006-2010). | |
Eddie A. Grier
c/o Perkins Coie LLP
Counsel to the Independent Trustees
1155 Avenue of the Americas
22nd Floor
New York, NY 10036
Birth Year: 1955 | | Trustee | | Since
February
2022 | | Dean, Santa Clara University Leavey School of Business (since July 2021); Dean, Virginia Commonwealth University School of Business (2010-2021); President and various other roles, Walt Disney Company (entertainment and media) (1981-2010). | | | 87 | | | Director, Witt/Keiffer, Inc. (executive search) (since 2016); Director, NuStar GP, LLC (energy) (since August 2021); Director, Sonida Senior Living, Inc. (residential community operator) (2016-2021); Director, NVR, Inc. (homebuilding) (2013-2020); Director, Middleburg Trust Company (wealth management) (2014-2019); Director, Colonial Williamsburg Company (2012-2021); Regent, University of Massachusetts Global (since 2021); Director and Chair, ChildFund International (2012-2021); Trustee, Brandman University (2010-2021); Director, Richmond Forum (2012-2019). | |
41
Morgan Stanley Institutional Fund Trust
Annual Report — September 30, 2023
Trustees and Officers Information (unaudited) (cont'd)
Independent Trustees: (cont'd)
Name, Address and Birth Year
of Independent Trustee | | Position(s)
Held with
Registrant | | Length of Time
Served* | | Principal Occupation(s) During Past 5 Years
and Other Relevant Professional Experience | | Number of
Funds in
Fund Complex
Overseen by
Independent
Trustee** | | Other Directorships
Held by Independent
Trustee During
Past 5 Years*** | |
Jakki L. Haussler
c/o Perkins Coie LLP
Counsel to the Independent Trustees
1155 Avenue of the Americas
22nd Floor
New York, NY 10036
Birth Year: 1957 | | Trustee | | Since
January
2015 | | Chairperson of the Audit Committee (since January 2023) and Director or Trustee of various Morgan Stanley Funds (since January 2015); Chairman, Opus Capital Group (since 1996); formerly, Chief Executive Officer, Opus Capital Group (1996-2019); Director, Capvest Venture Fund, LP (May 2000-December 2011); Partner, Adena Ventures, LP (July 1999-December 2010); Director, The Victory Funds (February 2005-July 2008). | | | 87 | | | Director, Vertiv Holdings Co. (VRT) (since August 2022); Director of Cincinnati Bell Inc. and Member, Audit Committee and Chairman, Governance and Nominating Committee (2008-2021); Director of Service Corporation International and Member, Audit Committee and Investment Committee; Director, Barnes Group Inc. (since July 2021); Director of Northern Kentucky University Foundation and Member, Investment Committee; Member of Chase College of Law Center for Law and Entrepreneurship Board of Advisors; Director of Best Transport (2005-2019); Director of Chase College of Law Board of Visitors; formerly, Member, University of Cincinnati Foundation Investment Committee. | |
Dr. Manuel H. Johnson
c/o Johnson Smick
International, Inc.
220 I Street, NE
Suite 200
Washington, D.C. 20002
Birth Year: 1949 | | Trustee | | Since
July
1991 | | Senior Partner, Johnson Smick International, Inc. (consulting firm); Chairperson of the Fixed Income, Liquidity and Alternatives Investment Committee (since January 2021), Chairperson of the Investment Committee (2006-2020) and Director or Trustee of various Morgan Stanley Funds (since July 1991); Co-Chairman and a founder of the Group of Seven Council (G7C) (international economic commission); formerly, Chairperson of the Audit Committee (July 1991-September 2006); Vice Chairman of the Board of Governors of the Federal Reserve System and Assistant Secretary of the U.S. Treasury. | | | 86 | | | Director of NVR, Inc. (home construction). | |
42
Morgan Stanley Institutional Fund Trust
Annual Report — September 30, 2023
Trustees and Officers Information (unaudited) (cont'd)
Independent Trustees: (cont'd)
Name, Address and Birth Year
of Independent Trustee | | Position(s)
Held with
Registrant | | Length of Time
Served* | | Principal Occupation(s) During Past 5 Years
and Other Relevant Professional Experience | | Number of
Funds in
Fund Complex
Overseen by
Independent
Trustee** | | Other Directorships
Held by Independent
Trustee During
Past 5 Years*** | |
Joseph K. Kearns
c/o Perkins Coie LLP
Counsel to the Independent Trustees
1155 Avenue of the Americas
22nd Floor
New York, NY 10036
Birth Year: 1942 | | Trustee | | Since
August
1994 | | Senior Adviser, Kearns & Associates LLC (investment consulting); Chairperson of the Audit Committee (2006-2022) and Director or Trustee of various Morgan Stanley Funds (since August 1994); formerly, Deputy Chairperson of the Audit Committee (July 2003-September 2006); CFO of the J. Paul Getty Trust (1982-1999). | | | 87 | | | Director, Rubicon Investments (since February 2019); Prior to August 2016, Director of Electro Rent Corporation (equipment leasing); Prior to December 31, 2013, Director of The Ford Family Foundation. | |
Michael F. Klein
c/o Perkins Coie LLP
Counsel to the Independent Trustees
1155 Avenue of the Americas
22nd Floor
New York, NY 10036
Birth Year: 1958 | | Trustee | | Since
August
2006 | | Chairperson of the Risk Committee (since January 2021); Managing Director, Aetos Alternatives Management, LP (since March 2000); Co-President, Aetos Alternatives Management, LP (since January 2004) and Co-Chief Executive Officer of Aetos Alternatives Management, LP (since August 2013); Chairperson of the Fixed Income Sub-Committee of the Investment Committee (2006-2020) and Director or Trustee of various Morgan Stanley Funds (since August 2006); formerly, Managing Director, Morgan Stanley & Co. Inc. and Morgan Stanley Dean Witter Investment Management and President, various Morgan Stanley Funds (June 1998-March 2000); Principal, Morgan Stanley & Co. Inc. and Morgan Stanley Dean Witter Investment Management (August 1997-December 1999). | | | 86 | | | Director of certain investment funds managed or sponsored by Aetos Alternatives Management, LP; Director of Sanitized AG and Sanitized Marketing AG (specialty chemicals). | |
Patricia A. Maleski
c/o Perkins Coie LLP
Counsel to the Independent Trustees
1155 Avenue of the Americas
22nd Floor
New York, NY 10036
Birth Year: 1960 | | Trustee | | Since
January
2017 | | Director or Trustee of various Morgan Stanley Funds (since January 2017); Managing Director, JPMorgan Asset Management (2004-2016); Oversight and Control Head of Fiduciary and Conflicts of Interest Program (2015-2016); Chief Control Officer—Global Asset Management (2013-2015); President, JPMorgan Funds (2010-2013); Chief Administrative Officer (2004-2013); various other positions including Treasurer and Board Liaison (since 2001). | | | 87 | | | Trustee (since January 2022) and Treasurer (since January 2023), Nutley Family Service Bureau, Inc. | |
W. Allen Reed
c/o Perkins Coie LLP
Counsel to the Independent Trustees
1155 Avenue of the Americas
22nd Floor
New York, NY 10036
Birth Year: 1947 | | Chair of the Board and Trustee | | Chair of the Board since August 2020 and Trustee since August 2006 | | Chair of the Boards of various Morgan Stanley Funds (since August 2020); Director or Trustee of various Morgan Stanley Funds (since August 2006); formerly, Vice Chair of the Boards of various Morgan Stanley Funds (January 2020-August 2020); President and Chief Executive Officer of General Motors Asset Management; Chairman and Chief Executive Officer of the GM Trust Bank and Corporate Vice President of General Motors Corporation (August 1994-December 2005). | | | 86 | | | Formerly, Director of Legg Mason, Inc. (2006-2019); and Director of the Auburn University Foundation (2010-2015). | |
* This is the earliest date the Trustee began serving the Morgan Stanley Funds. Each Trustee serves an indefinite term, until his or her successor is elected.
** The Fund Complex includes (as of December 31, 2022) all open-end and closed-end funds (including all of their portfolios) advised by Morgan Stanley Investment Management Inc. (the "Adviser") and any funds that have an adviser that is an affiliated person of the Adviser (including, but not limited to, Morgan Stanley AIP GP LP).
*** This includes any directorships at public companies and registered investment companies held by the Trustees at any time during the past five years.
43
Morgan Stanley Institutional Fund Trust
Annual Report — September 30, 2023
Trustees and Officers Information (unaudited) (cont'd)
Executive Officers:
Name, Address and Birth Year
of Executive Officer | | Position(s) Held
with
Registrant | | Length of
Time Served* | | Principal Occupation(s) During Past 5 Years | |
John H. Gernon
522 Fifth Avenue
New York, NY 10036
Birth Year: 1963 | | President and Principal Executive Officer | | Since
September
2013 | | President and Principal Executive Officer of the Equity and Fixed Income Funds and the Morgan Stanley AIP Funds (since September 2013) and the Liquidity Funds and various money market funds (since May 2014) in the Fund Complex; Managing Director of the Adviser. | |
Deidre A. Downes
1633 Broadway
New York, NY 10019
Birth Year: 1977 | | Chief Compliance Officer | | Since
November
2021 | | Executive Director of the Adviser (since January 2021) and Chief Compliance Officer of various Morgan Stanley Funds (since November 2021). Formerly, Vice President and Corporate Counsel at PGIM and Prudential Financial (October 2016-December 2020). | |
Francis J. Smith
522 Fifth Avenue
New York, NY 10036
Birth Year: 1965 | | Treasurer and Principal Financial Officer | | Treasurer since July 2003 and Principal Financial Officer since September
2002 | | Managing Director of the Adviser and various entities affiliated with the Adviser; Treasurer (since July 2003) and Principal Financial Officer of various Morgan Stanley Funds (since September 2002). | |
Mary E. Mullin
1633 Broadway
New York, NY 10019
Birth Year: 1967 | | Secretary | | Since
June
1999 | | Managing Director of the Adviser; Secretary of various Morgan Stanley Funds (since June 1999). | |
Michael J. Key
522 Fifth Avenue
New York, NY 10036
Birth Year: 1979 | | Vice President | | Since
June
2017 | | Vice President of the Equity and Fixed Income Funds, Liquidity Funds, various money market funds and the Morgan Stanley AIP Funds in the Fund Complex (since June 2017); Managing Director of the Adviser; Head of Product Development for Equity and Fixed Income Funds (since August 2013). | |
The Fund's statement of additional information includes further information about the Fund's Trustees and Officers, and is available without charge by visiting www.morganstanley.com/im or upon request by calling 1 (800) 869-6397.
* This is the earliest date the officer began serving the Morgan Stanley Funds. Each officer serves an indefinite term, until his or her successor is elected.
44
Morgan Stanley Institutional Fund Trust
Annual Report — September 30, 2023
Adviser and Administrator
Morgan Stanley Investment Management Inc.
522 Fifth Avenue
New York, New York 10036
Distributor
Morgan Stanley Distribution, Inc.
522 Fifth Avenue
New York, New York 10036
Dividend Disbursing and Transfer Agent
SS&C Global Investor & Distribution Solutions, Inc.
P.O. Box 219804
Kansas City, Missouri 64121-9804
Co-Transfer Agent
Eaton Vance Management
Two International Place
Boston, Massachusetts 02110
Custodian
State Street Bank and Trust Company
One Congress Street
Boston, Massachusetts 02114
Legal Counsel
Dechert LLP
1095 Avenue of the Americas
New York, New York 10036
Counsel to the Independent Trustees
Perkins Coie LLP
1155 Avenue of the Americas,
22nd Floor
New York, New York 10036
Independent Registered Public Accounting Firm
Ernst & Young LLP
200 Clarendon Street
Boston, Massachusetts 02116
45
(This page has been left blank intentionally.)
(This page has been left blank intentionally.)
Printed in U.S.A.
This Report has been prepared for shareholders and may be distributed to others only if preceded or accompanied by a current prospectus.
Morgan Stanley Investment Management Inc.
522 Fifth Avenue
New York, New York 10036
© 2023 Morgan Stanley. Morgan Stanley Distribution, Inc.

IFTLDANN
6045107 EXP 11.30.24

Morgan Stanley Institutional Fund Trust
Short Duration Municipal Income Portfolio
(formerly Ultra-Short Municipal Income Portfolio)
Annual Report
September 30, 2023

Morgan Stanley Institutional Fund Trust
Annual Report — September 30, 2023
Table of Contents (unaudited)
Shareholders' Letter | | | 2 | | |
Expense Example | | | 3 | | |
Investment Overview | | | 4 | | |
Portfolio of Investments | | | 7 | | |
Statement of Assets and Liabilities | | | 11 | | |
Statement of Operations | | | 12 | | |
Statements of Changes in Net Assets | | | 13 | | |
Financial Highlights | | | 14 | | |
Notes to Financial Statements | | | 17 | | |
Report of Independent Registered Public Accounting Firm | | | 22 | | |
Investment Advisory Agreement Approval | | | 23 | | |
Liquidity Risk Management Program | | | 25 | | |
Federal Tax Notice | | | 26 | | |
Important Notices | | | 27 | | |
U.S. Customer Privacy Notice | | | 28 | | |
Trustees and Officers Information | | | 31 | | |
This report is authorized for distribution only when preceded or accompanied by a prospectus or summary prospectus of the applicable Fund of the Morgan Stanley Institutional Fund Trust. To receive a prospectus and/or statement of additional information ("SAI"), which contains more complete information such as investment objectives, charges, expenses, policies for voting proxies, risk considerations and describes in detail each of the Fund's investment policies to the prospective investor, please call toll free 1 (800) 869-6397. Please read the prospectuses carefully before you invest or send money.
Additionally, you can access information about the Fund, including performance, characteristics and investment team commentary through Morgan Stanley Investment Management's website: www.morganstanley.com/im.
Market forecasts provided in this report may not necessarily come to pass. There is no guarantee that any sectors mentioned will continue to perform as discussed herein or that securities in such sectors will be held by the Fund in the future. There is no assurance that a fund will achieve its investment objective. Funds are subject to market risk, which is the possibility that market values of securities owned by the Fund will decline and, therefore, the value of the Fund's shares may be less than what you paid for them. Accordingly, you can lose money investing in this Fund. Please see the prospectus for more complete information on investment risks.
1
Morgan Stanley Institutional Fund Trust
Annual Report — September 30, 2023
Shareholders' Letter (unaudited)
Dear Shareholders,
We are pleased to provide this Annual Report, in which you will learn how your investment in Short Duration Municipal Income Portfolio (the "Fund") (formerly Ultra-Short Municipal Income Portfolio) performed during the latest twelve-month period.
Morgan Stanley Investment Management is a client-centric, investor-led organization. Our global presence, intellectual capital, and breadth of products and services enable us to partner with investors to meet the evolving challenges of today's financial markets. We aim to deliver superior investment service and to empower our clients to make the informed decisions that help them reach their investment goals.
As always, we thank you for selecting Morgan Stanley Investment Management, and look forward to working with you in the months and years ahead.
Sincerely,

John H. Gernon
President and Principal Executive Officer
October 2023
2
Morgan Stanley Institutional Fund Trust
Annual Report — September 30, 2023
Expense Example (unaudited)
Short Duration Municipal Income Portfolio
As a shareholder of the Fund, you may incur two types of costs: (1) transactional costs; and (2) ongoing costs, which may include advisory fees, administration fees, shareholder services fees and other Fund expenses. This example is intended to help you understand your ongoing costs (in dollars) of investing in the Fund and to compare these costs with the ongoing costs of investing in other mutual funds.
This example is based on an investment of $1,000 invested at the beginning of the six-month period ended September 30, 2023 and held for the entire six-month period.
Actual Expenses
The table below provides information about actual account values and actual expenses. You may use the information in this table, together with the amount you invested, to estimate the expenses that you paid over the period. Simply divide your account value by $1,000 (for example, an $8,600 account value divided by $1,000 = 8.6), then multiply the result by the number in the table under the heading entitled "Actual Expenses Paid During Period" to estimate the expenses you paid on your account during this period.
Hypothetical Example for Comparison Purposes
The table below provides information about hypothetical account values and hypothetical expenses based on the Fund's actual expense ratio and an assumed rate of return of 5% per year before expenses, which is not the Fund's actual return. The hypothetical account values and expenses may not be used to estimate the actual ending account balance or expenses you paid for the period. You may use this information to compare the ongoing costs of investing in the Fund and other funds. To do so, compare this 5% hypothetical example with the 5% hypothetical examples that appear in the shareholder reports of the other funds.
Please note that the expenses shown in the table are meant to highlight your ongoing costs only and do not reflect any transactional costs. Therefore, the information for each class in the table is useful in comparing ongoing costs only, and will not help you determine the relative total costs of owning different funds. In addition, if these transactional costs were included, your costs would have been higher.
| | | Beginning
Account
Value
4/1/23 | | Actual Ending
Account
Value
9/30/23 | | Hypothetical
Ending Account
Value | | Actual
Expenses
Paid
During
Period* | | Hypothetical
Expenses Paid
During Period* | | Net
Expense
Ratio
During
Period** | |
Short Duration Municipal Income Portfolio Class IR | | $ | 1,000.00 | | | $ | 1,011.10 | | | $ | 1,023.95 | | | $ | 0.85 | | | $ | 0.85 | | | | 0.17 | % | |
Short Duration Municipal Income Portfolio Institutional Class | | | 1,000.00 | | | | 1,010.60 | | | | 1,023.55 | | | | 1.25 | | | | 1.25 | | | | 0.25 | | |
Short Duration Municipal Income Portfolio Class A | | | 1,000.00 | | | | 1,010.70 | | | | 1,023.46 | | | | 1.35 | | | | 1.35 | | | | 0.27 | | |
* Expenses are calculated using each Fund Class' annualized net expense ratio (as disclosed), multiplied by the average account value over the period and multiplied by 181***/365 (to reflect the most recent one-half year period).
** Annualized.
*** Adjusted to reflect non-business days accruals.
3
Morgan Stanley Institutional Fund Trust
Annual Report — September 30, 2023
Investment Overview (unaudited)
Short Duration Municipal Income Portfolio
The Fund seeks to provide current income exempt from regular federal income tax and capital preservation while maintaining liquidity.
Performance
For the fiscal year ended September 30, 2023, the Fund's Institutional Class shares had a total return based on net asset value and reinvestment of distributions per share of 2.41%, net of fees. The Fund's Institutional Class shares outperformed against the Fund's new benchmark,(i) the ICE BofA 1-3 Year U.S. Municipal Securities Index (the "Index"), which returned 2.15%, and the Short Duration Municipal Income Blended Index,(iii) which returned 1.66%, and underperformed against the prior benchmark, Bloomberg BVAL Municipal AAA Yield Curve (Callable) 3-Month Index,(ii) which returned 2.85%. Past performance is no guarantee of future results.
Factors Affecting Performance
• In the trailing 12-month period ended September 30, 2023, the municipal market has been characterized by a broadly upward interest rate movement, as the Federal Reserve (Fed) continued the battle to bring inflation down to target levels. During the majority of the 12-month period, longer-dated portions of the municipal market outperformed but came under pressure following Fed Chairman Powell's August 2023 Jackson Hole and September 2023 Federal Open Market Committee press conference speeches. During the Fund's fiscal year, the municipal yield curve inverted in the 1- to 10-year segment of the curve (meaning that yields on 1-year maturity bonds were higher than yields on 10-year maturity bonds), the first inversion of any type for the asset class. As a result of this curve inversion, the front end of the municipal market was offering very attractive yield levels. At the end of the reporting period, all eyes
were on Fed rhetoric as investors tried to interpret the future path of interest rates.
• Effective July 31, 2023, the Fund's name, portfolio managers, benchmark and principal investment strategy changed ("Fund changes"). Before that date, the Fund was known as the Ultra-Short Municipal Income Portfolio, and the former benchmark was the Bloomberg BVAL Municipal AAA Yield Curve (Callable) 3-Month Index. For the period from October 1, 2022 to July 31, 2023 (which was prior to the Fund changes effective date and therefore does not reflect the Fund changes above), the portfolio outperformed the former benchmark. As a result of ongoing uncertainty around Fed policy and continued Treasury market volatility, the portfolio maintained a high exposure to floating-rate and variable-rate securities during the period October 1, 2022 to July 31, 2023. The Fund's exposure to variable rate demand obligations, which can be sold at par and therefore are less subject to have market value fluctuations, contributed to the Fund's outperformance versus the prior benchmark in the 10-month period.
• From the period after the Fund changes, July 31, 2023, to September 30, 2023, the Fund outperformed the Index.
• The primary contributor to relative performance in the two-month period after the Fund changes was the Fund's overweight allocation to municipal floating-rate notes (FRNs) and variable rate demand notes (VRDNs), as these are defensive securities with a low duration profile. This was additive to relative performance, as rates backed up in the period from the Fund changes through the end of the reporting period. Additionally, the Fund's underweight allocation to the local general obligation (GO) sector aided relative performance
(i) Effective July 31, 2023, the Fund's name, portfolio managers, benchmark and principal investment strategy changed. Before that date, the Fund was known as the Ultra-Short Municipal Income Portfolio, and the prior benchmark was the Bloomberg BVAL Municipal AAA Yield Curve (Callable) 3-Month Index.
(ii) "Bloomberg®" and the Bloomberg Index/Indices used are service marks of Bloomberg Finance L.P. and its affiliates, and have been licensed for use for certain purposes by Morgan Stanley Investment Management (MSIM). Bloomberg is not affiliated with MSIM, does not approve, endorse, review, or recommend any product, and. does not guarantee the timeliness, accurateness, or completeness of any data or information relating to any product.
(iii) Short Duration Municipal Income Blended Index is a performance linked benchmark of the old and new benchmark of the Fund. The old benchmark represented by Bloomberg BVAL Municipal AAA Yield Curve (Callable) 3-Month Index from the Fund's inception to July 30, 2023 and the new benchmark represented by ICE BofA 1-3 Year US Municipal Securities Index for the periods thereafter.
4
Morgan Stanley Institutional Fund Trust
Annual Report — September 30, 2023
Investment Overview (unaudited) (cont'd)
Short Duration Municipal Income Portfolio
as this sector trailed the broader Index during the two-month period, and bonds chosen for the Fund in this sector outpaced similar holdings in the Index. Finally, the Fund's overweight exposure to A rated municipals added to relative performance as this market segment outperformed the broader Index during the two-month period, and securities chosen for the Fund in this market segment outpaced similar Index holdings.
• The primary detractor from relative performance in the two-month period after the Fund changes was the Fund's overweight allocation to 3- to 5-year maturity bonds, as this market segment has a longer duration profile versus shorter-dated segments of the Index, which detracted during the two-month period as rates moved higher. Additionally, the Fund's security selection in the transportation sector weighed on relative performance in the two-month period, as bonds selected for the Fund in this sector lagged similar holdings in the Index.
Management Strategies
• In terms of strategy positioning, as of the end of the reporting period, the Fund has remained overweight to short-dated segments of the investable universe. In particular, the Fund was positioned with overweight exposure to defensive strategies, including FRNs and VRDNs. We believed this curve exposure could help buffer the portfolio against further upward rate movements, while also taking advantage of the outsized yield on the front end of the municipal yield curve. At period end, the Fund was looking to extend duration over time, if the picture around interest rate movement becomes clearer.
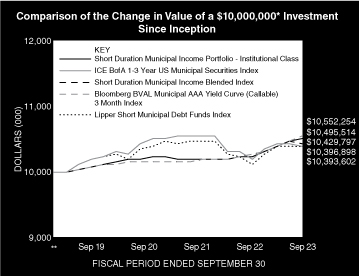
* Minimum Investment
** Commenced operations on December 19, 2018
5
Morgan Stanley Institutional Fund Trust
Annual Report — September 30, 2023
Investment Overview (unaudited) (cont'd)
Short Duration Municipal Income Portfolio
Performance Compared to the ICE BofA 1-3 Year US Municipal Securities Index(1), Short Duration Municipal Income Blended Index(2), Bloomberg BVAL Municipal AAA Yield Curve (Callable) 3-Month Index(3) and the Lipper Short Municipal Debt Funds Index(4)
| | | Period Ended September 30, 2023
Total Returns(5) | |
| | | | | Average Annual | |
| | | One
Year | | Five
Years | | Ten
Years | | Since
Inception(7) | |
Fund — Class IR Shares
w/o sales charges(6) | | | 2.51 | % | | | — | | | | — | | | | 1.10 | % | |
Fund — Institutional Class Shares
w/o sales charges(6) | | | 2.41 | | | | — | | | | — | | | | 1.02 | | |
Fund — Class A Shares
w/o sales charges(6) | | | 2.41 | | | | — | | | | — | | | | 0.98 | | |
ICE BofA 1-3 Year US Municipal
Securities Index | | | 2.15 | | | | — | | | | — | | | | 0.82 | | |
Short Duration Muni Income
Blended Index | | | 1.66 | | | | — | | | | — | | | | 0.88 | | |
Bloomberg BVAL Municipal AAA
Yield Curve (Callable) 3 Month Index | | | 2.85 | | | | — | | | | — | | | | 1.13 | | |
Lipper Short Municipal Debt
Funds Index | | | 2.57 | | | | — | | | | — | | | | 0.81 | | |
Performance data quoted represents past performance, which is no guarantee of future results, and current performance may be lower or higher than the figures shown. Performance assumes that all dividends and distributions, if any, were reinvested. For the most recent month-end performance figures, please visit www.morganstanley.com/im. Investment returns and principal value will fluctuate so that Fund shares, when redeemed, may be worth more or less than their original cost. Total returns do not reflect the deduction of taxes that a shareholder would pay on Fund distributions or the redemption of Fund shares. Performance of share classes will vary due to differences in expenses. The Fund returns are calculated based on the net asset value as of the last business day of the period.
(1) The ICE BofA (Intercontinental Exchange Bank of America) 1-3 Year US Municipal Securities Index is a subset of ICE BofA US Municipal Securities Index including all securities with a remaining term to final maturity less than 3 years. ICE BofA US Municipal Securities Index tracks the performance of US dollar denominated investment grade taxexempt debt publicly issued by US states and territories, and their political subdivisions, in the US domestic market. Qualifying securities must have at least one year remaining term to final maturity, at least 18 months to final maturity at the time of issuance, a fixed coupon schedule and an investment grade rating (based on an average of Moody's, S&P and Fitch). It is not possible to invest directly in an index. Effective July 31, 2023, the Fund changed its primary benchmark to the ICE BofA 1-3 Year US Municipal Securities Index because the Adviser believes it is a more appropriate benchmark for the Fund.
(2) The Short Duration Municipal Income Blended Index is a performance linked benchmark of the old and new benchmark of the Fund. The old benchmark represented by Bloomberg BVAL Municipal AAA Yield Curve (Callable) 3-Month Index from the Fund's inception to July 30, 2023 and the new benchmark represented by ICE BofA 1-3 Year US Municipal Securities Index for the periods thereafter. The Index is unmanaged and its returns do not include any sales charges or fees. Such costs would lower performance. It is not possible to invest directly in an index.
(3) Bloomberg BVAL Municipal AAA Yield Curve (Callable) 3-Month Index is Bloomberg's evaluated pricing service, BVAL, provides a municipal "AAA" 5% coupon benchmark yield curve that is the baseline curve for BVAL tax-exempt municipals. It is populated with high quality U.S. municipal bonds with an average rating of "AAA" from Moody's and S&P. The yield curve is built using nonparametric fit of market data obtained from the Municipal Securities Rulemaking Board, new issues and other proprietary contributed prices. The benchmark is updated hourly and utilizes eligible "AAA" traded observations throughout the day and accessible on through Bloomberg services. It is not possible to invest directly in an index
(4) The Lipper Short Municipal Debt Funds Index is an equally weighted performance index of the largest qualifying funds (based on net assets) in the Lipper Short Municipal Debt Funds classification. The Index, which is adjusted for capital gains distributions and income dividends, is unmanaged and should not be considered an investment. There are currently 30 funds represented in this Index. As of the date of this report, the Fund was in the Lipper Short Municipal Debt Funds classification.
(5) Total returns for the Fund reflect expenses waived and/or reimbursed, if applicable, by the Adviser. Without such waivers and/or reimbursements, total returns would have been lower.
(6) Commenced operations on December 19, 2018.
(7) For comparative purposes, average annual since inception returns listed for the Indexes refer to the inception date of the Fund, not the inception of the Indexes.
6
Morgan Stanley Institutional Fund Trust
Annual Report — September 30, 2023
Portfolio of Investments
Short Duration Municipal Income Portfolio
| | | Face
Amount
(000) | | Value
(000) | |
Fixed Income Securities (98.7%) | |
Municipal Bonds (92.0%) | |
Alabama (1.3%) | |
Black Belt Energy Gas District, Gas Project
Revenue Refunding Bonds 2023, | |
Series D-1 | |
5.50%, 6/1/49 (a) | | $ | 2,450 | | | $ | 2,500 | | |
Arizona (2.6%) | |
Arizona Health Facilities Authority
Revenue Bonds (Banner Health), | |
Series 2014A | |
4.00%, 1/1/44 | | | 2,855 | | | | 2,855 | | |
Industrial Development Authority of The
City of Chandler,
Industrial Development Revenue Bonds, | |
Series 2007 (AMT) | |
4.10%, 12/1/37 (a) | | | 2,000 | | | | 1,958 | | |
| | | | 4,813 | | |
California (2.3%) | |
State of California General Obligation Bonds
Various Purpose General Obligation
Refunding Bonds, | |
5.00%, 9/1/27 | | | 2,500 | | | | 2,640 | | |
State Public Works Board of The State of
California Lease Revenue Refunding
Bonds 2023, | |
Series C | |
5.00%, 9/1/27 (b) | | | 1,600 | | | | 1,683 | | |
| | | | 4,323 | | |
Colorado (2.2%) | |
Colorado Health Facilities Authority Hospital
Revenue Bonds, | |
Series 2023A-1 | |
5.00%, 11/15/58 (a) | | | 2,000 | | | | 2,102 | | |
State of Colorado Building Excellent Schools
Today Certificates of Participation Tax-Exempt, | |
Series 2013I | |
5.00%, 3/15/36 | | | 2,000 | | | | 2,010 | | |
| | | | 4,112 | | |
Connecticut (1.0%) | |
State of Connecticut Health And Educational
Facilities Authority Revenue Bonds,
Quinnipiac University Issue, | |
Series L | |
5.00%, 7/1/24 | | | 1,900 | | | | 1,913 | | |
District of Columbia (1.0%) | |
Metropolitan Washington Airports Authority,
Airport System, | |
Series 2011A-1 | |
3.95%, 10/1/39 (a) | | | 1,800 | | | | 1,800 | | |
Florida (8.0%) | |
Broward County,
Airport System Revenue Bonds, | |
Series 2015A | |
5.00%, 10/1/29 | | | 2,000 | | | | 2,016 | | |
| | | Face
Amount
(000) | | Value
(000) | |
Broward County,
Industrial Development Revenue,
Florida Power & Light Company, | |
Series 2018 B | |
4.20%, 12/1/48 (a) | | $ | 10,500 | | | $ | 10,500 | | |
School District of Miami-Dade County,
Tax Anticipation Notes, | |
Series 2023 | |
5.00%, 6/18/24 | | | 2,500 | | | | 2,519 | | |
| | | | 15,035 | | |
Georgia (4.0%) | |
City of Atlanta Airport General Revenue
Refunding Bonds, | |
Series 2014C | |
5.00%, 1/1/26 | | | 2,500 | | | | 2,504 | | |
Colquitt County School District,
General Obligation Bonds, | |
Series 2023 | |
5.00%, 12/1/24 | | | 1,000 | | | | 1,013 | | |
Main Street Natural Gas, Inc.,
Gas Supply Revenue Bonds, | |
Series 2021A | |
4.00%, 7/1/52 (a) | | | 2,500 | | | | 2,435 | | |
Series 2023D | |
5.00%, 12/1/54 (a) | | | 1,500 | | | | 1,487 | | |
| | | | 7,439 | | |
Hawaii (0.7%) | |
City And County of Honolulu General
Obligation Bonds, | |
Series 2023D | |
5.00%, 3/1/26 | | | 1,250 | | | | 1,288 | | |
Illinois (4.8%) | |
Board of Education of The City of Chicago
Unlimited Tax General Obligation
Refunding Bonds, | |
Series 2018C | |
5.00%, 12/1/23 | | | 1,000 | | | | 1,001 | | |
Illinois Finance Authority Revenue Bonds, | |
Series 2020B-2 | |
5.00%, 5/15/50 (a) | | | 2,500 | | | | 2,539 | | |
Illinois Finance Authority Water Facilities
Refunding Revenue Bonds, | |
Series 2020 | |
3.88%, 5/1/40 (a) | | | 1,500 | | | | 1,459 | | |
Sales Tax Securitization Corporation Second
Lien Sales Tax Securitization Bonds, | |
Series 2020A | |
5.00%, 1/1/27 | | | 2,290 | | | | 2,357 | | |
State of Illinois Build Illinois Bonds
(Sales Tax Revenue Bonds), | |
Series A | |
4.00%, 6/15/25 | | | 1,750 | | | | 1,752 | | |
| | | | 9,108 | | |
The accompanying notes are an integral part of the financial statements.
7
Morgan Stanley Institutional Fund Trust
Annual Report — September 30, 2023
Portfolio of Investments (cont'd)
Short Duration Municipal Income Portfolio
| | | Face
Amount
(000) | | Value
(000) | |
Indiana (1.9%) | |
City of Whiting,
Environmental Facilities Refunding
Revenue Bonds, | |
Series 2019A | |
5.00%, 12/1/44 (a) | | $ | 2,500 | | | $ | 2,540 | | |
Indiana Housing And Community Development
Authority Multifamily Housing Revenue Bonds, | |
Series 2023 | |
4.10%, 9/1/28 (a) | | | 1,000 | | | | 991 | | |
| | | | 3,531 | | |
Iowa (1.9%) | |
Iowa Finance Authority,
Solid Waste Facilities Revenue Bonds
(Midamerican Energy Company Project), | |
Series 2016B | |
4.30%, 12/1/46 (a) | | | 3,500 | | | | 3,500 | | |
Kentucky (9.7%) | |
Commonwealth of Kentucky State Property
And Buildings Commission Revenue
Refunding Bonds, | |
Series B | |
5.00%, 11/1/26 | | | 2,500 | | | | 2,576 | | |
County of Meade,
Industrial Building Revenue Bonds
(Nucor Steel Brandenburg Project)
(Green Bonds), | |
Series 2021B-1 | |
4.95%, 8/1/61 (a) | | | 3,000 | | | | 3,000 | | |
Daviess County,
Solid Waste Disposal Facilities Revenue, | |
Series 1993-A | |
4.00%, 12/1/23 (a) | | | 5,000 | | | | 5,000 | | |
Kentucky Economic Development
Finance Authority,
Catholic Health Initiatives, | |
Series 2004 C | |
4.80%, 5/1/34 (a) | | | 6,000 | | | | 6,000 | | |
University of Kentucky,
General Receipts Refunding Bonds, | |
Series D | |
3.00%, 10/1/25 | | | 1,600 | | | | 1,564 | | |
| | | | 18,140 | | |
Louisiana (2.7%) | |
Parish of St. James,
State of Louisiana Revenue Bonds,
Nucor Steel Louisiana LLC Project,
Gulf Opportunity Zone Bonds, | |
Series 2010B-1 | |
4.30%, 11/1/40 (a) | | | 5,000 | | | | 5,000 | | |
Massachusetts (1.1%) | |
Boston Water And Sewer Commission,
General Revenue And Refunding Bonds 2015, | |
Series A | |
4.00%, 11/1/27 | | | 2,000 | | | | 2,007 | | |
| | | Face
Amount
(000) | | Value
(000) | |
Michigan (3.3%) | |
Board of Control of Saginaw Valley,
State University General Revenue And
Refunding Bonds, | |
Series 2016A | |
5.00%, 7/1/30 | | $ | 1,750 | | | $ | 1,780 | | |
Michigan Finance Authority,
Hospital Revenue Bonds Trinity Health
Credit Group, | |
Series 2015 | |
4.83%, 12/1/39 (a) | | | 2,000 | | | | 2,002 | | |
Wayne County Airport Authority Airport
Revenue Bonds, | |
Series 2015F | |
5.00%, 12/1/31 | | | 2,500 | | | | 2,513 | | |
| | | | 6,295 | | |
Minnesota (0.8%) | |
Minnesota Rural Water Finance Authority
Public Projects Construction Notes, | |
Series 2023 | |
4.38%, 4/1/25 (b) | | | 1,500 | | | | 1,500 | | |
Missouri (2.0%) | |
Health And Educational Facilities Authority
of The State of Missouri Health Facilities
Revenue Bonds, | |
Series 2016 | |
5.00%, 11/15/28 | | | 1,300 | | | | 1,325 | | |
Series 2021A | |
4.00%, 7/1/26 | | | 1,100 | | | | 1,102 | | |
Missouri Joint Municipal Electric Utility
Commission, | |
Series 2023 | |
5.00%, 1/1/26 (b) | | | 1,345 | | | | 1,378 | | |
| | | | 3,805 | | |
Nebraska (0.8%) | |
Washington County,
Nebraska Industrial Development
Revenue Bonds, | |
Series 2010 B | |
4.01%, 12/1/40 (a) | | | 1,500 | | | | 1,500 | | |
New Jersey (0.9%) | |
New Jersey Economic Development Authority
Water Facilities Refunding Revenue Bonds, | |
Series 2020D | |
1.10%, 11/1/29 (a) | | | 2,000 | | | | 1,651 | | |
New Mexico (1.3%) | |
New Mexico Mortgage Finance Authority
Multifamily Housing Revenue Bonds, | |
Series 2023 | |
5.00%, 2/1/42 (a) | | | 325 | | | | 327 | | |
State of New Mexico,
Capital Projects General Obligation Bonds, | |
Series 2021 | |
5.00%, 3/1/25 | | | 2,000 | | | | 2,033 | | |
| | | | 2,360 | | |
The accompanying notes are an integral part of the financial statements.
8
Morgan Stanley Institutional Fund Trust
Annual Report — September 30, 2023
Portfolio of Investments (cont'd)
Short Duration Municipal Income Portfolio
| | | Face
Amount
(000) | | Value
(000) | |
New York (13.0%) | |
City of New York General Obligation Bonds, | |
Series B | |
4.80%, 10/1/46 (a) | | $ | 4,170 | | | $ | 4,170 | | |
Long Island Power Authority,
Electric System General Revenue Bonds, | |
Series 2022B | |
5.00%, 9/1/52 (a) | | | 2,000 | | | | 2,065 | | |
Metropolitan Transportation Authority, | |
Series 2016A | |
5.00%, 11/15/24 | | | 1,360 | | | | 1,372 | | |
New York City Transitional Finance Authority
Future Tax Secured Revenue, | |
Series A4 | |
4.75%, 8/1/45 (a) | | | 1,000 | | | | 1,000 | | |
New York Dorm Authority Personal Income
Tax Revenue Bonds 2014A | |
Series 2014A | |
5.00%, 2/15/29 | | | 2,500 | | | | 2,507 | | |
Port Authority of New York And New Jersey
Consolidated Bonds, | |
Series 185 | |
5.00%, 9/1/28 | | | 1,000 | | | | 1,003 | | |
Series 242 | |
5.00%, 12/1/26 - 12/1/27 | | | 3,000 | | | | 3,073 | | |
RBC Municipal Products Inc Trust,
Various States Certificates,
E-154 | |
4.08%, 6/1/28 (a)(c) | | | 7,800 | | | | 7,800 | | |
Tsasc, Inc.,
Tobacco Settlement Bonds,
Fiscal 2017, | |
Series A | |
5.00%, 6/1/24 | | | 1,475 | | | | 1,483 | | |
| | | | 24,473 | | |
North Carolina (0.9%) | |
University of North Carolina Hospitals
At Chapel Hill, | |
Series 2009A | |
3.85%, 2/1/24 (a) | | | 1,700 | | | | 1,700 | | |
Ohio (5.0%) | |
County of Hamilton,
Ohio Hospital Facilities Revenue Refunding
And Improvement Bonds, | |
Series B | |
4.13%, 8/15/51 (a) | | | 9,425 | | | | 9,425 | | |
Pennsylvania (4.9%) | |
Commonwealth of Pennsylvania,
General Obligation Bonds, | |
Series 2016 | |
5.00%, 9/15/24 | | | 1,775 | | | | 1,794 | | |
Pennsylvania Economic Development Financing
Authority, Solid Waste Disposal Refunding
Revenue Bonds Series 2019A (AMT), | |
Series 2019A | |
4.10%, 4/1/34 (a) | | | 2,000 | | | | 2,000 | | |
| | | Face
Amount
(000) | | Value
(000) | |
Pennsylvania Higher Educational Facilities Authority
Refunding Revenue Bonds, State System of
Higher Education, | |
Series AQ | |
5.00%, 6/15/24 | | $ | 1,440 | | | $ | 1,450 | | |
Pennsylvania Turnpike Commission Registration
Fee Revenue Refunding Bonds, Series 2023, | |
4.83%, 7/15/41 (a) | | | 2,000 | | | | 2,000 | | |
Philadelphia Redevelopment Authority City
Service Agreement Revenue Refunding Bonds, | |
Series 2015A | |
5.00%, 4/15/27 | | | 2,000 | | | | 2,028 | | |
| | | | 9,272 | | |
Puerto Rico (1.2%) | |
Commonwealth of Puerto Rico, | |
Series 2022 A-1 | |
5.63%, 7/1/27 | | | 2,198 | | | | 2,258 | | |
Texas (7.7%) | |
Cities of Dallas And Fort Worth, Texas Dallas
Fort Worth International Airport, | |
Series 2023B | |
5.00%, 11/1/25 | | | 1,250 | | | | 1,279 | | |
Series 2023C | |
5.00%, 11/1/27 | | | 1,250 | | | | 1,280 | | |
City of San Antonio,
General Improvement Bonds, | |
Series 2023 | |
5.00%, 2/1/25 | | | 1,335 | | | | 1,354 | | |
Tax Notes, | |
Series 2023 | |
5.64%, 2/1/26 | | | 1,500 | | | | 1,502 | | |
Water System Junior Lien Revenue
And Refunding Bonds, | |
Series 2023A | |
5.00%, 5/15/24 | | | 1,000 | | | | 1,007 | | |
Grand Parkway Transportation Corporation, | |
Series 2023, | |
5.00%, 10/1/52 (a) | | | 2,500 | | | | 2,602 | | |
Harris County,
Toll Road First Lien Revenue And
Refunding Bonds, | |
Series 2021 | |
5.00%, 8/15/25 | | | 2,000 | | | | 2,042 | | |
Hays Consolidated Independent School District, | |
Series 2023 | |
5.00%, 2/15/24 | | | 1,000 | | | | 1,003 | | |
Leander Independent School District,
Unlimited Tax School Building Bonds, | |
Series 2023 | |
5.00%, 2/15/24 | | | 1,455 | | | | 1,461 | | |
Texas Water Development Board State Water
Implementation Revenue Fund For Texas
Revenue Bonds, | |
Series 2023A | |
5.00%, 10/15/25 (b) | | | 1,000 | | | | 1,025 | | |
| | | | 14,555 | | |
The accompanying notes are an integral part of the financial statements.
9
Morgan Stanley Institutional Fund Trust
Annual Report — September 30, 2023
Portfolio of Investments (cont'd)
Short Duration Municipal Income Portfolio
| | | Face
Amount
(000) | | Value
(000) | |
Utah (0.1%) | |
Utah Water Finance Agency, | |
Series 2008 B | |
4.00%, 10/1/37 (a) | | $ | 270 | | | $ | 270 | | |
Virginia (1.1%) | |
Virginia Housing Development Authority
Rental Housing Bonds, | |
Series E | |
4.10%, 10/1/27 (b) | | | 2,000 | | | | 1,993 | | |
Washington (2.2%) | |
Port of Seattle, Intermediate Lien Revenue Bonds , | |
Series 2015C | |
5.00%, 4/1/31 | | | 2,000 | | | | 2,009 | | |
State of Washington,
Various Purpose General Obligation
Refunding Bonds, | |
Series R-2018D | |
5.00%, 8/1/25 | | | 2,070 | | | | 2,116 | | |
| | | | 4,125 | | |
Wisconsin (1.6%) | |
Wisconsin Health And Educational Facilities
Authority Revenue Bonds, | |
Series 2018B-3 | |
5.00%, 8/15/54 (a) | | | 3,000 | | | | 3,008 | | |
Total Municipal Bonds (Cost $173,742) | | | 172,699 | | |
Commercial Paper (6.7%) | |
San Antonio,
Electricity & Gas Revenue 3/A2, | |
3.60%, 10/26/23 | | | 10,000 | | | | 10,000 | | |
State of Oregon Department of Transportation, | |
3.62%, 12/12/23 | | | 2,500 | | | | 2,499 | | |
Total Commercial Paper (Cost $12,500) | | | 12,499 | | |
Total Fixed Income Securities (Cost $186,242) | | | 185,198 | | |
| | | Shares | | | |
Investment Company (2.2%) | |
Morgan Stanley Institutional Liquidity Funds —
Tax-Exempt Portfolio — Institutional Class —
(See Note G) (Cost $4,187) | | | 4,187,777 | | | | 4,187 | | |
Total Investments (100.9%) (Cost $190,429) (d)(e) | | | 189,385 | | |
Liabilities in Excess of Other Assets (–0.9%) | | | (1,743 | ) | |
Net Assets (100.0%) | | $ | 187,642 | | |
(a) Floating or variable rate securities: The rates disclosed are as of September 30, 2023. For securities based on a published reference rate and spread, the reference rate and spread are indicated in the description in the Portfolio of Investments. Certain variable rate securities may not be based on a published reference rate and spread but are determined by the issuer or agent and are based on current market conditions. These securities do not indicate a reference rate and spread in their description in the Portfolio of Investments.
(b) When-issued security.
(c) 144A security — Certain conditions for public sale may exist. Unless otherwise noted, these securities are deemed to be liquid.
(d) Securities are available for collateral in connection with purchase of when-issued security.
(e) At September 30, 2023, the aggregate cost for federal income tax purposes is approximately $190,429,000. The aggregate gross unrealized appreciation is approximately $5,000 and the aggregate gross unrealized depreciation is approximately $1,049,000, resulting in net unrealized depreciation of approximately $1,044,000.
AMT Alternative Minimum Tax.
Portfolio Composition
Classification | | Percentage of
Total Investments | |
Fixed Income Securities | | | 97.8 | % | |
Other* | | | 2.2 | | |
Total Investments | | | 100.0 | % | |
* Industries and/or investment types representing less than 5% of total investments.
The accompanying notes are an integral part of the financial statements.
10
Morgan Stanley Institutional Fund Trust
Annual Report — September 30, 2023
Short Duration Municipal Income Portfolio
Statement of Assets and Liabilities | | September 30, 2023
(000) | |
Assets: | |
Investments in Securities of Unaffiliated Issuers, at Value (Cost $186,242) | | $ | 185,198 | | |
Investment in Security of Affiliated Issuer, at Value (Cost $4,187) | | | 4,187 | | |
Total Investments in Securities, at Value (Cost $190,429) | | | 189,385 | | |
Receivable for Investments Sold | | | 11,941 | | |
Interest Receivable | | | 1,321 | | |
Due from Adviser | | | 29 | | |
Receivable from Affiliate | | | 6 | | |
Receivable for Fund Shares Sold | | | 5 | | |
Other Assets | | | 35 | | |
Total Assets | | | 202,722 | | |
Liabilities: | |
Payable for Investments Purchased | | | 7,584 | | |
Payable to Bank | | | 7,394 | | |
Payable for Professional Fees | | | 47 | | |
Payable for Administration Fees | | | 13 | | |
Payable for Fund Shares Redeemed | | | 10 | | |
Payable for Shareholder Services Fees — Institutional Class | | | — | @ | |
Payable for Shareholder Services Fees — Class A | | | 8 | | |
Payable for Custodian Fees | | | 2 | | |
Payable for Transfer Agency Fees — Class IR | | | — | @ | |
Payable for Transfer Agency Fees — Institutional Class | | | — | @ | |
Payable for Transfer Agency Fees — Class A | | | 1 | | |
Other Liabilities | | | 21 | | |
Total Liabilities | | | 15,080 | | |
Net Assets | | $ | 187,642 | | |
Net Assets Consist of: | |
Paid-in-Capital | | $ | 188,280 | | |
Total Accumulated Loss | | | (638 | ) | |
Net Assets | | $ | 187,642 | | |
CLASS IR: | |
Net Assets | | $ | 95,009 | | |
| Shares Outstanding (unlimited number of shares authorized, no par value) (not in 000's) | | | 9,526,849 | | |
Net Asset Value, Offering and Redemption Price Per Share | | $ | 9.97 | | |
INSTITUTIONAL CLASS: | |
Net Assets | | $ | 50 | | |
| Shares Outstanding (unlimited number of shares authorized, no par value) (not in 000's) | | | 5,024 | | |
Net Asset Value, Offering and Redemption Price Per Share | | $ | 9.97 | | |
CLASS A: | |
Net Assets | | $ | 92,583 | | |
| Shares Outstanding (unlimited number of shares authorized, no par value) (not in 000's) | | | 9,284,135 | | |
Net Asset Value, Offering and Redemption Price Per Share | | $ | 9.97 | | |
@ Amount is less than $500.
The accompanying notes are an integral part of the financial statements.
11
Morgan Stanley Institutional Fund Trust
Annual Report — September 30, 2023
Short Duration Municipal Income Portfolio
Statement of Operations | | Year Ended
September 30, 2023
(000) | |
Investment Income: | |
Interest from Securities of Unaffiliated Issuers | | $ | 5,889 | | |
Interest from Securities of Affiliated Issuers (Note G) | | | 14 | | |
Total Investment Income | | | 5,903 | | |
Expenses: | |
Advisory Fees (Note B) | | | 362 | | |
Shareholder Services Fees — Institutional Class (Note D) | | | 9 | | |
Shareholder Services Fees — Class A (Note D) | | | 168 | | |
Professional Fees | | | 161 | | |
Administration Fees (Note C) | | | 145 | | |
Registration Fees | | | 51 | | |
Shareholder Reporting Fees | | | 15 | | |
Custodian Fees (Note F) | | | 10 | | |
Trustees' Fees and Expenses | | | 9 | | |
Transfer Agency Fees — Class IR (Note E) | | | 2 | | |
Transfer Agency Fees — Institutional Class (Note E) | | | 3 | | |
Transfer Agency Fees — Class A (Note E) | | | 3 | | |
Pricing Fees | | | 3 | | |
Other Expenses | | | 24 | | |
Total Expenses | | | 965 | | |
Waiver of Advisory Fees (Note B) | | | (362 | ) | |
Expenses Reimbursed by Adviser (Note B) | | | (140 | ) | |
Reimbursement of Class Specific Expenses — Class IR (Note B) | | | (2 | ) | |
Reimbursement of Class Specific Expenses — Institutional Class (Note B) | | | (3 | ) | |
Reimbursement of Class Specific Expenses — Class A (Note B) | | | (1 | ) | |
Rebate from Morgan Stanley Affiliate (Note G) | | | (— | @) | |
Waiver of Shareholder Services Fees — Class A (Note D) | | | (84 | ) | |
Net Expenses | | | 373 | | |
Net Investment Income | | | 5,530 | | |
Change in Unrealized Appreciation (Depreciation): | |
Investments | | | (1,027 | ) | |
Net Realized Loss and Change in Unrealized Appreciation (Depreciation) | | | (1,027 | ) | |
Net Increase in Net Assets Resulting from Operations | | $ | 4,503 | | |
@ Amount is less than $500.
The accompanying notes are an integral part of the financial statements.
12
Morgan Stanley Institutional Fund Trust
Annual Report — September 30, 2023
Short Duration Municipal Income Portfolio
Statements of Changes in Net Assets | | Year Ended
September 30, 2023
(000) | | Year Ended
September 30, 2022
(000) | |
Increase (Decrease) in Net Assets: | |
Operations: | |
Net Investment Income | | $ | 5,530 | | | $ | 751 | | |
Net Change in Unrealized Appreciation (Depreciation) | | | (1,027 | ) | | | (18 | ) | |
Net Increase in Net Assets Resulting from Operations | | | 4,503 | | | | 733 | | |
Dividends and Distributions to Shareholders: | |
Class IR | | | (2,444 | ) | | | (400 | ) | |
Institutional Class | | | (263 | ) | | | (48 | ) | |
Class A | | | (2,281 | ) | | | (377 | ) | |
Total Dividends and Distributions to Shareholders | | | (4,988 | ) | | | (825 | ) | |
Capital Share Transactions:(1) | |
Class IR: | |
Subscribed | | | 83,383 | | | | 53,684 | | |
Distributions Reinvested | | | 2,452 | | | | 390 | | |
Redeemed | | | (61,875 | ) | | | (49,112 | ) | |
Institutional Class: | |
Subscribed | | | 10,050 | | | | 10,000 | | |
Distributions Reinvested | | | 264 | | | | 47 | | |
Redeemed | | | (20,740 | ) | | | (4,860 | ) | |
Class A: | |
Subscribed | | | 78,313 | | | | 22,904 | | |
Distributions Reinvested | | | 2,288 | | | | 369 | | |
Redeemed | | | (53,773 | ) | | | (47,416 | ) | |
Net Increase (Decrease) in Net Assets Resulting from Capital Share Transactions | | | 40,362 | | | | (13,994 | ) | |
Total Increase (Decrease) in Net Assets | | | 39,877 | | | | (14,086 | ) | |
Net Assets: | |
Beginning of Period | | | 147,765 | | | | 161,851 | | |
End of Period | | $ | 187,642 | | | $ | 147,765 | | |
(1) Capital Share Transactions: | |
Class IR: | |
Shares Subscribed | | | 8,338 | | | | 5,368 | | |
Shares Issued on Distributions Reinvested | | | 245 | | | | 39 | | |
Shares Redeemed | | | (6,187 | ) | | | (4,911 | ) | |
Net Increase in Class IR Shares Outstanding | | | 2,396 | | | | 496 | | |
Institutional Class: | |
Shares Subscribed | | | 1,005 | | | | 1,000 | | |
Shares Issued on Distributions Reinvested | | | 26 | | | | 5 | | |
Shares Redeemed | | | (2,074 | ) | | | (485 | ) | |
Net Increase (Decrease) in Institutional Class Shares Outstanding | | | (1,043 | ) | | | 520 | | |
Class A: | |
Shares Subscribed | | | 7,831 | | | | 2,290 | | |
Shares Issued on Distributions Reinvested | | | 229 | | | | 37 | | |
Shares Redeemed | | | (5,377 | ) | | | (4,742 | ) | |
Net Increase (Decrease) in Class A Shares Outstanding | | | 2,683 | | | | (2,415 | ) | |
The accompanying notes are an integral part of the financial statements.
13
Morgan Stanley Institutional Fund Trust
Annual Report — September 30, 2023
Financial Highlights
Short Duration Municipal Income Portfolio
| | | Class IR | |
| | | Year Ended September 30, | | Period from
December 19, 2018(1) to | |
Selected Per Share Data and Ratios | | 2023 | | 2022 | | 2021 | | 2020 | | September 30, 2019 | |
Net Asset Value, Beginning of Period | | $ | 10.00 | | | $ | 10.00 | | | $ | 10.00 | | | $ | 10.00 | | | $ | 10.00 | | |
Income (Loss) from Investment Operations: | |
Net Investment Income(2) | | | 0.31 | | | | 0.06 | | | | 0.01 | | | | 0.09 | | | | 0.12 | | |
Net Realized and Unrealized Gain (Loss) | | | (0.06 | ) | | | 0.00 | (3) | | | 0.00 | (3) | | | 0.00 | (3) | | | 0.00 | (3) | |
Total from Investment Operations | | | 0.25 | | | | 0.06 | | | | 0.01 | | | | 0.09 | | | | 0.12 | | |
Distributions from and/or in Excess of: | |
Net Investment Income | | | (0.28 | ) | | | (0.06 | ) | | | (0.01 | ) | | | (0.09 | ) | | | (0.12 | ) | |
Net Realized Gain | | | — | | | | (0.00 | )(3) | | | — | | | | — | | | | — | | |
Total Distributions | | | (0.28 | ) | | | (0.06 | ) | | | (0.01 | ) | | | (0.09 | ) | | | (0.12 | ) | |
Net Asset Value, End of Period | | $ | 9.97 | | | $ | 10.00 | | | $ | 10.00 | | | $ | 10.00 | | | $ | 10.00 | | |
Total Return(4) | | | 2.51 | % | | | 0.61 | % | | | 0.06 | % | | | 0.91 | % | | | 1.19 | %(5) | |
Ratios to Average Net Assets and Supplemental Data: | |
Net Assets, End of Period (Thousands) | | $ | 95,009 | | | $ | 71,284 | | | $ | 66,358 | | | $ | 118,335 | | | $ | 67,174 | | |
Ratio of Expenses Before Expense Limitation | | | 0.43 | % | | | 0.46 | % | | | 0.40 | % | | | 0.40 | % | | | 0.52 | %(6) | |
Ratio of Expenses After Expense Limitation | | | 0.15 | %(7) | | | 0.13 | %(7) | | | 0.13 | %(7) | | | 0.13 | %(7) | | | 0.13 | %(6)(7) | |
Ratio of Net Investment Income | | | 3.09 | %(7) | | | 0.59 | %(7) | | | 0.07 | %(7) | | | 0.78 | %(7) | | | 1.49 | %(6)(7) | |
Ratio of Rebate from Morgan Stanley Affiliates | | | 0.00 | %(8) | | | N/A | | | | N/A | | | | N/A | | | | N/A | | |
Portfolio Turnover Rate | | | N/A(9) | | | | N/A(9) | | | | N/A(9) | | | | N/A(9) | | | | N/A(9) | | |
(1) Commencement of Operations.
(2) Per share amount is based on average shares outstanding.
(3) Amount is less than $0.005 per share.
(4) Calculated based on the net asset value as of the last business day of the period.
(5) Not annualized.
(6) Annualized.
(7) The Ratio of Expenses After Expense Limitation and Ratio of Net Investment Income reflect the rebate of certain Fund expenses in connection with the investments in Morgan Stanley affiliates during the period. The effect of the rebate on the ratios is disclosed in the above table as "Ratio of Rebate from Morgan Stanley Affiliates."
(8) Amount is less than 0.005%.
(9) During the reporting period, the Fund did not hold any long-term investments and accordingly portfolio turnover is not applicable.
The accompanying notes are an integral part of the financial statements.
14
Morgan Stanley Institutional Fund Trust
Annual Report — September 30, 2023
Financial Highlights
Short Duration Municipal Income Portfolio
| | | Institutional Class | |
| | | Year Ended September 30, | | Period from
December 19, 2018(1) to | |
Selected Per Share Data and Ratios | | 2023 | | 2022 | | 2021 | | 2020 | | September 30, 2019 | |
Net Asset Value, Beginning of Period | | $ | 10.00 | | | $ | 10.01 | | | $ | 10.02 | | | $ | 10.00 | | | $ | 10.00 | | |
Income (Loss) from Investment Operations: | |
Net Investment Income(2) | | | 0.30 | | | | 0.07 | | | | 0.00 | (3) | | | 0.10 | | | | 0.11 | | |
Net Realized and Unrealized Gain (Loss) | | | (0.06 | ) | | | (0.03 | ) | | | (0.01 | ) | | | 0.00 | (3) | | | 0.00 | (3) | |
Total from Investment Operations | | | 0.24 | | | | 0.04 | | | | (0.01 | ) | | | 0.10 | | | | 0.11 | | |
Distributions from and/or in Excess of: | |
Net Investment Income | | | (0.27 | ) | | | (0.05 | ) | | | (0.00 | )(3) | | | (0.08 | ) | | | (0.11 | ) | |
Net Realized Gain | | | — | | | | (0.00 | )(3) | | | — | | | | — | | | | — | | |
Total Distributions | | | (0.27 | ) | | | (0.05 | ) | | | (0.00 | )(3) | | | (0.08 | ) | | | (0.11 | ) | |
Net Asset Value, End of Period | | $ | 9.97 | | | $ | 10.00 | | | $ | 10.01 | | | $ | 10.02 | | | $ | 10.00 | | |
Total Return(4) | | | 2.41 | % | | | 0.44 | % | | | (0.09 | )% | | | 1.01 | % | | | 1.11 | %(5) | |
Ratios to Average Net Assets and Supplemental Data: | |
Net Assets, End of Period (Thousands) | | $ | 50 | | | $ | 10,477 | | | $ | 5,292 | | | $ | 9,997 | | | $ | 40,250 | | |
Ratio of Expenses Before Expense Limitation | | | 0.54 | % | | | 0.60 | % | | | 0.53 | % | | | 0.49 | % | | | 0.62 | %(6) | |
Ratio of Expenses After Expense Limitation | | | 0.23 | %(7) | | | 0.21 | %(7) | | | 0.18 | %(7) | | | 0.23 | %(7) | | | 0.23 | %(6)(7) | |
Ratio of Net Investment Income (Loss) | | | 3.01 | %(7) | | | 0.74 | %(7) | | | (0.01 | )%(7) | | | 1.03 | %(7) | | | 1.39 | %(6)(7) | |
Ratio of Rebate from Morgan Stanley Affiliates | | | 0.00 | %(8) | | | N/A | | | | N/A | | | | N/A | | | | N/A | | |
Portfolio Turnover Rate | | | N/A(9) | | | | N/A(9) | | | | N/A(9) | | | | N/A(9) | | | | N/A(9) | | |
(1) Commencement of Operations.
(2) Per share amount is based on average shares outstanding.
(3) Amount is less than $0.005 per share.
(4) Calculated based on the net asset value as of the last business day of the period.
(5) Not annualized.
(6) Annualized.
(7) The Ratio of Expenses After Expense Limitation and Ratio of Net Investment Income (Loss) reflect the rebate of certain Fund expenses in connection with the investments in Morgan Stanley affiliates during the period. The effect of the rebate on the ratios is disclosed in the above table as "Ratio of Rebate from Morgan Stanley Affiliates."
(8) Amount is less than 0.005%.
(9) During the reporting period, the Fund did not hold any long-term investments and accordingly portfolio turnover is not applicable.
The accompanying notes are an integral part of the financial statements.
15
Morgan Stanley Institutional Fund Trust
Annual Report — September 30, 2023
Financial Highlights
Short Duration Municipal Income Portfolio
| | | Class A | |
| | | Year Ended September 30, | | Period from
December 19, 2018(1) to | |
Selected Per Share Data and Ratios | | 2023 | | 2022 | | 2021 | | 2020 | | September 30, 2019 | |
Net Asset Value, Beginning of Period | | $ | 10.00 | | | $ | 10.00 | | | $ | 10.00 | | | $ | 10.00 | | | $ | 10.00 | | |
Income (Loss) from Investment Operations: | |
Net Investment Income(2) | | | 0.30 | | | | 0.04 | | | | 0.00 | (3) | | | 0.07 | | | | 0.10 | | |
Net Realized and Unrealized Gain (Loss) | | | (0.06 | ) | | | 0.01 | | | | 0.00 | (3) | | | 0.00 | (3) | | | 0.00 | (3) | |
Total from Investment Operations | | | 0.24 | | | | 0.05 | | | | 0.00 | (3) | | | 0.07 | | | | 0.10 | | |
Distributions from and/or in Excess of: | |
Net Investment Income | | | (0.27 | ) | | | (0.05 | ) | | | (0.00 | )(3) | | | (0.07 | ) | | | (0.10 | ) | |
Net Realized Gain | | | — | | | | (0.00 | )(3) | | | — | | | | — | | | | — | | |
Total Distributions | | | (0.27 | ) | | | (0.05 | ) | | | (0.00 | )(3) | | | (0.07 | ) | | | (0.10 | ) | |
Net Asset Value, End of Period | | $ | 9.97 | | | $ | 10.00 | | | $ | 10.00 | | | $ | 10.00 | | | $ | 10.00 | | |
Total Return(4) | | | 2.41 | % | | | 0.53 | % | | | 0.01 | % | | | 0.73 | % | | | 1.04 | %(5) | |
Ratios to Average Net Assets and Supplemental Data: | |
Net Assets, End of Period (Thousands) | | $ | 92,583 | | | $ | 66,004 | | | $ | 90,201 | | | $ | 185,866 | | | $ | 132,882 | | |
Ratio of Expenses Before Expense Limitation | | | 0.63 | % | | | 0.66 | % | | | 0.60 | % | | | 0.59 | % | | | 0.72 | %(6) | |
Ratio of Expenses After Expense Limitation | | | 0.26 | %(7) | | | 0.21 | %(7) | | | 0.19 | %(7) | | | 0.32 | %(7) | | | 0.33 | %(6)(7) | |
Ratio of Net Investment Income (Loss) | | | 2.98 | %(7) | | | 0.44 | %(7) | | | (0.02 | )%(7) | | | 0.68 | %(7) | | | 1.30 | %(6)(7) | |
Ratio of Rebate from Morgan Stanley Affiliates | | | 0.00 | %(8) | | | N/A | | | | N/A | | | | N/A | | | | N/A | | |
Portfolio Turnover Rate | | | N/A(9) | | | | N/A(9) | | | | N/A(9) | | | | N/A(9) | | | | N/A(9) | | |
(1) Commencement of Operations.
(2) Per share amount is based on average shares outstanding.
(3) Amount is less than $0.005 per share.
(4) Calculated based on the net asset value as of the last business day of the period.
(5) Not annualized.
(6) Annualized.
(7) The Ratio of Expenses After Expense Limitation and Ratio of Net Investment Income (Loss) reflect the rebate of certain Fund expenses in connection with the investments in Morgan Stanley affiliates during the period. The effect of the rebate on the ratios is disclosed in the above table as "Ratio of Rebate from Morgan Stanley Affiliates."
(8) Amount is less than 0.005%.
(9) During the reporting period, the Fund did not hold any long-term investments and accordingly portfolio turnover is not applicable.
The accompanying notes are an integral part of the financial statements.
16
Morgan Stanley Institutional Fund Trust
Annual Report — September 30, 2023
Notes to Financial Statements
Morgan Stanley Institutional Fund Trust ("Trust") is registered under the Investment Company Act of 1940, as amended (the "Act"), as an open-end management investment company. The Trust is comprised of nine separate, active funds (individually referred to as a "Fund," collectively as the "Funds"). The Trust applies investment company accounting and reporting guidance Accounting Standards Codification ("ASC") Topic 946. All Funds are considered diversified for purposes of the Act.
The accompanying financial statements relate to the Short Duration Municipal Income Portfolio (name changed on July 31, 2023, formerly Ultra-Short Municipal Income Portfolio). The Fund seeks current income exempt from federal income tax and capital preservation while maintaining liquidity. The Fund offers three classes of shares — Class IR, Institutional Class and Class A.
A. Significant Accounting Policies: The following significant accounting policies are in conformity with U.S. generally accepted accounting principles ("GAAP"). Such policies are consistently followed by the Trust in the preparation of its financial statements. GAAP may require management to make estimates and assumptions that affect the reported amounts and disclosures in the financial statements. Actual results may differ from those estimates.
1. Security Valuation: (1) Fixed income securities may be valued by an outside pricing service/vendor approved by the Trust's Board of Trustees (the "Trustees"). The pricing service/vendor may employ a pricing model that takes into account, among other things, bids, yield spreads and/or other market data and specific security characteristics. If Morgan Stanley Investment Management Inc. (the "Adviser") a wholly-owned subsidiary of Morgan Stanley, determines that the price provided by the outside pricing service/vendor does not reflect the security's fair value or is unable to provide a price, prices from brokers/dealers may also be utilized. In these circumstances, the value of the security will be the mean of bid and asked prices obtained from reputable brokers/dealers; (2) when market quotations are not readily available, as defined by Rule 2a-5 under the Act, including circumstances under which the Adviser determines that the closing price, last sale price or the mean between the last reported bid and asked prices are not reflective of a security's market value, portfolio securities are valued at their fair value as determined in good faith under procedures approved by and under the general supervision of the Trustees. Occasionally, developments
affecting the closing prices of securities and other assets may occur between the times at which valuations of such securities are determined (that is, close of the foreign market on which the securities trade) and the close of business of the New York Stock Exchange ("NYSE"). If developments occur during such periods that are expected to materially affect the value of such securities, such valuations may be adjusted to reflect the estimated fair value of such securities as of the close of the NYSE, as determined in good faith by the Trustees or by the Adviser using a pricing service and/or procedures approved by the Trustees; and (3) investments in mutual funds, including the Morgan Stanley Institutional Liquidity Funds, are valued at the net asset value ("NAV") as of the close of each business day.
In connection with Rule 2a-5 of the Act, the Trustees have designated the Trust's Adviser as its valuation designee. The valuation designee has responsibility for determining fair value and to make the actual calculations pursuant to the fair valuation methodologies previously approved by the Trustees. Under procedures approved by the Trustees, the Trust's Adviser, as valuation designee, has formed a Valuation Committee whose members are approved by the Trustees. The Valuation Committee provides administration and oversight of the Trust's valuation policies and procedures, which are reviewed at least annually by the Trustees. These procedures allow the Trust to utilize independent pricing services, quotations from securities and financial instrument dealers and other market sources to determine fair value.
2. Fair Value Measurement: Financial Accounting Standards Board ("FASB") ASC 820, "Fair Value Measurement" ("ASC 820"), defines fair value as the price that would be received to sell an asset or pay to transfer a liability in an orderly transaction between market participants at the measurement date. ASC 820 establishes a three-tier hierarchy to distinguish between (1) inputs that reflect the assumptions market participants would use in valuing an asset or liability developed based on market data obtained from sources independent of the reporting entity (observable inputs) and (2) inputs that reflect the reporting entity's own assumptions about the assumptions market participants would use in valuing an asset or liability developed based on the best information available in the circumstances (unobservable inputs) and to establish classification of fair value measurements for disclosure purposes. Various inputs are used in determining the value of
17
Morgan Stanley Institutional Fund Trust
Annual Report — September 30, 2023
Notes to Financial Statements (cont'd)
the Fund's investments. The inputs are summarized in the three broad levels listed below:
• Level 1 – unadjusted quoted prices in active markets for identical investments
• Level 2 – other significant observable inputs (including quoted prices for similar investments, interest rates, prepayment speeds, credit risk, etc.)
• Level 3 – significant unobservable inputs including the Fund's own assumptions in determining the fair value of investments. Factors considered in making this determination may include, but are not limited to, information obtained by contacting the issuer, analysts, or the appropriate stock exchange (for exchange-traded securities), analysis of the issuer's financial statements or other available documents and, if necessary, available information concerning other securities in similar circumstances.
The inputs or methodology used for valuing securities are not necessarily an indication of the risk associated with investing in those securities and the determination of the significance of a particular input to the fair value measurement in its entirety requires judgment and considers factors specific to each security.
The following is a summary of the inputs used to value the Fund's investments as of September 30, 2023:
Investment Type | | Level 1
Unadjusted
quoted
prices
(000) | | Level 2
Other
significant
observable
inputs
(000) | | Level 3
Significant
unobservable
inputs
(000) | | Total
(000) | |
Assets: | |
Municipal Bonds | | $ | — | | | $ | 172,699 | | | $ | — | | | $ | 172,699 | | |
Commercial Paper | | | — | | | | 12,499 | | | | — | | | | 12,499 | | |
Total Fixed Income
Securities | | | — | | | | 185,198 | | | | — | | | | 185,198 | | |
Short-Term Investment | |
Investment Company | | | 4,187 | | | | — | | | | — | | | | 4,187 | | |
Total Assets | | $ | 4,187 | | | $ | 185,198 | | | $ | — | | | $ | 189,385 | | |
Transfers between investment levels may occur as the markets fluctuate and/or the availability of data used in an investment's valuation changes.
3. Indemnifications: The Trust enters into contracts that contain a variety of indemnification clauses. The Trust's maximum exposure under these arrangements is unknown
as this would involve future claims that may be made against the Fund that have not yet occurred.
4. Dividends and Distributions to Shareholders: Dividends and distributions to shareholders are recorded on the close of each business day. Dividends from net investment income, if any, are declared and paid monthly. Net realized capital gains, if any, are distributed at least annually.
5. Security Transactions, Income and Expenses: Security transactions are accounted for on the trade date (date the order to buy or sell is executed). Realized gains and losses on the sale of investment securities are determined on the specific identified cost method. Interest income is recognized on the accrual basis (except where collection is in doubt) net of applicable withholding taxes. Discounts are accreted and premiums are amortized over the life of the respective securities. Most expenses of the Trust can be directly attributed to a particular Fund. Expenses which cannot be directly attributed are apportioned among the Funds based upon relative net assets or other appropriate methods. Income, expenses (other than class specific expenses shareholder services and transfer agency fees) and realized and unrealized gains or losses are allocated to each class of shares based upon their relative net assets.
B. Advisory Fees: The Adviser, a wholly-owned subsidiary of Morgan Stanley, provides the Fund with advisory services under the terms of an Investment Advisory Agreement, paid quarterly, at an annual rate of 0.20% of the average daily net assets of the Fund.
The Adviser has agreed to reduce its advisory fee and/or reimburse the Fund so that total annual Fund operating expenses, excluding certain investment related expenses, taxes, interest and other extraordinary expenses (including litigation), will not exceed 0.25% for Class IR shares, 0.35% for Institutional Class shares and 0.35% for Class A shares. The fee waivers and/or expense reimbursements will continue for at least one year from the date of the Fund's prospectus or until such time as the Trustees act to discontinue all or a portion of such waivers and/or reimbursements when they deem such action is appropriate. The ratios of expenses to average net assets disclosed in the Fund's Financial Highlights may be lower than the maximum expense ratios due to these additional fee waivers and/or expense reimbursements. For the year ended September 30, 2023, approximately $362,000 of advisory fees
18
Morgan Stanley Institutional Fund Trust
Annual Report — September 30, 2023
Notes to Financial Statements (cont'd)
were waived and approximately $146,000 of other expenses were reimbursed by the Adviser pursuant to this arrangement.
C. Administration Fees: The Adviser also serves as Administrator to the Trust and provides administrative services pursuant to an Administration Agreement for an annual fee, accrued daily and paid monthly, of 0.08% of the Fund's average daily net assets.
Under a Sub-Administration Agreement between the Administrator and State Street Bank and Trust Company ("State Street"), State Street provides certain administrative services to the Trust. For such services, the Administrator pays State Street a portion of the fee the Administrator receives from the Fund.
D. Shareholder Services Fees: Morgan Stanley Distribution, Inc. ("MSDI" or the "Distributor"), a wholly-owned subsidiary of the Adviser, and an indirect subsidiary of Morgan Stanley, serves as the Trust's Distributor of Fund shares pursuant to a Distribution Agreement. The Trust has adopted a Shareholder Services Plan with respect to the Institutional Class shares pursuant to Rule 12b-1 under the Act. Under the Shareholder Services Plan, the Fund pays the Distributor a shareholder services fee, accrued daily and paid monthly, at an annual rate of 0.10% of the Fund's average daily net assets attributable to the Institutional Class shares.
The Trust has adopted a Shareholder Services Plan with respect to the Class A shares pursuant to Rule 12b-1 under the Act. Under the Shareholder Services Plan, the Fund pays the Distributor a shareholder services fee, accrued daily and paid monthly, at an annual rate of 0.20% of the Fund's average daily net assets attributable to the Class A shares. The Distributor has agreed to waive the 12b-1 fees on Class A shares of the Fund to the extent it exceeds 0.10% of the average daily net assets of such shares on an annualized basis. This waiver will continue for at least one year or until such time as the Trustees act to discontinue all or a portion of such waiver when it deems such action is appropriate. For the year ended September 30, 2023, this waiver amounted to approximately $84,000.
The shareholder services fees are used to support the expenses associated with servicing and maintaining accounts. The Distributor may compensate other parties for providing distribution-related and/or shareholder support services to investors who purchase Institutional Class and Class A shares.
E. Dividend Disbursing and Transfer/Co-Transfer Agent: The Trust's dividend disbursing and transfer agent is SS&C Global Investor & Distribution Solutions, Inc. ("SS&C GIDS"). Pursuant to a Transfer Agency Agreement, the Trust
pays SS&C GIDS a fee based on the number of classes, accounts and transactions relating to the Funds of the Trust.
Morgan Stanley Services Company Inc. serves as Co-Transfer Agent and provides certain transfer agency services to the Fund with respect to certain direct transactions with the Fund.
F. Custodian Fees: State Street (the "Custodian") also serves as Custodian for the Trust in accordance with a Custodian Agreement. The Custodian holds cash, securities and other assets of the Trust as required by the Act. Custody fees are payable monthly based on assets held in custody, investment purchases and sales activity and account maintenance fees, plus reimbursement for certain out-of-pocket expenses.
G. Security Transactions and Transactions with Affiliates: The Fund invests in the Institutional Class of the Morgan Stanley Institutional Liquidity Funds — Tax Exempt Portfolio (the "Liquidity Funds"), an open-end management investment company managed by the Adviser. Advisory fees paid by the Fund are reduced by an amount equal to its pro-rata share of the advisory and administration fees paid by the Fund due to its investment in the Liquidity Funds. For the year ended September 30, 2023, advisory fees paid were reduced by less than $500 relating to the Fund's investment in the Liquidity Funds.
A summary of the Fund's transactions in shares of affiliated investments during the year ended September 30, 2023 is as follows:
Affiliated
Investment
Company | | Value
September 30,
2022
(000) | | Purchases
at Cost
(000) | | Proceeds
from Sales
(000) | | Dividend
Income
(000) | |
Liquidity Funds | | $ | — | | | $ | 42,265 | | | $ | 38,078 | | | $ | 14 | | |
Affiliated
Investment
Company (cont'd) | | Realized
Gain
(Loss)
(000) | | Change in
Unrealized
Appreciation
(Depreciation)
(000) | | Value
September 30,
2023
(000) | |
Liquidity Funds | | $ | — | | | $ | — | | | $ | 4,187 | | |
The Fund has an unfunded Deferred Compensation Plan (the "Compensation Plan"), which allows each independent Trustee to defer payment of all, or a portion, of the fees he or she receives for serving on the Board of Trustees. Each eligible Trustee generally may elect to have the deferred amounts credited with a return equal to the total return on one or more of the Morgan Stanley funds that are offered as investment options under the Compensation Plan. Appreciation/depreciation and distributions received from these investments are recorded with an offsetting increase/decrease in the deferred compensation obligation and do not affect the NAV of the Fund.
19
Morgan Stanley Institutional Fund Trust
Annual Report — September 30, 2023
Notes to Financial Statements (cont'd)
H. Federal Income Taxes: It is the Fund's intention to continue to qualify as a regulated investment company and distribute all of its taxable and tax-exempt income. Accordingly, no provision for federal income taxes is required in the financial statements.
The Fund may be subject to taxes imposed by countries in which it invests. Such taxes are generally based on income and/or capital gains earned or repatriated. Taxes are accrued based on net investment income, net realized gains and net unrealized appreciation as such income and/or gains are earned. Taxes may also be based on transactions in foreign currency and are accrued based on the value of investments denominated in such currency.
FASB ASC 740-10, "Income Taxes — Overall", sets forth a minimum threshold for financial statement recognition of the benefit of a tax position taken or expected to be taken in a tax return. Management has concluded there are no significant uncertain tax positions that would require recognition in the financial statements. If applicable, the Fund recognizes interest accrued related to unrecognized tax benefits in "Interest Expense" and penalties in "Other Expenses" in the Statement of Operations. The Fund files tax returns with the U.S. Internal Revenue Service, New York and various states. Generally, each of the tax years in the four-year period ended September 30, 2023 remains subject to examination by taxing authorities.
The tax character of distributions paid may differ from the character of distributions shown for GAAP purposes due to short-term capital gains being treated as ordinary income for tax purposes. The tax character of distributions paid during fiscal years 2023 and 2022 was as follows:
2023
Distributions
Paid From: | | 2022
Distributions
Paid From: | |
Ordinary
Income
(000) | | Tax-Exempt
Income
(000) | | Ordinary
Income
(000) | | Tax-Exempt
Income
(000) | |
| $ | 259 | | | $ | 4,729 | | | $ | 133 | | | $ | 692 | | |
The amount and character of income and gains to be distributed are determined in accordance with income tax regulations which may differ from GAAP. These book/tax differences are either considered temporary or permanent in nature.
Temporary differences are attributable to differing book and tax treatments for the timing of the recognition of gains (losses) on certain investment transactions and the timing of the deductibility of certain expenses.
The Fund had no permanent differences causing reclassifications among the components of net assets for the year ended September 30, 2023.
At September 30, 2023, the components of distributable earnings for the Fund on a tax basis were as follows:
Undistributed
Ordinary
Income
(000) | | Undistributed
Long-Term
Capital Gain
(000) | |
| $ | 525 | | | $ | — | | |
I. Credit Facility: The Trust and other Morgan Stanley funds participated in a $300,000,000 committed, unsecured revolving line of credit facility (the "Facility") with State Street. Effective April 17, 2023, the committed line amount increased to $500,000,000. This Facility is to be used for temporary emergency purposes or funding of shareholder redemption requests. The interest rate for any funds drawn will be based on the federal funds rate or overnight bank funding rate plus a spread. The Facility also has a commitment fee of 0.25% per annum based on the unused portion of the Facility, which is allocated among participating funds based on relative net assets. During the twelve months ended September 30, 2023, the Fund did not have any borrowings under the Facility.
J. Other: At September 30, 2023, the Fund had record owners of 10% or greater. Investment activities of these shareholders could have a material impact on the Fund. The aggregate percentage of such owners was 99.5%.
K. Market Risk: An investment in the Fund is based on the values of the Fund's investments, which may change due to economic and other events that affect markets generally, as well as those that affect particular regions, countries, industries, companies or governments.The risks associated with these developments may be magnified if social, political, economic and other conditions and events, (such as war, natural disasters, health emergencies (e.g., epidemics and pandemics), terrorism, conflicts, social unrest, recessions, inflation, rapid interest rate changes and supply chain disruptions), adversely interrupt the global economy and financial markets. It is difficult to predict when events affecting the U.S. or global financial markets may occur, the effects that such events may have and the duration of those effects (which may last for extended periods). These events may negatively impact broad segments of businesses and populations and have a significant and rapid negative impact on the performance of the Fund's investments, adversely affect and increase the volatility of the Fund's share price and
20
Morgan Stanley Institutional Fund Trust
Annual Report — September 30, 2023
Notes to Financial Statements (cont'd)
exacerbate pre-existing risks to the Fund. The occurrence, duration and extent of these or other types of adverse economic and market conditions and uncertainty over the long term cannot be reasonably projected or estimated at this time. The ultimate impact of public health emergencies or other adverse economic or market developments and the extent to which the associated conditions impact the Fund and its investments will also depend on other future developments, which are highly uncertain, difficult to accurately predict and subject to change at any time. The financial performance of the Fund's investments (and, in turn, the Fund's investment results) as well as their liquidity may be adversely affected because of these and similar types of factors and developments.
L. Subsequent Event: At a meeting held on September 27-28, 2023, the Trustees unanimously approved the reorganization of the Fund into an exchange-traded fund ("ETF"), which will be managed by Morgan Stanley Investment Management Inc. The Trustees, including all of the Trustees who are not "interested persons" (as defined in the Investment Company Act of 1940, as amended) of the Fund, determined that participation in the reorganization is in the best interests of the Fund and the interests of existing shareholders of the Fund will not be diluted as a result of the reorganization. Subject to shareholder approval, the Fund will be reorganized into an ETF through the reorganization of the Fund into a newly-created ETF — Eaton Vance Short Duration Municipal Income ETF, which is a series of Morgan Stanley ETF Trust. If approved by shareholders, the reorganization is anticipated to occur (after the close of trading) on or about March 22, 2024 (the "Closing Date").
21
Morgan Stanley Institutional Fund Trust
Annual Report — September 30, 2023
Report of Independent Registered Public Accounting Firm
To the Shareholders and Board of Trustees of
Morgan Stanley Institutional Fund Trust —
Short Duration Municipal Income Portfolio
Opinion on the Financial Statements
We have audited the accompanying statement of assets and liabilities of Short Duration Municipal Income Portfolio (formerly Ultra-Short Municipal Income Portfolio) (the "Fund") (one of the funds constituting Morgan Stanley Institutional Fund Trust (the "Trust")), including the portfolio of investments, as of September 30, 2023, and the related statement of operations for the year then ended, the statements of changes in net assets for each of the three years in the period then ended, the financial highlights for each of the four years then ended and the period from December 19, 2018 (commencement of operations) through September 30, 2019 and the related notes (collectively referred to as the "financial statements"). In our opinion, the financial statements present fairly, in all material respects, the financial position of the Fund (one of the funds constituting Morgan Stanley Institutional Fund Trust) at September 30, 2023, the results of its operations for the year then ended, the changes in its net assets for each of the three years in the period then ended and its financial highlights for each of the four years then ended and the period from December 19, 2018 (commencement of operations) through September 30, 2019, in conformity with U.S. generally accepted accounting principles.
Basis for Opinion
These financial statements are the responsibility of the Trust's management. Our responsibility is to express an opinion on the Fund's financial statements based on our audits. We are a public accounting firm registered with the Public Company Accounting Oversight Board (United States) ("PCAOB") and are required to be independent with respect to the Trust in accordance with the U.S. federal securities laws and the applicable rules and regulations of the Securities and Exchange Commission and the PCAOB.
We conducted our audits in accordance with the standards of the PCAOB. Those standards require that we plan and perform the audit to obtain reasonable assurance about whether the financial statements are free of material misstatement, whether due to error or fraud. The Trust is not required to have, nor were we engaged to perform, an audit of the Trust's internal control over financial reporting. As part of our audits, we are required to obtain an understanding of internal control over financial reporting, but not for the purpose of expressing an opinion on the effectiveness of the Trust's internal control over financial reporting. Accordingly, we express no such opinion.
Our audits included performing procedures to assess the risks of material misstatement of the financial statements, whether due to error or fraud, and performing procedures that respond to those risks. Such procedures included examining, on a test basis, evidence regarding the amounts and disclosures in the financial statements. Our procedures included confirmation of securities owned as of September 30, 2023, by correspondence with the custodian, brokers and others; when replies were not received from brokers and others, we performed other auditing procedures. Our audits also included evaluating the accounting principles used and significant estimates made by management, as well as evaluating the overall presentation of the financial statements. We believe that our audits provide a reasonable basis for our opinion.

We have served as the auditor of one or more Morgan Stanley investment companies since 2000.
Boston, Massachusetts
November 27, 2023
22
Morgan Stanley Institutional Fund Trust
Annual Report — September 30, 2023
Investment Advisory Agreement Approval (unaudited)
Nature, Extent and Quality of Services
The Board reviewed and considered the nature and extent of the investment advisory services provided by the Adviser under the advisory agreement, including portfolio management, investment research and equity and fixed income securities trading. The Board also reviewed and considered the nature and extent of the non-advisory, administrative services provided by the Administrator under the administration agreement, including accounting, operations, clerical, bookkeeping, compliance, business management and planning, legal services and the provision of supplies, office space and utilities at the Adviser's expense. The Board also considered the Adviser's investment in personnel and infrastructure that benefits the Fund. (The Adviser and Administrator together are referred to as the "Adviser" and the advisory and administration agreements together are referred to as the "Management Agreement.") The Board also considered that the Adviser serves a variety of other investment advisory clients and has experience overseeing service providers. The Board also compared the nature of the services provided by the Adviser with similar services provided by non-affiliated advisers as prepared by Broadridge Financial Solutions, Inc. ("Broadridge").
The Board reviewed and considered the qualifications of the portfolio managers, the senior administrative managers and other key personnel of the Adviser who provide the advisory and administrative services to the Fund. The Board determined that the Adviser's portfolio managers and key personnel are well qualified by education and/or training and experience to perform the services in an efficient and professional manner. The Board concluded that the nature and extent of the advisory and administrative services provided were necessary and appropriate for the conduct of the business and investment activities of the Fund and supported its decision to approve the Management Agreement.
Performance, Fees and Expenses of the Fund
The Board reviewed the performance, fees and expenses of the Fund compared to its peers, as prepared by Broadridge, and to appropriate benchmarks where applicable. The Board discussed with the Adviser the performance goals and the actual results achieved in managing the Fund. When considering a fund's performance, the Board and the Adviser place emphasis on trends and longer-term returns (focusing on one-year, three-year and five-year performance, as of December 31, 2022, or since inception, as applicable). When a fund underperforms its benchmark and/or its peer group average, the Board and the Adviser discuss the causes of such underperformance and, where necessary, they discuss specific changes to investment strategy or investment personnel. The Board noted that the Fund's performance was better than its peer group average for the one-, three- and five-year periods. The Board discussed with the Adviser the level of the advisory and administration fees (together, the "management fee") for this Fund relative to comparable funds and/or other accounts advised by the Adviser and/or compared to its peers as prepared by Broadridge. In addition to the management fee, the Board also reviewed the Fund's total expense ratio. The Board noted that the Fund's management fee and total expense ratio were lower than its peer group averages. After discussion, the Board concluded that the Fund's performance, management fee and total expense ratio were competitive with its peer group averages.
Economies of Scale
The Board considered the size and growth prospects of the Fund and how that relates to the Fund's total expense ratio and particularly the Fund's management fee rate, which does not include breakpoints. In conjunction with its review of the Adviser's profitability, the Board discussed with the Adviser how a change in assets can affect the efficiency or effectiveness of managing the Fund and whether the management fee level is appropriate relative to current and projected asset levels and/or whether the management fee structure reflects economies of scale as asset levels change. The Board has determined that its review of the actual and/or potential economies of scale of the Fund supports its decision to approve the Management Agreement.
Profitability of the Adviser and Affiliates
The Board considered information concerning the costs incurred and profits realized by the Adviser and its affiliates during the last year from their relationship with the Fund and during the last two years from their relationship with the Morgan Stanley Fund Complex and reviewed with the Adviser the cost allocation methodology used to determine the profitability of the Adviser and affiliates. The Board has determined that its review of the analysis of the Adviser's expenses and profitability supports its decision to approve the Management Agreement.
23
Morgan Stanley Institutional Fund Trust
Annual Report — September 30, 2023
Investment Advisory Agreement Approval (unaudited) (cont'd)
Other Benefits of the Relationship
The Board considered other direct and indirect benefits to the Adviser and/or its affiliates derived from their relationship with the Fund and other funds advised by the Adviser. These benefits may include, among other things, fees for trading, distribution and/or shareholder servicing and for transaction processing and reporting platforms used by securities lending agents, and research received by the Adviser generated from commission dollars spent on funds' portfolio trading. The Board reviewed with the Adviser these arrangements and the reasonableness of the Adviser's costs relative to the services performed. The Board has determined that its review of the other benefits received by the Adviser or its affiliates supports its decision to approve the Management Agreement.
Resources of the Adviser and Historical Relationship Between the Fund and the Adviser
The Board considered whether the Adviser is financially sound and has the resources necessary to perform its obligations under the Management Agreement. The Board also reviewed and considered the historical relationship between the Fund and the Adviser, including the organizational structure of the Adviser, the policies and procedures formulated and adopted by the Adviser for managing the Fund's operations and the Board's confidence in the competence and integrity of the senior managers and key personnel of the Adviser. The Board concluded that the Adviser has the financial resources necessary to fulfill its obligations under the Management Agreement and that it is beneficial for the Fund to continue its relationship with the Adviser.
Other Factors and Current Trends
The Board considered the controls and procedures adopted and implemented by the Adviser and monitored by the Fund's Chief Compliance Officer and concluded that the conduct of business by the Adviser indicates a good faith effort on its part to adhere to high ethical standards in the conduct of the Fund's business.
General Conclusion
After considering and weighing all of the above factors, with various written materials and verbal information presented by the Adviser, the Board concluded that it would be in the best interest of the Fund and its shareholders to approve renewal of the Management Agreement for another year. In reaching this conclusion the Board did not give particular weight to any single piece of information or factor referenced above. The Board considered these factors and information over the course of the year and in numerous meetings, some of which were in executive session with only the independent Board members and their counsel present. It is possible that individual Board members may have weighed these factors, and the information presented, differently in reaching their individual decisions to approve the Management Agreement.
24
Morgan Stanley Institutional Fund Trust
Annual Report — September 30, 2023
Liquidity Risk Management Program (unaudited)
In compliance with Rule 22e-4 under the Investment Company Act of 1940, as amended (the "Liquidity Rule"), the Fund has adopted and implemented a liquidity risk management program (the "Program"), which is reasonably designed to assess and manage the risk that the Fund could not meet requests to redeem shares issued by the Fund without significant dilution of remaining investors' interests in the Fund (i.e., liquidity risk). The Fund's Board of Trustees (the "Board") previously approved the designation of the Liquidity Risk Subcommittee (the "LRS") as Program administrator. The LRS is comprised of representatives from various divisions within Morgan Stanley Investment Management.
At a meeting held on March 1-2, 2023, the Board reviewed a written report prepared by the LRS that addressed the Program's operation and assessed its adequacy, and effectiveness of implementation for the period from January 1, 2022, through December 31, 2022, as required under the Liquidity Rule. The report concluded that the Program operated effectively and was adequately and effectively implemented in all material aspects, and that the relevant controls and safeguards were appropriately designed to enable the LRS to administer the Program in compliance with the Liquidity Rule.
In accordance with the Program, the LRS assessed each Fund's liquidity risk no less frequently than annually taking into consideration certain factors, as applicable, such as (i) investment strategy and liquidity of portfolio investments, (ii) short-term and long-term cash flow projections and (iii) holdings of cash and cash equivalents and borrowing arrangements and other funding sources. Certain factors are considered under both normal and reasonably foreseeable stressed conditions.
Each Fund portfolio investment is classified into one of four liquidity categories, which classification is assessed at least monthly by the LRS. The classification is based on a determination of the number of days it is reasonably expected to take to convert the investment into cash, or sell or dispose of the investment, in current market conditions without significantly changing the market value of the investment. Liquidity classification determinations take into account various market, trading and investment-specific considerations, as well as market depth, and in some cases utilize third-party vendor data.
The Liquidity Rule limits a fund's investments in illiquid investments to 15% of its net assets and requires funds that do not primarily hold assets that are highly liquid investments to determine and maintain a minimum percentage of the fund's net assets to be invested in highly liquid investments (highly liquid investment minimum or "HLIM"). The LRS believes that the Program includes provisions reasonably designed to review, monitor and comply with the 15% limit on illiquid investments and for determining, periodically reviewing and complying with the HLIM requirement, as applicable.
There can be no assurance that the Program will achieve its objectives under all circumstances in the future. Please refer to the Fund's prospectus for more information regarding the Fund's exposure to liquidity risk and other risks to which it may be subject.
25
Morgan Stanley Institutional Fund Trust
Annual Report — September 30, 2023
Federal Tax Notice (unaudited)
For federal income tax purposes, the following information is furnished with respect to the distributions paid by the Fund during its taxable year ended September 30, 2023.
The Fund designated approximately $159,000 of its distributions paid as qualified interest income.
The Fund designated approximately $159,000 of its distributions paid as business interest income.
The Fund designated 94.82% of its income dividends as tax-exempt income dividends.
In January, the Fund provides tax information to shareholders for the preceding calendar year.
26
Morgan Stanley Institutional Fund Trust
Annual Report — September 30, 2023
Important Notices (unaudited)
Reporting to Shareholders
Each Morgan Stanley fund provides a complete schedule of portfolio holdings in its Semi-Annual and the Annual Reports within 60 days of the end of the fund's second and fourth fiscal quarters. The Semi-Annual and Annual Reports are filed electronically with the Securities and Exchange Commission ("SEC") on Form N-CSRS and Form N-CSR, respectively. Morgan Stanley makes these reports available on its public website, www.morganstanley.com/im. Each Morgan Stanley non-money market fund also files a complete schedule of portfolio holdings with the SEC for the fund's first and third fiscal quarters as an attachment to Form N-PORT. Morgan Stanley does not deliver the reports for the first and third fiscal quarters to shareholders, but makes the complete schedule of portfolio holdings for the fund's first and third fiscal quarters available on its public website. The holdings for each money market fund are also posted to the Morgan Stanley public website. You may obtain the Form N-PORT filings (as well as the Form N-CSR and N-CSRS filings) by accessing the SEC's website, www.sec.gov. You can also request copies of these materials, upon payment of a duplicating fee, by electronic request at the SEC's email address (publicinfo@sec.gov).
Proxy Voting Policies and Procedures and Proxy Voting Record
You may obtain a copy of the Trust's Proxy Voting Policy and Procedures and information regarding how the Trust voted proxies relating to portfolio securities during the most recent twelve-month period ended June 30, without charge, upon request, by calling toll free 1 (800) 869-6397 or by visiting our website at www.morganstanley.com/im. This information is also available on the SEC's website at www.sec.gov.
This report is authorized for distribution only when preceded or accompanied by a prospectus or summary prospectus of the applicable fund of Morgan Stanley Institutional Fund Trust, which describes in detail the fund's investment policies, risks, fees and expenses. Please read the prospectus carefully before you invest or send money. For additional information, including information regarding the investments comprising the Fund, please visit our website at www.morganstanley.com/im. or call toll free 1 (800) 869-6397.
Householding Notice
To reduce printing and mailing costs, the Fund attempts to eliminate duplicate mailings to the same address. The Fund delivers a single copy of certain shareholder documents, including shareholder reports, prospectuses and proxy materials, to investors with the same last name who reside at the same address. Your participation in this program will continue for an unlimited period of time unless you instruct us otherwise. You can request multiple copies of these documents by calling 1 (800) 869-6397, 8:00 a.m. to 6:00 p.m., ET. Once our Customer Service Center has received your instructions, we will begin sending individual copies for each account within 30 days.
Tailored Shareholder Reports
Effective January 24, 2023, the SEC adopted rule and form amendments to require open-end mutual funds and ETFs to transmit concise and visually engaging streamlined annual and semiannual reports to shareholders that highlight key information. Other information, including financial statements, will no longer appear in a streamlined shareholder report but must be available online, delivered free of charge upon request, and filed on a semiannual basis on Form N-CSR. The rule and form amendments have a compliance date of July 24, 2024. At this time, management is evaluating the impact of these amendments on the shareholder reports for the Morgan Stanley Funds.
27
Morgan Stanley Institutional Fund Trust
Annual Report — September 30, 2023
U.S. Customer Privacy Notice (unaudited) April 2021
FACTS | | WHAT DOES MSIM DO WITH YOUR PERSONAL INFORMATION? | |
Why? | | Financial companies choose how they share your personal information. Federal law gives consumers the right to limit some but not all sharing. Federal law also requires us to tell you how we collect, share, and protect your personal information. Please read this notice carefully to understand what we do. | |
What? | | The types of personal information we collect and share depend on the product or service you have with us. This information can include:
◼ Social Security number and income
◼ investment experience and risk tolerance
◼ checking account number and wire transfer instructions | |
How? | | All financial companies need to share customers' personal information to run their everyday business. In the section below, we list the reasons financial companies can share their customers' personal information; the reasons MSIM chooses to share; and whether you can limit this sharing. | |
Reasons we can share your personal information | | Does MSIM share? | | Can you limit this sharing? | |
For our everyday business purposes —
such as to process your transactions, maintain your account(s), respond to court orders and legal investigations, or report to credit bureaus | | Yes | | No | |
For our marketing purposes —
to offer our products and services to you | | Yes | | No | |
For joint marketing with other financial companies | | No | | We don't share | |
For our investment management affiliates' everyday business purposes —
information about your transactions, experiences, and creditworthiness | | Yes | | Yes | |
For our affiliates' everyday business purposes —
information about your transactions and experiences | | Yes | | No | |
For our affiliates' everyday business purposes —
information about your creditworthiness | | No | | We don't share | |
For our investment management affiliates to market to you | | Yes | | Yes | |
For our affiliates to market to you | | No | | We don't share | |
For non-affiliates to market to you | | No | | We don't share | |
28
Morgan Stanley Institutional Fund Trust
Annual Report — September 30, 2023
U.S. Customer Privacy Notice (unaudited) (cont'd) April 2021
To limit our sharing | | Call toll-free (844) 312-6327 or email: imprivacyinquiries@morganstanley.com
Please note:
If you are a new customer, we can begin sharing your information 30 days from the date we sent this notice. When you are no longer our customer, we continue to share your information as described in this notice. However, you can contact us at any time to limit our sharing. | |
Questions? | | Call toll-free (844) 312-6327 or email: imprivacyinquiries@morganstanley.com | |
Who we are
Who is providing this notice? | | Morgan Stanley Investment Management Inc. and its investment management affiliates ("MSIM") (see Investment Management Affiliates definition below) | |
What we do
How does MSIM protect my personal information? | | To protect your personal information from unauthorized access and use, we use security measures that comply with federal law. These measures include computer safeguards and secured files and buildings. We have policies governing the proper handling of customer information by personnel and requiring third parties that provide support to adhere to appropriate security standards with respect to such information. | |
How does MSIM collect my personal information? | | We collect your personal information, for example, when you
◼ open an account or make deposits or withdrawals from your account
◼ buy securities from us or make a wire transfer
◼ give us your contact information
We also collect your personal information from others, such as credit bureaus, affiliates, or other companies. | |
Why can't I limit all sharing? | | Federal law gives you the right to limit only
◼ sharing for affiliates' everyday business purposes — information about your creditworthiness
◼ affiliates from using your information to market to you
◼ sharing for non-affiliates to market to you
State laws and individual companies may give you additional rights to limit sharing. See below for more on your rights under state law. | |
29
Morgan Stanley Institutional Fund Trust
Annual Report — September 30, 2023
U.S. Customer Privacy Notice (unaudited) (cont'd) April 2021
Definitions
Investment Management Affiliates | | MSIM Investment Management Affiliates include registered investment advisers, registered broker-dealers, and registered and unregistered funds in the Investment Management Division. Investment Management Affiliates does not include entities associated with Morgan Stanley Wealth Management, such as Morgan Stanley Smith Barney LLC and Morgan Stanley & Co. | |
Affiliates | | Companies related by common ownership or control. They can be financial and non-financial companies.
◼ Our affiliates include companies with a Morgan Stanley name and financial companies such as Morgan Stanley Smith Barney LLC and Morgan Stanley & Co. | |
Non-affiliates | | Companies not related by common ownership or control. They can be financial and non-financial companies.
◼ MSIM does not share with non-affiliates so they can market to you. | |
Joint marketing | | A formal agreement between non-affiliated financial companies that together market financial products or services to you.
◼ MSIM doesn't jointly market | |
Other important information
Vermont: Except as permitted by law, we will not share personal information we collect about Vermont residents with Non-affiliates unless you provide us with your written consent to share such information.
California: Except as permitted by law, we will not share personal information we collect about California residents with Non-affiliates and we will limit sharing such personal information with our Affiliates to comply with California privacy laws that apply to us.
30
Morgan Stanley Institutional Fund Trust
Annual Report — September 30, 2023
Trustees and Officers Information (unaudited)
Independent Trustees:
Name, Address and Birth Year
of Independent Director | | Position(s)
Held with
Registrant | | Length of Time
Served* | | Principal Occupation(s) During Past 5 Years
and Other Relevant Professional Experience | | Number of
Funds in
Fund Complex
Overseen by
Independent
Director** | | Other Directorships
Held by Independent
Director During
Past 5 Years*** | |
Frank L. Bowman
c/o Perkins Coie LLP
Counsel to the Independent Trustees
1155 Avenue of the Americas
22nd Floor
New York, NY 10036
Birth Year: 1944 | | Trustee | | Since
August
2006 | | President, Strategic Decisions, LLC (consulting) (since February 2009); Director or Trustee of various Morgan Stanley Funds (since August 2006); Chairperson of the Compliance and Insurance Committee (since October 2015); formerly, Chairperson of the Insurance Sub-Committee of the Compliance and Insurance Committee (2007-2015); served as President and Chief Executive Officer of the Nuclear Energy Institute (policy organization) (February 2005-November 2008); retired as Admiral, U.S. Navy after serving over 38 years on active duty including 8 years as Director of the Naval Nuclear Propulsion Program in the Department of the Navy and the U.S. Department of Energy (1996-2004); served as Chief of Naval Personnel (July 1994-September 1996) and on the Joint Staff as Director of Political Military Affairs (June 1992-July 1994); knighted as Honorary Knight Commander of the Most Excellent Order of the British Empire; awarded the Officier de l'Orde National du Mèrite by the French Government; elected to the National Academy of Engineering (2009). | | | 86 | | | Director of Naval and Nuclear Technologies LLP; Director Emeritus of the Armed Services YMCA; Member of the National Security Advisory Council of the Center for U.S. Global Engagement and a former member of the CNA Military Advisory Board; Chairman of the Board of Trustees of Fairhaven United Methodist Church; Member of the Board of Advisors of the Dolphin Scholarship Foundation; Director of other various nonprofit organizations; formerly, Director of BP, plc (November 2010-May 2019). | |
Kathleen A. Dennis
c/o Perkins Coie LLP
Counsel to the Independent
Trustees
1155 Avenue of the Americas
22nd Floor
New York, NY 10036
Birth Year: 1953 | | Trustee | | Since
August
2006 | | Chairperson of the Governance Committee (since January 2021), Chairperson of the Liquidity and Alternatives Sub-Committee of the Investment Committee (2006-2020) and Director or Trustee of various Morgan Stanley Funds (since August 2006); President, Cedarwood Associates (mutual fund and investment management consulting) (since July 2006); formerly, Senior Managing Director of Victory Capital Management (1993-2006). | | | 86 | | | Board Member, University of Albany Foundation (2012-present); Board Member, Mutual Funds Directors Forum (2014-present); Director of various non-profit organizations. | |
Nancy C. Everett
c/o Perkins Coie LLP
Counsel to the Independent
Trustees
1155 Avenue of the Americas
22nd Floor
New York, NY 10036
Birth Year: 1955 | | Trustee | | Since
January
2015 | | Chairperson of the Equity Investment Committee (since January 2021); Director or Trustee of various Morgan Stanley Funds (since January 2015); Chief Executive Officer, Virginia Commonwealth University Investment Company (since November 2015); Owner, OBIR, LLC (institutional investment management consulting) (since June 2014); formerly, Managing Director, BlackRock, Inc. (February 2011-December 2013) and Chief Executive Officer, General Motors Asset Management (a/k/a Promark Global Advisors, Inc.) (June 2005-May 2010). | | | 87 | | | Formerly, Member of Virginia Commonwealth University School of Business Foundation (2005-2016); Member of Virginia Commonwealth University Board of Visitors (2013-2015); Member of Committee on Directors for Emerging Markets Growth Fund, Inc. (2007-2010); Chairperson of Performance Equity Management, LLC (2006-2010); and Chairperson, GMAM Absolute Return Strategies Fund, LLC (2006-2010). | |
31
Morgan Stanley Institutional Fund Trust
Annual Report — September 30, 2023
Trustees and Officers Information (unaudited) (cont'd)
Independent Trustees: (cont'd)
Name, Address and Birth Year
of Independent Director | | Position(s)
Held with
Registrant | | Length of Time
Served* | | Principal Occupation(s) During Past 5 Years
and Other Relevant Professional Experience | | Number of
Funds in
Fund Complex
Overseen by
Independent
Director** | | Other Directorships
Held by Independent
Director During
Past 5 Years*** | |
Jakki L. Haussler
c/o Perkins Coie LLP
Counsel to the Independent
Trustees
1155 Avenue of the Americas
22nd Floor
New York, NY 10036
Birth Year: 1957 | | Trustee | | Since
January
2015 | | Chairperson of the Audit Committee (since January 2023) and Director or Trustee of various Morgan Stanley Funds (since January 2015); Chairman, Opus Capital Group (since 1996); formerly, Chief Executive Officer, Opus Capital Group (1996-2019); Director, Capvest Venture Fund, LP (May 2000-December 2011); Partner, Adena Ventures, LP (July 1999-December 2010); Director, The Victory Funds (February 2005-July 2008). | | | 87 | | | Director, Vertiv Holdings Co. (VRT) (since August 2022); Director of Cincinnati Bell Inc. and Member, Audit Committee and Chairman, Governance and Nominating Committee (2008-2021); Director of Service Corporation International and Member, Audit Committee and Investment Committee; Director, Barnes Group Inc. (since July 2021); Director of Northern Kentucky University Foundation and Member, Investment Committee; Member of Chase College of Law Center for Law and Entrepreneurship Board of Advisors; Director of Best Transport (2005-2019); Director of Chase College of Law Board of Visitors; formerly, Member, University of Cincinnati Foundation Investment Committee. | |
Dr. Manuel H. Johnson
c/o Johnson Smick
International, Inc.
220 I Street, NE
Suite 200
Washington, D.C. 20002
Birth Year: 1949 | | Trustee | | Since
July
1991 | | Senior Partner, Johnson Smick International, Inc. (consulting firm); Chairperson of the Fixed Income, Liquidity and Alternatives Investment Committee (since January 2021), Chairperson of the Investment Committee (2006-2020) and Director or Trustee of various Morgan Stanley Funds (since July 1991); Co-Chairman and a founder of the Group of Seven Council (G7C) (international economic commission); formerly, Chairperson of the Audit Committee (July 1991-September 2006); Vice Chairman of the Board of Governors of the Federal Reserve System and Assistant Secretary of the U.S. Treasury. | | | 86 | | | Director of NVR, Inc. (home construction). | |
32
Morgan Stanley Institutional Fund Trust
Annual Report — September 30, 2023
Trustees and Officers Information (unaudited) (cont'd)
Independent Trustees: (cont'd)
Name, Address and Birth Year
of Independent Director | | Position(s)
Held with
Registrant | | Length of Time
Served* | | Principal Occupation(s) During Past 5 Years
and Other Relevant Professional Experience | | Number of
Funds in
Fund Complex
Overseen by
Independent
Director** | | Other Directorships
Held by Independent
Director During
Past 5 Years*** | |
Joseph K. Kearns
c/o Perkins Coie LLP
Counsel to the Independent
Trustees
1155 Avenue of the Americas
22nd Floor
New York, NY 10036
Birth Year: 1942 | | Trustee | | Since
August
1994 | | Senior Adviser, Kearns & Associates LLC (investment consulting); Chairperson of the Audit Committee (2006-2022) and Director or Trustee of various Morgan Stanley Funds (since August 1994); formerly, Deputy Chairperson of the Audit Committee (July 2003-September 2006); CFO of the J. Paul Getty Trust (1982-1999). | | | 87 | | | Director, Rubicon Investments (since February 2019); Prior to August 2016, Director of Electro Rent Corporation (equipment leasing); Prior to December 31, 2013, Director of The Ford Family Foundation. | |
Michael F. Klein
c/o Perkins Coie LLP
Counsel to the Independent
Trustees
1155 Avenue of the Americas
22nd Floor
New York, NY 10036
Birth Year: 1958 | | Trustee | | Since
August
2006 | | Chairperson of the Risk Committee (since January 2021); Managing Director, Aetos Alternatives Management, LP (since March 2000); Co-President, Aetos Alternatives Management, LP (since January 2004) and Co-Chief Executive Officer of Aetos Alternatives Management, LP (since August 2013); Chairperson of the Fixed Income Sub-Committee of the Investment Committee (2006-2020) and Director or Trustee of various Morgan Stanley Funds (since August 2006); formerly, Managing Director, Morgan Stanley & Co. Inc. and Morgan Stanley Dean Witter Investment Management and President, various Morgan Stanley Funds (June 1998-March 2000); Principal, Morgan Stanley & Co. Inc. and Morgan Stanley Dean Witter Investment Management (August 1997-December 1999). | | | 86 | | | Director of certain investment funds managed or sponsored by Aetos Alternatives Management, LP; Director of Sanitized AG and Sanitized Marketing AG (specialty chemicals). | |
Patricia A. Maleski
c/o Perkins Coie LLP
Counsel to the Independent
Trustees
1155 Avenue of the Americas
22nd Floor
New York, NY 10036
Birth Year: 1960 | | Trustee | | Since
January
2017 | | Director or Trustee of various Morgan Stanley Funds (since January 2017); Managing Director, JPMorgan Asset Management (2004-2016); Oversight and Control Head of Fiduciary and Conflicts of Interest Program (2015-2016); Chief Control Officer—Global Asset Management (2013-2015); President, JPMorgan Funds (2010-2013); Chief Administrative Officer (2004-2013); various other positions including Treasurer and Board Liaison (since 2001). | | | 87 | | | Trustee (since January 2022) and Treasurer (since January 2023), Nutley Family Service Bureau, Inc. | |
W. Allen Reed
c/o Perkins Coie LLP
Counsel to the Independent
Trustees
1155 Avenue of the Americas
22nd Floor
New York, NY 10036
Birth Year: 1947 | | Chair of the Board and Trustee | | Chair of the Board since August 2020 and Trustee since August 2006 | | Chair of the Boards of various Morgan Stanley Funds (since August 2020); Director or Trustee of various Morgan Stanley Funds (since August 2006); formerly, Vice Chair of the Boards of various Morgan Stanley Funds (January 2020-August 2020); President and Chief Executive Officer of General Motors Asset Management; Chairman and Chief Executive Officer of the GM Trust Bank and Corporate Vice President of General Motors Corporation (August 1994-December 2005). | | | 86 | | | Formerly, Director of Legg Mason, Inc. (2006-2019); and Director of the Auburn University Foundation (2010-2015). | |
* This is the earliest date the Trustee began serving the Morgan Stanley Funds. Each Trustee serves an indefinite term, until his or her successor is elected.
** The Fund Complex includes (as of December 31, 2022) all open-end and closed-end funds (including all of their portfolios) advised by Morgan Stanley Investment Management Inc. (the "Adviser") and any funds that have an adviser that is an affiliated person of the Adviser (including, but not limited to, Morgan Stanley AIP GP LP).
*** This includes any directorships at public companies and registered investment companies held by the Trustees at any time during the past five years.
33
Morgan Stanley Institutional Fund Trust
Annual Report — September 30, 2023
Trustees and Officers Information (unaudited) (cont'd)
Executive Officers:
Name, Address and Birth Year
of Executive Officer | | Position(s) Held
with
Registrant | | Length of
Time Served* | | Principal Occupation(s) During Past 5 Years | |
John H. Gernon
522 Fifth Avenue
New York, NY 10036
Birth Year: 1963 | | President and Principal Executive Officer | | Since
September
2013 | | President and Principal Executive Officer of the Equity and Fixed Income Funds and the Morgan Stanley AIP Funds (since September 2013) and the Liquidity Funds and various money market funds (since May 2014) in the Fund Complex; Managing Director of the Adviser. | |
Deidre A. Downes
1633 Broadway
New York, NY 10019
Birth Year: 1977 | | Chief Compliance Officer | | Since
November
2021 | | Executive Director of the Adviser (since January 2021) and Chief Compliance Officer of various Morgan Stanley Funds (since November 2021). Formerly, Vice President and Corporate Counsel at PGIM and Prudential Financial (October 2016-December 2020). | |
Francis J. Smith
522 Fifth Avenue
New York, NY 10036
Birth Year: 1965 | | Treasurer and Principal Financial Officer | | Treasurer since July 2003 and Principal Financial Officer since September
2002 | | Managing Director of the Adviser and various entities affiliated with the Adviser; Treasurer (since July 2003) and Principal Financial Officer of various Morgan Stanley Funds (since September 2002). | |
Mary E. Mullin
1633 Broadway
New York, NY 10019
Birth Year: 1967 | | Secretary | | Since
June
1999 | | Managing Director of the Adviser; Secretary of various Morgan Stanley Funds (since June 1999). | |
Michael J. Key
522 Fifth Avenue
New York, NY 10036
Birth Year: 1979 | | Vice President | | Since
June
2017 | | Vice President of the Equity and Fixed Income Funds, Liquidity Funds, various money market funds and the Morgan Stanley AIP Funds in the Fund Complex (since June 2017); Managing Director of the Adviser; Head of Product Development for Equity and Fixed Income Funds (since August 2013). | |
The Fund's statement of additional information includes further information about the Fund's Trustees and Officers, and is available without charge by visiting www.morganstanley.com/im or upon request by calling 1 (800) 869-6397.
* This is the earliest date the officer began serving the Morgan Stanley Funds. Each officer serves an indefinite term, until his or her successor is elected.
34
Morgan Stanley Institutional Fund Trust
Annual Report — September 30, 2023
Adviser and Administrator
Morgan Stanley Investment Management Inc.
522 Fifth Avenue
New York, New York 10036
Distributor
Morgan Stanley Distribution, Inc.
522 Fifth Avenue
New York, New York 10036
Dividend Disbursing and Transfer Agent
SS&C Global Investor & Distribution Solutions, Inc.
P.O. Box 219804
Kansas City, Missouri 64121-9804
Co-Transfer Agent
Morgan Stanley Services Company, Inc.
522 Fifth Avenue
New York, New York 10036
Custodian
State Street Bank and Trust Company
One Congress Street
Boston, Massachusetts 02114
Legal Counsel
Dechert LLP
1095 Avenue of the Americas
New York, New York 10036
Counsel to the Independent Trustees
Perkins Coie LLP
1155 Avenue of the Americas,
22nd Floor
New York, New York 10036
Independent Registered Public Accounting Firm
Ernst & Young LLP
200 Clarendon Street
Boston, Massachusetts 02116
35
(This page has been left blank intentionally.)
Printed in U.S.A.
This Report has been prepared for shareholders and may be distributed to others only if preceded or accompanied by a current prospectus.
Morgan Stanley Investment Management Inc.
522 Fifth Avenue
New York, New York 10036
© 2023 Morgan Stanley. Morgan Stanley Distribution, Inc.

IFTUSMIANN
6048656 EXP 11.30.24

Morgan Stanley Institutional Fund Trust
Ultra-Short Income Portfolio
Annual Report
September 30, 2023

Morgan Stanley Institutional Fund Trust
Annual Report — September 30, 2023
Table of Contents (unaudited)
Shareholders' Letter | | | 2 | | |
Expense Example | | | 3 | | |
Investment Overview | | | 4 | | |
Portfolio of Investments | | | 8 | | |
Statement of Assets and Liabilities | | | 12 | | |
Statement of Operations | | | 13 | | |
Statements of Changes in Net Assets | | | 14 | | |
Financial Highlights | | | 15 | | |
Notes to Financial Statements | | | 18 | | |
Report of Independent Registered Public Accounting Firm | | | 23 | | |
Investment Advisory Agreement Approval | | | 24 | | |
Liquidity Risk Management Program | | | 26 | | |
Federal Tax Notice | | | 27 | | |
Important Notices | | | 28 | | |
U.S. Customer Privacy Notice | | | 29 | | |
Trustees and Officers Information | | | 32 | | |
This report is authorized for distribution only when preceded or accompanied by a prospectus or summary prospectus of the applicable Fund of the Morgan Stanley Institutional Fund Trust. To receive a prospectus and/or statement of additional information ("SAI"), which contains more complete information such as investment objectives, charges, expenses, policies for voting proxies, risk considerations and describes in detail each of the Fund's investment policies to the prospective investor, please call toll free 1 (800) 869-6397. Please read the prospectuses carefully before you invest or send money.
Additionally, you can access information about the Fund, including performance, characteristics and investment team commentary through Morgan Stanley Investment Management's website: www.morganstanley.com/im.
Market forecasts provided in this report may not necessarily come to pass. There is no guarantee that any sectors mentioned will continue to perform as discussed herein or that securities in such sectors will be held by the Fund in the future. There is no assurance that a fund will achieve its investment objective. Funds are subject to market risk, which is the possibility that market values of securities owned by the Fund will decline and, therefore, the value of the Fund's shares may be less than what you paid for them. Accordingly, you can lose money investing in this Fund. Please see the prospectus for more complete information on investment risks.
1
Morgan Stanley Institutional Fund Trust
Annual Report — September 30, 2023
Shareholders' Letter (unaudited)
Dear Shareholders,
We are pleased to provide this Annual Report, in which you will learn how your investment in Ultra-Short Income Portfolio (the "Fund") performed during the latest twelve-month period.
Morgan Stanley Investment Management is a client-centric, investor-led organization. Our global presence, intellectual capital, and breadth of products and services enable us to partner with investors to meet the evolving challenges of today's financial markets. We aim to deliver superior investment service and to empower our clients to make the informed decisions that help them reach their investment goals.
As always, we thank you for selecting Morgan Stanley Investment Management, and look forward to working with you in the months and years ahead.
Sincerely,

John H. Gernon
President and Principal Executive Officer
October 2023
2
Morgan Stanley Institutional Fund Trust
Annual Report — September 30, 2023
Expense Example (unaudited)
Ultra-Short Income Portfolio
As a shareholder of the Fund, you may incur two types of costs: (1) transactional costs; and (2) ongoing costs, which may include advisory fees, administration fees, shareholder services fees and other Fund expenses. This example is intended to help you understand your ongoing costs (in dollars) of investing in the Fund and to compare these costs with the ongoing costs of investing in other mutual funds.
This example is based on an investment of $1,000 invested at the beginning of the six-month period ended September 30, 2023 and held for the entire six-month period.
Actual Expenses
The table below provides information about actual account values and actual expenses. You may use the information in this table, together with the amount you invested, to estimate the expenses that you paid over the period. Simply divide your account value by $1,000 (for example, an $8,600 account value divided by $1,000 = 8.6), then multiply the result by the number in the table under the heading entitled "Actual Expenses Paid During Period" to estimate the expenses you paid on your account during this period.
Hypothetical Example for Comparison Purposes
The table below provides information about hypothetical account values and hypothetical expenses based on the Fund's actual expense ratio and an assumed rate of return of 5% per year before expenses, which is not the Fund's actual return. The hypothetical account values and expenses may not be used to estimate the actual ending account balance or expenses you paid for the period. You may use this information to compare the ongoing costs of investing in the Fund and other funds. To do so, compare this 5% hypothetical example with the 5% hypothetical examples that appear in the shareholder reports of the other funds.
Please note that the expenses shown in the table are meant to highlight your ongoing costs only and do not reflect any transactional costs. Therefore, the information for each class in the table is useful in comparing ongoing costs only, and will not help you determine the relative total costs of owning different funds. In addition, if these transactional costs were included, your costs would have been higher.
| | | Beginning
Account
Value
4/1/23 | | Actual Ending
Account
Value
9/30/23 | | Hypothetical
Ending Account
Value | | Actual
Expenses
Paid
During
Period* | | Hypothetical
Expenses Paid
During Period* | | Net
Expense
Ratio
During
Period** | |
Ultra-Short Income Portfolio Class IR | | $ | 1,000.00 | | | $ | 1,028.10 | | | $ | 1,023.68 | | | $ | 1.26 | | | $ | 1.26 | | | | 0.25 | % | |
Ultra-Short Income Portfolio Institutional Class | | | 1,000.00 | | | | 1,026.90 | | | | 1,023.44 | | | | 1.52 | | | | 1.51 | | | | 0.30 | | |
Ultra-Short Income Portfolio Class A | | | 1,000.00 | | | | 1,027.60 | | | | 1,023.19 | | | | 1.77 | | | | 1.77 | | | | 0.35 | | |
* Expenses are calculated using each Fund Class' annualized net expense ratio (as disclosed), multiplied by the average account value over the period and multiplied by 182***/365 (to reflect the most recent one-half year period).
** Annualized.
*** Adjusted to reflect non-business days accruals.
3
Morgan Stanley Institutional Fund Trust
Annual Report — September 30, 2023
Investment Overview (unaudited)
Ultra-Short Income Portfolio
The Fund seeks current income with capital preservation while maintaining liquidity.
Performance
For the fiscal year ended September 30, 2023, the Fund's Institutional Class shares had a total return based on net asset value and reinvestment of distributions per share of 4.97%, net of fees. The Fund's Institutional Class shares outperformed against the Fund's benchmark, the ICE BofA 3-Month U.S. Treasury Bill Index (the "Index"), which returned 4.47%. For the seven-day period ended September 30, 2023, the Fund's Institutional Class shares provided an annualized current yield of 5.55% (subsidized) and 5.49% (non-subsidized), while its 30-day moving average annualized yield was 5.53% (subsidized) and 5.47% (non-subsidized). The 30-day SEC yield was 5.51% (subsidized) and 5.45% (non-subsidized). The non-subsidized yield reflects what the yield would have been had a fee and/or expense waiver not been in place during the period shown. Past performance is no guarantee of future results.
Factors Affecting Performance
• November 2022 began with the Federal Reserve (Fed) delivering its fourth consecutive 75 basis point(i) interest rate hike since the cycle began in March 2022, while indicating "ongoing increases" will be needed to achieve the Fed's objectives. Chair Powell left the door open to reducing the pace of hikes at future meetings, but clarified it was premature to consider a "pause" in rate increases. This meeting shifted the narrative in the markets, from a rapid hiking slope to a more measured one, albeit leading to a higher terminal (peak) rate. Although Fed speakers reinforced this posture during the month, the lower-than-expected inflation report caused markets to latch onto the pivot narrative and financial conditions eased significantly by the end of the month. Ahead of their blackout period, Fed officials closed the month by continuing to stress that inflation remains a major issue, and many in the market still forecast a terminal rate of 5% to 5.25% as a highly likely outcome.
• As widely anticipated, the Fed slowed the pace of rate hikes at the December 2022 Federal Open Market Committee (FOMC or the Committee) meeting, increasing the target range by 50 basis
points to the range of 4.25% to 4.50%. Updated dot plot forecasts showed that officials expected the terminal rate to reach 5.1% in 2023 before dropping back to 4.1% in 2024. The Committee additionally cited that "ongoing rate increases are likely appropriate" to continue tackling elevated inflation and a very tight labor market. The market priced in two additional rate hikes in early 2023 before a pause in the tightening cycle — a notable disconnect between market pricing and Fed communication.
• Gross domestic product (GDP) readings came in stronger than consensus estimates for the fourth quarter of 2022, with the annualized rate of 2.9% beating the expected 2.6% growth rate and the market beginning to gravitate more toward the "soft-landing" outcome for the economy in 2023.(ii) This helped exaggerate the already existing disconnect between Fed communication and market pricing.
• With respect to the labor market, the theme of resilience persisted throughout the fourth quarter of 2022 and into 2023. Payroll growth exceeded 500,000 jobs in the January 2023 report, coming after gains of 260,000 and 290,000 jobs in December and November 2022, respectively.(iii) The unemployment rate, at 3.5%, matched the lowest reading in 70 years. Fed officials repeatedly cited the tightness in the labor market as a major contributor to inflation potentially becoming embedded moving forward and as a rationale for them not blinking in the fight against inflation.
• The January 2023 consumer price index (CPI) numbers matched expectations, as the headline index increased by 0.5% month-over-month, while the core inflation gauge rose by 0.4% month-over-month. Combined with revisions to last year's readings, these data underscored that while inflation was most likely falling from its peak, progress was slower and more difficult than market participants would have liked. This caused the market to dilute some of the hope that had been building in the fourth quarter of 2022 when headline CPI rose 0.1% and 0.2% month-over-month in December and November, respectively. Markets were expected to
(i) One basis point = 0.01%
(ii) Source for all GDP data in this report: Bureau of Economic Analysis.
(iii) Source for labor market data in this report: Bureau of Labor Statistics and Bloomberg L.P.
4
Morgan Stanley Institutional Fund Trust
Annual Report — September 30, 2023
Investment Overview (unaudited) (cont'd)
Ultra-Short Income Portfolio
remain focused on the variations in contributions from underlying components of CPI, such as used cars, in the months that followed.
• The FOMC voted unanimously to increase the federal funds target rate by 0.25% to a range of 4.50% to 4.75% at the conclusion of its February 2023 meeting. The Committee noted that further rate hikes are "appropriate" in order to achieve "sufficiently restrictive" policy. The FOMC modified their messaging: in the post-meeting statement, it had previously discussed the "pace" of future rate increases, but now referred to the "extent" of future increases. This change didn't seem overly impactful on the surface, but it pointed to a Fed that was beginning to approach the end of its rate hiking cycle. Fed officials continued to monitor the economic outlook in effort to position policy accordingly. Market participants expected the Fed to continue raising rates into early summer 2023, as January 2023's employment figures far exceeded expectations.
• At the March 2023 meeting, the FOMC voted unanimously to increase the federal funds target rate by 0.25% to a range of 4.75% to 5.00%. During the month, several high-profile regional banks came under significant pressure to meet withdrawals. The Fed and U.S. Treasury acted swiftly, securing uninsured deposits and preventing widespread contagion by announcing a newly created Bank Term Funding Program. The new facility made additional funding available to ensure banks have the ability to meet the needs of their depositors. On the back of this announcement, the FOMC press release noted that the U.S. banking system was "sound and resilient," but these stresses were likely to result in tighter financial conditions and impact economic activity.
• In the first quarter of 2023, U.S. GDP grew 2.2% (annualized). The jobs market remained strong, despite the Fed's aggressive pace of interest rate hikes. Monthly non-farm payrolls averaged 295,000 jobs per month added to the economy in the first three months of 2023, and the unemployment rate was 3.5% as of March 2023.
• The FOMC voted unanimously to increase the federal funds target rate by 0.25% to a range of 5.00% to 5.25% at the conclusion of its May 2023 meeting. The press release was relatively unchanged from the prior meeting; however, it now included a
softer stance on forward guidance. Concerns around regional banks continued to flare as J.P. Morgan purchased First Republic Bank after U.S. regulators took control. Market participants believed the Fed was likely to hold its policy rate steady at its June 2023 meeting as it paused to interpret incoming data, with employment remaining tight and inflation still running above target.
• This pause materialized at the June 2023 meeting, as expected. The FOMC voted unanimously to maintain the federal funds target range at 5.00% to 5.25%. This was the first time since March 2022 that the Committee left rates unchanged. Market participants attempted to grasp whether this signaled a longer-term pause in policy rate movements.
• The June 2023 meeting also included an update of the Fed's summary of economic projections. The dot plot showed officials' median projection for the benchmark rate at the end of 2023 increased 0.50% to 5.6%. The 2023 median GDP growth projection was upgraded 0.60% to 1.0%. The 2024 GDP growth forecast was lowered slightly to 1.1%. The 2023 unemployment rate estimate decreased 0.40% to 4.1%. The Fed reduced its median 2023 personal consumption expenditure (PCE) inflation forecast to 3.2% in June, from 3.3% in March. The 2024 PCE projection was unchanged at 2.5%.
• In July 2023, the FOMC voted unanimously to increase the federal funds target rate by 0.25% to a range of 5.25% to 5.50%. The accompanying press release included an upgrade to its characterization of economic growth from "modest" to "moderate," but the statement overall was mostly unchanged. The job market remained strong, and inflation continued to run above the Fed's target. In his press conference, Chair Powell explained that the Fed remains data-dependent going forward while market participants grappled with the validity of another hike later in 2023.
• Economic data for the second quarter of 2023 continued to point to relative resilience in the U.S. economy. GDP growth rose 2.1% (annualized) in the April to June 2023 quarterly period. Monthly non-farm payrolls growth showed signs of slowing, averaging 240,000 jobs per month in the second quarter, while unemployment remained low, at 3.5% as of July 2023.
5
Morgan Stanley Institutional Fund Trust
Annual Report — September 30, 2023
Investment Overview (unaudited) (cont'd)
Ultra-Short Income Portfolio
• At the FOMC's next meeting in September 2023, officials voted to hold rates steady at a range of 5.25% to 5.50%. The press release was relatively unchanged aside from a minor adjustment in characterizing the economic expansion as "solid," from "moderate" previously. The release also noted that while job growth "remains strong" it has more recently "slowed."
• The September 2023 meeting included an update of the Fed's summary of economic projections. The Fed's dot plot showed officials' median projection for the benchmark rate at the end of 2023 was unchanged at 5.6%. The 2023 median GDP growth projection was increased substantially 110 basis points to 2.1%. The 2024 GDP growth forecast improved as well to 1.5%. The 2023 unemployment rate estimate declined 30 basis points to 3.8%. The Fed increased its median 2023 PCE inflation forecast to 3.3% in September from 3.2% in June. The 2024 PCE projection was unchanged at 2.5%.
• Positive factors affecting the Fund's performance relative to the Index in the period were its high allocations to daily resetting SOFR (secured overnight financing rate) and OBFR (overnight bank fund rate) floating-rate notes, along with elevated levels of daily and weekly liquidity(iv), which resulted in its ultra-short duration profile. This positioning enabled the Fund to turnover quickly as the Fed continued its historic tightening campaign throughout the reporting period. Additionally, due to duration positioning and to security selection, the Fund's net asset value (NAV) increased from $9.97 on September 30, 2022, to $9.98 to close the reporting period on September 30, 2023.
• Legacy fixed-rate securities that were purchased prior to the curve steepening lost some of their mark-to-market value and as a result decreased the portfolio's income accrual over alternative market options.
Management Strategies
• At period end, we remained comfortable managing the portfolio with elevated levels of daily and weekly liquidity.(iv)
• High allocations to SOFR and OBFR floating-rate notes (FRNs) helped contribute to minimal volatility in the Fund's NAV throughout the period. As of September 30, 2023, 41% of portfolio was allocated to SOFR and OBFR FRNs. SOFR and OBFR FRNs reset daily and immediately reprice following each subsequent interest rate hike and help preserve capital as the yield curve steepens.
• At period end, portfolio composition remained 95% invested in A1/P1 rated securities and with no exposure to China.
• We continued to maximize the Fund's allowable exposure to A2/P2 rated securities. We believed these securities remain attractive given their yield pickup over A1/P1 paper and diversification away from the financial sector that dominates the commercial paper/certificates of deposit A1/P1 market.(v)
(iv) Daily liquid assets include (i) cash; (ii) direct obligations of the U.S. Government; and (iii) securities that will mature or are subject to a demand feature that is exercisable and payable within one business day. Weekly liquid assets include (i) cash; (ii) direct obligations of the U.S. Government; (iii) Government securities issued by a person controlled or supervised by and acting as an instrumentality of the Government of the United States pursuant to authority granted by the Congress of the United States, that are issued at a discount to the principal amount to be repaid at maturity and have a remaining maturity of 60 days or less; and (iv) securities that will mature or are subject to a demand feature that is exercisable and payable within five business days.
(v) Diversification neither assures a profit nor guarantees against a loss in a declining market.
6
Morgan Stanley Institutional Fund Trust
Annual Report — September 30, 2023
Investment Overview (unaudited) (cont'd)
Ultra-Short Income Portfolio

* Minimum Investment
** Commenced operations on April 28, 2016.
In accordance with SEC regulations, the Fund's performance shown assumes and distributions were reinvested. The performance of Class A and Class IR shares will vary from the performance of Institutional Class shares and will be negatively impacted by additional fees assessed to those classes (where applicable).
Performance Compared to the ICE BofA 3-Month U.S. Treasury Bill Index(1) and the Lipper Ultra Short Obligations Funds Index(2)
| | | Period Ended September 30, 2023
Total Returns(3) | |
| | | | | Average Annual | |
| | | One
Year | | Five
Years | | Ten
Years | | Since
Inception(5) | |
Fund — Class IR Shares
w/o sales charges(4) | | | 5.03 | % | | | 1.91 | % | | | — | | | | 1.73 | % | |
Fund — Institutional Class Shares
w/o sales charges(4) | | | 4.97 | | | | 1.86 | | | | — | | | | 1.68 | | |
Fund — Class A Shares
w/o sales charges(4) | | | 4.92 | | | | 1.74 | | | | — | | | | 1.53 | | |
ICE BofA 3-Month U.S. Treasury
Bill Index | | | 4.47 | | | | 1.72 | | | | — | | | | 1.48 | | |
Lipper Ultra Short Obligations
Funds Index | | | 4.99 | | | | 1.85 | | | | — | | | | 1.75 | | |
Performance data quoted represents past performance, which is no guarantee of future results, and current performance may be lower or higher than the figures shown. Performance assumes that all dividends and distributions, if any, were reinvested. For the most recent month-end performance figures, please visit www.morganstanley.com/im. Investment returns and principal value will fluctuate so that Fund shares, when redeemed, may be worth more or less than their original cost. Total returns do not reflect the deduction of taxes that a shareholder would pay on Fund distributions or the redemption of Fund shares. Performance of share classes will vary due to differences in expenses. The Fund returns are calculated based on the net asset value as of the last business day of the period.
(1) The ICE BofA (Intercontinental Exchange Bank of America) 3-Month U.S. Treasury Bill Index tracks the performance of U.S. Treasury bills with a remaining maturity of three months. The Index is unmanaged and its returns do not include any sales charges or fees. Such costs would lower performance. It is not possible to invest directly in an index.
(2) The Lipper Ultra Short Obligations Funds Index is an equally weighted performance index of the largest qualifying funds (based on net assets) in the Lipper Ultra Short Obligations Funds classification. The Index, which is adjusted for capital gains distributions and income dividends, is unmanaged and should not be considered an investment. There are currently 30 funds represented in this Index. As of the date of this report, the Fund was in the Lipper Ultra Short Obligations' Funds classification.
(3) Total returns for the Fund reflect expenses waived and/or reimbursed, if applicable, by the Adviser. Without such waivers and/or reimbursements, total returns would have been lower.
(4) Commenced operations on April 28, 2016.
(5) For comparative purposes, average annual since inception returns listed for the Indexes refer to the inception date of the Fund, not the inception of the Indexes.
7
Morgan Stanley Institutional Fund Trust
Annual Report — September 30, 2023
Portfolio of Investments
Ultra-Short Income Portfolio
| | | Face
Amount
(000) | | Value
(000) | |
Certificates of Deposit (17.9%) | |
Domestic Banks (2.6%) | |
Bank of America NA, | |
5.80%, 5/28/24 | | $ | 100,000 | | | $ | 99,881 | | |
6.00%, 9/23/24 | | | 75,000 | | | | 75,009 | | |
Citibank NA | |
5.79%, 7/8/24 | | | 112,000 | | | | 111,787 | | |
| | | | 286,677 | | |
International Banks (15.3%) | |
Banco Santander SA, | |
5.89%, 1/19/24 | | | 75,000 | | | | 75,024 | | |
5.90%, 3/14/24 | | | 50,000 | | | | 49,999 | | |
6.05%, 9/11/24 | | | 100,000 | | | | 100,023 | | |
Bank of Nova Scotia | |
5.55%, 5/17/24 | | | 131,000 | | | | 130,663 | | |
Canadian Imperial Bank of Commerce | |
5.77%, 6/12/24 | | | 150,000 | | | | 149,798 | | |
National Bank of Kuwait SAKP, | |
5.68%, 12/14/23 | | | 150,000 | | | | 150,000 | | |
5.75%, 1/19/24 | | | 150,000 | | | | 149,877 | | |
5.95%, 12/14/23 | | | 200,000 | | | | 200,005 | | |
Natixis SA, | |
5.29%, 12/13/23 | | | 10,000 | | | | 9,992 | | |
5.94%, 6/14/24 | | | 25,000 | | | | 25,001 | | |
6.02%, 10/2/24 | | | 25,000 | | | | 25,000 | | |
Qatar National Bank | |
6.20%, 9/23/24 | | | 125,000 | | | | 117,768 | | |
Royal Bank of Canada | |
5.59%, 10/11/23 | | | 50,000 | | | | 50,001 | | |
Skandinaviska Enskilda Banken AB | |
6.01%, 8/9/24 | | | 102,000 | | | | 101,968 | | |
Swedbank AB | |
6.01%, 8/9/24 | | | 75,000 | | | | 75,021 | | |
Toronto-Dominion Bank, | |
5.48%, 4/19/24 | | | 116,500 | | | | 116,222 | | |
5.80%, 5/16/24 - 7/15/24 | | | 86,000 | | | | 85,910 | | |
5.88%, 6/14/24 | | | 75,000 | | | | 75,000 | | |
6.00%, 9/20/24 | | | 25,000 | | | | 25,019 | | |
Westpac Banking Corp. | |
5.58%, 3/8/24 | | | 4,310 | | | | 4,305 | | |
| | | | 1,716,596 | | |
Total Certificates of Deposit (Cost $2,004,590) | | | 2,003,273 | | |
Commercial Paper (a) (37.2%) | |
Asset-Backed Diversified Financial Services (3.7%) | |
Atlantic Asset Securitization LLC | |
5.42%, 12/5/23 | | | 50,000 | | | | 49,489 | | |
Cabot Trail Funding LLC | |
5.52%, 2/9/24 | | | 15,000 | | | | 14,690 | | |
Chariot Funding LLC, | |
5.66%, 12/13/23 | | | 100,000 | | | | 98,859 | | |
5.67%, 12/18/23 (b) | | | 173,500 | | | | 171,388 | | |
| | | Face
Amount
(000) | | Value
(000) | |
Equitable Short Term Funding LLC | |
5.58%, 11/8/23 (b) | | $ | 25,000 | | | $ | 24,851 | | |
Pacific Life Short Term Funding LLC | |
5.38%, 5/6/24 (b) | | | 10,000 | | | | 9,655 | | |
Thunder Bay Funding LLC | |
5.72%, 12/7/23 | | | 50,000 | | | | 49,480 | | |
| | | 418,412 | | |
Automobile (0.7%) | |
Mercedes-Benz Finance North America LLC, | |
5.37%, 10/27/23 | | | 14,000 | | | | 13,942 | | |
5.38%, 11/2/23 (b) | | | 40,000 | | | | 39,800 | | |
Toyota Financial Services de Puerto Rico, Inc. | |
5.41%, 10/5/23 | | | 22,000 | | | | 21,981 | | |
| | | | 75,723 | | |
Chemicals (5.2%) | |
BASF SE, | |
5.57%, 11/20/23 | | | 147,000 | | | | 145,844 | | |
5.58%, 11/21/23 | | | 40,000 | | | | 39,680 | | |
5.77%, 12/6/23 | | | 25,000 | | | | 24,742 | | |
5.78%, 12/18/23 - 12/19/23 | | | 295,000 | | | | 291,359 | | |
EIDP, Inc., | |
5.77%, 10/13/23 - 10/17/23 | | | 57,000 | | | | 56,859 | | |
5.84%, 12/7/23 | | | 5,000 | | | | 4,950 | | |
5.93%, 12/4/23 | | | 15,000 | | | | 14,855 | | |
| | | | 578,289 | | |
Communications (1.6%) | |
AT&T, Inc., | |
5.68%, 12/19/23 | | | 82,000 | | | | 80,975 | | |
5.80%, 2/23/24 | | | 21,625 | | | | 21,121 | | |
5.93%, 3/19/24 | | | 15,000 | | | | 14,588 | | |
Walt Disney Co. | |
5.71%, 3/26/24 | | | 65,000 | | | | 63,199 | | |
| | | | 179,883 | | |
Consumer, Non-Cyclical (2.2%) | |
LVMH Moet Hennessy Louis Vuitton, | |
5.77%, 6/6/24 | | | 80,000 | | | | 76,916 | | |
5.78%, 6/6/24 - 6/7/24 | | | 85,000 | | | | 81,714 | | |
5.80%, 6/10/24 | | | 65,000 | | | | 62,454 | | |
5.83%, 6/13/24 (b) | | | 22,000 | | | | 21,128 | | |
| | | | 242,212 | | |
Diversified Financial Services (0.6%) | |
Bay Square Funding LLC | |
6.05%, 9/18/24 | | | 50,000 | | | | 47,202 | | |
New York Life Short Term Funding LLC | |
5.33%, 10/4/23 | | | 20,000 | | | | 19,985 | | |
| | | 67,187 | | |
Domestic Banks (5.5%) | |
Barton Capital SA | |
5.46%, 11/1/23 | | | 50,000 | | | | 49,752 | | |
The accompanying notes are an integral part of the financial statements.
8
Morgan Stanley Institutional Fund Trust
Annual Report — September 30, 2023
Portfolio of Investments (cont'd)
Ultra-Short Income Portfolio
| | | Face
Amount
(000) | | Value
(000) | |
Domestic Banks (cont'd) | |
HSBC USA, Inc., | |
5.72%, 5/7/24 | | $ | 22,000 | | | $ | 21,203 | | |
5.93%, 5/17/24 | | | 35,000 | | | | 33,670 | | |
5.98%, 12/15/23 | | | 75,000 | | | | 74,108 | | |
6.01%, 12/8/23 | | | 74,000 | | | | 73,201 | | |
6.02%, 11/14/23 | | | 25,000 | | | | 24,825 | | |
6.25%, 6/3/24 - 6/6/24 (b) | | | 73,000 | | | | 69,977 | | |
6.26%, 6/7/24 | | | 25,000 | | | | 23,956 | | |
6.35%, 6/10/24 | | | 42,000 | | | | 40,223 | | |
6.39%, 7/12/24 | | | 25,000 | | | | 23,799 | | |
6.46%, 6/28/24 | | | 75,000 | | | | 71,582 | | |
6.47%, 8/22/24 | | | 14,250 | | | | 13,461 | | |
6.48%, 8/20/24 (b) | | | 48,000 | | | | 45,361 | | |
6.51%, 7/26/24 | | | 50,000 | | | | 47,472 | | |
| | | | 612,590 | | |
Finance (3.4%) | |
Barclays Capital, Inc., | |
5.68%, 12/19/23 | | | 100,000 | | | | 98,760 | | |
5.73%, 12/28/23 | | | 100,000 | | | | 98,616 | | |
5.75%, 12/18/23 | | | 32,000 | | | | 31,608 | | |
5.87%, 11/22/23 | | | 75,000 | | | | 74,388 | | |
6.15%, 7/24/24 | | | 30,000 | | | | 28,583 | | |
6.18%, 9/13/24 | | | 47,250 | | | | 44,653 | | |
Citigroup Global Markets, Inc. | |
5.47%, 12/14/23 | | | 9,350 | | | | 9,242 | | |
| | | | 385,850 | | |
Health Care Services (0.3%) | |
Catholic Health Initiatives, | |
5.68%, 12/7/23 | | | 14,154 | | | | 13,985 | | |
5.92%, 12/13/23 | | | 25,000 | | | | 24,675 | | |
| | | | 38,660 | | |
Insurance (1.2%) | |
Pricoa Short Term Funding LLC, | |
5.38%, 5/1/24 | | | 15,000 | | | | 14,496 | | |
5.92%, 6/17/24 | | | 75,000 | | | | 71,920 | | |
5.94%, 7/17/24 | | | 23,000 | | | | 21,947 | | |
Prudential Financial, Inc. | |
5.35%, 10/2/23 | | | 1,000 | | | | 999 | | |
Prudential Funding LLC | |
5.90%, 5/20/24 | | | 26,800 | | | | 25,825 | | |
| | | | 135,187 | | |
International Banks (12.8%) | |
Australia & New Zealand Banking Group Ltd. | |
5.85%, 4/22/24 | | | 4,000 | | | | 3,872 | | |
Barclays Bank PLC | |
5.98%, 7/9/24 (b) | | | 10,000 | | | | 9,549 | | |
Federation des Caisses Desjardins du Quebec | |
5.59%, 12/18/23 | | | 15,000 | | | | 14,817 | | |
Landesbank Baden-Wuerttemberg | |
5.34%, 10/3/23 - 10/6/23 | | | 506,000 | | | | 505,596 | | |
Lloyds Bank PLC | |
5.95%, 6/28/24 | | | 4,000 | | | | 3,828 | | |
| | | Face
Amount
(000) | | Value
(000) | |
Macquarie Bank Ltd., | |
5.41%, 10/4/23 (b) | | $ | 85,000 | | | $ | 84,937 | | |
5.49%, 11/24/23 | | | 75,000 | | | | 74,362 | | |
5.71%, 12/8/23 - 12/11/23 | | | 150,000 | | | | 148,366 | | |
5.72%, 12/15/23 (b) | | | 25,000 | | | | 24,704 | | |
5.99%, 5/10/24 | | | 20,000 | | | | 19,293 | | |
6.07%, 9/20/24 | | | 75,000 | | | | 70,799 | | |
National Australia Bank Ltd. | |
5.94%, 9/12/24 | | | 75,000 | | | | 70,954 | | |
Societe Generale SA, | |
5.62%, 2/26/24 (b) | | | 15,000 | | | | 14,675 | | |
5.82%, 11/10/23 (b) | | | 110,000 | | | | 109,319 | | |
6.38%, 7/1/24 (b) | | | 80,000 | | | | 76,507 | | |
Sumitomo Mitsui Trust Bank Ltd., | |
5.52%, 1/5/24 | | | 16,000 | | | | 15,759 | | |
5.61%, 12/14/23 | | | 35,000 | | | | 34,598 | | |
Suncorp Group Ltd. | |
5.52%, 11/6/23 | | | 19,000 | | | | 18,887 | | |
Toronto-Dominion Bank | |
6.00%, 8/23/24 | | | 52,500 | | | | 49,817 | | |
UBS AG | |
6.13%, 7/31/24 | | | 13,000 | | | | 12,371 | | |
Westpac Banking Corp. | |
5.93%, 9/6/24 | | | 70,000 | | | | 66,271 | | |
| | | 1,429,281 | | |
Total Commercial Paper (Cost $4,165,175) | | | 4,163,274 | | |
Corporate Bonds (0.9%) | |
Domestic Bank (0.6%) | |
JP Morgan Chase & Co. | |
3.88%, 2/1/24 (c) | | | 66,985 | | | | 66,518 | | |
Insurance (0.2%) | |
Equitable Financial Life Global Funding | |
0.50%, 11/17/23 (b) | | | 15,000 | | | | 14,906 | | |
International Banks (0.1%) | |
Federation des Caisses Desjardins du Quebec | |
0.70%, 5/21/24 (b) | | | 3,583 | | | | 3,466 | | |
Sumitomo Mitsui Trust Bank Ltd. | |
0.85%, 3/25/24 (b) | | | 11,353 | | | | 11,085 | | |
| | | | 14,551 | | |
Total Corporate Bonds (Cost $95,943) | | | 95,975 | | |
Floating Rate Notes (d) (32.1%) | |
Diversified Financial Services (1.1%) | |
Mizuho Markets Cayman LP, | |
SOFR + 0.52%, 5.90%, 12/22/23 (b) | | | 50,000 | | | | 50,039 | | |
SOFR + 0.60%, 6.00%, 3/20/24 | | | 75,000 | | | | 75,088 | | |
| | | | 125,127 | | |
Domestic Banks (2.5%) | |
Barton Capital SA, | |
SOFR + 0.47%, 5.78%, 12/1/23 | | | 100,000 | | | | 100,054 | | |
Citibank NA, | |
SOFR + 0.68%, 6.00%, 6/12/24 | | | 65,000 | | | | 65,090 | | |
The accompanying notes are an integral part of the financial statements.
9
Morgan Stanley Institutional Fund Trust
Annual Report — September 30, 2023
Portfolio of Investments (cont'd)
Ultra-Short Income Portfolio
| | | Face
Amount
(000) | | Value
(000) | |
Domestic Banks (cont'd) | |
Wells Fargo Bank NA, | |
SOFR + 0.65%, 5.96%, 7/3/24 | | $ | 114,500 | | | $ | 114,620 | | |
| | | | 279,764 | | |
Finance (1.0%) | |
American Express Co., | |
SOFR + 0.23%, 5.60%, 11/3/23 | | | 15,999 | | | | 15,998 | | |
J.P Morgan Securities LLC, | |
SOFR + 0.65%, 5.97%, 6/7/24 (b) | | | 100,000 | | | | 100,083 | | |
| | | | 116,081 | | |
International Banks (27.5%) | |
Bank of Montreal, | |
SOFR + 0.35%, 5.69%, 12/8/23 | | | 115,589 | | | | 115,591 | | |
SOFR + 0.75%, 6.06%, 12/1/23 | | | 200,000 | | | | 200,195 | | |
SOFR + 0.80%, 6.11%, 11/7/23 | | | 75,500 | | | | 75,550 | | |
MTN | |
SOFR + 0.71%, 6.06%, 3/8/24 (c) | | | 25,510 | | | | 25,545 | | |
Bank of Nova Scotia, | |
SOFR + 0.75%, 6.06%, 12/4/23 | | | 94,000 | | | | 94,096 | | |
MTN | |
SOFR + 0.96%, 6.30%, 3/11/24 | | | 15,361 | | | | 15,395 | | |
Barclays Bank PLC, | |
SOFR + 0.75%, 6.06%, 10/4/23 - 10/5/23 (b) | | | 75,000 | | | | 75,007 | | |
Canadian Imperial Bank of Commerce, | |
SOFR + 0.40%, 5.71%, 12/14/23 | | | 27,897 | | | | 27,900 | | |
SOFR + 0.66%, 5.97%, 6/7/24 | | | 150,000 | | | | 150,262 | | |
SOFR + 0.70%, 6.02%, 4/5/24 | | | 175,000 | | | | 175,409 | | |
Mizuho Bank Ltd., | |
SOFR + 0.56%, 5.88%, 3/14/24 | | | 100,000 | | | | 100,087 | | |
SOFR + 0.60%, 5.92%, 2/26/24 | | | 175,000 | | | | 175,187 | | |
Natixis SA, | |
SOFR + 0.36%, 5.67%, 11/1/23 | | | 42,000 | | | | 42,010 | | |
SOFR + 0.50%, 5.81%, 7/1/24 | | | 250,000 | | | | 250,063 | | |
Nordea Bank AB, | |
SOFR + 0.50%, 5.81%, 3/18/24 (b) | | | 40,000 | | | | 40,035 | | |
Nordea Bank ABP, | |
SOFR + 0.50%, 5.81%, 3/12/24 - 3/18/24 | | | 125,000 | | | | 125,106 | | |
SOFR + 0.51%, 5.82%, 3/15/24 | | | 50,000 | | | | 50,045 | | |
Royal Bank of Canada, | |
SOFR + 0.30%, 5.68%, 1/19/24 | | | 1,045 | | | | 1,045 | | |
SOFR + 0.75%, 6.06%, 11/29/23 (b) | | | 100,000 | | | | 100,094 | | |
MTN | |
SOFR + 0.45%, 5.81%, 10/26/23 | | | 28,691 | | | | 28,691 | | |
Skandinaviska Enskilda Banken AB, | |
SOFR + 0.65%, 5.97%, 6/12/24 (b) | | | 131,000 | | | | 131,160 | | |
Societe Generale SA, | |
SOFR + 0.68%, 5.99%, 6/27/24 (b) | | | 35,000 | | | | 35,051 | | |
SOFR + 0.82%, 6.13%, 12/11/23 (b) | | | 22,000 | | | | 22,027 | | |
SOFR + 0.90%, 6.21%, 11/20/23 (b) | | | 90,000 | | | | 90,094 | | |
| | | Face
Amount
(000) | | Value
(000) | |
Sumitomo Mitsui Banking Corp., | |
SOFR + 0.58%, 5.89%, 2/23/24 | | $ | 18,000 | | | $ | 18,018 | | |
SOFR + 0.60%, 5.91%, 12/5/23 | | | 125,000 | | | | 125,098 | | |
SOFR + 0.70%, 6.01%, 6/6/24 | | | 100,000 | | | | 100,124 | | |
SOFR + 0.92%, 6.23%, 11/30/23 | | | 150,000 | | | | 150,192 | | |
SOFR + 0.95%, 6.26%, 10/25/23 | | | 101,000 | | | | 101,057 | | |
Svenska Handelsbanken AB, | |
SOFR + 0.67%, 5.99%, 4/5/24 | | | 183,000 | | | | 183,315 | | |
SOFR + 0.72%, 6.04%, 12/5/23 | | | 180,000 | | | | 180,187 | | |
Toronto-Dominion Bank, | |
SOFR + 0.36%, 5.71%, 3/4/24 (c) | | | 41,413 | | | | 41,412 | | |
MTN | |
SOFR + 0.91%, 6.25%, 3/8/24 | | | 25,189 | | | | 25,242 | | |
| | | 3,070,290 | | |
Total Floating Rate Notes (Cost $3,587,753) | | | 3,591,262 | | |
Repurchase Agreements (10.6%) | |
Bank of America Securities, Inc., (5.77% (d), dated
1/27/23, due 1/26/24; proceeds $232,835;
fully collateralized by various Common Stocks
and Preferred Stocks; valued at $231,000)
(Demand 10/2/23) (e) | | | 220,000 | | | | 220,000 | | |
BMO Capital Markets Corp., (5.42%, dated
9/29/23, due 10/2/23; proceeds $1,000; fully
collateralized by various Corporate Bonds,
0.90% - 6.15%, due 3/25/24 - 12/1/49;
valued at $1,051) | | | 1,000 | | | | 1,000 | | |
BNP Paribas SA, (5.53% (d), dated 6/29/22, due
10/6/23; proceeds $246,393; fully collateralized
by various Corporate Bonds, 2.45% - 12.75%,
due 2/15/25 - 10/1/33; valued at $243,800)
(Demand 10/2/23) | | | 230,000 | | | | 230,000 | | |
Citigroup Global Markets, Inc., (5.94% (d), dated
11/14/22, due 1/2/24; proceeds $213,685;
fully collateralized by various Corporate Bonds,
3.13% - 12.75%, due 4/1/24 - 6/1/60; valued
at $212,000) (Demand 10/2/23) (e) | | | 200,000 | | | | 200,000 | | |
ING Financial Markets LLC, (5.40%, dated
9/29/23, due 10/2/23; proceeds $5,002; fully
collateralized by various Corporate Bonds,
1.95% - 6.50%, due 9/29/25 - 12/31/79;
valued at $5,251) | | | 5,000 | | | | 5,000 | | |
JP Morgan Securities LLC, (5.57% (d), dated
11/17/21, due 10/6/23; proceeds $77,451;
fully collateralized by various Convertable Bonds,
0.00% - 5.00%, due 3/15/26 - 11/1/26; valued
at $75,346) (Demand 10/2/23) (e) | | | 70,000 | | | | 70,000 | | |
JP Morgan Securities LLC, (5.77% (d), dated
1/5/23, due 12/28/23; proceeds $306,594;
fully collateralized by various Corporate Bonds,
2.15% - 11.50%, due 11/26/24 - 4/15/32;
valued at $308,835) (Demand 10/2/23) (e) | | | 290,000 | | | | 290,000 | | |
Pershing LLC, (5.64%, dated 9/29/23, due
10/2/23; proceeds $25,012; fully collateralized
by various Corporate Bonds, 1.60% - 9.62%,
due 6/14/24 - 12/31/79; valued at $26,428) (e) | | | 25,000 | | | | 25,000 | | |
The accompanying notes are an integral part of the financial statements.
10
Morgan Stanley Institutional Fund Trust
Annual Report — September 30, 2023
Portfolio of Investments (cont'd)
Ultra-Short Income Portfolio
| | | Face
Amount
(000) | | Value
(000) | |
Repurchase Agreements (cont'd) | |
Societe Generale SA, (5.47%, dated 9/29/23,
due 10/2/23; proceeds $55,025; fully
collateralized by various Corporate Bonds,
0.82% - 11.00%, due 2/29/24 - 12/31/79;
valued at $58,077) (e) | | $ | 55,000 | | | $ | 55,000 | | |
Wells Fargo Securities LLC, (5.71%, dated
9/15/23, due 12/14/23; proceeds $90,270;
fully collateralized by various Common Stocks;
valued at $93,450) (e) | | | 89,000 | | | | 89,000 | | |
Total Repurchase Agreements (Cost $1,185,000) | | | 1,185,000 | | |
Time Deposits (1.8%) | |
Domestic Bank (1.5%) | |
DNB Bank ASA (New York Branch) | |
5.30%, 10/2/23 | | | 164,000 | | | | 164,000 | | |
International Bank (0.3%) | |
Credit Agricole Corporate and Investment Bank | |
5.30%, 10/2/23 | | | 32,000 | | | | 32,000 | | |
Total Time Deposits (Cost $196,000) | | | 196,000 | | |
Total Investments (100.5%) (Cost $11,234,461) (f)(g) | | | 11,234,784 | | |
Liabilities in Excess of Other Assets (–0.5%) | | | (56,767 | ) | |
Net Assets (100.0%) | | $ | 11,178,017 | | |
(a) The rates shown are the effective yields at the date of purchase.
(b) 144A security — Certain conditions for public sale may exist. Unless otherwise noted, these securities are deemed to be liquid.
(c) All or a portion of the security is subject to delayed delivery.
(d) Floating or variable rate securities: The rates disclosed are as of September 30, 2023. For securities based on a published reference rate and spread, the reference rate and spread are indicated in the description in the Portfolio of Investments. Certain variable rate securities may not be based on a published reference rate and spread but are determined by the issuer or agent and are based on current market conditions. These securities do not indicate a reference rate and spread in their description in the Portfolio of Investments.
(e) Perpetual — One or more securities do not have a predetermined maturity date. Rates for these securities are fixed for a period of time after which they revert to a floating rate. Interest rates in effect are as of September 30, 2023.
(f) Securities are available for collateral in connection with securities purchased on a forward commitment basis.
(g) At September 30, 2023, the aggregate cost for federal income tax purposes is approximately $11,234,461,000. The aggregate gross unrealized appreciation is approximately $3,885,000 and the aggregate gross unrealized depreciation is approximately $3,562,000, resulting in net unrealized appreciation of approximately $323,000.
MTN Medium Term Note.
SOFR Secured Overnight Financing Rate.
Portfolio Composition
Classification | | Percentage of
Total Investments | |
Commercial Paper | | | 37.1 | % | |
Floating Rate Notes | | | 32.0 | | |
Certificates of Deposit | | | 17.8 | | |
Repurchase Agreements | | | 10.5 | | |
Other* | | | 2.6 | | |
Total Investments | | | 100.0 | % | |
* Industries and/or investment types representing less than 5% of total investments.
The accompanying notes are an integral part of the financial statements.
11
Morgan Stanley Institutional Fund Trust
Annual Report — September 30, 2023
Ultra-Short Income Portfolio
Statement of Assets and Liabilities | | September 30, 2023
(000) | |
Assets: | |
Investments in Securities of Unaffiliated Issuers, at Value (Cost $11,234,461, including value of repurchase agreements of $1,185,000) | | $ | 11,234,784 | | |
Cash | | | 1,914 | | |
Interest Receivable | | | 58,022 | | |
Receivable for Fund Shares Sold | | | 11,306 | | |
Other Assets | | | 1,077 | | |
Total Assets | | | 11,307,103 | | |
Liabilities: | |
Payable for Investments Purchased | | | 75,788 | | |
Payable for Fund Shares Redeemed | | | 43,131 | | |
Dividends Payable | | | 4,350 | | |
Payable for Advisory Fees | | | 3,976 | | |
Payable for Administration Fees | | | 759 | | |
Payable for Shareholder Services Fees — Institutional Class | | | 60 | | |
Payable for Shareholder Services Fees — Class A | | | 415 | | |
Payable for Custodian Fees | | | 51 | | |
Payable for Professional Fees | | | 50 | | |
Payable for Transfer Agency Fees — Class IR | | | 10 | | |
Payable for Transfer Agency Fees — Institutional Class | | | 4 | | |
Payable for Transfer Agency Fees — Class A | | | 3 | | |
Other Liabilities | | | 489 | | |
Total Liabilities | | | 129,086 | | |
Net Assets | | $ | 11,178,017 | | |
Net Assets Consist of: | |
Paid-in-Capital | | $ | 11,240,191 | | |
Total Accumulated Loss | | | (62,174 | ) | |
Net Assets | | $ | 11,178,017 | | |
CLASS IR: | |
Net Assets | | $ | 4,879,799 | | |
| Shares Outstanding (unlimited number of shares authorized, no par value) (not in 000's) | | | 489,074,616 | | |
Net Asset Value, Offering and Redemption Price Per Share | | $ | 9.98 | | |
INSTITUTIONAL CLASS: | |
Net Assets | | $ | 1,447,215 | | |
| Shares Outstanding (unlimited number of shares authorized, no par value) (not in 000's) | | | 145,039,058 | | |
Net Asset Value, Offering and Redemption Price Per Share | | $ | 9.98 | | |
CLASS A: | |
Net Assets | | $ | 4,851,003 | | |
| Shares Outstanding (unlimited number of shares authorized, no par value) (not in 000's) | | | 486,273,376 | | |
Net Asset Value, Offering and Redemption Price Per Share | | $ | 9.98 | | |
The accompanying notes are an integral part of the financial statements.
12
Morgan Stanley Institutional Fund Trust
Annual Report — September 30, 2023
Ultra-Short Income Portfolio
Statement of Operations | | Year Ended
September 30, 2023
(000) | |
Investment Income: | |
Interest from Securities of Unaffiliated Issuers | | $ | 571,008 | | |
Expenses: | |
Advisory Fees (Note B) | | | 22,524 | | |
Shareholder Services Fees — Institutional Class (Note D) | | | 807 | | |
Shareholder Services Fees — Class A (Note D) | | | 11,787 | | |
Administration Fees (Note C) | | | 9,009 | | |
Registration Fees | | | 1,289 | | |
Custodian Fees (Note F) | | | 189 | | |
Trustees' Fees and Expenses | | | 176 | | |
Professional Fees | | | 151 | | |
Transfer Agency Fees — Class IR (Note E) | | | 45 | | |
Transfer Agency Fees — Institutional Class (Note E) | | | 19 | | |
Transfer Agency Fees — Class A (Note E) | | | 14 | | |
Shareholder Reporting Fees | | | 49 | | |
Pricing Fees | | | 1 | | |
Other Expenses | | | 380 | | |
Total Expenses | | | 46,440 | | |
Waiver of Advisory Fees (Note B) | | | (5,614 | ) | |
Reimbursement of Class Specific Expenses — Class IR (Note B) | | | (45 | ) | |
Reimbursement of Class Specific Expenses — Institutional Class (Note B) | | | (19 | ) | |
Waiver of Shareholder Services Fees — Class A (Note D) | | | (7,072 | ) | |
Net Expenses | | | 33,690 | | |
Net Investment Income | | | 537,318 | | |
Realized Gain: | |
Investments Sold | | | 46 | | |
Change in Unrealized Appreciation (Depreciation): | |
Investments | | | 11,970 | | |
Net Realized Gain and Change in Unrealized Appreciation (Depreciation) | | | 12,016 | | |
Net Increase in Net Assets Resulting from Operations | | $ | 549,334 | | |
The accompanying notes are an integral part of the financial statements.
13
Morgan Stanley Institutional Fund Trust
Annual Report — September 30, 2023
Ultra-Short Income Portfolio
Statements of Changes in Net Assets | | Year Ended
September 30, 2023
(000) | | Year Ended
September 30, 2022
(000) | |
Increase (Decrease) in Net Assets: | |
Operations: | |
Net Investment Income | | $ | 537,318 | | | $ | 90,977 | | |
Net Realized Gain | | | 46 | | | | 235 | | |
Net Change in Unrealized Appreciation (Depreciation) | | | 11,970 | | | | (14,783 | ) | |
Net Increase in Net Assets Resulting from Operations | | | 549,334 | | | | 76,429 | | |
Dividends and Distributions to Shareholders: | |
Class IR | | | (237,467 | ) | | | (40,463 | ) | |
Institutional Class | | | (75,947 | ) | | | (15,723 | ) | |
Class A | | | (223,904 | ) | | | (34,791 | ) | |
Total Dividends and Distributions to Shareholders | | | (537,318 | ) | | | (90,977 | ) | |
Capital Share Transactions:(1) | |
Class IR: | |
Subscribed | | | 6,283,629 | | | | 7,214,321 | | |
Distributions Reinvested | | | 194,526 | | | | 30,579 | | |
Redeemed | | | (6,549,877 | ) | | | (7,307,703 | ) | |
Institutional Class: | |
Subscribed | | | 1,331,405 | | | | 2,043,532 | | |
Distributions Reinvested | | | 76,064 | | | | 15,376 | | |
Redeemed | | | (1,968,576 | ) | | | (1,884,107 | ) | |
Class A: | |
Subscribed | | | 3,934,159 | | | | 2,260,850 | | |
Distributions Reinvested | | | 223,899 | | | | 34,037 | | |
Redeemed | | | (3,763,110 | ) | | | (3,810,471 | ) | |
Net Decrease in Net Assets Resulting from Capital Share Transactions | | | (237,881 | ) | | | (1,403,586 | ) | |
Total Decrease in Net Assets | | | (225,865 | ) | | | (1,418,134 | ) | |
Net Assets: | |
Beginning of Period | | | 11,403,882 | | | | 12,822,016 | | |
End of Period | | $ | 11,178,017 | | | $ | 11,403,882 | | |
(1) Capital Share Transactions: | |
Class IR: | |
Shares Subscribed | | | 629,870 | | | | 723,399 | | |
Shares Issued on Distributions Reinvested | | | 19,501 | | | | 3,067 | | |
Shares Redeemed | | | (656,519 | ) | | | (732,632 | ) | |
Net Decrease in Class IR Shares Outstanding | | | (7,148 | ) | | | (6,166 | ) | |
Institutional Class: | |
Shares Subscribed | | | 133,403 | | | | 204,843 | | |
Shares Issued on Distributions Reinvested | | | 7,624 | | | | 1,542 | | |
Shares Redeemed | | | (197,293 | ) | | | (188,909 | ) | |
Net Increase (Decrease) in Institutional Class Shares Outstanding | | | (56,266 | ) | | | 17,476 | | |
Class A: | |
Shares Subscribed | | | 394,450 | | | | 226,710 | | |
Shares Issued on Distributions Reinvested | | | 22,446 | | | | 3,414 | | |
Shares Redeemed | | | (377,277 | ) | | | (382,083 | ) | |
Net Increase (Decrease) in Class A Shares Outstanding | | | 39,619 | | | | (151,959 | ) | |
The accompanying notes are an integral part of the financial statements.
14
Morgan Stanley Institutional Fund Trust
Annual Report — September 30, 2023
Financial Highlights
Ultra-Short Income Portfolio
| | | Class IR | |
| | | Year Ended September 30, | |
Selected Per Share Data and Ratios | | 2023 | | 2022 | | 2021 | | 2020 | | 2019 | |
Net Asset Value, Beginning of Period | | $ | 9.97 | | | $ | 9.98 | | | $ | 9.99 | | | $ | 10.02 | | | $ | 10.01 | | |
Income (Loss) from Investment Operations: | |
Net Investment Income(1) | | | 0.48 | | | | 0.10 | | | | 0.02 | | | | 0.13 | | | | 0.25 | | |
Net Realized and Unrealized Gain (Loss) | | | 0.01 | | | | (0.02 | ) | | | (0.01 | ) | | | (0.03 | ) | | | 0.01 | | |
Total from Investment Operations | | | 0.49 | | | | 0.08 | | | | 0.01 | | | | 0.10 | | | | 0.26 | | |
Distributions from and/or in Excess of: | |
Net Investment Income | | | (0.48 | ) | | | (0.09 | ) | | | (0.02 | ) | | | (0.13 | ) | | | (0.25 | ) | |
Net Asset Value, End of Period | | $ | 9.98 | | | $ | 9.97 | | | $ | 9.98 | | | $ | 9.99 | | | $ | 10.02 | | |
Total Return(2) | | | 5.03 | % | | | 0.79 | % | | | 0.10 | % | | | 1.03 | % | | | 2.68 | % | |
Ratios to Average Net Assets and Supplemental Data: | |
Net Assets, End of Period (Thousands) | | $ | 4,879,799 | | | $ | 4,945,966 | | | $ | 5,014,307 | | | $ | 5,388,750 | | | $ | 4,765,201 | | |
Ratio of Expenses Before Expense Limitation | | | 0.30 | % | | | 0.29 | % | | | 0.30 | % | | | 0.31 | % | | | 0.30 | % | |
Ratio of Expenses After Expense Limitation | | | 0.25 | % | | | 0.20 | % | | | 0.18 | % | | | 0.24 | % | | | 0.24 | % | |
Ratio of Expenses After Expense Limitation Excluding Interest Expenses | | | N/A | | | | N/A | | | | N/A | | | | 0.24 | % | | | 0.24 | % | |
Ratio of Net Investment Income | | | 4.82 | % | | | 0.96 | % | | | 0.21 | % | | | 1.34 | % | | | 2.53 | % | |
Portfolio Turnover Rate | | | N/A(3) | | | | N/A(3) | | | | N/A(3) | | | | N/A(3) | | | | N/A(3) | | |
(1) Per share amount is based on average shares outstanding.
(2) Calculated based on the net asset value as of the last business day of the period.
(3) During the reporting period, the Fund did not hold any long-term investments and accordingly portfolio turnover is not applicable.
The accompanying notes are an integral part of the financial statements.
15
Morgan Stanley Institutional Fund Trust
Annual Report — September 30, 2023
Financial Highlights
Ultra-Short Income Portfolio
| | | Institutional Class | |
| | | Year Ended September 30, | |
Selected Per Share Data and Ratios | | 2023 | | 2022 | | 2021 | | 2020 | | 2019 | |
Net Asset Value, Beginning of Period | | $ | 9.97 | | | $ | 9.98 | | | $ | 9.99 | | | $ | 10.02 | | | $ | 10.01 | | |
Income (Loss) from Investment Operations: | |
Net Investment Income(1) | | | 0.47 | | | | 0.08 | | | | 0.02 | | | | 0.14 | | | | 0.25 | | |
Net Realized and Unrealized Gain (Loss) | | | 0.01 | | | | (0.01 | ) | | | (0.01 | ) | | | (0.04 | ) | | | 0.01 | | |
Total from Investment Operations | | | 0.48 | | | | 0.07 | | | | 0.01 | | | | 0.10 | | | | 0.26 | | |
Distributions from and/or in Excess of: | |
Net Investment Income | | | (0.47 | ) | | | (0.08 | ) | | | (0.02 | ) | | | (0.13 | ) | | | (0.25 | ) | |
Net Asset Value, End of Period | | $ | 9.98 | | | $ | 9.97 | | | $ | 9.98 | | | $ | 9.99 | | | $ | 10.02 | | |
Total Return(2) | | | 4.97 | % | | | 0.74 | % | | | 0.05 | % | | | 0.98 | % | | | 2.62 | % | |
Ratios to Average Net Assets and Supplemental Data: | |
Net Assets, End of Period (Thousands) | | $ | 1,447,215 | | | $ | 2,006,592 | | | $ | 1,834,410 | | | $ | 2,544,657 | | | $ | 3,085,210 | | |
Ratio of Expenses Before Expense Limitation | | | 0.35 | % | | | 0.34 | % | | | 0.35 | % | | | 0.36 | % | | | 0.34 | % | |
Ratio of Expenses After Expense Limitation | | | 0.30 | % | | | 0.25 | % | | | 0.23 | % | | | 0.29 | % | | | 0.29 | % | |
Ratio of Expenses After Expense Limitation Excluding Interest Expenses | | | N/A | | | | N/A | | | | N/A | | | | 0.29 | % | | | 0.29 | % | |
Ratio of Net Investment Income | | | 4.77 | % | | | 0.79 | % | | | 0.16 | % | | | 1.39 | % | | | 2.48 | % | |
Portfolio Turnover Rate | | | N/A(3) | | | | N/A(3) | | | | N/A(3) | | | | N/A(3) | | | | N/A(3) | | |
(1) Per share amount is based on average shares outstanding.
(2) Calculated based on the net asset value as of the last business day of the period.
(3) During the reporting period, the Fund did not hold any long-term investments and accordingly portfolio turnover is not applicable.
The accompanying notes are an integral part of the financial statements.
16
Morgan Stanley Institutional Fund Trust
Annual Report — September 30, 2023
Financial Highlights
Ultra-Short Income Portfolio
| | | Class A | |
| | | Year Ended September 30, | |
Selected Per Share Data and Ratios | | 2023 | | 2022 | | 2021 | | 2020 | | 2019 | |
Net Asset Value, Beginning of Period | | $ | 9.97 | | | $ | 9.98 | | | $ | 9.99 | | | $ | 10.02 | | | $ | 10.01 | | |
Income (Loss) from Investment Operations: | |
Net Investment Income(1) | | | 0.47 | | | | 0.07 | | | | 0.01 | | | | 0.12 | | | | 0.23 | | |
Net Realized and Unrealized Gain (Loss) | | | 0.01 | | | | 0.00 | (2) | | | (0.01 | ) | | | (0.04 | ) | | | 0.01 | | |
Total from Investment Operations | | | 0.48 | | | | 0.07 | | | | (0.00 | )(2) | | | 0.08 | | | | 0.24 | | |
Distributions from and/or in Excess of: | |
Net Investment Income | | | (0.47 | ) | | | (0.08 | ) | | | (0.01 | ) | | | (0.11 | ) | | | (0.23 | ) | |
Net Asset Value, End of Period | | $ | 9.98 | | | $ | 9.97 | | | $ | 9.98 | | | $ | 9.99 | | | $ | 10.02 | | |
Total Return(3) | | | 4.92 | % | | | 0.67 | % | | | (0.03 | )% | | | 0.80 | % | | | 2.42 | % | |
Ratios to Average Net Assets and Supplemental Data: | |
Net Assets, End of Period (Thousands) | | $ | 4,851,003 | | | $ | 4,451,324 | | | $ | 5,973,299 | | | $ | 9,923,736 | | | $ | 10,784,226 | | |
Ratio of Expenses Before Expense Limitation | | | 0.55 | % | | | 0.54 | % | | | 0.55 | % | | | 0.56 | % | | | 0.55 | % | |
Ratio of Expenses After Expense Limitation | | | 0.35 | % | | | 0.31 | % | | | 0.32 | % | | | 0.46 | % | | | 0.49 | % | |
Ratio of Expenses After Expense Limitation Excluding Interest Expenses | | | N/A | | | | N/A | | | | N/A | | | | 0.46 | % | | | 0.49 | % | |
Ratio of Net Investment Income | | | 4.72 | % | | | 0.70 | % | | | 0.08 | % | | | 1.16 | % | | | 2.29 | % | |
Portfolio Turnover Rate | | | N/A(4) | | | | N/A(4) | | | | N/A(4) | | | | N/A(4) | | | | N/A(4) | | |
(1) Per share amount is based on average shares outstanding.
(2) Amount is less than $0.005 per share.
(3) Calculated based on the net asset value as of the last business day of the period.
(4) During the reporting period, the Fund did not hold any long-term investments and accordingly portfolio turnover is not applicable.
The accompanying notes are an integral part of the financial statements.
17
Morgan Stanley Institutional Fund Trust
Annual Report — September 30, 2023
Notes to Financial Statements
Morgan Stanley Institutional Fund Trust ("Trust") is registered under the Investment Company Act of 1940, as amended (the "Act"), as an open-end management investment company. The Trust is comprised of nine separate, active funds (individually referred to as a "Fund," collectively as the "Funds"). All Funds are considered diversified for purposes of the Act.
The Trust applies investment company accounting and reporting guidance Accounting Standards Codification ("ASC"). In the preparation of these financial statements, management has evaluated subsequent events occurring after the date of the Fund's Statement of Assets and Liabilities through the date that the financial statements were issued.
The accompanying financial statements relate to the Ultra-Short Income Portfolio. The Fund seeks current income with capital preservation while maintaining liquidity. The Fund offers three classes of shares — Class IR, Institutional Class and Class A.
A. Significant Accounting Policies: The following significant accounting policies are in conformity with U.S. generally accepted accounting principles ("GAAP"). Such policies are consistently followed by the Trust in the preparation of its financial statements. GAAP may require management to make estimates and assumptions that affect the reported amounts and disclosures in the financial statements. Actual results may differ from those estimates.
1. Security Valuation: (1) Fixed income securities may be valued by an outside pricing service/vendor approved by the Trust's Board of Trustees (the "Trustees"). The pricing service/vendor may employ a pricing model that takes into account, among other things, bids, yield spreads and/or other market data and specific security characteristics. If Morgan Stanley Investment Management Inc. (the "Adviser") a wholly-owned subsidiary of Morgan Stanley, determines that the price provided by the outside pricing service/vendor does not reflect the security's fair value or is unable to provide a price, prices from brokers/dealers may also be utilized. In these circumstances, the value of the security will be the mean of bid and asked prices obtained from reputable brokers/dealers; and (2) when market quotations are not readily available, as defined by Rule 2a-5 under the Act, including circumstances under which the Adviser determines that the closing price, last sale price or the mean between the last reported bid and asked prices are not reflective of a security's market value, portfolio securities are valued at their fair value as determined in good
faith under procedures approved by and under the general supervision of the Trustees. Occasionally, developments affecting the closing prices of securities and other assets may occur between the times at which valuations of such securities are determined (that is, close of the foreign market on which the securities trade) and the close of business of the New York Stock Exchange ("NYSE"). If developments occur during such periods that are expected to materially affect the value of such securities, such valuations may be adjusted to reflect the estimated fair value of such securities as of the close of the NYSE, as determined in good faith by the Trustees or by the Adviser using a pricing service and/or procedures approved by the Trustees.
In connection with Rule 2a-5 of the Act, the Trustees have designated the Trust's Adviser as its valuation designee. The valuation designee has responsibility for determining fair value and to make the actual calculations pursuant to the fair valuation methodologies previously approved by the Trustees. Under procedures approved by the Trustees, the Trust's Adviser, as valuation designee, has formed a Valuation Committee whose members are approved by the Trustees. The Valuation Committee provides administration and oversight of the Trust's valuation policies and procedures, which are reviewed at least annually by the Trustees. These procedures allow the Trust to utilize independent pricing services, quotations from securities and financial instrument dealers and other market sources to determine fair value.
2. Fair Value Measurement: Financial Accounting Standards Board ("FASB") ASC 820, "Fair Value Measurement" ("ASC 820"), defines fair value as the price that would be received to sell an asset or pay to transfer a liability in an orderly transaction between market participants at the measurement date. ASC 820 establishes a three-tier hierarchy to distinguish between (1) inputs that reflect the assumptions market participants would use in valuing an asset or liability developed based on market data obtained from sources independent of the reporting entity (observable inputs) and (2) inputs that reflect the reporting entity's own assumptions about the assumptions market participants would use in valuing an asset or liability developed based on the best information available in the circumstances (unobservable inputs) and to establish classification of fair value measurements for disclosure purposes. Various inputs are used in determining the value
18
Morgan Stanley Institutional Fund Trust
Annual Report — September 30, 2023
Notes to Financial Statements (cont'd)
of the Fund's investments. The inputs are summarized in the three broad levels listed below:
• Level 1 – unadjusted quoted prices in active markets for identical investments
• Level 2 – other significant observable inputs (including quoted prices for similar investments, interest rates, prepayment speeds, credit risk, etc.)
• Level 3 – significant unobservable inputs including the Fund's own assumptions in determining the fair value of investments. Factors considered in making this determination may include, but are not limited to, information obtained by contacting the issuer, analysts, or the appropriate stock exchange (for exchange-traded securities), analysis of the issuer's financial statements or other available documents and, if necessary, available information concerning other securities in similar circumstances.
The inputs or methodology used for valuing securities are not necessarily an indication of the risk associated with investing in those securities and the determination of the significance of a particular input to the fair value measurement in its entirety requires judgment and considers factors specific to each security.
The following is a summary of the inputs used to value the Fund's investments as of September 30, 2023:
Investment Type | | Level 1
Unadjusted
quoted
prices
(000) | | Level 2
Other
significant
observable
inputs
(000) | | Level 3
Significant
unobservable
inputs
(000) | | Total
(000) | |
Assets: | |
Short-Term
Investments | |
Certificates of
Deposit | | $ | — | | | $ | 2,003,273 | | | $ | — | | | $ | 2,003,273 | | |
Commercial Paper | | | — | | | | 4,163,274 | | | | — | | | | 4,163,274 | | |
Corporate Bonds | | | — | | | | 95,975 | | | | — | | | | 95,975 | | |
Floating Rate Notes | | | — | | | | 3,591,262 | | | | — | | | | 3,591,262 | | |
Repurchase
Agreements | | | — | | | | 1,185,000 | | | | — | | | | 1,185,000 | | |
Time Deposits | | | — | | | | 196,000 | | | | — | | | | 196,000 | | |
Total Short-Term
Investments | | | — | | | | 11,234,784 | | | | — | | | | 11,234,784 | | |
Total Assets | | $ | — | | | $ | 11,234,784 | | | $ | — | | | $ | 11,234,784 | | |
Transfers between investment levels may occur as the markets fluctuate and/or the availability of data used in an investment's valuation changes.
3. Repurchase Agreements: The Fund may enter into repurchase agreements under which the Fund lends cash and takes possession of securities with an agreement that the counterparty will repurchase such securities. In connection with transactions in repurchase agreements, a bank as custodian for the Fund takes possession of the underlying securities which are held as collateral, with a market value at least equal to the amount of the repurchase transaction, including principal and accrued interest. To the extent that any repurchase transaction exceeds one business day, the value of the collateral is marked-to-market on a daily basis to determine that the value of the collateral does not decrease below the repurchase price plus accrued interest as earned. If such a decrease occurs, additional collateral will be requested and, when received, will be added to the account to maintain full collateralization. In the event of default on the obligation to repurchase, the Fund has the right to liquidate the collateral and apply the proceeds in satisfaction of the obligation. In the event of default or bankruptcy by the counterparty to the agreement, realization and/or retention of the collateral or proceeds may be subject to legal proceedings. The Fund, along with other affiliated investment companies, may utilize a joint trading account for the purpose of entering into repurchase agreements.
The Fund may enter into repurchase agreements in which eligible securities are transferred into joint trading accounts maintained by the custodian for investment companies advised by the Fund's Adviser. The Fund will participate on a pro rata basis with the other investment companies in its share of the securities transferred under such repurchase agreements and in its share of proceeds from any repurchase or other disposition of such securities.
Repurchase agreements are subject to Master Repurchase Agreements which are agreements between the Fund and its counterparties that typically include provisions which provide for the net settlement of all transactions and collateral with the Fund, through a single payment, in the event of default or termination. Amounts presented on the Portfolio of Investments and Statement of Assets and Liabilities are not net settlement
19
Morgan Stanley Institutional Fund Trust
Annual Report — September 30, 2023
Notes to Financial Statements (cont'd)
amounts but gross. As indicated on the Portfolio of Investments, the cash or securities to be repurchased exceeds the repurchase price to be paid under the repurchase agreement reducing the net settlement amount to zero.
4. Indemnifications: The Trust enters into contracts that contain a variety of indemnification clauses. The Trust's maximum exposure under these arrangements is unknown as this would involve future claims that may be made against the Fund that have not yet occurred.
5. Dividends and Distributions to Shareholders: Dividends and distributions to shareholders are recorded on the close of each business day. Dividends from net investment income are declared daily and paid monthly. Net realized capital gains, if any, are distributed at least annually.
6. Security Transactions, Income and Expenses: Security transactions are accounted for on the trade date (date the order to buy or sell is executed). Realized gains and losses on the sale of investment securities are determined on the specific identified cost method. Dividend income and other distributions are recorded on the ex-dividend date (except for certain foreign dividends which may be recorded as soon as the Fund is informed of such dividends) net of applicable withholding taxes. Non-cash dividends received in the form of stock, if any, are recognized on the ex-dividend date and recorded as non-cash dividend income at fair value. Interest income is recognized on the accrual basis (except where collection is in doubt) net of applicable withholding taxes. Discounts are accreted and premiums are amortized over the life of the respective securities. Most expenses of the Trust can be directly attributed to a particular Fund. Expenses which cannot be directly attributed are apportioned among the Funds based upon relative net assets or other appropriate methods. Income, expenses (other than class specific expenses — distribution and shareholder services and transfer agency fees) and realized and unrealized gains or losses are allocated to each class of shares based upon their relative net assets.
B. Advisory Fees: The Adviser, a wholly-owned subsidiary of Morgan Stanley, provides the Fund with advisory services under the terms of an Investment Advisory Agreement, paid quarterly, at an annual rate of 0.20% of the average daily net assets of the Fund.
The Adviser has agreed to reduce its advisory fee and/or reimburse the Fund so that total annual Fund operating expenses, excluding certain investment related expenses, taxes, interest and other extraordinary expenses (including litigation), will not exceed 0.25% for Class IR shares, 0.30% for Institutional Class shares and 0.40% for Class A shares. The fee waivers and/or expense reimbursements will continue for at least one year from the date of the Fund's prospectus or until such time as the Trustees act to discontinue all or a portion of such waivers and/or reimbursements when they deem such action is appropriate. In addition, the Adviser may make additional voluntary fee waivers and/or expense reimbursements. The ratios of expenses to average net assets disclosed in the Fund's Financial Highlights may be lower than the maximum expense ratios due to these additional fee waivers and/or expense reimbursements. For the year ended September 30, 2023, approximately $5,614,000 of advisory fees were waived and approximately $64,000 of other expenses were reimbursed by the Adviser pursuant to this arrangement.
C. Administration Fees: The Adviser also serves as Administrator to the Trust and provides administrative services pursuant to an Administration Agreement for an annual fee, accrued daily and paid monthly, of 0.08% of the Fund's average daily net assets.
Under a Sub-Administration Agreement between the Administrator and State Street Bank and Trust Company ("State Street"), State Street provides certain administrative services to the Trust. For such services, the Administrator pays State Street a portion of the fee the Administrator receives from the Fund.
D. Shareholder Services Fees: Morgan Stanley Distribution, Inc. ("MSDI" or the "Distributor"), a wholly-owned subsidiary of the Adviser, and an indirect subsidiary of Morgan Stanley, serves as the Trust's Distributor of Fund shares pursuant to a Distribution Agreement. The Trust has adopted a Shareholder Services Plan with respect to the Institutional Class shares pursuant to Rule 12b-1 under the Act. Under the Shareholder Services Plan, the Fund pays the Distributor a shareholder services fee, accrued daily and paid monthly, at an annual rate of 0.05% of the Fund's average daily net assets attributable to the Institutional Class shares.
The Trust has adopted a Shareholder Services Plan with respect to the Class A shares pursuant to Rule 12b-1 under the Act. Under the Shareholder Services Plan, the Fund pays the Distributor a shareholder services fee, accrued daily and paid
20
Morgan Stanley Institutional Fund Trust
Annual Report — September 30, 2023
Notes to Financial Statements (cont'd)
monthly, at an annual rate of 0.25% of the Fund's average daily net assets attributable to the Class A shares. The Distributor has agreed to waive the 12b-1 fees on Class A shares of the Fund to the extent it exceeds 0.10% of the average daily net assets of such shares on an annualized basis. This waiver will continue for at least one year or until such time as the Trustees act to discontinue all or a portion of such waiver when it deems such action is appropriate. For the year ended September 30, 2023, this waiver amounted to approximately $7,072,000.
The Distributor, Adviser and Administrator may also waive the shareholder services fees, advisory fees, administration fees and/or reimburse expenses to enable the Fund to maintain a minimum level of daily net investment income. This arrangement had no effect for the year ended September 30, 2023. The Distributor, Adviser and Administrator may discontinue these voluntary fee waivers and/or expense reimbursements at any time in the future.
The shareholder services fees are used to support the expenses associated with servicing and maintaining accounts. The Distributor may compensate other parties for providing distribution-related and/or shareholder support services to investors who purchase Institutional Class and Class A shares.
E. Dividend Disbursing and Transfer/Co-Transfer Agent: The Trust's dividend disbursing and transfer agent is SS&C Global Investor & Distribution Solutions, Inc. ("SS&C GIDS"). Pursuant to a Transfer Agency Agreement, the Trust pays SS&C GIDS a fee based on the number of classes, accounts and transactions relating to the Funds of the Trust.
Morgan Stanley Services Company Inc. serves as Co-Transfer Agent and provides certain transfer agency services to the Fund with respect to certain direct transactions with the Fund.
F. Custodian Fees: State Street (the "Custodian") also serves as Custodian for the Trust in accordance with a Custodian Agreement. The Custodian holds cash, securities and other assets of the Trust as required by the Act. Custody fees are payable monthly based on assets held in custody, investment purchases and sales activity and account maintenance fees, plus reimbursement for certain out-of-pocket expenses.
G. Security Transactions and Transactions with Affiliates: The Fund has an unfunded Deferred Compensation Plan (the "Compensation Plan"), which allows each independent Trustee to defer payment of all, or a portion, of the
fees he or she receives for serving on the Board of Trustees. Each eligible Trustee generally may elect to have the deferred amounts credited with a return equal to the total return on one or more of the Morgan Stanley funds that are offered as investment Morgan Stanley Institutional Fund Trust options under the Compensation Plan. Appreciation/ depreciation and distributions received from these investments are recorded with an offsetting increase/decrease in the deferred compensation obligation and do not affect the NAV of the Fund.
H. Federal Income Taxes: It is the Fund's intention to continue to qualify as a regulated investment company and distribute all of its taxable and tax-exempt income. Accordingly, no provision for federal income taxes is required in the financial statements.
The Fund may be subject to taxes imposed by countries in which it invests. Such taxes are generally based on income and/or capital gains earned or repatriated. Taxes are accrued based on net investment income, net realized gains and net unrealized appreciation as such income and/or gains are earned. Taxes may also be based on transactions in foreign currency and are accrued based on the value of investments denominated in such currency.
FASB ASC 740-10, "Income Taxes — Overall", sets forth a minimum threshold for financial statement recognition of the benefit of a tax position taken or expected to be taken in a tax return. Management has concluded that there are no significant uncertain tax positions that would require recognition in the financial statements. If applicable, the Fund recognizes interest accrued related to unrecognized tax benefits in "Interest Expense" and penalties in "Other Expenses" in the Statement of Operations. The Fund files tax returns with the U.S. Internal Revenue Service, New York and various states. Generally, each of the tax years in the four-year period ended September 30, 2023 remains subject to examination by taxing authorities.
The tax character of distributions paid may differ from the character of distributions shown for GAAP purposes due to short-term capital gains being treated as ordinary income for tax purposes. The tax character of distributions paid during fiscal years 2023 and 2022 was as follows:
2023 Distributions
Paid From:
Ordinary Income
(000) | | 2022 Distributions
Paid From:
Ordinary Income
(000) | |
| $ | 537,318 | | | $ | 90,977 | | |
21
Morgan Stanley Institutional Fund Trust
Annual Report — September 30, 2023
Notes to Financial Statements (cont'd)
The amount and character of income and gains to be distributed are determined in accordance with income tax regulations which may differ from GAAP. These book/tax differences are either considered temporary or permanent in nature.
Temporary differences are attributable to differing book and tax treatments for the timing of the recognition of gains (losses) on certain investment transactions and the timing of the deductibility of certain expenses.
The Fund had no permanent differences causing reclassifications among the components of net assets for the year ended September 30, 2023
At September 30, 2023, the components of distributable earnings for the Fund on a tax basis were as follows:
Undistributed
Ordinary
Income
(000) | | Undistributed
Long-Term
Capital Gain
(000) | |
| $ | 6,217 | | | $ | — | | |
At September 30, 2023, the Fund had available for federal income tax purposes unused short-term capital losses of approximately $63,937,000 that do not have an expiration date.
To the extent that capital loss carryforwards are used to offset any future capital gains realized, no capital gains tax liability will be incurred by the Fund for gains realized and not distributed. To the extent that capital gains are offset, such gains will not be distributed to the shareholders. During the year ended September 30, 2023, the Fund utilized capital loss carryforwards for U.S. federal income tax purposes of approximately $46,000.
I. Credit Facility: The Trust and other Morgan Stanley funds participated in a $300,000,000 committed, unsecured revolving line of credit facility (the "Facility") with State Street. Effective April 17, 2023, the committed line amount increased to $500,000,000. This Facility is to be used for temporary emergency purposes or funding of shareholder redemption requests. The interest rate for any funds drawn will be based on the federal funds rate or overnight bank funding rate plus a spread. The Facility also has a commitment fee of 0.25% per annum based on the unused portion of the Facility, which is allocated among participating funds based on relative net assets. During the twelve months ended September 30, 2023, the Fund did not have any borrowings under the Facility.
J. Other: At September 30, 2023, the Fund had record owners of 10% or greater. Investment activities of these shareholders could have a material impact on the Fund. The aggregate percentage of such owners was 80.1%.
K. Market Risk: An investment in the Fund is based on the values of the Fund's investments, which may change due to economic and other events that affect markets generally, as well as those that affect particular regions, countries, industries, companies or governments. The risks associated with these developments may be magnified if social, political, economic and other conditions and events (such as war, natural disasters, health emergencies (e.g., epidemics and pandemics), terrorism, conflicts, social unrest, recessions, inflation, rapid interest rate changes and supply chain disruptions) adversely interrupt the global economy and financial markets. It is difficult to predict when events affecting the U.S. or global financial markets may occur, the effects that such events may have and the duration of those effects (which may last for extended periods). These events may negatively impact broad segments of businesses and populations and have a significant and rapid negative impact on the performance of the Fund's investments, adversely affect and increase the volatility of the Fund's share price and exacerbate pre-existing risks to the Fund. The occurrence, duration and extent of these or other types of adverse economic and market conditions and uncertainty over the long term cannot be reasonably projected or estimated at this time. The ultimate impact of public health emergencies or other adverse economic or market developments and the extent to which the associated conditions impact the Fund and its investments will also depend on other future developments, which are highly uncertain, difficult to accurately predict and subject to change at any time. The financial performance of the Fund's investments (and, in turn, the Fund's investment results) as well as their liquidity may be adversely affected because of these and similar types of factors and developments.
22
Morgan Stanley Institutional Fund Trust
Annual Report — September 30, 2023
Report of Independent Registered Public Accounting Firm
To the Shareholders and Board of Trustees of
Morgan Stanley Institutional Fund Trust —
Ultra-Short Income Portfolio
Opinion on the Financial Statements
We have audited the accompanying statement of assets and liabilities of Ultra-Short Income Portfolio (the "Fund") (one of the funds constituting Morgan Stanley Institutional Fund Trust (the "Trust")), including the portfolio of investments, as of September 30, 2023, and the related statement of operations for the year then ended, the statements of changes in net assets for each of the two years in the period then ended, the financial highlights for each of the five years in the period then ended and the related notes (collectively referred to as the "financial statements"). In our opinion, the financial statements present fairly, in all material respects, the financial position of the Fund (one of the funds constituting Morgan Stanley Institutional Fund Trust) at September 30, 2023, the results of its operations for the year then ended, the changes in its net assets for each of the two years in the period then ended and its financial highlights for each of the five years in the period then ended, in conformity with U.S. generally accepted accounting principles.
Basis for Opinion
These financial statements are the responsibility of the Trust's management. Our responsibility is to express an opinion on the Fund's financial statements based on our audits. We are a public accounting firm registered with the Public Company Accounting Oversight Board (United States) ("PCAOB") and are required to be independent with respect to the Trust in accordance with the U.S. federal securities laws and the applicable rules and regulations of the Securities and Exchange Commission and the PCAOB.
We conducted our audits in accordance with the standards of the PCAOB. Those standards require that we plan and perform the audit to obtain reasonable assurance about whether the financial statements are free of material misstatement, whether due to error or fraud. The Trust is not required to have, nor were we engaged to perform, an audit of the Trust's internal control over financial reporting. As part of our audits, we are required to obtain an understanding of internal control over financial reporting but not for the purpose of expressing an opinion on the effectiveness of the Trust's internal control over financial reporting. Accordingly, we express no such opinion.
Our audits included performing procedures to assess the risks of material misstatement of the financial statements, whether due to error or fraud, and performing procedures that respond to those risks. Such procedures included examining, on a test basis, evidence regarding the amounts and disclosures in the financial statements. Our procedures included confirmation of securities owned as of September 30, 2023, by correspondence with the custodian, brokers and others; when replies were not received from brokers and others, we performed other auditing procedures. Our audits also included evaluating the accounting principles used and significant estimates made by management, as well as evaluating the overall presentation of the financial statements. We believe that our audits provide a reasonable basis for our opinion.

We have served as the auditor of one or more Morgan Stanley investment companies since 2000.
Boston, Massachusetts
November 27, 2023
23
Morgan Stanley Institutional Fund Trust
Annual Report — September 30, 2023
Investment Advisory Agreement Approval (unaudited)
Nature, Extent and Quality of Services
The Board reviewed and considered the nature and extent of the investment advisory services provided by the Adviser under the advisory agreement, including portfolio management, investment research and equity and fixed income securities trading. The Board also reviewed and considered the nature and extent of the non-advisory, administrative services provided by the Administrator under the administration agreement, including accounting, operations, clerical, bookkeeping, compliance, business management and planning, legal services and the provision of supplies, office space and utilities at the Adviser's expense. The Board also considered the Adviser's investment in personnel and infrastructure that benefits the Fund. (The Adviser and Administrator together are referred to as the "Adviser" and the advisory and administration agreements together are referred to as the "Management Agreement.") The Board also considered that the Adviser serves a variety of other investment advisory clients and has experience overseeing service providers. The Board also compared the nature of the services provided by the Adviser with similar services provided by non-affiliated advisers as prepared by Broadridge Financial Solutions, Inc. ("Broadridge").
The Board reviewed and considered the qualifications of the portfolio managers, the senior administrative managers and other key personnel of the Adviser who provide the advisory and administrative services to the Fund. The Board determined that the Adviser's portfolio managers and key personnel are well qualified by education and/or training and experience to perform the services in an efficient and professional manner. The Board concluded that the nature and extent of the advisory and administrative services provided were necessary and appropriate for the conduct of the business and investment activities of the Fund and supported its decision to approve the Management Agreement.
Performance, Fees and Expenses of the Fund
The Board reviewed the performance, fees and expenses of the Fund compared to its peers, as prepared by Broadridge, and to appropriate benchmarks where applicable. The Board discussed with the Adviser the performance goals and the actual results achieved in managing the Fund. When considering a fund's performance, the Board and the Adviser place emphasis on trends and longer-term returns (focusing on one-year, three-year and five-year performance, as of December 31, 2022, or since inception, as applicable). When a fund underperforms its benchmark and/or its peer group average, the Board and the Adviser discuss the causes of such underperformance and, where necessary, they discuss specific changes to investment strategy or investment personnel. The Board noted that the Fund's performance was better than its peer group average for the one-, three- and five-year periods. The Board discussed with the Adviser the level of the advisory and administration fees (together, the "management fee") for this Fund relative to comparable funds and/or other accounts advised by the Adviser and/or compared to its peers as prepared by Broadridge. In addition to the management fee, the Board also reviewed the Fund's total expense ratio. The Board noted that the Fund's contractual management fee was higher than but close to its peer group average and the actual management fee and total expense ratio were lower than its peer group averages. After discussion, the Board concluded that the Fund's performance, management fee and total expense ratio were competitive with its peer group averages.
Economies of Scale
The Board considered the size and growth prospects of the Fund and how that relates to the Fund's total expense ratio and particularly the Fund's management fee rate, which does not include breakpoints. In conjunction with its review of the Adviser's profitability, the Board discussed with the Adviser how a change in assets can affect the efficiency or effectiveness of managing the Fund and whether the management fee level is appropriate relative to current and projected asset levels and/or whether the management fee structure reflects economies of scale as asset levels change. The Board has determined that its review of the actual and/or potential economies of scale of the Fund supports its decision to approve the Management Agreement.
Profitability of the Adviser and Affiliates
The Board considered information concerning the costs incurred and profits realized by the Adviser and its affiliates during the last year from their relationship with the Fund and during the last two years from their relationship with the Morgan Stanley Fund Complex and reviewed with the Adviser the cost allocation methodology used to determine the profitability of the Adviser and affiliates. The Board has determined that its review of the analysis of the Adviser's expenses and profitability supports its decision to approve the Management Agreement.
24
Morgan Stanley Institutional Fund Trust
Annual Report — September 30, 2023
Investment Advisory Agreement Approval (unaudited) (cont'd)
Other Benefits of the Relationship
The Board considered other direct and indirect benefits to the Adviser and/or its affiliates derived from their relationship with the Fund and other funds advised by the Adviser. These benefits may include, among other things, fees for trading, distribution and/or shareholder servicing and for transaction processing and reporting platforms used by securities lending agents, and research received by the Adviser generated from commission dollars spent on funds' portfolio trading. The Board reviewed with the Adviser these arrangements and the reasonableness of the Adviser's costs relative to the services performed. The Board has determined that its review of the other benefits received by the Adviser or its affiliates supports its decision to approve the Management Agreement.
Resources of the Adviser and Historical Relationship Between the Fund and the Adviser
The Board considered whether the Adviser is financially sound and has the resources necessary to perform its obligations under the Management Agreement. The Board also reviewed and considered the historical relationship between the Fund and the Adviser, including the organizational structure of the Adviser, the policies and procedures formulated and adopted by the Adviser for managing the Fund's operations and the Board's confidence in the competence and integrity of the senior managers and key personnel of the Adviser. The Board concluded that the Adviser has the financial resources necessary to fulfill its obligations under the Management Agreement and that it is beneficial for the Fund to continue its relationship with the Adviser.
Other Factors and Current Trends
The Board considered the controls and procedures adopted and implemented by the Adviser and monitored by the Fund's Chief Compliance Officer and concluded that the conduct of business by the Adviser indicates a good faith effort on its part to adhere to high ethical standards in the conduct of the Fund's business.
General Conclusion
After considering and weighing all of the above factors, with various written materials and verbal information presented by the Adviser, the Board concluded that it would be in the best interest of the Fund and its shareholders to approve renewal of the Management Agreement for another year. In reaching this conclusion the Board did not give particular weight to any single piece of information or factor referenced above. The Board considered these factors and information over the course of the year and in numerous meetings, some of which were in executive session with only the independent Board members and their counsel present. It is possible that individual Board members may have weighed these factors, and the information presented, differently in reaching their individual decisions to approve the Management Agreement.
25
Morgan Stanley Institutional Fund Trust
Annual Report — September 30, 2023
Liquidity Risk Management Program (unaudited)
In compliance with Rule 22e-4 under the Investment Company Act of 1940, as amended (the "Liquidity Rule"), the Fund has adopted and implemented a liquidity risk management program (the "Program"), which is reasonably designed to assess and manage the risk that the Fund could not meet requests to redeem shares issued by the Fund without significant dilution of remaining investors' interests in the Fund (i.e., liquidity risk). The Fund's Board of Trustees (the "Board") previously approved the designation of the Liquidity Risk Subcommittee (the "LRS") as Program administrator. The LRS is comprised of representatives from various divisions within Morgan Stanley Investment Management.
At a meeting held on March 1-2, 2023, the Board reviewed a written report prepared by the LRS that addressed the Program's operation and assessed its adequacy, and effectiveness of implementation for the period from January 1, 2022, through December 31, 2022, as required under the Liquidity Rule. The report concluded that the Program operated effectively and was adequately and effectively implemented in all material aspects, and that the relevant controls and safeguards were appropriately designed to enable the LRS to administer the Program in compliance with the Liquidity Rule.
In accordance with the Program, the LRS assessed each Fund's liquidity risk no less frequently than annually taking into consideration certain factors, as applicable, such as (i) investment strategy and liquidity of portfolio investments, (ii) short-term and long-term cash flow projections and (iii) holdings of cash and cash equivalents and borrowing arrangements and other funding sources. Certain factors are considered under both normal and reasonably foreseeable stressed conditions.
Each Fund portfolio investment is classified into one of four liquidity categories, which classification is assessed at least monthly by the LRS. The classification is based on a determination of the number of days it is reasonably expected to take to convert the investment into cash, or sell or dispose of the investment, in current market conditions without significantly changing the market value of the investment. Liquidity classification determinations take into account various market, trading and investment-specific considerations, as well as market depth, and in some cases utilize third-party vendor data.
The Liquidity Rule limits a fund's investments in illiquid investments to 15% of its net assets and requires funds that do not primarily hold assets that are highly liquid investments to determine and maintain a minimum percentage of the fund's net assets to be invested in highly liquid investments (highly liquid investment minimum or "HLIM"). The LRS believes that the Program includes provisions reasonably designed to review, monitor and comply with the 15% limit on illiquid investments and for determining, periodically reviewing and complying with the HLIM requirement, as applicable.
There can be no assurance that the Program will achieve its objectives under all circumstances in the future. Please refer to the Fund's prospectus for more information regarding the Fund's exposure to liquidity risk and other risks to which it may be subject.
26
Morgan Stanley Institutional Fund Trust
Annual Report — September 30, 2023
Federal Tax Notice (unaudited)
For federal income tax purposes, the following information is furnished with respect to the distributions paid by the Fund during its taxable year ended September 30, 2023.
The Fund designated approximately $291,551,000 of its distributions paid as qualified interest income.
The Fund designated approximately $537,291,000 of its distributions paid as business interest income.
In January, the Fund provides tax information to shareholders for the preceding calendar year.
27
Morgan Stanley Institutional Fund Trust
Annual Report — September 30, 2023
Important Notices (unaudited)
Reporting to Shareholders
Each Morgan Stanley fund provides a complete schedule of portfolio holdings in its Semi-Annual and the Annual Reports within 60 days of the end of the fund's second and fourth fiscal quarters. The Semi-Annual and Annual Reports are filed electronically with the Securities and Exchange Commission ("SEC") on Form N-CSRS and Form N-CSR, respectively. Morgan Stanley makes these reports available on its public website, www.morganstanley.com/im. Each Morgan Stanley non-money market fund also files a complete schedule of portfolio holdings with the SEC for the fund's first and third fiscal quarters as an attachment to Form N-PORT. Morgan Stanley does not deliver the reports for the first and third fiscal quarters to shareholders, but makes the complete schedule of portfolio holdings for the fund's first and third fiscal quarters available on its public website. The holdings for each money market fund are also posted to the Morgan Stanley public website. You may obtain the Form N-PORT filings (as well as the Form N-CSR and N-CSRS filings) by accessing the SEC's website, www.sec.gov. You can also request copies of these materials, upon payment of a duplicating fee, by electronic request at the SEC's email address (publicinfo@sec.gov).
Proxy Voting Policies and Procedures and Proxy Voting Record
You may obtain a copy of the Trust's Proxy Voting Policy and Procedures and information regarding how the Trust voted proxies relating to portfolio securities during the most recent twelve-month period ended June 30, without charge, upon request, by calling toll free 1 (800) 869-6397 or by visiting our website at www.morganstanley.com/im. This information is also available on the SEC's website at www.sec.gov.
This report is authorized for distribution only when preceded or accompanied by a prospectus or summary prospectus of the applicable fund of Morgan Stanley Institutional Fund Trust, which describes in detail the fund's investment policies, risks, fees and expenses. Please read the prospectus carefully before you invest or send money. For additional information, including information regarding the investments comprising the Fund, please visit our website at www.morganstanley.com/im. or call toll free 1 (800) 869-6397.
Householding Notice
To reduce printing and mailing costs, the Fund attempts to eliminate duplicate mailings to the same address. The Fund delivers a single copy of certain shareholder documents, including shareholder reports, prospectuses and proxy materials, to investors with the same last name who reside at the same address. Your participation in this program will continue for an unlimited period of time unless you instruct us otherwise. You can request multiple copies of these documents by calling 1 (800) 869-6397, 8:00 a.m. to 6:00 p.m., ET. Once our Customer Service Center has received your instructions, we will begin sending individual copies for each account within 30 days.
Tailored Shareholder Reports
Effective January 24, 2023, the SEC adopted rule and form amendments to require open-end mutual funds and ETFs to transmit concise and visually engaging streamlined annual and semiannual reports to shareholders that highlight key information. Other information, including financial statements, will no longer appear in a streamlined shareholder report but must be available online, delivered free of charge upon request, and filed on a semiannual basis on Form N-CSR. The rule and form amendments have a compliance date of July 24, 2024. At this time, management is evaluating the impact of these amendments on the shareholder reports for the Morgan Stanley Funds.
28
Morgan Stanley Institutional Fund Trust
Annual Report — September 30, 2023
U.S. Customer Privacy Notice (unaudited) April 2021
FACTS | | WHAT DOES MSIM DO WITH YOUR PERSONAL INFORMATION? | |
Why? | | Financial companies choose how they share your personal information. Federal law gives consumers the right to limit some but not all sharing. Federal law also requires us to tell you how we collect, share, and protect your personal information. Please read this notice carefully to understand what we do. | |
What? | | The types of personal information we collect and share depend on the product or service you have with us. This information can include:
◼ Social Security number and income
◼ investment experience and risk tolerance
◼ checking account number and wire transfer instructions | |
How? | | All financial companies need to share customers' personal information to run their everyday business. In the section below, we list the reasons financial companies can share their customers' personal information; the reasons MSIM chooses to share; and whether you can limit this sharing. | |
Reasons we can share your personal information | | Does MSIM share? | | Can you limit this sharing? | |
For our everyday business purposes —
such as to process your transactions, maintain your account(s), respond to court orders and legal investigations, or report to credit bureaus | | Yes | | No | |
For our marketing purposes —
to offer our products and services to you | | Yes | | No | |
For joint marketing with other financial companies | | No | | We don't share | |
For our investment management affiliates' everyday business purposes —
information about your transactions, experiences, and creditworthiness | | Yes | | Yes | |
For our affiliates' everyday business purposes —
information about your transactions and experiences | | Yes | | No | |
For our affiliates' everyday business purposes —
information about your creditworthiness | | No | | We don't share | |
For our investment management affiliates to market to you | | Yes | | Yes | |
For our affiliates to market to you | | No | | We don't share | |
For non-affiliates to market to you | | No | | We don't share | |
29
Morgan Stanley Institutional Fund Trust
Annual Report — September 30, 2023
U.S. Customer Privacy Notice (unaudited) (cont'd) April 2021
To limit our sharing | | Call toll-free (844) 312-6327 or email: imprivacyinquiries@morganstanley.com
Please note:
If you are a new customer, we can begin sharing your information 30 days from the date we sent this notice. When you are no longer our customer, we continue to share your information as described in this notice. However, you can contact us at any time to limit our sharing. | |
Questions? | | Call toll-free (844) 312-6327 or email: imprivacyinquiries@morganstanley.com | |
Who we are
Who is providing this notice? | | Morgan Stanley Investment Management Inc. and its investment management affiliates ("MSIM") (see Investment Management Affiliates definition below) | |
What we do
How does MSIM protect my personal information? | | To protect your personal information from unauthorized access and use, we use security measures that comply with federal law. These measures include computer safeguards and secured files and buildings. We have policies governing the proper handling of customer information by personnel and requiring third parties that provide support to adhere to appropriate security standards with respect to such information. | |
How does MSIM collect my personal information? | | We collect your personal information, for example, when you
◼ open an account or make deposits or withdrawals from your account
◼ buy securities from us or make a wire transfer
◼ give us your contact information
We also collect your personal information from others, such as credit bureaus, affiliates, or other companies. | |
Why can't I limit all sharing? | | Federal law gives you the right to limit only
◼ sharing for affiliates' everyday business purposes — information about your creditworthiness
◼ affiliates from using your information to market to you
◼ sharing for non-affiliates to market to you
State laws and individual companies may give you additional rights to limit sharing. See below for more on your rights under state law. | |
30
Morgan Stanley Institutional Fund Trust
Annual Report — September 30, 2023
U.S. Customer Privacy Notice (unaudited) (cont'd) April 2021
Definitions
Investment Management Affiliates | | MSIM Investment Management Affiliates include registered investment advisers, registered broker-dealers, and registered and unregistered funds in the Investment Management Division. Investment Management Affiliates does not include entities associated with Morgan Stanley Wealth Management, such as Morgan Stanley Smith Barney LLC and Morgan Stanley & Co. | |
Affiliates | | Companies related by common ownership or control. They can be financial and non-financial companies.
◼ Our affiliates include companies with a Morgan Stanley name and financial companies such as Morgan Stanley Smith Barney LLC and Morgan Stanley & Co. | |
Non-affiliates | | Companies not related by common ownership or control. They can be financial and non-financial companies.
◼ MSIM does not share with non-affiliates so they can market to you. | |
Joint marketing | | A formal agreement between non-affiliated financial companies that together market financial products or services to you.
◼ MSIM doesn't jointly market | |
Other important information
Vermont: Except as permitted by law, we will not share personal information we collect about Vermont residents with Non-affiliates unless you provide us with your written consent to share such information.
California: Except as permitted by law, we will not share personal information we collect about California residents with Non-affiliates and we will limit sharing such personal information with our Affiliates to comply with California privacy laws that apply to us.
31
Morgan Stanley Institutional Fund Trust
Annual Report — September 30, 2023
Trustees and Officers Information (unaudited)
Independent Trustees:
Name, Address and Birth Year
of Independent Trustee | | Position(s)
Held with
Registrant | | Length of Time
Served* | | Principal Occupation(s) During Past 5 Years
and Other Relevant Professional Experience | | Number of
Funds in
Fund Complex
Overseen by
Independent
Trustee** | | Other Directorships
Held by Independent
Trustee During
Past 5 Years*** | |
Frank L. Bowman
c/o Perkins Coie LLP
Counsel to the Independent Trustees
1155 Avenue of the Americas
22nd Floor
New York, NY 10036
Birth Year: 1944 | | Trustee | | Since
August
2006 | | President, Strategic Decisions, LLC (consulting) (since February 2009); Director or Trustee of various Morgan Stanley Funds (since August 2006); Chairperson of the Compliance and Insurance Committee (since October 2015); formerly, Chairperson of the Insurance Sub-Committee of the Compliance and Insurance Committee (2007-2015); served as President and Chief Executive Officer of the Nuclear Energy Institute (policy organization) (February 2005-November 2008); retired as Admiral, U.S. Navy after serving over 38 years on active duty including 8 years as Director of the Naval Nuclear Propulsion Program in the Department of the Navy and the U.S. Department of Energy (1996-2004); served as Chief of Naval Personnel (July 1994-September 1996) and on the Joint Staff as Director of Political Military Affairs (June 1992-July 1994); knighted as Honorary Knight Commander of the Most Excellent Order of the British Empire; awarded the Officier de l'Orde National du Mèrite by the French Government; elected to the National Academy of Engineering (2009). | | | 86 | | | Director of Naval and Nuclear Technologies LLP; Director Emeritus of the Armed Services YMCA; Member of the National Security Advisory Council of the Center for U.S. Global Engagement and a former member of the CNA Military Advisory Board; Chairman of the Board of Trustees of Fairhaven United Methodist Church; Member of the Board of Advisors of the Dolphin Scholarship Foundation; Director of other various nonprofit organizations; formerly, Director of BP, plc (November 2010-May 2019). | |
Frances L. Cashman
c/o Perkins Coie LLP
Counsel to the Independent
Trustees
1155 Avenue of the Americas
22nd Floor
New York, NY 10036
Birth Year: 1961 | | Trustee | | Since
February
2022 | | Chief Executive Officer, Asset Management Division, Delinian Ltd. (financial information) (May 2021-Present); Executive Vice President and various other roles, Legg Mason & Co. (asset management) (2010-2020); Managing Director, Stifel Nicolaus (2005-2010). | | | 87 | | | Trustee and Investment Committee Member, GeorgiaTech Foundation (since June 2019); Trustee and Chair of Marketing Committee, and Member of Investment Committee, Loyola Blakefield (Since September 2017); Trustee, MMI Gateway Foundation (since September 2017); Director and Investment Committee Member, Catholic Community Foundation Board (2012-2018); Director and Investment Committee Member, St. Ignatius Loyola Academy (2011-2017). | |
Kathleen A. Dennis
c/o Perkins Coie LLP
Counsel to the Independent
Trustees
1155 Avenue of the Americas
22nd Floor
New York, NY 10036
Birth Year: 1953 | | Trustee | | Since
August
2006 | | Chairperson of the Governance Committee (since January 2021), Chairperson of the Liquidity and Alternatives Sub-Committee of the Investment Committee (2006-2020) and Director or Trustee of various Morgan Stanley Funds (since August 2006); President, Cedarwood Associates (mutual fund and investment management consulting) (since July 2006); formerly, Senior Managing Director of Victory Capital Management (1993-2006). | | | 86 | | | Board Member, University of Albany Foundation (2012-present); Board Member, Mutual Funds Directors Forum (2014-present); Director of various non-profit organizations. | |
32
Morgan Stanley Institutional Fund Trust
Annual Report — September 30, 2023
Trustees and Officers Information (unaudited) (cont'd)
Independent Trustees: (cont'd)
Name, Address and Birth Year
of Independent Trustee | | Position(s)
Held with
Registrant | | Length of Time
Served* | | Principal Occupation(s) During Past 5 Years
and Other Relevant Professional Experience | | Number of
Funds in
Fund Complex
Overseen by
Independent
Trustee** | | Other Directorships
Held by Independent
Trustee During
Past 5 Years*** | |
Nancy C. Everett
c/o Perkins Coie LLP
Counsel to the Independent
Trustees
1155 Avenue of the Americas
22nd Floor
New York, NY 10036
Birth Year: 1955 | | Trustee | | Since
January
2015 | | Chairperson of the Equity Investment Committee (since January 2021); Director or Trustee of various Morgan Stanley Funds (since January 2015); Chief Executive Officer, Virginia Commonwealth University Investment Company (since November 2015); Owner, OBIR, LLC (institutional investment management consulting) (since June 2014); formerly, Managing Director, BlackRock, Inc. (February 2011-December 2013) and Chief Executive Officer, General Motors Asset Management (a/k/a Promark Global Advisors, Inc.) (June 2005-May 2010). | | | 87 | | | Formerly, Member of Virginia Commonwealth University School of Business Foundation (2005-2016); Member of Virginia Commonwealth University Board of Visitors (2013-2015); Member of Committee on Directors for Emerging Markets Growth Fund, Inc. (2007-2010); Chairperson of Performance Equity Management, LLC (2006-2010); and Chairperson, GMAM Absolute Return Strategies Fund, LLC (2006-2010). | |
Eddie A. Grier
c/o Perkins Coie LLP
Counsel to the Independent
Trustees
1155 Avenue of the Americas
22nd Floor
New York, NY 10036
Birth Year: 1955 | | Trustee | | Since
February
2022 | | Dean, Santa Clara University Leavey School of Business (since July 2021); Dean, Virginia Commonwealth University School of Business (2010-2021); President and various other roles, Walt Disney Company (entertainment and media) (1981-2010). | | | 87 | | | Director, Witt/Keiffer, Inc. (executive search) (since 2016); Director, NuStar GP, LLC (energy) (since August 2021); Director, Sonida Senior Living, Inc. (residential community operator) (2016-2021); Director, NVR, Inc. (homebuilding) (2013-2020); Director, Middleburg Trust Company (wealth management) (2014-2019); Director, Colonial Williamsburg Company (2012-2021); Regent, University of Massachusetts Global (since 2021); Director and Chair, ChildFund International (2012-2021); Trustee, Brandman University (2010-2021); Director, Richmond Forum (2012-2019). | |
33
Morgan Stanley Institutional Fund Trust
Annual Report — September 30, 2023
Trustees and Officers Information (unaudited) (cont'd)
Independent Trustees: (cont'd)
Name, Address and Birth Year
of Independent Trustee | | Position(s)
Held with
Registrant | | Length of Time
Served* | | Principal Occupation(s) During Past 5 Years
and Other Relevant Professional Experience | | Number of
Funds in
Fund Complex
Overseen by
Independent
Trustee** | | Other Directorships
Held by Independent
Trustee During
Past 5 Years*** | |
Jakki L. Haussler
c/o Perkins Coie LLP
Counsel to the Independent
Trustees
1155 Avenue of the Americas
22nd Floor
New York, NY 10036
Birth Year: 1957 | | Trustee | | Since
January
2015 | | Chairperson of the Audit Committee (since January 2023) and Director or Trustee of various Morgan Stanley Funds (since January 2015); Chairman, Opus Capital Group (since 1996); formerly, Chief Executive Officer, Opus Capital Group (1996-2019); Director, Capvest Venture Fund, LP (May 2000-December 2011); Partner, Adena Ventures, LP (July 1999-December 2010); Director, The Victory Funds (February 2005-July 2008). | | | 87 | | | Director, Vertiv Holdings Co. (VRT) (since August 2022); Director of Cincinnati Bell Inc. and Member, Audit Committee and Chairman, Governance and Nominating Committee (2008-2021); Director of Service Corporation International and Member, Audit Committee and Investment Committee; Director, Barnes Group Inc. (since July 2021); Director of Northern Kentucky University Foundation and Member, Investment Committee; Member of Chase College of Law Center for Law and Entrepreneurship Board of Advisors; Director of Best Transport (2005-2019); Director of Chase College of Law Board of Visitors; formerly, Member, University of Cincinnati Foundation Investment Committee. | |
Dr. Manuel H. Johnson
c/o Johnson Smick
International, Inc.
220 I Street, NE
Suite 200
Washington, D.C. 20002
Birth Year: 1949 | | Trustee | | Since
July
1991 | | Senior Partner, Johnson Smick International, Inc. (consulting firm); Chairperson of the Fixed Income, Liquidity and Alternatives Investment Committee (since January 2021), Chairperson of the Investment Committee (2006-2020) and Director or Trustee of various Morgan Stanley Funds (since July 1991); Co-Chairman and a founder of the Group of Seven Council (G7C) (international economic commission); formerly, Chairperson of the Audit Committee (July 1991-September 2006); Vice Chairman of the Board of Governors of the Federal Reserve System and Assistant Secretary of the U.S. Treasury. | | | 86 | | | Director of NVR, Inc. (home construction). | |
34
Morgan Stanley Institutional Fund Trust
Annual Report — September 30, 2023
Trustees and Officers Information (unaudited) (cont'd)
Independent Trustees: (cont'd)
Name, Address and Birth Year
of Independent Trustee | | Position(s)
Held with
Registrant | | Length of Time
Served* | | Principal Occupation(s) During Past 5 Years
and Other Relevant Professional Experience | | Number of
Funds in
Fund Complex
Overseen by
Independent
Trustee** | | Other Directorships
Held by Independent
Trustee During
Past 5 Years*** | |
Joseph K. Kearns
c/o Perkins Coie LLP
Counsel to the Independent
Trustees
1155 Avenue of the Americas
22nd Floor
New York, NY 10036
Birth Year: 1942 | | Trustee | | Since
August
1994 | | Senior Adviser, Kearns & Associates LLC (investment consulting); Chairperson of the Audit Committee (2006-2022) and Director or Trustee of various Morgan Stanley Funds (since August 1994); formerly, Deputy Chairperson of the Audit Committee (July 2003-September 2006); CFO of the J. Paul Getty Trust (1982-1999). | | | 87 | | | Director, Rubicon Investments (since February 2019); Prior to August 2016, Director of Electro Rent Corporation (equipment leasing); Prior to December 31, 2013, Director of The Ford Family Foundation. | |
Michael F. Klein
c/o Perkins Coie LLP
Counsel to the Independent
Trustees
1155 Avenue of the Americas
22nd Floor
New York, NY 10036
Birth Year: 1958 | | Trustee | | Since
August
2006 | | Chairperson of the Risk Committee (since January 2021); Managing Director, Aetos Alternatives Management, LP (since March 2000); Co-President, Aetos Alternatives Management, LP (since January 2004) and Co-Chief Executive Officer of Aetos Alternatives Management, LP (since August 2013); Chairperson of the Fixed Income Sub-Committee of the Investment Committee (2006-2020) and Director or Trustee of various Morgan Stanley Funds (since August 2006); formerly, Managing Director, Morgan Stanley & Co. Inc. and Morgan Stanley Dean Witter Investment Management and President, various Morgan Stanley Funds (June 1998-March 2000); Principal, Morgan Stanley & Co. Inc. and Morgan Stanley Dean Witter Investment Management (August 1997-December 1999). | | | 86 | | | Director of certain investment funds managed or sponsored by Aetos Alternatives Management, LP; Director of Sanitized AG and Sanitized Marketing AG (specialty chemicals). | |
Patricia A. Maleski
c/o Perkins Coie LLP
Counsel to the Independent
Trustees
1155 Avenue of the Americas
22nd Floor
New York, NY 10036
Birth Year: 1960 | | Trustee | | Since
January
2017 | | Director or Trustee of various Morgan Stanley Funds (since January 2017); Managing Director, JPMorgan Asset Management (2004-2016); Oversight and Control Head of Fiduciary and Conflicts of Interest Program (2015-2016); Chief Control Officer—Global Asset Management (2013-2015); President, JPMorgan Funds (2010-2013); Chief Administrative Officer (2004-2013); various other positions including Treasurer and Board Liaison (since 2001). | | | 87 | | | Trustee (since January 2022) and Treasurer (since January 2023), Nutley Family Service Bureau, Inc. | |
W. Allen Reed
c/o Perkins Coie LLP
Counsel to the Independent
Trustees
1155 Avenue of the Americas
22nd Floor
New York, NY 10036
Birth Year: 1947 | | Chair of the Board and Trustee | | Chair of the Board since August 2020 and Trustee since August 2006 | | Chair of the Boards of various Morgan Stanley Funds (since August 2020); Director or Trustee of various Morgan Stanley Funds (since August 2006); formerly, Vice Chair of the Boards of various Morgan Stanley Funds (January 2020-August 2020); President and Chief Executive Officer of General Motors Asset Management; Chairman and Chief Executive Officer of the GM Trust Bank and Corporate Vice President of General Motors Corporation (August 1994-December 2005). | | | 86 | | | Formerly, Director of Legg Mason, Inc. (2006-2019); and Director of the Auburn University Foundation (2010-2015). | |
* This is the earliest date the Trustee began serving the Morgan Stanley Funds. Each Trustee serves an indefinite term, until his or her successor is elected.
** The Fund Complex includes (as of December 31, 2022) all open-end and closed-end funds (including all of their portfolios) advised by Morgan Stanley Investment Management Inc. (the "Adviser") and any funds that have an adviser that is an affiliated person of the Adviser (including, but not limited to, Morgan Stanley AIP GP LP).
*** This includes any directorships at public companies and registered investment companies held by the Trustees at any time during the past five years.
35
Morgan Stanley Institutional Fund Trust
Annual Report — September 30, 2023
Trustees and Officers Information (unaudited) (cont'd)
Executive Officers:
Name, Address and Birth Year
of Executive Officer | | Position(s) Held
with
Registrant | | Length of
Time Served* | | Principal Occupation(s) During Past 5 Years | |
John H. Gernon
522 Fifth Avenue
New York, NY 10036
Birth Year: 1963 | | President and Principal Executive Officer | | Since
September
2013 | | President and Principal Executive Officer of the Equity and Fixed Income Funds and the Morgan Stanley AIP Funds (since September 2013) and the Liquidity Funds and various money market funds (since May 2014) in the Fund Complex; Managing Director of the Adviser. | |
Deidre A. Downes
1633 Broadway
New York, NY 10019
Birth Year: 1977 | | Chief Compliance Officer | | Since
November
2021 | | Executive Director of the Adviser (since January 2021) and Chief Compliance Officer of various Morgan Stanley Funds (since November 2021). Formerly, Vice President and Corporate Counsel at PGIM and Prudential Financial (October 2016-December 2020). | |
Francis J. Smith
522 Fifth Avenue
New York, NY 10036
Birth Year: 1965 | | Treasurer and Principal Financial Officer | | Treasurer since July 2003 and Principal Financial Officer since September
2002 | | Managing Director of the Adviser and various entities affiliated with the Adviser; Treasurer (since July 2003) and Principal Financial Officer of various Morgan Stanley Funds (since September 2002). | |
Mary E. Mullin
1633 Broadway
New York, NY 10019
Birth Year: 1967 | | Secretary | | Since
June
1999 | | Managing Director of the Adviser; Secretary of various Morgan Stanley Funds (since June 1999). | |
Michael J. Key
522 Fifth Avenue
New York, NY 10036
Birth Year: 1979 | | Vice President | | Since
June
2017 | | Vice President of the Equity and Fixed Income Funds, Liquidity Funds, various money market funds and the Morgan Stanley AIP Funds in the Fund Complex (since June 2017); Managing Director of the Adviser; Head of Product Development for Equity and Fixed Income Funds (since August 2013). | |
The Fund's statement of additional information includes further information about the Fund's Trustees and Officers, and is available without charge by visiting www.morganstanley.com/im or upon request by calling 1 (800) 869-6397.
* This is the earliest date the officer began serving the Morgan Stanley Funds. Each officer serves an indefinite term, until his or her successor is elected.
36
Morgan Stanley Institutional Fund Trust
Annual Report — September 30, 2023
Adviser and Administrator
Morgan Stanley Investment Management Inc.
522 Fifth Avenue
New York, New York 10036
Distributor
Morgan Stanley Distribution, Inc.
522 Fifth Avenue
New York, New York 10036
Dividend Disbursing and Transfer Agent
SS&C Global Investor & Distribution Solutions, Inc.
P.O. Box 219804
Kansas City, Missouri 64121-9804
Co-Transfer Agent
Morgan Stanley Services Company, Inc.
522 Fifth Avenue
New York, New York 10036
Custodian
State Street Bank and Trust Company
One Congress Street
Boston, Massachusetts 02114
Legal Counsel
Dechert LLP
1095 Avenue of the Americas
New York, New York 10036
Counsel to the Independent Trustees
Perkins Coie LLP
1155 Avenue of the Americas,
22nd Floor
New York, New York 10036
Independent Registered Public Accounting Firm
Ernst & Young LLP
200 Clarendon Street
Boston, Massachusetts 02116
37
Printed in U.S.A.
This Report has been prepared for shareholders and may be distributed to others only if preceded or accompanied by a current prospectus.
Morgan Stanley Investment Management Inc.
522 Fifth Avenue
New York, New York 10036
© 2023 Morgan Stanley. Morgan Stanley Distribution, Inc.

IFTUSIANN
6045117 EXP 11.30.24
Item 2. Code of Ethics.
(a) The registrant has adopted a code of ethics (the "Code of Ethics") that applies to its principal executive officer, principal financial officer, principal accounting officer or controller, or persons performing similar functions, regardless of whether these individuals are employed by the registrant or a third party.
(b) No information need be disclosed pursuant to this paragraph.
(c) Not applicable.
(d) Not applicable.
(e) Not applicable.
(f)
(1) The registrant’s Code of Ethics is attached hereto as Exhibit 13 A.
(2) Not applicable.
(3) Not applicable.
Item 3. Audit Committee Financial Expert.
The registrant's Board of Trustees has determined that Jakki L. Haussler, an “independent” Trustee, is an “audit committee financial expert" serving on its audit committee. Under applicable securities laws, a person who is determined to be an audit committee financial expert will not be deemed an "expert" for any purpose, including without limitation for the purposes of Section 11 of the Securities Act of 1933, as a result of being designated or identified as an audit committee financial expert. The designation or identification of a person as an audit committee financial expert does not impose on such person any duties, obligations, or liabilities that are greater than the duties, obligations, and liabilities imposed on such person as a member of the audit committee and Board of Trustees in the absence of such designation or identification.
Item 4. Principal Accountant Fees and Services.
(a)(b)(c)(d) and (g). Based on fees billed for the periods shown:
2023
| | | Registrant | | | Covered Entities | |
| Audit Fees | | $ | 586,943 | | | | N/A | |
| Non-Audit Fees | | | | | | | | |
| Audit-Related Fees | | $ | — | (2) | | $ | — | (2) |
| Tax Fees | | $ | — | (3) | | $ | — | (4) |
| All Other Fees | | $ | — | | | $ | 1,586,712 | (5) |
| Total Non-Audit Fees | | $ | — | | | $ | 1,586,712 | |
| Total | | $ | 586,943 | | | $ | 1,586,712 | |
2022
| | | Registrant | | | Covered Entities | |
| Audit Fees | | $ | 586,943 | | | | N/A | |
| Non-Audit Fees | | | | | | | | |
| Audit-Related Fees | | $ | — | (2) | | $ | — | (2) |
| Tax Fees | | $ | — | (3) | | $ | — | (4) |
| All Other Fees | | $ | — | | | $ | 13,150,465 | (5) |
| Total Non-Audit Fees | | $ | — | | | $ | 13,150,465 | |
| Total | | $ | 586,943 | | | $ | 13,150,465 | |
N/A- Not applicable, as not required by Item 4.
| (1) | Covered Entities include the Adviser (excluding sub-advisors) and any entity controlling, controlled by or under common control with the Adviser that provides ongoing services to the Registrant. |
| (2) | Audit-Related Fees represent assurance and related services provided that are reasonably related to the performance of the audit of the financial statements of the Covered Entities' and funds advised by the Adviser or its affiliates, specifically data verification and agreed-upon procedures related to asset securitizations and agreed-upon procedures engagements. |
| (3) | Tax Fees represent tax compliance, tax planning and tax advice services provided in connection with the preparation and review of the Registrant’s tax returns. |
| (4) | Tax Fees represent tax compliance, tax planning and tax advice services provided in connection with the review of Covered Entities' tax returns. |
| (5) | The fees included under “All Other Fees” are for services provided by Ernst & Young LLP related to surprise examinations for certain investment accounts to satisfy SEC Custody Rules and consulting services related to merger integration for sister entity to the Adviser. |
(e)(1) The audit committee’s pre-approval policies and procedures are as follows:
AUDIT COMMITTEE
AUDIT AND NON-AUDIT SERVICES
PRE-APPROVAL POLICY AND PROCEDURES
OF THE
MORGAN STANLEY FUNDS
AS ADOPTED AND AMENDED JULY 23, 2004 AND JUNE 12 AND 13, 20193
1. Statement of Principles
The Audit Committee of the Board is required to review and, in its sole discretion, pre-approve all Covered Services to be provided by the Independent Auditors to the Fund and Covered Entities in order to assure that services performed by the Independent Auditors do not impair the auditor’s independence from the Fund.
The SEC has issued rules specifying the types of services that an independent auditor may not provide to its audit client, as well as the audit committee’s administration of the engagement of the independent auditor. The SEC’s rules establish two different approaches to pre-approving services, which the SEC considers to be equally valid. Proposed services either: may be pre-approved without consideration of specific case-by-case services by the Audit Committee (“general pre-approval”); or require the specific pre-approval of the Audit Committee or its delegate (“specific pre-approval”). The Audit Committee believes that the combination of these two approaches in this Policy will result in an effective and efficient procedure to pre-approve services performed by the Independent Auditors. As set forth in this Policy, unless a type of service has received general pre-approval, it will require specific pre-approval by the Audit Committee (or by any member of the Audit Committee to which pre-approval authority has been delegated) if it is to be provided by the Independent Auditors. Any proposed services exceeding pre-approved cost levels or budgeted amounts will also require specific pre-approval by the Audit Committee.
The appendices to this Policy describe the Audit, Audit-related, Tax and All Other services that have the general pre-approval of the Audit Committee. The term of any general pre-approval is 12 months from the date of pre-approval, unless the Audit Committee considers and provides a different period and states otherwise. The Audit Committee will annually review and pre-approve the services that may be provided by the Independent Auditors without obtaining specific pre-approval from the Audit Committee. The Audit Committee will add to or subtract from the list of general pre-approved services from time to time, based on subsequent determinations.
The purpose of this Policy is to set forth the policy and procedures by which the Audit Committee intends to fulfill its responsibilities. It does not delegate the Audit Committee’s responsibilities to pre-approve services performed by the Independent Auditors to management.
The Fund’s Independent Auditors have reviewed this Policy and believes that implementation of the Policy will not adversely affect the Independent Auditors’ independence.
3 This Audit Committee Audit and Non-Audit Services Pre-Approval Policy and Procedures (the “Policy”), adopted as of the date above, supersedes and replaces all prior versions that may have been adopted from time to time.
2. Delegation
As provided in the Act and the SEC’s rules, the Audit Committee may delegate either type of pre-approval authority to one or more of its members. The member to whom such authority is delegated must report, for informational purposes only, any pre-approval decisions to the Audit Committee at its next scheduled meeting.
3. Audit Services
The annual Audit services engagement terms and fees are subject to the specific pre-approval of the Audit Committee. Audit services include the annual financial statement audit and other procedures required to be performed by the Independent Auditors to be able to form an opinion on the Fund’s financial statements. These other procedures include information systems and procedural reviews and testing performed in order to understand and place reliance on the systems of internal control, and consultations relating to the audit. The Audit Committee will approve, if necessary, any changes in terms, conditions and fees resulting from changes in audit scope, Fund structure or other items.
In addition to the annual Audit services engagement approved by the Audit Committee, the Audit Committee may grant general pre-approval to other Audit services, which are those services that only the Independent Auditors reasonably can provide. Other Audit services may include statutory audits and services associated with SEC registration statements (on Forms N-1A, N-2, N-3, N-4, etc.), periodic reports and other documents filed with the SEC or other documents issued in connection with securities offerings.
The Audit Committee has pre-approved the Audit services in Appendix A. All other Audit services not listed in Appendix A must be specifically pre-approved by the Audit Committee (or by any member of the Audit Committee to which pre-approval has been delegated).
4. Audit-related Services
Audit-related services are assurance and related services that are reasonably related to the performance of the audit or review of the Fund’s financial statements and, to the extent they are Covered Services, the Covered Entities or that are traditionally performed by the Independent Auditors. Because the Audit Committee believes that the provision of Audit-related services does not impair the independence of the auditor and is consistent with the SEC’s rules on auditor independence, the Audit Committee may grant general pre-approval to Audit-related services. Audit-related services include, among others, accounting consultations related to accounting, financial reporting or disclosure matters not classified as “Audit services”; assistance with understanding and implementing new accounting and financial reporting guidance from rulemaking authorities; agreed-upon or expanded audit procedures related to accounting and/or billing records required to respond to or comply with financial, accounting or regulatory reporting matters; and assistance with internal control reporting requirements under Forms N-CEN and/or N-CSR.
The Audit Committee has pre-approved the Audit-related services in Appendix A. All other Audit-related services not listed in Appendix A must be specifically pre-approved by the Audit Committee (or by any member of the Audit Committee to which pre-approval has been delegated).
5. Tax Services
The Audit Committee believes that the Independent Auditors can provide Tax services to the Fund and, to the extent they are Covered Services, the Covered Entities, such as tax compliance, tax planning and tax advice without impairing the auditor’s independence, and the SEC has stated that the Independent Auditors may provide such services.
Pursuant to the preceding paragraph, the Audit Committee has pre-approved the Tax Services in Appendix A. All Tax services in Appendix A must be specifically pre-approved by the Audit Committee (or by any member of the Audit Committee to which pre-approval has been delegated).
6. All Other Services
The Audit Committee believes, based on the SEC’s rules prohibiting the Independent Auditors from providing specific non-audit services, that other types of non-audit services are permitted. Accordingly, the Audit Committee believes it may grant general pre-approval to those permissible non-audit services classified as All Other services that it believes are routine and recurring services, would not impair the independence of the auditor and are consistent with the SEC’s rules on auditor independence.
The Audit Committee has pre-approved the All Other services in Appendix A. Permissible All Other services not listed in Appendix A must be specifically pre-approved by the Audit Committee (or by any member of the Audit Committee to which pre-approval has been delegated).
7. Pre-Approval Fee Levels or Budgeted Amounts
Pre-approval fee levels or budgeted amounts for all services to be provided by the Independent Auditors will be established annually by the Audit Committee. Any proposed services exceeding these levels or amounts will require specific pre-approval by the Audit Committee. The Audit Committee is mindful of the overall relationship of fees for audit and non-audit services in determining whether to pre-approve any such services.
8. Procedures
All requests or applications for services to be provided by the Independent Auditors that do not require specific approval by the Audit Committee will be submitted to the Fund’s Principal Financial and Accounting Officer and must include a detailed description of the services to be rendered. The Fund’s Principal Financial and Accounting Officer will determine whether such services are included within the list of services that have received the general pre-approval of the Audit Committee. The Audit Committee will be informed on a timely basis of any such services rendered by the Independent Auditors. Requests or applications to provide services that require specific approval by the Audit Committee or Chairperson of the Audit Committee will be submitted to the Audit Committee by the Fund’s Principal Financial and Accounting Officer, who, after consultation with the Independent Auditors, will discuss whether the request or application is consistent with the SEC’s rules on auditor independence.
The Audit Committee has designated the Fund’s Principal Financial and Accounting Officer to monitor the performance of all services provided by the Independent Auditors and to determine whether such services are in compliance with this Policy. The Fund’s Principal Financial and Accounting Officer will report to the Audit Committee on a periodic basis on the results of its monitoring. Both the Fund’s Principal Financial and Accounting Officer and management will immediately report to the Chairperson of the Audit Committee any breach of this Policy that comes to the attention of the Fund’s Principal Financial and Accounting Officer or any member of management.
9. Additional Requirements
The Audit Committee has determined to take additional measures on an annual basis to meet its responsibility to oversee the work of the Independent Auditors and to assure the auditor’s independence from the Fund, such as reviewing a formal written statement from the Independent Auditors delineating all relationships between the Independent Auditors and the Fund, consistent with the PCAOB’s Ethics and Independence Rule 3526, and discussing with the Independent Auditors its methods and procedures for ensuring independence.
10. Covered Entities
Covered Entities include the Fund’s investment adviser(s) and any entity controlling, controlled by or under common control with the Fund’s investment adviser(s) that provides ongoing services to the Fund(s). Beginning with non-audit service contracts entered into on or after May 6, 2003, the Fund’s audit committee must pre-approve non-audit services provided not only to the Fund but also to the Covered Entities if the engagements relate directly to the operations and financial reporting of the Fund. This list of Covered Entities would include:
Morgan Stanley Funds
Morgan Stanley & Co. LLC
Morgan Stanley Investment Management Inc.
Morgan Stanley Investment Management Limited
Morgan Stanley Investment Management Private Limited
Morgan Stanley Asset & Investment Trust Management Co., Limited
Morgan Stanley Investment Management Company
Morgan Stanley Services Company, Inc.
Morgan Stanley Distribution, Inc.
Morgan Stanley AIP GP LP
Morgan Stanley Alternative Investment Partners LP
Morgan Stanley Smith Barney LLC
Morgan Stanley Capital Management LLC
Morgan Stanley Asia Limited
Morgan Stanley Services Group
(e)(2) Beginning with non-audit service contracts entered into on or after May 6, 2003, the audit committee also is required to pre-approve services to Covered Entities to the extent that the services are determined to have a direct impact on the operations or financial reporting of the Registrant. 100% of such services were pre-approved by the audit committee pursuant to the Audit Committee’s pre-approval policies and procedures (attached hereto).
(f) Not applicable.
(g) See table above.
(h) The audit committee of the Board of Trustees has considered whether the provision of services other than audit services performed by the auditors to the Registrant and Covered Entities is compatible with maintaining the auditors' independence in performing audit services.
APPENDIX A
Pre-Approved Audit Services
| Service | Range of Fees |
| | The Fund(s) | Covered
Entities |
| Statutory audits or financial audits for the Funds | For a complete list of fees, please contact the legal department ** | N/A |
| Services associated with SEC registration statements (including new fund filings/seed audits), periodic reports and other documents filed with the SEC or other documents issued in connection with securities offerings (e.g., comfort letters for closed-end fund offerings, consents), and assistance in responding to SEC comment letters | * | * |
| Consultations by the Fund’s management as to the accounting or disclosure treatment of transactions or events and/or the actual or potential impact of final or proposed rules, standards or interpretations by the SEC, FASB, or other regulatory or standard setting bodies (Note: Under SEC rules, some consultations may be “audit related” services rather than “audit” services) | * | * |
Pre-Approved Audit-Related Services
| Service | Range of Fees |
| | The Fund(s) | Covered
Entities |
| Attest procedures not required by statute or regulation | * | * |
| Due diligence services pertaining to potential fund mergers | * | * |
| Consultations by the Fund’s management as to the accounting or disclosure treatment of transactions or events and/or the actual or potential impact of final or proposed rules, standards or interpretations by the SEC, FASB, or other regulatory or standard-setting bodies (Note: Under SEC rules, some consultations may be “audit” services rather than “audit-related” services) | * | * |
| General assistance with implementation of the requirements of SEC rules or listing standards promulgated pursuant to the Sarbanes-Oxley Act | * | * |
Pre-Approved Tax Services
| Service | Range of Fees |
| | The Fund(s) | Covered
Entities |
| U.S. federal, state and local tax planning and advice | * | * |
| U.S. federal, state and local tax compliance | * | * |
| International tax planning and advice | * | * |
| International tax compliance | * | * |
| Review/preparation of federal, state, local and international income, franchise, and other tax returns | $450,000
PwC | N/A |
| Identification of Passive Foreign Investment Companies | $175,000
PwC | * |
| PwC ITV Tool – assist in determining which Fund holdings have foreign capital gains tax exposure | $125,000
PwC | * |
| Foreign Tax Services - Preparation of local foreign tax returns and assistance with local tax compliance issues (including maintenance of transaction schedules, assistance in periodic tax remittances, tax registration, representing funds before foreign revenue authorities and assistance with assessment orders) | $500,000
PwC | * |
| Assistance with tax audits and appeals before the IRS and similar state, local and foreign agencies | * | * |
| Tax advice and assistance regarding statutory, regulatory or administrative developments (e.g., excise tax reviews, evaluation of Fund’s tax compliance function) | * | * |
Pre-Approved All Other Services
| Service | Range of Fees |
| | The Fund(s) | Covered
Entities |
| Risk management advisory services, e.g., assessment and testing of security infrastructure controls | * | * |
* Aggregate fees related to the pre-approved services will be limited to 10% of the 2023-2024 annual fees for audit and tax services (see fee schedule distributed by the Auditors).
** Audit and tax services for new funds/portfolios will be subject to the maximum audit and tax fee for a fund/portfolio on fee schedule distributed by the Auditors.
Prohibited Non-Audit Services
● Bookkeeping or other services related to the accounting records or financial statements of the audit client
● Financial information systems design and implementation
● Appraisal or valuation services, fairness opinions or contribution-in-kind reports
● Actuarial services
● Internal audit outsourcing services
● Management functions
● Human resources
● Broker-dealer, investment adviser or investment banking services
● Legal services
● Expert services unrelated to the audit
(i) Not Applicable.
(j) Not Applicable.
Item 5. Audit Committee of Listed Registrants.
(a) The registrant has a separately-designated standing audit committee established in accordance with Section 3(a)(58)(A) of the Exchange Act whose members are:
Joseph J. Kearns, Nancy C. Everett, Eddie A. Grier and Jakki L. Haussler.
(b) Not applicable.
Item 6. Schedule of Investments
(a) Refer to Item 1.
(b) Not applicable.
Item 7. Disclosure of Proxy Voting Policies and Procedures for Closed-End Management Investment Companies.
Applicable only to reports filed by closed-end funds.
Item 8. Portfolio Managers of Closed-End Management Investment Companies
Applicable only to reports filed by closed-end funds.
Item 9. Closed-End Fund Repurchases
Applicable only to reports filed by closed-end funds.
Item 10. Submission of Matters to a Vote of Security Holders
There have been no material changes to the procedures by which shareholders may recommend nominee to the Fund’s Board of Trustees since the Fund last provided disclosure in response to this item.
Item 11. Controls and Procedures
(a) The registrant’s principal executive officer and principal financial officer have concluded that the registrant’s disclosure controls and procedures are sufficient to ensure that information required to be disclosed by the registrant in this Form N-CSR was recorded, processed, summarized and reported within the time periods specified in the Securities and Exchange Commission's rules and forms, based upon such officers' evaluation of these controls and procedures as of a date within 90 days of the filing date of the report.
(b) There were no changes in the registrant's internal control over financial reporting that occurred during the period covered by this report that has materially affected, or is reasonably likely to materially affect, the registrant's internal control over financial reporting.
Item 12. Disclosure of Securities Lending Activities for Closed-End Management Investment Companies.
Not Applicable
Item 13. Exhibits
(a) The Code of Ethics for Principal Executive and Senior Financial Officers.
(b) A separate certification for each principal executive officer and principal financial officer of the registrant as part of EX-99.CERT.
(c) Section 906 certification
SIGNATURES
Pursuant to the requirements of the Securities Exchange Act of 1934 and the Investment Company Act of 1940, the registrant has duly caused this report to be signed on its behalf by the undersigned, thereunto duly authorized.
| Morgan Stanley Institutional Fund Trust | |
| | |
| /s/ John H. Gernon | |
| John H. Gernon | |
| Principal Executive Officer | |
| November 20, 2023 | |
Pursuant to the requirements of the Securities Exchange Act of 1934 and the Investment Company Act of 1940, this report has been signed by the following persons on behalf of the registrant and in the capacities and on the dates indicated.
| /s/ John H. Gernon | |
| John H. Gernon | |
| Principal Executive Officer | |
| November 20, 2023 | |
| | |
| /s/ Francis J. Smith | |
| Francis J. Smith | |
| Principal Financial Officer | |
| November 20, 2023 | |