UNITED STATES
SECURITIES AND EXCHANGE COMMISSION
Washington, D.C. 20549
FORM N-CSR
CERTIFIED SHAREHOLDER REPORT OF REGISTERED
MANAGEMENT INVESTMENT COMPANIES
Investment Company Act file number: 811-04000
CALVERT VARIABLE PRODUCTS, INC.
(Exact name of registrant as specified in charter)
4550 Montgomery Avenue
Suite 1000N
Bethesda, Maryland 20814
(Address of Principal Executive Offices)
John H. Streur
4550 Montgomery Avenue
Suite 1000N
Bethesda, Maryland 20814
(Name and Address of Agent for Service)
Registrant's telephone number, including area code: (301) 951-4800
Date of fiscal year end: December 31
Date of reporting period: Year ended December 31, 2015
Item 1. Report to Stockholders.
|
| |
|
Calvert VP SRI Large Cap Value Portfolio |
Annual Report December 31, 2015 | |
|
| | | | |
| | TABLE OF CONTENTS |
| | | | | |
| | | | | President's Letter |
| | | | | Portfolio Management Discussion |
| | | | | Understanding Your Fund's Expenses |
| | | | | Report of Independent Registered Public Accounting Firm |
| | | | | Schedule of Investments |
| | | | | Statement of Assets and Liabilities |
| | | | | Statement of Operations |
| | | | | Statements of Changes in Net Assets |
| | | | | Notes to Financial Statements |
| | | | | Financial Highlights |
| | | | | Proxy Voting |
| | | | | Availability of Quarterly Portfolio Holdings |
| | | | | Basis for Board’s Approval of Investment Advisory Contract |
| | | | | Director and Officer Information Table |
|
| |
| John Streur President and Chief Executive Officer, Calvert Investments, Inc. |
Dear Fellow Shareholders:
What once was a small social movement seemed to crystalize last year as the investing public began to recognize that financial and social goals can be represented by sustainable, responsible and impact investment strategies. The growth of this movement is influencing the entire world and fills us with optimism about the role capital markets and corporations can play in unlocking value beyond balance sheets and income statements.
As a global socially responsible investing (SRI) leader, we at Calvert are gratified that new findings from The Forum for Responsible and Social Investment reveal an explosion of SRI integration among all professional managers. U.S.-domiciled assets under management using responsible strategies grew to $6.57 trillion in 2014 from $3.74 trillion at the start of 2012. Approximately one of every six dollars under domestic professional management is now following SRI strategies.
A Look at 2015
While responsible investing is expanding at an exciting pace, the economic conditions in 2015 presented challenges including slower domestic growth, uncertainty over central bankers’ policy decisions, and volatility across both emerging markets and mature markets in Asia and Europe. These conditions placed downward pressure on multinational corporations’ capital expenditures, small and mid-sized business investments, commodity prices and consumer spending. Also at play is the heavy debt burden of developed countries. This debt burden results in a troubling sequence of events: countries must fund interest on the debt instead of funding innovation and development; the lack of development dampens growth; low growth limits employment opportunities; decreased employment opportunities disproportionally affect the poor. We believe this cycle will keep economic growth low for the foreseeable future.
In the face of this lower growth environment, we need to look for ways to improve economic inclusion and allow disadvantaged people to participate in a slow growth economy.
We are encouraged by evidence that global leaders recognize this need and are starting to take steps to replace it with a positive sequence of events: solving urgent social and environmental problems, which leads to stronger economies, which leads to growth and better employment opportunities.
The Evolution at Calvert
To respond to recent market swings, we have taken steps to manage your portfolio conservatively by focusing on equity and fixed-income investments best suited to the climate. Our steps included a thorough assessment of both the financial characteristics and environmental, social and governance (ESG) performance of a number of companies. As appropriate across funds, we strategically re-allocated capital to lower-risk, stable-return assets.
In addition to serving as stewards of your money, we also implemented a strategy to reinforce our focus on shareholders as well as the value they specifically seek from both a financial and social perspective. Our new leadership team implemented a complex-wide plan that spanned reducing fees for many funds, enhancing research capabilities and aligning most strategies under our Principles for Responsible Investment. This effort resulted in the reduction of several Calvert funds’ expense ratios by more than 10 percent.
www.calvert.com CALVERT VP SRI LARGE CAP VALUE PORTFOLIO ANNUAL REPORT (UNAUDITED) 1
Calvert has also publicly amplified the values held by our leadership and shareholders. During the 2015 proxy season, we co-filed or filed a variety of shareholder proposals and resolutions—specific to agricultural, environmental and diversity issues. We also advocated for responsible investing at key forums, such as an Impact Over Easy event, and partnered with Harvard University professor George Serafeim to further define for investors the evolving role of the corporation in society. Lastly, I was honored to attend the United Nations Development Conference and chair the Roundtable on Peace and Stability at the Private Sector Forum on Implementing the Sustainable Development Goals.
Looking Ahead to 2016 and Beyond
In the months to come, we need to adopt more modest economic growth expectations as China sputters, emerging economies confront fiscal woes, and political uncertainty looms in the U.S. and elsewhere. We believe this year may well mark the beginning of a lower-growth period that extends into the foreseeable future. But while research-driven investment strategies can adapt relatively quickly to a shifting landscape, capital markets participants must also consciously work to help ensure the less fortunate and those championing key environmental and social causes do not bear the brunt of economic tightening. To overlook this obligation in the near-term will only perpetuate inequalities that hinder all global citizens over the long-term.
Our 2016 outlook is both pragmatic and optimistic. The recent Vatican Encyclical and Paris Climate Agreement reinforces to us that the entire world—not just segments of the institutional investment community—is rapidly embracing the principles that underpin SRI strategies. Ongoing evidence of this shift is further energizing us as we leverage our bolstered research processes to ensure ESG standards, fundamental quality and fair valuation guide every investment we make.
Despite day-to-day fluctuations in the markets, the next year will be a transformative chapter in the story of how the global capital markets ultimately align financial and social goals. Our leadership appreciates and recognizes that it is your trust in us that empowers Calvert to help drive this transformation. Thank you for the opportunity to manage investments on your behalf.
Sincerely,
John Streur
President and Chief Executive Officer
Calvert Investments
2 www.calvert.com CALVERT VP SRI LARGE CAP VALUE PORTFOLIO ANNUAL REPORT (UNAUDITED)
|
| | |
| | | PORTFOLIO MANAGEMENT DISCUSSION |
|
| | | |
| Rachel Volynsky Vice President, Portfolio Manager | | Yvonne Bishop Assistant Portfolio Manager |
Market Review
The U.S. held up better than most developed markets in 2015, but the S&P 500 Index only managed to eke out a +1.4% total return. Stock markets in resource rich economies suffered large declines in U.S. dollar terms, while Japan was a relative bright spot with a +10% total return. This year has been particularly challenging for value investors - with a sluggish global economy, China’s growth decelerating, and commodity prices falling, investors were willing to pay a premium for growth opportunities.
Calendar year 2015 will likely be remembered as the year of the FANGs (FB, AMZN, NFLX, and GOOGL), with the market narrowing around a small handful of larger cap growth stocks. Regardless of business quality, balance sheet strength and valuation the market in general rewarded companies that posted positive earnings revisions and sales momentum, the top 2 contributing factors to returns over the past year.
Investment Strategy and Technique:
On October 1, 2015, we adopted the Calvert Principles for Responsible Investing.
| |
| • | The portfolio is free of fossil fuel investments |
| |
| • | Our stock selection process is value-driven, seeking companies with (1) solid balance sheets, (2) good businesses with strong products & processes, (3) strong company management, (4) trading at a discount to intrinsic value. We look for opportunities where the market has been overly punitive, provided the targets have solid corporate governance and favorable ESG characteristics/themes. |
Fund Performance Relative to the Benchmark
Stock selection was the primary detractor from our relative performance as this past year’s market sentiment has overly punished still strong companies that did post modest negative earnings revisions, due to short term
factors. A few of our holdings in the consumer discretionary sector struggled to adapt to changing consumer habits.
| |
| • | Retailers The Gap and Kingfisher plc are improving their supply chains to react faster to the competition |
| |
| • | Time Warner should weather changing TV viewing habits with its strong content and subscription based model |
Strong domestic currencies and weak emerging market demand proved to be strong headwinds for another group of our holdings.
| |
| • | Eaton and Cummins are both well-capitalized industrial companies with energy conservation themes to support earnings through the cycle |
| |
| • | Swatch’s luxury brands are expected to continue to appeal to the emerging Chinese consumer in face of a slowing Chinese economy |
Positive contributors to our relative performance included stock selection in consumer staples, technology and telecom sectors. Eliminating fossil fuels paid off well for us in light of oil’s 30% price decline and the weak demand for electric utilities.
| |
| • | Unilever and PepsiCo outperforming, capitalizing on health and wellness opportunities |
| |
| • | Deutsche Telekom benefited from an increased its focus on return on capital and substantial improvements in its US subsidiary T-Mobile |
| |
| • | Both Alphabet (formerly known as Google) and Microsoft have benefited from successful strategy transformation and better financial discipline |
| |
| • | Sector underweights in Electric Utilities and Oil & Gas Exploration & Production |
www.calvert.com CALVERT VP SRI LARGE CAP VALUE PORTFOLIO ANNUAL REPORT (UNAUDITED) 3
Positioning and Market Outlook
In summary, we maintain our conviction in the value philosophy and are excited about the defensive positioning of the Fund. We see the recent weakness in our holdings as creating greater upside return targets over our three to five year investment horizon and potentially sooner as many of the recent detractors revert from their oversold levels.
|
| |
| |
| Rachel Volynsky | Yvonne Bishop |
Calvert Investment Management, Inc.
December 2015
|
| | | |
| ECONOMIC SECTORS | % OF TOTAL INVESTMENTS | |
| Financials | 23.4 | % | |
| Information Technology | 14.7 | % | |
| Health Care | 13.7 | % | |
| Consumer Staples | 10.0 | % | |
| Telecommunication Services | 9.0 | % | |
| Consumer Discretionary | 8.9 | % | |
| Industrials | 8.9 | % | |
| Energy | 7.7 | % | |
| Materials | 1.9 | % | |
| Short-Term Investments | 1.8 | % | |
| Total | 100.0 | % | |
| | | |
| TEN LARGEST STOCK HOLDINGS | % OF NET ASSETS | |
| Microsoft Corp. | 3.7 | % | |
| US Bancorp | 3.6 | % | |
| Alphabet, Inc. | 3.5 | % | |
| Merck & Co., Inc. | 3.4 | % | |
| Vodafone Group plc (ADR) | 3.4 | % | |
| American International Group, Inc. | 3.3 | % | |
| JPMorgan Chase & Co. | 3.3 | % | |
| The PNC Financial Services Group, Inc. | 3.3 | % | |
| Sanofi SA (ADR) | 3.2 | % | |
| Verizon Communications, Inc. | 3.2 | % | |
| Total | 33.9 | % | |
| | | |
4 www.calvert.com CALVERT VP SRI LARGE CAP VALUE PORTFOLIO ANNUAL REPORT (UNAUDITED)
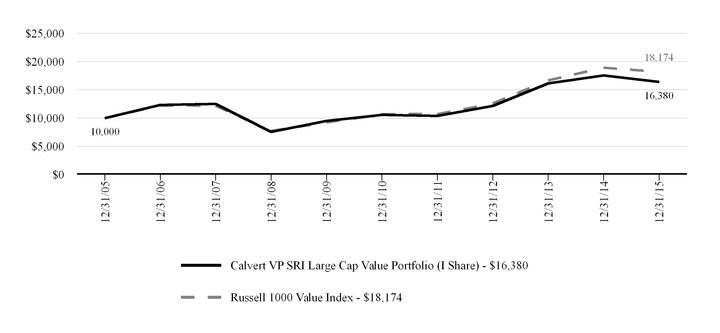
Growth of $10,000
The graph below shows the value of a hypothetical $10,000 investment in the Portfolio over the past 10 fiscal year periods. The results shown are for Class I shares, and assume the reinvestment of dividends. The result is compared with a broad based market index. Market indexes are unmanaged and their results do not reflect the effect of expenses or sales charges. The value of an investment in a different share class would be different.
|
| | | | | | |
| CALVERT VP SRI LARGE CAP VALUE PORTFOLIO |
| DECEMBER 31, 2015 |
| AVERAGE ANNUAL TOTAL RETURNS | 1 Year | 5 Year | 10 Year |
| Class I | -6.59 | % | 9.15 | % | 5.06 | % |
| Russell 1000 Value Index | -3.83 | % | 11.27 | % | 6.16 | % |
| | | | |
The performance data shown represents past performance, does not guarantee future results and assumes reinvestment of all dividends and distributions. All performance data reflects fee waivers and/or expense limitations, if any are in effect; in their absence performance would be lower. See Note B in Notes to Financial Statements. The investment return and principal value of an investment will fluctuate so that an investor’s shares, when redeemed, may be worth more or less than their original cost. Current performance may be lower or higher than the performance data quoted.
Visit calvert.com/institutional-VP-performance.html for current performance data. The gross expense ratio from the current prospectus for the Portfolio is 0.85%. This number may vary from the expense ratio shown elsewhere in this report because it is based on a different time period and, if applicable, does not include fee or expense waivers. The performance data and expense ratio reflect deduction of Portfolio operating expenses, but do not reflect charges and expenses imposed under the variable annuity or life insurance contract.
www.calvert.com CALVERT VP SRI LARGE CAP VALUE PORTFOLIO ANNUAL REPORT (UNAUDITED) 5
UNDERSTANDING YOUR FUND'S EXPENSES
As an investor, you incur two types of costs. There are transaction costs. There are also ongoing costs, which generally include management fees and other fund expenses. The following information is intended to help you understand your ongoing costs (in dollars) of investing in this mutual fund and to help you compare these costs with the ongoing costs of investing in other mutual funds.
To illustrate these ongoing costs, we have provided examples and calculated the expenses paid by the fund's investors during the period. The actual and hypothetical information presented in the examples is based on an investment of $1,000 invested at the beginning of the period and held for the entire period (July 1, 2015 to December 31, 2015).
Note: Expenses do not reflect charges and expenses of the variable annuity or variable universal life contract.
Actual Expenses
The first line of the table below provides information about actual account values and actual expenses. You may use the information in this line, together with the amount you invested, to estimate the expenses that you paid over the period. Simply divide your account value by $1,000 (for example, an $8,600 account value divided by $1,000 = 8.6), then multiply the result by the number in the first line under the heading entitled “Expenses Paid During Period” to estimate the expenses you paid on your account during this period.
Hypothetical Example for Comparison Purposes
The second line of the table below provides information about hypothetical account values and hypothetical expenses based on the Fund’s actual expense ratio and an assumed rate of return of 5% per year before expenses, which is not the Fund’s actual return. The hypothetical account values and expenses may not be used to estimate the actual ending account balance or expenses you paid for the period. You may use this information to compare the ongoing costs of investing in the Fund and other funds. To do so, compare the 5% hypothetical example with the 5% hypothetical examples that appear in the shareholder reports of the other funds.
Please note that the expenses shown in the table are meant to highlight your ongoing costs only and do not reflect any transactional costs. Therefore, the second line of the table is useful in comparing ongoing costs only, and will not help you determine the relative total costs of owning different funds. In addition, if these transactional costs were included, your costs would have been higher.
|
| | | | |
| | ANNUALIZED
EXPENSE RATIO | BEGINNING
ACCOUNT VALUE
7/1/15 | ENDING
ACCOUNT VALUE
12/31/15 | EXPENSES PAID
DURING PERIOD*
7/1/15 - 12/31/15 |
| | | | | |
| Actual | 0.78% | $1,000.00 | $918.30 | $3.77 |
| Hypothetical (5% return per year before expenses) | 0.78% | $1,000.00 | $1,021.27 | $3.97 |
| |
| * Expenses paid during the period are equal to the annualized expense ratio as indicated above, multiplied by the average account value over the period, multiplied by 184/365 (to reflect the one-half year period). Expense ratios shown in the Financial Highlights represent the actual expenses incurred for the fiscal year. |
6 www.calvert.com CALVERT VP SRI LARGE CAP VALUE PORTFOLIO ANNUAL REPORT (UNAUDITED)
REPORT OF INDEPENDENT REGISTERED PUBLIC ACCOUNTING FIRM
The Board of Directors of Calvert Variable Products, Inc. and Shareholders of Calvert VP SRI Large Cap Value Portfolio:
We have audited the accompanying statement of assets and liabilities, including the schedule of investments, of the Calvert VP SRI Large Cap Value Portfolio (the “Portfolio”), a series of Calvert Variable Products, Inc., as of December 31, 2015, and the related statement of operations for the year then ended, the statements of changes in net assets for each of the years in the two-year period then ended, and the financial highlights for each of the years in the five-year period then ended. These financial statements and financial highlights are the responsibility of the Portfolio’s management. Our responsibility is to express an opinion on these financial statements and financial highlights based on our audits.
We conducted our audits in accordance with the standards of the Public Company Accounting Oversight Board (United States). Those standards require that we plan and perform the audit to obtain reasonable assurance about whether the financial statements and financial highlights are free of material misstatement. An audit includes examining, on a test basis, evidence supporting the amounts and disclosures in the financial statements. Our procedures included confirmation of securities owned as of December 31, 2015, by correspondence with the custodian and brokers or by performing other appropriate auditing procedures. An audit also includes assessing the accounting principles used and significant estimates made by management, as well as evaluating the overall financial statement presentation. We believe that our audits provide a reasonable basis for our opinion.
In our opinion, the financial statements and financial highlights referred to above present fairly, in all material respects, the financial position of the Portfolio as of December 31, 2015, the results of its operations for the year then ended, the changes in its net assets for each of the years in the two-year period then ended, and the financial highlights for each of the years in the five-year period then ended, in conformity with U.S. generally accepted accounting principles.
Philadelphia, Pennsylvania
February 24, 2016
www.calvert.com CALVERT VP SRI LARGE CAP VALUE PORTFOLIO ANNUAL REPORT 7
CALVERT VP SRI LARGE CAP VALUE PORTFOLIO
SCHEDULE OF INVESTMENTS
DECEMBER 31, 2015
|
| | | | |
| | SHARES | VALUE ($) |
| COMMON STOCKS - 98.1% | | |
| Banks - 12.1% | | |
| BB&T Corp. | 19,000 | 718,390 |
|
| JPMorgan Chase & Co. | 39,420 | 2,602,903 |
|
| PNC Financial Services Group, Inc. (The) | 27,056 | 2,578,707 |
|
| US Bancorp | 67,500 | 2,880,225 |
|
| Wells Fargo & Co. | 14,000 | 761,040 |
|
| | | 9,541,265 |
|
| | | |
| Beverages - 2.0% | | |
PepsiCo, Inc. | 16,050 | 1,603,716 |
|
| | | |
| Biotechnology - 4.9% | | |
| Amgen, Inc. | 12,800 | 2,077,824 |
|
| Gilead Sciences, Inc. | 17,798 | 1,800,980 |
|
| | | 3,878,804 |
|
| | | |
| Capital Markets - 4.4% | | |
| Bank of New York Mellon Corp. (The) | 45,188 | 1,862,649 |
|
| Invesco Ltd. | 24,000 | 803,520 |
|
| T. Rowe Price Group, Inc. | 11,000 | 786,390 |
|
| | | 3,452,559 |
|
| | | |
| Chemicals - 1.8% | | |
Potash Corp. of Saskatchewan, Inc. | 84,677 | 1,449,670 |
|
| | | |
| Communications Equipment - 4.9% | | |
| Cisco Systems, Inc. | 62,524 | 1,697,839 |
|
| QUALCOMM, Inc. | 44,327 | 2,215,685 |
|
| | | 3,913,524 |
|
| | | |
| Consumer Finance - 1.8% | | |
Capital One Financial Corp. | 19,604 | 1,415,017 |
|
| | | |
| Diversified Telecommunication Services - 5.6% | | |
| Deutsche Telekom AG (ADR) | 106,854 | 1,910,549 |
|
| Verizon Communications, Inc. | 54,000 | 2,495,880 |
|
| | | 4,406,429 |
|
| | | |
| Electrical Equipment - 2.0% | | |
Eaton Corp. plc | 30,251 | 1,574,262 |
|
| | | |
8 www.calvert.com CALVERT VP SRI LARGE CAP VALUE PORTFOLIO ANNUAL REPORT
|
| | | | |
| | SHARES | VALUE ($) |
| COMMON STOCKS - Cont'd | | |
| Energy Equipment & Services - 7.7% | | |
| Core Laboratories NV | 11,200 | 1,217,888 |
|
| FMC Technologies, Inc. * | 26,000 | 754,260 |
|
| National Oilwell Varco, Inc. | 70,635 | 2,365,566 |
|
| Oceaneering International, Inc. | 15,500 | 581,560 |
|
| Technip SA(a) | 23,459 | 1,157,822 |
|
| | | 6,077,096 |
|
| | | |
| Food & Staples Retailing - 1.6% | | |
J Sainsbury plc(a) | 325,000 | 1,238,647 |
|
| | | |
| Food Products - 0.5% | | |
General Mills, Inc. | 7,000 | 403,620 |
|
| | | |
| Household Products - 2.9% | | |
Procter & Gamble Co. (The) | 29,350 | 2,330,683 |
|
| | | |
| Industrial Conglomerates - 2.3% | | |
General Electric Co. | 58,864 | 1,833,614 |
|
| | | |
| Insurance - 5.2% | | |
| American International Group, Inc. | 42,246 | 2,617,985 |
|
| MetLife, Inc. | 30,416 | 1,466,355 |
|
| | | 4,084,340 |
|
| | | |
| Internet Software & Services - 3.5% | | |
Alphabet, Inc. * | 3,610 | 2,739,557 |
|
| | | |
| IT Services - 2.5% | | |
International Business Machines Corp. | 14,647 | 2,015,720 |
|
| | | |
| Machinery - 4.6% | | |
| Cummins, Inc. | 13,251 | 1,166,221 |
|
| Deere & Co. | 20,749 | 1,582,526 |
|
| Dover Corp. | 14,100 | 864,471 |
|
| | | 3,613,218 |
|
| | | |
| Media - 3.8% | | |
| Comcast Corp., Class A | 26,815 | 1,513,170 |
|
| Time Warner, Inc. | 22,865 | 1,478,680 |
|
| | | 2,991,850 |
|
| | | |
| Multiline Retail - 1.6% | | |
Target Corp. | 17,000 | 1,234,370 |
|
| | | |
| Personal Products - 3.0% | | |
Unilever NV, NY Shares | 53,935 | 2,336,464 |
|
| | | |
www.calvert.com CALVERT VP SRI LARGE CAP VALUE PORTFOLIO ANNUAL REPORT 9
|
| | | | |
| | SHARES | VALUE ($) |
| COMMON STOCKS - Cont'd | | |
| Pharmaceuticals - 8.8% | | |
| Merck & Co., Inc. | 51,564 | 2,723,610 |
|
| Pfizer, Inc. | 51,824 | 1,672,879 |
|
| Sanofi SA (ADR) | 59,039 | 2,518,013 |
|
| | | 6,914,502 |
|
| | | |
| Software - 3.7% | | |
Microsoft Corp. | 53,357 | 2,960,246 |
|
| | | |
| Specialty Retail - 1.4% | | |
Gap, Inc. (The) | 45,741 | 1,129,803 |
|
| | | |
| Textiles, Apparel & Luxury Goods - 2.1% | | |
Swatch Group AG (The)(a) | 4,778 | 1,666,991 |
|
| | | |
| Wireless Telecommunication Services - 3.4% | | |
Vodafone Group plc (ADR) | 83,199 | 2,684,000 |
|
| | | |
| | | |
| Total Common Stocks (Cost $81,976,737) | | 77,489,967 |
|
| | | |
| | | |
| | PRINCIPAL
AMOUNT ($) | |
| TIME DEPOSIT - 1.9% | | |
| State Street Bank Time Deposit, 0.278%, 1/4/16 | 1,447,544 | 1,447,544 |
|
| | | |
| | | |
| Total Time Deposit (Cost $1,447,544) | | 1,447,544 |
|
| | | |
| | | |
| TOTAL INVESTMENTS (Cost $83,424,281) - 100.0% | | 78,937,511 |
|
| Other assets and liabilities, net - 0.0% | | 28,316 |
|
NET ASSETS - 100.0% | |
| $78,965,827 |
|
|
| |
| NOTES TO SCHEDULE OF INVESTMENTS |
| * | Non-income producing security. |
| (a) | Due to significant market movements following the close of trading in the local market, the value of this security as of December 31, 2015 was adjusted by a third party pricing service. See Note A. |
|
| |
| Abbreviations: |
| ADR: | American Depositary Receipts |
| Ltd.: | Limited |
| plc: | Public Limited Company |
| See notes to financial statements. |
10 www.calvert.com CALVERT VP SRI LARGE CAP VALUE PORTFOLIO ANNUAL REPORT
CALVERT VP SRI LARGE CAP VALUE PORTFOLIO
STATEMENT OF ASSETS AND LIABILITIES
DECEMBER 31, 2015
|
| | | |
| ASSETS | |
| Investments in securities, at value (Cost $83,424,281) - see accompanying schedule |
| $78,937,511 |
|
| Receivable for shares sold | 4,940 |
|
| Dividends and interest receivable | 143,640 |
|
| Directors' deferred compensation plan | 51,414 |
|
| Receivable from Calvert Investment Services, Inc. | 230 |
|
| Total assets | 79,137,735 |
|
| | |
| LIABILITIES | |
| Payable for shares redeemed | 117 |
|
| Payable to Calvert Investment Management, Inc. | 53,671 |
|
| Payable to Calvert Investment Administrative Services, Inc. | 6,780 |
|
| Directors' deferred compensation plan | 51,414 |
|
| Accrued expenses and other liabilities | 59,926 |
|
| Total liabilities | 171,908 |
|
| NET ASSETS |
| $78,965,827 |
|
| | |
| NET ASSETS CONSIST OF: | |
| Paid-in capital applicable to 955,598 shares of common stock outstanding; | |
| $0.10 par value, 40,000,000 shares authorized |
| $83,138,990 |
|
| Undistributed net investment income | 2,067,749 |
|
| Accumulated net realized gain (loss) on investments and foreign currency transactions | (1,753,388) |
|
| Net unrealized appreciation (depreciation) on investments and assets and liabilities denominated in foreign currencies | (4,487,524) |
|
| NET ASSETS |
| $78,965,827 |
|
| | |
| NET ASSET VALUE PER SHARE |
| $82.63 |
|
| See notes to financial statements. | |
www.calvert.com CALVERT VP SRI LARGE CAP VALUE PORTFOLIO ANNUAL REPORT 11
CALVERT VP SRI LARGE CAP VALUE PORTFOLIO
STATEMENT OF OPERATIONS
YEAR ENDED DECEMBER 31, 2015
|
| | | |
| NET INVESTMENT INCOME | |
| Investment Income: | |
| Dividend income (net of foreign taxes withheld of $58,471) |
| $2,953,901 |
|
| Interest income | 1,985 |
|
| Total investment income | 2,955,886 |
|
| | |
| Expenses: | |
| Investment advisory fee | 725,211 |
|
| Administrative fees | 113,314 |
|
| Transfer agency fees and expenses | 10,343 |
|
| Directors' fees and expenses | 19,937 |
|
| Accounting fees | 26,049 |
|
| Custodian fees | 16,672 |
|
| Professional fees | 33,988 |
|
| Reports to shareholders | 22,129 |
|
| Miscellaneous | 5,524 |
|
| Total expenses | 973,167 |
|
| Reimbursement from Advisor | (89,316) |
|
| Net expenses | 883,851 |
|
| NET INVESTMENT INCOME | 2,072,035 |
|
| | |
| | |
| REALIZED AND UNREALIZED GAIN (LOSS) | |
| Net realized gain (loss) on: | |
| Investments | 12,513,565 |
|
| Foreign currency transactions | (4,281) |
|
| | 12,509,284 |
|
| | |
| Change in unrealized appreciation (depreciation) on: | |
| Investments | (18,817,812) |
|
| Assets and liabilities denominated in foreign currencies | (754) |
|
| | (18,818,566) |
|
| | |
| NET REALIZED AND UNREALIZED GAIN (LOSS) | (6,309,282) |
|
| | |
| INCREASE (DECREASE) IN NET ASSETS RESULTING FROM OPERATIONS |
| ($4,237,247 | ) |
| See notes to financial statements. | |
12 www.calvert.com CALVERT VP SRI LARGE CAP VALUE PORTFOLIO ANNUAL REPORT
CALVERT VP SRI LARGE CAP VALUE PORTFOLIO
STATEMENTS OF CHANGES IN NET ASSETS
|
| | | | | | | |
| INCREASE (DECREASE) IN NET ASSETS | YEAR ENDED
DECEMBER 31, 2015 | | YEAR ENDED
DECEMBER 31, 2014 |
| Operations: | | | |
| Net investment income |
| $2,072,035 |
| |
| $2,039,094 |
|
| Net realized gain (loss) | 12,509,284 |
| | 28,609,928 |
|
| Change in unrealized appreciation (depreciation) | (18,818,566) |
| | (17,613,156) |
|
| | | | |
| INCREASE (DECREASE) IN NET ASSETS RESULTING FROM OPERATIONS | (4,237,247) |
| | 13,035,866 |
|
| | | | |
| Distributions to shareholders from: | | | |
| Net investment income | (163,277) |
| | (2,179,364) |
|
| Net realized gain | (3,701,551) |
| | (14,806,187) |
|
| Total distributions | (3,864,828) |
| | (16,985,551) |
|
| | | | |
| Capital share transactions: | | | |
| Shares sold | 1,420,077 |
| | 1,538,975 |
|
| Reinvestment of distributions | 3,864,829 |
| | 16,985,551 |
|
| Shares redeemed | (67,318,109) |
| | (21,511,824) |
|
| Total capital share transactions | (62,033,203) |
| | (2,987,298) |
|
| | | | |
| TOTAL INCREASE (DECREASE) IN NET ASSETS | (70,135,278) |
| | (6,936,983) |
|
| | | | |
| | | | |
| NET ASSETS | | | |
| Beginning of year | 149,101,105 |
| | 156,038,088 |
|
| End of year (including undistributed net investment income of $2,067,749 and $163,272, respectively) |
| $78,965,827 |
| |
| $149,101,105 |
|
| | | | |
| CAPITAL SHARE ACTIVITY | | | |
| Shares sold | 15,584 |
| | 15,232 |
|
| Reinvestment of distributions | 45,966 |
| | 180,928 |
|
| Shares redeemed | (710,349) |
| | (213,868) |
|
| Total capital share activity | (648,799) |
| | (17,708) |
|
| See notes to financial statements. |
www.calvert.com CALVERT VP SRI LARGE CAP VALUE PORTFOLIO ANNUAL REPORT 13
NOTES TO FINANCIAL STATEMENTS
NOTE A — SIGNIFICANT ACCOUNTING POLICIES
General: Calvert VP SRI Large Cap Value Portfolio (the “Portfolio”), a series of Calvert Variable Products, Inc. (the “Fund”), is registered under the Investment Company Act of 1940 as a diversified, open-end management investment company. The Fund is comprised of eleven separate portfolios. The operations of each series of the Fund are accounted for separately. Shares of the Portfolio are sold without sales charge to affiliated and unaffiliated insurance companies for allocation to certain of their variable separate accounts. The Portfolio applies the accounting and reporting guidance in the Financial Accounting Standards Board (FASB) Accounting Standards Codification Topic 946, Financial Services – Investment Companies (ASC 946).
Security Valuation: Net asset value per share is determined every business day as of the close of the regular session of the New York Stock Exchange (generally 4:00 p.m. Eastern time). The Portfolio uses independent pricing services approved by the Board of Directors (“the Board”) to value its investments wherever possible. Investments for which market quotations are not available or deemed not reliable are fair valued in good faith under the direction of the Board.
The Board has adopted Valuation Procedures (the “Procedures”) to determine the fair value of securities and other financial instruments for which market prices are not readily available or which may not be reliably priced. The Board has delegated the day-to-day responsibility for determining the fair value of assets of the Portfolio to Calvert Investment Management, Inc. (the “Advisor” or “Calvert”) and has provided these Procedures to govern Calvert in its valuation duties.
Calvert has chartered an internal Valuation Committee to oversee the implementation of these Procedures and to assist it in carrying out the valuation responsibilities that the Board has delegated.
The Valuation Committee meets on a regular basis to review illiquid securities and other investments which may not have readily available market prices. The Valuation Committee’s fair valuation determinations are subject to review, approval and ratification by the Board at its next regularly scheduled meeting covering the calendar quarter in which the fair valuation was determined.
The Valuation Committee utilizes various methods to measure the fair value of the Portfolio’s investments. U.S. generally accepted accounting principles (GAAP) establishes a disclosure hierarchy that categorizes the inputs to valuation techniques used to value assets and liabilities at measurement date. These inputs are summarized in the three broad levels listed below:
Level 1 - quoted prices in active markets for identical securities
Level 2 - other significant observable inputs (including quoted prices for similar securities, interest rates, prepayment speeds, credit risk, etc.)
Level 3 - significant unobservable inputs (including the Portfolio’s own assumptions in determining the fair value of investments)
The inputs or methodologies used for valuing securities are not necessarily an indication of the risk associated with investing in those securities.
Changes in valuation techniques may result in transfers in or out of an investment’s assigned level within the hierarchy during the year. Transfers in and/or out of levels are determined based on the fair value of such securities at the end of the year. Valuation techniques used to value the Portfolio’s investments by major category are as follows:
Common and preferred stock securities, including restricted securities, for which market quotations are readily available, are valued at the last reported sale price or official closing price as reported by an independent pricing service on the primary market or exchange on which they are traded and are categorized as Level 1 in the hierarchy. In the event there were no sales during the day or closing prices are not available, securities are valued at the last quoted bid price or the last available price and are categorized as Level 2 in the hierarchy. Foreign securities are valued based on quotations from the principal market in which such securities are normally traded. If events occur after the close of the principal market in which foreign securities are traded, and before the close of business of the Portfolio, that are expected to materially affect the value of those securities, then they are valued at their fair value taking these events into account and are categorized as Level 2 in the hierarchy.
14 www.calvert.com CALVERT VP SRI LARGE CAP VALUE PORTFOLIO ANNUAL REPORT
Debt securities are valued based on evaluated prices received from independent pricing services or from dealers who make markets in such securities and are generally categorized as Level 2 in the hierarchy. Short-term securities of sufficient credit quality with remaining maturities of sixty days or less for which quotations are not readily available are valued at amortized cost, which approximates fair value, and are categorized as Level 2 in the hierarchy. For restricted securities and private placements where observable inputs are limited, assumptions about market activity and risk are used and such securities are categorized as Level 3 in the hierarchy.
If a market value cannot be determined for a security using the methodologies described above, or if, in the good faith opinion of the Advisor, the market value does not constitute a readily available market quotation, or if a significant event has occurred that would materially affect the value of the security, the security will be fair valued as determined in good faith by the Valuation Committee.
The Valuation Committee considers a number of factors, including significant unobservable valuation inputs when arriving at fair value. It considers all significant facts that are reasonably available and relevant to the determination of fair value.
The Valuation Committee primarily employs a market-based approach which may use related or comparable assets or liabilities, recent transactions, market multiples, book values, and other relevant information for the investment to determine the fair value of the investment. When more appropriate, the Portfolio may employ an income-based or cost approach. An income-based valuation approach discounts anticipated future cash flows of the investment to calculate a present amount (discounted). The measurement is based on the value indicated by current market expectations about those future amounts. Discounts may also be applied due to the nature or duration of any restrictions on the disposition of the investments. A cost based approach is based on the amount that currently would be required to replace the service capacity of an asset (current replacement cost). From the seller’s perspective, the price that would be received for the asset is determined based on the cost to a buyer to acquire or construct a substitute asset of comparable utility, adjusted for obsolescence.
The values assigned to fair value investments are based on available information and do not necessarily represent amounts that might ultimately be realized. Further, due to the inherent uncertainty of valuations of such investments, the fair values may differ significantly from the values that would have been used had an active market existed, and the differences could be material. The Valuation Committee employs various methods for calibrating these valuation approaches including a regular review of key inputs and assumptions, transactional back-testing or disposition analysis and reviews of any related market activity.
At December 31, 2015, no securities were fair valued in good faith under the direction of the Board.
The following table summarizes the market value of the Portfolio's holdings as of December 31, 2015, based on the inputs used to value them:
|
| | | | | | | | | | | |
| | VALUATION INPUTS |
| INVESTMENTS IN SECURITIES* | LEVEL 1 | LEVEL 2 | LEVEL 3 | TOTAL |
| Common Stocks** |
| $73,426,507 |
|
| $4,063,460 |
| $— |
|
| $77,489,967 |
|
| Time Deposit | — |
| 1,447,544 |
| — |
| 1,447,544 |
|
| TOTAL |
| $73,426,507 |
|
| $5,511,004 |
| $— |
|
| $78,937,511 |
|
| |
| * For a complete listing of investments, please refer to the Schedule of Investments. |
| ** For further breakdown of equity securities by industry, please refer to the Schedule of Investments. |
There were no transfers between levels during the year.
Security Transactions and Investment Income: Security transactions are accounted for on trade date. Realized gains and losses are recorded on an identified cost basis and may include proceeds from litigation. Dividend income is recorded on the ex-dividend date or, in the case of dividends on certain foreign securities, as soon as the Portfolio is informed of the ex-dividend date. Withholding taxes on foreign dividends have been provided for in accordance with the Portfolio’s understanding of the applicable country’s tax rules and rates. Distributions received on securities that represent a return of capital are recorded as a reduction of cost of investments. Distributions received on securities that represent a capital gain
www.calvert.com CALVERT VP SRI LARGE CAP VALUE PORTFOLIO ANNUAL REPORT 15
are recorded as a realized gain. Interest income, which includes amortization of premium and accretion of discount on debt securities, is accrued as earned.
Foreign Currency Transactions: The Portfolio’s accounting records are maintained in U.S. dollars. For valuation of assets and liabilities on each date of net asset value determination, foreign denominations are converted into U.S. dollars using the current exchange rate. Security transactions, income, and expenses are translated at the prevailing rate of exchange on the date of the event. The effect of changes in foreign exchange rates on securities and foreign currencies is included in the net realized and unrealized gain or loss on investments and assets and liabilities denominated in foreign currencies.
Distributions to Shareholders: Distributions to shareholders are recorded by the Portfolio on ex-dividend date. Dividends from net investment income and distributions from net realized capital gains, if any, are paid at least annually. Distributions are determined in accordance with income tax regulations which may differ from U.S. generally accepted accounting principles; accordingly, periodic reclassifications are made within the Portfolio's capital accounts to reflect income and gains available for distribution under income tax regulations.
Estimates: The preparation of financial statements in conformity with U.S. generally accepted accounting principles requires management to make estimates and assumptions that affect the reported amounts of assets and liabilities and disclosure of contingent assets and liabilities at the date of the financial statements and the reported amounts of increases and decreases in net assets from operations during the reporting period. Actual results could differ from those estimates.
Federal Income Taxes: No provision for federal income or excise tax is required since the Portfolio intends to continue to qualify as a regulated investment company under the Internal Revenue Code and to distribute substantially all of its taxable earnings.
Management has analyzed the Portfolio's tax positions taken for all open federal income tax years and has concluded that no provision for federal income tax is required in the Portfolio's financial statements. A Portfolio's federal tax return is subject to examination by the Internal Revenue Service for a period of three years.
NOTE B — RELATED PARTY TRANSACTIONS
Calvert Investment Management, Inc. (the “Advisor”) is wholly-owned by Calvert Investments, Inc., which is indirectly wholly-owned by Ameritas Mutual Holding Company. The Advisor provides investment advisory services and pays the salaries and fees of officers and Directors of the Fund who are employees of the Advisor or its affiliates. For its services, the Advisor receives an annual fee, payable monthly, of 0.64%, of the Portfolio’s average daily net assets.
The Advisor has contractually agreed to limit net annual portfolio operating expenses through April 30, 2016. The contractual expense cap is 0.78%. For the purpose of this expense limit, operating expenses do not include interest expense, brokerage commissions, taxes, and extraordinary expenses. This expense limitation does not limit acquired fund fees and expenses, if any.
Calvert Investment Administrative Services, Inc. ("CIAS"), an affiliate of the Advisor, provides administrative services to the Portfolio for an annual fee, payable monthly, of 0.10% of the Portfolio’s average daily net assets.
On November 24, 2015, the Board of Directors approved the recommendation made by CIAS to standardize and rationalize the administrative fee paid by the Calvert Funds at 0.12% for all series and all share classes of the Calvert Funds. CIAS and the Fund have entered into an Amended and Restated Administrative Services Agreement that will establish a 0.12% administrative fee for all classes of the Fund commencing on May 1, 2016. CIAS has contractually agreed to waive 0.02% for Class I shares of the Fund (the difference between the current administrative fee and the new 0.12% fee) from May 1, 2016 through April 30, 2018.
Calvert Investment Services, Inc. (“CIS”), an affiliate of the Advisor, acts as shareholder servicing agent for the Portfolio. For its services, CIS received a fee of $8,499 for the year ended December 31, 2015. Boston Financial Data Services, Inc. is the transfer and dividend disbursing agent.
Each Director of the Fund who is not an employee of the Advisor or its affiliates receives a fee of $1,500 for each Board and Committee meeting attended plus an annual fee of $44,000. Committee chairs receive an additional $5,000 annual retainer. Eligible Directors may participate in a Deferred Compensation Plan (the “Plan”). Obligations of the Plan will be paid solely out of the Portfolio’s assets. Directors’ fees are allocated to each of the portfolios served.
16 www.calvert.com CALVERT VP SRI LARGE CAP VALUE PORTFOLIO ANNUAL REPORT
NOTE C — INVESTMENT ACTIVITY AND TAX INFORMATION
During the year, the cost of purchases and proceeds from sales of investments, other than short-term securities, were $36,758,971 and $98,879,652, respectively.
|
| |
| Capital Loss Carryforward | |
| EXPIRATION DATE | |
| 2017 | ($4,860,481) |
| 2018 | (3,201,024) |
Under the Regulated Investment Company Modernization Act of 2010, capital losses incurred in taxable years beginning after December 22, 2010 can be carried forward to offset future capital gains for an unlimited period. These losses are required to be utilized prior to the losses incurred in pre-enactment taxable years and will retain their character as either long-term or short-term. Losses incurred in pre-enactment taxable years can be utilized until expiration. The Portfolio's use of net capital losses acquired from reorganizations may be limited under certain tax provisions.
The tax character of dividends and distributions paid during the years ended December 31, 2015 and December 31, 2014 was as follows:
|
| | | | | | |
| DISTRIBUTIONS PAID FROM: | 2015 | 2014 |
| Ordinary income |
| $163,277 |
|
| $2,179,364 |
|
| Long-term capital gains | 3,701,551 |
| 14,806,187 |
|
| Total |
| $3,864,828 |
|
| $16,985,551 |
|
As of December 31, 2015, the tax basis components of distributable earnings/(accumulated losses) and the federal tax cost were as follows:
|
| | | |
| Unrealized appreciation |
| $4,384,522 |
|
| Unrealized (depreciation) | (8,902,555) |
|
| Net unrealized appreciation (depreciation) |
| ($4,518,033 | ) |
| Undistributed ordinary income |
| $2,067,749 |
|
| Undistributed long-term capital gain |
| $6,339,380 |
|
| Capital loss carryforward |
| ($8,061,505 | ) |
| Federal income tax cost of investments |
| $83,455,544 |
|
The differences between the components of distributable earnings on a tax basis and the amounts reflected in the Statement of Assets and Liabilities are primarily due to temporary book-tax differences that will reverse in a subsequent period. These differences are mainly due to wash sales and Internal Revenue Code Section 382 limitation.
Reclassifications, as shown in the table below, have been made to the Portfolio's components of net assets to reflect income and gains available for distribution (or available capital loss carryovers, as applicable) under income tax law and regulations. These reclassifications are due to permanent book-tax differences and have no impact on net assets. The primary permanent differences causing such reclassifications for the Portfolio are due to foreign currency transactions.
|
| | | |
| Undistributed net investment income |
| ($4,281 | ) |
| Accumulated net realized gain (loss) | 4,281 |
|
NOTE D — LINE OF CREDIT
A financing agreement is in place with the Calvert Funds and State Street Corporation (“SSC”). Under the agreement, SSC provides an unsecured line of credit facility, in the aggregate amount of $50 million ($25 million committed and $25 million uncommitted), accessible by the Calvert Funds for temporary or emergency purposes only. Borrowings bear interest at the higher of the London Interbank Offered Rate (LIBOR) or the overnight Federal Funds Rate plus 1.25% per annum. A commitment fee of 0.20% per annum is incurred on the unused portion of the committed facility. An
www.calvert.com CALVERT VP SRI LARGE CAP VALUE PORTFOLIO ANNUAL REPORT 17
administrative fee of $25,000 was paid in connection with the uncommitted facility. These fees are allocated to all participating funds. The Portfolio had no loans outstanding pursuant to this line of credit at December 31, 2015.
For the year ended December 31, 2015, borrowing information by the Portfolio under the agreement was as follows:
|
| | | |
| Average Daily Balance | Weighted Average Interest Rate | Maximum Amount Borrowed | Month of Maximum Amount Borrowed |
| $9,802 | 1.38% | $1,258,783 | July 2015 |
NOTE E — SUBSEQUENT EVENTS
In preparing the financial statements as of December 31, 2015, no subsequent events or transactions occurred that would have required recognition or disclosure in these financial statements.
NOTICE TO SHAREHOLDERS (UNAUDITED)
For the fiscal year ended December 31, 2015, the Portfolio considers 100.0% of the ordinary dividends paid during the year as qualified dividend income and as eligible for the corporate dividends received deduction in accordance with Section 854 of the Internal Revenue Code. The Portfolio also considers $3,701,551 of the long-term capital gain distributions paid during the year as capital gain dividends in accordance with Section 852(b)(3)(C) of the Internal Revenue Code.
18 www.calvert.com CALVERT VP SRI LARGE CAP VALUE PORTFOLIO ANNUAL REPORT
CALVERT VP SRI LARGE CAP VALUE PORTFOLIO
FINANCIAL HIGHLIGHTS
|
| | | | | | | | | | | | | | | | | | | | |
| | YEARS ENDED | |
| | December 31, 2015 (a) | | December 31, 2014 | | December 31, 2013 | | December 31, 2012 | | December 31, 2011 (a) | |
| Net asset value, beginning |
| $92.93 |
| |
| $96.19 |
| |
| $73.80 |
| |
| $64.22 |
| |
| $66.82 |
| |
| Income from investment operations: | | | | | | | | | | |
| Net investment income | 1.69 |
| | 1.44 |
| | 1.39 |
| | 1.36 |
| | 1.24 |
| |
| Net realized and unrealized gain (loss) | (7.74) |
| | 7.22 |
| | 22.48 |
| | 9.56 |
| | (2.36) |
| |
| Total from investment operations | (6.05) |
| | 8.66 |
| | 23.87 |
| | 10.92 |
| | (1.12) |
| |
| Distributions from: | | | | | | | | | | |
| Net investment income | (0.18) |
| | (1.53) |
| | (1.48) |
| | (1.34) |
| | (1.48) |
| |
| Net realized gain | (4.07) |
| | (10.39) |
| | — |
| | — |
| | — |
| |
| Total distributions | (4.25) |
| | (11.92) |
| | (1.48) |
| | (1.34) |
| | (1.48) |
| |
| Total increase (decrease) in net asset value | (10.30) |
| | (3.26) |
| | 22.39 |
| | 9.58 |
| | (2.60) |
| |
| Net asset value, ending |
| $82.63 |
| |
| $92.93 |
| |
| $96.19 |
| |
| $73.80 |
| |
| $64.22 |
| |
| Total return (b) | (6.59 | %) | | 8.88 | % | | 32.39 | % | | 17.03 | % | | (1.68 | %) | |
| Ratios to average net assets: (c) | | | | | | | | | | |
| Net investment income | 1.83 | % | | 1.34 | % | | 1.51 | % | | 1.87 | % | | 1.85 | % | |
| Total expenses | 0.86 | % | | 0.85 | % | | 0.84 | % | | 0.85 | % | | 0.85 | % | |
| Net expenses | 0.78 | % | | 0.78 | % | | 0.78 | % | | 0.77 | % | | 0.75 | % | |
| Portfolio turnover | 34 | % | | 72 | % | | 55 | % | | 51 | % | | 16 | % | |
| Net assets, ending (in thousands) |
| $78,966 |
| |
| $149,101 |
| |
| $156,038 |
| |
| $130,833 |
| |
| $117,125 |
| |
| | | | | | | | | | | |
| (a)Per share figures are calculated using the Average Shares Method. |
| (b)Total return is not annualized for periods of less than one year and does not reflect charges and expenses of the variable annuity or variable universal life contract. |
| (c)Total expenses do not reflect amounts reimbursed and/or waived by the Advisor and certain of its affiliates, if applicable. Net expenses are net of all reductions and represent the net expenses paid by the Portfolio. |
| See notes to financial statements. |
www.calvert.com CALVERT VP SRI LARGE CAP VALUE PORTFOLIO ANNUAL REPORT 19
PROXY VOTING
The Proxy Voting Guidelines that the Portfolio uses to determine how to vote proxies relating to portfolio securities is provided as an Appendix to the Fund’s Statement of Additional Information. The Statement of Additional Information can be obtained free of charge by calling the Fund at 1-800-368-2745, by visiting the Calvert website at www.calvert.com or by visiting the SEC’s website at www.sec.gov.
Information regarding how the Fund voted proxies relating to portfolio securities during the most recent 12-month period ended June 30 is available by calling the Fund, by visiting the Calvert website at www.calvert.com or visiting the SEC’s website at www.sec.gov.
AVAILABILITY OF QUARTERLY PORTFOLIO HOLDINGS
The Fund files its complete schedule of portfolio holdings with the SEC for the first and third quarters of each fiscal year on Form N-Q. The Fund’s Form N-Q is available on the SEC’s website at www.sec.gov. The Fund’s Form N-Q may be reviewed and copied at the SEC’s Public Reference Room in Washington, DC; information on the operation of the Public Reference Room may be obtained by calling 1-800-SEC-0330.
BASIS FOR BOARD'S APPROVAL OF INVESTMENT ADVISORY CONTRACT
At a meeting held on December 9, 2015, the Board of Directors, and by a separate vote, the disinterested Directors, approved the continuance of the Investment Advisory Agreement between the Fund and the Advisor with respect to the Portfolio.
In evaluating the Investment Advisory Agreement, the Board considered a variety of information relating to the Portfolio and the Advisor. The disinterested Directors reviewed a report prepared by the Advisor regarding various services provided to the Portfolio by the Advisor and its affiliates. Such report included, among other data, information regarding the Advisor’s personnel and the Advisor’s revenue and cost of providing services to the Portfolio, and a separate report prepared by an independent third party, which provided a statistical analysis comparing the Portfolio's investment performance, expenses, and fees to comparable mutual funds.
The disinterested Directors were separately represented by independent legal counsel with respect to their consideration of the reapproval of the Investment Advisory Agreement. Prior to voting, the disinterested Directors reviewed the proposed continuance of the Investment Advisory Agreement with management and also met in private sessions with their counsel at which no representatives of management were present.
In the course of its deliberations regarding the Investment Advisory Agreement, the Board considered the following factors, among others: the nature, extent and quality of the services provided by the Advisor, including the personnel providing such services; the Advisor's financial condition; the level and method of computing the Portfolio's advisory fee; comparative performance, fee and expense information for the Portfolio; the profitability of the Calvert Family of Funds to the Advisor and its affiliates; the allocation of the Portfolio’s brokerage, including the Advisor’s process for monitoring “best execution”; the direct and indirect benefits, if any, derived by the Advisor and its affiliates from their relationship with the Portfolio; the effect of the Portfolio's growth and size on the Portfolio's performance and expenses; the Advisor's compliance programs and policies; the Advisor's performance of substantially similar duties for other funds; and any possible conflicts of interest.
In considering the nature, extent and quality of the services provided by the Advisor under the Investment Advisory Agreement, the Board reviewed information provided by the Advisor relating to its operations and personnel, including, among other information, biographical information on the Advisor's investment, supervisory and professional staff and descriptions of its organizational and management structure. The Board also took into account similar information provided periodically throughout the previous year by the Advisor, as well as the Board’s familiarity with the Advisor’s management through Board of Directors’ meetings, discussions and other reports. The Board considered the Advisor’s management style and its performance in employing its investment strategies, as well as its current level of staffing and overall resources. The Board also noted that it reviewed on a quarterly basis information regarding the Advisor’s compliance with applicable policies and procedures, including those related to personal investing. The Advisor's administrative capabilities, including its ability to supervise the other service providers for the Portfolio, were also considered. The Board also took into account the environmental, social, sustainability and governance research and analysis provided by the Advisor to the Portfolio. The Board observed that the scope of services provided by the Advisor generally had expanded over time as a result of regulatory, market and other changes. The Board took into consideration,
20 www.calvert.com CALVERT VP SRI LARGE CAP VALUE PORTFOLIO ANNUAL REPORT (UNAUDITED)
among other factors, the effectiveness of the Portfolio’s and Advisor’s processes, policies and procedures and the Advisor’s personnel. The Board also took into account, among other items, periodic reports received from the Advisor over the past year concerning the Advisor’s ongoing review and enhancement of certain processes, policies and procedures of the Portfolio and the Advisor. The Board concluded that it was satisfied with the nature, extent and quality of services provided to the Portfolio by the Advisor under the Investment Advisory Agreement.
In considering the Portfolio’s performance, the Board noted that it reviewed on a quarterly basis detailed information about the Portfolio’s performance results, portfolio composition and investment strategies. In addition, the Board took into account overall financial market conditions. The Board also reviewed various comparative data provided to it in connection with its consideration of the renewal of the Investment Advisory Agreement, including, among other information, a comparison of the Portfolio’s total return with its Lipper index and with that of other mutual funds deemed to be in its peer group by an independent third party in its report. This comparison indicated that the Portfolio performed below the median of its peer group for the one-year period ended June 30, 2015, and above the median of its peer group for the three- and five-year periods ended June 30, 2015. The data also indicated that the Portfolio underperformed its Lipper index for the one-, three- and five-year periods ended June 30, 2015. The Board took into account management’s discussion of Portfolio performance and management’s continued close monitoring of the Portfolio’s performance. The Board also considered that a new portfolio manager was added to the current team in July 2014. Based upon its review, the Board concluded that appropriate action is being taken with respect to the Portfolio’s performance.
In considering the Portfolio’s fees and expenses, the Board compared the Portfolio’s fees and total expense ratio with various comparative data for the funds in its peer group. Among other findings, the data indicated that the Portfolio's advisory fee (after taking into account expense reimbursements) was below the median of its peer group and that total expenses (net of expense reimbursements) were below the median of its peer group. The Board noted that the allocation of advisory and administrative fees may vary among the Portfolio’s peer group. In addition, the Board took into account the fees the Advisor charged to its other clients and considered these fee comparisons in light of the differences in managing these other accounts. The Board noted that the Advisor is currently reimbursing a portion of the Portfolio’s expenses. The Board also took into account the Advisor’s current undertaking to maintain expense limitations for the Portfolio and management’s discussion of the Portfolio’s expenses and certain factors that affected the level of such expenses, including the current size of the Portfolio and the cost of providing the environmental, social, sustainability and governance research and analysis provided by the Advisor. Based upon its review, the Board determined that the advisory fee was reasonable in view of the quality of services received by the Portfolio from the Advisor and the other factors considered.
The Board reviewed the Advisor’s profitability on a portfolio-by-portfolio basis. In reviewing the overall profitability of the advisory fee to the Portfolio’s Advisor, the Board also considered the fact that affiliates of the Advisor provided shareholder servicing and administrative services to the Portfolio for which they received compensation. The information considered by the Board included Calvert’s operating profit margin information both before and after tax expenses with respect to the services that the Advisor and its affiliates provided to the Calvert Family of Funds complex. The Board reviewed the profitability of the Advisor’s relationship with the Portfolio in terms of the total amount of annual advisory fees it received with respect to the Portfolio and whether the Advisor had the financial wherewithal to continue to provide services to the Portfolio. The Board also considered that the Advisor derived benefits to its reputation and other indirect benefits from its relationship with the Portfolio. In addition, the Board took into account that affiliates of the Advisor may benefit from certain indirect tax benefits relating to dividend received deductions and foreign tax credits. The Board noted that the Advisor is currently reimbursing a portion of the expenses of the Portfolio. Based upon its review, the Board concluded that the Advisor’s and its affiliates’ level of profitability from their relationship with the Portfolio was reasonable.
The Board considered the effect of the Portfolio’s growth and size on its performance and fees. Although the Portfolio’s advisory fee did not contain breakpoints that would reduce the advisory fee rate on assets above specified asset levels, the Board noted that if the Portfolio’s assets increased over time, the Portfolio might realize other economies of scale if assets increased proportionally more than certain other expenses. The Board also noted that given the Portfolio’s current level of assets, the Portfolio would be unlikely to recognize economies of scale by implementing a breakpoint in the advisory fee at this time.
In reapproving the Investment Advisory Agreement, the Board, including the disinterested Directors, did not identify any single factor as controlling, and each Director may have attributed different weight to various factors.
www.calvert.com CALVERT VP SRI LARGE CAP VALUE PORTFOLIO ANNUAL REPORT (UNAUDITED) 21
Conclusions
The Board reached the following conclusions regarding the Investment Advisory Agreement, among others: (a) the Advisor has demonstrated that it possesses the capability and resources to perform the duties required of it under the Investment Advisory Agreement; (b) the Advisor maintains appropriate compliance programs; (c) appropriate action is being taken with respect to the Portfolio’s performance; (d) the Advisor is likely to execute its investment strategies consistently over time; and (e) the Portfolio's advisory fee is reasonable in view of the quality of services received by the Portfolio from the Advisor and the other factors considered. Based on its conclusions, the Board determined that reapproval of the Investment Advisory Agreement would be in the best interests of the Portfolio and its shareholders.
22 www.calvert.com CALVERT VP SRI LARGE CAP VALUE PORTFOLIO ANNUAL REPORT (UNAUDITED)
DIRECTOR AND OFFICER INFORMATION TABLE
|
| | | | | |
| Name & Age | Position with Fund | Position Start Date | Principal Occupation During Last 5 Years | # of Calvert Portfolios Overseen | Other Directorships |
| INDEPENDENT DIRECTORS |
FRANK H. BLATZ, JR., Esq. AGE: 80 | Director | 1982 CVS
2008 CVP | Of counsel to firm of Schiller & Pittenger, P.C. | 13 | None |
ALICE GRESHAM BULLOCK AGE: 65 | Director | 1999 CVS
2008 CVP | Professor at Howard University School of Law. She is former Dean of Howard University School of Law and Deputy Director of the Association of American Law Schools. | 15 | None |
M. CHARITO KRUVANT AGE: 70 | Director | 1999 CVS
2008 CVP | President and CEO of Creative Associates International, Inc., a firm that specializes in human resources development, information management, public affairs and private enterprise development. | 22 | • Acacia Federal Savings Bank (through 2013) • Summit Foundation • WETA Public Broadcasting |
CYNTHIA MILLIGAN AGE: 69
| Director | 1999 CVS
2008 CVP | Dean Emeritus, College of Business Administration, University of Nebraska, Lincoln. She is former President and Chief Executive Officer for CMA, a consulting firm for financial institutions. | 15 | • Wells Fargo Company (banking and financial services) - NYSE • Wells Fargo Bank N.A. (Since 2014) • Gallup, Inc. (management consulting) • W.K. Kellogg Foundation • Raven Industries (technology company) - NASDAQ • Colonial Williamsburg Foundation • Kellogg Company (food manufacturing) - NYSE |
ARTHUR J. PUGH AGE: 78 | Director | 1982 CVS
2008 CVP | Retired executive. | 13 | None |
| INTERESTED DIRECTORS |
WILLIAM LESTER* AGE: 58 | Director & Chair (CVS)
Director & Senior Vice President (CVP) | 2004 CVS
2008 CVP | Executive Vice President Finance/Investments and Corporate Treasurer of Ameritas Mutual Holding Company. Chair and former President (resigned 2012) of Ameritas Investment Partners, Inc. | 13 | • Acacia Federal Savings Bank (through 2013)• Ameritas Investment Partners, Inc. (financial services)• Ameritas Investment Corp. (financial services)• Universal and Inland Insurance Companies• Bryan/LGH Health Systems |
www.calvert.com CALVERT VP SRI LARGE CAP VALUE PORTFOLIO ANNUAL REPORT (UNAUDITED) 23
|
| | | | | |
| Name & Age | Position with Fund | Position Start Date | Principal Occupation During Last 5 Years | # of Calvert Portfolios Overseen | Other Directorships |
| INTERESTED DIRECTORS |
JOHN H. STREUR* AGE: 56
| President (CVS)
Director, Chair & President (CVP) | 2015 | President and Chief Executive Officer of Calvert Investments, Inc. (since January 2015) and Chief Compliance Officer for the Advisor and Calvert Investment Distributors, Inc. (since August 10, 2015); President and Director, Portfolio 21 Investments, Inc. (through October 2014); President, Chief Executive Officer and Director, Managers Investment Group LLC (through January 2012); President and Director, The Managers Funds and Managers AMG Funds (through January 2012). | 40 | • Portfolio 21 Investments, Inc. (asset management)(through October 2014) • Managers Investment Group LLC (asset management)(through January 2012) • The Managers Funds (asset management) (through January 2012) • Managers AMG Funds (asset management) (through January 2012) • Calvert Social Investment Foundation |
|
| | | |
| Name & Age | Position with Fund | Position Start Date | Principal Occupation During Last 5 Years |
| OFFICERS |
VICKI L. BENJAMIN AGE: 54 | Treasurer | 2015 | Executive Vice President, Chief Financial Officer and Chief Operating Officer of Calvert Investments, Inc. since October 2015; Senior Vice President and Chief Financial Officer of Calvert Investments, Inc. (March 2015 - September 2015). Prior to Calvert, Ms. Benjamin was a Senior Partner at KPMG. |
ROBERT D. BENSON, ESQ. AGE: 37 | Assistant Vice President & Assistant Secretary | 2014 | Assistant General Counsel (since 2014), Assistant Vice President & Assistant Secretary (since 2015) and Staff Attorney (prior to 2014), Calvert Investments, Inc. |
HOPE BROWN AGE: 42 | Chief Compliance Officer | 2014 | Chief Compliance Officer for the Calvert Funds (since 2014). Vice President and Chief Compliance Officer, Wilmington Funds (2012-2014). Vice President and Senior Compliance Officer, Wilmington Trust Investment Advisors, Inc. (2010-2012). |
STU DALHEIM AGE: 46 | Vice President | 2015 | Vice President - Shareholder Advocacy for the Advisor. |
MATTHEW DUCH Age: 40 | Vice President | 2011 | Vice President of the Advisor and portfolio manager for Calvert’s taxable fixed-income funds. |
ROBERT J. ENDERSON, CFA AGE: 57 | Assistant Treasurer | 2014 | Vice President, Corporate Finance, of Calvert Investments, Inc.; Acting Chief Financial Officer of Calvert Investments, Inc. (September 2014 - March 2015). |
PATRICK FAUL AGE: 51 | Vice President | 2010 | Vice President and Head of Credit Research for the Advisor. |
TRACI L. GOLDT AGE: 42 | Assistant Secretary | 2004 | SEC Filing and Administrative Operations Manager, Calvert Investments, Inc. |
JADE HUANG AGE: 41 | Vice President | 2015 | Equity Portfolio Manager since November 2015 and Senior Equity Analyst prior to November 2015, Advisor. |
EMILY KAISER AGE: 32 | Assistant Vice President | 2015 | Senior Sustainability Analyst since November 2015 and Sustainability Analyst (January 2014 - October 2015), Advisor. Prior to joining Calvert, Ms. Kaiser attended law school from 2010 to 2013 and also held legal and policy positions with the U.S. Agency for International Development (2013), the Solidarity Center, AFL-CIO (2013), the U.S. Department of Labor (2012), the office of the U.S. Trade Representative (2012) and the Public International Law and Policy Group (2011-2012). |
VISHAL KHANDUJA, CFA AGE: 37 | Vice President | 2014 | Head of Taxable Fixed Income (since 2015) and Vice President of the Advisor (since 2014); Portfolio Manager for Calvert’s taxable fixed-income funds since 2012. Previously worked at Columbia Management as Portfolio Manager - Global Rates and Currency Team (2009-2012). |
24 www.calvert.com CALVERT VP SRI LARGE CAP VALUE PORTFOLIO ANNUAL REPORT (UNAUDITED)
|
| | | |
| Name & Age | Position with Fund | Position Start Date | Principal Occupation During Last 5 Years |
| OFFICERS |
LANCELOT A. KING, ESQ. AGE: 45 | Assistant Vice President & Secretary | 2002 | Assistant Vice President, Assistant Secretary and Associate General Counsel of Calvert Investments, Inc. |
ERICA LASDON AGE: 44 | Assistant Vice President | 2015 | Director of Sustainability Research since August 2015 and Senior Sustainability Analyst and Manager prior to August 2015, Advisor. |
JOSHUA LINDER AGE: 30 | Vice President | 2015 | Equity Portfolio Manager since November 2015, Assistant Portfolio Manager (January 2014 - October 2015) and Equity Analyst (2011 - 2013), Advisor. |
CHRISTOPHER MADDEN AGE: 40 | Vice President | 2015 | Equity Portfolio Manager since November 2015 and Senior Equity Analyst prior to November 2015, Advisor. |
ANDREW K. NIEBLER, ESQ. AGE: 48 | Assistant Vice President & Assistant Secretary | 2006 | Assistant Vice President, Assistant Secretary and Associate General Counsel of Calvert Investments, Inc. |
MARYBETH PILAT, CPA AGE: 47 | Fund Controller and Assistant Treasurer | 2015 | Director of Fund Administration, Calvert Investment Administrative Services, Inc. since August 2015. VP Expense & Budgeting, Global Fiduciary Platform, Legg Mason (May 2015 - July 2015). Vice President and Assistant Treasurer, Columbia Funds, Ameriprise, Columbia Management (2010 - April 2015). |
| |
| * | The address of Directors and Officers is 4550 Montgomery Avenue, Suite 1000N, Bethesda, Maryland 20814. Mr. Streur is an interested person of the Fund since he is an officer and director of the Fund’s Advisor and its affiliates. Mr. Lester is an interested person of the Fund since he is an officer and director of the parent company of the Fund’s Advisor. |
Additional information about the Fund’s Directors can be found in the Statement of Additional Information (SAI). You can get a free copy of the SAI by contacting your broker, or the Fund at 1-800-368-2745.
www.calvert.com CALVERT VP SRI LARGE CAP VALUE PORTFOLIO ANNUAL REPORT (UNAUDITED) 25
|
| |
| | |
This report is intended to provide fund information to shareholders. It is not authorized for distribution to prospective investors unless preceded or accompanied by a prospectus. Note: The information on our website is not incorporated by reference into this report; our website address is included as an inactive textual reference only. Investors should carefully consider the investment objectives, risks, charges and expenses of the Calvert Funds. This and other important information is contained in the fund’s summary prospectus and prospectus, which can be obtained from your financial professional and should be read carefully before investing. You may also call Calvert at 800/368-2745. |
| Printed on recycled paper using soy inks. | |
|
| |
|
Calvert VP S&P 500 Index Portfolio |
Annual Report December 31, 2015 | |
|
| | | | |
| | TABLE OF CONTENTS |
| | | | | |
| | | | | Portfolio Management Discussion |
| | | | | Understanding Your Fund's Expenses |
| | | | | Report of Independent Registered Public Accounting Firm |
| | | | | Schedule of Investments |
| | | | | Statement of Assets and Liabilities |
| | | | | Statement of Operations |
| | | | | Statements of Changes in Net Assets |
| | | | | Notes to Financial Statements |
| | | | | Financial Highlights |
| | | | | Proxy Voting |
| | | | | Availability of Quarterly Portfolio Holdings |
| | | | | Basis for Board’s Approval of Investment Advisory Contracts |
| | | | | Director and Officer Information Table |
|
| |
| PORTFOLIO MANAGEMENT DISCUSSION |
|
| |
| Kevin Keene Ameritas Investment Partners, Inc. |
Market Review
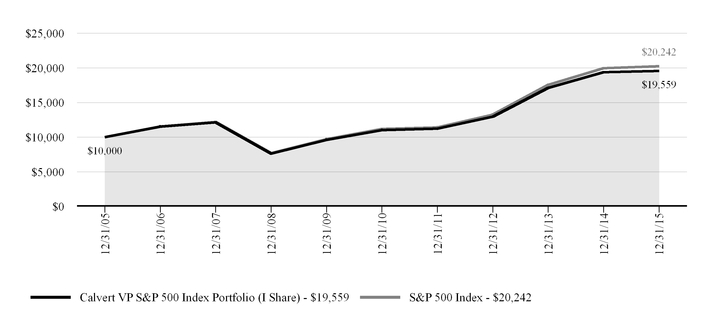
The broad domestic equity market was largely unchanged for 2015 as the market grappled with competing economic forces. The first six months of the year were marked by generally calm equity markets and the last six months saw a significant increase in volatility. After much speculation and anticipation, the Federal Reserve increased short-term interest rates in December for the first time in nearly 10 years. Turmoil in Chinese markets finally spread across the globe as the Standard & Poor's (S&P) 500 Index lost 12% over a six week period. Domestic economic data has been generally positive, if not robust. Unemployment stands at nearly 5% at year-end; however gross domestic product (GDP) growth has been weak by historical recovery standards.
Investment Strategy and Technique
As an index fund, the Calvert VP S&P 500 Index Portfolio (the Portfolio) seeks as closely as possible to replicate the holdings and match the performance of the S&P 500 Index. In pursuit of this objective, the Portfolio employs a passive management approach and holds each member of the index. Cash holdings gain exposure to the index via futures contracts so that 100% of the Portfolio’s assets are fully invested.
Fund Performance Relative to the Benchmark
For the year ended December 31, 2015, the Portfolio returned 0.98% compared with 1.38% for the S&P 500 Index. The underperformance relative to the Index was largely attributable to fees and operating expenses, which the Index does not incur. The Portfolio continued to meet its objective by closely tracking the Index.
Positioning and Market Outlook
Entering 2016, the outlook for equities is mixed. The economy continues to expand modestly and headline employment is nearing peak levels. With the Federal Reserve increasing interest rates for the first time in almost a decade, it is giving the economy a vote of confidence.
However, there is no shortage of risk as we enter the new year. The bull market that began in 2009 is starting to
|
| | | |
| ECONOMIC SECTORS | % OF TOTAL INVESTMENTS | |
| Information Technology | 19.9 | % | |
| Financials | 15.9 | % | |
| Health Care | 14.6 | % | |
| Consumer Discretionary | 12.4 | % | |
| Consumer Staples | 9.7 | % | |
| Industrials | 9.7 | % | |
| Energy | 6.2 | % | |
| Utilities | 2.9 | % | |
| Materials | 2.7 | % | |
| Telecommunication Services | 2.4 | % | |
| Exchange-Traded Products | 1.7 | % | |
| Short-Term Investments | 1.5 | % | |
| Government | 0.4 | % | |
| Total | 100.0 | % | |
| | | |
| TEN LARGEST STOCK HOLDINGS | % OF NET ASSETS | |
| Apple, Inc. | 3.2 | % | |
| Microsoft Corp. | 2.4 | % | |
| Exxon Mobil Corp. | 1.7 | % | |
| General Electric Co. | 1.6 | % | |
| Johnson & Johnson | 1.5 | % | |
| Amazon.com, Inc. | 1.4 | % | |
| Wells Fargo & Co. | 1.4 | % | |
| Berkshire Hathaway, Inc., Class B | 1.3 | % | |
| JPMorgan Chase & Co. | 1.3 | % | |
| Facebook, Inc., Class A | 1.3 | % | |
| Total | 17.1 | % | |
| | | |
show its age as questions arise over its ability to continue now that the Federal Reserve has essentially taken its foot off the gas. Commodity price declines continue to point to weak global growth, which will be a headwind to new highs in the stock market.
Ameritas Investment Partners, Inc.
December 2015
www.calvert.com CALVERT VP S&P 500 INDEX PORTFOLIO ANNUAL REPORT (UNAUDITED) 1
Growth of $10,000
The graph below shows the value of a hypothetical $10,000 investment in the Portfolio over the past 10 fiscal year periods. The results shown are for Class I shares, and assume the reinvestment of dividends. The result is compared with a broad based market index. Market indexes are unmanaged and their results do not reflect the effect of expenses or sales charges.
|
| | | | | | |
| CALVERT VP S&P 500 INDEX PORTFOLIO |
| DECEMBER 31, 2015 |
| AVERAGE ANNUAL TOTAL RETURNS | 1 Year | 5 Year | 10 Year |
| Class I | 0.98 | % | 12.12 | % | 6.94 | % |
| S&P 500 Index | 1.38 | % | 12.57 | % | 7.31 | % |
| | | | |
The performance data shown represents past performance, does not guarantee future results and assumes reinvestment of all dividends and distributions. All performance data reflects fee waivers and/or expense limitations, if any are in effect; in their absence performance would be lower. See Note B in Notes to Financial Statements. The investment return and principal value of an investment will fluctuate so that an investor’s shares, when redeemed, may be worth more or less than their original cost. Current performance may be lower or higher than the performance data quoted.
Visit calvert.com/institutional-VP-performance.html for current performance data. The gross expense ratio from the current prospectus for the Portfolio is 0.46%. This number may vary from the expense ratio shown elsewhere in this report because it is based on a different time period and, if applicable, does not include fee or expense waivers. The performance data and expense ratio reflect deduction of Portfolio operating expenses, but do not reflect charges and expenses imposed under the variable annuity or life insurance contract.
2 www.calvert.com CALVERT VP S&P 500 INDEX PORTFOLIO ANNUAL REPORT (UNAUDITED)
UNDERSTANDING YOUR FUND'S EXPENSES
As an investor, you incur two types of costs. There are transaction costs. There are also ongoing costs, which generally include management fees and other fund expenses. The following information is intended to help you understand your ongoing costs (in dollars) of investing in this mutual fund and to help you compare these costs with the ongoing costs of investing in other mutual funds.
To illustrate these ongoing costs, we have provided examples and calculated the expenses paid by the fund's investors during the period. The actual and hypothetical information presented in the examples is based on an investment of $1,000 invested at the beginning of the period and held for the entire period (July 1, 2015 to December 31, 2015).
Note: Expenses do not reflect charges and expenses of the variable annuity or variable universal life contract.
Actual Expenses
The first line of the table below provides information about actual account values and actual expenses. You may use the information in this line, together with the amount you invested, to estimate the expenses that you paid over the period. Simply divide your account value by $1,000 (for example, an $8,600 account value divided by $1,000 = 8.6), then multiply the result by the number in the first line under the heading entitled “Expenses Paid During Period” to estimate the expenses you paid on your account during this period.
Hypothetical Example for Comparison Purposes
The second line of the table below provides information about hypothetical account values and hypothetical expenses based on the Fund’s actual expense ratio and an assumed rate of return of 5% per year before expenses, which is not the Fund’s actual return. The hypothetical account values and expenses may not be used to estimate the actual ending account balance or expenses you paid for the period. You may use this information to compare the ongoing costs of investing in the Fund and other funds. To do so, compare the 5% hypothetical example with the 5% hypothetical examples that appear in the shareholder reports of the other funds.
Please note that the expenses shown in the table are meant to highlight your ongoing costs only and do not reflect any transactional costs. Therefore, the second line of the table is useful in comparing ongoing costs only, and will not help you determine the relative total costs of owning different funds. In addition, if these transactional costs were included, your costs would have been higher.
|
| | | | |
| | ANNUALIZED
EXPENSE RATIO | BEGINNING
ACCOUNT VALUE
7/1/15 | ENDING
ACCOUNT VALUE
12/31/15 | EXPENSES PAID
DURING PERIOD*
7/1/15 - 12/31/15 |
| | | | | |
| Actual | 0.42% | $1,000.00 | $999.60 | $2.12 |
| Hypothetical (5% return per year before expenses) | 0.42% | $1,000.00 | $1,023.09 | $2.14 |
| |
| * Expenses paid during the period are equal to the annualized expense ratio as indicated above, multiplied by the average account value over the period, multiplied by 184/365 (to reflect the one-half year period). Expense ratios shown in the Financial Highlights represent the actual expenses incurred for the fiscal year. |
www.calvert.com CALVERT VP S&P 500 INDEX PORTFOLIO ANNUAL REPORT (UNAUDITED) 3
REPORT OF INDEPENDENT REGISTERED PUBLIC ACCOUNTING FIRM
The Board of Directors of Calvert Variable Products, Inc. and Shareholders of Calvert VP S&P 500 Index Portfolio:
We have audited the accompanying statement of assets and liabilities, including the schedule of investments, of the Calvert VP S&P 500 Index Portfolio (the “Portfolio”), a series of Calvert Variable Products, Inc., as of December 31, 2015, and the related statement of operations for the year then ended, the statements of changes in net assets for each of the years in the two-year period then ended, and the financial highlights for each of the years in the five-year period then ended. These financial statements and financial highlights are the responsibility of the Portfolio’s management. Our responsibility is to express an opinion on these financial statements and financial highlights based on our audits.
We conducted our audits in accordance with the standards of the Public Company Accounting Oversight Board (United States). Those standards require that we plan and perform the audit to obtain reasonable assurance about whether the financial statements and financial highlights are free of material misstatement. An audit includes examining, on a test basis, evidence supporting the amounts and disclosures in the financial statements. Our procedures included confirmation of securities owned as of December 31, 2015, by correspondence with the custodian and brokers or by performing other appropriate auditing procedures. An audit also includes assessing the accounting principles used and significant estimates made by management, as well as evaluating the overall financial statement presentation. We believe that our audits provide a reasonable basis for our opinion.
In our opinion, the financial statements and financial highlights referred to above present fairly, in all material respects, the financial position of the Portfolio as of December 31, 2015, the results of its operations for the year then ended, the changes in its net assets for each of the years in the two-year period then ended, and the financial highlights for each of the years in the five-year period then ended, in conformity with U.S. generally accepted accounting principles.
Philadelphia, Pennsylvania
February 24, 2016
4 www.calvert.com CALVERT VP S&P 500 INDEX PORTFOLIO ANNUAL REPORT
CALVERT VP S&P 500 INDEX PORTFOLIO
SCHEDULE OF INVESTMENTS
DECEMBER 31, 2015
|
| | |
| | SHARES | VALUE ($) |
| COMMON STOCKS - 96.5% | | |
| Aerospace & Defense - 2.6% | | |
| Boeing Co. (The) | 11,795 | 1,705,439 |
| General Dynamics Corp. | 5,566 | 764,546 |
| Honeywell International, Inc. | 14,434 | 1,494,929 |
| L-3 Communications Holdings, Inc. | 1,468 | 175,441 |
| Lockheed Martin Corp. | 4,950 | 1,074,892 |
| Northrop Grumman Corp. | 3,416 | 644,975 |
| Precision Castparts Corp. | 2,588 | 600,442 |
| Raytheon Co. | 5,639 | 702,225 |
| Rockwell Collins, Inc. | 2,500 | 230,750 |
| Textron, Inc. | 5,149 | 216,309 |
| United Technologies Corp. | 15,500 | 1,489,085 |
| | | 9,099,033 |
| | | |
| Air Freight & Logistics - 0.7% | | |
| C.H. Robinson Worldwide, Inc. | 2,738 | 169,811 |
| Expeditors International of Washington, Inc. | 3,600 | 162,360 |
| FedEx Corp. | 4,918 | 732,733 |
| United Parcel Service, Inc., Class B | 13,105 | 1,261,094 |
| | | 2,325,998 |
| | | |
| Airlines - 0.6% | | |
| American Airlines Group, Inc. | 11,825 | 500,789 |
| Delta Air Lines, Inc. | 14,924 | 756,497 |
| Southwest Airlines Co. | 12,181 | 524,514 |
| United Continental Holdings, Inc. * | 7,150 | 409,695 |
| | | 2,191,495 |
| | | |
| Auto Components - 0.4% | | |
| BorgWarner, Inc. | 4,218 | 182,344 |
| Delphi Automotive plc | 5,246 | 449,740 |
| Goodyear Tire & Rubber Co. (The) | 5,121 | 167,303 |
| Johnson Controls, Inc. | 12,252 | 483,831 |
| | | 1,283,218 |
| | | |
| Automobiles - 0.6% | | |
| Ford Motor Co. | 73,120 | 1,030,261 |
| General Motors Co. | 26,523 | 902,047 |
| Harley-Davidson, Inc. | 3,598 | 163,313 |
| | | 2,095,621 |
| | | |
| Banks - 5.8% | | |
| Bank of America Corp. | 195,017 | 3,282,136 |
| BB&T Corp. | 14,435 | 545,787 |
| Citigroup, Inc. | 55,794 | 2,887,340 |
| Comerica, Inc. | 3,350 | 140,131 |
| Fifth Third Bancorp | 15,164 | 304,796 |
www.calvert.com CALVERT VP S&P 500 INDEX PORTFOLIO ANNUAL REPORT 5
|
| | |
| | SHARES | VALUE ($) |
| COMMON STOCKS - Cont'd | | |
| Huntington Bancshares, Inc. | 15,271 | 168,897 |
| JPMorgan Chase & Co. | 68,944 | 4,552,372 |
| KeyCorp | 16,295 | 214,931 |
| M&T Bank Corp. | 2,990 | 362,328 |
| People's United Financial, Inc. | 6,131 | 99,016 |
| PNC Financial Services Group, Inc. (The) | 9,511 | 906,493 |
| Regions Financial Corp. | 25,440 | 244,224 |
| SunTrust Banks, Inc. | 9,545 | 408,908 |
| US Bancorp | 30,795 | 1,314,023 |
| Wells Fargo & Co. | 87,055 | 4,732,310 |
| Zions Bancorporation | 3,653 | 99,727 |
| | | 20,263,419 |
| | | |
| Beverages - 2.2% | | |
| Brown-Forman Corp., Class B | 1,991 | 197,666 |
| Coca-Cola Co. (The) | 73,528 | 3,158,763 |
| Coca-Cola Enterprises, Inc. | 3,954 | 194,695 |
| Constellation Brands, Inc., Class A | 3,227 | 459,654 |
| Dr Pepper Snapple Group, Inc. | 3,623 | 337,664 |
| Molson Coors Brewing Co., Class B | 2,931 | 275,279 |
| Monster Beverage Corp. * | 2,853 | 424,983 |
| PepsiCo, Inc. | 27,286 | 2,726,417 |
| | | 7,775,121 |
| | | |
| Biotechnology - 3.6% | | |
| AbbVie, Inc. | 30,617 | 1,813,751 |
| Alexion Pharmaceuticals, Inc. * | 4,192 | 799,624 |
| Amgen, Inc. | 14,188 | 2,303,138 |
| Baxalta, Inc. | 10,190 | 397,716 |
| Biogen, Inc. * | 4,184 | 1,281,768 |
| Celgene Corp. * | 14,715 | 1,762,269 |
| Gilead Sciences, Inc. | 26,992 | 2,731,321 |
| Regeneron Pharmaceuticals, Inc. * | 1,451 | 787,704 |
| Vertex Pharmaceuticals, Inc. * | 4,564 | 574,288 |
| | | 12,451,579 |
| | | |
| Building Products - 0.1% | | |
| Allegion plc | 1,909 | 125,841 |
| Masco Corp. | 6,602 | 186,837 |
| | | 312,678 |
| | | |
| Capital Markets - 2.0% | | |
| Affiliated Managers Group, Inc. * | 1,020 | 162,955 |
| Ameriprise Financial, Inc. | 3,261 | 347,036 |
| Bank of New York Mellon Corp. (The) | 20,470 | 843,773 |
| BlackRock, Inc. | 2,376 | 809,075 |
| Charles Schwab Corp. (The) | 22,464 | 739,740 |
| E*Trade Financial Corp. * | 5,387 | 159,671 |
| Franklin Resources, Inc. | 7,097 | 261,312 |
| Goldman Sachs Group, Inc. (The) | 7,429 | 1,338,929 |
| Invesco Ltd. | 7,982 | 267,237 |
| Legg Mason, Inc. | 1,897 | 74,419 |
6 www.calvert.com CALVERT VP S&P 500 INDEX PORTFOLIO ANNUAL REPORT
|
| | |
| | SHARES | VALUE ($) |
| COMMON STOCKS - Cont'd | | |
| Morgan Stanley | 28,286 | 899,778 |
| Northern Trust Corp. | 4,101 | 295,641 |
| State Street Corp. | 7,557 | 501,483 |
| T. Rowe Price Group, Inc. | 4,703 | 336,217 |
| | | 7,037,266 |
| | | |
| Chemicals - 2.0% | | |
| Air Products & Chemicals, Inc. | 3,619 | 470,868 |
| Airgas, Inc. | 1,215 | 168,059 |
| CF Industries Holdings, Inc. | 4,470 | 182,421 |
| Dow Chemical Co. (The) | 21,061 | 1,084,220 |
| E. I. du Pont de Nemours & Co. | 16,414 | 1,093,172 |
| Eastman Chemical Co. | 2,772 | 187,138 |
| Ecolab, Inc. | 4,984 | 570,070 |
| FMC Corp. | 2,457 | 96,142 |
| International Flavors & Fragrances, Inc. | 1,500 | 179,460 |
| LyondellBasell Industries NV, Class A | 6,734 | 585,185 |
| Monsanto Co. | 8,253 | 813,085 |
| Mosaic Co. (The) | 6,326 | 174,534 |
| PPG Industries, Inc. | 5,102 | 504,180 |
| Praxair, Inc. | 5,404 | 553,370 |
| Sherwin-Williams Co. (The) | 1,483 | 384,987 |
| | | 7,046,891 |
| | | |
| Commercial Services & Supplies - 0.4% | | |
| ADT Corp. (The) | 3,214 | 105,998 |
| Cintas Corp. | 1,638 | 149,140 |
| Pitney Bowes, Inc. | 3,738 | 77,190 |
| Republic Services, Inc. | 4,670 | 205,433 |
| Stericycle, Inc. * | 1,592 | 191,995 |
| Tyco International plc | 7,767 | 247,690 |
| Waste Management, Inc. | 7,777 | 415,058 |
| | | 1,392,504 |
| | | |
| Communications Equipment - 1.4% | | |
| Cisco Systems, Inc. | 95,378 | 2,589,989 |
| F5 Networks, Inc. * | 1,373 | 133,126 |
| Harris Corp. | 2,301 | 199,957 |
| Juniper Networks, Inc. | 6,739 | 185,996 |
| Motorola Solutions, Inc. | 2,977 | 203,776 |
| QUALCOMM, Inc. | 28,152 | 1,407,178 |
| | | 4,720,022 |
| | | |
| Construction & Engineering - 0.1% | | |
| Fluor Corp. | 2,756 | 130,138 |
| Jacobs Engineering Group, Inc. * | 2,351 | 98,624 |
| Quanta Services, Inc. * | 3,066 | 62,087 |
| | | 290,849 |
www.calvert.com CALVERT VP S&P 500 INDEX PORTFOLIO ANNUAL REPORT 7
|
| | |
| | SHARES | VALUE ($) |
| COMMON STOCKS - Cont'd | | |
| Construction Materials - 0.1% | | |
| Martin Marietta Materials, Inc. | 1,257 | 171,681 |
| Vulcan Materials Co. | 2,413 | 229,163 |
| | | 400,844 |
| | | |
| Consumer Finance - 0.8% | | |
| American Express Co. | 15,669 | 1,089,779 |
| Capital One Financial Corp. | 9,965 | 719,274 |
| Discover Financial Services | 8,006 | 429,282 |
| Navient Corp. | 7,283 | 83,390 |
| Synchrony Financial * | 15,600 | 474,396 |
| | | 2,796,121 |
| | | |
| Containers & Packaging - 0.3% | | |
| Avery Dennison Corp. | 1,736 | 108,778 |
| Ball Corp. | 2,565 | 186,552 |
| International Paper Co. | 7,991 | 301,261 |
| Owens-Illinois, Inc. * | 3,045 | 53,044 |
| Sealed Air Corp. | 3,698 | 164,931 |
| WestRock Co. | 4,859 | 221,667 |
| | | 1,036,233 |
| | | |
| Distributors - 0.1% | | |
| Genuine Parts Co. | 2,834 | 243,412 |
| | | |
| | | |
| Diversified Consumer Services - 0.0% | | |
| H&R Block, Inc. | 4,309 | 143,533 |
| | | |
| | | |
| Diversified Financial Services - 2.0% | | |
| Berkshire Hathaway, Inc., Class B * | 35,151 | 4,641,338 |
| CME Group, Inc. | 6,337 | 574,132 |
| Intercontinental Exchange, Inc. | 2,223 | 569,666 |
| Leucadia National Corp. | 5,904 | 102,671 |
| McGraw Hill Financial, Inc. | 5,124 | 505,124 |
| Moody's Corp. | 3,317 | 332,828 |
| Nasdaq, Inc. | 2,189 | 127,334 |
| | | 6,853,093 |
| | | |
| Diversified Telecommunication Services - 2.3% | | |
| AT&T, Inc. | 115,412 | 3,971,327 |
| CenturyLink, Inc. | 10,566 | 265,841 |
| Frontier Communications Corp. | 21,490 | 100,358 |
| Level 3 Communications, Inc. * | 5,508 | 299,415 |
| Verizon Communications, Inc. | 76,360 | 3,529,359 |
| | | 8,166,300 |
| | | |
| Electric Utilities - 1.7% | | |
| American Electric Power Co., Inc. | 9,173 | 534,511 |
| Duke Energy Corp. | 12,947 | 924,286 |
| Edison International | 6,010 | 355,852 |
8 www.calvert.com CALVERT VP S&P 500 INDEX PORTFOLIO ANNUAL REPORT
|
| | |
| | SHARES | VALUE ($) |
| COMMON STOCKS - Cont'd | | |
| Entergy Corp. | 3,309 | 226,203 |
| Eversource Energy | 5,829 | 297,687 |
| Exelon Corp. | 17,185 | 477,227 |
| FirstEnergy Corp. | 7,746 | 245,781 |
| NextEra Energy, Inc. | 8,636 | 897,194 |
| Pepco Holdings, Inc. | 4,631 | 120,452 |
| Pinnacle West Capital Corp. | 2,178 | 140,437 |
| PPL Corp. | 12,582 | 429,424 |
| Southern Co. (The) | 17,005 | 795,664 |
| Xcel Energy, Inc. | 9,260 | 332,527 |
| | | 5,777,245 |
| | | |
| Electrical Equipment - 0.4% | | |
| AMETEK, Inc. | 4,525 | 242,494 |
| Eaton Corp. plc | 8,794 | 457,640 |
| Emerson Electric Co. | 12,259 | 586,348 |
| Rockwell Automation, Inc. | 2,554 | 262,066 |
| | | 1,548,548 |
| | | |
| Electronic Equipment & Instruments - 0.4% | | |
| Amphenol Corp., Class A | 5,798 | 302,829 |
| Corning, Inc. | 22,156 | 405,012 |
| FLIR Systems, Inc. | 2,784 | 78,147 |
| TE Connectivity Ltd. | 7,235 | 467,453 |
| | | 1,253,441 |
| | | |
| Energy Equipment & Services - 1.0% | | |
| Baker Hughes, Inc. | 8,043 | 371,185 |
| Cameron International Corp. * | 3,584 | 226,509 |
| Diamond Offshore Drilling, Inc. | 1,478 | 31,186 |
| Ensco plc, Class A | 4,311 | 66,346 |
| FMC Technologies, Inc. * | 4,339 | 125,875 |
| Halliburton Co. | 15,859 | 539,840 |
| Helmerich & Payne, Inc. | 1,995 | 106,832 |
| National Oilwell Varco, Inc. | 7,237 | 242,367 |
| Schlumberger Ltd. | 23,619 | 1,647,425 |
| Transocean Ltd. | 6,277 | 77,709 |
| | | 3,435,274 |
| | | |
| Food & Staples Retailing - 2.3% | | |
| Costco Wholesale Corp. | 8,228 | 1,328,822 |
| CVS Health Corp. | 20,739 | 2,027,652 |
| Kroger Co. (The) | 18,356 | 767,832 |
| Safeway Casa Ley CVR *(a) | 4,297 | 473 |
| Safeway PDC LLC CVR *(a) | 4,297 | 301 |
| Sysco Corp. | 9,863 | 404,383 |
| Wal-Mart Stores, Inc. | 29,458 | 1,805,775 |
| Walgreens Boots Alliance, Inc. | 16,337 | 1,391,177 |
| Whole Foods Market, Inc. | 6,392 | 214,132 |
| | | 7,940,547 |
www.calvert.com CALVERT VP S&P 500 INDEX PORTFOLIO ANNUAL REPORT 9
|
| | |
| | SHARES | VALUE ($) |
| COMMON STOCKS - Cont'd | | |
| Food Products - 1.6% | | |
| Archer-Daniels-Midland Co. | 11,176 | 409,936 |
| Campbell Soup Co. | 3,301 | 173,467 |
| ConAgra Foods, Inc. | 7,995 | 337,069 |
| General Mills, Inc. | 11,160 | 643,486 |
| Hershey Co. (The) | 2,753 | 245,760 |
| Hormel Foods Corp. | 2,506 | 198,174 |
| J. M. Smucker Co. (The) | 2,241 | 276,405 |
| Kellogg Co. | 4,703 | 339,886 |
| Keurig Green Mountain, Inc. | 2,162 | 194,537 |
| Kraft Heinz Co. (The) | 11,089 | 806,836 |
| McCormick & Co., Inc. | 2,176 | 186,178 |
| Mead Johnson Nutrition Co. | 3,728 | 294,326 |
| Mondelez International, Inc., Class A | 29,764 | 1,334,618 |
| Tyson Foods, Inc., Class A | 5,711 | 304,568 |
| | | 5,745,246 |
| | | |
| Gas Utilities - 0.0% | | |
| AGL Resources, Inc. | 2,200 | 140,382 |
| | | |
| | | |
| Health Care Equipment & Supplies - 2.1% | | |
| Abbott Laboratories | 27,873 | 1,251,776 |
| Baxter International, Inc. | 10,190 | 388,749 |
| Becton Dickinson and Co. | 3,920 | 604,033 |
| Boston Scientific Corp. * | 25,101 | 462,863 |
| C.R. Bard, Inc. | 1,407 | 266,542 |
| DENTSPLY International, Inc. | 2,627 | 159,853 |
| Edwards Lifesciences Corp. * | 4,028 | 318,131 |
| Intuitive Surgical, Inc. * | 690 | 376,850 |
| Medtronic plc | 26,336 | 2,025,765 |
| St. Jude Medical, Inc. | 5,243 | 323,860 |
| Stryker Corp. | 5,935 | 551,599 |
| Varian Medical Systems, Inc. * | 1,865 | 150,692 |
| Zimmer Holdings, Inc. | 3,190 | 327,262 |
| | | 7,207,975 |
| | | |
| Health Care Providers & Services - 2.7% | | |
| Aetna, Inc. | 6,593 | 712,835 |
| AmerisourceBergen Corp. | 3,659 | 379,475 |
| Anthem, Inc. | 4,953 | 690,646 |
| Cardinal Health, Inc. | 6,142 | 548,296 |
| Cigna Corp. | 4,821 | 705,457 |
| DaVita HealthCare Partners, Inc. * | 3,122 | 217,635 |
| Express Scripts Holding Co. * | 12,654 | 1,106,086 |
| HCA Holdings, Inc. * | 5,999 | 405,712 |
| Henry Schein, Inc. * | 1,587 | 251,048 |
| Humana, Inc. | 2,804 | 500,542 |
| Laboratory Corporation of America Holdings * | 1,856 | 229,476 |
| McKesson Corp. | 4,325 | 853,020 |
| Patterson Co.'s, Inc. | 1,604 | 72,517 |
| Quest Diagnostics, Inc. | 2,665 | 189,588 |
10 www.calvert.com CALVERT VP S&P 500 INDEX PORTFOLIO ANNUAL REPORT
|
| | |
| | SHARES | VALUE ($) |
| COMMON STOCKS - Cont'd | | |
| Tenet Healthcare Corp. * | 1,917 | 58,085 |
| UnitedHealth Group, Inc. | 17,892 | 2,104,815 |
| Universal Health Services, Inc., Class B | 1,690 | 201,938 |
| | | 9,227,171 |
| | | |
| Health Care Technology - 0.1% | | |
| Cerner Corp. * | 5,669 | 341,104 |
| | | |
| | | |
| Hotels, Restaurants & Leisure - 1.8% | | |
| Carnival Corp. | 8,685 | 473,159 |
| Chipotle Mexican Grill, Inc. * | 573 | 274,954 |
| Darden Restaurants, Inc. | 2,139 | 136,126 |
| Marriott International, Inc., Class A | 3,612 | 242,148 |
| McDonald's Corp. | 17,198 | 2,031,772 |
| Royal Caribbean Cruises Ltd. | 3,129 | 316,686 |
| Starbucks Corp. | 27,848 | 1,671,715 |
| Starwood Hotels & Resorts Worldwide, Inc. | 3,199 | 221,627 |
| Wyndham Worldwide Corp. | 2,248 | 163,317 |
| Wynn Resorts Ltd. | 1,494 | 103,370 |
| Yum! Brands, Inc. | 8,142 | 594,773 |
| | | 6,229,647 |
| | | |
| Household Durables - 0.4% | | |
| D.R. Horton, Inc. | 6,188 | 198,202 |
| Garmin Ltd. | 2,258 | 83,930 |
| Harman International Industries, Inc. | 1,332 | 125,488 |
| Leggett & Platt, Inc. | 2,580 | 108,411 |
| Lennar Corp., Class A | 3,357 | 164,191 |
| Mohawk Industries, Inc. * | 1,163 | 220,260 |
| Newell Rubbermaid, Inc. | 5,073 | 223,618 |
| PulteGroup, Inc. | 6,287 | 112,034 |
| Whirlpool Corp. | 1,441 | 211,640 |
| | | 1,447,774 |
| | | |
| Household Products - 1.9% | | |
| Church & Dwight Co., Inc. | 2,500 | 212,200 |
| Clorox Co. (The) | 2,456 | 311,495 |
| Colgate-Palmolive Co. | 16,889 | 1,125,145 |
| Kimberly-Clark Corp. | 6,818 | 867,931 |
| Procter & Gamble Co. (The) | 50,954 | 4,046,257 |
| | | 6,563,028 |
| | | |
| Independent Power and Renewable Electricity Producers - 0.1% | | |
| AES Corp. | 12,777 | 122,276 |
| NRG Energy, Inc. | 6,546 | 77,046 |
| | | 199,322 |
www.calvert.com CALVERT VP S&P 500 INDEX PORTFOLIO ANNUAL REPORT 11
|
| | |
| | SHARES | VALUE ($) |
| COMMON STOCKS - Cont'd | | |
| Industrial Conglomerates - 2.5% | | |
| 3M Co. | 11,532 | 1,737,181 |
| Danaher Corp. | 11,157 | 1,036,262 |
| General Electric Co. | 176,739 | 5,505,420 |
| Roper Technologies, Inc. | 1,841 | 349,403 |
| | | 8,628,266 |
| | | |
| Insurance - 2.6% | | |
| ACE Ltd. | 6,107 | 713,603 |
| Aflac, Inc. | 7,992 | 478,721 |
| Allstate Corp. (The) | 7,254 | 450,401 |
| American International Group, Inc. | 23,168 | 1,435,721 |
| Aon plc | 5,130 | 473,037 |
| Assurant, Inc. | 1,272 | 102,447 |
| Chubb Corp. (The) | 4,302 | 570,617 |
| Cincinnati Financial Corp. | 2,744 | 162,363 |
| Hartford Financial Services Group, Inc. (The) | 7,784 | 338,293 |
| Lincoln National Corp. | 4,635 | 232,955 |
| Loews Corp. | 5,243 | 201,331 |
| Marsh & McLennan Co.'s, Inc. | 9,944 | 551,395 |
| MetLife, Inc. | 20,846 | 1,004,986 |
| Principal Financial Group, Inc. | 5,048 | 227,059 |
| Progressive Corp. (The) | 10,994 | 349,609 |
| Prudential Financial, Inc. | 8,523 | 693,857 |
| Torchmark Corp. | 2,183 | 124,780 |
| Travelers Co.'s, Inc. (The) | 5,698 | 643,076 |
| Unum Group | 4,721 | 157,162 |
| XL Group plc | 5,659 | 221,720 |
| | | 9,133,133 |
| | | |
| Internet & Catalog Retail - 2.1% | | |
| Amazon.com, Inc. * | 7,196 | 4,863,705 |
| Expedia, Inc. | 2,202 | 273,709 |
| Netflix, Inc. * | 7,945 | 908,749 |
| Priceline Group, Inc. (The) * | 932 | 1,188,253 |
| TripAdvisor, Inc. * | 2,053 | 175,018 |
| | | 7,409,434 |
| | | |
| Internet Software & Services - 4.1% | | |
| Akamai Technologies, Inc. * | 3,284 | 172,837 |
| Alphabet, Inc.: | | |
| Class A * | 5,456 | 4,244,822 |
| Class C * | 5,565 | 4,223,167 |
| eBay, Inc. * | 20,698 | 568,781 |
| Facebook, Inc., Class A * | 42,524 | 4,450,562 |
| VeriSign, Inc. * | 1,874 | 163,713 |
| Yahoo!, Inc. * | 16,433 | 546,562 |
| | | 14,370,444 |
12 www.calvert.com CALVERT VP S&P 500 INDEX PORTFOLIO ANNUAL REPORT
|
| | |
| | SHARES | VALUE ($) |
| COMMON STOCKS - Cont'd | | |
| IT Services - 3.5% | | |
| Accenture plc, Class A | 11,679 | 1,220,455 |
| Alliance Data Systems Corp. * | 1,145 | 316,673 |
| Automatic Data Processing, Inc. | 8,638 | 731,811 |
| Cognizant Technology Solutions Corp., Class A * | 11,430 | 686,029 |
| CSRA, Inc. | 2,620 | 78,600 |
| Fidelity National Information Services, Inc. | 5,309 | 321,725 |
| Fiserv, Inc. * | 4,280 | 391,449 |
| International Business Machines Corp. | 16,716 | 2,300,456 |
| MasterCard, Inc., Class A | 18,546 | 1,805,639 |
| Paychex, Inc. | 5,972 | 315,859 |
| PayPal Holdings, Inc. * | 20,698 | 749,268 |
| Teradata Corp. * | 2,854 | 75,403 |
| Total System Services, Inc. | 3,086 | 153,683 |
| Visa, Inc., Class A | 36,455 | 2,827,085 |
| Western Union Co. (The) | 9,942 | 178,061 |
| Xerox Corp. | 17,929 | 190,585 |
| | | 12,342,781 |
| | | |
| Leisure Products - 0.1% | | |
| Hasbro, Inc. | 2,110 | 142,129 |
| Mattel, Inc. | 6,258 | 170,030 |
| | | 312,159 |
| | | |
| Life Sciences - Tools & Services - 0.6% | | |
| Agilent Technologies, Inc. | 6,148 | 257,048 |
| Illumina, Inc. * | 2,700 | 518,251 |
| PerkinElmer, Inc. | 2,230 | 119,461 |
| Thermo Fisher Scientific, Inc. | 7,461 | 1,058,343 |
| Waters Corp. * | 1,564 | 210,483 |
| | | 2,163,586 |
| | | |
| Machinery - 1.1% | | |
| Caterpillar, Inc. | 10,905 | 741,104 |
| Cummins, Inc. | 3,155 | 277,671 |
| Deere & Co. | 5,850 | 446,179 |
| Dover Corp. | 3,071 | 188,283 |
| Flowserve Corp. | 2,533 | 106,589 |
| Illinois Tool Works, Inc. | 6,182 | 572,948 |
| Ingersoll-Rand plc | 4,956 | 274,017 |
| PACCAR, Inc. | 6,543 | 310,138 |
| Parker-Hannifin Corp. | 2,596 | 251,760 |
| Pentair plc | 3,403 | 168,551 |
| Snap-on, Inc. | 1,077 | 184,630 |
| Stanley Black & Decker, Inc. | 2,879 | 307,276 |
| Xylem, Inc. | 3,390 | 123,735 |
| | | 3,952,881 |
| | | |
| Media - 2.9% | | |
| Cablevision Systems Corp., Class A | 4,231 | 134,969 |
| CBS Corp., Class B | 8,123 | 382,837 |
| Comcast Corp., Class A | 45,733 | 2,580,713 |
www.calvert.com CALVERT VP S&P 500 INDEX PORTFOLIO ANNUAL REPORT 13
|
| | |
| | SHARES | VALUE ($) |
| COMMON STOCKS - Cont'd | | |
| Discovery Communications, Inc.: | | |
| Class A * | 2,741 | 73,130 |
| Class C * | 5,063 | 127,689 |
| Interpublic Group of Co.'s, Inc. (The) | 7,815 | 181,933 |
| News Corp.: | | |
| Class A | 7,149 | 95,511 |
| Class B | 2,023 | 28,241 |
| Omnicom Group, Inc. | 4,629 | 350,230 |
| Scripps Networks Interactive, Inc., Class A | 1,779 | 98,219 |
| TEGNA, Inc. | 4,184 | 106,776 |
| Time Warner Cable, Inc. | 5,293 | 982,328 |
| Time Warner, Inc. | 14,974 | 968,368 |
| Twenty-First Century Fox, Inc.: | | |
| Class A | 21,927 | 595,537 |
| Class B | 8,091 | 220,318 |
| Viacom, Inc., Class B | 6,689 | 275,319 |
| Walt Disney Co. (The) | 28,486 | 2,993,309 |
| | | 10,195,427 |
| | | |
| Metals & Mining - 0.2% | | |
| Alcoa, Inc. | 24,401 | 240,838 |
| Freeport-McMoRan, Inc. | 21,262 | 143,944 |
| Newmont Mining Corp. | 9,847 | 177,148 |
| Nucor Corp. | 5,875 | 236,762 |
| | | 798,692 |
| | | |
| Multi-Utilities - 1.1% | | |
| Ameren Corp. | 4,476 | 193,497 |
| CenterPoint Energy, Inc. | 7,928 | 145,558 |
| CMS Energy Corp. | 5,395 | 194,652 |
| Consolidated Edison, Inc. | 5,403 | 347,251 |
| Dominion Resources, Inc. | 11,111 | 751,548 |
| DTE Energy Co. | 3,266 | 261,900 |
| NiSource, Inc. | 5,809 | 113,333 |
| PG&E Corp. | 9,178 | 488,178 |
| Public Service Enterprise Group, Inc. | 9,333 | 361,094 |
| SCANA Corp. | 2,659 | 160,843 |
| Sempra Energy | 4,419 | 415,430 |
| TECO Energy, Inc. | 4,324 | 115,235 |
| WEC Energy Group, Inc. | 5,858 | 300,574 |
| | | 3,849,093 |
| | | |
| Multiline Retail - 0.6% | | |
| Dollar General Corp. | 5,449 | 391,620 |
| Dollar Tree, Inc. * | 4,404 | 340,077 |
| Kohl's Corp. | 3,768 | 179,470 |
| Macy's, Inc. | 5,898 | 206,312 |
| Nordstrom, Inc. | 2,593 | 129,157 |
| Target Corp. | 11,538 | 837,774 |
| | | 2,084,410 |
14 www.calvert.com CALVERT VP S&P 500 INDEX PORTFOLIO ANNUAL REPORT
|
| | |
| | SHARES | VALUE ($) |
| COMMON STOCKS - Cont'd | | |
| Oil, Gas & Consumable Fuels - 5.3% | | |
| Anadarko Petroleum Corp. | 9,446 | 458,887 |
| Apache Corp. | 7,115 | 316,404 |
| Cabot Oil & Gas Corp. | 7,698 | 136,178 |
| Chesapeake Energy Corp. | 9,340 | 42,030 |
| Chevron Corp. | 35,207 | 3,167,222 |
| Cimarex Energy Co. | 1,700 | 151,946 |
| Columbia Pipeline Group, Inc. | 7,129 | 142,580 |
| ConocoPhillips | 23,084 | 1,077,792 |
| Consol Energy, Inc. | 4,241 | 33,504 |
| Devon Energy Corp. | 7,235 | 231,520 |
| EOG Resources, Inc. | 10,221 | 723,545 |
| EQT Corp. | 2,799 | 145,912 |
| Exxon Mobil Corp. | 77,968 | 6,077,606 |
| Hess Corp. | 4,532 | 219,711 |
| Kinder Morgan, Inc. | 33,725 | 503,177 |
| Marathon Oil Corp. | 12,472 | 157,022 |
| Marathon Petroleum Corp. | 9,982 | 517,467 |
| Murphy Oil Corp. | 3,112 | 69,864 |
| Newfield Exploration Co. * | 2,965 | 96,540 |
| Noble Energy, Inc. | 8,017 | 264,000 |
| Occidental Petroleum Corp. | 14,381 | 972,299 |
| Oneok, Inc. | 3,835 | 94,571 |
| Phillips 66 | 8,984 | 734,891 |
| Pioneer Natural Resources Co. | 2,777 | 348,180 |
| Range Resources Corp. | 3,111 | 76,562 |
| Southwestern Energy Co. * | 7,013 | 49,862 |
| Spectra Energy Corp. | 12,373 | 296,210 |
| Tesoro Corp. | 2,255 | 237,609 |
| Valero Energy Corp. | 9,018 | 637,663 |
| Williams Co.'s, Inc. (The) | 12,801 | 328,986 |
| | | 18,309,740 |
| | | |
| Personal Products - 0.1% | | |
| Estee Lauder Co.'s, Inc. (The), Class A | 4,168 | 367,034 |
| | | |
| | | |
| Pharmaceuticals - 5.6% | | |
| Allergan plc * | 7,386 | 2,308,125 |
| Bristol-Myers Squibb Co. | 31,210 | 2,146,936 |
| Eli Lilly & Co. | 18,284 | 1,540,610 |
| Endo International plc * | 3,907 | 239,187 |
| Johnson & Johnson | 51,870 | 5,328,086 |
| Mallinckrodt plc * | 2,190 | 163,440 |
| Merck & Co., Inc. | 52,321 | 2,763,595 |
| Mylan NV * | 7,707 | 416,717 |
| Perrigo Co. plc | 2,738 | 396,189 |
| Pfizer, Inc. | 115,719 | 3,735,409 |
| Zoetis, Inc. | 8,613 | 412,735 |
| | | 19,451,029 |
www.calvert.com CALVERT VP S&P 500 INDEX PORTFOLIO ANNUAL REPORT 15
|
| | |
| | SHARES | VALUE ($) |
| COMMON STOCKS - Cont'd | | |
| Professional Services - 0.3% | | |
| Dun & Bradstreet Corp. (The) | 675 | 70,153 |
| Equifax, Inc. | 2,251 | 250,694 |
| Nielsen Holdings PLC | 6,932 | 323,031 |
| Robert Half International, Inc. | 2,535 | 119,500 |
| Verisk Analytics, Inc., Class A* | 3,000 | 230,640 |
| | | 994,018 |
| | | |
| Real Estate Investment Trusts - 2.6% | | |
| American Tower Corp. | 7,921 | 767,941 |
| Apartment Investment & Management Co., Class A | 2,926 | 117,128 |
| AvalonBay Communities, Inc. | 2,564 | 472,109 |
| Boston Properties, Inc. | 2,823 | 360,045 |
| Crown Castle International Corp. | 6,319 | 546,278 |
| Equinix, Inc. | 1,161 | 351,086 |
| Equity Residential | 6,815 | 556,036 |
| Essex Property Trust, Inc. | 1,220 | 292,080 |
| General Growth Properties, Inc. | 10,968 | 298,439 |
| HCP, Inc. | 8,453 | 323,243 |
| Host Hotels & Resorts, Inc. | 13,964 | 214,208 |
| Iron Mountain, Inc. | 3,380 | 91,294 |
| Kimco Realty Corp. | 7,575 | 200,435 |
| Macerich Co. (The) | 2,616 | 211,085 |
| Plum Creek Timber Co., Inc. | 3,281 | 156,569 |
| Prologis, Inc. | 9,811 | 421,088 |
| Public Storage | 2,719 | 673,496 |
| Realty Income Corp. | 4,681 | 241,680 |
| Simon Property Group, Inc. | 5,797 | 1,127,169 |
| SL Green Realty Corp. | 1,840 | 207,883 |
| Ventas, Inc. | 6,171 | 348,230 |
| Vornado Realty Trust | 3,325 | 332,367 |
| Welltower, Inc. | 6,572 | 447,093 |
| Weyerhaeuser Co. | 9,712 | 291,166 |
| | | 9,048,148 |
| | | |
| Real Estate Management & Development - 0.1% | | |
| CBRE Group, Inc., Class A * | 5,445 | 188,288 |
| | | |
| | | |
| Road & Rail - 0.7% | | |
| CSX Corp. | 18,528 | 480,802 |
| JB Hunt Transport Services, Inc. | 1,700 | 124,712 |
| Kansas City Southern | 2,035 | 151,953 |
| Norfolk Southern Corp. | 5,592 | 473,027 |
| Ryder System, Inc. | 1,055 | 59,956 |
| Union Pacific Corp. | 15,997 | 1,250,965 |
| | | 2,541,415 |
| | | |
| Semiconductors & Semiconductor Equipment - 2.4% | | |
| Analog Devices, Inc. | 5,795 | 320,579 |
| Applied Materials, Inc. | 21,522 | 401,816 |
| Avago Technologies Ltd. | 4,875 | 707,606 |
16 www.calvert.com CALVERT VP S&P 500 INDEX PORTFOLIO ANNUAL REPORT
|
| | |
| | SHARES | VALUE ($) |
| COMMON STOCKS - Cont'd | | |
| Broadcom Corp., Class A | 10,489 | 606,474 |
| First Solar, Inc. * | 1,396 | 92,122 |
| Intel Corp. | 88,383 | 3,044,794 |
| KLA-Tencor Corp. | 3,059 | 212,142 |
| Lam Research Corp. | 2,991 | 237,545 |
| Linear Technology Corp. | 4,364 | 185,339 |
| Microchip Technology, Inc. | 3,961 | 184,345 |
| Micron Technology, Inc. * | 20,170 | 285,607 |
| NVIDIA Corp. | 9,538 | 314,373 |
| Qorvo, Inc. * | 2,653 | 135,038 |
| Skyworks Solutions, Inc. | 3,578 | 274,898 |
| Texas Instruments, Inc. | 18,999 | 1,041,335 |
| Xilinx, Inc. | 4,959 | 232,924 |
| | | 8,276,937 |
| | | |
| Software - 4.2% | | |
| Activision Blizzard, Inc. | 9,400 | 363,874 |
| Adobe Systems, Inc. * | 9,337 | 877,118 |
| Autodesk, Inc. * | 4,204 | 256,150 |
| CA, Inc. | 5,883 | 168,018 |
| Citrix Systems, Inc. * | 2,881 | 217,948 |
| Electronic Arts, Inc. * | 5,801 | 398,645 |
| Intuit, Inc. | 4,945 | 477,193 |
| Microsoft Corp. | 149,607 | 8,300,196 |
| Oracle Corp. | 59,962 | 2,190,412 |
| Red Hat, Inc. * | 3,493 | 289,255 |
| Salesforce.com, Inc. * | 11,641 | 912,654 |
| Symantec Corp. | 12,760 | 267,960 |
| | | 14,719,423 |
| | | |
| Specialty Retail - 2.5% | | |
| Advance Auto Parts, Inc. | 1,350 | 203,188 |
| AutoNation, Inc. * | 1,361 | 81,197 |
| AutoZone, Inc. * | 579 | 429,566 |
| Bed Bath & Beyond, Inc. * | 3,234 | 156,041 |
| Best Buy Co., Inc. | 5,759 | 175,362 |
| CarMax, Inc. * | 3,917 | 211,400 |
| GameStop Corp., Class A | 1,998 | 56,024 |
| Gap, Inc. (The) | 4,464 | 110,261 |
| Home Depot, Inc. (The) | 23,746 | 3,140,408 |
| L Brands, Inc. | 4,821 | 461,948 |
| Lowe's Co.'s, Inc. | 17,139 | 1,303,250 |
| O'Reilly Automotive, Inc. * | 1,847 | 468,067 |
| Ross Stores, Inc. | 7,585 | 408,149 |
| Signet Jewelers Ltd. | 1,500 | 185,535 |
| Staples, Inc. | 11,929 | 112,968 |
| Tiffany & Co. | 2,047 | 156,166 |
| TJX Co.'s, Inc. (The) | 12,540 | 889,211 |
| Tractor Supply Co. | 2,555 | 218,452 |
| Urban Outfitters, Inc. * | 2,033 | 46,251 |
| | | 8,813,444 |
| | | |
www.calvert.com CALVERT VP S&P 500 INDEX PORTFOLIO ANNUAL REPORT 17
|
| | |
| | SHARES | VALUE ($) |
| COMMON STOCKS - Cont'd | | |
| Technology Hardware, Storage & Peripherals - 4.0% | | |
| Apple, Inc. | 104,421 | 10,991,355 |
| EMC Corp. | 36,360 | 933,725 |
| Hewlett Packard Enterprise Co. | 33,906 | 515,371 |
| HP, Inc. | 33,906 | 401,447 |
| NetApp, Inc. | 5,814 | 154,246 |
| SanDisk Corp. | 3,759 | 285,646 |
| Seagate Technology plc | 5,667 | 207,752 |
| Western Digital Corp. | 4,323 | 259,596 |
| | | 13,749,138 |
| | | |
| Textiles, Apparel & Luxury Goods - 0.9% | | |
| Coach, Inc. | 5,058 | 165,548 |
| Fossil Group, Inc. * | 838 | 30,637 |
| Hanesbrands, Inc. | 7,477 | 220,048 |
| Michael Kors Holdings Ltd. * | 3,447 | 138,087 |
| NIKE, Inc., Class B | 25,274 | 1,579,625 |
| PVH Corp. | 1,525 | 112,316 |
| Ralph Lauren Corp. | 1,080 | 120,399 |
| Under Armour, Inc., Class A * | 3,377 | 272,220 |
| VF Corp. | 6,351 | 395,350 |
| | | 3,034,230 |
| | | |
| Tobacco - 1.6% | | |
| Altria Group, Inc. | 36,865 | 2,145,912 |
| Philip Morris International, Inc. | 29,004 | 2,549,742 |
| Reynolds American, Inc. | 15,370 | 709,325 |
| | | 5,404,979 |
| | | |
| Trading Companies & Distributors - 0.2% | | |
| Fastenal Co. | 5,444 | 222,224 |
| United Rentals, Inc. * | 1,777 | 128,904 |
| W.W. Grainger, Inc. | 1,124 | 227,711 |
| | | 578,839 |
| | | |
| Total Common Stocks (Cost $202,472,810) | | 335,698,902 |
| | | |
| | | |
| EXCHANGE-TRADED PRODUCTS - 1.7% | | |
| SPDR S&P 500 ETF Trust | 29,250 | 5,963,782 |
| | | |
| | | |
| Total Exchange-Traded Products (Cost $5,947,380) | | 5,963,782 |
| | | |
| | | |
| | PRINCIPAL
AMOUNT ($) | VALUE ($) |
| U.S. TREASURY OBLIGATIONS - 0.4% | | |
| United States Treasury Bills, 0.15%, 3/31/16 ^ | 1,500,000 | 1,499,367 |
| | | |
| Total U.S. Treasury Obligations (Cost $1,499,415) | | 1,499,367 |
18 www.calvert.com CALVERT VP S&P 500 INDEX PORTFOLIO ANNUAL REPORT
|
| | | | |
| | PRINCIPAL
AMOUNT ($) | VALUE ($) |
| TIME DEPOSIT - 1.5% | | |
| State Street Bank Time Deposit, 0.278%, 1/4/16 | 5,047,862 | 5,047,862 |
|
| | | |
| | | |
| Total Time Deposit (Cost $5,047,862) | | 5,047,862 |
|
| | | |
| | | |
| TOTAL INVESTMENTS (Cost $214,967,467) - 100.1% | | 348,209,913 |
|
| Other assets and liabilities, net - (0.1)% | | (244,671) |
|
NET ASSETS - 100.0% | |
| $347,965,242 |
|
| | | |
|
| | | | | | | | | | |
| FUTURES | NUMBER OF
CONTRACTS | EXPIRATION
DATE | UNDERLYING FACE AMOUNT AT VALUE | UNREALIZED
APPRECIATION
(DEPRECIATION) |
| Long: | | | | | |
| | E-Mini S&P 500 Index^ | 24 | 3/16 |
| $2,442,480 |
|
| $41,220 |
|
| | S&P 500 Index^ | 9 | 3/16 | 4,579,650 |
| 76,905 |
|
| | Total Long | | | |
| $118,125 |
|
|
|
| NOTES TO SCHEDULE OF INVESTMENTS |
| * Non-income producing security. |
| ^ Futures collateralized by $1,500,000 par value of U.S. Treasury Bills. |
| (a) This security was valued under the direction of the Board of Directors. See Note A. |
|
| |
| Abbreviations: |
| ETF: | Exchange-Traded Fund |
| CVR: | Contingent Value Rights |
| LLC: | Limited Liability Corporation |
| Ltd.: | Limited |
| plc: | Public Limited Company |
| See notes to financial statements. |
www.calvert.com CALVERT VP S&P 500 INDEX PORTFOLIO ANNUAL REPORT 19
CALVERT VP S&P 500 INDEX PORTFOLIO
STATEMENT OF ASSETS AND LIABILITIES
DECEMBER 31, 2015
|
| | | |
| ASSETS | |
| Investments in securities, at value (Cost $214,967,467) - see accompanying schedule |
| $348,209,913 |
|
| Cash | 4,105 |
|
| Receivable for shares sold | 3,357 |
|
| Dividends and interest receivable | 486,442 |
|
| Directors' deferred compensation plan | 226,858 |
|
| Total assets | 348,930,675 |
|
| | |
| LIABILITIES | |
| Payable for securities purchased | 38,441 |
|
| Payable for shares redeemed | 414,450 |
|
| Payable for futures contracts variation margin | 66,240 |
|
| Payable to Calvert Investment Management, Inc. | 72,515 |
|
| Payable to Calvert Investment Administrative Services, Inc. | 29,927 |
|
| Payable to Calvert Investment Services, Inc. | 3,477 |
|
| Directors' deferred compensation plan | 226,858 |
|
| Accrued expenses and other liabilities | 113,525 |
|
| Total liabilities | 965,433 |
|
| NET ASSETS |
| $347,965,242 |
|
| | |
| NET ASSETS CONSIST OF: | |
| Paid-in capital applicable to 3,104,954 shares of common stock outstanding; | |
| $0.10 par value, 30,000,000 shares authorized |
| $219,167,902 |
|
| Undistributed net investment income | 5,805,719 |
|
| Accumulated net realized gain (loss) | (10,368,950) |
|
| Net unrealized appreciation (depreciation) | 133,360,571 |
|
| NET ASSETS |
| $347,965,242 |
|
| | |
| NET ASSET VALUE PER SHARE |
| $112.07 |
|
| See notes to financial statements. |
20 www.calvert.com CALVERT VP S&P 500 INDEX PORTFOLIO ANNUAL REPORT
CALVERT VP S&P 500 INDEX PORTFOLIO
STATEMENT OF OPERATIONS
YEAR ENDED DECEMBER 31, 2015
|
| | | |
| NET INVESTMENT INCOME | |
| Investment Income: | |
| Dividend income (net of foreign taxes withheld of $515) |
| $7,427,760 |
|
| Interest income | 11,225 |
|
| Total investment income | 7,438,985 |
|
| | |
| Expenses: | |
| Investment advisory fee | 899,065 |
|
| Administrative fees | 359,626 |
|
| Transfer agency fees and expenses | 33,716 |
|
| Directors' fees and expenses | 64,797 |
|
| Accounting fees | 66,568 |
|
| Custodian fees | 66,369 |
|
| Professional fees | 50,155 |
|
| Reports to shareholders | 53,782 |
|
| Licensing fees | 42,213 |
|
| Miscellaneous | 22,303 |
|
| Total expenses | 1,658,594 |
|
| Reimbursement from Advisor | (148,166) |
|
| Net expenses | 1,510,428 |
|
| NET INVESTMENT INCOME | 5,928,557 |
|
| | |
| | |
| REALIZED AND UNREALIZED GAIN (LOSS) | |
| Net realized gain (loss) on: | |
| Investments | 7,815,409 |
|
| Futures | (195,028) |
|
| | 7,620,381 |
|
| | |
| Change in unrealized appreciation (depreciation) on: | |
| Investments | (10,278,764) |
|
| Futures | (54,775) |
|
| | (10,333,539) |
|
| | |
| NET REALIZED AND UNREALIZED GAIN (LOSS) | (2,713,158) |
|
| | |
| INCREASE (DECREASE) IN NET ASSETS RESULTING FROM OPERATIONS |
| $3,215,399 |
|
| See notes to financial statements. |
www.calvert.com CALVERT VP S&P 500 INDEX PORTFOLIO ANNUAL REPORT 21
CALVERT VP S&P 500 INDEX PORTFOLIO
STATEMENTS OF CHANGES IN NET ASSETS
|
| | | | | | | |
| INCREASE (DECREASE) IN NET ASSETS | YEAR ENDED
DECEMBER 31, 2015 | | YEAR ENDED
DECEMBER 31, 2014 |
| Operations: | | | |
| Net investment income |
| $5,928,557 |
| |
| $5,595,559 |
|
| Net realized gain (loss) | 7,620,381 |
| | 30,984,197 |
|
| Change in unrealized appreciation (depreciation) | (10,333,539) |
| | 7,642,425 |
|
| | | | |
| INCREASE (DECREASE) IN NET ASSETS RESULTING FROM OPERATIONS | 3,215,399 |
| | 44,222,181 |
|
| | | | |
| Distributions to shareholders from: | | | |
| Net investment income | (652,135) |
| | (5,642,605) |
|
| Net realized gain | (5,882,206) |
| | (29,898,617) |
|
| Total distributions | (6,534,341) |
| | (35,541,222) |
|
| | | | |
| Capital share transactions: | | | |
| Shares sold | 46,515,764 |
| | 25,564,791 |
|
| Reinvestment of distributions | 6,534,339 |
| | 35,541,222 |
|
| Shares issued from merger (See Note E) | — |
| | 9,936,888 |
|
| Shares redeemed | (63,247,953) |
| | (71,929,561) |
|
| Total capital share transactions | (10,197,850) |
| | (886,660) |
|
| | | | |
| TOTAL INCREASE (DECREASE) IN NET ASSETS | (13,516,792) |
| | 7,794,299 |
|
| | | | |
| | | | |
| NET ASSETS | | | |
| Beginning of year | 361,482,034 |
| | 353,687,735 |
|
| End of year (including undistributed net investment income of $5,805,719 and $652,113, respectively) |
| $347,965,242 |
| |
| $361,482,034 |
|
| | | | |
| CAPITAL SHARE ACTIVITY | | | |
| Shares sold | 404,834 |
| | 219,083 |
|
| Reinvestment of distributions | 57,344 |
| | 311,056 |
|
| Shares issued from merger (See Note E) | — |
| | 87,703 |
|
| Shares redeemed | (554,116) |
| | (618,357) |
|
| Total capital share activity | (91,938) |
| | (515) |
|
| See notes to financial statements. |
22 www.calvert.com CALVERT VP S&P 500 INDEX PORTFOLIO ANNUAL REPORT
NOTES TO FINANCIAL STATEMENTS
NOTE A — SIGNIFICANT ACCOUNTING POLICIES
General: Calvert VP S&P 500 Index Portfolio (the “Portfolio”), a series of Calvert Variable Products, Inc. (the “Fund”), is registered under the Investment Company Act of 1940 as a diversified, open-end management investment company. The Fund is comprised of eleven separate portfolios. The operations of each series of the Fund are accounted for separately. Shares of the Portfolio are sold without sales charge to affiliated and unaffiliated insurance companies for allocation to certain of their variable separate accounts. The Portfolio applies the accounting and reporting guidance in the Financial Accounting Standards Board (FASB) Accounting Standards Codification Topic 946, Financial Services – Investment Companies (ASC 946).
Security Valuation: Net asset value per share is determined every business day as of the close of the regular session of the New York Stock Exchange (generally 4:00 p.m. Eastern time). The Portfolio uses independent pricing services approved by the Board of Directors (“the Board”) to value its investments wherever possible. Investments for which market quotations are not available or deemed not reliable are fair valued in good faith under the direction of the Board.
The Board has adopted Valuation Procedures (the “Procedures”) to determine the fair value of securities and other financial instruments for which market prices are not readily available or which may not be reliably priced. The Board has delegated the day-to-day responsibility for determining the fair value of assets of the Portfolio to Calvert Investment Management, Inc. (the “Advisor” or “Calvert”) and has provided these Procedures to govern Calvert in its valuation duties.
Calvert has chartered an internal Valuation Committee to oversee the implementation of these Procedures and to assist it in carrying out the valuation responsibilities that the Board has delegated.
The Valuation Committee meets on a regular basis to review illiquid securities and other investments which may not have readily available market prices. The Valuation Committee’s fair valuation determinations are subject to review, approval and ratification by the Board at its next regularly scheduled meeting covering the calendar quarter in which the fair valuation was determined.
The Valuation Committee utilizes various methods to measure the fair value of the Portfolio’s investments. U.S. generally accepted accounting principles (GAAP) establishes a disclosure hierarchy that categorizes the inputs to valuation techniques used to value assets and liabilities at measurement date. These inputs are summarized in the three broad levels listed below:
Level 1 - quoted prices in active markets for identical securities
Level 2 - other significant observable inputs (including quoted prices for similar securities, interest rates, prepayment speeds, credit risk, etc.)
Level 3 - significant unobservable inputs (including the Portfolio’s own assumptions in determining the fair value of investments)
The inputs or methodologies used for valuing securities are not necessarily an indication of the risk associated with investing in those securities.
Changes in valuation techniques may result in transfers in or out of an investment’s assigned level within the hierarchy during the year. Transfers in and/or out of levels are determined based on the fair value of such securities at the end of the year. Valuation techniques used to value the Portfolio’s investments by major category are as follows:
Common stock securities, including restricted securities, for which market quotations are readily available, are valued at the last reported sale price or official closing price as reported by an independent pricing service on the primary market or exchange on which they are traded and are categorized as Level 1 in the hierarchy. In the event there were no sales during the day or closing prices are not available, securities are valued at the last quoted bid price or the last available price and are categorized as Level 2 in the hierarchy. Foreign securities are valued based on quotations from the principal market in which such securities are normally traded. If events occur after the close of the principal market in which foreign securities are traded, and before the close of business of the Portfolio, that are expected to materially affect the value of those securities, then they are valued at their fair value taking these events into account and are categorized as Level 2 in the hierarchy. For restricted securities and private placements where observable
www.calvert.com CALVERT VP S&P 500 INDEX PORTFOLIO ANNUAL REPORT 23
inputs are limited, assumptions about market activity and risk are used and such securities are categorized as Level 3 in the hierarchy.
Exchange-traded products are valued at the official closing price as reported by an independent pricing service on the primary market or exchange on which they are traded and are categorized as Level 1 in the hierarchy.
Debt securities, including restricted securities, are valued based on evaluated prices received from independent pricing services or from dealers who make markets in such securities. For U.S. government and government agency obligations, pricing services utilize matrix pricing which considers yield or price of bonds of comparable quality, coupon, maturity and type as well as dealer supplied prices and such securities are generally categorized as Level 2 in the hierarchy. Short-term securities of sufficient credit quality with remaining maturities of sixty days or less for which quotations are not readily available are valued at amortized cost, which approximates fair value, and are categorized as Level 2 in the hierarchy.
Futures contracts are valued at unrealized appreciation (depreciation) based on the settlement price established each day by the board of trade or exchange on which they are traded and are categorized as Level 1 in the hierarchy.
If a market value cannot be determined for a security using the methodologies described above, or if, in the good faith opinion of the Advisor, the market value does not constitute a readily available market quotation, or if a significant event has occurred that would materially affect the value of the security, the security will be fair valued as determined in good faith by the Valuation Committee.
The Valuation Committee considers a number of factors, including significant unobservable valuation inputs when arriving at fair value. It considers all significant facts that are reasonably available and relevant to the determination of fair value.
The Valuation Committee primarily employs a market-based approach which may use related or comparable assets or liabilities, recent transactions, market multiples, book values, and other relevant information for the investment to determine the fair value of the investment. When more appropriate, the Portfolio may employ an income-based or cost approach. An income-based valuation approach discounts anticipated future cash flows of the investment to calculate a present amount (discounted). The measurement is based on the value indicated by current market expectations about those future amounts. Discounts may also be applied due to the nature or duration of any restrictions on the disposition of the investments. A cost based approach is based on the amount that currently would be required to replace the service capacity of an asset (current replacement cost). From the seller’s perspective, the price that would be received for the asset is determined based on the cost to a buyer to acquire or construct a substitute asset of comparable utility, adjusted for obsolescence.
The values assigned to fair value investments are based on available information and do not necessarily represent amounts that might ultimately be realized. Further, due to the inherent uncertainty of valuations of such investments, the fair values may differ significantly from the values that would have been used had an active market existed, and the differences could be material. The Valuation Committee employs various methods for calibrating these valuation approaches including a regular review of key inputs and assumptions, transactional back-testing or disposition analysis and reviews of any related market activity.
At December 31, 2015, securities valued at $774, or 0.0% of net assets, were fair valued in good faith under the direction of the Board.
24 www.calvert.com CALVERT VP S&P 500 INDEX PORTFOLIO ANNUAL REPORT
The following table summarizes the market value of the Portfolio's holdings as of December 31, 2015, based on the inputs used to value them:
|
| | | | | | | | | | | |
| | VALUATION INPUTS |
| INVESTMENTS IN SECURITIES* | LEVEL 1 | LEVEL 2 | LEVEL 3 | TOTAL |
| Common Stocks** |
| $335,698,128 |
|
| $774 |
| $— |
|
| $335,698,902 |
|
| Exchange-Traded Products | 5,963,782 |
| — |
| — |
| 5,963,782 |
|
| U.S. Treasury Obligations | — |
| 1,499,367 |
| — |
| 1,499,367 |
|
| Time Deposit | — |
| 5,047,862 |
| — |
| 5,047,862 |
|
| TOTAL |
| $341,661,910 |
|
| $6,548,003 |
| $— |
|
| $348,209,913 |
|
| Futures Contracts *** |
| $118,125 |
| $— |
| $— |
|
| $118,125 |
|
| |
| * For a complete listing of investments, please refer to the Schedule of Investments. |
| ** For further breakdown of equity securities by industry type, please refer to the Schedule of Investments. |
| *** The value listed for these securities reflects unrealized appreciation (depreciation) as shown on the Schedule of Investments. |
There were no transfers between levels during the year.
Futures Contracts: The Portfolio may purchase and sell futures contracts, but only when, in the judgment of the Advisor, such a position acts as a hedge. The Portfolio may not enter into futures contracts for the purpose of speculation or leverage. These futures contracts may include, but are not limited to, market index futures contracts. The Portfolio is subject to market risk in the normal course of pursuing its investment objectives and may use futures contracts to hedge against changes in the value of securities. The Portfolio may enter into futures contracts agreeing to buy or sell a financial instrument for a set price at a future date. Initial margin deposits of either cash or securities as required by the broker are made upon entering into the contract. While the contract is open, daily variation margin payments are made to or received from the broker reflecting the daily change in market value of the contract and are recorded for financial reporting purposes as unrealized gains or losses by the Portfolio. When a futures contract is closed, a realized gain or loss is recorded equal to the difference between the opening and closing value of the contract. The risks associated with entering into futures contracts may include the possible illiquidity of the secondary market which would limit the Portfolio’s ability to close out a futures contract prior to the settlement date, an imperfect correlation between the value of the contracts and the underlying financial instruments, or that the counterparty will fail to perform its obligations under the contracts’ terms. Futures contracts are designed by boards of trade which are designated “contracts markets” by the Commodities Futures Trading Commission. Futures contracts trade on the contracts markets in a manner that is similar to the way a stock trades on a stock exchange, and the boards of trade, through their clearing corporations, guarantee the futures contracts against default. As a result, there is minimal counterparty credit risk to the Portfolio. During the year, futures contracts were used to hedge the lack of equity market exposure inherent in a cash position. The Portfolio’s futures contracts at year end are presented in the Schedule of Investments.
At December 31, 2015, the Portfolio had the following derivatives, categorized by risk exposure:
|
| | | | | |
| Risk | Statement of Assets and Liabilities | Assets | Statement of Assets and Liabilities | Liabilities | |
| Equity | Unrealized appreciation on futures contracts | $118,125* | Unrealized depreciation on futures contracts | ($—)* | |
| * Only the current day’s variation margin is reported within the Statement of Assets and Liabilities. |
The effect of derivative instruments on the Statement of Operations for the year ended December 31, 2015 was as follows:
|
| | | |
| | Statement of Operations Location |
| Risk | Derivatives | Net Realized Gain (Loss) | Net Change in Unrealized appreciation (depreciation) |
| Equity | Futures | ($195,028) | ($54,775) |
www.calvert.com CALVERT VP S&P 500 INDEX PORTFOLIO ANNUAL REPORT 25
During the year, the Portfolio invested in E-Mini S&P 500 Index and S&P 500 Index futures. The volume of outstanding contracts has varied throughout the year with an average number of contracts as in the following table:
|
| |
| Derivative Description | Average Number of Contracts* |
| Futures Contracts long | 78 |
| Futures Contracts short | — |
* Averages are based on activity levels during the year ended December 31, 2015.
Security Transactions and Investment Income: Security transactions are accounted for on trade date. Realized gains and losses are recorded on an identified cost basis and may include proceeds from litigation. Dividend income is recorded on the ex-dividend date or, in the case of dividends on certain foreign securities, as soon as the Portfolio is informed of the ex-dividend date. Withholding taxes on foreign dividends have been provided for in accordance with the Portfolio’s understanding of the applicable country’s tax rules and rates. Distributions received on securities that represent a return of capital are recorded as a reduction of cost of investments. Distributions received on securities that represent a capital gain are recorded as a realized gain. Interest income, which includes amortization of premium and accretion of discount on debt securities, is accrued as earned.
Foreign Currency Transactions: The Portfolio’s accounting records are maintained in U.S. dollars. For valuation of assets and liabilities on each date of net asset value determination, foreign denominations are converted into U.S. dollars using the current exchange rate. Security transactions, income, and expenses are translated at the prevailing rate of exchange on the date of the event. The effect of changes in foreign exchange rates on securities and foreign currencies is included in the net realized and unrealized gain or loss on investments and assets and liabilities denominated in foreign currencies.
Distributions to Shareholders: Distributions to shareholders are recorded by the Portfolio on ex-dividend date. Dividends from net investment income and distributions from net realized capital gains, if any, are paid at least annually. Distributions are determined in accordance with income tax regulations which may differ from U.S. generally accepted accounting principles; accordingly, periodic reclassifications are made within the Portfolio's capital accounts to reflect income and gains available for distribution under income tax regulations.
Estimates: The preparation of financial statements in conformity with U.S. generally accepted accounting principles requires management to make estimates and assumptions that affect the reported amounts of assets and liabilities and disclosure of contingent assets and liabilities at the date of the financial statements and the reported amounts of increases and decreases in net assets from operations during the reporting period. Actual results could differ from those estimates.
Federal Income Taxes: No provision for federal income or excise tax is required since the Portfolio intends to continue to qualify as a regulated investment company under the Internal Revenue Code and to distribute substantially all of its taxable earnings.
Management has analyzed the Portfolio's tax positions taken for all open federal income tax years and has concluded that no provision for federal income tax is required in the Portfolio's financial statements. A Portfolio's federal tax return is subject to examination by the Internal Revenue Service for a period of three years.
NOTE B — RELATED PARTY TRANSACTIONS
Calvert Investment Management, Inc. (the “Advisor”) is wholly-owned by Calvert Investments, Inc., which is indirectly wholly-owned by Ameritas Mutual Holding Company. The Advisor provides investment advisory services and pays the salaries and fees of officers and Directors of the Portfolio who are employees of the Advisor or its affiliates. For its services, the Advisor receives an annual fee, payable monthly, of 0.25%, of the Portfolio’s average daily net assets.
The Advisor has contractually agreed to limit net annual portfolio operating expenses through April 30, 2016. The contractual expense cap is 0.42%. For the purpose of this expense limit, operating expenses do not include interest expense, brokerage commissions, taxes, and extraordinary expenses. This expense limitation does not limit acquired fund fees and expenses, if any.
Calvert Investment Administrative Services, Inc. ("CIAS"), an affiliate of the Advisor, provides administrative services to the Portfolio for an annual fee, payable monthly, of 0.10% of the Portfolio’s average daily net assets.
26 www.calvert.com CALVERT VP S&P 500 INDEX PORTFOLIO ANNUAL REPORT
On November 24, 2015, the Board of Directors approved the recommendation made by CIAS to standardize and rationalize the administrative fee paid by the Calvert Funds at 0.12% for all series and all share classes of the Calvert Funds. CIAS and the Portfolio have entered into an Amended and Restated Administrative Services Agreement that will establish a 0.12% administrative fee for all share classes commencing on May 1, 2016. CIAS has contractually agreed to waive 0.02% for Class I (the difference between the current administrative fee and the new 0.12% fee) from May 1, 2016 through April 30, 2018.
Calvert Investment Services, Inc. (“CIS”), an affiliate of the Advisor, acts as shareholder servicing agent for the Portfolio. For its services, CIS received a fee of $26,972 for the year ended December 31, 2015. Boston Financial Data Services, Inc. is the transfer and dividend disbursing agent.
Each Director of the Portfolio who is not an employee of the Advisor or its affiliates receives a fee of $1,500 for each Board and Committee meeting attended plus an annual fee of $44,000. Committee chairs receive an additional $5,000 annual retainer. Eligible Directors may participate in a Deferred Compensation Plan (the “Plan”). Obligations of the Plan will be paid solely out of the Portfolio’s assets. Directors’ fees are allocated to each of the portfolios served.
NOTE C — INVESTMENT ACTIVITY AND TAX INFORMATION
During the year, the cost of purchases and proceeds from sales of investments, other than short-term securities, were $13,863,228 and $14,989,118, respectively.
|
| | | |
| CAPITAL LOSS CARRYFORWARDS | |
| EXPIRATION DATE | |
| 2016 |
| ($4,955,593 | ) |
| 2017 | (509,504) |
|
| 2018 | (2,611,900) |
|
| NO EXPIRATION DATE | |
| Long-term |
| ($844,503 | ) |
Under the Regulated Investment Company Modernization Act of 2010, capital losses incurred in taxable years beginning after December 22, 2010 can be carried forward to offset future capital gains for an unlimited period. These losses are required to be utilized prior to the losses incurred in pre-enactment taxable years and will retain their character as either long-term or short-term. Losses incurred in pre-enactment taxable years can be utilized until expiration. The Portfolio's use of net capital losses acquired from reorganizations may be limited under certain tax provisions.
The tax character of dividends and distributions paid during the years ended December 31, 2015 and December 31, 2014 was as follows:
|
| | | | | | |
| DISTRIBUTIONS PAID FROM: | 2015 | 2014 |
| Ordinary income |
| $652,135 |
|
| $7,913,642 |
|
| Long-term capital gains | 5,882,206 |
| 27,627,580 |
|
| Total |
| $6,534,341 |
|
| $35,541,222 |
|
As of December 31, 2015, the tax basis components of distributable earnings/(accumulated losses) and the federal tax cost were as follows:
|
| | | |
| Unrealized appreciation |
| $134,274,304 |
|
| Unrealized (depreciation) | (6,741,176) |
|
| Net unrealized appreciation (depreciation) |
| $127,533,128 |
|
| Undistributed ordinary income |
| $5,805,719 |
|
| Undistributed long-term capital gain |
| $4,379,993 |
|
| Capital loss carryforward |
| ($8,921,500 | ) |
| Federal income tax cost of investments |
| $220,676,785 |
|
www.calvert.com CALVERT VP S&P 500 INDEX PORTFOLIO ANNUAL REPORT 27
The differences between the components of distributable earnings on a tax basis and the amounts reflected in the Statement of Assets and Liabilities are primarily due to temporary book-tax differences that will reverse in a subsequent period. These differences are mainly due to wash sales, real estate investment trusts and Section 1256 futures contracts.
Reclassifications, as shown in the table below, have been made to the Portfolio's components of net assets to reflect income and gains available for distribution (or available capital loss carryovers, as applicable) under income tax law and regulations. These reclassifications are due to permanent book-tax differences and have no impact on net assets. The primary permanent differences causing such reclassifications for the Portfolio are due to real estate investment trusts.
|
| | | |
| Undistributed net investment income |
| ($122,816 | ) |
| Accumulated net realized gain (loss) | 3,427,791 |
|
| Paid-in capital | (3,304,975) |
|
NOTE D — LINE OF CREDIT
A financing agreement is in place with the Calvert Funds and State Street Corporation (“SSC”). Under the agreement, SSC provides an unsecured line of credit facility, in the aggregate amount of $50 million ($25 million committed and $25 million uncommitted), accessible by the Calvert Funds for temporary or emergency purposes only. Borrowings bear interest at the higher of the London Interbank Offered Rate (LIBOR) or the overnight Federal Funds Rate plus 1.25% per annum. A commitment fee of 0.20% per annum is incurred on the unused portion of the committed facility. An administrative fee of $25,000 was paid in connection with the uncommitted facility. These fees are allocated to all participating funds. The Portfolio had no borrowings under the agreement during the year ended December 31, 2015.
NOTE E — REORGANIZATION
On December 11, 2013, the Board of Directors approved an Agreement and Plan of Reorganization (the “Plan”), providing for the transfer of all of the assets of Calvert VP SRI Equity Portfolio (“Equity”) in exchange for shares of the acquiring portfolio, Calvert VP S&P 500 Index Portfolio (“S&P 500”) and the assumption of the liabilities of Equity.
Shareholders approved the Plan at a meeting on April 11, 2014 and the reorganization took place on April 30, 2014.
The acquisition was accomplished by a tax-free exchange of the following shares:
|
| | | | | | |
| Merged Portfolio | Shares | Acquiring Portfolio | Shares | Value |
| Equity | 414,513 | S&P 500 | 87,703 | $ | 9,936,888 |
|
For financial reporting purposes, assets received and shares issued by S&P 500 were recorded at fair value; however, the cost basis of the investments received from Equity were carried forward to align ongoing reporting of S&P 500’s realized and unrealized gains and losses with amounts distributable to shareholders for tax purposes.
The net assets and net unrealized appreciation (depreciation) immediately before the acquisition were as follows:
|
| | | | |
| | | Unrealized Appreciation | | |
| Merged Portfolio | Net Assets | (Depreciation) | Acquiring Portfolio | Net Assets |
| Equity | $9,936,888 | $3,099,235 | S&P 500 | $353,291,843 |
Assuming the acquisition had been completed on January 1, 2014, S&P 500’s results of operations for the year ended December 31, 2014 would have been as follows:
|
|
| Net investment income .................................................................................................$ 5,602,503 (a) |
| Net realized and change in unrealized gain (loss) on investments............................... $38,567,547 (b) |
| Net increase (decrease) in assets from operations........................................................ $44,170,050 |
Because S&P 500 and Equity sold and redeemed shares throughout the period, it is not practicable to provide pro-forma information on a per-share basis.
Because the combined investment portfolios have been managed as a single integrated portfolio since the acquisition was completed, it is also not practicable to separate the amounts of revenue and earnings of Equity that have been included in S&P 500’s Statement of Operations since April 30, 2014.
28 www.calvert.com CALVERT VP S&P 500 INDEX PORTFOLIO ANNUAL REPORT
(a) $5,595,559 as reported, plus $6,944 from Equity pre-merger.
(b) $38,626,622 as reported, plus ($59,075) from Equity pre-merger.
NOTE F — SUBSEQUENT EVENTS
In preparing the financial statements as of December 31, 2015, no subsequent events or transactions occurred that would have required recognition or disclosure in these financial statements.
NOTICE TO SHAREHOLDERS (UNAUDITED)
For the year ended December 31, 2015, the Portfolio considers 93.6% of the ordinary dividends paid during the year as eligible for the corporate dividends received deduction in accordance with Section 854 of the Internal Revenue Code and $5,882,206 of the long-term capital gain distributions paid during the year as capital gain dividends in accordance with Section 852(b)(3)(C) of the Internal Revenue Code.
www.calvert.com CALVERT VP S&P 500 INDEX PORTFOLIO ANNUAL REPORT 29
CALVERT VP S&P 500 INDEX PORTFOLIO
FINANCIAL HIGHLIGHTS
|
| | | | | | | | | | | | | | | | | | | | |
| | YEARS ENDED | |
| | December 31, 2015(a) | | December 31, 2014 | | December 31, 2013 | | December 31, 2012 | | December 31, 2011 | |
| Net asset value, beginning |
| $113.07 |
| |
| $110.62 |
| |
| $86.62 |
| |
| $76.32 |
| |
| $78.77 |
| |
| Income from investment operations: | | | | | | | | | | |
| Net investment income | 1.88 |
| | 1.94 |
| | 1.81 |
| | 1.63 |
| | 1.27 |
| |
| Net realized and unrealized gain (loss) | (0.74) |
| | 12.80 |
| | 25.72 |
| | 10.21 |
| | 0.11 |
| |
| Total from investment operations | 1.14 |
| | 14.74 |
| | 27.53 |
| | 11.84 |
| | 1.38 |
| |
| Distributions from: | | | | | | | | | | |
| Net investment income | (0.21) |
| | (1.95) |
| | (1.95) |
| | (1.54) |
| | (1.25) |
| |
| Net realized gain | (1.93) |
| | (10.34) |
| | (1.58) |
| | — |
| | (2.58) |
| |
| Total distributions | (2.14) |
| | (12.29) |
| | (3.53) |
| | (1.54) |
| | (3.83) |
| |
| Total increase (decrease) in net asset value | (1.00) |
| | 2.45 |
| | 24.00 |
| | 10.30 |
| | (2.45) |
| |
| Net asset value, ending |
| $112.07 |
| |
| $113.07 |
| |
| $110.62 |
| |
| $86.62 |
| |
| $76.32 |
| |
| Total return(b) | 0.98 | % | | 13.21 | % | | 31.87 | % | | 15.55 | % | | 1.73 | % | |
| Ratios to average net assets: (c) | | | | | | | | | | |
| Net investment income | 1.65 | % | | 1.59 | % | | 1.69 | % | | 1.90 | % | | 1.70 | % | |
| Total expenses | 0.46 | % | | 0.46 | % | | 0.48 | % | | 0.45 | % | | 0.46 | % | |
| Net expenses | 0.42 | % | | 0.42 | % | | 0.42 | % | | 0.41 | % | | 0.39 | % | |
| Portfolio turnover | 4 | % | | 9 | % | | 11 | % | | 5 | % | | 7 | % | |
| Net assets, ending (in thousands) |
| $347,965 |
| |
| $361,482 |
| |
| $353,688 |
| |
| $285,405 |
| |
| $259,068 |
| |
| | | | | | | | | | | |
| (a)Per share figures are calculated using the Average Shares Method. |
| (b)Total return is not annualized for periods of less than one year and does not reflect charges and expenses of the variable annuity or variable universal life contract. |
| (c)Total expenses do not reflect amounts reimbursed and/or waived by the Advisor and certain of its affiliates, if applicable. Net expenses are net of all reductions and represent the net expenses paid by the Portfolio. |
| See notes to financial statements. |
30 www.calvert.com CALVERT VP S&P 500 INDEX PORTFOLIO ANNUAL REPORT
PROXY VOTING
The Proxy Voting Guidelines that the Portfolio uses to determine how to vote proxies relating to portfolio securities is provided as an Appendix to the Fund’s Statement of Additional Information. The Statement of Additional Information can be obtained free of charge by calling the Fund at 1-800-368-2745, by visiting the Calvert website at www.calvert.com or by visiting the SEC’s website at www.sec.gov.
Information regarding how the Fund voted proxies relating to portfolio securities during the most recent 12-month period ended June 30 is available by calling the Fund, by visiting the Calvert website at www.calvert.com or visiting the SEC’s website at www.sec.gov.
AVAILABILITY OF QUARTERLY PORTFOLIO HOLDINGS
The Fund files its complete schedule of portfolio holdings with the SEC for the first and third quarters of each fiscal year on Form N-Q. The Fund’s Form N-Q is available on the SEC’s website at www.sec.gov. The Fund’s Form N-Q may be reviewed and copied at the SEC’s Public Reference Room in Washington, DC; information on the operation of the Public Reference Room may be obtained by calling 1-800-SEC-0330.
BASIS FOR BOARD'S APPROVAL OF INVESTMENT ADVISORY CONTRACTS
At a meeting held on December 9, 2015, the Board of Directors, and by a separate vote, the disinterested Directors, approved the continuance of the Investment Advisory Agreement between the Portfolio and the Advisor and the Investment Subadvisory Agreement between the Advisor and the Subadvisor with respect to the Portfolio.
In evaluating the Investment Advisory Agreement, the Board considered a variety of information relating to the Portfolio and the Advisor. The disinterested Directors reviewed a report prepared by the Advisor regarding various services provided to the Portfolio by the Advisor and its affiliates. Such report included, among other data, information regarding the Advisor's personnel and the Advisor's revenue and cost of providing services to the Portfolio, and a separate report prepared by an independent third party, which provided a statistical analysis comparing the Portfolio's investment performance, expenses, and fees to comparable mutual funds.
The disinterested Directors were separately represented by independent legal counsel with respect to their consideration of the reapproval of the Investment Advisory Agreement and the Investment Subadvisory Agreement. Prior to voting, the disinterested Directors reviewed the proposed continuance of the Investment Advisory Agreement and Investment Subadvisory Agreement with management and also met in private sessions with their counsel at which no representatives of management were present.
In the course of its deliberations regarding the Investment Advisory Agreement, the Board considered the following factors, among others: the nature, extent and quality of the services provided by the Advisor, including the personnel providing such services; the Advisor's financial condition; the level and method of computing the Portfolio's advisory fee; comparative performance, fee and expense information for the Portfolio; the profitability of the Calvert Family of Funds to the Advisor and its affiliates; the allocation of the Portfolio's brokerage, including the Advisor's process for monitoring "best execution"; the direct and indirect benefits, if any, derived by the Advisor and its affiliates from their relationship with the Portfolio; the effect of the Portfolio's growth and size on the Portfolio's performance and expenses; the Advisor's compliance programs and policies; the Advisor's performance of substantially similar duties for other funds; and any possible conflicts of interest.
In considering the nature, extent and quality of the services provided by the Advisor under the Investment Advisory Agreement, the Board reviewed information provided by the Advisor relating to its operations and personnel, including, among other information, biographical information on the Advisor's supervisory and professional staff and descriptions of its organizational and management structure. The Board also took into account similar information provided periodically throughout the previous year by the Advisor, as well as the Board’s familiarity with the Advisor’s management through Board of Directors' meetings, discussions and other reports. The Board considered the Advisor's current level of staffing and overall resources. The Board also noted that it reviewed on a quarterly basis information regarding the Advisor’s compliance with applicable policies and procedures, including those related to personal investing. The Advisor's administrative capabilities, including its ability to supervise the other service providers for the Portfolio, were also considered. The Board discussed the Advisor's effectiveness in monitoring the performance of the Subadvisor and its timeliness in responding to performance issues. The Board observed that the scope of services provided by the Advisor
www.calvert.com CALVERT VP S&P 500 INDEX PORTFOLIO ANNUAL REPORT (UNAUDITED) 31
generally had expanded over time as a result of regulatory, market and other changes. The Board took into consideration, among other factors, the effectiveness of the Portfolio’s and Advisor’s processes, policies and procedures and the Advisor’s personnel. The Board also took into account, among other items, periodic reports received from the Advisor over the past year concerning the Advisor’s ongoing review and enhancement of certain processes, policies and procedures of the Portfolio and the Advisor. The Board concluded that it was satisfied with the nature, extent and quality of services provided to the Portfolio by the Advisor under the Investment Advisory Agreement.
In considering the Portfolio's performance, the Board noted that it reviewed on a quarterly basis detailed information about the Portfolio's performance results, portfolio composition and investment strategies. In addition, the Board took into account overall financial market conditions. The Board also reviewed various comparative data provided to it in connection with its consideration of the renewal of the Investment Advisory Agreement, including, among other information, a comparison of the Portfolio's total return with its Lipper index and with that of other mutual funds deemed to be in its peer group by an independent third party in its report. This comparison indicated that the Portfolio performed below the median of its peer group for the one-, three- and five-year periods ended June 30, 2015. The data also indicated that the Portfolio underperformed its Lipper index for the one-, three- and five-year periods ended June 30, 2015. The Board took into account management’s discussion of the Portfolio’s performance, including the impact of differing fees and expenses among the funds in the peer group on the Portfolio’s relative performance. Based upon its review, the Board concluded that the Portfolio’s performance was satisfactory relative to the performance of passively-managed funds that track the same benchmark index as does the Portfolio.
In considering the Portfolio's fees and expenses, the Board compared the Portfolio's fees and total expense ratio with various comparative data for the funds in its peer group. Among other findings, the data indicated that the Portfolio's advisory fee (after taking into account expense reimbursements) was above the median of its peer group and that total expenses (net of expense reimbursements) were above the median of its peer group. The Board noted that the allocation of advisory and administrative fees may vary among the Portfolio’s peer group. The Board noted that the Advisor is currently reimbursing a portion of the Portfolio’s expenses. The Board also took into account the Advisor’s current undertaking to maintain expense limitations for the Portfolio. The Board noted that the Advisor paid the Subadvisor’s subadvisory fee under the Investment Subadvisory Agreement with respect to the Portfolio. The Board also took into account management's discussion of the Portfolio's expenses and certain factors that affected the level of such expenses, including the current size of the Portfolio. Based upon its review, the Board determined that the advisory fee was reasonable in view of the quality of services received by the Portfolio from the Advisor and the other factors considered.
The Board reviewed the Advisor’s profitability on a portfolio-by-portfolio basis. In reviewing the overall profitability of the advisory fee to the Portfolio's Advisor, the Board also considered the fact that affiliates of the Advisor provided shareholder servicing and administrative services to the Portfolio for which they received compensation. The information considered by the Board included Calvert’s operating profit margin information both before and after tax expenses with respect to the services that the Advisor and its affiliates provided to the Calvert Family of Funds complex. The Board reviewed the profitability of the Advisor's relationship with the Portfolio in terms of the total amount of annual advisory fees it received with respect to the Portfolio and whether the Advisor had the financial wherewithal to continue to provide services to the Portfolio. The Board also considered that the Advisor derived benefits to its reputation and other indirect benefits from its relationship with the Portfolio. In addition, the Board took into account that affiliates of the Advisor may benefit from certain indirect tax benefits relating to dividend received deductions and foreign tax credits. The Board also noted that the Advisor paid the subadvisory fee to the Subadvisor, an affiliate of the Advisor, and that the Advisor is currently reimbursing a portion of the expenses of the Portfolio. Based upon its review, the Board concluded that the Advisor’s and its affiliates’ level of profitability from their relationship with the Portfolio was reasonable.
The Board considered the effect of the Portfolio's current size and potential growth on its performance and fees. Although the Portfolio’s advisory fee did not contain breakpoints that would reduce the advisory fee rate on assets above specified asset levels, the Board noted that if the Portfolio’s assets increased over time, the Portfolio might realize other economies of scale if assets increased proportionally more than certain other expenses. The Board also noted that given the Portfolio’s current level of assets, the Portfolio would be unlikely to recognize economies of scale by implementing a breakpoint in the advisory fee at this time.
In reapproving the Investment Advisory Agreement, the Board, including the disinterested Directors, did not identify any single factor as controlling, and each Director may have attributed different weight to various factors.
32 www.calvert.com CALVERT VP S&P 500 INDEX PORTFOLIO ANNUAL REPORT (UNAUDITED)
In evaluating the Investment Subadvisory Agreement, the disinterested Directors reviewed information provided by the Subadvisor relating to its operations, personnel, investment philosophy, strategies and techniques. Among other information, the Subadvisor provided biographical information on portfolio management and other professional staff, performance information for itself, and descriptions of its investment philosophies, strategies and techniques, organizational and management structures and brokerage policies and practices.
The Board reapproved the Investment Subadvisory Agreement between the Subadvisor and the Advisor based on a number of factors relating to the Subadvisor's ability to perform under the Investment Subadvisory Agreement. In the course of its deliberations, the Board evaluated, among other factors: the nature, extent and the quality of the services to be provided by the Subadvisor; the Subadvisor's management style and long-term performance record; the Portfolio's performance record and the Subadvisor's performance in employing its investment strategies; the Subadvisor's current level of staffing and its overall resources; the qualifications and experience of the Subadvisor's personnel; the Subadvisor's financial condition with respect to its ability to perform the services required under the Investment Subadvisory Agreement; the Subadvisor's risk management processes; the Subadvisor's compliance systems, including those related to personal investing; and any disciplinary history. Based upon its review, the Board concluded that it was satisfied with the nature, extent and quality of services provided to the Portfolio by the Subadvisor under the Investment Subadvisory Agreement.
As noted above, the Board considered, among other information, the Portfolio's performance during the one-, three- and five-year periods ended June 30, 2015, as compared to the Portfolio's peer group and noted that it reviewed on a quarterly basis detailed information about the Portfolio's performance results, portfolio composition and investment strategies. The Board noted the Advisor's expertise and resources in monitoring the performance, investment style and risk adjusted performance of the Subadvisor.
In considering the cost of services to be provided by the Subadvisor and the profitability to the Subadvisor of its relationship with the Portfolio, the Board noted that the Advisor and Subadvisor were affiliated and the subadvisory fee under the Investment Subadvisory Agreement was paid by the Advisor out of the advisory fee that the Advisor received under the Investment Advisory Agreement. Based upon its review, the Board determined that the subadvisory fee was reasonable in view of the quality of services received by the Portfolio from the Subadvisor and the other factors considered. Because the Advisor would pay the Subadvisor’s subadvisory fee, the cost of services to be provided by the Subadvisor and the level of profitability to the Subadvisor from its relationship with the Portfolio were not material factors in the Board’s deliberations. For similar reasons, the Board did not consider the potential economies of scale in the Subadvisor’s management of the Portfolio to be a material factor in its consideration.
In reapproving the Investment Subadvisory Agreement, the Board, including the disinterested Directors, did not identify any single factor as controlling, and each Director may have attributed different weight to various factors.
Conclusions
The Board reached the following conclusions regarding the Investment Advisory Agreement and the Investment Subadvisory Agreement, among others: (a) the Advisor has demonstrated that it possesses the capability and resources to perform the duties required of it under the Investment Advisory Agreement; (b) the Subadvisor is qualified to manage the Portfolio's assets in accordance with the Portfolio’s investment objective and policies; (c) the Advisor and Subadvisor maintain appropriate compliance programs; (d) the Subadvisor is likely to execute its investment strategies consistently over time; (e) the performance of the Portfolio is satisfactory relative to the performance of passively-managed funds that track the same benchmark index as does the Portfolio; and (f) the Portfolio's advisory and subadvisory fees are reasonable in view of the quality of services received by the Portfolio from the Advisor and Subadvisor and the other factors considered. Based on its conclusions, the Board determined that reapproval of the Investment Advisory Agreement and the Investment Subadvisory Agreement would be in the best interests of the Portfolio and its shareholders.
www.calvert.com CALVERT VP S&P 500 INDEX PORTFOLIO ANNUAL REPORT (UNAUDITED) 33
DIRECTOR AND OFFICER INFORMATION TABLE
|
| | | | | |
| Name & Age | Position with Fund | Position Start Date | Principal Occupation During Last 5 Years | # of Calvert Portfolios Overseen | Other Directorships |
| INDEPENDENT DIRECTORS |
FRANK H. BLATZ, JR., Esq. AGE: 80 | Director | 1982 CVS
2008 CVP | Of counsel to firm of Schiller & Pittenger, P.C. | 13 | None |
ALICE GRESHAM BULLOCK AGE: 65 | Director | 1999 CVS
2008 CVP | Professor at Howard University School of Law. She is former Dean of Howard University School of Law and Deputy Director of the Association of American Law Schools. | 15 | None |
M. CHARITO KRUVANT AGE: 70 | Director | 1999 CVS
2008 CVP | President and CEO of Creative Associates International, Inc., a firm that specializes in human resources development, information management, public affairs and private enterprise development. | 22 | • Acacia Federal Savings Bank (through 2013) • Summit Foundation • WETA Public Broadcasting |
CYNTHIA MILLIGAN AGE: 69
| Director | 1999 CVS
2008 CVP | Dean Emeritus, College of Business Administration, University of Nebraska, Lincoln. She is former President and Chief Executive Officer for CMA, a consulting firm for financial institutions. | 15 | • Wells Fargo Company (banking and financial services) - NYSE • Wells Fargo Bank N.A. (Since 2014) • Gallup, Inc. (management consulting) • W.K. Kellogg Foundation • Raven Industries (technology company) - NASDAQ • Colonial Williamsburg Foundation • Kellogg Company (food manufacturing) - NYSE |
ARTHUR J. PUGH AGE: 78 | Director | 1982 CVS
2008 CVP | Retired executive. | 13 | None |
| INTERESTED DIRECTORS |
WILLIAM LESTER* AGE: 58 | Director & Chair (CVS)
Director & Senior Vice President (CVP) | 2004 CVS
2008 CVP | Executive Vice President Finance/Investments and Corporate Treasurer of Ameritas Mutual Holding Company. Chair and former President (resigned 2012) of Ameritas Investment Partners, Inc. | 13 | • Acacia Federal Savings Bank (through 2013)• Ameritas Investment Partners, Inc. (financial services)• Ameritas Investment Corp. (financial services)• Universal and Inland Insurance Companies• Bryan/LGH Health Systems |
34 www.calvert.com CALVERT VP S&P 500 INDEX PORTFOLIO ANNUAL REPORT (UNAUDITED)
|
| | | | | |
| Name & Age | Position with Fund | Position Start Date | Principal Occupation During Last 5 Years | # of Calvert Portfolios Overseen | Other Directorships |
| INTERESTED DIRECTORS |
JOHN H. STREUR* AGE: 56
| President (CVS)
Director, Chair & President (CVP) | 2015 | President and Chief Executive Officer of Calvert Investments, Inc. (since January 2015) and Chief Compliance Officer for the Advisor and Calvert Investment Distributors, Inc. (since August 10, 2015); President and Director, Portfolio 21 Investments, Inc. (through October 2014); President, Chief Executive Officer and Director, Managers Investment Group LLC (through January 2012); President and Director, The Managers Funds and Managers AMG Funds (through January 2012). | 40 | • Portfolio 21 Investments, Inc. (asset management)(through October 2014) • Managers Investment Group LLC (asset management)(through January 2012) • The Managers Funds (asset management) (through January 2012) • Managers AMG Funds (asset management) (through January 2012) • Calvert Social Investment Foundation |
|
| | | |
| Name & Age | Position with Fund | Position Start Date | Principal Occupation During Last 5 Years |
| OFFICERS |
VICKI L. BENJAMIN AGE: 54 | Treasurer | 2015 | Executive Vice President, Chief Financial Officer and Chief Operating Officer of Calvert Investments, Inc. since October 2015; Senior Vice President and Chief Financial Officer of Calvert Investments, Inc. (March 2015 - September 2015). Prior to Calvert, Ms. Benjamin was a Senior Partner at KPMG. |
ROBERT D. BENSON, ESQ. AGE: 37 | Assistant Vice President & Assistant Secretary | 2014 | Assistant General Counsel (since 2014), Assistant Vice President & Assistant Secretary (since 2015) and Staff Attorney (prior to 2014), Calvert Investments, Inc. |
HOPE BROWN AGE: 42 | Chief Compliance Officer | 2014 | Chief Compliance Officer for the Calvert Funds (since 2014). Vice President and Chief Compliance Officer, Wilmington Funds (2012-2014). Vice President and Senior Compliance Officer, Wilmington Trust Investment Advisors, Inc. (2010-2012). |
STU DALHEIM AGE: 46 | Vice President | 2015 | Vice President - Shareholder Advocacy for the Advisor. |
MATTHEW DUCH Age: 40 | Vice President | 2011 | Vice President of the Advisor and portfolio manager for Calvert’s taxable fixed-income funds. |
ROBERT J. ENDERSON, CFA AGE: 57 | Assistant Treasurer | 2014 | Vice President, Corporate Finance, of Calvert Investments, Inc.; Acting Chief Financial Officer of Calvert Investments, Inc. (September 2014 - March 2015). |
PATRICK FAUL AGE: 51 | Vice President | 2010 | Vice President and Head of Credit Research for the Advisor. |
TRACI L. GOLDT AGE: 42 | Assistant Secretary | 2004 | SEC Filing and Administrative Operations Manager, Calvert Investments, Inc. |
JADE HUANG AGE: 41 | Vice President | 2015 | Equity Portfolio Manager since November 2015 and Senior Equity Analyst prior to November 2015, Advisor. |
EMILY KAISER AGE: 32 | Assistant Vice President | 2015 | Senior Sustainability Analyst since November 2015 and Sustainability Analyst (January 2014 - October 2015), Advisor. Prior to joining Calvert, Ms. Kaiser attended law school from 2010 to 2013 and also held legal and policy positions with the U.S. Agency for International Development (2013), the Solidarity Center, AFL-CIO (2013), the U.S. Department of Labor (2012), the office of the U.S. Trade Representative (2012) and the Public International Law and Policy Group (2011-2012). |
VISHAL KHANDUJA, CFA AGE: 37 | Vice President | 2014 | Head of Taxable Fixed Income (since 2015) and Vice President of the Advisor (since 2014); Portfolio Manager for Calvert’s taxable fixed-income funds since 2012. Previously worked at Columbia Management as Portfolio Manager - Global Rates and Currency Team (2009-2012). |
www.calvert.com CALVERT VP S&P 500 INDEX PORTFOLIO ANNUAL REPORT (UNAUDITED) 35
|
| | | |
| Name & Age | Position with Fund | Position Start Date | Principal Occupation During Last 5 Years |
| OFFICERS |
LANCELOT A. KING, ESQ. AGE: 45 | Assistant Vice President & Secretary | 2002 | Assistant Vice President, Assistant Secretary and Associate General Counsel of Calvert Investments, Inc. |
ERICA LASDON AGE: 44 | Assistant Vice President | 2015 | Director of Sustainability Research since August 2015 and Senior Sustainability Analyst and Manager prior to August 2015, Advisor. |
JOSHUA LINDER AGE: 30 | Vice President | 2015 | Equity Portfolio Manager since November 2015, Assistant Portfolio Manager (January 2014 - October 2015) and Equity Analyst (2011 - 2013), Advisor. |
CHRISTOPHER MADDEN AGE: 40 | Vice President | 2015 | Equity Portfolio Manager since November 2015 and Senior Equity Analyst prior to November 2015, Advisor. |
ANDREW K. NIEBLER, ESQ. AGE: 48 | Assistant Vice President & Assistant Secretary | 2006 | Assistant Vice President, Assistant Secretary and Associate General Counsel of Calvert Investments, Inc. |
MARYBETH PILAT, CPA AGE: 47 | Fund Controller and Assistant Treasurer | 2015 | Director of Fund Administration, Calvert Investment Administrative Services, Inc. since August 2015. VP Expense & Budgeting, Global Fiduciary Platform, Legg Mason (May 2015 - July 2015). Vice President and Assistant Treasurer, Columbia Funds, Ameriprise, Columbia Management (2010 - April 2015). |
| |
| * | The address of Directors and Officers is 4550 Montgomery Avenue, Suite 1000N, Bethesda, Maryland 20814. Mr. Streur is an interested person of the Fund since he is an officer and director of the Fund’s Advisor and its affiliates. Mr. Lester is an interested person of the Fund since he is an officer and director of the parent company of the Fund’s Advisor. |
Additional information about the Fund’s Directors can be found in the Statement of Additional Information (SAI). You can get a free copy of the SAI by contacting your broker, or the Fund at 1-800-368-2745.
36 www.calvert.com CALVERT VP S&P 500 INDEX PORTFOLIO ANNUAL REPORT (UNAUDITED)
|
| |
| | |
This report is intended to provide fund information to shareholders. It is not authorized for distribution to prospective investors unless preceded or accompanied by a prospectus. Note: The information on our website is not incorporated by reference into this report; our website address is included as an inactive textual reference only. Investors should carefully consider the investment objectives, risks, charges and expenses of the Calvert Funds. This and other important information is contained in the fund’s summary prospectus and prospectus, which can be obtained from your financial professional and should be read carefully before investing. You may also call Calvert at 800/368-2745. |
| Printed on recycled paper using soy inks. | |
|
| |
|
Calvert VP S&P MidCap 400 Index Portfolio |
Annual Report December 31, 2015 | |
|
| | | | |
| | TABLE OF CONTENTS |
| | | | | |
| | | | | Portfolio Management Discussion |
| | | | | Understanding Your Fund's Expenses |
| | | | | Report of Independent Registered Public Accounting Firm |
| | | | | Schedule of Investments |
| | | | | Statement of Assets and Liabilities |
| | | | | Statement of Operations |
| | | | | Statements of Changes in Net Assets |
| | | | | Notes to Financial Statements |
| | | | | Financial Highlights |
| | | | | Proxy Voting |
| | | | | Availability of Quarterly Portfolio Holdings |
| | | | | Basis for Board’s Approval of Investment Advisory Contracts |
| | | | | Director and Officer Information Table |
|
| |
| PORTFOLIO MANAGEMENT DISCUSSION |
|
| |
| Kevin Keene Ameritas Investment Partners, Inc. |
Market Review
The broad domestic equity market was largely unchanged for 2015 as the market grappled with competing economic forces. The first six months of the year were marked by generally calm equity markets and the last six months saw a significant increase in volatility. After much speculation and anticipation, the Federal Reserve increased short-term interest rates in December for the first time in nearly 10 years. Turmoil in Chinese markets finally spread across the globe as the Standard & Poor's (S&P) MidCap 400 Index lost 10% over a six week period. Domestic economic data has been generally positive, if not robust. Unemployment stands at nearly 5% at year-end; however gross domestic product (GDP) growth has been weak by historical recovery standards.
Investment Strategy and Technique:
As an index fund the Calvert VP S&P MidCap 400 Index Portfolio (the Portfolio) seeks as closely as possible to replicate the holdings and match the performance of the S&P MidCap 400 Index. In pursuit of this objective, the Portfolio employs a passive management approach and holds each member of the index. Cash holdings gain exposure to the index via futures contracts so that 100% of the Portfolio’s assets are fully invested.
Fund Performance Relative to the Benchmark
For the year ended December 31, 2015, the Portfolio’s Class I shares returned -2.68% compared with -2.18% for the Standard & Poor’s (S&P) MidCap 400 Index. The underperformance relative to the Index was largely attributable to fees and operating expenses, which the Index does not incur. The Portfolio continued to meet its objective by closely tracking the Index. Midcap stocks underperformed the broad equity market as the consumer discretionary and consumer staples sectors within the midcap universe significantly underperformed these sectors in the broad equity market.
|
| | | |
| ECONOMIC SECTORS | % OF TOTAL INVESTMENTS | |
| Financials | 25.6 | % | |
| Information Technology | 15.8 | % | |
| Industrials | 14.3 | % | |
| Consumer Discretionary | 12.1 | % | |
| Health Care | 9.3 | % | |
| Materials | 6.1 | % | |
| Utilities | 4.8 | % | |
| Short-Term Investments | 3.7 | % | |
| Consumer Staples | 3.3 | % | |
| Energy | 2.8 | % | |
| Exchange-Traded Products | 1.6 | % | |
| Government | 0.4 | % | |
| Telecommunication Services | 0.2 | % | |
| Total | 100.0 | % | |
| | | |
| TEN LARGEST STOCK HOLDINGS | % OF NET ASSETS | |
| Jarden Corp. | 0.8 | % | |
| Extra Space Storage, Inc. | 0.7 | % | |
| Acuity Brands, Inc. | 0.7 | % | |
| Alaska Air Group, Inc. | 0.7 | % | |
| Federal Realty Investment Trust | 0.6 | % | |
| UDR, Inc. | 0.6 | % | |
| Hologic, Inc. | 0.6 | % | |
| Mettler-Toledo International, Inc. | 0.6 | % | |
| LKQ Corp. | 0.6 | % | |
| Foot Locker, Inc. | 0.6 | % | |
| Total | 6.5 | % | |
| | | |
Positioning and Market Outlook
Entering 2016, the outlook for equities is mixed. The economy continues to expand modestly and headline employment is nearing peak levels. With the Federal Reserve increasing interest rates for the first time in almost a decade, it is giving the economy a vote of confidence.
www.calvert.com CALVERT VP S&P MIDCAP 400 INDEX PORTFOLIO ANNUAL REPORT (UNAUDITED) 1
However, there is no shortage of risk as we enter the new year. The bull market that began in 2009 is starting to show its age as questions arise over its ability to continue now that the Federal Reserve has essentially taken its foot off the gas. Commodity price declines continue to point to weak global growth, which will be a headwind to new highs in the stock market.
Ameritas Investment Partners, Inc.
December 2015
2 www.calvert.com CALVERT VP S&P MIDCAP 400 INDEX PORTFOLIO ANNUAL REPORT (UNAUDITED)
Growth of $10,000
The graph below shows the value of a hypothetical $10,000 investment in the Portfolio over the past 10 fiscal year periods. The results shown are for Class I shares, and assume the reinvestment of dividends. The result is compared with a broad based market index. Market indexes are unmanaged and their results do not reflect the effect of expenses or sales charges. The value of an investment in a different share class would be different.
|
| | | | | | |
| CALVERT VP S&P MIDCAP 400 INDEX PORTFOLIO |
| DECEMBER 31, 2015 |
| AVERAGE ANNUAL TOTAL RETURNS | 1 Year | 5 Year | 10 Year |
| Class I | -2.68 | % | 10.12 | % | 7.59 | % |
| Class F | -2.90 | % | 9.85 | % | 7.35 | % |
| S&P MidCap 400 Index | -2.18 | % | 10.68 | % | 8.18 | % |
| | | | |
| Class F share performance prior to October 1, 2007 is based on Class I performance, adjusted to reflect Class F expenses. |
| | | | |
The performance data shown represents past performance, does not guarantee future results and assumes reinvestment of all dividends and distributions. All performance data reflects fee waivers and/or expense limitations, if any are in effect; in their absence performance would be lower. See Note B in Notes to Financial Statements. The investment return and principal value of an investment will fluctuate so that an investor’s shares, when redeemed, may be worth more or less than their original cost. Current performance may be lower or higher than the performance data quoted.
Visit calvert.com/institutional-VP-performance.html for current performance data. The gross expense ratio from the current prospectus for the Portfolio is 0.53%. This number may vary from the expense ratio shown elsewhere in this report because it is based on a different time period and, if applicable, does not include fee or expense waivers. The performance data and expense ratio reflect deduction of Portfolio operating expenses, but do not reflect charges and expenses imposed under the variable annuity or life insurance contract.
www.calvert.com CALVERT VP S&P MIDCAP 400 INDEX PORTFOLIO ANNUAL REPORT (UNAUDITED) 3
UNDERSTANDING YOUR FUND'S EXPENSES
As an investor, you incur two types of costs. There are transaction costs. There are also ongoing costs, which generally include management fees, distribution and/or service fees, and other fund expenses. The following information is intended to help you understand your ongoing costs (in dollars) of investing in this mutual fund and to help you compare these costs with the ongoing costs of investing in other mutual funds.
To illustrate these ongoing costs, we have provided examples and calculated the expenses paid by the fund's investors during the period. The actual and hypothetical information presented in the examples is based on an investment of $1,000 invested at the beginning of the period and held for the entire period (July 1, 2015 to December 31, 2015).
Note: Expenses do not reflect charges and expenses of the variable annuity or variable universal life contract.
Actual Expenses
The first line of the table below provides information about actual account values and actual expenses. You may use the information in this line, together with the amount you invested, to estimate the expenses that you paid over the period. Simply divide your account value by $1,000 (for example, an $8,600 account value divided by $1,000 = 8.6), then multiply the result by the number in the first line under the heading entitled “Expenses Paid During Period” to estimate the expenses you paid on your account during this period.
Hypothetical Example for Comparison Purposes
The second line of the table below provides information about hypothetical account values and hypothetical expenses based on the Fund’s actual expense ratio and an assumed rate of return of 5% per year before expenses, which is not the Fund’s actual return. The hypothetical account values and expenses may not be used to estimate the actual ending account balance or expenses you paid for the period. You may use this information to compare the ongoing costs of investing in the Fund and other funds. To do so, compare the 5% hypothetical example with the 5% hypothetical examples that appear in the shareholder reports of the other funds.
Please note that the expenses shown in the table are meant to highlight your ongoing costs only and do not reflect any transactional costs. Therefore, the second line of the table is useful in comparing ongoing costs only, and will not help you determine the relative total costs of owning different funds. In addition, if these transactional costs were included, your costs would have been higher.
|
| | | | |
| | ANNUALIZED
EXPENSE RATIO | BEGINNING
ACCOUNT VALUE
7/1/15 | ENDING
ACCOUNT VALUE
12/31/15 | EXPENSES PAID
DURING PERIOD*
7/1/15 - 12/31/15 |
| Class I | | | | |
| Actual | 0.55% | $1,000.00 | $936.40 | $2.68 |
| Hypothetical (5% return per year before expenses) | 0.55% | $1,000.00 | $1,022.43 | $2.80 |
| Class F | | | | |
| Actual | 0.77% | $1,000.00 | $935.40 | $3.76 |
| Hypothetical (5% return per year before expenses) | 0.77% | $1,000.00 | $1,021.32 | $3.92 |
| |
| * Expenses paid during the period are equal to the annualized expense ratio for each class as indicated above, multiplied by the average account value over the period, multiplied by 184/365 (to reflect the one-half year period). Expense ratios shown in the Financial Highlights represent the actual expenses incurred for the fiscal year. |
4 www.calvert.com CALVERT VP S&P MIDCAP 400 INDEX PORTFOLIO ANNUAL REPORT (UNAUDITED)
REPORT OF INDEPENDENT REGISTERED PUBLIC ACCOUNTING FIRM
The Board of Directors of Calvert Variable Products, Inc. and Shareholders of Calvert VP S&P MidCap 400 Index Portfolio:
We have audited the accompanying statement of assets and liabilities, including the schedule of investments, of the Calvert VP S&P MidCap 400 Index Portfolio (the “Portfolio”), a series of Calvert Variable Products, Inc., as of December 31, 2015, and the related statement of operations for the year then ended, the statements of changes in net assets for each of the years in the two-year period then ended, and the financial highlights for each of the years in the five-year period then ended. These financial statements and financial highlights are the responsibility of the Portfolio’s management. Our responsibility is to express an opinion on these financial statements and financial highlights based on our audits.
We conducted our audits in accordance with the standards of the Public Company Accounting Oversight Board (United States). Those standards require that we plan and perform the audit to obtain reasonable assurance about whether the financial statements and financial highlights are free of material misstatement. An audit includes examining, on a test basis, evidence supporting the amounts and disclosures in the financial statements. Our procedures included confirmation of securities owned as of December 31, 2015, by correspondence with the custodian and brokers or by performing other appropriate auditing procedures. An audit also includes assessing the accounting principles used and significant estimates made by management, as well as evaluating the overall financial statement presentation. We believe that our audits provide a reasonable basis for our opinion.
In our opinion, the financial statements and financial highlights referred to above present fairly, in all material respects, the financial position of the Portfolio as of December 31, 2015, the results of its operations for the year then ended, the changes in its net assets for each of the years in the two-year period then ended, and the financial highlights for each of the years in the five-year period then ended, in conformity with U.S. generally accepted accounting principles.
Philadelphia, Pennsylvania
February 24, 2016
www.calvert.com CALVERT VP S&P MIDCAP 400 INDEX PORTFOLIO ANNUAL REPORT 5
CALVERT VP S&P MIDCAP 400 INDEX PORTFOLIO
SCHEDULE OF INVESTMENTS
DECEMBER 31, 2015
|
| | | | |
| | SHARES | VALUE ($) |
| COMMON STOCKS - 94.2% | | |
| Aerospace & Defense - 1.6% | | |
| B/E Aerospace, Inc. | 15,929 | 674,912 |
|
| Esterline Technologies Corp. * | 4,463 | 361,503 |
|
| Huntington Ingalls Industries, Inc. | 7,090 | 899,366 |
|
| KLX, Inc. * | 7,791 | 239,885 |
|
| Orbital ATK, Inc. | 8,914 | 796,377 |
|
| Teledyne Technologies, Inc. * | 5,301 | 470,199 |
|
| Triumph Group, Inc. | 7,466 | 296,773 |
|
| | | 3,739,015 |
|
| | | |
| Airlines - 1.1% | | |
| Alaska Air Group, Inc. | 19,126 | 1,539,834 |
|
| JetBlue Airways Corp. * | 47,290 | 1,071,119 |
|
| | | 2,610,953 |
|
| | | |
| Auto Components - 0.4% | | |
| Dana Holding Corp. | 23,076 | 318,449 |
|
| Gentex Corp. | 44,389 | 710,668 |
|
| | | 1,029,117 |
|
| | | |
| Automobiles - 0.2% | | |
| Thor Industries, Inc. | 6,863 | 385,357 |
|
| | | |
| Banks - 5.2% | | |
| Associated Banc-Corp. | 22,871 | 428,831 |
|
| BancorpSouth, Inc. | 12,836 | 307,936 |
|
| Bank of Hawaii Corp. | 6,450 | 405,705 |
|
| Bank of the Ozarks, Inc. | 12,275 | 607,121 |
|
| Cathay General Bancorp | 11,540 | 361,548 |
|
| Commerce Bancshares, Inc. | 12,661 | 538,595 |
|
| Cullen/Frost Bankers, Inc. | 8,259 | 495,540 |
|
| East West Bancorp, Inc. | 21,580 | 896,865 |
|
| First Horizon National Corp. | 36,122 | 524,491 |
|
| First Niagara Financial Group, Inc. | 52,709 | 571,893 |
|
| FirstMerit Corp. | 24,625 | 459,256 |
|
| Fulton Financial Corp. | 26,495 | 344,700 |
|
| Hancock Holding Co. | 11,680 | 293,986 |
|
| International Bancshares Corp. | 8,718 | 224,053 |
|
| PacWest Bancorp | 16,981 | 731,881 |
|
| Prosperity Bancshares, Inc. | 9,890 | 473,335 |
|
| Signature Bank * | 7,622 | 1,168,986 |
|
| SVB Financial Group * | 7,772 | 924,091 |
|
| Synovus Financial Corp. | 19,974 | 646,758 |
|
| TCF Financial Corp. | 25,330 | 357,660 |
|
| Trustmark Corp. | 9,915 | 228,442 |
|
6 www.calvert.com CALVERT VP S&P MIDCAP 400 INDEX PORTFOLIO ANNUAL REPORT
|
| | | | |
| | SHARES | VALUE ($) |
| COMMON STOCKS - Cont'd | | |
| Umpqua Holdings Corp. | 33,130 | 526,767 |
|
| Valley National Bancorp | 33,459 | 329,571 |
|
| Webster Financial Corp. | 13,613 | 506,267 |
|
| | | 12,354,278 |
|
| | | |
| Beverages - 0.1% | | |
| Boston Beer Company, Inc. (The), Class A * | 1,457 | 294,183 |
|
| | | |
| Biotechnology - 0.5% | | |
| United Therapeutics Corp. * | 6,841 | 1,071,369 |
|
| | | |
| Building Products - 1.3% | | |
| A.O. Smith Corp. | 11,285 | 864,544 |
|
| Fortune Brands Home & Security, Inc. | 24,103 | 1,337,716 |
|
| Lennox International, Inc. | 6,020 | 751,898 |
|
| | | 2,954,158 |
|
| | | |
| Capital Markets - 1.9% | | |
| Eaton Vance Corp. | 17,803 | 577,351 |
|
| Federated Investors, Inc., Class B | 14,328 | 410,497 |
|
| Janus Capital Group, Inc. | 21,978 | 309,670 |
|
| Raymond James Financial, Inc. | 19,103 | 1,107,401 |
|
| SEI Investments Co. | 20,932 | 1,096,837 |
|
| Stifel Financial Corp. * | 10,430 | 441,815 |
|
| Waddell & Reed Financial, Inc., Class A | 12,562 | 360,027 |
|
| WisdomTree Investments, Inc. | 17,211 | 269,868 |
|
| | | 4,573,466 |
|
| | | |
| Chemicals - 2.9% | | |
| Albemarle Corp. | 16,860 | 944,329 |
|
| Ashland, Inc. | 9,570 | 982,839 |
|
| Cabot Corp. | 9,557 | 390,690 |
|
| Chemours Co. (The) | 27,100 | 145,256 |
|
| Minerals Technologies, Inc. | 5,208 | 238,839 |
|
| NewMarket Corp. | 1,520 | 578,710 |
|
| Olin Corp. | 25,266 | 436,091 |
|
| PolyOne Corp. | 13,023 | 413,610 |
|
| RPM International, Inc. | 19,977 | 880,187 |
|
| Scotts Miracle-Gro Co. (The), Class A | 6,810 | 439,313 |
|
| Sensient Technologies Corp. | 6,825 | 428,746 |
|
| Valspar Corp. (The) | 11,034 | 915,270 |
|
| | | 6,793,880 |
|
| | | |
| Commercial Services & Supplies - 1.6% | | |
| Clean Harbors, Inc. * | 8,020 | 334,033 |
|
| Copart, Inc. * | 15,364 | 583,986 |
|
| Deluxe Corp. | 7,500 | 409,050 |
|
| Herman Miller, Inc. | 8,745 | 250,981 |
|
| HNI Corp. | 6,671 | 240,556 |
|
| MSA Safety, Inc. | 4,650 | 202,136 |
|
| Rollins, Inc. | 14,235 | 368,686 |
|
| RR Donnelley & Sons Co. | 31,187 | 459,073 |
|
www.calvert.com CALVERT VP S&P MIDCAP 400 INDEX PORTFOLIO ANNUAL REPORT 7
|
| | | | |
| | SHARES | VALUE ($) |
| COMMON STOCKS - Cont'd | | |
| Travel Centers of America LLC (a) | 60,000 | — |
|
| Waste Connections, Inc. | 18,438 | 1,038,428 |
|
| | | 3,886,929 |
|
| | | |
| Communications Equipment - 1.0% | | |
| ARRIS Group, Inc. * | 20,259 | 619,317 |
|
| Ciena Corp. * | 18,972 | 392,531 |
|
| InterDigital, Inc. | 5,497 | 269,573 |
|
| NetScout Systems, Inc. * | 15,132 | 464,552 |
|
| Plantronics, Inc. | 5,083 | 241,036 |
|
| Polycom, Inc. * | 20,274 | 255,250 |
|
| | | 2,242,259 |
|
| | | |
| Construction & Engineering - 0.5% | | |
| AECOM * | 22,549 | 677,146 |
|
| Granite Construction, Inc. | 5,915 | 253,813 |
|
| KBR, Inc. | 21,492 | 363,645 |
|
| | | 1,294,604 |
|
| | | |
| Construction Materials - 0.2% | | |
| Eagle Materials, Inc. | 7,532 | 455,159 |
|
| | | |
| Consumer Finance - 0.2% | | |
| SLM Corp. * | 63,661 | 415,070 |
|
| | | |
| Containers & Packaging - 1.4% | | |
| AptarGroup, Inc. | 9,371 | 680,803 |
|
| Bemis Co., Inc. | 14,684 | 656,228 |
|
| Greif, Inc., Class A | 3,861 | 118,957 |
|
| Packaging Corp. of America | 14,617 | 921,602 |
|
| Silgan Holdings, Inc. | 6,077 | 326,457 |
|
| Sonoco Products Co. | 15,137 | 618,649 |
|
| | | 3,322,696 |
|
| | | |
| Distributors - 0.6% | | |
| LKQ Corp. * | 46,107 | 1,366,150 |
|
| | | |
| Diversified Consumer Services - 0.7% | | |
| DeVry Education Group, Inc. | 8,485 | 214,756 |
|
| Graham Holdings Co., Class B | 666 | 322,990 |
|
| Service Corp. International | 29,658 | 771,701 |
|
| Sotheby's | 9,274 | 238,898 |
|
| | | 1,548,345 |
|
| | | |
| Diversified Financial Services - 1.5% | | |
| CBOE Holdings, Inc. | 12,517 | 812,353 |
|
| FactSet Research Systems, Inc. | 6,221 | 1,011,348 |
|
| MarketAxess Holdings, Inc. | 5,600 | 624,904 |
|
| MSCI, Inc. | 13,915 | 1,003,689 |
|
| | | 3,452,294 |
|
| | | |
8 www.calvert.com CALVERT VP S&P MIDCAP 400 INDEX PORTFOLIO ANNUAL REPORT
|
| | | | |
| | SHARES | VALUE ($) |
| COMMON STOCKS - Cont'd | | |
| Electric Utilities - 1.8% | | |
| Cleco Corp. | 8,989 | 469,316 |
|
| Great Plains Energy, Inc. | 23,175 | 632,909 |
|
| Hawaiian Electric Industries, Inc. | 16,107 | 466,298 |
|
| IDACORP, Inc. | 7,491 | 509,388 |
|
| OGE Energy Corp. | 29,988 | 788,384 |
|
| PNM Resources, Inc. | 11,788 | 360,359 |
|
| Westar Energy, Inc. | 21,332 | 904,690 |
|
| | | 4,131,344 |
|
| | | |
| Electrical Equipment - 1.2% | | |
| Acuity Brands, Inc. | 6,608 | 1,544,950 |
|
| Hubbell, Inc. | 8,197 | 828,225 |
|
| Regal-Beloit Corp. | 6,721 | 393,313 |
|
| | | 2,766,488 |
|
| | | |
| Electronic Equipment & Instruments - 3.6% | | |
| Arrow Electronics, Inc. * | 14,116 | 764,805 |
|
| Avnet, Inc. | 19,924 | 853,544 |
|
| Belden, Inc. | 6,395 | 304,914 |
|
| Cognex Corp. | 13,065 | 441,205 |
|
| FEI Co. | 6,166 | 491,985 |
|
| Ingram Micro, Inc., Class A | 23,431 | 711,834 |
|
| IPG Photonics Corp. * | 5,497 | 490,113 |
|
| Jabil Circuit, Inc. | 28,567 | 665,326 |
|
| Keysight Technologies, Inc. * | 25,658 | 726,891 |
|
| Knowles Corp. * | 13,274 | 176,942 |
|
| National Instruments Corp. | 15,217 | 436,576 |
|
| SYNNEX Corp. | 4,430 | 398,390 |
|
| Tech Data Corp. * | 5,306 | 352,212 |
|
| Trimble Navigation Ltd. * | 37,805 | 810,917 |
|
| Vishay Intertechnology, Inc. | 20,202 | 243,434 |
|
| Zebra Technologies Corp., Class A * | 7,756 | 540,205 |
|
| | | 8,409,293 |
|
| | | |
| Energy Equipment & Services - 1.2% | | |
| Atwood Oceanics, Inc. | 8,854 | 90,576 |
|
| Dril-Quip, Inc. * | 5,803 | 343,712 |
|
| Nabors Industries Ltd. | 43,506 | 370,236 |
|
| Noble Corp. plc | 36,100 | 380,855 |
|
| Oceaneering International, Inc. | 14,807 | 555,559 |
|
| Oil States International, Inc. * | 7,736 | 210,806 |
|
| Patterson-UTI Energy, Inc. | 22,015 | 331,986 |
|
| Rowan Co.'s plc, Class A | 18,600 | 315,270 |
|
| Superior Energy Services, Inc. | 22,560 | 303,883 |
|
| | | 2,902,883 |
|
| | | |
| Food & Staples Retailing - 0.5% | | |
| Casey's General Stores, Inc. | 5,887 | 709,089 |
|
| SUPERVALU, Inc. * | 39,793 | 269,797 |
|
| United Natural Foods, Inc. * | 7,517 | 295,869 |
|
| | | 1,274,755 |
|
www.calvert.com CALVERT VP S&P MIDCAP 400 INDEX PORTFOLIO ANNUAL REPORT 9
|
| | | | |
| | SHARES | VALUE ($) |
| COMMON STOCKS - Cont'd | | |
| Food Products - 2.1% | | |
| Dean Foods Co. | 13,920 | 238,728 |
|
| Flowers Foods, Inc. | 28,178 | 605,545 |
|
| Hain Celestial Group, Inc. (The) * | 15,385 | 621,400 |
|
| Ingredion, Inc. | 10,749 | 1,030,184 |
|
| Lancaster Colony Corp. | 2,854 | 329,523 |
|
| Post Holdings, Inc. * | 9,370 | 578,129 |
|
| Tootsie Roll Industries, Inc. | 2,685 | 84,819 |
|
| TreeHouse Foods, Inc. * | 6,433 | 504,733 |
|
| WhiteWave Foods Co. (The) * | 26,594 | 1,034,773 |
|
| | | 5,027,834 |
|
| | | |
| Gas Utilities - 1.6% | | |
| Atmos Energy Corp. | 15,320 | 965,773 |
|
| National Fuel Gas Co. | 12,668 | 541,557 |
|
| ONE Gas, Inc. | 7,886 | 395,641 |
|
| Questar Corp. | 26,382 | 513,921 |
|
| UGI Corp. | 25,975 | 876,916 |
|
| WGL Holdings, Inc. | 7,475 | 470,850 |
|
| | | 3,764,658 |
|
| | | |
| Health Care Equipment & Supplies - 4.1% | | |
| Align Technology, Inc. * | 10,921 | 719,148 |
|
| Cooper Co.'s, Inc. (The) | 7,337 | 984,625 |
|
| Halyard Health, Inc. * | 7,000 | 233,870 |
|
| Hill-Rom Holdings, Inc. | 8,521 | 409,519 |
|
| Hologic, Inc. * | 37,147 | 1,437,217 |
|
| IDEXX Laboratories, Inc. * | 13,821 | 1,007,827 |
|
| LivaNova plc * | 6,350 | 377,000 |
|
| ResMed, Inc. | 21,129 | 1,134,416 |
|
| Sirona Dental Systems, Inc. * | 8,352 | 915,129 |
|
| STERIS plc | 12,955 | 976,030 |
|
| Teleflex, Inc. | 6,230 | 818,934 |
|
| West Pharmaceutical Services, Inc. | 10,800 | 650,376 |
|
| | | 9,664,091 |
|
| | | |
| Health Care Providers & Services - 2.7% | | |
| Amsurg Corp. * | 8,100 | 615,600 |
|
| Centene Corp. * | 17,862 | 1,175,498 |
|
| Community Health Systems, Inc. * | 17,699 | 469,555 |
|
| Health Net, Inc. * | 11,567 | 791,877 |
|
| LifePoint Health, Inc. * | 6,624 | 486,202 |
|
| Mednax, Inc. * | 14,132 | 1,012,699 |
|
| Molina Healthcare, Inc. * | 6,147 | 369,619 |
|
| Owens & Minor, Inc. | 9,333 | 335,801 |
|
| VCA, Inc. * | 12,190 | 670,450 |
|
| WellCare Health Plans, Inc. * | 6,604 | 516,499 |
|
| | | 6,443,800 |
|
| | | |
| Health Care Technology - 0.2% | | |
| Allscripts Healthcare Solutions, Inc. * | 28,379 | 436,469 |
|
| | | |
10 www.calvert.com CALVERT VP S&P MIDCAP 400 INDEX PORTFOLIO ANNUAL REPORT
|
| | | | |
| | SHARES | VALUE ($) |
| COMMON STOCKS - Cont'd | | |
| Hotels, Restaurants & Leisure - 2.0% | | |
| Brinker International, Inc. | 9,167 | 439,558 |
|
| Buffalo Wild Wings, Inc. * | 2,838 | 453,087 |
|
| Cheesecake Factory, Inc. (The) | 6,843 | 315,531 |
|
| Cracker Barrel Old Country Store, Inc. | 3,600 | 456,588 |
|
| Domino's Pizza, Inc. | 8,276 | 920,705 |
|
| Dunkin' Brands Group, Inc. | 13,982 | 595,493 |
|
| International Speedway Corp., Class A | 4,137 | 139,499 |
|
| Jack in the Box, Inc. | 5,494 | 421,445 |
|
| Panera Bread Co., Class A * | 3,592 | 699,650 |
|
| Wendy's Co. (The) | 32,793 | 353,180 |
|
| | | 4,794,736 |
|
| | | |
| Household Durables - 2.4% | | |
| CalAtlantic Group, Inc. | 11,550 | 437,976 |
|
| Jarden Corp. * | 31,262 | 1,785,685 |
|
| KB Home | 13,594 | 167,614 |
|
| MDC Holdings, Inc. | 5,956 | 152,057 |
|
| NVR, Inc. * | 555 | 911,865 |
|
| Tempur Sealy International, Inc. * | 9,297 | 655,067 |
|
| Toll Brothers, Inc. * | 24,358 | 811,121 |
|
| TRI Pointe Group, Inc. * | 22,000 | 278,740 |
|
| Tupperware Brands Corp. | 7,514 | 418,154 |
|
| | | 5,618,279 |
|
| | | |
| Household Products - 0.1% | | |
| Energizer Holdings, Inc. | 9,339 | 318,086 |
|
| | | |
| Independent Power and Renewable Electricity Producers - 0.0% | | |
| Talen Energy Corp. * | 9,652 | 60,132 |
|
| | | |
| Industrial Conglomerates - 0.4% | | |
| Carlisle Co.'s, Inc. | 9,798 | 868,985 |
|
| | | |
| Insurance - 5.3% | | |
| Alleghany Corp. * | 2,350 | 1,123,136 |
|
| American Financial Group, Inc. | 10,791 | 777,815 |
|
| Arthur J. Gallagher & Co. | 26,668 | 1,091,788 |
|
| Aspen Insurance Holdings Ltd. | 9,130 | 440,979 |
|
| Brown & Brown, Inc. | 17,659 | 566,854 |
|
| CNO Financial Group, Inc. | 28,067 | 535,799 |
|
| Endurance Specialty Holdings Ltd. | 9,251 | 591,972 |
|
| Everest Re Group Ltd. | 6,502 | 1,190,451 |
|
| First American Financial Corp. | 16,203 | 581,688 |
|
| Genworth Financial, Inc., Class A * | 73,181 | 272,965 |
|
| Hanover Insurance Group, Inc. (The) | 6,527 | 530,906 |
|
| Kemper Corp. | 7,405 | 275,836 |
|
| Mercury General Corp. | 5,370 | 250,081 |
|
| Old Republic International Corp. | 36,697 | 683,665 |
|
| Primerica, Inc. | 7,450 | 351,864 |
|
| Reinsurance Group of America, Inc. | 9,926 | 849,169 |
|
www.calvert.com CALVERT VP S&P MIDCAP 400 INDEX PORTFOLIO ANNUAL REPORT 11
|
| | | | |
| | SHARES | VALUE ($) |
| COMMON STOCKS - Cont'd | | |
| RenaissanceRe Holdings Ltd. | 6,618 | 749,091 |
|
| StanCorp Financial Group, Inc. | 6,335 | 721,430 |
|
| WR Berkley Corp. | 14,976 | 819,936 |
|
| | | 12,405,425 |
|
| | | |
| Internet & Catalog Retail - 0.1% | | |
| HSN, Inc. | 4,800 | 243,216 |
|
| | | |
| Internet Software & Services - 0.4% | | |
| j2 Global, Inc. | 6,905 | 568,420 |
|
| Rackspace Hosting, Inc. * | 17,164 | 434,592 |
|
| | | 1,003,012 |
|
| | | |
| IT Services - 3.9% | | |
| Acxiom Corp. * | 11,722 | 245,224 |
|
| Broadridge Financial Solutions, Inc. | 17,766 | 954,567 |
|
| Computer Sciences Corp. | 20,946 | 684,515 |
|
| Convergys Corp. | 15,004 | 373,450 |
|
| CoreLogic, Inc. * | 13,498 | 457,042 |
|
| DST Systems, Inc. | 4,909 | 559,920 |
|
| Gartner, Inc. * | 12,457 | 1,129,850 |
|
| Global Payments, Inc. | 19,564 | 1,262,074 |
|
| Jack Henry & Associates, Inc. | 12,063 | 941,638 |
|
| Leidos Holdings, Inc. | 9,634 | 542,009 |
|
| MAXIMUS, Inc. | 9,901 | 556,931 |
|
| NeuStar, Inc., Class A * | 8,302 | 198,999 |
|
| Science Applications International Corp. | 6,292 | 288,048 |
|
| VeriFone Systems, Inc. * | 17,099 | 479,114 |
|
| WEX, Inc. * | 5,832 | 515,549 |
|
| | | 9,188,930 |
|
| | | |
| Leisure Products - 0.8% | | |
| Brunswick Corp. | 13,741 | 694,058 |
|
| Polaris Industries, Inc. | 9,172 | 788,333 |
|
| Vista Outdoor, Inc. * | 9,488 | 422,311 |
|
| | | 1,904,702 |
|
| | | |
| Life Sciences - Tools & Services - 1.5% | | |
| Bio-Rad Laboratories, Inc., Class A * | 3,138 | 435,115 |
|
| Bio-Techne Corp. | 5,582 | 502,380 |
|
| Charles River Laboratories International, Inc. * | 7,114 | 571,895 |
|
| Mettler-Toledo International, Inc. * | 4,129 | 1,400,268 |
|
| PAREXEL International Corp. * | 8,035 | 547,344 |
|
| | | 3,457,002 |
|
| | | |
| Machinery - 3.9% | | |
| AGCO Corp. | 11,258 | 511,001 |
|
| CLARCOR, Inc. | 7,547 | 374,935 |
|
| Crane Co. | 7,332 | 350,763 |
|
| Donaldson Co., Inc. | 18,619 | 533,621 |
|
| Graco, Inc. | 8,439 | 608,199 |
|
| IDEX Corp. | 11,523 | 882,777 |
|
12 www.calvert.com CALVERT VP S&P MIDCAP 400 INDEX PORTFOLIO ANNUAL REPORT
|
| | | | |
| | SHARES | VALUE ($) |
| COMMON STOCKS - Cont'd | | |
| ITT Corp. | 13,467 | 489,121 |
|
| Joy Global, Inc. | 15,000 | 189,150 |
|
| Kennametal, Inc. | 11,887 | 228,230 |
|
| Lincoln Electric Holdings, Inc. | 9,952 | 516,409 |
|
| Nordson Corp. | 8,083 | 518,525 |
|
| Oshkosh Corp. | 11,291 | 440,801 |
|
| Terex Corp. | 15,936 | 294,497 |
|
| Timken Co. (The) | 10,882 | 311,116 |
|
| Toro Co. (The) | 8,220 | 600,635 |
|
| Trinity Industries, Inc. | 23,401 | 562,092 |
|
| Valmont Industries, Inc. | 3,532 | 374,463 |
|
| Wabtec Corp. | 14,483 | 1,030,031 |
|
| Woodward, Inc. | 8,626 | 428,367 |
|
| | | 9,244,733 |
|
| | | |
| Marine - 0.2% | | |
| Kirby Corp. * | 8,229 | 433,010 |
|
| | | |
| Media - 1.4% | | |
| AMC Networks, Inc., Class A * | 9,145 | 682,949 |
|
| Cable One, Inc. | 666 | 288,818 |
|
| Cinemark Holdings, Inc. | 15,654 | 523,313 |
|
| DreamWorks Animation SKG, Inc., Class A * | 10,941 | 281,950 |
|
| John Wiley & Sons, Inc., Class A | 7,418 | 334,032 |
|
| Live Nation Entertainment, Inc. * | 21,810 | 535,872 |
|
| Meredith Corp. | 5,657 | 244,665 |
|
| New York Times Co., (The) Class A | 18,719 | 251,209 |
|
| Time, Inc. | 16,423 | 257,348 |
|
| | | 3,400,156 |
|
| | | |
| Metals & Mining - 1.3% | | |
| Allegheny Technologies, Inc. | 16,000 | 180,000 |
|
| Carpenter Technology Corp. | 7,558 | 228,781 |
|
| Commercial Metals Co. | 17,437 | 238,712 |
|
| Compass Minerals International, Inc. | 4,994 | 375,898 |
|
| Reliance Steel & Aluminum Co. | 10,813 | 626,181 |
|
| Royal Gold, Inc. | 9,776 | 356,531 |
|
| Steel Dynamics, Inc. | 36,309 | 648,842 |
|
| United States Steel Corp. | 21,600 | 172,368 |
|
| Worthington Industries, Inc. | 7,253 | 218,605 |
|
| | | 3,045,918 |
|
| | | |
| Multi-Utilities - 1.1% | | |
| Alliant Energy Corp. | 17,109 | 1,068,457 |
|
| Black Hills Corp. | 7,724 | 358,625 |
|
| MDU Resources Group, Inc. | 29,227 | 535,439 |
|
| Vectren Corp. | 12,281 | 520,960 |
|
| | | 2,483,481 |
|
| | | |
www.calvert.com CALVERT VP S&P MIDCAP 400 INDEX PORTFOLIO ANNUAL REPORT 13
|
| | | | |
| | SHARES | VALUE ($) |
| COMMON STOCKS - Cont'd | | |
| Multiline Retail - 0.2% | | |
| Big Lots, Inc. | 7,479 | 288,241 |
|
| J.C. Penney Co., Inc. * | 45,388 | 302,284 |
|
| | | 590,525 |
|
| | | |
| Oil, Gas & Consumable Fuels - 1.6% | | |
| California Resources Corp. | 46,378 | 108,061 |
|
| Denbury Resources, Inc. | 53,121 | 107,304 |
|
| Energen Corp. | 11,819 | 484,461 |
|
| Gulfport Energy Corp. * | 15,993 | 392,948 |
|
| HollyFrontier Corp. | 27,605 | 1,101,163 |
|
| QEP Resources, Inc. | 23,800 | 318,920 |
|
| SM Energy Co. | 9,986 | 196,325 |
|
| Western Refining, Inc. | 10,463 | 372,692 |
|
| World Fuel Services Corp. | 10,719 | 412,253 |
|
| WPX Energy, Inc. * | 35,001 | 200,906 |
|
| | | 3,695,033 |
|
| | | |
| Paper & Forest Products - 0.3% | | |
| Domtar Corp. | 9,478 | 350,212 |
|
| Louisiana-Pacific Corp. * | 21,361 | 384,712 |
|
| | | 734,924 |
|
| | | |
| Personal Products - 0.4% | | |
| Avon Products, Inc. | 65,356 | 264,692 |
|
| Edgewell Personal Care Co. | 9,061 | 710,110 |
|
| | | 974,802 |
|
| | | |
| Pharmaceuticals - 0.3% | | |
| Akorn, Inc. * | 11,835 | 441,564 |
|
| Catalent, Inc. * | 15,000 | 375,450 |
|
| | | 817,014 |
|
| | | |
| Professional Services - 1.2% | | |
| CEB, Inc. | 4,992 | 306,459 |
|
| FTI Consulting, Inc. * | 6,201 | 214,927 |
|
| Manpowergroup, Inc. | 11,111 | 936,546 |
|
| Towers Watson & Co., Class A | 10,481 | 1,346,389 |
|
| | | 2,804,321 |
|
| | | |
| Real Estate Investment Trusts - 10.2% | | |
| Alexandria Real Estate Equities, Inc. | 10,942 | 988,719 |
|
| American Campus Communities, Inc. | 16,865 | 697,199 |
|
| BioMed Realty Trust, Inc. | 30,266 | 717,002 |
|
| Camden Property Trust | 13,036 | 1,000,643 |
|
| Care Capital Properties, Inc. | 12,500 | 382,125 |
|
| Communications Sales & Leasing, Inc. | 17,973 | 335,915 |
|
| Corporate Office Properties Trust | 14,176 | 309,462 |
|
| Corrections Corp. of America | 17,557 | 465,085 |
|
| Douglas Emmett, Inc. | 21,045 | 656,183 |
|
| Duke Realty Corp. | 51,825 | 1,089,362 |
|
| Equity One, Inc. | 11,087 | 301,012 |
|
14 www.calvert.com CALVERT VP S&P MIDCAP 400 INDEX PORTFOLIO ANNUAL REPORT
|
| | | | |
| | SHARES | VALUE ($) |
| COMMON STOCKS - Cont'd | | |
| Extra Space Storage, Inc. | 18,633 | 1,643,617 |
|
| Federal Realty Investment Trust | 10,478 | 1,530,836 |
|
| Highwoods Properties, Inc. | 14,387 | 627,273 |
|
| Hospitality Properties Trust | 22,541 | 589,447 |
|
| Kilroy Realty Corp. | 13,851 | 876,491 |
|
| Lamar Advertising Co., Class A | 12,305 | 738,054 |
|
| LaSalle Hotel Properties | 16,974 | 427,066 |
|
| Liberty Property Trust | 22,383 | 694,992 |
|
| Mack-Cali Realty Corp. | 13,383 | 312,493 |
|
| Mid-America Apartment Communities, Inc. | 11,319 | 1,027,878 |
|
| National Retail Properties, Inc. | 20,551 | 823,068 |
|
| Omega Healthcare Investors, Inc. | 24,842 | 868,973 |
|
| Post Properties, Inc. | 8,300 | 491,028 |
|
| Potlatch Corp. | 5,968 | 180,472 |
|
| Rayonier, Inc. | 18,833 | 418,093 |
|
| Regency Centers Corp. | 14,150 | 963,898 |
|
| Senior Housing Properties Trust | 35,325 | 524,223 |
|
| Sovran Self Storage, Inc. | 5,375 | 576,791 |
|
| Tanger Factory Outlet Centers, Inc. | 14,371 | 469,932 |
|
| Taubman Centers, Inc. | 9,091 | 697,462 |
|
| UDR, Inc. | 39,357 | 1,478,642 |
|
| Urban Edge Properties | 13,878 | 325,439 |
|
| Weingarten Realty Investors | 17,093 | 591,076 |
|
| WP GLIMCHER, Inc. | 27,362 | 290,311 |
|
| | | 24,110,262 |
|
| | | |
| Real Estate Management & Development - 0.6% | | |
| Alexander & Baldwin, Inc. | 6,827 | 241,062 |
|
| Jones Lang LaSalle, Inc. | 6,798 | 1,086,728 |
|
| | | 1,327,790 |
|
| | | |
| Road & Rail - 0.7% | | |
| Genesee & Wyoming, Inc., Class A * | 8,548 | 458,942 |
|
| Landstar System, Inc. | 6,546 | 383,923 |
|
| Old Dominion Freight Line, Inc. * | 10,507 | 620,648 |
|
| Werner Enterprises, Inc. | 6,550 | 153,205 |
|
| | | 1,616,718 |
|
| | | |
| Semiconductors & Semiconductor Equipment - 1.9% | | |
| Advanced Micro Devices, Inc. * | 94,503 | 271,224 |
|
| Atmel Corp. | 62,574 | 538,762 |
|
| Cree, Inc. * | 15,512 | 413,705 |
|
| Cypress Semiconductor Corp. * | 49,770 | 488,244 |
|
| Fairchild Semiconductor International, Inc. * | 17,459 | 361,576 |
|
| Integrated Device Technology, Inc. * | 22,019 | 580,201 |
|
| Intersil Corp., Class A | 19,496 | 248,769 |
|
| Silicon Laboratories, Inc. * | 5,956 | 289,104 |
|
| SunEdison, Inc. * | 47,326 | 240,889 |
|
| Synaptics, Inc. * | 5,500 | 441,870 |
|
| Teradyne, Inc. | 31,018 | 641,142 |
|
| | | 4,515,486 |
|
| | | |
www.calvert.com CALVERT VP S&P MIDCAP 400 INDEX PORTFOLIO ANNUAL REPORT 15
|
| | | | |
| | SHARES | VALUE ($) |
| COMMON STOCKS - Cont'd | | |
| Software - 4.5% | | |
| ACI Worldwide, Inc. * | 17,849 | 381,969 |
|
| ANSYS, Inc. * | 13,512 | 1,249,860 |
|
| Cadence Design Systems, Inc. * | 44,900 | 934,369 |
|
| CDK Global, Inc. | 24,039 | 1,141,131 |
|
| Commvault Systems, Inc. * | 6,304 | 248,062 |
|
| Fair Isaac Corp. | 4,656 | 438,502 |
|
| Fortinet, Inc. * | 21,853 | 681,158 |
|
| Manhattan Associates, Inc. * | 11,100 | 734,487 |
|
| Mentor Graphics Corp. | 14,708 | 270,921 |
|
| PTC, Inc. * | 17,243 | 597,125 |
|
| SolarWinds, Inc. * | 9,365 | 551,599 |
|
| Solera Holdings, Inc. | 10,030 | 549,945 |
|
| Synopsys, Inc. * | 23,537 | 1,073,523 |
|
| Tyler Technologies, Inc. * | 4,900 | 854,168 |
|
| Ultimate Software Group, Inc. (The) * | 4,300 | 840,693 |
|
| | | 10,547,512 |
|
| | | |
| Specialty Retail - 2.5% | | |
| Aaron's, Inc. | 9,524 | 213,242 |
|
| Abercrombie & Fitch Co., Class A | 10,143 | 273,861 |
|
| American Eagle Outfitters, Inc. | 27,008 | 418,624 |
|
| Ascena Retail Group, Inc. * | 25,608 | 252,239 |
|
| Cabela's, Inc. * | 7,500 | 350,475 |
|
| Chico's FAS, Inc. | 20,923 | 223,248 |
|
| CST Brands, Inc. | 11,596 | 453,867 |
|
| Dick's Sporting Goods, Inc. | 13,596 | 480,619 |
|
| Foot Locker, Inc. | 20,717 | 1,348,469 |
|
| Guess?, Inc. | 9,458 | 178,567 |
|
| Murphy USA, Inc. * | 6,050 | 367,477 |
|
| Office Depot, Inc. * | 73,787 | 416,159 |
|
| Rent-A-Center, Inc. | 7,777 | 116,422 |
|
| Williams-Sonoma, Inc. | 12,653 | 739,062 |
|
| | | 5,832,331 |
|
| | | |
| Technology Hardware, Storage & Peripherals - 0.5% | | |
| 3D Systems Corp. * | 15,715 | 136,563 |
|
| Diebold, Inc. | 9,724 | 292,595 |
|
| Lexmark International, Inc., Class A | 9,215 | 299,027 |
|
| NCR Corp. * | 18,721 | 457,916 |
|
| | | 1,186,101 |
|
| | | |
| Textiles, Apparel & Luxury Goods - 0.8% | | |
| Carter's, Inc. | 7,878 | 701,378 |
|
| Deckers Outdoor Corp. * | 4,993 | 235,670 |
|
| Kate Spade & Co. * | 19,154 | 340,367 |
|
| Skechers U.S.A., Inc., Class A * | 19,616 | 592,599 |
|
| | | 1,870,014 |
|
| | | |
16 www.calvert.com CALVERT VP S&P MIDCAP 400 INDEX PORTFOLIO ANNUAL REPORT
|
| | | | |
| | SHARES | VALUE ($) |
| COMMON STOCKS - Cont'd | | |
| Thrifts & Mortgage Finance - 0.7% | | |
| New York Community Bancorp, Inc. | 73,191 | 1,194,477 |
|
| Washington Federal, Inc. | 14,434 | 343,962 |
|
| | | 1,538,439 |
|
| | | |
| Trading Companies & Distributors - 0.6% | | |
| GATX Corp. | 6,399 | 272,277 |
|
| MSC Industrial Direct Co., Inc., Class A | 7,273 | 409,252 |
|
| NOW, Inc. * | 15,977 | 252,756 |
|
| Watsco, Inc. | 3,861 | 452,239 |
|
| | | 1,386,524 |
|
| | | |
| Water Utilities - 0.3% | | |
| Aqua America, Inc. | 26,582 | 792,144 |
|
| | | |
| Wireless Telecommunication Services - 0.2% | | |
| Telephone & Data Systems, Inc. | 14,161 | 366,628 |
|
| | | |
| Total Common Stocks (Cost $170,208,500) | | 221,787,268 |
|
| | | |
| | | |
| EXCHANGE-TRADED PRODUCTS - 1.6% | | |
| SPDR S&P MidCap 400 ETF Trust | 15,200 | 3,862,168 |
|
| | | |
| Total Exchange-Traded Products (Cost $3,909,764) | | 3,862,168 |
|
| | | |
| | | |
| | PRINCIPAL
AMOUNT ($) | VALUE ($) |
|
| U.S. TREASURY OBLIGATIONS - 0.4% | | |
| United States Treasury Bills, 0.152%, 3/31/16 ^ | 1,000,000 | 999,578 |
|
| | | |
| Total U.S. Treasury Obligations (Cost $999,611) | | 999,578 |
|
| | | |
| | | |
| TIME DEPOSIT - 3.7% | | |
| State Street Bank Time Deposit, 0.278%, 1/4/16 | 8,616,913 | 8,616,913 |
|
| | | |
| Total Time Deposit (Cost $8,616,913) | | 8,616,913 |
|
| | | |
| | | |
| TOTAL INVESTMENTS (Cost $183,734,788) - 99.9% | | 235,265,927 |
|
| Other assets and liabilities, net - 0.1% | | 246,647 |
|
NET ASSETS - 100.0% | |
| $235,512,574 |
|
|
| | | | | | | | | | |
| FUTURES | NUMBER OF
CONTRACTS | EXPIRATION
DATE | UNDERLYING FACE AMOUNT AT VALUE | UNREALIZED
APPRECIATION
(DEPRECIATION) |
| Long: | | | | | |
| | E-Mini S&P 400 Index^ | 69 | 3/16 |
| $9,615,150 |
|
| $47,020 |
|
| See notes to financial statements. |
www.calvert.com CALVERT VP S&P MIDCAP 400 INDEX PORTFOLIO ANNUAL REPORT 17
|
|
| NOTES TO SCHEDULE OF INVESTMENTS |
| * Non-income producing security. |
| ^ Futures collateralized by $1,000,000 par value of U.S. Treasury Bills. |
| (a) This security was valued under the direction of the Board of Directors. See Note A. |
|
| |
| Abbreviations: |
| ETF: | Exchange-Traded Fund |
| LLC: | Limited Liability Corporation |
| Ltd.: | Limited |
| plc: | Public Limited Company |
| See notes to financial statements. |
18 www.calvert.com CALVERT VP S&P MIDCAP 400 INDEX PORTFOLIO ANNUAL REPORT
CALVERT VP S&P MIDCAP 400 INDEX PORTFOLIO
STATEMENT OF ASSETS AND LIABILITIES
DECEMBER 31, 2015
|
| | | |
| ASSETS | |
| Investments in securities, at value (Cost $183,734,788) - see accompanying schedule |
| $235,265,927 |
|
| Cash | 14,270 |
|
| Receivable for securities sold | 194,227 |
|
| Receivable for shares sold | 207,243 |
|
| Dividends and interest receivable | 228,640 |
|
| Directors' deferred compensation plan | 153,303 |
|
| Total assets | 236,063,610 |
|
| | |
| LIABILITIES | |
| Payable for shares redeemed | 116,302 |
|
| Payable for futures contracts variation margin | 89,700 |
|
| Payable to Calvert Investment Management, Inc. | 60,760 |
|
| Payable to Calvert Investment Distributors, Inc. | 2,179 |
|
| Payable to Calvert Investment Administrative Services, Inc. | 20,253 |
|
| Payable to Calvert Investment Services, Inc. | 3,949 |
|
| Directors' deferred compensation plan | 153,303 |
|
| Accrued expenses and other liabilities | 104,590 |
|
| Total liabilities | 551,036 |
|
| NET ASSETS |
| $235,512,574 |
|
| | |
| NET ASSETS CONSIST OF: | |
| Paid-in capital applicable to the following shares of common stock outstanding; | |
| $0.10 par value, 20,000,000 shares authorized: | |
| Class I: 2,430,784 shares outstanding |
| $154,342,440 |
|
| Class F: 140,592 shares outstanding | 12,383,191 |
|
| Undistributed net investment income | 2,294,403 |
|
| Accumulated net realized gain (loss) | 14,914,381 |
|
| Net unrealized appreciation (depreciation) | 51,578,159 |
|
| NET ASSETS |
| $235,512,574 |
|
| | |
| NET ASSET VALUE PER SHARE | |
| Class I (based on net assets of $222,461,638) |
| $91.52 |
|
| Class F (based on net assets of $13,050,936) |
| $92.83 |
|
| See notes to financial statements. |
www.calvert.com CALVERT VP S&P MIDCAP 400 INDEX PORTFOLIO ANNUAL REPORT 19
CALVERT VP S&P MIDCAP 400 INDEX PORTFOLIO
STATEMENT OF OPERATIONS
YEAR ENDED DECEMBER 31, 2015
|
| | | |
| NET INVESTMENT INCOME | |
| Investment Income: | |
| Dividend income |
| $3,997,191 |
|
| Interest income | 9,402 |
|
| Total investment income | 4,006,593 |
|
| | |
| Expenses: | |
| Investment advisory fee | 754,052 |
|
| Administrative fees | 251,351 |
|
| Transfer agency fees and expenses | 31,367 |
|
| Distribution Plan expenses: | |
| Class F | 21,812 |
|
| Directors' fees and expenses | 45,479 |
|
| Accounting fees | 49,526 |
|
| Custodian fees | 60,461 |
|
| Professional fees | 41,943 |
|
| Reports to shareholders | 62,171 |
|
| Licensing fees | 30,135 |
|
| Miscellaneous | 44,974 |
|
| Total expenses | 1,393,271 |
|
| NET INVESTMENT INCOME | 2,613,322 |
|
| | |
| | |
| REALIZED AND UNREALIZED GAIN (LOSS) | |
| Net realized gain (loss) on: | |
| Investments | 19,168,807 |
|
| Futures | (567,000) |
|
| | 18,601,807 |
|
| | |
| Change in unrealized appreciation (depreciation) on: | |
| Investments | (27,550,721) |
|
| Futures | (123,085) |
|
| | (27,673,806) |
|
| | |
| NET REALIZED AND UNREALIZED GAIN (LOSS) | (9,071,999) |
|
| | |
| INCREASE (DECREASE) IN NET ASSETS RESULTING FROM OPERATIONS | $(6,458,677) |
| See notes to financial statements. |
20 www.calvert.com CALVERT VP S&P MIDCAP 400 INDEX PORTFOLIO ANNUAL REPORT
CALVERT VP S&P MIDCAP 400 INDEX PORTFOLIO
STATEMENTS OF CHANGES IN NET ASSETS
|
| | | | | | | |
| INCREASE (DECREASE) IN NET ASSETS | YEAR ENDED
DECEMBER 31, 2015 | | YEAR ENDED
DECEMBER 31, 2014 |
| Operations: | | | |
| Net investment income |
| $2,613,322 |
| |
| $2,484,952 |
|
| Net realized gain (loss) | 18,601,807 |
| | 20,531,619 |
|
| Change in unrealized appreciation (depreciation) | (27,673,806) |
| | (1,034,932) |
|
| | | | |
| INCREASE (DECREASE) IN NET ASSETS RESULTING FROM OPERATIONS | (6,458,677) |
| | 21,981,639 |
|
| | | | |
| Distributions to shareholders from: | | | |
| Net investment income: | | | |
| Class I shares | (215,559) |
| | (2,334,748) |
|
| Class F shares | — |
| | (50,505) |
|
| Net realized gain: | | | |
| Class I shares | (3,781,218) |
| | (19,263,615) |
|
| Class F shares | (216,938) |
| | (677,145) |
|
| Total distributions | (4,213,715) |
| | (22,326,013) |
|
| | | | |
| Capital share transactions: | | | |
| Shares sold: | | | |
| Class I shares | 19,394,619 |
| | 18,850,465 |
|
| Class F shares | 5,906,496 |
| | 2,499,561 |
|
| Reinvestment of distributions: | | | |
| Class I shares | 3,996,777 |
| | 21,598,364 |
|
| Class F shares | 216,938 |
| | 727,650 |
|
| Shares redeemed: | | | |
| Class I shares | (32,877,804) |
| | (43,161,985) |
|
| Class F shares | (982,332) |
| | (690,344) |
|
| Total capital share transactions | (4,345,306) |
| | (176,289) |
|
| | | | |
| TOTAL INCREASE (DECREASE) IN NET ASSETS | (15,017,698) |
| | (520,663) |
|
| | | | |
| | | | |
| NET ASSETS | | | |
| Beginning of year | 250,530,272 |
| | 251,050,935 |
|
| End of year (including undistributed net investment income of $2,294,403 and $218,147, respectively) |
| $235,512,574 |
| |
| $250,530,272 |
|
| | | | |
| CAPITAL SHARE ACTIVITY | | | |
| Shares sold: | | | |
| Class I shares | 198,681 |
| | 189,362 |
|
| Class F shares | 59,791 |
| | 24,802 |
|
| Reinvestment of distributions: | | | |
| Class I shares | 42,884 |
| | 223,239 |
|
| Class F shares | 2,295 |
| | 7,407 |
|
| Shares redeemed: | | | |
| Class I shares | (337,945) |
| | (433,723) |
|
| Class F shares | (9,981) |
| | (6,900) |
|
| Total capital share activity | (44,275) |
| | 4,187 |
|
| See notes to financial statements. |
www.calvert.com CALVERT VP S&P MIDCAP 400 INDEX PORTFOLIO ANNUAL REPORT 21
NOTES TO FINANCIAL STATEMENTS
NOTE A — SIGNIFICANT ACCOUNTING POLICIES
General: Calvert VP S&P MidCap 400 Index Portfolio (the “Portfolio”), a series of Calvert Variable Products, Inc. (the “Fund”), is registered under the Investment Company Act of 1940 as a diversified, open-end management investment company. The Fund is comprised of eleven separate portfolios. The operations of each series of the Fund are accounted for separately. The Fund applies the accounting and reporting guidance in the Financial Accounting Standards Board (FASB) Accounting Standards Codification Topic 946, Financial Services – Investment Companies (ASC 946).
Shares of the Portfolio are sold without sales charge to affiliated and unaffiliated insurance companies for allocation to certain of their variable separate accounts. The Portfolio offers Class F and Class I shares. Class F shares are subject to Distribution Plan Expenses, while Class I shares are not. Each class has different: (a) dividend rates, due to differences in Distribution Plan expenses and other class-specific expenses, (b) exchange privileges; and (c) class-specific voting rights.
Security Valuation: Net asset value per share is determined every business day as of the close of the regular session of the New York Stock Exchange (generally 4:00 p.m. Eastern time). The Portfolio uses independent pricing services approved by the Board of Directors (“the Board”) to value its investments wherever possible. Investments for which market quotations are not available or deemed not reliable are fair valued in good faith under the direction of the Board.
The Board has adopted Valuation Procedures (the “Procedures”) to determine the fair value of securities and other financial instruments for which market prices are not readily available or which may not be reliably priced. The Board has delegated the day-to-day responsibility for determining the fair value of assets of the Portfolio to Calvert Investment Management, Inc. (the “Advisor” or “Calvert”) and has provided these Procedures to govern Calvert in its valuation duties.
Calvert has chartered an internal Valuation Committee to oversee the implementation of these Procedures and to assist it in carrying out the valuation responsibilities that the Board has delegated.
The Valuation Committee meets on a regular basis to review illiquid securities and other investments which may not have readily available market prices. The Valuation Committee’s fair valuation determinations are subject to review, approval and ratification by the Board at its next regularly scheduled meeting covering the calendar quarter in which the fair valuation was determined.
The Valuation Committee utilizes various methods to measure the fair value of the Portfolio’s investments. U.S. generally accepted accounting principles (GAAP) establishes a disclosure hierarchy that categorizes the inputs to valuation techniques used to value assets and liabilities at measurement date. These inputs are summarized in the three broad levels listed below:
Level 1 - quoted prices in active markets for identical securities
Level 2 - other significant observable inputs (including quoted prices for similar securities, interest rates, prepayment speeds, credit risk, etc.)
Level 3 - significant unobservable inputs (including the Portfolio’s own assumptions in determining the fair value of investments)
The inputs or methodologies used for valuing securities are not necessarily an indication of the risk associated with investing in those securities.
Changes in valuation techniques may result in transfers in or out of an investment’s assigned level within the hierarchy during the year. Transfers in and/or out of levels are determined based on the fair value of such securities at the end of the year. Valuation techniques used to value the Portfolio’s investments by major category are as follows:
Common stock securities, including restricted securities, for which market quotations are readily available, are valued at the last reported sale price or official closing price as reported by an independent pricing service on the primary market or exchange on which they are traded and are categorized as Level 1 in the hierarchy. In the event there were no sales during the day or closing prices are not available, securities are valued at the last quoted bid price or the last available price and are categorized as Level 2 in the hierarchy. Foreign securities are valued based on quotations from the principal market in which such securities are normally traded. If events occur after the close of the principal market in which foreign securities are traded, and before the close of business of the Portfolio, that are expected to
22 www.calvert.com CALVERT VP S&P MIDCAP 400 INDEX PORTFOLIO ANNUAL REPORT
materially affect the value of those securities, then they are valued at their fair value taking these events into account and are categorized as Level 2 in the hierarchy.
Exchange-traded products are valued at the official closing price as reported by an independent pricing service on the primary market or exchange on which they are traded and are categorized as Level 1 in the hierarchy.
Debt securities, including restricted securities, are valued based on evaluated prices received from independent pricing services or from dealers who make markets in such securities. For U.S. government obligations, pricing services utilize matrix pricing which considers yield or price of bonds of comparable quality, coupon, maturity and type as well as dealer supplied prices and such securities are generally categorized as Level 2 in the hierarchy. Short-term securities of sufficient credit quality with remaining maturities of sixty days or less for which quotations are not readily available are valued at amortized cost, which approximates fair value, and are categorized as Level 2 in the hierarchy.
Futures contracts are valued at unrealized appreciation (depreciation) based on the settlement price established each day by the board of trade or exchange on which they are traded and are categorized as Level 1 in the hierarchy.
If a market value cannot be determined for a security using the methodologies described above, or if, in the good faith opinion of the Advisor, the market value does not constitute a readily available market quotation, or if a significant event has occurred that would materially affect the value of the security, the security will be fair valued as determined in good faith by the Valuation Committee.
The Valuation Committee considers a number of factors, including significant unobservable valuation inputs when arriving at fair value. It considers all significant facts that are reasonably available and relevant to the determination of fair value.
The Valuation Committee primarily employs a market-based approach which may use related or comparable assets or liabilities, recent transactions, market multiples, book values, and other relevant information for the investment to determine the fair value of the investment. When more appropriate, the Portfolio may employ an income-based or cost approach. An income-based valuation approach discounts anticipated future cash flows of the investment to calculate a present amount (discounted). The measurement is based on the value indicated by current market expectations about those future amounts. Discounts may also be applied due to the nature or duration of any restrictions on the disposition of the investments. A cost based approach is based on the amount that currently would be required to replace the service capacity of an asset (current replacement cost). From the seller’s perspective, the price that would be received for the asset is determined based on the cost to a buyer to acquire or construct a substitute asset of comparable utility, adjusted for obsolescence.
The values assigned to fair value investments are based on available information and do not necessarily represent amounts that might ultimately be realized. Further, due to the inherent uncertainty of valuations of such investments, the fair values may differ significantly from the values that would have been used had an active market existed, and the differences could be material. The Valuation Committee employs various methods for calibrating these valuation approaches including a regular review of key inputs and assumptions, transactional back-testing or disposition analysis and reviews of any related market activity.
At December 31, 2015, securities valued at $0, or 0.0% of net assets, were fair valued in good faith under the direction of the Board.
www.calvert.com CALVERT VP S&P MIDCAP 400 INDEX PORTFOLIO ANNUAL REPORT 23
The following table summarizes the market value of the Portfolio's holdings as of December 31, 2015, based on the inputs used to value them:
|
| | | | | | | | | | | |
| | VALUATION INPUTS |
| INVESTMENTS IN SECURITIES* | LEVEL 1 | LEVEL 2 | LEVEL 3 | TOTAL |
| Common Stocks** |
| $221,787,268 |
| $— |
| $0 |
|
| $221,787,268 |
|
| Exchange-Traded Products | 3,862,168 |
| — |
| — |
| 3,862,168 |
|
| U.S. Treasury Obligations | — |
| 999,578 |
| — |
| 999,578 |
|
| Time Deposit | — |
| 8,616,913 |
| — |
| 8,616,913 |
|
| TOTAL |
| $225,649,436 |
|
| $9,616,491 |
| $0^ |
|
| $235,265,927 |
|
| Futures Contracts*** |
| $47,020 |
| $— |
| $— |
|
| $47,020 |
|
| |
| * For a complete listing of investments, please refer to the Schedule of Investments. |
| ** For further breakdown of equity securities by industry, please refer to the Schedule of Investments. |
| *** The value listed for these securities reflects unrealized appreciation (depreciation) as shown on the Schedule of Investments. |
| ^ Level 3 securities are valued at $0 and represent 0.0% of net assets. |
There were no transfers between levels during the year.
Futures Contracts: The Portfolio may purchase and sell futures contracts, but only when, in the judgment of the Advisor, such a position acts as a hedge. The Portfolio may not enter into futures contracts for the purpose of speculation or leverage. These futures contracts may include, but are not limited to, market index futures. The Portfolio is subject to market risk in the normal course of pursuing its investment objectives and may use futures contracts to hedge against changes in the value of securities. The Portfolio may enter into futures contracts agreeing to buy or sell a financial instrument for a set price at a future date. Initial margin deposits of either cash or securities as required by the broker are made upon entering into the contract. While the contract is open, daily variation margin payments are made to or received from the broker reflecting the daily change in market value of the contract and are recorded for financial reporting purposes as unrealized gains or losses by the Portfolio. When a futures contract is closed, a realized gain or loss is recorded equal to the difference between the opening and closing value of the contract. The risks associated with entering into futures contracts may include the possible illiquidity of the secondary market which would limit the Portfolio’s ability to close out a futures contract prior to the settlement date, an imperfect correlation between the value of the contracts and the underlying financial instruments, or that the counterparty will fail to perform its obligations under the contracts’ terms. Futures contracts are designed by boards of trade which are designated “contracts markets” by the Commodities Futures Trading Commission. Futures contracts trade on the contracts markets in a manner that is similar to the way a stock trades on a stock exchange, and the boards of trade, through their clearing corporations, guarantee the futures contracts against default. As a result, there is minimal counterparty credit risk to the Portfolio. During the year, futures contracts were used to hedge the lack of equity market exposure inherent in a cash position. The Portfolio’s futures contracts at year end are presented in the Schedule of Investments.
At December 31, 2015, the Portfolio had the following derivatives, categorized by risk exposure:
|
| | | | | |
| Risk | Statement of Assets and Liabilities | Assets | Statement of Assets and Liabilities | Liabilities | |
| Equity | Unrealized appreciation on futures contracts | $47,020* | Unrealized depreciation on futures contracts | ($0)* | |
| * Only the current day’s variation margin is reported within the Statement of Assets and Liabilities. |
The effect of derivative instruments on the Statement of Operations for the year ended December 31, 2015 was as follows:
|
| | | |
| | Statement of Operations Location |
| Risk | Derivatives | Net Realized Gain (Loss) | Net Change in Unrealized appreciation (depreciation) |
| Equity | Futures | ($567,000) | ($123,085) |
24 www.calvert.com CALVERT VP S&P MIDCAP 400 INDEX PORTFOLIO ANNUAL REPORT
During the year, the Portfolio invested in E-Mini S&P 400 Index futures. The volume of outstanding contracts has varied throughout the year with an average number of contracts as in the following table:
|
| |
| Derivative Description | Average Number of Contracts* |
| Futures contracts long | 68 |
| Futures contracts short | - |
| | |
| *Averages are based on activity levels during the year ended December 31, 2015. |
Security Transactions and Investment Income: Security transactions are accounted for on trade date. Realized gains and losses are recorded on an identified cost basis and may include proceeds from litigation. Dividend income is recorded on the ex-dividend date. Distributions received on securities that represent a return of capital are recorded as a reduction of cost of investments. Distributions received on securities that represent a capital gain are recorded as a realized gain. Interest income, which includes amortization of premium and accretion of discount on debt securities, is accrued as earned. Investment income and realized and unrealized gains and losses are allocated to separate classes of shares based upon the relative net assets of each class.
Distributions to Shareholders: Distributions to shareholders are recorded by the Portfolio on ex-dividend date. Dividends from net investment income and distributions from net realized capital gains, if any, are paid at least annually. Distributions are determined in accordance with income tax regulations which may differ from U.S. generally accepted accounting principles; accordingly, periodic reclassifications are made within the Portfolio's capital accounts to reflect income and gains available for distribution under income tax regulations.
Estimates: The preparation of financial statements in conformity with U.S. generally accepted accounting principles requires management to make estimates and assumptions that affect the reported amounts of assets and liabilities and disclosure of contingent assets and liabilities at the date of the financial statements and the reported amounts of increases and decreases in net assets from operations during the reporting period. Actual results could differ from those estimates.
Federal Income Taxes: No provision for federal income or excise tax is required since the Portfolio intends to continue to qualify as a regulated investment company under the Internal Revenue Code and to distribute substantially all of its taxable earnings.
Management has analyzed the Portfolio's tax positions taken for all open federal income tax years and has concluded that no provision for federal income tax is required in the Portfolio's financial statements. A Portfolio's federal tax return is subject to examination by the Internal Revenue Service for a period of three years.
NOTE B — RELATED PARTY TRANSACTIONS
Calvert Investment Management, Inc. (the “Advisor”) is wholly-owned by Calvert Investments, Inc., which is indirectly wholly-owned by Ameritas Mutual Holding Company. The Advisor provides investment advisory services and pays the salaries and fees of officers and Directors of the Portfolio who are employees of the Advisor or its affiliates. For its services, the Advisor receives an annual fee, payable monthly, of 0.30% of the Portfolio’s average daily net assets.
The Advisor has contractually agreed to limit net annual portfolio operating expenses through April 30, 2016. The contractual expense caps are 0.81% for Class F and 0.57% for Class I. For the purpose of this expense limit, operating expenses do not include interest expense, brokerage commissions, taxes, and extraordinary expenses. This expense limitation does not limit acquired fund fees and expenses, if any.
Calvert Investment Administrative Services, Inc. ("CIAS"), an affiliate of the Advisor, provides administrative services to the Portfolio for an annual fee, payable monthly, of 0.10% of the Portfolio’s average daily net assets.
On November 24, 2015, the Board of Directors approved the recommendation made by CIAS to standardize and rationalize the administrative fee paid by the Calvert Funds at 0.12% for all series and all share classes of the Calvert Funds. CIAS and the Portfolio have entered into an Amended and Restated Administrative Services Agreement that will establish a 0.12% administrative fee for all share classes commencing on May 1, 2016. CIAS has contractually agreed to waive 0.02% for Class F and I (the difference between the current administrative fee and the new 0.12% fee) from May 1, 2016 through April 30, 2018.
www.calvert.com CALVERT VP S&P MIDCAP 400 INDEX PORTFOLIO ANNUAL REPORT 25
Calvert Investment Distributors, Inc. (“CID”), an affiliate of the Advisor, is the distributor and principal underwriter for the Portfolio. Pursuant to Rule 12b-1 under the Investment Company Act of 1940, the Portfolio has adopted a Distribution Plan that permits the Portfolio to pay certain expenses associated with the distribution and servicing of its Class F shares. The expenses paid may not exceed 0.20% annually of the average daily net assets of Class F.
Calvert Investment Services, Inc. (“CIS”), an affiliate of the Advisor, acts as shareholder servicing agent for the Portfolio. For its services, CIS received a fee of $18,851 for the year ended December 31, 2015. Boston Financial Data Services, Inc. is the transfer and dividend disbursing agent.
Each Director of the Portfolio who is not an employee of the Advisor or its affiliates receives a fee of $1,500 for each Board and Committee meeting attended plus an annual fee of $44,000. Committee chairs receive an additional $5,000 annual retainer. Eligible Directors may participate in a Deferred Compensation Plan (the “Plan”). Obligations of the Plan will be paid solely out of the Portfolio’s assets. Directors’ fees are allocated to each of the portfolios served.
NOTE C — INVESTMENT ACTIVITY AND TAX INFORMATION
During the year, the cost of purchases and proceeds from sales of investments, other than short-term securities, were $35,078,698 and $30,754,440, respectively.
|
| | | |
| Capital Loss Carryforwards | |
| EXPIRATION DATE | |
| 2016 |
| ($1,412,024 | ) |
Under the Regulated Investment Company Modernization Act of 2010, capital losses incurred in taxable years beginning after December 22, 2010 can be carried forward to offset future capital gains for an unlimited period. These losses are required to be utilized prior to the losses incurred in pre-enactment taxable years and will retain their character as either long-term or short-term. Losses incurred in pre-enactment taxable years can be utilized until expiration. The Portfolio's use of net capital losses acquired from reorganizations may be limited under certain tax provisions.
The tax character of dividends and distributions paid during the years ended December 31, 2015 and December 31, 2014 was as follows:
|
| | | | | | |
| DISTRIBUTIONS PAID FROM: | 2015 |
| 2014 |
|
| Ordinary income |
| $215,559 |
|
| $2,385,253 |
|
| Long-term capital gains | 3,998,156 |
| 19,940,760 |
|
| Total |
| $4,213,715 |
|
| $22,326,013 |
|
As of December 31, 2015, the tax basis components of distributable earnings/(accumulated losses) and the federal tax cost were as follows:
|
| | | |
| Unrealized appreciation |
| $68,138,857 |
|
| Unrealized (depreciation) | (16,394,937) |
|
| Net unrealized appreciation (depreciation) |
| $51,743,920 |
|
| Undistributed ordinary income |
| $2,294,403 |
|
| Undistributed long-term capital gain |
| $16,160,644 |
|
| Capital loss carryforward |
| ($1,412,024 | ) |
| Federal income tax cost of investments |
| $183,522,007 |
|
The differences between the components of distributable earnings on a tax basis and the amounts reflected in the Statement of Assets and Liabilities are primarily due to temporary book-tax differences that will reverse in a subsequent period. These differences are mainly due wash sales, real estate investment trusts and Section 1256 futures contracts.
26 www.calvert.com CALVERT VP S&P MIDCAP 400 INDEX PORTFOLIO ANNUAL REPORT
Reclassifications, as shown in the table below, have been made to the Portfolio's components of net assets to reflect income and gains available for distribution (or available capital loss carryovers, as applicable) under income tax law and regulations. These reclassifications are due to permanent book-tax differences and have no impact on net assets. The primary permanent differences causing such reclassifications for the Portfolio are due to real estate investment trusts.
|
| | | |
| Undistributed net investment income |
| ($321,507 | ) |
| Accumulated net realized gain (loss) | 1,484,058 |
|
| Paid-in capital | (1,162,551) |
|
NOTE D — LINE OF CREDIT
A financing agreement is in place with the Calvert Funds and State Street Corporation (“SSC”). Under the agreement, SSC provides an unsecured line of credit facility, in the aggregate amount of $50 million ($25 million committed and $25 million uncommitted), accessible by the Calvert Funds for temporary or emergency purposes only. Borrowings bear interest at the higher of the London Interbank Offered Rate (LIBOR) or the overnight Federal Funds Rate plus 1.25% per annum. A commitment fee of 0.20% per annum is incurred on the unused portion of the committed facility. An administrative fee of $25,000 was paid in connection with the uncommitted facility. These fees are allocated to all participating funds. The Portfolio had no borrowings under the agreement during the year ended December 31, 2015.
NOTE E — SUBSEQUENT EVENTS
In preparing the financial statements as of December 31, 2015, no subsequent events or transactions occurred that would have required recognition or disclosure in these financial statements.
NOTICE TO SHAREHOLDERS (UNAUDITED)
For the fiscal year ended December 31, 2015, the Portfolio considers 100.0% of the ordinary dividends paid during the year as eligible for the corporate dividends received deduction in accordance with Section 854 of the Internal Revenue Code. The Portfolio also considers $3,998,156 of the long-term capital gain distributions paid during the year as capital gain dividends in accordance with Section 852(b)(3)(C) of the Internal Revenue Code.
www.calvert.com CALVERT VP S&P MIDCAP 400 INDEX PORTFOLIO ANNUAL REPORT 27
CALVERT VP S&P MIDCAP 400 INDEX PORTFOLIO
FINANCIAL HIGHLIGHTS
|
| | | | | | | | | | | | | | | | | | | | |
| | YEARS ENDED | |
| CLASS I SHARES | December 31, 2015 (a) | | December 31, 2014 (a) | | December 31, 2013 (a) | | December 31, 2012 (a) | | December 31, 2011 (a) | |
| Net asset value, beginning |
| $95.73 |
| |
| $96.10 |
| |
| $75.22 |
| |
| $66.38 |
| |
| $68.39 |
| |
| Income from investment operations: | | | | | | | | | | |
| Net investment income | 1.02 |
| | 1.00 |
| | 0.88 |
| | 0.86 |
| | 0.59 |
| |
| Net realized and unrealized gain (loss) | (3.56) |
| | 7.99 |
| | 23.70 |
| | 10.58 |
| | (2.12) |
| |
| Total from investment operations | (2.54) |
| | 8.99 |
| | 24.58 |
| | 11.44 |
| | (1.53) |
| |
| Distributions from: | | | | | | | | | | |
| Net investment income | (0.09) |
| | (1.01) |
| | (0.82) |
| | (0.72) |
| | (0.48) |
| |
| Net realized gain | (1.58) |
| | (8.35) |
| | (2.88) |
| | (1.88) |
| | — |
| |
| Total distributions | (1.67) |
| | (9.36) |
| | (3.70) |
| | (2.60) |
| | (0.48) |
| |
| Total increase (decrease) in net asset value | (4.21) |
| | (0.37) |
| | 20.88 |
| | 8.84 |
| | (2.01) |
| |
| Net asset value, ending |
| $91.52 |
| |
| $95.73 |
| |
| $96.10 |
| |
| $75.22 |
| |
| $66.38 |
| |
| Total return(b) | (2.68 | %) | | 9.25 | % | | 32.82 | % | | 17.31 | % | | (2.24 | %) | |
| Ratios to average net assets: (c) | | | | | | | | | | |
| Net investment income | 1.05 | % | | 1.01 | % | | 1.00 | % | | 1.17 | % | | 0.85 | % | |
| Total expenses | 0.54 | % | | 0.53 | % | | 0.52 | % | | 0.53 | % | | 0.56 | % | |
| Net expenses | 0.54 | % | | 0.53 | % | | 0.52 | % | | 0.53 | % | | 0.55 | % | |
| Portfolio turnover | 13 | % | | 14 | % | | 12 | % | | 10 | % | | 16 | % | |
| Net assets, ending (in thousands) |
| $222,462 |
| |
| $241,929 |
| |
| $244,903 |
| |
| $188,872 |
| |
| $178,563 |
| |
| | | | | | | | | | | |
| (a)Per share figures are calculated using the Average Shares Method. | |
| (b)Total return is not annualized for periods of less than one year and does not reflect charges and expenses of the variable annuity or variable universal life contract. | |
| (c)Total expenses do not reflect amounts reimbursed and/or waived by the Advisor and certain of its affiliates, if applicable. Net expenses are net of all reductions and represent the net expenses paid by the Portfolio. | |
| See notes to financial statements. |
28 www.calvert.com CALVERT VP S&P MIDCAP 400 INDEX PORTFOLIO ANNUAL REPORT
CALVERT VP S&P MIDCAP 400 INDEX PORTFOLIO
FINANCIAL HIGHLIGHTS
|
| | | | | | | | | | | | | | | | | | | | |
| | YEARS ENDED | |
| CLASS F SHARES | December 31, 2015 (a) | | December 31, 2014 (a) | | December 31, 2013 (a) | | December 31, 2012 (a) | | December 31, 2011 (a) | |
| Net asset value, beginning |
| $97.20 |
| |
| $97.32 |
| |
| $76.04 |
| |
| $67.03 |
| |
| $69.00 |
| |
| Income from investment operations: | | | | | | | | | | |
| Net investment income | 0.85 |
| | 0.81 |
| | 0.65 |
| | 0.71 |
| | 0.44 |
| |
| Net realized and unrealized gain (loss) | (3.64) |
| | 8.04 |
| | 23.94 |
| | 10.64 |
| | (2.14) |
| |
| Total from investment operations | (2.79) |
| | 8.85 |
| | 24.59 |
| | 11.35 |
| | (1.70) |
| |
| Distributions from: | | | | | | | | | | |
| Net investment income | — |
| | (0.62) |
| | (0.43) |
| | (0.46) |
| | (0.27) |
| |
| Net realized gain | (1.58) |
| | (8.35) |
| | (2.88) |
| | (1.88) |
| | — |
| |
| Total distributions | (1.58) |
| | (8.97) |
| | (3.31) |
| | (2.34) |
| | (0.27) |
| |
| Total increase (decrease) in net asset value | (4.37) |
| | (0.12) |
| | 21.28 |
| | 9.01 |
| | (1.97) |
| |
| Net asset value, ending |
| $92.83 |
| |
| $97.20 |
| |
| $97.32 |
| |
| $76.04 |
| |
| $67.03 |
| |
| Total return(b) | (2.90 | %) | | 9.00 | % | | 32.47 | % | | 16.99 | % | | (2.47 | %) | |
| Ratios to average net assets: (c) | | | | | | | | | | |
| Net investment income | 0.86 | % | | 0.81 | % | | 0.73 | % | | 0.95 | % | | 0.63 | % | |
| Total expenses | 0.77 | % | | 0.75 | % | | 0.90 | % | | 0.86 | % | | 0.93 | % | |
| Net expenses | 0.77 | % | | 0.75 | % | | 0.81 | % | | 0.80 | % | | 0.79 | % | |
| Portfolio turnover | 13 | % | | 14 | % | | 12 | % | | 10 | % | | 16 | % | |
| Net assets, ending (in thousands) |
| $13,051 |
| |
| $8,601 |
| |
| $6,148 |
| |
| $2,677 |
| |
| $1,698 |
| |
| | | | | | | | | | | |
| (a)Per share figures are calculated using the Average Shares Method. | |
| (b)Total return is not annualized for periods of less than one year and does not reflect charges and expenses of the variable annuity or variable universal life contract. | |
| (c)Total expenses do not reflect amounts reimbursed and/or waived by the Advisor and certain of its affiliates, if applicable. Net expenses are net of all reductions and represent the net expenses paid by the Portfolio. | |
| See notes to financial statements. | | | | | | | |
www.calvert.com CALVERT VP S&P MIDCAP 400 INDEX PORTFOLIO ANNUAL REPORT 29
PROXY VOTING
The Proxy Voting Guidelines that the Portfolio uses to determine how to vote proxies relating to portfolio securities is provided as an Appendix to the Fund’s Statement of Additional Information. The Statement of Additional Information can be obtained free of charge by calling the Fund at 1-800-368-2745, by visiting the Calvert website at www.calvert.com or by visiting the SEC’s website at www.sec.gov.
Information regarding how the Fund voted proxies relating to portfolio securities during the most recent 12-month period ended June 30 is available by calling the Fund, by visiting the Calvert website at www.calvert.com or visiting the SEC’s website at www.sec.gov.
AVAILABILITY OF QUARTERLY PORTFOLIO HOLDINGS
The Fund files its complete schedule of portfolio holdings with the SEC for the first and third quarters of each fiscal year on Form N-Q. The Fund’s Form N-Q is available on the SEC’s website at www.sec.gov. The Fund’s Form N-Q may be reviewed and copied at the SEC’s Public Reference Room in Washington, DC; information on the operation of the Public Reference Room may be obtained by calling 1-800-SEC-0330.
BASIS FOR BOARD'S APPROVAL OF INVESTMENT ADVISORY CONTRACTS
At a meeting held on December 9, 2015, the Board of Directors, and by a separate vote, the disinterested Directors, approved the continuance of the Investment Advisory Agreement between the Portfolio and the Advisor and the Investment Subadvisory Agreement between the Advisor and the Subadvisor with respect to the Portfolio.
In evaluating the Investment Advisory Agreement, the Board considered a variety of information relating to the Portfolio and the Advisor. The disinterested Directors reviewed a report prepared by the Advisor regarding various services provided to the Portfolio by the Advisor and its affiliates. Such report included, among other data, information regarding the Advisor's personnel and the Advisor's revenue and cost of providing services to the Portfolio, and a separate report prepared by an independent third party, which provided a statistical analysis comparing the Portfolio's investment performance, expenses, and fees to comparable mutual funds.
The disinterested Directors were separately represented by independent legal counsel with respect to their consideration of the reapproval of the Investment Advisory Agreement and the Investment Subadvisory Agreement. Prior to voting, the disinterested Directors reviewed the proposed continuance of the Investment Advisory Agreement and Investment Subadvisory Agreement with management and also met in private sessions with their counsel at which no representatives of management were present.
In the course of its deliberations regarding the Investment Advisory Agreement, the Board considered the following factors, among others: the nature, extent and quality of the services provided by the Advisor, including the personnel providing such services; the Advisor's financial condition; the level and method of computing the Portfolio's advisory fee; comparative performance, fee and expense information for the Portfolio; the profitability of the Calvert Family of Funds to the Advisor and its affiliates; the allocation of the Portfolio's brokerage, including the Advisor's process for monitoring "best execution"; the direct and indirect benefits, if any, derived by the Advisor and its affiliates from their relationship with the Portfolio; the effect of the Portfolio's growth and size on the Portfolio's performance and expenses; the Advisor's compliance programs and policies; the Advisor's performance of substantially similar duties for other funds; and any possible conflicts of interest.
In considering the nature, extent and quality of the services provided by the Advisor under the Investment Advisory Agreement, the Board reviewed information provided by the Advisor relating to its operations and personnel, including, among other information, biographical information on the Advisor's supervisory and professional staff and descriptions of its organizational and management structure. The Board also took into account similar information provided periodically throughout the previous year by the Advisor, as well as the Board’s familiarity with the Advisor’s management through Board of Directors' meetings, discussions and other reports. The Board considered the Advisor's current level of staffing and overall resources. The Board also noted that it reviewed on a quarterly basis information regarding the Advisor’s compliance with applicable policies and procedures, including those related to personal investing. The Advisor's administrative capabilities, including its ability to supervise the other service providers for the Portfolio, were also considered. The Board discussed the Advisor's effectiveness in monitoring the performance of the Subadvisor and its timeliness in responding to performance issues. The Board observed that the scope of services provided by the Advisor
30 www.calvert.com CALVERT VP S&P MIDCAP 400 INDEX PORTFOLIO ANNUAL REPORT (UNAUDITED)
generally had expanded over time as a result of regulatory, market and other changes. The Board took into consideration, among other factors, the effectiveness of the Portfolio’s and Advisor’s processes, policies and procedures and the Advisor’s personnel. The Board also took into account, among other items, periodic reports received from the Advisor over the past year concerning the Advisor’s ongoing review and enhancement of certain processes, policies and procedures of the Portfolio and the Advisor. The Board concluded that it was satisfied with the nature, extent and quality of services provided to the Portfolio by the Advisor under the Investment Advisory Agreement.
In considering the Portfolio's performance, the Board noted that it reviewed on a quarterly basis detailed information about the Portfolio's performance results, portfolio composition and investment strategies. In addition, the Board took into account overall financial market conditions. The Board also reviewed various comparative data provided to it in connection with its consideration of the renewal of the Investment Advisory Agreement, including, among other information, a comparison of the Portfolio's total return with its Lipper index and with that of other mutual funds deemed to be in its peer group by an independent third party in its report. This comparison indicated that the Portfolio performed below the median of its peer group for the one-, three- and five-year periods ended June 30, 2015. The data also indicated that the Portfolio outperformed its Lipper index for the one-, three- and five-year periods ended June 30, 2015. The Board took into account management’s discussion of the Portfolio’s performance, including the impact of differing fees and expenses among the funds in the peer group on the Portfolio’s relative performance. Based upon its review, the Board concluded that the Portfolio’s performance was satisfactory relative to the performance of passively-managed funds that track the same benchmark index as does the Portfolio.
In considering the Portfolio's fees and expenses, the Board compared the Portfolio's fees and total expense ratio with various comparative data for the funds in its peer group. Among other findings, the data indicated that the Portfolio's advisory fee was above the median of its peer group and that total expenses were above the median of its peer group. The Board noted that the allocation of advisory and administrative fees may vary among the Portfolio’s peer group. The Board noted that the Advisor is not currently reimbursing any of the Portfolio’s expenses. The Board also took into account the Advisor’s current undertaking to maintain expense limitations for the Portfolio. The Board noted that the Advisor paid the Subadvisor’s subadvisory fee under the Investment Subadvisory Agreement with respect to the Portfolio. The Board also took into account management's discussion of the Portfolio's expenses and certain factors that affected the level of such expenses, including the current size of the Portfolio. Based upon its review, the Board determined that the advisory fee was reasonable in view of the quality of services received by the Portfolio from the Advisor and the other factors considered.
The Board reviewed the Advisor’s profitability on a portfolio-by-portfolio basis. In reviewing the overall profitability of the advisory fee to the Portfolio's Advisor, the Board also considered the fact that affiliates of the Advisor provided shareholder servicing, administrative and distribution services to the Portfolio for which they received compensation. The information considered by the Board included Calvert’s operating profit margin information both before and after tax expenses with respect to the services that the Advisor and its affiliates provided to the Calvert Family of Funds complex. The Board reviewed the profitability of the Advisor's relationship with the Portfolio in terms of the total amount of annual advisory fees it received with respect to the Portfolio and whether the Advisor had the financial wherewithal to continue to provide services to the Portfolio. The Board also considered that the Advisor derived benefits to its reputation and other indirect benefits from its relationship with the Portfolio. In addition, the Board took into account that affiliates of the Advisor may benefit from certain indirect tax benefits relating to dividend received deductions and foreign tax credits. The Board also noted that the Advisor paid the subadvisory fee to the Subadvisor, an affiliate of the Advisor. Based upon its review, the Board concluded that the Advisor’s and its affiliates’ level of profitability from their relationship with the Portfolio was reasonable.
The Board considered the effect of the Portfolio's current size and potential growth on its performance and fees. Although the Portfolio’s advisory fee did not contain breakpoints that would reduce the advisory fee rate on assets above specified asset levels, the Board noted that if the Portfolio’s assets increased over time, the Portfolio might realize other economies of scale if assets increased proportionally more than certain other expenses. The Board also noted that given the Portfolio’s current level of assets, the Portfolio would be unlikely to recognize economies of scale by implementing a breakpoint in the advisory fee at this time.
In reapproving the Investment Advisory Agreement, the Board, including the disinterested Directors, did not identify any single factor as controlling, and each Director may have attributed different weight to various factors.
www.calvert.com CALVERT VP S&P MIDCAP 400 INDEX PORTFOLIO ANNUAL REPORT (UNAUDITED) 31
In evaluating the Investment Subadvisory Agreement, the disinterested Directors reviewed information provided by the Subadvisor relating to its operations, personnel, investment philosophy, strategies and techniques. Among other information, the Subadvisor provided biographical information on portfolio management and other professional staff, performance information for itself, and descriptions of its investment philosophies, strategies and techniques, organizational and management structures and brokerage policies and practices.
The Board reapproved the Investment Subadvisory Agreement between the Subadvisor and the Advisor based on a number of factors relating to the Subadvisor's ability to perform under the Investment Subadvisory Agreement. In the course of its deliberations, the Board evaluated, among other factors: the nature, extent and the quality of the services to be provided by the Subadvisor; the Subadvisor's management style and long-term performance record; the Portfolio's performance record and the Subadvisor's performance in employing its investment strategies; the Subadvisor's current level of staffing and its overall resources; the qualifications and experience of the Subadvisor's personnel; the Subadvisor's financial condition with respect to its ability to perform the services required under the Investment Subadvisory Agreement; the Subadvisor's risk management processes; the Subadvisor's compliance systems, including those related to personal investing; and any disciplinary history. Based upon its review, the Board concluded that it was satisfied with the nature, extent and quality of services provided to the Portfolio by the Subadvisor under the Investment Subadvisory Agreement.
As noted above, the Board considered, among other information, the Portfolio's performance during the one-, three- and five-year periods ended June 30, 2015, as compared to the Portfolio's peer group and noted that it reviewed on a quarterly basis detailed information about the Portfolio's performance results, portfolio composition and investment strategies. The Board noted the Advisor's expertise and resources in monitoring the performance, investment style and risk adjusted performance of the Subadvisor.
In considering the cost of services to be provided by the Subadvisor and the profitability to the Subadvisor of its relationship with the Portfolio, the Board noted that the Advisor and Subadvisor were affiliated and the subadvisory fee under the Investment Subadvisory Agreement was paid by the Advisor out of the advisory fee that the Advisor received under the Investment Advisory Agreement. Based upon its review, the Board determined that the subadvisory fee was reasonable in view of the quality of services received by the Portfolio from the Subadvisor and the other factors considered. Because the Advisor would pay the Subadvisor’s subadvisory fee, the cost of services to be provided by the Subadvisor and the level of profitability to the Subadvisor from its relationship with the Portfolio were not material factors in the Board’s deliberations. For similar reasons, the Board did not consider the potential economies of scale in the Subadvisor’s management of the Portfolio to be a material factor in its consideration.
In reapproving the Investment Subadvisory Agreement, the Board, including the disinterested Directors, did not identify any single factor as controlling, and each Director may have attributed different weight to various factors.
Conclusions
The Board reached the following conclusions regarding the Investment Advisory Agreement and the Investment Subadvisory Agreement, among others: (a) the Advisor has demonstrated that it possesses the capability and resources to perform the duties required of it under the Investment Advisory Agreement; (b) the Subadvisor is qualified to manage the Portfolio's assets in accordance with the Portfolio’s investment objective and policies; (c) the Advisor and Subadvisor maintain appropriate compliance programs; (d) the Subadvisor is likely to execute its investment strategies consistently over time; (e) the performance of the Portfolio is satisfactory relative to the performance of passively-managed funds that track the same benchmark index as does the Portfolio; and (f) the Portfolio's advisory and subadvisory fees are reasonable in view of the quality of services received by the Portfolio from the Advisor and Subadvisor and the other factors considered. Based on its conclusions, the Board determined that reapproval of the Investment Advisory Agreement and the Investment Subadvisory Agreement would be in the best interests of the Portfolio and its shareholders.
32 www.calvert.com CALVERT VP S&P MIDCAP 400 INDEX PORTFOLIO ANNUAL REPORT (UNAUDITED)
DIRECTOR AND OFFICER INFORMATION TABLE
|
| | | | | |
| Name & Age | Position with Fund | Position Start Date | Principal Occupation During Last 5 Years | # of Calvert Portfolios Overseen | Other Directorships |
| INDEPENDENT DIRECTORS |
FRANK H. BLATZ, JR., Esq. AGE: 80 | Director | 1982 CVS
2008 CVP | Of counsel to firm of Schiller & Pittenger, P.C. | 13 | None |
ALICE GRESHAM BULLOCK AGE: 65 | Director | 1999 CVS
2008 CVP | Professor at Howard University School of Law. She is former Dean of Howard University School of Law and Deputy Director of the Association of American Law Schools. | 15 | None |
M. CHARITO KRUVANT AGE: 70 | Director | 1999 CVS
2008 CVP | President and CEO of Creative Associates International, Inc., a firm that specializes in human resources development, information management, public affairs and private enterprise development. | 22 | • Acacia Federal Savings Bank (through 2013) • Summit Foundation • WETA Public Broadcasting |
CYNTHIA MILLIGAN AGE: 69
| Director | 1999 CVS
2008 CVP | Dean Emeritus, College of Business Administration, University of Nebraska, Lincoln. She is former President and Chief Executive Officer for CMA, a consulting firm for financial institutions. | 15 | • Wells Fargo Company (banking and financial services) - NYSE • Wells Fargo Bank N.A. (Since 2014) • Gallup, Inc. (management consulting) • W.K. Kellogg Foundation • Raven Industries (technology company) - NASDAQ • Colonial Williamsburg Foundation • Kellogg Company (food manufacturing) - NYSE |
ARTHUR J. PUGH AGE: 78 | Director | 1982 CVS
2008 CVP | Retired executive. | 13 | None |
| INTERESTED DIRECTORS |
WILLIAM LESTER* AGE: 58 | Director & Chair (CVS)
Director & Senior Vice President (CVP) | 2004 CVS
2008 CVP | Executive Vice President Finance/Investments and Corporate Treasurer of Ameritas Mutual Holding Company. Chair and former President (resigned 2012) of Ameritas Investment Partners, Inc. | 13 | • Acacia Federal Savings Bank (through 2013)• Ameritas Investment Partners, Inc. (financial services)• Ameritas Investment Corp. (financial services)• Universal and Inland Insurance Companies• Bryan/LGH Health Systems |
www.calvert.com CALVERT VP S&P MIDCAP 400 INDEX PORTFOLIO ANNUAL REPORT (UNAUDITED) 33
|
| | | | | |
| Name & Age | Position with Fund | Position Start Date | Principal Occupation During Last 5 Years | # of Calvert Portfolios Overseen | Other Directorships |
| INTERESTED DIRECTORS |
JOHN H. STREUR* AGE: 56
| President (CVS)
Director, Chair & President (CVP) | 2015 | President and Chief Executive Officer of Calvert Investments, Inc. (since January 2015) and Chief Compliance Officer for the Advisor and Calvert Investment Distributors, Inc. (since August 10, 2015); President and Director, Portfolio 21 Investments, Inc. (through October 2014); President, Chief Executive Officer and Director, Managers Investment Group LLC (through January 2012); President and Director, The Managers Funds and Managers AMG Funds (through January 2012). | 40 | • Portfolio 21 Investments, Inc. (asset management)(through October 2014) • Managers Investment Group LLC (asset management)(through January 2012) • The Managers Funds (asset management) (through January 2012) • Managers AMG Funds (asset management) (through January 2012) • Calvert Social Investment Foundation |
|
| | | |
| Name & Age | Position with Fund | Position Start Date | Principal Occupation During Last 5 Years |
| OFFICERS |
VICKI L. BENJAMIN AGE: 54 | Treasurer | 2015 | Executive Vice President, Chief Financial Officer and Chief Operating Officer of Calvert Investments, Inc. since October 2015; Senior Vice President and Chief Financial Officer of Calvert Investments, Inc. (March 2015 - September 2015). Prior to Calvert, Ms. Benjamin was a Senior Partner at KPMG. |
ROBERT D. BENSON, ESQ. AGE: 37 | Assistant Vice President & Assistant Secretary | 2014 | Assistant General Counsel (since 2014), Assistant Vice President & Assistant Secretary (since 2015) and Staff Attorney (prior to 2014), Calvert Investments, Inc. |
HOPE BROWN AGE: 42 | Chief Compliance Officer | 2014 | Chief Compliance Officer for the Calvert Funds (since 2014). Vice President and Chief Compliance Officer, Wilmington Funds (2012-2014). Vice President and Senior Compliance Officer, Wilmington Trust Investment Advisors, Inc. (2010-2012). |
STU DALHEIM AGE: 46 | Vice President | 2015 | Vice President - Shareholder Advocacy for the Advisor. |
MATTHEW DUCH Age: 40 | Vice President | 2011 | Vice President of the Advisor and portfolio manager for Calvert’s taxable fixed-income funds. |
ROBERT J. ENDERSON, CFA AGE: 57 | Assistant Treasurer | 2014 | Vice President, Corporate Finance, of Calvert Investments, Inc.; Acting Chief Financial Officer of Calvert Investments, Inc. (September 2014 - March 2015). |
PATRICK FAUL AGE: 51 | Vice President | 2010 | Vice President and Head of Credit Research for the Advisor. |
TRACI L. GOLDT AGE: 42 | Assistant Secretary | 2004 | SEC Filing and Administrative Operations Manager, Calvert Investments, Inc. |
JADE HUANG AGE: 41 | Vice President | 2015 | Equity Portfolio Manager since November 2015 and Senior Equity Analyst prior to November 2015, Advisor. |
EMILY KAISER AGE: 32 | Assistant Vice President | 2015 | Senior Sustainability Analyst since November 2015 and Sustainability Analyst (January 2014 - October 2015), Advisor. Prior to joining Calvert, Ms. Kaiser attended law school from 2010 to 2013 and also held legal and policy positions with the U.S. Agency for International Development (2013), the Solidarity Center, AFL-CIO (2013), the U.S. Department of Labor (2012), the office of the U.S. Trade Representative (2012) and the Public International Law and Policy Group (2011-2012). |
VISHAL KHANDUJA, CFA AGE: 37 | Vice President | 2014 | Head of Taxable Fixed Income (since 2015) and Vice President of the Advisor (since 2014); Portfolio Manager for Calvert’s taxable fixed-income funds since 2012. Previously worked at Columbia Management as Portfolio Manager - Global Rates and Currency Team (2009-2012). |
34 www.calvert.com CALVERT VP S&P MIDCAP 400 INDEX PORTFOLIO ANNUAL REPORT (UNAUDITED)
|
| | | |
| Name & Age | Position with Fund | Position Start Date | Principal Occupation During Last 5 Years |
| OFFICERS |
LANCELOT A. KING, ESQ. AGE: 45 | Assistant Vice President & Secretary | 2002 | Assistant Vice President, Assistant Secretary and Associate General Counsel of Calvert Investments, Inc. |
ERICA LASDON AGE: 44 | Assistant Vice President | 2015 | Director of Sustainability Research since August 2015 and Senior Sustainability Analyst and Manager prior to August 2015, Advisor. |
JOSHUA LINDER AGE: 30 | Vice President | 2015 | Equity Portfolio Manager since November 2015, Assistant Portfolio Manager (January 2014 - October 2015) and Equity Analyst (2011 - 2013), Advisor. |
CHRISTOPHER MADDEN AGE: 40 | Vice President | 2015 | Equity Portfolio Manager since November 2015 and Senior Equity Analyst prior to November 2015, Advisor. |
ANDREW K. NIEBLER, ESQ. AGE: 48 | Assistant Vice President & Assistant Secretary | 2006 | Assistant Vice President, Assistant Secretary and Associate General Counsel of Calvert Investments, Inc. |
MARYBETH PILAT, CPA AGE: 47 | Fund Controller and Assistant Treasurer | 2015 | Director of Fund Administration, Calvert Investment Administrative Services, Inc. since August 2015. VP Expense & Budgeting, Global Fiduciary Platform, Legg Mason (May 2015 - July 2015). Vice President and Assistant Treasurer, Columbia Funds, Ameriprise, Columbia Management (2010 - April 2015). |
| |
| * | The address of Directors and Officers is 4550 Montgomery Avenue, Suite 1000N, Bethesda, Maryland 20814. Mr. Streur is an interested person of the Fund since he is an officer and director of the Fund’s Advisor and its affiliates. Mr. Lester is an interested person of the Fund since he is an officer and director of the parent company of the Fund’s Advisor. |
Additional information about the Fund’s Directors can be found in the Statement of Additional Information (SAI). You can get a free copy of the SAI by contacting your broker, or the Fund at 1-800-368-2745.
www.calvert.com CALVERT VP S&P MIDCAP 400 INDEX PORTFOLIO ANNUAL REPORT (UNAUDITED) 35
|
| |
| | |
This report is intended to provide fund information to shareholders. It is not authorized for distribution to prospective investors unless preceded or accompanied by a prospectus. Note: The information on our website is not incorporated by reference into this report; our website address is included as an inactive textual reference only. Investors should carefully consider the investment objectives, risks, charges and expenses of the Calvert Funds. This and other important information is contained in the fund’s summary prospectus and prospectus, which can be obtained from your financial professional and should be read carefully before investing. You may also call Calvert at 800/368-2745. |
| Printed on recycled paper using soy inks. | |
|
| |
|
Calvert VP NASDAQ 100 Index Portfolio |
Annual Report December 31, 2015 | |
|
| | | | |
| | TABLE OF CONTENTS |
| | | | | |
| | | | | Portfolio Management Discussion |
| | | | | Understanding Your Fund's Expenses |
| | | | | Report of Independent Registered Public Accounting Firm |
| | | | | Schedule of Investments |
| | | | | Statement of Assets and Liabilities |
| | | | | Statement of Operations |
| | | | | Statements of Changes in Net Assets |
| | | | | Notes to Financial Statements |
| | | | | Financial Highlights |
| | | | | Proxy Voting |
| | | | | Availability of Quarterly Portfolio Holdings |
| | | | | Basis for Board’s Approval of Investment Advisory Contracts |
| | | | | Director and Officer Information Table |
|
| |
| PORTFOLIO MANAGEMENT DISCUSSION |
|
| |
| Kevin L. Keene Vice President, Ameritas Investment Partners, Inc. |
Market Review
The broad domestic equity market was largely unchanged for 2015 as the market grappled with competing economic forces. The first six months of the year were marked by generally calm equity markets and the last six months saw a significant increase in volatility. After much speculation and anticipation, the Federal Reserve increased short-term interest rates in December for the first time in nearly 10 years. Turmoil in Chinese markets finally spread across the globe as the NASDAQ 100 Index lost 14% over a six week period. Domestic economic data has been generally positive, if not robust. Unemployment stands at nearly 5% at year-end; however gross domestic product (GDP) growth has been weak by historical recovery standards.
Investment Strategy and Technique:
As an index portfolio, the Calvert VP NASDAQ 100 Index Portfolio (the Portfolio) seeks as closely as possible to replicate the holdings and match the performance of the NASDAQ 100 Index. In pursuit of this objective, the Portfolio employs a passive management approach and holds each member of the index. Cash holdings gain exposure to the index via futures contracts so that 100% of the Portfolio’s assets are fully invested.
Fund Performance Relative to the Benchmark
For the year ended December 31, 2015, the Portfolio's Class I shares returned 9.07% compared with 9.75% for the NASDAQ 100 Index (The Index). The underperformance relative to the Index was largely attributable to fees and operating expenses, which the Index does not incur. The Portfolio continued to meet its objective by closely tracking the Index. The NASDAQ 100 Index outperformed the broad equity market as its focus on large cap stocks, a heavy weighting in the technology sector, and no exposure to the energy sector were all positives in 2015.
Positioning and Market Outlook
Entering 2016, the outlook for equities is mixed. The economy continues to expand modestly and headline employment is nearing peak levels.
|
| | | |
| ECONOMIC SECTORS | % OF TOTAL INVESTMENTS | |
| Information Technology | 52.2 | % | |
| Consumer Discretionary | 19.6 | % | |
| Health Care | 14.0 | % | |
| Consumer Staples | 6.5 | % | |
| Short-Term Investments | 2.7 | % | |
| Exchange-Traded Products | 2.3 | % | |
| Industrials | 1.4 | % | |
| Telecommunication Services | 1.0 | % | |
| Government | 0.3 | % | |
| Total | 100.0 | % | |
| | | |
| TEN LARGEST STOCK HOLDINGS | % OF NET ASSETS | |
| Apple, Inc. | 10.5 | % | |
| Microsoft Corp. | 7.9 | % | |
| Amazon.com, Inc. | 5.7 | % | |
| Alphabet, Inc., Class C | 4.7 | % | |
| Facebook, Inc., Class A | 4.3 | % | |
| Alphabet, Inc., Class A | 4.1 | % | |
| Intel Corp. | 2.9 | % | |
| Gilead Sciences, Inc. | 2.6 | % | |
| Comcast Corp., Class A | 2.5 | % | |
| Cisco Systems, Inc. | 2.5 | % | |
| Total | 47.7 | % | |
| | | |
With the Federal Reserve increasing interest rates for the first time in almost a decade, it is giving the economy a vote of confidence. However, there is no shortage of risk as we enter the new year. The bull market that began in 2009 is starting to show its age as questions arise over its ability to continue now that the Federal Reserve has essentially taken its foot off the gas. Commodity price declines continue to point to weak global growth, which will be a headwind to new highs in the stock market.
Ameritas Investment Partners, Inc.
December 2015
www.calvert.com CALVERT VP NASDAQ 100 INDEX PORTFOLIO ANNUAL REPORT (UNAUDITED) 1
Growth of $10,000
The graph below shows the value of a hypothetical $10,000 investment in the Portfolio over the past 10 fiscal year periods. The results shown are for Class I shares, and assume the reinvestment of dividends. The result is compared with a broad based market index. Market indexes are unmanaged and their results do not reflect the effect of expenses or sales charges. The value of an investment in a different share class would be different.
|
| | | | | | |
| CALVERT VP NASDAQ 100 INDEX PORTFOLIO |
| DECEMBER 31, 2015 |
| AVERAGE ANNUAL TOTAL RETURNS | 1 Year | 5 Year | 10 Year |
| Class I | 9.07 | % | 16.37 | % | 11.15 | % |
| Class F | 9.02 | % | 16.35 | % | 11.14 | % |
| NASDAQ 100 | 9.75 | % | 17.09 | % | 11.82 | % |
| | | | |
| Calvert VP Nasdaq 100 Index Portfolio first offered Class F shares on October 30, 2015. Performance prior to that date reflects the performance of Class I shares. Actual Class F share performance would have been different. |
| | | | |
The performance data shown represents past performance, does not guarantee future results and assumes reinvestment of all dividends and distributions. All performance data reflects fee waivers and/or expense limitations, if any are in effect; in their absence performance would be lower. See Note B in Notes to Financial Statements. The investment return and principal value of an investment will fluctuate so that an investor’s shares, when redeemed, may be worth more or less than their original cost. Current performance may be lower or higher than the performance data quoted.
Visit calvert.com/institutional-VP-performance.html for current performance data. The gross expense ratio from the current prospectus for the Portfolio is 0.63%. This number may vary from the expense ratio shown elsewhere in this report because it is based on a different time period and, if applicable, does not include fee or expense waivers. The performance data and expense ratio reflect deduction of Portfolio operating expenses, but do not reflect charges and expenses imposed under the variable annuity or life insurance contract.
2 www.calvert.com CALVERT VP NASDAQ 100 INDEX PORTFOLIO ANNUAL REPORT (UNAUDITED)
UNDERSTANDING YOUR FUND'S EXPENSES
As an investor, you incur two types of costs. There are transaction costs. There are also ongoing costs, which generally include management fees and other fund expenses. The following information is intended to help you understand your ongoing costs (in dollars) of investing in this mutual fund and to help you compare these costs with the ongoing costs of investing in other mutual funds.
To illustrate these ongoing costs, we have provided examples and calculated the expenses paid by the Fund's investors during the period. The actual and hypothetical information presented in the examples is based on an investment of $1,000 invested at the beginning of the period and held for the entire period (July 1, 2015 to December 31, 2015).
Note: Expenses do not reflect charges and expenses of the variable annuity or variable universal life contract.
Actual Expenses
The first line of the table below provides information about actual account values and actual expenses. You may use the information in this line, together with the amount you invested, to estimate the expenses that you paid over the period. Simply divide your account value by $1,000 (for example, an $8,600 account value divided by $1,000 = 8.6), then multiply the result by the number in the first line under the heading entitled “Expenses Paid During Period” to estimate the expenses you paid on your account during this period.
Hypothetical Example for Comparison Purposes
The second line of the table below provides information about hypothetical account values and hypothetical expenses based on the Fund’s actual expense ratio and an assumed rate of return of 5% per year before expenses, which is not the Fund’s actual return. The hypothetical account values and expenses may not be used to estimate the actual ending account balance or expenses you paid for the period. You may use this information to compare the ongoing costs of investing in the Fund and other funds. To do so, compare the 5% hypothetical example with the 5% hypothetical examples that appear in the shareholder reports of the other funds.
Please note that the expenses shown in the table are meant to highlight your ongoing costs only and do not reflect any transactional costs. Therefore, the second line of the table is useful in comparing ongoing costs only, and will not help you determine the relative total costs of owning different funds. In addition, if these transactional costs were included, your costs would have been higher.
|
| | | | |
| | ANNUALIZED
EXPENSE RATIO | BEGINNING
ACCOUNT VALUE
7/1/15 | ENDING
ACCOUNT VALUE
12/31/15 | EXPENSES PAID
DURING PERIOD*
7/1/15 - 12/31/15 |
| Class I | | | | |
| Actual | 0.62% | $1,000.00 | $1,048.20 | $3.20 |
| Hypothetical (5% return per year before expenses) | 0.62% | $1,000.00 | $1,022.08 | $3.16 |
| Class F | | | | |
| Actual | 0.87% | $1,000.00 | $1,047.70 | $4.49 |
| Hypothetical (5% return per year before expenses) | 0.87% | $1,000.00 | $1,020.82 | $4.43 |
| |
| * Expenses paid during the period are equal to the annualized expense ratio for each class as indicated above, multiplied by the average account value over the period, multiplied by 184/365 (to reflect the one-half year period). Expense ratios shown in the Financial Highlights represent the actual expenses incurred for the fiscal year. |
www.calvert.com CALVERT VP NASDAQ 100 INDEX PORTFOLIO ANNUAL REPORT (UNAUDITED) 3
REPORT OF INDEPENDENT REGISTERED PUBLIC ACCOUNTING FIRM
The Board of Directors of Calvert Variable Products, Inc. and Shareholders of Calvert VP Nasdaq 100 Index Portfolio:
We have audited the accompanying statement of assets and liabilities, including the schedule of investments, of the Calvert VP Nasdaq 100 Index Portfolio (the “Portfolio”), a series of Calvert Variable Products, Inc., as of December 31, 2015, and the related statement of operations for the year then ended, the statements of changes in net assets for each of the years in the two-year period then ended, and the financial highlights for each of the years or periods in the five-year period then ended. These financial statements and financial highlights are the responsibility of the Portfolio’s management. Our responsibility is to express an opinion on these financial statements and financial highlights based on our audits.
We conducted our audits in accordance with the standards of the Public Company Accounting Oversight Board (United States). Those standards require that we plan and perform the audit to obtain reasonable assurance about whether the financial statements and financial highlights are free of material misstatement. An audit includes examining, on a test basis, evidence supporting the amounts and disclosures in the financial statements. Our procedures included confirmation of securities owned as of December 31, 2015, by correspondence with the custodian and brokers or by performing other appropriate auditing procedures. An audit also includes assessing the accounting principles used and significant estimates made by management, as well as evaluating the overall financial statement presentation. We believe that our audits provide a reasonable basis for our opinion.
In our opinion, the financial statements and financial highlights referred to above present fairly, in all material respects, the financial position of the Portfolio as of December 31, 2015, the results of its operations for the year then ended, the changes in its net assets for each of the years in the two-year period then ended, and the financial highlights for each of the years or periods in the five-year period then ended, in conformity with U.S. generally accepted accounting principles.
Philadelphia, Pennsylvania
February 24, 2016
4 www.calvert.com CALVERT VP NASDAQ 100 INDEX PORTFOLIO ANNUAL REPORT
CALVERT VP NASDAQ 100 INDEX PORTFOLIO
SCHEDULE OF INVESTMENTS
DECEMBER 31, 2015
|
| | |
| | SHARES | VALUE ($) |
| COMMON STOCKS - 94.8% | | |
| | | |
| Airlines - 0.5% | | |
| American Airlines Group, Inc. | 10,606 | 449,164 |
| | | |
| Automobiles - 0.6% | | |
| Tesla Motors, Inc. * | 2,203 | 528,742 |
| | | |
| Beverages - 0.5% | | |
| Monster Beverage Corp. * | 3,407 | 507,507 |
| | | |
| Biotechnology - 10.7% | | |
| Alexion Pharmaceuticals, Inc. * | 3,791 | 723,133 |
| Amgen, Inc. | 12,692 | 2,060,292 |
| Biogen, Inc. * | 3,751 | 1,149,119 |
| BioMarin Pharmaceutical, Inc. * | 2,713 | 284,214 |
| Celgene Corp. * | 13,219 | 1,583,107 |
| Gilead Sciences, Inc. | 24,249 | 2,453,756 |
| Incyte Corp. * | 3,130 | 339,449 |
| Regeneron Pharmaceuticals, Inc. * | 1,719 | 933,194 |
| Vertex Pharmaceuticals, Inc. * | 4,134 | 520,181 |
| | | 10,046,445 |
| | | |
| Commercial Services & Supplies - 0.2% | | |
| Stericycle, Inc. * | 1,396 | 168,358 |
| | | |
| Communications Equipment - 3.8% | | |
| Cisco Systems, Inc. | 85,410 | 2,319,308 |
| QUALCOMM, Inc. | 25,291 | 1,264,171 |
| | | 3,583,479 |
| | | |
| Food & Staples Retailing - 3.1% | | |
| Costco Wholesale Corp. | 7,360 | 1,188,640 |
| Walgreens Boots Alliance, Inc. | 17,604 | 1,499,069 |
| Whole Foods Market, Inc. | 5,742 | 192,357 |
| | | 2,880,066 |
| | | |
| Food Products - 2.9% | | |
| Kraft Heinz Co. (The) | 20,418 | 1,485,614 |
| Mondelez International, Inc., Class A | 26,712 | 1,197,766 |
| | | 2,683,380 |
| | | |
| Health Care Equipment & Supplies - 0.4% | | |
| Intuitive Surgical, Inc. * | 629 | 343,535 |
| | | |
www.calvert.com CALVERT VP NASDAQ 100 INDEX PORTFOLIO ANNUAL REPORT 5
|
| | |
| | SHARES | VALUE ($) |
| COMMON STOCKS - Cont'd | | |
| Health Care Providers & Services - 1.3% | | |
| Express Scripts Holding Co. * | 11,379 | 994,638 |
| Henry Schein, Inc. * | 1,377 | 217,828 |
| | | 1,212,466 |
| | | |
| Health Care Technology - 0.4% | | |
| Cerner Corp. * | 5,721 | 344,233 |
| | | |
| Hotels, Restaurants & Leisure - 2.1% | | |
| Marriott International, Inc., Class A | 4,326 | 290,015 |
| Norwegian Cruise Line Holdings Ltd. * | 3,861 | 226,255 |
| Starbucks Corp. | 24,983 | 1,499,729 |
| | | 2,015,999 |
| | | |
| Internet & Catalog Retail - 9.3% | | |
| Amazon.com, Inc. * | 7,887 | 5,330,744 |
| Ctrip.com International Ltd. (ADR) * | 5,254 | 243,418 |
| Expedia, Inc. | 1,971 | 244,995 |
| JD.com, Inc. (ADR) * | 14,669 | 473,295 |
| Liberty Interactive Corp. QVC Group, Class A * | 7,868 | 214,954 |
| Liberty Ventures, Series A * | 2,262 | 102,039 |
| Netflix, Inc. * | 7,191 | 822,507 |
| Priceline Group, Inc. (The) * | 841 | 1,072,233 |
| TripAdvisor, Inc. * | 2,211 | 188,488 |
| | | 8,692,673 |
| | | |
| Internet Software & Services - 15.3% | | |
| Akamai Technologies, Inc. * | 2,925 | 153,943 |
| Alphabet, Inc.: | | |
| Class A * | 4,902 | 3,813,805 |
| Class C * | 5,813 | 4,411,369 |
| Baidu, Inc. (ADR) * | 4,662 | 881,305 |
| eBay, Inc. * | 20,202 | 555,151 |
| Facebook, Inc., Class A * | 38,203 | 3,998,326 |
| Yahoo!, Inc. * | 15,890 | 528,501 |
| | | 14,342,400 |
| | | |
| IT Services - 2.9% | | |
| Automatic Data Processing, Inc. | 7,744 | 656,072 |
| Cognizant Technology Solutions Corp., Class A * | 10,231 | 614,064 |
| Fiserv, Inc. * | 3,845 | 351,664 |
| Paychex, Inc. | 6,066 | 320,831 |
| PayPal Holdings, Inc. * | 20,556 | 744,127 |
| | | 2,686,758 |
| | | |
| Leisure Products - 0.2% | | |
| Mattel, Inc. | 5,655 | 153,646 |
| | | |
| Life Sciences - Tools & Services - 0.5% | | |
| Illumina, Inc. * | 2,463 | 472,760 |
| | | |
6 www.calvert.com CALVERT VP NASDAQ 100 INDEX PORTFOLIO ANNUAL REPORT
|
| | |
| | SHARES | VALUE ($) |
| COMMON STOCKS - Cont'd | | |
| Machinery - 0.3% | | |
| PACCAR, Inc. | 5,947 | 281,888 |
| Media - 5.7% | | |
| Charter Communications, Inc., Class A * | 1,889 | 345,876 |
| Comcast Corp., Class A | 41,127 | 2,320,797 |
| Discovery Communications, Inc.: | | |
| Class A * | 2,448 | 65,313 |
| Class C * | 4,668 | 117,727 |
| DISH Network Corp., Class A * | 3,783 | 216,312 |
| Liberty Global plc: | | |
| Class A * | 4,253 | 180,157 |
| Class C * | 9,934 | 405,009 |
| Liberty Media Corp.: | | |
| Class A * | 1,744 | 68,452 |
| Class C * | 3,703 | 141,010 |
| Sirius XM Holdings, Inc. * | 88,247 | 359,165 |
| Twenty-First Century Fox, Inc.: | | |
| Class A | 19,699 | 535,025 |
| Class B | 13,436 | 365,862 |
| Viacom, Inc., Class B | 5,841 | 240,415 |
| | | 5,361,120 |
| | | |
| Multiline Retail - 0.3% | | |
| Dollar Tree, Inc. * | 3,951 | 305,096 |
| | | |
| Pharmaceuticals - 0.7% | | |
| Endo International plc * | 3,810 | 233,248 |
| Mylan NV * | 8,274 | 447,375 |
| | | 680,623 |
| | | |
| Professional Services - 0.2% | | |
| Verisk Analytics, Inc. * | 2,851 | 219,185 |
| | | |
| Semiconductors & Semiconductor Equipment - 7.6% | | |
| Analog Devices, Inc. | 5,196 | 287,443 |
| Applied Materials, Inc. | 20,202 | 377,171 |
| Avago Technologies Ltd. | 4,644 | 674,077 |
| Intel Corp. | 79,402 | 2,735,399 |
| KLA-Tencor Corp. | 2,673 | 185,372 |
| Lam Research Corp. | 2,618 | 207,922 |
| Linear Technology Corp. | 3,931 | 166,950 |
| Maxim Integrated Products, Inc. | 4,782 | 181,716 |
| Micron Technology, Inc. * | 18,269 | 258,689 |
| NVIDIA Corp. | 9,052 | 298,354 |
| NXP Semiconductors NV * | 4,236 | 356,883 |
| Skyworks Solutions, Inc. | 3,216 | 247,085 |
| Texas Instruments, Inc. | 17,015 | 932,592 |
| Xilinx, Inc. | 4,296 | 201,783 |
| | | 7,111,436 |
| | | |
www.calvert.com CALVERT VP NASDAQ 100 INDEX PORTFOLIO ANNUAL REPORT 7
|
| | |
| | SHARES | VALUE ($) |
| COMMON STOCKS - Cont'd | | |
| Software - 11.3% | | |
| Activision Blizzard, Inc. | 12,303 | 476,249 |
| Adobe Systems, Inc. * | 8,393 | 788,438 |
| Autodesk, Inc. * | 3,788 | 230,803 |
| CA, Inc. | 7,277 | 207,831 |
| Check Point Software Technologies Ltd. * | 3,021 | 245,849 |
| Citrix Systems, Inc. * | 2,627 | 198,733 |
| Electronic Arts, Inc. * | 5,190 | 356,657 |
| Intuit, Inc. | 4,442 | 428,653 |
| Microsoft Corp. | 134,405 | 7,456,789 |
| Symantec Corp. | 11,214 | 235,494 |
| | | 10,625,496 |
| | | |
| Specialty Retail - 1.4% | | |
| Bed Bath & Beyond, Inc. * | 2,830 | 136,548 |
| O'Reilly Automotive, Inc. * | 1,648 | 417,636 |
| Ross Stores, Inc. | 6,852 | 368,706 |
| Tractor Supply Co. | 2,238 | 191,349 |
| Ulta Salon, Cosmetics & Fragrance, Inc. * | 1,076 | 199,060 |
| | | 1,313,299 |
| | | |
| Technology Hardware, Storage & Peripherals - 11.4% | | |
| Apple, Inc. | 93,811 | 9,874,546 |
| NetApp, Inc. | 4,973 | 131,934 |
| SanDisk Corp. | 3,389 | 257,530 |
| Seagate Technology plc | 5,007 | 183,556 |
| Western Digital Corp. | 3,899 | 234,135 |
| | | 10,681,701 |
| | | |
| Trading Companies & Distributors - 0.2% | | |
| Fastenal Co. | 4,856 | 198,222 |
| | | |
| Wireless Telecommunication Services - 1.0% | | |
| SBA Communications Corp., Class A * | 2,152 | 226,111 |
| T-Mobile US, Inc. * | 13,731 | 537,157 |
| Vodafone Group plc (ADR) | 6,609 | 213,206 |
| | | 976,474 |
| | | |
| Total Common Stocks (Cost $45,581,269) | | 88,866,151 |
| | | |
| | | |
| EXCHANGE-TRADED PRODUCTS - 2.3% | | |
| Powershares QQQ Trust, Series 1 | 19,500 | 2,181,270 |
| | | |
| Total Exchange-Traded Products (Cost $2,036,475) | | 2,181,270 |
8 www.calvert.com CALVERT VP NASDAQ 100 INDEX PORTFOLIO ANNUAL REPORT
|
| | | | |
| | PRINCIPAL
AMOUNT ($) | VALUE ($) |
| U.S. TREASURY OBLIGATIONS - 0.3% | | |
| United States Treasury Bills, 0.152%, 3/31/16 ^ | 300,000 | 299,873 |
|
| | | |
| Total U.S. Treasury Obligations (Cost $299,887) | | 299,873 |
|
| | | |
| | | |
| TIME DEPOSIT - 2.7% | | |
| State Street Bank Time Deposit, 0.278%, 1/4/16 | 2,496,753 | 2,496,753 |
|
| | | |
| Total Time Deposit (Cost $2,496,753) | | 2,496,753 |
|
| | | |
| | | |
| TOTAL INVESTMENTS (Cost $50,414,384) - 100.1% | | 93,844,047 |
|
| Other assets and liabilities, net - (0.1)% | | (69,438) |
|
NET ASSETS - 100.0% | |
| $93,774,609 |
|
|
|
| NOTES TO SCHEDULE OF INVESTMENTS |
| * Non-income producing security. |
| ^ Futures collateralized by $300,000 par value of U.S. Treasury Bills. |
|
| |
| Abbreviations: |
| ADR.: | American Depositary Receipts |
| Ltd.: | Limited |
| plc: | Public Limited Company |
|
| | | | | | |
| FUTURES | NUMBER OF
CONTRACTS | EXPIRATION
DATE | UNDERLYING FACE AMOUNT AT VALUE | UNREALIZED
APPRECIATION
(DEPRECIATION) |
| Long: | | | | | |
| | E-Mini NASDAQ 100 Index^ | 29 | 3/16 | $2,660,895 | $430 |
| See notes to financial statements. |
www.calvert.com CALVERT VP NASDAQ 100 INDEX PORTFOLIO ANNUAL REPORT 9
CALVERT VP NASDAQ 100 INDEX PORTFOLIO
STATEMENT OF ASSETS AND LIABILITIES
DECEMBER 31, 2015
|
| | | |
| ASSETS | |
| Investments in securities, at value (Cost $50,414,384) - see accompanying schedule |
| $93,844,047 |
|
| Receivable for shares sold | 35,437 |
|
| Dividends and interest receivable | 37,580 |
|
| Directors' deferred compensation plan | 61,061 |
|
| Total assets | 93,978,125 |
|
| | |
| LIABILITIES | |
| Payable for shares redeemed | 34,504 |
|
| Payable for futures contracts variation margin | 33,785 |
|
| Payable to Calvert Investment Management, Inc. | 28,122 |
|
| Payable to Calvert Investment Distributors, Inc. | 21 |
|
| Payable to Calvert Investment Administrative Services, Inc. | 8,009 |
|
| Payable to Calvert Investment Services, Inc. | 1,638 |
|
| Directors' deferred compensation plan | 61,061 |
|
| Accrued expenses and other liabilities | 36,376 |
|
| Total liabilities | 203,516 |
|
| NET ASSETS |
| $93,774,609 |
|
| | |
| NET ASSETS CONSIST OF: | |
| Paid-in capital applicable to the following shares of common stock outstanding; | |
| $0.10 par value, 20,000,000 shares authorized: | |
| Class I: 1,915,222 shares outstanding |
| $46,419,374 |
|
| Class F: 2,023 shares outstanding | 101,609 |
|
| Undistributed net investment income | 542,067 |
|
| Accumulated net realized gain (loss) | 3,281,466 |
|
| Net unrealized appreciation (depreciation) | 43,430,093 |
|
| NET ASSETS |
| $93,774,609 |
|
| | |
| NET ASSET VALUE PER SHARE | |
| Class I (based on net assets of $93,675,680) |
| $48.91 |
|
| Class F (based on net assets of $98,929) |
| $48.91 |
|
| See notes to financial statements. |
10 www.calvert.com CALVERT VP NASDAQ 100 INDEX PORTFOLIO ANNUAL REPORT
CALVERT VP NASDAQ 100 INDEX PORTFOLIO
STATEMENT OF OPERATIONS
YEAR ENDED DECEMBER 31, 2015
|
| | | |
| NET INVESTMENT INCOME | |
| Investment Income: | |
| Dividend income (net of foreign taxes withheld of $378) |
| $1,089,119 |
|
| Interest income | 3,254 |
|
| Total investment income | 1,092,373 |
|
| | |
| Expenses: | |
| Investment advisory fee | 311,688 |
|
| Administrative fees | 89,054 |
|
| Transfer agency fees and expenses | 11,443 |
|
| Distribution Plan expenses: | |
| Class F (a) | 42 |
|
| Directors' fees and expenses | 15,971 |
|
| Accounting fees | 21,623 |
|
| Custodian fees | 22,242 |
|
| Professional fees | 33,058 |
|
| Reports to shareholders | 21,593 |
|
| Licensing fees | 23,000 |
|
| Miscellaneous | 582 |
|
| Total expenses | 550,296 |
|
| NET INVESTMENT INCOME | 542,077 |
|
| | |
| | |
| REALIZED AND UNREALIZED GAIN (LOSS) | |
| Net realized gain (loss) on: | |
| Investments | 3,156,440 |
|
| Futures | 148,212 |
|
| | 3,304,652 |
|
| | |
| Change in unrealized appreciation (depreciation) on: | |
| Investments | 3,756,205 |
|
| Futures | 10,800 |
|
| | 3,767,005 |
|
| | |
| NET REALIZED AND UNREALIZED GAIN (LOSS) | 7,071,657 |
|
| | |
| INCREASE (DECREASE) IN NET ASSETS RESULTING FROM OPERATIONS |
| $7,613,734 |
|
| | |
| (a) From October 30, 2015 inception. | |
| See notes to financial statements. |
www.calvert.com CALVERT VP NASDAQ 100 INDEX PORTFOLIO ANNUAL REPORT 11
CALVERT VP NASDAQ 100 INDEX PORTFOLIO
STATEMENTS OF CHANGES IN NET ASSETS
|
| | | | | | | |
| INCREASE (DECREASE) IN NET ASSETS | YEAR ENDED
DECEMBER 31, 2015 | | YEAR ENDED
DECEMBER 31, 2014 |
| Operations: | | | |
| Net investment income |
| $542,077 |
| |
| $851,332 |
|
| Net realized gain (loss) | 3,304,652 |
| | 7,737,751 |
|
| Change in unrealized appreciation (depreciation) | 3,767,005 |
| | 5,071,065 |
|
| | | | |
| INCREASE (DECREASE) IN NET ASSETS RESULTING FROM OPERATIONS | 7,613,734 |
| | 13,660,148 |
|
| | | | |
| Distributions to shareholders from: | | | |
| Net investment income: | | | |
| Class I shares | (48,796) |
| | (915,724) |
|
| Net realized gain: | | | |
| Class I shares | (1,520,782) |
| | (7,949,781) |
|
| Class F shares (a) | (1,608) |
| | — |
|
| Total distributions | (1,571,186) |
| | (8,865,505) |
|
| | | | |
| Capital share transactions: | | | |
| Shares sold: | | | |
| Class I shares | 15,059,436 |
| | 8,706,637 |
|
| Class F shares (a) | 100,001 |
| | — |
|
| Reinvestment of distributions: | | | |
| Class I shares | 1,569,578 |
| | 8,865,505 |
|
| Class F shares (a) | 1,608 |
| | — |
|
| Shares redeemed: | | | |
| Class I shares | (11,695,826) |
| | (20,443,966) |
|
| Total capital share transactions | 5,034,797 |
| | (2,871,824) |
|
| | | | |
| TOTAL INCREASE (DECREASE) IN NET ASSETS | 11,077,345 |
| | 1,922,819 |
|
| | | | |
| | | | |
| NET ASSETS | | | |
| Beginning of year | 82,697,264 |
| | 80,774,445 |
|
| End of year (including undistributed net investment income of $542,067 and $48,786, respectively) |
| $93,774,609 |
| |
| $82,697,264 |
|
| | | | |
| CAPITAL SHARE ACTIVITY | | | |
| Shares sold: | | | |
| Class I shares | 315,094 |
| | 184,533 |
|
| Class F shares (a) | 1,991 |
| | — |
|
| Reinvestment of distributions: | | | |
| Class I shares | 31,416 |
| | 192,394 |
|
| Class F shares (a) | 32 |
| | — |
|
| Shares redeemed: | | | |
| Class I shares | (245,382) |
| | (442,114) |
|
| Total capital share activity | 103,151 |
| | (65,187) |
|
| | | | |
| (a) From October 30, 2015 inception. | | | |
| See notes to financial statements. |
12 www.calvert.com CALVERT VP NASDAQ 100 INDEX PORTFOLIO ANNUAL REPORT
NOTES TO FINANCIAL STATEMENTS
NOTE A — SIGNIFICANT ACCOUNTING POLICIES
General: Calvert VP Nasdaq 100 Index Portfolio (the “Portfolio”), a series of Calvert Variable Products, Inc. (the “Fund”), is registered under the Investment Company Act of 1940 as a diversified, open-end management investment company. The Fund is comprised of eleven separate portfolios. The operations of each series of the Fund are accounted for separately. The Portfolio applies the accounting and reporting guidance in the Financial Accounting Standards Board (FASB) Accounting Standards Codification Topic 946, Financial Services – Investment Companies (ASC 946).
The Portfolio offers Class F and Class I shares. Class F shares commenced operations on October 30, 2015. Class F shares are subject to Distribution Plan expenses, while Class I shares are not. Shares of the Portfolio are sold without sales charge to affiliated and unaffiliated insurance companies for allocation to certain of their variable separate accounts. Each class has different: (a) dividend rates, due to differences in Distribution Plan expenses and other class-specific expenses, (b) exchange privileges; and (c) class-specific voting rights.
Security Valuation: Net asset value per share is determined every business day as of the close of the regular session of the New York Stock Exchange (generally 4:00 p.m. Eastern time). The Portfolio uses independent pricing services approved by the Board of Directors (“the Board”) to value its investments wherever possible. Investments for which market quotations are not available or deemed not reliable are fair valued in good faith under the direction of the Board.
The Board has adopted Valuation Procedures (the “Procedures”) to determine the fair value of securities and other financial instruments for which market prices are not readily available or which may not be reliably priced. The Board has delegated the day-to-day responsibility for determining the fair value of assets of the Portfolio to Calvert Investment Management, Inc. (the “Advisor” or “Calvert”) and has provided these Procedures to govern Calvert in its valuation duties.
Calvert has chartered an internal Valuation Committee to oversee the implementation of these Procedures and to assist it in carrying out the valuation responsibilities that the Board has delegated.
The Valuation Committee meets on a regular basis to review illiquid securities and other investments which may not have readily available market prices. The Valuation Committee’s fair valuation determinations are subject to review, approval and ratification by the Board at its next regularly scheduled meeting covering the calendar quarter in which the fair valuation was determined.
The Valuation Committee utilizes various methods to measure the fair value of the Portfolio’s investments. U.S. generally accepted accounting principles (GAAP) establishes a disclosure hierarchy that categorizes the inputs to valuation techniques used to value assets and liabilities at measurement date. These inputs are summarized in the three broad levels listed below:
Level 1 - quoted prices in active markets for identical securities
Level 2 - other significant observable inputs (including quoted prices for similar securities, interest rates, prepayment speeds, credit risk, etc.)
Level 3 - significant unobservable inputs (including the Portfolio’s own assumptions in determining the fair value of investments)
The inputs or methodologies used for valuing securities are not necessarily an indication of the risk associated with investing in those securities.
Changes in valuation techniques may result in transfers in or out of an investment’s assigned level within the hierarchy during the year. Transfers in and/or out of levels are determined based on the fair value of such securities at the end of the year. Valuation techniques used to value the Portfolio’s investments by major category are as follows:
Common stock securities, including restricted securities, for which market quotations are readily available, are valued at the last reported sale price or official closing price as reported by an independent pricing service on the primary market or exchange on which they are traded and are categorized as Level 1 in the hierarchy. In the event there were no sales during the day or closing prices are not available, securities are valued at the last quoted bid price or the last available price and are categorized as Level 2 in the hierarchy. Foreign securities are valued based on quotations from the principal market in which such securities are normally traded. If events occur after the close of the principal
www.calvert.com CALVERT VP NASDAQ 100 INDEX PORTFOLIO ANNUAL REPORT 13
market in which foreign securities are traded, and before the close of business of the Portfolio, that are expected to materially affect the value of those securities, then they are valued at their fair value taking these events into account and are categorized as Level 2 in the hierarchy.
Exchange-traded products are valued at the official closing price as reported by an independent pricing service on the primary market or exchange on which they are traded and are categorized as Level 1 in the hierarchy.
Debt securities, including restricted securities, are valued based on evaluated prices received from independent pricing services or from dealers who make markets in such securities. For U.S. government and government agency obligations, pricing services utilize matrix pricing which considers yield or price of bonds of comparable quality, coupon, maturity and type as well as dealer supplied prices and such securities are generally categorized as Level 2 in the hierarchy. Short-term securities of sufficient credit quality with remaining maturities of sixty days or less for which quotations are not readily available are valued at amortized cost, which approximates fair value, and are categorized as Level 2 in the hierarchy.
Futures contracts are valued at unrealized appreciation (depreciation) based on the settlement price established each day by the board of trade or exchange on which they are traded and are categorized as Level 1 in the hierarchy.
If a market value cannot be determined for a security using the methodologies described above, or if, in the good faith opinion of the Advisor, the market value does not constitute a readily available market quotation, or if a significant event has occurred that would materially affect the value of the security, the security will be fair valued as determined in good faith by the Valuation Committee.
The Valuation Committee considers a number of factors, including significant unobservable valuation inputs when arriving at fair value. It considers all significant facts that are reasonably available and relevant to the determination of fair value.
The Valuation Committee primarily employs a market-based approach which may use related or comparable assets or liabilities, recent transactions, market multiples, book values, and other relevant information for the investment to determine the fair value of the investment. When more appropriate, the Portfolio may employ an income-based or cost approach. An income-based valuation approach discounts anticipated future cash flows of the investment to calculate a present amount (discounted). The measurement is based on the value indicated by current market expectations about those future amounts. Discounts may also be applied due to the nature or duration of any restrictions on the disposition of the investments. A cost based approach is based on the amount that currently would be required to replace the service capacity of an asset (current replacement cost). From the seller’s perspective, the price that would be received for the asset is determined based on the cost to a buyer to acquire or construct a substitute asset of comparable utility, adjusted for obsolescence.
The values assigned to fair value investments are based on available information and do not necessarily represent amounts that might ultimately be realized. Further, due to the inherent uncertainty of valuations of such investments, the fair values may differ significantly from the values that would have been used had an active market existed, and the differences could be material. The Valuation Committee employs various methods for calibrating these valuation approaches including a regular review of key inputs and assumptions, transactional back-testing or disposition analysis and reviews of any related market activity.
At December 31, 2015, no securities were fair valued in good faith under the direction of the Board.
14 www.calvert.com CALVERT VP NASDAQ 100 INDEX PORTFOLIO ANNUAL REPORT
The following table summarizes the market value of the Portfolio's holdings as of December 31, 2015, based on the inputs used to value them:
|
| | | | | | | | | | | |
| | VALUATION INPUTS |
| INVESTMENTS IN SECURITIES* | LEVEL 1 | LEVEL 2 | LEVEL 3 | TOTAL |
| Common Stocks** |
| $88,866,151 |
| $— |
| $— |
|
| $88,866,151 |
|
| Exchange-Traded Products | 2,181,270 |
| — |
| — |
| 2,181,270 |
|
| U.S. Treasury Obligations | — |
| 299,873 |
| — |
| 299,873 |
|
| Time Deposit | — |
| 2,496,753 |
| — |
| 2,496,753 |
|
| TOTAL |
| $91,047,421 |
|
| $2,796,626 |
| $— |
|
| $93,844,047 |
|
| Futures Contracts*** |
| $430 |
| $— |
| $— |
|
| $430 |
|
| |
| * For a complete listing of investments, please refer to the Schedule of Investments. |
| ** For further breakdown of equity securities by industry type, please refer to the Schedule of Investments. |
| *** The value listed for these securities reflects unrealized appreciation (depreciation) as shown in the Schedule of Investments. |
There were no transfers between levels during the year.
Futures Contracts: The Portfolio may purchase and sell futures contracts to manage overall portfolio volatility. These futures contracts may include, but are not limited to, futures contracts based on U.S. government obligations and market index futures contracts. The Portfolio may enter into futures contracts agreeing to buy or sell a financial instrument for a set price at a future date. Initial margin deposits of either cash or securities as required by the broker are made upon entering into the contract. While the contract is open, daily variation margin payments are made to or received from the broker reflecting the daily change in market value of the contract and are recorded for financial reporting purposes as unrealized gains or losses by the Portfolio. When a futures contract is closed, a realized gain or loss is recorded equal to the difference between the opening and closing value of the contract. The risks associated with entering into futures contracts may include the possible illiquidity of the secondary market which would limit the Portfolio’s ability to close out a futures contract prior to the settlement date, an imperfect correlation between the value of the contracts and the underlying financial instruments, or that the counterparty will fail to perform its obligations under the contracts’ terms. Futures contracts are designed by boards of trade which are designated “contracts markets” by the Commodities Futures Trading Commission. Futures contracts trade on the contracts markets in a manner that is similar to the way a stock trades on a stock exchange, and the boards of trade, through their clearing corporations, guarantee the futures contracts against default. As a result, there is minimal counterparty credit risk to the Portfolio. During the year, futures contracts were used to adjust the Portfolio’s overall equity exposure in an effort to stabilize portfolio volatility around a target level. The Portfolio’s futures contracts at year end are presented in the Schedule of Investments.
At December 31, 2015, the Portfolio had the following derivatives, categorized by risk exposure:
|
| | | | | |
| Risk | Statement of Assets and Liabilities | Assets | Statement of Assets and Liabilities | Liabilities | |
| Equity | Unrealized appreciation on futures contracts | $430* | Unrealized depreciation on futures contracts | ($—)* | |
| * Only the current day’s variation margin is reported within the Statement of Assets and Liabilities. |
The effect of derivative instruments on the Statement of Operations for the year ended December 31, 2015 was as follows:
|
| | | |
| | Statement of Operations Location |
| Risk | Derivatives | Net Realized Gain (Loss) | Net Change in Unrealized Appreciation (Depreciation) |
| Equity | Futures | $148,212 | $10,800 |
www.calvert.com CALVERT VP NASDAQ 100 INDEX PORTFOLIO ANNUAL REPORT 15
During the year, the Portfolio invested in E-Mini NASDAQ 100 Index futures. The volume of outstanding contracts has varied throughout the year with an average number of contracts as in the following table:
|
| |
| Derivative Description | Average Number of Contracts* |
| Futures contracts long | 38 |
| Futures contracts short | — |
| | |
| *Averages are based on activity levels during the year ended December 31, 2015. |
Security Transactions and Investment Income: Security transactions are accounted for on trade date. Realized gains and losses are recorded on an identified cost basis and may include proceeds from litigation. Dividend income is recorded on the ex-dividend date or, in the case of dividends on certain foreign securities, as soon as the Portfolio is informed of the ex-dividend date. Withholding taxes on foreign dividends have been provided for in accordance with the Portfolio’s understanding of the applicable country’s tax rules and rates. Distributions received on securities that represent a return of capital are recorded as a reduction of cost of investments. Distributions received on securities that represent a capital gain are recorded as a realized gain. Interest income, which includes amortization of premium and accretion of discount on debt securities, is accrued as earned. Investment income and realized and unrealized gains and losses are allocated to separate classes of shares based upon the relative net assets of each class. Expenses arising in connection with a specific class are charged directly to that class. Expenses common to the classes are allocated to each class in proportion to their relative net assets.
Foreign Currency Transactions: The Portfolio’s accounting records are maintained in U.S. dollars. For valuation of assets and liabilities on each date of net asset value determination, foreign denominations are converted into U.S. dollars using the current exchange rate. Security transactions, income, and expenses are translated at the prevailing rate of exchange on the date of the event. The effect of changes in foreign exchange rates on securities and foreign currencies is included in the net realized and unrealized gain or loss on investments and assets and liabilities denominated in foreign currencies.
Distributions to Shareholders: Distributions to shareholders are recorded by the Portfolio on ex-dividend date. Dividends from net investment income and distributions from net realized capital gains, if any, are paid at least annually. Distributions are determined in accordance with income tax regulations which may differ from U.S. generally accepted accounting principles; accordingly, periodic reclassifications are made within the Portfolio's capital accounts to reflect income and gains available for distribution under income tax regulations.
Estimates: The preparation of financial statements in conformity with U.S. generally accepted accounting principles requires management to make estimates and assumptions that affect the reported amounts of assets and liabilities and disclosure of contingent assets and liabilities at the date of the financial statements and the reported amounts of increases and decreases in net assets from operations during the reporting period. Actual results could differ from those estimates.
Redemption Fees: The Portfolio charged a 2% redemption fee on redemptions, including exchanges, made within 30 days of purchase in the same Fund. The redemption fee was accounted for as an addition to paid-in capital. This fee was eliminated effective February 2, 2015.
Federal Income Taxes: No provision for federal income or excise tax is required since the Portfolio intends to continue to qualify as a regulated investment company under the Internal Revenue Code and to distribute substantially all of its taxable earnings.
Management has analyzed the Portfolio's tax positions taken for all open federal income tax years and has concluded that no provision for federal income tax is required in the Portfolio's financial statements. A Portfolio's federal tax return is subject to examination by the Internal Revenue Service for a period of three years.
NOTE B — RELATED PARTY TRANSACTIONS
Calvert Investment Management, Inc. (the “Advisor”) is wholly-owned by Calvert Investments, Inc., which is indirectly wholly-owned by Ameritas Mutual Holding Company. The Advisor provides investment advisory services and pays the salaries and fees of officers and Directors of the Fund who are employees of the Advisor or its affiliates. For its services, the Advisor receives an annual fee, payable monthly, of 0.35% of the Portfolio’s average daily net assets.
16 www.calvert.com CALVERT VP NASDAQ 100 INDEX PORTFOLIO ANNUAL REPORT
The Advisor has contractually agreed to limit net annual portfolio operating expenses through April 30, 2016 for Class I and through April 30, 2017 for Class F. The contractual expense caps are 0.94% for Class F and 0.69% for Class I. For the purpose of this expense limit, operating expenses do not include interest expense, brokerage commissions, taxes, and extraordinary expenses. This expense limitation does not limit acquired fund fees and expenses, if any.
Calvert Investment Administrative Services, Inc. ("CIAS"), an affiliate of the Advisor, provides administrative services to the Portfolio for an annual fee, payable monthly, of 0.10% of the Portfolio’s average daily net assets.
On November 24, 2015, the Board of Directors approved the recommendation made by CIAS to standardize and rationalize the administrative fee paid by the Calvert Funds at 0.12% for all series and all share classes of the Calvert Funds. CIAS and the Portfolio have entered into an Amended and Restated Administrative Services Agreement that will establish a 0.12% administrative fee commencing on May 1, 2016. CIAS has contractually agreed to waive 0.02% (the difference between the current administrative fee and the new 0.12% fee) from May 1, 2016 through April 30, 2018.
Calvert Investment Distributors, Inc. (“CID”), an affiliate of the Advisor, is the distributor and principal underwriter for the Portfolio. Pursuant to Rule 12b-1 under the Investment Company Act of 1940, the Portfolio has adopted a Distribution Plan that permits the Portfolio to pay certain expenses associated with the distribution and servicing of its Class F shares. The expenses paid may not exceed 0.25% annually of the average daily net assets of Class F.
Calvert Investment Services, Inc. (“CIS”), an affiliate of the Advisor, acts as shareholder servicing agent for the Portfolio. For its services, CIS received a fee of $6,679 for the year ended December 31, 2015. Boston Financial Data Services, Inc. is the transfer and dividend disbursing agent.
Each Director of the Fund who is not an employee of the Advisor or its affiliates receives a fee of $1,500 for each Board and Committee meeting attended plus an annual fee of $44,000. Committee chairs receive an additional $5,000 annual retainer. Eligible Directors may participate in a Deferred Compensation Plan (the “Plan”). Obligations of the Plan will be paid solely out of the Portfolio’s assets. Directors’ fees are allocated to each of the portfolios served.
NOTE C — INVESTMENT ACTIVITY AND TAX INFORMATION
During the year, the cost of purchases and proceeds from sales of investments, other than short-term securities, were $9,896,812 and $6,848,601, respectively.
The tax character of dividends and distributions paid during the years ended December 31, 2015 and December 31, 2014 was as follows:
|
| | | | | | |
| DISTRIBUTIONS PAID FROM: | 2015 | 2014 |
| Ordinary income |
| $197,601 |
|
| $1,696,565 |
|
| Long-term capital gains | 1,373,585 |
| 7,168,940 |
|
| Total |
| $1,571,186 |
|
| $8,865,505 |
|
As of December 31, 2015, the tax basis components of distributable earnings/(accumulated losses) and the federal tax cost were as follows:
|
| | | |
| Unrealized appreciation |
| $44,268,681 |
|
| Unrealized (depreciation) | (869,084) |
|
| Net unrealized appreciation (depreciation) |
| $43,399,597 |
|
| Undistributed ordinary income |
| $597,268 |
|
| Undistributed long-term capital gain |
| $3,256,761 |
|
| Federal income tax cost of investments |
| $50,444,450 |
|
The differences between the components of distributable earnings on a tax basis and the amounts reflected in the Statement of Assets and Liabilities are primarily due to temporary book-tax differences that will reverse in a subsequent period. These differences are mainly due to wash sales and Section 1256 contracts.
www.calvert.com CALVERT VP NASDAQ 100 INDEX PORTFOLIO ANNUAL REPORT 17
NOTE D — LINE OF CREDIT
A financing agreement is in place with the Calvert Funds and State Street Corporation (“SSC”). Under the agreement, SSC provides an unsecured line of credit facility, in the aggregate amount of $50 million ($25 million committed and $25 million uncommitted), accessible by the Calvert Funds for temporary or emergency purposes only. Borrowings bear interest at the higher of the London Interbank Offered Rate (LIBOR) or the overnight Federal Funds Rate plus 1.25% per annum. A commitment fee of 0.20% per annum is incurred on the unused portion of the committed facility. An administrative fee of $25,000 was paid in connection with the uncommitted facility. These fees are allocated to all participating funds. The Portfolio had no borrowings under the agreement during the year ended December 31, 2015.
NOTE E — SUBSEQUENT EVENTS
In preparing the financial statements as of December 31, 2015, no subsequent events or transactions occurred that would have required recognition or disclosure in these financial statements.
NOTICE TO SHAREHOLDERS (UNAUDITED)
For the fiscal year ended December 31, 2015, the Portfolio considers 0% of the ordinary dividends paid during the year as qualified dividend income and as eligible for the corporate dividends received deduction in accordance with Section 854 of the Internal Revenue Code. The Portfolio also considers $1,373,585 of the long-term capital gain distributions paid during the year as capital gain dividends in accordance with Section 852(b)(3)(C) of the Internal Revenue Code.
18 www.calvert.com CALVERT VP NASDAQ 100 INDEX PORTFOLIO ANNUAL REPORT
CALVERT VP NASDAQ 100 INDEX PORTFOLIO
FINANCIAL HIGHLIGHTS
|
| | | | | | | | | | | | | | | | | | | | |
| | YEARS ENDED | |
| CLASS I SHARES | December 31, 2015 (a) | | December 31, 2014 | | December 31, 2013 | | December 31, 2012 | | December 31, 2011 | |
| Net asset value, beginning |
| $45.59 |
| |
| $42.98 |
| |
| $32.57 |
| |
| $29.67 |
| |
| $30.46 |
| |
| Income from investment operations: | | | | | | | | | | |
| Net investment income | 0.29 |
| | 0.53 |
| | 0.32 |
| | 0.28 |
| | 0.09 |
| |
| Net realized and unrealized gain (loss) | 3.87 |
| | 7.55 |
| | 11.39 |
| | 4.90 |
| | 0.83 |
| |
| Total from investment operations | 4.16 |
| | 8.08 |
| | 11.71 |
| | 5.18 |
| | 0.92 |
| |
| Distributions from: | | | | | | | | | | |
| Net investment income | (0.03) |
| | (0.57) |
| | (0.32) |
| | (0.24) |
| | (0.09) |
| |
| Net realized gain | (0.81) |
| | (4.90) |
| | (0.98) |
| | (2.04) |
| | (1.62) |
| |
| Total distributions | (0.84) |
| | (5.47) |
| | (1.30) |
| | (2.28) |
| | (1.71) |
| |
| Total increase (decrease) in net asset value | 3.32 |
| | 2.61 |
| | 10.41 |
| | 2.90 |
| | (0.79) |
| |
| Net asset value, ending |
| $48.91 |
| |
| $45.59 |
| |
| $42.98 |
| |
| $32.57 |
| |
| $29.67 |
| |
| Total return(b) | 9.07 | % | | 18.66 | % | | 36.05 | % | | 17.62 | % | | 3.02 | % | |
| Ratios to average net assets: (c) | | | | | | | | | | |
| Net investment income | 0.61 | % | | 1.07 | % | | 0.80 | % | | 0.84 | % | | 0.27 | % | |
| Total expenses | 0.62 | % | | 0.63 | % | | 0.61 | % | | 0.63 | % | | 0.67 | % | |
| Net expenses | 0.62 | % | | 0.63 | % | | 0.61 | % | | 0.63 | % | | 0.65 | % | |
| Portfolio turnover | 8 | % | | 11 | % | | 13 | % | | 17 | % | | 23 | % | |
| Net assets, ending (in thousands) |
| $93,676 |
| |
| $82,697 |
| |
| $80,774 |
| |
| $64,689 |
| |
| $53,984 |
| |
| | | | | | | | | | | |
| (a)Per share figures are calculated using the Average Shares Method. | |
| (b)Total return is not annualized for periods of less than one year and does not reflect charges and expenses of the variable annuity or variable universal life contract. | |
| (c)Total expenses do not reflect amounts reimbursed and/or waived by the Advisor and certain of its affiliates, if applicable. Net expenses are net of all reductions and represent the net expenses paid by the Portfolio. | |
| See notes to financial statements. |
www.calvert.com CALVERT VP NASDAQ 100 INDEX PORTFOLIO ANNUAL REPORT 19
CALVERT VP NASDAQ 100 INDEX PORTFOLIO
FINANCIAL HIGHLIGHTS
|
| | | | |
| | PERIOD ENDED | |
| CLASS F SHARES | December 31, 2015 (a)(b) | |
| Net asset value, beginning |
| $50.24 |
| |
| Income from investment operations: | | |
| Net investment income | 0.06 |
| |
| Net realized and unrealized gain (loss) | (0.58) |
| |
| Total from investment operations | (0.52) |
| |
| Distributions from: | | |
| Net realized gain | (0.81) |
| |
| Total distributions | (0.81) |
| |
| Total increase (decrease) in net asset value | (1.33) |
| |
| Net asset value, ending |
| $48.91 |
| |
| Total return(c) | (1.07 | %) | |
| Ratios to average net assets (d) | | |
| Net investment income | 0.71%(e) |
| |
| Total expenses | 0.87%(e) |
| |
| Net expenses | 0.87%(e) |
| |
| Portfolio turnover | 8 | % | |
| Net assets, ending (in thousands) |
| $99 |
| |
| | | |
| (a)From October 30, 2015 inception. | | |
| (b)Per share figures are calculated using the Average Shares Method. |
| (c)Total return is not annualized for periods of less than one year and does not reflect charges and expenses of the variable annuity or variable universal life contract. |
| (d)Total expenses do not reflect amounts reimbursed and/or waived by the Advisor and certain of its affiliates, if applicable. Net expenses are net of all reductions and represent the net expenses paid by the Portfolio. |
| (e)Annualized. |
| See notes to financial statements. |
20 www.calvert.com CALVERT VP NASDAQ 100 INDEX PORTFOLIO ANNUAL REPORT
PROXY VOTING
The Proxy Voting Guidelines that the Portfolio uses to determine how to vote proxies relating to portfolio securities is provided as an Appendix to the Fund’s Statement of Additional Information. The Statement of Additional Information can be obtained free of charge by calling the Fund at 1-800-368-2745, by visiting the Calvert website at www.calvert.com or by visiting the SEC’s website at www.sec.gov.
Information regarding how the Fund voted proxies relating to portfolio securities during the most recent 12-month period ended June 30 is available by calling the Fund, by visiting the Calvert website at www.calvert.com or visiting the SEC’s website at www.sec.gov.
AVAILABILITY OF QUARTERLY PORTFOLIO HOLDINGS
The Fund files its complete schedule of portfolio holdings with the SEC for the first and third quarters of each fiscal year on Form N-Q. The Fund’s Form N-Q is available on the SEC’s website at www.sec.gov. The Fund’s Form N-Q may be reviewed and copied at the SEC’s Public Reference Room in Washington, DC; information on the operation of the Public Reference Room may be obtained by calling 1-800-SEC-0330.
BASIS FOR BOARD'S APPROVAL OF INVESTMENT ADVISORY CONTRACTS
At a meeting held on December 9, 2015, the Board of Directors, and by a separate vote, the disinterested Directors, approved the continuance of the Investment Advisory Agreement between the Portfolio and the Advisor and the Investment Subadvisory Agreement between the Advisor and the Subadvisor with respect to the Portfolio.
In evaluating the Investment Advisory Agreement, the Board considered a variety of information relating to the Portfolio and the Advisor. The disinterested Directors reviewed a report prepared by the Advisor regarding various services provided to the Portfolio by the Advisor and its affiliates. Such report included, among other data, information regarding the Advisor's personnel and the Advisor's revenue and cost of providing services to the Portfolio, and a separate report prepared by an independent third party, which provided a statistical analysis comparing the Portfolio's investment performance, expenses, and fees to comparable mutual funds.
The disinterested Directors were separately represented by independent legal counsel with respect to their consideration of the reapproval of the Investment Advisory Agreement and the Investment Subadvisory Agreement. Prior to voting, the disinterested Directors reviewed the proposed continuance of the Investment Advisory Agreement and Investment Subadvisory Agreement with management and also met in private sessions with their counsel at which no representatives of management were present.
In the course of its deliberations regarding the Investment Advisory Agreement, the Board considered the following factors, among others: the nature, extent and quality of the services provided by the Advisor, including the personnel providing such services; the Advisor's financial condition; the level and method of computing the Portfolio's advisory fee; comparative performance, fee and expense information for the Portfolio; the profitability of the Calvert Family of Funds to the Advisor and its affiliates; the allocation of the Portfolio's brokerage, including the Advisor's process for monitoring "best execution"; the direct and indirect benefits, if any, derived by the Advisor and its affiliates from their relationship with the Portfolio; the effect of the Portfolio's growth and size on the Portfolio's performance and expenses; the Advisor's compliance programs and policies; the Advisor's performance of substantially similar duties for other funds; and any possible conflicts of interest.
In considering the nature, extent and quality of the services provided by the Advisor under the Investment Advisory Agreement, the Board reviewed information provided by the Advisor relating to its operations and personnel, including, among other information, biographical information on the Advisor's supervisory and professional staff and descriptions of its organizational and management structure. The Board also took into account similar information provided periodically throughout the previous year by the Advisor, as well as the Board’s familiarity with the Advisor’s management through Board of Directors' meetings, discussions and other reports. The Board considered the Advisor's current level of staffing and overall resources. The Board also noted that it reviewed on a quarterly basis information regarding the Advisor’s compliance with applicable policies and procedures, including those related to personal investing. The Advisor's administrative capabilities, including its ability to supervise the other service providers for the Portfolio, were also considered. The Board discussed the Advisor's effectiveness in monitoring the performance of the Subadvisor and its timeliness in responding to performance issues. The Board observed that the scope of services provided by the Advisor
www.calvert.com CALVERT VP NASDAQ 100 INDEX PORTFOLIO ANNUAL REPORT (UNAUDITED) 21
generally had expanded over time as a result of regulatory, market and other changes. The Board took into consideration, among other factors, the effectiveness of the Portfolio’s and Advisor’s processes, policies and procedures and the Advisor’s personnel. The Board also took into account, among other items, periodic reports received from the Advisor over the past year concerning the Advisor’s ongoing review and enhancement of certain processes, policies and procedures of the Portfolio and the Advisor. The Board concluded that it was satisfied with the nature, extent and quality of services provided to the Portfolio by the Advisor under the Investment Advisory Agreement.
In considering the Portfolio's performance, the Board noted that it reviewed on a quarterly basis detailed information about the Portfolio's performance results, portfolio composition and investment strategies. In addition, the Board took into account overall financial market conditions. The Board also reviewed various comparative data provided to it in connection with its consideration of the renewal of the Investment Advisory Agreement, including, among other information, a comparison of the Portfolio's total return with its Lipper index and with that of other mutual funds deemed to be in its peer universe by an independent third party in its report. This comparison indicated that the Portfolio performed above the median of its peer universe for the one-, three- and five-year periods ended June 30, 2015. The data also indicated that the Portfolio outperformed its Lipper index for the one-, three- and five-year periods ended June 30, 2015. The Board also noted management’s discussion of the Portfolio’s performance, including the impact of differing fees and expenses among the funds in the peer group and the Portfolio’s relative performance. Based upon its review, the Board concluded that the Portfolio’s performance was satisfactory relative to the performance of passively-managed funds that track the same benchmark index as does the Portfolio.
In considering the Portfolio's fees and expenses, the Board compared the Portfolio's fees and total expense ratio with various comparative data for the funds in its peer group. Among other findings, the data indicated that the Portfolio's advisory fee was at the median of its peer group and that total expenses were above the median of its peer group. The Board noted that the allocation of advisory and administrative fees may vary among the Portfolio’s peer group. The Board also took into account the Advisor’s current undertaking to maintain expense limitations for the Portfolio. The Board noted that the Advisor is not currently reimbursing any Portfolio expenses. The Board noted that the Advisor paid the Subadvisor’s subadvisory fee under the Investment Subadvisory Agreement with respect to the Portfolio. The Board also took into account management's discussion of the Portfolio's expenses and certain factors that affected the level of such expenses, including the current size of the Portfolio. Based upon its review, the Board determined that the advisory fee was reasonable in view of the quality of services received by the Portfolio from the Advisor and the other factors considered.
The Board reviewed the Advisor’s profitability on a portfolio-by-portfolio basis. In reviewing the overall profitability of the advisory fee to the Portfolio's Advisor, the Board also considered the fact that affiliates of the Advisor provided shareholder servicing and administrative services to the Portfolio for which they received compensation. The information considered by the Board included Calvert’s operating profit margin information both before and after tax expenses with respect to the services that the Advisor and its affiliates provided to the Calvert Family of Funds complex. The Board reviewed the profitability of the Advisor's relationship with the Portfolio in terms of the total amount of annual advisory fees it received with respect to the Portfolio and whether the Advisor had the financial wherewithal to continue to provide services to the Portfolio. The Board also considered that the Advisor derived benefits to its reputation and other indirect benefits from its relationship with the Portfolio. In addition, the Board took into account that affiliates of the Advisor may benefit from certain indirect tax benefits relating to dividend received deductions and foreign tax credits. The Board also noted that the Advisor paid the subadvisory fee to the Subadvisor, an affiliate of the Advisor. Based upon its review, the Board concluded that the Advisor’s and its affiliates�� level of profitability from their relationship with the Portfolio was reasonable.
The Board considered the effect of the Portfolio's current size and potential growth on its performance and fees. Although the Portfolio’s advisory fee did not contain breakpoints that would reduce the advisory fee rate on assets above specified asset levels, the Board noted that if the Portfolio’s assets increased over time, the Portfolio might realize other economies of scale if assets increased proportionally more than certain other expenses. The Board also noted that given the Portfolio’s current level of assets, the Portfolio would be unlikely to recognize economies of scale by implementing a breakpoint in the advisory fee at this time.
In reapproving the Investment Advisory Agreement, the Board, including the disinterested Directors, did not identify any single factor as controlling, and each Director may have attributed different weight to various factors.
22 www.calvert.com CALVERT VP NASDAQ 100 INDEX PORTFOLIO ANNUAL REPORT (UNAUDITED)
In evaluating the Investment Subadvisory Agreement, the disinterested Directors reviewed information provided by the Subadvisor relating to its operations, personnel, investment philosophy, strategies and techniques. Among other information, the Subadvisor provided biographical information on portfolio management and other professional staff, performance information for itself, and descriptions of its investment philosophies, strategies and techniques, organizational and management structures and brokerage policies and practices.
The Board reapproved the Investment Subadvisory Agreement between the Subadvisor and the Advisor based on a number of factors relating to the Subadvisor's ability to perform under the Investment Subadvisory Agreement. In the course of its deliberations, the Board evaluated, among other factors: the nature, extent and the quality of the services to be provided by the Subadvisor; the Subadvisor's management style and long-term performance record; the Portfolio's performance record and the Subadvisor's performance in employing its investment strategies; the Subadvisor's current level of staffing and its overall resources; the qualifications and experience of the Subadvisor's personnel; the Subadvisor's financial condition with respect to its ability to perform the services required under the Investment Subadvisory Agreement; the Subadvisor's risk management processes; the Subadvisor's compliance systems, including those related to personal investing; and any disciplinary history. Based upon its review, the Board concluded that it was satisfied with the nature, extent and quality of services provided to the Portfolio by the Subadvisor under the Investment Subadvisory Agreement.
As noted above, the Board considered, among other information, the Portfolio's performance during the one-, three- and five-year periods ended June 30, 2015, as compared to the Portfolio's peer universe and noted that it reviewed on a quarterly basis detailed information about the Portfolio's performance results, portfolio composition and investment strategies. The Board noted the Advisor's expertise and resources in monitoring the performance, investment style and risk adjusted performance of the Subadvisor.
In considering the cost of services to be provided by the Subadvisor and the profitability to the Subadvisor of its relationship with the Portfolio, the Board noted that the Advisor and Subadvisor were affiliated and the subadvisory fee under the Investment Subadvisory Agreement was paid by the Advisor out of the advisory fee that the Advisor received under the Investment Advisory Agreement. Based upon its review, the Board determined that the subadvisory fee was reasonable in view of the quality of services received by the Portfolio from the Subadvisor and the other factors considered. Because the Advisor would pay the Subadvisor’s subadvisory fee, the cost of services to be provided by the Subadvisor and the level of profitability to the Subadvisor from its relationship with the Portfolio were not material factors in the Board’s deliberations. For similar reasons, the Board did not consider the potential economies of scale in the Subadvisor’s management of the Portfolio to be a material factor in its consideration.
In reapproving the Investment Subadvisory Agreement, the Board, including the disinterested Directors, did not identify any single factor as controlling, and each Director may have attributed different weight to various factors.
Conclusions
The Board reached the following conclusions regarding the Investment Advisory Agreement and the Investment Subadvisory Agreement, among others: (a) the Advisor has demonstrated that it possesses the capability and resources to perform the duties required of it under the Investment Advisory Agreement; (b) the Subadvisor is qualified to manage the Portfolio's assets in accordance with the Portfolio’s investment objective and policies; (c) the Advisor and Subadvisor maintain appropriate compliance programs; (d) the Subadvisor is likely to execute its investment strategies consistently over time; (e) the performance of the Portfolio is satisfactory relative to the performance of passively-managed funds that track the same benchmark index as does the Portfolio; and (f) the Portfolio's advisory and subadvisory fees are reasonable in view of the quality of services received by the Portfolio from the Advisor and Subadvisor and the other factors considered. Based on its conclusions, the Board determined that reapproval of the Investment Advisory Agreement and the Investment Subadvisory Agreement would be in the best interests of the Portfolio and its shareholders.
www.calvert.com CALVERT VP NASDAQ 100 INDEX PORTFOLIO ANNUAL REPORT (UNAUDITED) 23
DIRECTOR AND OFFICER INFORMATION TABLE
|
| | | | | |
| Name & Age | Position with Fund | Position Start Date | Principal Occupation During Last 5 Years | # of Calvert Portfolios Overseen | Other Directorships |
| INDEPENDENT DIRECTORS |
FRANK H. BLATZ, JR., Esq. AGE: 80 | Director | 1982 CVS
2008 CVP | Of counsel to firm of Schiller & Pittenger, P.C. | 13 | None |
ALICE GRESHAM BULLOCK AGE: 65 | Director | 1999 CVS
2008 CVP | Professor at Howard University School of Law. She is former Dean of Howard University School of Law and Deputy Director of the Association of American Law Schools. | 15 | None |
M. CHARITO KRUVANT AGE: 70 | Director | 1999 CVS
2008 CVP | President and CEO of Creative Associates International, Inc., a firm that specializes in human resources development, information management, public affairs and private enterprise development. | 22 | • Acacia Federal Savings Bank (through 2013) • Summit Foundation • WETA Public Broadcasting |
CYNTHIA MILLIGAN AGE: 69
| Director | 1999 CVS
2008 CVP | Dean Emeritus, College of Business Administration, University of Nebraska, Lincoln. She is former President and Chief Executive Officer for CMA, a consulting firm for financial institutions. | 15 | • Wells Fargo Company (banking and financial services) - NYSE • Wells Fargo Bank N.A. (Since 2014) • Gallup, Inc. (management consulting) • W.K. Kellogg Foundation • Raven Industries (technology company) - NASDAQ • Colonial Williamsburg Foundation • Kellogg Company (food manufacturing) - NYSE |
ARTHUR J. PUGH AGE: 78 | Director | 1982 CVS
2008 CVP | Retired executive. | 13 | None |
| INTERESTED DIRECTORS |
WILLIAM LESTER* AGE: 58 | Director & Chair (CVS)
Director & Senior Vice President (CVP) | 2004 CVS
2008 CVP | Executive Vice President Finance/Investments and Corporate Treasurer of Ameritas Mutual Holding Company. Chair and former President (resigned 2012) of Ameritas Investment Partners, Inc. | 13 | • Acacia Federal Savings Bank (through 2013)• Ameritas Investment Partners, Inc. (financial services)• Ameritas Investment Corp. (financial services)• Universal and Inland Insurance Companies• Bryan/LGH Health Systems |
24 www.calvert.com CALVERT VP NASDAQ 100 INDEX PORTFOLIO ANNUAL REPORT (UNAUDITED)
|
| | | | | |
| Name & Age | Position with Fund | Position Start Date | Principal Occupation During Last 5 Years | # of Calvert Portfolios Overseen | Other Directorships |
| INTERESTED DIRECTORS |
JOHN H. STREUR* AGE: 56
| President (CVS)
Director, Chair & President (CVP) | 2015 | President and Chief Executive Officer of Calvert Investments, Inc. (since January 2015) and Chief Compliance Officer for the Advisor and Calvert Investment Distributors, Inc. (since August 10, 2015); President and Director, Portfolio 21 Investments, Inc. (through October 2014); President, Chief Executive Officer and Director, Managers Investment Group LLC (through January 2012); President and Director, The Managers Funds and Managers AMG Funds (through January 2012). | 40 | • Portfolio 21 Investments, Inc. (asset management)(through October 2014) • Managers Investment Group LLC (asset management)(through January 2012) • The Managers Funds (asset management) (through January 2012) • Managers AMG Funds (asset management) (through January 2012) • Calvert Social Investment Foundation |
|
| | | |
| Name & Age | Position with Fund | Position Start Date | Principal Occupation During Last 5 Years |
| OFFICERS |
VICKI L. BENJAMIN AGE: 54 | Treasurer | 2015 | Executive Vice President, Chief Financial Officer and Chief Operating Officer of Calvert Investments, Inc. since October 2015; Senior Vice President and Chief Financial Officer of Calvert Investments, Inc. (March 2015 - September 2015). Prior to Calvert, Ms. Benjamin was a Senior Partner at KPMG. |
ROBERT D. BENSON, ESQ. AGE: 37 | Assistant Vice President & Assistant Secretary | 2014 | Assistant General Counsel (since 2014), Assistant Vice President & Assistant Secretary (since 2015) and Staff Attorney (prior to 2014), Calvert Investments, Inc. |
HOPE BROWN AGE: 42 | Chief Compliance Officer | 2014 | Chief Compliance Officer for the Calvert Funds (since 2014). Vice President and Chief Compliance Officer, Wilmington Funds (2012-2014). Vice President and Senior Compliance Officer, Wilmington Trust Investment Advisors, Inc. (2010-2012). |
STU DALHEIM AGE: 46 | Vice President | 2015 | Vice President - Shareholder Advocacy for the Advisor. |
MATTHEW DUCH Age: 40 | Vice President | 2011 | Vice President of the Advisor and portfolio manager for Calvert’s taxable fixed-income funds. |
ROBERT J. ENDERSON, CFA AGE: 57 | Assistant Treasurer | 2014 | Vice President, Corporate Finance, of Calvert Investments, Inc.; Acting Chief Financial Officer of Calvert Investments, Inc. (September 2014 - March 2015). |
PATRICK FAUL AGE: 51 | Vice President | 2010 | Vice President and Head of Credit Research for the Advisor. |
TRACI L. GOLDT AGE: 42 | Assistant Secretary | 2004 | SEC Filing and Administrative Operations Manager, Calvert Investments, Inc. |
JADE HUANG AGE: 41 | Vice President | 2015 | Equity Portfolio Manager since November 2015 and Senior Equity Analyst prior to November 2015, Advisor. |
EMILY KAISER AGE: 32 | Assistant Vice President | 2015 | Senior Sustainability Analyst since November 2015 and Sustainability Analyst (January 2014 - October 2015), Advisor. Prior to joining Calvert, Ms. Kaiser attended law school from 2010 to 2013 and also held legal and policy positions with the U.S. Agency for International Development (2013), the Solidarity Center, AFL-CIO (2013), the U.S. Department of Labor (2012), the office of the U.S. Trade Representative (2012) and the Public International Law and Policy Group (2011-2012). |
VISHAL KHANDUJA, CFA AGE: 37 | Vice President | 2014 | Head of Taxable Fixed Income (since 2015) and Vice President of the Advisor (since 2014); Portfolio Manager for Calvert’s taxable fixed-income funds since 2012. Previously worked at Columbia Management as Portfolio Manager - Global Rates and Currency Team (2009-2012). |
www.calvert.com CALVERT VP NASDAQ 100 INDEX PORTFOLIO ANNUAL REPORT (UNAUDITED) 25
|
| | | |
| Name & Age | Position with Fund | Position Start Date | Principal Occupation During Last 5 Years |
| OFFICERS |
LANCELOT A. KING, ESQ. AGE: 45 | Assistant Vice President & Secretary | 2002 | Assistant Vice President, Assistant Secretary and Associate General Counsel of Calvert Investments, Inc. |
ERICA LASDON AGE: 44 | Assistant Vice President | 2015 | Director of Sustainability Research since August 2015 and Senior Sustainability Analyst and Manager prior to August 2015, Advisor. |
JOSHUA LINDER AGE: 30 | Vice President | 2015 | Equity Portfolio Manager since November 2015, Assistant Portfolio Manager (January 2014 - October 2015) and Equity Analyst (2011 - 2013), Advisor. |
CHRISTOPHER MADDEN AGE: 40 | Vice President | 2015 | Equity Portfolio Manager since November 2015 and Senior Equity Analyst prior to November 2015, Advisor. |
ANDREW K. NIEBLER, ESQ. AGE: 48 | Assistant Vice President & Assistant Secretary | 2006 | Assistant Vice President, Assistant Secretary and Associate General Counsel of Calvert Investments, Inc. |
MARYBETH PILAT, CPA AGE: 47 | Fund Controller and Assistant Treasurer | 2015 | Director of Fund Administration, Calvert Investment Administrative Services, Inc. since August 2015. VP Expense & Budgeting, Global Fiduciary Platform, Legg Mason (May 2015 - July 2015). Vice President and Assistant Treasurer, Columbia Funds, Ameriprise, Columbia Management (2010 - April 2015). |
| |
| * | The address of Directors and Officers is 4550 Montgomery Avenue, Suite 1000N, Bethesda, Maryland 20814. Mr. Streur is an interested person of the Fund since he is an officer and director of the Fund’s Advisor and its affiliates. Mr. Lester is an interested person of the Fund since he is an officer and director of the parent company of the Fund’s Advisor. |
Additional information about the Fund’s Directors can be found in the Statement of Additional Information (SAI). You can get a free copy of the SAI by contacting your broker, or the Fund at 1-800-368-2745.
26 www.calvert.com CALVERT VP NASDAQ 100 INDEX PORTFOLIO ANNUAL REPORT (UNAUDITED)
|
| |
| | |
This report is intended to provide fund information to shareholders. It is not authorized for distribution to prospective investors unless preceded or accompanied by a prospectus. Note: The information on our website is not incorporated by reference into this report; our website address is included as an inactive textual reference only. Investors should carefully consider the investment objectives, risks, charges and expenses of the Calvert Funds. This and other important information is contained in the fund’s summary prospectus and prospectus, which can be obtained from your financial professional and should be read carefully before investing. You may also call Calvert at 800/368-2745. |
| Printed on recycled paper using soy inks. | |
|
| |
|
Calvert VP Russell 2000 Small Cap Index Portfolio |
Annual Report December 31, 2015 | |
|
| | | | |
| | TABLE OF CONTENTS |
| | | | | |
| | | | | Portfolio Management Discussion |
| | | | | Understanding Your Fund's Expenses |
| | | | | Report of Independent Registered Public Accounting Firm |
| | | | | Schedule of Investments |
| | | | | Statement of Assets and Liabilities |
| | | | | Statement of Operations |
| | | | | Statements of Changes in Net Assets |
| | | | | Notes to Financial Statements |
| | | | | Financial Highlights |
| | | | | Proxy Voting |
| | | | | Availability of Quarterly Portfolio Holdings |
| | | | | Basis for Board’s Approval of Investment Advisory Contracts |
| | | | | Director and Officer Information Table |
|
| |
| PORTFOLIO MANAGEMENT DISCUSSION |
|
| |
| Kevin Keene Ameritas Investment Partners, Inc. |
Market Review
The broad domestic equity market was largely unchanged for 2015 as the market grappled with competing economic forces. The first six months of the year were marked by generally calm equity markets and the last six months saw a significant increase in volatility. After much speculation and anticipation, the Federal Reserve increased short-term interest rates in December for the first time in nearly 10 years. Turmoil in Chinese markets finally spread across the globe as the Russell 2000 Index lost 12% over a six week period. Domestic economic data has been generally positive, if not robust. Unemployment stands at nearly 5% at year-end; however gross domestic product (GDP) growth has been weak by historical recovery standards.
Investment Strategy and Technique:
As an index fund, the VP Russell 2000 Small Cap Index Portfolio (the Portfolio) seeks as closely as possible to replicate the holdings and match the performance of the Russell 2000 Index. In pursuit of this objective, the Portfolio employs a passive management approach and holds each member of the index. Cash holdings gain exposure to the index via futures contracts so that 100% of the Portfolio’s assets are fully invested.
Fund Performance Relative to the Benchmark
For the year ended December 31, 2015, the Portfolio’s Class I shares returned -5.19% compared with -4.41% for the Russell 2000 Index. The underperformance relative to the Index was largely attributable to fees and operating expenses, which the Index does not incur. The Portfolio continued to meet its objective by closely tracking the Index. The Russell 2000 Index underperformed the broad equity market as small cap stocks trailed large cap stocks.
Positioning and Market Outlook
Entering 2016, the outlook for equities is mixed. The economy continues to expand modestly and headline employment is nearing peak levels. With the Federal Reserve increasing interest rates for the first time in almost a decade, it is giving the economy a vote of confidence.
|
| | | |
| ECONOMIC SECTORS | % OF TOTAL INVESTMENTS | |
| Financials | 24.7 | % | |
| Information Technology | 17.2 | % | |
| Health Care | 15.7 | % | |
| Consumer Discretionary | 13.0 | % | |
| Industrials | 11.7 | % | |
| Utilities | 3.5 | % | |
| Materials | 3.4 | % | |
| Consumer Staples | 3.3 | % | |
| Energy | 2.6 | % | |
| Short-Term Investments | 2.6 | % | |
| Exchange-Traded Products | 0.8 | % | |
| Telecommunication Services | 0.8 | % | |
| Government | 0.7 | % | |
| Total | 100.0 | % | |
| | | |
| TEN LARGEST STOCK HOLDINGS | % OF NET ASSETS | |
| STERIS plc | 0.4 | % | |
| Tyler Technologies, Inc. | 0.3 | % | |
| Dyax Corp. | 0.3 | % | |
| CubeSmart | 0.3 | % | |
| Neurocrine Biosciences, Inc. | 0.3 | % | |
| Manhattan Associates, Inc. | 0.3 | % | |
| Casey's General Stores, Inc. | 0.3 | % | |
| Vail Resorts, Inc. | 0.3 | % | |
| Anacor Pharmaceuticals, Inc. | 0.3 | % | |
| Piedmont Natural Gas Co., Inc. | 0.3 | % | |
| Total | 3.1 | % | |
| | | |
However, there is no shortage of risk as we enter the new year. The bull market that began in 2009 is starting to show its age as questions arise over its ability to continue now that the Federal Reserve has essentially taken its foot off the gas. Commodity price declines continue to point to weak global growth, which will be a headwind to new highs in the stock market.
Ameritas Investment Partners, Inc.
December 2015
www.calvert.com CALVERT VP RUSSELL 2000 SMALL CAP INDEX PORTFOLIO ANNUAL REPORT (UNAUDITED) 1
Growth of $10,000
The graph below shows the value of a hypothetical $10,000 investment in the Portfolio over the past 10 fiscal year periods. The results shown are for Class I shares, and assume the reinvestment of dividends. The result is compared with a broad based market index. Market indexes are unmanaged and their results do not reflect the effect of expenses or sales charges. The value of an investment in a different share class would be different.
|
| | | | | | |
| CALVERT VP RUSSELL 2000 SMALL CAP INDEX PORTFOLIO |
| DECEMBER 31, 2015 |
| AVERAGE ANNUAL TOTAL RETURNS | 1 Year | 5 Year | 10 Year |
| Class I | -5.19 | % | 8.39 | % | 6.10 | % |
| Class F | -5.40 | % | 8.16 | % | 5.88 | % |
| Russell 2000 Index | -4.41 | % | 9.19 | % | 6.80 | % |
| | | | |
| Class F share performance prior to October 1, 2007 is based on Class I performance, adjusted to reflect Class F expenses. |
| | | | |
The performance data shown represents past performance, does not guarantee future results and assumes reinvestment of all dividends and distributions. All performance data reflects fee waivers and/or expense limitations, if any are in effect; in their absence performance would be lower. See Note B in Notes to Financial Statements. The investment return and principal value of an investment will fluctuate so that an investor’s shares, when redeemed, may be worth more or less than their original cost. Current performance may be lower or higher than the performance data quoted.
Visit calvert.com/institutional-VP-performance.html for current performance data. The gross expense ratio from the current prospectus for the Portfolio is 0.76%. This number may vary from the expense ratio shown elsewhere in this report because it is based on a different time period and, if applicable, does not include fee or expense waivers. The performance data and expense ratio reflect deduction of Portfolio operating expenses, but do not reflect charges and expenses imposed under the variable annuity or life insurance contract.
2 www.calvert.com CALVERT VP RUSSELL 2000 SMALL CAP INDEX PORTFOLIO ANNUAL REPORT (UNAUDITED)
UNDERSTANDING YOUR FUND'S EXPENSES
As an investor, you incur two types of costs. There are transaction costs. There are also ongoing costs, which generally include management fees, distribution and/or service fees, and other fund expenses. The following information is intended to help you understand your ongoing costs (in dollars) of investing in this mutual fund and to help you compare these costs with the ongoing costs of investing in other mutual funds.
To illustrate these ongoing costs, we have provided examples and calculated the expenses paid by the fund's investors during the period. The actual and hypothetical information presented in the examples is based on an investment of $1,000 invested at the beginning of the period and held for the entire period (July 1, 2015 to December 31, 2015).
Note: Expenses do not reflect charges and expenses of the variable annuity or variable universal life contract.
Actual Expenses
The first line of the table below provides information about actual account values and actual expenses. You may use the information in this line, together with the amount you invested, to estimate the expenses that you paid over the period. Simply divide your account value by $1,000 (for example, an $8,600 account value divided by $1,000 = 8.6), then multiply the result by the number in the first line under the heading entitled “Expenses Paid During Period” to estimate the expenses you paid on your account during this period.
Hypothetical Example for Comparison Purposes
The second line of the table below provides information about hypothetical account values and hypothetical expenses based on the Fund’s actual expense ratio and an assumed rate of return of 5% per year before expenses, which is not the Fund’s actual return. The hypothetical account values and expenses may not be used to estimate the actual ending account balance or expenses you paid for the period. You may use this information to compare the ongoing costs of investing in the Fund and other funds. To do so, compare the 5% hypothetical example with the 5% hypothetical examples that appear in the shareholder reports of the other funds.
Please note that the expenses shown in the table are meant to highlight your ongoing costs only and do not reflect any transactional costs. Therefore, the second line of the table is useful in comparing ongoing costs only, and will not help you determine the relative total costs of owning different funds. In addition, if these transactional costs were included, your costs would have been higher.
|
| | | | |
| | ANNUALIZED
EXPENSE RATIO | BEGINNING
ACCOUNT VALUE
7/1/15 | ENDING
ACCOUNT VALUE
12/31/15 | EXPENSES PAID
DURING PERIOD*
7/1/15 - 12/31/15 |
| Class I | | | | |
| Actual | 0.76% | $1,000.00 | $909.00 | $3.66 |
| Hypothetical (5% return per year before expenses) | 0.76% | $1,000.00 | $1,021.37 | $3.87 |
| Class F | | | | |
| Actual | 0.96% | $1,000.00 | $907.90 | $4.62 |
| Hypothetical (5% return per year before expenses) | 0.96% | $1,000.00 | $1,020.37 | $4.89 |
| |
| * Expenses paid during the period are equal to the annualized expense ratio for each class as indicated above, multiplied by the average account value over the period, multiplied by 184/365 (to reflect the one-half year period). Expense ratios shown in the Financial Highlights represent the actual expenses incurred for the fiscal year. |
www.calvert.com CALVERT VP RUSSELL 2000 SMALL CAP INDEX PORTFOLIO ANNUAL REPORT (UNAUDITED) 3
REPORT OF INDEPENDENT REGISTERED PUBLIC ACCOUNTING FIRM
The Board of Directors of Calvert Variable Products, Inc. and Shareholders of Calvert VP Russell 2000 Small Cap Index Portfolio:
We have audited the accompanying statement of assets and liabilities, including the schedule of investments, of the Calvert VP Russell 2000 Small Cap Index Portfolio (the “Portfolio”), a series of Calvert Variable Products, Inc., as of December 31, 2015, and the related statement of operations for the year then ended, the statements of changes in net assets for each of the years in the two-year period then ended, and the financial highlights for each of the years in the five-year period then ended. These financial statements and financial highlights are the responsibility of the Portfolio’s management. Our responsibility is to express an opinion on these financial statements and financial highlights based on our audits.
We conducted our audits in accordance with the standards of the Public Company Accounting Oversight Board (United States). Those standards require that we plan and perform the audit to obtain reasonable assurance about whether the financial statements and financial highlights are free of material misstatement. An audit includes examining, on a test basis, evidence supporting the amounts and disclosures in the financial statements. Our procedures included confirmation of securities owned as of December 31, 2015, by correspondence with the custodian and brokers or by performing other appropriate auditing procedures. An audit also includes assessing the accounting principles used and significant estimates made by management, as well as evaluating the overall financial statement presentation. We believe that our audits provide a reasonable basis for our opinion.
In our opinion, the financial statements and financial highlights referred to above present fairly, in all material respects, the financial position of the Portfolio as of December 31, 2015, the results of its operations for the year then ended, the changes in its net assets for each of the years in the two-year period then ended, and the financial highlights for each of the years in the five-year period then ended, in conformity with U.S. generally accepted accounting principles.
Philadelphia, Pennsylvania
February 24, 2016
4 www.calvert.com CALVERT VP RUSSELL 2000 SMALL CAP INDEX PORTFOLIO ANNUAL REPORT
CALVERT VP RUSSELL 2000 SMALL CAP INDEX PORTFOLIO
SCHEDULE OF INVESTMENTS
DECEMBER 31, 2015
|
| | |
| | SHARES | VALUE ($) |
| COMMON STOCKS - 95.9% | | |
| Aerospace & Defense - 1.4% | | |
| AAR Corp. | 2,738 | 71,982 |
| Aerojet Rocketdyne Holdings, Inc. * | 5,118 | 80,148 |
| Aerovironment, Inc. * | 1,707 | 50,305 |
| American Science & Engineering, Inc. | 703 | 29,090 |
| Astronics Corp. * | 1,713 | 69,736 |
| Cubic Corp. | 1,711 | 80,845 |
| Curtiss-Wright Corp. | 3,670 | 251,395 |
| DigitalGlobe, Inc. * | 5,596 | 87,633 |
| Ducommun, Inc. * | 914 | 14,825 |
| Engility Holdings, Inc. | 1,480 | 48,071 |
| Esterline Technologies Corp. * | 2,301 | 186,381 |
| HEICO Corp. | 1,485 | 80,725 |
| HEICO Corp., Class A | 3,080 | 151,536 |
| KEYW Holding Corp. (The) * | 2,749 | 16,549 |
| KLX, Inc. * | 4,071 | 125,346 |
| Kratos Defense & Security Solutions, Inc. * | 3,789 | 15,535 |
| Moog, Inc., Class A * | 2,863 | 173,498 |
| National Presto Industries, Inc. | 420 | 34,801 |
| Sparton Corp. * | 882 | 17,631 |
| Taser International, Inc. * | 4,125 | 71,321 |
| Teledyne Technologies, Inc. * | 2,727 | 241,885 |
| Vectrus, Inc. * | 813 | 16,984 |
| | | 1,916,222 |
| | | |
| Air Freight & Logistics - 0.4% | | |
| Air Transport Services Group, Inc. * | 4,073 | 41,056 |
| Atlas Air Worldwide Holdings, Inc. * | 1,930 | 79,786 |
| Echo Global Logistics, Inc. * | 2,286 | 46,612 |
| Forward Air Corp. | 2,390 | 102,794 |
| Hub Group, Inc., Class A * | 2,785 | 91,766 |
| Park-Ohio Holdings Corp. | 726 | 26,702 |
| Radiant Logistics, Inc. * | 2,087 | 7,158 |
| UTi Worldwide, Inc. * | 7,123 | 50,075 |
| XPO Logistics, Inc. * | 5,520 | 150,420 |
| | | 596,369 |
| | | |
| Airlines - 0.4% | | |
| Allegiant Travel Co. | 1,035 | 173,704 |
| Hawaiian Holdings, Inc. * | 3,718 | 131,357 |
| Republic Airways Holdings, Inc. * | 4,602 | 18,086 |
| SkyWest, Inc. | 4,346 | 82,661 |
| Virgin America, Inc. * | 1,944 | 70,003 |
| | | 475,811 |
| | | |
www.calvert.com CALVERT VP RUSSELL 2000 SMALL CAP INDEX PORTFOLIO ANNUAL REPORT 5
|
| | | | |
| | SHARES | VALUE ($) |
| COMMON STOCKS - Cont'd | | |
| Auto Components - 1.1% | | |
| American Axle & Manufacturing Holdings, Inc. * | 6,004 | 113,716 |
|
| Cooper Tire & Rubber Co. | 4,443 | 168,168 |
|
| Cooper-Standard Holding, Inc. * | 1,048 | 81,314 |
|
| Dana Holding Corp. | 11,890 | 164,082 |
|
| Dorman Products, Inc. * | 2,064 | 97,978 |
|
| Drew Industries, Inc. | 1,976 | 120,319 |
|
| Federal-Mogul Holdings Corp. * | 2,583 | 17,694 |
|
| Fox Factory Holding Corp. * | 1,308 | 21,621 |
|
| Gentherm, Inc. * | 2,771 | 131,346 |
|
| Horizon Global Corp. * | 1,398 | 14,497 |
|
| Metaldyne Performance Group, Inc. | 1,006 | 18,450 |
|
| Modine Manufacturing Co. * | 4,047 | 36,625 |
|
| Motorcar Parts of America, Inc. * | 1,585 | 53,589 |
|
| Standard Motor Products, Inc. | 1,539 | 58,559 |
|
| Stoneridge, Inc. * | 2,174 | 32,175 |
|
| Strattec Security Corp. | 311 | 17,568 |
|
| Superior Industries International, Inc. | 2,023 | 37,264 |
|
| Tenneco, Inc. * | 4,510 | 207,054 |
|
| Tower International, Inc. | 1,846 | 52,740 |
|
| | | 1,444,759 |
|
| | | |
| Automobiles - 0.0% | | |
| Winnebago Industries, Inc. | 2,078 | 41,352 |
|
| | | |
| Banks - 8.9% | | |
| 1st Source Corp. | 1,262 | 38,958 |
|
| Access National Corp. | 561 | 11,478 |
|
| Allegiance Bancshares, Inc. * | 238 | 5,629 |
|
| American National Bankshares, Inc. | 705 | 18,055 |
|
| Ameris Bancorp | 2,665 | 90,583 |
|
| Ames National Corp. | 756 | 18,363 |
|
| Arrow Financial Corp. | 1,003 | 27,251 |
|
| Banc of California, Inc. | 2,665 | 38,962 |
|
| BancFirst Corp. | 651 | 38,162 |
|
| Banco Latinoamericano de Comercio Exterior S.A. | 2,320 | 60,158 |
|
| Bancorp, Inc. (The) * | 2,534 | 16,142 |
|
| BancorpSouth, Inc. | 7,451 | 178,749 |
|
| Bank of Marin Bancorp | 545 | 29,103 |
|
| Bank of the Ozarks, Inc. | 6,019 | 297,700 |
|
| Banner Corp. | 1,639 | 75,165 |
|
| Bar Harbor Bankshares | 461 | 15,868 |
|
| BBCN Bancorp, Inc. | 6,139 | 105,714 |
|
| Berkshire Hills Bancorp, Inc. | 2,523 | 73,445 |
|
| Blue Hills Bancorp, Inc. | 2,498 | 38,244 |
|
| BNC Bancorp | 2,200 | 55,836 |
|
| Boston Private Financial Holdings, Inc. | 6,409 | 72,678 |
|
| Bridge Bancorp, Inc. | 963 | 29,304 |
|
| Bryn Mawr Bank Corp. | 1,427 | 40,983 |
|
| C1 Financial, Inc. * | 287 | 6,948 |
|
| Camden National Corp. | 710 | 31,304 |
|
| Capital Bank Financial Corp., Class A | 1,735 | 55,485 |
|
6 www.calvert.com CALVERT VP RUSSELL 2000 SMALL CAP INDEX PORTFOLIO ANNUAL REPORT
|
| | | | |
| | SHARES | VALUE ($) |
| COMMON STOCKS - Cont'd | | |
| Capital City Bank Group, Inc. | 1,232 | 18,911 |
|
| Cardinal Financial Corp. | 2,513 | 57,171 |
|
| Cascade Bancorp * | 3,096 | 18,793 |
|
| Cathay General Bancorp | 6,167 | 193,212 |
|
| CenterState Banks, Inc. | 3,507 | 54,885 |
|
| Central Pacific Financial Corp. | 1,534 | 33,779 |
|
| Century Bancorp, Inc., Class A | 277 | 12,038 |
|
| Chemical Financial Corp. | 2,602 | 89,171 |
|
| Citizens & Northern Corp. | 1,125 | 23,625 |
|
| City Holding Co. | 1,174 | 53,581 |
|
| CNB Financial Corp. | 1,282 | 23,114 |
|
| CoBiz Financial, Inc. | 2,995 | 40,193 |
|
| Columbia Banking System, Inc. | 4,452 | 144,735 |
|
| Community Bank System, Inc. | 3,331 | 133,040 |
|
| Community Trust Bancorp, Inc. | 1,316 | 46,007 |
|
| CommunityOne Bancorp * | 901 | 12,136 |
|
| ConnectOne Bancorp, Inc. | 2,307 | 43,118 |
|
| CU Bancorp * | 1,297 | 32,892 |
|
| Customers Bancorp, Inc. * | 2,244 | 61,082 |
|
| CVB Financial Corp. | 8,200 | 138,744 |
|
| Eagle Bancorp, Inc. * | 2,309 | 116,535 |
|
| Enterprise Bancorp, Inc. | 478 | 10,922 |
|
| Enterprise Financial Services Corp. | 1,698 | 48,138 |
|
| Equity Bancshares, Inc., Class A * | 170 | 3,976 |
|
| Farmers Capital Bank Corp. * | 578 | 15,670 |
|
| FCB Financial Holdings, Inc., Class A * | 2,159 | 77,271 |
|
| Fidelity Southern Corp. | 1,097 | 24,474 |
|
| Financial Institutions, Inc. | 1,134 | 31,752 |
|
| First BanCorp * | 9,341 | 30,358 |
|
| First Bancorp, Inc. | 691 | 14,145 |
|
| First Bancorp/Southern Pines | 1,553 | 29,103 |
|
| First Busey Corp. | 2,117 | 43,674 |
|
| First Business Financial Services, Inc. | 708 | 17,707 |
|
| First Citizens BancShares, Inc., Class A | 595 | 153,611 |
|
| First Commonwealth Financial Corp. | 6,865 | 62,266 |
|
| First Community Bancshares, Inc. | 1,464 | 27,274 |
|
| First Connecticut Bancorp, Inc. | 1,473 | 25,645 |
|
| First Financial Bancorp | 5,061 | 91,452 |
|
| First Financial Bankshares, Inc. | 4,950 | 149,341 |
|
| First Financial Corp. | 966 | 32,815 |
|
| First Interstate BancSystem, Inc., Class A | 1,462 | 42,500 |
|
| First Merchants Corp. | 3,106 | 78,955 |
|
| First Midwest Bancorp, Inc. | 6,017 | 110,893 |
|
| First NBC Bank Holding Co. * | 1,338 | 50,028 |
|
| First of Long Island Corp. (The) | 901 | 27,030 |
|
| FirstMerit Corp. | 12,795 | 238,627 |
|
| Flushing Financial Corp. | 2,270 | 49,123 |
|
| FNB Corp. | 13,482 | 179,850 |
|
| Franklin Financial Network, Inc. * | 421 | 13,211 |
|
| Fulton Financial Corp. | 13,636 | 177,404 |
|
| German American Bancorp, Inc. | 1,152 | 38,385 |
|
| Glacier Bancorp, Inc. | 5,829 | 154,643 |
|
www.calvert.com CALVERT VP RUSSELL 2000 SMALL CAP INDEX PORTFOLIO ANNUAL REPORT 7
|
| | | | |
| | SHARES | VALUE ($) |
| COMMON STOCKS - Cont'd | | |
| Great Southern Bancorp, Inc. | 940 | 42,544 |
|
| Great Western Bancorp, Inc. | 3,189 | 92,545 |
|
| Green Bancorp, Inc. * | 1,113 | 11,664 |
|
| Guaranty Bancorp | 1,371 | 22,676 |
|
| Hampton Roads Bankshares, Inc. * | 2,909 | 5,353 |
|
| Hancock Holding Co. | 6,011 | 151,297 |
|
| Hanmi Financial Corp. | 2,465 | 58,470 |
|
| Heartland Financial USA, Inc. | 1,357 | 42,556 |
|
| Heritage Commerce Corp. | 1,714 | 20,499 |
|
| Heritage Financial Corp. | 2,334 | 43,973 |
|
| Heritage Oaks Bancorp | 1,809 | 14,490 |
|
| Hilltop Holdings, Inc. * | 5,877 | 112,956 |
|
| Home BancShares, Inc. | 4,406 | 178,531 |
|
| HomeTrust Bancshares, Inc. * | 1,850 | 37,462 |
|
| Horizon Bancorp | 750 | 20,970 |
|
| IBERIABANK Corp. | 2,947 | 162,291 |
|
| Independent Bank Corp. | 2,054 | 31,282 |
|
| Independent Bank Corp./Rockland | 2,018 | 93,877 |
|
| Independent Bank Group, Inc. | 819 | 26,208 |
|
| International Bancshares Corp. | 4,180 | 107,426 |
|
| Investors Bancorp, Inc. | 26,915 | 334,823 |
|
| Lakeland Bancorp, Inc. | 3,213 | 37,881 |
|
| Lakeland Financial Corp. | 1,410 | 65,734 |
|
| LegacyTexas Financial Group, Inc. | 3,674 | 91,923 |
|
| Live Oak Bancshares, Inc. | 380 | 5,396 |
|
| MainSource Financial Group, Inc. | 1,757 | 40,200 |
|
| MB Financial, Inc. | 5,883 | 190,433 |
|
| Mercantile Bank Corp. | 1,508 | 37,006 |
|
| Merchants Bancshares, Inc. | 377 | 11,872 |
|
| Metro Bancorp, Inc. | 915 | 28,713 |
|
| MidWestOne Financial Group, Inc. | 611 | 18,580 |
|
| National Bank Holdings Corp., Class A | 2,344 | 50,091 |
|
| National Bankshares, Inc. | 719 | 25,553 |
|
| National Commerce Corp. * | 466 | 11,673 |
|
| National Penn Bancshares, Inc. | 10,936 | 134,841 |
|
| National Penn Bancshares, Inc. (a)* | 25,000 | — |
|
| NBT Bancorp, Inc. | 3,400 | 94,792 |
|
| NewBridge Bancorp | 2,966 | 36,126 |
|
| OFG Bancorp | 3,440 | 25,181 |
|
| Old National Bancorp | 9,028 | 122,420 |
|
| Old Second Bancorp, Inc. * | 2,274 | 17,828 |
|
| Opus Bank | 804 | 29,724 |
|
| Pacific Continental Corp. | 1,543 | 22,960 |
|
| Pacific Premier Bancorp, Inc. * | 1,824 | 38,760 |
|
| Park National Corp. | 1,007 | 91,113 |
|
| Park Sterling Corp. | 3,952 | 28,929 |
|
| Peapack Gladstone Financial Corp. | 1,336 | 27,548 |
|
| Penns Woods Bancorp, Inc. | 415 | 17,621 |
|
| People's Utah Bancorp | 225 | 3,872 |
|
| Peoples Bancorp, Inc. | 1,418 | 26,715 |
|
| Peoples Financial Services Corp. | 676 | 25,742 |
|
| Pinnacle Financial Partners, Inc. | 2,769 | 142,216 |
|
8 www.calvert.com CALVERT VP RUSSELL 2000 SMALL CAP INDEX PORTFOLIO ANNUAL REPORT
|
| | | | |
| | SHARES | VALUE ($) |
| COMMON STOCKS - Cont'd | | |
| Preferred Bank | 1,057 | 34,902 |
|
| PrivateBancorp, Inc. | 6,067 | 248,868 |
|
| Prosperity Bancshares, Inc. | 5,406 | 258,731 |
|
| QCR Holdings, Inc. | 901 | 21,885 |
|
| Renasant Corp. | 3,102 | 106,740 |
|
| Republic Bancorp, Inc., Class A | 907 | 23,954 |
|
| S&T Bancorp, Inc. | 2,878 | 88,700 |
|
| Sandy Spring Bancorp, Inc. | 2,099 | 56,589 |
|
| Seacoast Banking Corp. of Florida * | 1,837 | 27,518 |
|
| ServisFirst Bancshares, Inc. | 1,720 | 81,752 |
|
| Sierra Bancorp | 987 | 17,421 |
|
| Simmons First National Corp., Class A | 2,304 | 118,333 |
|
| South State Corp. | 1,866 | 134,259 |
|
| Southside Bancshares, Inc. | 2,181 | 52,388 |
|
| Southwest Bancorp, Inc. | 1,698 | 29,681 |
|
| State Bank Financial Corp. | 2,758 | 58,001 |
|
| Sterling Bancorp | 9,598 | 155,680 |
|
| Stock Yards Bancorp, Inc. | 1,229 | 46,444 |
|
| Stonegate Bank | 892 | 29,311 |
|
| Suffolk Bancorp | 896 | 25,402 |
|
| Sun Bancorp, Inc. * | 618 | 12,756 |
|
| Talmer Bancorp, Inc., Class A | 4,217 | 76,370 |
|
| Texas Capital Bancshares, Inc. * | 3,533 | 174,601 |
|
| Tompkins Financial Corp. | 1,247 | 70,032 |
|
| TowneBank | 3,792 | 79,139 |
|
| TriCo Bancshares | 1,995 | 54,743 |
|
| TriState Capital Holdings, Inc. * | 1,979 | 27,686 |
|
| Triumph Bancorp, Inc. * | 1,130 | 18,645 |
|
| Trustmark Corp. | 5,214 | 120,131 |
|
| UMB Financial Corp. | 3,038 | 141,419 |
|
| Umpqua Holdings Corp. | 17,021 | 270,634 |
|
| Union Bankshares Corp. | 3,482 | 87,886 |
|
| United Bankshares, Inc. | 5,360 | 198,266 |
|
| United Community Banks, Inc. | 3,877 | 75,563 |
|
| Univest Corp. of Pennsylvania | 1,440 | 30,038 |
|
| Valley National Bancorp | 17,945 | 176,758 |
|
| Washington Trust Bancorp, Inc. | 1,232 | 48,689 |
|
| Webster Financial Corp. | 7,006 | 260,553 |
|
| WesBanco, Inc. | 2,789 | 83,726 |
|
| West BanCorp., Inc. | 1,387 | 27,393 |
|
| Westamerica BanCorp. | 1,972 | 92,191 |
|
| Western Alliance Bancorp * | 6,621 | 237,429 |
|
| Wilshire Bancorp, Inc. | 5,565 | 64,276 |
|
| Wintrust Financial Corp. | 3,660 | 177,583 |
|
| Yadkin Financial Corp. | 1,832 | 46,111 |
|
| | | 12,249,785 |
|
| | | |
| Beverages - 0.2% | | |
| Boston Beer Company, Inc. (The), Class A * | 702 | 141,741 |
|
| Castle Brands, Inc. * | 5,139 | 6,321 |
|
| Coca-Cola Bottling Co. Consolidated | 359 | 65,521 |
|
| Craft Brew Alliance, Inc. * | 855 | 7,156 |
|
www.calvert.com CALVERT VP RUSSELL 2000 SMALL CAP INDEX PORTFOLIO ANNUAL REPORT 9
|
| | | | |
| | SHARES | VALUE ($) |
| COMMON STOCKS - Cont'd | | |
| MGP Ingredients, Inc. | 826 | 21,435 |
|
| National Beverage Corp. * | 894 | 40,623 |
|
| | | 282,797 |
|
| | | |
| Biotechnology - 6.2% | | |
| Abeona Therapeutics, Inc. * | 806 | 2,708 |
|
| ACADIA Pharmaceuticals, Inc. * | 6,151 | 219,283 |
|
| Acceleron Pharma, Inc. * | 1,694 | 82,599 |
|
| Achillion Pharmaceuticals, Inc. * | 9,072 | 97,887 |
|
| Acorda Therapeutics, Inc. * | 3,302 | 141,260 |
|
| Adamas Pharmaceuticals, Inc. * | 802 | 22,713 |
|
| Aduro Biotech, Inc. * | 644 | 18,122 |
|
| Advaxis, Inc. * | 2,339 | 23,530 |
|
| Aegerion Pharmaceuticals, Inc. * | 1,935 | 19,544 |
|
| Affimed NV * | 1,180 | 8,402 |
|
| Agenus, Inc. * | 5,577 | 25,320 |
|
| Aimmune Therapeutics, Inc. * | 875 | 16,144 |
|
| Akebia Therapeutics, Inc. * | 1,882 | 24,315 |
|
| Alder Biopharmaceuticals, Inc. * | 1,788 | 59,058 |
|
| AMAG Pharmaceuticals, Inc. * | 2,648 | 79,943 |
|
| Amicus Therapeutics, Inc. * | 8,941 | 86,728 |
|
| Anacor Pharmaceuticals, Inc. * | 3,163 | 357,324 |
|
| Anthera Pharmaceuticals, Inc. * | 2,764 | 12,825 |
|
| Applied Genetic Technologies Corp. * | 435 | 8,874 |
|
| Ardelyx, Inc. * | 1,293 | 23,429 |
|
| Arena Pharmaceuticals, Inc. * | 19,683 | 37,398 |
|
| ARIAD Pharmaceuticals, Inc. * | 12,921 | 80,756 |
|
| Array BioPharma, Inc. * | 10,886 | 45,939 |
|
| Arrowhead Research Corp. * | 4,648 | 28,585 |
|
| Asterias Biotherapeutics, Inc. * | 815 | 3,203 |
|
| Atara Biotherapeutics, Inc. * | 1,318 | 34,808 |
|
| aTyr Pharma, Inc. * | 466 | 4,581 |
|
| Avalanche Biotechnologies, Inc. * | 1,509 | 14,366 |
|
| Axovant Sciences Ltd. * | 1,100 | 19,833 |
|
| Bellicum Pharmaceuticals, Inc. * | 743 | 15,061 |
|
| BioCryst Pharmaceuticals, Inc. * | 5,597 | 57,761 |
|
| BioSpecifics Technologies Corp. * | 326 | 14,008 |
|
| BioTime, Inc. * | 3,184 | 13,054 |
|
| Blueprint Medicines Corp. * | 723 | 19,044 |
|
| Calithera Biosciences, Inc. * | 700 | 5,362 |
|
| Cara Therapeutics, Inc. * | 1,288 | 21,716 |
|
| Catabasis Pharmaceuticals, Inc. * | 350 | 2,776 |
|
| Catalyst Pharmaceuticals, Inc. * | 5,813 | 14,242 |
|
| Celldex Therapeutics, Inc. * | 7,600 | 119,168 |
|
| Cellular Biomedicine Group, Inc. * | 759 | 16,311 |
|
| Cepheid * | 5,540 | 202,376 |
|
| Chelsea Therapeutics International Ltd. (a)* | 5,785 | 686 |
|
| ChemoCentryx, Inc. * | 2,120 | 17,172 |
|
| Chiasma, Inc. * | 575 | 11,253 |
|
| Chimerix, Inc. * | 3,539 | 31,674 |
|
| Cidara Therapeutics, Inc. * | 375 | 6,435 |
|
| Clovis Oncology, Inc. * | 2,169 | 75,915 |
|
10 www.calvert.com CALVERT VP RUSSELL 2000 SMALL CAP INDEX PORTFOLIO ANNUAL REPORT
|
| | | | |
| | SHARES | VALUE ($) |
| COMMON STOCKS - Cont'd | | |
| Coherus Biosciences, Inc. * | 1,820 | 41,787 |
|
| Concert Pharmaceuticals, Inc. * | 1,187 | 22,517 |
|
| CorMedix, Inc. * | 2,396 | 4,864 |
|
| CTI BioPharma Corp. * | 12,809 | 15,755 |
|
| Curis, Inc. * | 8,583 | 24,977 |
|
| Cytokinetics, Inc. * | 2,136 | 22,343 |
|
| CytomX Therapeutics, Inc. * | 560 | 11,687 |
|
| CytRx Corp. * | 4,998 | 13,245 |
|
| Dicerna Pharmaceuticals, Inc. * | 1,166 | 13,840 |
|
| Dimension Therapeutics, Inc. * | 449 | 5,065 |
|
| Dyax Corp. * | 11,242 | 422,924 |
|
| Dynavax Technologies Corp. * | 2,638 | 63,734 |
|
| Eagle Pharmaceuticals, Inc. * | 662 | 58,700 |
|
| Edge Therapeutics, Inc. * | 706 | 8,825 |
|
| Emergent Biosolutions, Inc. * | 2,331 | 93,263 |
|
| Enanta Pharmaceuticals, Inc. * | 1,235 | 40,780 |
|
| Epizyme, Inc. * | 2,242 | 35,917 |
|
| Esperion Therapeutics, Inc. * | 1,013 | 22,549 |
|
| Exact Sciences Corp. * | 7,462 | 68,874 |
|
| Exelixis, Inc. * | 17,002 | 95,891 |
|
| Fibrocell Science, Inc. * | 1,895 | 8,622 |
|
| FibroGen, Inc. * | 3,693 | 112,526 |
|
| Five Prime Therapeutics, Inc. * | 1,765 | 73,247 |
|
| Flexion Therapeutics, Inc. * | 1,074 | 20,696 |
|
| Foundation Medicine, Inc. * | 920 | 19,375 |
|
| Galena Biopharma, Inc. * | 8,878 | 13,051 |
|
| Genocea Biosciences, Inc. * | 1,434 | 7,557 |
|
| Genomic Health, Inc. * | 1,445 | 50,864 |
|
| Geron Corp. * | 13,372 | 64,720 |
|
| Global Blood Therapeutics, Inc. * | 550 | 17,782 |
|
| Halozyme Therapeutics, Inc. * | 8,185 | 141,846 |
|
| Heron Therapeutics, Inc. * | 2,291 | 61,170 |
|
| Idera Pharmaceuticals, Inc. * | 7,586 | 23,441 |
|
| Ignyta, Inc. * | 1,416 | 18,974 |
|
| Immune Design Corp. * | 874 | 17,550 |
|
| ImmunoGen, Inc. * | 6,651 | 90,254 |
|
| Immunomedics, Inc. * | 6,814 | 20,919 |
|
| Infinity Pharmaceuticals, Inc. * | 4,129 | 32,413 |
|
| Inovio Pharmaceuticals, Inc. * | 5,391 | 36,228 |
|
| Insmed, Inc. * | 4,746 | 86,140 |
|
| Insys Therapeutics, Inc. * | 1,760 | 50,389 |
|
| Invitae Corp. * | 642 | 5,271 |
|
| Ironwood Pharmaceuticals, Inc. * | 9,719 | 112,643 |
|
| Karyopharm Therapeutics, Inc. * | 1,782 | 23,611 |
|
| Keryx Biopharmaceuticals, Inc. * | 7,995 | 40,375 |
|
| Kite Pharma, Inc. * | 2,226 | 137,166 |
|
| La Jolla Pharmaceutical Co. * | 892 | 24,084 |
|
| Lexicon Pharmaceuticals, Inc. * | 3,233 | 43,031 |
|
| Ligand Pharmaceuticals, Inc. * | 1,354 | 146,801 |
|
| Lion Biotechnologies, Inc. * | 3,475 | 26,827 |
|
| Loxo Oncology, Inc. * | 609 | 17,326 |
|
| MacroGenics, Inc. * | 2,420 | 74,947 |
|
www.calvert.com CALVERT VP RUSSELL 2000 SMALL CAP INDEX PORTFOLIO ANNUAL REPORT 11
|
| | | | |
| | SHARES | VALUE ($) |
| COMMON STOCKS - Cont'd | | |
| MannKind Corp. * | 19,042 | 27,611 |
|
| Medgenics, Inc. * | 1,299 | 7,820 |
|
| Merrimack Pharmaceuticals, Inc. * | 8,667 | 68,469 |
|
| MiMedx Group, Inc. * | 8,019 | 75,138 |
|
| Mirati Therapeutics, Inc. * | 893 | 28,219 |
|
| Momenta Pharmaceuticals, Inc. * | 4,757 | 70,594 |
|
| Myriad Genetics, Inc. * | 5,360 | 231,338 |
|
| NantKwest, Inc. * | 525 | 9,098 |
|
| Natera, Inc. * | 800 | 8,640 |
|
| Navidea Biopharmaceuticals, Inc. * | 10,313 | 13,716 |
|
| Neurocrine Biosciences, Inc. * | 6,662 | 376,869 |
|
| NewLink Genetics Corp. * | 1,605 | 58,406 |
|
| Nivalis Therapeutics, Inc. * | 400 | 3,096 |
|
| Northwest Biotherapeutics, Inc. * | 3,184 | 10,189 |
|
| Novavax, Inc. * | 20,685 | 173,547 |
|
| Ocata Therapeutics, Inc. * | 2,753 | 23,180 |
|
| OncoMed Pharmaceuticals, Inc. * | 1,132 | 25,515 |
|
| Oncothyreon, Inc. * | 6,340 | 14,075 |
|
| Ophthotech Corp. * | 1,829 | 143,631 |
|
| Orexigen Therapeutics, Inc. * | 7,897 | 13,583 |
|
| Organovo Holdings, Inc. * | 5,600 | 13,944 |
|
| Osiris Therapeutics, Inc. | 1,445 | 14,999 |
|
| Otonomy, Inc. * | 1,140 | 31,635 |
|
| OvaScience, Inc. * | 1,811 | 17,693 |
|
| PDL BioPharma, Inc. | 12,664 | 44,831 |
|
| Peregrine Pharmaceuticals, Inc. * | 11,824 | 13,834 |
|
| Pfenex, Inc. * | 1,259 | 15,586 |
|
| Portola Pharmaceuticals, Inc. * | 3,886 | 199,935 |
|
| Progenics Pharmaceuticals, Inc. * | 5,151 | 31,576 |
|
| Proteon Therapeutics, Inc. * | 595 | 9,228 |
|
| Prothena Corp. plc * | 2,414 | 164,418 |
|
| PTC Therapeutics, Inc. * | 2,612 | 84,629 |
|
| Radius Health, Inc. * | 2,558 | 157,419 |
|
| Raptor Pharmaceutical Corp. * | 6,081 | 31,621 |
|
| REGENXBIO, Inc. * | 615 | 10,209 |
|
| Regulus Therapeutics, Inc. * | 2,183 | 19,036 |
|
| Repligen Corp. * | 2,535 | 71,715 |
|
| Retrophin, Inc. * | 2,698 | 52,044 |
|
| Rigel Pharmaceuticals, Inc. * | 7,590 | 22,998 |
|
| Sage Therapeutics, Inc. * | 1,064 | 62,031 |
|
| Sangamo BioSciences, Inc. * | 5,756 | 52,552 |
|
| Sarepta Therapeutics, Inc. * | 3,490 | 134,644 |
|
| Seres Therapeutics, Inc. * | 675 | 23,686 |
|
| Sorrento Therapeutics, Inc. * | 2,189 | 19,066 |
|
| Spark Therapeutics, Inc. * | 707 | 32,034 |
|
| Spectrum Pharmaceuticals, Inc. * | 5,050 | 30,451 |
|
| Stemline Therapeutics, Inc. * | 1,313 | 8,285 |
|
| Synergy Pharmaceuticals, Inc. * | 7,787 | 44,152 |
|
| Synta Pharmaceuticals Corp. * | 5,731 | 2,017 |
|
| T2 Biosystems, Inc. * | 524 | 5,733 |
|
| TESARO, Inc. * | 1,877 | 98,205 |
|
| TG Therapeutics, Inc. * | 2,728 | 32,545 |
|
12 www.calvert.com CALVERT VP RUSSELL 2000 SMALL CAP INDEX PORTFOLIO ANNUAL REPORT
|
| | | | |
| | SHARES | VALUE ($) |
| COMMON STOCKS - Cont'd | | |
| Threshold Pharmaceuticals, Inc. * | 4,048 | 1,943 |
|
| Tobira Therapeutics, Inc. * | 153 | 1,538 |
|
| Tokai Pharmaceuticals, Inc. * | 500 | 4,360 |
|
| Trevena, Inc. * | 1,911 | 20,066 |
|
| Trius Therapeutics, Inc (a)* | 3,210 | 417 |
|
| Trovagene, Inc. * | 1,887 | 10,190 |
|
| Ultragenyx Pharmaceutical, Inc. * | 3,021 | 338,896 |
|
| Vanda Pharmaceuticals, Inc. * | 3,487 | 32,464 |
|
| Verastem, Inc. * | 2,484 | 4,620 |
|
| Versartis, Inc. * | 1,736 | 21,509 |
|
| Vitae Pharmaceuticals, Inc. * | 1,024 | 18,534 |
|
| Vital Therapies, Inc. * | 1,295 | 14,918 |
|
| Voyager Therapeutics, Inc. * | 521 | 11,410 |
|
| vTv Therapeutics, Inc., Class A * | 500 | 3,405 |
|
| XBiotech, Inc. * | 314 | 3,413 |
|
| Xencor, Inc. * | 2,195 | 32,091 |
|
| XOMA Corp. * | 6,130 | 8,153 |
|
| Zafgen, Inc. * | 1,272 | 8,001 |
|
| ZIOPHARM Oncology, Inc. * | 8,524 | 70,834 |
|
| | | 8,493,121 |
|
| | | |
| Building Products - 0.9% | | |
| AAON, Inc. | 3,159 | 73,352 |
|
| Advanced Drainage Systems, Inc. | 2,597 | 62,406 |
|
| American Woodmark Corp. * | 1,038 | 83,019 |
|
| Apogee Enterprises, Inc. | 2,253 | 98,028 |
|
| Builders FirstSource, Inc. * | 3,852 | 42,680 |
|
| Continental Building Products, Inc. * | 2,429 | 42,410 |
|
| Gibraltar Industries, Inc. * | 2,647 | 67,340 |
|
| Griffon Corp. | 2,639 | 46,974 |
|
| Insteel Industries, Inc. | 1,631 | 34,121 |
|
| Masonite International Corp. * | 2,330 | 142,666 |
|
| NCI Building Systems, Inc. * | 2,515 | 31,211 |
|
| Nortek, Inc. * | 776 | 33,849 |
|
| Patrick Industries, Inc. * | 1,080 | 46,980 |
|
| PGT, Inc. * | 3,685 | 41,972 |
|
| Ply Gem Holdings, Inc. * | 1,362 | 17,079 |
|
| Quanex Building Products Corp. | 2,614 | 54,502 |
|
| Simpson Manufacturing Co., Inc. | 3,250 | 110,988 |
|
| Trex Co., Inc. * | 2,476 | 94,187 |
|
| Universal Forest Products, Inc. | 1,553 | 106,179 |
|
| | | 1,229,943 |
|
| | | |
| Capital Markets - 1.3% | | |
| Arlington Asset Investment Corp., Class A | 1,962 | 25,957 |
|
| Ashford, Inc. * | 72 | 3,834 |
|
| Associated Capital Group, Inc., Class A * | 520 | 15,860 |
|
| BGC Partners, Inc., Class A | 14,141 | 138,723 |
|
| Calamos Asset Management, Inc., Class A | 1,559 | 15,091 |
|
| CIFC Corp. | 974 | 5,435 |
|
| Cohen & Steers, Inc. | 1,662 | 50,658 |
|
| Cowen Group, Inc., Class A * | 8,597 | 32,927 |
|
www.calvert.com CALVERT VP RUSSELL 2000 SMALL CAP INDEX PORTFOLIO ANNUAL REPORT 13
|
| | | | |
| | SHARES | VALUE ($) |
| COMMON STOCKS - Cont'd | | |
| Diamond Hill Investment Group, Inc. | 250 | 47,250 |
|
| Evercore Partners, Inc., Class A | 2,671 | 144,421 |
|
| Fifth Street Asset Management, Inc. | 520 | 1,695 |
|
| Financial Engines, Inc. | 4,002 | 134,747 |
|
| GAMCO Investors, Inc., Class A | 520 | 16,141 |
|
| Greenhill & Co., Inc. | 2,260 | 64,659 |
|
| HFF, Inc., Class A | 2,937 | 91,253 |
|
| Houlihan Lokey, Inc. | 950 | 24,899 |
|
| INTL. FCStone, Inc. * | 1,181 | 39,516 |
|
| Investment Technology Group, Inc. | 2,642 | 44,967 |
|
| Janus Capital Group, Inc. | 11,331 | 159,654 |
|
| KCG Holdings, Inc., Class A * | 2,651 | 32,634 |
|
| Ladenburg Thalmann Financial Services, Inc. * | 8,462 | 23,355 |
|
| Medley Management, Inc., Class A | 520 | 2,959 |
|
| Moelis & Co., Class A | 1,358 | 39,626 |
|
| OM Asset Management plc | 2,120 | 32,500 |
|
| Oppenheimer Holdings, Inc., Class A | 932 | 16,198 |
|
| Piper Jaffray Cos. * | 1,333 | 53,853 |
|
| Pzena Investment Management, Inc., Class A | 491 | 4,223 |
|
| RCS Capital Corp., Class A * | 3,801 | 1,157 |
|
| Safeguard Scientifics, Inc. * | 1,902 | 27,598 |
|
| Stifel Financial Corp. * | 5,239 | 221,924 |
|
| Virtu Financial, Inc., Class A | 1,467 | 33,213 |
|
| Virtus Investment Partners, Inc. | 528 | 62,019 |
|
| Westwood Holdings Group, Inc. | 603 | 31,410 |
|
| WisdomTree Investments, Inc. | 8,805 | 138,062 |
|
| Zais Group Holdings, Inc. * | 295 | 2,732 |
|
| | | 1,781,150 |
|
| | | |
| Chemicals - 1.7% | | |
| A Schulman, Inc. | 2,260 | 69,246 |
|
| American Vanguard Corp. | 2,506 | 35,109 |
|
| Axiall Corp. | 5,420 | 83,468 |
|
| Balchem Corp. | 2,399 | 145,859 |
|
| Calgon Carbon Corp. | 4,068 | 70,173 |
|
| Chase Corp. | 526 | 21,424 |
|
| Chemtura Corp. * | 5,184 | 141,368 |
|
| Core Molding Technologies, Inc. * | 592 | 7,595 |
|
| Ferro Corp. * | 5,633 | 62,639 |
|
| Flotek Industries, Inc. * | 4,128 | 47,224 |
|
| FutureFuel Corp. | 1,874 | 25,299 |
|
| Hawkins, Inc. | 939 | 33,588 |
|
| HB Fuller Co. | 3,891 | 141,905 |
|
| Innophos Holdings, Inc. | 1,613 | 46,745 |
|
| Innospec, Inc. | 1,871 | 101,614 |
|
| Intrepid Potash, Inc. * | 4,719 | 13,921 |
|
| KMG Chemicals, Inc. | 568 | 13,075 |
|
| Koppers Holdings, Inc. * | 1,798 | 32,814 |
|
| Kraton Performance Polymers, Inc. * | 2,418 | 40,163 |
|
| Kronos Worldwide, Inc. | 1,877 | 10,586 |
|
| LSB Industries, Inc. * | 1,588 | 11,513 |
|
| Minerals Technologies, Inc. | 2,680 | 122,905 |
|
14 www.calvert.com CALVERT VP RUSSELL 2000 SMALL CAP INDEX PORTFOLIO ANNUAL REPORT
|
| | | | |
| | SHARES | VALUE ($) |
| COMMON STOCKS - Cont'd | | |
| Olin Corp. | 12,782 | 220,617 |
|
| OMNOVA Solutions, Inc. * | 3,910 | 23,968 |
|
| PolyOne Corp. | 6,883 | 218,604 |
|
| Quaker Chemical Corp. | 1,029 | 79,501 |
|
| Rayonier Advanced Materials, Inc. | 3,138 | 30,721 |
|
| Rentech, Inc. * | 2,000 | 7,040 |
|
| Senomyx, Inc. * | 3,810 | 14,364 |
|
| Sensient Technologies Corp. | 3,607 | 226,592 |
|
| Stepan Co. | 1,489 | 73,989 |
|
| Trecora Resources * | 1,798 | 22,277 |
|
| Tredegar Corp. | 2,145 | 29,215 |
|
| Trinseo S.A. * | 1,009 | 28,454 |
|
| Tronox Ltd., Class A | 4,908 | 19,190 |
|
| Valhi, Inc. | 1,474 | 1,975 |
|
| | | 2,274,740 |
|
| | | |
| Commercial Services & Supplies - 2.0% | | |
| ABM Industries, Inc. | 4,321 | 123,019 |
|
| ACCO Brands Corp. * | 8,482 | 60,477 |
|
| ARC Document Solutions, Inc. * | 3,218 | 14,223 |
|
| Brady Corp., Class A | 3,687 | 84,727 |
|
| Brink's Co. (The) | 3,753 | 108,311 |
|
| Casella Waste Systems, Inc., Class A * | 3,332 | 19,925 |
|
| CECO Environmental Corp. | 1,551 | 11,912 |
|
| Civeo Corp. * | 8,414 | 11,948 |
|
| Deluxe Corp. | 3,853 | 210,143 |
|
| Ennis, Inc. | 2,271 | 43,717 |
|
| Essendant, Inc. | 2,957 | 96,132 |
|
| G&K Services, Inc., Class A | 1,543 | 97,055 |
|
| Healthcare Services Group, Inc. | 5,517 | 192,378 |
|
| Heritage-Crystal Clean, Inc. * | 692 | 7,335 |
|
| Herman Miller, Inc. | 4,604 | 132,135 |
|
| HNI Corp. | 3,433 | 123,794 |
|
| InnerWorkings, Inc. * | 3,823 | 28,672 |
|
| Interface, Inc. | 5,099 | 97,595 |
|
| Kimball International, Inc., Class B | 2,797 | 27,327 |
|
| Knoll, Inc. | 3,767 | 70,820 |
|
| Matthews International Corp., Class A | 2,671 | 142,765 |
|
| McGrath RentCorp | 2,018 | 50,833 |
|
| Mobile Mini, Inc. | 3,537 | 110,107 |
|
| MSA Safety, Inc. | 2,261 | 98,286 |
|
| Multi-Color Corp. | 1,079 | 64,535 |
|
| NL Industries, Inc. * | 532 | 1,617 |
|
| Quad/Graphics, Inc. | 2,476 | 23,027 |
|
| SP Plus Corp. * | 1,439 | 34,392 |
|
| Steelcase, Inc., Class A | 6,427 | 95,762 |
|
| Team, Inc. * | 1,759 | 56,218 |
|
| Tetra Tech, Inc. | 4,650 | 120,993 |
|
| TRC Cos., Inc. * | 1,320 | 12,210 |
|
| UniFirst Corp. | 1,147 | 119,517 |
|
| US Ecology, Inc. | 1,672 | 60,928 |
|
| Viad Corp. | 1,798 | 50,757 |
|
www.calvert.com CALVERT VP RUSSELL 2000 SMALL CAP INDEX PORTFOLIO ANNUAL REPORT 15
|
| | | | |
| | SHARES | VALUE ($) |
| COMMON STOCKS - Cont'd | | |
| West Corp. | 4,028 | 86,884 |
|
| | | 2,690,476 |
|
| | | |
| Communications Equipment - 1.5% | | |
| ADTRAN, Inc. | 4,115 | 70,860 |
|
| Aerohive Networks, Inc. * | 1,801 | 9,203 |
|
| Alliance Fiber Optic Products, Inc. * | 992 | 15,039 |
|
| Applied Optoelectronics, Inc. * | 1,325 | 22,737 |
|
| Bel Fuse, Inc., Class B | 968 | 16,737 |
|
| Black Box Corp. | 1,186 | 11,303 |
|
| CalAmp Corp. * | 3,105 | 61,883 |
|
| Calix, Inc. * | 3,092 | 24,334 |
|
| Ciena Corp. * | 9,524 | 197,052 |
|
| Clearfield, Inc. * | 1,022 | 13,705 |
|
| Comtech Telecommunications Corp. | 1,254 | 25,193 |
|
| Digi International, Inc. * | 2,313 | 26,322 |
|
| EMCORE Corp. * | 1,917 | 11,751 |
|
| Extreme Networks, Inc. * | 8,019 | 32,718 |
|
| Finisar Corp. * | 8,019 | 116,596 |
|
| Harmonic, Inc. * | 7,780 | 31,665 |
|
| Infinera Corp. * | 10,374 | 187,977 |
|
| InterDigital, Inc. | 2,783 | 136,478 |
|
| Ixia * | 4,679 | 58,160 |
|
| KVH Industries, Inc. * | 1,491 | 14,045 |
|
| NETGEAR, Inc. * | 2,510 | 105,194 |
|
| NetScout Systems, Inc. * | 7,182 | 220,487 |
|
| Novatel Wireless, Inc. * | 2,908 | 4,856 |
|
| Oclaro, Inc. * | 8,388 | 29,190 |
|
| Plantronics, Inc. | 2,732 | 129,551 |
|
| Polycom, Inc. * | 10,423 | 131,226 |
|
| Ruckus Wireless, Inc. * | 5,810 | 62,225 |
|
| ShoreTel, Inc. * | 5,065 | 44,825 |
|
| Sonus Networks, Inc. * | 4,404 | 31,401 |
|
| Ubiquiti Networks, Inc. * | 2,363 | 74,883 |
|
| ViaSat, Inc. * | 3,297 | 201,150 |
|
| | | 2,118,746 |
|
| | | |
| Construction & Engineering - 0.8% | | |
| Aegion Corp. * | 2,830 | 54,647 |
|
| Ameresco, Inc., Class A * | 1,452 | 9,075 |
|
| Argan, Inc. | 1,001 | 32,432 |
|
| Comfort Systems USA, Inc. | 2,879 | 81,821 |
|
| Dycom Industries, Inc. * | 2,630 | 183,995 |
|
| EMCOR Group, Inc. | 4,838 | 232,418 |
|
| Furmanite Corp. * | 3,036 | 20,220 |
|
| Granite Construction, Inc. | 3,036 | 130,275 |
|
| Great Lakes Dredge & Dock Corp. * | 5,123 | 20,287 |
|
| HC2 Holdings, Inc. * | 1,520 | 8,041 |
|
| MasTec, Inc. * | 5,152 | 89,542 |
|
| MYR Group, Inc. * | 1,740 | 35,861 |
|
| Northwest Pipe Co. * | 929 | 10,396 |
|
| NV5 Holdings, Inc. * | 395 | 8,682 |
|
16 www.calvert.com CALVERT VP RUSSELL 2000 SMALL CAP INDEX PORTFOLIO ANNUAL REPORT
|
| | | | |
| | SHARES | VALUE ($) |
| COMMON STOCKS - Cont'd | | |
| Orion Marine Group, Inc. * | 2,350 | 9,799 |
|
| Primoris Services Corp. | 2,993 | 65,936 |
|
| Tutor Perini Corp. * | 2,896 | 48,479 |
|
| | | 1,041,906 |
|
| | | |
| Construction Materials - 0.2% | | |
| Headwaters, Inc. * | 5,691 | 96,007 |
|
| Summit Materials, Inc., Class A * | 2,472 | 49,530 |
|
| United States Lime & Minerals, Inc. | 156 | 8,574 |
|
| US Concrete, Inc. * | 1,160 | 61,086 |
|
| | | 215,197 |
|
| Consumer Finance - 0.4% | | |
| Cash America International, Inc. | 2,121 | 63,524 |
|
| Encore Capital Group, Inc. * | 2,162 | 62,871 |
|
| Enova International, Inc. * | 2,251 | 14,879 |
|
| Ezcorp, Inc., Class A * | 4,319 | 21,552 |
|
| First Cash Financial Services, Inc. * | 2,176 | 81,448 |
|
| Green Dot Corp., Class A * | 3,541 | 58,143 |
|
| JG Wentworth Co., (The) Class A * | 860 | 1,548 |
|
| Nelnet, Inc., Class A | 1,973 | 66,234 |
|
| PRA Group, Inc. * | 3,729 | 129,359 |
|
| Regional Management Corp. * | 935 | 14,464 |
|
| World Acceptance Corp. * | 581 | 21,555 |
|
| | | 535,577 |
|
| | | |
| Containers & Packaging - 0.4% | | |
| AEP Industries, Inc. * | 367 | 28,314 |
|
| Berry Plastics Group, Inc. * | 9,215 | 333,399 |
|
| Greif, Inc., Class A | 2,377 | 73,235 |
|
| Multi Packaging Solutions International Ltd. * | 1,453 | 25,210 |
|
| Myers Industries, Inc. | 1,882 | 25,068 |
|
| | | 485,226 |
|
| | | |
| Distributors - 0.3% | | |
| Core-Mark Holding Co., Inc. | 1,782 | 146,017 |
|
| Fenix Parts, Inc. * | 1,065 | 7,231 |
|
| Pool Corp. | 3,359 | 271,340 |
|
| VOXX International Corp. * | 1,390 | 7,312 |
|
| Weyco Group, Inc. | 562 | 15,039 |
|
| | | 446,939 |
|
| | | |
| Diversified Consumer Services - 1.0% | | |
| 2U, Inc. * | 1,849 | 51,735 |
|
| American Public Education, Inc. * | 1,323 | 24,621 |
|
| Apollo Education Group, Inc. * | 7,281 | 55,845 |
|
| Ascent Capital Group, Inc., Class A * | 1,027 | 17,171 |
|
| Bridgepoint Education, Inc. * | 1,306 | 9,938 |
|
| Bright Horizons Family Solutions, Inc. * | 2,885 | 192,718 |
|
| Cambium Learning Group, Inc. * | 1,013 | 4,913 |
|
| Capella Education Co. | 953 | 44,047 |
|
| Career Education Corp. * | 5,930 | 21,526 |
|
| Carriage Services, Inc. | 1,428 | 34,415 |
|
www.calvert.com CALVERT VP RUSSELL 2000 SMALL CAP INDEX PORTFOLIO ANNUAL REPORT 17
|
| | | | |
| | SHARES | VALUE ($) |
| COMMON STOCKS - Cont'd | | |
| Chegg, Inc. * | 6,601 | 44,425 |
|
| Collectors Universe, Inc. | 618 | 9,579 |
|
| DeVry Education Group, Inc. | 4,918 | 124,474 |
|
| Grand Canyon Education, Inc. * | 3,633 | 145,756 |
|
| Houghton Mifflin Harcourt Co. * | 10,565 | 230,106 |
|
| K12, Inc. * | 3,081 | 27,113 |
|
| Liberty Tax, Inc. | 395 | 9,413 |
|
| LifeLock, Inc. * | 7,212 | 103,492 |
|
| Regis Corp. * | 3,158 | 44,686 |
|
| Sotheby's | 4,801 | 123,674 |
|
| Strayer Education, Inc. * | 932 | 56,032 |
|
| Universal Technical Institute, Inc. | 1,842 | 8,584 |
|
| Weight Watchers International, Inc. * | 2,151 | 49,043 |
|
| | | 1,433,306 |
|
| | | |
| Diversified Financial Services - 0.4% | | |
| FNFV Group * | 6,176 | 69,356 |
|
| GAIN Capital Holdings, Inc. | 2,074 | 16,820 |
|
| MarketAxess Holdings, Inc. | 2,880 | 321,379 |
|
| Marlin Business Services Corp. | 795 | 12,768 |
|
| NewStar Financial, Inc. * | 2,242 | 20,133 |
|
| On Deck Capital, Inc. * | 1,011 | 10,413 |
|
| PICO Holdings, Inc. * | 1,974 | 20,372 |
|
| Resource America, Inc., Class A | 1,082 | 6,633 |
|
| Tiptree Financial, Inc., Class A | 2,311 | 14,190 |
|
| | | 492,064 |
|
| | | |
| Diversified Telecommunication Services - 0.7% | | |
| 8x8, Inc. * | 6,803 | 77,894 |
|
| Atlantic Tele-Network, Inc. | 816 | 63,836 |
|
| Cincinnati Bell, Inc. * | 17,650 | 63,540 |
|
| Cogent Communications Holdings, Inc. | 3,554 | 123,288 |
|
| Consolidated Communications Holdings, Inc. | 3,898 | 81,663 |
|
| FairPoint Communications, Inc. * | 1,772 | 28,476 |
|
| General Communication, Inc., Class A * | 2,713 | 53,663 |
|
| Globalstar, Inc. * | 36,744 | 52,911 |
|
| Hawaiian Telcom Holdco, Inc. * | 922 | 22,921 |
|
| IDT Corp., Class B | 1,313 | 15,310 |
|
| inContact, Inc. * | 5,364 | 51,173 |
|
| Inteliquent, Inc. | 2,529 | 44,940 |
|
| Intelsat S.A. * | 2,452 | 10,200 |
|
| Iridium Communications, Inc. * | 6,339 | 53,311 |
|
| Lumos Networks Corp. * | 1,756 | 19,667 |
|
| ORBCOMM, Inc. * | 3,946 | 28,569 |
|
| pdvWireless, Inc. * | 1,002 | 27,555 |
|
| Straight Path Communications, Inc., Class B * | 722 | 12,375 |
|
| Vonage Holdings Corp. * | 14,328 | 82,243 |
|
| Winsdtream Holdings, Inc. | 7,781 | 50,110 |
|
| | | 963,645 |
|
| | | |
18 www.calvert.com CALVERT VP RUSSELL 2000 SMALL CAP INDEX PORTFOLIO ANNUAL REPORT
|
| | | | |
| | SHARES | VALUE ($) |
| COMMON STOCKS - Cont'd | | |
| Electric Utilities - 1.2% | | |
| ALLETE, Inc. | 3,762 | 191,222 |
|
| Cleco Corp. | 4,668 | 243,716 |
|
| El Paso Electric Co. | 3,117 | 120,005 |
|
| Empire District Electric Co. (The) | 3,365 | 94,456 |
|
| Genie Energy Ltd., Class B * | 966 | 10,771 |
|
| IDACORP, Inc. | 3,885 | 264,180 |
|
| MGE Energy, Inc. | 2,675 | 124,120 |
|
| Otter Tail Corp. | 3,144 | 83,725 |
|
| PNM Resources, Inc. | 6,147 | 187,914 |
|
| Portland General Electric Co. | 6,946 | 252,626 |
|
| Spark Energy, Inc., Class A | 264 | 5,470 |
|
| Unitil Corp. | 1,238 | 44,419 |
|
| | | 1,622,624 |
|
| | | |
| Electrical Equipment - 0.6% | | |
| Allied Motion Technologies, Inc. | 482 | 12,619 |
|
| AZZ, Inc. | 1,988 | 110,473 |
|
| Encore Wire Corp. | 1,601 | 59,381 |
|
| EnerSys | 3,431 | 191,896 |
|
| Enphase Energy, Inc. * | 1,376 | 4,830 |
|
| Franklin Electric Co., Inc. | 3,676 | 99,362 |
|
| FuelCell Energy, Inc. * | 1,721 | 8,536 |
|
| Generac Holdings, Inc. * | 5,337 | 158,883 |
|
| General Cable Corp. | 3,773 | 50,671 |
|
| LSI Industries, Inc. | 1,507 | 18,370 |
|
| Plug Power, Inc. * | 14,972 | 31,591 |
|
| Powell Industries, Inc. | 811 | 21,110 |
|
| Power Solutions International, Inc. * | 402 | 7,337 |
|
| PowerSecure International, Inc. * | 1,635 | 24,607 |
|
| Preformed Line Products Co. | 222 | 9,346 |
|
| Sunrun, Inc. * | 1,400 | 16,478 |
|
| Thermon Group Holdings, Inc. * | 2,669 | 45,159 |
|
| Vicor Corp. * | 1,707 | 15,568 |
|
| | | 886,217 |
|
| | | |
| Electronic Equipment & Instruments - 2.6% | | |
| Agilysys, Inc. * | 1,316 | 13,147 |
|
| Anixter International, Inc. * | 2,202 | 132,979 |
|
| AVX Corp. | 3,566 | 43,291 |
|
| Badger Meter, Inc. | 1,117 | 65,445 |
|
| Belden, Inc. | 3,291 | 156,915 |
|
| Benchmark Electronics, Inc. * | 4,044 | 83,589 |
|
| Checkpoint Systems, Inc. | 3,461 | 21,700 |
|
| Coherent, Inc. * | 1,839 | 119,737 |
|
| Control4 Corp. * | 1,024 | 7,444 |
|
| CTS Corp. | 2,562 | 45,194 |
|
| Daktronics, Inc. | 2,960 | 25,811 |
|
| DTS, Inc. * | 1,575 | 35,563 |
|
| Electro Rent Corp. | 1,712 | 15,750 |
|
| ePlus, Inc. * | 467 | 43,552 |
|
| Fabrinet * | 2,734 | 65,124 |
|
www.calvert.com CALVERT VP RUSSELL 2000 SMALL CAP INDEX PORTFOLIO ANNUAL REPORT 19
|
| | | | |
| | SHARES | VALUE ($) |
| COMMON STOCKS - Cont'd | | |
| FARO Technologies, Inc. * | 1,341 | 39,586 |
|
| FEI Co. | 3,207 | 255,887 |
|
| GSI Group, Inc. * | 2,626 | 35,766 |
|
| II-VI, Inc. * | 4,403 | 81,720 |
|
| Insight Enterprises, Inc. * | 2,991 | 75,134 |
|
| InvenSense, Inc. * | 6,369 | 65,155 |
|
| Itron, Inc. * | 2,967 | 107,346 |
|
| Kimball Electronics, Inc. * | 2,097 | 23,046 |
|
| Knowles Corp. * | 6,568 | 87,551 |
|
| Littelfuse, Inc. | 1,742 | 186,411 |
|
| Mercury Systems, Inc. * | 2,519 | 46,249 |
|
| Mesa Laboratories, Inc. | 233 | 23,184 |
|
| Methode Electronics, Inc. | 2,959 | 94,185 |
|
| MTS Systems Corp. | 1,150 | 72,921 |
|
| Multi-Fineline Electronix, Inc. * | 789 | 16,317 |
|
| Newport Corp. * | 3,209 | 50,927 |
|
| OSI Systems, Inc. * | 1,529 | 135,561 |
|
| Park Electrochemical Corp. | 1,804 | 27,168 |
|
| PC Connection, Inc. | 756 | 17,116 |
|
| Plexus Corp. * | 2,593 | 90,548 |
|
| RealD, Inc. * | 3,490 | 36,819 |
|
| Rofin-Sinar Technologies, Inc. * | 2,173 | 58,193 |
|
| Rogers Corp. * | 1,437 | 74,106 |
|
| Sanmina Corp. * | 6,377 | 131,239 |
|
| ScanSource, Inc. * | 2,089 | 67,308 |
|
| SYNNEX Corp. | 2,219 | 199,555 |
|
| Tech Data Corp. * | 2,828 | 187,723 |
|
| TTM Technologies, Inc. * | 5,067 | 32,986 |
|
| Universal Display Corp. * | 3,104 | 168,982 |
|
| Vishay Intertechnology, Inc. | 10,452 | 125,947 |
|
| Vishay Precision Group, Inc. * | 1,011 | 11,445 |
|
| | | 3,501,322 |
|
| | | |
| Energy Equipment & Services - 0.8% | | |
| Archrock, Inc. | 5,249 | 39,473 |
|
| Atwood Oceanics, Inc. | 4,989 | 51,037 |
|
| Basic Energy Services, Inc. * | 2,777 | 7,442 |
|
| Bristow Group, Inc. | 2,689 | 69,645 |
|
| C&J Energy Services Ltd. * | 4,013 | 19,102 |
|
| CARBO Ceramics, Inc. | 1,515 | 26,058 |
|
| Dawson Geophysical Co. * | 1,180 | 4,083 |
|
| Era Group, Inc. * | 1,735 | 19,345 |
|
| Exterran Corp. * | 2,624 | 42,115 |
|
| Fairmount Santrol Holdings, Inc. * | 4,937 | 11,602 |
|
| Forum Energy Technologies, Inc. * | 4,578 | 57,042 |
|
| Geospace Technologies Corp. * | 1,271 | 17,883 |
|
| Gulfmark Offshore, Inc., Class A * | 2,302 | 10,750 |
|
| Helix Energy Solutions Group, Inc. * | 8,174 | 42,995 |
|
| Hornbeck Offshore Services, Inc. * | 2,469 | 24,542 |
|
| Independence Contract Drilling, Inc. * | 903 | 4,560 |
|
| ION Geophysical Corp. * | 11,881 | 5,977 |
|
| Key Energy Services, Inc. * | 11,770 | 5,674 |
|
20 www.calvert.com CALVERT VP RUSSELL 2000 SMALL CAP INDEX PORTFOLIO ANNUAL REPORT
|
| | | | |
| | SHARES | VALUE ($) |
| COMMON STOCKS - Cont'd | | |
| Matrix Service Co. * | 2,252 | 46,256 |
|
| McDermott International, Inc. * | 18,414 | 61,687 |
|
| Natural Gas Services Group, Inc. * | 1,066 | 23,772 |
|
| Newpark Resources, Inc. * | 6,491 | 34,272 |
|
| Nordic American Offshore Ltd. | 1,600 | 8,432 |
|
| North Atlantic Drilling Ltd. * | 617 | 1,518 |
|
| Oil States International, Inc. * | 3,982 | 108,510 |
|
| Parker Drilling Co. * | 10,148 | 18,469 |
|
| PHI, Inc. * | 1,085 | 17,805 |
|
| Pioneer Energy Services Corp. * | 5,200 | 11,284 |
|
| RigNet, Inc. * | 1,109 | 22,945 |
|
| SEACOR Holdings, Inc. * | 1,408 | 74,005 |
|
| Seventy Seven Energy, Inc. * | 4,338 | 4,555 |
|
| Tesco Corp. | 3,109 | 22,509 |
|
| TETRA Technologies, Inc. * | 6,615 | 49,745 |
|
| Tidewater, Inc. | 3,629 | 25,258 |
|
| Unit Corp. * | 3,890 | 47,458 |
|
| US Silica Holdings, Inc. | 4,120 | 77,168 |
|
| | | 1,114,973 |
|
| | | |
| Food & Staples Retailing - 0.9% | | |
| Andersons, Inc. (The) | 2,192 | 69,333 |
|
| Casey's General Stores, Inc. | 2,998 | 361,109 |
|
| Chefs' Warehouse, Inc. (The) * | 1,456 | 24,286 |
|
| Fairway Group Holdings Corp. * | 1,354 | 894 |
|
| Fresh Market, Inc. (The) * | 3,326 | 77,895 |
|
| Ingles Markets, Inc., Class A | 1,087 | 47,915 |
|
| Natural Grocers by Vitamin Cottage, Inc. * | 875 | 17,824 |
|
| Performance Food Group Co. * | 1,190 | 27,537 |
|
| PriceSmart, Inc. | 1,502 | 124,651 |
|
| Smart & Final Stores, Inc. * | 1,874 | 34,125 |
|
| SpartanNash Co. | 2,903 | 62,821 |
|
| SUPERVALU, Inc. * | 20,203 | 136,976 |
|
| United Natural Foods, Inc. * | 3,864 | 152,087 |
|
| Village Super Market, Inc., Class A | 640 | 16,864 |
|
| Weis Markets, Inc. | 958 | 42,439 |
|
| | | 1,196,756 |
|
| | | |
| Food Products - 1.6% | | |
| Alico, Inc. | 267 | 10,330 |
|
| Amplify Snack Brands, Inc. * | 1,175 | 13,536 |
|
| Arcadia Biosciences, Inc. * | 634 | 1,927 |
|
| B&G Foods, Inc. | 4,473 | 156,644 |
|
| Boulder Brands, Inc. * | 4,219 | 46,325 |
|
| Cal-Maine Foods, Inc. | 2,417 | 112,004 |
|
| Calavo Growers, Inc. | 1,188 | 58,212 |
|
| Darling Ingredients, Inc. * | 12,751 | 134,141 |
|
| Dean Foods Co. | 7,282 | 124,886 |
|
| Diamond Foods, Inc. * | 2,033 | 78,372 |
|
| Farmer Bros Co. * | 538 | 17,361 |
|
| Fresh Del Monte Produce, Inc. | 2,572 | 99,999 |
|
| Freshpet, Inc. * | 1,604 | 13,618 |
|
www.calvert.com CALVERT VP RUSSELL 2000 SMALL CAP INDEX PORTFOLIO ANNUAL REPORT 21
|
| | | | |
| | SHARES | VALUE ($) |
| COMMON STOCKS - Cont'd | | |
| Inventure Foods, Inc. * | 1,177 | 8,357 |
|
| J&J Snack Foods Corp. | 1,149 | 134,054 |
|
| John B Sanfilippo & Son, Inc. | 716 | 38,686 |
|
| Lancaster Colony Corp. | 1,429 | 164,992 |
|
| Landec Corp. * | 2,282 | 26,996 |
|
| Lifeway Foods, Inc. * | 385 | 4,274 |
|
| Limoneira Co. | 753 | 11,250 |
|
| Omega Protein Corp. * | 1,591 | 35,320 |
|
| Post Holdings, Inc. * | 4,763 | 293,877 |
|
| Sanderson Farms, Inc. | 1,730 | 134,110 |
|
| Seaboard Corp. * | 20 | 57,895 |
|
| Seneca Foods Corp., Class A * | 794 | 23,010 |
|
| Snyder's-Lance, Inc. | 3,769 | 129,277 |
|
| Tootsie Roll Industries, Inc. | 1,438 | 45,426 |
|
| TreeHouse Foods, Inc. * | 3,309 | 259,624 |
|
| | | 2,234,503 |
|
| | | |
| Gas Utilities - 1.2% | | |
| Chesapeake Utilities Corp. | 1,240 | 70,370 |
|
| Laclede Group, Inc. (The) | 3,343 | 198,608 |
|
| New Jersey Resources Corp. | 6,605 | 217,701 |
|
| Northwest Natural Gas Co. | 2,109 | 106,736 |
|
| ONE Gas, Inc. | 4,059 | 203,640 |
|
| Piedmont Natural Gas Co., Inc. | 6,080 | 346,682 |
|
| South Jersey Industries, Inc. | 5,281 | 124,209 |
|
| Southwest Gas Corp. | 3,615 | 199,403 |
|
| WGL Holdings, Inc. | 3,838 | 241,756 |
|
| | | 1,709,105 |
|
| | | |
| Health Care Equipment & Supplies - 3.8% | | |
| Abaxis, Inc. | 1,739 | 96,828 |
|
| ABIOMED, Inc. * | 3,221 | 290,792 |
|
| Accuray, Inc. * | 6,420 | 43,335 |
|
| Analogic Corp. | 957 | 79,048 |
|
| AngioDynamics, Inc. * | 2,155 | 26,162 |
|
| Anika Therapeutics, Inc. * | 1,292 | 49,303 |
|
| Antares Pharma, Inc. * | 9,495 | 11,489 |
|
| AtriCure, Inc. * | 2,456 | 55,113 |
|
| Atrion Corp. | 110 | 41,932 |
|
| Cantel Medical Corp. | 2,651 | 164,733 |
|
| Cardiovascular Systems, Inc. * | 2,478 | 37,467 |
|
| Cerus Corp. * | 7,927 | 50,099 |
|
| ConforMIS, Inc. * | 800 | 13,832 |
|
| CONMED Corp. | 2,130 | 93,826 |
|
| Corindus Vascular Robotics, Inc. * | 1,737 | 5,576 |
|
| CryoLife, Inc. | 2,420 | 26,088 |
|
| Cutera, Inc. * | 1,118 | 14,299 |
|
| Cynosure, Inc., Class A * | 1,710 | 76,386 |
|
| EndoChoice Holdings, Inc. * | 500 | 4,175 |
|
| Endologix, Inc. * | 5,203 | 51,510 |
|
| Entellus Medical, Inc. * | 465 | 7,840 |
|
| Exactech, Inc. * | 863 | 15,663 |
|
22 www.calvert.com CALVERT VP RUSSELL 2000 SMALL CAP INDEX PORTFOLIO ANNUAL REPORT
|
| | | | |
| | SHARES | VALUE ($) |
| COMMON STOCKS - Cont'd | | |
| GenMark Diagnostics, Inc. * | 3,729 | 28,937 |
|
| Glaukos Corp. * | 550 | 13,579 |
|
| Globus Medical, Inc., Class A * | 5,297 | 147,363 |
|
| Greatbatch, Inc. * | 1,969 | 103,372 |
|
| Haemonetics Corp. * | 3,989 | 128,605 |
|
| Halyard Health, Inc. * | 3,591 | 119,975 |
|
| HeartWare International, Inc. * | 1,332 | 67,133 |
|
| ICU Medical, Inc. * | 1,127 | 127,103 |
|
| Inogen, Inc. * | 1,214 | 48,669 |
|
| Insulet Corp. * | 4,380 | 165,608 |
|
| Integra LifeSciences Holdings Corp. * | 2,202 | 149,252 |
|
| Invacare Corp. | 2,498 | 43,440 |
|
| InVivo Therapeutics Holdings Corp. * | 2,050 | 14,760 |
|
| Invuity, Inc. * | 350 | 3,087 |
|
| iRadimed Corp. * | 219 | 6,139 |
|
| K2M Group Holdings, Inc. * | 1,359 | 26,827 |
|
| Lantheus Holdings, Inc. * | 950 | 3,211 |
|
| LDR Holding Corp. * | 1,792 | 44,997 |
|
| LeMaitre Vascular, Inc. | 917 | 15,818 |
|
| LivaNova plc * | 3,459 | 205,361 |
|
| Masimo Corp. * | 3,375 | 140,096 |
|
| Meridian Bioscience, Inc. | 3,556 | 72,969 |
|
| Merit Medical Systems, Inc. * | 3,534 | 65,697 |
|
| Natus Medical, Inc. * | 2,544 | 122,239 |
|
| Neogen Corp. * | 2,859 | 161,591 |
|
| Nevro Corp. * | 1,295 | 87,425 |
|
| Novocure Ltd. * | 608 | 13,595 |
|
| NuVasive, Inc. * | 3,732 | 201,939 |
|
| NxStage Medical, Inc. * | 5,151 | 112,858 |
|
| OraSure Technologies, Inc. * | 4,811 | 30,983 |
|
| Orthofix International NV * | 1,448 | 56,776 |
|
| Oxford Immunotec Global plc * | 1,165 | 13,397 |
|
| Penumbra, Inc. * | 356 | 19,156 |
|
| Quidel Corp. * | 2,221 | 47,085 |
|
| Rockwell Medical, Inc. * | 3,471 | 35,543 |
|
| RTI Surgical, Inc. * | 4,427 | 17,575 |
|
| SeaSpine Holdings Corp. * | 659 | 11,322 |
|
| Second Sight Medical Products, Inc. * | 912 | 5,372 |
|
| Sientra, Inc. * | 500 | 2,960 |
|
| Spectranetics Corp. (The) * | 3,271 | 49,261 |
|
| STAAR Surgical Co. * | 3,235 | 23,098 |
|
| STERIS plc | 6,659 | 501,689 |
|
| SurModics, Inc. * | 1,145 | 23,209 |
|
| Tandem Diabetes Care, Inc. * | 810 | 9,566 |
|
| TransEnterix, Inc. * | 2,569 | 6,371 |
|
| Unilife Corp. * | 11,004 | 5,448 |
|
| Utah Medical Products, Inc. | 296 | 17,328 |
|
| Vascular Solutions, Inc. * | 1,424 | 48,971 |
|
| Veracyte, Inc. * | 444 | 3,197 |
|
www.calvert.com CALVERT VP RUSSELL 2000 SMALL CAP INDEX PORTFOLIO ANNUAL REPORT 23
|
| | | | |
| | SHARES | VALUE ($) |
| COMMON STOCKS - Cont'd | | |
| West Pharmaceutical Services, Inc. | 5,553 | 334,402 |
|
| Wright Medical Group N.V. * | 6,887 | 166,528 |
|
| Zeltiq Aesthetics, Inc. * | 2,605 | 74,321 |
|
| | | 5,200,699 |
|
| | | |
| Health Care Providers & Services - 2.6% | | |
| AAC Holdings, Inc. * | 500 | 9,530 |
|
| Aceto Corp. | 2,247 | 60,624 |
|
| Addus HomeCare Corp. * | 471 | 10,965 |
|
| Adeptus Health, Inc., Class A * | 494 | 26,933 |
|
| Air Methods Corp. * | 3,030 | 127,048 |
|
| Alliance HealthCare Services, Inc. * | 430 | 3,947 |
|
| Almost Family, Inc. * | 554 | 21,179 |
|
| Amedisys, Inc. * | 2,178 | 85,639 |
|
| AMN Healthcare Services, Inc. * | 3,670 | 113,954 |
|
| Amsurg Corp. * | 4,205 | 319,580 |
|
| BioScrip, Inc. * | 6,131 | 10,729 |
|
| BioTelemetry, Inc. * | 2,365 | 27,623 |
|
| Capital Senior Living Corp. * | 2,506 | 52,275 |
|
| Chemed Corp. | 1,318 | 197,436 |
|
| Civitas Solutions, Inc. * | 1,020 | 29,366 |
|
| CorVel Corp. * | 664 | 29,163 |
|
| Cross Country Healthcare, Inc. * | 2,877 | 47,154 |
|
| Diplomat Pharmacy, Inc. * | 2,792 | 95,542 |
|
| Ensign Group, Inc. (The) | 3,978 | 90,022 |
|
| ExamWorks Group, Inc. * | 3,163 | 84,136 |
|
| Five Star Quality Care, Inc. * | 3,773 | 11,998 |
|
| Genesis Healthcare, Inc. * | 2,829 | 9,817 |
|
| Hanger, Inc. * | 2,724 | 44,810 |
|
| HealthEquity, Inc. * | 2,799 | 70,171 |
|
| HealthSouth Corp. | 7,194 | 250,423 |
|
| Healthways, Inc. * | 2,396 | 30,837 |
|
| Kindred Healthcare, Inc. | 6,440 | 76,700 |
|
| Landauer, Inc. | 822 | 27,060 |
|
| LHC Group, Inc. * | 1,040 | 47,102 |
|
| Magellan Health, Inc. * | 1,949 | 120,175 |
|
| Molina Healthcare, Inc. * | 3,056 | 183,757 |
|
| National HealthCare Corp. | 778 | 48,003 |
|
| National Research Corp., Class A | 681 | 10,923 |
|
| Nobilis Health Corp. * | 2,467 | 6,957 |
|
| Owens & Minor, Inc. | 4,870 | 175,223 |
|
| PharMerica Corp. * | 2,345 | 82,075 |
|
| Providence Service Corp. (The) * | 915 | 42,932 |
|
| RadNet, Inc. * | 2,930 | 18,107 |
|
| Select Medical Holdings Corp. | 8,104 | 96,519 |
|
| Surgery Partners, Inc. * | 1,289 | 26,412 |
|
| Surgical Care Affiliates, Inc. * | 1,661 | 66,124 |
|
| Team Health Holdings, Inc. * | 5,558 | 243,941 |
|
| Teladoc, Inc. * | 750 | 13,470 |
|
| Triple-S Management Corp., Class B * | 2,042 | 48,824 |
|
| Trupanion, Inc. * | 737 | 7,193 |
|
| Universal American Corp. | 3,383 | 23,681 |
|
24 www.calvert.com CALVERT VP RUSSELL 2000 SMALL CAP INDEX PORTFOLIO ANNUAL REPORT
|
| | | | |
| | SHARES | VALUE ($) |
| COMMON STOCKS - Cont'd | | |
| US Physical Therapy, Inc. | 1,051 | 56,418 |
|
| WellCare Health Plans, Inc. * | 3,399 | 265,836 |
|
| | | 3,548,333 |
|
| | | |
| Health Care Technology - 0.6% | | |
| Castlight Health, Inc., Class B * | 2,604 | 11,119 |
|
| Computer Programs & Systems, Inc. | 938 | 46,665 |
|
| Connecture, Inc. * | 580 | 2,094 |
|
| Evolent Health, Inc., Class A * | 1,050 | 12,716 |
|
| HealthStream, Inc. * | 1,758 | 38,676 |
|
| HMS Holdings Corp. * | 6,833 | 84,319 |
|
| Imprivata, Inc. * | 521 | 5,887 |
|
| MedAssets, Inc. * | 4,659 | 144,149 |
|
| Medidata Solutions, Inc. * | 4,266 | 210,271 |
|
| Omnicell, Inc. * | 2,797 | 86,931 |
|
| Press Ganey Holdings, Inc. * | 790 | 24,925 |
|
| Quality Systems, Inc. | 3,856 | 62,159 |
|
| Vocera Communications, Inc. * | 1,818 | 22,180 |
|
| | | 752,091 |
|
| | | |
| Hotels, Restaurants & Leisure - 3.2% | | |
| Belmond Ltd., Class A * | 7,476 | 71,022 |
|
| Biglari Holdings, Inc. * | 130 | 42,357 |
|
| BJ's Restaurants, Inc. * | 1,658 | 72,073 |
|
| Bloomin' Brands, Inc. | 9,567 | 161,587 |
|
| Bob Evans Farms, Inc. | 1,825 | 70,901 |
|
| Bojangles', Inc. * | 640 | 10,157 |
|
| Boyd Gaming Corp. * | 6,158 | 122,359 |
|
| Bravo Brio Restaurant Group, Inc. * | 1,583 | 14,247 |
|
| Buffalo Wild Wings, Inc. * | 1,466 | 234,047 |
|
| Caesars Acquisition Co., Class A * | 4,096 | 27,894 |
|
| Caesars Entertainment Corp. * | 4,594 | 36,247 |
|
| Carrols Restaurant Group, Inc. * | 3,096 | 36,347 |
|
| Cheesecake Factory, Inc. (The) | 3,763 | 173,512 |
|
| Churchill Downs, Inc. | 1,038 | 146,867 |
|
| Chuy's Holdings, Inc. * | 1,271 | 39,833 |
|
| ClubCorp Holdings, Inc. | 3,390 | 61,935 |
|
| Cracker Barrel Old Country Store, Inc. | 1,480 | 187,708 |
|
| Dave & Buster's Entertainment, Inc. * | 1,758 | 73,379 |
|
| Del Frisco's Restaurant Group, Inc. * | 2,117 | 33,914 |
|
| Denny's Corp. * | 6,511 | 64,003 |
|
| Diamond Resorts International, Inc. * | 3,170 | 80,867 |
|
| DineEquity, Inc. | 1,309 | 110,833 |
|
| El Pollo Loco Holdings, Inc. * | 720 | 9,094 |
|
| Eldorado Resorts, Inc. * | 2,176 | 23,936 |
|
| Empire Resorts, Inc. * | 270 | 4,867 |
|
| Fiesta Restaurant Group, Inc. * | 2,070 | 69,552 |
|
| Fogo De Chao, Inc. * | 400 | 6,064 |
|
| Habit Restaurants, Inc., (The) Class A * | 887 | 20,454 |
|
| International Speedway Corp., Class A | 2,154 | 72,633 |
|
| Interval Leisure Group, Inc. | 3,020 | 47,142 |
|
| Intrawest Resorts Holdings, Inc. * | 1,551 | 12,129 |
|
www.calvert.com CALVERT VP RUSSELL 2000 SMALL CAP INDEX PORTFOLIO ANNUAL REPORT 25
|
| | | | |
| | SHARES | VALUE ($) |
| COMMON STOCKS - Cont'd | | |
| Isle of Capri Casinos, Inc. * | 1,930 | 26,885 |
|
| J. Alexander's Holdings, Inc. * | 1,066 | 11,641 |
|
| Jack in the Box, Inc. | 2,885 | 221,308 |
|
| Jamba, Inc. * | 1,460 | 19,695 |
|
| Kona Grill, Inc. * | 652 | 10,341 |
|
| Krispy Kreme Doughnuts, Inc. * | 5,005 | 75,425 |
|
| La Quinta Holdings, Inc. * | 7,226 | 98,346 |
|
| Marcus Corp. (The) | 1,417 | 26,880 |
|
| Marriott Vacations Worldwide Corp. | 1,995 | 113,615 |
|
| Monarch Casino & Resort, Inc. * | 917 | 20,834 |
|
| Morgans Hotel Group Co. * | 2,245 | 7,566 |
|
| Noodles & Co. * | 970 | 9,399 |
|
| Papa John's International, Inc. | 2,234 | 124,814 |
|
| Papa Murphy's Holdings, Inc. * | 523 | 5,889 |
|
| Penn National Gaming, Inc. * | 6,159 | 98,667 |
|
| Pinnacle Entertainment, Inc. * | 4,671 | 145,362 |
|
| Planet Fitness, Inc., Class A * | 1,220 | 19,069 |
|
| Popeyes Louisiana Kitchen, Inc. * | 1,787 | 104,540 |
|
| Potbelly Corp. * | 1,684 | 19,720 |
|
| Red Robin Gourmet Burgers, Inc. * | 1,090 | 67,297 |
|
| Ruby Tuesday, Inc. * | 5,637 | 31,060 |
|
| Ruth's Hospitality Group, Inc. | 3,111 | 49,527 |
|
| Scientific Games Corp., Class A * | 4,117 | 36,929 |
|
| SeaWorld Entertainment, Inc. | 5,276 | 103,884 |
|
| Shake Shack, Inc., Class A * | 505 | 19,998 |
|
| Sonic Corp. | 4,013 | 129,660 |
|
| Speedway Motorsports, Inc. | 1,049 | 21,735 |
|
| Texas Roadhouse, Inc. | 5,402 | 193,230 |
|
| Vail Resorts, Inc. | 2,805 | 359,012 |
|
| Wingstop, Inc. * | 525 | 11,975 |
|
| Zoe's Kitchen, Inc. * | 1,491 | 41,718 |
|
| | | 4,363,981 |
|
| | | |
| Household Durables - 1.2% | | |
| Bassett Furniture Industries, Inc. | 830 | 20,816 |
|
| Beazer Homes USA, Inc. * | 2,186 | 25,117 |
|
| CalAtlantic Group, Inc. | 5,937 | 225,131 |
|
| Cavco Industries, Inc. * | 684 | 56,984 |
|
| Century Communities, Inc. * | 1,175 | 20,809 |
|
| CSS Industries, Inc. | 772 | 21,909 |
|
| Ethan Allen Interiors, Inc. | 2,160 | 60,091 |
|
| Flexsteel Industries, Inc. | 405 | 17,893 |
|
| Green Brick Partners, Inc. * | 1,109 | 7,985 |
|
| Helen of Troy Ltd. * | 2,199 | 207,256 |
|
| Hooker Furniture Corp. | 834 | 21,050 |
|
| Hovnanian Enterprises, Inc., Class A * | 9,758 | 17,662 |
|
| Installed Building Products, Inc. * | 1,536 | 38,139 |
|
| iRobot Corp. * | 2,473 | 87,544 |
|
| KB Home | 6,299 | 77,667 |
|
| La-Z-Boy, Inc. | 3,950 | 96,459 |
|
| LGI Homes, Inc. * | 1,281 | 31,167 |
|
| Libbey, Inc. | 1,811 | 38,611 |
|
26 www.calvert.com CALVERT VP RUSSELL 2000 SMALL CAP INDEX PORTFOLIO ANNUAL REPORT
|
| | | | |
| | SHARES | VALUE ($) |
| COMMON STOCKS - Cont'd | | |
| Lifetime Brands, Inc. | 858 | 11,377 |
|
| M/I Homes, Inc. * | 2,148 | 47,084 |
|
| MDC Holdings, Inc. | 3,015 | 76,973 |
|
| Meritage Homes Corp. * | 3,060 | 104,010 |
|
| NACCO Industries, Inc., Class A | 427 | 18,019 |
|
| New Home Co., Inc. (The) * | 775 | 10,044 |
|
| Skullcandy, Inc. * | 1,457 | 6,892 |
|
| Taylor Morrison Home Corp., Class A * | 2,509 | 40,144 |
|
| TRI Pointe Group, Inc. * | 12,890 | 163,316 |
|
| Universal Electronics, Inc. * | 1,224 | 62,853 |
|
| WCI Communities, Inc. * | 1,051 | 23,416 |
|
| William Lyon Homes, Class A * | 1,572 | 25,938 |
|
| ZAGG, Inc. * | 2,279 | 24,932 |
|
| | | 1,687,288 |
|
| | | |
| Household Products - 0.2% | | |
| Central Garden & Pet Co., Class A * | 3,442 | 46,811 |
|
| HRG Group, Inc. * | 6,069 | 82,296 |
|
| Oil-Dri Corp. of America | 406 | 14,953 |
|
| Orchids Paper Products Co. | 518 | 16,016 |
|
| WD-40 Co. | 1,124 | 110,883 |
|
| | | 270,959 |
|
| | | |
| Independent Power and Renewable Electricity Producers - 0.4% | | |
| Abengoa Yield plc | 3,786 | 73,032 |
|
| Atlantic Power Corp. | 10,236 | 20,165 |
|
| Dynegy, Inc. * | 9,890 | 132,526 |
|
| NRG Yield, Inc., Class A | 2,663 | 37,042 |
|
| NRG Yield, Inc., Class C | 4,869 | 71,867 |
|
| Ormat Technologies, Inc. | 2,907 | 106,018 |
|
| Pattern Energy Group, Inc. | 4,371 | 91,398 |
|
| Talen Energy Corp. * | 6,440 | 40,121 |
|
| TerraForm Global, Inc., Class A | 3,400 | 19,006 |
|
| Vivint Solar, Inc. * | 1,800 | 17,208 |
|
| | | 608,383 |
|
| | | |
| Industrial Conglomerates - 0.0% | | |
| Raven Industries, Inc. | 2,917 | 45,505 |
|
| | | |
| Insurance - 2.5% | | |
| Ambac Financial Group, Inc. * | 3,473 | 48,935 |
|
| American Equity Investment Life Holding Co. | 6,347 | 152,518 |
|
| AMERISAFE, Inc. | 1,465 | 74,569 |
|
| Argo Group International Holdings Ltd. | 2,156 | 129,015 |
|
| Atlas Financial Holdings, Inc. * | 1,031 | 20,517 |
|
| Baldwin & Lyons, Inc., Class B | 853 | 20,498 |
|
| Citizens, Inc. * | 3,380 | 25,113 |
|
| CNO Financial Group, Inc. | 14,509 | 276,977 |
|
| Crawford & Co., Class B | 2,478 | 13,158 |
|
| Donegal Group, Inc., Class A | 916 | 12,897 |
|
| eHealth, Inc. * | 1,593 | 15,898 |
|
| EMC Insurance Group, Inc. | 745 | 18,849 |
|
www.calvert.com CALVERT VP RUSSELL 2000 SMALL CAP INDEX PORTFOLIO ANNUAL REPORT 27
|
| | | | |
| | SHARES | VALUE ($) |
| COMMON STOCKS - Cont'd | | |
| Employers Holdings, Inc. | 2,669 | 72,864 |
|
| Enstar Group Ltd. * | 701 | 105,178 |
|
| FBL Financial Group, Inc., Class A | 766 | 48,748 |
|
| Federated National Holding Co. | 1,014 | 29,974 |
|
| Fidelity & Guaranty Life | 987 | 25,040 |
|
| First American Financial Corp. | 8,365 | 300,303 |
|
| Global Indemnity plc * | 810 | 23,506 |
|
| Greenlight Capital Re Ltd., Class A * | 2,232 | 41,761 |
|
| Hallmark Financial Services, Inc. * | 1,205 | 14,086 |
|
| HCI Group, Inc. | 801 | 27,915 |
|
| Heritage Insurance Holdings, Inc. | 1,906 | 41,589 |
|
| Horace Mann Educators Corp. | 3,175 | 105,347 |
|
| Independence Holding Co. | 665 | 9,210 |
|
| Infinity Property & Casualty Corp. | 885 | 72,774 |
|
| James River Group Holdings Ltd. | 967 | 32,433 |
|
| Kansas City Life Insurance Co. | 365 | 13,976 |
|
| Kemper Corp. | 3,357 | 125,048 |
|
| Maiden Holdings Ltd. | 4,341 | 64,724 |
|
| MBIA, Inc. * | 10,647 | 68,993 |
|
| National General Holdings Corp. | 3,122 | 68,247 |
|
| National Interstate Corp. | 681 | 18,183 |
|
| National Western Life Group, Inc., Class A | 193 | 48,624 |
|
| Navigators Group, Inc. (The) * | 819 | 70,262 |
|
| OneBeacon Insurance Group Ltd., Class A | 1,823 | 22,623 |
|
| Patriot National, Inc. * | 731 | 4,905 |
|
| Primerica, Inc. | 3,773 | 178,199 |
|
| RLI Corp. | 3,333 | 205,813 |
|
| Safety Insurance Group, Inc. | 1,103 | 62,187 |
|
| Selective Insurance Group, Inc. | 4,395 | 147,584 |
|
| State Auto Financial Corp. | 1,338 | 27,549 |
|
| State National Cos., Inc. | 2,290 | 22,465 |
|
| Stewart Information Services Corp. | 1,793 | 66,933 |
|
| Symetra Financial Corp. | 5,796 | 184,139 |
|
| Third Point Reinsurance Ltd. * | 6,514 | 87,353 |
|
| United Fire Group, Inc. | 1,562 | 59,840 |
|
| United Insurance Holdings Corp. | 1,490 | 25,479 |
|
| Universal Insurance Holdings, Inc. | 2,530 | 58,645 |
|
| | | 3,391,443 |
|
| | | |
| Internet & Catalog Retail - 0.6% | | |
| 1-800-Flowers.com, Inc., Class A * | 2,081 | 15,150 |
|
| Blue Nile, Inc. * | 1,104 | 40,991 |
|
| Duluth Holdings, Inc. * | 634 | 9,250 |
|
| Etsy, Inc. * | 1,543 | 12,745 |
|
| EVINE Live, Inc. * | 3,387 | 6,029 |
|
| FTD Cos., Inc. * | 1,526 | 39,935 |
|
| HSN, Inc. | 2,509 | 127,131 |
|
| Lands' End, Inc. * | 1,477 | 34,621 |
|
| Liberty TripAdvisor Holdings, Inc., Class A * | 5,772 | 175,122 |
|
| Nutrisystem, Inc. | 2,351 | 50,876 |
|
| Overstock.com, Inc. * | 951 | 11,678 |
|
| PetMed Express, Inc. | 1,778 | 30,475 |
|
28 www.calvert.com CALVERT VP RUSSELL 2000 SMALL CAP INDEX PORTFOLIO ANNUAL REPORT
|
| | | | |
| | SHARES | VALUE ($) |
| COMMON STOCKS - Cont'd | | |
| Shutterfly, Inc. * | 2,901 | 129,269 |
|
| Wayfair, Inc., Class A * | 1,548 | 73,716 |
|
| | | 756,988 |
|
| | | |
| Internet Software & Services - 2.3% | | |
| Actua Corp. * | 3,133 | 35,873 |
|
| Alarm.com Holdings, Inc. * | 650 | 10,842 |
|
| Amber Road, Inc. * | 800 | 4,072 |
|
| Angie's List, Inc. * | 3,417 | 31,949 |
|
| Apigee Corp. * | 399 | 3,204 |
|
| Appfolio, Inc., Class A * | 450 | 6,570 |
|
| Bankrate, Inc. * | 5,150 | 68,495 |
|
| Bazaarvoice, Inc. * | 4,145 | 18,155 |
|
| Benefitfocus, Inc. * | 608 | 22,125 |
|
| Blucora, Inc. * | 3,157 | 30,939 |
|
| Box, Inc., Class A * | 1,099 | 15,342 |
|
| Brightcove, Inc. * | 2,425 | 15,035 |
|
| Carbonite, Inc. * | 1,044 | 10,231 |
|
| Care.com, Inc. * | 566 | 4,053 |
|
| ChannelAdvisor Corp. * | 1,855 | 25,692 |
|
| Cimpress NV * | 2,532 | 205,447 |
|
| comScore, Inc. * | 2,656 | 109,294 |
|
| Constant Contact, Inc. * | 2,482 | 72,574 |
|
| Cornerstone OnDemand, Inc. * | 4,163 | 143,748 |
|
| Cvent, Inc. * | 1,817 | 63,432 |
|
| Demandware, Inc. * | 2,577 | 139,081 |
|
| DHI Group, Inc. * | 3,501 | 32,104 |
|
| EarthLink Holdings Corp. | 7,956 | 59,113 |
|
| Endurance International Group Holdings, Inc. * | 4,524 | 49,447 |
|
| Envestnet, Inc. * | 2,989 | 89,222 |
|
| Everyday Health, Inc. * | 1,666 | 10,029 |
|
| Five9, Inc. * | 1,093 | 9,509 |
|
| Gogo, Inc. * | 4,336 | 77,181 |
|
| GrubHub, Inc. * | 5,802 | 140,408 |
|
| GTT Communications, Inc. * | 1,887 | 32,192 |
|
| Hortonworks, Inc. * | 632 | 13,841 |
|
| Instructure, Inc. * | 392 | 8,161 |
|
| Internap Corp. * | 4,533 | 29,011 |
|
| Intralinks Holdings, Inc. * | 3,311 | 30,031 |
|
| j2 Global, Inc. | 3,720 | 306,230 |
|
| Limelight Networks, Inc. * | 4,616 | 6,739 |
|
| Liquidity Services, Inc. * | 2,122 | 13,793 |
|
| LivePerson, Inc. * | 4,955 | 33,446 |
|
| LogMeIn, Inc. * | 1,900 | 127,490 |
|
| Marchex, Inc., Class B | 2,943 | 11,448 |
|
| Marin Software, Inc. * | 2,360 | 8,449 |
|
| Marketo, Inc. * | 2,685 | 77,086 |
|
| MaxPoint Interactive, Inc. * | 534 | 913 |
|
| MINDBODY, Inc., Class A * | 550 | 8,322 |
|
| Monster Worldwide, Inc. * | 7,023 | 40,242 |
|
| New Relic, Inc. * | 505 | 18,397 |
|
| NIC, Inc. | 5,058 | 99,542 |
|
www.calvert.com CALVERT VP RUSSELL 2000 SMALL CAP INDEX PORTFOLIO ANNUAL REPORT 29
|
| | | | |
| | SHARES | VALUE ($) |
| COMMON STOCKS - Cont'd | | |
| OPOWER, Inc. * | 2,018 | 21,310 |
|
| Q2 Holdings, Inc. * | 1,503 | 39,634 |
|
| QuinStreet, Inc. * | 2,943 | 12,626 |
|
| Quotient Technology, Inc. * | 4,711 | 32,129 |
|
| RealNetworks, Inc. * | 1,733 | 7,365 |
|
| Reis, Inc. | 719 | 17,062 |
|
| RetailMeNot, Inc. * | 2,759 | 27,369 |
|
| Rocket Fuel, Inc. * | 1,645 | 5,741 |
|
| SciQuest, Inc. * | 2,242 | 29,079 |
|
| Shutterstock, Inc. * | 1,515 | 48,995 |
|
| SPS Commerce, Inc. * | 1,276 | 89,588 |
|
| Stamps.com, Inc. * | 1,100 | 120,571 |
|
| TechTarget, Inc. * | 1,109 | 8,905 |
|
| Textura Corp. * | 1,671 | 36,060 |
|
| Travelzoo, Inc. * | 642 | 5,374 |
|
| TrueCar, Inc. * | 3,777 | 36,033 |
|
| United Online, Inc. * | 1,133 | 13,358 |
|
| Web.com Group, Inc. * | 3,382 | 67,674 |
|
| WebMD Health Corp. * | 2,916 | 140,843 |
|
| Wix.com Ltd. * | 1,243 | 28,278 |
|
| Xactly Corp. * | 600 | 5,118 |
|
| XO Group, Inc. * | 2,474 | 39,732 |
|
| | | 3,201,343 |
|
| | | |
| IT Services - 2.5% | | |
| 6D Global Technologies, Inc. *(a) | 1,527 | 15 |
|
| Acxiom Corp. * | 6,033 | 126,210 |
|
| Blackhawk Network Holdings, Inc. * | 4,190 | 185,240 |
|
| CACI International, Inc., Class A * | 1,866 | 173,128 |
|
| Cardtronics, Inc. * | 3,463 | 116,530 |
|
| Cass Information Systems, Inc. | 943 | 48,527 |
|
| Ciber, Inc. * | 6,559 | 23,022 |
|
| Convergys Corp. | 7,627 | 189,836 |
|
| CSG Systems International, Inc. | 2,527 | 90,921 |
|
| Datalink Corp. * | 1,373 | 9,336 |
|
| EPAM Systems, Inc. * | 3,774 | 296,712 |
|
| Euronet Worldwide, Inc. * | 4,004 | 290,010 |
|
| Everi Holdings, Inc. * | 5,479 | 24,053 |
|
| EVERTEC, Inc. | 5,077 | 84,989 |
|
| ExlService Holdings, Inc. * | 2,570 | 115,470 |
|
| Forrester Research, Inc. | 776 | 22,101 |
|
| Hackett Group, Inc. (The) | 1,931 | 31,031 |
|
| Heartland Payment Systems, Inc. | 2,824 | 267,772 |
|
| Lionbridge Technologies, Inc. * | 5,129 | 25,183 |
|
| Luxoft Holding, Inc. * | 1,416 | 109,216 |
|
| ManTech International Corp., Class A | 1,948 | 58,908 |
|
| MAXIMUS, Inc. | 5,085 | 286,031 |
|
| ModusLink Global Solutions, Inc. * | 3,259 | 8,082 |
|
| MoneyGram International, Inc. * | 2,614 | 16,390 |
|
| NeuStar, Inc., Class A * | 4,273 | 102,424 |
|
| Perficient, Inc. * | 2,876 | 49,237 |
|
| PFSweb, Inc. * | 930 | 11,969 |
|
30 www.calvert.com CALVERT VP RUSSELL 2000 SMALL CAP INDEX PORTFOLIO ANNUAL REPORT
|
| | | | |
| | SHARES | VALUE ($) |
| COMMON STOCKS - Cont'd | | |
| Science Applications International Corp. | 3,506 | 160,505 |
|
| ServiceSource International, Inc. * | 5,266 | 24,276 |
|
| Sykes Enterprises, Inc. * | 3,008 | 92,586 |
|
| Syntel, Inc. * | 2,422 | 109,596 |
|
| TeleTech Holdings, Inc. | 1,255 | 35,027 |
|
| Travelport Worldwide Ltd. | 8,146 | 105,083 |
|
| Unisys Corp. * | 3,852 | 42,565 |
|
| Virtusa Corp. * | 2,330 | 96,322 |
|
| | | 3,428,303 |
|
| | | |
| Leisure Products - 0.3% | | |
| Arctic Cat, Inc. | 1,125 | 18,427 |
|
| Black Diamond, Inc. * | 1,890 | 8,354 |
|
| Callaway Golf Co. | 6,676 | 62,888 |
|
| Escalade, Inc. | 888 | 11,766 |
|
| JAKKS Pacific, Inc. * | 1,960 | 15,602 |
|
| Johnson Outdoors, Inc., Class A | 405 | 8,865 |
|
| Malibu Boats, Inc., Class A * | 1,378 | 22,558 |
|
| Marine Products Corp. | 813 | 4,911 |
|
| MCBC Holdings, Inc. * | 550 | 7,535 |
|
| Nautilus, Inc. * | 2,675 | 44,726 |
|
| Performance Sports Group Ltd. * | 3,499 | 33,695 |
|
| Smith & Wesson Holding Corp. * | 4,149 | 91,195 |
|
| Sturm Ruger & Co., Inc. | 1,443 | 86,017 |
|
| | | 416,539 |
|
| | | |
| Life Sciences - Tools & Services - 0.7% | | |
| Accelerate Diagnostics, Inc. * | 1,660 | 35,673 |
|
| Affymetrix, Inc. * | 6,207 | 62,629 |
|
| Albany Molecular Research, Inc. * | 2,006 | 39,819 |
|
| Cambrex Corp. * | 2,416 | 113,769 |
|
| Fluidigm Corp. * | 2,221 | 24,009 |
|
| Harvard Bioscience, Inc. * | 2,582 | 8,960 |
|
| INC Research Holdings, Inc., Class A * | 1,001 | 48,559 |
|
| Luminex Corp. * | 3,221 | 68,897 |
|
| NanoString Technologies, Inc. * | 900 | 13,239 |
|
| NeoGenomics, Inc. * | 4,132 | 32,519 |
|
| Pacific Biosciences of California, Inc. * | 5,069 | 66,556 |
|
| PAREXEL International Corp. * | 4,258 | 290,055 |
|
| PRA Health Sciences, Inc. * | 1,700 | 76,959 |
|
| Sequenom, Inc. * | 10,313 | 16,913 |
|
| | | 898,556 |
|
| | | |
| Machinery - 2.5% | | |
| Accuride Corp. * | 4,261 | 7,073 |
|
| Actuant Corp., Class A | 4,596 | 110,120 |
|
| Alamo Group, Inc. | 670 | 34,907 |
|
| Albany International Corp., Class A | 2,184 | 79,825 |
|
| Altra Industrial Motion Corp. | 2,038 | 51,113 |
|
| American Railcar Industries, Inc. | 687 | 31,794 |
|
| Astec Industries, Inc. | 1,463 | 59,544 |
|
| Barnes Group, Inc. | 4,228 | 149,629 |
|
www.calvert.com CALVERT VP RUSSELL 2000 SMALL CAP INDEX PORTFOLIO ANNUAL REPORT 31
|
| | | | |
| | SHARES | VALUE ($) |
| COMMON STOCKS - Cont'd | | |
| Blount International, Inc. * | 4,185 | 41,055 |
|
| Blue Bird Corp. * | 396 | 4,015 |
|
| Briggs & Stratton Corp. | 3,442 | 59,547 |
|
| Chart Industries, Inc. * | 2,357 | 42,332 |
|
| CIRCOR International, Inc. | 1,323 | 55,764 |
|
| CLARCOR, Inc. | 3,871 | 192,311 |
|
| Columbus McKinnon Corp. | 1,673 | 31,620 |
|
| Commercial Vehicle Group, Inc. * | 2,272 | 6,271 |
|
| Douglas Dynamics, Inc. | 1,993 | 41,993 |
|
| EnPro Industries, Inc. | 1,761 | 77,202 |
|
| ESCO Technologies, Inc. | 2,013 | 72,750 |
|
| ExOne Co. (The) * | 889 | 8,926 |
|
| Federal Signal Corp. | 4,825 | 76,476 |
|
| FreightCar America, Inc. | 1,042 | 20,246 |
|
| Gerber Scientific, Inc. (a)* | 2,334 | — |
|
| Global Brass & Copper Holdings, Inc. | 1,912 | 40,726 |
|
| Gorman-Rupp Co. (The) | 1,593 | 42,581 |
|
| Graham Corp. | 863 | 14,516 |
|
| Greenbrier Cos., Inc. (The) | 2,037 | 66,447 |
|
| Harsco Corp. | 6,181 | 48,706 |
|
| Hillenbrand, Inc. | 4,856 | 143,883 |
|
| Hurco Cos., Inc. | 529 | 14,050 |
|
| Hyster-Yale Materials Handling, Inc. | 732 | 38,393 |
|
| John Bean Technologies Corp. | 2,255 | 112,367 |
|
| Kadant, Inc. | 966 | 39,229 |
|
| LB Foster Co., Class A | 815 | 11,133 |
|
| Lindsay Corp. | 911 | 65,956 |
|
| Lydall, Inc. * | 1,313 | 46,585 |
|
| Meritor, Inc. * | 7,535 | 62,917 |
|
| Milacron Holdings Corp. * | 1,150 | 14,387 |
|
| Miller Industries, Inc. | 1,050 | 22,869 |
|
| Mueller Industries, Inc. | 4,397 | 119,159 |
|
| Mueller Water Products, Inc., Class A | 12,416 | 106,778 |
|
| Navistar International Corp. * | 3,937 | 34,803 |
|
| NN, Inc. | 2,081 | 33,171 |
|
| Omega Flex, Inc. | 248 | 8,186 |
|
| Proto Labs, Inc. * | 1,797 | 114,451 |
|
| RBC Bearings, Inc. * | 1,805 | 116,585 |
|
| Rexnord Corp. * | 7,858 | 142,387 |
|
| Standex International Corp. | 986 | 81,986 |
|
| Sun Hydraulics Corp. | 1,860 | 59,018 |
|
| Tennant Co. | 1,420 | 79,889 |
|
| Titan International, Inc. | 3,947 | 15,551 |
|
| TriMas Corp. * | 3,495 | 65,182 |
|
| Twin Disc, Inc. | 694 | 7,301 |
|
| Wabash National Corp. * | 5,241 | 62,001 |
|
| Watts Water Technologies, Inc., Class A | 2,174 | 107,983 |
|
| Woodward, Inc. | 5,041 | 250,336 |
|
| Xerium Technologies, Inc. * | 941 | 11,151 |
|
| | | 3,455,176 |
|
| | | |
32 www.calvert.com CALVERT VP RUSSELL 2000 SMALL CAP INDEX PORTFOLIO ANNUAL REPORT
|
| | | | |
| | SHARES | VALUE ($) |
| COMMON STOCKS - Cont'd | | |
| Marine - 0.1% | | |
| Eagle Bulk Shipping, Inc. * | 1,715 | 6,037 |
|
| Golden Ocean Group Ltd. * | 6,107 | 6,534 |
|
| Matson, Inc. | 3,354 | 142,981 |
|
| Navios Maritime Holdings, Inc. | 7,110 | 12,443 |
|
| Safe Bulkers, Inc. | 3,487 | 2,824 |
|
| Scorpio Bulkers, Inc. * | 1,950 | 19,284 |
|
| Ultrapetrol Bahamas Ltd. * | 1,843 | 194 |
|
| | | 190,297 |
|
| | | |
| Media - 1.5% | | |
| AMC Entertainment Holdings, Inc., Class A | 1,817 | 43,608 |
|
| Carmike Cinemas, Inc. * | 1,988 | 45,605 |
|
| Central European Media Enterprises Ltd., Class A * | 6,603 | 17,762 |
|
| Crown Media Holdings, Inc., Class A * | 3,539 | 19,854 |
|
| Cumulus Media, Inc., Class A * | 12,148 | 4,010 |
|
| Daily Journal Corp. * | 88 | 17,776 |
|
| DreamWorks Animation SKG, Inc., Class A * | 5,861 | 151,038 |
|
| Entercom Communications Corp., Class A * | 2,183 | 24,515 |
|
| Entravision Communications Corp., Class A | 4,508 | 34,757 |
|
| Eros International plc * | 2,183 | 19,974 |
|
| EW Scripps Co., (The) Class A | 4,564 | 86,716 |
|
| Global Eagle Entertainment, Inc. * | 3,417 | 33,726 |
|
| Gray Television, Inc. * | 4,872 | 79,414 |
|
| Harte-Hanks, Inc. | 4,010 | 12,992 |
|
| Hemisphere Media Group, Inc. * | 742 | 10,944 |
|
| IMAX Corp. * | 4,661 | 165,652 |
|
| Journal Media Group, Inc. | 1,479 | 17,778 |
|
| Loral Space & Communications, Inc. * | 1,011 | 41,158 |
|
| MDC Partners, Inc., Class A | 3,353 | 72,827 |
|
| Media General, Inc. * | 7,023 | 113,421 |
|
| Meredith Corp. | 2,836 | 122,657 |
|
| National CineMedia, Inc. | 5,048 | 79,304 |
|
| New Media Investment Group, Inc. | 3,448 | 67,098 |
|
| New York Times Co., (The) Class A | 10,612 | 142,413 |
|
| Nexstar Broadcasting Group, Inc., Class A | 2,415 | 141,760 |
|
| Reading International, Inc., Class A * | 1,506 | 19,744 |
|
| Rentrak Corp. * | 979 | 46,532 |
|
| Saga Communications, Inc., Class A | 394 | 15,149 |
|
| Scholastic Corp. | 2,058 | 79,356 |
|
| SFX Entertainment, Inc. * | 3,959 | 753 |
|
| Sinclair Broadcast Group, Inc., Class A | 5,114 | 166,409 |
|
| Sizmek, Inc. * | 2,184 | 7,972 |
|
| Time, Inc. | 8,452 | 132,443 |
|
| Townsquare Media, Inc., Class A * | 783 | 9,365 |
|
| Tribune Publishing Co. | 2,030 | 18,717 |
|
| World Wrestling Entertainment, Inc., Class A | 2,503 | 44,653 |
|
| | | 2,107,852 |
|
| | | |
| Metals & Mining - 0.7% | | |
| AK Steel Holding Corp. * | 13,722 | 30,737 |
|
| Carpenter Technology Corp. | 3,890 | 117,750 |
|
www.calvert.com CALVERT VP RUSSELL 2000 SMALL CAP INDEX PORTFOLIO ANNUAL REPORT 33
|
| | | | |
| | SHARES | VALUE ($) |
| COMMON STOCKS - Cont'd | | |
| Century Aluminum Co. * | 3,803 | 16,809 |
|
| Cliffs Natural Resources, Inc. * | 11,829 | 18,690 |
|
| Coeur Mining, Inc. * | 10,492 | 26,020 |
|
| Commercial Metals Co. | 8,931 | 122,265 |
|
| Ferroglobe plc | 5,015 | 53,911 |
|
| Handy & Harman Ltd. * | 202 | 4,143 |
|
| Haynes International, Inc. | 1,062 | 38,965 |
|
| Hecla Mining Co. | 28,581 | 54,018 |
|
| Horsehead Holding Corp. * | 4,443 | 9,108 |
|
| Kaiser Aluminum Corp. | 1,324 | 110,766 |
|
| Materion Corp. | 1,555 | 43,540 |
|
| Olympic Steel, Inc. | 846 | 9,797 |
|
| Real Industry, Inc. * | 1,889 | 15,169 |
|
| Ryerson Holding Corp. * | 965 | 4,507 |
|
| Schnitzer Steel Industries, Inc., Class A | 2,273 | 32,663 |
|
| Stillwater Mining Co. * | 9,314 | 79,821 |
|
| SunCoke Energy, Inc. | 5,034 | 17,468 |
|
| TimkenSteel Corp. | 3,081 | 25,819 |
|
| Worthington Industries, Inc. | 3,705 | 111,669 |
|
| | | 943,635 |
|
| | | |
| Multi-Utilities - 0.4% | | |
| Avista Corp. | 4,806 | 169,988 |
|
| Black Hills Corp. | 3,989 | 185,209 |
|
| NorthWestern Corp. | 3,630 | 196,928 |
|
| | | 552,125 |
|
| | | |
| Multiline Retail - 0.4% | | |
| Big Lots, Inc. | 3,882 | 149,612 |
|
| Burlington Stores, Inc. * | 5,819 | 249,635 |
|
| Fred's, Inc., Class A | 3,167 | 51,844 |
|
| Ollie's Bargain Outlet Holdings, Inc. * | 800 | 13,608 |
|
| Tuesday Morning Corp. * | 3,766 | 24,479 |
|
| | | 489,178 |
|
| | | |
| Oil, Gas & Consumable Fuels - 1.8% | | |
| Abraxas Petroleum Corp. * | 7,685 | 8,146 |
|
| Adams Resources & Energy, Inc. | 189 | 7,258 |
|
| Alon USA Energy, Inc. | 2,410 | 35,764 |
|
| Approach Resources, Inc. * | 3,528 | 6,491 |
|
| Ardmore Shipping Corp. | 1,617 | 20,568 |
|
| Bill Barrett Corp. * | 4,332 | 17,025 |
|
| Bonanza Creek Energy, Inc. * | 3,836 | 20,216 |
|
| Callon Petroleum Co. * | 6,252 | 52,142 |
|
| Carrizo Oil & Gas, Inc. * | 4,551 | 134,619 |
|
| Clayton Williams Energy, Inc. * | 515 | 15,229 |
|
| Clean Energy Fuels Corp. * | 5,949 | 21,416 |
|
| Cloud Peak Energy, Inc. * | 5,496 | 11,432 |
|
| Contango Oil & Gas Co. * | 1,560 | 10,000 |
|
| Delek US Holdings, Inc. | 4,427 | 108,904 |
|
| DHT Holdings, Inc. | 7,166 | 57,973 |
|
| Dorian LPG Ltd. * | 1,932 | 22,740 |
|
34 www.calvert.com CALVERT VP RUSSELL 2000 SMALL CAP INDEX PORTFOLIO ANNUAL REPORT
|
| | | | |
| | SHARES | VALUE ($) |
| COMMON STOCKS - Cont'd | | |
| Earthstone Energy, Inc. * | 101 | 1,344 |
|
| Eclipse Resources Corp. * | 2,658 | 4,838 |
|
| Energy Fuels, Inc. * | 3,400 | 10,030 |
|
| Energy XXI Ltd. | 8,400 | 8,484 |
|
| Erin Energy Corp. * | 1,082 | 3,462 |
|
| Evolution Petroleum Corp. | 1,370 | 6,590 |
|
| EXCO Resources, Inc. * | 14,704 | 18,233 |
|
| Frontline Ltd. | 18,640 | 55,734 |
|
| GasLog Ltd. | 3,212 | 26,660 |
|
| Gastar Exploration, Inc. * | 6,157 | 8,066 |
|
| Gener8 Maritime, Inc. * | 1,300 | 12,285 |
|
| Green Plains, Inc. | 2,929 | 67,074 |
|
| Halcon Resources Corp. * | 4,673 | 5,888 |
|
| Hallador Energy Co. | 353 | 1,610 |
|
| Isramco, Inc. * | 85 | 7,591 |
|
| Jones Energy, Inc., Class A * | 2,235 | 8,605 |
|
| Magnum Hunter Resources Corp. (a)* | 1,482 | — |
|
| Matador Resources Co. * | 5,646 | 111,621 |
|
| Navios Maritime Acquisition Corp. | 7,368 | 22,178 |
|
| Nordic American Tankers Ltd. | 6,883 | 106,962 |
|
| Northern Oil and Gas, Inc. * | 5,718 | 22,071 |
|
| Oasis Petroleum, Inc. * | 10,743 | 79,176 |
|
| Pacific Ethanol, Inc. * | 1,816 | 8,680 |
|
| Panhandle Oil and Gas, Inc., Class A | 1,238 | 20,006 |
|
| Par Pacific Holdings, Inc. * | 1,236 | 29,095 |
|
| Parsley Energy, Inc., Class A * | 7,181 | 132,489 |
|
| PDC Energy, Inc. * | 3,091 | 164,998 |
|
| Peabody Energy Corp. | 1,429 | 10,975 |
|
| Penn Virginia Corp. * | 5,878 | 1,766 |
|
| Renewable Energy Group, Inc. * | 3,095 | 28,752 |
|
| REX American Resources Corp. * | 552 | 29,847 |
|
| Rex Energy Corp. * | 4,308 | 4,523 |
|
| Ring Energy, Inc. * | 1,669 | 11,766 |
|
| RSP Permian, Inc. * | 5,103 | 124,462 |
|
| Sanchez Energy Corp. * | 4,490 | 19,352 |
|
| SandRidge Energy, Inc. * | 33,414 | 6,683 |
|
| Scorpio Tankers, Inc. | 13,801 | 110,684 |
|
| SemGroup Corp., Class A | 3,388 | 97,778 |
|
| Ship Finance International Ltd. | 4,576 | 75,824 |
|
| Solazyme, Inc. * | 6,808 | 16,884 |
|
| Stone Energy Corp. * | 4,921 | 21,111 |
|
| Synergy Resources Corp. * | 8,031 | 68,424 |
|
| Teekay Tankers Ltd., Class A | 7,096 | 48,820 |
|
| TransAtlantic Petroleum Ltd. * | 2,028 | 2,819 |
|
| Triangle Petroleum Corp. * | 3,599 | 2,771 |
|
| Ultra Petroleum Corp. * | 11,823 | 29,557 |
|
| Uranium Energy Corp. * | 7,100 | 7,526 |
|
| W&T Offshore, Inc. * | 3,057 | 7,062 |
|
| Western Refining, Inc. | 5,490 | 195,554 |
|
| Westmoreland Coal Co. * | 1,194 | 7,021 |
|
| | | 2,423,654 |
|
| | | |
www.calvert.com CALVERT VP RUSSELL 2000 SMALL CAP INDEX PORTFOLIO ANNUAL REPORT 35
|
| | | | |
| | SHARES | VALUE ($) |
| COMMON STOCKS - Cont'd | | |
| Paper & Forest Products - 0.6% | | |
| Boise Cascade Co. * | 3,051 | 77,892 |
|
| Clearwater Paper Corp. * | 1,471 | 66,975 |
|
| Deltic Timber Corp. | 942 | 55,456 |
|
| KapStone Paper and Packaging Corp. | 6,572 | 148,461 |
|
| Louisiana-Pacific Corp. * | 10,994 | 198,002 |
|
| Neenah Paper, Inc. | 1,291 | 80,597 |
|
| PH Glatfelter Co. | 3,337 | 61,534 |
|
| Schweitzer-Mauduit International, Inc. | 2,352 | 98,760 |
|
| Wausau Paper Corp. | 3,164 | 32,368 |
|
| | | 820,045 |
|
| | | |
| Personal Products - 0.2% | | |
| Elizabeth Arden, Inc. * | 2,269 | 22,463 |
|
| Inter Parfums, Inc. | 1,484 | 35,349 |
|
| Medifast, Inc. | 838 | 25,458 |
|
| Natural Health Trends Corp. | 608 | 20,386 |
|
| Nature's Sunshine Products, Inc. | 1,018 | 10,302 |
|
| Nutraceutical International Corp. * | 861 | 22,231 |
|
| Revlon, Inc., Class A * | 936 | 26,058 |
|
| Synutra International, Inc. * | 1,867 | 8,794 |
|
| USANA Health Sciences, Inc. * | 481 | 61,448 |
|
| | | 232,489 |
|
| Pharmaceuticals - 1.9% | | |
| Aclaris Therapeutics, Inc. * | 346 | 9,321 |
|
| Aerie Pharmaceuticals, Inc. * | 1,583 | 38,546 |
|
| Agile Therapeutics, Inc. * | 803 | 7,837 |
|
| Alimera Sciences, Inc. * | 1,462 | 3,538 |
|
| Amphastar Pharmaceuticals, Inc. * | 2,452 | 34,892 |
|
| ANI Pharmaceuticals, Inc. * | 616 | 27,797 |
|
| Aratana Therapeutics, Inc. * | 2,189 | 12,215 |
|
| Assembly Biosciences, Inc. * | 1,107 | 8,314 |
|
| BioDelivery Sciences International, Inc. * | 3,714 | 17,790 |
|
| Carbylan Therapeutics, Inc. * | 957 | 3,464 |
|
| Catalent, Inc. * | 6,454 | 161,544 |
|
| Cempra, Inc. * | 2,640 | 82,183 |
|
| Collegium Pharmaceutical, Inc. * | 515 | 14,162 |
|
| Corcept Therapeutics, Inc. * | 3,942 | 19,631 |
|
| Corium International, Inc. * | 671 | 5,449 |
|
| Depomed, Inc. * | 4,628 | 83,906 |
|
| Dermira, Inc. * | 1,061 | 36,721 |
|
| Durect Corp. * | 8,677 | 19,176 |
|
| Endocyte, Inc. * | 2,665 | 10,687 |
|
| Flex Pharma, Inc. * | 474 | 5,901 |
|
| Foamix Pharmaceuticals Ltd. * | 1,746 | 14,160 |
|
| Forest Laboratories, Inc. (a)* | 1,024 | — |
|
| Heska Corp. * | 439 | 16,981 |
|
| Impax Laboratories, Inc. * | 5,534 | 236,634 |
|
| Intersect ENT, Inc. * | 1,082 | 24,345 |
|
| Intra-Cellular Therapies, Inc. * | 2,032 | 109,301 |
|
| Lannett Co., Inc. * | 2,047 | 82,126 |
|
| Medicines Co. (The) * | 5,111 | 190,845 |
|
36 www.calvert.com CALVERT VP RUSSELL 2000 SMALL CAP INDEX PORTFOLIO ANNUAL REPORT
|
| | | | |
| | SHARES | VALUE ($) |
| COMMON STOCKS - Cont'd | | |
| MyoKardia, Inc. * | 425 | 6,231 |
|
| Nektar Therapeutics * | 10,150 | 171,027 |
|
| Neos Therapeutics, Inc. * | 450 | 6,444 |
|
| Ocular Therapeutix, Inc. * | 1,006 | 9,426 |
|
| Omeros Corp. * | 3,039 | 47,803 |
|
| Omthera Pharmaceutical, Inc. (a)* | 508 | 305 |
|
| Pacira Pharmaceuticals, Inc. * | 2,812 | 215,933 |
|
| Paratek Pharmaceuticals, Inc. * | 941 | 17,851 |
|
| Pernix Therapeutics Holdings, Inc. * | 2,981 | 8,794 |
|
| Phibro Animal Health Corp., Class A | 1,313 | 39,561 |
|
| POZEN, Inc. * | 2,758 | 18,837 |
|
| Prestige Brands Holdings, Inc. * | 4,036 | 207,773 |
|
| Relypsa, Inc. * | 2,516 | 71,303 |
|
| Revance Therapeutics, Inc. * | 1,427 | 48,746 |
|
| Sagent Pharmaceuticals, Inc. * | 1,961 | 31,200 |
|
| SciClone Pharmaceuticals, Inc. * | 3,828 | 35,218 |
|
| Sucampo Pharmaceuticals, Inc., Class A * | 1,939 | 33,525 |
|
| Supernus Pharmaceuticals, Inc. * | 2,624 | 35,267 |
|
| Teligent, Inc. * | 2,576 | 22,926 |
|
| Tetraphase Pharmaceuticals, Inc. * | 2,696 | 27,041 |
|
| TherapeuticsMD, Inc. * | 10,413 | 107,983 |
|
| Theravance Biopharma, Inc. * | 2,108 | 34,550 |
|
| Theravance, Inc. | 6,571 | 69,258 |
|
| VIVUS, Inc. * | 8,977 | 9,157 |
|
| XenoPort, Inc. * | 5,108 | 28,043 |
|
| Zogenix, Inc. * | 1,914 | 28,212 |
|
| Zynerba Pharmaceuticals, Inc. * | 300 | 3,021 |
|
| | | 2,612,901 |
|
| | | |
| Professional Services - 1.3% | | |
| Acacia Research Corp. | 4,242 | 18,198 |
|
| Advisory Board Co. (The) * | 3,275 | 162,473 |
|
| Barrett Business Services, Inc. | 606 | 26,385 |
|
| CBIZ, Inc. * | 3,612 | 35,614 |
|
| CDI Corp. | 1,164 | 7,869 |
|
| CEB, Inc. | 2,582 | 158,509 |
|
| CRA International, Inc. * | 707 | 13,186 |
|
| Exponent, Inc. | 2,005 | 100,150 |
|
| Franklin Covey Co. * | 1,007 | 16,857 |
|
| FTI Consulting, Inc. * | 3,210 | 111,259 |
|
| GP Strategies Corp. * | 1,007 | 25,286 |
|
| Heidrick & Struggles International, Inc. | 1,525 | 41,511 |
|
| Hill International, Inc. * | 2,159 | 8,377 |
|
| Huron Consulting Group, Inc. * | 1,787 | 106,148 |
|
| ICF International, Inc. * | 1,507 | 53,589 |
|
| Insperity, Inc. | 1,495 | 71,984 |
|
| Kelly Services, Inc., Class A | 2,314 | 37,371 |
|
| Kforce, Inc. | 1,903 | 48,108 |
|
| Korn/Ferry International | 3,891 | 129,103 |
|
| Mistras Group, Inc. * | 1,338 | 25,542 |
|
| Navigant Consulting, Inc. * | 3,723 | 59,791 |
|
| On Assignment, Inc. * | 3,992 | 179,440 |
|
www.calvert.com CALVERT VP RUSSELL 2000 SMALL CAP INDEX PORTFOLIO ANNUAL REPORT 37
|
| | | | |
| | SHARES | VALUE ($) |
| COMMON STOCKS - Cont'd | | |
| Pendrell Corp. * | 12,424 | 6,226 |
|
| Resources Connection, Inc. | 2,900 | 47,386 |
|
| RPX Corp. * | 4,188 | 46,068 |
|
| TriNet Group, Inc. * | 3,176 | 61,456 |
|
| TrueBlue, Inc. * | 3,417 | 88,022 |
|
| Volt Information Sciences, Inc. * | 744 | 6,056 |
|
| VSE Corp. | 430 | 26,737 |
|
| WageWorks, Inc. * | 2,758 | 125,130 |
|
| | | 1,843,831 |
|
| | | |
| Real Estate Investment Trusts - 8.7% | | |
| Acadia Realty Trust | 5,308 | 175,960 |
|
| AG Mortgage Investment Trust, Inc. | 2,395 | 30,752 |
|
| Agree Realty Corp. | 1,546 | 52,549 |
|
| Alexander's, Inc. | 162 | 62,226 |
|
| Altisource Residential Corp. | 4,415 | 54,790 |
|
| American Assets Trust, Inc. | 2,868 | 109,988 |
|
| American Capital Mortgage Investment Corp. | 3,949 | 55,128 |
|
| American Residential Properties, Inc. | 2,485 | 46,966 |
|
| Anworth Mortgage Asset Corp. | 8,089 | 35,187 |
|
| Apollo Commercial Real Estate Finance, Inc. | 4,509 | 77,690 |
|
| Apollo Residential Mortgage, Inc. | 2,739 | 32,731 |
|
| Ares Commercial Real Estate Corp. | 2,562 | 29,309 |
|
| Armada Hoffler Properties, Inc. | 1,639 | 17,177 |
|
| ARMOUR Residential REIT, Inc. | 3,399 | 73,962 |
|
| Ashford Hospitality Prime, Inc. | 2,530 | 36,685 |
|
| Ashford Hospitality Trust, Inc. | 6,276 | 39,602 |
|
| Bluerock Residential Growth REIT, Inc. | 1,454 | 17,230 |
|
| Campus Crest Communities, Inc. * | 5,690 | 38,692 |
|
| Capstead Mortgage Corp. | 7,394 | 64,624 |
|
| CareTrust REIT, Inc. | 3,804 | 41,654 |
|
| CatchMark Timber Trust, Inc., Class A | 3,052 | 34,518 |
|
| Cedar Realty Trust, Inc. | 7,099 | 50,261 |
|
| Chatham Lodging Trust | 2,956 | 60,539 |
|
| Chesapeake Lodging Trust | 4,604 | 115,837 |
|
| Colony Capital, Inc., Class A | 8,620 | 167,918 |
|
| CorEnergy Infrastructure Trust, Inc. | 821 | 12,184 |
|
| CoreSite Realty Corp. | 1,850 | 104,932 |
|
| Cousins Properties, Inc. | 16,716 | 157,632 |
|
| CubeSmart | 12,838 | 393,100 |
|
| CyrusOne, Inc. | 5,086 | 190,471 |
|
| CYS Investments, Inc. | 12,204 | 87,014 |
|
| DCT Industrial Trust, Inc. | 6,857 | 256,246 |
|
| DiamondRock Hospitality Co. | 15,490 | 149,478 |
|
| DuPont Fabros Technology, Inc. | 4,873 | 154,913 |
|
| Dynex Capital, Inc. | 4,570 | 29,019 |
|
| Easterly Government Properties, Inc. | 1,213 | 20,839 |
|
| EastGroup Properties, Inc. | 2,493 | 138,636 |
|
| Education Realty Trust, Inc. | 4,402 | 166,748 |
|
| EPR Properties | 4,413 | 257,940 |
|
| Equity One, Inc. | 5,797 | 157,389 |
|
| FelCor Lodging Trust, Inc. | 11,057 | 80,716 |
|
38 www.calvert.com CALVERT VP RUSSELL 2000 SMALL CAP INDEX PORTFOLIO ANNUAL REPORT
|
| | | | |
| | SHARES | VALUE ($) |
| COMMON STOCKS - Cont'd | | |
| First Industrial Realty Trust, Inc. | 8,545 | 189,101 |
|
| First Potomac Realty Trust | 5,123 | 58,402 |
|
| Franklin Street Properties Corp. | 6,941 | 71,839 |
|
| GEO Group, Inc. (The) | 5,761 | 166,550 |
|
| Getty Realty Corp. | 2,309 | 39,599 |
|
| Gladstone Commercial Corp. | 1,672 | 24,394 |
|
| Government Properties Income Trust | 5,430 | 86,174 |
|
| Gramercy Property Trust | 32,382 | 249,990 |
|
| Great Ajax Corp. | 338 | 4,097 |
|
| Hannon Armstrong Sustainable Infrastructure Capital, Inc. | 2,851 | 53,941 |
|
| Hatteras Financial Corp. | 7,470 | 98,230 |
|
| Healthcare Realty Trust, Inc. | 7,748 | 219,423 |
|
| Hersha Hospitality Trust | 3,788 | 82,427 |
|
| Highwoods Properties, Inc. | 7,258 | 316,449 |
|
| Hudson Pacific Properties, Inc. | 5,745 | 161,664 |
|
| Independence Realty Trust, Inc. | 2,573 | 19,323 |
|
| InfraREIT, Inc. * | 1,690 | 31,265 |
|
| Inland Real Estate Corp. | 7,356 | 78,121 |
|
| Invesco Mortgage Capital, Inc. | 9,503 | 117,742 |
|
| Investors Real Estate Trust | 9,894 | 68,763 |
|
| iStar, Inc. * | 6,600 | 77,418 |
|
| Kite Realty Group Trust | 6,450 | 167,248 |
|
| Ladder Capital Corp. | 3,069 | 38,117 |
|
| LaSalle Hotel Properties | 8,718 | 219,345 |
|
| Lexington Realty Trust | 15,856 | 126,848 |
|
| LTC Properties, Inc. | 2,743 | 118,333 |
|
| Mack-Cali Realty Corp. | 6,878 | 160,601 |
|
| Medical Properties Trust, Inc. | 18,323 | 210,898 |
|
| Monmouth Real Estate Investment Corp. | 5,012 | 52,425 |
|
| Monogram Residential Trust, Inc. | 12,851 | 125,426 |
|
| National Health Investors, Inc. | 2,899 | 176,462 |
|
| National Storage Affiliates Trust | 1,767 | 30,269 |
|
| New Residential Investment Corp. | 17,853 | 217,092 |
|
| New Senior Investment Group, Inc. | 6,726 | 66,318 |
|
| New York Mortgage Trust, Inc. | 9,264 | 49,377 |
|
| New York REIT, Inc. | 12,538 | 144,187 |
|
| NexPoint Residential Trust, Inc. | 1,463 | 19,151 |
|
| One Liberty Properties, Inc. | 1,012 | 21,718 |
|
| Orchid Island Capital, Inc. | 1,416 | 14,061 |
|
| Parkway Properties Inc/Md | 6,906 | 107,941 |
|
| Pebblebrook Hotel Trust | 5,545 | 155,371 |
|
| Pennsylvania Real Estate Investment Trust | 5,334 | 116,655 |
|
| PennyMac Mortgage Investment Trust | 5,756 | 87,837 |
|
| Physicians Realty Trust | 6,776 | 114,243 |
|
| Potlatch Corp. | 3,139 | 94,923 |
|
| Preferred Apartment Communities, Inc., Class A | 1,715 | 22,432 |
|
| PS Business Parks, Inc. | 1,504 | 131,495 |
|
| QTS Realty Trust, Inc., Class A | 2,152 | 97,077 |
|
| RAIT Financial Trust | 7,053 | 19,043 |
|
| Ramco-Gershenson Properties Trust | 6,108 | 101,454 |
|
| Redwood Trust, Inc. | 6,503 | 85,840 |
|
| Resource Capital Corp. | 2,766 | 35,294 |
|
www.calvert.com CALVERT VP RUSSELL 2000 SMALL CAP INDEX PORTFOLIO ANNUAL REPORT 39
|
| | | | |
| | SHARES | VALUE ($) |
| COMMON STOCKS - Cont'd | | |
| Retail Opportunity Investments Corp. | 7,752 | 138,761 |
|
| Rexford Industrial Realty, Inc. | 4,272 | 69,890 |
|
| RLJ Lodging Trust | 10,201 | 220,648 |
|
| Rouse Properties, Inc. | 2,824 | 41,117 |
|
| Ryman Hospitality Properties, Inc. | 3,356 | 173,304 |
|
| Sabra Health Care REIT, Inc. | 5,071 | 102,586 |
|
| Saul Centers, Inc. | 873 | 44,759 |
|
| Select Income REIT | 4,836 | 95,849 |
|
| Silver Bay Realty Trust Corp. | 2,806 | 43,942 |
|
| Sovran Self Storage, Inc. | 2,745 | 294,566 |
|
| STAG Industrial, Inc. | 4,997 | 92,195 |
|
| Starwood Waypoint | 2,946 | 66,697 |
|
| STORE Capital Corp. | 3,155 | 73,196 |
|
| Summit Hotel Properties, Inc. | 6,735 | 80,483 |
|
| Sun Communities, Inc. | 3,946 | 270,419 |
|
| Sunstone Hotel Investors, Inc. | 16,105 | 201,151 |
|
| Terreno Realty Corp. | 3,319 | 75,076 |
|
| UMH Properties, Inc. | 1,825 | 18,469 |
|
| United Development Funding IV | 2,365 | 26,015 |
|
| Universal Health Realty Income Trust | 985 | 49,260 |
|
| Urban Edge Properties | 6,851 | 160,656 |
|
| Urstadt Biddle Properties, Inc., Class A | 2,125 | 40,885 |
|
| Washington Real Estate Investment Trust | 5,259 | 142,309 |
|
| Western Asset Mortgage Capital Corp. | 3,699 | 37,804 |
|
| Whitestone REIT | 1,829 | 21,966 |
|
| Xenia Hotels & Resorts, Inc. | 8,618 | 132,114 |
|
| | | 11,935,742 |
|
| Real Estate Management & Development - 0.4% | | |
| Alexander & Baldwin, Inc. | 3,770 | 133,119 |
|
| Altisource Asset Management Corp. * | 70 | 1,201 |
|
| Altisource Portfolio Solutions S.A. * | 1,173 | 32,621 |
|
| AV Homes, Inc. * | 824 | 10,556 |
|
| Consolidated-Tomoka Land Co. | 377 | 19,872 |
|
| Forestar Group, Inc. * | 2,595 | 28,389 |
|
| FRP Holdings, Inc. * | 453 | 15,375 |
|
| Kennedy-Wilson Holdings, Inc. | 7,230 | 174,098 |
|
| Marcus & Millichap, Inc. * | 1,049 | 30,568 |
|
| RE/MAX Holdings, Inc., Class A | 1,023 | 38,158 |
|
| RMR Group, Inc. (The) * | 143 | 2,061 |
|
| St Joe Co. (The) * | 4,238 | 78,445 |
|
| Tejon Ranch Co. * | 1,147 | 21,965 |
|
| | | 586,428 |
|
| | | |
| Road & Rail - 0.4% | | |
| ArcBest Corp. | 2,213 | 47,336 |
|
| Celadon Group, Inc. | 1,805 | 17,852 |
|
| Covenant Transportation Group, Inc., Class A * | 905 | 17,095 |
|
| Heartland Express, Inc. | 3,887 | 66,157 |
|
| Knight Transportation, Inc. | 4,827 | 116,958 |
|
| Marten Transport Ltd. | 2,020 | 35,754 |
|
| PAM Transportation Services, Inc. * | 289 | 7,974 |
|
| Roadrunner Transportation Systems, Inc. * | 2,171 | 20,473 |
|
40 www.calvert.com CALVERT VP RUSSELL 2000 SMALL CAP INDEX PORTFOLIO ANNUAL REPORT
|
| | | | |
| | SHARES | VALUE ($) |
| COMMON STOCKS - Cont'd | | |
| Saia, Inc. * | 1,936 | 43,076 |
|
| Swift Transportation Co. * | 6,796 | 93,921 |
|
| Universal Truckload Services, Inc. | 475 | 6,669 |
|
| USA Truck, Inc. * | 561 | 9,789 |
|
| Werner Enterprises, Inc. | 3,424 | 80,087 |
|
| YRC Worldwide, Inc. * | 2,802 | 39,732 |
|
| | | 602,873 |
|
| | | |
| Semiconductors & Semiconductor Equipment - 3.2% | | |
| Advanced Energy Industries, Inc. * | 3,385 | 95,559 |
|
| Advanced Micro Devices, Inc. * | 49,090 | 140,888 |
|
| Alpha & Omega Semiconductor Ltd. * | 1,207 | 11,092 |
|
| Ambarella, Inc. * | 2,418 | 134,779 |
|
| Amkor Technology, Inc. * | 7,647 | 46,494 |
|
| Applied Micro Circuits Corp. * | 6,307 | 40,176 |
|
| Axcelis Technologies, Inc. * | 9,665 | 25,032 |
|
| Brooks Automation, Inc. | 5,690 | 60,769 |
|
| Cabot Microelectronics Corp. * | 1,908 | 83,532 |
|
| Cascade Microtech, Inc. * | 1,145 | 18,606 |
|
| Cavium, Inc. * | 4,268 | 280,450 |
|
| CEVA, Inc. * | 1,590 | 37,142 |
|
| Cirrus Logic, Inc. * | 4,894 | 144,520 |
|
| Cohu, Inc. | 2,037 | 24,587 |
|
| Diodes, Inc. * | 2,893 | 66,481 |
|
| DSP Group, Inc. * | 1,705 | 16,095 |
|
| Entegris, Inc. * | 10,823 | 143,621 |
|
| Exar Corp. * | 3,348 | 20,523 |
|
| Fairchild Semiconductor International, Inc. * | 8,986 | 186,100 |
|
| FormFactor, Inc. * | 4,374 | 39,366 |
|
| Inphi Corp. * | 2,806 | 75,818 |
|
| Integrated Device Technology, Inc. * | 11,449 | 301,681 |
|
| Intersil Corp., Class A | 10,174 | 129,820 |
|
| IXYS Corp. | 2,094 | 26,447 |
|
| Kopin Corp. * | 6,180 | 16,810 |
|
| Lattice Semiconductor Corp. * | 9,014 | 58,321 |
|
| M/A-COM Technology Solutions Holdings, Inc. * | 1,810 | 74,011 |
|
| Mattson Technology, Inc. * | 5,778 | 20,396 |
|
| MaxLinear, Inc., Class A * | 4,028 | 59,333 |
|
| Microsemi Corp. * | 7,345 | 239,374 |
|
| MKS Instruments, Inc. | 4,119 | 148,284 |
|
| Monolithic Power Systems, Inc. | 3,051 | 194,379 |
|
| Nanometrics, Inc. * | 2,115 | 32,021 |
|
| NeoPhotonics Corp. * | 2,155 | 23,403 |
|
| NVE Corp. | 408 | 22,921 |
|
| OmniVision Technologies, Inc. * | 4,484 | 130,126 |
|
| PDF Solutions, Inc. * | 2,083 | 22,580 |
|
| Photronics, Inc. * | 5,437 | 67,691 |
|
| PMC-Sierra, Inc. * | 13,463 | 156,440 |
|
| Power Integrations, Inc. | 2,271 | 110,439 |
|
| Rambus, Inc. * | 8,912 | 103,290 |
|
| Rudolph Technologies, Inc. * | 2,894 | 41,153 |
|
| Semtech Corp. * | 5,124 | 96,946 |
|
www.calvert.com CALVERT VP RUSSELL 2000 SMALL CAP INDEX PORTFOLIO ANNUAL REPORT 41
|
| | | | |
| | SHARES | VALUE ($) |
| COMMON STOCKS - Cont'd | | |
| Sigma Designs, Inc. * | 2,732 | 17,266 |
|
| Silicon Laboratories, Inc. * | 3,296 | 159,988 |
|
| Synaptics, Inc. * | 2,842 | 228,326 |
|
| Tessera Technologies, Inc. | 4,061 | 121,871 |
|
| Ultra Clean Holdings, Inc. * | 2,008 | 10,281 |
|
| Ultratech, Inc. * | 2,360 | 46,775 |
|
| Veeco Instruments, Inc. * | 3,117 | 64,086 |
|
| Xcerra Corp. * | 4,282 | 25,906 |
|
| | | 4,441,995 |
|
| | | |
| Software - 4.4% | | |
| A10 Networks, Inc. * | 2,617 | 17,168 |
|
| ACI Worldwide, Inc. * | 9,010 | 192,814 |
|
| American Software, Inc., Class A | 1,795 | 18,273 |
|
| Aspen Technology, Inc. * | 6,589 | 248,801 |
|
| AVG Technologies NV * | 3,122 | 62,596 |
|
| Barracuda Networks, Inc. * | 711 | 13,281 |
|
| Blackbaud, Inc. | 3,617 | 238,216 |
|
| Bottomline Technologies de, Inc. * | 3,347 | 99,506 |
|
| BroadSoft, Inc. * | 2,249 | 79,525 |
|
| Callidus Software, Inc. * | 4,118 | 76,471 |
|
| Code Rebel Corp. * | 83 | 222 |
|
| Commvault Systems, Inc. * | 3,491 | 137,371 |
|
| Digimarc Corp. * | 626 | 22,855 |
|
| Digital Turbine, Inc. * | 3,758 | 4,998 |
|
| Ebix, Inc. | 2,069 | 67,843 |
|
| Ellie Mae, Inc. * | 2,269 | 136,662 |
|
| EnerNOC, Inc. * | 2,044 | 7,869 |
|
| Epiq Systems, Inc. | 2,837 | 37,080 |
|
| Fair Isaac Corp. | 2,396 | 225,655 |
|
| Fleetmatics Group plc * | 2,950 | 149,830 |
|
| Gigamon, Inc. * | 2,167 | 57,577 |
|
| Globant S.A. * | 1,179 | 44,224 |
|
| Glu Mobile, Inc. * | 9,287 | 22,567 |
|
| Guidance Software, Inc. * | 1,234 | 7,429 |
|
| Guidewire Software, Inc. * | 5,415 | 325,766 |
|
| HubSpot, Inc. * | 1,452 | 81,762 |
|
| Imperva, Inc. * | 2,048 | 129,659 |
|
| Infoblox, Inc. * | 4,373 | 80,419 |
|
| Interactive Intelligence Group, Inc. * | 1,335 | 41,946 |
|
| Jive Software, Inc. * | 3,414 | 13,929 |
|
| Manhattan Associates, Inc. * | 5,694 | 376,772 |
|
| Mentor Graphics Corp. | 7,718 | 142,166 |
|
| MicroStrategy, Inc., Class A * | 717 | 128,551 |
|
| MobileIron, Inc. * | 3,001 | 10,834 |
|
| Model N, Inc. * | 1,727 | 19,273 |
|
| Monotype Imaging Holdings, Inc. | 3,293 | 77,847 |
|
| Park City Group, Inc. * | 855 | 10,183 |
|
| Paycom Software, Inc. * | 2,435 | 91,629 |
|
| Paylocity Holding Corp. * | 1,195 | 48,457 |
|
| Pegasystems, Inc. | 2,759 | 75,873 |
|
| Progress Software Corp. * | 3,905 | 93,720 |
|
42 www.calvert.com CALVERT VP RUSSELL 2000 SMALL CAP INDEX PORTFOLIO ANNUAL REPORT
|
| | | | |
| | SHARES | VALUE ($) |
| COMMON STOCKS - Cont'd | | |
| Proofpoint, Inc. * | 3,042 | 197,760 |
|
| PROS Holdings, Inc. * | 1,967 | 45,320 |
|
| QAD, Inc., Class A | 789 | 16,190 |
|
| Qlik Technologies, Inc. * | 7,049 | 223,171 |
|
| Qualys, Inc. * | 1,802 | 59,628 |
|
| Rapid7, Inc. * | 650 | 9,835 |
|
| RealPage, Inc. * | 4,073 | 91,439 |
|
| RingCentral, Inc., Class A * | 4,135 | 97,503 |
|
| Rovi Corp. * | 6,823 | 113,671 |
|
| Rubicon Project, Inc. (The) * | 1,981 | 32,587 |
|
| Sapiens International Corp. NV | 2,130 | 21,726 |
|
| Seachange International, Inc. * | 2,824 | 19,034 |
|
| Silver Spring Networks, Inc. * | 3,137 | 45,204 |
|
| Synchronoss Technologies, Inc. * | 2,992 | 105,408 |
|
| Take-Two Interactive Software, Inc. * | 6,530 | 227,505 |
|
| Tangoe, Inc. * | 3,466 | 29,080 |
|
| TeleCommunication Systems, Inc., Class A * | 4,102 | 20,387 |
|
| Telenav, Inc. * | 2,354 | 13,394 |
|
| TiVo, Inc. * | 7,493 | 64,665 |
|
| TubeMogul, Inc. * | 1,078 | 14,661 |
|
| Tyler Technologies, Inc. * | 2,599 | 453,058 |
|
| Varonis Systems, Inc. * | 522 | 9,814 |
|
| VASCO Data Security International, Inc. * | 2,265 | 37,893 |
|
| Verint Systems, Inc. * | 4,735 | 192,052 |
|
| VirnetX Holding Corp. * | 3,778 | 9,709 |
|
| Workiva, Inc. * | 633 | 11,122 |
|
| Xura, Inc. * | 1,972 | 48,472 |
|
| Zendesk, Inc. * | 4,147 | 109,647 |
|
| Zix Corp. * | 5,001 | 25,405 |
|
| | | 6,062,959 |
|
| Specialty Retail - 2.6% | | |
| Abercrombie & Fitch Co., Class A | 5,368 | 144,936 |
|
| America's Car-Mart, Inc. * | 726 | 19,377 |
|
| American Eagle Outfitters, Inc. | 15,081 | 233,756 |
|
| Asbury Automotive Group, Inc. * | 1,983 | 133,734 |
|
| Ascena Retail Group, Inc. * | 13,245 | 130,463 |
|
| Barnes & Noble Education, Inc. * | 2,474 | 24,616 |
|
| Barnes & Noble, Inc. | 3,916 | 34,108 |
|
| bebe stores, Inc. | 3,035 | 1,715 |
|
| Big 5 Sporting Goods Corp. | 1,497 | 14,955 |
|
| Boot Barn Holdings, Inc. * | 922 | 11,331 |
|
| Buckle, Inc. (The) | 2,185 | 67,254 |
|
| Build-A-Bear Workshop, Inc. * | 1,105 | 13,525 |
|
| Caleres, Inc. | 3,380 | 90,652 |
|
| Cato Corp., (The) Class A | 2,030 | 74,745 |
|
| Chico's FAS, Inc. | 11,063 | 118,042 |
|
| Children's Place, Inc. (The) | 1,591 | 87,823 |
|
| Christopher & Banks Corp. * | 3,132 | 5,168 |
|
| Citi Trends, Inc. | 1,298 | 27,583 |
|
| Conn's, Inc. * | 2,111 | 49,545 |
|
| Container Store Group, Inc. (The) * | 1,542 | 12,644 |
|
| Destination XL Group, Inc. * | 3,868 | 21,351 |
|
www.calvert.com CALVERT VP RUSSELL 2000 SMALL CAP INDEX PORTFOLIO ANNUAL REPORT 43
|
| | | | |
| | SHARES | VALUE ($) |
| COMMON STOCKS - Cont'd | | |
| Express, Inc. * | 6,521 | 112,683 |
|
| Finish Line, Inc., (The) Class A | 3,554 | 64,256 |
|
| Five Below, Inc. * | 4,204 | 134,948 |
|
| Francesca's Holdings Corp. * | 3,266 | 56,861 |
|
| Genesco, Inc. * | 1,856 | 105,477 |
|
| Group 1 Automotive, Inc. | 1,801 | 136,336 |
|
| Guess?, Inc. | 4,778 | 90,209 |
|
| Haverty Furniture Cos., Inc. | 1,689 | 36,212 |
|
| Hibbett Sports, Inc. * | 1,921 | 58,091 |
|
| Kirkland's, Inc. | 1,302 | 18,879 |
|
| Lithia Motors, Inc., Class A | 1,757 | 187,419 |
|
| Lumber Liquidators Holdings, Inc. * | 2,090 | 36,282 |
|
| MarineMax, Inc. * | 2,047 | 37,706 |
|
| Mattress Firm Holding Corp. * | 1,582 | 70,605 |
|
| Men's Wearhouse, Inc. (The) | 3,729 | 54,742 |
|
| Monro Muffler Brake, Inc. | 2,456 | 162,636 |
|
| Outerwall, Inc. | 1,424 | 52,033 |
|
| Party City Holdco, Inc. * | 1,941 | 25,058 |
|
| Pep Boys-Manny Moe & Jack (The) * | 4,589 | 84,484 |
|
| Pier 1 Imports, Inc. | 6,957 | 35,411 |
|
| Rent-A-Center, Inc. | 4,092 | 61,257 |
|
| Restoration Hardware Holdings, Inc. * | 2,577 | 204,743 |
|
| Select Comfort Corp. * | 4,036 | 86,411 |
|
| Shoe Carnival, Inc. | 1,156 | 26,819 |
|
| Sonic Automotive, Inc., Class A | 2,540 | 57,810 |
|
| Sportsman's Warehouse Holdings, Inc. * | 872 | 11,249 |
|
| Stage Stores, Inc. | 2,464 | 22,447 |
|
| Stein Mart, Inc. | 2,386 | 16,058 |
|
| Systemax, Inc. * | 1,000 | 8,600 |
|
| Tile Shop Holdings, Inc. * | 2,513 | 41,213 |
|
| Tilly's, Inc., Class A * | 827 | 5,483 |
|
| Vitamin Shoppe, Inc. * | 2,295 | 75,047 |
|
| West Marine, Inc. * | 1,507 | 12,794 |
|
| Winmark Corp. | 223 | 20,741 |
|
| Zumiez, Inc. * | 1,698 | 25,674 |
|
| | | 3,553,997 |
|
| | | |
| Technology Hardware, Storage & Peripherals - 0.6% | | |
| Avid Technology, Inc. * | 2,494 | 18,181 |
|
| CPI Card Group, Inc. * | 1,394 | 14,860 |
|
| Cray, Inc. * | 3,150 | 102,218 |
|
| Diebold, Inc. | 5,004 | 150,570 |
|
| Eastman Kodak Co. * | 1,582 | 19,838 |
|
| Electronics For Imaging, Inc. * | 3,618 | 169,105 |
|
| Imation Corp. * | 2,711 | 3,714 |
|
| Immersion Corp. * | 2,323 | 27,086 |
|
| Nimble Storage, Inc. * | 3,910 | 35,972 |
|
| Pure Storage, Inc., Class A * | 2,364 | 36,808 |
|
| QLogic Corp. * | 6,734 | 82,155 |
|
| Quantum Corp. * | 19,651 | 18,276 |
|
| Silicon Graphics International Corp. * | 2,677 | 15,794 |
|
| Stratasys Ltd. * | 3,930 | 92,276 |
|
44 www.calvert.com CALVERT VP RUSSELL 2000 SMALL CAP INDEX PORTFOLIO ANNUAL REPORT
|
| | | | |
| | SHARES | VALUE ($) |
| COMMON STOCKS - Cont'd | | |
| Super Micro Computer, Inc. * | 2,845 | 69,731 |
|
| Violin Memory, Inc. * | 7,183 | 6,466 |
|
| | | 863,050 |
|
| | | |
| Textiles, Apparel & Luxury Goods - 0.8% | | |
| Cherokee, Inc. * | 661 | 11,402 |
|
| Columbia Sportswear Co. | 2,214 | 107,955 |
|
| Crocs, Inc. * | 5,941 | 60,836 |
|
| Culp, Inc. | 785 | 19,994 |
|
| Deckers Outdoor Corp. * | 2,668 | 125,930 |
|
| G-III Apparel Group Ltd. * | 3,078 | 136,232 |
|
| Iconix Brand Group, Inc. * | 3,684 | 25,162 |
|
| Movado Group, Inc. | 1,238 | 31,829 |
|
| Oxford Industries, Inc. | 1,130 | 72,117 |
|
| Perry Ellis International, Inc. * | 933 | 17,186 |
|
| Sequential Brands Group, Inc. * | 2,801 | 22,153 |
|
| Steven Madden Ltd. * | 4,343 | 131,245 |
|
| Superior Uniform Group, Inc. | 573 | 9,729 |
|
| Tumi Holdings, Inc. * | 4,539 | 75,483 |
|
| Unifi, Inc. * | 1,199 | 33,752 |
|
| Vera Bradley, Inc. * | 1,814 | 28,589 |
|
| Vince Holding Corp. * | 1,135 | 5,198 |
|
| Wolverine World Wide, Inc. | 7,966 | 133,112 |
|
| | | 1,047,904 |
|
| | | |
| Thrifts & Mortgage Finance - 2.1% | | |
| Anchor BanCorp Wisconsin, Inc. * | 570 | 24,806 |
|
| Astoria Financial Corp. | 6,944 | 110,062 |
|
| Bank Mutual Corp. | 3,599 | 28,072 |
|
| BankFinancial Corp. | 1,984 | 25,058 |
|
| BBX Capital Corp., Class A * | 622 | 9,734 |
|
| Bear State Financial, Inc. * | 1,029 | 11,144 |
|
| Beneficial Bancorp, Inc. * | 6,383 | 85,022 |
|
| BofI Holding, Inc. * | 4,740 | 99,777 |
|
| Brookline Bancorp, Inc. | 5,406 | 62,169 |
|
| BSB Bancorp, Inc. * | 625 | 14,619 |
|
| Capitol Federal Financial, Inc. | 10,856 | 136,351 |
|
| Charter Financial Corp. | 1,280 | 16,909 |
|
| Clifton Bancorp, Inc. | 2,373 | 34,029 |
|
| Dime Community Bancshares, Inc. | 2,402 | 42,011 |
|
| Essent Group Ltd. * | 4,289 | 93,886 |
|
| EverBank Financial Corp. | 7,468 | 119,339 |
|
| Federal Agricultural Mortgage Corp., Class C | 895 | 28,255 |
|
| First Defiance Financial Corp. | 799 | 30,186 |
|
| Flagstar Bancorp, Inc. * | 1,712 | 39,564 |
|
| Fox Chase Bancorp, Inc. | 1,196 | 24,267 |
|
| Hingham Institution for Savings | 102 | 12,220 |
|
| HomeStreet, Inc. * | 1,967 | 42,704 |
|
| Impac Mortgage Holdings, Inc. * | 665 | 11,970 |
|
| Kearny Financial Corp. | 7,218 | 91,452 |
|
| LendingTree, Inc. * | 447 | 39,908 |
|
| Meridian Bancorp, Inc. | 4,240 | 59,784 |
|
www.calvert.com CALVERT VP RUSSELL 2000 SMALL CAP INDEX PORTFOLIO ANNUAL REPORT 45
|
| | | | |
| | SHARES | VALUE ($) |
| COMMON STOCKS - Cont'd | | |
| Meta Financial Group, Inc. | 474 | 21,771 |
|
| MGIC Investment Corp. * | 26,211 | 231,443 |
|
| Nationstar Mortgage Holdings, Inc. * | 3,032 | 40,538 |
|
| NMI Holdings, Inc., Class A * | 4,529 | 30,661 |
|
| Northfield Bancorp, Inc. | 3,620 | 57,630 |
|
| Northwest Bancshares, Inc. | 7,910 | 105,915 |
|
| OceanFirst Financial Corp. | 1,187 | 23,776 |
|
| Ocwen Financial Corp. * | 8,291 | 57,788 |
|
| Oritani Financial Corp. | 3,396 | 56,034 |
|
| PennyMac Financial Services, Inc., Class A * | 1,102 | 16,927 |
|
| PHH Corp. * | 3,832 | 62,078 |
|
| Provident Financial Services, Inc. | 5,242 | 105,626 |
|
| Radian Group, Inc. | 14,773 | 197,811 |
|
| Stonegate Mortgage Corp. * | 1,281 | 6,981 |
|
| Territorial Bancorp, Inc. | 665 | 18,447 |
|
| TrustCo Bank Corp. | 7,825 | 48,046 |
|
| United Community Financial Corp. | 3,416 | 20,154 |
|
| United Financial Bancorp, Inc. | 3,817 | 49,163 |
|
| Walker & Dunlop, Inc. * | 2,042 | 58,830 |
|
| Walter Investment Management Corp. * | 3,180 | 45,220 |
|
| Washington Federal, Inc. | 7,319 | 174,412 |
|
| Waterstone Financial, Inc. | 2,330 | 32,853 |
|
| WSFS Financial Corp. | 2,397 | 77,567 |
|
| | | 2,832,969 |
|
| | | |
| Tobacco - 0.2% | | |
| Universal Corp. | 1,744 | 97,803 |
|
| Vector Group Ltd. | 6,620 | 156,166 |
|
| | | 253,969 |
|
| | | |
| Trading Companies & Distributors - 0.7% | | |
| Aircastle Ltd. | 4,816 | 100,606 |
|
| Applied Industrial Technologies, Inc. | 3,099 | 125,479 |
|
| Beacon Roofing Supply, Inc. * | 3,830 | 157,719 |
|
| BMC Stock Holdings, Inc. * | 2,906 | 48,676 |
|
| CAI International, Inc. * | 1,481 | 14,928 |
|
| DXP Enterprises, Inc. * | 972 | 22,162 |
|
| H&E Equipment Services, Inc. | 2,409 | 42,109 |
|
| Kaman Corp. | 2,101 | 85,742 |
|
| Lawson Products, Inc. * | 447 | 10,437 |
|
| MRC Global, Inc. * | 7,949 | 102,542 |
|
| Neff Corp., Class A * | 900 | 6,894 |
|
| Rush Enterprises, Inc., Class A * | 2,992 | 65,495 |
|
| TAL International Group, Inc. * | 2,566 | 40,799 |
|
| Textainer Group Holdings Ltd. | 1,837 | 25,920 |
|
| Titan Machinery, Inc. * | 1,521 | 16,625 |
|
| Univar, Inc. * | 3,150 | 53,582 |
|
| Veritiv Corp. * | 629 | 22,782 |
|
| | | 942,497 |
|
| | | |
46 www.calvert.com CALVERT VP RUSSELL 2000 SMALL CAP INDEX PORTFOLIO ANNUAL REPORT
|
| | | | |
| | SHARES | VALUE ($) |
| COMMON STOCKS - Cont'd | | |
| Transportation Infrastructure - 0.0% | | |
| Wesco Aircraft Holdings, Inc. * | 4,699 | 56,247 |
|
| | | |
| Water Utilities - 0.3% | | |
| American States Water Co. | 2,916 | 122,326 |
|
| Artesian Resources Corp., Class A | 490 | 13,573 |
|
| California Water Service Group | 3,695 | 85,983 |
|
| Connecticut Water Service, Inc. | 883 | 33,563 |
|
| Consolidated Water Co., Ltd. | 1,137 | 13,917 |
|
| Middlesex Water Co. | 1,246 | 33,069 |
|
| SJW Corp. | 1,344 | 39,849 |
|
| York Water Co. (The) | 992 | 24,740 |
|
| | | 367,020 |
|
| | | |
| Wireless Telecommunication Services - 0.1% | | |
| Boingo Wireless, Inc. * | 2,827 | 18,715 |
|
| Contra Leap Wireless, Inc. (a)* | 4,674 | 11,778 |
|
| NTELOS Holdings Corp. * | 1,286 | 11,754 |
|
| Shenandoah Telecommunications Co. | 1,866 | 80,331 |
|
| Spok Holdings, Inc. | 1,934 | 35,431 |
|
| | | 158,009 |
|
| | | |
| Total Common Stocks (Cost $113,908,023) | | 131,421,884 |
|
| | | |
| | | |
| EXCHANGE-TRADED PRODUCTS - 0.8% | | |
| iShares Russell 2000 ETF | 10,000 | 1,125,100 |
|
| | | |
| Total Exchange-Traded Products (Cost $1,275,100) | | 1,125,100 |
|
| | | |
| | | |
| | PRINCIPAL
AMOUNT ($) | |
| U.S. TREASURY OBLIGATIONS - 0.7% | | |
| United States Treasury Bills, 0.152%, 3/31/16 ^ | 1,000,000 | 999,578 |
|
| | | |
| Total U.S. Treasury Obligations (Cost $999,621) | | 999,578 |
|
| | | |
| | | |
| TIME DEPOSIT - 2.6% | | |
| State Street Bank Time Deposit, 0.278%, 1/4/16 | 3,540,323 | 3,540,323 |
|
| | | |
| Total Time Deposit (Cost $3,540,323) | | 3,540,323 |
|
| | | |
| | | |
| TOTAL INVESTMENTS (Cost $119,723,067) - 100.0% | | 137,086,885 |
|
| Other assets and liabilities, net - 0.0% | | 25,730 |
|
NET ASSETS - 100.0% | |
| $137,112,615 |
|
| See notes to financial statements. |
www.calvert.com CALVERT VP RUSSELL 2000 SMALL CAP INDEX PORTFOLIO ANNUAL REPORT 47
|
| | | | | | | | | | |
| FUTURES | NUMBER OF
CONTRACTS | EXPIRATION
DATE | UNDERLYING FACE AMOUNT AT VALUE | UNREALIZED
APPRECIATION
(DEPRECIATION) |
| Long: | | | | | |
| | E-Mini Russell 2000 Index^ | 41 | 3/16 |
| $4,639,150 |
|
| $92,705 |
|
|
|
| NOTES TO SCHEDULE OF INVESTMENTS |
| * Non-income producing security. |
| ^ Futures collateralized by $1,000,000 par value of U.S. Treasury Bills. |
| (a) This security was valued under the direction of the Board of Directors. See Note A. |
|
| |
| Abbreviations: |
| ETF: | Exchange-Traded Fund |
| Ltd.: | Limited |
| plc: | Public Limited Company |
| REIT: | Real Estate Investment Trust |
| See notes to financial statements. |
48 www.calvert.com CALVERT VP RUSSELL 2000 SMALL CAP INDEX PORTFOLIO ANNUAL REPORT
CALVERT VP RUSSELL 2000 SMALL CAP INDEX PORTFOLIO
STATEMENT OF ASSETS AND LIABILITIES
DECEMBER 31, 2015
|
| | | |
| ASSETS | |
| Investments in securities, at value (Cost $119,723,067) - see accompanying schedule |
| $137,086,885 |
|
| Cash | 490 |
|
| Receivable for shares sold | 153,222 |
|
| Dividends and interest receivable | 198,485 |
|
| Directors' deferred compensation plan | 89,274 |
|
| Receivable from Calvert Investment Management, Inc. | 20,506 |
|
| Total assets | 137,548,862 |
|
| | |
| LIABILITIES | |
| Payable for shares redeemed | 132,716 |
|
| Payable for futures contracts variation margin | 47,150 |
|
| Payable to Calvert Investment Distributors, Inc. | 2,963 |
|
| Payable to Calvert Investment Administrative Services, Inc. | 11,823 |
|
| Payable to Calvert Investment Services, Inc. | 2,233 |
|
| Directors' deferred compensation plan | 89,274 |
|
| Accrued expenses and other liabilities | 150,088 |
|
| Total liabilities | 436,247 |
|
| NET ASSETS |
| $137,112,615 |
|
| | |
| NET ASSETS CONSIST OF: | |
| Paid-in capital applicable to the following shares of common stock outstanding; | |
| $0.10 par value, 20,000,000 shares authorized: | |
| Class I: 1,716,584 shares outstanding | $89,577,679 |
| Class F: 248,650 shares outstanding | 15,699,065 |
|
| Undistributed net investment income | 817,322 |
|
| Accumulated net realized gain (loss) on investments and foreign currency transactions | 13,562,026 |
|
| Net unrealized appreciation (depreciation) | 17,456,523 |
|
| NET ASSETS |
| $137,112,615 |
|
| | |
| NET ASSET VALUE PER SHARE | |
| Class I (based on net assets of $119,673,853) |
| $69.72 |
|
| Class F (based on net assets of $17,438,762) |
| $70.13 |
|
| See notes to financial statements. | |
www.calvert.com CALVERT VP RUSSELL 2000 SMALL CAP INDEX PORTFOLIO ANNUAL REPORT 49
CALVERT VP RUSSELL 2000 SMALL CAP INDEX PORTFOLIO
STATEMENT OF OPERATIONS
YEAR ENDED DECEMBER 31, 2015
|
| | | |
| NET INVESTMENT INCOME | |
| Investment Income: | |
| Dividend income (net of foreign taxes withheld of $909) |
| $2,272,112 |
|
| Interest income | 5,861 |
|
| Total investment income | 2,277,973 |
|
| | |
| Expenses: | |
| Investment advisory fee | 546,178 |
|
| Administrative fees | 156,051 |
|
| Transfer agency fees and expenses | 20,932 |
|
| Distribution Plan expenses: | |
| Class F | 36,686 |
|
| Directors' fees and expenses | 28,672 |
|
| Accounting fees | 33,728 |
|
| Custodian fees | 171,096 |
|
| Professional fees | 38,381 |
|
| Reports to shareholders | 88,711 |
|
| Contract services | 38,304 |
|
| Licensing fees | 60,000 |
|
| Miscellaneous | 60,476 |
|
| Total expenses | 1,279,215 |
|
| Reimbursement from Advisor: | |
| Class I | (74,188) |
|
| Class F | (11,732) |
|
| Net expenses | 1,193,295 |
|
| NET INVESTMENT INCOME | 1,084,678 |
|
| | |
| | |
| REALIZED AND UNREALIZED GAIN (LOSS) | |
| Net realized gain (loss) on: | |
| Investments | 14,304,786 |
|
| Foreign currency transactions | (16) |
|
| Futures | (842,610) |
|
| | 13,462,160 |
|
| | |
| Change in unrealized appreciation (depreciation) on: | |
| Investments | (21,822,170) |
|
| Futures | (109,285) |
|
| | (21,931,455) |
|
| | |
| NET REALIZED AND UNREALIZED GAIN (LOSS) | (8,469,295) |
|
| | |
| INCREASE (DECREASE) IN NET ASSETS RESULTING FROM OPERATIONS | $(7,384,617) |
| See notes to financial statements. |
50 www.calvert.com CALVERT VP RUSSELL 2000 SMALL CAP INDEX PORTFOLIO ANNUAL REPORT
CALVERT VP RUSSELL 2000 SMALL CAP INDEX PORTFOLIO
STATEMENTS OF CHANGES IN NET ASSETS
|
| | | | | | | |
| INCREASE (DECREASE) IN NET ASSETS | YEAR ENDED
DECEMBER 31, 2015 | | YEAR ENDED
DECEMBER 31, 2014 |
| Operations: | | | |
| Net investment income |
| $1,084,678 |
| |
| $993,442 |
|
| Net realized gain (loss) | 13,462,160 |
| | 18,576,316 |
|
| Change in unrealized appreciation (depreciation) | (21,931,455) |
| | (12,247,733) |
|
| | | | |
| INCREASE (DECREASE) IN NET ASSETS RESULTING FROM OPERATIONS | (7,384,617) |
| | 7,322,025 |
|
| | | | |
| Distributions to shareholders from: | | | |
| Net investment income: | | | |
| Class I shares | (192,907) |
| | (841,383) |
|
| Class F shares | — |
| | (56,269) |
|
| Net realized gain: | | | |
| Class I shares | (3,507,179) |
| | (16,740,646) |
|
| Class F shares | (503,660) |
| | (1,895,122) |
|
| Total distributions | (4,203,746) |
| | (19,533,420) |
|
| | | | |
| Capital share transactions: | | | |
| Shares sold: | | | |
| Class I shares | 9,831,626 |
| | 12,312,897 |
|
| Class F shares | 5,908,634 |
| | 4,903,319 |
|
| Shares issued from merger (See Note E): | | | |
| Class I shares | — |
| | 25,315,650 |
|
| Reinvestment of distributions: | | | |
| Class I shares | 3,700,086 |
| | 17,582,029 |
|
| Class F shares | 503,659 |
| | 1,951,391 |
|
| Shares redeemed: | | | |
| Class I shares | (34,261,751) |
| | (34,849,885) |
|
| Class F shares | (4,666,051) |
| | (3,436,958) |
|
| Total capital share transactions | (18,983,797) |
| | 23,778,443 |
|
| | | | |
| TOTAL INCREASE (DECREASE) IN NET ASSETS | (30,572,160) |
| | 11,567,048 |
|
| | | | |
| | | | |
| NET ASSETS | | | |
| Beginning of year | 167,684,775 |
| | 156,117,727 |
|
| End of year (including undistributed net investment income of $817,322 and $150,014, respectively) |
| $137,112,615 |
| |
| $167,684,775 |
|
| See notes to financial statements. |
www.calvert.com CALVERT VP RUSSELL 2000 SMALL CAP INDEX PORTFOLIO ANNUAL REPORT 51
|
| | | | | | | |
CALVERT VP RUSSELL 2000 SMALL CAP INDEX PORTFOLIO STATEMENTS OF CHANGES IN NET ASSETS - Cont'd |
| CAPITAL SHARE ACTIVITY | YEAR ENDED
DECEMBER 31, 2015 | | YEAR ENDED
DECEMBER 31, 2014 |
| Shares sold: | | | |
| Class I shares | 129,051 |
| | 150,830 |
|
| Class F shares | 77,673 |
| | 59,942 |
|
| Shares issued from merger (See Note E): | | | |
| Class I shares | — |
| | 316,884 |
|
| Reinvestment of distributions: | | | |
| Class I shares | 51,938 |
| | 230,252 |
|
| Class F shares | 7,028 |
| | 25,396 |
|
| Shares redeemed: | | | |
| Class I shares | (449,443) |
| | (426,697) |
|
| Class F shares | (60,826) |
| | (41,839) |
|
| Total capital share activity | (244,579) |
| | 314,768 |
|
| See notes to financial statements. |
52 www.calvert.com CALVERT VP RUSSELL 2000 SMALL CAP INDEX PORTFOLIO ANNUAL REPORT
NOTES TO FINANCIAL STATEMENTS
NOTE A — SIGNIFICANT ACCOUNTING POLICIES
General: Calvert VP Russell 2000 Small Cap Index Portfolio (the “Portfolio”), a series of Calvert Variable Products, Inc. (the “Fund”), is registered under the Investment Company Act of 1940 as a diversified, open-end management investment company. The Fund is comprised of eleven separate portfolios. The operations of each series of the Fund are accounted for separately. The Portfolio applies the accounting and reporting guidance in the Financial Accounting Standards Board (FASB) Accounting Standards Codification Topic 946, Financial Services – Investment Companies (ASC 946).
Shares of the Portfolio are sold without sales charge to affiliated and unaffiliated insurance companies for allocation to certain of their variable separate accounts. The Portfolio offers Class F and Class I shares. Class F shares are subject to Distribution Plan Expenses, while Class I shares are not. Each class has different: (a) dividend rates, due to differences in Distribution Plan expenses and other class-specific expenses, (b) exchange privileges; and (c) class-specific voting rights.
Security Valuation: Net asset value per share is determined every business day as of the close of the regular session of the New York Stock Exchange (generally 4:00 p.m. Eastern time). The Portfolio uses independent pricing services approved by the Board of Directors (“the Board”) to value its investments wherever possible. Investments for which market quotations are not available or deemed not reliable are fair valued in good faith under the direction of the Board.
The Board has adopted Valuation Procedures (the “Procedures”) to determine the fair value of securities and other financial instruments for which market prices are not readily available or which may not be reliably priced. The Board has delegated the day-to-day responsibility for determining the fair value of assets of the Portfolio to Calvert Investment Management, Inc. (the “Advisor” or “Calvert”) and has provided these Procedures to govern Calvert in its valuation duties.
Calvert has chartered an internal Valuation Committee to oversee the implementation of these Procedures and to assist it in carrying out the valuation responsibilities that the Board has delegated.
The Valuation Committee meets on a regular basis to review illiquid securities and other investments which may not have readily available market prices. The Valuation Committee’s fair valuation determinations are subject to review, approval and ratification by the Board at its next regularly scheduled meeting covering the calendar quarter in which the fair valuation was determined.
The Valuation Committee utilizes various methods to measure the fair value of the Portfolio’s investments. U.S. generally accepted accounting principles (GAAP) establishes a disclosure hierarchy that categorizes the inputs to valuation techniques used to value assets and liabilities at measurement date. These inputs are summarized in the three broad levels listed below:
Level 1 - quoted prices in active markets for identical securities
Level 2 - other significant observable inputs (including quoted prices for similar securities, interest rates, prepayment speeds, credit risk, etc.)
Level 3 - significant unobservable inputs (including the Portfolio’s own assumptions in determining the fair value of investments)
The inputs or methodologies used for valuing securities are not necessarily an indication of the risk associated with investing in those securities.
Changes in valuation techniques may result in transfers in or out of an investment’s assigned level within the hierarchy during the year. Transfers in and/or out of levels are determined based on the fair value of such securities at the end of the year. Valuation techniques used to value the Portfolio’s investments by major category are as follows:
Common stock securities, including restricted securities, for which market quotations are readily available, are valued at the last reported sale price or official closing price as reported by an independent pricing service on the primary market or exchange on which they are traded and are categorized as Level 1 in the hierarchy. In the event there were no sales during the day or closing prices are not available, securities are valued at the last quoted bid price or the last available price and are categorized as Level 2 in the hierarchy. Foreign securities are valued based on quotations from the principal market in which such securities are normally traded. If events occur after the close of the principal market in which foreign securities are traded, and before the close of business of the Portfolio, that are expected to
www.calvert.com CALVERT VP RUSSELL 2000 SMALL CAP INDEX PORTFOLIO ANNUAL REPORT 53
materially affect the value of those securities, then they are valued at their fair value taking these events into account and are categorized as Level 2 in the hierarchy.
Exchange-traded products are valued at the official closing price as reported by an independent pricing service on the primary market or exchange on which they are traded and are categorized as Level 1 in the hierarchy.
Debt securities, including restricted securities, are valued based on evaluated prices received from independent pricing services or from dealers who make markets in such securities. For U.S. government obligations, pricing services utilize matrix pricing which considers yield or price of bonds of comparable quality, coupon, maturity and type as well as dealer supplied prices and such securities are generally categorized as Level 2 in the hierarchy. Short-term securities of sufficient credit quality with remaining maturities of sixty days or less for which quotations are not readily available are valued at amortized cost, which approximates fair value, and are categorized as Level 2 in the hierarchy.
Futures contracts are valued at unrealized appreciation (depreciation) based on the settlement price established each day by the board of trade or exchange on which they are traded and are categorized as Level 1 in the hierarchy.
If a market value cannot be determined for a security using the methodologies described above, or if, in the good faith opinion of the Advisor, the market value does not constitute a readily available market quotation, or if a significant event has occurred that would materially affect the value of the security, the security will be fair valued as determined in good faith by the Valuation Committee.
The Valuation Committee considers a number of factors, including significant unobservable valuation inputs when arriving at fair value. It considers all significant facts that are reasonably available and relevant to the determination of fair value.
The Valuation Committee primarily employs a market-based approach which may use related or comparable assets or liabilities, recent transactions, market multiples, book values, and other relevant information for the investment to determine the fair value of the investment. When more appropriate, the Portfolio may employ an income-based or cost approach. An income-based valuation approach discounts anticipated future cash flows of the investment to calculate a present amount (discounted). The measurement is based on the value indicated by current market expectations about those future amounts. Discounts may also be applied due to the nature or duration of any restrictions on the disposition of the investments. A cost based approach is based on the amount that currently would be required to replace the service capacity of an asset (current replacement cost). From the seller’s perspective, the price that would be received for the asset is determined based on the cost to a buyer to acquire or construct a substitute asset of comparable utility, adjusted for obsolescence.
The values assigned to fair value investments are based on available information and do not necessarily represent amounts that might ultimately be realized. Further, due to the inherent uncertainty of valuations of such investments, the fair values may differ significantly from the values that would have been used had an active market existed, and the differences could be material. The Valuation Committee employs various methods for calibrating these valuation approaches including a regular review of key inputs and assumptions, transactional back-testing or disposition analysis and reviews of any related market activity.
At December 31, 2015, securities valued at $13,201, or 0.0% of net assets, were fair valued in good faith under the direction of the Board.
54 www.calvert.com CALVERT VP RUSSELL 2000 SMALL CAP INDEX PORTFOLIO ANNUAL REPORT
The following table summarizes the market value of the Portfolio's holdings as of December 31, 2015, based on the inputs used to value them:
|
| | | | | | | | | | | |
| | VALUATION INPUTS |
| INVESTMENTS IN SECURITIES* | LEVEL 1 | LEVEL 2 | LEVEL 3 | TOTAL |
| Common Stocks** |
| $131,408,683 |
|
| $13,186 |
| $15 |
|
| $131,421,884 |
|
| Exchange-Traded Products | 1,125,100 |
| — |
| — |
| 1,125,100 |
|
| U.S. Treasury Obligations | — |
| 999,578 |
| — |
| 999,578 |
|
| Time Deposit | — |
| 3,540,323 |
| — |
| 3,540,323 |
|
| TOTAL |
| $132,533,783 |
|
| $4,553,087 |
| $15^ |
|
| $137,086,885 |
|
| Futures Contracts*** |
| $92,705 |
| $— |
| $— |
|
| $92,705 |
|
| |
| * For a complete listing of investments, please refer to the Schedule of Investments. |
| ** For further breakdown of equity securities by industry, please refer to the Schedule of Investments. |
| *** The value listed for these securities reflects unrealized appreciation (depreciation) as shown on the Schedule of Investments. |
| ^ Level 3 securities represents 0.0% of net assets. |
There were no transfers between levels during the year.
Futures Contracts: The Portfolio may purchase and sell futures contracts, but only when, in the judgment of the Advisor, such a position acts as a hedge. The Portfolio may not enter into futures contracts for the purpose of speculation or leverage. These futures contracts may include, but are not limited to, market index futures. The Portfolio is subject to market risk in the normal course of pursuing its investment objectives and may use futures contracts to hedge against changes in the value of securities. The Portfolio may enter into futures contracts agreeing to buy or sell a financial instrument for a set price at a future date. Initial margin deposits of either cash or securities as required by the broker are made upon entering into the contract. While the contract is open, daily variation margin payments are made to or received from the broker reflecting the daily change in market value of the contract and are recorded for financial reporting purposes as unrealized gains or losses by the Portfolio. When a futures contract is closed, a realized gain or loss is recorded equal to the difference between the opening and closing value of the contract. The risks associated with entering into futures contracts may include the possible illiquidity of the secondary market which would limit the Portfolio’s ability to close out a futures contract prior to the settlement date, an imperfect correlation between the value of the contracts and the underlying financial instruments, or that the counterparty will fail to perform its obligations under the contracts’ terms. Futures contracts are designed by boards of trade which are designated “contracts markets” by the Commodities Futures Trading Commission. Futures contracts trade on the contracts markets in a manner that is similar to the way a stock trades on a stock exchange, and the boards of trade, through their clearing corporations, guarantee the futures contracts against default. As a result, there is minimal counterparty credit risk to the Portfolio. During the year, futures contracts were used to hedge the lack of equity market exposure inherent in a cash position. The Portfolio’s futures contracts at year end are presented in the Schedule of Investments.
At December 31, 2015, the Portfolio had the following derivatives, categorized by risk exposure:
|
| | | | |
| Risk | Statement of Assets and Liabilities | Assets | Statement of Assets and Liabilities | Liabilities |
| Equity | Unrealized appreciation on futures contracts | $92,705* | Unrealized depreciation on futures contracts | ($—)* |
| * Only the current day’s variation margin is reported within the Statement of Assets and Liabilities. |
The effect of derivative instruments on the Statement of Operations for the year ended December 31, 2015 was as follows:
|
| | | | | | | |
| | Statement of Operations Location |
| Risk | Derivatives | Net Realized Gain (Loss) | Net Change in Unrealized appreciation (depreciation) |
| Equity | Futures |
| ($842,610 | ) |
| ($109,285 | ) |
www.calvert.com CALVERT VP RUSSELL 2000 SMALL CAP INDEX PORTFOLIO ANNUAL REPORT 55
During the year, the Portfolio invested in E-Mini Russell 2000 Index futures. The volume of outstanding contracts has varied throughout the year with an average number of contracts as in the following table:
|
| |
| Derivative Description | Average Number of Contracts* |
| Futures contracts long | 52 |
| Futures contracts short | — |
| *Averages are based on activity levels during the year ended December 31, 2015. |
Security Transactions and Investment Income: Security transactions are accounted for on trade date. Realized gains and losses are recorded on an identified cost basis and may include proceeds from litigation. Dividend income is recorded on the ex-dividend date or, in the case of dividends on certain foreign securities, as soon as the Portfolio is informed of the ex-dividend date. Withholding taxes on foreign dividends have been provided for in accordance with the Portfolio’s understanding of the applicable country’s tax rules and rates. Distributions received on securities that represent a return of capital are recorded as a reduction of cost of investments. Distributions received on securities that represent a capital gain are recorded as a realized gain. Interest income, which includes amortization of premium and accretion of discount on debt securities, is accrued as earned. Investment income and realized and unrealized gains and losses are allocated to separate classes of shares based upon the relative net assets of each class. Expenses arising in connection with a specific class are charged directly to that class. Expenses common to the classes are allocated to each class in proportion to their relative net assets.
Foreign Currency Transactions: The Portfolio’s accounting records are maintained in U.S. dollars. For valuation of assets and liabilities on each date of net asset value determination, foreign denominations are converted into U.S. dollars using the current exchange rate. Security transactions, income, and expenses are translated at the prevailing rate of exchange on the date of the event. The effect of changes in foreign exchange rates on securities and foreign currencies is included in the net realized and unrealized gain or loss on investments and assets and liabilities denominated in foreign currencies.
Distributions to Shareholders: Distributions to shareholders are recorded by the Portfolio on ex-dividend date. Dividends from net investment income and distributions from net realized capital gains, if any, are paid at least annually. Distributions are determined in accordance with income tax regulations which may differ from U.S. generally accepted accounting principles; accordingly, periodic reclassifications are made within the Portfolio's capital accounts to reflect income and gains available for distribution under income tax regulations.
Estimates: The preparation of financial statements in conformity with U.S. generally accepted accounting principles requires management to make estimates and assumptions that affect the reported amounts of assets and liabilities and disclosure of contingent assets and liabilities at the date of the financial statements and the reported amounts of increases and decreases in net assets from operations during the reporting period. Actual results could differ from those estimates.
Federal Income Taxes: No provision for federal income or excise tax is required since the Portfolio intends to continue to qualify as a regulated investment company under the Internal Revenue Code and to distribute substantially all of its taxable earnings.
Management has analyzed the Portfolio's tax positions taken for all open federal income tax years and has concluded that no provision for federal income tax is required in the Portfolio's financial statements. A Portfolio's federal tax return is subject to examination by the Internal Revenue Service for a period of three years.
NOTE B — RELATED PARTY TRANSACTIONS
Calvert Investment Management, Inc. (the “Advisor”) is wholly-owned by Calvert Investments, Inc., which is indirectly wholly-owned by Ameritas Mutual Holding Company. The Advisor provides investment advisory services and pays the salaries and fees of officers and Directors of the Portfolio who are employees of the Advisor or its affiliates. For its services, the Advisor receives an annual fee, payable monthly, of 0.35% of the Portfolio’s average daily net assets.
The Advisor has contractually agreed to limit net annual portfolio operating expenses through April 30, 2016. The contractual expense cap are 0.95% for Class F and 0.74% for Class I. For the purpose of this expense limit, operating expenses do not include interest expense, brokerage commissions, taxes, and extraordinary expenses. This expense limitation does not limit acquired fund fees and expenses, if any.
56 www.calvert.com CALVERT VP RUSSELL 2000 SMALL CAP INDEX PORTFOLIO ANNUAL REPORT
Calvert Investment Administrative Services, Inc. ("CIAS"), an affiliate of the Advisor, provides administrative services to the Portfolio for an annual fee, payable monthly, of 0.10% of the Portfolio’s average daily net assets.
On November 24, 2015, the Board of Directors approved the recommendation made by CIAS to standardize and rationalize the administrative fee paid by the Calvert Funds at 0.12% for all series and all share classes of the Calvert Funds. CIAS and the Portfolio have entered into an Amended and Restated Administrative Services Agreement that will establish a 0.12% administrative fee for all share classes commencing on May 1, 2016. CIAS has contractually agreed to waive 0.02% for Class F and I (the difference between the current administrative fee and the new 0.12% fee) from May 1, 2016 through April 30, 2018.
Calvert Investment Distributors, Inc. (“CID”), an affiliate of the Advisor, is the distributor and principal underwriter for the Portfolio. Pursuant to Rule 12b-1 under the Investment Company Act of 1940, the Portfolio has adopted a Distribution Plan that permits the Portfolio to pay certain expenses associated with the distribution and servicing of its Class F shares. The expenses paid may not exceed 0.20% annually of the average daily net assets of Class F.
Calvert Investment Services, Inc. (“CIS”), an affiliate of the Advisor, acts as shareholder servicing agent for the Portfolio. For its services, CIS received a fee of $11,704 for the year ended December 31, 2015. Boston Financial Data Services, Inc. is the transfer and dividend disbursing agent.
Each Director of the Portfolio who is not an employee of the Advisor or its affiliates receives a fee of $1,500 for each Board and Committee meeting attended plus an annual fee of $44,000. Committee chairs receive an additional $5,000 annual retainer. Eligible Directors may participate in a Deferred Compensation Plan (the “Plan”). Obligations of the Plan will be paid solely out of the Portfolio’s assets. Directors’ fees are allocated to each of the portfolios served.
NOTE C — INVESTMENT ACTIVITY AND TAX INFORMATION
During the year, the cost of purchases and proceeds from sales of investments, other than short-term securities, were $20,257,506 and $36,560,556, respectively.
The tax character of dividends and distributions paid during the years ended December 31, 2015 and December 31, 2014 was as follows:
|
| | | | | | |
| DISTRIBUTIONS PAID FROM: | 2015 | 2014 |
| Ordinary income |
| $551,674 |
|
| $2,280,149 |
|
| Long-term capital gains | 3,652,072 |
| 17,253,271 |
|
| Total |
| $4,203,746 |
|
| $19,533,420 |
|
As of December 31, 2015, the tax basis components of distributable earnings/(accumulated losses) and the federal tax cost were as follows:
|
| | | |
| Unrealized appreciation |
| $37,192,576 |
|
| Unrealized (depreciation) | (19,667,786) |
|
| Net unrealized appreciation (depreciation) |
| $17,524,790 |
|
| Undistributed ordinary income |
| $1,095,909 |
|
| Undistributed long-term capital gain |
| $13,215,172 |
|
| Federal income tax cost of investments |
| $119,562,095 |
|
The differences between the components of distributable earnings on a tax basis and the amounts reflected in the Statement of Assets and Liabilities are primarily due to temporary book-tax differences that will reverse in a subsequent period. These differences are mainly due to wash sales, real estate investment trusts, passive foreign investment companies, and Section 1256 futures contracts.
www.calvert.com CALVERT VP RUSSELL 2000 SMALL CAP INDEX PORTFOLIO ANNUAL REPORT 57
Reclassifications, as shown in the table below, have been made to the Portfolio's components of net assets to reflect income and gains available for distribution (or available capital loss carryovers, as applicable) under income tax law and regulations. These reclassifications are due to permanent book-tax differences and have no impact on net assets. The primary permanent differences causing such reclassifications for the Portfolio are due to real estate investment trusts, passive foreign investment companies and foreign currency transactions.
|
| | | |
| Undistributed net investment income |
| ($224,463 | ) |
| Accumulated net realized gain (loss) | 224,463 |
|
NOTE D — LINE OF CREDIT
A financing agreement is in place with the Calvert Funds and State Street Corporation (“SSC”). Under the agreement, SSC provides an unsecured line of credit facility, in the aggregate amount of $50 million ($25 million committed and $25 million uncommitted), accessible by the Calvert Funds for temporary or emergency purposes only. Borrowings bear interest at the higher of the London Interbank Offered Rate (LIBOR) or the overnight Federal Funds Rate plus 1.25% per annum. A commitment fee of 0.20% per annum is incurred on the unused portion of the committed facility. An administrative fee of $25,000 was paid in connection with the uncommitted facility. These fees are allocated to all participating funds. The Portfolio had no borrowings under the agreement during the year ended December 31, 2015.
NOTE E — REORGANIZATION
On December 11, 2013, the Board of Directors of Calvert Variable Series, Inc. approved the reorganization of the Calvert VP Small Cap Growth Portfolio (“VP Small Cap”) into the Calvert VP Russell 2000 Small Cap Index (“VP Russell”).
Shareholders approved the reorganization at a meeting on April 11, 2014 and the reorganization took place on April 30, 2014. The acquisition was accomplished by a tax-free exchange of the following shares:
|
| | | | |
| Merged Portfolio | Shares | Acquiring Portfolio | Shares | Value |
| VP Small Cap | 525,988 | VP Russell, Class I | 316,884 | $25,315,650 |
For financial reporting purposes, assets received and shares issued by VP Russell were recorded at fair value; however, the cost basis of the investments received from VP Small Cap were carried forward to align ongoing reporting of VP Russell’s realized and unrealized gains and losses with amounts distributable to shareholders for tax purposes.
The net assets and net unrealized appreciation (depreciation) immediately before the acquisition were as follows:
|
| | | | |
| | | Unrealized Appreciation | | |
| Merged Portfolio | Net Assets | (Depreciation) | Acquiring Portfolio | Net Assets |
| VP Small Cap | $25,315,650 | $6,095,146 | VP Russell | $148,811,142 |
Assuming the acquisition had been completed on January 1, 2014, VP Russell’s results of operations for the year ended December 31, 2014 would have been as follows:
|
|
| Net investment income ..................................................................................................$949,473 (a) |
| Net realized and change in unrealized gain (loss) on investments............................... $5,364,591 (b) |
| Net increase (decrease) in assets from operations........................................................$6,314,064 |
Because VP Small Cap and VP Russell sold and redeemed shares throughout the period, it is not practicable to provide pro-forma information on a per-share basis. Because the combined investment portfolios have been managed as a single integrated portfolio since the acquisition was completed, it is also not practicable to separate the amounts of revenue and earnings of VP Small Cap that have been included in VP Russell’s Statement of Operations since April 30, 2014.
(a) $993,442 as reported, plus ($43,969) from VP Small Cap pre-merger.
(b) $6,328,583 as reported, plus ($963,992) from VP Small Cap pre-merger.
58 www.calvert.com CALVERT VP RUSSELL 2000 SMALL CAP INDEX PORTFOLIO ANNUAL REPORT
NOTE F — SUBSEQUENT EVENTS
In preparing the financial statements as of December 31, 2015, no subsequent events or transactions occurred that would have required recognition or disclosure in these financial statements.
NOTICE TO SHAREHOLDERS (UNAUDITED)
For the year ended December 31, 2015, the Portfolio considers 66.4% of the ordinary dividends paid during the year as eligible for the corporate dividends received deduction in accordance with Section 854 of the Internal Revenue Code and $3,652,072 of the long-term capital gain distributions paid during the year as capital gain dividends in accordance with Section 852(b)(3)(C) of the Internal Revenue Code.
www.calvert.com CALVERT VP RUSSELL 2000 SMALL CAP INDEX PORTFOLIO ANNUAL REPORT 59
CALVERT VP RUSSELL 2000 SMALL CAP INDEX PORTFOLIO
FINANCIAL HIGHLIGHTS
|
| | | | | | | | | | | | | | | | | | | | |
| | YEARS ENDED | |
| CLASS I SHARES | December 31, 2015 (a) | | December 31, 2014 | | December 31, 2013 | | December 31, 2012 (a) | | December 31, 2011 | |
| Net asset value, beginning |
| $75.83 |
| |
| $82.34 |
| |
| $62.39 |
| |
| $57.44 |
| |
| $62.98 |
| |
| Income from investment operations: | | | | | | | | | | |
| Net investment income | 0.55 |
| | 0.50 |
| | 0.56 |
| | 0.87 |
| | 0.44 |
| |
| Net realized and unrealized gain (loss) | (4.44) |
| | 2.99 |
| | 22.96 |
| | 7.95 |
| | (3.50) |
| |
| Total from investment operations | (3.89) |
| | 3.49 |
| | 23.52 |
| | 8.82 |
| | (3.06) |
| |
| Distributions from: | | | | | | | | | | |
| Net investment income | (0.12) |
| | (0.48) |
| | (0.58) |
| | (0.63) |
| | (0.33) |
| |
| Net realized gain | (2.10) |
| | (9.52) |
| | (2.99) |
| | (3.24) |
| | (2.15) |
| |
| Total distributions | (2.22) |
| | (10.00) |
| | (3.57) |
| | (3.87) |
| | (2.48) |
| |
| Total increase (decrease) in net asset value | (6.11) |
| | (6.51) |
| | 19.95 |
| | 4.95 |
| | (5.54) |
| |
| Net asset value, ending |
| $69.72 |
| |
| $75.83 |
| |
| $82.34 |
| |
| $62.39 |
| |
| $57.44 |
| |
| Total return(b) | (5.19 | %) | | 4.15 | % | | 37.89 | % | | 15.50 | % | | (4.89 | %) | |
| Ratios to average net assets: (c) | | | | | | | | | | |
| Net investment income | 0.72 | % | | 0.63 | % | | 0.75 | % | | 1.40 | % | | 0.60 | % | |
| Total expenses | 0.79 | % | | 0.75 | % | | 0.69 | % | | 0.76 | % | | 0.79 | % | |
| Net expenses | 0.74 | % | | 0.74 | % | | 0.69 | % | | 0.73 | % | | 0.71 | % | |
| Portfolio turnover | 14 | % | | 21 | % | | 11 | % | | 13 | % | | 17 | % | |
| Net assets, ending (in thousands) |
| $119,674 |
| |
| $150,532 |
| |
| $141,111 |
| |
| $106,827 |
| |
| $90,325 |
| |
| | | | | | | | | | | |
| (a)Per share figures are calculated using the Average Shares Method. |
| (b)Total return is not annualized for periods of less than one year and does not reflect charges and expenses of the variable annuity or variable universal life contract. |
| (c)Total expenses do not reflect amounts reimbursed and/or waived by the Advisor and certain of its affiliates, if applicable. Net expenses are net of all reductions and represent the net expenses paid by the Portfolio. |
| See notes to financial statements. |
60 www.calvert.com CALVERT VP RUSSELL 2000 SMALL CAP INDEX PORTFOLIO ANNUAL REPORT
CALVERT VP RUSSELL 2000 SMALL CAP INDEX PORTFOLIO
FINANCIAL HIGHLIGHTS
|
| | | | | | | | | | | | | | | | | | | | |
| | YEARS ENDED | |
| CLASS F SHARES | December 31, 2015 (a) | | December 31, 2014 | | December 31, 2013 | | December 31, 2012 (a) | | December 31, 2011 | |
| Net asset value, beginning |
| $76.31 |
| |
| $82.79 |
| |
| $62.68 |
| |
| $57.69 |
| |
| $63.21 |
| |
| Income from investment operations: | | | | | | | | | | |
| Net investment income | 0.40 |
| | 0.31 |
| | 0.36 |
| | 0.77 |
| | 0.25 |
| |
| Net realized and unrealized gain (loss) | (4.48) |
| | 3.01 |
| | 23.11 |
| | 7.94 |
| | (3.44) |
| |
| Total from investment operations | (4.08) |
| | 3.32 |
| | 23.47 |
| | 8.71 |
| | (3.19) |
| |
| Distributions from: | | | | | | | | | | |
| Net investment income | — |
| | (0.28) |
| | (0.37) |
| | (0.48) |
| | (0.18) |
| |
| Net realized gain | (2.10) |
| | (9.52) |
| | (2.99) |
| | (3.24) |
| | (2.15) |
| |
| Total distributions | (2.10) |
| | (9.80) |
| | (3.36) |
| | (3.72) |
| | (2.33) |
| |
| Total increase (decrease) in net asset value | (6.18) |
| | (6.48) |
| | 20.11 |
| | 4.99 |
| | (5.52) |
| |
| Net asset value, ending |
| $70.13 |
| |
| $76.31 |
| |
| $82.79 |
| |
| $62.68 |
| |
| $57.69 |
| |
| Total return(b) | (5.40 | %) | | 3.93 | % | | 37.62 | % | | 15.23 | % | | (5.07 | %) | |
| Ratios to average net assets (c) | | | | | | | | | | |
| Net investment income | 0.52 | % | | 0.43 | % | | 0.55 | % | | 1.23 | % | | 0.42 | % | |
| Total expenses | 1.01 | % | | 0.98 | % | | 0.90 | % | | 0.99 | % | | 1.03 | % | |
| Net expenses | 0.95 | % | | 0.95 | % | | 0.90 | % | | 0.94 | % | | 0.92 | % | |
| Portfolio turnover | 14 | % | | 21 | % | | 11 | % | | 13 | % | | 17 | % | |
| Net assets, ending (in thousands) |
| $17,439 |
| |
| $17,153 |
| |
| $15,007 |
| |
| $9,323 |
| |
| $6,638 |
| |
| | | | | | | | | | | |
| (a)Per share figures are calculated using the Average Shares Method. |
| (b)Total return is not annualized for periods of less than one year and does not reflect charges and expenses of the variable annuity or variable universal life contract. |
| (c)Total expenses do not reflect amounts reimbursed and/or waived by the Advisor and certain of its affiliates, if applicable. Net expenses are net of all reductions and represent the net expenses paid by the Portfolio. |
| See notes to financial statements. |
www.calvert.com CALVERT VP RUSSELL 2000 SMALL CAP INDEX PORTFOLIO ANNUAL REPORT 61
PROXY VOTING
The Proxy Voting Guidelines that the Portfolio uses to determine how to vote proxies relating to portfolio securities is provided as an Appendix to the Fund’s Statement of Additional Information. The Statement of Additional Information can be obtained free of charge by calling the Fund at 1-800-368-2745, by visiting the Calvert website at www.calvert.com or by visiting the SEC’s website at www.sec.gov.
Information regarding how the Fund voted proxies relating to portfolio securities during the most recent 12-month period ended June 30 is available by calling the Fund, by visiting the Calvert website at www.calvert.com or visiting the SEC’s website at www.sec.gov.
AVAILABILITY OF QUARTERLY PORTFOLIO HOLDINGS
The Fund files its complete schedule of portfolio holdings with the SEC for the first and third quarters of each fiscal year on Form N-Q. The Fund’s Form N-Q is available on the SEC’s website at www.sec.gov. The Fund’s Form N-Q may be reviewed and copied at the SEC’s Public Reference Room in Washington, DC; information on the operation of the Public Reference Room may be obtained by calling 1-800-SEC-0330.
BASIS FOR BOARD'S APPROVAL OF INVESTMENT ADVISORY CONTRACTS
At a meeting held on December 9, 2015, the Board of Directors, and by a separate vote, the disinterested Directors, approved the continuance of the Investment Advisory Agreement between the Portfolio and the Advisor and the Investment Subadvisory Agreement between the Advisor and the Subadvisor with respect to the Portfolio.
In evaluating the Investment Advisory Agreement, the Board considered a variety of information relating to the Portfolio and the Advisor. The disinterested Directors reviewed a report prepared by the Advisor regarding various services provided to the Portfolio by the Advisor and its affiliates. Such report included, among other data, information regarding the Advisor's personnel and the Advisor's revenue and cost of providing services to the Portfolio, and a separate report prepared by an independent third party, which provided a statistical analysis comparing the Portfolio's investment performance, expenses, and fees to comparable mutual funds.
The disinterested Directors were separately represented by independent legal counsel with respect to their consideration of the reapproval of the Investment Advisory Agreement and the Investment Subadvisory Agreement. Prior to voting, the disinterested Directors reviewed the proposed continuance of the Investment Advisory Agreement and Investment Subadvisory Agreement with management and also met in private sessions with their counsel at which no representatives of management were present.
In the course of its deliberations regarding the Investment Advisory Agreement, the Board considered the following factors, among others: the nature, extent and quality of the services provided by the Advisor, including the personnel providing such services; the Advisor's financial condition; the level and method of computing the Portfolio's advisory fee; comparative performance, fee and expense information for the Portfolio; the profitability of the Calvert Family of Funds to the Advisor and its affiliates; the allocation of the Portfolio's brokerage, including the Advisor's process for monitoring "best execution"; the direct and indirect benefits, if any, derived by the Advisor and its affiliates from their relationship with the Portfolio; the effect of the Portfolio's growth and size on the Portfolio's performance and expenses; the Advisor's compliance programs and policies; the Advisor's performance of substantially similar duties for other funds; and any possible conflicts of interest.
In considering the nature, extent and quality of the services provided by the Advisor under the Investment Advisory Agreement, the Board reviewed information provided by the Advisor relating to its operations and personnel, including, among other information, biographical information on the Advisor's supervisory and professional staff and descriptions of its organizational and management structure. The Board also took into account similar information provided periodically throughout the previous year by the Advisor, as well as the Board’s familiarity with the Advisor’s management through Board of Directors' meetings, discussions and other reports. The Board considered the Advisor's current level of staffing and overall resources. The Board also noted that it reviewed on a quarterly basis information regarding the Advisor’s compliance with applicable policies and procedures, including those related to personal investing. The Advisor's administrative capabilities, including its ability to supervise the other service providers for the Portfolio, were also considered. The Board discussed the Advisor's effectiveness in monitoring the performance of the Subadvisor and its timeliness in responding to performance issues. The Board observed that the scope of services provided by the Advisor
62 www.calvert.com CALVERT VP RUSSELL 2000 SMALL CAP INDEX PORTFOLIO ANNUAL REPORT (UNAUDITED)
generally had expanded over time as a result of regulatory, market and other changes. The Board took into consideration, among other factors, the effectiveness of the Portfolio’s and Advisor’s processes, policies and procedures and the Advisor’s personnel. The Board also took into account, among other items, periodic reports received from the Advisor over the past year concerning the Advisor’s ongoing review and enhancement of certain processes, policies and procedures of the Portfolio and the Advisor. The Board concluded that it was satisfied with the nature, extent and quality of services provided to the Portfolio by the Advisor under the Investment Advisory Agreement.
In considering the Portfolio's performance, the Board noted that it reviewed on a quarterly basis detailed information about the Portfolio's performance results, portfolio composition and investment strategies. In addition, the Board took into account overall financial market conditions. The Board also reviewed various comparative data provided to it in connection with its consideration of the renewal of the Investment Advisory Agreement, including, among other information, a comparison of the Portfolio's total return with its Lipper index and with that of other mutual funds deemed to be in its peer group by an independent third party in its report. This comparison indicated that the Portfolio performed below the median of its peer group for the one-, three- and five-year periods ended June 30, 2015. The data also indicated that the Portfolio outperformed its Lipper index for the one-year period ended June 30, 2015 and underperformed its Lipper index for the three- and five-year periods ended June 30, 2015. The Board took into account management’s discussion of the Portfolio’s performance, including the impact of differing fees and expenses among the portfolios in the peer group on the Portfolio’s relative performance. Based upon its review, the Board concluded that the Portfolio’s performance was satisfactory relative to the performance of passively-managed funds that track the same benchmark index as does the Portfolio.
In considering the Portfolio's fees and expenses, the Board compared the Portfolio's fees and total expense ratio with various comparative data for the funds in its peer group. Among other findings, the data indicated that the Portfolio's advisory fee (after taking into account expense reimbursements) was above the median of its peer group and that total expenses (net of expense reimbursements) were above the median of its peer group. The Board noted that the allocation of advisory and administrative fees may vary among the Portfolio’s peer group. The Board noted that the Advisor is currently reimbursing a portion of the Portfolio expenses. The Board also took into account the Advisor’s current undertaking to maintain expense limitations for the Portfolio. The Board noted that the Advisor paid the Subadvisor’s subadvisory fee under the Investment Subadvisory Agreement with respect to the Portfolio. The Board also took into account management's discussion of the Portfolio's expenses and certain factors that affected the level of such expenses, including the current size of the Portfolio. Based upon its review, the Board determined that the advisory fee was reasonable in view of the quality of services received by the Portfolio from the Advisor and the other factors considered.
The Board reviewed the Advisor’s profitability on a portfolio-by-portfolio basis. In reviewing the overall profitability of the advisory fee to the Portfolio's Advisor, the Board also considered the fact that affiliates of the Advisor provided shareholder servicing, administrative and distribution services to the Portfolio for which they received compensation. The information considered by the Board included Calvert’s operating profit margin information both before and after tax expenses with respect to the services that the Advisor and its affiliates provided to the Calvert Family of Funds complex. The Board reviewed the profitability of the Advisor's relationship with the Portfolio in terms of the total amount of annual advisory fees it received with respect to the Portfolio and whether the Advisor had the financial wherewithal to continue to provide services to the Portfolio. The Board also considered that the Advisor derived benefits to its reputation and other indirect benefits from its relationship with the Portfolio. In addition, the Board took into account that affiliates of the Advisor may benefit from certain indirect tax benefits relating to dividend received deductions and foreign tax credits. The Board also noted that the Advisor paid the subadvisory fee to the Subadvisor, an affiliate of the Advisor, and that the Advisor had reimbursed a portion of the expenses of the Portfolio. Based upon its review, the Board concluded that the Advisor’s and its affiliates’ level of profitability from their relationship with the Portfolio was reasonable.
The Board considered the effect of the Portfolio's current size and potential growth on its performance and fees. Although the Portfolio’s advisory fee did not contain breakpoints that would reduce the advisory fee rate on assets above specified asset levels, the Board noted that if the Portfolio’s assets increased over time, the Portfolio might realize other economies of scale if assets increased proportionally more than certain other expenses. The Board also noted that given the Portfolio’s current level of assets, the Portfolio would be unlikely to recognize economies of scale by implementing a breakpoint in the advisory fee at this time.
In reapproving the Investment Advisory Agreement, the Board, including the disinterested Directors, did not identify any single factor as controlling, and each Director may have attributed different weight to various factors.
www.calvert.com CALVERT VP RUSSELL 2000 SMALL CAP INDEX PORTFOLIO ANNUAL REPORT (UNAUDITED) 63
In evaluating the Investment Subadvisory Agreement, the disinterested Directors reviewed information provided by the Subadvisor relating to its operations, personnel, investment philosophy, strategies and techniques. Among other information, the Subadvisor provided biographical information on portfolio management and other professional staff, performance information for itself, and descriptions of its investment philosophies, strategies and techniques, organizational and management structures and brokerage policies and practices.
The Board reapproved the Investment Subadvisory Agreement between the Subadvisor and the Advisor based on a number of factors relating to the Subadvisor's ability to perform under the Investment Subadvisory Agreement. In the course of its deliberations, the Board evaluated, among other factors: the nature, extent and the quality of the services to be provided by the Subadvisor; the Subadvisor's management style and long-term performance record; the Portfolio's performance record and the Subadvisor's performance in employing its investment strategies; the Subadvisor's current level of staffing and its overall resources; the qualifications and experience of the Subadvisor's personnel; the Subadvisor's financial condition with respect to its ability to perform the services required under the Investment Subadvisory Agreement; the Subadvisor's risk management processes; the Subadvisor's compliance systems, including those related to personal investing; and any disciplinary history. Based upon its review, the Board concluded that it was satisfied with the nature, extent and quality of services provided to the Portfolio by the Subadvisor under the Investment Subadvisory Agreement.
As noted above, the Board considered, among other information, the Portfolio's performance during the one-, three- and five-year periods ended June 30, 2015, as compared to the Portfolio's peer group and noted that it reviewed on a quarterly basis detailed information about the Portfolio's performance results, portfolio composition and investment strategies. The Board noted the Advisor's expertise and resources in monitoring the performance, investment style and risk adjusted performance of the Subadvisor.
In considering the cost of services to be provided by the Subadvisor and the profitability to the Subadvisor of its relationship with the Portfolio, the Board noted that the Advisor and Subadvisor were affiliated and the subadvisory fee under the Investment Subadvisory Agreement was paid by the Advisor out of the advisory fee that the Advisor received under the Investment Advisory Agreement. Based upon its review, the Board determined that the subadvisory fee was reasonable in view of the quality of services received by the Portfolio from the Subadvisor and the other factors considered. Because the Advisor would pay the Subadvisor’s subadvisory fee, the cost of services to be provided by the Subadvisor and the level of profitability to the Subadvisor from its relationship with the Portfolio were not material factors in the Board’s deliberations. For similar reasons, the Board did not consider the potential economies of scale in the Subadvisor’s management of the Portfolio to be a material factor in its consideration.
In reapproving the Investment Subadvisory Agreement, the Board, including the disinterested Directors, did not identify any single factor as controlling, and each Director may have attributed different weight to various factors.
Conclusions
The Board reached the following conclusions regarding the Investment Advisory Agreement and the Investment Subadvisory Agreement, among others: (a) the Advisor has demonstrated that it possesses the capability and resources to perform the duties required of it under the Investment Advisory Agreement; (b) the Subadvisor is qualified to manage the Portfolio's assets in accordance with the Portfolio’s investment objective and policies; (c) the Advisor and Subadvisor maintain appropriate compliance programs; (d) the Subadvisor is likely to execute its investment strategies consistently over time; (e) the performance of the Portfolio is satisfactory relative to the performance of passively-managed funds that track the same benchmark index as does the Portfolio; and (f) the Portfolio's advisory and subadvisory fees are reasonable in view of the quality of services received by the Portfolio from the Advisor and Subadvisor and the other factors considered. Based on its conclusions, the Board determined that reapproval of the Investment Advisory Agreement and the Investment Subadvisory Agreement would be in the best interests of the Portfolio and its shareholders.
64 www.calvert.com CALVERT VP RUSSELL 2000 SMALL CAP INDEX PORTFOLIO ANNUAL REPORT (UNAUDITED)
DIRECTOR AND OFFICER INFORMATION TABLE
|
| | | | | |
| Name & Age | Position with Fund | Position Start Date | Principal Occupation During Last 5 Years | # of Calvert Portfolios Overseen | Other Directorships |
| INDEPENDENT DIRECTORS |
FRANK H. BLATZ, JR., Esq. AGE: 80 | Director | 1982 CVS
2008 CVP | Of counsel to firm of Schiller & Pittenger, P.C. | 13 | None |
ALICE GRESHAM BULLOCK AGE: 65 | Director | 1999 CVS
2008 CVP | Professor at Howard University School of Law. She is former Dean of Howard University School of Law and Deputy Director of the Association of American Law Schools. | 15 | None |
M. CHARITO KRUVANT AGE: 70 | Director | 1999 CVS
2008 CVP | President and CEO of Creative Associates International, Inc., a firm that specializes in human resources development, information management, public affairs and private enterprise development. | 22 | • Acacia Federal Savings Bank (through 2013) • Summit Foundation • WETA Public Broadcasting |
CYNTHIA MILLIGAN AGE: 69
| Director | 1999 CVS
2008 CVP | Dean Emeritus, College of Business Administration, University of Nebraska, Lincoln. She is former President and Chief Executive Officer for CMA, a consulting firm for financial institutions. | 15 | • Wells Fargo Company (banking and financial services) - NYSE • Wells Fargo Bank N.A. (Since 2014) • Gallup, Inc. (management consulting) • W.K. Kellogg Foundation • Raven Industries (technology company) - NASDAQ • Colonial Williamsburg Foundation • Kellogg Company (food manufacturing) - NYSE |
ARTHUR J. PUGH AGE: 78 | Director | 1982 CVS
2008 CVP | Retired executive. | 13 | None |
| INTERESTED DIRECTORS |
WILLIAM LESTER* AGE: 58 | Director & Chair (CVS)
Director & Senior Vice President (CVP) | 2004 CVS
2008 CVP | Executive Vice President Finance/Investments and Corporate Treasurer of Ameritas Mutual Holding Company. Chair and former President (resigned 2012) of Ameritas Investment Partners, Inc. | 13 | • Acacia Federal Savings Bank (through 2013)• Ameritas Investment Partners, Inc. (financial services)• Ameritas Investment Corp. (financial services)• Universal and Inland Insurance Companies• Bryan/LGH Health Systems |
www.calvert.com CALVERT VP RUSSELL 2000 SMALL CAP INDEX PORTFOLIO ANNUAL REPORT (UNAUDITED) 65
|
| | | | | |
| Name & Age | Position with Fund | Position Start Date | Principal Occupation During Last 5 Years | # of Calvert Portfolios Overseen | Other Directorships |
| INTERESTED DIRECTORS |
JOHN H. STREUR* AGE: 56
| President (CVS)
Director, Chair & President (CVP) | 2015 | President and Chief Executive Officer of Calvert Investments, Inc. (since January 2015) and Chief Compliance Officer for the Advisor and Calvert Investment Distributors, Inc. (since August 10, 2015); President and Director, Portfolio 21 Investments, Inc. (through October 2014); President, Chief Executive Officer and Director, Managers Investment Group LLC (through January 2012); President and Director, The Managers Funds and Managers AMG Funds (through January 2012). | 40 | • Portfolio 21 Investments, Inc. (asset management)(through October 2014) • Managers Investment Group LLC (asset management)(through January 2012) • The Managers Funds (asset management) (through January 2012) • Managers AMG Funds (asset management) (through January 2012) • Calvert Social Investment Foundation |
|
| | | |
| Name & Age | Position with Fund | Position Start Date | Principal Occupation During Last 5 Years |
| OFFICERS |
VICKI L. BENJAMIN AGE: 54 | Treasurer | 2015 | Executive Vice President, Chief Financial Officer and Chief Operating Officer of Calvert Investments, Inc. since October 2015; Senior Vice President and Chief Financial Officer of Calvert Investments, Inc. (March 2015 - September 2015). Prior to Calvert, Ms. Benjamin was a Senior Partner at KPMG. |
ROBERT D. BENSON, ESQ. AGE: 37 | Assistant Vice President & Assistant Secretary | 2014 | Assistant General Counsel (since 2014), Assistant Vice President & Assistant Secretary (since 2015) and Staff Attorney (prior to 2014), Calvert Investments, Inc. |
HOPE BROWN AGE: 42 | Chief Compliance Officer | 2014 | Chief Compliance Officer for the Calvert Funds (since 2014). Vice President and Chief Compliance Officer, Wilmington Funds (2012-2014). Vice President and Senior Compliance Officer, Wilmington Trust Investment Advisors, Inc. (2010-2012). |
STU DALHEIM AGE: 46 | Vice President | 2015 | Vice President - Shareholder Advocacy for the Advisor. |
MATTHEW DUCH Age: 40 | Vice President | 2011 | Vice President of the Advisor and portfolio manager for Calvert’s taxable fixed-income funds. |
ROBERT J. ENDERSON, CFA AGE: 57 | Assistant Treasurer | 2014 | Vice President, Corporate Finance, of Calvert Investments, Inc.; Acting Chief Financial Officer of Calvert Investments, Inc. (September 2014 - March 2015). |
PATRICK FAUL AGE: 51 | Vice President | 2010 | Vice President and Head of Credit Research for the Advisor. |
TRACI L. GOLDT AGE: 42 | Assistant Secretary | 2004 | SEC Filing and Administrative Operations Manager, Calvert Investments, Inc. |
JADE HUANG AGE: 41 | Vice President | 2015 | Equity Portfolio Manager since November 2015 and Senior Equity Analyst prior to November 2015, Advisor. |
EMILY KAISER AGE: 32 | Assistant Vice President | 2015 | Senior Sustainability Analyst since November 2015 and Sustainability Analyst (January 2014 - October 2015), Advisor. Prior to joining Calvert, Ms. Kaiser attended law school from 2010 to 2013 and also held legal and policy positions with the U.S. Agency for International Development (2013), the Solidarity Center, AFL-CIO (2013), the U.S. Department of Labor (2012), the office of the U.S. Trade Representative (2012) and the Public International Law and Policy Group (2011-2012). |
VISHAL KHANDUJA, CFA AGE: 37 | Vice President | 2014 | Head of Taxable Fixed Income (since 2015) and Vice President of the Advisor (since 2014); Portfolio Manager for Calvert’s taxable fixed-income funds since 2012. Previously worked at Columbia Management as Portfolio Manager - Global Rates and Currency Team (2009-2012). |
66 www.calvert.com CALVERT VP RUSSELL 2000 SMALL CAP INDEX PORTFOLIO ANNUAL REPORT (UNAUDITED)
|
| | | |
| Name & Age | Position with Fund | Position Start Date | Principal Occupation During Last 5 Years |
| OFFICERS |
LANCELOT A. KING, ESQ. AGE: 45 | Assistant Vice President & Secretary | 2002 | Assistant Vice President, Assistant Secretary and Associate General Counsel of Calvert Investments, Inc. |
ERICA LASDON AGE: 44 | Assistant Vice President | 2015 | Director of Sustainability Research since August 2015 and Senior Sustainability Analyst and Manager prior to August 2015, Advisor. |
JOSHUA LINDER AGE: 30 | Vice President | 2015 | Equity Portfolio Manager since November 2015, Assistant Portfolio Manager (January 2014 - October 2015) and Equity Analyst (2011 - 2013), Advisor. |
CHRISTOPHER MADDEN AGE: 40 | Vice President | 2015 | Equity Portfolio Manager since November 2015 and Senior Equity Analyst prior to November 2015, Advisor. |
ANDREW K. NIEBLER, ESQ. AGE: 48 | Assistant Vice President & Assistant Secretary | 2006 | Assistant Vice President, Assistant Secretary and Associate General Counsel of Calvert Investments, Inc. |
MARYBETH PILAT, CPA AGE: 47 | Fund Controller and Assistant Treasurer | 2015 | Director of Fund Administration, Calvert Investment Administrative Services, Inc. since August 2015. VP Expense & Budgeting, Global Fiduciary Platform, Legg Mason (May 2015 - July 2015). Vice President and Assistant Treasurer, Columbia Funds, Ameriprise, Columbia Management (2010 - April 2015). |
| |
| * | The address of Directors and Officers is 4550 Montgomery Avenue, Suite 1000N, Bethesda, Maryland 20814. Mr. Streur is an interested person of the Fund since he is an officer and director of the Fund’s Advisor and its affiliates. Mr. Lester is an interested person of the Fund since he is an officer and director of the parent company of the Fund’s Advisor. |
Additional information about the Fund’s Directors can be found in the Statement of Additional Information (SAI). You can get a free copy of the SAI by contacting your broker, or the Fund at 1-800-368-2745.
www.calvert.com CALVERT VP RUSSELL 2000 SMALL CAP INDEX PORTFOLIO ANNUAL REPORT (UNAUDITED) 67
|
| |
| | |
This report is intended to provide fund information to shareholders. It is not authorized for distribution to prospective investors unless preceded or accompanied by a prospectus. Note: The information on our website is not incorporated by reference into this report; our website address is included as an inactive textual reference only. Investors should carefully consider the investment objectives, risks, charges and expenses of the Calvert Funds. This and other important information is contained in the fund’s summary prospectus and prospectus, which can be obtained from your financial professional and should be read carefully before investing. You may also call Calvert at 800/368-2745. |
| Printed on recycled paper using soy inks. | |
|
| |
|
Calvert VP EAFE International Index Portfolio |
Annual Report December 31, 2015 | |
|
| | | | |
| | TABLE OF CONTENTS |
| | | | | |
| | | | | Portfolio Management Discussion |
| | | | | Understanding Your Fund's Expenses |
| | | | | Report of Independent Registered Public Accounting Firm |
| | | | | Schedule of Investments |
| | | | | Statement of Assets and Liabilities |
| | | | | Statement of Operations |
| | | | | Statements of Changes in Net Assets |
| | | | | Notes to Financial Statements |
| | | | | Financial Highlights |
| | | | | Proxy Voting |
| | | | | Availability of Quarterly Portfolio Holdings |
| | | | | Basis for Board’s Approval of Investment Advisory Contracts |
| | | | | Director and Officer Information Table |
|
| |
| PORTFOLIO MANAGEMENT DISCUSSION |
|
| |
| Theodore D. Miller Vice President, World Asset Management, Inc. |
Market Review
International equity environment for 2015 was slightly weaker as the low interest rate environment and global deflationary trends drove international economic growth lower especially in the natural resource producing countries. Developed Markets experienced a rising first half of the year only to spend the second half of the year giving back all of the gains as energy and metals stocks showed severe weakness. Despite the commodity deflation worries, a strengthening US Dollar has helped to make foreign products look more attractive relative to US importers and helped foreign profit margins. In emerging markets, China continued to show weakening growth and investors are increasingly looking at a hard landing in the equity markets there.
Investment Strategy and Technique:
The Calvert VP EAFE International Index Fund (“Fund”) seeks to match as closely as possible, before fees and expenses, the performance of the Morgan Stanley Capital International (MSCI) EAFE Free Index (“MSCI Index”). As an index fund, the Fund uses a passive management buy and hold approach. All investment decisions are based on the goal of producing returns equivalent to the index.
Fund Performance Relative to the Benchmark
Foreign stock markets had flat absolute returns for the year, slightly weaker than the US S&P 500 Index. The Fund posted a -1.61% return for the year, compared to the -0.39% return for the MSCI EAFE Index. There were 21 countries in the EAFE universe as of December 31. Japan and the U.K. were the most heavily weighted, with weights of 23.4% and 19.3% respectively, accounting for 42.7% of the Index. The strongest returns for 2015 came from Denmark, Ireland and Belgium. Singapore, Spain and Norway were the least performing countries in the EAFE universe. For the year, the strongest sector returns were in the Consumer Staples sector, followed by Health Care and Consumer Discretionary. The weakest sectors were Energy, Materials and Information Technology.
|
| | | |
| ECONOMIC SECTORS | % OF TOTAL INVESTMENTS | |
| Financials | 25.3 | % | |
| Consumer Discretionary | 13.1 | % | |
| Industrials | 12.5 | % | |
| Health Care | 11.8 | % | |
| Consumer Staples | 11.7 | % | |
| Materials | 6.3 | % | |
| Information Technology | 5.3 | % | |
| Telecommunication Services | 4.9 | % | |
| Energy | 4.5 | % | |
| Utilities | 3.7 | % | |
| Exchange-Traded Products | 0.9 | % | |
| Total | 100.0 | % | |
| | | |
| TEN LARGEST STOCK HOLDINGS | % OF NET ASSETS | |
| Nestle SA | 1.9 | % | |
| Novartis AG | 1.6 | % | |
| Roche Holding AG | 1.6 | % | |
| Toyota Motor Corp. | 1.3 | % | |
| HSBC Holdings plc | 1.2 | % | |
| Novo Nordisk A/S | 0.9 | % | |
| Commonwealth Bank of Australia | 0.8 | % | |
| Bayer AG | 0.8 | % | |
| British American Tobacco plc | 0.8 | % | |
| Sanofi SA | 0.8 | % | |
| Total | 11.7 | % | |
| | | |
Positioning and Market Outlook
We expect a volatile 2016 in the financial markets emanating from inconsistent economic growth in the United States, Europe and Asia. The US Federal Reserve desire to raise rates may lead to four more raises in 2016 however market volatility may mitigate that number. Continued high levels of oil production and storage will keep a lid on oil and gasoline prices globally and resulting lower prices will eventually help increase consumer and investor confidence.
www.calvert.com CALVERT VP EAFE INTERNATIONAL INDEX PORTFOLIO ANNUAL REPORT (UNAUDITED) 1
We do however see a mixed environment internationally with increasing volatility in the European and Asian equity markets as Arab, Chinese and Russian geopolitical concerns and revalued Chinese equities cause markets to swing.
World Asset Management, Inc.
December 2015
2 www.calvert.com CALVERT VP EAFE INTERNATIONAL INDEX PORTFOLIO ANNUAL REPORT (UNAUDITED)
Growth of $10,000
The graph below shows the value of a hypothetical $10,000 investment in the Portfolio over the past 10 fiscal year periods. The results shown are for Class I shares, and assume the reinvestment of dividends. The result is compared with a broad based market index. Market indexes are unmanaged and their results do not reflect the effect of expenses or sales charges. The value of an investment in a different share class would be different.
|
| | | | | | |
| CALVERT VP EAFE INTERNATIONAL INDEX PORTFOLIO |
| DECEMBER 31, 2015 |
| AVERAGE ANNUAL TOTAL RETURNS | 1 Year | 5 Year | 10 Year |
| Class I | -1.61 | % | 2.62 | % | 2.10 | % |
| Class F | -1.84 | % | 2.40 | % | 1.87 | % |
| MSCI EAFE Index | -0.39 | % | 4.07 | % | 3.50 | % |
| | | | |
| Class F share performance prior to October 1, 2007 is based on Class I performance, adjusted to reflect Class F expenses. |
| | | | |
The performance data shown represents past performance, does not guarantee future results and assumes reinvestment of all dividends and distributions. All performance data reflects fee waivers and/or expense limitations, if any are in effect; in their absence performance would be lower. See Note B in Notes to Financial Statements. The investment return and principal value of an investment will fluctuate so that an investor’s shares, when redeemed, may be worth more or less than their original cost. Current performance may be lower or higher than the performance data quoted.
Visit calvert.com/institutional-VP-performance.html for current performance data. The gross expense ratio from the current prospectus for the Portfolio is 0.99%. This number may vary from the expense ratio shown elsewhere in this report because it is based on a different time period and, if applicable, does not include fee or expense waivers. The performance data and expense ratio reflect deduction of Portfolio operating expenses, but do not reflect charges and expenses imposed under the variable annuity or life insurance contract.
www.calvert.com CALVERT VP EAFE INTERNATIONAL INDEX PORTFOLIO ANNUAL REPORT (UNAUDITED) 3
UNDERSTANDING YOUR FUND'S EXPENSES
As an investor, you incur two types of costs. There are transaction costs. There are also ongoing costs, which generally include management fees, distribution and/or service fees, and other fund expenses. The following information is intended to help you understand your ongoing costs (in dollars) of investing in this mutual fund and to help you compare these costs with the ongoing costs of investing in other mutual funds.
To illustrate these ongoing costs, we have provided examples and calculated the expenses paid by the fund's investors during the period. The actual and hypothetical information presented in the examples is based on an investment of $1,000 invested at the beginning of the period and held for the entire period (July 1, 2015 to December 31, 2015).
Note: Expenses do not reflect charges and expenses of the variable annuity or variable universal life contract.
Actual Expenses
The first line of the table below provides information about actual account values and actual expenses. You may use the information in this line, together with the amount you invested, to estimate the expenses that you paid over the period. Simply divide your account value by $1,000 (for example, an $8,600 account value divided by $1,000 = 8.6), then multiply the result by the number in the first line under the heading entitled “Expenses Paid During Period” to estimate the expenses you paid on your account during this period.
Hypothetical Example for Comparison Purposes
The second line of the table below provides information about hypothetical account values and hypothetical expenses based on the Fund’s actual expense ratio and an assumed rate of return of 5% per year before expenses, which is not the Fund’s actual return. The hypothetical account values and expenses may not be used to estimate the actual ending account balance or expenses you paid for the period. You may use this information to compare the ongoing costs of investing in the Fund and other funds. To do so, compare the 5% hypothetical example with the 5% hypothetical examples that appear in the shareholder reports of the other funds.
Please note that the expenses shown in the table are meant to highlight your ongoing costs only and do not reflect any transactional costs. Therefore, the second line of the table is useful in comparing ongoing costs only, and will not help you determine the relative total costs of owning different funds. In addition, if these transactional costs were included, your costs would have been higher.
|
| | | | |
| | ANNUALIZED
EXPENSE RATIO | BEGINNING
ACCOUNT VALUE
7/1/15 | ENDING
ACCOUNT VALUE
12/31/15 | EXPENSES PAID
DURING PERIOD*
7/1/15 - 12/31/15 |
| Class I | | | | |
| Actual | 0.99% | $1,000.00 | $927.80 | $4.81 |
| Hypothetical (5% return per year before expenses) | 0.99% | $1,000.00 | $1,020.22 | $5.04 |
| Class F | | | | |
| Actual | 1.19% | $1,000.00 | $926.90 | $5.78 |
| Hypothetical (5% return per year before expenses) | 1.19% | $1,000.00 | $1,019.21 | $6.06 |
| |
| * Expenses paid during the period are equal to the annualized expense ratio for each class as indicated above, multiplied by the average account value over the period, multiplied by 184/365 (to reflect the one-half year period). Expense ratios shown in the Financial Highlights represent the actual expenses incurred for the fiscal year. |
4 www.calvert.com CALVERT VP EAFE INTERNATIONAL INDEX PORTFOLIO ANNUAL REPORT (UNAUDITED)
REPORT OF INDEPENDENT REGISTERED PUBLIC ACCOUNTING FIRM
The Board of Directors of Calvert Variable Products, Inc. and Shareholders of Calvert VP EAFE International Index Portfolio:
We have audited the accompanying statement of assets and liabilities, including the schedule of investments, of the Calvert VP EAFE International Index Portfolio (the “Portfolio”), a series of Calvert Variable Products, Inc., as of December 31, 2015, and the related statement of operations for the year then ended, the statements of changes in net assets for each of the years in the two-year period then ended, and the financial highlights for each of the years in the five-year period then ended. These financial statements and financial highlights are the responsibility of the Portfolio’s management. Our responsibility is to express an opinion on these financial statements and financial highlights based on our audits.
We conducted our audits in accordance with the standards of the Public Company Accounting Oversight Board (United States). Those standards require that we plan and perform the audit to obtain reasonable assurance about whether the financial statements and financial highlights are free of material misstatement. An audit includes examining, on a test basis, evidence supporting the amounts and disclosures in the financial statements. Our procedures included confirmation of securities owned as of December 31, 2015, by correspondence with the custodian and brokers or by performing other appropriate auditing procedures. An audit also includes assessing the accounting principles used and significant estimates made by management, as well as evaluating the overall financial statement presentation. We believe that our audits provide a reasonable basis for our opinion.
In our opinion, the financial statements and financial highlights referred to above present fairly, in all material respects, the financial position of the Portfolio as of December 31, 2015, the results of its operations for the year then ended, the changes in its net assets for each of the years in the two-year period then ended, and the financial highlights for each of the years in the five-year period then ended, in conformity with U.S. generally accepted accounting principles.
Philadelphia, Pennsylvania
February 24, 2016
www.calvert.com CALVERT VP EAFE INTERNATIONAL INDEX PORTFOLIO ANNUAL REPORT 5
CALVERT VP EAFE INTERNATIONAL INDEX PORTFOLIO
SCHEDULE OF INVESTMENTS
DECEMBER 31, 2015
|
| | | |
| | SHARES | VALUE ($) |
| COMMON STOCKS - 98.2% | | |
| Australia - 6.7% | | |
| AGL Energy Ltd. (c) | 8,593 | 112,363 |
|
| Alumina Ltd. (c) | 33,251 | 27,700 |
|
| Amcor Ltd. (c) | 15,024 | 146,169 |
|
| AMP Ltd. (c) | 37,669 | 158,794 |
|
| APA Group (c) | 14,191 | 89,153 |
|
| Aristocrat Leisure Ltd. (c) | 7,049 | 52,095 |
|
| Asciano Ltd. (c) | 8,074 | 51,369 |
|
| ASX Ltd. (c) | 2,505 | 76,853 |
|
| Aurizon Holdings Ltd. (c) | 27,026 | 85,951 |
|
| AusNet Services (c) | 22,548 | 24,224 |
|
| Australia & New Zealand Banking Group Ltd. (c) | 36,621 | 739,048 |
|
| Bank of Queensland Ltd. (c) | 4,831 | 48,673 |
|
| Bendigo & Adelaide Bank Ltd. (c) | 5,936 | 51,296 |
|
| BGP Holdings plc (a)(c) | 77,172 | — |
|
| BHP Billiton Ltd. (c) | 40,904 | 531,356 |
|
| Boral Ltd. (c) | 9,943 | 42,535 |
|
| Brambles Ltd. (c) | 19,957 | 167,002 |
|
| Caltex Australia Ltd. (c) | 3,495 | 95,161 |
|
| Challenger Ltd. (c) | 7,256 | 45,742 |
|
| CIMIC Group Ltd. (c) | 1,337 | 23,467 |
|
| Coca-Cola Amatil Ltd. (c) | 7,293 | 49,153 |
|
| Cochlear Ltd. (c) | 728 | 50,416 |
|
| Commonwealth Bank of Australia (c) | 21,630 | 1,336,320 |
|
| Computershare Ltd. (c) | 6,021 | 50,751 |
|
| Crown Resorts Ltd. (c) | 4,794 | 43,308 |
|
| CSL Ltd. (c) | 5,920 | 451,359 |
|
| Dexus Property Group REIT (c) | 12,428 | 67,391 |
|
| DUET Group (c) | 29,563 | 48,988 |
|
| Flight Centre Travel Group Ltd. (c) | 729 | 21,008 |
|
| Fortescue Metals Group Ltd. (c) | 20,497 | 27,645 |
|
| Goodman Group REIT (c) | 22,692 | 102,737 |
|
| GPT Group (The) REIT (c) | 22,639 | 78,252 |
|
| Harvey Norman Holdings Ltd. (c) | 7,311 | 22,094 |
|
| Healthscope Ltd. (c) | 22,098 | 42,605 |
|
| Iluka Resources Ltd. (c) | 5,512 | 24,390 |
|
| Incitec Pivot Ltd. (c) | 21,789 | 62,302 |
|
| Insurance Australia Group Ltd. (c) | 30,966 | 124,410 |
|
| Lend Lease Group (c) | 7,138 | 73,627 |
|
| Macquarie Group Ltd. (c) | 3,823 | 228,449 |
|
| Medibank Pvt Ltd. (c) | 35,649 | 55,566 |
|
| Mirvac Group REIT (c) | 47,863 | 68,491 |
|
| National Australia Bank Ltd. (c) | 33,440 | 728,990 |
|
| Newcrest Mining Ltd.* (c) | 9,922 | 93,793 |
|
| Oil Search Ltd. (c) | 17,453 | 85,448 |
|
| Orica Ltd. (c) | 4,797 | 53,660 |
|
| Origin Energy Ltd. (c) | 22,575 | 76,046 |
|
6 www.calvert.com CALVERT VP EAFE INTERNATIONAL INDEX PORTFOLIO ANNUAL REPORT
|
| | | |
| | SHARES | VALUE ($) |
| COMMON STOCKS - Cont'd | | |
| Platinum Asset Management Ltd. (c) | 3,064 | 17,893 |
|
| Qantas Airways Ltd.* (c) | 6,788 | 20,130 |
|
| QBE Insurance Group Ltd. (c) | 17,438 | 158,644 |
|
| Ramsay Health Care Ltd. (c) | 1,801 | 88,565 |
|
| REA Group Ltd. (c) | 693 | 27,557 |
|
| Rio Tinto Ltd. (c) | 5,402 | 174,290 |
|
| Santos Ltd. (c) | 21,360 | 56,533 |
|
| Scentre Group REIT (c) | 67,810 | 205,503 |
|
| Seek Ltd. (c) | 4,281 | 47,600 |
|
| Sonic Healthcare Ltd. (c) | 4,943 | 64,048 |
|
| South32 Ltd.* (c) | 68,913 | 52,867 |
|
| Stockland REIT (c) | 30,571 | 90,757 |
|
| Suncorp Group Ltd. (c) | 16,386 | 143,468 |
|
| Sydney Airport (c) | 14,056 | 64,668 |
|
| TABCORP Holdings Ltd. (c) | 10,920 | 37,239 |
|
| Tatts Group Ltd. (c) | 19,034 | 60,451 |
|
| Telstra Corp. Ltd. (c) | 54,497 | 221,123 |
|
| TPG Telecom Ltd. (c) | 3,657 | 26,144 |
|
| Transurban Group (c) | 25,737 | 195,417 |
|
| Treasury Wine Estates Ltd. (c) | 9,400 | 56,429 |
|
| Vicinity Centres REIT (c) | 43,556 | 88,268 |
|
| Wesfarmers Ltd. (c) | 14,312 | 430,602 |
|
| Westfield Corp. REIT (c) | 25,143 | 172,971 |
|
| Westpac Banking Corp. (c) | 42,313 | 1,025,643 |
|
| Woodside Petroleum Ltd. (c) | 9,444 | 198,072 |
|
| Woolworths Ltd. (c) | 16,131 | 285,465 |
|
| | | 10,646,497 |
|
| | | |
| Austria - 0.2% | | |
| Andritz AG (c) | 1,020 | 49,433 |
|
| Erste Group Bank AG* (c) | 3,558 | 111,107 |
|
| OMV AG (c) | 1,875 | 52,593 |
|
| Raiffeisen Bank International AG* (c) | 1,542 | 22,542 |
|
| Voestalpine AG (c) | 1,475 | 45,104 |
|
| | | 280,779 |
|
| | | |
| Belgium - 1.4% | | |
| Ageas SA/NV (c) | 2,565 | 118,792 |
|
| Anheuser-Busch InBev NV (c) | 10,241 | 1,263,972 |
|
| Colruyt SA (c) | 925 | 47,470 |
|
| Delhaize Group SA (c) | 1,321 | 128,569 |
|
| Groupe Bruxelles Lambert SA (c) | 1,044 | 89,187 |
|
| KBC Groep NV (c) | 3,192 | 199,417 |
|
| Proximus (c) | 1,968 | 63,795 |
|
| Solvay SA (c) | 767 | 81,441 |
|
| Telenet Group Holding NV* (c) | 691 | 37,209 |
|
| UCB SA (c) | 1,610 | 144,799 |
|
| Umicore SA (c) | 1,212 | 50,621 |
|
| | | 2,225,272 |
|
| | | |
www.calvert.com CALVERT VP EAFE INTERNATIONAL INDEX PORTFOLIO ANNUAL REPORT 7
|
| | | |
| | SHARES | VALUE ($) |
| COMMON STOCKS - Cont'd | | |
| Denmark - 1.9% | | |
| AP Moeller - Maersk A/S: | | |
| Class A (c) | 49 | 62,932 |
|
| Class B (c) | 88 | 114,174 |
|
| Carlsberg A/S Class B (c) | 1,362 | 120,321 |
|
| Chr Hansen Holding A/S (c) | 1,259 | 78,683 |
|
| Coloplast A/S Class B (c) | 1,414 | 114,039 |
|
| Danske Bank A/S (c) | 8,992 | 240,030 |
|
| DSV A/S (c) | 2,451 | 96,207 |
|
| ISS A/S (c) | 1,891 | 68,148 |
|
| Novo Nordisk A/S Class B (c) | 24,955 | 1,433,233 |
|
| Novozymes A/S Class B (c) | 2,971 | 142,147 |
|
| Pandora A/S (c) | 1,401 | 176,638 |
|
| TDC A/S (c) | 10,510 | 52,094 |
|
| Tryg A/S (c) | 1,475 | 29,269 |
|
| Vestas Wind Systems A/S (c) | 2,853 | 199,025 |
|
| William Demant Holding A/S* (c) | 317 | 30,080 |
|
| | | 2,957,020 |
|
| | | |
| Finland - 0.9% | | |
| Elisa Oyj (c) | 1,841 | 69,179 |
|
| Fortum Oyj (c) | 5,749 | 86,105 |
|
| Kone Oyj Class B (c) | 4,290 | 180,225 |
|
| Metso Oyj (c) | 1,484 | 33,016 |
|
| Neste Oyj (c) | 1,632 | 48,622 |
|
| Nokia Oyj (c) | 46,847 | 333,229 |
|
| Nokian Renkaat Oyj (c) | 1,493 | 52,988 |
|
| Orion Oyj, Class B (c) | 1,325 | 45,638 |
|
| Sampo Oyj, Class A (c) | 5,693 | 288,317 |
|
| Stora Enso Oyj, Class R (c) | 7,125 | 64,022 |
|
| UPM-Kymmene Oyj (c) | 6,797 | 125,782 |
|
| Wartsila Oyj Abp (c) | 1,914 | 86,721 |
|
| | | 1,413,844 |
|
| | | |
| France - 9.2% | | |
| Accor SA (c) | 2,703 | 116,497 |
|
| Aeroports de Paris (c) | 390 | 45,181 |
|
| Air Liquide SA (c) | 4,381 | 491,639 |
|
| Alcatel-Lucent* | 35,975 | 142,582 |
|
| Alstom SA* (c) | 2,807 | 85,713 |
|
| Arkema SA (c) | 862 | 60,240 |
|
| Atos SE (c) | 1,127 | 94,577 |
|
| AXA SA (c) | 24,911 | 680,469 |
|
| BNP Paribas SA (c) | 13,490 | 762,955 |
|
| Bollore SA (c) | 11,052 | 51,464 |
|
| Bouygues SA (c) | 2,581 | 102,213 |
|
| Bureau Veritas SA (c) | 3,432 | 68,242 |
|
| Cap Gemini SA (c) | 2,083 | 192,576 |
|
| Carrefour SA (c) | 7,053 | 202,932 |
|
| Casino Guichard-Perrachon SA (c) | 744 | 34,148 |
|
| Christian Dior SE (c) | 694 | 117,791 |
|
| Cie de Saint-Gobain (c) | 6,182 | 265,721 |
|
8 www.calvert.com CALVERT VP EAFE INTERNATIONAL INDEX PORTFOLIO ANNUAL REPORT
|
| | | |
| | SHARES | VALUE ($) |
| COMMON STOCKS - Cont'd | | |
| Cie Generale des Etablissements Michelin (c) | 2,375 | 225,314 |
|
| CNP Assurances (c) | 2,259 | 30,401 |
|
| Credit Agricole SA (c) | 13,339 | 157,012 |
|
| Danone SA (c) | 7,500 | 505,736 |
|
| Dassault Systemes (c) | 1,626 | 129,986 |
|
| Edenred (c) | 2,711 | 51,036 |
|
| Electricite de France SA (c) | 3,129 | 45,928 |
|
| Engie (c) | 18,609 | 329,064 |
|
| Essilor International SA (c) | 2,615 | 325,705 |
|
| Eurazeo SA (c) | 526 | 36,170 |
|
| Eutelsat Communications SA (c) | 2,168 | 64,690 |
|
| Fonciere Des Regions REIT (c) | 394 | 35,242 |
|
| Gecina SA REIT (c) | 454 | 55,035 |
|
| Groupe Eurotunnel SE (c) | 6,051 | 75,032 |
|
| Hermes International (c) | 336 | 113,193 |
|
| Icade SA REIT (c) | 435 | 29,180 |
|
| Iliad SA (c) | 335 | 79,858 |
|
| Imerys SA (c) | 465 | 32,411 |
|
| Ingenico Group (c) | 710 | 89,670 |
|
| JC Decaux SA (c) | 961 | 36,754 |
|
| Kering (c) | 964 | 164,181 |
|
| Klepierre REIT (c) | 2,802 | 124,155 |
|
| L'Oreal SA (c) | 3,207 | 539,101 |
|
| Lagardere SCA (c) | 1,553 | 46,168 |
|
| Legrand SA (c) | 3,387 | 191,007 |
|
| LVMH Moet Hennessy Louis Vuitton SE (c) | 3,558 | 555,749 |
|
| Natixis SA (c) | 12,114 | 68,417 |
|
| Numericable-SFR SAS (c) | 1,395 | 50,608 |
|
| Orange SA (c) | 25,302 | 424,123 |
|
| Pernod-Ricard SA (c) | 2,704 | 307,166 |
|
| Peugeot SA* (c) | 5,600 | 98,108 |
|
| Publicis Groupe SA (c) | 2,406 | 159,444 |
|
| Remy Cointreau SA (c) | 320 | 22,895 |
|
| Renault SA (c) | 2,448 | 245,197 |
|
| Rexel SA (c) | 3,820 | 50,671 |
|
| Safran SA (c) | 3,717 | 254,353 |
|
| Sanofi SA (c) | 15,041 | 1,282,322 |
|
| Schneider Electric SE (c) | 7,109 | 404,422 |
|
| SCOR SE (c) | 1,988 | 74,308 |
|
| Societe BIC SA (c) | 366 | 60,172 |
|
| Societe Generale SA (c) | 9,239 | 425,819 |
|
| Sodexo SA (c) | 1,200 | 116,638 |
|
| Suez Environnement Co. (c) | 3,852 | 72,015 |
|
| Technip SA (c) | 1,349 | 66,580 |
|
| Thales SA (c) | 1,332 | 99,726 |
|
| Total SA (c) | 27,674 | 1,231,464 |
|
| Unibail-Rodamco SE REIT (c) | 1,255 | 317,947 |
|
| Valeo SA (c) | 1,012 | 156,108 |
|
| Veolia Environnement SA (c) | 5,729 | 135,683 |
|
www.calvert.com CALVERT VP EAFE INTERNATIONAL INDEX PORTFOLIO ANNUAL REPORT 9
|
| | | |
| | SHARES | VALUE ($) |
| COMMON STOCKS - Cont'd | | |
| Vinci SA (c) | 6,093 | 390,415 |
|
| Vivendi SA (c) | 14,805 | 318,537 |
|
| Wendel SA (c) | 375 | 44,506 |
|
| Zodiac Aerospace (c) | 2,568 | 61,158 |
|
| | | 14,521,520 |
|
| Germany - 8.5% | | |
| adidas AG (c) | 2,664 | 259,371 |
|
| Allianz SE (c) | 5,820 | 1,030,192 |
|
| Axel Springer SE (c) | 582 | 32,339 |
|
| BASF SE (c) | 11,697 | 893,492 |
|
| Bayer AG (c) | 10,532 | 1,320,264 |
|
| Bayerische Motoren Werke AG (c) | 4,216 | 443,655 |
|
| Beiersdorf AG (c) | 1,283 | 116,618 |
|
| Brenntag AG (c) | 1,967 | 102,577 |
|
| Commerzbank AG* (c) | 13,557 | 140,246 |
|
| Continental AG (c) | 1,401 | 339,763 |
|
| Daimler AG (c) | 12,262 | 1,022,664 |
|
| Deutsche Bank AG (c) | 17,566 | 430,785 |
|
| Deutsche Boerse AG (c) | 2,458 | 217,267 |
|
| Deutsche Lufthansa AG* (c) | 3,046 | 48,062 |
|
| Deutsche Post AG (c) | 12,340 | 347,226 |
|
| Deutsche Telekom AG (c) | 41,097 | 742,985 |
|
| Deutsche Wohnen AG (c) | 4,296 | 119,483 |
|
| E.ON SE (c) | 25,484 | 246,425 |
|
| Evonik Industries AG (c) | 1,809 | 59,980 |
|
| Fraport AG Frankfurt Airport Services Worldwide (c) | 543 | 34,618 |
|
| Fresenius Medical Care AG & Co. KGaA (c) | 2,783 | 234,278 |
|
| Fresenius SE & Co. KGaA (c) | 4,858 | 347,102 |
|
| GEA Group AG (c) | 2,329 | 93,772 |
|
| Hannover Rueck SE (c) | 767 | 87,840 |
|
| HeidelbergCement AG (c) | 1,794 | 146,236 |
|
| Henkel AG & Co. KGaA (c) | 1,323 | 126,853 |
|
| Hugo Boss AG (c) | 865 | 71,975 |
|
| Infineon Technologies AG (c) | 14,382 | 210,289 |
|
| K+S AG (c) | 2,477 | 64,348 |
|
| Kabel Deutschland Holding AG (c) | 291 | 35,933 |
|
| Lanxess AG (c) | 1,184 | 54,468 |
|
| Linde AG (c) | 2,365 | 343,003 |
|
| MAN SE (c) | 448 | 45,287 |
|
| Merck KGAA (c) | 1,646 | 159,748 |
|
| Metro AG (c) | 2,307 | 73,572 |
|
| Muenchener Rueckversicherungs-Gesellschaft AG (c) | 2,124 | 425,030 |
|
| OSRAM Licht AG (c) | 1,151 | 48,391 |
|
| ProSiebenSat.1 Media AG (c) | 2,786 | 140,810 |
|
| RTL Group SA* (c) | 509 | 42,479 |
|
| RWE AG (c) | 6,334 | 80,670 |
|
| SAP SE (c) | 12,517 | 996,168 |
|
| Siemens AG (c) | 10,098 | 978,907 |
|
| Symrise AG (c) | 1,570 | 104,062 |
|
| Telefonica Deutschland Holding AG (c) | 7,832 | 41,778 |
|
| ThyssenKrupp AG (c) | 4,685 | 92,832 |
|
| TUI AG (c) | 6,350 | 112,677 |
|
10 www.calvert.com CALVERT VP EAFE INTERNATIONAL INDEX PORTFOLIO ANNUAL REPORT
|
| | | |
| | SHARES | VALUE ($) |
| COMMON STOCKS - Cont'd | | |
| United Internet AG (c) | 1,592 | 87,473 |
|
| Volkswagen AG (c) | 450 | 69,274 |
|
| Vonovia SE (c) | 5,935 | 183,683 |
|
| Zalando SE(b)(c) | 1,100 | 43,418 |
|
| | | 13,490,368 |
|
| | | |
| Hong Kong - 3.1% | | |
| AIA Group Ltd. (c) | 153,436 | 914,015 |
|
| ASM Pacific Technology Ltd. (c) | 3,164 | 24,771 |
|
| Bank of East Asia Ltd. (The) (c) | 14,997 | 55,517 |
|
| BOC Hong Kong Holdings Ltd. (c) | 47,129 | 142,687 |
|
| Cathay Pacific Airways Ltd. (c) | 15,537 | 26,753 |
|
| Cheung Kong Infrastructure Holdings Ltd. (c) | 8,022 | 73,836 |
|
| Cheung Kong Property Holdings Ltd. (c) | 34,409 | 223,497 |
|
| CK Hutchison Holdings Ltd. (c) | 34,409 | 460,909 |
|
| CLP Holdings Ltd. (c) | 24,132 | 205,086 |
|
| First Pacific Co. Ltd. (c) | 31,118 | 20,610 |
|
| Galaxy Entertainment Group Ltd. (c) | 30,294 | 94,446 |
|
| Genting Singapore plc (c) | 78,217 | 42,185 |
|
| Hang Lung Properties Ltd. (c) | 29,030 | 65,836 |
|
| Hang Seng Bank Ltd. (c) | 9,739 | 185,307 |
|
| Henderson Land Development Co. Ltd. (c) | 14,952 | 91,010 |
|
| HK Electric Investments & HK Electric Investments Ltd. (c) | 33,761 | 28,280 |
|
| HKT Trust & HKT Ltd. (c) | 34,891 | 44,495 |
|
| Hong Kong & China Gas Co. Ltd. (c) | 88,352 | 173,287 |
|
| Hong Kong Exchanges and Clearing Ltd. (c) | 14,523 | 369,010 |
|
| Hongkong Land Holdings Ltd. (c) | 14,982 | 104,478 |
|
| Hysan Development Co. Ltd. (c) | 8,404 | 34,395 |
|
| Kerry Properties Ltd. (c) | 8,558 | 23,351 |
|
| Li & Fung Ltd. (c) | 77,050 | 52,088 |
|
| Link REIT (c) | 28,742 | 172,007 |
|
| Melco Crown Entertainment Ltd. ADR | 2,423 | 40,706 |
|
| MGM China Holdings Ltd. (c) | 12,507 | 15,513 |
|
| MTR Corp. Ltd. (c) | 18,897 | 93,346 |
|
| New World Development Co. Ltd. (c) | 69,822 | 68,594 |
|
| Noble Group Ltd. (c) | 61,959 | 17,246 |
|
| NWS Holdings Ltd. (c) | 19,706 | 29,182 |
|
| PCCW Ltd. (c) | 53,970 | 31,613 |
|
| Power Assets Holdings Ltd. (c) | 17,668 | 162,650 |
|
| Sands China Ltd. (c) | 30,830 | 103,872 |
|
| Shangri-La Asia Ltd. (c) | 16,395 | 16,067 |
|
| Sino Land Co. Ltd. (c) | 39,600 | 57,800 |
|
| SJM Holdings Ltd. (c) | 26,062 | 18,588 |
|
| Sun Hung Kai Properties Ltd. (c) | 21,982 | 264,222 |
|
| Swire Pacific Ltd., Class A (c) | 7,493 | 84,135 |
|
| Swire Properties Ltd. (c) | 15,404 | 44,172 |
|
| Techtronic Industries Co. Ltd. (c) | 17,786 | 72,245 |
|
| WH Group Ltd.(b)(c) | 76,670 | 42,393 |
|
| Wharf Holdings Ltd. (The) (c) | 17,371 | 96,208 |
|
www.calvert.com CALVERT VP EAFE INTERNATIONAL INDEX PORTFOLIO ANNUAL REPORT 11
|
| | | |
| | SHARES | VALUE ($) |
| COMMON STOCKS - Cont'd | | |
| Wheelock & Co. Ltd. (c) | 11,644 | 49,073 |
|
| Wynn Macau Ltd. (c) | 20,521 | 23,783 |
|
| Yue Yuen Industrial Holdings Ltd. (c) | 9,769 | 33,122 |
|
| | | 4,992,386 |
|
| | | |
| Ireland - 0.9% | | |
| Bank of Ireland* (c) | 350,353 | 128,297 |
|
| CRH plc (c) | 10,471 | 302,415 |
|
| Experian plc (c) | 12,392 | 219,010 |
|
| James Hardie Industries plc (c) | 5,822 | 73,445 |
|
| Kerry Group plc Class A (c) | 2,015 | 166,613 |
|
| Ryanair Holdings plc (c) | 2,214 | 35,804 |
|
| Shire plc (c) | 7,540 | 516,833 |
|
| | | 1,442,417 |
|
| | | |
| Israel - 0.8% | | |
| Azrieli Group (c) | 476 | 17,725 |
|
| Bank Hapoalim BM (c) | 13,522 | 69,837 |
|
| Bank Leumi Le-Israel BM* (c) | 17,831 | 61,851 |
|
| Bezeq The Israeli Telecommunication Corp. Ltd. (c) | 25,255 | 55,579 |
|
| Check Point Software Technologies Ltd.* | 1,727 | 140,543 |
|
| Delek Group Ltd. (c) | 61 | 12,214 |
|
| Israel Chemicals Ltd. (c) | 6,654 | 26,980 |
|
| Mizrahi Tefahot Bank Ltd. (c) | 1,822 | 21,756 |
|
| Mobileye NV* | 2,069 | 87,477 |
|
| NICE-Systems Ltd. (c) | 734 | 42,113 |
|
| Taro Pharmaceutical Industries Ltd.* | 190 | 29,365 |
|
| Teva Pharmaceutical Industries Ltd. (c) | 11,656 | 765,071 |
|
| | | 1,330,511 |
|
| | | |
| Italy - 2.1% | | |
| Assicurazioni Generali SpA (c) | 14,871 | 271,676 |
|
| Atlantia SpA (c) | 5,258 | 139,150 |
|
| Banca Monte dei Paschi di Siena SpA* (c) | 33,151 | 43,747 |
|
| Banco Popolare SC* (c) | 4,688 | 64,231 |
|
| Enel Green Power SpA (c) | 22,288 | 45,129 |
|
| Enel SpA (c) | 89,821 | 375,390 |
|
| Eni SpA (c) | 32,399 | 479,566 |
|
| Exor SpA (c) | 1,274 | 57,609 |
|
| Finmeccanica SpA* (c) | 5,238 | 72,342 |
|
| Intesa Sanpaolo SpA: | | |
| Milano Stock Exchange (c) | 161,551 | 537,938 |
|
| Luxottica Group SpA (c) | 2,154 | 140,302 |
|
| Mediobanca SpA (c) | 7,180 | 68,784 |
|
| Prysmian SpA (c) | 2,552 | 55,776 |
|
| Saipem SpA* (c) | 3,486 | 27,999 |
|
| Snam SpA (c) | 26,750 | 139,776 |
|
| Telecom Italia SpA* (c) | 146,145 | 184,051 |
|
| Telecom Italia SpA - RSP (c) | 78,004 | 79,718 |
|
| Terna Rete Elettrica Nazionale SpA (c) | 19,199 | 98,838 |
|
12 www.calvert.com CALVERT VP EAFE INTERNATIONAL INDEX PORTFOLIO ANNUAL REPORT
|
| | | |
| | SHARES | VALUE ($) |
| COMMON STOCKS - Cont'd | | |
| UniCredit SpA (c) | 60,798 | 334,596 |
|
| Unione di Banche Italiane SCPA (c) | 11,672 | 77,455 |
|
| UnipolSai SpA (c) | 14,396 | 36,441 |
|
| | | 3,330,514 |
|
| | | |
| Japan - 23.0% | | |
| ABC-Mart, Inc. (c) | 346 | 18,967 |
|
| Acom Co. Ltd.* (c) | 5,254 | 24,721 |
|
| Aeon Co. Ltd. (c) | 8,328 | 127,973 |
|
| Aeon Financial Service Co. Ltd. (c) | 1,363 | 30,473 |
|
| Aeon Mall Co. Ltd. (c) | 1,500 | 25,732 |
|
| Air Water, Inc. (c) | 2,080 | 33,350 |
|
| Aisin Seiki Co. Ltd. (c) | 2,439 | 104,797 |
|
| Ajinomoto Co. Inc. (c) | 7,192 | 170,109 |
|
| Alfresa Holdings Corp. (c) | 2,244 | 44,362 |
|
| Alps Electric Co. Ltd. (c) | 2,282 | 61,675 |
|
| Amada Holdings Co. Ltd. (c) | 4,579 | 43,668 |
|
| ANA Holdings, Inc. (c) | 15,277 | 44,058 |
|
| Aozora Bank Ltd. (c) | 14,312 | 49,876 |
|
| Asahi Glass Co. Ltd. (c) | 12,091 | 68,901 |
|
| Asahi Group Holdings Ltd. (c) | 4,927 | 153,926 |
|
| Asahi Kasei Corp. (c) | 16,077 | 108,737 |
|
| Asics Corp. (c) | 2,070 | 42,814 |
|
| Astellas Pharma, Inc. (c) | 26,882 | 381,583 |
|
| Bandai Namco Holdings, Inc. (c) | 2,261 | 47,477 |
|
| Bank of Kyoto Ltd. (The) (c) | 4,493 | 41,593 |
|
| Bank of Yokohama Ltd. (The) (c) | 14,374 | 87,923 |
|
| Benesse Holdings, Inc. (c) | 876 | 25,207 |
|
| Bridgestone Corp. (c) | 8,284 | 283,471 |
|
| Brother Industries Ltd. (c) | 3,105 | 35,581 |
|
| Calbee, Inc. (c) | 967 | 40,556 |
|
| Canon, Inc. (c) | 13,589 | 411,599 |
|
| Casio Computer Co. Ltd. (c) | 2,569 | 59,929 |
|
| Central Japan Railway Co. (c) | 1,836 | 325,012 |
|
| Chiba Bank Ltd. (The) (c) | 8,920 | 63,200 |
|
| Chubu Electric Power Co., Inc. (c) | 8,205 | 112,157 |
|
| Chugai Pharmaceutical Co. Ltd. (c) | 2,851 | 99,299 |
|
| Chugoku Bank Ltd. (The) (c) | 2,141 | 28,519 |
|
| Chugoku Electric Power Co., Inc. (The) (c) | 3,780 | 49,720 |
|
| Citizen Holdings Co. Ltd. (c) | 3,479 | 24,972 |
|
| Credit Saison Co. Ltd. (c) | 1,953 | 38,463 |
|
| Dai Nippon Printing Co. Ltd. (c) | 7,046 | 69,613 |
|
| Dai-ichi Life Insurance Co. Ltd. (The) (c) | 13,732 | 227,700 |
|
| Daicel Corp. (c) | 3,820 | 56,807 |
|
| Daihatsu Motor Co. Ltd. (c) | 2,530 | 34,057 |
|
| Daiichi Sankyo Co. Ltd. (c) | 8,127 | 166,905 |
|
| Daikin Industries Ltd. (c) | 2,986 | 217,170 |
|
| Daito Trust Construction Co. Ltd. (c) | 909 | 105,169 |
|
| Daiwa House Industry Co. Ltd. (c) | 7,636 | 218,783 |
|
| Daiwa Securities Group, Inc. (c) | 21,166 | 129,323 |
|
| Denso Corp. (c) | 6,192 | 295,034 |
|
| Dentsu, Inc. (c) | 2,754 | 150,646 |
|
www.calvert.com CALVERT VP EAFE INTERNATIONAL INDEX PORTFOLIO ANNUAL REPORT 13
|
| | | |
| | SHARES | VALUE ($) |
| COMMON STOCKS - Cont'd | | |
| Don Quijote Holdings Co. Ltd. (c) | 1,531 | 53,752 |
|
| East Japan Railway Co. (c) | 4,249 | 399,065 |
|
| Eisai Co. Ltd. (c) | 3,210 | 212,049 |
|
| Electric Power Development Co. Ltd. (c) | 1,891 | 67,249 |
|
| FamilyMart Co. Ltd. (c) | 771 | 35,801 |
|
| FANUC Corp. (c) | 2,491 | 429,141 |
|
| Fast Retailing Co. Ltd. (c) | 675 | 236,216 |
|
| Fuji Electric Co. Ltd. (c) | 7,371 | 30,889 |
|
| Fuji Heavy Industries Ltd. (c) | 7,477 | 307,163 |
|
| FUJIFILM Holdings Corp. (c) | 5,898 | 245,492 |
|
| Fujitsu Ltd. (c) | 23,727 | 118,019 |
|
| Fukuoka Financial Group, Inc. (c) | 9,854 | 48,842 |
|
| GungHo Online Entertainment, Inc.* (c) | 5,308 | 14,440 |
|
| Gunma Bank Ltd. (The) (c) | 4,959 | 28,811 |
|
| Hachijuni Bank Ltd. (The) (c) | 5,383 | 33,012 |
|
| Hakuhodo DY Holdings, Inc. (c) | 3,069 | 33,144 |
|
| Hamamatsu Photonics KK (c) | 1,813 | 49,660 |
|
| Hankyu Hanshin Holdings, Inc. (c) | 14,573 | 94,598 |
|
| Hikari Tsushin, Inc. (c) | 249 | 16,892 |
|
| Hino Motors Ltd. (c) | 3,404 | 39,248 |
|
| Hirose Electric Co. Ltd. (c) | 382 | 46,136 |
|
| Hiroshima Bank Ltd. (The) (c) | 6,585 | 37,369 |
|
| Hisamitsu Pharmaceutical Co., Inc. (c) | 751 | 31,480 |
|
| Hitachi Chemical Co. Ltd. (c) | 1,371 | 21,709 |
|
| Hitachi Construction Machinery Co. Ltd. (c) | 1,416 | 22,031 |
|
| Hitachi High-Technologies Corp. (c) | 901 | 24,332 |
|
| Hitachi Ltd. (c) | 61,559 | 348,049 |
|
| Hitachi Metals Ltd. (c) | 2,823 | 34,788 |
|
| Hokuhoku Financial Group, Inc. (c) | 16,015 | 32,606 |
|
| Hokuriku Electric Power Co. (c) | 2,215 | 32,694 |
|
| Honda Motor Co. Ltd. (c) | 20,763 | 664,836 |
|
| Hoshizaki Electric Co. Ltd. (c) | 507 | 31,490 |
|
| HOYA Corp. (c) | 5,302 | 216,012 |
|
| Hulic Co. Ltd. (c) | 3,885 | 34,053 |
|
| Idemitsu Kosan Co. Ltd. (c) | 1,158 | 18,412 |
|
| IHI Corp. (c) | 17,730 | 48,715 |
|
| Iida Group Holdings Co. Ltd. (c) | 1,926 | 35,651 |
|
| INPEX Corp. (c) | 12,105 | 119,380 |
|
| Isetan Mitsukoshi Holdings Ltd. (c) | 4,527 | 58,861 |
|
| Isuzu Motors Ltd. (c) | 7,687 | 82,667 |
|
| ITOCHU Corp. (c) | 20,119 | 237,006 |
|
| Itochu Techno-Solutions Corp. (c) | 631 | 12,600 |
|
| Iyo Bank Ltd. (The) (c) | 3,197 | 31,014 |
|
| J Front Retailing Co. Ltd. (c) | 3,073 | 44,493 |
|
| Japan Airlines Co. Ltd. (c) | 1,524 | 54,540 |
|
| Japan Airport Terminal Co. Ltd. (c) | 552 | 24,464 |
|
| Japan Exchange Group, Inc. (c) | 6,992 | 109,130 |
|
| Japan Post Bank Co. Ltd.* | 5,200 | 75,660 |
|
| Japan Post Holdings Co. Ltd.* | 5,800 | 89,936 |
|
| Japan Prime Realty Investment Corp. REIT (c) | 10 | 34,197 |
|
| Japan Real Estate Investment Corp. REIT (c) | 16 | 77,763 |
|
| Japan Retail Fund Investment Corp. REIT (c) | 30 | 57,571 |
|
14 www.calvert.com CALVERT VP EAFE INTERNATIONAL INDEX PORTFOLIO ANNUAL REPORT
|
| | | |
| | SHARES | VALUE ($) |
| COMMON STOCKS - Cont'd | | |
| Japan Tobacco, Inc. (c) | 14,009 | 514,028 |
|
| JFE Holdings, Inc. (c) | 6,260 | 98,327 |
|
| JGC Corp. (c) | 2,728 | 41,716 |
|
| Joyo Bank Ltd. (The) (c) | 8,020 | 37,882 |
|
| JSR Corp. (c) | 2,491 | 38,852 |
|
| JTEKT Corp. (c) | 2,623 | 42,901 |
|
| JX Holdings, Inc. (c) | 28,604 | 119,542 |
|
| Kajima Corp. (c) | 10,949 | 65,109 |
|
| Kakaku.com, Inc. (c) | 1,835 | 36,202 |
|
| Kamigumi Co. Ltd. (c) | 3,070 | 26,408 |
|
| Kaneka Corp. (c) | 3,686 | 38,300 |
|
| Kansai Electric Power Co., Inc. (The)* (c) | 8,966 | 107,208 |
|
| Kansai Paint Co. Ltd. (c) | 2,951 | 44,586 |
|
| Kao Corp. (c) | 6,418 | 329,130 |
|
| Kawasaki Heavy Industries Ltd. (c) | 18,383 | 67,936 |
|
| KDDI Corp. (c) | 22,276 | 576,275 |
|
| Keihan Electric Railway Co. Ltd. (c) | 6,705 | 44,824 |
|
| Keikyu Corp. (c) | 5,970 | 49,264 |
|
| Keio Corp. (c) | 7,367 | 63,593 |
|
| Keisei Electric Railway Co. Ltd. (c) | 3,631 | 46,180 |
|
| Keyence Corp. (c) | 580 | 318,119 |
|
| Kikkoman Corp. (c) | 1,906 | 65,924 |
|
| Kintetsu Group Holdings Co. Ltd. (c) | 23,446 | 95,314 |
|
| Kirin Holdings Co. Ltd. (c) | 10,476 | 141,661 |
|
| Kobe Steel Ltd. (c) | 39,444 | 42,826 |
|
| Koito Manufacturing Co. Ltd. (c) | 1,367 | 55,879 |
|
| Komatsu Ltd. (c) | 11,760 | 191,488 |
|
| Konami Corp. (c) | 1,220 | 29,076 |
|
| Konica Minolta, Inc. (c) | 5,761 | 57,745 |
|
| Kose Corp. (c) | 392 | 36,063 |
|
| Kubota Corp. (c) | 14,284 | 220,043 |
|
| Kuraray Co. Ltd. (c) | 4,536 | 54,813 |
|
| Kurita Water Industries Ltd. (c) | 1,403 | 29,353 |
|
| Kyocera Corp. (c) | 4,087 | 189,303 |
|
| Kyowa Hakko Kirin Co. Ltd. (c) | 2,936 | 46,146 |
|
| Kyushu Electric Power Co., Inc.* (c) | 5,524 | 60,321 |
|
| Kyushu Financial Group, Inc.* (c) | 4,497 | 31,403 |
|
| Lawson, Inc. (c) | 843 | 68,319 |
|
| LIXIL Group Corp. (c) | 3,444 | 76,385 |
|
| M3, Inc. (c) | 2,472 | 51,199 |
|
| Mabuchi Motor Co. Ltd. (c) | 648 | 34,987 |
|
| Makita Corp. (c) | 1,540 | 88,444 |
|
| Marubeni Corp. (c) | 21,027 | 107,869 |
|
| Marui Group Co. Ltd. (c) | 2,885 | 46,843 |
|
| Maruichi Steel Tube Ltd. (c) | 618 | 18,226 |
|
| Mazda Motor Corp. (c) | 6,876 | 141,358 |
|
| McDonald’s Holdings Company (Japan), Ltd.* (c) | 875 | 19,023 |
|
| Medipal Holdings Corp. (c) | 1,770 | 30,119 |
|
| MEIJI Holdings Co. Ltd. (c) | 1,555 | 128,134 |
|
| Minebea Co. Ltd. (c) | 4,067 | 34,900 |
|
| Miraca Holdings, Inc. (c) | 702 | 30,938 |
|
| Mitsubishi Chemical Holdings Corp. (c) | 17,265 | 109,391 |
|
www.calvert.com CALVERT VP EAFE INTERNATIONAL INDEX PORTFOLIO ANNUAL REPORT 15
|
| | | |
| | SHARES | VALUE ($) |
| COMMON STOCKS - Cont'd | | |
| Mitsubishi Corp. (c) | 17,213 | 285,777 |
|
| Mitsubishi Electric Corp. (c) | 24,612 | 257,873 |
|
| Mitsubishi Estate Co. Ltd. (c) | 15,937 | 330,106 |
|
| Mitsubishi Gas Chemical Co., Inc. (c) | 5,092 | 25,999 |
|
| Mitsubishi Heavy Industries Ltd. (c) | 38,670 | 168,799 |
|
| Mitsubishi Logistics Corp. (c) | 1,456 | 19,191 |
|
| Mitsubishi Materials Corp. (c) | 14,234 | 44,738 |
|
| Mitsubishi Motors Corp. (c) | 8,276 | 69,924 |
|
| Mitsubishi Tanabe Pharma Corp. (c) | 2,860 | 49,239 |
|
| Mitsubishi UFJ Financial Group, Inc. (c) | 162,409 | 1,004,464 |
|
| Mitsubishi UFJ Lease & Finance Co. Ltd. (c) | 6,486 | 33,390 |
|
| Mitsui & Co. Ltd. (c) | 21,736 | 257,982 |
|
| Mitsui Chemicals, Inc. (c) | 10,764 | 47,711 |
|
| Mitsui Fudosan Co. Ltd. (c) | 11,995 | 300,364 |
|
| Mitsui OSK Lines Ltd. (c) | 14,995 | 37,749 |
|
| Mixi, Inc. (c) | 544 | 20,297 |
|
| Mizuho Financial Group, Inc. (c) | 299,965 | 598,402 |
|
| MS&AD Insurance Group Holdings, Inc. (c) | 6,452 | 188,559 |
|
| Murata Manufacturing Co. Ltd. (c) | 2,582 | 370,339 |
|
| Nabtesco Corp. (c) | 1,594 | 32,371 |
|
| Nagoya Railroad Co. Ltd. (c) | 11,361 | 47,261 |
|
| NEC Corp. (c) | 33,174 | 105,300 |
|
| Nexon Co. Ltd. (c) | 1,699 | 27,561 |
|
| NGK Insulators Ltd. (c) | 3,392 | 76,463 |
|
| NGK Spark Plug Co. Ltd. (c) | 2,277 | 59,942 |
|
| NH Foods Ltd. (c) | 2,282 | 44,726 |
|
| NHK Spring Co. Ltd. (c) | 2,088 | 20,901 |
|
| Nidec Corp. (c) | 2,834 | 204,995 |
|
| Nikon Corp. (c) | 4,339 | 57,926 |
|
| Nintendo Co. Ltd. (c) | 1,353 | 186,133 |
|
| Nippon Building Fund, Inc. REIT (c) | 17 | 81,147 |
|
| Nippon Electric Glass Co. Ltd. (c) | 5,241 | 26,409 |
|
| Nippon Express Co. Ltd. (c) | 10,749 | 50,400 |
|
| Nippon Paint Holdings Co. Ltd. (c) | 1,864 | 45,059 |
|
| Nippon Prologis REIT, Inc. (c) | 18 | 32,506 |
|
| Nippon Steel & Sumitomo Metal Corp. (c) | 9,682 | 191,585 |
|
| Nippon Telegraph & Telephone Corp. (c) | 9,554 | 379,059 |
|
| Nippon Yusen KK (c) | 20,575 | 49,837 |
|
| Nissan Motor Co. Ltd. (c) | 31,666 | 331,413 |
|
| Nisshin Seifun Group, Inc. (c) | 2,805 | 45,768 |
|
| Nissin Foods Holdings Co. Ltd. (c) | 845 | 44,746 |
|
| Nitori Holdings Co. Ltd. (c) | 947 | 79,540 |
|
| Nitto Denko Corp. (c) | 2,102 | 153,228 |
|
| NOK Corp. (c) | 1,253 | 29,267 |
|
| Nomura Holdings, Inc. (c) | 46,250 | 256,872 |
|
| Nomura Real Estate Holdings, Inc. (c) | 1,634 | 30,248 |
|
| Nomura Real Estate Master Fund, Inc. REIT* (c) | 46 | 56,900 |
|
| Nomura Research Institute Ltd. (c) | 1,600 | 61,455 |
|
| NSK Ltd. (c) | 6,065 | 65,737 |
|
| NTT Data Corp. (c) | 1,633 | 78,834 |
|
| NTT DoCoMo, Inc. (c) | 18,212 | 373,017 |
|
| NTT Urban Development Corp. (c) | 1,516 | 14,559 |
|
16 www.calvert.com CALVERT VP EAFE INTERNATIONAL INDEX PORTFOLIO ANNUAL REPORT
|
| | | |
| | SHARES | VALUE ($) |
| COMMON STOCKS - Cont'd | | |
| Obayashi Corp. (c) | 8,405 | 77,490 |
|
| Obic Co. Ltd. (c) | 824 | 43,652 |
|
| Odakyu Electric Railway Co. Ltd. (c) | 8,109 | 87,235 |
|
| Oji Holdings Corp. (c) | 10,167 | 40,951 |
|
| Olympus Corp. (c) | 3,491 | 137,407 |
|
| Omron Corp. (c) | 2,532 | 84,282 |
|
| Ono Pharmaceutical Co. Ltd. (c) | 1,050 | 186,498 |
|
| Oracle Corp. Japan (c) | 502 | 23,395 |
|
| Oriental Land Co. Ltd. (c) | 2,547 | 153,244 |
|
| ORIX Corp. (c) | 16,863 | 236,399 |
|
| Osaka Gas Co. Ltd. (c) | 24,271 | 87,457 |
|
| Otsuka Corp. (c) | 683 | 33,472 |
|
| Otsuka Holdings Co. Ltd. (c) | 4,973 | 175,811 |
|
| Panasonic Corp. (c) | 28,118 | 285,177 |
|
| Park24 Co. Ltd. (c) | 1,242 | 30,116 |
|
| Rakuten, Inc.* (c) | 11,838 | 136,333 |
|
| Recruit Holdings Co. Ltd. (c) | 1,799 | 52,863 |
|
| Resona Holdings, Inc. (c) | 28,120 | 136,400 |
|
| Ricoh Co. Ltd. (c) | 9,012 | 92,503 |
|
| Rinnai Corp. (c) | 481 | 42,556 |
|
| Rohm Co. Ltd. (c) | 1,247 | 62,978 |
|
| Ryohin Keikaku Co. Ltd. (c) | 308 | 62,400 |
|
| Sankyo Co. Ltd. (c) | 642 | 23,930 |
|
| Sanrio Co. Ltd. (c) | 644 | 15,067 |
|
| Santen Pharmaceutical Co. Ltd. (c) | 4,814 | 79,116 |
|
| SBI Holdings, Inc. (c) | 2,791 | 30,108 |
|
| Secom Co. Ltd. (c) | 2,674 | 180,828 |
|
| Sega Sammy Holdings, Inc. (c) | 2,453 | 22,892 |
|
| Seibu Holdings, Inc. (c) | 1,576 | 32,212 |
|
| Seiko Epson Corp. (c) | 3,562 | 54,709 |
|
| Sekisui Chemical Co. Ltd. (c) | 5,303 | 69,126 |
|
| Sekisui House Ltd. (c) | 7,682 | 129,004 |
|
| Seven & I Holdings Co. Ltd. (c) | 9,596 | 437,243 |
|
| Seven Bank Ltd. (c) | 7,840 | 34,295 |
|
| Shikoku Electric Power Co., Inc. (c) | 2,349 | 36,633 |
|
| Shimadzu Corp. (c) | 3,292 | 55,120 |
|
| Shimamura Co. Ltd. (c) | 291 | 33,989 |
|
| Shimano, Inc. (c) | 1,003 | 153,519 |
|
| Shimizu Corp. (c) | 7,655 | 62,335 |
|
| Shin-Etsu Chemical Co. Ltd. (c) | 5,228 | 283,775 |
|
| Shinsei Bank Ltd. (c) | 23,392 | 43,002 |
|
| Shionogi & Co. Ltd. (c) | 3,801 | 171,724 |
|
| Shiseido Co. Ltd. (c) | 4,584 | 94,794 |
|
| Shizuoka Bank Ltd. (The) (c) | 6,887 | 66,711 |
|
| Showa Shell Sekiyu KK (c) | 2,480 | 20,145 |
|
| SMC Corp. (c) | 686 | 177,782 |
|
| SoftBank Group Corp. (c) | 12,233 | 616,064 |
|
| Sohgo Security Services Co. Ltd. (c) | 779 | 36,431 |
|
| Sompo Japan Nipponkoa Holdings, Inc. (c) | 4,231 | 138,301 |
|
| Sony Corp. (c) | 16,074 | 393,525 |
|
| Sony Financial Holdings, Inc. (c) | 2,290 | 40,879 |
|
| Stanley Electric Co. Ltd. (c) | 1,879 | 41,360 |
|
www.calvert.com CALVERT VP EAFE INTERNATIONAL INDEX PORTFOLIO ANNUAL REPORT 17
|
| | | |
| | SHARES | VALUE ($) |
| COMMON STOCKS - Cont'd | | |
| Sumitomo Chemical Co. Ltd. (c) | 18,975 | 108,829 |
|
| Sumitomo Corp. (c) | 14,334 | 145,896 |
|
| Sumitomo Dainippon Pharma Co. Ltd. (c) | 2,095 | 24,635 |
|
| Sumitomo Electric Industries Ltd. (c) | 9,606 | 135,262 |
|
| Sumitomo Heavy Industries Ltd. (c) | 7,281 | 32,594 |
|
| Sumitomo Metal Mining Co. Ltd. (c) | 6,296 | 76,047 |
|
| Sumitomo Mitsui Financial Group, Inc. (c) | 16,208 | 610,996 |
|
| Sumitomo Mitsui Trust Holdings, Inc. (c) | 42,257 | 159,428 |
|
| Sumitomo Realty & Development Co. Ltd. (c) | 4,547 | 129,471 |
|
| Sumitomo Rubber Industries Ltd. (c) | 2,251 | 29,242 |
|
| Suntory Beverage & Food Ltd. (c) | 1,799 | 78,825 |
|
| Suruga Bank Ltd. (c) | 2,301 | 47,380 |
|
| Suzuken Co. Ltd. (c) | 1,020 | 38,853 |
|
| Suzuki Motor Corp. (c) | 4,644 | 140,891 |
|
| Sysmex Corp. (c) | 1,855 | 118,560 |
|
| T&D Holdings, Inc. (c) | 7,377 | 96,909 |
|
| Taiheiyo Cement Corp. (c) | 14,976 | 43,635 |
|
| Taisei Corp. (c) | 13,511 | 88,954 |
|
| Taisho Pharmaceutical Holdings Co. Ltd. (c) | 415 | 29,285 |
|
| Taiyo Nippon Sanso Corp. (c) | 1,995 | 18,009 |
|
| Takashimaya Co. Ltd. (c) | 3,744 | 33,668 |
|
| Takeda Pharmaceutical Co. Ltd. (c) | 10,062 | 500,587 |
|
| TDK Corp. (c) | 1,567 | 100,166 |
|
| Teijin Ltd. (c) | 12,316 | 41,922 |
|
| Terumo Corp. (c) | 3,869 | 119,675 |
|
| THK Co. Ltd. (c) | 1,576 | 29,145 |
|
| Tobu Railway Co. Ltd. (c) | 13,226 | 65,157 |
|
| Toho Co. Ltd. (c) | 1,492 | 41,312 |
|
| Toho Gas Co. Ltd. (c) | 5,391 | 34,791 |
|
| Tohoku Electric Power Co., Inc. (c) | 5,858 | 73,182 |
|
| Tokio Marine Holdings, Inc. (c) | 8,683 | 334,338 |
|
| Tokyo Electric Power Co., Inc.* (c) | 18,420 | 105,874 |
|
| Tokyo Electron Ltd. (c) | 2,185 | 131,041 |
|
| Tokyo Gas Co. Ltd. (c) | 28,999 | 136,127 |
|
| Tokyo Tatemono Co. Ltd. (c) | 2,700 | 29,336 |
|
| Tokyu Corp. (c) | 14,325 | 113,237 |
|
| Tokyu Fudosan Holdings Corp. (c) | 6,708 | 41,946 |
|
| TonenGeneral Sekiyu KK (c) | 3,720 | 31,240 |
|
| Toppan Printing Co. Ltd. (c) | 6,680 | 61,468 |
|
| Toray Industries, Inc. (c) | 18,700 | 173,430 |
|
| Toshiba Corp.* (c) | 51,271 | 105,143 |
|
| TOTO Ltd. (c) | 1,800 | 63,069 |
|
| Toyo Seikan Group Holdings Ltd. (c) | 2,150 | 39,743 |
|
| Toyo Suisan Kaisha Ltd. (c) | 1,167 | 40,595 |
|
| Toyoda Gosei Co. Ltd. (c) | 855 | 19,404 |
|
| Toyota Industries Corp. (c) | 2,074 | 110,765 |
|
| Toyota Motor Corp. (c) | 34,825 | 2,136,138 |
|
| Toyota Tsusho Corp. (c) | 2,749 | 64,255 |
|
| Trend Micro, Inc.* (c) | 1,340 | 54,321 |
|
| Unicharm Corp. (c) | 4,744 | 96,654 |
|
| United Urban Investment Corp. REIT (c) | 34 | 46,086 |
|
| USS Co. Ltd. (c) | 2,886 | 43,393 |
|
18 www.calvert.com CALVERT VP EAFE INTERNATIONAL INDEX PORTFOLIO ANNUAL REPORT
|
| | | |
| | SHARES | VALUE ($) |
| COMMON STOCKS - Cont'd | | |
| West Japan Railway Co. (c) | 2,097 | 144,551 |
|
| Yahoo Japan Corp. (c) | 18,429 | 74,847 |
|
| Yakult Honsha Co. Ltd. (c) | 1,138 | 55,625 |
|
| Yamada Denki Co. Ltd. (c) | 8,852 | 38,256 |
|
| Yamaguchi Financial Group, Inc. (c) | 2,594 | 30,718 |
|
| Yamaha Corp. (c) | 2,135 | 51,550 |
|
| Yamaha Motor Co. Ltd. (c) | 3,396 | 76,050 |
|
| Yamato Holdings Co. Ltd. (c) | 4,331 | 91,732 |
|
| Yamazaki Baking Co. Ltd. (c) | 1,450 | 32,529 |
|
| Yaskawa Electric Corp. (c) | 2,989 | 40,655 |
|
| Yokogawa Electric Corp. (c) | 2,987 | 35,888 |
|
| Yokohama Rubber Co. Ltd. (The) (c) | 1,300 | 19,906 |
|
| | | 36,463,132 |
|
| | | |
| Luxembourg - 0.2% | | |
| ArcelorMittal (c) | 12,934 | 53,999 |
|
| Millicom International Cellular SA (SDR) (c) | 801 | 45,582 |
|
| SES SA (FDR) (c) | 4,151 | 114,968 |
|
| Tenaris SA (c) | 6,112 | 72,701 |
|
| | | 287,250 |
|
| | | |
| Netherlands - 4.5% | | |
| Aegon NV (c) | 23,074 | 130,133 |
|
| AerCap Holdings NV* | 2,262 | 97,628 |
|
| Airbus Group NV (c) | 7,523 | 504,702 |
|
| Akzo Nobel NV (c) | 3,153 | 210,425 |
|
| Altice NV: | | |
| Class A * (c) | 4,774 | 68,211 |
|
| Class B * (c) | 1,414 | 20,441 |
|
| ASML Holding NV (c) | 4,415 | 393,123 |
|
| Boskalis Westminster NV (c) | 1,113 | 45,303 |
|
| CNH Industrial NV (c) | 12,280 | 83,639 |
|
| Fiat Chrysler Automobiles NV* (c) | 11,455 | 157,601 |
|
| Gemalto NV (c) | 1,042 | 62,211 |
|
| Heineken Holding NV (c) | 1,283 | 98,274 |
|
| Heineken NV (c) | 2,934 | 250,205 |
|
| ING Groep NV (CVA) (c) | 49,282 | 662,838 |
|
| Koninklijke Ahold NV, Amsterdam Stock Exchange (c) | 10,626 | 224,162 |
|
| Koninklijke DSM NV (c) | 2,310 | 115,502 |
|
| Koninklijke KPN NV (c) | 40,789 | 153,893 |
|
| Koninklijke Philips NV (c) | 12,100 | 307,393 |
|
| Koninklijke Vopak NV (c) | 925 | 39,746 |
|
| NN Group NV (c) | 3,042 | 106,885 |
|
| NXP Semiconductors NV* | 3,045 | 256,541 |
|
| OCI NV* (c) | 1,109 | 27,279 |
|
| QIAGEN NV* (c) | 2,816 | 76,123 |
|
| Randstad Holding NV (c) | 1,631 | 101,372 |
|
| Royal Dutch Shell plc: | | |
| Class A (c) | 49,900 | 1,121,269 |
|
| Class B (c) | 31,081 | 709,832 |
|
| STMicroelectronics NV (c) | 8,250 | 54,988 |
|
www.calvert.com CALVERT VP EAFE INTERNATIONAL INDEX PORTFOLIO ANNUAL REPORT 19
|
| | | |
| | SHARES | VALUE ($) |
| COMMON STOCKS - Cont'd | | |
| TNT Express NV (c) | 6,456 | 54,585 |
|
| Unilever NV (CVA) (c) | 20,746 | 898,088 |
|
| Wolters Kluwer NV (c) | 3,844 | 128,689 |
|
| | | 7,161,081 |
|
| | | |
| New Zealand - 0.2% | | |
| Auckland International Airport Ltd. (c) | 12,539 | 49,261 |
|
| Contact Energy Ltd. (c) | 9,492 | 30,708 |
|
| Fletcher Building Ltd. (c) | 8,772 | 43,870 |
|
| Meridian Energy Ltd. (c) | 16,872 | 27,489 |
|
| Mighty River Power Ltd. (c) | 9,216 | 17,409 |
|
| Ryman Healthcare Ltd. (c) | 4,937 | 28,675 |
|
| Spark New Zealand Ltd. (c) | 23,305 | 52,535 |
|
| | | 249,947 |
|
| | | |
| Norway - 0.5% | | |
| DNB ASA (c) | 12,446 | 152,961 |
|
| Gjensidige Forsikring ASA (c) | 2,633 | 41,870 |
|
| Norsk Hydro ASA (c) | 17,408 | 64,656 |
|
| Orkla ASA (c) | 10,551 | 83,153 |
|
| Schibsted ASA: | | |
| Class A (c) | 962 | 31,531 |
|
| Class B* (c) | 1,134 | 35,948 |
|
| Statoil ASA (c) | 14,213 | 198,515 |
|
| Telenor ASA (c) | 9,561 | 158,841 |
|
| Yara International ASA (c) | 2,277 | 97,937 |
|
| | | 865,412 |
|
| | | |
| Portugal - 0.2% | | |
| Banco Comercial Portugues SA* (c) | 526,347 | 27,691 |
|
| Banco Espirito Santo SA(a)(c) | 34,023 | — |
|
| EDP - Energias de Portugal SA (c) | 29,494 | 105,911 |
|
| Galp Energia SGPS SA (c) | 4,910 | 56,869 |
|
| Jeronimo Martins SGPS SA (c) | 3,314 | 43,023 |
|
| | | 233,494 |
|
| | | |
| Singapore - 1.2% | | |
| Ascendas Real Estate Investment Trust REIT (c) | 26,903 | 43,114 |
|
| CapitaLand Commercial Trust REIT (c) | 27,140 | 25,782 |
|
| CapitaLand Ltd. (c) | 33,196 | 77,960 |
|
| CapitaLand Mall Trust REIT (c) | 31,907 | 43,267 |
|
| City Developments Ltd. (c) | 5,387 | 28,993 |
|
| ComfortDelGro Corp. Ltd. (c) | 28,011 | 59,953 |
|
| DBS Group Holdings Ltd. (c) | 22,406 | 262,485 |
|
| Global Logistic Properties Ltd. (c) | 40,729 | 61,364 |
|
| Golden Agri-Resources Ltd. (c) | 92,959 | 22,160 |
|
| Hutchison Port Holdings Trust (c) | 74,548 | 39,382 |
|
| Jardine Cycle & Carriage Ltd. (c) | 1,534 | 37,454 |
|
| Keppel Corp. Ltd. (c) | 18,825 | 85,959 |
|
| Oversea-Chinese Banking Corp. Ltd. (c) | 38,765 | 239,738 |
|
| SembCorp Industries Ltd. (c) | 12,944 | 27,716 |
|
| SembCorp Marine Ltd. (c) | 11,005 | 13,515 |
|
20 www.calvert.com CALVERT VP EAFE INTERNATIONAL INDEX PORTFOLIO ANNUAL REPORT
|
| | | |
| | SHARES | VALUE ($) |
| COMMON STOCKS - Cont'd | | |
| Singapore Airlines Ltd. (c) | 6,876 | 54,147 |
|
| Singapore Exchange Ltd. (c) | 10,236 | 55,408 |
|
| Singapore Press Holdings Ltd. (c) | 20,385 | 56,550 |
|
| Singapore Technologies Engineering Ltd. (c) | 20,536 | 43,388 |
|
| Singapore Telecommunications Ltd. (c) | 101,529 | 261,458 |
|
| StarHub Ltd. (c) | 7,954 | 20,702 |
|
| Suntec Real Estate Investment Trust REIT (c) | 31,243 | 33,977 |
|
| United Overseas Bank Ltd. (c) | 16,450 | 226,606 |
|
| UOL Group Ltd. (c) | 6,217 | 27,280 |
|
| Wilmar International Ltd. (c) | 24,466 | 50,429 |
|
| Yangzijiang Shipbuilding Holdings Ltd. (c) | 25,259 | 19,515 |
|
| | | 1,918,302 |
|
| | | |
| Spain - 3.1% | | |
| Abertis Infraestructuras SA (c) | 6,607 | 102,899 |
|
| ACS Actividades de Construccion y Servicios SA (c) | 2,404 | 69,979 |
|
| Aena SA(b)(c) | 859 | 97,787 |
|
| Amadeus IT Holding SA Class A (c) | 5,588 | 245,854 |
|
| Banco Bilbao Vizcaya Argentaria SA (c) | 81,176 | 591,492 |
|
| Banco de Sabadell SA (c) | 63,950 | 113,173 |
|
| Banco Popular Espanol SA (c) | 22,062 | 72,589 |
|
| Banco Santander SA (c) | 184,107 | 903,130 |
|
| Bankia SA (c) | 59,634 | 69,293 |
|
| Bankinter SA (c) | 8,726 | 61,802 |
|
| CaixaBank SA (c) | 33,407 | 116,116 |
|
| Distribuidora Internacional de Alimentacion SA* (c) | 7,877 | 46,240 |
|
| Enagas SA (c) | 2,736 | 76,921 |
|
| Endesa SA (c) | 4,111 | 82,294 |
|
| Ferrovial SA (c) | 5,736 | 129,349 |
|
| Gas Natural SDG SA (c) | 4,460 | 90,528 |
|
| Grifols SA (c) | 1,930 | 88,776 |
|
| Iberdrola SA (c) | 68,600 | 485,924 |
|
| Industria de Diseno Textil SA (c) | 13,892 | 476,327 |
|
| International Consolidated Airlines Group SA (c) | 10,350 | 92,188 |
|
| Mapfre SA (c) | 14,103 | 35,146 |
|
| Red Electrica Corp. SA (c) | 1,378 | 114,762 |
|
| Repsol SA (c) | 13,376 | 145,504 |
|
| Telefonica SA (c) | 59,224 | 653,152 |
|
| Zardoya Otis SA (c) | 2,290 | 26,660 |
|
| | | 4,987,885 |
|
| | | |
| Sweden - 2.8% | | |
| Alfa Laval AB (c) | 3,739 | 67,828 |
|
| Assa Abloy AB Class B (c) | 12,765 | 267,115 |
|
| Atlas Copco AB: | | |
| Class A (c) | 8,552 | 208,151 |
|
| Class B (c) | 4,969 | 114,143 |
|
| Boliden AB (c) | 3,540 | 58,642 |
|
| Electrolux AB, Series B (c) | 3,114 | 74,677 |
|
| Getinge AB Class B (c) | 2,590 | 67,343 |
|
| Hennes & Mauritz AB Class B (c) | 12,092 | 430,196 |
|
| Hexagon AB Class B (c) | 3,288 | 121,701 |
|
www.calvert.com CALVERT VP EAFE INTERNATIONAL INDEX PORTFOLIO ANNUAL REPORT 21
|
| | | |
| | SHARES | VALUE ($) |
| COMMON STOCKS - Cont'd | | |
| Husqvarna AB Class B (c) | 5,378 | 35,451 |
|
| ICA Gruppen AB (c) | 1,019 | 36,865 |
|
| Industrivarden AB, Class C (c) | 2,161 | 36,903 |
|
| Investment AB Kinnevik Class B (c) | 3,047 | 93,321 |
|
| Investor AB Class B (c) | 5,801 | 213,237 |
|
| Lundin Petroleum AB* (c) | 2,866 | 41,044 |
|
| Nordea Bank AB (c) | 38,685 | 421,732 |
|
| Sandvik AB (c) | 13,579 | 117,503 |
|
| Securitas AB Class B (c) | 3,987 | 60,676 |
|
| Skandinaviska Enskilda Banken AB Class A (c) | 19,346 | 202,087 |
|
| Skanska AB Class B (c) | 4,839 | 93,290 |
|
| SKF AB Class B (c) | 5,147 | 82,903 |
|
| Svenska Cellulosa AB SCA Class B (c) | 7,503 | 217,695 |
|
| Svenska Handelsbanken AB Class A (c) | 19,071 | 251,507 |
|
| Swedbank AB Class A (c) | 11,533 | 253,059 |
|
| Swedish Match AB (c) | 2,543 | 89,888 |
|
| Tele2 AB Class B (c) | 4,201 | 41,692 |
|
| Telefonaktiebolaget LM Ericsson Class B (c) | 38,759 | 375,105 |
|
| TeliaSonera AB (c) | 33,088 | 164,389 |
|
| Volvo AB Class B (c) | 19,634 | 181,097 |
|
| | | 4,419,240 |
|
| | | |
| Switzerland - 9.5% | | |
| ABB Ltd.* (c) | 28,006 | 496,984 |
|
| Actelion Ltd.* (c) | 1,308 | 179,934 |
|
| Adecco SA* (c) | 2,111 | 144,913 |
|
| Aryzta AG* (c) | 1,110 | 56,148 |
|
| Baloise Holding AG (c) | 636 | 80,632 |
|
| Barry Callebaut AG* (c) | 28 | 30,530 |
|
| Chocoladefabriken Lindt & Sprungli AG: | | |
| Participation Certificate (c) | 12 | 74,733 |
|
| Registered Shares (c) | 1 | 74,410 |
|
| Cie Financiere Richemont SA (c) | 6,648 | 477,429 |
|
| Coca-Cola HBC AG* (c) | 2,546 | 54,293 |
|
| Credit Suisse Group AG* (c) | 22,873 | 494,239 |
|
| Dufry AG* (c) | 522 | 61,898 |
|
| EMS-Chemie Holding AG (c) | 107 | 46,841 |
|
| Galenica AG (c) | 49 | 76,378 |
|
| Geberit AG (c) | 481 | 161,743 |
|
| Givaudan SA* (c) | 117 | 210,471 |
|
| Glencore plc(c) | 155,832 | 207,381 |
|
| Julius Baer Group Ltd.* (c) | 2,850 | 136,605 |
|
| Kuehne + Nagel International AG (c) | 687 | 94,174 |
|
| LafargeHolcim Ltd.* (c) | 5,405 | 270,764 |
|
| Lonza Group AG* (c) | 673 | 109,385 |
|
| Nestle SA (c) | 40,607 | 3,009,188 |
|
| Novartis AG (c) | 28,980 | 2,476,494 |
|
| Pargesa Holding SA (c) | 406 | 25,571 |
|
| Partners Group Holding AG (c) | 204 | 73,225 |
|
| Roche Holding AG (c) | 8,947 | 2,465,072 |
|
| Schindler Holding AG: | | |
| Participation Certificate (c) | 563 | 94,249 |
|
22 www.calvert.com CALVERT VP EAFE INTERNATIONAL INDEX PORTFOLIO ANNUAL REPORT
|
| | | |
| | SHARES | VALUE ($) |
| COMMON STOCKS - Cont'd | | |
| Registered Shares (c) | 269 | 45,125 |
|
| SGS SA (c) | 69 | 131,418 |
|
| Sika AG (c) | 27 | 96,767 |
|
| Sonova Holding AG (c) | 695 | 88,206 |
|
| Sulzer AG (c) | 315 | 29,614 |
|
| Swatch Group AG (The): | | |
| Bearer Shares (c) | 392 | 136,764 |
|
| Registered Shares (c) | 653 | 44,101 |
|
| Swiss Life Holding AG* (c) | 408 | 109,472 |
|
| Swiss Prime Site AG* (c) | 842 | 65,733 |
|
| Swiss Re AG (c) | 4,485 | 436,184 |
|
| Swisscom AG (c) | 329 | 163,576 |
|
| Syngenta AG (c) | 1,183 | 464,216 |
|
| Transocean Ltd. (c) | 4,630 | 57,560 |
|
| UBS Group AG (c) | 46,565 | 895,869 |
|
| Wolseley plc (c) | 3,304 | 179,632 |
|
| Zurich Insurance Group AG* (c) | 1,915 | 488,508 |
|
| | | 15,116,429 |
|
| United Kingdom - 17.3% | | |
| 3i Group plc(c) | 12,386 | 87,316 |
|
| Aberdeen Asset Management plc (c) | 11,749 | 50,061 |
|
| Admiral Group plc (c) | 2,671 | 64,979 |
|
| Aggreko plc (c) | 3,262 | 43,884 |
|
| Amec Foster Wheeler plc (c) | 5,048 | 31,881 |
|
| Anglo American plc (c) | 17,853 | 78,671 |
|
| Antofagasta plc (c) | 5,191 | 35,578 |
|
| ARM Holdings plc (c) | 17,886 | 270,136 |
|
| Ashtead Group plc (c) | 6,410 | 105,492 |
|
| Associated British Foods plc (c) | 4,537 | 223,363 |
|
| AstraZeneca plc (c) | 16,095 | 1,088,351 |
|
| Auto Trader Group plc(b)(c) | 9,562 | 62,496 |
|
| Aviva plc (c) | 51,527 | 389,407 |
|
| Babcock International Group plc (c) | 3,210 | 47,809 |
|
| BAE Systems plc (c) | 40,297 | 296,627 |
|
| Barclays plc (c) | 213,689 | 691,760 |
|
| Barratt Developments plc (c) | 12,841 | 117,692 |
|
| BG Group plc (c) | 43,502 | 630,943 |
|
| BHP Billiton plc (c) | 26,899 | 302,050 |
|
| BP plc (c) | 232,926 | 1,213,970 |
|
| British American Tobacco plc (c) | 23,742 | 1,318,832 |
|
| British Land Co. plc (The) REIT (c) | 12,397 | 142,716 |
|
| BT Group plc (c) | 106,605 | 736,894 |
|
| Bunzl plc (c) | 4,267 | 117,891 |
|
| Burberry Group plc (c) | 5,665 | 99,658 |
|
| Capita plc (c) | 8,463 | 150,601 |
|
| Carnival plc (c) | 2,345 | 133,166 |
|
| Centrica plc (c) | 64,396 | 206,876 |
|
| Cobham plc (c) | 14,738 | 61,187 |
|
| Compass Group plc (c) | 20,985 | 363,266 |
|
| Croda International plc (c) | 1,757 | 78,326 |
|
| Diageo plc (c) | 32,037 | 873,813 |
|
| Direct Line Insurance Group plc (c) | 17,512 | 104,622 |
|
www.calvert.com CALVERT VP EAFE INTERNATIONAL INDEX PORTFOLIO ANNUAL REPORT 23
|
| | | |
| | SHARES | VALUE ($) |
| COMMON STOCKS - Cont'd | | |
| Dixons Carphone plc (c) | 12,669 | 93,124 |
|
| easyJet plc (c) | 2,023 | 51,793 |
|
| Fresnillo plc (c) | 2,910 | 30,462 |
|
| G4S plc (c) | 20,084 | 66,718 |
|
| GKN plc (c) | 21,825 | 99,100 |
|
| GlaxoSmithKline plc (c) | 61,981 | 1,252,104 |
|
| Hammerson plc REIT (c) | 10,153 | 89,747 |
|
| Hargreaves Lansdown plc (c) | 3,322 | 73,568 |
|
| HSBC Holdings plc (c) | 249,140 | 1,966,406 |
|
| ICAP plc (c) | 7,046 | 52,903 |
|
| IMI plc (c) | 3,463 | 43,695 |
|
| Imperial Tobacco Group plc (c) | 12,189 | 641,196 |
|
| Inmarsat plc (c) | 5,725 | 95,403 |
|
| InterContinental Hotels Group plc (c) | 3,007 | 116,702 |
|
| Intertek Group plc (c) | 2,088 | 85,407 |
|
| Intu Properties plc REIT (c) | 12,136 | 56,724 |
|
| Investec plc (c) | 7,077 | 49,951 |
|
| ITV plc (c) | 48,783 | 198,810 |
|
| J Sainsbury plc (c) | 17,536 | 66,834 |
|
| Johnson Matthey plc (c) | 2,609 | 101,330 |
|
| Kingfisher plc (c) | 29,370 | 142,238 |
|
| Land Securities Group plc REIT (c) | 10,069 | 174,596 |
|
| Legal & General Group plc (c) | 75,729 | 298,712 |
|
| Lloyds Banking Group plc (c) | 727,216 | 782,849 |
|
| London Stock Exchange Group plc (c) | 3,993 | 161,390 |
|
| Marks & Spencer Group plc (c) | 20,940 | 139,177 |
|
| Meggitt plc (c) | 9,867 | 54,433 |
|
| Melrose Industries plc (c) | 12,675 | 54,093 |
|
| Merlin Entertainments plc (c) | 9,037 | 60,571 |
|
| Mondi plc (c) | 4,677 | 91,228 |
|
| National Grid plc (c) | 47,677 | 655,871 |
|
| Next plc (c) | 1,849 | 198,245 |
|
| Old Mutual plc (c) | 62,767 | 165,287 |
|
| Pearson plc (c) | 10,456 | 113,018 |
|
| Persimmon plc* (c) | 3,904 | 116,608 |
|
| Petrofac Ltd. (c) | 3,415 | 40,019 |
|
| Provident Financial plc (c) | 1,871 | 92,684 |
|
| Prudential plc (c) | 32,745 | 733,216 |
|
| Randgold Resources Ltd. (c) | 1,187 | 73,254 |
|
| Reckitt Benckiser Group plc (c) | 8,149 | 750,234 |
|
| RELX NV (c) | 12,670 | 212,881 |
|
| RELX plc (c) | 14,226 | 249,459 |
|
| Rexam plc (c) | 9,126 | 80,967 |
|
| Rio Tinto plc (c) | 15,965 | 465,341 |
|
| Rolls-Royce Holdings plc* (c) | 23,417 | 198,246 |
|
| Royal Bank of Scotland Group plc* (c) | 44,221 | 195,675 |
|
| Royal Mail plc (c) | 11,462 | 74,598 |
|
| RSA Insurance Group plc (c) | 13,161 | 82,717 |
|
| SABMiller plc (c) | 12,362 | 740,605 |
|
| Sage Group plc (The) (c) | 13,737 | 122,161 |
|
| Schroders plc (c) | 1,609 | 70,086 |
|
| Segro plc REIT (c) | 9,520 | 60,106 |
|
24 www.calvert.com CALVERT VP EAFE INTERNATIONAL INDEX PORTFOLIO ANNUAL REPORT
|
| | | |
| | SHARES | VALUE ($) |
| COMMON STOCKS - Cont'd | | |
| Severn Trent plc (c) | 3,015 | 96,709 |
|
| Sky plc (c) | 13,149 | 215,167 |
|
| Smith & Nephew plc (c) | 11,401 | 201,829 |
|
| Smiths Group plc (c) | 5,110 | 70,704 |
|
| Sports Direct International plc* (c) | 3,545 | 30,062 |
|
| SSE plc (c) | 12,648 | 283,269 |
|
| St James's Place plc (c) | 6,670 | 98,395 |
|
| Standard Chartered plc (c) | 41,689 | 345,924 |
|
| Standard Life plc (c) | 25,081 | 143,933 |
|
| Tate & Lyle plc (c) | 5,940 | 52,356 |
|
| Taylor Wimpey plc (c) | 41,436 | 123,756 |
|
| Tesco plc* (c) | 103,632 | 228,124 |
|
| Travis Perkins plc (c) | 3,169 | 91,579 |
|
| Unilever plc (c) | 16,346 | 700,018 |
|
| United Utilities Group plc (c) | 8,684 | 119,697 |
|
| Vodafone Group plc (c) | 338,110 | 1,093,811 |
|
| Weir Group plc (The) (c) | 2,762 | 40,633 |
|
| Whitbread plc (c) | 2,323 | 150,148 |
|
| William Hill plc (c) | 11,256 | 65,696 |
|
| WM Morrison Supermarkets plc (c) | 28,253 | 61,324 |
|
| WPP plc (c) | 16,496 | 379,765 |
|
| | | 27,495,755 |
|
| | | |
| Total Common Stocks (Cost $141,972,417) | | 155,829,055 |
|
| | | |
| | | |
| PREFERRED STOCKS - 0.5% | | |
| Germany - 0.5% | | |
| Bayerische Motoren Werke AG (c) | 694 | 58,084 |
|
| Fuchs Petrolub SE (c) | 915 | 43,196 |
|
| Henkel AG (c) & Co. KGaA (c) | 2,269 | 252,721 |
|
| Porsche Automobil Holding SE (c) | 1,950 | 105,580 |
|
| Volkswagen AG (c) | 2,363 | 342,043 |
|
| | | 801,624 |
|
| | | |
| Italy - 0.0% | | |
| Intesa Sanpaolo SpA: | | |
| OTC (c) | 12,277 | 37,316 |
|
| | | |
| Total Preferred Stocks (Cost $715,947) | | 838,940 |
|
| | | |
| | | |
| RIGHTS - 0% | | |
| Ascendas Real Estate Investment Trust REIT* | 1,008 | 50 |
|
| Repsol SA* | 13,376 | 6,667 |
|
| Unione di Banche Italiane SCPA(a)(c) | 11,672 | — |
|
| | | |
| Total Rights (Cost $6,761) | | 6,717 |
|
| | | |
| | | |
www.calvert.com CALVERT VP EAFE INTERNATIONAL INDEX PORTFOLIO ANNUAL REPORT 25
|
| | | | |
| | SHARES | VALUE ($) |
| COMMON STOCKS - Cont'd | | |
| EXCHANGE-TRADED PRODUCTS - 0.9% | | |
| iShares MSCI EAFE ETF | 24,605 | 1,445,544 |
|
| | | |
| Total Exchange-Traded Products (Cost $1,473,485) | | 1,445,544 |
|
| | | |
| | | |
| | PRINCIPAL
AMOUNT ($) | VALUE ($) |
| TIME DEPOSIT - 0.1% | | |
| State Street Bank Time Deposit, 0.278%, 1/4/16 | 75,001 | 75,001 |
|
| | | |
| Total Time Deposit (Cost $75,001) | | 75,001 |
|
| | | |
| | | |
| TOTAL INVESTMENTS (Cost $144,243,611) - 99.7% | | 158,195,257 |
|
| Other assets and liabilities, net - 0.3% | | 521,411 |
|
NET ASSETS - 100.0% | |
| $158,716,668 |
|
|
|
| NOTES TO SCHEDULE OF INVESTMENTS |
| * Non-income producing security. |
| (a)This security was valued under the direction of the Board of Directors. See Note A. |
| (b) Security is exempt from registration under Rule 144A of the Securities Act of 1933. These securities may be resold in transactions exempt from registration, normally to qualified institutional buyers. |
| (c) Due to significant market movements following the close of trading in the local markets, the value of this security as of December 31, 2015 was adjusted by a third party pricing service. See Note A. |
|
| |
| Abbreviations: |
| ADR: | American Depositary Receipts |
| CVA: | Certificaten Van Aandelen |
| ETF: | Exchanged-Traded Fund |
| FDR: | Fiduciary Depositary Receipts |
| Ltd.: | Limited |
| plc: | Public Limited Company |
| REIT: | Real Estate Investment Trust |
| SDR: | Swedish Depositary Receipts |
| See notes to financial statements. |
26 www.calvert.com CALVERT VP EAFE INTERNATIONAL INDEX PORTFOLIO ANNUAL REPORT
CALVERT VP EAFE INTERNATIONAL INDEX PORTFOLIO
STATEMENT OF ASSETS AND LIABILITIES
DECEMBER 31, 2015
|
| | | |
| ASSETS | |
| Investments in securities, at value (Cost $144,243,611) - see accompanying schedule |
| $158,195,257 |
|
| Cash denominated in foreign currencies (Cost $152,776) | 152,738 |
|
| Receivable for securities sold | 202,461 |
|
| Receivable for shares sold | 55,528 |
|
| Directors' deferred compensation plan | 103,324 |
|
| Dividends and interest receivable | 429,684 |
|
| Total assets | 159,138,992 |
|
| | |
| LIABILITIES | |
| Payable for securities purchased | 42,415 |
|
| Payable for shares redeemed | 7,974 |
|
| Payable to Calvert Investment Management, Inc. | 75,428 |
|
| Payable to Calvert Investment Distributors, Inc. | 669 |
|
| Payable to Calvert Investment Administrative Services, Inc. | 13,644 |
|
| Payable to Calvert Investment Services, Inc. | 3,077 |
|
| Directors' deferred compensation plan | 103,324 |
|
| Accrued expenses and other liabilities | 175,793 |
|
| Total liabilities | 422,324 |
|
| NET ASSETS |
| $158,716,668 |
|
| | |
| NET ASSETS CONSIST OF: | |
| Paid-in capital applicable to the following shares of common stock outstanding; | |
| $0.10 par value, 20,000,000 shares authorized: | |
| Class I: 2,013,979 shares outstanding |
| $154,920,024 |
|
| Class F: 50,431 shares outstanding | 3,295,725 |
|
| Undistributed net investment income | 3,293,224 |
|
| Accumulated net realized gain (loss) on investments and foreign currency transactions | (16,708,069) |
|
Net unrealized appreciation (depreciation) on investments, foreign currencies, and assets and liabilities denominated in foreign currencies | 13,915,764 |
|
| NET ASSETS |
| $158,716,668 |
|
| | |
| NET ASSET VALUE PER SHARE | |
| Class I (based on net assets of $154,810,853) |
| $76.87 |
|
| Class F (based on net assets of $3,905,815) |
| $77.45 |
|
| See notes to financial statements. |
www.calvert.com CALVERT VP EAFE INTERNATIONAL INDEX PORTFOLIO ANNUAL REPORT 27
CALVERT VP EAFE INTERNATIONAL INDEX PORTFOLIO
STATEMENT OF OPERATIONS
YEAR ENDED DECEMBER 31, 2015
|
| | | |
| NET INVESTMENT INCOME | |
| Investment Income: | |
| Dividend income (net of foreign taxes withheld of $392,156) |
| $5,132,742 |
|
| Interest income | 294 |
|
| Total investment income | 5,133,036 |
|
| | |
| Expenses: | |
| Investment advisory fee | 972,444 |
|
| Administrative fees | 173,651 |
|
| Transfer agency fees and expenses | 19,570 |
|
| Distribution Plan expenses: | |
| Class F | 7,857 |
|
| Directors' fees and expenses | 31,143 |
|
| Accounting fees | 36,749 |
|
| Custodian fees | 193,574 |
|
| Professional fees | 39,546 |
|
| Reports to shareholders | 33,498 |
|
| Licensing fees | 79,460 |
|
| Miscellaneous | 71,946 |
|
| Total expenses | 1,659,438 |
|
| Reimbursement from Advisor: | |
| Class F | (1,928) |
|
| Net expenses | 1,657,510 |
|
| NET INVESTMENT INCOME | 3,475,526 |
|
| | |
| | |
| REALIZED AND UNREALIZED GAIN (LOSS) | |
| Net realized gain (loss) on: | |
| Investments | 1,892,385 |
|
| Foreign currency transactions | (40,441) |
|
| | 1,851,944 |
|
| | |
| Change in unrealized appreciation (depreciation) on: | |
| Investments and foreign currencies | (7,117,244) |
|
| Assets and liabilities denominated in foreign currencies | 2,830 |
|
| | (7,114,414) |
|
| | |
| NET REALIZED AND UNREALIZED GAIN (LOSS) | (5,262,470) |
|
| | |
| INCREASE (DECREASE) IN NET ASSETS RESULTING FROM OPERATIONS |
| ($1,786,944 | ) |
| See notes to financial statements. | |
28 www.calvert.com CALVERT VP EAFE INTERNATIONAL INDEX PORTFOLIO ANNUAL REPORT
CALVERT VP EAFE INTERNATIONAL INDEX PORTFOLIO
STATEMENTS OF CHANGES IN NET ASSETS
|
| | | | | | | |
| INCREASE (DECREASE) IN NET ASSETS | YEAR ENDED
DECEMBER 31, 2015 | | YEAR ENDED
DECEMBER 31, 2014 |
| Operations: | | | |
| Net investment income |
| $3,475,526 |
| |
| $4,502,246 |
|
| Net realized gain (loss) | 1,851,944 |
| | 1,433,985 |
|
| Change in unrealized appreciation (depreciation) | (7,114,414) |
| | (18,712,828) |
|
| | | | |
| INCREASE (DECREASE) IN NET ASSETS RESULTING FROM OPERATIONS | (1,786,944) |
| | (12,776,597) |
|
| | | | |
| Distributions to shareholders from: | | | |
| Net investment income: | | | |
| Class I shares | (412,021) |
| | (4,488,001) |
|
| Class F shares | (1,214) |
| | (86,279) |
|
| Total distributions | (413,235) |
| | (4,574,280) |
|
| | | | |
| Capital share transactions: | | | |
| Shares sold: | | | |
| Class I shares | 15,102,485 |
| | 43,703,214 |
|
| Class F shares | 1,000,627 |
| | 2,027,994 |
|
| Reinvestment of distributions: | | | |
| Class I shares | 412,021 |
| | 4,488,001 |
|
| Class F shares | 1,214 |
| | 86,279 |
|
| Shares redeemed: | | | |
| Class I shares | (28,984,820) |
| | (19,976,029) |
|
| Class F shares | (965,554) |
| | (940,769) |
|
| Total capital share transactions | (13,434,027) |
| | 29,388,690 |
|
| | | | |
| TOTAL INCREASE (DECREASE) IN NET ASSETS | (15,634,206) |
| | 12,037,813 |
|
| | | | |
| | | | |
| NET ASSETS | | | |
| Beginning of year | 174,350,874 |
| | 162,313,061 |
|
| End of year (including undistributed net investment income of $3,293,224 and $102,507, respectively) |
| $158,716,668 |
| |
| $174,350,874 |
|
| | | | |
| CAPITAL SHARE ACTIVITY | | | |
| Shares sold: | | | |
| Class I shares | 184,533 |
| | 503,078 |
|
| Class F shares | 12,356 |
| | 23,454 |
|
| Reinvestment of distributions: | | | |
| Class I shares | 5,262 |
| | 56,753 |
|
| Class F shares | 15 |
| | 1,082 |
|
| Shares redeemed: | | | |
| Class I shares | (351,455) |
| | (235,815) |
|
| Class F shares | (11,681) |
| | (11,029) |
|
| Total capital share activity | (160,970) |
| | 337,523 |
|
| See notes to financial statements. |
www.calvert.com CALVERT VP EAFE INTERNATIONAL INDEX PORTFOLIO ANNUAL REPORT 29
NOTES TO FINANCIAL STATEMENTS
NOTE A — SIGNIFICANT ACCOUNTING POLICIES
General: Calvert VP EAFE International Index Portfolio (the “Portfolio”), a series of Calvert Variable Products, Inc. (the “Fund”), is registered under the Investment Company Act of 1940 as a diversified, open-end management investment company. The Fund is comprised of eleven separate portfolios. The operations of each series of the Fund are accounted for separately. The Portfolio applies the accounting and reporting guidance in the Financial Accounting Standards Board (FASB) Accounting Standards Codification Topic 946, Financial Services – Investment Companies (ASC 946).
Shares of the Portfolio are sold without sales charge to affiliated and unaffiliated insurance companies for allocation to certain of their variable separate accounts. The Portfolio offers Class F and Class I shares. Class F shares are subject to Distribution Plan Expenses, while Class I shares are not. Each class has different: (a) dividend rates, due to differences in Distribution Plan expenses and other class-specific expenses, (b) exchange privileges; and (c) class-specific voting rights.
Security Valuation: Net asset value per share is determined every business day as of the close of the regular session of the New York Stock Exchange (generally 4:00 p.m. Eastern time). The Portfolio uses independent pricing services approved by the Board of Directors (“the Board”) to value its investments wherever possible. Investments for which market quotations are not available or deemed not reliable are fair valued in good faith under the direction of the Board.
The Board has adopted Valuation Procedures (the “Procedures”) to determine the fair value of securities and other financial instruments for which market prices are not readily available or which may not be reliably priced. The Board has delegated the day-to-day responsibility for determining the fair value of assets of the Portfolio to Calvert Investment Management, Inc. (the “Advisor” or “Calvert”) and has provided these Procedures to govern Calvert in its valuation duties.
Calvert has chartered an internal Valuation Committee to oversee the implementation of these Procedures and to assist it in carrying out the valuation responsibilities that the Board has delegated.
The Valuation Committee meets on a regular basis to review illiquid securities and other investments which may not have readily available market prices. The Valuation Committee’s fair valuation determinations are subject to review, approval and ratification by the Board at its next regularly scheduled meeting covering the calendar quarter in which the fair valuation was determined.
The Valuation Committee utilizes various methods to measure the fair value of the Portfolio’s investments. U.S. generally accepted accounting principles (GAAP) establishes a disclosure hierarchy that categorizes the inputs to valuation techniques used to value assets and liabilities at measurement date. These inputs are summarized in the three broad levels listed below:
Level 1 - quoted prices in active markets for identical securities
Level 2 - other significant observable inputs (including quoted prices for similar securities, interest rates, prepayment speeds, credit risk, etc.)
Level 3 - significant unobservable inputs (including the Portfolio’s own assumptions in determining the fair value of investments)
The inputs or methodologies used for valuing securities are not necessarily an indication of the risk associated with investing in those securities.
Changes in valuation techniques may result in transfers in or out of an investment’s assigned level within the hierarchy during the year. Transfers in and/or out of levels are determined based on the fair value of such securities at the end of the year. Valuation techniques used to value the Portfolio’s investments by major category are as follows:
Common stock, Preferred stock, and Rights securities, including restricted securities, for which market quotations are readily available, are valued at the last reported sale price or official closing price as reported by an independent pricing service on the primary market or exchange on which they are traded and are categorized as Level 1 in the hierarchy. In the event there were no sales during the day or closing prices are not available, securities are valued at the last quoted bid price or the last available price and are categorized as Level 2 in the hierarchy. Foreign securities are valued based on quotations from the principal market in which such securities are normally traded. If events occur after the close of the principal market in which foreign securities are traded, and before the close of business of the
30 www.calvert.com CALVERT VP EAFE INTERNATIONAL INDEX PORTFOLIO ANNUAL REPORT
Portfolio, that are expected to materially affect the value of those securities, then they are valued at their fair value taking these events into account and are categorized as Level 2 in the hierarchy. The Portfolio has retained a third party fair value pricing service to quantitatively analyze the price movement of its holdings on foreign exchanges and to automatically fair value if the variation from the prior day’s closing price exceeds specified parameters. Such securities would be categorized as Level 2 in the hierarchy in these circumstances. Utilizing this technique may result in transfers between Level 1 and Level 2.
Exchange-traded products are valued at the official closing price as reported by an independent pricing service on the primary market or exchange on which they are traded and are categorized as Level 1 in the hierarchy.
Short-term securities of sufficient credit quality with remaining maturities of sixty days or less for which quotations are not readily available are valued at amortized cost, which approximates fair value, and are categorized as Level 2 in the hierarchy.
If a market value cannot be determined for a security using the methodologies described above, or if, in the good faith opinion of the Advisor, the market value does not constitute a readily available market quotation, or if a significant event has occurred that would materially affect the value of the security, the security will be fair valued as determined in good faith by the Valuation Committee.
The Valuation Committee considers a number of factors, including significant unobservable valuation inputs when arriving at fair value. It considers all significant facts that are reasonably available and relevant to the determination of fair value.
The Valuation Committee primarily employs a market-based approach which may use related or comparable assets or liabilities, recent transactions, market multiples, book values, and other relevant information for the investment to determine the fair value of the investment. When more appropriate, the Portfolio may employ an income-based or cost approach. An income-based valuation approach discounts anticipated future cash flows of the investment to calculate a present amount (discounted). The measurement is based on the value indicated by current market expectations about those future amounts. Discounts may also be applied due to the nature or duration of any restrictions on the disposition of the investments. A cost based approach is based on the amount that currently would be required to replace the service capacity of an asset (current replacement cost). From the seller’s perspective, the price that would be received for the asset is determined based on the cost to a buyer to acquire or construct a substitute asset of comparable utility, adjusted for obsolescence.
The values assigned to fair value investments are based on available information and do not necessarily represent amounts that might ultimately be realized. Further, due to the inherent uncertainty of valuations of such investments, the fair values may differ significantly from the values that would have been used had an active market existed, and the differences could be material. The Valuation Committee employs various methods for calibrating these valuation approaches including a regular review of key inputs and assumptions, transactional back-testing or disposition analysis and reviews of any related market activity.
At December 31, 2015, securities valued at $0 or 0.0% of net assets, were fair valued in good faith under the direction of the Board.
www.calvert.com CALVERT VP EAFE INTERNATIONAL INDEX PORTFOLIO ANNUAL REPORT 31
The following table summarizes the market value of the Portfolio's holdings as of December 31, 2015, based on the inputs used to value them:
|
| | | | | | | | | | | |
| | VALUATION INPUTS |
| INVESTMENTS IN SECURITIES* | LEVEL 1 | LEVEL 2 | LEVEL 3 | TOTAL |
| Common Stocks** |
| $960,438 |
| $154,868,617*** |
| $0 |
|
| $155,829,055 |
|
| Preferred Stocks** | — |
| 838,940*** |
| — |
| 838,940 |
|
| Rights | 6,717 |
| — |
| — |
| 6,717 |
|
| Exchange-Traded Products | 1,445,544 |
| — |
| — |
| 1,445,544 |
|
| Time Deposit | — |
| 75,001 |
| — |
| 75,001 |
|
| TOTAL |
| $24,112,699 |
|
| $155,782,558 |
| $0^ |
|
| $158,195,257 |
|
| |
| * For a complete listing of investments, please refer to the Schedule of Investments. |
| ** For further breakdown of equity securities by country, please refer to the Schedule of Investments. |
| *** Includes certain securities trading primarily outside the U.S. whose value was adjusted as a result of significant market movements following the close of trading. |
| ^ Level 3 securities are valued at $0 and represent 0.0% of net assets. |
There were no transfers between levels during the year.
Security Transactions and Investment Income: Security transactions are accounted for on trade date. Realized gains and losses are recorded on an identified cost basis and may include proceeds from litigation. Dividend income is recorded on the ex-dividend date or, in the case of dividends on certain foreign securities, as soon as the Portfolio is informed of the ex-dividend date. Withholding taxes on foreign dividends have been provided for in accordance with the Portfolio’s understanding of the applicable country’s tax rules and rates. Distributions received on securities that represent a return of capital are recorded as a reduction of cost of investments. Distributions received on securities that represent a capital gain are recorded as a realized gain. Interest income, which includes amortization of premium and accretion of discount on debt securities, is accrued as earned. Investment income and realized and unrealized gains and losses are allocated to separate classes of shares based upon the relative net assets of each class. Expenses arising in connection with a specific class are charged directly to that class. Expenses common to the classes are allocated to each class in proportion to their relative net assets.
Foreign Currency Transactions: The Portfolio’s accounting records are maintained in U.S. dollars. For valuation of assets and liabilities on each date of net asset value determination, foreign denominations are converted into U.S. dollars using the current exchange rate. Security transactions, income, and expenses are translated at the prevailing rate of exchange on the date of the event. The effect of changes in foreign exchange rates on securities and foreign currencies is included in the net realized and unrealized gain or loss on investments and assets and liabilities denominated in foreign currencies.
Distributions to Shareholders: Distributions to shareholders are recorded by the Portfolio on ex-dividend date. Dividends from net investment income and distributions from net realized capital gains, if any, are paid at least annually. Distributions are determined in accordance with income tax regulations which may differ from U.S. generally accepted accounting principles; accordingly, periodic reclassifications are made within the Portfolio's capital accounts to reflect income and gains available for distribution under income tax regulations.
Estimates: The preparation of financial statements in conformity with U.S. generally accepted accounting principles requires management to make estimates and assumptions that affect the reported amounts of assets and liabilities and disclosure of contingent assets and liabilities at the date of the financial statements and the reported amounts of increases and decreases in net assets from operations during the reporting period. Actual results could differ from those estimates.
Federal Income Taxes: No provision for federal income or excise tax is required since the Portfolio intends to continue to qualify as a regulated investment company under the Internal Revenue Code and to distribute substantially all of its taxable earnings.
32 www.calvert.com CALVERT VP EAFE INTERNATIONAL INDEX PORTFOLIO ANNUAL REPORT
Management has analyzed the Portfolio's tax positions taken for all open federal income tax years and has concluded that no provision for federal income tax is required in the Portfolio's financial statements. A Portfolio's federal tax return is subject to examination by the Internal Revenue Service for a period of three years.
NOTE B — RELATED PARTY TRANSACTIONS
Calvert Investment Management, Inc. (the “Advisor”) is wholly-owned by Calvert Investments, Inc., which is indirectly wholly-owned by Ameritas Mutual Holding Company. The Advisor provides investment advisory services and pays the salaries and fees of officers and Directors of the Fund who are employees of the Advisor or its affiliates. For its services, the Advisor receives an annual fee, payable monthly, of 0.56%, of the Portfolio’s average daily net assets.
The Advisor has contractually agreed to limit net annual portfolio operating expenses through April 30, 2016. The contractual expense caps are 1.19% for Class F and 0.99% for Class I. For the purpose of this expense limit, operating expenses do not include interest expense, brokerage commissions, taxes, and extraordinary expenses. This expense limitation does not limit acquired fund fees and expenses, if any.
Calvert Investment Administrative Services, Inc. ("CIAS"), an affiliate of the Advisor, provides administrative services to the Portfolio for an annual fee, payable monthly, of 0.10% of the Portfolio’s average daily net assets.
On November 24, 2015, the Board of Directors approved the recommendation made by CIAS to standardize and rationalize the administrative fee paid by the Calvert Funds at 0.12% for all series and all share classes of the Calvert Funds. CIAS and the Fund have entered into an Amended and Restated Administrative Services Agreement that will establish a 0.12% administrative fee for all classes of the Fund commencing on May 1, 2016. CIAS has contractually agreed to waive 0.02% for Class F and Class I shares of the Fund (the difference between the current administrative fee and the new 0.12% fee) from May 1, 2016 through April 30, 2018.
Calvert Investment Distributors, Inc. (“CID”), an affiliate of the Advisor, is the distributor and principal underwriter for the Portfolio. Pursuant to Rule 12b-1 under the Investment Company Act of 1940, the Portfolio has adopted a Distribution Plan that permits the Portfolio to pay certain expenses associated with the distribution and servicing of its Class F shares. The expenses paid may not exceed 0.20% annually of the average daily net assets of Class F.
Calvert Investment Services, Inc. (“CIS”), an affiliate of the Advisor, acts as shareholder servicing agent for the Portfolio. For its services, CIS received a fee of $13,024 for the year ended December 31, 2015. Boston Financial Data Services, Inc. is the transfer and dividend disbursing agent.
Each Director of the Fund who is not an employee of the Advisor or its affiliates receives a fee of $1,500 for each Board and Committee meeting attended plus an annual fee of $44,000. Committee chairs receive an additional $5,000 annual retainer. Eligible Directors may participate in a Deferred Compensation Plan (the “Plan”). Obligations of the Plan will be paid solely out of the Portfolio’s assets. Directors’ fees are allocated to each of the portfolios served.
NOTE C — INVESTMENT ACTIVITY AND TAX INFORMATION
During the year, the cost of purchases and proceeds from sales of investments, other than short-term securities, were $16,488,333 and $25,904,160, respectively.
|
| | | |
| Capital Loss Carryforwards |
| EXPIRATION DATE |
| 2016 |
| ($13,985,501 | ) |
| 2017 | (15,978) |
|
Under the Regulated Investment Company Modernization Act of 2010, capital losses incurred in taxable years beginning after December 22, 2010 can be carried forward to offset future capital gains for an unlimited period. These losses are required to be utilized prior to the losses incurred in pre-enactment taxable years and will retain their character as either long-term or short-term. Losses incurred in pre-enactment taxable years can be utilized until expiration. The Portfolio's use of net capital losses acquired from reorganizations may be limited under certain tax provisions.
www.calvert.com CALVERT VP EAFE INTERNATIONAL INDEX PORTFOLIO ANNUAL REPORT 33
The tax character of dividends and distributions paid during the years ended December 31, 2015 and December 31, 2014 was as follows:
|
| | | | | | |
| DISTRIBUTIONS PAID FROM: | 2015 | 2014 |
| Ordinary income |
| $413,235 |
|
| $4,574,280 |
|
| Total |
| $413,235 |
|
| $4,574,280 |
|
As of December 31, 2015, the tax basis components of distributable earnings/(accumulated losses) and the federal tax cost were as follows:
|
| | | |
| Unrealized appreciation |
| $29,348,175 |
|
| Unrealized (depreciation) | (18,598,061) |
|
| Net unrealized appreciation (depreciation) |
| $10,750,114 |
|
| Undistributed ordinary income |
| $3,788,165 |
|
| Capital loss carryforward |
| ($14,001,479 | ) |
| Federal income tax cost of investments |
| $147,445,143 |
|
The differences between the components of distributable earnings on a tax basis and the amounts reflected in the Statement of Assets and Liabilities are primarily due to temporary book-tax differences that will reverse in a subsequent period. These differences are mainly due to wash sales, passive foreign investment companies, and income reclassifications.
Reclassifications, as shown in the table below, have been made to the Portfolio's components of net assets to reflect income and gains available for distribution (or available capital loss carryovers, as applicable) under income tax law and regulations. These reclassifications are due to permanent book-tax differences and have no impact on net assets. The primary permanent differences causing such reclassifications for the Fund are due to foreign currency transactions and passive foreign investment companies.
|
| | | |
| Undistributed net investment income |
| $128,426 |
|
| Accumulated net realized gain (loss) | (128,426) |
|
NOTE D — LINE OF CREDIT
A financing agreement is in place with the Calvert Funds and State Street Corporation (“SSC”). Under the agreement, SSC provides an unsecured line of credit facility, in the aggregate amount of $50 million ($25 million committed and $25 million uncommitted), accessible by the Calvert Funds for temporary or emergency purposes only. Borrowings bear interest at the higher of the London Interbank Offered Rate (LIBOR) or the overnight Federal Funds Rate plus 1.25% per annum. A commitment fee of 0.20% per annum is incurred on the unused portion of the committed facility. An administrative fee of $25,000 was paid in connection with the uncommitted facility. These fees are allocated to all participating funds. The Portfolio had no loans outstanding pursuant to this line of credit at December 31, 2015.
For the year ended December 31, 2015, borrowing information by the Portfolio under the agreement was as follows:
|
| | | |
| Average Daily Balance | Weighted Average Interest Rate | Maximum Amount Borrowed | Month of Maximum Amount Borrowed |
| $86,482 | 1.41% | 5,499,001 | May 2015 |
NOTE E — SUBSEQUENT EVENTS
In preparing the financial statements as of December 31, 2015, no subsequent events or transactions occurred that would have required recognition or disclosure in these financial statements.
34 www.calvert.com CALVERT VP EAFE INTERNATIONAL INDEX PORTFOLIO ANNUAL REPORT
NOTICE TO SHAREHOLDERS (UNAUDITED)
For the fiscal year ended December 31, 2015, the Portfolio considers 0% of the ordinary dividends paid during the year as qualified dividend income and as eligible for the corporate dividends received deduction in accordance with Section 854 of the Internal Revenue Code. It also considers $5,560,066 as income derived from foreign sources and $307,370 as foreign taxes paid.
www.calvert.com CALVERT VP EAFE INTERNATIONAL INDEX PORTFOLIO ANNUAL REPORT 35
CALVERT VP EAFE INTERNATIONAL INDEX PORTFOLIO
FINANCIAL HIGHLIGHTS
|
| | | | | | | | | | | | | | | | | | | | |
| | YEARS ENDED | |
| CLASS I SHARES | December 31, 2015(a) | | December 31, 2014(a) | | December 31, 2013(a) | | December 31, 2012(a) | | December 31, 2011(a) | |
| Net asset value, beginning |
| $78.33 |
| |
| $85.97 |
| |
| $72.87 |
| |
| $63.54 |
| |
| $74.78 |
| |
| Income from investment operations: | | | | | | | | | | |
| Net investment income | 1.63 |
| | 2.24 |
| | 1.70 |
| | 1.70 |
| | 1.85 |
| |
| Net realized and unrealized gain (loss) | (2.88) |
| | (7.75) |
| | 13.34 |
| | 9.30 |
| | (11.37) |
| |
| Total from investment operations | (1.25) |
| | (5.51) |
| | 15.04 |
| | 11.00 |
| | (9.52) |
| |
| Distributions from: | | | | | | | | | | |
| Net investment income | (0.21) |
| | (2.13) |
| | (1.94) |
| | (1.67) |
| | (1.72) |
| |
| Net realized gain | — |
| | — |
| | — |
| | — |
| | — |
| |
| Total distributions | (0.21) |
| | (2.13) |
| | (1.94) |
| | (1.67) |
| | (1.72) |
| |
| Total increase (decrease) in net asset value | (1.46) |
| | (7.64) |
| | 13.10 |
| | 9.33 |
| | (11.24) |
| |
| Net asset value, ending |
| $76.87 |
| |
| $78.33 |
| |
| $85.97 |
| |
| $72.87 |
| |
| $63.54 |
| |
| Total return (b) | (1.61 | %) | | (6.44 | %) | | 20.72 | % | | 17.34 | % | | (12.71 | %) | |
| Ratios to average net assets: (c) | | | | | | | | | | |
| Net investment income | 2.01 | % | | 2.63 | % | | 2.15 | % | | 2.51 | % | | 2.53 | % | |
| Total expenses | 0.95 | % | | 0.98 | % | | 0.97 | % | | 0.96 | % | | 1.00 | % | |
| Net expenses | 0.95 | % | | 0.98 | % | | 0.97 | % | | 0.96 | % | | 0.95 | % | |
| Portfolio turnover | 10 | % | | 28 | % | | 12 | % | | 16 | % | | 24 | % | |
| Net assets, ending (in thousands) |
| $154,811 |
| |
| $170,425 |
| |
| $159,182 |
| |
| $142,443 |
| |
| $122,329 |
| |
| | | | | | | | | | | |
| (a)Per share figures are calculated using the Average Shares Method. |
| (b)Total return is not annualized for periods of less than one year and does not reflect charges and expenses of the variable annuity or variable universal life contract. |
| (c)Total expenses do not reflect amounts reimbursed and/or waived by the Advisor and certain of its affiliates, if applicable. Net expenses are net of all reductions and represent the net expenses paid by the Portfolio. |
| See notes to financial statements. |
36 www.calvert.com CALVERT VP EAFE INTERNATIONAL INDEX PORTFOLIO ANNUAL REPORT
CALVERT VP EAFE INTERNATIONAL INDEX PORTFOLIO
FINANCIAL HIGHLIGHTS
|
| | | | | | | | | | | | | | | | | | | | |
| | YEARS ENDED | |
| CLASS F SHARES | December 31, 2015 (a) | | December 31, 2014 (a) | | December 31, 2013 (a) | | December 31, 2012 (a) | | December 31, 2011 (a) | |
| Net asset value, beginning |
| $78.93 |
| |
| $86.41 |
| |
| $73.19 |
| |
| $65.66 |
| |
| $76.90 |
| |
| Income from investment operations: | | | | | | | | | | |
| Net investment income | 1.44 |
| | 2.03 |
| | 1.49 |
| | 1.80 |
| | 1.67 |
| |
| Net realized and unrealized gain (loss) | (2.90) |
| | (7.74) |
| | 13.44 |
| | 9.36 |
| | (11.60) |
| |
| Total from investment operations | (1.46) |
| | (5.71) |
| | 14.93 |
| | 11.16 |
| | (9.93) |
| |
| Distributions from: | | | | | | | | | | |
| Net investment income | (0.02) |
| | (1.77) |
| | (1.71) |
| | (3.63) |
| | (1.31) |
| |
| Net realized gain | — |
| | — |
| | — |
| | — |
| | — |
| |
| Total distributions | (0.02) |
| | (1.77) |
| | (1.71) |
| | (3.63) |
| | (1.31) |
| |
| Total increase (decrease) in net asset value | (1.48) |
| | (7.48) |
| | 13.22 |
| | 7.53 |
| | (11.24) |
| |
| Net asset value, ending |
| $77.45 |
| |
| $78.93 |
| |
| $86.41 |
| |
| $73.19 |
| |
| $65.66 |
| |
| Total return (b) | (1.84 | %) | | (6.62 | %) | | 20.47 | % | | 17.05 | % | | (12.90 | %) | |
| Ratios to average net assets (c) | | | | | | | | | | |
| Net investment income | 1.75 | % | | 2.37 | % | | 1.85 | % | | 2.66 | % | | 2.24 | % | |
| Total expenses | 1.24 | % | | 1.32 | % | | 1.26 | % | | 1.25 | % | | 1.25 | % | |
| Net expenses | 1.19 | % | | 1.19 | % | | 1.19 | % | | 1.18 | % | | 1.16 | % | |
| Portfolio turnover | 10 | % | | 28 | % | | 12 | % | | 16 | % | | 24 | % | |
| Net assets, ending (in thousands) |
| $3,906 |
| |
| $3,926 |
| |
| $3,131 |
| |
| $2,150 |
| |
| $6,429 |
| |
| | | | | | | | | | | |
| (a)Per share figures are calculated using the Average Shares Method. |
| (b)Total return is not annualized for periods of less than one year and does not reflect charges and expenses of the variable annuity or variable universal life contract. |
| (c)Total expenses do not reflect amounts reimbursed and/or waived by the Advisor and certain of its affiliates, if applicable. Net expenses are net of all reductions and represent the net expenses paid by the Portfolio. |
| See notes to financial statements. |
www.calvert.com CALVERT VP EAFE INTERNATIONAL INDEX PORTFOLIO ANNUAL REPORT 37
PROXY VOTING
The Proxy Voting Guidelines that the Portfolio uses to determine how to vote proxies relating to portfolio securities is provided as an Appendix to the Fund’s Statement of Additional Information. The Statement of Additional Information can be obtained free of charge by calling the Fund at 1-800-368-2745, by visiting the Calvert website at www.calvert.com or by visiting the SEC’s website at www.sec.gov.
Information regarding how the Fund voted proxies relating to portfolio securities during the most recent 12-month period ended June 30 is available by calling the Fund, by visiting the Calvert website at www.calvert.com or visiting the SEC’s website at www.sec.gov.
AVAILABILITY OF QUARTERLY PORTFOLIO HOLDINGS
The Fund files its complete schedule of portfolio holdings with the SEC for the first and third quarters of each fiscal year on Form N-Q. The Fund’s Form N-Q is available on the SEC’s website at www.sec.gov. The Fund’s Form N-Q may be reviewed and copied at the SEC’s Public Reference Room in Washington, DC; information on the operation of the Public Reference Room may be obtained by calling 1-800-SEC-0330.
BASIS FOR BOARD'S APPROVAL OF INVESTMENT ADVISORY CONTRACTS
At a meeting held on December 9, 2015, the Board of Directors, and by a separate vote, the disinterested Directors, approved the continuance of the Investment Advisory Agreement between the Portfolio and the Advisor and the Investment Subadvisory Agreement between the Advisor and the Subadvisor with respect to the Portfolio.
In evaluating the Investment Advisory Agreement, the Board considered a variety of information relating to the Portfolio and the Advisor. The disinterested Directors reviewed a report prepared by the Advisor regarding various services provided to the Portfolio by the Advisor and its affiliates. Such report included, among other data, information regarding the Advisor's personnel and the Advisor's revenue and cost of providing services to the Portfolio, and a separate report prepared by an independent third party, which provided a statistical analysis comparing the Portfolio's investment performance, expenses, and fees to comparable mutual funds.
The disinterested Directors were separately represented by independent legal counsel with respect to their consideration of the reapproval of the Investment Advisory Agreement and the Investment Subadvisory Agreement. Prior to voting, the disinterested Directors reviewed the proposed continuance of the Investment Advisory Agreement and Investment Subadvisory Agreement with management and also met in private sessions with their counsel at which no representatives of management were present.
In the course of its deliberations regarding the Investment Advisory Agreement, the Board considered the following factors, among others: the nature, extent and quality of the services provided by the Advisor, including the personnel providing such services; the Advisor's financial condition; the level and method of computing the Portfolio's advisory fee; comparative performance, fee and expense information for the Portfolio; the profitability of the Calvert Family of Funds to the Advisor and its affiliates; the allocation of the Portfolio's brokerage, including the Advisor's process for monitoring "best execution"; the direct and indirect benefits, if any, derived by the Advisor and its affiliates from their relationship with the Portfolio; the effect of the Portfolio's growth and size on the Portfolio's performance and expenses; the Advisor's compliance programs and policies; the Advisor's performance of substantially similar duties for other funds; and any possible conflicts of interest.
In considering the nature, extent and quality of the services provided by the Advisor under the Investment Advisory Agreement, the Board reviewed information provided by the Advisor relating to its operations and personnel, including, among other information, biographical information on the Advisor's supervisory and professional staff and descriptions of its organizational and management structure. The Board also took into account similar information provided periodically throughout the previous year by the Advisor, as well as the Board’s familiarity with the Advisor’s management through Board of Directors' meetings, discussions and other reports. The Board considered the Advisor's current level of staffing and overall resources. The Board also noted that it reviewed on a quarterly basis information regarding the Advisor’s compliance with applicable policies and procedures, including those related to personal investing. The Advisor's administrative capabilities, including its ability to supervise the other service providers for the Portfolio, were also considered. The Board discussed the Advisor's effectiveness in monitoring the performance of the Subadvisor and its timeliness in responding to performance issues. The Board observed that the scope of services provided by the Advisor
38 www.calvert.com CALVERT VP EAFE INTERNATIONAL INDEX PORTFOLIO ANNUAL REPORT (UNAUDITED)
generally had expanded over time as a result of regulatory, market and other changes. The Board took into consideration, among other factors, the effectiveness of the Portfolio’s and Advisor’s processes, policies and procedures and the Advisor’s personnel. The Board also took into account, among other items, periodic reports received from the Advisor over the past year concerning the Advisor’s ongoing review and enhancement of certain processes, policies and procedures of the Portfolio and the Advisor. The Board concluded that it was satisfied with the nature, extent and quality of services provided to the Portfolio by the Advisor under the Investment Advisory Agreement.
In considering the Portfolio's performance, the Board noted that it reviewed on a quarterly basis detailed information about the Portfolio's performance results, portfolio composition and investment strategies. In addition, the Board took into account overall financial market conditions. The Board also reviewed various comparative data provided to it in connection with its consideration of the renewal of the Investment Advisory Agreement, including, among other information, a comparison of the Portfolio's total return with that of other mutual funds deemed to be in its peer universe by an independent third party in its report. This comparison indicated that the Portfolio performed above the median of its peer universe for the one-year period ended June 30, 2015, and below the median of its peer universe for the three- and five-year periods ended June 30, 2015. The data also indicated that the Portfolio underperformed its Lipper index for the one-, three- and five-year periods ended June 30, 2015. The Board took into account management’s discussion of the Portfolio’s performance, including the impact of Portfolio expenses and fair valuation determinations on the Portfolio’s relative performance. Based upon its review, the Board concluded that the Portfolio’s performance was satisfactory relative to the performance of passively-managed funds that track the same benchmark index as does the Portfolio.
In considering the Portfolio's fees and expenses, the Board compared the Portfolio's fees and total expense ratio with various comparative data for the funds in its peer group. Among other findings, the data indicated that the Portfolio's advisory fee was above the median of its peer group and that total expenses were above the median of its peer group. The Board noted that the allocation of advisory and administrative fees may vary among the Portfolio’s peer group. The Board also took into account the Advisor’s current undertaking to maintain expense limitations for the Portfolio. The Board noted that the Advisor is not currently reimbursing any Portfolio expenses. The Board noted that the Advisor paid the Subadvisor’s subadvisory fee under the Investment Subadvisory Agreement with respect to the Portfolio. The Board also took into account management's discussion of the Portfolio's expenses and certain factors that affected the level of such expenses, including the current size of the Portfolio. Based upon its review, the Board determined that the advisory fee was reasonable in view of the quality of services received by the Portfolio from the Advisor and the other factors considered.
The Board reviewed the Advisor’s profitability on a portfolio-by-portfolio basis. In reviewing the overall profitability of the advisory fee to the Portfolio's Advisor, the Board also considered the fact that affiliates of the Advisor provided shareholder servicing, administrative and distribution services to the Portfolio for which they received compensation. The information considered by the Board included Calvert’s operating profit margin information both before and after tax expenses with respect to the services that the Advisor and its affiliates provided to the Calvert Family of Funds complex. The Board reviewed the profitability of the Advisor's relationship with the Portfolio in terms of the total amount of annual advisory fees it received with respect to the Portfolio and whether the Advisor had the financial wherewithal to continue to provide services to the Portfolio. The Board also considered that the Advisor derived benefits to its reputation and other indirect benefits from its relationship with the Portfolio. In addition, the Board took into account that affiliates of the Advisor may benefit from certain indirect tax benefits relating to dividend received deductions and foreign tax credits. The Board also noted that the Advisor paid the subadvisory fee to the Subadvisor. Based upon its review, the Board concluded that the Advisor’s and its affiliates’ level of profitability from their relationship with the Portfolio was reasonable.
The Board considered the effect of the Portfolio's current size and potential growth on its performance and fees. Although the Portfolio’s advisory fee did not contain breakpoints that would reduce the advisory fee rate on assets above specified asset levels, the Board noted that if the Portfolio’s assets increased over time, the Portfolio might realize other economies of scale if assets increased proportionally more than certain other expenses. The Board also noted that given the Portfolio’s current level of assets, the Portfolio would be unlikely to recognize economies of scale by implementing a breakpoint in the advisory fee at this time.
In reapproving the Investment Advisory Agreement, the Board, including the disinterested Directors, did not identify any single factor as controlling, and each Director may have attributed different weight to various factors.
www.calvert.com CALVERT VP EAFE INTERNATIONAL INDEX PORTFOLIO ANNUAL REPORT (UNAUDITED) 39
In evaluating the Investment Subadvisory Agreement, the disinterested Directors reviewed information provided by the Subadvisor relating to its operations, personnel, investment philosophy, strategies and techniques. Among other information, the Subadvisor provided biographical information on portfolio management and other professional staff, performance information for itself, and descriptions of its investment philosophies, strategies and techniques, organizational and management structures and brokerage policies and practices.
The Board reapproved the Investment Subadvisory Agreement between the Subadvisor and the Advisor based on a number of factors relating to the Subadvisor's ability to perform under the Investment Subadvisory Agreement. In the course of its deliberations, the Board evaluated, among other factors: the nature, extent and the quality of the services to be provided by the Subadvisor; the Subadvisor's management style and long-term performance record; the Portfolio's performance record and the Subadvisor's performance in employing its investment strategies; the Subadvisor's current level of staffing and its overall resources; the qualifications and experience of the Subadvisor's personnel; the Subadvisor's financial condition with respect to its ability to perform the services required under the Investment Subadvisory Agreement; the Subadvisor's risk management processes; the Subadvisor's compliance systems, including those related to personal investing; and any disciplinary history. Based upon its review, the Board concluded that it was satisfied with the nature, extent and quality of services provided to the Portfolio by the Subadvisor under the Investment Subadvisory Agreement.
As noted above, the Board considered, among other information, the Portfolio's performance during the one-, three- and five-year periods ended June 30, 2015, as compared to the Portfolio's peer universe, and noted that it reviewed on a quarterly basis detailed information about the Portfolio's performance results, portfolio composition and investment strategies. The Board noted the Advisor's expertise and resources in monitoring the performance, investment style and risk adjusted performance of the Subadvisor.
In considering the cost of services to be provided by the Subadvisor and the profitability to the Subadvisor of its relationship with the Portfolio, the Board noted that the subadvisory fee under the Investment Subadvisory Agreement was paid by the Advisor out of the advisory fee that the Advisor received under the Investment Advisory Agreement. The Board also relied on the ability of the Advisor to negotiate the Investment Subadvisory Agreement and the corresponding subadvisory fee at arm's length. In addition, the Board took into account the fees the Subadvisor charged to its other clients and considered these fee comparisons in light of the differences in managing these other accounts. Based upon its review, the Board determined that the subadvisory fee was reasonable in view of the quality of services received by the Portfolio from the Subadvisor and the other factors considered. Because the Advisor pays the Subadvisor’s subadvisory fee and the subadvisory fee was negotiated at arm’s length by the Advisor, the cost of services to be provided by the Subadvisor was not a material factor in the Board’s deliberations. For similar reasons, the Board did not consider the potential economies of scale in the Subadvisor’s management of the Portfolio to be a material factor in its consideration, although the Board noted that the subadvisory fee included breakpoints that would reduce the subadvisory fee on assets above certain specified asset levels.
In reapproving the Investment Subadvisory Agreement, the Board, including the disinterested Directors, did not identify any single factor as controlling, and each Director may have attributed different weight to various factors.
Conclusions
The Board reached the following conclusions regarding the Investment Advisory Agreement and the Investment Subadvisory Agreement, among others: (a) the Advisor has demonstrated that it possesses the capability and resources to perform the duties required of it under the Investment Advisory Agreement; (b) the Subadvisor is qualified to manage the Portfolio's assets in accordance with the Portfolio’s investment objective and policies; (c) the Advisor and Subadvisor maintain appropriate compliance programs; (d) the Subadvisor is likely to execute its investment strategies consistently over time; (e) the performance of the Portfolio is satisfactory relative to the performance of passively-managed funds that track the same benchmark index as does the Portfolio; and (f) the Portfolio's advisory and subadvisory fees are reasonable in view of the quality of services received by the Portfolio from the Advisor and Subadvisor and the other factors considered. Based on its conclusions, the Board determined that reapproval of the Investment Advisory Agreement and the Investment Subadvisory Agreement would be in the best interests of the Portfolio and its shareholders.
40 www.calvert.com CALVERT VP EAFE INTERNATIONAL INDEX PORTFOLIO ANNUAL REPORT (UNAUDITED)
DIRECTOR AND OFFICER INFORMATION TABLE
|
| | | | | |
| Name & Age | Position with Fund | Position Start Date | Principal Occupation During Last 5 Years | # of Calvert Portfolios Overseen | Other Directorships |
| INDEPENDENT DIRECTORS |
FRANK H. BLATZ, JR., Esq. AGE: 80 | Director | 1982 CVS
2008 CVP | Of counsel to firm of Schiller & Pittenger, P.C. | 13 | None |
ALICE GRESHAM BULLOCK AGE: 65 | Director | 1999 CVS
2008 CVP | Professor at Howard University School of Law. She is former Dean of Howard University School of Law and Deputy Director of the Association of American Law Schools. | 15 | None |
M. CHARITO KRUVANT AGE: 70 | Director | 1999 CVS
2008 CVP | President and CEO of Creative Associates International, Inc., a firm that specializes in human resources development, information management, public affairs and private enterprise development. | 22 | • Acacia Federal Savings Bank (through 2013) • Summit Foundation • WETA Public Broadcasting |
CYNTHIA MILLIGAN AGE: 69
| Director | 1999 CVS
2008 CVP | Dean Emeritus, College of Business Administration, University of Nebraska, Lincoln. She is former President and Chief Executive Officer for CMA, a consulting firm for financial institutions. | 15 | • Wells Fargo Company (banking and financial services) - NYSE • Wells Fargo Bank N.A. (Since 2014) • Gallup, Inc. (management consulting) • W.K. Kellogg Foundation • Raven Industries (technology company) - NASDAQ • Colonial Williamsburg Foundation • Kellogg Company (food manufacturing) - NYSE |
ARTHUR J. PUGH AGE: 78 | Director | 1982 CVS
2008 CVP | Retired executive. | 13 | None |
| INTERESTED DIRECTORS |
WILLIAM LESTER* AGE: 58 | Director & Chair (CVS)
Director & Senior Vice President (CVP) | 2004 CVS
2008 CVP | Executive Vice President Finance/Investments and Corporate Treasurer of Ameritas Mutual Holding Company. Chair and former President (resigned 2012) of Ameritas Investment Partners, Inc. | 13 | • Acacia Federal Savings Bank (through 2013)• Ameritas Investment Partners, Inc. (financial services)• Ameritas Investment Corp. (financial services)• Universal and Inland Insurance Companies• Bryan/LGH Health Systems |
www.calvert.com CALVERT VP EAFE INTERNATIONAL INDEX PORTFOLIO ANNUAL REPORT (UNAUDITED) 41
|
| | | | | |
| Name & Age | Position with Fund | Position Start Date | Principal Occupation During Last 5 Years | # of Calvert Portfolios Overseen | Other Directorships |
| INTERESTED DIRECTORS |
JOHN H. STREUR* AGE: 56
| President (CVS)
Director, Chair & President (CVP) | 2015 | President and Chief Executive Officer of Calvert Investments, Inc. (since January 2015) and Chief Compliance Officer for the Advisor and Calvert Investment Distributors, Inc. (since August 10, 2015); President and Director, Portfolio 21 Investments, Inc. (through October 2014); President, Chief Executive Officer and Director, Managers Investment Group LLC (through January 2012); President and Director, The Managers Funds and Managers AMG Funds (through January 2012). | 40 | • Portfolio 21 Investments, Inc. (asset management)(through October 2014) • Managers Investment Group LLC (asset management)(through January 2012) • The Managers Funds (asset management) (through January 2012) • Managers AMG Funds (asset management) (through January 2012) • Calvert Social Investment Foundation |
|
| | | |
| Name & Age | Position with Fund | Position Start Date | Principal Occupation During Last 5 Years |
| OFFICERS |
VICKI L. BENJAMIN AGE: 54 | Treasurer | 2015 | Executive Vice President, Chief Financial Officer and Chief Operating Officer of Calvert Investments, Inc. since October 2015; Senior Vice President and Chief Financial Officer of Calvert Investments, Inc. (March 2015 - September 2015). Prior to Calvert, Ms. Benjamin was a Senior Partner at KPMG. |
ROBERT D. BENSON, ESQ. AGE: 37 | Assistant Vice President & Assistant Secretary | 2014 | Assistant General Counsel (since 2014), Assistant Vice President & Assistant Secretary (since 2015) and Staff Attorney (prior to 2014), Calvert Investments, Inc. |
HOPE BROWN AGE: 42 | Chief Compliance Officer | 2014 | Chief Compliance Officer for the Calvert Funds (since 2014). Vice President and Chief Compliance Officer, Wilmington Funds (2012-2014). Vice President and Senior Compliance Officer, Wilmington Trust Investment Advisors, Inc. (2010-2012). |
STU DALHEIM AGE: 46 | Vice President | 2015 | Vice President - Shareholder Advocacy for the Advisor. |
MATTHEW DUCH Age: 40 | Vice President | 2011 | Vice President of the Advisor and portfolio manager for Calvert’s taxable fixed-income funds. |
ROBERT J. ENDERSON, CFA AGE: 57 | Assistant Treasurer | 2014 | Vice President, Corporate Finance, of Calvert Investments, Inc.; Acting Chief Financial Officer of Calvert Investments, Inc. (September 2014 - March 2015). |
PATRICK FAUL AGE: 51 | Vice President | 2010 | Vice President and Head of Credit Research for the Advisor. |
TRACI L. GOLDT AGE: 42 | Assistant Secretary | 2004 | SEC Filing and Administrative Operations Manager, Calvert Investments, Inc. |
JADE HUANG AGE: 41 | Vice President | 2015 | Equity Portfolio Manager since November 2015 and Senior Equity Analyst prior to November 2015, Advisor. |
EMILY KAISER AGE: 32 | Assistant Vice President | 2015 | Senior Sustainability Analyst since November 2015 and Sustainability Analyst (January 2014 - October 2015), Advisor. Prior to joining Calvert, Ms. Kaiser attended law school from 2010 to 2013 and also held legal and policy positions with the U.S. Agency for International Development (2013), the Solidarity Center, AFL-CIO (2013), the U.S. Department of Labor (2012), the office of the U.S. Trade Representative (2012) and the Public International Law and Policy Group (2011-2012). |
VISHAL KHANDUJA, CFA AGE: 37 | Vice President | 2014 | Head of Taxable Fixed Income (since 2015) and Vice President of the Advisor (since 2014); Portfolio Manager for Calvert’s taxable fixed-income funds since 2012. Previously worked at Columbia Management as Portfolio Manager - Global Rates and Currency Team (2009-2012). |
42 www.calvert.com CALVERT VP EAFE INTERNATIONAL INDEX PORTFOLIO ANNUAL REPORT (UNAUDITED)
|
| | | |
| Name & Age | Position with Fund | Position Start Date | Principal Occupation During Last 5 Years |
| OFFICERS |
LANCELOT A. KING, ESQ. AGE: 45 | Assistant Vice President & Secretary | 2002 | Assistant Vice President, Assistant Secretary and Associate General Counsel of Calvert Investments, Inc. |
ERICA LASDON AGE: 44 | Assistant Vice President | 2015 | Director of Sustainability Research since August 2015 and Senior Sustainability Analyst and Manager prior to August 2015, Advisor. |
JOSHUA LINDER AGE: 30 | Vice President | 2015 | Equity Portfolio Manager since November 2015, Assistant Portfolio Manager (January 2014 - October 2015) and Equity Analyst (2011 - 2013), Advisor. |
CHRISTOPHER MADDEN AGE: 40 | Vice President | 2015 | Equity Portfolio Manager since November 2015 and Senior Equity Analyst prior to November 2015, Advisor. |
ANDREW K. NIEBLER, ESQ. AGE: 48 | Assistant Vice President & Assistant Secretary | 2006 | Assistant Vice President, Assistant Secretary and Associate General Counsel of Calvert Investments, Inc. |
MARYBETH PILAT, CPA AGE: 47 | Fund Controller and Assistant Treasurer | 2015 | Director of Fund Administration, Calvert Investment Administrative Services, Inc. since August 2015. VP Expense & Budgeting, Global Fiduciary Platform, Legg Mason (May 2015 - July 2015). Vice President and Assistant Treasurer, Columbia Funds, Ameriprise, Columbia Management (2010 - April 2015). |
| |
| * | The address of Directors and Officers is 4550 Montgomery Avenue, Suite 1000N, Bethesda, Maryland 20814. Mr. Streur is an interested person of the Fund since he is an officer and director of the Fund’s Advisor and its affiliates. Mr. Lester is an interested person of the Fund since he is an officer and director of the parent company of the Fund’s Advisor. |
Additional information about the Fund’s Directors can be found in the Statement of Additional Information (SAI). You can get a free copy of the SAI by contacting your broker, or the Fund at 1-800-368-2745.
www.calvert.com CALVERT VP EAFE INTERNATIONAL INDEX PORTFOLIO ANNUAL REPORT (UNAUDITED) 43
|
| |
| | |
This report is intended to provide fund information to shareholders. It is not authorized for distribution to prospective investors unless preceded or accompanied by a prospectus. Note: The information on our website is not incorporated by reference into this report; our website address is included as an inactive textual reference only. Investors should carefully consider the investment objectives, risks, charges and expenses of the Calvert Funds. This and other important information is contained in the fund’s summary prospectus and prospectus, which can be obtained from your financial professional and should be read carefully before investing. You may also call Calvert at 800/368-2745. |
| Printed on recycled paper using soy inks. | |
|
| |
|
Calvert VP Investment Grade Bond Index Portfolio |
Annual Report December 31, 2015 | |
|
| | | | |
| | TABLE OF CONTENTS |
| | | | | |
| | | | | Portfolio Management Discussion |
| | | | | Understanding Your Fund's Expenses |
| | | | | Report of Independent Registered Public Accounting Firm |
| | | | | Schedule of Investments |
| | | | | Statement of Assets and Liabilities |
| | | | | Statement of Operations |
| | | | | Statements of Changes in Net Assets |
| | | | | Notes to Financial Statements |
| | | | | Financial Highlights |
| | | | | Proxy Voting |
| | | | | Availability of Quarterly Portfolio Holdings |
| | | | | Basis for Board’s Approval of Investment Advisory Contracts |
| | | | | Director and Officer Information Table |
|
| |
| PORTFOLIO MANAGEMENT DISCUSSION |
|
| |
| Tina J. Udell Ameritas Investment Partners, Inc. |
Market Review
While the US economy and labor markets continued to show signs of strength, the markets were plagued by continued falling oil prices, heightened concerns over global growth (especially China), renewed threats of terrorism and plummeting commodity prices. Treasury yields increased along the curve with the most profound impact on the front-end in conjunction with the anticipation of the Federal Reserve increasing short-term rates. As expected, the Federal Reserve hiked rates with two weeks left to spare in the year, after multiple quarters of debate over the timing of the liftoff. Higher rates resulted in lackluster performance in Treasuries. The credit markets had disappointing results as well, as credit spreads were forced higher in the second half of the year on the back of heightened credit risk aversion. The securitized sector had the strongest performance within the Index due to stable mortgage rates and a lack of the spread widening experienced by credit assets.
Investment Strategy and Technique:
The Portfolio employs a passive management approach in an effort to mirror, as closely as possible, the performance of the Barclays U.S. Aggregate Bond Index. However, with more than 9,700 securities in the Index, full replication is not feasible.
Therefore, we utilize a stratified sampling strategy to create a Portfolio of securities with similar characteristics to the Index, including duration, sector allocation and quality. Stratified sampling requires the portfolio manager to select securities in each sector to represent sectors in the Index. Since the Barclays U.S. Aggregate Index is not an actual mutual fund, it is not possible to invest in it directly. Unlike the Index, the Portfolio incurs operating expenses.
Fund Performance Relative to the Benchmark
For the year ended December 31, 2015, the Calvert VP Investment Grade Bond Index Portfolio Class I shares returned 0.04% compared with 0.55% for the Barclays U.S. Aggregate Bond Index. The underperformance was largely due to fees and operating expenses, which the Index does not incur.
|
| | | |
| ECONOMIC SECTORS | % OF TOTAL INVESTMENTS | |
| Government | 45.1 | % | |
| Mortgage Securities | 28.4 | % | |
| Financial | 7.9 | % | |
| Industrial | 3.3 | % | |
| Energy | 3.2 | % | |
| Communications | 2.9 | % | |
| Consumer, Non-cyclical | 2.6 | % | |
| Consumer, Cyclical | 1.6 | % | |
| Basic Materials | 1.5 | % | |
| Technology | 1.4 | % | |
| Short-Term Investments | 0.8 | % | |
| Utilities | 0.7 | % | |
| Asset Backed Securities | 0.6 | % | |
| Total | 100 | % | |
| | | |
Positioning and Market Outlook
The outlook for 2016 is for continued economic growth in the U.S., led by the consumer, who is supported by low energy prices and solid wage gains. It is anticipated the Fed will continue along its highly publicized path, with possibly four more rate increases in 2016, dependent on inflation and strength in the labor markets. Again the impact of higher rates will be more pronounced on the short-end of the curve with the longer-end moving higher, but remaining relatively range-bound. Stress in energy and commodities will bleed into the new year, continuing to put pressure on credit and corporate fundamentals until commodity prices stabilize.
Ameritas Investment Partners, Inc.
December 2015
www.calvert.com CALVERT VP INVESTMENT GRADE BOND INDEX PORTFOLIO ANNUAL REPORT (UNAUDITED) 1
Growth of $10,000
The graph below shows the value of a hypothetical $10,000 investment in the Portfolio over the past 10 fiscal year periods. The results shown are for Class I shares, and assume the reinvestment of dividends. The result is compared with a broad based market index. Market indexes are unmanaged and their results do not reflect the effect of expenses or sales charges. The value of an investment in a different share class would be different.
|
| | | | | | |
| CALVERT VP INVESTMENT GRADE BOND INDEX PORTFOLIO |
| DECEMBER 31, 2015 |
| AVERAGE ANNUAL TOTAL RETURNS | 1 Year | 5 Year | 10 Year |
| Class I | 0.04 | % | 3.00 | % | 4.35 | % |
| Class F | -0.01 | % | 2.99 | % | 4.34 | % |
| Barclays U.S. Aggregate Bond Index | 0.55 | % | 3.25 | % | 4.51 | % |
| | | | |
| Calvert VP Investment Grade Bond Index Portfolio first offered Class F shares on October 30, 2015. Performance prior to that date reflects the performance of Class I shares. Actual Class F share performance would have been different. |
| | | | |
The performance data shown represents past performance, does not guarantee future results and assumes reinvestment of all dividends and distributions. All performance data reflects fee waivers and/or expense limitations, if any are in effect; in their absence performance would be lower. See Note B in Notes to Financial Statements. The investment return and principal value of an investment will fluctuate so that an investor’s shares, when redeemed, may be worth more or less than their original cost. Current performance may be lower or higher than the performance data quoted.
Visit calvert.com/institutional-VP-performance.html for current performance data. The gross expense ratio from the current prospectus for the Portfolio is 0.50%. This number may vary from the expense ratio shown elsewhere in this report because it is based on a different time period and, if applicable, does not include fee or expense waivers. The performance data and expense ratio reflect deduction of Portfolio operating expenses, but do not reflect charges and expenses imposed under the variable annuity or life insurance contract.
2 www.calvert.com CALVERT VP INVESTMENT GRADE BOND INDEX PORTFOLIO ANNUAL REPORT (UNAUDITED)
UNDERSTANDING YOUR FUND'S EXPENSES
As an investor, you incur two types of costs. There are transaction costs. There are also ongoing costs, which generally include management fees and other fund expenses. The following information is intended to help you understand your ongoing costs (in dollars) of investing in this mutual fund and to help you compare these costs with the ongoing costs of investing in other mutual funds.
To illustrate these ongoing costs, we have provided examples and calculated the expenses paid by the fund's investors during the period. The actual and hypothetical information presented in the examples is based on an investment of $1,000 invested at the beginning of the period and held for the entire period (July 1, 2015 to December 31, 2015).
Note: Expenses do not reflect charges and expenses of the variable annuity or variable universal life contract.
Actual Expenses
The first line of the table below provides information about actual account values and actual expenses. You may use the information in this line, together with the amount you invested, to estimate the expenses that you paid over the period. Simply divide your account value by $1,000 (for example, an $8,600 account value divided by $1,000 = 8.6), then multiply the result by the number in the first line under the heading entitled “Expenses Paid During Period” to estimate the expenses you paid on your account during this period.
Hypothetical Example for Comparison Purposes
The second line of the table below provides information about hypothetical account values and hypothetical expenses based on the Fund’s actual expense ratio and an assumed rate of return of 5% per year before expenses, which is not the Fund’s actual return. The hypothetical account values and expenses may not be used to estimate the actual ending account balance or expenses you paid for the period. You may use this information to compare the ongoing costs of investing in the Fund and other funds. To do so, compare the 5% hypothetical example with the 5% hypothetical examples that appear in the shareholder reports of the other funds.
Please note that the expenses shown in the table are meant to highlight your ongoing costs only and do not reflect any transactional costs. Therefore, the second line of the table is useful in comparing ongoing costs only, and will not help you determine the relative total costs of owning different funds. In addition, if these transactional costs were included, your costs would have been higher.
|
| | | | |
| | ANNUALIZED
EXPENSE RATIO | BEGINNING
ACCOUNT VALUE
7/1/15 | ENDING
ACCOUNT VALUE
12/31/15 | EXPENSES PAID
DURING PERIOD*
7/1/15 - 12/31/15 |
| Class I | | | | |
| Actual | 0.53% | $1,000.00 | $1,002.40 | $2.67 |
| Hypothetical (5% return per year before expenses) | 0.53% | $1,000.00 | $1,022.53 | $2.70 |
| Class F | | | | |
| Actual | 0.78% | $1,000.00 | $1,001.90 | $3.94 |
| Hypothetical (5% return per year before expenses) | 0.78% | $1,000.00 | $1,021.27 | $3.97 |
| |
| * Expenses paid during the period are equal to the annualized expense ratio for each class as indicated above, multiplied by the average account value over the period, multiplied by 184/365 (to reflect the one-half year period). Expense ratios shown in the Financial Highlights represent the actual expenses incurred for the fiscal year. |
www.calvert.com CALVERT VP INVESTMENT GRADE BOND INDEX PORTFOLIO ANNUAL REPORT (UNAUDITED) 3
REPORT OF INDEPENDENT REGISTERED PUBLIC ACCOUNTING FIRM
The Board of Directors of Calvert Variable Products, Inc. and Shareholders of Calvert VP Investment Grade Bond Index Portfolio:
We have audited the accompanying statement of assets and liabilities, including the schedule of investments, of the Calvert VP Investment Grade Bond Index Portfolio (the “Portfolio”), a series of Calvert Variable Products, Inc., as of December 31, 2015, and the related statement of operations for the year then ended, the statements of changes in net assets for each of the years in the two-year period then ended, and the financial highlights for each of the years or periods in the five-year period then ended. These financial statements and financial highlights are the responsibility of the Portfolio’s management. Our responsibility is to express an opinion on these financial statements and financial highlights based on our audits.
We conducted our audits in accordance with the standards of the Public Company Accounting Oversight Board (United States). Those standards require that we plan and perform the audit to obtain reasonable assurance about whether the financial statements and financial highlights are free of material misstatement. An audit includes examining, on a test basis, evidence supporting the amounts and disclosures in the financial statements. Our procedures included confirmation of securities owned as of December 31, 2015, by correspondence with the custodian and brokers or by performing other appropriate auditing procedures. An audit also includes assessing the accounting principles used and significant estimates made by management, as well as evaluating the overall financial statement presentation. We believe that our audits provide a reasonable basis for our opinion.
In our opinion, the financial statements and financial highlights referred to above present fairly, in all material respects, the financial position of the Portfolio as of December 31, 2015, the results of its operations for the year then ended, the changes in its net assets for each of the years in the two-year period then ended, and the financial highlights for each of the years or periods in the five-year period then ended, in conformity with U.S. generally accepted accounting principles.
Philadelphia, Pennsylvania
February 24, 2016
4 www.calvert.com CALVERT VP INVESTMENT GRADE BOND INDEX PORTFOLIO ANNUAL REPORT
CALVERT VP INVESTMENT GRADE BOND INDEX PORTFOLIO
SCHEDULE OF INVESTMENTS
DECEMBER 31, 2015
|
| | | | |
| | PRINCIPAL
AMOUNT ($) | VALUE ($) |
|
| ASSET-BACKED SECURITIES - 0.6% | | |
| Asset-Backed - Automobile - 0.3% | | |
| American Credit Acceptance Receivables Trust, 2.84%, 5/15/19 (a) | 35,851 | 35,907 |
|
| Avis Budget Rental Car Funding AESOP LLC, 2.50%, 2/20/21 (a) | 150,000 | 149,677 |
|
| Santander Drive Auto Receivables Trust, 1.94%, 3/15/18 | 40,492 | 40,547 |
|
| World Omni Auto Receivables Trust, 0.87%, 7/15/19 | 300,000 | 298,884 |
|
| | | 525,015 |
|
| | | |
| Asset-Backed - Credit Card - 0.3% | | |
| Citibank Credit Card Issuance Trust, 1.02%, 2/22/19 | 75,000 | 74,820 |
|
| Synchrony Credit Card Master Note Trust, 1.36%, 8/17/20 | 200,000 | 199,011 |
|
| World Financial Network Credit Card Master Trust, 3.14%, 1/17/23 | 250,000 | 257,426 |
|
| | | 531,257 |
|
| | | |
| Asset-Backed - Other - 0.0% | | |
| MVW Owner Trust (a) | 46,391 | 45,611 |
|
| | | |
| Total Asset-Backed Securities (Cost $1,105,786) | | 1,101,883 |
|
| | | |
| | | |
| COMMERCIAL MORTGAGE-BACKED SECURITIES - 1.7% | | |
| Banc of America Commercial Mortgage Trust, 5.619%, 4/10/49 (b) | 550,000 | 556,585 |
|
| Citigroup Commercial Mortgage Trust: | | |
| 4.131%, 11/10/46 | 422,000 | 446,852 |
|
| 3.855%, 5/10/47 | 645,000 | 669,363 |
|
| DBUBS Mortgage Trust: | | |
| 3.386%, 7/10/44 (a) | 365,308 | 366,556 |
|
| 3.742%, 11/10/46 (a) | 214,862 | 215,248 |
|
| Morgan Stanley Capital I Trust, 3.476%, 6/15/44 (a) | 448,531 | 450,241 |
|
| UBS-Barclays Commercial Mortgage Trust, 2.85%, 12/10/45 | 625,000 | 613,273 |
|
| | | |
| Total Commercial Mortgage-Backed Securities (Cost $3,267,363) | | 3,318,118 |
|
| | | |
| | | |
| CORPORATE BONDS - 25.0% | | |
| Basic Materials - 1.5% | | |
| Alcoa, Inc., 5.72%, 2/23/19 | 149,000 | 154,416 |
|
| Barrick North America Finance LLC, 5.75%, 5/1/43 | 100,000 | 72,327 |
|
| Dow Chemical Co. (The), 4.375%, 11/15/42 | 100,000 | 87,089 |
|
| Ecolab, Inc., 4.35%, 12/8/21 | 150,000 | 160,165 |
|
| Freeport-McMoRan, Inc.: | | |
| 3.10%, 3/15/20 | 100,000 | 64,000 |
|
| 5.45%, 3/15/43 | 50,000 | 26,000 |
|
| Glencore Finance Canada Ltd., 3.60%, 1/15/17 (a) | 125,000 | 120,750 |
|
| LYB International Finance BV, 5.25%, 7/15/43 | 100,000 | 96,009 |
|
| Mosaic Co. (The), 5.625%, 11/15/43 | 400,000 | 383,399 |
|
| Reliance Steel & Aluminum Co., 4.50%, 4/15/23 | 200,000 | 186,172 |
|
www.calvert.com CALVERT VP INVESTMENT GRADE BOND INDEX PORTFOLIO ANNUAL REPORT 5
|
| | | | |
| | PRINCIPAL
AMOUNT ($) | VALUE ($) |
|
| CORPORATE BONDS - Cont'd | | |
| Rio Tinto Finance USA Ltd., 3.75%, 9/20/21 | 400,000 | 388,813 |
|
| Rio Tinto Finance USA plc, 3.50%, 3/22/22 | 150,000 | 141,385 |
|
| Teck Resources Ltd., 4.75%, 1/15/22 | 500,000 | 242,500 |
|
| Vale Overseas Ltd., 4.375%, 1/11/22 | 500,000 | 378,415 |
|
| Valspar Corp. (The), 4.20%, 1/15/22 | 300,000 | 305,850 |
|
| | | 2,807,290 |
|
| | | |
| Communications - 2.8% | | |
| 21st Century Fox America, Inc., 5.40%, 10/1/43 | 100,000 | 104,089 |
|
| Amazon.com, Inc., 2.50%, 11/29/22 | 200,000 | 193,493 |
|
| America Movil SAB de CV, 2.375%, 9/8/16 | 100,000 | 100,367 |
|
| AT&T, Inc.: | | |
| 2.95%, 5/15/16 | 100,000 | 100,609 |
|
| 3.90%, 3/11/24 | 200,000 | 204,217 |
|
| CCO Safari II LLC, 4.908%, 7/23/25 (a) | 500,000 | 499,513 |
|
| Comcast Corp., 3.125%, 7/15/22 | 100,000 | 101,627 |
|
| Crown Castle Towers LLC, 4.883%, 8/15/20 (a) | 300,000 | 320,706 |
|
| DIRECTV Holdings LLC, 5.20%, 3/15/20 | 200,000 | 216,601 |
|
| Discovery Communications LLC, 5.05%, 6/1/20 | 200,000 | 212,643 |
|
| NBCUniversal Media LLC: | | |
| 2.875%, 1/15/23 | 100,000 | 99,295 |
|
| 4.45%, 1/15/43 | 200,000 | 195,951 |
|
| Pearson Funding Two plc, 4.00%, 5/17/16 (a) | 250,000 | 251,766 |
|
| Telefonica Emisiones SAU, 3.992%, 2/16/16 | 100,000 | 100,275 |
|
| Time Warner, Inc.: | | |
| 4.875%, 3/15/20 | 100,000 | 108,118 |
|
| 4.00%, 1/15/22 | 290,000 | 300,447 |
|
| 5.375%, 10/15/41 | 100,000 | 102,303 |
|
| 4.90%, 6/15/42 | 200,000 | 188,016 |
|
| Verizon Communications, Inc.: | | |
| 5.15%, 9/15/23 | 300,000 | 329,798 |
|
| 5.05%, 3/15/34 | 200,000 | 199,264 |
|
| 6.55%, 9/15/43 | 350,000 | 415,524 |
|
| Viacom, Inc., 3.875%, 4/1/24 | 100,000 | 93,704 |
|
| WPP Finance 2010, 3.75%, 9/19/24 | 1,000,000 | 994,813 |
|
| | | 5,433,139 |
|
| | | |
| Consumer, Cyclical - 1.6% | | |
| BorgWarner, Inc., 5.75%, 11/1/16 | 500,000 | 515,752 |
|
| Cintas Corp. No. 2, 3.25%, 6/1/22 | 350,000 | 351,836 |
|
| CVS Pass-Through Trust, 6.036%, 12/10/28 | 95,838 | 105,248 |
|
| Ford Motor Credit Co. LLC: | | |
| 4.207%, 4/15/16 | 200,000 | 201,601 |
|
| 4.25%, 2/3/17 | 100,000 | 102,171 |
|
| 5.875%, 8/2/21 | 200,000 | 223,027 |
|
| Lowe's Co.'s, Inc., 3.875%, 9/15/23 | 100,000 | 105,839 |
|
| Toyota Motor Credit Corp., 2.05%, 1/12/17 | 100,000 | 100,859 |
|
| Wal-Mart Stores, Inc.: | | |
| 2.55%, 4/11/23 | 100,000 | 98,620 |
|
| 6.50%, 8/15/37 | 250,000 | 322,912 |
|
6 www.calvert.com CALVERT VP INVESTMENT GRADE BOND INDEX PORTFOLIO ANNUAL REPORT
|
| | | | |
| | PRINCIPAL
AMOUNT ($) | VALUE ($) |
|
| CORPORATE BONDS - Cont'd | | |
| Yum! Brands, Inc., 3.75%, 11/1/21 | 1,000,000 | 919,961 |
|
| | | 3,047,826 |
|
| | | |
| Consumer, Non-cyclical - 2.6% | | |
| AbbVie, Inc., 2.90%, 11/6/22 | 200,000 | 193,488 |
|
| Amgen, Inc., 4.10%, 6/15/21 | 700,000 | 737,214 |
|
| Anheuser-Busch InBev Finance, Inc.: | | |
| 2.625%, 1/17/23 | 100,000 | 95,968 |
|
| 4.00%, 1/17/43 | 100,000 | 90,054 |
|
| 4.625%, 2/1/44 | 1,000,000 | 993,940 |
|
| Cigna Corp., 4.00%, 2/15/22 | 400,000 | 413,436 |
|
| Dr Pepper Snapple Group, Inc., 3.20%, 11/15/21 | 75,000 | 75,333 |
|
| Equifax, Inc., 3.30%, 12/15/22 | 450,000 | 448,504 |
|
| Gilead Sciences, Inc., 3.70%, 4/1/24 | 100,000 | 102,432 |
|
| Hershey Co. (The), 1.50%, 11/1/16 | 50,000 | 50,234 |
|
| Kraft Foods Group, Inc., 3.50%, 6/6/22 | 100,000 | 101,095 |
|
| Kroger Co. (The), 3.85%, 8/1/23 | 100,000 | 103,100 |
|
| Laboratory Corporation of America Holdings, 4.00%, 11/1/23 | 100,000 | 101,007 |
|
| Life Technologies Corp., 6.00%, 3/1/20 | 100,000 | 110,855 |
|
| Molson Coors Brewing Co., 5.00%, 5/1/42 | 100,000 | 96,300 |
|
| PepsiCo, Inc., 2.75%, 3/5/22 | 100,000 | 100,246 |
|
| Pfizer, Inc., 4.40%, 5/15/44 | 1,000,000 | 1,015,550 |
|
| Sanofi, 1.25%, 4/10/18 | 100,000 | 99,563 |
|
| Zoetis, Inc., 4.70%, 2/1/43 | 100,000 | 87,299 |
|
| | | 5,015,618 |
|
| | | |
| Energy - 3.2% | | |
| BP Capital Markets plc, 2.50%, 11/6/22 | 500,000 | 475,320 |
|
| Chevron Corp., 3.191%, 6/24/23 | 100,000 | 100,532 |
|
| CNOOC Curtis Funding No. 1 Pty. Ltd., 4.50%, 10/3/23 (a) | 100,000 | 103,249 |
|
| Colonial Pipeline Co., 6.58%, 8/28/32 (a) | 100,000 | 114,888 |
|
| Enbridge Energy Partners LP, 5.20%, 3/15/20 | 300,000 | 303,945 |
|
| Energy Transfer Partners LP, 4.65%, 6/1/21 | 1,000,000 | 938,846 |
|
| Ensco plc, 4.70%, 3/15/21 | 700,000 | 563,625 |
|
| Enterprise Products Operating LLC, 7.034%, 1/15/68 (b)(c) | 400,000 | 406,000 |
|
| Petroleos Mexicanos, 6.375%, 1/23/45 | 1,000,000 | 846,381 |
|
| Pioneer Natural Resources Co., 5.875%, 7/15/16 | 250,000 | 253,907 |
|
| Shell International Finance BV: | | |
| 2.25%, 1/6/23 | 200,000 | 187,176 |
|
| 4.125%, 5/11/35 | 1,350,000 | 1,288,611 |
|
| 4.55%, 8/12/43 | 100,000 | 97,203 |
|
| Texas Eastern Transmission LP, 2.80%, 10/15/22 (a) | 400,000 | 355,536 |
|
| TransContinental Gas Pipe Line Co. LLC, 4.45%, 8/1/42 | 100,000 | 66,918 |
|
| | | 6,102,137 |
|
| | | |
| Financial - 7.9% | | |
| American International Group, Inc., 4.875%, 6/1/22 | 250,000 | 269,985 |
|
| Australia & New Zealand Banking Group Ltd., 4.875%, 1/12/21 (a) | 800,000 | 880,493 |
|
www.calvert.com CALVERT VP INVESTMENT GRADE BOND INDEX PORTFOLIO ANNUAL REPORT 7
|
| | | | |
| | PRINCIPAL
AMOUNT ($) | VALUE ($) |
|
| CORPORATE BONDS - Cont'd | | |
| Bank of America Corp.: | | |
| 5.65%, 5/1/18 | 250,000 | 268,827 |
|
| 4.125%, 1/22/24 | 300,000 | 309,855 |
|
| Bank of America NA, 5.30%, 3/15/17 | 650,000 | 676,179 |
|
| Bank of New York Mellon Corp. (The), 1.30%, 1/25/18 | 850,000 | 842,378 |
|
| Berkshire Hathaway Finance Corp.: | | |
| 2.90%, 10/15/20 | 500,000 | 518,184 |
|
| 3.00%, 5/15/22 | 200,000 | 203,398 |
|
| 4.30%, 5/15/43 | 1,000,000 | 980,674 |
|
| Boston Properties LP, 3.85%, 2/1/23 | 100,000 | 102,047 |
|
| Capital One Bank, 3.375%, 2/15/23 | 200,000 | 195,715 |
|
| Citigroup, Inc.: | | |
| 1.75%, 5/1/18 | 450,000 | 446,194 |
|
| 6.125%, 5/15/18 | 200,000 | 218,392 |
|
| 2.50%, 9/26/18 | 500,000 | 504,342 |
|
| 5.50%, 9/13/25 | 80,000 | 86,840 |
|
| DDR Corp., 4.75%, 4/15/18 | 300,000 | 313,820 |
|
| Discover Financial Services, 3.85%, 11/21/22 | 200,000 | 198,175 |
|
| ERP Operating LP, 4.625%, 12/15/21 | 100,000 | 108,528 |
|
| Excalibur One 77B LLC, 1.492%, 1/1/25 | 34,581 | 33,296 |
|
| General Electric Capital Corp., 4.625%, 1/7/21 | 100,000 | 109,838 |
|
| General Electric Capital Corp. / LJ VP Holdings LLC, 3.80%, 6/18/19 (a) | 400,000 | 420,503 |
|
| Genworth Holdings, Inc., 4.80%, 2/15/24 | 100,000 | 67,500 |
|
| Goldman Sachs Group, Inc. (The): | | |
| 5.35%, 1/15/16 | 200,000 | 200,209 |
|
| 2.375%, 1/22/18 | 200,000 | 201,728 |
|
| 2.625%, 1/31/19 | 200,000 | 201,430 |
|
| 5.375%, 3/15/20 | 150,000 | 164,781 |
|
| 4.00%, 3/3/24 | 500,000 | 513,190 |
|
| Hartford Financial Services Group, Inc. (The), 5.125%, 4/15/22 | 100,000 | 109,821 |
|
| JPMorgan Chase & Co.: | | |
| 2.35%, 1/28/19 | 300,000 | 301,273 |
|
| 4.50%, 1/24/22 | 400,000 | 431,442 |
|
| 3.375%, 5/1/23 | 700,000 | 687,972 |
|
| Kimco Realty Corp., 4.30%, 2/1/18 | 300,000 | 312,782 |
|
| Liberty Property LP, 3.375%, 6/15/23 | 350,000 | 331,952 |
|
| MetLife, Inc., 4.875%, 11/13/43 | 100,000 | 104,911 |
|
| Morgan Stanley: | | |
| 2.125%, 4/25/18 | 300,000 | 300,401 |
|
| 4.10%, 5/22/23 | 500,000 | 505,100 |
|
| 5.00%, 11/24/25 | 150,000 | 159,232 |
|
| NYSE Holdings LLC, 2.00%, 10/5/17 | 450,000 | 450,698 |
|
| Prudential Financial, Inc., 5.10%, 8/15/43 | 1,000,000 | 1,042,101 |
|
| Regions Bank, 7.50%, 5/15/18 | 100,000 | 111,114 |
|
| Toronto-Dominion Bank (The), 2.375%, 10/19/16 | 100,000 | 101,049 |
|
| Ventas Realty LP / Ventas Capital Corp., 3.25%, 8/15/22 | 250,000 | 243,373 |
|
| Welltower, Inc., 5.25%, 1/15/22 | 800,000 | 865,289 |
|
| | | 15,095,011 |
|
| | | |
8 www.calvert.com CALVERT VP INVESTMENT GRADE BOND INDEX PORTFOLIO ANNUAL REPORT
|
| | | | |
| | PRINCIPAL
AMOUNT ($) | VALUE ($) |
|
| CORPORATE BONDS - Cont'd | | |
| Industrial - 3.3% | | |
| BNSF Funding Trust I, 6.613%, 12/15/55 (b)(c) | 540,000 | 602,100 |
|
| Cummins, Inc., 4.875%, 10/1/43 | 100,000 | 103,236 |
|
| Deere & Co., 6.55%, 10/1/28 | 250,000 | 311,781 |
|
| GATX Corp., 4.85%, 6/1/21 | 900,000 | 946,809 |
|
| General Electric Co., 4.50%, 3/11/44 | 100,000 | 102,913 |
|
| John Deere Capital Corp., 1.20%, 10/10/17 | 250,000 | 249,089 |
|
| Kennametal, Inc., 2.65%, 11/1/19 | 950,000 | 924,458 |
|
| L-3 Communications Corp.: | | |
| 5.20%, 10/15/19 | 400,000 | 423,546 |
|
| 4.75%, 7/15/20 | 800,000 | 832,258 |
|
| Northrop Grumman Corp., 3.25%, 8/1/23 | 150,000 | 149,951 |
|
| Stanley Black & Decker, Inc., 2.90%, 11/1/22 | 650,000 | 636,750 |
|
| Thermo Fisher Scientific, Inc., 3.60%, 8/15/21 | 500,000 | 507,721 |
|
| United Parcel Service, Inc., 6.20%, 1/15/38 | 250,000 | 320,663 |
|
| United Technologies Corp., 4.50%, 6/1/42 | 100,000 | 100,704 |
|
| | | 6,211,979 |
|
| | | |
| Technology - 1.4% | | |
| Apple, Inc., 3.85%, 5/4/43 | 1,100,000 | 1,013,444 |
|
| CA, Inc., 5.375%, 12/1/19 | 200,000 | 215,821 |
|
| International Business Machines Corp.: | | |
| 2.90%, 11/1/21 | 100,000 | 101,389 |
|
| 3.625%, 2/12/24 | 100,000 | 102,942 |
|
| NetApp, Inc., 3.25%, 12/15/22 | 100,000 | 94,438 |
|
| Oracle Corp.: | | |
| 5.75%, 4/15/18 | 250,000 | 272,783 |
|
| 2.375%, 1/15/19 | 900,000 | 913,897 |
|
| | | 2,714,714 |
|
| | | |
| Utilities - 0.7% | | |
| Connecticut Light & Power Co. (The), 5.65%, 5/1/18 | 200,000 | 217,518 |
|
| PacifiCorp, 4.10%, 2/1/42 | 100,000 | 96,438 |
|
| Public Service Electric & Gas Co., 3.95%, 5/1/42 | 1,000,000 | 965,333 |
|
| | | 1,279,289 |
|
| | | |
| Total Corporate Bonds (Cost $48,068,234) | | 47,707,003 |
|
| | | |
| | | |
| MUNICIPAL OBLIGATIONS - 0.5% | | |
| New York - 0.5% | | |
| New York City GO Bonds, 3.60%, 8/1/28 | 1,000,000 | 994,390 |
|
| | | |
| Wisconsin - 0.0% | | |
| Owen Withee Wisconsin School District GO Bonds, 5.64%, 3/1/16 | 20,000 | 20,117 |
|
| | | |
| Total Municipal Obligations (Cost $1,008,383) | | 1,014,507 |
|
| | | |
| | | |
www.calvert.com CALVERT VP INVESTMENT GRADE BOND INDEX PORTFOLIO ANNUAL REPORT 9
|
| | | | |
| | PRINCIPAL
AMOUNT ($) | VALUE ($) |
|
| SOVEREIGN GOVERNMENT BONDS - 0.5% | | |
| Mexico Government International Bond, 5.55%, 1/21/45 | 500,000 | 512,500 |
|
| Province of Ontario Canada, 2.45%, 6/29/22 | 400,000 | 396,270 |
|
| Province of Quebec Canada, 2.625%, 2/13/23 | 75,000 | 74,352 |
|
| | | |
| Total Sovereign Government Bonds (Cost $971,151) | | 983,122 |
|
| | | |
| | | |
| U.S. GOVERNMENT AGENCIES AND INSTRUMENTALITIES - 7.9% | | |
| Fannie Mae, 6.25%, 5/15/29 | 1,300,000 | 1,762,505 |
|
| Federal Home Loan Bank, 4.875%, 5/17/17 | 1,000,000 | 1,052,202 |
|
| Freddie Mac: | | |
| 5.00%, 2/16/17 | 1,000,000 | 1,045,517 |
|
| 5.125%, 11/17/17 | 1,000,000 | 1,073,858 |
|
| 4.875%, 6/13/18 | 3,500,000 | 3,800,804 |
|
| 3.75%, 3/27/19 | 3,200,000 | 3,426,115 |
|
| 6.75%, 3/15/31 | 1,300,000 | 1,863,627 |
|
| 6.25%, 7/15/32 | 700,000 | 973,171 |
|
| | | |
| Total U.S. Government Agencies and Instrumentalities (Cost $14,572,243) | | 14,997,799 |
|
| | | |
| | | |
| U.S. GOVERNMENT AGENCY MORTGAGE-BACKED SECURITIES - 26.6% | | |
| Fannie Mae: | | |
| 5.00%, 12/1/16 | 28,336 | 29,340 |
|
| 5.00%, 11/1/17 | 8,270 | 8,563 |
|
| 5.50%, 8/1/18 | 33,281 | 34,411 |
|
| 6.50%, 4/1/23 | 40,958 | 42,218 |
|
| 2.50%, 12/1/27 | 626,626 | 628,987 |
|
| 4.50%, 5/1/31 | 522,102 | 568,470 |
|
| 6.50%, 8/1/32 | 71,969 | 82,250 |
|
| 5.50%, 7/1/33 | 62,643 | 70,459 |
|
| 5.50%, 7/1/33 | 164,484 | 186,750 |
|
| 6.00%, 8/1/33 | 19,617 | 22,137 |
|
| 5.50%, 11/1/33 | 82,266 | 92,658 |
|
| 5.50%, 3/1/34 | 148,322 | 167,103 |
|
| 6.00%, 6/1/34 | 91,895 | 104,500 |
|
| 5.00%, 7/1/34 | 145,228 | 160,578 |
|
| 5.00%, 10/1/34 | 112,587 | 124,049 |
|
| 5.50%, 3/1/35 | 164,910 | 185,427 |
|
| 5.50%, 6/1/35 | 72,175 | 80,360 |
|
| 5.50%, 9/1/35 | 79,039 | 88,777 |
|
| 5.50%, 2/1/36 | 34,722 | 38,913 |
|
| 5.50%, 4/1/36 | 164,164 | 176,021 |
|
| 6.50%, 9/1/36 | 85,399 | 97,598 |
|
| 5.50%, 11/1/36 | 54,150 | 60,464 |
|
| 6.00%, 8/1/37 | 622,947 | 704,775 |
|
| 6.00%, 5/1/38 | 71,276 | 80,433 |
|
| 5.50%, 6/1/38 | 82,789 | 92,767 |
|
| 6.00%, 7/1/38 | 360,626 | 410,183 |
|
| 2.505%, 9/1/38(b) | 323,350 | 343,950 |
|
| 4.00%, 3/1/39 | 124,000 | 131,258 |
|
10 www.calvert.com CALVERT VP INVESTMENT GRADE BOND INDEX PORTFOLIO ANNUAL REPORT
|
| | | | |
| | PRINCIPAL
AMOUNT ($) | VALUE ($) |
|
| U.S. GOVERNMENT AGENCY MORTGAGE-BACKED SECURITIES - Cont'd | | |
| 4.50%, 5/1/40 | 598,268 | 653,499 |
|
| 4.50%, 7/1/40 | 262,315 | 283,677 |
|
| 4.50%, 10/1/40 | 1,035,505 | 1,120,723 |
|
| 3.50%, 2/1/41 | 730,702 | 755,640 |
|
| 3.50%, 3/1/41 | 749,036 | 774,599 |
|
| 4.00%, 3/1/41 | 420,180 | 445,769 |
|
| 4.50%, 6/1/41 | 1,206,420 | 1,305,278 |
|
| 3.50%, 3/1/42 | 1,344,327 | 1,391,153 |
|
| 4.00%, 8/1/42 | 1,110,944 | 1,182,750 |
|
| 3.50%, 12/1/42 | 1,439,547 | 1,489,610 |
|
| 2.50%, 1/1/43 | 1,158,545 | 1,119,570 |
|
| 3.00%, 1/1/43 | 1,684,518 | 1,688,294 |
|
| 3.00%, 5/1/43 | 2,308,565 | 2,314,641 |
|
| 3.00%, 8/1/43 | 1,800,181 | 1,808,270 |
|
| 3.00%, 8/1/43 | 2,794,074 | 2,799,793 |
|
| 3.50%, 8/1/43 | 1,689,609 | 1,745,996 |
|
| 4.50%, 11/1/43 | 1,769,796 | 1,911,428 |
|
| 4.00%, 5/1/44 | 2,724,728 | 2,885,012 |
|
| 4.50%, 11/1/44 | 1,643,978 | 1,782,495 |
|
| 4.00%, 6/1/45 | 937,506 | 992,455 |
|
| Freddie Mac: | | |
| 4.50%, 9/1/18 | 37,298 | 38,512 |
|
| 5.00%, 11/1/20 | 53,053 | 56,225 |
|
| 4.00%, 3/1/25 | 493,121 | 520,573 |
|
| 3.50%, 11/1/25 | 491,193 | 514,839 |
|
| 3.50%, 7/1/26 | 372,600 | 390,496 |
|
| 2.50%, 3/1/28 | 212,019 | 215,569 |
|
| 5.00%, 2/1/33 | 42,652 | 46,531 |
|
| 5.00%, 4/1/35 | 66,709 | 73,527 |
|
| 5.00%, 12/1/35 | 149,275 | 164,160 |
|
| 6.00%, 8/1/36 | 48,092 | 54,685 |
|
| 5.00%, 10/1/36 | 274,367 | 301,182 |
|
| 6.50%, 10/1/37 | 47,787 | 50,836 |
|
| 5.00%, 1/1/38 | 488,471 | 532,888 |
|
| 5.00%, 7/1/39 | 181,041 | 198,096 |
|
| 4.00%, 11/1/39 | 565,301 | 598,827 |
|
| 4.50%, 1/1/40 | 253,726 | 273,667 |
|
| 5.00%, 1/1/40 | 959,109 | 1,062,904 |
|
| 4.50%, 4/1/40 | 656,370 | 708,124 |
|
| 6.00%, 4/1/40 | 120,901 | 136,548 |
|
| 4.50%, 5/1/40 | 186,525 | 203,546 |
|
| 4.50%, 5/1/40 | 446,758 | 481,698 |
|
| 4.50%, 6/1/41 | 334,707 | 360,986 |
|
| 3.50%, 10/1/41 | 880,449 | 908,291 |
|
| 3.00%, 7/1/42 | 459,887 | 460,197 |
|
| 3.50%, 7/1/42 | 1,080,377 | 1,113,505 |
|
| 3.00%, 1/1/43 | 1,453,286 | 1,454,268 |
|
| 4.50%, 9/1/44 | 1,186,141 | 1,280,330 |
|
| Ginnie Mae: | | |
| 4.50%, 7/20/33 | 290,035 | 314,283 |
|
| 5.50%, 7/20/34 | 125,293 | 139,796 |
|
www.calvert.com CALVERT VP INVESTMENT GRADE BOND INDEX PORTFOLIO ANNUAL REPORT 11
|
| | | | |
| | PRINCIPAL
AMOUNT ($) | VALUE ($) |
|
| U.S. GOVERNMENT AGENCY MORTGAGE-BACKED SECURITIES - Cont'd | | |
| 6.00%, 11/20/37 | 161,763 | 183,229 |
|
| 6.00%, 10/15/38 | 759,064 | 858,114 |
|
| 5.00%, 12/15/38 | 276,416 | 304,259 |
|
| 5.00%, 5/15/39 | 367,089 | 409,481 |
|
| 5.00%, 10/15/39 | 561,766 | 626,828 |
|
| 4.00%, 12/20/40 | 1,181,908 | 1,282,243 |
|
| 4.00%, 11/20/41 | 124,034 | 132,676 |
|
| 4.00%, 8/20/42 | 868,536 | 927,594 |
|
| | | |
| Total U.S. Government Agency Mortgage-Backed Securities (Cost $49,652,969) | | 50,643,564 |
|
| | | |
| | | |
| U.S. TREASURY OBLIGATIONS - 36.0% | | |
| United States Treasury Bonds: | | |
| 8.125%, 5/15/21 | 1,000,000 | 1,318,359 |
|
| 8.00%, 11/15/21 | 1,000,000 | 1,335,273 |
|
| 6.25%, 8/15/23 | 1,000,000 | 1,290,703 |
|
| 5.375%, 2/15/31 | 1,750,000 | 2,373,096 |
|
| 3.875%, 8/15/40 | 1,000,000 | 1,169,141 |
|
| 4.375%, 5/15/41 | 2,000,000 | 2,523,984 |
|
| 3.125%, 11/15/41 | 1,000,000 | 1,033,125 |
|
| 3.00%, 5/15/42 | 1,000,000 | 1,006,172 |
|
| 3.75%, 11/15/43 | 1,045,000 | 1,203,628 |
|
| 3.125%, 8/15/44 | 1,600,000 | 1,635,187 |
|
| 2.50%, 2/15/45 | 1,000,000 | 897,227 |
|
| United States Treasury Notes: | | |
| 1.50%, 7/31/16 | 1,000,000 | 1,005,039 |
|
| 4.875%, 8/15/16 | 2,000,000 | 2,051,484 |
|
| 2.75%, 11/30/16 | 1,000,000 | 1,017,227 |
|
| 0.875%, 1/31/17 | 7,400,000 | 7,400,577 |
|
| 3.00%, 2/28/17 | 1,000,000 | 1,024,219 |
|
| 0.875%, 4/15/17 | 520,000 | 519,879 |
|
| 4.50%, 5/15/17 | 2,000,000 | 2,096,016 |
|
| 2.375%, 7/31/17 | 2,000,000 | 2,042,188 |
|
| 1.875%, 9/30/17 | 2,000,000 | 2,028,204 |
|
| 4.25%, 11/15/17 | 1,000,000 | 1,058,633 |
|
| 2.625%, 1/31/18 | 1,000,000 | 1,030,938 |
|
| 3.50%, 2/15/18 | 2,000,000 | 2,099,844 |
|
| 2.375%, 5/31/18 | 1,000,000 | 1,028,164 |
|
| 4.00%, 8/15/18 | 2,000,000 | 2,145,546 |
|
| 3.75%, 11/15/18 | 1,000,000 | 1,069,883 |
|
| 1.625%, 3/31/19 | 947,000 | 952,919 |
|
| 3.125%, 5/15/19 | 2,000,000 | 2,109,922 |
|
| 3.625%, 8/15/19 | 1,000,000 | 1,073,672 |
|
| 1.00%, 8/31/19 | 2,000,000 | 1,960,546 |
|
| 3.375%, 11/15/19 | 1,100,000 | 1,174,593 |
|
| 3.625%, 2/15/20 | 1,000,000 | 1,078,594 |
|
| 1.125%, 4/30/20 | 1,000,000 | 977,148 |
|
| 2.625%, 8/15/20 | 2,000,000 | 2,077,578 |
|
| 2.625%, 11/15/20 | 3,000,000 | 3,116,952 |
|
| 3.625%, 2/15/21 | 1,000,000 | 1,086,992 |
|
12 www.calvert.com CALVERT VP INVESTMENT GRADE BOND INDEX PORTFOLIO ANNUAL REPORT
|
| | | | |
| | PRINCIPAL
AMOUNT ($) | VALUE ($) |
|
| U.S. TREASURY OBLIGATIONS - Cont'd | | |
| 2.25%, 3/31/21 | 200,000 | 204,063 |
|
| 3.125%, 5/15/21 | 500,000 | 531,758 |
|
| 1.75%, 5/15/22 | 1,000,000 | 983,633 |
|
| 1.625%, 11/15/22 | 1,000,000 | 971,445 |
|
| 2.75%, 11/15/23 | 1,000,000 | 1,043,633 |
|
| 2.75%, 2/15/24 | 3,000,000 | 3,124,806 |
|
| 2.25%, 11/15/24 | 2,000,000 | 1,998,984 |
|
| 2.00%, 2/15/25 | 700,000 | 684,277 |
|
| | | |
| Total U.S. Treasury Obligations (Cost $66,903,063) | | 68,555,251 |
|
| | | |
| | | |
| FLOATING RATE LOAN (f) - 0.0% | | |
| Financial - 0.0% | | |
| Alliance Mortgage Investments, Inc., 12.61%, 6/1/20 *(b)(d)(e) | 96,336 | 2,177 |
|
| | | |
| Total Floating Rate Loan (Cost $96,336) | | 2,177 |
|
| | | |
| | | |
| TIME DEPOSIT - 0.8% | | |
| State Street Bank Time Deposit, 0.278%, 1/4/16 | 1,539,665 | 1,539,665 |
|
| | | |
| Total Time Deposit (Cost $1,539,665) | | 1,539,665 |
|
| | | |
| | | |
| TOTAL INVESTMENTS (Cost $187,185,193) - 99.6% | | 189,863,089 |
|
| Other assets and liabilities, net - 0.4% | | 673,129 |
|
NET ASSETS - 100.0% | |
| $190,536,218 |
|
|
| |
| NOTES TO SCHEDULE OF INVESTMENTS |
| * Non-income producing security. |
| (a) Security is exempt from registration under Rule 144A of the Securities Act of 1933. These securities may be resold in transactions exempt from registration, normally to qualified institutional buyers. |
| (b) The coupon rate shown on floating or adjustable rate securities represents the rate in effect on December 31, 2015. |
| (c) The coupon rate changes periodically based upon a predetermined schedule. The interest rate disclosed is that which is in effect on December 31, 2015. |
| (d) This security was valued under the direction of the Board of Directors. See Note A. |
| (e) Alliance Bancorp and its affiliates filed for Chapter 7 bankruptcy on July 13, 2007. This security is no longer accruing interest. |
| (f) Remaining maturities of floating rate loans may be less than the stated maturities shown as a result of contractual or optional prepayments by the borrower. Such prepayments cannot be predicted with certainty. Floating rate loans generally pay interest at rates which are periodically re-determined at a margin above the London InterBank Offered Rate ("LIBOR") or other short-term rates. The rate shown is the rate in effect at December 31, 2015. Floating rate loans are generally considered restrictive in that the Fund is ordinarily contractually obligated to receive consent from the Agent Bank and /or Borrower prior to disposition of a floating rate loan. |
| | |
| Abbreviations: |
| GO: | General Obligation |
| LLC: | Limited Liability Corporation |
| LP: | Limited Partnership |
| Ltd.: | Limited |
| plc: | Public Limited Company |
| See notes to financial statements. |
www.calvert.com CALVERT VP INVESTMENT GRADE BOND INDEX PORTFOLIO ANNUAL REPORT 13
CALVERT VP INVESTMENT GRADE BOND INDEX PORTFOLIO
STATEMENT OF ASSETS AND LIABILITIES
DECEMBER 31, 2015
|
| | | |
| ASSETS | |
| Investments in securities, at value (Cost $187,185,193) - see accompanying schedule |
| $189,863,089 |
|
| Receivable for shares sold | 48,229 |
|
| Interest receivable | 1,371,446 |
|
| Directors' deferred compensation plan | 124,445 |
|
| Total assets | 191,407,209 |
|
| | |
| LIABILITIES | |
| Payable for shares redeemed | 612,299 |
|
| Payable to Calvert Investment Management, Inc. | 49,086 |
|
| Payable to Calvert Investment Distributors, Inc. | 21 |
|
| Payable to Calvert Investment Administrative Services, Inc. | 16,331 |
|
| Payable to Calvert Investment Services, Inc. | 1,815 |
|
| Directors' deferred compensation plan | 124,445 |
|
| Accrued expenses and other liabilities | 66,994 |
|
| Total liabilities | 870,991 |
|
| NET ASSETS |
| $190,536,218 |
|
| | |
| NET ASSETS CONSIST OF: | |
| Paid-in capital applicable to the following shares of common stock outstanding; | |
| $0.10 par value, 20,000,000 shares authorized: | |
| Class I: 3,472,765 shares outstanding |
| $186,351,249 |
|
| Class F: 1,811 shares outstanding | 99,684 |
|
| Undistributed net investment income | 4,890,811 |
|
| Accumulated net realized gain (loss) | (3,483,422) |
|
| Net unrealized appreciation (depreciation) | 2,677,896 |
|
| NET ASSETS |
| $190,536,218 |
|
| | |
| NET ASSET VALUE PER SHARE | |
| Class I (based on net assets of $190,436,999) |
| $54.84 |
|
| Class F (based on net assets of $99,219) |
| $54.79 |
|
| See notes to financial statements. | |
14 www.calvert.com CALVERT VP INVESTMENT GRADE BOND INDEX PORTFOLIO ANNUAL REPORT
CALVERT VP INVESTMENT GRADE BOND INDEX PORTFOLIO
STATEMENT OF OPERATIONS
YEAR ENDED DECEMBER 31, 2015
|
| | | |
| NET INVESTMENT INCOME | |
| Investment Income: | |
| Interest income |
| $5,456,115 |
|
| Total investment income | 5,456,115 |
|
| | |
| Expenses: | |
| Investment advisory fee | 611,563 |
|
| Administrative fees | 203,854 |
|
| Transfer agency fees and expenses | 18,434 |
|
| Distribution Plan expenses: | |
| Class F (a) | 41 |
|
| Directors' fees and expenses | 37,066 |
|
| Accounting fees | 42,609 |
|
| Custodian fees | 60,956 |
|
| Professional fees | 41,419 |
|
| Reports to shareholders | 33,685 |
|
| Miscellaneous | 7,997 |
|
| Total expenses | 1,057,624 |
|
| NET INVESTMENT INCOME | 4,398,491 |
|
| | |
| | |
| REALIZED AND UNREALIZED GAIN (LOSS) ON INVESTMENTS | |
| Net realized gain (loss) | 257,424 |
|
| | |
| Change in unrealized appreciation (depreciation) | (4,412,529) |
|
| | |
| NET REALIZED AND UNREALIZED GAIN (LOSS) ON INVESTMENTS | (4,155,105) |
|
| | |
| INCREASE (DECREASE) IN NET ASSETS RESULTING FROM OPERATIONS |
| $243,386 |
|
| |
| (a) From October 30, 2015 inception. |
| See notes to financial statements. |
www.calvert.com CALVERT VP INVESTMENT GRADE BOND INDEX PORTFOLIO ANNUAL REPORT 15
CALVERT VP INVESTMENT GRADE BOND INDEX PORTFOLIO
STATEMENTS OF CHANGES IN NET ASSETS
|
| | | | | | | |
| INCREASE (DECREASE) IN NET ASSETS | YEAR ENDED
DECEMBER 31, 2015 | | YEAR ENDED
DECEMBER 31, 2014 |
| Operations: | | | |
| Net investment income |
| $4,398,491 |
| |
| $4,493,498 |
|
| Net realized gain (loss) | 257,424 |
| | 628,500 |
|
| Change in unrealized appreciation (depreciation) | (4,412,529) |
| | 6,885,546 |
|
| | | | |
| INCREASE (DECREASE) IN NET ASSETS RESULTING FROM OPERATIONS | 243,386 |
| | 12,007,544 |
|
| | | | |
| Distributions to shareholders from: | | | |
| Net investment income: | | | |
| Class I shares | (283,410) |
| | (5,135,063) |
|
| Class F shares (a) | (191) |
| | — |
|
| Total distributions | (283,601) |
| | (5,135,063) |
|
| | | | |
| Capital share transactions: | | | |
| Shares sold: | | | |
| Class I shares | 15,395,868 |
| | 18,293,381 |
|
| Class F shares (a) | 100,001 |
| | — |
|
| Reinvestment of distributions: | | | |
| Class I shares | 283,410 |
| | 5,135,063 |
|
| Class F shares (a) | 191 |
| | — |
|
| Shares issued from merger (See Note E): | | | |
| Class I shares | — |
| | 43,577,155 |
|
| Shares redeemed: | | | |
| Class I shares | (37,132,964) |
| | (61,581,147) |
|
| Class F shares (a) | (1) |
| | — |
|
| Total capital share transactions | (21,353,495) |
| | 5,424,452 |
|
| | | | |
| TOTAL INCREASE (DECREASE) IN NET ASSETS | (21,393,710) |
| | 12,296,933 |
|
| | | | |
| NET ASSETS | | | |
| Beginning of year | 211,929,928 |
| | 199,632,995 |
|
| End of year (including undistributed net investment income of $4,890,811 and $283,567, respectively) |
| $190,536,218 |
| |
| $211,929,928 |
|
| | | | |
| CAPITAL SHARE ACTIVITY | | | |
| Shares sold: | | | |
| Class I shares | 279,122 |
| | 332,134 |
|
| Class F shares (a) | 1,807 |
| | — |
|
| Reinvestment of distributions: | | | |
| Class I shares | 5,178 |
| | 93,603 |
|
| Class F shares (a) | 4 |
| | — |
|
| Shares issued from merger (See Note E): | | | |
| Class I shares | — |
| | 793,764 |
|
| Shares redeemed: | | | |
| Class I shares | (671,688) |
| | (1,118,449) |
|
| Total capital share activity | (385,577) |
| | 101,052 |
|
| | | | |
| (a) From October 30, 2015 inception. | | | |
| See notes to financial statements. |
16 www.calvert.com CALVERT VP INVESTMENT GRADE BOND INDEX PORTFOLIO ANNUAL REPORT
NOTES TO FINANCIAL STATEMENTS
NOTE A — SIGNIFICANT ACCOUNTING POLICIES
General: Calvert VP Investment Grade Bond Index Portfolio (the “Portfolio”), a series of Calvert Variable Products, Inc. (the “Fund”), is registered under the Investment Company Act of 1940 as a diversified, open-end management investment company. The Fund is comprised of eleven separate portfolios. The operations of each series of the Fund are accounted for separately. The Portfolio applies the accounting and reporting guidance in the Financial Accounting Standards Board (FASB) Accounting Standards Codification Topic 946, Financial Services – Investment Companies (ASC 946).
The Portfolio offers Class F and Class I shares. Class F shares commenced operations on October 30, 2015. Class F shares are subject to Distribution Plan expenses, while Class I shares are not. Shares of the Portfolio are sold without sales charge to affiliated and unaffiliated insurance companies for allocation to certain of their variable separate accounts. Each class has different: (a) dividend rates, due to differences in Distribution Plan expenses and other class-specific expenses, (b) exchange privileges; and (c) class-specific voting rights.
Security Valuation: Net asset value per share is determined every business day as of the close of the regular session of the New York Stock Exchange (generally 4:00 p.m. Eastern time). The Portfolio uses independent pricing services approved by the Board of Directors (“the Board”) to value its investments wherever possible. Investments for which market quotations are not available or deemed not reliable are fair valued in good faith under the direction of the Board.
The Board has adopted Valuation Procedures (the “Procedures”) to determine the fair value of securities and other financial instruments for which market prices are not readily available or which may not be reliably priced. The Board has delegated the day-to-day responsibility for determining the fair value of assets of the Portfolio to Calvert Investment Management, Inc. (the “Advisor” or “Calvert”) and has provided these Procedures to govern Calvert in its valuation duties.
Calvert has chartered an internal Valuation Committee to oversee the implementation of these Procedures and to assist it in carrying out the valuation responsibilities that the Board has delegated.
The Valuation Committee meets on a regular basis to review illiquid securities and other investments which may not have readily available market prices. The Valuation Committee’s fair valuation determinations are subject to review, approval and ratification by the Board at its next regularly scheduled meeting covering the calendar quarter in which the fair valuation was determined.
The Valuation Committee utilizes various methods to measure the fair value of the Portfolio’s investments. U.S. generally accepted accounting principles (GAAP) establishes a disclosure hierarchy that categorizes the inputs to valuation techniques used to value assets and liabilities at measurement date. These inputs are summarized in the three broad levels listed below:
Level 1 - quoted prices in active markets for identical securities
Level 2 - other significant observable inputs (including quoted prices for similar securities, interest rates, prepayment speeds, credit risk, etc.)
Level 3 - significant unobservable inputs (including the Portfolio’s own assumptions in determining the fair value of investments)
The inputs or methodologies used for valuing securities are not necessarily an indication of the risk associated with investing in those securities.
Changes in valuation techniques may result in transfers in or out of an investment’s assigned level within the hierarchy during the year. Transfers in and/or out of levels are determined based on the fair value of such securities at the end of the year. Valuation techniques used to value the Portfolio’s investments by major category are as follows:
Debt securities, including restricted securities, are valued based on evaluated prices received from independent pricing services or from dealers who make markets in such securities. For corporate bonds, municipal securities, sovereign government bonds, and U.S. government and government agency obligations, pricing services utilize matrix pricing which considers yield or price of bonds of comparable quality, coupon, maturity and type as well as dealer supplied prices and such securities are generally categorized as Level 2 in the hierarchy. For asset-backed securities, commercial mortgage-backed securities, and U.S. government agency mortgage-backed securities, pricing services
www.calvert.com CALVERT VP INVESTMENT GRADE BOND INDEX PORTFOLIO ANNUAL REPORT 17
utilize matrix pricing which considers prepayment speed assumptions, attributes of the collateral, yield or price of bonds of comparable quality, coupon, maturity and type as well as dealer supplied prices and, accordingly, such securities are generally categorized as Level 2 in the hierarchy.
Short-term securities of sufficient credit quality with remaining maturities of sixty days or less for which quotations are not readily available are valued at amortized cost, which approximates fair value, and are categorized as Level 2 in the hierarchy.
If a market value cannot be determined for a security using the methodologies described above, or if, in the good faith opinion of the Advisor, the market value does not constitute a readily available market quotation, or if a significant event has occurred that would materially affect the value of the security, the security will be fair valued as determined in good faith by the Valuation Committee.
The Valuation Committee considers a number of factors, including significant unobservable valuation inputs when arriving at fair value. It considers all significant facts that are reasonably available and relevant to the determination of fair value.
The Valuation Committee primarily employs a market-based approach which may use related or comparable assets or liabilities, recent transactions, market multiples, book values, and other relevant information for the investment to determine the fair value of the investment. When more appropriate, the Portfolio may employ an income-based or cost approach. An income-based valuation approach discounts anticipated future cash flows of the investment to calculate a present amount (discounted). The measurement is based on the value indicated by current market expectations about those future amounts. Discounts may also be applied due to the nature or duration of any restrictions on the disposition of the investments. A cost based approach is based on the amount that currently would be required to replace the service capacity of an asset (current replacement cost). From the seller’s perspective, the price that would be received for the asset is determined based on the cost to a buyer to acquire or construct a substitute asset of comparable utility, adjusted for obsolescence.
The values assigned to fair value investments are based on available information and do not necessarily represent amounts that might ultimately be realized. Further, due to the inherent uncertainty of valuations of such investments, the fair values may differ significantly from the values that would have been used had an active market existed, and the differences could be material. The Valuation Committee employs various methods for calibrating these valuation approaches including a regular review of key inputs and assumptions, transactional back-testing or disposition analysis and reviews of any related market activity.
At December 31, 2015, securities valued at $2,177, or 0.0% of net assets, were fair valued in good faith under the direction of the Board.
18 www.calvert.com CALVERT VP INVESTMENT GRADE BOND INDEX PORTFOLIO ANNUAL REPORT
The following table summarizes the market value of the Portfolio's holdings as of December 31, 2015, based on the inputs used to value them:
|
| | | | | | | | | | |
| | VALUATION INPUTS |
| INVESTMENTS IN SECURITIES* | LEVEL 1 | LEVEL 2 | LEVEL 3 | TOTAL |
| Asset-Backed Securities | $— |
|
| $1,101,883 |
| $— |
|
| $1,101,883 |
|
| Commercial Mortgage-Backed Securities | — |
| 3,318,118 |
| — |
| 3,318,118 |
|
| Corporate Bonds | — |
| 47,707,003 |
| — |
| 47,707,003 |
|
| Floating Rate Loan | — |
| — |
| 2,177 |
| 2,177 |
|
| Municipal Obligations | — |
| 1,014,507 |
| — |
| 1,014,507 |
|
| Sovereign Government Bonds | — |
| 983,122 |
| — |
| 983,122 |
|
| U.S. Government Agencies and Instrumentalities | — |
| 14,997,799 |
| — |
| 14,997,799 |
|
| U.S. Government Agency Mortgage-Backed Securities | — |
| 50,643,564 |
| — |
| 50,643,564 |
|
| U.S. Treasury Obligations | — |
| 68,555,251 |
| — |
| 68,555,251 |
|
| Time Deposit | — |
| 1,539,665 |
| — |
| 1,539,665 |
|
| TOTAL | $— |
|
| $189,860,912 |
| $2,177^ |
|
| $189,863,089 |
|
| |
| * For a complete listing of investments, please refer to the Schedule of Investments. |
| ^ Level 3 securities represent 0.0% of net assets. |
There were no transfers between levels during the year.
Security Transactions and Investment Income: Security transactions are accounted for on trade date. Realized gains and losses are recorded on an identified cost basis and may include proceeds from litigation. Interest income, which includes amortization of premium and accretion of discount on debt securities, is accrued as earned. Debt obligations may be placed on non-accrual status and related interest income may be reduced by ceasing current accruals and writing off interest receivables when the collection of all or a portion of interest has become doubtful based on consistently applied procedures. (See the Notes to Schedule of Investments on page 15.) A debt obligation may be removed from non-accrual status when the issuer resumes interest payments or when collectability of interest is reasonably assured. Investment income and realized and unrealized gains and losses are allocated to separate classes of shares based upon the relative net assets of each class. Expenses arising in connection with a specific class are charged directly to that class. Expenses common to the classes are allocated to each class in proportion to their relative net assets.
Distributions to Shareholders: Distributions to shareholders are recorded by the Portfolio on ex-dividend date. Dividends from net investment income and distributions from net realized capital gains, if any, are paid at least annually. Distributions are determined in accordance with income tax regulations which may differ from U.S. generally accepted accounting principles; accordingly, periodic reclassifications are made within the Portfolio's capital accounts to reflect income and gains available for distribution under income tax regulations.
Estimates: The preparation of financial statements in conformity with U.S. generally accepted accounting principles requires management to make estimates and assumptions that affect the reported amounts of assets and liabilities and disclosure of contingent assets and liabilities at the date of the financial statements and the reported amounts of increases and decreases in net assets from operations during the reporting period. Actual results could differ from those estimates.
Federal Income Taxes: No provision for federal income or excise tax is required since the Portfolio intends to continue to qualify as a regulated investment company under the Internal Revenue Code and to distribute substantially all of its taxable earnings.
Management has analyzed the Portfolio's tax positions taken for all open federal income tax years and has concluded that no provision for federal income tax is required in the Portfolio's financial statements. A Portfolio's federal tax return is subject to examination by the Internal Revenue Service for a period of three years.
www.calvert.com CALVERT VP INVESTMENT GRADE BOND INDEX PORTFOLIO ANNUAL REPORT 19
NOTE B — RELATED PARTY TRANSACTIONS
Calvert Investment Management, Inc. (the “Advisor”) is wholly-owned by Calvert Investments, Inc., which is indirectly wholly-owned by Ameritas Mutual Holding Company. The Advisor provides investment advisory services and pays the salaries and fees of officers and Directors of the Fund who are employees of the Advisor or its affiliates. For its services, the Advisor receives an annual fee, payable monthly, of 0.30% of the Portfolio’s average daily net assets.
The Advisor has contractually agreed to limit net annual portfolio operating expenses through April 30, 2016 for Class I and through April 30, 2017 for Class F. The contractual expense caps are 0.85% for Class F and 0.60% for Class I. For the purpose of this expense limit, operating expenses do not include interest expense, brokerage commissions, taxes, and extraordinary expenses. This expense limitation does not limit acquired fund fees and expenses, if any.
Calvert Investment Administrative Services, Inc. ("CIAS"), an affiliate of the Advisor, provides administrative services to the Portfolio for an annual fee, payable monthly, of 0.10% of the Portfolio’s average daily net assets.
On November 24, 2015, the Board of Directors approved the recommendation made by CIAS to standardize and rationalize the administrative fee paid by the Calvert Funds at 0.12% for all series and all share classes of the Calvert Funds. CIAS and the Portfolio have entered into an Amended and Restated Administrative Services Agreement that will establish a 0.12% administrative fee for all share classes commencing on May 1, 2016. CIAS has contractually agreed to waive 0.02% for Class F and I (the difference between the current administrative fee and the new 0.12% fee) from May 1, 2016 through April 30, 2018.
Calvert Investment Distributors, Inc. (“CID”), an affiliate of the Advisor, is the distributor and principal underwriter for the Portfolio. Pursuant to Rule 12b-1 under the Investment Company Act of 1940, the Portfolio has adopted a Distribution Plan that permits the Portfolio to pay certain expenses associated with the distribution and servicing of its Class F shares. The expenses paid may not exceed 0.25% annually of the average daily net assets of Class F.
Calvert Investment Services, Inc. (“CIS”), an affiliate of the Advisor, acts as shareholder servicing agent for the Portfolio. For its services, CIS received a fee of $15,289 for the year ended December 31, 2015. Boston Financial Data Services, Inc. is the transfer and dividend disbursing agent.
Each Director of the Fund who is not an employee of the Advisor or its affiliates receives a fee of $1,500 for each Board and Committee meeting attended plus an annual fee of $44,000. Committee chairs receive an additional $5,000 annual retainer. Eligible Directors may participate in a Deferred Compensation Plan (the “Plan”). Obligations of the Plan will be paid solely out of the Portfolio’s assets. Directors’ fees are allocated to each of the portfolios served.
NOTE C — INVESTMENT ACTIVITY AND TAX INFORMATION
During the year, the cost of purchases and proceeds from sales of investments, other than U.S. government and short-term securities, were $3,883,096 and $6,968,479, respectively. U.S. government security purchases and sales were $8,604,153 and $21,610,052 respectively.
Under the Regulated Investment Company Modernization Act of 2010, capital losses incurred in taxable years beginning after December 22, 2010 can be carried forward to offset future capital gains for an unlimited period. These losses are required to be utilized prior to the losses incurred in pre-enactment taxable years and will retain their character as either long-term or short-term. Losses incurred in pre-enactment taxable years can be utilized until expiration. The Portfolio's use of net capital losses acquired from reorganizations may be limited under certain tax provisions.
|
| | | |
| Capital Loss Carryforwards |
| EXPIRATION DATE |
| 2016 |
| ($1,654,294 | ) |
| 2017 | (175,128) |
|
| NO EXPIRATION DATE |
| Short-term |
| ($512,188 | ) |
| Long-term | (589,876) |
|
20 www.calvert.com CALVERT VP INVESTMENT GRADE BOND INDEX PORTFOLIO ANNUAL REPORT
The tax character of dividends and distributions paid during the years ended December 31, 2015 and December 31, 2014 was as follows:
|
| | |
| DISTRIBUTIONS PAID FROM: | 2015 | 2014 |
| Ordinary income | $283,601 | $5,135,063 |
| Total | $283,601 | $5,135,063 |
As of December 31, 2015, the tax basis components of distributable earnings/(accumulated losses) and the federal tax cost were as follows:
|
| | | |
| Unrealized appreciation |
| $4,022,189 |
|
| Unrealized (depreciation) | (1,896,229) |
|
| Net unrealized appreciation (depreciation) |
| $2,125,960 |
|
| Undistributed ordinary income |
| $4,890,811 |
|
| Capital loss carryforward |
| ($2,931,486 | ) |
| Federal income tax cost of investments |
| $187,737,129 |
|
The differences between the components of distributable earnings on a tax basis and the amounts reflected in the Statement of Assets and Liabilities are primarily due to temporary book-tax differences that will reverse in a subsequent period. These differences are mainly due to wash sales.
Reclassifications, as shown in the table below, have been made to the Portfolio's components of net assets to reflect income and gains available for distribution (or available capital loss carryovers, as applicable) under income tax law and regulations. These reclassifications are due to permanent book-tax differences and have no impact on net assets. The primary permanent differences causing such reclassifications for the Portfolio are due to asset-backed securities and expired capital loss carryforwards.
|
| | | |
| Undistributed net investment income |
| $492,354 |
|
| Accumulated net realized gain (loss) | 455,245 |
|
| Paid-in capital | (947,599) |
|
NOTE D — LINE OF CREDIT
A financing agreement is in place with the Calvert Funds and State Street Corporation (“SSC”). Under the agreement, SSC provides an unsecured line of credit facility, in the aggregate amount of $50 million ($25 million committed and $25 million uncommitted), accessible by the Calvert Funds for temporary or emergency purposes only. Borrowings bear interest at the higher of the London Interbank Offered Rate (LIBOR) or the overnight Federal Funds Rate plus 1.25% per annum. A commitment fee of 0.20% per annum is incurred on the unused portion of the committed facility. An administrative fee of $25,000 was paid in connection with the uncommitted facility. These fees are allocated to all participating funds. The Portfolio had no borrowings under the agreement during the year ended December 31, 2015.
NOTE E — REORGANIZATIONS
On June 4, 2014, the Board of Directors of Calvert Variable Products, Inc. approved the reorganization of the Calvert VP Inflation Protected Plus Portfolio (“VP Inflation”) into the Calvert VP Investment Grade Bond Index Portfolio (“VP Bond Index”). Shareholders approved the reorganization at a meeting on October 31, 2014 and the reorganization took place on November 14, 2014.
The acquisition was accomplished by a taxable exchange of the following shares:
|
| | | | |
| Merged Portfolio | Shares | Acquiring Portfolio | Shares | Value |
| VP INFLATION | 211,356 | VP BOND INDEX | 201,744 | $11,267,111 |
For financial reporting purposes, assets received and shares issued by VP Bond Index were recorded at fair value.
www.calvert.com CALVERT VP INVESTMENT GRADE BOND INDEX PORTFOLIO ANNUAL REPORT 21
The net assets immediately before the acquisitions were as follows:
|
| | | |
| Merged Portfolio | Net Assets | Acquiring Portfolio | Net Assets |
| VP INFLATION | $11,267,111 | VP BOND INDEX | $203,877,715 |
Assuming the acquisition had been completed on January 1, 2014, VP Bond Index’s results of operations for the year ended December 31, 2014 would have been as follows:
|
| |
| Net investment income | $5,376,920 (a) |
| Net realized and change in unrealized gain (loss) on investments | $11,081,684 (b) |
| | |
| Net increase (decrease) in assets from operations | $16,458,604 |
Because VP Bond Index and VP Inflation sold and redeemed shares throughout the period, it is not practicable to provide pro-forma information on a per-share basis.
Because the combined investment portfolios have been managed as a single integrated portfolio since the acquisition was completed, it is also not practicable to separate the amounts of revenue and earnings of VP Inflation that have been included in VP Bond Index’s Statement of Operations since November 14, 2014.
(a) $4,493,498 as reported, plus $883,422 from VP Income pre-merger.
(b) $7,514,046 as reported plus $3,567,638 from VP Inflation pre-merger.
On December 11, 2013, the Board of Directors of Calvert Variable Products, Inc. approved the reorganization of the Calvert VP Income Portfolio (“VP Income”) into the Calvert VP Investment Grade Bond Index Portfolio (“VP Bond Index”). Shareholders approved the reorganization at a meeting on April 11, 2014 and the reorganization took place on April 30, 2014.
The acquisition was accomplished by a tax-free exchange of the following shares:
|
| | | | |
| Merged Portfolio | Shares | Acquiring Portfolio | Shares | Value |
| VP INCOME | 1,995,827 | VP BOND INDEX | 592,020 | $32,310,044 |
For financial reporting purposes, assets received and shares issued by VP Bond Index were recorded at fair value; however, the cost basis of the investments received from VP Income were carried forward to align ongoing reporting of VP Bond Index’s realized and unrealized gains and losses with amounts distributable to shareholders for tax purposes.
The net assets and net unrealized appreciation (depreciation) immediately before the acquisitions were as follows:
|
| | | | |
| Merged Portfolio | Net Assets | Unrealized Appreciation (Depreciation) | Acquiring Portfolio | Net Assets |
| VP INCOME | $32,310,044 | $552,102 | VP BOND INDEX | $200,923,845 |
Assuming the acquisition had been completed on January 1, 2014, VP Bond Index’s results of operations for the year ended December 31, 2014 would have been as follows:
|
| |
| Net investment income | $4,792,097 (a) |
| Net realized and change in unrealized gain (loss) on investments | $8,348,371 (b) |
| | |
| Net increase (decrease) in assets from operations | $13,140,468 |
Because VP Bond Index and VP Income sold and redeemed shares throughout the period, it is not practicable to provide pro-forma information on a per-share basis.
Because the combined investment portfolios have been managed as a single integrated portfolio since the acquisition was completed, it is also not practicable to separate the amounts of revenue and earnings of VP Income that have been included in VP Bond Index’s Statement of Operations since April 30, 2014.
22 www.calvert.com CALVERT VP INVESTMENT GRADE BOND INDEX PORTFOLIO ANNUAL REPORT
(a) $4,493,498 as reported, plus $298,599 from VP Income pre-merger.
(b) $7,514,046 as reported, plus $834,325 from VP Income pre-merger.
NOTE F — SUBSEQUENT EVENTS
In preparing the financial statements as of December 31, 2015, no subsequent events or transactions occurred that would have required recognition or disclosure in these financial statements.
www.calvert.com CALVERT VP INVESTMENT GRADE BOND INDEX PORTFOLIO ANNUAL REPORT 23
CALVERT VP INVESTMENT GRADE BOND INDEX PORTFOLIO
FINANCIAL HIGHLIGHTS
|
| | | | | | | | | | | | | | | | | | | | |
| | YEARS ENDED | |
| CLASS I SHARES | December 31, 2015 (a) | | December 31, 2014 | | December 31, 2013 | | December 31, 2012 | | December 31, 2011 (a) | |
| Net asset value, beginning |
| $54.90 |
| |
| $53.11 |
| |
| $56.06 |
| |
| $55.50 |
| |
| $52.80 |
| |
| Income from investment operations: | | | | | | | | | | |
| Net investment income | 1.19 |
| | 1.19 |
| | 1.03 |
| | 1.08 |
| | 1.42 |
| |
| Net realized and unrealized gain (loss) | (1.17) |
| | 1.96 |
| | (2.59) |
| | 1.04 |
| | 3.01 |
| |
| Total from investment operations | 0.02 |
| | 3.15 |
| | (1.56) |
| | 2.12 |
| | 4.43 |
| |
| Distributions from: | | | | | | | | | | |
| Net investment income | (0.08) |
| | (1.36) |
| | (1.31) |
| | (1.28) |
| | (1.35) |
| |
| Net realized gain | — |
| | — |
| | (0.08) |
| | (0.28) |
| | (0.38) |
| |
| Total distributions | (0.08) |
| | (1.36) |
| | (1.39) |
| | (1.56) |
| | (1.73) |
| |
| Total increase (decrease) in net asset value | (0.06) |
| | 1.79 |
| | (2.95) |
| | 0.56 |
| | 2.70 |
| |
| Net asset value, ending |
| $54.84 |
| |
| $54.90 |
| |
| $53.11 |
| |
| $56.06 |
| |
| $55.50 |
| |
| Total return(b) | 0.04 | % | | 5.93 | % | | (2.80 | %) | | 3.83 | % | | 8.39 | % | |
| Ratios to average net assets: (c) | | | | | | | | | | |
| Net investment income | 2.16 | % | | 2.17 | % | | 1.84 | % | | 2.07 | % | | 2.58 | % | |
| Total expenses | 0.52 | % | | 0.50 | % | | 0.50 | % | | 0.49 | % | | 0.50 | % | |
| Net expenses | 0.52 | % | | 0.50 | % | | 0.50 | % | | 0.49 | % | | 0.50 | % | |
| Portfolio turnover | 6 | % | | 24 | % | | 41 | % | | 43 | % | | 40 | % | |
| Net assets, ending (in thousands) |
| $190,437 |
| |
| $211,930 |
| |
| $199,633 |
| |
| $203,442 |
| |
| $168,830 |
| |
| | | | | | | | | | | |
| (a)Per share figures are calculated using the Average Shares Method. |
| (b)Total return is not annualized for periods of less than one year and does not reflect charges and expenses of the variable annuity or variable universal life contract. |
| (c)Total expenses do not reflect amounts reimbursed and/or waived by the Advisor and certain of its affiliates, if applicable. Net expenses are net of all reductions and represent the net expenses paid by the Portfolio. |
| See notes to financial statements. |
24 www.calvert.com CALVERT VP INVESTMENT GRADE BOND INDEX PORTFOLIO ANNUAL REPORT
CALVERT VP INVESTMENT GRADE BOND INDEX PORTFOLIO
FINANCIAL HIGHLIGHTS
|
| | | | |
| | PERIOD ENDED | |
| CLASS F SHARES | December 31, 2015(a)(b) | |
| Net asset value, beginning |
| $55.33 |
| |
| Income from investment operations: | | |
| Net investment income | 0.19 |
| |
| Net realized and unrealized gain (loss) | (0.62) |
| |
| Total from investment operations | (0.43) |
| |
| Distributions from: | | |
| Net investment income | (0.11) |
| |
| Total distributions | (0.11) |
| |
| Total increase (decrease) in net asset value | (0.54) |
| |
| Net asset value, ending |
| $54.79 |
| |
| Total return(c) | (0.78 | %) | |
| Ratios to average net assets (d) | | |
| Net investment income | 2.01%(e) |
| |
| Total expenses | 0.78%(e) |
| |
| Net expenses | 0.78%(e) |
| |
| Portfolio turnover | 6 | % | |
| Net assets, ending (in thousands) |
| $99 |
| |
| | | |
| (a)Per share figures are calculated using the Average Shares Method. |
| (b)From October 30, 2015 inception. |
| (c)Total return is not annualized for periods of less than one year and does not reflect charges and expenses of the variable annuity or variable universal life contract. |
| (d)Total expenses do not reflect amounts reimbursed and/or waived by the Advisor and certain of its affiliates, if applicable. Net expenses are net of all reductions and represent the net expenses paid by the Portfolio. |
| (e)Annualized. |
| See notes to financial statements. |
www.calvert.com CALVERT VP INVESTMENT GRADE BOND INDEX PORTFOLIO ANNUAL REPORT 25
PROXY VOTING
The Proxy Voting Guidelines that the Portfolio uses to determine how to vote proxies relating to portfolio securities is provided as an Appendix to the Fund’s Statement of Additional Information. The Statement of Additional Information can be obtained free of charge by calling the Fund at 1-800-368-2745, by visiting the Calvert website at www.calvert.com or by visiting the SEC’s website at www.sec.gov.
Information regarding how the Fund voted proxies relating to portfolio securities during the most recent 12-month period ended June 30 is available by calling the Fund, by visiting the Calvert website at www.calvert.com or visiting the SEC’s website at www.sec.gov.
AVAILABILITY OF QUARTERLY PORTFOLIO HOLDINGS
The Fund files its complete schedule of portfolio holdings with the SEC for the first and third quarters of each fiscal year on Form N-Q. The Fund’s Form N-Q is available on the SEC’s website at www.sec.gov. The Fund’s Form N-Q may be reviewed and copied at the SEC’s Public Reference Room in Washington, DC; information on the operation of the Public Reference Room may be obtained by calling 1-800-SEC-0330.
BASIS FOR BOARD'S APPROVAL OF INVESTMENT ADVISORY CONTRACTS
At a meeting held on December 9, 2015, the Board of Directors, and by a separate vote, the disinterested Directors, approved the continuance of the Investment Advisory Agreement between the Portfolio and the Advisor and the Investment Subadvisory Agreement between the Advisor and the Subadvisor with respect to the Portfolio.
In evaluating the Investment Advisory Agreement, the Board considered a variety of information relating to the Portfolio and the Advisor. The disinterested Directors reviewed a report prepared by the Advisor regarding various services provided to the Portfolio by the Advisor and its affiliates. Such report included, among other data, information regarding the Advisor's personnel and the Advisor's revenue and cost of providing services to the Portfolio, and a separate report prepared by an independent third party, which provided a statistical analysis comparing the Portfolio's investment performance, expenses, and fees to comparable mutual funds.
The disinterested Directors were separately represented by independent legal counsel with respect to their consideration of the reapproval of the Investment Advisory Agreement and the Investment Subadvisory Agreement. Prior to voting, the disinterested Directors reviewed the proposed continuance of the Investment Advisory Agreement and Investment Subadvisory Agreement with management and also met in private sessions with their counsel at which no representatives of management were present.
In the course of its deliberations regarding the Investment Advisory Agreement, the Board considered the following factors, among others: the nature, extent and quality of the services provided by the Advisor, including the personnel providing such services; the Advisor's financial condition; the level and method of computing the Portfolio's advisory fee; comparative performance, fee and expense information for the Portfolio; the profitability of the Calvert Family of Funds to the Advisor and its affiliates; the allocation of the Portfolio's brokerage, including the Advisor's process for monitoring "best execution"; the direct and indirect benefits, if any, derived by the Advisor and its affiliates from their relationship with the Portfolio; the effect of the Portfolio's growth and size on the Portfolio's performance and expenses; the Advisor's compliance programs and policies; the Advisor's performance of substantially similar duties for other funds; and any possible conflicts of interest.
In considering the nature, extent and quality of the services provided by the Advisor under the Investment Advisory Agreement, the Board reviewed information provided by the Advisor relating to its operations and personnel, including, among other information, biographical information on the Advisor's supervisory and professional staff and descriptions of its organizational and management structure. The Board also took into account similar information provided periodically throughout the previous year by the Advisor, as well as the Board’s familiarity with the Advisor’s management through Board of Directors' meetings, discussions and other reports. The Board considered the Advisor's current level of staffing and overall resources. The Board also noted that it reviewed on a quarterly basis information regarding the Advisor’s compliance with applicable policies and procedures, including those related to personal investing. The Advisor's administrative capabilities, including its ability to supervise the other service providers for the Portfolio, were also considered. The Board discussed the Advisor's effectiveness in monitoring the performance of the Subadvisor and its timeliness in responding to performance issues. The Board observed that the scope of services provided by the Advisor
26 www.calvert.com CALVERT VP INVESTMENT GRADE BOND INDEX PORTFOLIO ANNUAL REPORT
generally had expanded over time as a result of regulatory, market and other changes. The Board took into consideration, among other factors, the effectiveness of the Portfolio’s and Advisor’s processes, policies and procedures and the Advisor’s personnel. The Board also took into account, among other items, periodic reports received from the Advisor over the past year concerning the Advisor’s ongoing review and enhancement of certain processes, policies and procedures of the Portfolio and the Advisor. The Board concluded that it was satisfied with the nature, extent and quality of services provided to the Portfolio by the Advisor under the Investment Advisory Agreement.
In considering the Portfolio's performance, the Board noted that it reviewed on a quarterly basis detailed information about the Portfolio's performance results, portfolio composition and investment strategies. In addition, the Board took into account overall financial market conditions. The Board also reviewed various comparative data provided to it in connection with its consideration of the renewal of the Investment Advisory Agreement, including, among other information, a comparison of the Portfolio's total return with its Lipper index and with that of other mutual funds deemed to be in its peer universe by an independent third party in its report. This comparison indicated that the Portfolio performed above the median of its peer universe for the one-year period ended June 30, 2015, and below the median of its peer universe for the three- and five-year periods ended June 30, 2015. The data also indicated that the Portfolio outperformed its Lipper index for the one-year period ended June 30, 2015, and underperformed its Lipper index for the three- and five-year periods ended June 30, 2015. The Board also took into account management’s discussion of the Portfolio’s performance, including the composition of the peer universe against which the Portfolio was being measured, and the impact of differing fees and expenses among the funds in the peer group on the Portfolio’s relative performance. Based upon its review, the Board concluded that the Portfolio’s performance was satisfactory relative to the performance of passively-managed funds that track the same benchmark index as does the Portfolio.
In considering the Portfolio's fees and expenses, the Board compared the Portfolio's fees and total expense ratio with various comparative data for the funds in its peer group. Among other findings, the data indicated that the Portfolio's advisory fee was above the median of its peer group and that total expenses were above the median of its peer group. The Board noted that the allocation of advisory and administrative fees may vary among the Portfolio’s peer group. The Board also took into account the Advisor’s current undertaking to maintain expense limitations for the Portfolio. The Board noted that the Advisor is not currently reimbursing any Portfolio expenses. The Board noted that the Advisor paid the Subadvisor’s subadvisory fee under the Investment Subadvisory Agreement with respect to the Portfolio. The Board also took into account management's discussion of the Portfolio's expenses and certain factors that affected the level of such expenses, including the current size of the Portfolio. Based upon its review, the Board determined that the advisory fee was reasonable in view of the quality of services received by the Portfolio from the Advisor and the other factors considered.
The Board reviewed the Advisor’s profitability on a portfolio-by-portfolio basis. In reviewing the overall profitability of the advisory fee to the Portfolio's Advisor, the Board also considered the fact that affiliates of the Advisor provided shareholder servicing and administrative services to the Portfolio for which they received compensation. The information considered by the Board included Calvert’s operating profit margin information both before and after tax expenses with respect to the services that the Advisor and its affiliates provided to the Calvert Family of Funds complex. The Board reviewed the profitability of the Advisor's relationship with the Portfolio in terms of the total amount of annual advisory fees it received with respect to the Portfolio and whether the Advisor had the financial wherewithal to continue to provide services to the Portfolio. The Board also considered that the Advisor derived benefits to its reputation and other indirect benefits from its relationship with the Portfolio. In addition, the Board took into account that affiliates of the Advisor may benefit from certain indirect tax benefits relating to dividend received deductions and foreign tax credits. The Board also noted that the Advisor paid the subadvisory fee to the Subadvisor, an affiliate of the Advisor. Based upon its review, the Board concluded that the Advisor’s and its affiliates’ level of profitability from their relationship with the Portfolio was reasonable.
The Board considered the effect of the Portfolio's current size and potential growth on its performance and fees. Although the Portfolio’s advisory fee did not contain breakpoints that would reduce the advisory fee rate on assets above specified asset levels, the Board noted that if the Portfolio’s assets increased over time, the Portfolio might realize other economies of scale if assets increased proportionally more than certain other expenses. The Board also noted that given the Portfolio’s current level of assets, the Portfolio would be unlikely to recognize economies of scale by implementing a breakpoint in the advisory fee at this time.
www.calvert.com CALVERT VP INVESTMENT GRADE BOND INDEX PORTFOLIO ANNUAL REPORT (UNAUDITED) 27
In reapproving the Investment Advisory Agreement, the Board, including the disinterested Directors, did not identify any single factor as controlling, and each Director may have attributed different weight to various factors.
In evaluating the Investment Subadvisory Agreement, the disinterested Directors reviewed information provided by the Subadvisor relating to its operations, personnel, investment philosophy, strategies and techniques. Among other information, the Subadvisor provided biographical information on portfolio management and other professional staff, performance information for itself, and descriptions of its investment philosophies, strategies and techniques, organizational and management structures and brokerage policies and practices.
The Board reapproved the Investment Subadvisory Agreement between the Subadvisor and the Advisor based on a number of factors relating to the Subadvisor's ability to perform under the Investment Subadvisory Agreement. In the course of its deliberations, the Board evaluated, among other factors: the nature, extent and the quality of the services to be provided by the Subadvisor; the Subadvisor's management style and long-term performance record; the Portfolio's performance record and the Subadvisor's performance in employing its investment strategies; the Subadvisor's current level of staffing and its overall resources; the qualifications and experience of the Subadvisor's personnel; the Subadvisor's financial condition with respect to its ability to perform the services required under the Investment Subadvisory Agreement; the Subadvisor's risk management processes; the Subadvisor's compliance systems, including those related to personal investing; and any disciplinary history. Based upon its review, the Board concluded that it was satisfied with the nature, extent and quality of services provided to the Portfolio by the Subadvisor under the Investment Subadvisory Agreement.
As noted above, the Board considered, among other information, the Portfolio's performance during the one-, three- and five-year periods ended June 30, 2015, as compared to the Portfolio's peer universe and noted that it reviewed on a quarterly basis detailed information about the Portfolio's performance results, portfolio composition and investment strategies. The Board noted the Advisor's expertise and resources in monitoring the performance, investment style and risk adjusted performance of the Subadvisor.
In considering the cost of services to be provided by the Subadvisor and the profitability to the Subadvisor of its relationship with the Portfolio, the Board noted that the Advisor and Subadvisor were affiliated and the subadvisory fee under the Investment Subadvisory Agreement was paid by the Advisor out of the advisory fee that the Advisor received under the Investment Advisory Agreement. Based upon its review, the Board determined that the subadvisory fee was reasonable in view of the quality of services received by the Portfolio from the Subadvisor and the other factors considered. Because the Advisor would pay the Subadvisor’s subadvisory fee, the cost of services to be provided by the Subadvisor and the level of profitability to the Subadvisor from its relationship with the Portfolio were not material factors in the Board’s deliberations. For similar reasons, the Board did not consider the potential economies of scale in the Subadvisor’s management of the Portfolio to be a material factor in its consideration.
In reapproving the Investment Subadvisory Agreement, the Board, including the disinterested Directors, did not identify any single factor as controlling, and each Director may have attributed different weight to various factors.
Conclusions
The Board reached the following conclusions regarding the Investment Advisory Agreement and the Investment Subadvisory Agreement, among others: (a) the Advisor has demonstrated that it possesses the capability and resources to perform the duties required of it under the Investment Advisory Agreement; (b) the Subadvisor is qualified to manage the Portfolio's assets in accordance with the Portfolio’s investment objective and policies; (c) the Advisor and Subadvisor maintain appropriate compliance programs; (d) the Subadvisor is likely to execute its investment strategies consistently over time; (e) the performance of the Portfolio is satisfactory relative to the performance of passively-managed funds that track the same benchmark index as does the Portfolio; and (f) the Portfolio's advisory and subadvisory fees are reasonable in view of the quality of services received by the Portfolio from the Advisor and Subadvisor and the other factors considered. Based on its conclusions, the Board determined that reapproval of the Investment Advisory Agreement and the Investment Subadvisory Agreement would be in the best interests of the Portfolio and its shareholders.
28 www.calvert.com CALVERT VP INVESTMENT GRADE BOND INDEX PORTFOLIO ANNUAL REPORT (UNAUDITED)
DIRECTOR AND OFFICER INFORMATION TABLE
|
| | | | | |
| Name & Age | Position with Fund | Position Start Date | Principal Occupation During Last 5 Years | # of Calvert Portfolios Overseen | Other Directorships |
| INDEPENDENT DIRECTORS |
FRANK H. BLATZ, JR., Esq. AGE: 80 | Director | 1982 CVS
2008 CVP | Of counsel to firm of Schiller & Pittenger, P.C. | 13 | None |
ALICE GRESHAM BULLOCK AGE: 65 | Director | 1999 CVS
2008 CVP | Professor at Howard University School of Law. She is former Dean of Howard University School of Law and Deputy Director of the Association of American Law Schools. | 15 | None |
M. CHARITO KRUVANT AGE: 70 | Director | 1999 CVS
2008 CVP | President and CEO of Creative Associates International, Inc., a firm that specializes in human resources development, information management, public affairs and private enterprise development. | 22 | • Acacia Federal Savings Bank (through 2013) • Summit Foundation • WETA Public Broadcasting |
CYNTHIA MILLIGAN AGE: 69
| Director | 1999 CVS
2008 CVP | Dean Emeritus, College of Business Administration, University of Nebraska, Lincoln. She is former President and Chief Executive Officer for CMA, a consulting firm for financial institutions. | 15 | • Wells Fargo Company (banking and financial services) - NYSE • Wells Fargo Bank N.A. (Since 2014) • Gallup, Inc. (management consulting) • W.K. Kellogg Foundation • Raven Industries (technology company) - NASDAQ • Colonial Williamsburg Foundation • Kellogg Company (food manufacturing) - NYSE |
ARTHUR J. PUGH AGE: 78 | Director | 1982 CVS
2008 CVP | Retired executive. | 13 | None |
| INTERESTED DIRECTORS |
WILLIAM LESTER* AGE: 58 | Director & Chair (CVS)
Director & Senior Vice President (CVP) | 2004 CVS
2008 CVP | Executive Vice President Finance/Investments and Corporate Treasurer of Ameritas Mutual Holding Company. Chair and former President (resigned 2012) of Ameritas Investment Partners, Inc. | 13 | • Acacia Federal Savings Bank (through 2013)• Ameritas Investment Partners, Inc. (financial services)• Ameritas Investment Corp. (financial services)• Universal and Inland Insurance Companies• Bryan/LGH Health Systems |
www.calvert.com CALVERT VP INVESTMENT GRADE BOND INDEX PORTFOLIO ANNUAL REPORT (UNAUDITED) 29
|
| | | | | |
| Name & Age | Position with Fund | Position Start Date | Principal Occupation During Last 5 Years | # of Calvert Portfolios Overseen | Other Directorships |
| INTERESTED DIRECTORS |
JOHN H. STREUR* AGE: 56
| President (CVS)
Director, Chair & President (CVP) | 2015 | President and Chief Executive Officer of Calvert Investments, Inc. (since January 2015) and Chief Compliance Officer for the Advisor and Calvert Investment Distributors, Inc. (since August 10, 2015); President and Director, Portfolio 21 Investments, Inc. (through October 2014); President, Chief Executive Officer and Director, Managers Investment Group LLC (through January 2012); President and Director, The Managers Funds and Managers AMG Funds (through January 2012). | 40 | • Portfolio 21 Investments, Inc. (asset management)(through October 2014) • Managers Investment Group LLC (asset management)(through January 2012) • The Managers Funds (asset management) (through January 2012) • Managers AMG Funds (asset management) (through January 2012) • Calvert Social Investment Foundation |
|
| | | |
| Name & Age | Position with Fund | Position Start Date | Principal Occupation During Last 5 Years |
| OFFICERS |
VICKI L. BENJAMIN AGE: 54 | Treasurer | 2015 | Executive Vice President, Chief Financial Officer and Chief Operating Officer of Calvert Investments, Inc. since October 2015; Senior Vice President and Chief Financial Officer of Calvert Investments, Inc. (March 2015 - September 2015). Prior to Calvert, Ms. Benjamin was a Senior Partner at KPMG. |
ROBERT D. BENSON, ESQ. AGE: 37 | Assistant Vice President & Assistant Secretary | 2014 | Assistant General Counsel (since 2014), Assistant Vice President & Assistant Secretary (since 2015) and Staff Attorney (prior to 2014), Calvert Investments, Inc. |
HOPE BROWN AGE: 42 | Chief Compliance Officer | 2014 | Chief Compliance Officer for the Calvert Funds (since 2014). Vice President and Chief Compliance Officer, Wilmington Funds (2012-2014). Vice President and Senior Compliance Officer, Wilmington Trust Investment Advisors, Inc. (2010-2012). |
STU DALHEIM AGE: 46 | Vice President | 2015 | Vice President - Shareholder Advocacy for the Advisor. |
MATTHEW DUCH Age: 40 | Vice President | 2011 | Vice President of the Advisor and portfolio manager for Calvert’s taxable fixed-income funds. |
ROBERT J. ENDERSON, CFA AGE: 57 | Assistant Treasurer | 2014 | Vice President, Corporate Finance, of Calvert Investments, Inc.; Acting Chief Financial Officer of Calvert Investments, Inc. (September 2014 - March 2015). |
PATRICK FAUL AGE: 51 | Vice President | 2010 | Vice President and Head of Credit Research for the Advisor. |
TRACI L. GOLDT AGE: 42 | Assistant Secretary | 2004 | SEC Filing and Administrative Operations Manager, Calvert Investments, Inc. |
JADE HUANG AGE: 41 | Vice President | 2015 | Equity Portfolio Manager since November 2015 and Senior Equity Analyst prior to November 2015, Advisor. |
EMILY KAISER AGE: 32 | Assistant Vice President | 2015 | Senior Sustainability Analyst since November 2015 and Sustainability Analyst (January 2014 - October 2015), Advisor. Prior to joining Calvert, Ms. Kaiser attended law school from 2010 to 2013 and also held legal and policy positions with the U.S. Agency for International Development (2013), the Solidarity Center, AFL-CIO (2013), the U.S. Department of Labor (2012), the office of the U.S. Trade Representative (2012) and the Public International Law and Policy Group (2011-2012). |
VISHAL KHANDUJA, CFA AGE: 37 | Vice President | 2014 | Head of Taxable Fixed Income (since 2015) and Vice President of the Advisor (since 2014); Portfolio Manager for Calvert’s taxable fixed-income funds since 2012. Previously worked at Columbia Management as Portfolio Manager - Global Rates and Currency Team (2009-2012). |
30 www.calvert.com CALVERT VP INVESTMENT GRADE BOND INDEX PORTFOLIO ANNUAL REPORT (UNAUDITED)
|
| | | |
| Name & Age | Position with Fund | Position Start Date | Principal Occupation During Last 5 Years |
| OFFICERS |
LANCELOT A. KING, ESQ. AGE: 45 | Assistant Vice President & Secretary | 2002 | Assistant Vice President, Assistant Secretary and Associate General Counsel of Calvert Investments, Inc. |
ERICA LASDON AGE: 44 | Assistant Vice President | 2015 | Director of Sustainability Research since August 2015 and Senior Sustainability Analyst and Manager prior to August 2015, Advisor. |
JOSHUA LINDER AGE: 30 | Vice President | 2015 | Equity Portfolio Manager since November 2015, Assistant Portfolio Manager (January 2014 - October 2015) and Equity Analyst (2011 - 2013), Advisor. |
CHRISTOPHER MADDEN AGE: 40 | Vice President | 2015 | Equity Portfolio Manager since November 2015 and Senior Equity Analyst prior to November 2015, Advisor. |
ANDREW K. NIEBLER, ESQ. AGE: 48 | Assistant Vice President & Assistant Secretary | 2006 | Assistant Vice President, Assistant Secretary and Associate General Counsel of Calvert Investments, Inc. |
MARYBETH PILAT, CPA AGE: 47 | Fund Controller and Assistant Treasurer | 2015 | Director of Fund Administration, Calvert Investment Administrative Services, Inc. since August 2015. VP Expense & Budgeting, Global Fiduciary Platform, Legg Mason (May 2015 - July 2015). Vice President and Assistant Treasurer, Columbia Funds, Ameriprise, Columbia Management (2010 - April 2015). |
| |
| * | The address of Directors and Officers is 4550 Montgomery Avenue, Suite 1000N, Bethesda, Maryland 20814. Mr. Streur is an interested person of the Fund since he is an officer and director of the Fund’s Advisor and its affiliates. Mr. Lester is an interested person of the Fund since he is an officer and director of the parent company of the Fund’s Advisor. |
Additional information about the Fund’s Directors can be found in the Statement of Additional Information (SAI). You can get a free copy of the SAI by contacting your broker, or the Fund at 1-800-368-2745.
www.calvert.com CALVERT VP INVESTMENT GRADE BOND INDEX PORTFOLIO ANNUAL REPORT (UNAUDITED) 31
|
| |
| | |
This report is intended to provide fund information to shareholders. It is not authorized for distribution to prospective investors unless preceded or accompanied by a prospectus. Note: The information on our website is not incorporated by reference into this report; our website address is included as an inactive textual reference only. Investors should carefully consider the investment objectives, risks, charges and expenses of the Calvert Funds. This and other important information is contained in the fund’s summary prospectus and prospectus, which can be obtained from your financial professional and should be read carefully before investing. You may also call Calvert at 800/368-2745. |
| Printed on recycled paper using soy inks. | |
|
| |
|
Calvert VP Natural Resources Portfolio |
Annual Report December 31, 2015 | |
|
| | | | |
| | TABLE OF CONTENTS |
| | | | | |
| | | | | Portfolio Management Discussion |
| | | | | Understanding Your Fund's Expenses |
| | | | | Report of Independent Registered Public Accounting Firm |
| | | | | Schedule of Investments |
| | | | | Statement of Assets and Liabilities |
| | | | | Statement of Operations |
| | | | | Statements of Changes in Net Assets |
| | | | | Notes to Financial Statements |
| | | | | Financial Highlights |
| | | | | Proxy Voting |
| | | | | Availability of Quarterly Portfolio Holdings |
| | | | | Basis for Board’s Approval of Investment Advisory Contracts |
| | | | | Director and Officer Information Table |
|
| | |
| | | PORTFOLIO MANAGEMENT DISCUSSION |
|
| |
| John N. Thompson Ameritas Investment Partners, Inc. |
Market Review
The investment climate for commodities and commodity related companies was nothing short of dismal during 2015. The sector experienced sharp price drops and underperformed the overall equity market, with the best major sub-categories posting double digit declines.
Crude oil prices, as measured by West Texas Intermediate crude, started the year near $54 per barrel, and fell to $37 at year end as the positive effects of modest declines in supply were offset by softer economic reports out of China which put global economic strength and the Commodity’s level of demand into question. In concert with oil, other commodities generally fell hard, grains fared relatively better than most other commodities, trading down 10% to 15% on the year, pushed down by generally favorable growing conditions. Base-metals dropped harder, Copper and Zinc declined 24% and 26% respectively, with their declines attributed to concerns of a global slow-down, as well as some forecasted supply increases.
Investment Strategy and Technique:
The Calvert VP Natural Resources Portfolio (the Portfolio) invests in exchange-traded funds (ETFs) and exchange-traded notes (ETNs) that track various commodity, natural resource, and raw materials indices. The Portfolio is constructed to maintain diversified broad exposures to a wide variety of commodities and natural resources, offering exposures similar to the benchmark. Fund selection is based on the underlying company or commodity holdings, the fund management processes, and fund expenses. As of December 31,2015, the Portfolio’s largest exposure was to Energy at 65.3%, followed by Precious Metals at 9.2%, and Grains at about 9.0%.
Fund Performance Relative to the Benchmark
For the year ended December 31, 2015, the Calvert VP Natural Resources Portfolio returned -24.86% compared to 1.38% for the benchmark Standard & Poor’s (S&P) 500 Index. Concentrated holdings by design, in the commodity and natural resource sectors caused the Portfolio to underperform the benchmark, since the S&P 500 Index has a more diversified allocation of holdings across sectors.
|
| | | |
| ECONOMIC SECTORS | % OF TOTAL INVESTMENTS | |
| Energy Stocks | 58.7 | % | |
| Grain Commodities | 9.1 | % | |
| Energy Commodities | 7.2 | % | |
| Industrial Metals Commodities | 5.9 | % | |
| Precious Metals Commodities | 5.5 | % | |
| Metals Stocks | 5.0 | % | |
| Soft Commodities | 3.2 | % | |
| Industry Stocks | 2.1 | % | |
| Livestock Commodities | 1.7 | % | |
| Steel and Other Stocks | 1.6 | % | |
| Total | 100 | % | |
| | | |
The blended return from the Natural Resources Composite Benchmark, a mix of market indices that more closely reflects the Portfolio’s asset allocation strategy, returned -24.09% for the period.
There was a slight lag in performance attributed to the Fund’s fees, as well as the expenses of underlying investments. Pockets of strength could be found in a slight overweight to grains and an underweight to energy commodities, offset by a slight overweight to steel companies.
Positioning and Market Outlook
Entering 2016 the outlook for commodities and natural resources is far from certain. The price declines and volatility of 2014 and 2015 have shaken market confidence and de-stabilized the market contributors. At current levels, our view is commodity and natural resource prices declines are reflected is the related stock prices, and we see an environment where price stabilization could yield above-average stock price recoveries within the Energy and Materials sectors. As such we hold a modest overweight exposure to funds holding stocks, and underweight more direct commodity exposures.
Ameritas Investment Partners, Inc.
December 2015
www.calvert.com CALVERT VP NATURAL RESOURCES PORTFOLIO ANNUAL REPORT (UNAUDITED) 1
Growth of $10,000
The graph below shows the value of a hypothetical $10,000 investment in the Portfolio over the past 10 fiscal year periods or since inception (for funds without 10-year records). The results shown are for Class I shares, and assume the reinvestment of dividends. The result is compared with a broad based market index. Market indexes are unmanaged and their results do not reflect the effect of expenses or sales charges. The value of an investment in a different share class would be different.
|
| | | | | | |
| CALVERT VP NATURAL RESOURCES PORTFOLIO |
| DECEMBER 31, 2015 |
| AVERAGE ANNUAL TOTAL RETURNS | 1 Year | 5 Year | Since Inception (12/28/2006) |
| Class I | -24.86 | % | -9.65 | % | -4.26 | % |
| S&P 500 Index | 1.38 | % | 12.57 | % | 6.34 | % |
| Natural Resources Composite Benchmark | -24.09 | % | -9.19 | % | -3.06 | % |
| | | | |
| The Natural Resources Composite Benchmark is an internally constructed index comprised of blend of 35% Bloomberg Commodity Index and 65% S&P North American Natural Resources Sector Index. |
| | | | |
The performance data shown represents past performance, does not guarantee future results and assumes reinvestment of all dividends and distributions. All performance data reflects fee waivers and/or expense limitations, if any are in effect; in their absence performance would be lower. See Note B in Notes to Financial Statements. The investment return and principal value of an investment will fluctuate so that an investor’s shares, when redeemed, may be worth more or less than their original cost. Current performance may be lower or higher than the performance data quoted.
Visit calvert.com/institutional-VP-performance.html for current performance data. The gross expense ratio from the current prospectus for the Portfolio is 1.25% (includes Acquired Fund fees). This number may vary from the expense ratio shown elsewhere in this report because it is based on a different time period and, if applicable, does not include fee or expense waivers. The performance data and expense ratio reflect deduction of Portfolio operating expenses, but do not reflect charges and expenses imposed under the variable annuity or life insurance contract.
2 www.calvert.com CALVERT VP NATURAL RESOURCES PORTFOLIO ANNUAL REPORT (UNAUDITED)
UNDERSTANDING YOUR FUND'S EXPENSES
As an investor, you incur two types of costs. There are transaction costs. There are also ongoing costs, which generally include management fees and other fund expenses. The following information is intended to help you understand your ongoing costs (in dollars) of investing in this mutual fund and to help you compare these costs with the ongoing costs of investing in other mutual funds.
To illustrate these ongoing costs, we have provided examples and calculated the expenses paid by the fund's investors during the period. The actual and hypothetical information presented in the examples is based on an investment of $1,000 invested at the beginning of the period and held for the entire period (July 1, 2015 to December 31, 2015).
Note: Expenses do not reflect charges and expenses of the variable annuity or variable universal life contract.
Actual Expenses
The first line of the table below provides information about actual account values and actual expenses. You may use the information in this line, together with the amount you invested, to estimate the expenses that you paid over the period. Simply divide your account value by $1,000 (for example, an $8,600 account value divided by $1,000 = 8.6), then multiply the result by the number in the first line under the heading entitled “Expenses Paid During Period” to estimate the expenses you paid on your account during this period.
Hypothetical Example for Comparison Purposes
The second line of the table below provides information about hypothetical account values and hypothetical expenses based on the Fund’s actual expense ratio and an assumed rate of return of 5% per year before expenses, which is not the Fund’s actual return. The hypothetical account values and expenses may not be used to estimate the actual ending account balance or expenses you paid for the period. You may use this information to compare the ongoing costs of investing in the Fund and other funds. To do so, compare the 5% hypothetical example with the 5% hypothetical examples that appear in the shareholder reports of the other funds.
Please note that the expenses shown in the table are meant to highlight your ongoing costs only and do not reflect any transactional costs. Therefore, the second line of the table is useful in comparing ongoing costs only, and will not help you determine the relative total costs of owning different funds. In addition, if these transactional costs were included, your costs would have been higher.
|
| | | | |
| | ANNUALIZED
EXPENSE RATIO | BEGINNING
ACCOUNT VALUE
7/1/15 | ENDING
ACCOUNT VALUE
12/31/15 | EXPENSES PAID
DURING PERIOD*
7/1/15 - 12/31/15 |
| | | | | |
| Actual | 0.79% | $1,000.00 | $782.50 | $3.55 |
| Hypothetical (5% return per year before expenses) | 0.79% | $1,000.00 | $1,021.22 | $4.02 |
| |
| * Expenses paid during the period are equal to the annualized expense ratio as indicated above, multiplied by the average account value over the period, multiplied by 184/365 (to reflect the one-half year period). Expenses do not include fees and expenses incurred indirectly from investment in underlying funds, including affiliated and unaffiliated companies. Expense ratios shown in the Financial Highlights represent the actual expenses incurred for the fiscal year. |
www.calvert.com CALVERT VP NATURAL RESOURCES PORTFOLIO ANNUAL REPORT (UNAUDITED) 3
REPORT OF INDEPENDENT REGISTERED PUBLIC ACCOUNTING FIRM
The Board of Directors of Calvert Variable Products, Inc. and Shareholders of Calvert VP Natural Resources Portfolio:
We have audited the accompanying statement of assets and liabilities, including the schedule of investments, of the Calvert VP Natural Resources Portfolio (the “Portfolio”), a series of Calvert Variable Products, Inc., as of December 31, 2015, and the related statement of operations for the year then ended, the statements of changes in net assets for each of the years in the two-year period then ended, and the financial highlights for each of the years in the five-year period then ended. These financial statements and financial highlights are the responsibility of the Portfolio’s management. Our responsibility is to express an opinion on these financial statements and financial highlights based on our audits.
We conducted our audits in accordance with the standards of the Public Company Accounting Oversight Board (United States). Those standards require that we plan and perform the audit to obtain reasonable assurance about whether the financial statements and financial highlights are free of material misstatement. An audit includes examining, on a test basis, evidence supporting the amounts and disclosures in the financial statements. Our procedures included confirmation of securities owned as of December 31, 2015, by correspondence with the custodian and brokers or by performing other appropriate auditing procedures. An audit also includes assessing the accounting principles used and significant estimates made by management, as well as evaluating the overall financial statement presentation. We believe that our audits provide a reasonable basis for our opinion.
In our opinion, the financial statements and financial highlights referred to above present fairly, in all material respects, the financial position of the Portfolio as of December 31, 2015, the results of its operations for the year then ended, the changes in its net assets for each of the years in the two-year period then ended, and the financial highlights for each of the years in the five-year period then ended, in conformity with U.S. generally accepted accounting principles.
Philadelphia, Pennsylvania
February 24, 2016
4 www.calvert.com CALVERT VP NATURAL RESOURCES PORTFOLIO ANNUAL REPORT
CALVERT VP NATURAL RESOURCES PORTFOLIO
SCHEDULE OF INVESTMENTS
DECEMBER 31, 2015
|
| | | | |
| | SHARES | VALUE ($) |
| EXCHANGE-TRADED PRODUCTS - 97.9% | | |
| Energy Select Sector SPDR Fund | 99,000 | 5,994,450 |
|
| iPath Bloomberg Commodity Index Total Return ETN * | 427,400 | 9,176,278 |
|
| iPath Bloomberg Grains Subindex Total Return ETN * | 45,100 | 1,368,785 |
|
| iShares North American Natural Resources ETF | 367,000 | 10,327,380 |
|
| iShares U.S. Oil & Gas Exploration & Production ETF | 56,100 | 2,968,251 |
|
| Market Vectors Gold Miners ETF | 74,400 | 1,020,768 |
|
| Market Vectors Oil Service ETF | 112,100 | 2,965,045 |
|
| PowerShares DB Base Metals Fund * | 80,600 | 957,528 |
|
| PowerShares DB Precious Metals Fund * | 13,200 | 426,228 |
|
| SPDR S&P Metals & Mining ETF | 79,900 | 1,194,505 |
|
| Vanguard Energy ETF | 71,900 | 5,976,328 |
|
| Wisdomtree Continuous Commodity Fund | 147,000 | 2,722,440 |
|
| | | |
| Total Exchange-Traded Products (Cost $67,458,598) | | 45,097,986 |
|
| | | |
| | | |
| | PRINCIPAL
AMOUNT ($) | VALUE ($) |
|
| TIME DEPOSIT - 3.2% | | |
| State Street Bank Time Deposit, 0.278%, 1/4/16 | 1,493,398 | 1,493,398 |
|
| | | |
| Total Time Deposit (Cost $1,493,398) | | 1,493,398 |
|
| | | |
| | | |
| TOTAL INVESTMENTS (Cost $68,951,996) - 101.1% | | 46,591,384 |
|
| Other assets and liabilities, net - (1.1)% | | (499,785) |
|
NET ASSETS - 100.0% | |
| $46,091,599 |
|
| |
|
| |
| NOTES TO SCHEDULE OF INVESTMENTS |
| * Non-income producing security. |
| | |
| Abbreviations: |
| ETF: | Exchange-Traded Fund |
| ETN: | Exchange-Traded Note |
| SPDR: | Standard & Poor's Depository Receipt |
| See notes to financial statements. |
www.calvert.com CALVERT VP NATURAL RESOURCES PORTFOLIO ANNUAL REPORT 5
CALVERT VP NATURAL RESOURCES PORTFOLIO
STATEMENT OF ASSETS AND LIABILITIES
DECEMBER 31, 2015
|
| | | |
| ASSETS | |
| Investments in securities, at value (Cost $68,951,996) - see accompanying schedule |
| $46,591,384 |
|
| Receivable for shares sold | 211,834 |
|
| Interest receivable | 12 |
|
| Directors' deferred compensation plan | 29,877 |
|
| Total assets | 46,833,107 |
|
| | |
| LIABILITIES | |
| Payable for securities purchased | 644,506 |
|
| Payable for shares redeemed | 15 |
|
| Payable to Calvert Investment Management, Inc. | 27,749 |
|
| Payable to Calvert Investment Administrative Services, Inc. | 3,945 |
|
| Payable to Calvert Investment Services, Inc. | 136 |
|
| Directors' deferred compensation plan | 29,877 |
|
| Accrued expenses and other liabilities | 35,280 |
|
| Total liabilities | 741,508 |
|
| NET ASSETS |
| $46,091,599 |
|
| | |
| NET ASSETS CONSIST OF: | |
| Paid-in capital applicable to 1,435,034 shares of common stock outstanding; | |
| $0.10 par value, 20,000,000 shares authorized |
| $70,876,725 |
|
| Undistributed net investment income | 431,568 |
|
| Accumulated net realized gain (loss) | (2,856,082) |
|
| Net unrealized appreciation (depreciation) | (22,360,612) |
|
| NET ASSETS |
| $46,091,599 |
|
| | |
| NET ASSET VALUE PER SHARE |
| $32.12 |
|
| See notes to financial statements. |
6 www.calvert.com CALVERT VP NATURAL RESOURCES PORTFOLIO ANNUAL REPORT
CALVERT VP NATURAL RESOURCES PORTFOLIO
STATEMENT OF OPERATIONS
YEAR ENDED DECEMBER 31, 2015
|
| | | |
| NET INVESTMENT INCOME | |
| Investment Income: | |
| Dividend income |
| $866,083 |
|
| Interest income | 719 |
|
| Total investment income | 866,802 |
|
| | |
| Expenses: | |
| Investment advisory fee | 302,997 |
|
| Administrative fees | 55,090 |
|
| Transfer agency fees and expenses | 6,189 |
|
| Directors' fees and expenses | 9,573 |
|
| Accounting fees | 15,700 |
|
| Custodian fees | 11,090 |
|
| Professional fees | 26,493 |
|
| Reports to shareholders | 14,198 |
|
| Miscellaneous | 5,372 |
|
| Total expenses | 446,702 |
|
| Reimbursement from Advisor | (11,489) |
|
| Net expenses | 435,213 |
|
| NET INVESTMENT INCOME | 431,589 |
|
| | |
| | |
| REALIZED AND UNREALIZED GAIN (LOSS) ON INVESTMENTS | |
| Net realized gain (loss) | (3,498,278) |
|
| | |
| Change in unrealized appreciation (depreciation) | (11,354,648) |
|
| | |
| NET REALIZED AND UNREALIZED GAIN (LOSS) ON INVESTMENTS | (14,852,926) |
|
| | |
| INCREASE (DECREASE) IN NET ASSETS RESULTING FROM OPERATIONS |
| ($14,421,337 | ) |
| See notes to financial statements. | |
www.calvert.com CALVERT VP NATURAL RESOURCES PORTFOLIO ANNUAL REPORT 7
CALVERT VP NATURAL RESOURCES PORTFOLIO
STATEMENTS OF CHANGES IN NET ASSETS
|
| | | | | | | |
| INCREASE (DECREASE) IN NET ASSETS | YEAR ENDED
DECEMBER 31, 2015 | | YEAR ENDED
DECEMBER 31, 2014 |
| Operations: | | | |
| Net investment income |
| $431,589 |
| |
| $246,244 |
|
| Net realized gain (loss) | (3,498,278) |
| | 1,847,242 |
|
| Change in unrealized appreciation (depreciation) | (11,354,648) |
| | (12,346,464) |
|
| | | | |
| INCREASE (DECREASE) IN NET ASSETS RESULTING FROM OPERATIONS | (14,421,337) |
| | (10,252,978) |
|
| | | | |
| Distributions to shareholders from: | | | |
| Net investment income | (161,807) |
| | (62,226) |
|
| Net realized gain | (89,484) |
| | — |
|
| Total distributions | (251,291) |
| | (62,226) |
|
| | | | |
| Capital share transactions: | | | |
| Shares sold | 10,255,623 |
| | 10,742,802 |
|
| Reinvestment of distributions | 251,291 |
| | 62,226 |
|
| Shares redeemed | (10,225,120) |
| | (9,956,940) |
|
| Total capital share transactions | 281,794 |
| | 848,088 |
|
| | | | |
| TOTAL INCREASE (DECREASE) IN NET ASSETS | (14,390,834) |
| | (9,467,116) |
|
| | | | |
| | | | |
| NET ASSETS | | | |
| Beginning of year | 60,482,433 |
| | 69,949,549 |
|
| End of year (including undistributed net investment income of $431,568 and $176,886, respectively) |
| $46,091,599 |
| |
| $60,482,433 |
|
| | | | |
| CAPITAL SHARE ACTIVITY | | | |
| Shares sold | 271,451 |
| | 226,478 |
|
| Reinvestment of distributions | 7,756 |
| | 1,434 |
|
| Shares redeemed | (251,308) |
| | (192,542) |
|
| Total capital share activity | 27,899 |
| | 35,370 |
|
| See notes to financial statements. |
8 www.calvert.com CALVERT VP NATURAL RESOURCES PORTFOLIO ANNUAL REPORT
NOTES TO FINANCIAL STATEMENTS
NOTE A — SIGNIFICANT ACCOUNTING POLICIES
General: Calvert VP Natural Resources Portfolio (the “Portfolio”), a series of Calvert Variable Products, Inc. (the “Fund”), is registered under the Investment Company Act of 1940 as a diversified, open-end management investment company. The Fund is comprised of eleven separate portfolios. The operations of each series of the Fund are accounted for separately. Shares of the Portfolio are sold without sales charge to affiliated and unaffiliated insurance companies for allocation to certain of their variable separate accounts. The Portfolio invests primarily in exchange traded funds and exchange traded notes (the “Underlying Funds”) representing different natural resources exposure. The Portfolio applies the accounting and reporting guidance in the Financial Accounting Standards Board (FASB) Accounting Standards Codification Topic 946, Financial Services – Investment Companies (ASC 946).
Security Valuation: Net asset value per share is determined every business day as of the close of the regular session of the New York Stock Exchange (generally 4:00 p.m. Eastern time). The Portfolio uses independent pricing services approved by the Board of Directors (“the Board”) to value its investments wherever possible. Investments for which market quotations are not available or deemed not reliable are fair valued in good faith under the direction of the Board.
The Board has adopted Valuation Procedures (the “Procedures”) to determine the fair value of securities and other financial instruments for which market prices are not readily available or which may not be reliably priced. The Board has delegated the day-to-day responsibility for determining the fair value of assets of the Portfolio to Calvert Investment Management, Inc. (the “Advisor” or “Calvert”) and has provided these Procedures to govern Calvert in its valuation duties.
Calvert has chartered an internal Valuation Committee to oversee the implementation of these Procedures and to assist it in carrying out the valuation responsibilities that the Board has delegated.
The Valuation Committee meets on a regular basis to review illiquid securities and other investments which may not have readily available market prices. The Valuation Committee’s fair valuation determinations are subject to review, approval and ratification by the Board at its next regularly scheduled meeting covering the calendar quarter in which the fair valuation was determined.
The Valuation Committee utilizes various methods to measure the fair value of the Portfolio’s investments. U.S. generally accepted accounting principles (GAAP) establishes a disclosure hierarchy that categorizes the inputs to valuation techniques used to value assets and liabilities at measurement date. These inputs are summarized in the three broad levels listed below:
Level 1 - quoted prices in active markets for identical securities
Level 2 - other significant observable inputs (including quoted prices for similar securities, interest rates, prepayment speeds, credit risk, etc.)
Level 3 - significant unobservable inputs (including the Portfolio’s own assumptions in determining the fair value of investments)
The inputs or methodologies used for valuing securities are not necessarily an indication of the risk associated with investing in those securities.
Changes in valuation techniques may result in transfers in or out of an investment’s assigned level within the hierarchy during the year. Transfers in and/or out of levels are determined based on the fair value of such securities at the end of the year. Valuation techniques used to value the Portfolio’s investments by major category are as follows:
Exchange-traded products are valued at the official closing price as reported by an independent pricing service on the primary market or exchange on which they are traded and are categorized as Level 1 in the hierarchy.
Short-term securities of sufficient credit quality with remaining maturities of sixty days or less for which quotations are not readily available are valued at amortized cost, which approximates fair value, and are categorized as Level 2 in the hierarchy.
www.calvert.com CALVERT VP NATURAL RESOURCES PORTFOLIO ANNUAL REPORT 9
If a market value cannot be determined for a security using the methodologies described above, or if, in the good faith opinion of the Advisor, the market value does not constitute a readily available market quotation, or if a significant event has occurred that would materially affect the value of the security, the security will be fair valued as determined in good faith by the Valuation Committee.
The Valuation Committee considers a number of factors, including significant unobservable valuation inputs when arriving at fair value. It considers all significant facts that are reasonably available and relevant to the determination of fair value.
The Valuation Committee primarily employs a market-based approach which may use related or comparable assets or liabilities, recent transactions, market multiples, book values, and other relevant information for the investment to determine the fair value of the investment. When more appropriate, the Portfolio may employ an income-based or cost approach. An income-based valuation approach discounts anticipated future cash flows of the investment to calculate a present amount (discounted). The measurement is based on the value indicated by current market expectations about those future amounts. Discounts may also be applied due to the nature or duration of any restrictions on the disposition of the investments. A cost based approach is based on the amount that currently would be required to replace the service capacity of an asset (current replacement cost). From the seller’s perspective, the price that would be received for the asset is determined based on the cost to a buyer to acquire or construct a substitute asset of comparable utility, adjusted for obsolescence.
The values assigned to fair value investments are based on available information and do not necessarily represent amounts that might ultimately be realized. Further, due to the inherent uncertainty of valuations of such investments, the fair values may differ significantly from the values that would have been used had an active market existed, and the differences could be material. The Valuation Committee employs various methods for calibrating these valuation approaches including a regular review of key inputs and assumptions, transactional back-testing or disposition analysis and reviews of any related market activity.
At December 31, 2015, no securities were fair valued in good faith under the direction of the Board.
The following table summarizes the market value of the Portfolio's holdings as of December 31, 2015, based on the inputs used to value them:
|
| | | | | | | | | | | |
| | VALUATION INPUTS |
| INVESTMENTS IN SECURITIES* | LEVEL 1 | LEVEL 2 | LEVEL 3 | TOTAL |
| Exchange-Traded Products |
| $45,097,986 |
| $— |
| $— |
|
| $45,097,986 |
|
| Time Deposit | — |
| 1,493,398 |
| — |
| 1,493,398 |
|
| TOTAL |
| $45,097,986 |
|
| $1,493,398 |
| $— |
|
| $46,591,384 |
|
| |
| * For a complete listing of investments, please refer to the Schedule of Investments. |
There were no transfers between levels during the year.
Security Transactions and Investment Income: Security transactions are accounted for on trade date. Realized gains and losses are recorded on an identified cost basis and may include proceeds from litigation. Income and capital gain distributions from the Underlying Funds, if any, are recorded on ex-dividend date. Distributions received on securities that represent a return of capital are recorded as a reduction of cost of investments. Distributions received on securities that represent a capital gain are recorded as a realized gain. Interest income, which includes amortization of premium and accretion of discount on debt securities, is accrued as earned. Expenses included in the accompanying financial statements reflect the expenses of the Portfolio and do not include any expenses associated with the Underlying Funds.
Distributions to Shareholders: Distributions to shareholders are recorded by the Portfolio on ex-dividend date. Dividends from net investment income and distributions from net realized capital gains, if any, are paid at least annually. Distributions are determined in accordance with income tax regulations which may differ from U.S. generally accepted accounting principles; accordingly, periodic reclassifications are made within the Portfolio's capital accounts to reflect income and gains available for distribution under income tax regulations.
10 www.calvert.com CALVERT VP NATURAL RESOURCES PORTFOLIO ANNUAL REPORT
Estimates: The preparation of financial statements in conformity with U.S. generally accepted accounting principles requires management to make estimates and assumptions that affect the reported amounts of assets and liabilities and disclosure of contingent assets and liabilities at the date of the financial statements and the reported amounts of increases and decreases in net assets from operations during the reporting period. Actual results could differ from those estimates.
Federal Income Taxes: No provision for federal income or excise tax is required since the Portfolio intends to continue to qualify as a regulated investment company under the Internal Revenue Code and to distribute substantially all of its taxable earnings.
Management has analyzed the Portfolio's tax positions taken for all open federal income tax years and has concluded that no provision for federal income tax is required in the Portfolio's financial statements. A Portfolio's federal tax return is subject to examination by the Internal Revenue Service for a period of three years.
NOTE B — RELATED PARTY TRANSACTIONS
Calvert Investment Management, Inc. (the “Advisor”) is wholly-owned by Calvert Investments, Inc., which is indirectly wholly-owned by Ameritas Mutual Holding Company. The Advisor provides investment advisory services and pays the salaries and fees of officers and Directors of the Fund who are employees of the Advisor or its affiliates. For its services, the Advisor receives an annual fee, payable monthly, of 0.55%, of the Portfolio’s average daily net assets.
The Advisor has contractually agreed to limit net annual portfolio operating expenses through April 30, 2016. The contractual expense cap is 0.79 %. For the purpose of this expense limit, operating expenses do not include interest expense, brokerage commissions, taxes, and extraordinary expenses. This expense limitation does not limit fees and expenses associated with the Underlying Funds.
Calvert Investment Administrative Services, Inc. ("CIAS"), an affiliate of the Advisor, provides administrative services to the Portfolio for an annual fee, payable monthly, of 0.10% of the Portfolio’s average daily net assets.
On November 24, 2015, the Board of Directors approved the recommendation made by CIAS to standardize and rationalize the administrative fee paid by the Calvert Funds at 0.12% for all series and all share classes of the Calvert Funds. CIAS and the Portfolio have entered into an Amended and Restated Administrative Services Agreement that will establish a 0.12% administrative fee commencing on May 1, 2016. CIAS has contractually agreed to waive 0.02% (the difference between the current administrative fee and the new 0.12% fee) from May 1, 2016 through April 30, 2018.
Calvert Investment Services, Inc. ("CIS"), an affiliate of the Advisor, acts as shareholder servicing agent for the Portfolio. For its services, CIS received a fee of $4,132 for the year ended December 31, 2015.
Each Director of the Fund who is not an employee of the Advisor or its affiliates receives a fee of $1,500 for each Board and Committee meeting attended plus an annual fee of $44,000. Committee chairs receive an additional $5,000 annual retainer. Eligible Directors may participate in a Deferred Compensation Plan (the “Plan”). Obligations of the Plan will be paid solely out of the Portfolio’s assets. Directors’ fees are allocated to each of the portfolios served.
NOTE C — INVESTMENT ACTIVITY AND TAX INFORMATION
During the year, the cost of purchases and proceeds from sales of investments, other than short-term securities, were $12,557,355 and $12,144,401, respectively.
|
| | | |
| Capital Loss Carryforward | |
| NO EXPIRATION DATE | |
| Short-term |
| ($1,785,381 | ) |
| Long-term |
| ($1,130,535 | ) |
Under the Regulated Investment Company Modernization Act of 2010, capital losses incurred in taxable years beginning after December 22, 2010 can be carried forward to offset future capital gains for an unlimited period. These losses will retain their character as either long-term or short-term.
www.calvert.com CALVERT VP NATURAL RESOURCES PORTFOLIO ANNUAL REPORT 11
The tax character of dividends and distributions paid during the years ended December 31, 2015 and December 31, 2014 was as follows:
|
| | | | | | |
| DISTRIBUTIONS PAID FROM: | 2015 | 2014 |
| Ordinary income |
| $161,820 |
|
| $62,226 |
|
| Long-term capital gains | 89,471 |
| — |
|
| Total |
| $251,291 |
|
| $62,226 |
|
As of December 31, 2015, the tax basis components of distributable earnings/(accumulated losses) and the federal tax cost were as follows:
|
| | | |
| Unrealized appreciation | $— |
|
| Unrealized (depreciation) | (22,300,778) |
|
| Net unrealized appreciation (depreciation) |
| ($22,300,778 | ) |
| Undistributed ordinary income |
| $431,568 |
|
| Capital loss carryforward |
| ($2,915,916 | ) |
| Federal income tax cost of investments |
| $68,892,162 |
|
The differences between the components of distributable earnings on a tax basis and the amounts reflected in the Statement of Assets and Liabilities are primarily due to temporary book-tax differences that will reverse in a subsequent period. These differences are mainly due to wash sales and partnerships.
Reclassifications, as shown in the table below, have been made to the Portfolio's components of net assets to reflect income and gains available for distribution (or available capital loss carryovers, as applicable) under income tax law and regulations. These reclassifications are due to permanent book-tax differences and have no impact on net assets. The primary permanent differences causing such reclassifications for the Portfolio are due to investments in partnerships and distributions re-designations.
|
| | | |
| Undistributed net investment income |
| ($15,100 | ) |
| Accumulated net realized gain (loss) | 15,100 |
|
NOTE D — LINE OF CREDIT
A financing agreement is in place with the Calvert Funds and State Street Corporation (“SSC”). Under the agreement, SSC provides an unsecured line of credit facility, in the aggregate amount of $50 million ($25 million committed and $25 million uncommitted), accessible by the Calvert Funds for temporary or emergency purposes only. Borrowings bear interest at the higher of the London Interbank Offered Rate (LIBOR) or the overnight Federal Funds Rate plus 1.25% per annum. A commitment fee of 0.20% per annum is incurred on the unused portion of the committed facility. An administrative fee of $25,000 was paid in connection with the uncommitted facility. These fees are allocated to all participating funds. The Portfolio had no borrowings under the agreement during the year ended December 31, 2015.
NOTE E — SUBSEQUENT EVENTS
In preparing the financial statements as of December 31, 2015, no subsequent events or transactions occurred that would have required recognition or disclosure in these financial statements.
NOTICE TO SHAREHOLDERS (UNAUDITED)
For the fiscal year ended December 31, 2015, the Portfolio reports the maximum amount allowable of its net taxable income as eligible for the corporate dividends-received deduction. The Portfolio also considers $89,471 of the long-term capital gain distributions paid during the year as capital gain dividends in accordance with Section 852(b)(3)(C) of the Internal Revenue Code.
12 www.calvert.com CALVERT VP NATURAL RESOURCES PORTFOLIO ANNUAL REPORT
CALVERT VP NATURAL RESOURCES PORTFOLIO
FINANCIAL HIGHLIGHTS
|
| | | | | | | | | | | | | | | | | | | | |
| | YEARS ENDED | |
| | December 31, 2015(a) | | December 31, 2014 | | December 31, 2013(a) | | December 31, 2012 | | December 31, 2011 | |
| Net asset value, beginning |
| $42.98 |
| |
| $50.99 |
| |
| $50.98 |
| |
| $49.84 |
| |
| $55.64 |
| |
| Income from investment operations: | | | | | | | | | | |
| Net investment income | 0.31 |
| | 0.17 |
| | 0.17 |
| | 0.08 |
| | 0.10 |
| |
| Net realized and unrealized gain (loss) | (11.00) |
| | (8.14) |
| | 0.19 |
| | 2.35 |
| | (5.74) |
| |
| Total from investment operations | (10.69) |
| | (7.97) |
| | 0.36 |
| | 2.43 |
| | (5.64) |
| |
| Distributions from: | | | | | | | | | | |
| Net investment income | (0.11) |
| | (0.04) |
| | — |
| | (0.01) |
| | (0.16) |
| |
| Net realized gain | (0.06) |
| | — |
| | (0.35) |
| | (1.28) |
| | — |
| |
| Total distributions | (0.17) |
| | (0.04) |
| | (0.35) |
| | (1.29) |
| | (0.16) |
| |
| Total increase (decrease) in net asset value | (10.86) |
| | (8.01) |
| | 0.01 |
| | 1.14 |
| | (5.80) |
| |
| Net asset value, ending |
| $32.12 |
| |
| $42.98 |
| |
| $50.99 |
| |
| $50.98 |
| |
| $49.84 |
| |
| Total return (b) | (24.86 | %) | | (15.62 | %) | | 0.72 | % | | 4.90 | % | | (10.13 | %) | |
| Ratios to average net assets: (c)(d) | | | | | | | | | | |
| Net investment income | 0.78 | % | | 0.37 | % | | 0.33 | % | | 0.19 | % | | 0.29 | % | |
| Total expenses | 0.81 | % | | 0.79 | % | | 0.79 | % | | 0.79 | % | | 0.84 | % | |
| Net expenses | 0.79 | % | | 0.79 | % | | 0.79 | % | | 0.78 | % | | 0.76 | % | |
| Portfolio turnover | 22 | % | | 112 | % | | 31 | % | | 37 | % | | 28 | % | |
| Net assets, ending (in thousands) |
| $46,092 |
| |
| $60,482 |
| |
| $69,950 |
| |
| $54,665 |
| |
| $48,746 |
| |
| | | | | | | | | | | |
| (a)Per share figures are calculated using the Average Shares Method. |
| (b)Total return is not annualized for periods of less than one year and does not reflect charges and expenses of the variable annuity or variable universal life contract. |
| (c)Total expenses do not reflect amounts reimbursed and/or waived by the Advisor and certain of its affiliates, if applicable. Net expenses are net of all reductions and represent the net expenses paid by the Portfolio. |
| (d)Amounts do not include the activity of the Underlying Funds. |
| See notes to financial statements. |
www.calvert.com CALVERT VP NATURAL RESOURCES PORTFOLIO ANNUAL REPORT 13
PROXY VOTING
The Proxy Voting Guidelines that the Portfolio uses to determine how to vote proxies relating to portfolio securities is provided as an Appendix to the Fund’s Statement of Additional Information. The Statement of Additional Information can be obtained free of charge by calling the Fund at 1-800-368-2745, by visiting the Calvert website at www.calvert.com or by visiting the SEC’s website at www.sec.gov.
Information regarding how the Fund voted proxies relating to portfolio securities during the most recent 12-month period ended June 30 is available by calling the Fund, by visiting the Calvert website at www.calvert.com or visiting the SEC’s website at www.sec.gov.
AVAILABILITY OF QUARTERLY PORTFOLIO HOLDINGS
The Fund files its complete schedule of portfolio holdings with the SEC for the first and third quarters of each fiscal year on Form N-Q. The Fund’s Form N-Q is available on the SEC’s website at www.sec.gov. The Fund’s Form N-Q may be reviewed and copied at the SEC’s Public Reference Room in Washington, DC; information on the operation of the Public Reference Room may be obtained by calling 1-800-SEC-0330.
BASIS FOR BOARD'S APPROVAL OF INVESTMENT ADVISORY CONTRACTS
At a meeting held on December 9, 2015, the Board of Directors, and by a separate vote, the disinterested Directors, approved the continuance of the Investment Advisory Agreement between the Portfolio and the Advisor and the Investment Subadvisory Agreement between the Advisor and the Subadvisor with respect to the Portfolio.
In evaluating the Investment Advisory Agreement, the Board considered a variety of information relating to the Portfolio and the Advisor. The disinterested Directors reviewed a report prepared by the Advisor regarding various services provided to the Portfolio by the Advisor and its affiliates. Such report included, among other data, information regarding the Advisor's personnel and the Advisor's revenue and cost of providing services to the Portfolio, and a separate report prepared by an independent third party, which provided a statistical analysis comparing the Portfolio's investment performance, expenses, and fees to comparable mutual funds.
The disinterested Directors were separately represented by independent legal counsel with respect to their consideration of the reapproval of the Investment Advisory Agreement and the Investment Subadvisory Agreement. Prior to voting, the disinterested Directors reviewed the proposed continuance of the Investment Advisory Agreement and Investment Subadvisory Agreement with management and also met in private sessions with their counsel at which no representatives of management were present.
In the course of its deliberations regarding the Investment Advisory Agreement, the Board considered the following factors, among others: the nature, extent and quality of the services provided by the Advisor, including the personnel providing such services; the Advisor's financial condition; the level and method of computing the Portfolio's advisory fee; comparative performance, fee and expense information for the Portfolio; the profitability of the Calvert Family of Funds to the Advisor and its affiliates; the allocation of the Portfolio's brokerage, including the Advisor's process for monitoring "best execution"; the direct and indirect benefits, if any, derived by the Advisor and its affiliates from their relationship with the Portfolio; the effect of the Portfolio's growth and size on the Portfolio's performance and expenses; the Advisor's compliance programs and policies; the Advisor's performance of substantially similar duties for other funds; and any possible conflicts of interest.
In considering the nature, extent and quality of the services provided by the Advisor under the Investment Advisory Agreement, the Board reviewed information provided by the Advisor relating to its operations and personnel, including, among other information, biographical information on the Advisor's supervisory and professional staff and descriptions of its organizational and management structure. The Board also took into account similar information provided periodically throughout the previous year by the Advisor, as well as the Board’s familiarity with the Advisor’s management through Board of Directors' meetings, discussions and other reports. The Board considered the Advisor's current level of staffing and overall resources. The Board also noted that it reviewed on a quarterly basis information regarding the Advisor’s compliance with applicable policies and procedures, including those related to personal investing. The Advisor's administrative capabilities, including its ability to supervise the other service providers for the Portfolio, were also considered. The Board discussed the Advisor's effectiveness in monitoring the performance of the Subadvisor and its timeliness in responding to performance issues. The Board observed that the scope of services provided by the Advisor
14 www.calvert.com CALVERT VP NATURAL RESOURCES PORTFOLIO ANNUAL REPORT (UNAUDITED)
generally had expanded over time as a result of regulatory, market and other changes. The Board took into consideration, among other factors, the effectiveness of the Portfolio’s and Advisor’s processes, policies and procedures and the Advisor’s personnel. The Board also took into account, among other items, periodic reports received from the Advisor over the past year concerning the Advisor’s ongoing review and enhancement of certain processes, policies and procedures of the Portfolio and the Advisor. The Board concluded that it was satisfied with the nature, extent and quality of services provided to the Portfolio by the Advisor under the Investment Advisory Agreement.
In considering the Portfolio's performance, the Board noted that it reviewed on a quarterly basis detailed information about the Portfolio's performance results, portfolio composition and investment strategies. In addition, the Board took into account overall financial market conditions. The Board also reviewed various comparative data provided to it in connection with its consideration of the renewal of the Investment Advisory Agreement, including, among other information, a comparison of the Portfolio's total return with its Lipper index and with that of other mutual funds deemed to be in its peer universe by an independent third party in its report. This comparison indicated that the Portfolio performed above the median of its peer universe for the one-year period ended June 30, 2015, and below the median of its peer universe for the three- and five-year periods ended June 30, 2015. The data also indicated that the Portfolio outperformed its Lipper index for the one-year period ended June 30, 2015, and underperformed its Lipper index for the three- and five-year periods ended June 30, 2015. The Board took into account management’s discussion of the Portfolio’s performance, a recent strategy change and management’s continued close monitoring of the Portfolio’s performance. Based upon its review, the Board concluded that appropriate action is being taken with respect to the Portfolio’s performance.
In considering the Portfolio's fees and expenses, the Board compared the Portfolio's fees and total expense ratio with various comparative data for the funds in its peer universe. Among other findings, the data indicated that the Portfolio's advisory fee was above the median of its peer universe and that total expenses were above the median of its peer universe. The Board noted that the allocation of advisory and administrative fees may vary among the Portfolio’s peer universe. The Board noted that the Advisor is not currently reimbursing the Portfolio’s expenses. The Board also took into account the Advisor’s current undertaking to maintain expense limitations for the Portfolio. The Board noted that the Advisor paid the Subadvisor’s subadvisory fee under the Investment Subadvisory Agreement with respect to the Portfolio. The Board also took into account management's discussion of the Portfolio's expenses and certain factors that affected the level of such expenses, including the current size of the Portfolio. Based upon its review, the Board determined that the advisory fee was reasonable in view of the quality of services received by the Portfolio from the Advisor and the other factors considered.
The Board reviewed the Advisor’s profitability on a portfolio-by-portfolio basis. In reviewing the overall profitability of the advisory fee to the Portfolio's Advisor, the Board also considered the fact that affiliates of the Advisor provided shareholder servicing and administrative services to the Portfolio for which they received compensation. The information considered by the Board included Calvert’s operating profit margin information both before and after tax expenses with respect to the services that the Advisor and its affiliates provided to the Calvert Family of Funds complex. The Board reviewed the profitability of the Advisor's relationship with the Portfolio in terms of the total amount of annual advisory fees it received with respect to the Portfolio and whether the Advisor had the financial wherewithal to continue to provide services to the Portfolio. The Board also considered that the Advisor derived benefits to its reputation and other indirect benefits from its relationship with the Portfolio. In addition, the Board took into account that affiliates of the Advisor may benefit from certain indirect tax benefits relating to dividend received deductions and foreign tax credits. The Board also noted that the Advisor paid the subadvisory fee to the Subadvisor, an affiliate of the Advisor. Based upon its review, the Board concluded that the Advisor’s and its affiliates’ level of profitability from their relationship with the Portfolio was reasonable.
The Board considered the effect of the Portfolio's current size and potential growth on its performance and fees. Although the Portfolio’s advisory fee did not contain breakpoints that would reduce the advisory fee rate on assets above specified asset levels, the Board noted that if the Portfolio’s assets increased over time, the Portfolio might realize other economies of scale if assets increased proportionally more than certain other expenses. The Board also noted that given the Portfolio’s current level of assets, the Portfolio would be unlikely to recognize economies of scale by implementing a breakpoint in the advisory fee at this time.
In reapproving the Investment Advisory Agreement, the Board, including the disinterested Directors, did not identify any single factor as controlling, and each Director may have attributed different weight to various factors.
www.calvert.com CALVERT VP NATURAL RESOURCES PORTFOLIO ANNUAL REPORT (UNAUDITED) 15
In evaluating the Investment Subadvisory Agreement, the disinterested Directors reviewed information provided by the Subadvisor relating to its operations, personnel, investment philosophy, strategies and techniques. Among other information, the Subadvisor provided biographical information on portfolio management and other professional staff, performance information for itself, and descriptions of its investment philosophies, strategies and techniques, organizational and management structures and brokerage policies and practices.
The Board reapproved the Investment Subadvisory Agreement between the Subadvisor and the Advisor based on a number of factors relating to the Subadvisor's ability to perform under the Investment Subadvisory Agreement. In the course of its deliberations, the Board evaluated, among other factors: the nature, extent and the quality of the services to be provided by the Subadvisor; the Subadvisor's management style and long-term performance record; the Portfolio's performance record and the Subadvisor's performance in employing its investment strategies; the Subadvisor's current level of staffing and its overall resources; the qualifications and experience of the Subadvisor's personnel; the Subadvisor's financial condition with respect to its ability to perform the services required under the Investment Subadvisory Agreement; the Subadvisor’s risk management processes; the Subadvisor's compliance systems, including those related to personal investing; and any disciplinary history. Based upon its review, the Board concluded that it was satisfied with the nature, extent and quality of services provided to the Portfolio by the Subadvisor under the Investment Subadvisory Agreement.
As noted above, the Board considered, among other information, the Portfolio's performance during the one-, three- and five-year periods ended June 30, 2015, as compared to the Portfolio's peer universe and noted that it reviewed on a quarterly basis detailed information about the Portfolio's performance results, portfolio composition and investment strategies. The Board noted the Advisor's expertise and resources in monitoring the performance, investment style and risk adjusted performance of the Subadvisor.
In considering the cost of services to be provided by the Subadvisor and the profitability to the Subadvisor of its relationship with the Portfolio, the Board noted that the Advisor and Subadvisor were affiliated and the subadvisory fee under the Investment Subadvisory Agreement was paid by the Advisor out of the advisory fee that the Advisor received under the Investment Advisory Agreement. Based upon its review, the Board determined that the subadvisory fee was reasonable in view of the quality of services received by the Portfolio from the Subadvisor and the other factors considered. Because the Advisor would pay the Subadvisor’s subadvisory fee, the cost of services to be provided by the Subadvisor and the level of profitability to the Subadvisor from its relationship with the Portfolio were not material factors in the Board’s deliberations. For similar reasons, the Board did not consider the potential economies of scale in the Subadvisor’s management of the Portfolio to be a material factor in its consideration.
In reapproving the Investment Subadvisory Agreement, the Board, including the disinterested Directors, did not identify any single factor as controlling, and each Director may have attributed different weight to various factors.
Conclusions
The Board reached the following conclusions regarding the Investment Advisory Agreement and the Investment Subadvisory Agreement, among others: (a) the Advisor has demonstrated that it possesses the capability and resources to perform the duties required of it under the Investment Advisory Agreement; (b) the Subadvisor is qualified to manage the Portfolio's assets in accordance with the Portfolio’s investment objective and policies; (c) the Advisor and Subadvisor maintain appropriate compliance programs; (d) the Subadvisor is likely to execute its investment strategies consistently over time; (e) appropriate action is being taken with respect to the Portfolio’s performance; and (f) the Portfolio's advisory and subadvisory fees are reasonable in view of the quality of services received by the Portfolio from the Advisor and Subadvisor and the other factors considered. Based on its conclusions, the Board determined that reapproval of the Investment Advisory Agreement and the Investment Subadvisory Agreement would be in the best interests of the Portfolio and its shareholders.
16 www.calvert.com CALVERT VP NATURAL RESOURCES PORTFOLIO ANNUAL REPORT (UNAUDITED)
DIRECTOR AND OFFICER INFORMATION TABLE
|
| | | | | |
| Name & Age | Position with Fund | Position Start Date | Principal Occupation During Last 5 Years | # of Calvert Portfolios Overseen | Other Directorships |
| INDEPENDENT DIRECTORS |
FRANK H. BLATZ, JR., Esq. AGE: 80 | Director | 1982 CVS
2008 CVP | Of counsel to firm of Schiller & Pittenger, P.C. | 13 | None |
ALICE GRESHAM BULLOCK AGE: 65 | Director | 1999 CVS
2008 CVP | Professor at Howard University School of Law. She is former Dean of Howard University School of Law and Deputy Director of the Association of American Law Schools. | 15 | None |
M. CHARITO KRUVANT AGE: 70 | Director | 1999 CVS
2008 CVP | President and CEO of Creative Associates International, Inc., a firm that specializes in human resources development, information management, public affairs and private enterprise development. | 22 | • Acacia Federal Savings Bank (through 2013) • Summit Foundation • WETA Public Broadcasting |
CYNTHIA MILLIGAN AGE: 69
| Director | 1999 CVS
2008 CVP | Dean Emeritus, College of Business Administration, University of Nebraska, Lincoln. She is former President and Chief Executive Officer for CMA, a consulting firm for financial institutions. | 15 | • Wells Fargo Company (banking and financial services) - NYSE • Wells Fargo Bank N.A. (Since 2014) • Gallup, Inc. (management consulting) • W.K. Kellogg Foundation • Raven Industries (technology company) - NASDAQ • Colonial Williamsburg Foundation • Kellogg Company (food manufacturing) - NYSE |
ARTHUR J. PUGH AGE: 78 | Director | 1982 CVS
2008 CVP | Retired executive. | 13 | None |
| INTERESTED DIRECTORS |
WILLIAM LESTER* AGE: 58 | Director & Chair (CVS)
Director & Senior Vice President (CVP) | 2004 CVS
2008 CVP | Executive Vice President Finance/Investments and Corporate Treasurer of Ameritas Mutual Holding Company. Chair and former President (resigned 2012) of Ameritas Investment Partners, Inc. | 13 | • Acacia Federal Savings Bank (through 2013)• Ameritas Investment Partners, Inc. (financial services)• Ameritas Investment Corp. (financial services)• Universal and Inland Insurance Companies• Bryan/LGH Health Systems |
www.calvert.com CALVERT VP NATURAL RESOURCES PORTFOLIO ANNUAL REPORT (UNAUDITED) 17
|
| | | | | |
| Name & Age | Position with Fund | Position Start Date | Principal Occupation During Last 5 Years | # of Calvert Portfolios Overseen | Other Directorships |
| INTERESTED DIRECTORS |
JOHN H. STREUR* AGE: 56
| President (CVS)
Director, Chair & President (CVP) | 2015 | President and Chief Executive Officer of Calvert Investments, Inc. (since January 2015) and Chief Compliance Officer for the Advisor and Calvert Investment Distributors, Inc. (since August 10, 2015); President and Director, Portfolio 21 Investments, Inc. (through October 2014); President, Chief Executive Officer and Director, Managers Investment Group LLC (through January 2012); President and Director, The Managers Funds and Managers AMG Funds (through January 2012). | 40 | • Portfolio 21 Investments, Inc. (asset management)(through October 2014) • Managers Investment Group LLC (asset management)(through January 2012) • The Managers Funds (asset management) (through January 2012) • Managers AMG Funds (asset management) (through January 2012) • Calvert Social Investment Foundation |
|
| | | |
| Name & Age | Position with Fund | Position Start Date | Principal Occupation During Last 5 Years |
| OFFICERS |
VICKI L. BENJAMIN AGE: 54 | Treasurer | 2015 | Executive Vice President, Chief Financial Officer and Chief Operating Officer of Calvert Investments, Inc. since October 2015; Senior Vice President and Chief Financial Officer of Calvert Investments, Inc. (March 2015 - September 2015). Prior to Calvert, Ms. Benjamin was a Senior Partner at KPMG. |
ROBERT D. BENSON, ESQ. AGE: 37 | Assistant Vice President & Assistant Secretary | 2014 | Assistant General Counsel (since 2014), Assistant Vice President & Assistant Secretary (since 2015) and Staff Attorney (prior to 2014), Calvert Investments, Inc. |
HOPE BROWN AGE: 42 | Chief Compliance Officer | 2014 | Chief Compliance Officer for the Calvert Funds (since 2014). Vice President and Chief Compliance Officer, Wilmington Funds (2012-2014). Vice President and Senior Compliance Officer, Wilmington Trust Investment Advisors, Inc. (2010-2012). |
STU DALHEIM AGE: 46 | Vice President | 2015 | Vice President - Shareholder Advocacy for the Advisor. |
MATTHEW DUCH Age: 40 | Vice President | 2011 | Vice President of the Advisor and portfolio manager for Calvert’s taxable fixed-income funds. |
ROBERT J. ENDERSON, CFA AGE: 57 | Assistant Treasurer | 2014 | Vice President, Corporate Finance, of Calvert Investments, Inc.; Acting Chief Financial Officer of Calvert Investments, Inc. (September 2014 - March 2015). |
PATRICK FAUL AGE: 51 | Vice President | 2010 | Vice President and Head of Credit Research for the Advisor. |
TRACI L. GOLDT AGE: 42 | Assistant Secretary | 2004 | SEC Filing and Administrative Operations Manager, Calvert Investments, Inc. |
JADE HUANG AGE: 41 | Vice President | 2015 | Equity Portfolio Manager since November 2015 and Senior Equity Analyst prior to November 2015, Advisor. |
EMILY KAISER AGE: 32 | Assistant Vice President | 2015 | Senior Sustainability Analyst since November 2015 and Sustainability Analyst (January 2014 - October 2015), Advisor. Prior to joining Calvert, Ms. Kaiser attended law school from 2010 to 2013 and also held legal and policy positions with the U.S. Agency for International Development (2013), the Solidarity Center, AFL-CIO (2013), the U.S. Department of Labor (2012), the office of the U.S. Trade Representative (2012) and the Public International Law and Policy Group (2011-2012). |
VISHAL KHANDUJA, CFA AGE: 37 | Vice President | 2014 | Head of Taxable Fixed Income (since 2015) and Vice President of the Advisor (since 2014); Portfolio Manager for Calvert’s taxable fixed-income funds since 2012. Previously worked at Columbia Management as Portfolio Manager - Global Rates and Currency Team (2009-2012). |
18 www.calvert.com CALVERT VP NATURAL RESOURCES PORTFOLIO ANNUAL REPORT (UNAUDITED)
|
| | | |
| Name & Age | Position with Fund | Position Start Date | Principal Occupation During Last 5 Years |
| OFFICERS |
LANCELOT A. KING, ESQ. AGE: 45 | Assistant Vice President & Secretary | 2002 | Assistant Vice President, Assistant Secretary and Associate General Counsel of Calvert Investments, Inc. |
ERICA LASDON AGE: 44 | Assistant Vice President | 2015 | Director of Sustainability Research since August 2015 and Senior Sustainability Analyst and Manager prior to August 2015, Advisor. |
JOSHUA LINDER AGE: 30 | Vice President | 2015 | Equity Portfolio Manager since November 2015, Assistant Portfolio Manager (January 2014 - October 2015) and Equity Analyst (2011 - 2013), Advisor. |
CHRISTOPHER MADDEN AGE: 40 | Vice President | 2015 | Equity Portfolio Manager since November 2015 and Senior Equity Analyst prior to November 2015, Advisor. |
ANDREW K. NIEBLER, ESQ. AGE: 48 | Assistant Vice President & Assistant Secretary | 2006 | Assistant Vice President, Assistant Secretary and Associate General Counsel of Calvert Investments, Inc. |
MARYBETH PILAT, CPA AGE: 47 | Fund Controller and Assistant Treasurer | 2015 | Director of Fund Administration, Calvert Investment Administrative Services, Inc. since August 2015. VP Expense & Budgeting, Global Fiduciary Platform, Legg Mason (May 2015 - July 2015). Vice President and Assistant Treasurer, Columbia Funds, Ameriprise, Columbia Management (2010 - April 2015). |
| |
| * | The address of Directors and Officers is 4550 Montgomery Avenue, Suite 1000N, Bethesda, Maryland 20814. Mr. Streur is an interested person of the Fund since he is an officer and director of the Fund’s Advisor and its affiliates. Mr. Lester is an interested person of the Fund since he is an officer and director of the parent company of the Fund’s Advisor. |
Additional information about the Fund’s Directors can be found in the Statement of Additional Information (SAI). You can get a free copy of the SAI by contacting your broker, or the Fund at 1-800-368-2745.
www.calvert.com CALVERT VP NATURAL RESOURCES PORTFOLIO ANNUAL REPORT (UNAUDITED) 19
|
| |
| | |
This report is intended to provide fund information to shareholders. It is not authorized for distribution to prospective investors unless preceded or accompanied by a prospectus. Note: The information on our website is not incorporated by reference into this report; our website address is included as an inactive textual reference only. Investors should carefully consider the investment objectives, risks, charges and expenses of the Calvert Funds. This and other important information is contained in the fund’s summary prospectus and prospectus, which can be obtained from your financial professional and should be read carefully before investing. You may also call Calvert at 800/368-2745. |
| Printed on recycled paper using soy inks. | |
|
| |
|
Calvert VP Volatility Managed Moderate Portfolio |
Annual Report December 31, 2015 | |
|
| | | | |
| | TABLE OF CONTENTS |
| | | | | |
| | | | | Portfolio Management Discussion |
| | | | | Understanding Your Fund's Expenses |
| | | | | Report of Independent Registered Public Accounting Firm |
| | | | | Schedule of Investments |
| | | | | Statement of Assets and Liabilities |
| | | | | Statement of Operations |
| | | | | Statements of Changes in Net Assets |
| | | | | Notes to Financial Statements |
| | | | | Financial Highlights |
| | | | | Proxy Voting |
| | | | | Availability of Quarterly Portfolio Holdings |
| | | | | Basis for Board’s Approval of Investment Advisory Contracts |
| | | | | Director and Officer Information Table |
|
| | |
| | | PORTFOLIO MANAGEMENT DISCUSSION |
|
| |
| John P. Nichols, CFA Vice President - Equities |
Market Review
Both stock and bond markets posted meager returns for 2015 with continued weak energy prices, concerns about slowing economic growth, and the specter of high interest rates weighing on investors. Growth stocks were the only bright spot in the market, outperforming value stocks around the globe and across the spectrum of market capitalization. U.S. and foreign equities produced similar returns, with a strong dollar trimming back local market returns for foreign equities. Emerging market equities were the big losers for 2015 suffering double digit losses during a steep market sell-off and spike in volatility in August.
Investment Strategy and Technique:
The Calvert VP Volatility Managed Moderate Portfolio (the Portfolio) seeks to stabilize portfolio volatility1 around a target level of 8% while pursuing current income and modest growth potential consistent with the preservation of capital. To achieve this objective, the Portfolio invests in a portfolio of exchange traded funds (ETFs) diversified across multiple asset classes and utilizes a derivatives-based risk management strategy. The asset allocated portfolios of ETFs is designed to achieve market returns at a level of risk that is consistent with the Portfolio’s volatility target in a long-term context, while the risk management strategy employs futures contracts to respond to short-term changes in market volatility. The risk management strategy combines two components - volatility management and a capital protection strategy - that work together in an effort to reduce the negative effects of high portfolio volatility during market downturns while seeking to participate in up markets. The Portfolio’s realized volatility for the year was in line with its 8% target.
Fund Performance Relative to the Benchmark
For the one-year period ended December 31, 2015, the Portfolio returned -1.22%, outperforming its benchmark, the S&P 500 Daily Risk Control 7.5% Total Return Index, which returned -2.64%.
Calvert has developed a secondary composite benchmark based on a mix of market indices that more closely reflect the Portfolio’s asset allocation strategy as compared to the single asset class benchmark listed above that is used to capture the impact of the volatility management strategy.
The Portfolio underperformed the blended composite benchmark’s return of 0.84%.
This year, the Portfolio outperformed the S&P 500 Daily Risk Control 7.5% Index by 1.42%. The Portfolio’s advantage was realized during the equity market’s sharp sell-off in August. The Portfolio and the benchmark had high equity exposures coming into the market downturn because the volatility models of each recommended increased equity exposures during a period of very low equity market volatility. The Portfolio benefited from having a lower level of equity market exposure than the benchmark at this time due to the capital protection strategy and risk control policies. Consequently, when equity markets sold off, the Portfolio protected capital to a greater degree than did the benchmark. Over the balance of the year, the Portfolio generally benefited from a higher level of equity exposure than the benchmark as markets recovered all of the losses from the August sell off and closed out the year with a modest gain in the S&P 500 Index.
____________________________________
1 Volatility refers to the annualized standard deviation of daily logarithmic portfolio returns.
www.calvert.com CALVERT VP VOLATILITY MANAGED MODERATE PORTFOLIO ANNUAL REPORT (UNAUDITED) 1
| |
| • | Our volatility management and capital protection strategy protected the Portfolio against losses in the market’s sharp sell-off in August. |
| |
| • | The Portfolio participated in rising markets earlier in the year and in the closing quarter, but often underperformed its primary benchmark during these periods due to risk control measures that limit the Portfolio’s equity exposure. |
| |
| • | The Portfolio underperformed its secondary composite benchmark by 2.06%, primarily due to having its equity exposure at the highest allowed level heading into the equity market’s sharp sell-off in August. |
Positioning and Market Outlook
As 2015 closed out, equity markets remained volatile. Our allocation across equity and fixed income ETFs has remained relatively stable across 2015 and into the new year. We use futures to adjust the Portfolio’s risk profile, relying on our volatility management and capital protection strategy to determine the appropriate level of market risk for the Portfolio. Markets experienced an uptick in volatility and suffered losses in the closing days of 2015 and our strategy responded by decreasing the level of equity exposure (including futures contracts) in the Portfolio to 48.4%, which is in line with our long-term target for the Portfolio’s equity allocation.
Calvert Investment Management, Inc.
December 2015
|
| | | |
| ECONOMIC SECTORS | % OF TOTAL INVESTMENTS | |
| Equity Funds | 48.7 | % | |
| Debt Funds | 46.9 | % | |
| Short-Term Investments | 4.4 | % | |
| Total | 100 | % | |
| | | |
2 www.calvert.com CALVERT VP VOLATILITY MANAGED MODERATE PORTFOLIO ANNUAL REPORT (UNAUDITED)
Growth of $10,000
The graph below shows the value of a hypothetical $10,000 investment in the Portfolio over the past 10 fiscal year periods or since inception (for funds without 10-year records). The results assume the reinvestment of dividends and are compared with a broad-based market index. Market indexes are unmanaged and their results do not reflect the effect of expenses or sales charges.
|
| | | | |
| CALVERT VP VOLATILITY MANAGED MODERATE PORTFOLIO |
| DECEMBER 31, 2015 |
| AVERAGE ANNUAL TOTAL RETURNS | 1 Year | Since Inception (4/30/2013) |
| Class F | -1.22 | % | 2.93 | % |
| S&P 500 Daily Risk Control 7.5% Total Return Index | -2.64 | % | 4.93 | % |
| Volatility Managed Moderate Composite | 0.84 | % | 5.30 | % |
| | | |
| The Volatility Managed Moderate Composite Benchmark is an internally constructed index comprised of a blend of 36% Russell 3000 Index, 2% MSCI U.S. REIT, 10% MSCI EAFE Index, 48% Barclays U.S. Aggregate Bond Index and 4% Barclays 3 Month T-Bill Bellwether Index. |
| | | |
The performance data shown represents past performance, does not guarantee future results and assumes reinvestment of all dividends and distributions. All performance data reflects fee waivers and/or expense limitations, if any are in effect; in their absence performance would be lower. See Note B in Notes to Financial Statements. The investment return and principal value of an investment will fluctuate so that an investor’s shares, when redeemed, may be worth more or less than their original cost. Current performance may be lower or higher than the performance data quoted.
Visit www.calvert.com/institutional-VP-performance.html for current performance data. The gross expense ratio from the current prospectus for the Portfolio is 1.03% (includes Acquired Fund fees). This number may vary from the expense ratio shown elsewhere in this report because it is based on a different time period and, if applicable, does not include fee or expense waivers. The performance data and expense ratio reflect deduction of Portfolio operating expenses, but do not reflect charges and expenses imposed under the variable annuity or life insurance contract.
www.calvert.com CALVERT VP VOLATILITY MANAGED MODERATE PORTFOLIO ANNUAL REPORT (UNAUDITED) 3
UNDERSTANDING YOUR FUND'S EXPENSES
As an investor, you incur two types of costs. There are transaction costs. There are also ongoing costs, which generally include management fees, distribution and/or service fees, and other fund expenses. The following information is intended to help you understand your ongoing costs (in dollars) of investing in this mutual fund and to help you compare these costs with the ongoing costs of investing in other mutual funds.
To illustrate these ongoing costs, we have provided examples and calculated the expenses paid by the fund's investors during the period. The actual and hypothetical information presented in the examples is based on an investment of $1,000 invested at the beginning of the period and held for the entire period (July 1, 2015 to December 31, 2015).
Note: Expenses do not reflect charges and expenses of the variable annuity or variable universal life contract.
Actual Expenses
The first line of the table below provides information about actual account values and actual expenses. You may use the information in this line, together with the amount you invested, to estimate the expenses that you paid over the period. Simply divide your account value by $1,000 (for example, an $8,600 account value divided by $1,000 = 8.6), then multiply the result by the number in the first line under the heading entitled “Expenses Paid During Period” to estimate the expenses you paid on your account during this period.
Hypothetical Example for Comparison Purposes
The second line of the table below provides information about hypothetical account values and hypothetical expenses based on the Fund’s actual expense ratio and an assumed rate of return of 5% per year before expenses, which is not the Fund’s actual return. The hypothetical account values and expenses may not be used to estimate the actual ending account balance or expenses you paid for the period. You may use this information to compare the ongoing costs of investing in the Fund and other funds. To do so, compare the 5% hypothetical example with the 5% hypothetical examples that appear in the shareholder reports of the other funds.
Please note that the expenses shown in the table are meant to highlight your ongoing costs only and do not reflect any transactional costs. Therefore, the second line of the table is useful in comparing ongoing costs only, and will not help you determine the relative total costs of owning different funds. In addition, if these transactional costs were included, your costs would have been higher.
|
| | | | |
| | ANNUALIZED
EXPENSE RATIO | BEGINNING
ACCOUNT VALUE
7/1/15 | ENDING
ACCOUNT VALUE
12/31/15 | EXPENSES PAID DURING PERIOD*
7/1/15 - 12/31/15 |
| | | | | |
| Actual | 0.83% | $1,000.00 | $979.80 | $4.14 |
| Hypothetical (5% return per year before expenses) | 0.83% | $1,000.00 | $1,021.02 | $4.23 |
| |
| * Expenses paid during the period are equal to the annualized expense ratio as indicated above, multiplied by the average account value over the period, multiplied by 184/365 (to reflect the one-half year period). Expenses do not include fees and expenses incurred indirectly from investment in underlying funds. Expense ratios shown in the Financial Highlights represent the actual expenses incurred for the fiscal year. |
4 www.calvert.com CALVERT VP VOLATILITY MANAGED MODERATE PORTFOLIO ANNUAL REPORT (UNAUDITED)
REPORT OF INDEPENDENT REGISTERED PUBLIC ACCOUNTING FIRM
The Board of Directors of Calvert Variable Products, Inc. and Shareholders of Calvert VP Volatility Managed Moderate Portfolio:
We have audited the accompanying statement of assets and liabilities, including the schedule of investments, of the Calvert VP Volatility Managed Moderate Portfolio (the “Portfolio”), a series of Calvert Variable Products, Inc., as of December 31, 2015, and the related statement of operations for the year then ended, the statements of changes in net assets for each of the years in the two-year period then ended, and the financial highlights for each of the years or periods in the three-year period then ended. These financial statements and financial highlights are the responsibility of the Portfolio’s management. Our responsibility is to express an opinion on these financial statements and financial highlights based on our audits.
We conducted our audits in accordance with the standards of the Public Company Accounting Oversight Board (United States). Those standards require that we plan and perform the audit to obtain reasonable assurance about whether the financial statements and financial highlights are free of material misstatement. An audit includes examining, on a test basis, evidence supporting the amounts and disclosures in the financial statements. Our procedures included confirmation of securities owned as of December 31, 2015, by correspondence with the custodian and brokers or by performing other appropriate auditing procedures. An audit also includes assessing the accounting principles used and significant estimates made by management, as well as evaluating the overall financial statement presentation. We believe that our audits provide a reasonable basis for our opinion.
In our opinion, the financial statements and financial highlights referred to above present fairly, in all material respects, the financial position of the Portfolio as of December 31, 2015, and the results of its operations for the year then ended, the changes in its net assets for each of the years in the two-year period then ended, and the financial highlights for each of the years or periods in the three-year period then ended, in conformity with U.S. generally accepted accounting principles.
Philadelphia, Pennsylvania
February 24, 2016
www.calvert.com CALVERT VP VOLATILITY MANAGED MODERATE PORTFOLIO ANNUAL REPORT 5
CALVERT VP VOLATILITY MANAGED MODERATE PORTFOLIO
SCHEDULE OF INVESTMENTS
DECEMBER 31, 2015
|
| | | | |
| | SHARES | VALUE ($) |
| EXCHANGE-TRADED PRODUCTS - 95.7% | | |
| Consumer Staples Select Sector SPDR Fund | 9,300 | 469,557 |
|
| Financial Select Sector SPDR Fund | 22,400 | 532,672 |
|
| iShares Core S&P Mid-Cap ETF | 27,300 | 3,805,074 |
|
| iShares Core U.S. Aggregate Bond ETF | 205,000 | 22,142,050 |
|
| iShares North American Natural Resources ETF | 16,000 | 450,240 |
|
| iShares Russell 2000 ETF | 25,400 | 2,857,754 |
|
| iShares S&P 500 Growth ETF | 49,400 | 5,720,520 |
|
| iShares S&P 500 Value ETF | 64,600 | 5,719,038 |
|
| iShares S&P Mid-Cap 400 Growth ETF | 6,000 | 965,760 |
|
| iShares S&P Mid-Cap 400 Value ETF | 8,100 | 949,320 |
|
| SPDR Barclays High Yield Bond ETF | 26,200 | 888,442 |
|
| Technology Select Sector SPDR Fund | 11,500 | 492,545 |
|
| Vanguard FTSE Developed Markets ETF | 235,200 | 8,636,544 |
|
| Vanguard FTSE Emerging Markets ETF | 28,500 | 932,235 |
|
| Vanguard REIT ETF | 24,300 | 1,937,439 |
|
| Vanguard S&P 500 ETF | 72,000 | 13,458,960 |
|
| Vanguard Total Bond Market ETF | 275,000 | 22,209,000 |
|
| | | |
| Total Exchange-Traded Products (Cost $93,596,063) | | 92,167,150 |
|
| | | |
| | PRINCIPAL
AMOUNT ($) | |
| TIME DEPOSIT - 4.4% | | |
| State Street Bank Time Deposit, 0.278%, 1/4/16 | 4,218,826 | 4,218,826 |
|
| | | |
| Total Time Deposit (Cost $4,218,826) | | 4,218,826 |
|
| | | |
| TOTAL INVESTMENTS (Cost $97,814,889) - 100.1% | | 96,385,976 |
|
| Other assets and liabilities, net - (0.1)% | | (141,053) |
|
NET ASSETS - 100.0% | |
| $96,244,923 |
|
|
| | | | | | | | | |
| FUTURES | NUMBER OF
CONTRACTS | EXPIRATION
DATE | UNDERLYING FACE AMOUNT AT VALUE | UNREALIZED
APPRECIATION
(DEPRECIATION) |
| Short: | |
| | E-Mini S&P 500 Index | (2) | 3/16 |
| ($203,540 | ) |
| $758 |
|
| | MSCI EAFE Mini Index | (3) | 3/16 | (254,730) |
| (1,397) |
|
| | Russell 2000 Mini Index | (1) | 3/16 | (113,150) |
| (151) |
|
| | Total Short | | | |
| ($790 | ) |
|
|
| NOTES TO SCHEDULE OF INVESTMENTS |
Abbreviations: ETF: Exchange Traded Fund FTSE: Financial Times Stock Exchange REIT: Real Estate Investment Trust SPDR: Standard and Poor's Depository Receipt |
| See notes to financial statements. |
6 www.calvert.com CALVERT VP VOLATILITY MANAGED MODERATE PORTFOLIO ANNUAL REPORT
CALVERT VP VOLATILITY MANAGED MODERATE PORTFOLIO
STATEMENT OF ASSETS AND LIABILITIES
DECEMBER 31, 2015
|
| | | |
| ASSETS | |
| Investments in securities, at value (Cost $97,814,889) - see accompanying schedule |
| $96,385,976 |
|
| Cash collateral at broker | 30,393 |
|
| Receivable for shares sold | 346 |
|
| Directors' deferred compensation plan | 62,745 |
|
| Dividends and interest receivable | 4,989 |
|
| Total assets | 96,484,449 |
|
| | |
| LIABILITIES | |
| Payable for shares redeemed | 91,017 |
|
| Payable for futures contracts variation margin | 785 |
|
| Payable to Calvert Investment Management, Inc. | 23,227 |
|
| Payable to Calvert Investment Distributors, Inc. | 20,647 |
|
| Payable to Calvert Investment Administrative Services, Inc. | 8,259 |
|
| Payable to Calvert Investment Services, Inc. | 3,157 |
|
| Directors' deferred compensation plan | 62,745 |
|
| Accrued expenses and other liabilities | 29,689 |
|
| Total liabilities | 239,526 |
|
| NET ASSETS |
| $96,244,923 |
|
| | |
| NET ASSETS CONSIST OF: | |
| Paid-in capital applicable to 6,210,683 shares of common stock outstanding; | |
| $0.10 par value, 100,000,000 shares authorized |
| $97,859,503 |
|
| Undistributed net investment income | 29,415 |
|
| Accumulated net realized gain (loss) | (214,292) |
|
| Net unrealized appreciation (depreciation) | (1,429,703) |
|
| NET ASSETS |
| $96,244,923 |
|
| | |
| NET ASSET VALUE PER SHARE |
| $15.50 |
|
| See notes to financial statements. |
www.calvert.com CALVERT VP VOLATILITY MANAGED MODERATE PORTFOLIO ANNUAL REPORT 7
CALVERT VP VOLATILITY MANAGED MODERATE PORTFOLIO
STATEMENT OF OPERATIONS
YEAR ENDED DECEMBER 31, 2015
|
| | | |
| NET INVESTMENT INCOME | |
| Investment Income: | |
| Dividend income |
| $2,191,064 |
|
| Interest income | 4,038 |
|
| Total investment income | 2,195,102 |
|
| | |
| Expenses: | |
| Investment advisory fee | 409,132 |
|
| Administrative fees | 97,412 |
|
| Transfer agency fees and expenses | 9,122 |
|
| Distribution Plan expenses | 243,531 |
|
| Directors' fees and expenses | 18,257 |
|
| Accounting fees | 14,975 |
|
| Custodian fees | 19,150 |
|
| Professional fees | 27,403 |
|
| Reports to shareholders | 8,396 |
|
| Miscellaneous | 5,057 |
|
| Total expenses | 852,435 |
|
| Reimbursement from Advisor | (43,912) |
|
| Net expenses | 808,523 |
|
| NET INVESTMENT INCOME | 1,386,579 |
|
| | |
| | |
| REALIZED AND UNREALIZED GAIN (LOSS) | |
| Net realized gain (loss) on: | |
| Investments | 711,414 |
|
| Futures | (462,126) |
|
| | 249,288 |
|
| | |
| Change in unrealized appreciation (depreciation) on: | |
| Investments | (2,649,109) |
|
| Futures | (179,354) |
|
| | (2,828,463) |
|
| | |
| NET REALIZED AND UNREALIZED GAIN (LOSS) | (2,579,175) |
|
| | |
| INCREASE (DECREASE) IN NET ASSETS RESULTING FROM OPERATIONS | ($1,192,596) |
| |
| See notes to financial statements. |
8 www.calvert.com CALVERT VP VOLATILITY MANAGED MODERATE PORTFOLIO ANNUAL REPORT
CALVERT VP VOLATILITY MANAGED MODERATE PORTFOLIO
STATEMENTS OF CHANGES IN NET ASSETS
|
| | | | | | | |
| INCREASE (DECREASE) IN NET ASSETS | YEAR ENDED
DECEMBER 31, 2015 | | YEAR ENDED
DECEMBER 31, 2014 |
| Operations: | | | |
| Net investment income |
| $1,386,579 |
| |
| $1,039,123 |
|
| Net realized gain (loss) | 249,288 |
| | 676,692 |
|
| Change in unrealized appreciation (depreciation) | (2,828,463) |
| | 1,223,709 |
|
| | | | |
| INCREASE (DECREASE) IN NET ASSETS RESULTING FROM OPERATIONS | (1,192,596) |
| | 2,939,524 |
|
| | | | |
| Distributions to shareholders from: | | | |
| Net investment income | (1,317,345) |
| | (986,377) |
|
| Net realized gain | (610,789) |
| | (609,792) |
|
| Total distributions | (1,928,134) |
| | (1,596,169) |
|
| | | | |
| Capital share transactions: | | | |
| Shares sold | 10,306,066 |
| | 92,545,266 |
|
| Reinvestment of distributions | 1,928,134 |
| | 1,561,442 |
|
| Shares redeemed | (12,633,880) |
| | (4,848,684) |
|
| Total capital share transactions | (399,680) |
| | 89,258,024 |
|
| | | | |
| TOTAL INCREASE (DECREASE) IN NET ASSETS | (3,520,410) |
| | 90,601,379 |
|
| | | | |
| | | | |
| NET ASSETS | | | |
| Beginning of year | 99,765,333 |
| | 9,163,954 |
|
| End of year (including undistributed net investment income of $29,415 and $1,654, respectively) |
| $96,244,923 |
| |
| $99,765,333 |
|
| | | | |
| CAPITAL SHARE ACTIVITY | | | |
| Shares sold | 642,919 |
| | 5,832,817 |
|
| Reinvestment of distributions | 123,519 |
| | 97,044 |
|
| Shares redeemed | (786,387) |
| | (303,338) |
|
| Total capital share activity | (19,949) |
| | 5,626,523 |
|
| | | | |
| See notes to financial statements. |
www.calvert.com CALVERT VP VOLATILITY MANAGED MODERATE PORTFOLIO ANNUAL REPORT 9
NOTES TO FINANCIAL STATEMENTS
NOTE A — SIGNIFICANT ACCOUNTING POLICIES
General: Calvert VP Volatility Managed Moderate Portfolio (the “Portfolio”), a series of Calvert Variable Products, Inc. (the “Fund”), is registered under the Investment Company Act of 1940 as a diversified, open-end management investment company. The Fund is comprised of eleven separate portfolios. The operations of each series of the Fund are accounted for separately. The Portfolio applies the accounting and reporting guidance in the Financial Accounting Standards Board (FASB) Accounting Standards Codification Topic 946, Financial Services – Investment Companies (ASC 946).
The Portfolio offers Class F shares, which are subject to Distribution Plan expenses. Shares of the Portfolio are sold without sales charge to affiliated and unaffiliated insurance companies for allocation to certain of their variable separate accounts. The Portfolio invests primarily in exchange traded funds representing a broad range of asset classes (the “Underlying Funds”) and derivatives to manage overall portfolio volatility.
Security Valuation: Net asset value per share is determined every business day as of the close of the regular session of the New York Stock Exchange (generally 4:00 p.m. Eastern time). The Portfolio uses independent pricing services approved by the Board of Directors (“the Board”) to value its investments wherever possible. Investments for which market quotations are not available or deemed not reliable are fair valued in good faith under the direction of the Board.
The Board has adopted Valuation Procedures (the “Procedures”) to determine the fair value of securities and other financial instruments for which market prices are not readily available or which may not be reliably priced. The Board has delegated the day-to-day responsibility for determining the fair value of assets of the Portfolio to Calvert Investment Management, Inc. (the “Advisor” or “Calvert”) and has provided these Procedures to govern Calvert in its valuation duties.
Calvert has chartered an internal Valuation Committee to oversee the implementation of these Procedures and to assist it in carrying out the valuation responsibilities that the Board has delegated.
The Valuation Committee meets on a regular basis to review illiquid securities and other investments which may not have readily available market prices. The Valuation Committee’s fair valuation determinations are subject to review, approval and ratification by the Board at its next regularly scheduled meeting covering the calendar quarter in which the fair valuation was determined.
The Valuation Committee utilizes various methods to measure the fair value of the Portfolio’s investments. U.S. generally accepted accounting principles (GAAP) establishes a disclosure hierarchy that categorizes the inputs to valuation techniques used to value assets and liabilities at measurement date. These inputs are summarized in the three broad levels listed below:
Level 1 - quoted prices in active markets for identical securities
Level 2 - other significant observable inputs (including quoted prices for similar securities, interest rates, prepayment speeds, credit risk, etc.)
Level 3 - significant unobservable inputs (including the Portfolio’s own assumptions in determining the fair value of investments)
The inputs or methodologies used for valuing securities are not necessarily an indication of the risk associated with investing in those securities.
Changes in valuation techniques may result in transfers in or out of an investment’s assigned level within the hierarchy during the year. Transfers in and/or out of levels are determined based on the fair value of such securities at the end of the year. Valuation techniques used to value the Portfolio’s investments by major category are as follows:
Exchange-traded products are valued at the official closing price as reported by an independent pricing service on the primary market or exchange on which they are traded and are categorized as Level 1 in the hierarchy.
Short-term securities of sufficient credit quality with remaining maturities of sixty days or less for which quotations are not readily available are valued at amortized cost, which approximates fair value, and are categorized as Level 2 in the hierarchy.
10 www.calvert.com CALVERT VP VOLATILITY MANAGED MODERATE PORTFOLIO ANNUAL REPORT
Futures contracts are valued at unrealized appreciation (depreciation) based on the settlement price established each day by the board of trade or exchange on which they are traded and are categorized as Level 1 in the hierarchy.
If a market value cannot be determined for a security using the methodologies described above, or if, in the good faith opinion of the Advisor, the market value does not constitute a readily available market quotation, or if a significant event has occurred that would materially affect the value of the security, the security will be fair valued as determined in good faith by the Valuation Committee.
The Valuation Committee considers a number of factors, including significant unobservable valuation inputs when arriving at fair value. It considers all significant facts that are reasonably available and relevant to the determination of fair value.
The Valuation Committee primarily employs a market-based approach which may use related or comparable assets or liabilities, recent transactions, market multiples, book values, and other relevant information for the investment to determine the fair value of the investment. When more appropriate, the Portfolio may employ an income-based or cost approach. An income-based valuation approach discounts anticipated future cash flows of the investment to calculate a present amount (discounted). The measurement is based on the value indicated by current market expectations about those future amounts. Discounts may also be applied due to the nature or duration of any restrictions on the disposition of the investments. A cost based approach is based on the amount that currently would be required to replace the service capacity of an asset (current replacement cost). From the seller’s perspective, the price that would be received for the asset is determined based on the cost to a buyer to acquire or construct a substitute asset of comparable utility, adjusted for obsolescence.
The values assigned to fair value investments are based on available information and do not necessarily represent amounts that might ultimately be realized. Further, due to the inherent uncertainty of valuations of such investments, the fair values may differ significantly from the values that would have been used had an active market existed, and the differences could be material. The Valuation Committee employs various methods for calibrating these valuation approaches including a regular review of key inputs and assumptions, transactional back-testing or disposition analysis and reviews of any related market activity.
At December 31, 2015, no securities were fair valued in good faith under the direction of the Board.
The following table summarizes the market value of the Portfolio's holdings as of December 31, 2015, based on the inputs used to value them:
|
| | | | | | | | | | | |
| | VALUATION INPUTS |
| INVESTMENTS IN SECURITIES* | LEVEL 1 | LEVEL 2 | LEVEL 3 | TOTAL |
| Exchange-Traded Products |
| $92,167,150 |
| $— |
| $— |
|
| $92,167,150 |
|
| Time Deposit | — |
| 4,218,826 |
| — |
| 4,218,826 |
|
| TOTAL |
| $92,167,150 |
|
| $4,218,826 |
| $— |
|
| $96,385,976 |
|
| Futures Contracts** |
| ($790 | ) | $— |
| $— |
|
| ($790 | ) |
| |
| * For a complete listing of investments, please refer to the Schedule of Investments. |
| ** The value listed for these securities reflects unrealized appreciation (depreciation) as shown on the Schedule of Investments. |
| There were no transfers between levels during the year. |
Futures Contracts: The Portfolio may purchase and sell futures contracts to manage overall portfolio volatility. These futures contracts may include, but are not limited to, futures contracts based on U.S. government obligations and market index futures contracts. The Portfolio may enter into futures contracts agreeing to buy or sell a financial instrument for a set price at a future date. Initial margin deposits of either cash or securities as required by the broker are made upon entering into the contract. While the contract is open, daily variation margin payments are made to or received from the broker reflecting the daily change in market value of the contract and are recorded for financial reporting purposes as unrealized gains or losses by the Portfolio. When a futures contract is closed, a realized gain or loss is recorded equal to the difference between the opening and closing value of the contract. The risks associated with entering into futures contracts may include the possible illiquidity of the secondary market which would limit the Portfolio’s ability to close out a futures contract prior to the settlement date, an imperfect correlation between the value of the contracts and the
www.calvert.com CALVERT VP VOLATILITY MANAGED MODERATE PORTFOLIO ANNUAL REPORT 11
underlying financial instruments, or that the counterparty will fail to perform its obligations under the contracts’ terms. Futures contracts are designed by boards of trade which are designated “contracts markets” by the Commodities Futures Trading Commission. Futures contracts trade on the contracts markets in a manner that is similar to the way a stock trades on a stock exchange, and the boards of trade, through their clearing corporations, guarantee the futures contracts against default. As a result, there is minimal counterparty credit risk to the Portfolio. During the year, futures contracts were used to adjust the Portfolio’s overall equity exposure in an effort to stabilize portfolio volatility around a target level. The Portfolio’s futures contracts at year end are presented in the Schedule of Investments.
At December 31, 2015, the Portfolio had the following derivatives, categorized by risk exposure:
|
| | | | | |
| Risk | Statement of Assets and Liabilities | Assets | Statement of Assets and Liabilities | Liabilities | |
| Equity | Unrealized appreciation on futures contracts | $758* | Unrealized depreciation on futures contracts | $1,548* | |
| * Only the current day’s variation margin is reported within the Statement of Assets and Liabilities. |
The effect of derivative instruments on the Statement of Operations for the year ended December 31, 2015 was as follows:
|
| | | |
| | Statement of Operations Location |
| Risk | Derivatives | Net Realized Gain (Loss) | Net Change in Unrealized appreciation (depreciation) |
| Equity | Futures | ($462,126) | ($179,354) |
During the year, the Portfolio invested in E-Mini S&P 500 Index, E-Mini S&P MidCap 400 Index, MSCI EAFE Mini Index, and Russell 2000 Mini Index futures. The volume of outstanding contracts has varied throughout the year with an average number of contracts as in the following table:
|
| |
| Derivative Description | Average Number of Contracts* |
| Futures contracts long | 50 |
| Futures contracts short | (8) |
| | |
| *Averages are based on activity levels during the year ended December 31, 2015. |
Security Transactions and Investment Income: Security transactions, normally purchases and sales of shares of the Underlying Funds, are accounted for on trade date. Realized gains and losses are recorded on an identified cost basis and may include proceeds from litigation. Income and capital gain distributions from the Underlying Funds, if any, are recorded on ex-dividend date. Distributions received on securities that represent a return of capital are recorded as a reduction of cost of investments. Distributions received on securities that represent a capital gain are recorded as a realized gain. Interest income, which includes amortization of premium and accretion of discount on debt securities, is accrued as earned. Expenses included in the accompanying financial statements reflect the expenses of the Portfolio and do not include any expenses associated with the Underlying Funds.
Distributions to Shareholders: Distributions to shareholders are recorded by the Portfolio on ex-dividend date. Dividends from net investment income and distributions from net realized capital gains, if any, are paid at least annually. Distributions are determined in accordance with income tax regulations which may differ from U.S. generally accepted accounting principles; accordingly, periodic reclassifications are made within the Portfolio's capital accounts to reflect income and gains available for distribution under income tax regulations.
Estimates: The preparation of financial statements in conformity with U.S. generally accepted accounting principles requires management to make estimates and assumptions that affect the reported amounts of assets and liabilities and disclosure of contingent assets and liabilities at the date of the financial statements and the reported amounts of increases and decreases in net assets from operations during the reporting period. Actual results could differ from those estimates.
Federal Income Taxes: No provision for federal income or excise tax is required since the Portfolio intends to continue to qualify as a regulated investment company under the Internal Revenue Code and to distribute substantially all of its taxable earnings.
12 www.calvert.com CALVERT VP VOLATILITY MANAGED MODERATE PORTFOLIO ANNUAL REPORT
Management has analyzed the Portfolio's tax positions taken for all open federal income tax years and has concluded that no provision for federal income tax is required in the Portfolio's financial statements. A Portfolio's federal tax return is subject to examination by the Internal Revenue Service for a period of three years.
NOTE B — RELATED PARTY TRANSACTIONS
Calvert Investment Management, Inc. (the “Advisor”) is wholly-owned by Calvert Investments, Inc., which is indirectly wholly-owned by Ameritas Mutual Holding Company. The Advisor provides investment advisory services and pays the salaries and fees of officers and Directors of the Fund who are employees of the Advisor or its affiliates. For its services, the Advisor receives an annual fee, payable monthly of 0.42% of the Portfolio’s average daily net assets.
The Advisor has contractually agreed to limit net annual portfolio operating expenses through April 30, 2016. The contractual expense cap is 0.83%. For the purpose of this expense limit, operating expenses do not include interest expense, brokerage commissions, taxes, and extraordinary expenses. This expense limitation does not limit fees and expenses associated with the Underlying Funds.
Calvert Investment Administrative Services, Inc. ("CIAS"), an affiliate of the Advisor, provides administrative services to the Portfolio for an annual fee, payable monthly, of 0.10% of the Portfolio’s average daily net assets.
On November 24, 2015, the Board of Directors approved the recommendation made by CIAS to standardize and rationalize the administrative fee paid by the Calvert Funds at 0.12% for all series and all share classes of the Calvert Funds. CIAS and the Portfolio have entered into an Amended and Restated Administrative Services Agreement that will establish a 0.12% administrative fee commencing on May 1, 2016. CIAS has contractually agreed to waive 0.02% (the difference between the current administrative fee and the new 0.12% fee) from May 1, 2016 through April 30, 2018.
Calvert Investment Distributors, Inc. (“CID”), an affiliate of the Advisor, is the distributor and principal underwriter for the Portfolio. Pursuant to Rule 12b-1 under the Investment Company Act of 1940, the Portfolio has adopted a Distribution Plan that permits the Portfolio to pay certain expenses associated with the distribution and servicing of its Class F shares. The expenses paid may not exceed 0.25% annually of the average daily net assets of Class F.
Calvert Investment Services, Inc. (“CIS”), an affiliate of the Advisor, acts as shareholder servicing agent for the Portfolio. For its services, CIS received a fee of $7,306 for the year ended December 31, 2015. Boston Financial Data Services, Inc. is the transfer and dividend disbursing agent.
Each Director of the Fund who is not an employee of the Advisor or its affiliates receives a fee of $1,500 for each Board and Committee meeting attended plus an annual fee of $44,000. Committee chairs receive an additional $5,000 annual retainer. Eligible Directors may participate in a Deferred Compensation Plan (the “Plan”). Obligations of the Plan will be paid solely out of the Portfolio’s assets. Directors’ fees are allocated to each of the portfolios served.
NOTE C — INVESTMENT ACTIVITY AND TAX INFORMATION
During the year, the cost of purchases and proceeds from sales of investments, other than short-term securities, were $19,624,183 and $21,165,939, respectively.
The tax character of dividends and distributions paid during the years ended December 31, 2015 and December 31, 2014 was as follows:
|
| | | | | | |
| DISTRIBUTIONS PAID FROM: | 2015 | 2014 |
| Ordinary income |
| $1,721,248 |
|
| $1,288,365 |
|
| Long-term capital gains | 206,886 |
| 307,804 |
|
| Total |
| $1,928,134 |
|
| $1,596,169 |
|
www.calvert.com CALVERT VP VOLATILITY MANAGED MODERATE PORTFOLIO ANNUAL REPORT 13
As of December 31, 2015, the tax basis components of distributable earnings/(accumulated losses) and the federal tax cost were as follows:
|
| | | |
| Unrealized appreciation |
| $1,018,527 |
|
| Unrealized (depreciation) | (2,538,307) |
|
| Net unrealized appreciation (depreciation) |
| ($1,519,780 | ) |
| Undistributed ordinary income |
| $29,415 |
|
| Undistributed capital gains |
| $308 |
|
| Late year ordinary and post October capital loss deferrals |
| ($124,523 | ) |
| Federal income tax cost of investments |
| $97,905,756 |
|
The differences between the components of distributable earnings on a tax basis and the amounts reflected in the Statement of Assets and Liabilities are primarily due to temporary book-tax differences that will reverse in a subsequent period. These differences are mainly due to wash sales, Section 1256 futures contracts and loss deferral.
Reclassifications, as shown in the table below, have been made to the Portfolio's components of net assets to reflect income and gains available for distribution (or available capital loss carryovers, as applicable) under income tax law and regulations. These reclassifications are due to permanent book-tax differences and have no impact on net assets. The primary permanent differences causing such reclassifications for the Portfolio are due to distribution recharacterizations.
|
| | | |
| Undistributed net investment income |
| ($41,473 | ) |
| Accumulated net realized gain (loss) | 41,473 |
|
NOTE D — LINE OF CREDIT
A financing agreement is in place with the Calvert Funds and State Street Corporation (“SSC”). Under the agreement, SSC provides an unsecured line of credit facility, in the aggregate amount of $50 million ($25 million committed and $25 million uncommitted), accessible by the Calvert Funds for temporary or emergency purposes only. Borrowings bear interest at the higher of the London Interbank Offered Rate (LIBOR) or the overnight Federal Funds Rate plus 1.25% per annum. A commitment fee of 0.20% per annum is incurred on the unused portion of the committed facility. An administrative fee of $25,000 was paid in connection with the uncommitted facility. These fees are allocated to all participating funds. The Portfolio had no borrowings under the agreement during the year ended December 31, 2015.
NOTE E — SUBSEQUENT EVENTS
In preparing the financial statements as of December 31, 2015, no subsequent events or transactions occurred that would have required recognition or disclosure in these financial statements.
NOTICE TO SHAREHOLDERS (UNAUDITED)
For the fiscal year ended December 31, 2015, the Portfolio reports the maximum amount allowable of its net taxable income as eligible for the corporate dividends-received deduction. The Portfolio also considers $206,844 of the long-term capital gain distributions paid during the year as capital gain dividends in accordance with Section 852(b)(3)(C) of the Internal Revenue Code.
14 www.calvert.com CALVERT VP VOLATILITY MANAGED MODERATE PORTFOLIO ANNUAL REPORT
CALVERT VP VOLATILITY MANAGED MODERATE PORTFOLIO
FINANCIAL HIGHLIGHTS
|
| | | | | | | | | | | | |
| | PERIODS ENDED | |
| | December 31, 2015 (a) | | December 31, 2014 (a) | | December 31, 2013 (a)(b) | |
| Net asset value, beginning |
| $16.01 |
| |
| $15.17 |
| |
| $15.00 |
| |
| Income from investment operations: | | | | | | |
| Net investment income | 0.23 |
| | 0.29 |
| | 0.21 |
| |
| Net realized and unrealized gain (loss) | (0.42) |
| | 0.81 |
| | 0.08 |
| |
| Total from investment operations | (0.19) |
| | 1.10 |
| | 0.29 |
| |
| Distributions from: | | | | | | |
| Net investment income | (0.22) |
| | (0.16) |
| | (0.12) |
| |
| Net realized gain | (0.10) |
| | (0.10) |
| | — |
| |
| Total distributions | (0.32) |
| | (0.26) |
| | (0.12) |
| |
| Total increase (decrease) in net asset value | (0.51) |
| | 0.84 |
| | 0.17 |
| |
| Net asset value, ending |
| $15.50 |
| |
| $16.01 |
| |
| $15.17 |
| |
| Total return(c) | (1.22 | %) | | 7.25 | % | | 1.97 | % | |
| Ratios to average net assets: (d)(e) | | | | | | |
| Net investment income | 1.42 | % | | 1.80 | % | | 2.10%(f) |
| |
| Total expenses | 0.88 | % | | 0.93 | % | | 1.60%(f) |
| |
| Net expenses | 0.83 | % | | 0.83 | % | | 0.83%(f) |
| |
| Portfolio turnover | 21 | % | | 36 | % | | 3 | % | |
| Net assets, ending (in thousands) |
| $96,245 |
| |
| $99,765 |
| |
| $9,164 |
| |
| | | | | | | |
| (a)Per share figures are calculated using the Average Shares Method. |
| (b)From April 30, 2013 inception. |
| (c)Total return is not annualized for periods of less than one year and does not reflect charges and expenses of the variable annuity or variable universal life contract. |
| (d)Total expenses do not reflect amounts reimbursed and/or waived by the Advisor and certain of its affiliates, if applicable. Net expenses are net of all reductions and represent the net expenses paid by the Portfolio. |
| (e)Amounts do not include the income or expenses of the Underlying Funds. |
| (f)Annualized. |
| See notes to financial statements. |
www.calvert.com CALVERT VP VOLATILITY MANAGED MODERATE PORTFOLIO ANNUAL REPORT 15
PROXY VOTING
The Proxy Voting Guidelines that the Portfolio uses to determine how to vote proxies relating to portfolio securities is provided as an Appendix to the Fund’s Statement of Additional Information. The Statement of Additional Information can be obtained free of charge by calling the Fund at 1-800-368-2745, by visiting the Calvert website at www.calvert.com or by visiting the SEC’s website at www.sec.gov.
Information regarding how the Fund voted proxies relating to portfolio securities during the most recent 12-month period ended June 30 is available by calling the Fund, by visiting the Calvert website at www.calvert.com or visiting the SEC’s website at www.sec.gov.
AVAILABILITY OF QUARTERLY PORTFOLIO HOLDINGS
The Fund files its complete schedule of portfolio holdings with the SEC for the first and third quarters of each fiscal year on Form N-Q. The Fund’s Form N-Q is available on the SEC’s website at www.sec.gov. The Fund’s Form N-Q may be reviewed and copied at the SEC’s Public Reference Room in Washington, DC; information on the operation of the Public Reference Room may be obtained by calling 1-800-SEC-0330.
BASIS FOR BOARD'S APPROVAL OF INVESTMENT ADVISORY CONTRACTS
At a meeting held on December 9, 2015, the Board of Directors, and by a separate vote, the disinterested Directors, approved the continuance of the Investment Advisory Agreement between the Portfolio and the Advisor and the Investment Subadvisory Agreements between the Advisor and each Subadvisor with respect to the Portfolio.
In evaluating the Investment Advisory Agreement, the Board considered a variety of information relating to the Portfolio and the Advisor. The disinterested Directors reviewed a report prepared by the Advisor regarding various services provided to the Portfolio by the Advisor and its affiliates. Such report included, among other data, information regarding the Advisor's personnel and the Advisor's revenue and cost of providing services to the Portfolio, and a separate report prepared by an independent third party, which provided a statistical analysis comparing the Portfolio's investment performance, expenses, and fees to comparable mutual funds.
The disinterested Directors were separately represented by independent legal counsel with respect to their consideration of the reapproval of the Investment Advisory Agreement and each of the Investment Subadvisory Agreements. Prior to voting, the disinterested Directors reviewed the proposed continuance of the Investment Advisory Agreement and Investment Subadvisory Agreements with management and also met in private sessions with their counsel at which no representatives of management were present.
In the course of its deliberations regarding the Investment Advisory Agreement, the Board considered the following factors, among others: the nature, extent and quality of the services provided by the Advisor, including the personnel providing such services; the Advisor's financial condition; the level and method of computing the Portfolio's advisory fee; comparative performance, fee and expense information for the Portfolio; the profitability of the Calvert Family of Funds to the Advisor and its affiliates; the allocation of the Portfolio's brokerage, including the Advisor's process for monitoring "best execution"; the direct and indirect benefits, if any, derived by the Advisor and its affiliates from their relationship with the Portfolio; the effect of the Portfolio's growth and size on the Portfolio's performance and expenses; the Advisor's compliance programs and policies; the Advisor's performance of substantially similar duties for other funds; and any possible conflicts of interest.
In considering the nature, extent and quality of the services provided by the Advisor under the Investment Advisory Agreement, the Board reviewed information provided by the Advisor relating to its operations and personnel, including, among other information, biographical information on the Advisor's supervisory and professional staff and descriptions of its organizational and management structure. The Board also took into account similar information provided periodically throughout the previous year by the Advisor, as well as the Board’s familiarity with the Advisor’s management through Board of Directors' meetings, discussions and other reports. The Board considered the Advisor's current level of staffing and overall resources. The Board also noted that it reviewed on a quarterly basis information regarding the Advisor’s compliance with applicable policies and procedures, including those related to personal investing. The Advisor's administrative capabilities, including its ability to supervise the other service providers for the Portfolio, were also considered. The Board discussed the Advisor's effectiveness in monitoring the performance of each Subadvisor and its timeliness in responding to performance issues. The Board observed that the scope of services provided by the Advisor
16 www.calvert.com CALVERT VP VOLATILITY MANAGED MODERATE PORTFOLIO ANNUAL REPORT (UNAUDITED)
generally had expanded over time as a result of regulatory, market and other changes. The Board took into consideration, among other factors, the effectiveness of the Portfolio’s and Advisor’s processes, policies and procedures and the Advisor’s personnel. The Board also took into account, among other items, periodic reports received from the Advisor over the past year concerning the Advisor’s ongoing review and enhancement of certain processes, policies and procedures of the Portfolio and the Advisor. The Board concluded that it was satisfied with the nature, extent and quality of services provided to the Portfolio by the Advisor under the Investment Advisory Agreement.
In considering the Portfolio's performance, the Board noted that it reviewed on a quarterly basis detailed information about the Portfolio's performance results, portfolio composition and investment strategies. In addition, the Board took into account overall financial market conditions. The Board also reviewed various comparative data provided to it in connection with its consideration of the renewal of the Investment Advisory Agreement, including, among other information, a comparison of the Portfolio's total return with its Lipper index and with that of other mutual funds deemed to be in its peer universe by an independent third party in its report. This comparison indicated that the Portfolio performed above the median of its peer universe for the one-year period ended June 30, 2015. The data also indicated that the Portfolio outperformed its Lipper index for the one-year period ended June 30, 2015. The Board also took into account management’s discussion of the Portfolio’s performance and management’s statement that the Portfolio had performed in-line with expectations. Based upon its review, the Board concluded that the Portfolio’s performance was satisfactory in view of the Portfolio’s investment strategy.
In considering the Portfolio's fees and expenses, the Board compared the Portfolio's fees and total expense ratio with various comparative data for the funds in its peer universe Among other findings, the data indicated that the Portfolio's advisory fee (after taking into account waivers and/or reimbursements) was at the median of its peer universe for the period ended June 30, 2015, and that total expenses (net of waivers and/or reimbursements) were below the median of its peer universe. The Board noted that the allocation of advisory and administrative fees may vary among the Portfolio’s peer universe. The Board also took into account the Advisor’s current undertaking to maintain expense limitations for the Portfolio. The Board noted that the Advisor paid each Subadvisor’s subadvisory fee under the Investment Subadvisory Agreement with respect to the Portfolio and that the Advisor is currently reimbursing the expenses of the Portfolio. The Board also took into account management's discussion of the Portfolio's expenses and certain factors that affected the level of such expenses, including the current size of the Portfolio. Based upon its review, the Board determined that the advisory fee was reasonable in view of the quality of services received by the Portfolio from the Advisor and the other factors considered.
The Board reviewed the Advisor’s profitability on a portfolio-by-portfolio basis. In reviewing the overall profitability of the advisory fee to the Portfolio's Advisor, the Board also considered the fact that affiliates of the Advisor provided shareholder servicing and administrative services to the Portfolio for which they received compensation. The information considered by the Board included Calvert’s operating profit margin information both before and after tax expenses with respect to the services that the Advisor and its affiliates provided to the Calvert Family of Funds complex. The Board reviewed the profitability of the Advisor's relationship with the Portfolio in terms of the total amount of annual advisory fees it received with respect to the Portfolio and whether the Advisor had the financial wherewithal to continue to provide services to the Portfolio. The Board also considered that the Advisor derived benefits to its reputation and other indirect benefits from its relationship with the Portfolio. In addition, the Board took into account that affiliates of the Advisor may benefit from certain indirect tax benefits relating to dividend received deductions and foreign tax credits. The Board also noted that the Advisor paid the subadvisory fee to each Subadvisor, including Ameritas Investment Partners, Inc. (“AIP”), an affiliate of the Advisor, and is currently reimbursing the expenses of the Portfolio. Based upon its review, the Board concluded that the Advisor’s and its affiliates’ level of profitability from their relationship with the Portfolio was reasonable.
The Board considered the effect of the Portfolio's current size and potential growth on its performance and fees. Although the Portfolio’s advisory fee did not contain breakpoints that would reduce the advisory fee rate on assets above specified asset levels, the Board noted that if the Portfolio’s assets increased over time, the Portfolio might realize other economies of scale if assets increased proportionally more than certain other expenses. The Board also noted that given the Portfolio’s current level of assets, the Portfolio would be unlikely to recognize economies of scale by implementing a breakpoint in the advisory fee at this time.
In reapproving the Investment Advisory Agreement, the Board, including the disinterested Directors, did not identify any single factor as controlling, and each Director may have attributed different weight to various factors.
www.calvert.com CALVERT VP VOLATILITY MANAGED MODERATE PORTFOLIO ANNUAL REPORT (UNAUDITED) 17
In evaluating the Investment Subadvisory Agreements, the disinterested Directors reviewed information provided by each Subadvisor relating to its operations, personnel, investment philosophy, strategies and techniques. Among other information, each Subadvisor provided biographical information on portfolio management and other professional staff, performance information for itself, and descriptions of its investment philosophies, strategies and techniques, organizational and management structures and brokerage policies and practices.
The Board reapproved the Investment Subadvisory Agreement between each Subadvisor and the Advisor based on a number of factors relating to the Subadvisor's ability to perform under the Investment Subadvisory Agreement. In the course of its deliberations, the Board evaluated, among other factors: the nature, extent and the quality of the services to be provided by each Subadvisor; each Subadvisor's management style and long-term performance record; the Portfolio's performance record and each Subadvisor's performance in employing its investment strategies; each Subadvisor's current level of staffing and its overall resources; the qualifications and experience of each Subadvisor's personnel; each Subadvisor's financial condition with respect to its ability to perform the services required under the Investment Subadvisory Agreement; each Subadvisor's risk management processes; each Subadvisor's compliance systems, including those related to personal investing; and any disciplinary history. Based upon its review, the Board concluded that it was satisfied with the nature, extent and quality of services provided to the Portfolio by each Subadvisor under the Investment Subadvisory Agreements.
As noted above, the Board considered, among other information, the Portfolio's performance during the one-year period ended June 30, 2015, as compared to the Portfolio's peer universe and noted that it reviewed on a quarterly basis detailed information about the Portfolio's performance results, portfolio composition and investment strategies. The Board noted the Advisor's expertise and resources in monitoring the performance, investment style and risk adjusted performance of each Subadvisor.
In considering the cost of services to be provided by each Subadvisor and the profitability to each Subadvisor of its relationship with the Portfolio, the Board noted that the Advisor and AIP were affiliated, and the subadvisory fee under each Investment Subadvisory Agreements was paid by the Advisor out of the advisory fee that the Advisor received under the Investment Advisory Agreement. The Board also relied on the ability of the Advisor to negotiate the Investment Subadvisory Agreement with Milliman Financial Risk Management LLC (“Milliman”) and the corresponding subadvisory fee at arm’s length. In addition, the Board took into account the fees Milliman charged to its other clients and considered these fee comparisons in light of the differences in managing these other accounts. Based upon its review, the Board determined that the subadvisory fee was reasonable in view of the quality of services received by the Portfolio from each Subadvisor and the other factors considered. Because the Advisor would pay each Subadvisor’s subadvisory fee, the cost of services to be provided by each Subadvisor and the level of profitability to each Subadvisor from its relationship with the Portfolio were not material factors in the Board’s deliberations. For similar reasons, the Board did not consider the potential economies of scale in each Subadvisor’s management of the Portfolio to be a material factor in its consideration.
In reapproving the Investment Subadvisory Agreements, the Board, including the disinterested Directors, did not identify any single factor as controlling, and each Director may have attributed different weight to various factors.
Conclusions
The Board reached the following conclusions regarding the Investment Advisory Agreement and the Investment Subadvisory Agreements, among others: (a) the Advisor has demonstrated that it possesses the capability and resources to perform the duties required of it under the Investment Advisory Agreement; (b) each Subadvisor is qualified to manage the Portfolio's assets in accordance with the Portfolio’s investment objective and policies; (c) the Advisor and each Subadvisor maintain appropriate compliance programs; (d) each Subadvisor is likely to execute its investment strategies consistently over time; (e) the Portfolio’s performance was satisfactory in view of the Portfolio’s investment strategy; and (f) the Portfolio's advisory and subadvisory fees are reasonable in view of the quality of services received by the Portfolio from the Advisor and Subadvisors and the other factors considered. Based on its conclusions, the Board determined that reapproval of the Investment Advisory Agreement and the Investment Subadvisory Agreements would be in the best interests of the Portfolio and its shareholder.
18 www.calvert.com CALVERT VP VOLATILITY MANAGED MODERATE PORTFOLIO ANNUAL REPORT (UNAUDITED)
DIRECTOR AND OFFICER INFORMATION TABLE
|
| | | | | |
| Name & Age | Position with Fund | Position Start Date | Principal Occupation During Last 5 Years | # of Calvert Portfolios Overseen | Other Directorships |
| INDEPENDENT DIRECTORS |
FRANK H. BLATZ, JR., Esq. AGE: 80 | Director | 1982 CVS
2008 CVP | Of counsel to firm of Schiller & Pittenger, P.C. | 13 | None |
ALICE GRESHAM BULLOCK AGE: 65 | Director | 1999 CVS
2008 CVP | Professor at Howard University School of Law. She is former Dean of Howard University School of Law and Deputy Director of the Association of American Law Schools. | 15 | None |
M. CHARITO KRUVANT AGE: 70 | Director | 1999 CVS
2008 CVP | President and CEO of Creative Associates International, Inc., a firm that specializes in human resources development, information management, public affairs and private enterprise development. | 22 | • Acacia Federal Savings Bank (through 2013) • Summit Foundation • WETA Public Broadcasting |
CYNTHIA MILLIGAN AGE: 69
| Director | 1999 CVS
2008 CVP | Dean Emeritus, College of Business Administration, University of Nebraska, Lincoln. She is former President and Chief Executive Officer for CMA, a consulting firm for financial institutions. | 15 | • Wells Fargo Company (banking and financial services) - NYSE • Wells Fargo Bank N.A. (Since 2014) • Gallup, Inc. (management consulting) • W.K. Kellogg Foundation • Raven Industries (technology company) - NASDAQ • Colonial Williamsburg Foundation • Kellogg Company (food manufacturing) - NYSE |
ARTHUR J. PUGH AGE: 78 | Director | 1982 CVS
2008 CVP | Retired executive. | 13 | None |
| INTERESTED DIRECTORS |
WILLIAM LESTER* AGE: 58 | Director & Chair (CVS)
Director & Senior Vice President (CVP) | 2004 CVS
2008 CVP | Executive Vice President Finance/Investments and Corporate Treasurer of Ameritas Mutual Holding Company. Chair and former President (resigned 2012) of Ameritas Investment Partners, Inc. | 13 | • Acacia Federal Savings Bank (through 2013)• Ameritas Investment Partners, Inc. (financial services)• Ameritas Investment Corp. (financial services)• Universal and Inland Insurance Companies• Bryan/LGH Health Systems |
www.calvert.com CALVERT VP VOLATILITY MANAGED MODERATE PORTFOLIO ANNUAL REPORT (UNAUDITED) 19
|
| | | | | |
| Name & Age | Position with Fund | Position Start Date | Principal Occupation During Last 5 Years | # of Calvert Portfolios Overseen | Other Directorships |
| INTERESTED DIRECTORS |
JOHN H. STREUR* AGE: 56
| President (CVS)
Director, Chair & President (CVP) | 2015 | President and Chief Executive Officer of Calvert Investments, Inc. (since January 2015) and Chief Compliance Officer for the Advisor and Calvert Investment Distributors, Inc. (since August 10, 2015); President and Director, Portfolio 21 Investments, Inc. (through October 2014); President, Chief Executive Officer and Director, Managers Investment Group LLC (through January 2012); President and Director, The Managers Funds and Managers AMG Funds (through January 2012). | 40 | • Portfolio 21 Investments, Inc. (asset management)(through October 2014) • Managers Investment Group LLC (asset management)(through January 2012) • The Managers Funds (asset management) (through January 2012) • Managers AMG Funds (asset management) (through January 2012) • Calvert Social Investment Foundation |
|
| | | |
| Name & Age | Position with Fund | Position Start Date | Principal Occupation During Last 5 Years |
| OFFICERS |
VICKI L. BENJAMIN AGE: 54 | Treasurer | 2015 | Executive Vice President, Chief Financial Officer and Chief Operating Officer of Calvert Investments, Inc. since October 2015; Senior Vice President and Chief Financial Officer of Calvert Investments, Inc. (March 2015 - September 2015). Prior to Calvert, Ms. Benjamin was a Senior Partner at KPMG. |
ROBERT D. BENSON, ESQ. AGE: 37 | Assistant Vice President & Assistant Secretary | 2014 | Assistant General Counsel (since 2014), Assistant Vice President & Assistant Secretary (since 2015) and Staff Attorney (prior to 2014), Calvert Investments, Inc. |
HOPE BROWN AGE: 42 | Chief Compliance Officer | 2014 | Chief Compliance Officer for the Calvert Funds (since 2014). Vice President and Chief Compliance Officer, Wilmington Funds (2012-2014). Vice President and Senior Compliance Officer, Wilmington Trust Investment Advisors, Inc. (2010-2012). |
STU DALHEIM AGE: 46 | Vice President | 2015 | Vice President - Shareholder Advocacy for the Advisor. |
MATTHEW DUCH Age: 40 | Vice President | 2011 | Vice President of the Advisor and portfolio manager for Calvert’s taxable fixed-income funds. |
ROBERT J. ENDERSON, CFA AGE: 57 | Assistant Treasurer | 2014 | Vice President, Corporate Finance, of Calvert Investments, Inc.; Acting Chief Financial Officer of Calvert Investments, Inc. (September 2014 - March 2015). |
PATRICK FAUL AGE: 51 | Vice President | 2010 | Vice President and Head of Credit Research for the Advisor. |
TRACI L. GOLDT AGE: 42 | Assistant Secretary | 2004 | SEC Filing and Administrative Operations Manager, Calvert Investments, Inc. |
JADE HUANG AGE: 41 | Vice President | 2015 | Equity Portfolio Manager since November 2015 and Senior Equity Analyst prior to November 2015, Advisor. |
EMILY KAISER AGE: 32 | Assistant Vice President | 2015 | Senior Sustainability Analyst since November 2015 and Sustainability Analyst (January 2014 - October 2015), Advisor. Prior to joining Calvert, Ms. Kaiser attended law school from 2010 to 2013 and also held legal and policy positions with the U.S. Agency for International Development (2013), the Solidarity Center, AFL-CIO (2013), the U.S. Department of Labor (2012), the office of the U.S. Trade Representative (2012) and the Public International Law and Policy Group (2011-2012). |
VISHAL KHANDUJA, CFA AGE: 37 | Vice President | 2014 | Head of Taxable Fixed Income (since 2015) and Vice President of the Advisor (since 2014); Portfolio Manager for Calvert’s taxable fixed-income funds since 2012. Previously worked at Columbia Management as Portfolio Manager - Global Rates and Currency Team (2009-2012). |
20 www.calvert.com CALVERT VP VOLATILITY MANAGED MODERATE PORTFOLIO ANNUAL REPORT (UNAUDITED)
|
| | | |
| Name & Age | Position with Fund | Position Start Date | Principal Occupation During Last 5 Years |
| OFFICERS |
LANCELOT A. KING, ESQ. AGE: 45 | Assistant Vice President & Secretary | 2002 | Assistant Vice President, Assistant Secretary and Associate General Counsel of Calvert Investments, Inc. |
ERICA LASDON AGE: 44 | Assistant Vice President | 2015 | Director of Sustainability Research since August 2015 and Senior Sustainability Analyst and Manager prior to August 2015, Advisor. |
JOSHUA LINDER AGE: 30 | Vice President | 2015 | Equity Portfolio Manager since November 2015, Assistant Portfolio Manager (January 2014 - October 2015) and Equity Analyst (2011 - 2013), Advisor. |
CHRISTOPHER MADDEN AGE: 40 | Vice President | 2015 | Equity Portfolio Manager since November 2015 and Senior Equity Analyst prior to November 2015, Advisor. |
ANDREW K. NIEBLER, ESQ. AGE: 48 | Assistant Vice President & Assistant Secretary | 2006 | Assistant Vice President, Assistant Secretary and Associate General Counsel of Calvert Investments, Inc. |
MARYBETH PILAT, CPA AGE: 47 | Fund Controller and Assistant Treasurer | 2015 | Director of Fund Administration, Calvert Investment Administrative Services, Inc. since August 2015. VP Expense & Budgeting, Global Fiduciary Platform, Legg Mason (May 2015 - July 2015). Vice President and Assistant Treasurer, Columbia Funds, Ameriprise, Columbia Management (2010 - April 2015). |
| |
| * | The address of Directors and Officers is 4550 Montgomery Avenue, Suite 1000N, Bethesda, Maryland 20814. Mr. Streur is an interested person of the Fund since he is an officer and director of the Fund’s Advisor and its affiliates. Mr. Lester is an interested person of the Fund since he is an officer and director of the parent company of the Fund’s Advisor. |
Additional information about the Fund’s Directors can be found in the Statement of Additional Information (SAI). You can get a free copy of the SAI by contacting your broker, or the Fund at 1-800-368-2745.
www.calvert.com CALVERT VP VOLATILITY MANAGED MODERATE PORTFOLIO ANNUAL REPORT (UNAUDITED) 21
|
| |
| | |
This report is intended to provide fund information to shareholders. It is not authorized for distribution to prospective investors unless preceded or accompanied by a prospectus. Note: The information on our website is not incorporated by reference into this report; our website address is included as an inactive textual reference only. Investors should carefully consider the investment objectives, risks, charges and expenses of the Calvert Funds. This and other important information is contained in the fund’s summary prospectus and prospectus, which can be obtained from your financial professional and should be read carefully before investing. You may also call Calvert at 800/368-2745. |
| Printed on recycled paper using soy inks. | |
|
| |
|
Calvert VP Volatility Managed Moderate Growth Portfolio |
Annual Report December 31, 2015 | |
|
| | | | |
| | TABLE OF CONTENTS |
| | | | | |
| | | | | Portfolio Management Discussion |
| | | | | Understanding Your Fund's Expenses |
| | | | | Report of Independent Registered Public Accounting Firm |
| | | | | Schedule of Investments |
| | | | | Statement of Assets and Liabilities |
| | | | | Statement of Operations |
| | | | | Statements of Changes in Net Assets |
| | | | | Notes to Financial Statements |
| | | | | Financial Highlights |
| | | | | Proxy Voting |
| | | | | Availability of Quarterly Portfolio Holdings |
| | | | | Basis for Board’s Approval of Investment Advisory Contracts |
| | | | | Director and Officer Information Table |
|
| | |
| | | PORTFOLIO MANAGEMENT DISCUSSION |
|
| |
| John P. Nichols, CFA Vice President - Equities |
Market Review
Both stock and bond markets posted meager returns for 2015 with continued weak energy prices, concerns about slowing economic growth, and the specter of high interest rates weighing on investors. Growth stocks were the only bright spot in the market, outperforming value stocks around the globe and across the spectrum of market capitalization. U.S. and foreign equities produced similar returns, with a strong dollar trimming back local market returns for foreign equities. Emerging market equities were the big losers for 2015 suffering double digit losses during a steep market sell-off and spike in volatility in August.
Investment Strategy and Technique:
The Calvert VP Volatility Managed Moderate Growth Portfolio (the Portfolio) seeks to stabilize portfolio volatility1 around a target level of 10% while pursuing current income and modest growth potential consistent with the preservation of capital. To achieve this objective, the Portfolio invests in a portfolio of exchange traded funds (ETFs) diversified across multiple asset classes and utilizes a derivatives-based risk management strategy. The asset allocated portfolio of ETFs is designed to achieve market returns at a level of risk that is consistent with the Portfolio’s volatility target in a long-term context, while the risk management strategy employs futures contracts to respond to short-term changes in market volatility. The risk management strategy combines two components - volatility management and a capital protection strategy - that work together in an effort to reduce the negative effects of high portfolio volatility during market downturns while seeking to participate in up markets.
Fund Performance Relative to the Benchmark
For the one-year period ended December 31, 2015, the Portfolio returned -2.29%, outperforming its benchmark, the S&P 500 Daily Risk Control 10% Total Return Index, which returned -3.64%.
Calvert has developed a secondary composite benchmark based on a mix of market indices that more closely reflect the Portfolio’s asset allocation strategy as compared to the single asset class benchmark listed above that is used to capture the impact of the volatility management strategy.
The Portfolio underperformed the blended composite benchmark’s return of 0.83%.
This year, the Portfolio outperformed the S&P 500 Daily Risk Control 10% Index by 1.35%. The Portfolio’s advantage was realized during the equity market’s sharp sell-off in August. The Portfolio and the benchmark had high equity exposures coming into the market downturn because the volatility models of each recommended increased equity exposures during a period of very low equity market volatility. The Portfolio benefited from having a lower level of equity market exposure than the benchmark at this time due to the capital protection strategy and risk control policies. Consequently, when equity markets sold off, the Portfolio protected capital to a greater degree than did the benchmark.
| |
| • | Our volatility management and capital protection strategy protected the Portfolio against losses in the market’s sharp sell-off in August. |
| |
| • | The Portfolio participated in rising markets earlier in the year and in the closing quarter, but often underperformed its primary benchmark during these periods due to risk control measures that limit the Portfolio’s equity exposure. |
____________________________________
1 Volatility refers to the annualized standard deviation of daily logarithmic portfolio returns.
www.calvert.com CALVERT VP VOLATILITY MANAGED MODERATE GROWTH PORTFOLIO ANNUAL REPORT (UNAUDITED) 1
| |
| • | The Portfolio underperformed its secondary composite benchmark by 3.12%, primarily due to having its equity exposure at the highest allowed level heading into the equity market’s sharp sell-off in August. |
Positioning and Market Outlook
As 2015 closed out, equity markets remained volatile. Our allocation across equity and fixed income ETFs has remained relatively stable across 2015 and into the new year. We use futures to adjust the Portfolio’s risk profile, relying on our volatility management and capital protection strategy to determine the appropriate level of market risk for the Portfolio. Markets experienced an uptick in volatility and suffered losses in the closing days of 2015 and our strategy responded by decreasing the level of equity exposure (including futures contracts) in the Portfolio to 57.7%, which is 6% below our long-term target for the Portfolio’s equity allocation.
Calvert Investment Management, Inc.
December 2015
|
| | | |
| ECONOMIC SECTORS | % OF TOTAL INVESTMENTS | |
| Equity Funds | 63.6 | % | |
| Debt Funds | 31.1 | % | |
| Short-Term Investments | 5.3 | % | |
| Total | 100 | % | |
| | | |
2 www.calvert.com CALVERT VP VOLATILITY MANAGED MODERATE GROWTH PORTFOLIO ANNUAL REPORT (UNAUDITED)
Growth of $10,000
The graph below shows the value of a hypothetical $10,000 investment in the Portfolio over the past 10 fiscal year periods or since inception (for funds without 10-year records). The results assume the reinvestment of dividends and are compared with a broad-based market index. Market indexes are unmanaged and their results do not reflect the effect of expenses or sales charges.
|
| | | | |
| CALVERT VP VOLATILITY MANAGED MODERATE GROWTH PORTFOLIO | |
| DECEMBER 31, 2015 |
| AVERAGE ANNUAL TOTAL RETURNS | 1 Year | Since Inception (4/30/2013) |
| Class F | -2.29 | % | 3.16 | % |
| S&P 500 Daily Risk Control 10% Total Return Index | -3.64 | % | 6.31 | % |
| Volatility Managed Growth Composite | 0.83 | % | 6.52 | % |
| | | |
| The Volatility Managed Moderate Growth Composite Benchmark is an internally constructed index comprised of a blend of 47% Russell 3000 Index, 3% MSCI U.S. REIT, 13% MSCI EAFE Index, 33% Barclays U.S. Aggregate Bond Index and 4% Barclays 3 Month T-Bill Bellwether Index. |
| | | |
The performance data shown represents past performance, does not guarantee future results and assumes reinvestment of all dividends and distributions. All performance data reflects fee waivers and/or expense limitations, if any are in effect; in their absence performance would be lower. See Note B in Notes to Financial Statements. The investment return and principal value of an investment will fluctuate so that an investor’s shares, when redeemed, may be worth more or less than their original cost. Current performance may be lower or higher than the performance data quoted.
Visit calvert.com/institutional-VP-performance.html for current performance data. The gross expense ratio from the current prospectus for the Portfolio is 1.17% (includes Acquired Fund fees). This number may vary from the expense ratio shown elsewhere in this report because it is based on a different time period and, if applicable, does not include fee or expense waivers. The performance data and expense ratio reflect deduction of Portfolio operating expenses, but do not reflect charges and expenses imposed under the variable annuity or life insurance contract.
www.calvert.com CALVERT VP VOLATILITY MANAGED MODERATE GROWTH PORTFOLIO ANNUAL REPORT (UNAUDITED) 3
UNDERSTANDING YOUR FUND'S EXPENSES
As an investor, you incur two types of costs. There are transaction costs. There are also ongoing costs, which generally include management fees, distribution and/or service fees, and other fund expenses. The following information is intended to help you understand your ongoing costs (in dollars) of investing in this mutual fund and to help you compare these costs with the ongoing costs of investing in other mutual funds.
To illustrate these ongoing costs, we have provided examples and calculated the expenses paid by the fund's investors during the period. The actual and hypothetical information presented in the examples is based on an investment of $1,000 invested at the beginning of the period and held for the entire period (July 1, 2015 to December 31, 2015).
Note: Expenses do not reflect charges and expenses of the variable annuity or variable universal life contract.
Actual Expenses
The first line of the table below provides information about actual account values and actual expenses. You may use the information in this line, together with the amount you invested, to estimate the expenses that you paid over the period. Simply divide your account value by $1,000 (for example, an $8,600 account value divided by $1,000 = 8.6), then multiply the result by the number in the first line under the heading entitled “Expenses Paid During Period” to estimate the expenses you paid on your account during this period.
Hypothetical Example for Comparison Purposes
The second line of the table below provides information about hypothetical account values and hypothetical expenses based on the Fund’s actual expense ratio and an assumed rate of return of 5% per year before expenses, which is not the Fund’s actual return. The hypothetical account values and expenses may not be used to estimate the actual ending account balance or expenses you paid for the period. You may use this information to compare the ongoing costs of investing in the Fund and other funds. To do so, compare the 5% hypothetical example with the 5% hypothetical examples that appear in the shareholder reports of the other funds.
Please note that the expenses shown in the table are meant to highlight your ongoing costs only and do not reflect any transactional costs. Therefore, the second line of the table is useful in comparing ongoing costs only, and will not help you determine the relative total costs of owning different funds. In addition, if these transactional costs were included, your costs would have been higher.
|
| | | | |
| | ANNUALIZED
EXPENSE RATIO | BEGINNING
ACCOUNT VALUE
7/1/15 | ENDING
ACCOUNT VALUE
12/31/15 | EXPENSES PAID
DURING PERIOD*
7/1/15 - 12/31/15 |
| | | | | |
| Actual | 0.83% | $1,000.00 | $965.80 | $4.11 |
| Hypothetical (5% return per year before expenses) | 0.83% | $1,000.00 | $1,021.02 | $4.23 |
| |
| * Expenses paid during the period are equal to the annualized expense ratio as indicated above, multiplied by the average account value over the period, multiplied by 184/365 (to reflect the one-half year period). Expenses do not include fees and expenses incurred indirectly from investment in underlying funds. Expense ratios shown in the Financial Highlights represent the actual expenses incurred for the fiscal year. |
4 www.calvert.com CALVERT VP VOLATILITY MANAGED MODERATE GROWTH PORTFOLIO ANNUAL REPORT (UNAUDITED)
REPORT OF INDEPENDENT REGISTERED PUBLIC ACCOUNTING FIRM
The Board of Directors of Calvert Variable Products, Inc. and Shareholders of Calvert VP Volatility Managed Moderate Growth Portfolio:
We have audited the accompanying statement of assets and liabilities, including the schedule of investments, of the Calvert VP Volatility Managed Moderate Growth Portfolio (the “Portfolio”), a series of Calvert Variable Products, Inc., as of December 31, 2015, and the related statement of operations for the year then ended, the statements of changes in net assets for each of the years in the two-year period then ended, and the financial highlights for each of the years or periods in the three-year period then ended. These financial statements and financial highlights are the responsibility of the Portfolio’s management. Our responsibility is to express an opinion on these financial statements and financial highlights based on our audits.
We conducted our audits in accordance with the standards of the Public Company Accounting Oversight Board (United States). Those standards require that we plan and perform the audit to obtain reasonable assurance about whether the financial statements and financial highlights are free of material misstatement. An audit includes examining, on a test basis, evidence supporting the amounts and disclosures in the financial statements. Our procedures included confirmation of securities owned as of December 31, 2015, by correspondence with the custodian and brokers or by performing other appropriate auditing procedures. An audit also includes assessing the accounting principles used and significant estimates made by management, as well as evaluating the overall financial statement presentation. We believe that our audits provide a reasonable basis for our opinion.
In our opinion, the financial statements and financial highlights referred to above present fairly, in all material respects, the financial position of the Portfolio as of December 31, 2015, and the results of its operations for the year then ended, the changes in its net assets for each of the years in the two-year period then ended, and the financial highlights for each of the years or periods in the three-year period then ended, in conformity with U.S. generally accepted accounting principles.
Philadelphia, Pennsylvania
February 24, 2016
www.calvert.com CALVERT VP VOLATILITY MANAGED MODERATE GROWTH PORTFOLIO ANNUAL REPORT 5
CALVERT VP VOLATILITY MANAGED MODERATE GROWTH PORTFOLIO
SCHEDULE OF INVESTMENTS
DECEMBER 31, 2015
|
| | | | |
| | SHARES | VALUE ($) |
| EXCHANGE-TRADED PRODUCTS - 94.4% | | |
| Consumer Staples Select Sector SPDR Fund | 5,400 | 272,646 |
|
| Financial Select Sector SPDR Fund | 13,600 | 323,408 |
|
| iShares Core S&P Mid-Cap ETF | 27,500 | 3,832,950 |
|
| iShares Core U.S. Aggregate Bond ETF | 118,100 | 12,755,981 |
|
| iShares North American Natural Resources ETF | 10,600 | 298,284 |
|
| iShares Russell 2000 ETF | 22,600 | 2,542,726 |
|
| iShares S&P 500 Growth ETF | 43,900 | 5,083,620 |
|
| iShares S&P 500 Value ETF | 57,300 | 5,072,769 |
|
| iShares S&P Mid-Cap 400 Growth ETF | 4,000 | 643,840 |
|
| iShares S&P Mid-Cap 400 Value ETF | 5,500 | 644,600 |
|
| SPDR Barclays High Yield Bond ETF | 10,800 | 366,228 |
|
| Technology Select Sector SPDR Fund | 7,300 | 312,659 |
|
| Vanguard FTSE Developed Markets ETF | 209,600 | 7,696,512 |
|
| Vanguard FTSE Emerging Markets ETF | 18,800 | 614,948 |
|
| Vanguard REIT ETF | 23,600 | 1,881,628 |
|
| Vanguard S&P 500 ETF | 61,600 | 11,514,888 |
|
| Vanguard Total Bond Market ETF | 84,700 | 6,840,372 |
|
| | | |
| Total Exchange-Traded Products (Cost $61,809,646) | | 60,698,059 |
|
| | | |
| | PRINCIPAL
AMOUNT ($) | |
| TIME DEPOSIT - 5.3% | | |
| State Street Bank Time Deposit, 0.278%, 1/4/16 | 3,387,811 | 3,387,811 |
|
| | | |
| Total Time Deposit (Cost $3,387,811) | | 3,387,811 |
|
| | | |
| TOTAL INVESTMENTS (Cost $65,197,457) - 99.7% | | 64,085,870 |
|
| Other assets and liabilities, net - 0.3% | | 223,982 |
|
NET ASSETS - 100.0% | |
| $64,309,852 |
|
|
| | | | | | | | | |
| FUTURES | NUMBER OF
CONTRACTS | EXPIRATION
DATE | UNDERLYING FACE AMOUNT AT VALUE | UNREALIZED
APPRECIATION
(DEPRECIATION) |
| Short: | |
| | E-Mini S&P 500 Index | (18) | 3/16 |
| ($1,831,860 | ) |
| ($24,369 | ) |
| | E-Mini S&P MidCap 400 Index | (4) | 3/16 | (557,400) |
| (8,823) |
|
| | MSCI EAFE Mini Index | (10) | 3/16 | (849,100) |
| (16,158) |
|
| | Russell 2000 Mini Index | (5) | 3/16 | (565,750) |
| (10,724) |
|
| | Total Short | | | |
| ($60,074 | ) |
|
|
| NOTES TO SCHEDULE OF INVESTMENTS |
Abbreviations: ETF: Exchange Traded Fund FTSE: Financial Times Stock Exchange REIT: Real Estate Investment Trust SPDR: Standard and Poor's Depository Receipt |
| See notes to financial statements. |
6 www.calvert.com CALVERT VP VOLATILITY MANAGED MODERATE GROWTH PORTFOLIO ANNUAL REPORT
CALVERT VP VOLATILITY MANAGED MODERATE GROWTH PORTFOLIO
STATEMENT OF ASSETS AND LIABILITIES
DECEMBER 31, 2015
|
| | | |
| ASSETS | |
| Investments in securities, at value (Cost $65,197,457) - see accompanying schedule |
| $64,085,870 |
|
| Cash collateral at broker | 305,109 |
|
| Receivable for shares sold | 41,441 |
|
| Dividends and interest receivable | 2,069 |
|
| Directors' deferred compensation plan | 41,862 |
|
| Total assets | 64,476,351 |
|
| | |
| LIABILITIES | |
| Payable for shares redeemed | 84 |
|
| Payable for futures contracts variation margin | 60,045 |
|
| Payable to Calvert Investment Management, Inc. | 24,352 |
|
| Payable to Calvert Investment Distributors, Inc. | 13,592 |
|
| Payable to Calvert Investment Administrative Services, Inc. | 5,437 |
|
| Payable to Calvert Investment Services, Inc. | 1,550 |
|
| Directors' deferred compensation plan | 41,862 |
|
| Accrued expenses and other liabilities | 19,577 |
|
| Total liabilities | 166,499 |
|
| NET ASSETS |
| $64,309,852 |
|
| | |
| NET ASSETS CONSIST OF: | |
| Paid-in capital applicable to 4,110,413 shares of common stock outstanding; | |
| $0.10 par value, 100,000,000 shares authorized |
| $65,822,271 |
|
| Undistributed net investment income | 102,069 |
|
| Accumulated net realized gain (loss) | (442,827) |
|
| Net unrealized appreciation (depreciation) | (1,171,661) |
|
| NET ASSETS |
| $64,309,852 |
|
| | |
| NET ASSET VALUE PER SHARE |
| $15.65 |
|
| See notes to financial statements. | |
www.calvert.com CALVERT VP VOLATILITY MANAGED MODERATE GROWTH PORTFOLIO ANNUAL REPORT 7
CALVERT VP VOLATILITY MANAGED MODERATE GROWTH PORTFOLIO
STATEMENT OF OPERATIONS
YEAR ENDED DECEMBER 31, 2015
|
| | | |
| NET INVESTMENT INCOME | |
| Investment Income: | |
| Dividend income |
| $1,184,553 |
|
| Interest income | 2,838 |
|
| Total investment income | 1,187,391 |
|
| | |
| Expenses: | |
| Investment advisory fee | 216,021 |
|
| Administrative fees | 51,434 |
|
| Transfer agency fees and expenses | 5,503 |
|
| Distribution Plan expenses | 128,584 |
|
| Directors' fees and expenses | 9,719 |
|
| Accounting fees | 12,157 |
|
| Custodian fees | 19,142 |
|
| Professional fees | 13,990 |
|
| Reports to shareholders | 1,520 |
|
| Miscellaneous | 4,416 |
|
| Total expenses | 462,486 |
|
| Reimbursement from Advisor | (35,587) |
|
| Net expenses | 426,899 |
|
| NET INVESTMENT INCOME | 760,492 |
|
| | |
| | |
| REALIZED AND UNREALIZED GAIN (LOSS) | |
| Net realized gain (loss) on: | |
| Investments | 545,220 |
|
| Futures | (949,734) |
|
| | (404,514) |
|
| | |
| Change in unrealized appreciation (depreciation) on: | |
| Investments | (2,327,268) |
|
| Futures | (111,079) |
|
| | (2,438,347) |
|
| | |
| NET REALIZED AND UNREALIZED GAIN (LOSS) | (2,842,861) |
|
| | |
| INCREASE (DECREASE) IN NET ASSETS RESULTING FROM OPERATIONS | ($2,082,369) |
| See notes to financial statements. | |
8 www.calvert.com CALVERT VP VOLATILITY MANAGED MODERATE GROWTH PORTFOLIO ANNUAL REPORT
CALVERT VP VOLATILITY MANAGED MODERATE GROWTH PORTFOLIO
STATEMENTS OF CHANGES IN NET ASSETS
|
| | | | | | | |
| INCREASE (DECREASE) IN NET ASSETS | YEAR ENDED
DECEMBER 31, 2015 | | YEAR ENDED
DECEMBER 31, 2014 |
| Operations: | | | |
| Net investment income |
| $760,492 |
| |
| $379,167 |
|
| Net realized gain (loss) | (404,514) |
| | 422,838 |
|
| Change in unrealized appreciation (depreciation) | (2,438,347) |
| | 789,111 |
|
| | | | |
| INCREASE (DECREASE) IN NET ASSETS RESULTING FROM OPERATIONS | (2,082,369) |
| | 1,591,116 |
|
| | | | |
| Distributions to shareholders from: | | | |
| Net investment income | (633,002) |
| | (365,942) |
|
| Net realized gain | (99,334) |
| | (386,762) |
|
| Total distributions | (732,336) |
| | (752,704) |
|
| | | | |
| Capital share transactions: | | | |
| Shares sold | 34,613,871 |
| | 22,105,955 |
|
| Reinvestment of distributions | 732,336 |
| | 705,557 |
|
| Shares redeemed | (3,649,856) |
| | (1,880,670) |
|
| Total capital share transactions | 31,696,351 |
| | 20,930,842 |
|
| | | | |
| TOTAL INCREASE (DECREASE) IN NET ASSETS | 28,881,646 |
| | 21,769,254 |
|
| | | | |
| | | | |
| NET ASSETS | | | |
| Beginning of year | 35,428,206 |
| | 13,658,952 |
|
| End of year (including undistributed net investment income of $102,069 and $0, respectively) |
| $64,309,852 |
| |
| $35,428,206 |
|
| | | | |
| CAPITAL SHARE ACTIVITY | | | |
| Shares sold | 2,104,777 |
| | 1,376,925 |
|
| Reinvestment of distributions | 46,380 |
| | 43,259 |
|
| Shares redeemed | (227,508) |
| | (116,147) |
|
| Total capital share activity | 1,923,649 |
| | 1,304,037 |
|
| See notes to financial statements. |
www.calvert.com CALVERT VP VOLATILITY MANAGED MODERATE GROWTH PORTFOLIO ANNUAL REPORT 9
NOTES TO FINANCIAL STATEMENTS
NOTE A — SIGNIFICANT ACCOUNTING POLICIES
General: Calvert VP Volatility Managed Moderate Growth Portfolio (the “Portfolio”), a series of Calvert Variable Products, Inc. (the “Fund”), is registered under the Investment Company Act of 1940 as a diversified, open-end management investment company. The Fund is comprised of eleven separate portfolios. The operations of each series of the Fund are accounted for separately. The Portfolio applies the accounting and reporting guidance in the Financial Accounting Standards Board (FASB) Accounting Standards Codification Topic 946, Financial Services – Investment Companies (ASC 946).
The Portfolio offers Class F shares, which are subject to Distribution Plan expenses. Shares of the Portfolio are sold without sales charge to affiliated and unaffiliated insurance companies for allocation to certain of their variable separate accounts. The Portfolio invests primarily in exchange traded funds representing a broad range of asset classes (the “Underlying Funds”) and derivatives to manage overall portfolio volatility.
Security Valuation: Net asset value per share is determined every business day as of the close of the regular session of the New York Stock Exchange (generally 4:00 p.m. Eastern time). The Portfolio uses independent pricing services approved by the Board of Directors (“the Board”) to value its investments wherever possible. Investments for which market quotations are not available or deemed not reliable are fair valued in good faith under the direction of the Board.
The Board has adopted Valuation Procedures (the “Procedures”) to determine the fair value of securities and other financial instruments for which market prices are not readily available or which may not be reliably priced. The Board has delegated the day-to-day responsibility for determining the fair value of assets of the Portfolio to Calvert Investment Management, Inc. (the “Advisor” or “Calvert”) and has provided these Procedures to govern Calvert in its valuation duties.
Calvert has chartered an internal Valuation Committee to oversee the implementation of these Procedures and to assist it in carrying out the valuation responsibilities that the Board has delegated.
The Valuation Committee meets on a regular basis to review illiquid securities and other investments which may not have readily available market prices. The Valuation Committee’s fair valuation determinations are subject to review, approval and ratification by the Board at its next regularly scheduled meeting covering the calendar quarter in which the fair valuation was determined.
The Valuation Committee utilizes various methods to measure the fair value of the Portfolio’s investments. U.S. generally accepted accounting principles (GAAP) establishes a disclosure hierarchy that categorizes the inputs to valuation techniques used to value assets and liabilities at measurement date. These inputs are summarized in the three broad levels listed below:
Level 1 - quoted prices in active markets for identical securities
Level 2 - other significant observable inputs (including quoted prices for similar securities, interest rates, prepayment speeds, credit risk, etc.)
Level 3 - significant unobservable inputs (including the Portfolio’s own assumptions in determining the fair value of investments)
The inputs or methodologies used for valuing securities are not necessarily an indication of the risk associated with investing in those securities.
Changes in valuation techniques may result in transfers in or out of an investment’s assigned level within the hierarchy during the year. Transfers in and/or out of levels are determined based on the fair value of such securities at the end of the year. Valuation techniques used to value the Portfolio’s investments by major category are as follows:
Exchange-traded products are valued at the official closing price as reported by an independent pricing service on the primary market or exchange on which they are traded and are categorized as Level 1 in the hierarchy.
Short-term securities of sufficient credit quality with remaining maturities of sixty days or less for which quotations are not readily available are valued at amortized cost, which approximates fair value, and are categorized as Level 2 in the hierarchy.
10 www.calvert.com CALVERT VP VOLATILITY MANAGED MODERATE GROWTH PORTFOLIO ANNUAL REPORT
Futures contracts are valued at unrealized appreciation (depreciation) based on the settlement price established each day by the board of trade or exchange on which they are traded and are categorized as Level 1 in the hierarchy.
If a market value cannot be determined for a security using the methodologies described above, or if, in the good faith opinion of the Advisor, the market value does not constitute a readily available market quotation, or if a significant event has occurred that would materially affect the value of the security, the security will be fair valued as determined in good faith by the Valuation Committee.
The Valuation Committee considers a number of factors, including significant unobservable valuation inputs when arriving at fair value. It considers all significant facts that are reasonably available and relevant to the determination of fair value.
The Valuation Committee primarily employs a market-based approach which may use related or comparable assets or liabilities, recent transactions, market multiples, book values, and other relevant information for the investment to determine the fair value of the investment. When more appropriate, the Portfolio may employ an income-based or cost approach. An income-based valuation approach discounts anticipated future cash flows of the investment to calculate a present amount (discounted). The measurement is based on the value indicated by current market expectations about those future amounts. Discounts may also be applied due to the nature or duration of any restrictions on the disposition of the investments. A cost based approach is based on the amount that currently would be required to replace the service capacity of an asset (current replacement cost). From the seller’s perspective, the price that would be received for the asset is determined based on the cost to a buyer to acquire or construct a substitute asset of comparable utility, adjusted for obsolescence.
The values assigned to fair value investments are based on available information and do not necessarily represent amounts that might ultimately be realized. Further, due to the inherent uncertainty of valuations of such investments, the fair values may differ significantly from the values that would have been used had an active market existed, and the differences could be material. The Valuation Committee employs various methods for calibrating these valuation approaches including a regular review of key inputs and assumptions, transactional back-testing or disposition analysis and reviews of any related market activity.
At December 31, 2015, no securities were fair valued in good faith under the direction of the Board.
The following table summarizes the market value of the Portfolio's holdings as of December 31, 2015, based on the inputs used to value them:
|
| | | | | | | | | | | |
| | VALUATION INPUTS |
| INVESTMENTS IN SECURITIES* | LEVEL 1 | LEVEL 2 | LEVEL 3 | TOTAL |
| Exchange-Traded Products |
| $60,698,059 |
| $— |
| $— |
|
| $60,698,059 |
|
| Time Deposit | — |
| 3,387,811 |
| — |
| 3,387,811 |
|
| TOTAL |
| $60,698,059 |
|
| $3,387,811 |
| $— |
|
| $64,085,870 |
|
| Futures Contracts** |
| ($60,074 | ) | $— |
| $— |
|
| ($60,074 | ) |
| |
| * For a complete listing of investments, please refer to the Schedule of Investments. |
| ** The value listed for these securities reflects unrealized appreciation (depreciation) as shown on the Schedule of Investments. |
There were no transfers between levels during the year.
Futures Contracts: The Portfolio may purchase and sell futures contracts to manage overall portfolio volatility. These futures contracts may include, but are not limited to, futures contracts based on U.S. government obligations and market index futures contracts. The Portfolio may enter into futures contracts agreeing to buy or sell a financial instrument for a set price at a future date. Initial margin deposits of either cash or securities as required by the broker are made upon entering into the contract. While the contract is open, daily variation margin payments are made to or received from the broker reflecting the daily change in market value of the contract and are recorded for financial reporting purposes as unrealized gains or losses by the Portfolio. When a futures contract is closed, a realized gain or loss is recorded equal to the difference between the opening and closing value of the contract. The risks associated with entering into futures contracts may include the possible illiquidity of the secondary market which would limit the Portfolio’s ability to close out a futures contract prior to the settlement date, an imperfect correlation between the value of the contracts and the
www.calvert.com CALVERT VP VOLATILITY MANAGED MODERATE GROWTH PORTFOLIO ANNUAL REPORT 11
underlying financial instruments, or that the counterparty will fail to perform its obligations under the contracts’ terms. Futures contracts are designed by boards of trade which are designated “contracts markets” by the Commodities Futures Trading Commission. Futures contracts trade on the contracts markets in a manner that is similar to the way a stock trades on a stock exchange, and the boards of trade, through their clearing corporations, guarantee the futures contracts against default. As a result, there is minimal counterparty credit risk to the Portfolio. During the year, futures contracts were used to adjust the Portfolio’s overall equity exposure in an effort to stabilize portfolio volatility around a target level. The Portfolio’s futures contracts at year end are presented in the Schedule of Investments.
At December 31, 2015, the Portfolio had the following derivatives, categorized by risk exposure:
|
| | | | |
| Risk | Statement of Assets and Liabilities | Assets | Statement of Assets and Liabilities | Liabilities |
| Equity | Unrealized appreciation on futures contracts | $—* | Unrealized depreciation on futures contracts | ($60,074)* |
| * Only the current day’s variation margin is reported within the Statement of Assets and Liabilities. |
The effect of derivative instruments on the Statement of Operations for the year ended December 31, 2015 was as follows:
|
| | | |
| | Statement of Operations Location |
| Risk | Derivatives | Net Realized Gain (Loss) | Net Change in Unrealized appreciation (depreciation) |
| Equity | Futures | ($949,734) | ($111,079) |
During the year, the Portfolio invested in MSCI EAFE Mini Index, Russell 2000 Mini Index, E-Mini S&P MidCap 400 Index, and E-Mini S&P 500 Index futures. The volume of outstanding contracts has varied throughout the year with an average number of contracts as in the following table:
|
| |
| Derivative Description | Average Number of Contracts* |
| Futures contracts long | 23 |
| Futures contracts short | (15) |
| | |
| *Averages are based on activity levels during the year ended December 31, 2015. |
Security Transactions and Investment Income: Security transactions, normally purchases and sales of shares of the Underlying Funds, are accounted for on trade date. Realized gains and losses are recorded on an identified cost basis and may include proceeds from litigation. Income and capital gain distributions from the Underlying Funds, if any, are recorded on ex-dividend date. Distributions received on securities that represent a return of capital are recorded as a reduction of cost of investments. Distributions received on securities that represent a capital gain are recorded as a realized gain. Interest income, which includes amortization of premium and accretion of discount on debt securities, is accrued as earned. Expenses included in the accompanying financial statements reflect the expenses of the Portfolio and do not include any expenses associated with the Underlying Funds.
Distributions to Shareholders: Distributions to shareholders are recorded by the Portfolio on ex-dividend date. Dividends from net investment income and distributions from net realized capital gains, if any, are paid at least annually. Distributions are determined in accordance with income tax regulations which may differ from U.S. generally accepted accounting principles; accordingly, periodic reclassifications are made within the Portfolio's capital accounts to reflect income and gains available for distribution under income tax regulations.
Estimates: The preparation of financial statements in conformity with U.S. generally accepted accounting principles requires management to make estimates and assumptions that affect the reported amounts of assets and liabilities and disclosure of contingent assets and liabilities at the date of the financial statements and the reported amounts of increases and decreases in net assets from operations during the reporting period. Actual results could differ from those estimates.
Federal Income Taxes: No provision for federal income or excise tax is required since the Portfolio intends to continue to qualify as a regulated investment company under the Internal Revenue Code and to distribute substantially all of its taxable earnings.
12 www.calvert.com CALVERT VP VOLATILITY MANAGED MODERATE GROWTH PORTFOLIO ANNUAL REPORT
Management has analyzed the Portfolio's tax positions taken for all open federal income tax years and has concluded that no provision for federal income tax is required in the Portfolio's financial statements. A Portfolio's federal tax return is subject to examination by the Internal Revenue Service for a period of three years.
NOTE B — RELATED PARTY TRANSACTIONS
Calvert Investment Management, Inc. (the “Advisor”) is wholly-owned by Calvert Investments, Inc., which is indirectly wholly-owned by Ameritas Mutual Holding Company. The Advisor provides investment advisory services and pays the salaries and fees of officers and Directors of the Fund who are employees of the Advisor or its affiliates. For its services, the Advisor receives an annual fee, payable monthly of 0.42% of the Portfolio’s average daily net assets.
The Advisor has contractually agreed to limit net annual portfolio operating expenses through April 30, 2016. The contractual expense cap is 0.83%. For the purpose of this expense limit, operating expenses do not include interest expense, brokerage commissions, taxes, and extraordinary expenses. This expense limitation does not limit fees and expenses associated with the Underlying Funds.
Calvert Investment Administrative Services, Inc. ("CIAS"), an affiliate of the Advisor, provides administrative services to the Portfolio for an annual fee, payable monthly, of 0.10% of the Portfolio’s average daily net assets.
On November 24, 2015, the Board of Directors approved the recommendation made by CIAS to standardize and rationalize the administrative fee paid by the Calvert Funds at 0.12% for all series and all share classes of the Calvert Funds. CIAS and the Portfolio have entered into an Amended and Restated Administrative Services Agreement that will establish a 0.12% administrative fee commencing on May 1, 2016. CIAS has contractually agreed to waive 0.02% (the difference between the current administrative fee and the new 0.12% fee) from May 1, 2016 through April 30, 2018.
Calvert Investment Distributors, Inc. (“CID”), an affiliate of the Advisor, is the distributor and principal underwriter for the Portfolio. Pursuant to Rule 12b-1 under the Investment Company Act of 1940, the Portfolio has adopted a Distribution Plan that permits the Portfolio to pay certain expenses associated with the distribution and servicing of its Class F shares. The expenses paid may not exceed 0.25% annually of the average daily net assets of Class F.
Calvert Investment Services, Inc. (“CIS”), an affiliate of the Advisor, acts as shareholder servicing agent for the Portfolio. For its services, CIS received a fee of $3,858 for the year ended December 31, 2015. Boston Financial Data Services, Inc. is the transfer and dividend disbursing agent.
Each Director of the Fund who is not an employee of the Advisor or its affiliates receives a fee of $1,500 for each Board and Committee meeting attended plus an annual fee of $44,000. Committee chairs receive an additional $5,000 annual retainer. Eligible Directors may participate in a Deferred Compensation Plan (the “Plan”). Obligations of the Plan will be paid solely out of the Portfolio’s assets. Directors’ fees are allocated to each of the portfolios served.
NOTE C — INVESTMENT ACTIVITY AND TAX INFORMATION
During the year, the cost of purchases and proceeds from sales of investments, other than short-term securities, were $36,218,038 and $7,572,418, respectively.
|
| | | |
| Capital Loss Carryforwards | |
| NO EXPIRATION DATE | |
| Short-term |
| ($292,524 | ) |
Under the Regulated Investment Company Modernization Act of 2010, capital losses incurred in taxable years beginning after December 22, 2010 can be carried forward to offset future capital gains for an unlimited period. These losses will retain their character as either long-term or short-term.
The tax character of dividends and distributions paid during the years ended December 31, 2015 and December 31, 2014 was as follows:
|
| | | | | | |
| DISTRIBUTIONS PAID FROM: | 2015 |
| 2014 |
|
| Ordinary income |
| $639,167 |
|
| $662,782 |
|
| Long-term capital gains | 93,169 |
| 89,922 |
|
| Total |
| $732,336 |
|
| $752,704 |
|
www.calvert.com CALVERT VP VOLATILITY MANAGED MODERATE GROWTH PORTFOLIO ANNUAL REPORT 13
As of December 31, 2015, the tax basis components of distributable earnings/(accumulated losses) and the federal tax cost were as follows:
|
| | | |
| Unrealized appreciation |
| $463,670 |
|
| Unrealized (depreciation) | (1,580,255) |
|
| Net unrealized appreciation (depreciation) |
| ($1,116,585 | ) |
| Undistributed ordinary income |
| $102,069 |
|
| Capital loss carryforward |
| ($292,524 | ) |
| Late year ordinary and post October capital loss deferrals |
| ($205,379 | ) |
| Federal income tax cost of investments |
| $65,202,455 |
|
The differences between the components of distributable earnings on a tax basis and the amounts reflected in the Statement of Assets and Liabilities are primarily due to temporary book-tax differences that will reverse in a subsequent period. These differences are mainly due to wash sales, Section 1256 futures contracts, real estate investment trust adjustments and loss deferral.
Reclassifications, as shown in the table below, have been made to the Portfolio's components of net assets to reflect income and gains available for distribution (or available capital loss carryovers, as applicable) under income tax law and regulations. These reclassifications are due to permanent book-tax differences and have no impact on net assets. The primary permanent differences causing such reclassifications for the Portfolio are due to distribution recharacterizations.
|
| | | |
| Undistributed net investment income |
| ($25,421 | ) |
| Accumulated net realized gain (loss) | 25,421 |
|
NOTE D — LINE OF CREDIT
A financing agreement is in place with the Calvert Funds and State Street Corporation (“SSC”). Under the agreement, SSC provides an unsecured line of credit facility, in the aggregate amount of $50 million ($25 million committed and $25 million uncommitted), accessible by the Calvert Funds for temporary or emergency purposes only. Borrowings bear interest at the higher of the London Interbank Offered Rate (LIBOR) or the overnight Federal Funds Rate plus 1.25% per annum. A commitment fee of 0.20% per annum is incurred on the unused portion of the committed facility. An administrative fee of $25,000 was paid in connection with the uncommitted facility. These fees are allocated to all participating funds. The Portfolio had no borrowings under the agreement during the year ended December 31, 2015.
NOTE E — SUBSEQUENT EVENTS
In preparing the financial statements as of December 31, 2015, no subsequent events or transactions occurred that would have required recognition or disclosure in these financial statements.
NOTICE TO SHAREHOLDERS (UNAUDITED)
For the fiscal year ended December 31, 2015, the Portfolio reports the maximum amount allowable of its net taxable income as eligible for the corporate dividends-received deduction. The Portfolio also considers $93,169 of the long-term capital gain distributions paid during the year as capital gain dividends in accordance with Section 852(b)(3)(C) of the Internal Revenue Code.
14 www.calvert.com CALVERT VP VOLATILITY MANAGED MODERATE GROWTH PORTFOLIO ANNUAL REPORT
CALVERT VP VOLATILITY MANAGED MODERATE GROWTH PORTFOLIO
FINANCIAL HIGHLIGHTS
|
| | | | | | | | | | | | |
| | PERIODS ENDED | |
| | December 31, 2015 (a) | | December 31, 2014 (a) | | December 31, 2013 (a)(b) | |
| Net asset value, beginning |
| $16.20 |
| |
| $15.47 |
| |
| $15.00 |
| |
| Income from investment operations: | | | | | | |
| Net investment income | 0.24 |
| | 0.26 |
| | 0.20 |
| |
| Net realized and unrealized gain (loss) | (0.61) |
| | 0.82 |
| | 0.39 |
| |
| Total from investment operations | (0.37) |
| | 1.08 |
| | 0.59 |
| |
| Distributions from: | | | | | | |
| Net investment income | (0.16) |
| | (0.17) |
| | (0.12) |
| |
| Net realized gain | (0.02) |
| | (0.18) |
| | — |
| |
| Total distributions | (0.18) |
| | (0.35) |
| | (0.12) |
| |
| Total increase (decrease) in net asset value | (0.55) |
| | 0.73 |
| | 0.47 |
| |
| Net asset value, ending |
| $15.65 |
| |
| $16.20 |
| |
| $15.47 |
| |
| Total return(c) | (2.29 | %) | | 6.99 | % | | 3.94 | % | |
| Ratios to average net assets: (d)(e) | | | | | | |
| Net investment income | 1.48 | % | | 1.64 | % | | 2.06%(f) |
| |
| Total expenses | 0.90 | % | | 1.06 | % | | 1.41%(f) |
| |
| Net expenses | 0.83 | % | | 0.83 | % | | 0.83%(f) |
| |
| Portfolio turnover | 16 | % | | 46 | % | | 6 | % | |
| Net assets, ending (in thousands) |
| $64,310 |
| |
| $35,428 |
| |
| $13,659 |
| |
| | | | | | | |
| (a)Per share figures are calculated using the Average Shares Method. |
(b)From April 30, 2013 inception. (c) Total return is not annualized for periods of less than one year and does not reflect charges and expenses of the variable annuity or variable universal life contract. |
| (d)Total expenses do not reflect amounts reimbursed and/or waived by the Advisor and certain of its affiliates, if applicable. Net expenses are net of all reductions and represent the net expenses paid by the Portfolio. |
| (e)Amounts do not include the income or expenses of the Underlying Funds. |
| (f)Annualized. |
| See notes to financial statements. |
www.calvert.com CALVERT VP VOLATILITY MANAGED MODERATE GROWTH PORTFOLIO ANNUAL REPORT 15
PROXY VOTING
The Proxy Voting Guidelines that the Portfolio uses to determine how to vote proxies relating to portfolio securities is provided as an Appendix to the Fund’s Statement of Additional Information. The Statement of Additional Information can be obtained free of charge by calling the Fund at 1-800-368-2745, by visiting the Calvert website at www.calvert.com or by visiting the SEC’s website at www.sec.gov.
Information regarding how the Fund voted proxies relating to portfolio securities during the most recent 12-month period ended June 30 is available by calling the Fund, by visiting the Calvert website at www.calvert.com or visiting the SEC’s website at www.sec.gov.
AVAILABILITY OF QUARTERLY PORTFOLIO HOLDINGS
The Fund files its complete schedule of portfolio holdings with the SEC for the first and third quarters of each fiscal year on Form N-Q. The Fund’s Form N-Q is available on the SEC’s website at www.sec.gov. The Fund’s Form N-Q may be reviewed and copied at the SEC’s Public Reference Room in Washington, DC; information on the operation of the Public Reference Room may be obtained by calling 1-800-SEC-0330.
BASIS FOR BOARD'S APPROVAL OF INVESTMENT ADVISORY CONTRACTS
At a meeting held on December 9, 2015, the Board of Directors, and by a separate vote, the disinterested Directors, approved the continuance of the Investment Advisory Agreement between the Portfolio and the Advisor and the Investment Subadvisory Agreements between the Advisor and each Subadvisor with respect to the Portfolio.
In evaluating the Investment Advisory Agreement, the Board considered a variety of information relating to the Portfolio and the Advisor. The disinterested Directors reviewed a report prepared by the Advisor regarding various services provided to the Portfolio by the Advisor and its affiliates. Such report included, among other data, information regarding the Advisor's personnel and the Advisor's revenue and cost of providing services to the Portfolio, and a separate report prepared by an independent third party, which provided a statistical analysis comparing the Portfolio's investment performance, expenses, and fees to comparable mutual funds.
The disinterested Directors were separately represented by independent legal counsel with respect to their consideration of the reapproval of the Investment Advisory Agreement and each of the Investment Subadvisory Agreements. Prior to voting, the disinterested Directors reviewed the proposed continuance of the Investment Advisory Agreement and Investment Subadvisory Agreements with management and also met in private sessions with their counsel at which no representatives of management were present.
In the course of its deliberations regarding the Investment Advisory Agreement, the Board considered the following factors, among others: the nature, extent and quality of the services provided by the Advisor, including the personnel providing such services; the Advisor's financial condition; the level and method of computing the Portfolio's advisory fee; comparative performance, fee and expense information for the Portfolio; the profitability of the Calvert Family of Funds to the Advisor and its affiliates; the allocation of the Portfolio's brokerage, including the Advisor's process for monitoring "best execution"; the direct and indirect benefits, if any, derived by the Advisor and its affiliates from their relationship with the Portfolio; the effect of the Portfolio's growth and size on the Portfolio's performance and expenses; the Advisor's compliance programs and policies; the Advisor's performance of substantially similar duties for other funds; and any possible conflicts of interest.
In considering the nature, extent and quality of the services provided by the Advisor under the Investment Advisory Agreement, the Board reviewed information provided by the Advisor relating to its operations and personnel, including, among other information, biographical information on the Advisor's supervisory and professional staff and descriptions of its organizational and management structure. The Board also took into account similar information provided periodically throughout the previous year by the Advisor, as well as the Board’s familiarity with the Advisor’s management through Board of Directors' meetings, discussions and other reports. The Board considered the Advisor's current level of staffing and overall resources. The Board also noted that it reviewed on a quarterly basis information regarding the Advisor’s compliance with applicable policies and procedures, including those related to personal investing. The Advisor's administrative capabilities, including its ability to supervise the other service providers for the Portfolio, were also considered. The Board discussed the Advisor's effectiveness in monitoring the performance of each Subadvisor and its timeliness in responding to performance issues. The Board observed that the scope of services provided by the Advisor
16 www.calvert.com CALVERT VP VOLATILITY MANAGED MODERATE GROWTH PORTFOLIO ANNUAL REPORT (UNAUDITED)
generally had expanded over time as a result of regulatory, market and other changes. The Board took into consideration, among other factors, the effectiveness of the Portfolio’s and Advisor’s processes, policies and procedures and the Advisor’s personnel. The Board also took into account, among other items, periodic reports received from the Advisor over the past year concerning the Advisor’s ongoing review and enhancement of certain processes, policies and procedures of the Portfolio and the Advisor. The Board concluded that it was satisfied with the nature, extent and quality of services provided to the Portfolio by the Advisor under the Investment Advisory Agreement.
In considering the Portfolio's performance, the Board noted that it reviewed on a quarterly basis detailed information about the Portfolio's performance results, portfolio composition and investment strategies. In addition, the Board took into account overall financial market conditions. The Board also reviewed various comparative data provided to it in connection with its consideration of the renewal of the Investment Advisory Agreement, including, among other information, a comparison of the Portfolio's total return with its Lipper index and with that of other mutual funds deemed to be in its peer universe by an independent third party in its report. This comparison indicated that the Portfolio performed above the median of its peer universe for the one-year period ended June 30, 2015. The data also indicated that the Portfolio underperformed its Lipper index for the one-year period ended June 30, 2015. The Board also took into account management’s discussion of the Portfolio’s performance and management’s statement that the Portfolio had performed in-line with expectations. Based upon its review, the Board concluded that the Portfolio’s performance was satisfactory based on the Portfolio’s investment strategy.
In considering the Portfolio's fees and expenses, the Board compared the Portfolio's fees and total expense ratio with various comparative data for the funds in its peer universe. Among other findings, the data indicated that the Portfolio’s advisory fee (after taking into account waivers and/or reimbursements) was below the median of its peer universe for the period ended June 30, 2015, and that total expenses (net of waivers and/or reimbursements) were below the median of its peer universe. The Board noted that the allocation of advisory and administrative fees may vary among the Portfolio’s peer universe. The Board also took into account the Advisor’s current undertaking to maintain expense limitations for the Portfolio. The Board noted that the Advisor paid each Subadvisor’s subadvisory fee under the Investment Subadvisory Agreement with respect to the Portfolio and that the Advisor is currently reimbursing a portion of the expenses of the Portfolio. The Board also took into account management's discussion of the Portfolio's expenses and certain factors that affected the level of such expenses, including the current size of the Portfolio. Based upon its review, the Board determined that the advisory fee was reasonable in view of the quality of services received by the Portfolio from the Advisor and the other factors considered.
The Board reviewed the Advisor’s profitability on a portfolio-by-portfolio basis. In reviewing the overall profitability of the advisory fee to the Portfolio's Advisor, the Board also considered the fact that affiliates of the Advisor provided shareholder servicing and administrative services to the Portfolio for which they received compensation. The information considered by the Board included Calvert’s operating profit margin information both before and after tax expenses with respect to the services that the Advisor and its affiliates provided to the Calvert Family of Funds complex. The Board reviewed the profitability of the Advisor's relationship with the Portfolio in terms of the total amount of annual advisory fees it received with respect to the Portfolio and whether the Advisor had the financial wherewithal to continue to provide services to the Portfolio. The Board also considered that the Advisor derived benefits to its reputation and other indirect benefits from its relationship with the Portfolio. In addition, the Board took into account that affiliates of the Advisor may benefit from certain indirect tax benefits relating to dividend received deductions and foreign tax credits. The Board also noted that the Advisor paid the subadvisory fee to each Subadvisor, including Ameritas Investment Partners, Inc. (“AIP”), an affiliate of the Advisor, and is currently reimbursing the expenses of the Portfolio. Based upon its review, the Board concluded that the Advisor’s and its affiliates’ level of profitability from their relationship with the Portfolio was reasonable.
The Board considered the effect of the Portfolio's current size and potential growth on its performance and fees. Although the Portfolio’s advisory fee did not contain breakpoints that would reduce the advisory fee rate on assets above specified asset levels, the Board noted that if the Portfolio’s assets increased over time, the Portfolio might realize other economies of scale if assets increased proportionally more than certain other expenses. The Board also noted that given the Portfolio’s current level of assets, the Portfolio would be unlikely to recognize economies of scale by implementing a breakpoint in the advisory fee at this time.
In reapproving the Investment Advisory Agreement, the Board, including the disinterested Directors, did not identify any single factor as controlling, and each Director may have attributed different weight to various factors.
www.calvert.com CALVERT VP VOLATILITY MANAGED MODERATE GROWTH PORTFOLIO ANNUAL REPORT (UNAUDITED) 17
In evaluating the Investment Subadvisory Agreements, the disinterested Directors reviewed information provided by each Subadvisor relating to its operations, personnel, investment philosophy, strategies and techniques. Among other information, each Subadvisor provided biographical information on portfolio management and other professional staff, performance information for itself, and descriptions of its investment philosophies, strategies and techniques, organizational and management structures and brokerage policies and practices.
The Board reapproved the Investment Subadvisory Agreement between each Subadvisor and the Advisor based on a number of factors relating to the Subadvisor's ability to perform under the Investment Subadvisory Agreement. In the course of its deliberations, the Board evaluated, among other factors: the nature, extent and the quality of the services to be provided by each Subadvisor; each Subadvisor's management style and long-term performance record; the Portfolio's performance record and each Subadvisor's performance in employing its investment strategies; each Subadvisor's current level of staffing and its overall resources; the qualifications and experience of each Subadvisor's personnel; each Subadvisor's financial condition with respect to its ability to perform the services required under the Investment Subadvisory Agreement; each Subadvisor's risk management processes; each Subadvisor's compliance systems, including those related to personal investing; and any disciplinary history. Based upon its review, the Board concluded that it was satisfied with the nature, extent and quality of services provided to the Portfolio by each Subadvisor under the Investment Subadvisory Agreements.
As noted above, the Board considered, among other information, the Portfolio's performance during the one-year period ended June 30, 2015, as compared to the Portfolio's peer universe and noted that it reviewed on a quarterly basis detailed information about the Portfolio's performance results, portfolio composition and investment strategies. The Board noted the Advisor's expertise and resources in monitoring the performance, investment style and risk adjusted performance of each Subadvisor.
In considering the cost of services to be provided by each Subadvisor and the profitability to each Subadvisor of its relationship with the Portfolio, the Board noted that the Advisor and AIP were affiliated, and the subadvisory fee under each Investment Subadvisory Agreement was paid by the Advisor out of the advisory fee that the Advisor received under the Investment Advisory Agreement. The Board also relied on the ability of the Advisor to negotiate the Investment Subadvisory Agreement with Milliman Financial Risk Management LLC (“Milliman”) and the corresponding subadvisory fee at arm’s length. In addition, the Board took into account the fees Milliman charged to its other clients and considered these fee comparisons in light of the differences in managing these other accounts. Based upon its review, the Board determined that the subadvisory fee was reasonable in view of the quality of services received by the Portfolio from each Subadvisor and the other factors considered. Because the Advisor would pay each Subadvisor’s subadvisory fee, the cost of services to be provided by each Subadvisor and the level of profitability to each Subadvisor from its relationship with the Portfolio were not material factors in the Board’s deliberations. For similar reasons, the Board did not consider the potential economies of scale in each Subadvisor’s management of the Portfolio to be a material factor in its consideration.
In reapproving the Investment Subadvisory Agreements, the Board, including the disinterested Directors, did not identify any single factor as controlling, and each Director may have attributed different weight to various factors.
Conclusions
The Board reached the following conclusions regarding the Investment Advisory Agreement and the Investment Subadvisory Agreements, among others: (a) the Advisor has demonstrated that it possesses the capability and resources to perform the duties required of it under the Investment Advisory Agreement; (b) each Subadvisor is qualified to manage the Portfolio's assets in accordance with the Portfolio’s investment objective and policies; (c) the Advisor and each Subadvisor maintain appropriate compliance programs; (d) each Subadvisor is likely to execute its investment strategies consistently over time; (e) the performance of the Portfolio is satisfactory based on the Portfolio’s investment strategy; and (f) the Portfolio's advisory and subadvisory fees are reasonable in view of the quality of services received by the Portfolio from the Advisor and Subadvisors and the other factors considered. Based on its conclusions, the Board determined that reapproval of the Investment Advisory Agreement and the Investment Subadvisory Agreements would be in the best interests of the Portfolio and its shareholders.
18 www.calvert.com CALVERT VP VOLATILITY MANAGED MODERATE GROWTH PORTFOLIO ANNUAL REPORT (UNAUDITED)
DIRECTOR AND OFFICER INFORMATION TABLE
|
| | | | | |
| Name & Age | Position with Fund | Position Start Date | Principal Occupation During Last 5 Years | # of Calvert Portfolios Overseen | Other Directorships |
| INDEPENDENT DIRECTORS |
FRANK H. BLATZ, JR., Esq. AGE: 80 | Director | 1982 CVS
2008 CVP | Of counsel to firm of Schiller & Pittenger, P.C. | 13 | None |
ALICE GRESHAM BULLOCK AGE: 65 | Director | 1999 CVS
2008 CVP | Professor at Howard University School of Law. She is former Dean of Howard University School of Law and Deputy Director of the Association of American Law Schools. | 15 | None |
M. CHARITO KRUVANT AGE: 70 | Director | 1999 CVS
2008 CVP | President and CEO of Creative Associates International, Inc., a firm that specializes in human resources development, information management, public affairs and private enterprise development. | 22 | • Acacia Federal Savings Bank (through 2013) • Summit Foundation • WETA Public Broadcasting |
CYNTHIA MILLIGAN AGE: 69
| Director | 1999 CVS
2008 CVP | Dean Emeritus, College of Business Administration, University of Nebraska, Lincoln. She is former President and Chief Executive Officer for CMA, a consulting firm for financial institutions. | 15 | • Wells Fargo Company (banking and financial services) - NYSE • Wells Fargo Bank N.A. (Since 2014) • Gallup, Inc. (management consulting) • W.K. Kellogg Foundation • Raven Industries (technology company) - NASDAQ • Colonial Williamsburg Foundation • Kellogg Company (food manufacturing) - NYSE |
ARTHUR J. PUGH AGE: 78 | Director | 1982 CVS
2008 CVP | Retired executive. | 13 | None |
| INTERESTED DIRECTORS |
WILLIAM LESTER* AGE: 58 | Director & Chair (CVS)
Director & Senior Vice President (CVP) | 2004 CVS
2008 CVP | Executive Vice President Finance/Investments and Corporate Treasurer of Ameritas Mutual Holding Company. Chair and former President (resigned 2012) of Ameritas Investment Partners, Inc. | 13 | • Acacia Federal Savings Bank (through 2013)• Ameritas Investment Partners, Inc. (financial services)• Ameritas Investment Corp. (financial services)• Universal and Inland Insurance Companies• Bryan/LGH Health Systems |
www.calvert.com CALVERT VP VOLATILITY MANAGED MODERATE GROWTH PORTFOLIO ANNUAL REPORT (UNAUDITED) 19
|
| | | | | |
| Name & Age | Position with Fund | Position Start Date | Principal Occupation During Last 5 Years | # of Calvert Portfolios Overseen | Other Directorships |
| INTERESTED DIRECTORS |
JOHN H. STREUR* AGE: 56
| President (CVS)
Director, Chair & President (CVP) | 2015 | President and Chief Executive Officer of Calvert Investments, Inc. (since January 2015) and Chief Compliance Officer for the Advisor and Calvert Investment Distributors, Inc. (since August 10, 2015); President and Director, Portfolio 21 Investments, Inc. (through October 2014); President, Chief Executive Officer and Director, Managers Investment Group LLC (through January 2012); President and Director, The Managers Funds and Managers AMG Funds (through January 2012). | 40 | • Portfolio 21 Investments, Inc. (asset management)(through October 2014) • Managers Investment Group LLC (asset management)(through January 2012) • The Managers Funds (asset management) (through January 2012) • Managers AMG Funds (asset management) (through January 2012) • Calvert Social Investment Foundation |
|
| | | |
| Name & Age | Position with Fund | Position Start Date | Principal Occupation During Last 5 Years |
| OFFICERS |
VICKI L. BENJAMIN AGE: 54 | Treasurer | 2015 | Executive Vice President, Chief Financial Officer and Chief Operating Officer of Calvert Investments, Inc. since October 2015; Senior Vice President and Chief Financial Officer of Calvert Investments, Inc. (March 2015 - September 2015). Prior to Calvert, Ms. Benjamin was a Senior Partner at KPMG. |
ROBERT D. BENSON, ESQ. AGE: 37 | Assistant Vice President & Assistant Secretary | 2014 | Assistant General Counsel (since 2014), Assistant Vice President & Assistant Secretary (since 2015) and Staff Attorney (prior to 2014), Calvert Investments, Inc. |
HOPE BROWN AGE: 42 | Chief Compliance Officer | 2014 | Chief Compliance Officer for the Calvert Funds (since 2014). Vice President and Chief Compliance Officer, Wilmington Funds (2012-2014). Vice President and Senior Compliance Officer, Wilmington Trust Investment Advisors, Inc. (2010-2012). |
STU DALHEIM AGE: 46 | Vice President | 2015 | Vice President - Shareholder Advocacy for the Advisor. |
MATTHEW DUCH Age: 40 | Vice President | 2011 | Vice President of the Advisor and portfolio manager for Calvert’s taxable fixed-income funds. |
ROBERT J. ENDERSON, CFA AGE: 57 | Assistant Treasurer | 2014 | Vice President, Corporate Finance, of Calvert Investments, Inc.; Acting Chief Financial Officer of Calvert Investments, Inc. (September 2014 - March 2015). |
PATRICK FAUL AGE: 51 | Vice President | 2010 | Vice President and Head of Credit Research for the Advisor. |
TRACI L. GOLDT AGE: 42 | Assistant Secretary | 2004 | SEC Filing and Administrative Operations Manager, Calvert Investments, Inc. |
JADE HUANG AGE: 41 | Vice President | 2015 | Equity Portfolio Manager since November 2015 and Senior Equity Analyst prior to November 2015, Advisor. |
EMILY KAISER AGE: 32 | Assistant Vice President | 2015 | Senior Sustainability Analyst since November 2015 and Sustainability Analyst (January 2014 - October 2015), Advisor. Prior to joining Calvert, Ms. Kaiser attended law school from 2010 to 2013 and also held legal and policy positions with the U.S. Agency for International Development (2013), the Solidarity Center, AFL-CIO (2013), the U.S. Department of Labor (2012), the office of the U.S. Trade Representative (2012) and the Public International Law and Policy Group (2011-2012). |
VISHAL KHANDUJA, CFA AGE: 37 | Vice President | 2014 | Head of Taxable Fixed Income (since 2015) and Vice President of the Advisor (since 2014); Portfolio Manager for Calvert’s taxable fixed-income funds since 2012. Previously worked at Columbia Management as Portfolio Manager - Global Rates and Currency Team (2009-2012). |
20 www.calvert.com CALVERT VP VOLATILITY MANAGED MODERATE GROWTH PORTFOLIO ANNUAL REPORT (UNAUDITED)
|
| | | |
| Name & Age | Position with Fund | Position Start Date | Principal Occupation During Last 5 Years |
| OFFICERS |
LANCELOT A. KING, ESQ. AGE: 45 | Assistant Vice President & Secretary | 2002 | Assistant Vice President, Assistant Secretary and Associate General Counsel of Calvert Investments, Inc. |
ERICA LASDON AGE: 44 | Assistant Vice President | 2015 | Director of Sustainability Research since August 2015 and Senior Sustainability Analyst and Manager prior to August 2015, Advisor. |
JOSHUA LINDER AGE: 30 | Vice President | 2015 | Equity Portfolio Manager since November 2015, Assistant Portfolio Manager (January 2014 - October 2015) and Equity Analyst (2011 - 2013), Advisor. |
CHRISTOPHER MADDEN AGE: 40 | Vice President | 2015 | Equity Portfolio Manager since November 2015 and Senior Equity Analyst prior to November 2015, Advisor. |
ANDREW K. NIEBLER, ESQ. AGE: 48 | Assistant Vice President & Assistant Secretary | 2006 | Assistant Vice President, Assistant Secretary and Associate General Counsel of Calvert Investments, Inc. |
MARYBETH PILAT, CPA AGE: 47 | Fund Controller and Assistant Treasurer | 2015 | Director of Fund Administration, Calvert Investment Administrative Services, Inc. since August 2015. VP Expense & Budgeting, Global Fiduciary Platform, Legg Mason (May 2015 - July 2015). Vice President and Assistant Treasurer, Columbia Funds, Ameriprise, Columbia Management (2010 - April 2015). |
| |
| * | The address of Directors and Officers is 4550 Montgomery Avenue, Suite 1000N, Bethesda, Maryland 20814. Mr. Streur is an interested person of the Fund since he is an officer and director of the Fund’s Advisor and its affiliates. Mr. Lester is an interested person of the Fund since he is an officer and director of the parent company of the Fund’s Advisor. |
Additional information about the Fund’s Directors can be found in the Statement of Additional Information (SAI). You can get a free copy of the SAI by contacting your broker, or the Fund at 1-800-368-2745.
www.calvert.com CALVERT VP VOLATILITY MANAGED MODERATE GROWTH PORTFOLIO ANNUAL REPORT (UNAUDITED) 21
|
| |
| | |
This report is intended to provide fund information to shareholders. It is not authorized for distribution to prospective investors unless preceded or accompanied by a prospectus. Note: The information on our website is not incorporated by reference into this report; our website address is included as an inactive textual reference only. Investors should carefully consider the investment objectives, risks, charges and expenses of the Calvert Funds. This and other important information is contained in the fund’s summary prospectus and prospectus, which can be obtained from your financial professional and should be read carefully before investing. You may also call Calvert at 800/368-2745. |
| Printed on recycled paper using soy inks. | |
|
| |
|
Calvert VP Volatility Managed Growth Portfolio |
Annual Report December 31, 2015 | |
|
| | | | |
| | TABLE OF CONTENTS |
| | | | | |
| | | | | Portfolio Management Discussion |
| | | | | Understanding Your Fund's Expenses |
| | | | | Report of Independent Registered Public Accounting Firm |
| | | | | Schedule of Investments |
| | | | | Statement of Assets and Liabilities |
| | | | | Statement of Operations |
| | | | | Statements of Changes in Net Assets |
| | | | | Notes to Financial Statements |
| | | | | Financial Highlights |
| | | | | Proxy Voting |
| | | | | Availability of Quarterly Portfolio Holdings |
| | | | | Basis for Board’s Approval of Investment Advisory Contracts |
| | | | | Director and Officer Information Table |
|
| | |
| | | PORTFOLIO MANAGEMENT DISCUSSION |
|
| |
| John P. Nichols, CFA Vice President - Equities |
Market Review
Both stock and bond markets posted meager returns for 2015 with continued weak energy prices, concerns about slowing economic growth, and the specter of high interest rates weighing on investors. Growth stocks were the only bright spot in the market, outperforming value stocks around the globe and across the spectrum of market capitalization. U.S. and foreign equities produced similar returns, with a strong dollar trimming back local market returns for foreign equities. Emerging market equities were the big losers for 2015 suffering double digit losses during a steep market sell-off and spike in volatility in August.
Investment Strategy and Technique:
The Calvert VP Volatility Managed Growth Portfolio (the Portfolio) seeks to stabilize portfolio volatility1 around a target level of 12% while pursuing current income and modest growth potential consistent with the preservation of capital. To achieve this objective, the Portfolio invests in a portfolio of exchange traded funds (ETFs) diversified across multiple asset classes and utilizes a derivatives-based risk management strategy. The asset allocated portfolios of ETFs is designed to achieve market returns at a level of risk that is consistent with the Portfolio’s volatility target in a long-term context, while the risk management strategy employs futures contracts to respond to short-term changes in market volatility. The risk management strategy combines two components - volatility management and a capital protection strategy - that work together in an effort to reduce the negative effects of high portfolio volatility during market downturns while seeking to participate in up markets.
Fund Performance Relative to the Benchmark
For the one-year period ended December 31, 2015, the Portfolio returned -3.51% outperforming its benchmark, the S&P 500 Daily Risk Control 12% Total Return Index, which returned -4.51%.
Calvert has developed a secondary composite benchmark based on a mix of market indices that more closely reflect the Portfolio’s asset allocation strategy as compared to the single asset class benchmark listed above that is used to capture the impact of the volatility management strategy.
The Portfolio underperformed the blended composite benchmark’s return of 0.77%.
This year, the Portfolio outperformed the S&P 500 Daily Risk Control 12% Index by 1%. The Portfolio’s advantage was realized during the equity market’s sharp sell-off in August. The Portfolio and the benchmark had high equity exposures coming into the market downturn because the volatility models of each recommended increased equity exposures during a period of very low equity market volatility. The Portfolio benefited from having a lower level of equity market exposure than the benchmark at this time due to the capital protection strategy and risk control policies. Consequently, when equity markets sold off, the Portfolio protected capital to a greater degree than did the benchmark.
| |
| • | Our volatility management and capital protection strategy protected the Portfolio against losses in the market’s sharp sell-off in August. |
| |
| • | The Portfolio participated in rising markets earlier in the year and in the closing quarter, but often underperformed its primary benchmark during these periods due to risk control measures that limit the Portfolio’s equity exposure. |
| |
| • | The Portfolio underperformed its secondary composite benchmark by 4.28%, primarily due to having its equity exposure at the highest allowed level heading into the equity market’s sharp sell-off in August. |
____________________________________
1 Volatility refers to the annualized standard deviation of daily logarithmic portfolio returns.
www.calvert.com CALVERT VP VOLATILITY MANAGED GROWTH PORTFOLIO ANNUAL REPORT (UNAUDITED) 1
Positioning and Market Outlook
As 2015 closed out, equity markets remained volatile. Our allocation across equity and fixed income ETFs has remained relatively stable across 2015 and into the new year. We use futures to adjust the Portfolio’s risk profile, relying on our volatility management and capital protection strategy to determine the appropriate level of market risk for the Portfolio. Markets experienced an uptick in volatility and suffered losses in the closing days of 2015 and our strategy responded by decreasing the level of equity exposure (including futures contracts) in the Portfolio to 59.6%, which is 18% below our long-term target for the Portfolio’s equity allocation.
Calvert Investment Management, Inc.
December 2015
|
| | | |
| ECONOMIC SECTORS | % OF TOTAL INVESTMENTS | |
| Equity Funds | 78.5 | % | |
| Debt Funds | 16.5 | % | |
| Short-Term Investments | 5.0 | % | |
| Total | 100 | % | |
| | | |
2 www.calvert.com CALVERT VP VOLATILITY MANAGED GROWTH PORTFOLIO ANNUAL REPORT (UNAUDITED)
Growth of $10,000
The graph below shows the value of a hypothetical $10,000 investment in the Portfolio over the past 10 fiscal year periods or since inception (for funds without 10-year records). The results assume the reinvestment of dividends and are compared with a broad-based market index. Market indexes are unmanaged and their results do not reflect the effect of expenses or sales charges.
|
| | | | |
| CALVERT VP VOLATILITY MANAGED GROWTH PORTFOLIO |
| DECEMBER 31, 2015 |
| AVERAGE ANNUAL TOTAL RETURNS | 1 Year | Since Inception (4/30/2013) |
| Class F | -3.51 | % | 3.14 | % |
| S&P 500 Daily Risk Control 12% Total Return Index | -4.51 | % | 7.46 | % |
| Volatility Managed Growth Composite | 0.77 | % | 7.71 | % |
| | | |
| The Volatility Managed Growth Composite Benchmark is an internally constructed index comprised of a blend of 58% Russell 3000 Index, 4% MSCI U.S. REIT, 16% MSCI EAFE Index, 18% Barclays U.S. Aggregate Bond Index and 4% Barclays 3 Month T-Bill Bellwether Index. |
| | | |
The performance data shown represents past performance, does not guarantee future results and assumes reinvestment of all dividends and distributions. All performance data reflects fee waivers and/or expense limitations, if any are in effect; in their absence performance would be lower. See Note B in Notes to Financial Statements. The investment return and principal value of an investment will fluctuate so that an investor’s shares, when redeemed, may be worth more or less than their original cost. Current performance may be lower or higher than the performance data quoted.
Visit calvert.com/institutional-VP-performance.html for current performance data. The gross expense ratio from the current prospectus for the Portfolio is 1.06% (includes Acquired Fund fees). This number may vary from the expense ratio shown elsewhere in this report because it is based on a different time period and, if applicable, does not include fee or expense waivers. The performance data and expense ratio reflect deduction of Portfolio operating expenses, but do not reflect charges and expenses imposed under the variable annuity or life insurance contract.
www.calvert.com CALVERT VP VOLATILITY MANAGED GROWTH PORTFOLIO ANNUAL REPORT (UNAUDITED) 3
UNDERSTANDING YOUR FUND'S EXPENSES
As an investor, you incur two types of costs. There are transaction costs. There are also ongoing costs, which generally include management fees, distribution and/or service fees, and other fund expenses. The following information is intended to help you understand your ongoing costs (in dollars) of investing in this mutual fund and to help you compare these costs with the ongoing costs of investing in other mutual funds.
To illustrate these ongoing costs, we have provided examples and calculated the expenses paid by the fund's investors during the period. The actual and hypothetical information presented in the examples is based on an investment of $1,000 invested at the beginning of the period and held for the entire period (July 1, 2015 to December 31, 2015).
Note: Expenses do not reflect charges and expenses of the variable annuity or variable universal life contract.
Actual Expenses
The first line of the table below provides information about actual account values and actual expenses. You may use the information in this line, together with the amount you invested, to estimate the expenses that you paid over the period. Simply divide your account value by $1,000 (for example, an $8,600 account value divided by $1,000 = 8.6), then multiply the result by the number in the first line under the heading entitled “Expenses Paid During Period” to estimate the expenses you paid on your account during this period.
Hypothetical Example for Comparison Purposes
The second line of the table below provides information about hypothetical account values and hypothetical expenses based on the Fund’s actual expense ratio and an assumed rate of return of 5% per year before expenses, which is not the Fund’s actual return. The hypothetical account values and expenses may not be used to estimate the actual ending account balance or expenses you paid for the period. You may use this information to compare the ongoing costs of investing in the Fund and other funds. To do so, compare the 5% hypothetical example with the 5% hypothetical examples that appear in the shareholder reports of the other funds.
Please note that the expenses shown in the table are meant to highlight your ongoing costs only and do not reflect any transactional costs. Therefore, the second line of the table is useful in comparing ongoing costs only, and will not help you determine the relative total costs of owning different funds. In addition, if these transactional costs were included, your costs would have been higher.
|
| | | | |
| | ANNUALIZED
EXPENSE RATIO | BEGINNING
ACCOUNT VALUE
7/1/15 | ENDING
ACCOUNT VALUE
12/31/15 | EXPENSES PAID
DURING PERIOD*
7/1/15 - 12/31/15 |
| | | | | |
| Actual | 0.83% | $1,000.00 | $954.00 | $4.09 |
| Hypothetical (5% return per year before expenses) | 0.83% | $1,000.00 | $1,021.02 | $4.23 |
| |
| * Expenses paid during the period are equal to the annualized expense ratio as indicated above, multiplied by the average account value over the period, multiplied by 184/365 (to reflect the one-half year period). Expenses do not include fees and expenses incurred indirectly from investment in underlying funds. Expense ratios shown in the Financial Highlights represent the actual expenses incurred for the fiscal year. |
4 www.calvert.com CALVERT VP VOLATILITY MANAGED GROWTH PORTFOLIO ANNUAL REPORT (UNAUDITED)
REPORT OF INDEPENDENT REGISTERED PUBLIC ACCOUNTING FIRM
The Board of Directors of Calvert Variable Products, Inc. and Shareholders of Calvert VP Volatility Managed Growth Portfolio:
We have audited the accompanying statement of assets and liabilities, including the schedule of investments, of the Calvert VP Volatility Managed Growth Portfolio (the “Portfolio”), a series of Calvert Variable Products, Inc., as of December 31, 2015, and the related statement of operations for the year then ended, the statements of changes in net assets for each of the years in the two-year period then ended, and the financial highlights for each of the years or periods in the three-year period then ended. These financial statements and financial highlights are the responsibility of the Portfolio’s management. Our responsibility is to express an opinion on these financial statements and financial highlights based on our audits.
We conducted our audits in accordance with the standards of the Public Company Accounting Oversight Board (United States). Those standards require that we plan and perform the audit to obtain reasonable assurance about whether the financial statements and financial highlights are free of material misstatement. An audit includes examining, on a test basis, evidence supporting the amounts and disclosures in the financial statements. Our procedures included confirmation of securities owned as of December 31, 2015, by correspondence with the custodian and brokers or by performing other appropriate auditing procedures. An audit also includes assessing the accounting principles used and significant estimates made by management, as well as evaluating the overall financial statement presentation. We believe that our audits provide a reasonable basis for our opinion.
In our opinion, the financial statements and financial highlights referred to above present fairly, in all material respects, the financial position of the Portfolio as of December 31, 2015, and the results of its operations for the year then ended, the changes in its net assets for each of the years in the two-year period then ended, and the financial highlights for each of the years or periods in the three-year period then ended, in conformity with U.S. generally accepted accounting principles.
Philadelphia, Pennsylvania
February 24, 2016
www.calvert.com CALVERT VP VOLATILITY MANAGED GROWTH PORTFOLIO ANNUAL REPORT 5
CALVERT VP VOLATILITY MANAGED GROWTH PORTFOLIO
SCHEDULE OF INVESTMENTS
DECEMBER 31, 2015
|
| | | | |
| | SHARES | VALUE ($) |
| EXCHANGE-TRADED PRODUCTS - 94.0% | | |
| Consumer Staples Select Sector SPDR Fund | 10,300 | 520,047 |
|
| Financial Select Sector SPDR Fund | 24,600 | 584,988 |
|
| iShares Core S&P Mid-Cap ETF | 63,800 | 8,892,444 |
|
| iShares Core U.S. Aggregate Bond ETF | 164,800 | 17,800,048 |
|
| iShares North American Natural Resources ETF | 18,500 | 520,590 |
|
| iShares Russell 2000 ETF | 49,400 | 5,557,994 |
|
| iShares S&P 500 Growth ETF | 95,600 | 11,070,480 |
|
| iShares S&P 500 Value ETF | 125,000 | 11,066,250 |
|
| iShares S&P Mid-Cap 400 Growth ETF | 6,700 | 1,078,432 |
|
| iShares S&P Mid-Cap 400 Value ETF | 9,500 | 1,113,400 |
|
| SPDR Barclays High Yield Bond ETF | 19,300 | 654,463 |
|
| Technology Select Sector SPDR Fund | 13,400 | 573,922 |
|
| Vanguard FTSE Developed Markets ETF | 456,200 | 16,751,664 |
|
| Vanguard FTSE Emerging Markets ETF | 33,200 | 1,085,972 |
|
| Vanguard REIT ETF | 56,200 | 4,480,826 |
|
| Vanguard S&P 500 ETF | 131,000 | 24,487,830 |
|
| | | |
| Total Exchange-Traded Products (Cost $107,201,465) | | 106,239,350 |
|
| | | |
| | | |
| | PRINCIPAL
AMOUNT ($) | |
| TIME DEPOSIT - 4.9% | | |
| State Street Bank Time Deposit, 0.278%, 1/4/16 | 5,561,935 | 5,561,935 |
|
| | | |
| Total Time Deposit (Cost $5,561,935) | | 5,561,935 |
|
| | | |
| TOTAL INVESTMENTS (Cost $112,763,400) - 98.9% | | 111,801,285 |
|
| Other assets and liabilities, net - 1.1% | | 1,283,177 |
|
NET ASSETS - 100.0% | |
| $113,084,462 |
|
|
| | | | | | | | | |
| FUTURES | NUMBER OF
CONTRACTS | EXPIRATION
DATE | UNDERLYING FACE AMOUNT AT VALUE | UNREALIZED
APPRECIATION
(DEPRECIATION) |
| Short: | |
| | E-Mini S&P 500 Index | (100) | 3/16 |
| ($10,177,000 | ) |
| ($135,825 | ) |
| | E-Mini S&P MidCap 400 Index | (21) | 3/16 | (2,926,350) |
| (33,316) |
|
| | MSCI EAFE Mini Index | (52) | 3/16 | (4,415,320) |
| (85,632) |
|
| | Russell 2000 Mini Index | (28) | 3/16 | (3,168,200) |
| (65,362) |
|
| | Total Short | | | |
| ($320,135 | ) |
|
|
| NOTES TO SCHEDULE OF INVESTMENTS |
Abbreviations: ETF: Exchange Traded Fund FTSE: Financial Times Stock Exchange REIT: Real Estate Investment Trust SPDR: Standard and Poor's Depository Receipt |
| See notes to financial statements. |
6 www.calvert.com CALVERT VP VOLATILITY MANAGED GROWTH PORTFOLIO ANNUAL REPORT
CALVERT VP VOLATILITY MANAGED GROWTH PORTFOLIO
STATEMENT OF ASSETS AND LIABILITIES
DECEMBER 31, 2015
|
| | | |
| ASSETS | |
| Investments in securities, at value (Cost $112,763,400) - see accompanying schedule |
| $111,801,285 |
|
| Cash collateral at broker | 1,653,838 |
|
| Receivable for shares sold | 46,425 |
|
| Dividends and interest receivable | 3,694 |
|
| Directors' deferred compensation plan | 73,628 |
|
| Total assets | 113,578,870 |
|
| | |
| LIABILITIES | |
| Payable for shares redeemed | 115 |
|
| Payable for futures contracts variation margin | 319,980 |
|
| Payable to Calvert Investment Management, Inc. | 36,577 |
|
| Payable to Calvert Investment Distributors, Inc. | 24,027 |
|
| Payable to Calvert Investment Administrative Services, Inc. | 9,611 |
|
| Payable to Calvert Investment Services, Inc. | 2,774 |
|
| Directors' deferred compensation plan | 73,628 |
|
| Accrued expenses and other liabilities | 27,696 |
|
| Total liabilities | 494,408 |
|
| NET ASSETS |
| $113,084,462 |
|
| | |
| NET ASSETS CONSIST OF: | |
| Paid-in capital applicable to 7,150,196 shares of common stock outstanding; | |
| $0.10 par value, 100,000,000 shares authorized |
| $115,530,703 |
|
| Accumulated net realized gain (loss) | (1,163,991) |
|
| Net unrealized appreciation (depreciation) | (1,282,250) |
|
| NET ASSETS |
| $113,084,462 |
|
| | |
| NET ASSET VALUE PER SHARE |
| $15.82 |
|
| See notes to financial statements. | |
www.calvert.com CALVERT VP VOLATILITY MANAGED GROWTH PORTFOLIO ANNUAL REPORT 7
CALVERT VP VOLATILITY MANAGED GROWTH PORTFOLIO
STATEMENT OF OPERATIONS
YEAR ENDED DECEMBER 31, 2015
|
| | | |
| NET INVESTMENT INCOME | |
| Investment Income: | |
| Dividend income |
| $2,277,018 |
|
| Interest income | 4,770 |
|
| Total investment income | 2,281,788 |
|
| | |
| Expenses: | |
| Investment advisory fee | 436,166 |
|
| Administrative fees | 103,849 |
|
| Transfer agency fees and expenses | 9,395 |
|
| Distribution Plan expenses | 259,623 |
|
| Directors' fees and expenses | 19,569 |
|
| Accounting fees | 17,144 |
|
| Custodian fees | 26,792 |
|
| Professional fees | 20,377 |
|
| Miscellaneous | 4,825 |
|
| Total expenses | 897,740 |
|
| Reimbursement from Advisor | (35,793) |
|
| Net expenses | 861,947 |
|
| NET INVESTMENT INCOME | 1,419,841 |
|
| | |
| | |
| REALIZED AND UNREALIZED GAIN (LOSS) | |
| Net realized gain (loss) on: | |
| Investments | 1,614,508 |
|
| Futures | (2,684,798) |
|
| | (1,070,290) |
|
| | |
| Change in unrealized appreciation (depreciation) on: | |
| Investments | (4,473,693) |
|
| Futures | (456,782) |
|
| | (4,930,475) |
|
| | |
| NET REALIZED AND UNREALIZED GAIN (LOSS) | (6,000,765) |
|
| | |
| INCREASE (DECREASE) IN NET ASSETS RESULTING FROM OPERATIONS | ($4,580,924) |
| See notes to financial statements. | |
8 www.calvert.com CALVERT VP VOLATILITY MANAGED GROWTH PORTFOLIO ANNUAL REPORT
CALVERT VP VOLATILITY MANAGED GROWTH PORTFOLIO
STATEMENTS OF CHANGES IN NET ASSETS
|
| | | | | | | |
| INCREASE (DECREASE) IN NET ASSETS | YEAR ENDED
DECEMBER 31, 2015 | | YEAR ENDED
DECEMBER 31, 2014 |
| Operations: | | | |
| Net investment income |
| $1,419,841 |
| |
| $861,514 |
|
| Net realized gain (loss) | (1,070,290) |
| | 14,535 |
|
| Change in unrealized appreciation (depreciation) | (4,930,475) |
| | 2,301,678 |
|
| | | | |
| INCREASE (DECREASE) IN NET ASSETS RESULTING FROM OPERATIONS | (4,580,924) |
| | 3,177,727 |
|
| | | | |
| Distributions to shareholders from: | | | |
| Net investment income | (1,371,920) |
| | (843,131) |
|
| Net realized gain | (32,404) |
| | — |
|
| Total distributions | (1,404,324) |
| | (843,131) |
|
| | | | |
| Capital share transactions: | | | |
| Shares sold | 41,069,295 |
| | 55,107,214 |
|
| Reinvestment of distributions | 1,404,324 |
| | 820,131 |
|
| Shares redeemed | (5,792,541) |
| | (1,582,718) |
|
| Total capital share transactions | 36,681,078 |
| | 54,344,627 |
|
| | | | |
| TOTAL INCREASE (DECREASE) IN NET ASSETS | 30,695,830 |
| | 56,679,223 |
|
| | | | |
| | | | |
| NET ASSETS | | | |
| Beginning of year | 82,388,632 |
| | 25,709,409 |
|
| End of year |
| $113,084,462 |
| |
| $82,388,632 |
|
| | | | |
| CAPITAL SHARE ACTIVITY | | | |
| Shares sold | 2,452,954 |
| | 3,390,227 |
|
| Reinvestment of distributions | 87,935 |
| | 48,992 |
|
| Shares redeemed | (352,408) |
| | (96,423) |
|
| Total capital share activity | 2,188,481 |
| | 3,342,796 |
|
| See notes to financial statements. |
www.calvert.com CALVERT VP VOLATILITY MANAGED GROWTH PORTFOLIO ANNUAL REPORT 9
NOTES TO FINANCIAL STATEMENTS
NOTE A — SIGNIFICANT ACCOUNTING POLICIES
General: Calvert VP Volatility Managed Growth Portfolio (the “Portfolio”), a series of Calvert Variable Products, Inc. (the “Fund”), is registered under the Investment Company Act of 1940 as a diversified, open-end management investment company. The Fund is comprised of eleven separate portfolios. The operations of each series of the Fund are accounted for separately. The Portfolio applies the accounting and reporting guidance in the Financial Accounting Standards Board (FASB) Accounting Standards Codification Topic 946, Financial Services – Investment Companies (ASC 946).
The Portfolio offers Class F shares, which are subject to Distribution Plan expenses. Shares of the Portfolio are sold without sales charge to affiliated and unaffiliated insurance companies for allocation to certain of their variable separate accounts. The Portfolio invests primarily in exchange traded funds representing a broad range of asset classes (the “Underlying Funds”) and derivatives to manage overall portfolio volatility.
Security Valuation: Net asset value per share is determined every business day as of the close of the regular session of the New York Stock Exchange (generally 4:00 p.m. Eastern time). The Portfolio uses independent pricing services approved by the Board of Directors (“the Board”) to value its investments wherever possible. Investments for which market quotations are not available or deemed not reliable are fair valued in good faith under the direction of the Board.
The Board has adopted Valuation Procedures (the “Procedures”) to determine the fair value of securities and other financial instruments for which market prices are not readily available or which may not be reliably priced. The Board has delegated the day-to-day responsibility for determining the fair value of assets of the Portfolio to Calvert Investment Management, Inc. (the “Advisor” or “Calvert”) and has provided these Procedures to govern Calvert in its valuation duties.
Calvert has chartered an internal Valuation Committee to oversee the implementation of these Procedures and to assist it in carrying out the valuation responsibilities that the Board has delegated.
The Valuation Committee meets on a regular basis to review illiquid securities and other investments which may not have readily available market prices. The Valuation Committee’s fair valuation determinations are subject to review, approval and ratification by the Board at its next regularly scheduled meeting covering the calendar quarter in which the fair valuation was determined.
The Valuation Committee utilizes various methods to measure the fair value of the Portfolio’s investments. U.S. generally accepted accounting principles (GAAP) establishes a disclosure hierarchy that categorizes the inputs to valuation techniques used to value assets and liabilities at measurement date. These inputs are summarized in the three broad levels listed below:
Level 1 - quoted prices in active markets for identical securities
Level 2 - other significant observable inputs (including quoted prices for similar securities, interest rates, prepayment speeds, credit risk, etc.)
Level 3 - significant unobservable inputs (including the Portfolio’s own assumptions in determining the fair value of investments)
The inputs or methodologies used for valuing securities are not necessarily an indication of the risk associated with investing in those securities.
Changes in valuation techniques may result in transfers in or out of an investment’s assigned level within the hierarchy during the year. Transfers in and/or out of levels are determined based on the fair value of such securities at the end of the year. Valuation techniques used to value the Portfolio’s investments by major category are as follows:
Exchange-traded products are valued at the official closing price as reported by an independent pricing service on the primary market or exchange on which they are traded and are categorized as Level 1 in the hierarchy.
Short-term securities of sufficient credit quality with remaining maturities of sixty days or less for which quotations are not readily available are valued at amortized cost, which approximates fair value, and are categorized as Level 2 in the hierarchy.
10 www.calvert.com CALVERT VP VOLATILITY MANAGED GROWTH PORTFOLIO ANNUAL REPORT
Futures contracts are valued at unrealized appreciation (depreciation) based on the settlement price established each day by the board of trade or exchange on which they are traded and are categorized as Level 1 in the hierarchy.
If a market value cannot be determined for a security using the methodologies described above, or if, in the good faith opinion of the Advisor, the market value does not constitute a readily available market quotation, or if a significant event has occurred that would materially affect the value of the security, the security will be fair valued as determined in good faith by the Valuation Committee.
The Valuation Committee considers a number of factors, including significant unobservable valuation inputs when arriving at fair value. It considers all significant facts that are reasonably available and relevant to the determination of fair value.
The Valuation Committee primarily employs a market-based approach which may use related or comparable assets or liabilities, recent transactions, market multiples, book values, and other relevant information for the investment to determine the fair value of the investment. When more appropriate, the Portfolio may employ an income-based or cost approach. An income-based valuation approach discounts anticipated future cash flows of the investment to calculate a present amount (discounted). The measurement is based on the value indicated by current market expectations about those future amounts. Discounts may also be applied due to the nature or duration of any restrictions on the disposition of the investments. A cost based approach is based on the amount that currently would be required to replace the service capacity of an asset (current replacement cost). From the seller’s perspective, the price that would be received for the asset is determined based on the cost to a buyer to acquire or construct a substitute asset of comparable utility, adjusted for obsolescence.
The values assigned to fair value investments are based on available information and do not necessarily represent amounts that might ultimately be realized. Further, due to the inherent uncertainty of valuations of such investments, the fair values may differ significantly from the values that would have been used had an active market existed, and the differences could be material. The Valuation Committee employs various methods for calibrating these valuation approaches including a regular review of key inputs and assumptions, transactional back-testing or disposition analysis and reviews of any related market activity.
At December 31, 2015, no securities were fair valued in good faith under the direction of the Board.
The following table summarizes the market value of the Portfolio's holdings as of December 31, 2015, based on the inputs used to value them:
|
| | | | | | | | | | | |
| | VALUATION INPUTS |
| INVESTMENTS IN SECURITIES* | LEVEL 1 | LEVEL 2 | LEVEL 3 | TOTAL |
| Exchange-Traded Products |
| $106,239,350 |
| $— |
| $— |
|
| $106,239,350 |
|
| Time Deposit | — |
| 5,561,935 |
| — |
| 5,561,935 |
|
| TOTAL |
| $106,239,350 |
|
| $5,561,935 |
| $— |
|
| $111,801,285 |
|
| Futures Contracts** |
| ($320,135 | ) | $— |
| $— |
|
| ($320,135 | ) |
| |
| * For a complete listing of investments, please refer to the Schedule of Investments. |
| ** The value listed for these securities reflects unrealized appreciation (depreciation) as shown on the Schedule of Investments. |
There were no transfers between levels during the year.
Futures Contracts: The Portfolio may purchase and sell futures contracts to manage overall portfolio volatility. These futures contracts may include, but are not limited to, futures contracts based on U.S. government obligations and market index futures contracts. The Portfolio may enter into futures contracts agreeing to buy or sell a financial instrument for a set price at a future date. Initial margin deposits of either cash or securities as required by the broker are made upon entering into the contract. While the contract is open, daily variation margin payments are made to or received from the broker reflecting the daily change in market value of the contract and are recorded for financial reporting purposes as unrealized gains or losses by the Portfolio. When a futures contract is closed, a realized gain or loss is recorded equal to the difference between the opening and closing value of the contract. The risks associated with entering into futures contracts may include the possible illiquidity of the secondary market which would limit the Portfolio’s ability to close out a futures contract prior to the settlement date, an imperfect correlation between the value of the contracts and the
www.calvert.com CALVERT VP VOLATILITY MANAGED GROWTH PORTFOLIO ANNUAL REPORT 11
underlying financial instruments, or that the counterparty will fail to perform its obligations under the contracts’ terms. Futures contracts are designed by boards of trade which are designated “contracts markets” by the Commodities Futures Trading Commission. Futures contracts trade on the contracts markets in a manner that is similar to the way a stock trades on a stock exchange, and the boards of trade, through their clearing corporations, guarantee the futures contracts against default. As a result, there is minimal counterparty credit risk to the Portfolio. During the year, futures contracts were used to adjust the Portfolio’s overall equity exposure in an effort to stabilize portfolio volatility around a target level. The Portfolio’s futures contracts at year end are presented in the Schedule of Investments.
At December 31, 2015, the Portfolio had the following derivatives, categorized by risk exposure:
|
| | | | | |
| Risk | Statement of Assets and Liabilities | Assets | Statement of Assets and Liabilities | Liabilities | |
| Equity | Unrealized appreciation on futures contracts | $—* | Unrealized depreciation on futures contracts | ($320,135*) | |
| * Only the current day’s variation margin is reported within the Statement of Assets and Liabilities. |
The effect of derivative instruments on the Statement of Operations for the year ended December 31, 2015 was as follows:
|
| | | |
| | Statement of Operations Location |
| Risk | Derivatives | Net Realized Gain (Loss) | Net Change in Unrealized appreciation (depreciation) |
| Equity | Futures | ($2,684,798) | ($456,782) |
During the year, the Portfolio invested in E-Mini S&P 500 Index, MSCI EAFE Mini Index, E-Mini S&P MidCap 400 Index, and Russell 2000 Mini Index futures. The volume of outstanding contracts has varied throughout the year with an average number of contracts as in the following table:
|
| | |
| Derivative Description | | Average Number of Contracts* |
| Futures contracts long | | 32 |
| Futures contracts short | | (75) |
| | | |
| *Averages are based on activity levels during the year ended December 31, 2015. |
Security Transactions and Investment Income: Security transactions, normally purchases and sales of shares of the Underlying Funds, are accounted for on trade date. Realized gains and losses are recorded on an identified cost basis and may include proceeds from litigation. Income and capital gain distributions from the Underlying Funds, if any, are recorded on ex-dividend date. Distributions received on securities that represent a return of capital are recorded as a reduction of cost of investments. Distributions received on securities that represent a capital gain are recorded as a realized gain. Interest income, which includes amortization of premium and accretion of discount on debt securities, is accrued as earned. Expenses included in the accompanying financial statements reflect the expenses of the Portfolio and do not include any expenses associated with the Underlying Funds.
Distributions to Shareholders: Distributions to shareholders are recorded by the Portfolio on ex-dividend date. Dividends from net investment income and distributions from net realized capital gains, if any, are paid at least annually. Distributions are determined in accordance with income tax regulations which may differ from U.S. generally accepted accounting principles; accordingly, periodic reclassifications are made within the Portfolio's capital accounts to reflect income and gains available for distribution under income tax regulations.
Estimates: The preparation of financial statements in conformity with U.S. generally accepted accounting principles requires management to make estimates and assumptions that affect the reported amounts of assets and liabilities and disclosure of contingent assets and liabilities at the date of the financial statements and the reported amounts of increases and decreases in net assets from operations during the reporting period. Actual results could differ from those estimates.
Federal Income Taxes: No provision for federal income or excise tax is required since the Portfolio intends to continue to qualify as a regulated investment company under the Internal Revenue Code and to distribute substantially all of its taxable earnings.
12 www.calvert.com CALVERT VP VOLATILITY MANAGED GROWTH PORTFOLIO ANNUAL REPORT
Management has analyzed the Portfolio's tax positions taken for all open federal income tax years and has concluded that no provision for federal income tax is required in the Portfolio's financial statements. A Portfolio's federal tax return is subject to examination by the Internal Revenue Service for a period of three years.
NOTE B — RELATED PARTY TRANSACTIONS
Calvert Investment Management, Inc. (the “Advisor”) is wholly-owned by Calvert Investments, Inc., which is indirectly wholly-owned by Ameritas Mutual Holding Company. The Advisor provides investment advisory services and pays the salaries and fees of officers and Directors of the Fund who are employees of the Advisor or its affiliates. For its services, the Advisor receives an annual fee, payable monthly of 0.42% of the Portfolio’s average daily net assets.
The Advisor has contractually agreed to limit net annual portfolio operating expenses through April 30, 2016. The contractual expense cap is 0.83%. For the purpose of this expense limit, operating expenses do not include interest expense, brokerage commissions, taxes, and extraordinary expenses. This expense limitation does not limit fees and expenses associated with the Underlying Funds.
Calvert Investment Administrative Services, Inc. ("CIAS"), an affiliate of the Advisor, provides administrative services to the Portfolio for an annual fee, payable monthly, of 0.10% of the Portfolio’s average daily net assets.
On November 24, 2015, the Board of Directors approved the recommendation made by CIAS to standardize and rationalize the administrative fee paid by the Calvert Funds at 0.12% for all series and all share classes of the Calvert Funds. CIAS and the Portfolio have entered into an Amended and Restated Administrative Services Agreement that will establish a 0.12% administrative fee commencing on May 1, 2016. CIAS has contractually agreed to waive 0.02% (the difference between the current administrative fee and the new 0.12% fee) from May 1, 2016 through April 30, 2018.
Calvert Investment Distributors, Inc. (“CID”), an affiliate of the Advisor, is the distributor and principal underwriter for the Portfolio. Pursuant to Rule 12b-1 under the Investment Company Act of 1940, the Portfolio has adopted a Distribution Plan that permits the Portfolio to pay certain expenses associated with the distribution and servicing of its Class F shares. The expenses paid may not exceed 0.25% annually of the average daily net assets of Class F.
Calvert Investment Services, Inc. (“CIS”), an affiliate of the Advisor, acts as shareholder servicing agent for the Portfolio. For its services, CIS received a fee of $7,789 for the year ended December 31, 2015. Boston Financial Data Services, Inc. is the transfer and dividend disbursing agent.
Each Director of the Fund who is not an employee of the Advisor or its affiliates receives a fee of $1,500 for each Board and Committee meeting attended plus an annual fee of $44,000. Committee chairs receive an additional $5,000 annual retainer. Eligible Directors may participate in a Deferred Compensation Plan (the “Plan”). Obligations of the Plan will be paid solely out of the Portfolio’s assets. Directors’ fees are allocated to each of the portfolios served.
NOTE C — INVESTMENT ACTIVITY AND TAX INFORMATION
During the year, the cost of purchases and proceeds from sales of investments, other than short-term securities, were $47,070,928 and $16,435,096, respectively.
|
| | | |
| Capital Loss Carryforwards | |
| NO EXPIRATION DATE | |
| Short-term |
| ($1,230,786 | ) |
| Long-term | (279,089) |
|
Under the Regulated Investment Company Modernization Act of 2010, capital losses incurred in taxable years beginning after December 22, 2010 can be carried forward to offset future capital gains for an unlimited period. These losses will retain their character as either long-term or short-term.
www.calvert.com CALVERT VP VOLATILITY MANAGED GROWTH PORTFOLIO ANNUAL REPORT 13
The tax character of dividends and distributions paid during the years ended December 31, 2015 and December 31, 2014 was as follows:
|
| | | | | | |
| DISTRIBUTIONS PAID FROM: | 2015 | 2014 |
| Ordinary income |
| $1,400,061 |
|
| $843,131 |
|
| Return of capital | 4,263 |
| - |
|
| Total |
| $1,404,324 |
|
| $843,131 |
|
As of December 31, 2015, the tax basis components of distributable earnings/(accumulated losses) and the federal tax cost were as follows:
|
| | | |
| Unrealized appreciation |
| $1,930,648 |
|
| Unrealized (depreciation) | (2,867,014) |
|
| Net unrealized appreciation (depreciation) |
| ($936,366 | ) |
| Capital loss carryforward |
| ($1,509,875 | ) |
| Federal income tax cost of investments |
| $112,737,651 |
|
The differences between the components of distributable earnings on a tax basis and the amounts reflected in the Statement of Assets and Liabilities are primarily due to temporary book-tax differences that will reverse in a subsequent period. These differences are mainly due to wash sales, real estate investment fund adjustments and Section 1256 futures contracts.
Reclassifications, as shown in the table below, have been made to the Portfolio's components of net assets to reflect income and gains available for distribution (or available capital loss carryovers, as applicable) under income tax law and regulations. These reclassifications are due to permanent book-tax differences and have no impact on net assets. The primary permanent differences causing such reclassifications for the Portfolio are due to distribution recharacterizations.
|
| | | |
| Undistributed net investment income |
| ($47,921 | ) |
| Accumulated net realized gain (loss) | 52,184 |
|
| Paid in capital | (4,263 | ) |
NOTE D — LINE OF CREDIT
A financing agreement is in place with the Calvert Funds and State Street Corporation (“SSC”). Under the agreement, SSC provides an unsecured line of credit facility, in the aggregate amount of $50 million ($25 million committed and $25 million uncommitted), accessible by the Calvert Funds for temporary or emergency purposes only. Borrowings bear interest at the higher of the London Interbank Offered Rate (LIBOR) or the overnight Federal Funds Rate plus 1.25% per annum. A commitment fee of 0.20% per annum is incurred on the unused portion of the committed facility. An administrative fee of $25,000 was paid in connection with the uncommitted facility. These fees are allocated to all participating funds. The Portfolio had no borrowings under the agreement during the year ended December 31, 2015.
NOTE E — SUBSEQUENT EVENTS
In preparing the financial statements as of December 31, 2015, no subsequent events or transactions occurred that would have required recognition or disclosure in these financial statements.
NOTICE TO SHAREHOLDERS (UNAUDITED)
For the fiscal year ended December 31, 2015, the Portfolio reports the maximum amount allowable of its net taxable income as eligible for the corporate dividends-received deduction.
14 www.calvert.com CALVERT VP VOLATILITY MANAGED GROWTH PORTFOLIO ANNUAL REPORT
CALVERT VP VOLATILITY MANAGED GROWTH PORTFOLIO
FINANCIAL HIGHLIGHTS
|
| | | | | | | | | | | | |
| | PERIODS ENDED | |
| | December 31, 2015 (a) | | December 31, 2014 (a) | | December 31, 2013 (a)(b) | |
| Net asset value, beginning |
| $16.60 |
| |
| $15.88 |
| |
| $15.00 |
| |
| Income from investment operations: | | | | | | |
| Net investment income | 0.23 |
| | 0.26 |
| | 0.21 |
| |
| Net realized and unrealized gain (loss) | (0.82) |
| | 0.63 |
| | 0.78 |
| |
| Total from investment operations | (0.59) |
| | 0.89 |
| | 0.99 |
| |
| Distributions from: | | | | | | |
| Net investment income | (0.19) |
| | (0.17) |
| | (0.11) |
| |
| Net realized gain | —(c) |
| | — |
| | — |
| |
| Total distributions | (0.19) |
| | (0.17) |
| | (0.11) |
| |
| Total increase (decrease) in net asset value | (0.78) |
| | 0.72 |
| | 0.88 |
| |
| Net asset value, ending |
| $15.82 |
| |
| $16.60 |
| |
| $15.88 |
| |
| Total return(d) | (3.51 | %) | | 5.61 | % | | 6.59 | % | |
| Ratios to average net assets: (e)(f) | | | | | | |
| Net investment income | 1.37 | % | | 1.57 | % | | 2.12%(g) |
| |
| Total expenses | 0.86 | % | | 0.94 | % | | 1.25%(g) |
| |
| Net expenses | 0.83 | % | | 0.83 | % | | 0.83%(g) |
| |
| Portfolio turnover | 17 | % | | 30 | % | | 1 | % | |
| Net assets, ending (in thousands) |
| $113,084 |
| |
| $82,389 |
| |
| $25,709 |
| |
| | | | | | | |
| (a)Per share figures are calculated using the Average Shares Method. |
| (b)From April 30, 2013 inception. |
| (c)Amount is less than $0.01 per share. |
| (d)Total return is not annualized for periods of less than one year and does not reflect charges and expenses of the variable annuity or variable universal life contract. |
| (e)Total expenses do not reflect amounts reimbursed and/or waived by the Advisor and certain of its affiliates, if applicable. Net expenses are net of all reductions and represent the net expenses paid by the Portfolio. |
| (f)Amounts do not include the income or expenses of the Underlying Funds. |
| (g)Annualized. |
| See notes to financial statements. |
www.calvert.com CALVERT VP VOLATILITY MANAGED GROWTH PORTFOLIO ANNUAL REPORT 15
PROXY VOTING
The Proxy Voting Guidelines that the Portfolio uses to determine how to vote proxies relating to portfolio securities is provided as an Appendix to the Fund’s Statement of Additional Information. The Statement of Additional Information can be obtained free of charge by calling the Fund at 1-800-368-2745, by visiting the Calvert website at www.calvert.com or by visiting the SEC’s website at www.sec.gov.
Information regarding how the Fund voted proxies relating to portfolio securities during the most recent 12-month period ended June 30 is available by calling the Fund, by visiting the Calvert website at www.calvert.com or visiting the SEC’s website at www.sec.gov.
AVAILABILITY OF QUARTERLY PORTFOLIO HOLDINGS
The Fund files its complete schedule of portfolio holdings with the SEC for the first and third quarters of each fiscal year on Form N-Q. The Fund’s Form N-Q is available on the SEC’s website at www.sec.gov. The Fund’s Form N-Q may be reviewed and copied at the SEC’s Public Reference Room in Washington, DC; information on the operation of the Public Reference Room may be obtained by calling 1-800-SEC-0330.
BASIS FOR BOARD'S APPROVAL OF INVESTMENT ADVISORY CONTRACTS
At a meeting held on December 9, 2015, the Board of Directors, and by a separate vote, the disinterested Directors, approved the continuance of the Investment Advisory Agreement between the Portfolio and the Advisor and the Investment Subadvisory Agreements between the Advisor and each Subadvisor with respect to the Portfolio.
In evaluating the Investment Advisory Agreement, the Board considered a variety of information relating to the Portfolio and the Advisor. The disinterested Directors reviewed a report prepared by the Advisor regarding various services provided to the Portfolio by the Advisor and its affiliates. Such report included, among other data, information regarding the Advisor's personnel and the Advisor's revenue and cost of providing services to the Portfolio, and a separate report prepared by an independent third party, which provided a statistical analysis comparing the Portfolio's investment performance, expenses, and fees to comparable mutual funds.
The disinterested Directors were separately represented by independent legal counsel with respect to their consideration of the reapproval of the Investment Advisory Agreement and each of the Investment Subadvisory Agreements. Prior to voting, the disinterested Directors reviewed the proposed continuance of the Investment Advisory Agreement and Investment Subadvisory Agreements with management and also met in private sessions with their counsel at which no representatives of management were present.
In the course of its deliberations regarding the Investment Advisory Agreement, the Board considered the following factors, among others: the nature, extent and quality of the services provided by the Advisor, including the personnel providing such services; the Advisor's financial condition; the level and method of computing the Portfolio's advisory fee; comparative performance, fee and expense information for the Portfolio; the profitability of the Calvert Family of Funds to the Advisor and its affiliates; the allocation of the Portfolio's brokerage, including the Advisor's process for monitoring "best execution"; the direct and indirect benefits, if any, derived by the Advisor and its affiliates from their relationship with the Portfolio; the effect of the Portfolio's growth and size on the Portfolio's performance and expenses; the Advisor's compliance programs and policies; the Advisor's performance of substantially similar duties for other funds; and any possible conflicts of interest.
In considering the nature, extent and quality of the services provided by the Advisor under the Investment Advisory Agreement, the Board reviewed information provided by the Advisor relating to its operations and personnel, including, among other information, biographical information on the Advisor's supervisory and professional staff and descriptions of its organizational and management structure. The Board also took into account similar information provided periodically throughout the previous year by the Advisor, as well as the Board’s familiarity with the Advisor’s management through Board of Directors' meetings, discussions and other reports. The Board considered the Advisor's current level of staffing and overall resources. The Board also noted that it reviewed on a quarterly basis information regarding the Advisor’s compliance with applicable policies and procedures, including those related to personal investing. The Advisor's administrative capabilities, including its ability to supervise the other service providers for the Portfolio, were also considered. The Board discussed the Advisor's effectiveness in monitoring the performance of each Subadvisor and its timeliness in responding to performance issues. The Board observed that the scope of services provided by the Advisor
16 www.calvert.com CALVERT VP VOLATILITY MANAGED GROWTH PORTFOLIO ANNUAL REPORT (UNAUDITED)
generally had expanded over time as a result of regulatory, market and other changes. The Board took into consideration, among other factors, the effectiveness of the Portfolio’s and Advisor’s processes, policies and procedures and the Advisor’s personnel. The Board also took into account, among other items, periodic reports received from the Advisor over the past year concerning the Advisor’s ongoing review and enhancement of certain processes, policies and procedures of the Portfolio and the Advisor. The Board concluded that it was satisfied with the nature, extent and quality of services provided to the Portfolio by the Advisor under the Investment Advisory Agreement.
In considering the Portfolio's performance, the Board noted that it reviewed on a quarterly basis detailed information about the Portfolio's performance results, portfolio composition and investment strategies. In addition, the Board took into account overall financial market conditions. The Board also reviewed various comparative data provided to it in connection with its consideration of the renewal of the Investment Advisory Agreement, including, among other information, a comparison of the Portfolio's total return with its Lipper index and with that of other mutual funds deemed to be in its peer universe by an independent third party in its report. This comparison indicated that the Portfolio performed above the median of its peer universe for the one-year period ended June 30, 2015. The data also indicated that the Portfolio underperformed its Lipper index for the one-year period ended June 30, 2015. The Board also took into account management’s discussion of the Portfolio’s performance and management’s statement that the Portfolio had performed in-line with expectations. Based upon its review, the Board concluded that the Portfolio’s performance was satisfactory in view of the Portfolio’s investment strategy.
In considering the Portfolio's fees and expenses, the Board compared the Portfolio's fees and total expense ratio with various comparative data for the funds in its peer universe. Among other findings, the data indicated that the Portfolio's advisory fee (after taking into account waivers and/or reimbursements) was below the median of its peer universe for the period ended June 30, 2015, and that total expenses (net of waivers and/or reimbursements) were below the median of its peer universe. The Board noted that the allocation of advisory and administrative fees may vary among the Portfolio’s peer universe. The Board also took into account the Advisor’s current undertaking to maintain expense limitations for the Portfolio. The Board noted that the Advisor paid each Subadvisor’s subadvisory fee under the Investment Subadvisory Agreement with respect to the Portfolio and that the Advisor is currently reimbursing the expenses of the Portfolio. The Board also took into account management's discussion of the Portfolio's expenses and certain factors that affected the level of such expenses, including the current size of the Portfolio. Based upon its review, the Board determined that the advisory fee was reasonable in view of the quality of services received by the Portfolio from the Advisor and the other factors considered.
The Board reviewed the Advisor’s profitability on a portfolio-by-portfolio basis. In reviewing the overall profitability of the advisory fee to the Portfolio's Advisor, the Board also considered the fact that affiliates of the Advisor provided shareholder servicing and administrative services to the Portfolio for which they received compensation. The information considered by the Board included Calvert’s operating profit margin information both before and after tax expenses with respect to the services that the Advisor and its affiliates provided to the Calvert Family of Funds complex. The Board reviewed the profitability of the Advisor's relationship with the Portfolio in terms of the total amount of annual advisory fees it received with respect to the Portfolio and whether the Advisor had the financial wherewithal to continue to provide services to the Portfolio. The Board also considered that the Advisor derived benefits to its reputation and other indirect benefits from its relationship with the Portfolio. In addition, the Board took into account that affiliates of the Advisor may benefit from certain indirect tax benefits relating to dividend received deductions and foreign tax credits. The Board also noted that the Advisor paid the subadvisory fee to each Subadvisor, including Ameritas Investment Partners, Inc. (“AIP”), an affiliate of the Advisor, and is currently reimbursing the expenses of the Portfolio. Based upon its review, the Board concluded that the Advisor’s and its affiliates’ level of profitability from their relationship with the Portfolio was reasonable.
The Board considered the effect of the Portfolio's current size and potential growth on its performance and fees. Although the Portfolio’s advisory fee did not contain breakpoints that would reduce the advisory fee rate on assets above specified asset levels, the Board noted that if the Portfolio’s assets increased over time, the Portfolio might realize other economies of scale if assets increased proportionally more than certain other expenses. The Board also noted that given the Portfolio’s current level of assets, the Portfolio would be unlikely to recognize economies of scale by implementing a breakpoint in the advisory fee at this time.
In reapproving the Investment Advisory Agreement, the Board, including the disinterested Directors, did not identify any single factor as controlling, and each Director may have attributed different weight to various factors.
www.calvert.com CALVERT VP VOLATILITY MANAGED GROWTH PORTFOLIO ANNUAL REPORT (UNAUDITED) 17
In evaluating the Investment Subadvisory Agreements, the disinterested Directors reviewed information provided by each Subadvisor relating to its operations, personnel, investment philosophy, strategies and techniques. Among other information, each Subadvisor provided biographical information on portfolio management and other professional staff, performance information for itself, and descriptions of its investment philosophies, strategies and techniques, organizational and management structures and brokerage policies and practices.
The Board reapproved the Investment Subadvisory Agreement between each Subadvisor and the Advisor based on a number of factors relating to the Subadvisor's ability to perform under the Investment Subadvisory Agreement. In the course of its deliberations, the Board evaluated, among other factors: the nature, extent and the quality of the services to be provided by each Subadvisor; each Subadvisor's management style and long-term performance record; the Portfolio's performance record and each Subadvisor's performance in employing its investment strategies; each Subadvisor's current level of staffing and its overall resources; the qualifications and experience of each Subadvisor's personnel; each Subadvisor's financial condition with respect to its ability to perform the services required under the Investment Subadvisory Agreement; each Subadvisor's risk management processes; each Subadvisor's compliance systems, including those related to personal investing; and any disciplinary history. Based upon its review, the Board concluded that it was satisfied with the nature, extent and quality of services provided to the Portfolio by each Subadvisor under the Investment Subadvisory Agreements.
As noted above, the Board considered, among other information, the Portfolio's performance during the one-year period ended June 30, 2015, as compared to the Portfolio's peer universe and noted that it reviewed on a quarterly basis detailed information about the Portfolio's performance results, portfolio composition and investment strategies. The Board noted the Advisor's expertise and resources in monitoring the performance, investment style and risk adjusted performance of each Subadvisor.
In considering the cost of services to be provided by each Subadvisor and the profitability to each Subadvisor of its relationship with the Portfolio, the Board noted that the Advisor and AIP were affiliated, and the subadvisory fee under each Investment Subadvisory Agreements was paid by the Advisor out of the advisory fee that the Advisor received under the Investment Advisory Agreement. The Board also relied on the ability of the Advisor to negotiate the Investment Subadvisory Agreement with Milliman Financial Risk Management LLC (“Milliman”) and the corresponding subadvisory fee at arm’s length. In addition, the Board took into account the fees Milliman charged to its other clients and considered these fee comparisons in light of the differences in managing these other accounts. Based upon its review, the Board determined that the subadvisory fee was reasonable in view of the quality of services received by the Portfolio from each Subadvisor and the other factors considered. Because the Advisor would pay each Subadvisor’s subadvisory fee, the cost of services to be provided by each Subadvisor and the level of profitability to each Subadvisor from its relationship with the Portfolio were not material factors in the Board’s deliberations. For similar reasons, the Board did not consider the potential economies of scale in each Subadvisor’s management of the Portfolio to be a material factor in its consideration.
In reapproving the Investment Subadvisory Agreements, the Board, including the disinterested Directors, did not identify any single factor as controlling, and each Director may have attributed different weight to various factors.
Conclusions
The Board reached the following conclusions regarding the Investment Advisory Agreement and the Investment Subadvisory Agreements, among others: (a) the Advisor has demonstrated that it possesses the capability and resources to perform the duties required of it under the Investment Advisory Agreement; (b) each Subadvisor is qualified to manage the Portfolio's assets in accordance with the Portfolio’s investment objective and policies; (c) the Advisor and each Subadvisor maintain appropriate compliance programs; (d) each Subadvisor is likely to execute its investment strategies consistently over time; (e) the performance of the Portfolio is satisfactory in view of the Portfolio’s investment strategy; and (f) the Portfolio's advisory and subadvisory fees are reasonable in view of the quality of services received by the Portfolio from the Advisor and Subadvisors and the other factors considered. Based on its conclusions, the Board determined that reapproval of the Investment Advisory Agreement and the Investment Subadvisory Agreements would be in the best interests of the Portfolio and its shareholders.
18 www.calvert.com CALVERT VP VOLATILITY MANAGED GROWTH PORTFOLIO ANNUAL REPORT (UNAUDITED)
DIRECTOR AND OFFICER INFORMATION TABLE
|
| | | | | |
| Name & Age | Position with Fund | Position Start Date | Principal Occupation During Last 5 Years | # of Calvert Portfolios Overseen | Other Directorships |
| INDEPENDENT DIRECTORS |
FRANK H. BLATZ, JR., Esq. AGE: 80 | Director | 1982 CVS
2008 CVP | Of counsel to firm of Schiller & Pittenger, P.C. | 13 | None |
ALICE GRESHAM BULLOCK AGE: 65 | Director | 1999 CVS
2008 CVP | Professor at Howard University School of Law. She is former Dean of Howard University School of Law and Deputy Director of the Association of American Law Schools. | 15 | None |
M. CHARITO KRUVANT AGE: 70 | Director | 1999 CVS
2008 CVP | President and CEO of Creative Associates International, Inc., a firm that specializes in human resources development, information management, public affairs and private enterprise development. | 22 | • Acacia Federal Savings Bank (through 2013) • Summit Foundation • WETA Public Broadcasting |
CYNTHIA MILLIGAN AGE: 69
| Director | 1999 CVS
2008 CVP | Dean Emeritus, College of Business Administration, University of Nebraska, Lincoln. She is former President and Chief Executive Officer for CMA, a consulting firm for financial institutions. | 15 | • Wells Fargo Company (banking and financial services) - NYSE • Wells Fargo Bank N.A. (Since 2014) • Gallup, Inc. (management consulting) • W.K. Kellogg Foundation • Raven Industries (technology company) - NASDAQ • Colonial Williamsburg Foundation • Kellogg Company (food manufacturing) - NYSE |
ARTHUR J. PUGH AGE: 78 | Director | 1982 CVS
2008 CVP | Retired executive. | 13 | None |
| INTERESTED DIRECTORS |
WILLIAM LESTER* AGE: 58 | Director & Chair (CVS)
Director & Senior Vice President (CVP) | 2004 CVS
2008 CVP | Executive Vice President Finance/Investments and Corporate Treasurer of Ameritas Mutual Holding Company. Chair and former President (resigned 2012) of Ameritas Investment Partners, Inc. | 13 | • Acacia Federal Savings Bank (through 2013)• Ameritas Investment Partners, Inc. (financial services)• Ameritas Investment Corp. (financial services)• Universal and Inland Insurance Companies• Bryan/LGH Health Systems |
www.calvert.com CALVERT VP VOLATILITY MANAGED GROWTH PORTFOLIO ANNUAL REPORT (UNAUDITED) 19
|
| | | | | |
| Name & Age | Position with Fund | Position Start Date | Principal Occupation During Last 5 Years | # of Calvert Portfolios Overseen | Other Directorships |
| INTERESTED DIRECTORS |
JOHN H. STREUR* AGE: 56
| President (CVS)
Director, Chair & President (CVP) | 2015 | President and Chief Executive Officer of Calvert Investments, Inc. (since January 2015) and Chief Compliance Officer for the Advisor and Calvert Investment Distributors, Inc. (since August 10, 2015); President and Director, Portfolio 21 Investments, Inc. (through October 2014); President, Chief Executive Officer and Director, Managers Investment Group LLC (through January 2012); President and Director, The Managers Funds and Managers AMG Funds (through January 2012). | 40 | • Portfolio 21 Investments, Inc. (asset management)(through October 2014) • Managers Investment Group LLC (asset management)(through January 2012) • The Managers Funds (asset management) (through January 2012) • Managers AMG Funds (asset management) (through January 2012) • Calvert Social Investment Foundation |
|
| | | |
| Name & Age | Position with Fund | Position Start Date | Principal Occupation During Last 5 Years |
| OFFICERS |
VICKI L. BENJAMIN AGE: 54 | Treasurer | 2015 | Executive Vice President, Chief Financial Officer and Chief Operating Officer of Calvert Investments, Inc. since October 2015; Senior Vice President and Chief Financial Officer of Calvert Investments, Inc. (March 2015 - September 2015). Prior to Calvert, Ms. Benjamin was a Senior Partner at KPMG. |
ROBERT D. BENSON, ESQ. AGE: 37 | Assistant Vice President & Assistant Secretary | 2014 | Assistant General Counsel (since 2014), Assistant Vice President & Assistant Secretary (since 2015) and Staff Attorney (prior to 2014), Calvert Investments, Inc. |
HOPE BROWN AGE: 42 | Chief Compliance Officer | 2014 | Chief Compliance Officer for the Calvert Funds (since 2014). Vice President and Chief Compliance Officer, Wilmington Funds (2012-2014). Vice President and Senior Compliance Officer, Wilmington Trust Investment Advisors, Inc. (2010-2012). |
STU DALHEIM AGE: 46 | Vice President | 2015 | Vice President - Shareholder Advocacy for the Advisor. |
MATTHEW DUCH Age: 40 | Vice President | 2011 | Vice President of the Advisor and portfolio manager for Calvert’s taxable fixed-income funds. |
ROBERT J. ENDERSON, CFA AGE: 57 | Assistant Treasurer | 2014 | Vice President, Corporate Finance, of Calvert Investments, Inc.; Acting Chief Financial Officer of Calvert Investments, Inc. (September 2014 - March 2015). |
PATRICK FAUL AGE: 51 | Vice President | 2010 | Vice President and Head of Credit Research for the Advisor. |
TRACI L. GOLDT AGE: 42 | Assistant Secretary | 2004 | SEC Filing and Administrative Operations Manager, Calvert Investments, Inc. |
JADE HUANG AGE: 41 | Vice President | 2015 | Equity Portfolio Manager since November 2015 and Senior Equity Analyst prior to November 2015, Advisor. |
EMILY KAISER AGE: 32 | Assistant Vice President | 2015 | Senior Sustainability Analyst since November 2015 and Sustainability Analyst (January 2014 - October 2015), Advisor. Prior to joining Calvert, Ms. Kaiser attended law school from 2010 to 2013 and also held legal and policy positions with the U.S. Agency for International Development (2013), the Solidarity Center, AFL-CIO (2013), the U.S. Department of Labor (2012), the office of the U.S. Trade Representative (2012) and the Public International Law and Policy Group (2011-2012). |
VISHAL KHANDUJA, CFA AGE: 37 | Vice President | 2014 | Head of Taxable Fixed Income (since 2015) and Vice President of the Advisor (since 2014); Portfolio Manager for Calvert’s taxable fixed-income funds since 2012. Previously worked at Columbia Management as Portfolio Manager - Global Rates and Currency Team (2009-2012). |
20 www.calvert.com CALVERT VP VOLATILITY MANAGED GROWTH PORTFOLIO ANNUAL REPORT (UNAUDITED)
|
| | | |
| Name & Age | Position with Fund | Position Start Date | Principal Occupation During Last 5 Years |
| OFFICERS |
LANCELOT A. KING, ESQ. AGE: 45 | Assistant Vice President & Secretary | 2002 | Assistant Vice President, Assistant Secretary and Associate General Counsel of Calvert Investments, Inc. |
ERICA LASDON AGE: 44 | Assistant Vice President | 2015 | Director of Sustainability Research since August 2015 and Senior Sustainability Analyst and Manager prior to August 2015, Advisor. |
JOSHUA LINDER AGE: 30 | Vice President | 2015 | Equity Portfolio Manager since November 2015, Assistant Portfolio Manager (January 2014 - October 2015) and Equity Analyst (2011 - 2013), Advisor. |
CHRISTOPHER MADDEN AGE: 40 | Vice President | 2015 | Equity Portfolio Manager since November 2015 and Senior Equity Analyst prior to November 2015, Advisor. |
ANDREW K. NIEBLER, ESQ. AGE: 48 | Assistant Vice President & Assistant Secretary | 2006 | Assistant Vice President, Assistant Secretary and Associate General Counsel of Calvert Investments, Inc. |
MARYBETH PILAT, CPA AGE: 47 | Fund Controller and Assistant Treasurer | 2015 | Director of Fund Administration, Calvert Investment Administrative Services, Inc. since August 2015. VP Expense & Budgeting, Global Fiduciary Platform, Legg Mason (May 2015 - July 2015). Vice President and Assistant Treasurer, Columbia Funds, Ameriprise, Columbia Management (2010 - April 2015). |
| |
| * | The address of Directors and Officers is 4550 Montgomery Avenue, Suite 1000N, Bethesda, Maryland 20814. Mr. Streur is an interested person of the Fund since he is an officer and director of the Fund’s Advisor and its affiliates. Mr. Lester is an interested person of the Fund since he is an officer and director of the parent company of the Fund’s Advisor. |
Additional information about the Fund’s Directors can be found in the Statement of Additional Information (SAI). You can get a free copy of the SAI by contacting your broker, or the Fund at 1-800-368-2745.
www.calvert.com CALVERT VP VOLATILITY MANAGED GROWTH PORTFOLIO ANNUAL REPORT (UNAUDITED) 21
|
| |
| | |
This report is intended to provide fund information to shareholders. It is not authorized for distribution to prospective investors unless preceded or accompanied by a prospectus. Note: The information on our website is not incorporated by reference into this report; our website address is included as an inactive textual reference only. Investors should carefully consider the investment objectives, risks, charges and expenses of the Calvert Funds. This and other important information is contained in the fund’s summary prospectus and prospectus, which can be obtained from your financial professional and should be read carefully before investing. You may also call Calvert at 800/368-2745. |
| Printed on recycled paper using soy inks. | |
Item 2. Code of Ethics.
(a) The registrant has adopted a code of ethics (the "Code of Ethics") that applies to its principal executive officer and principal financial officer (also referred to as “principal accounting officer”).
(b) No information need be disclosed under this paragraph.
(c) The registrant has not amended its Code of Ethics during the period covered by the shareholder report presented in Item 1 hereto.
(d) The registrant has not granted a waiver or implicit waiver from a provision of its Code of Ethics during the period covered by the shareholder report presented in Item 1 hereto.
(e) Not applicable.
(f) The registrant's Code of Ethics is attached as an Exhibit hereto.
Item 3. Audit Committee Financial Expert.
The registrant's Board of Trustees/Directors has determined that M. Charito Kruvant, an “independent” Trustee/Director serving on the registrant’s audit committee, is an “audit committee financial expert,” as defined in Item 3 of Form N-CSR. Under applicable securities laws, a person who is determined to be an audit committee financial expert will not be deemed an "expert" for any purpose, including without limitation for the purposes of Section 11 of the Securities Act of 1933, as a result of being designated or identified as an audit committee financial expert. The designation or identification of a person as an audit committee financial expert does not impose on such person any duties, obligations, or liabilities that are greater than the duties, obligations, and liabilities imposed on such person as a member of the audit committee and Board of Trustees in the absence of such designation or identification.
Item 4. Principal Accountant Fees and Services.
Services fees paid to auditing firm:
|
| | | | |
| | Fiscal Year
ended 12/31/15 | Fiscal Year
ended 12/31/14 |
| | $ | %* | $ | % * |
| | | | | |
| (a) Audit Fees | $215,512 | 0% | $203,523 | 0% |
| (b) Audit-Related Fees | $0 | 0% | $0 | 0% |
| (c) Tax Fees (tax return preparation and filing for the registrant) | $37,100 | 0% | $33,330 | 0% |
| (d) All Other Fees | $0 | 0% | $0 | 0% |
| | | | | |
| Total | $252,612 | 0% | $236,853 | 0% |
* Percentage of fees approved by the Audit Committee pursuant to (c)(7)(i)(C) of Rule 2-01 of Reg. S-X (statutory de minimis waiver of Committee’s requirement to pre-approve)
(e) Audit Committee pre-approval policies and procedures:
The Audit Committee is required to pre-approve all audit and non-audit services provided to the registrant by the auditors, and to the registrant’s investment advisor, and any entity controlling, controlled by, or under common control with the advisor that provides ongoing services to the registrant. In determining whether to pre-approve non-audit services, the Audit Committee considers whether the services are consistent with maintaining the independence of the auditors. The Committee may delegate its authority to pre-approve certain matters to one or more of its members. In this regard, the Committee has delegated authority jointly to the Audit Committee Chair together with another Committee member with respect to non-audit services not exceeding $25,000 in each instance. In addition, the Committee has pre-approved the retention of the auditors to provide tax-related services related to the tax treatment and tax accounting of newly acquired securities, upon request by the investment advisor in each instance.
(f) Not applicable.
(g) Aggregate non-audit fees billed by the registrant’s accountant for services rendered to the registrant, and rendered to the registrant’s investment advisor, and any entity controlling, controlled by, or under common control with the advisor that provides ongoing services to the registrant for each of the last two fiscal years of the registrant:
|
| | | | |
| | Fiscal Year
ended 12/31/15 | Fiscal Year
ended 12/31/14 |
| | $ | %* | $ | % * |
| | | | | |
| | $325,000 | 0%* | $28,146 | 0%* |
* Percentage of fees approved by the Audit Committee pursuant to (c)(7)(i)(C) of Rule 2-01 of Reg. S-X (statutory de minimis waiver of Committee’s requirement to pre-approve)
(h) The registrant’s Audit Committee of the Board of Trustees has considered whether the provision of non-audit services that were rendered to the registrant’s investment advisor, and any entity controlling, controlled by, or under common control with the investment advisor that provides ongoing services to the registrant that were not pre-approved pursuant to paragraph (c) (7)(ii) of Rule 2-01 of Reg. S-X is compatible with maintaining the principal accountant’s independence and found that the provision of such services is compatible with maintaining the principal accountant’s independence.
Item 5. Audit Committee of Listed Registrants.
Not applicable.
Item 6. Schedule of Investments.
| |
| (a) | This Schedule is included as part of the report to shareholders filed under Item 1 of this Form. |
Item 7. Disclosure of Proxy Voting Policies and Procedures for Closed-End Management Investment Companies.
Not applicable.
Item 8. Portfolio Managers of Closed-End Management Investment Companies.
Not applicable.
Item 9. Purchases of Equity Securities by Closed-End Management Investment Company and Affiliated Purchasers.
Not applicable.
Item 10. Submission of Matters to a Vote of Security Holders.
There have been no changes to the procedures by which shareholders may recommend nominees to the registrant's Board of Directors since registrant last provided disclosure in response to this Item.
Item 11. Controls and Procedures.
(a) The principal executive and financial officers concluded that the registrant's disclosure controls and procedures (as defined in Rule 30a-3(c) under the 1940 Act) are effective, based on the evaluation of these controls and procedures required by Rule 30a-
3(b) under the 1940 Act and Rules 13a-15(b) or 15d-15(b) under the Exchange Act, as of a date within 90 days of the filing date of this report.
(b) There was no change in the registrant's internal control over financial reporting (as defined in Rule 30a-3(d) under the 1940 Act) that occurred during the registrant's second fiscal quarter of the period covered by this report that has materially affected, or is reasonably likely to materially affect, the registrant's internal control over financial reporting.
Item 12. Exhibits.
(a)(1) A copy of the Registrant’s Code of Ethics.
Attached hereto.
(a)(2) A separate certification for each principal executive officer and principal financial officer of the registrant as required by Rule 30a-2 under the Act (17 CFR 270.30a-2).
Attached hereto.
(a)(3) Not applicable.
(b) A certification for the registrant's Principal Executive Officer and Principal Financial Officer, as required by Rule 30a-2(b) under the Investment Company Act of 1940, is attached hereto. The certification furnished pursuant to this paragraph is not deemed to be "filed" for purposes of Section 18 of the Securities Exchange Act of 1934, or otherwise subject to the liability of that section. Such certification is not deemed to be incorporated by reference into any filing under the Securities Act of 1933 or the Securities Exchange Act of 1934, except to the extent that the registrant specifically incorporates it by reference.
Pursuant to the requirements of the Securities Exchange Act of 1934 and the Investment Act of 1940, the registrant has duly caused this report to be signed on its behalf by the undersigned, thereunto duly authorized.
CALVERT VARIABLE PRODUCTS, INC.
By: /s/ John H. Streur
John H. Streur
President -- Principal Executive Officer
Date: March 4, 2016
Pursuant to the requirements of the Securities Exchange Act of 1934 and the Investment Act of 1940, this report has been signed below by the following persons on behalf of the registrant and in the capacities and on the dates indicated.
/s/ John H. Streur
John H. Streur
President -- Principal Executive Officer
Date: March 4, 2016
/s/ Vicki L. Benjamin
Vicki L. Benjamin
Treasurer -- Principal Financial Officer
Date: March 4, 2016