UNITED STATES
SECURITIES AND EXCHANGE COMMISSION
Washington, D.C. 20549
FORM N-CSR
CERTIFIED SHAREHOLDER REPORT OF REGISTERED
MANAGEMENT INVESTMENT COMPANIES
Investment Company Act file number: 811-04000
CaLvert Variable Products, Inc.
(Exact name of registrant as specified in charter)
4550 Montgomery Avenue
Suite 1000N
Bethesda, Maryland 20814
(Address of Principal Executive Offices)
William M. Tartikoff, Esq.
4550 Montgomery Avenue
Suite 1000N
Bethesda, Maryland 20814
(Name and Address of Agent for Service)
Registrant's telephone number, including area code: (301) 951-4800
Date of fiscal year end: December 31
Date of reporting period: Year ended December 31, 2013
Item 1. Report to Stockholders.
[Calvert VP SRI Large Cap Value Portfolio Annual Report to Shareholders]
[Calvert VP S&P 500 Index Portfolio Annual Report to Shareholders]
[Calvert VP S&P MidCap 400 Index Portfolio Annual Report to Shareholders]
[Calvert VP Nasdaq-100 Index Portfolio Annual Report to Shareholders]
[Calvert VP Russell 2000 Small Cap Index Portfolio Annual Report to Shareholders]
[Calvert VP EAFE International Index Portfolio Annual Report to Shareholders]
[Calvert VP Investment Grade Bond Index Portfolio Annual Report to Shareholders]
[Calvert VP Inflation Protected Plus Portfolio Annual Report to Shareholders]
[Calvert VP Natural Resources Portfolio Annual Report to Shareholders]
[Calvert VP Volatility Managed Moderate Portfolio Annual Report to Shareholders]
[Calvert VP Volatility Managed Moderate Growth Portfolio Annual Report to Shareholders]
[Calvert VP Volatility Managed Growth Portfolio Annual Report to Shareholders]
CALVERT VP SRI LARGE CAP VALUE PORTFOLIO
Portfolio within Calvert Variable Products, Inc.
Managed by Calvert Investment Management, Inc.
INVESTMENT PERFORMANCE
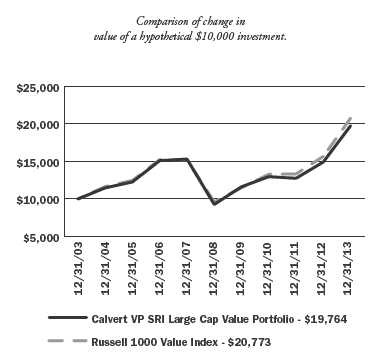
For the one-year period ended December 31, 2013, Calvert VP SRI Large Cap Value Portfolio returned 32.39% versus 32.53% for the Russell 1000 Value Index. The slight underperformance was primarily driven by stock selection in the Industrials, Technology, and Materials sectors.
INVESTMENT CLIMATE
The politicians in Washington D.C. finally learned their lesson as far as having a semblance of fiscal sanity. For the first time since 1986, a divided Congress was able to pass a budget. The annual debt crisis we have become accustomed to was avoided and investors rejoiced. Additionally, the Federal Reserve (Fed) announced in December 2013 that it would begin “tapering” the propping up of financial assets (“Quantitative Easing”) since the economy appeared to be on sound footing. Meanwhile, the Fed announced Janet Yellen would replace the retiring Ben Bernanke.
The unemployment rate started the year at 7.9% and steadily declined to 7.0% by year-end. The economy also managed to grow steadily from 1.8% to 4.1% through the third quarter. Automobile sales continued their rebound. Housing starts climbed and home prices increased 9% to a seven-year high, following the housing crisis that began five years ago. The recovery in auto and housing credit are closely tied to the Quantitative Easing the Federal Reserve undertook to stabilize the economy.
The investment climate of a less acrimonious and scare-mongering Congress—coupled with declining unemployment, rising economic growth and a healthy recovery in cyclical industries—provided strong support for equities. Flows haven’t followed suit yet, as the vast amount of investable funds remains in cash and bonds—that rotation is yet to come.
| | AVERAGE ANNUAL TOTAL RETURN |
| | (period ended 12.31.13) |
| |
| One year | 32.39% |
| Five year | 16.35% |
| Ten year | 7.05% |
The performance data shown represents past performance, does not guarantee future results and assumes reinvestment of all dividends and distributions. All performance data reflects fee waivers and/or expense limitations, if any are in effect; in their absence performance would be lower. See Note B in Notes to Financial Statements. The investment return and principal value of an investment will fluctuate so that an investor’s shares, when redeemed, may be worth more or less than their original cost. Current performance may be lower or higher than the performance data quoted. Visit www.calvert.com/ institutional-VP-performance.html for current performance data. The gross expense ratio from the current prospectus for the Portfolio is 0.85%. This number may vary from the expense ratio shown elsewhere in this report because it is based on a different time period and, if applicable, does not include fee or expense waivers. The performance data and expense ratio reflect deduction of Portfolio operating expenses, but do not reflect charges and expenses imposed under the variable annuity or life insurance contract.
4 www.calvert.com CALVERT VP SRI LARGE CAP VALUE PORTFOLIO ANNUAL REPORT
| |
| | % OF TOTAL |
| ECONOMIC SECTORS | INVESTMENTS |
| |
| Consumer Discretionary | 10.0% |
| Consumer Staples | 5.9% |
| Energy | 13.2% |
| Financials | 26.0% |
| Health Care | 11.8% |
| Industrials | 9.3% |
| Information Technology | 9.8% |
| Materials | 5.7% |
| Short-Term Investments | 1.4% |
| Telecommunication Services | 4.9% |
| Utilities | 2.0% |
| Total | 100% |
PORTFOLIO STRATEGY
The economy has been slow to emerge from the shock of the 2008 financial crisis. In 2013, the economy started to evince some “animal spirits” and achieved economic growth approaching 4%. The portfolio was geared to take advantage of this type of economic growth.
To raise funds to invest in more cyclical names, some smaller positions were liquidated, including four holdings that were received as a result of spin-offs. Also, 15 names were sold after achieving their price target, including CBS, ConocoPhillips and Hartford Financial—which had rebounded from much lower levels. Deere, Barrick Gold, and Newmont Mining were also sold, due to poor near-term earnings outlooks.
Four new companies were purchased with the proceeds. These were BB&T and Capital One in the banking sub-sector, BCE Inc in the telecom sub-sector and Eaton Corp in the industrial production sub-sector. In addition, we increased positions in other more cyclical holdings the Fund already held to take advantage of the incipient economic rebound.
PERFORMANCE CONTRIBUTORS
The top three contributors to performance were the Financials, Energy, and Utilities sectors. Financials outperformed due to superior sub-sector allocation and stock selection. We also avoided holding real estate investment trusts. Better stock selection in insurance companies such as Hartford Financial, MetLife, and American International Group helped. The Fund also benefited from an overweight to commercial banks, with holdings in KeyCorp and PNC Financial.
Energy holdings in the Portfolio also outperformed the Index, thanks to an underweight to this underper-forming sector and solid stock selection. Overweight holdings in refiners Phillips 66 and Marathon Petroleum added to performance, as did a position in ConocoPhillips. The refiners outperformed as they benefited from discounted West Texas Intermediate crude relative to Brent crude prices, rising exports, and master limited partnership IPOs. The fund exited Marathon Petroleum as the Brent WTI spread narrowed and catalysts diminished. Relative performance was benefited from avoiding Chevron and an underweight in ExxonMobil.
Finally, the fund underweighted the poorly performing Utilities sector. Multi-utilities were poor performers over the year and were avoided.
PERFORMANCE DETRACTORS
The Portfolio’s top three detractors from performance were the Industrials, Technology, and Materials sectors. We were underweight the outperforming Industrials sector and also had poor stock selection. The biggest detractor was a lack of exposure to certain aerospace & defense industry holdings, which performed well during the period but did not the meet Portfolio’s ESG criteria. Holdings in ADT and Deere also hurt, and were among the bottom ten contributors to return.
Poor stock selection in Technology also hurt relative performance. The Fund did not hold Apple or Hewlett Packard, which outperformed for the year. A position in IBM also hurt relative performance, although we did take profits early in the year as the stock neared full valuation. However, TE Connectivity helped partly offset the lower performance.
Holdings in gold stock, Newmont Mining and Barrick Gold, primarily drove the weak performance of Materials. We sold them during the first half of the year as gold prices plummeted and a recovery in earnings
www.calvert.com CALVERT VP SRI LARGE CAP VALUE PORTFOLIO ANNUAL REPORT 5
looked very unlikely. This was partly offset with an overweight of chemical companies, Dow Chemical and DuPont, which were top ten contributors to return. Management at both companies is focused on restructuring their portfolios towards higher margin businesses.
OUTLOOK
The economy has been growing for over three years but has only recently begun to expand. Although unemployment has declined to 7%, housing has begun to rebuild, and the Fed has begun tapering its purchases of fixed-income securities. The Fed, however, remains in stimulus mode as there appears to be no rebound in inflation.
In an environment of increasing economic growth and a simultaneous increase in corporate earnings, equities are the preferred financial asset. Fixed income could suffer from fears of inflation rebounding or excessive demand for credit and rising interest rates. As equity investors, we will remain diversified among sectors, investing with the expectations of a rebounding economy and rising interest rates. We also plan to remain fully invested, as many investors still have not rotated back into equities from cash and fixed income.
January 2014
The following holdings represented the following percentages of Fund net assets as of December 31, 2013: CBS 0%, ConocoPhillips 0%, Hartford Insurance 0%, Deere 0%, Barrick Gold 0%, Newmont Mining 0%, BB&T 3.14%, Capital One 3.33%, BCE Inc. 2.38%, Eaton Corp. 2.51%, MetLife 1.69%, American International Group 1.78%, KeyCorp 0%, PNC Financial 3.23%, Phillips 66 1.57%, Marathon 2.80%, Chevron 0%, ExxonMobil 0%, ADT 0%, Apple 0%, Hewlett Packard 0%, IBM 1.49%, TE Connectivity 1.72%, Dow Chemical 3.35%, and DuPont, 2.37%. Holdings are subject to change.
6 www.calvert.com CALVERT VP SRI LARGE CAP VALUE PORTFOLIO ANNUAL REPORT
SHAREHOLDER EXPENSE EXAMPLE
As a shareholder of the Fund, you incur two types of costs: (1) transaction costs, and (2) ongoing costs, including management fees and other Fund expenses. This Example is intended to help you understand your ongoing costs (in dollars) of investing in the Fund and to compare these costs with the ongoing costs of investing in other mutual funds.
This Example is based on an investment of $1,000 invested at the beginning of the period and held for the entire period (July 1, 2013 to December 31, 2013).
Note: Expenses do not reflect charges and expenses of the variable annuity or variable universal life contract.
Actual Expenses
The first line of the table below provides information about actual account values and actual expenses. You may use the information in this line, together with the amount you invested, to estimate the expenses that you paid over the period. Simply divide your account value by $1,000 (for example, an $8,600 account value divided by $1,000 = 8.6), then multiply the result by the number in the first line under the heading entitled “Expenses Paid During Period” to estimate the expenses you paid on your account during this period.
Hypothetical Example for Comparison Purposes
The second line of the table below provides information about hypothetical account values and hypothetical expenses based on the Fund’s actual expense ratio and an assumed rate of return of 5% per year before expenses, which is not the Fund’s actual return. The hypothetical account values and expenses may not be used to estimate the actual ending account balance or expenses you paid for the period. You may use this information to compare the ongoing costs of investing in the Fund and other funds. To do so, compare the 5% hypothetical example with the 5% hypothetical examples that appear in the shareholder reports of the other funds.
Please note that the expenses shown in the table are meant to highlight your ongoing costs only and do not reflect any transactional costs. Therefore, the second line of the table is useful in comparing ongoing costs only, and will not help you determine the relative total costs of owning different funds. In addition, if these transactional costs were included, your costs would have been higher.
| | BEGINNING | ENDING | EXPENSES PAID |
| | ACCOUNT VALUE | ACCOUNTVALUE | DURINGPERIOD* |
| | 7/1/13 | 12/31/13 | 7/1/13 - 12/31/13 |
| |
| Actual | $1,000.00 | $1,145.96 | $4.21 |
| |
Hypothetical
(5% return per year before expenses) | $1,000.00 | $1,021.28 | $3.97 |
* Expenses are equal to the Fund’s annualized expense ratio of 0.78%, multiplied by the average account value over the period, multiplied by 184/365 (to reflect the one-half year period).
www.calvert.com CALVERT VP SRI LARGE CAP VALUE PORTFOLIO ANNUAL REPORT 7
REPORT OF INDEPENDENT REGISTERED PUBLIC ACCOUNTING FIRM
The Board of Directors of Calvert Variable Products, Inc. and Shareholders of Calvert VP SRI Large Cap Value Portfolio: We have audited the accompanying statement of net assets of the Calvert VP SRI Large Cap Value Portfolio (the “Portfolio”), a series of Calvert Variable Products, Inc., as of December 31, 2013, and the related statement of operations for the year then ended, the statements of changes in net assets for each of the years in the two-year period then ended, and the financial highlights for each of the years in the five-year period then ended. These financial statements and financial highlights are the responsibility of the Portfolio’s management. Our responsibility is to express an opinion on these financial statements and financial highlights based on our audits.
We conducted our audits in accordance with the standards of the Public Company Accounting Oversight Board (United States). Those standards require that we plan and perform the audit to obtain reasonable assurance about whether the financial statements and financial highlights are free of material misstatement. An audit includes examining, on a test basis, evidence supporting the amounts and disclosures in the financial statements. Our procedures included confirmation of securities owned as of December 31, 2013, by correspondence with the custodian and brokers or by performing other appropriate auditing procedures. An audit also includes assessing the accounting principles used and significant estimates made by management, as well as evaluating the overall financial statement presentation. We believe that our audits provide a reasonable basis for our opinion.
In our opinion, the financial statements and financial highlights referred to above present fairly, in all material respects, the financial position of the Calvert VP SRI Large Cap Value Portfolio as of December 31, 2013, the results of its operations for the year then ended, the changes in its net assets for each of the years in the two-year period then ended, and the financial highlights for each of the years in the five-year period then ended, in conformity with U.S. generally accepted accounting principles.

Philadelphia, Pennsylvania
February 24, 2014
8 www.calvert.com CALVERT VP SRI LARGE CAP VALUE PORTFOLIO ANNUAL REPORT
| | |
| STATEMENT OF NET ASSETS |
| DECEMBER 31, 2013 |
| |
| EQUITY SECURITIES - 98.1% | SHARES | VALUE |
| Beverages - 1.5% | | |
| PepsiCo, Inc | 27,700 | $2,297,438 |
| |
| Capital Markets - 4.0% | | |
| Goldman Sachs Group, Inc | 12,500 | 2,215,750 |
| Morgan Stanley | 131,200 | 4,114,432 |
| | | 6,330,182 |
| |
| Chemicals - 5.7% | | |
| Dow Chemical Co. | 117,600 | 5,221,440 |
| E. I. du Pont de Nemours & Co. | 56,900 | 3,696,793 |
| | | 8,918,233 |
| |
| Commercial Banks - 6.4% | | |
| BB&T Corp | 131,300 | 4,900,116 |
| The PNC Financial Services Group, Inc. | 65,000 | 5,042,700 |
| | | 9,942,816 |
| |
| Commercial Services & Supplies - 3.2% | | |
| Tyco International Ltd. | 121,825 | 4,999,698 |
| |
| Consumer Finance - 3.3% | | |
| Capital One Financial Corp. | 67,800 | 5,194,158 |
| |
| Diversified Financial Services - 8.7% | | |
| Bank of America Corp. | 267,584 | 4,166,283 |
| Berkshire Hathaway, Inc., Class B* | 39,650 | 4,700,904 |
| Citigroup, Inc. | 89,800 | 4,679,478 |
| | | 13,546,665 |
| |
| Diversified Telecommunication Services - 4.9% | | |
| AT&T, Inc. | 110,300 | 3,878,148 |
| BCE, Inc. | 85,700 | 3,709,953 |
| | | 7,588,101 |
| |
| Electric Utilities - 2.0% | | |
| The Southern Co. | 75,300 | 3,095,583 |
| |
| Electrical Equipment - 2.5% | | |
| Eaton Corp. plc | 51,400 | 3,912,568 |
| |
| Electronic Equipment & Instruments - 1.7% | | |
| TE Connectivity Ltd | 48,825 | 2,690,746 |
| |
| Food & Staples Retailing - 2.3% | | |
| CVS Caremark Corp | 49,700 | 3,557,029 |
| |
| Food Products - 2.1% | | |
| Unilever NV, NY Shares | 81,000 | 3,258,630 |
www.calvert.com CALVERT VP SRI LARGE CAP VALUE PORTFOLIO ANNUAL REPORT 9
| | |
| EQUITY SECURITIES - CONT’D | SHARES | VALUE |
| Health Care Equipment & Supplies - 3.4% | | |
| Abbott Laboratories | 35,700 | $1,368,381 |
| Covidien plc | 57,125 | 3,890,212 |
| | | 5,258,593 |
| |
| Health Care Providers & Services - 1.4% | | |
| WellPoint, Inc. | 26,100 | 2,411,379 |
| |
| Industrial Conglomerates - 3.5% | | |
| General Electric Co | 196,500 | 5,507,895 |
| |
| Insurance - 3.5% | | |
| American International Group, Inc. | 54,500 | 2,782,225 |
| MetLife, Inc. | 48,900 | 2,636,688 |
| | | 5,418,913 |
| |
| Internet Software & Services - 4.7% | | |
| eBay, Inc.* | 69,300 | 3,803,877 |
| Google, Inc.* | 3,100 | 3,474,201 |
| | | 7,278,078 |
| |
| IT Services - 1.5% | | |
| International Business Machines Corp. | 12,400 | 2,325,868 |
| |
| Media - 5.8% | | |
| Comcast Corp | 70,700 | 3,673,925 |
| DIRECTV* | 47,000 | 3,247,230 |
| Time Warner, Inc. | 29,966 | 2,089,230 |
| | | 9,010,385 |
| |
| Multiline Retail - 2.3% | | |
| Target Corp | 57,600 | 3,644,352 |
| |
| Oil, Gas & Consumable Fuels - 13.2% | | |
| Devon Energy Corp. | 76,100 | 4,708,307 |
| Marathon Oil Corp | 123,900 | 4,373,670 |
| Occidental Petroleum Corp | 54,400 | 5,173,440 |
| Phillips 66 Co. | 31,821 | 2,454,354 |
| Royal Dutch Shell plc (ADR) | 53,600 | 3,820,072 |
| | | 20,529,843 |
| |
| Pharmaceuticals - 6.8% | | |
| Merck & Co., Inc. | 54,100 | 2,707,705 |
| Pfizer, Inc. | 114,282 | 3,500,458 |
| Zoetis, Inc | 135,303 | 4,423,055 |
| | | 10,631,218 |
| |
| Software - 1.9% | | |
| Microsoft Corp. | 77,400 | 2,897,082 |
| |
| Specialty Retail - 1.8% | | |
| Lowe’s Co.’s, Inc | 57,900 | 2,868,945 |
| |
| |
| Total Equity Securities (Cost $121,170,213) | | 153,114,398 |
10 www.calvert.com CALVERT VP SRI LARGE CAP VALUE PORTFOLIO ANNUAL REPORT
| | |
| | PRINCIPAL | |
| TIME DEPOSIT - 1.4% | AMOUNT | VALUE |
| State Street Bank Time Deposit, 0.083%, 1/2/14 | $2,101,320 | $2,101,320 |
| |
| Total Time Deposit (Cost $2,101,320) | | 2,101,320 |
| |
| |
| |
| TOTAL INVESTMENTS (Cost $123,271,533) - 99.5% | | 155,215,718 |
| Other assets and liabilities, net - 0.5% | | 822,370 |
| NET ASSETS - 100% | | $156,038,088 |
| |
| |
| |
| NET ASSETS CONSISTS OF: | | |
| Paid-in capital applicable to 1,622,105 shares of common stock outstanding; | | |
| $0.10 par value, 40,000,000 shares authorized | | $148,159,491 |
| Undistributed net investment income | | 303,806 |
| Accumulated net realized gain (loss) on investments and foreign currency transactions | | (24,369,407) |
| Net unrealized appreciation (depreciation) on investments and assets and liabilities | | |
| denominated in foreign currencies | | 31,944,198 |
| |
| NET ASSETS | | $156,038,088 |
| |
| NET ASSET VALUE PER SHARE | | $96.19 |
* Non-income producing security.
Abbreviations:
ADR: American Depositary Receipts
plc: Public Limited Company
See notes to financial statements.
www.calvert.com CALVERT VP SRI LARGE CAP VALUE PORTFOLIO ANNUAL REPORT 11
| |
| STATEMENT OF OPERATIONS |
| YEAR ENDED DECEMBER 31, 2013 |
| |
| NET INVESTMENT INCOME | |
| Investment Income: | |
| Dividend income (net of foreign taxes withheld of $52,523) | $3,312,087 |
| Interest income | 3,178 |
| Total investment income | 3,315,265 |
| |
| Expenses: | |
| Investment advisory fee | 928,231 |
| Transfer agency fees and expenses | 21,373 |
| Directors’ fees and expenses | 24,642 |
| Administrative fees | 145,036 |
| Accounting fees | 22,587 |
| Custodian fees | 12,524 |
| Reports to shareholders | 7,555 |
| Professional fees | 37,565 |
| Miscellaneous | 11,653 |
| Total expenses | 1,211,166 |
| Reimbursement from Advisor | (80,588) |
| Net expenses | 1,130,578 |
| |
| NET INVESTMENT INCOME | 2,184,687 |
| |
| |
| REALIZED AND UNREALIZED GAIN (LOSS) | |
| Net realized gain (loss) on: | |
| Investments | 20,004,363 |
| Foreign currency transactions | (124) |
| | 20,004,239 |
| |
| Change in unrealized appreciation (depreciation) on: | |
| Investments and assets and liabilities denominated in foreign currencies | 18,157,045 |
| |
| |
| NET REALIZED AND UNREALIZED GAIN (LOSS) | 38,161,284 |
| |
| INCREASE (DECREASE) IN NET ASSETS | |
| RESULTING FROM OPERATIONS | $40,345,971 |
See notes to financial statements.
12 www.calvert.com CALVERT VP SRI LARGE CAP VALUE PORTFOLIO ANNUAL REPORT
| | |
| STATEMENTS OF CHANGES IN NET ASSETS |
| |
| | YEAR ENDED | YEAR ENDED |
| | DECEMBER 31, | DECEMBER 31, |
| INCREASE (DECREASE) IN NET ASSETS | 2013 | 2012 |
| Operations: | | |
| Net investment income | $2,184,687 | $2,347,904 |
| Net realized gain (loss) | 20,004,239 | (7,024,450) |
| Change in unrealized appreciation (depreciation) | 18,157,045 | 24,420,581 |
| |
| INCREASE (DECREASE) IN NET ASSETS | | |
| RESULTING FROM OPERATIONS | 40,345,971 | 19,744,035 |
| |
| Distributions to shareholders from: | | |
| Net investment income | (2,383,890) | (2,332,014) |
| Total distributions | (2,383,890) | (2,332,014) |
| |
| |
| Capital share transactions: | | |
| Shares sold | 5,371,585 | 5,545,985 |
| Reinvestment of distributions | 2,383,890 | 2,332,014 |
| Shares redeemed | (20,512,297) | (11,582,336) |
| Total capital share transactions | (12,756,822) | (3,704,337) |
| |
| |
| TOTAL INCREASE (DECREASE) IN NET ASSETS | 25,205,259 | 13,707,684 |
| |
| |
| NET ASSETS | | |
| Beginning of year | 130,832,829 | 117,125,145 |
| End of year (including undistributed net investment income | | |
| of $303,806 and $561,838, respectively) | $156,038,088 | $130,832,829 |
| |
| |
| CAPITAL SHARE ACTIVITY | | |
| Shares sold | 61,624 | 80,826 |
| Reinvestment of distributions | 25,339 | 32,090 |
| Shares redeemed | (237,588) | (164,029) |
| Total capital share activity | (150,625) | (51,113) |
See notes to financial statements.
www.calvert.com CALVERT VP SRI LARGE CAP VALUE PORTFOLIO ANNUAL REPORT 13
NOTES TO FINANCIAL STATEMENTS
NOTE A –- SIGNIFICANT ACCOUNTING POLICIES
General: Calvert VP SRI Large Cap Value Portfolio (the “Portfolio”), a series of Calvert Variable Products, Inc. (the “Fund”), is registered under the Investment Company Act of 1940 as a diversified, open-end management investment company. The Fund is comprised of twelve separate portfolios. The operations of each series of the Fund are accounted for separately. Shares of the Portfolio are sold without sales charge to affiliated and unaffiliated insurance companies for allocation to certain of their variable separate accounts.
Security Valuation: Net asset value per share is determined every business day as of the close of the regular session of the New York Stock Exchange (generally 4:00 p.m. Eastern time). The Portfolio uses independent pricing services approved by the Board of Directors (“the Board”) to value its investments wherever possible. Investments for which market quotations are not available or deemed not reliable are fair valued in good faith under the direction of the Board.
The Board has adopted Valuation Procedures (the “Procedures”) to determine the fair value of securities and other financial instruments for which market prices are not readily available or which may not be reliably priced. The Board has delegated the day-to-day responsibility for determining the fair value of assets of the Portfolio to Calvert Investment Management, Inc. (the “Advisor” or “Calvert”) and has provided these Procedures to govern Calvert in its valuation duties.
Calvert has chartered an internal Valuation Committee to oversee the implementation of these Procedures and to assist it in carrying out the valuation responsibilities that the Board has delegated.
The Valuation Committee meets on a regular basis to review illiquid securities and other investments which may not have readily available market prices. The Valuation Committee’s fair valuation determinations are subject to review, approval and ratification by the Board at its next regularly scheduled meeting covering the calendar quarter in which the fair valuation was determined.
The Valuation Committee utilizes various methods to measure the fair value of the Portfolio’s investments. Generally Accepted Accounting Principles (GAAP) establishes a disclosure hierarchy that categorizes the inputs to valuation techniques used to value assets and liabilities at measurement date. These inputs are summarized in the three broad levels listed below:
Level 1 – quoted prices in active markets for identical securities
Level 2 – other significant observable inputs (including quoted prices for similar securities, interest rates, prepayment speeds, credit risk, etc.)
Level 3 – significant unobservable inputs (including the Portfolio’s own assumptions in determining the fair value of investments) The inputs or methodologies used for valuing securities are not necessarily an indication of the risk associated with investing in those securities.
Changes in valuation techniques may result in transfers in or out of an investment’s assigned level within the hierarchy during the period. There were no such transfers during the period. Valuation techniques used to value the Portfolio’s investments by major category are as follows: Equity securities, including restricted securities, for which market quotations are readily available, are valued at the last reported sale price or official closing price as reported by an independent pricing service on the primary market or exchange on which they are traded and are categorized as Level 1 in the hierarchy.
In the event there were no sales during the day or closing prices are not available, securities are valued at the last quoted bid price or may be valued using the last available price and are categorized as Level 2 in the hierarchy. Foreign securities are valued based on quotations from the principal market in which
14 www.calvert.com CALVERT VP SRI LARGE CAP VALUE PORTFOLIO ANNUAL REPORT
such securities are normally traded. If events occur after the close of the principal market in which foreign securities are traded, and before the close of business of the Portfolio, that are expected to materially affect the value of those securities, then they are valued at their fair value taking these events into account. For restricted securities and private placements where observable inputs are limited, assumptions about market activity and risk are used and such securities are categorized as Level 3 in the hierarchy.
Short-term securities of sufficient credit quality with remaining maturities of sixty days or less for which quotations are not readily available are valued at amortized cost, which approximates fair value, and are categorized as Level 2 in the hierarchy.
If a market value cannot be determined for a security using the methodologies described above, or if, in the good faith opinion of the Advisor, the market value does not constitute a readily available market quotation, or if a significant event has occurred that would materially affect the value of the security, the security will be fair valued as determined in good faith by the Valuation Committee.
The Valuation Committee considers a number of factors, including significant unobservable valuation inputs when arriving at fair value. It considers all significant facts that are reasonably available and relevant to the determination of fair value.
The Valuation Committee primarily employs a market-based approach which may use related or comparable assets or liabilities, recent transactions, market multiples, book values, and other relevant information for the investment to determine the fair value of the investment. When more appropriate, the fund may employ an income-based or cost approach. An income-based valuation approach discounts anticipated future cash flows of the investment to calculate a present amount (discounted). The measurement is based on the value indicated by current market expectations about those future amounts. Discounts may also be applied due to the nature or duration of any restrictions on the disposition of the investments. A cost based approach is based on the amount that currently would be required to replace the service capacity of an asset (current replacement cost). From the seller’s perspective, the price that would be received for the asset is determined based on the cost to a buyer to acquire or construct a substitute asset of comparable utility, adjusted for obsolescence.
The values assigned to fair value investments are based on available information and do not necessarily represent amounts that might ultimately be realized. Further, due to the inherent uncertainty of valuations of such investments, the fair values may differ significantly from the values that would have been used had an active market existed, and the differences could be material. The Valuation Committee employs various methods for calibrating these valuation approaches including a regular review of key inputs and assumptions, transactional back-testing or disposition analysis and reviews of any related market activity.
At December 31, 2013, no securities were fair valued in good faith under the direction of the Board.
The following is a summary of the inputs used to value the Portfolio’s net assets as of December 31, 2013:
| | | VALUATION INPUTS | |
| INVESTMENTS IN SECURITIES | LEVEL 1 | LEVEL 2 | LEVEL 3 | TOTAL |
| Equity securities* | $153,114,398 | — | — | $153,114,398 |
| Other debt obligations | — | $2,101,320 | — | 2,101,320 |
| TOTAL | $153,114,398 | $2,101,320 | — | $155,215,718 |
* For further breakdown of equity securities by industry type, please refer to the Statement of Net Assets.
Security Transactions and Investment Income: Security transactions are accounted for on trade date. Realized gains and losses are recorded on an identified cost basis and may include proceeds from litigation. Dividend income is recorded on the ex-dividend date or, in the case of dividends on certain foreign securities,
www.calvert.com CALVERT VP SRI LARGE CAP VALUE PORTFOLIO ANNUAL REPORT 15
as soon as the Portfolio is informed of the ex-dividend date. Withholding taxes on foreign dividends have been provided for in accordance with the Portfolio’s understanding of the applicable country’s tax rules and rates. Distributions received on securities that represent a return of capital or capital gain are recorded as a reduction of cost of investments and/or as a realized gain. Interest income, which includes amortization of premium and accretion of discount on debt securities, is accrued as earned.
Foreign Currency Transactions: The Portfolio’s accounting records are maintained in U.S. dollars. For valuation of assets and liabilities on each date of net asset value determination, foreign denominations are converted into U.S. dollars using the current exchange rate. Security transactions, income and expenses are translated at the prevailing rate of exchange on the date of the event. The effect of changes in foreign exchange rates on securities is included with the net realized and unrealized gain or loss on investments.
Distributions to Shareholders: Distributions to shareholders are recorded by the Portfolio on ex-dividend date. Dividends from net investment income and distributions from net realized capital gains, if any, are paid at least annually. Distributions are determined in accordance with income tax regulations which may differ from generally accepted accounting principles; accordingly, periodic reclassifications are made within the Portfolio’s capital accounts to reflect income and gains available for distribution under income tax regulations.
Estimates: The preparation of financial statements in conformity with accounting principles generally accepted in the United States requires management to make estimates and assumptions that affect the reported amounts of assets and liabilities and disclosure of contingent assets and liabilities at the date of the financial statements and the reported amounts of income and expenses during the reporting period. Actual results could differ from those estimates.
Federal Income Taxes: No provision for federal income or excise tax is required since the Portfolio intends to continue to qualify as a regulated investment company under the Internal Revenue Code and to distribute substantially all of its taxable earnings.
Management has analyzed the Portfolio’s tax positions taken for all open federal income tax years and has concluded that no provision for federal income tax is required in the Portfolio’s financial statements. A Portfolio’s federal tax return is subject to examination by the Internal Revenue Service for a period of three years.
NOTE B — RELATED PARTY TRANSACTIONS
Calvert Investment Management, Inc. (the “Advisor”) is wholly-owned by Calvert Investments, Inc., which is indirectly wholly owned by Ameritas Mutual Holding Company. The Advisor provides investment advisory services and pays the salaries and fees of officers and Directors of the Fund who are employees of the Advisor or its affiliates. For its services, the Advisor receives an annual fee, payable monthly, of .64% of the Portfolio’s average daily net assets. Under the terms of the agreement, $83,146 was payable at year end. In addition, $25,017 was payable at year end for operating expenses paid by the Advisor during December 2013.
The Advisor has contractually agreed to limit net annual portfolio operating expenses through April 30, 2014. The contractual expense cap is .78%. For the purpose of this expense limit, operating expenses do not include interest expense, brokerage commissions, taxes, and extraordinary expenses. This expense limitation does not limit acquired fund fees and expenses, if any. Under the terms of the agreement, $9,133 was receivable at year end.
Calvert Investment Administrative Services, Inc., an affiliate of the Advisor, provides administrative services to the Portfolio for an annual fee, payable monthly, of .10% of the average daily net assets of the Portfolio. Under the terms of the agreement, $12,992 was payable at year end.
Calvert Investment Services, Inc. (“CIS”), an affiliate of the Advisor, acts as shareholder servicing agent for the Portfolio. For its services, CIS received a fee of $12,892 for the year ended December 31, 2013. Under the terms of the agreement, $923 was payable at year end. Boston Financial Data Services, Inc. is the transfer and dividend disbursing agent.
16 www.calvert.com CALVERT VP SRI LARGE CAP VALUE PORTFOLIO ANNUAL REPORT
Each Director of the Fund who is not an employee of the Advisor or its affiliates receives a fee of $1,500 for each Board and Committee meeting attended plus an annual fee of $40,000. Committee chairs receive an additional $5,000 annual retainer. Directors’ fees are allocated to each of the portfolios served.
NOTE C — INVESTMENT ACTIVITY AND TAX INFORMATION
During the year, the cost of purchases and proceeds from sales of investments, other than short-term securities, were $77,266,280 and $90,490,999, respectively.
| Capital Loss Carryforwards | |
| Expiration Date: | |
| 31-Dec-15 | ($953,081) |
| 31-Dec-17 | (15,318,788) |
| 31-Dec-18 | (7,422,814) |
| |
| No Expiration Date: | |
| Long-term | ($240,140) |
Under the Regulated Investment Company Modernization Act of 2010, capital losses incurred in taxable years beginning after December 22, 2010 can be carried forward to offset future capital gains for an unlimited period. These losses are required to be utilized prior to the losses incurred in pre-enactment taxable years and will retain their character as either long-term or short-term. Capital losses incurred in pre-enactment taxable years can be utilized until expiration. The Portfolio’s use of net capital losses acquired from reorganizations may be limited under certain tax provisions.
The tax character of dividends and distributions paid during the years ended December 31, 2013 and December 31, 2012 was as follows:
| Distributions paid from: | 2013 | 2012 |
| Ordinary income | $2,383,890 | $2,332,014 |
| Total | $2,383,890 | $2,332,014 |
As of December 31, 2013, the tax basis components of distributable earnings/(accumulated losses) and the federal tax cost were as follows:
| Unrealized appreciation | $31,747,120 |
| Unrealized (depreciation) | (237,519) |
| Net unrealized appreciation/(depreciation) | $31,509,601 |
| |
| Undistrbuted ordinary income | $303,806 |
| Capital loss carryforward | ($23,934,823) |
| Federal income tax cost of investments | $123,706,117 |
The differences between the components of distributable earnings on a tax basis and the amounts reflected in the statement of net assets are primarily due to temporary book-tax differences that will reverse in a subsequent period. These differences are due to wash sales and capital loss limitations under Internal Revenue Code Section 382.
Reclassifications, as shown in the table below, have been made to the Portfolio’s components of net assets to reflect income and gains available for distribution (or available capital loss carryovers, as applicable) under income tax law and regulations. These reclassifications are due to permanent book-tax differences and have
www.calvert.com CALVERT VP SRI LARGE CAP VALUE PORTFOLIO ANNUAL REPORT 17
no impact on net assets. The primary permanent differences causing such reclassifications for the Portfolio are due to partnerships and foreign currency transactions.
| Undistributed net investment income | ($58,829) |
| Accumulated net realized gain (loss) | 71,521 |
| Paid-in capital | (12,692) |
NOTE D — LINE OF CREDIT
A financing agreement is in place with the Calvert Funds and State Street Corporation (“SSC”). Under the agreement, SSC provides an unsecured line of credit facility, in the aggregate amount of $50 million ($25 million committed and $25 million uncommitted), accessible by the Funds for temporary or emergency purposes only. Borrowings under the committed facility bear interest at the higher of the London Interbank Offered Rate (LIBOR) or the overnight Federal Funds Rate plus 1.25% per annum. A commitment fee of .11% per annum is incurred on the unused portion of the committed facility, which is allocated to all participating funds. The Portfolio had no borrowings under the agreement during the year ended December 31, 2013.
NOTE E — SUBSEQUENT EVENTS
In preparing the financial statements as of December 31, 2013, no subsequent events or transactions occurred that would have required recognition or disclosure in these financial statements.
18 www.calvert.com CALVERT VP SRI LARGE CAP VALUE PORTFOLIO ANNUAL REPORT
| | | |
| FINANCIAL HIGHLIGHTS |
| |
| | | YEARS ENDED | |
| | DECEMBER
31, | DECEMBER 31, | DECEMBER 31, |
| | 2013 | 2012 | 2011 (z) |
| Net asset value, beginning | $73.80 | $64.22 | $66.82 |
| Income from investment operations: | | | |
| Net investment income | 1.39 | 1.36 | 1.24 |
| Net realized and unrealized gain (loss) | 22.48 | 9.56 | (2.36) |
| Total from investment operations | 23.87 | 10.92 | (1.12) |
| Distributions from: | | | |
| Net investment income | (1.48) | (1.34) | (1.48) |
| Total distributions | (1.48) | (1.34) | (1.48) |
| Total increase (decrease) in net asset value | 22.39 | 9.58 | (2.60) |
| Net asset value, ending | $96.19 | $73.80 | $64.22 |
| |
| Total return* | 32.39% | 17.03% | (1.68%) |
| Ratios to average net assets: A | | | |
| Net investment income | 1.51% | 1.87% | 1.85% |
| Total expenses | .84% | .85% | .85% |
| Expenses before offsets | .78% | .77% | .75% |
| Net expenses | .78% | .77% | .75% |
| Portfolio turnover | 55% | 51% | 16% |
| Net assets, ending (in thousands) | $156,038 | $130,833 | $117,125 |
| |
| | | YEARS ENDED |
| | | DECEMBER 31, | DECEMBER 31, |
| | | 2010 (z) | 2009 |
| Net asset value, beginning | | $60.76 | $49.45 |
| Income from investment operations: | | | |
| Net investment income | | 1.05 | 1.16 |
| Net realized and unrealized gain (loss) | | 6.00 | 11.41 |
| Total from investment operations | | 7.05 | 12.57 |
| Distributions from: | | | |
| Net investment income | | (.99) | (1.14) |
| Net realized gain | | — | (.12) |
| Total distributions | | (.99) | (1.26) |
| Total increase (decrease) in net asset value | | 6.06 | 11.31 |
| Net asset value, ending | | $66.82 | $60.76 |
| |
| Total return* | | 11.60% | 25.40% |
| Ratios to average net assets:A | | | |
| Net investment income | | 1.70% | 2.19% |
| Total expenses | | .84% | .85% |
| Expenses before offsets | | .74% | .74% |
| Net expenses | | .74% | .74% |
| Portfolio turnover | | 27% | 29% |
| Net assets, ending (in thousands) | | $164,863 | $178,063 |
See notes to financial highlights.
www.calvert.com CALVERT VP SRI LARGE CAP VALUE PORTFOLIO ANNUAL REPORT 19
A Total expenses do not reflect amounts reimbursed and/or waived by the Advisor or reductions from expense offset arrangements. Expenses before offsets reflect expenses after reimbursement and/or waiver by the Advisor but prior to reductions from expense offset arrangements. Net expenses are net of all reductions and represent the net expenses paid by the portfolio.
(z) Per share figures calculated using the Average Shares Method.
* Total return is not annualized for periods of less than one year and does not reflect charges and expenses of the variable annuity or variable universal life contract.
See notes to financial statements.
20 www.calvert.com CALVERT VP SRI LARGE CAP VALUE PORTFOLIO ANNUAL REPORT
EXPLANATION OF FINANCIAL TABLES
SCHEDULE OF INVESTMENTS
The Schedule of Investments is a snapshot of all securities held in the fund at their market value, on the last day of the reporting period. Securities are listed by asset type (e.g., common stock, corporate bonds, U.S. government obligations) and may be further broken down into sub-groups and by industry classification.
STATEMENT OF ASSETS AND LIABILITIES
The Statement of Assets and Liabilities is often referred to as the fund’s balance sheet. It lists the value of what the fund owns, is due and owes on the last day of the reporting period. The fund’s assets include the market value of securities owned, cash, receivables for securities sold and shareholder subscriptions, and receivables for dividends and interest payments that have been earned, but not yet received. The fund’s liabilities typically include payables for securities purchased and shareholder redemptions, and expenses owed but not yet paid. The statement also reports the fund’s net asset value (NAV) per share on the last day of the reporting period. The NAV is calculated by dividing the fund’s net assets (assets minus liabilities) by the number of shares outstanding. This statement is accompanied by a Schedule of Investments. Alternatively, if certain conditions are met, a Statement of Net Assets may be presented in lieu of this statement and the Schedule of Investments.
STATEMENT OF NET ASSETS
The Statement of Net Assets provides a detailed list of the fund’s holdings, including each security’s market value on the last day of the reporting period. The Statement of Net Assets includes a Schedule of Investments. Other assets are added and other liabilities subtracted from the investments total to calculate the fund’s net assets. Finally, net assets are divided by the outstanding shares of the fund to arrive at its share price, or Net Asset Value (NAV) per share.
At the end of the Statement of Net Assets is a table displaying the composition of the fund’s net assets. Paid in Capital is the money invested by shareholders and represents the bulk of net assets. Undistributed Net Investment Income and Accumulated Net Realized Gains usually approximate the amounts the fund had available to distribute to shareholders as of the statement date. Accumulated Realized Losses will appear as negative balances. Unrealized Appreciation (Depreciation) is the difference between the market value of the fund’s investments and their cost, and reflects the gains (losses) that would be realized if the fund were to sell all of its investments at their statement-date values.
STATEMENT OF OPERATIONS
The Statement of Operations summarizes the fund’s investment income earned and expenses incurred in operating the fund. Investment income includes dividends earned from stocks and interest earned from interest-bearing securities in the fund. Expenses incurred in operating the fund include the advisory fee paid to the investment advisor, administrative services fees, distribution plan expenses (if applicable), transfer agent fees, shareholder servicing expenses, custodial, legal, and audit fees, and the printing and postage expenses related to shareholder reports. Expense offsets (fees paid indirectly) are also shown. Credits earned from offset arrangements are used to reduce the fund’s expenses. This statement also shows net gains (losses) realized on the sale of investments and the increase or decrease in the unrealized appreciation (depreciation) on investments held during the period.
STATEMENT OF CHANGES IN NET ASSETS
The Statement of Changes in Net Assets shows how the fund’s total net assets changed during the two most recent reporting periods. Changes in the fund’s net assets are attributable to investment operations, distributions and capital share transactions.
The Operations section of the report summarizes information detailed in the Statement of Operations. The Distribution section shows the dividend and capital gain distributions made to shareholders. The amounts shown as distributions in this section may not match the net investment income and realized gains amounts
www.calvert.com CALVERT VP SRI LARGE CAP VALUE PORTFOLIO ANNUAL REPORT (UNAUDITED) 21
shown in the Operations section because distributions are determined on a tax basis and certain investments or transactions may be treated differently for financial statement and tax purposes. The Capital Share Transactions section shows the amount shareholders invested in the fund, either by purchasing shares or by reinvesting distributions, and the amounts redeemed. The corresponding numbers of shares issued, reinvested and redeemed are shown at the end of the report.
FINANCIAL HIGHLIGHTS
The Financial Highlights table provides a per-share breakdown by class of the components that affect the fund’s net asset value for current and past reporting periods. The table provides total return, total distributions, expense ratios, portfolio turnover and net assets for the applicable period. Total return is a measure of a fund’s performance that encompasses all elements of return: dividends, capital gain distributions and changes in net asset value. Total return is the change in value of an investment over a given period, assuming reinvestment of any dividends and capital gain distributions, expressed as a percentage of the initial investment. Total distributions include distributions from net investment income and net realized gains. Long-term gains are earned on securities held in the fund more than one year. Short-term gains, on the sale of securities held less than one year, are treated as ordinary dividend income for tax purposes. The expense ratio is a fund’s cost of doing business, expressed as a percentage of net assets. These expenses directly reduce returns to shareholders. Portfolio turnover measures the trading activity in a fund’s investment portfolio – how often securities are bought and sold by a fund. Portfolio turnover is affected by market conditions, changes in the size of the fund, the nature of the fund’s investments and the investment style of the portfolio manager.
PROXY VOTING
The Proxy Voting Guidelines that the Portfolio uses to determine how to vote proxies relating to portfolio securities is provided as an Appendix to the Fund’s Statement of Additional Information. The Statement of Additional Information can be obtained free of charge by calling the Fund at 1-800-368-2745, by visiting the Calvert website at www.calvert.com or by visiting the SEC’s website at www.sec.gov.
Information regarding how the Fund voted proxies relating to portfolio securities during the most recent 12-month period ended June 30 is available by calling the Fund, by visiting the Calvert website at www. calvert.com or visiting the SEC’s website at www.sec.gov.
AVAILABILITY OF QUARTERLY PORTFOLIO HOLDINGS
The Fund files its complete schedule of portfolio holdings with the SEC for the first and third quarters of each fiscal year on Form N-Q. The Fund’s Form N-Q is available on the SEC’s website at www.sec.gov. The Fund’s Form N-Q may be reviewed and copied at the SEC’s Public Reference Room in Washington, DC; information on the operation of the Public Reference Room may be obtained by calling 1-800-SEC-0330.
BASIS FOR BOARD’S APPROVAL OF INVESTMENT ADVISORY CONTRACT
At a meeting held on December 11, 2013, the Board of Directors, and by a separate vote, the disinterested Directors, approved the continuance of the Investment Advisory Agreement between the Fund and the Advisor with respect to the Portfolio.
In evaluating the Investment Advisory Agreement, the Board considered a variety of information relating to the Portfolio and the Advisor. The disinterested Directors reviewed a report prepared by the Advisor regarding various services provided to the Portfolio by the Advisor and its affiliates. Such report included, among other data, information regarding the Advisor’s personnel and the Advisor’s revenue and cost of providing services to the Portfolio, and a separate report prepared by an independent third party, which
22 www.calvert.com CALVERT VP SRI LARGE CAP VALUE PORTFOLIO ANNUAL REPORT (UNAUDITED)
provided a statistical analysis comparing the Portfolio’s investment performance, expenses, and fees to comparable mutual funds.
The disinterested Directors were separately represented by independent legal counsel with respect to their consideration of the reapproval of the Investment Advisory Agreement. Prior to voting, the disinterested Directors reviewed the proposed continuance of the Investment Advisory Agreement with management and also met in private sessions with their counsel at which no representatives of management were present.
In the course of its deliberations regarding the Investment Advisory Agreement, the Board considered the following factors, among others: the nature, extent and quality of the services provided by the Advisor, including the personnel providing such services; the Advisor’s financial condition; the level and method of computing the Portfolio’s advisory fee; comparative performance, fee and expense information for the Portfolio; the profitability of the Calvert Family of Funds to the Advisor and its affiliates; the allocation of the Portfolio’s brokerage, including the Advisor’s process for monitoring “best execution”; the direct and indirect benefits, if any, derived by the Advisor and its affiliates from their relationship with the Portfolio; the effect of the Portfolio’s growth and size on the Portfolio’s performance and expenses; the Advisor’s compliance programs and policies; the Advisor’s performance of substantially similar duties for other funds; and any possible conflicts of interest.
In considering the nature, extent and quality of the services provided by the Advisor under the Investment Advisory Agreement, the Board reviewed information provided by the Advisor relating to its operations and personnel, including, among other information, biographical information on the Advisor’s investment, supervisory and professional staff and descriptions of its organizational and management structure. The Board also took into account similar information provided periodically throughout the previous year by the Advisor, as well as the Board’s familiarity with the Advisor’s management through Board of Directors’ meetings, discussions and other reports. The Board considered the Advisor’s management style and its performance in employing its investment strategies, as well as its current level of staffing and overall resources. The Board also noted that it reviewed on a quarterly basis information regarding the Advisor’s compliance with applicable policies and procedures, including those related to personal investing. The Advisor’s administrative capabilities, including its ability to supervise the other service providers for the Portfolio, were also considered. The Board also took into account the environmental, social, sustainability and governance research and analysis provided by the Advisor to the Portfolio. The Board observed that the scope of services provided by the Advisor generally had expanded over time as a result of regulatory, market and other changes. The Board took into consideration, among other factors, the effectiveness of the Portfolio’s and Advisor’s processes, policies and procedures and the Advisor’s personnel. The Board also took into account, among other items, periodic reports received from the Advisor over the past year concerning the Advisor’s ongoing review and enhancement of certain processes, policies and procedures of the Portfolio and the Advisor. The Board concluded that it was satisfied with the nature, extent and quality of services provided to the Portfolio by the Advisor under the Investment Advisory Agreement.
In considering the Portfolio’s performance, the Board noted that it reviewed on a quarterly basis detailed information about the Portfolio’s performance results, portfolio composition and investment strategies. In addition, the Board took into account overall financial market conditions. The Board also reviewed various comparative data provided to it in connection with its consideration of the renewal of the Investment Advisory Agreement, including, among other information, a comparison of the Portfolio’s total return with its Lipper index and with that of other mutual funds deemed to be in its peer group by an independent third party in its report. This comparison indicated that the Portfolio performed above the median of its peer group for the one-, three- and five-year periods ended June 30, 2013. The data also indicated that the Portfolio outperformed its Lipper index for the one-year period ended June 30, 2013, and underperformed its Lipper index for the three- and five-year periods ended June 30, 2013. Based upon its review, the Board concluded that the Portfolio’s performance was satisfactory relative to the performance of funds with similar investment objectives and to relevant indices.
www.calvert.com CALVERT VP SRI LARGE CAP VALUE PORTFOLIO ANNUAL REPORT (UNAUDITED) 23
In considering the Portfolio’s fees and expenses, the Board compared the Portfolio’s fees and total expense ratio with various comparative data for the funds in its peer group. Among other findings, the data indicated that the Portfolio’s advisory fee (after taking into account expense reimbursements) was below the median of its peer group and that total expenses (net of expense reimbursements) were also below the median of its peer group. The Board noted that the allocation of advisory and administrative fees may vary among the Portfolio’s peer group. In addition, the Board took into account the fees the Advisor charged to its other clients and considered these fee comparisons in light of the differences in managing these other accounts. The Board noted that the Advisor had reimbursed a portion of the Portfolio’s expenses. The Board also took into account the Advisor’s current undertaking to maintain expense limitations for the Portfolio and management’s discussion of the Portfolio’s expenses and certain factors that affected the level of such expenses, including the current size of the Portfolio and the cost of providing the environmental, social, sustainability and governance research and analysis provided by the Advisor. Based upon its review, the Board determined that the advisory fee was reasonable in view of the quality of services received by the Portfolio from the Advisor and the other factors considered.
The Board reviewed the Advisor’s profitability on a portfolio-by-portfolio basis. In reviewing the overall profitability of the advisory fee to the Portfolio’s Advisor, the Board also considered the fact that affiliates of the Advisor provided shareholder servicing and administrative services to the Portfolio for which they received compensation. The information considered by the Board included Calvert’s operating profit margin information both before and after tax expenses with respect to the services that the Advisor and its affiliates provided to the Calvert Family of Funds complex. The Board reviewed the profitability of the Advisor’s relationship with the Portfolio in terms of the total amount of annual advisory fees it received with respect to the Portfolio and whether the Advisor had the financial wherewithal to continue to provide services to the Portfolio. The Board also considered that the Advisor derived benefits to its reputation and other indirect benefits from its relationship with the Portfolio. In addition, the Board took into account that affiliates of the Advisor may benefit from certain indirect tax benefits relating to dividend received deductions and foreign tax credits.
The Board noted that the Advisor had reimbursed a portion of the expenses of the Portfolio. Based upon its review, the Board concluded that the Advisor’s and its affiliates’ level of profitability from their relationship with the Portfolio was reasonable.
The Board considered the effect of the Portfolio’s growth and size on its performance and fees. Although the Portfolio’s advisory fee did not contain breakpoints that would reduce the advisory fee rate on assets above specified asset levels, the Board noted that if the Portfolio’s assets increased over time, the Portfolio might realize other economies of scale if assets increased proportionally more than certain other expenses. The Board also noted that given the Portfolio’s current level of assets, the Portfolio would be unlikely to recognize economies of scale by implementing a breakpoint in the advisory fee at this time.
In reapproving the Investment Advisory Agreement, the Board, including the disinterested Directors, did not identify any single factor as controlling, and each Director may have attributed different weight to various factors.
CONCLUSIONS
The Board reached the following conclusions regarding the Investment Advisory Agreement, among others: (a) the Advisor has demonstrated that it possesses the capability and resources to perform the duties required of it under the Investment Advisory Agreement; (b) the Advisor maintains appropriate compliance programs; (c) the performance of the Portfolio is satisfactory relative to the performance of funds with similar investment objectives and to relevant indices; (d) the Advisor is likely to execute its investment strategies consistently over time; and (e) the Portfolio’s advisory fee is reasonable in view of the quality of services received by the Portfolio from the Advisor and the other factors considered. Based on its conclusions, the Board determined that reapproval of the Investment Advisory Agreement would be in the best interests of the Portfolio and its shareholders.
24 www.calvert.com CALVERT VP SRI LARGE CAP VALUE PORTFOLIO ANNUAL REPORT (UNAUDITED)
This report is intended to provide fund information to shareholders. It is not authorized for distribution to prospective investors unless preceded or accompanied by a prospectus.
Note: The information on our website is not incorporated by reference into this report; our website address is included as an inactive textual reference only.
Investors should carefully consider the investment objectives, risks, charges and expenses of the Calvert Funds. This and other important information is contained in the fund’s summary prospectus and prospectus, which can be obtained from your financial professional and should be read carefully before investing. You may also call Calvert at 800/368-2745 or visit www. calvert.com.
www.calvert.com CALVERT VP SRI LARGE CAP VALUE PORTFOLIO ANNUAL REPORT (UNAUDITED) 25
26 www.calvert.com CALVERT VP SRI LARGE CAP VALUE PORTFOLIO ANNUAL REPORT (UNAUDITED)

www.calvert.com CALVERT VP SRI LARGE CAP VALUE PORTFOLIO ANNUAL REPORT (UNAUDITED) 27
This page intentionally left blank.
This page intentionally left blank.

CALVERT VP S&P 500 INDEX PORTFOLIO
Portfolio within Calvert Variable Products, Inc.
Managed by Ameritas Investment Partners, Inc., Subadvisor
INVESTMENT PERFORMANCE
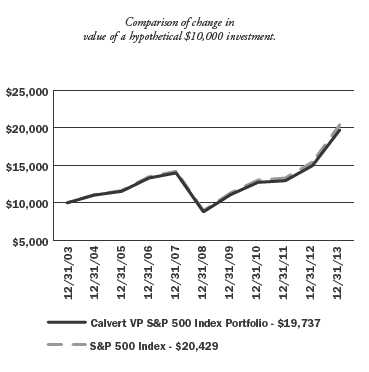
For the one-year ended December 31, 2013, Calvert VP S&P 500 Index Portfolio returned 31.87% compared with 32.39% for the Standard & Poor’s (S&P) 500 Index. The slight underperformance relative to the Index was largely attributable to fees and operating expenses, which the Index does not have.
INVESTMENT CLIMATE
The equity markets earned strong positive returns in 2013 as economic recovery in the United States continued to take hold. Within the domestic universe, small-cap stocks provided the highest return in 2013, up 38.82% as measured by the Russell 2000 Index. Mid-cap and large cap stocks provided slightly lower returns, with the S&P MidCap 400 Index and S&P 500 Index returning 33.50% and 32.39%, respectively. Domestic equity markets generally outperformed international equity markets, with emerging markets lagging the most.
The Federal Reserve (Fed) continued its accommodative monetary policy in 2013, which provided the fuel to power U.S. stocks higher. Domestic GDP growth improved steadily throughout the year, and inflation remained under control. The housing market continued its recovery—the resulting increases in homeowner equity and consumer confidence and decreases in default rates should benefit the banking industry. Lastly, the combination of increased home values and the rise in the stock market had a significant positive impact on household net worth.
PORTFOLIO STRATEGY
As an index fund, the Portfolio seeks, as closely as possible, to replicate the holdings and match the performance of the S&P 500 Index. In pursuit of this objective, the Portfolio employs a passive management approach to replicate the Index.
| | AVERAGE ANNUAL TOTAL RETURN |
| | (period ended 12.31.13) |
| One year | 31.87% |
| Five year | 17.52% |
| Ten year | 7.04% |
The performance data shown represents past performance, does not guarantee future results and assumes reinvestment of all dividends and distributions. All performance data reflects fee waivers and/or expense limitations, if any are in effect; in their absence performance would be lower. See Note B in Notes to Financial Statements. The investment return and principal value of an investment will fluctuate so that an investor’s shares, when redeemed, may be worth more or less than their original cost. Current performance may be lower or higher than the performance data quoted. Visit www.calvert.com/ institutional-VP-performance.html for current performance data. The gross expense ratio from the current prospectus for the Portfolio is 0.45%. This number may vary from the expense ratio shown elsewhere in this report because it is based on a different time period and, if applicable, does not include fee or expense waivers. The performance data and expense ratio reflect deduction of Portfolio operating expenses, but do not reflect charges and expenses imposed
4 www.calvert.com CALVERT VP S&P 500 INDEX PORTFOLIO ANNUAL REPORT
| |
| | % OF TOTAL |
| ECONOMIC SECTORS | INVESTMENTS |
| |
| Consumer Discretionary | 12.5% |
| Consumer Staples | 9.6% |
| Energy | 10.0% |
| Exchange Traded Products | 0.4% |
| Financials | 15.7% |
| Government | 0.3% |
| Health Care | 12.6% |
| Industrials | 10.8% |
| Information Technology | 18.4% |
| Materials | 3.4% |
| Short-Term Investments | 1.0% |
| Telecommunication Services | 2.3% |
| Utilities | 3.0% |
| Total | 100% |
At year end, the Index’s largest exposures were to the Information Technology and Financial sectors, at 18.4% and 15.7%, respectively. Other significant weightings included Health Care, Consumer Discretionary, and Industrials, which ranged from 11% to 13%. The smallest exposures were to Telecommunication Services and Utilities, at 2.3% and 3.0%, respectively.
The top performers were Consumer Discretionary, up 43.1%, and Health Care, up 41.5%. The weakest performers were Telecommunication Services, up 11.5%, and Utilities, up 13.2%.
During 2013, the Portfolio continued to meet its investment objective of closely tracking the total return of the Index. Market fluctuation and cash flows may cause the Portfolio to hold a slightly different weighting than the Index. Since the S&P 500 Index is not an actual mutual fund, it is not possible to invest directly in it. Unlike the Index, the Portfolio incurs operating expenses.
OUTLOOK
Entering 2014, we believe the outlook for equities is mildly positive. The economy continues to recover and corporate earnings remain strong, although valuations have become more stretched and the market is pricing in a fairly optimistic outlook already. The unemployment rate is declining and the economy will not suffer the same fiscal drag that it did last year from the sequester.
The Fed has begun the tapering process. And while the tone in Washington has improved slightly, the government’s inability to function properly does remain a concern. In addition, economic growth in Europe remains sluggish and China’s growth appears to have slowed.
That said, the Fed anticipates keeping short-term rates low for an extended period of time after it ends its asset-purchasing program. Although it is unlikely that 2014 will provide returns similar to 2013, Fed policies should provide a positive backdrop for equities in the year ahead.
January 2014
www.calvert.com CALVERT VP S&P 500 INDEX PORTFOLIO ANNUAL REPORT 5
SHAREHOLDER EXPENSE EXAMPLE
As a shareholder of the Fund, you incur two types of costs: (1) transaction costs, and (2) ongoing costs, including management fees and other Fund expenses. This Example is intended to help you understand your ongoing costs (in dollars) of investing in the Fund and to compare these costs with the ongoing costs of investing in other mutual funds.
This Example is based on an investment of $1,000 invested at the beginning of the period and held for the entire period (July 1, 2013 to December 31, 2013).
Note: Expenses do not reflect charges and expenses of the variable annuity or variable universal life contract.
Actual Expenses
The first line of the table below provides information about actual account values and actual expenses. You may use the information in this line, together with the amount you invested, to estimate the expenses that you paid over the period. Simply divide your account value by $1,000 (for example, an $8,600 account value divided by $1,000 = 8.6), then multiply the result by the number in the first line under the heading entitled “Expenses Paid During Period” to estimate the expenses you paid on your account during this period.
Hypothetical Example for Comparison Purposes
The second line of the table below provides information about hypothetical account values and hypothetical expenses based on the Fund’s actual expense ratio and an assumed rate of return of 5% per year before expenses, which is not the Fund’s actual return. The hypothetical account values and expenses may not be used to estimate the actual ending account balance or expenses you paid for the period. You may use this information to compare the ongoing costs of investing in the Fund and other funds. To do so, compare the 5% hypothetical example with the 5% hypothetical examples that appear in the shareholder reports of the other funds.
Please note that the expenses shown in the table are meant to highlight your ongoing costs only and do not reflect any transactional costs. Therefore, the second line of the table is useful in comparing ongoing costs only, and will not help you determine the relative total costs of owning different funds. In addition, if these transactional costs were included, your costs would have been higher.
| | BEGINNING | ENDING | EXPENSES PAID |
| | ACCOUNT VALUE | ACCOUNT VALUE | DURING PERIOD* |
| | 7/1/13 | 12/31/13 | 7/1/13 - 12/31/13 |
| Actual | $1,000.00 | $1,160.96 | $2.28 |
| |
Hypothetical
(5% return per year before expenses) | $1,000.00 | $1,023.09 | $2.14 |
* Expenses are equal to the Fund’s annualized expense ratio of 0.42%, multiplied by the average account value over the period, multiplied by 184/365 (to reflect the one-half year period).
6 www.calvert.com CALVERT VP S&P 500 INDEX PORTFOLIO ANNUAL REPORT
REPORT OF INDEPENDENT REGISTERED PUBLIC ACCOUNTING FIRM
The Board of Directors of Calvert Variable Products, Inc. and Shareholders of Calvert VP S&P 500 Index Portfolio: We have audited the accompanying statement of net assets of the Calvert VP S&P 500 Index Portfolio (the “Portfolio”), a series of Calvert Variable Products, Inc., as of December 31, 2013, and the related statement of operations for the year then ended, the statements of changes in net assets for each of the years in the two-year period then ended, and the financial highlights for each of the years in the five-year period then ended. These financial statements and financial highlights are the responsibility of the Portfolio’s management. Our responsibility is to express an opinion on these financial statements and financial highlights based on our audits.
We conducted our audits in accordance with the standards of the Public Company Accounting Oversight Board (United States). Those standards require that we plan and perform the audit to obtain reasonable assurance about whether the financial statements and financial highlights are free of material misstatement. An audit includes examining, on a test basis, evidence supporting the amounts and disclosures in the financial statements. Our procedures included confirmation of securities owned as of December 31, 2013, by correspondence with the custodian and brokers or by performing other appropriate auditing procedures. An audit also includes assessing the accounting principles used and significant estimates made by management, as well as evaluating the overall financial statement presentation. We believe that our audits provide a reasonable basis for our opinion.
In our opinion, the financial statements and financial highlights referred to above present fairly, in all material respects, the financial position of the Calvert VP S&P 500 Index Portfolio as of December 31, 2013, the results of its operations for the year then ended, the changes in its net assets for each of the years in the two-year period then ended, and the financial highlights for each of the years in the five-year period then ended, in conformity with U.S. generally accepted accounting principles.

Philadelphia, Pennsylvania
February 24, 2014
www.calvert.com CALVERT VP S&P 500 INDEX PORTFOLIO ANNUAL REPORT 7
| | |
| STATEMENT OF NET ASSETS |
| DECEMBER 31, 2013 |
| |
| EQUITY SECURITIES - 98.2% | SHARES | VALUE |
| Aerospace & Defense - 2.7% | | |
| General Dynamics Corp. | 7,059 | $674,487 |
| Honeywell International, Inc. | 16,471 | 1,504,955 |
| L-3 Communications Holdings, Inc. | 1,914 | 204,530 |
| Lockheed Martin Corp. | 5,648 | 839,632 |
| Northrop Grumman Corp. | 4,660 | 534,083 |
| Precision Castparts Corp | 3,049 | 821,096 |
| Raytheon Co | 6,706 | 608,234 |
| Rockwell Collins, Inc. | 2,884 | 213,185 |
| Textron, Inc | 5,909 | 217,215 |
| The Boeing Co. | 14,512 | 1,980,743 |
| United Technologies Corp | 17,720 | 2,016,536 |
| | | 9,614,696 |
| |
| Air Freight & Logistics - 0.8% | | |
| C.H. Robinson Worldwide, Inc | 3,183 | 185,696 |
| Expeditors International of Washington, Inc. | 4,394 | 194,435 |
| FedEx Corp | 6,266 | 900,863 |
| United Parcel Service, Inc., Class B | 15,005 | 1,576,725 |
| | | 2,857,719 |
| |
| Airlines - 0.2% | | |
| Delta Air Lines, Inc | 17,910 | 491,988 |
| Southwest Airlines Co | 14,947 | 281,601 |
| | | 773,589 |
| |
| Auto Components - 0.4% | | |
| BorgWarner, Inc. | 4,777 | 267,082 |
| Delphi Automotive plc | 5,975 | 359,277 |
| Goodyear Tire & Rubber Co | 5,316 | 126,786 |
| Johnson Controls, Inc | 14,379 | 737,643 |
| | | 1,490,788 |
| |
| Automobiles - 0.7% | | |
| Ford Motor Co. | 82,799 | 1,277,588 |
| General Motors Co.* | 23,838 | 974,259 |
| Harley-Davidson, Inc | 4,641 | 321,343 |
| | | 2,573,190 |
| |
| Beverages - 2.1% | | |
| Beam, Inc | 3,421 | 232,833 |
| Brown-Forman Corp., Class B | 3,439 | 259,885 |
| Coca-Cola Enterprises, Inc | 5,069 | 223,695 |
| Constellation Brands, Inc.* | 3,510 | 247,034 |
| Dr Pepper Snapple Group, Inc. | 4,339 | 211,396 |
| Molson Coors Brewing Co., Class B | 3,340 | 187,541 |
| Monster Beverage Corp.* | 2,870 | 194,500 |
| PepsiCo, Inc | 32,192 | 2,670,005 |
| The Coca-Cola Co | 79,719 | 3,293,192 |
| | | 7,520,081 |
8 www.calvert.com CALVERT VP S&P 500 INDEX PORTFOLIO ANNUAL REPORT
| | |
| EQUITY SECURITIES - CONT’D | SHARES | VALUE |
| Biotechnology - 2.4% | | |
| Alexion Pharmaceuticals, Inc.* | 4,152 | $552,465 |
| Amgen, Inc. | 15,830 | 1,807,153 |
| Biogen Idec, Inc.* | 4,958 | 1,387,001 |
| Celgene Corp.* | 8,650 | 1,461,504 |
| Gilead Sciences, Inc.* | 32,187 | 2,418,853 |
| Regeneron Pharmaceuticals, Inc.* | 1,651 | 454,421 |
| Vertex Pharmaceuticals, Inc.* | 4,928 | 366,150 |
| | | 8,447,547 |
| |
| Building Products - 0.1% | | |
| Allegion plc* | 1,909 | 84,359 |
| Masco Corp. | 7,589 | 172,801 |
| | | 257,160 |
| |
| Capital Markets - 2.2% | | |
| Ameriprise Financial, Inc. | 4,084 | 469,864 |
| Bank of New York Mellon Corp | 24,109 | 842,368 |
| BlackRock, Inc | 2,655 | 840,228 |
| Charles Schwab Corp | 24,476 | 636,376 |
| E*Trade Financial Corp.* | 6,096 | 119,725 |
| Franklin Resources, Inc | 8,475 | 489,262 |
| Goldman Sachs Group, Inc | 8,840 | 1,566,978 |
| Invesco Ltd. | 9,458 | 344,271 |
| Legg Mason, Inc. | 2,372 | 103,135 |
| Morgan Stanley | 29,082 | 912,012 |
| Northern Trust Corp. | 4,778 | 295,710 |
| State Street Corp | 9,215 | 676,289 |
| T. Rowe Price Group, Inc | 5,515 | 461,992 |
| | | 7,758,210 |
| |
| Chemicals - 2.5% | | |
| Air Products & Chemicals, Inc. | 4,430 | 495,185 |
| Airgas, Inc | 1,401 | 156,702 |
| CF Industries Holdings, Inc | 1,212 | 282,444 |
| Dow Chemical Co. | 25,460 | 1,130,424 |
| E. I. du Pont de Nemours & Co | 19,440 | 1,263,017 |
| Eastman Chemical Co. | 3,296 | 265,987 |
| Ecolab, Inc. | 5,741 | 598,614 |
| FMC Corp | 2,798 | 211,137 |
| International Flavors & Fragrances, Inc. | 1,733 | 149,003 |
| LyondellBasell Industries NV | 9,170 | 736,168 |
| Monsanto Co | 11,038 | 1,286,479 |
| Mosaic Co | 7,210 | 340,817 |
| PPG Industries, Inc | 2,981 | 565,376 |
| Praxair, Inc | 6,179 | 803,455 |
| Sherwin-Williams Co | 1,821 | 334,154 |
| Sigma-Aldrich Corp. | 2,559 | 240,572 |
| | | 8,859,534 |
| |
| Commercial Banks - 2.7% | | |
| BB&T Corp | 14,921 | 556,852 |
| Comerica, Inc. | 3,970 | 188,734 |
| Fifth Third Bancorp | 18,589 | 390,927 |
| Huntington Bancshares, Inc | 17,836 | 172,117 |
| KeyCorp | 18,822 | 252,591 |
| M&T Bank Corp | 2,752 | 320,388 |
www.calvert.com CALVERT VP S&P 500 INDEX PORTFOLIO ANNUAL REPORT 9
| | |
| EQUITY SECURITIES - CONT’D | SHARES | VALUE |
| Commercial Banks - Cont’d | | |
| Regions Financial Corp | 28,917 | $285,989 |
| SunTrust Banks, Inc. | 11,236 | 413,597 |
| The PNC Financial Services Group, Inc. | 11,260 | 873,551 |
| US Bancorp | 38,337 | 1,548,815 |
| Wells Fargo & Co | 100,922 | 4,581,859 |
| Zions Bancorporation | 3,918 | 117,383 |
| | | 9,702,803 |
| |
| Commercial Services & Supplies - 0.5% | | |
| Cintas Corp. | 2,215 | 131,992 |
| Iron Mountain, Inc | 3,568 | 108,289 |
| Pitney Bowes, Inc | 4,271 | 99,514 |
| Republic Services, Inc. | 5,747 | 190,800 |
| Stericycle, Inc.* | 1,834 | 213,056 |
| The ADT Corp | 4,233 | 171,310 |
| Tyco International Ltd | 9,867 | 404,942 |
| Waste Management, Inc. | 9,159 | 410,964 |
| | | 1,730,867 |
| |
| Communications Equipment - 1.7% | | |
| Cisco Systems, Inc. | 112,233 | 2,519,631 |
| F5 Networks, Inc.* | 1,676 | 152,281 |
| Harris Corp | 2,330 | 162,657 |
| Juniper Networks, Inc.* | 10,763 | 242,921 |
| Motorola Solutions, Inc. | 4,833 | 326,228 |
| QUALCOMM, Inc. | 35,464 | 2,633,202 |
| | | 6,036,920 |
| |
| Computers & Peripherals - 4.0% | | |
| Apple, Inc. | 18,937 | 10,625,740 |
| EMC Corp | 43,197 | 1,086,404 |
| Hewlett-Packard Co | 40,342 | 1,128,769 |
| NetApp, Inc. | 7,240 | 297,854 |
| SanDisk Corp. | 4,794 | 338,169 |
| Seagate Technology plc | 6,870 | 385,819 |
| Western Digital Corp | 4,419 | 370,754 |
| | | 14,233,509 |
| |
| Construction & Engineering - 0.2% | | |
| Fluor Corp. | 3,464 | 278,124 |
| Jacobs Engineering Group, Inc.* | 2,781 | 175,175 |
| Quanta Services, Inc.* | 4,528 | 142,904 |
| | | 596,203 |
| |
| Construction Materials - 0.0% | | |
| Vulcan Materials Co. | 2,765 | 164,296 |
| |
| Consumer Finance - 1.0% | | |
| American Express Co. | 19,339 | 1,754,628 |
| Capital One Financial Corp | 12,103 | 927,211 |
| Discover Financial Services | 10,055 | 562,577 |
| SLM Corp | 9,158 | 240,672 |
| | | 3,485,088 |
10 www.calvert.com CALVERT VP S&P 500 INDEX PORTFOLIO ANNUAL REPORT
| | |
| EQUITY SECURITIES - CONT’D | SHARES | VALUE |
| Containers & Packaging - 0.2% | | |
| Avery Dennison Corp. | 2,028 | $101,785 |
| Ball Corp. | 3,163 | 163,401 |
| Bemis Co., Inc. | 2,187 | 89,580 |
| MeadWestvaco Corp | 3,763 | 138,968 |
| Owens-Illinois, Inc.* | 3,498 | 125,158 |
| Sealed Air Corp | 4,163 | 141,750 |
| | | 760,642 |
| |
| Distributors - 0.1% | | |
| Genuine Parts Co | 3,295 | 274,111 |
| |
| Diversified Consumer Services - 0.1% | | |
| Graham Holdings Co.* | 97 | 64,342 |
| H&R Block, Inc. | 5,787 | 168,055 |
| | | 232,397 |
| |
| Diversified Financial Services - 5.1% | | |
| Bank of America Corp. | 223,896 | 3,486,061 |
| Berkshire Hathaway, Inc., Class B* | 37,785 | 4,479,790 |
| Citigroup, Inc. | 63,667 | 3,317,687 |
| CME Group, Inc. | 6,651 | 521,838 |
| IntercontinentalExchange Group, Inc. | 2,432 | 547,005 |
| JPMorgan Chase & Co. | 79,110 | 4,626,353 |
| Leucadia National Corp | 6,633 | 187,979 |
| McGraw Hill Financial, Inc. | 5,684 | 444,489 |
| Moody’s Corp | 3,973 | 311,761 |
| The NASDAQ OMX Group, Inc | 2,444 | 97,271 |
| | | 18,020,234 |
| |
| Diversified Telecommunication Services - 2.1% | | |
| AT&T, Inc. | 110,582 | 3,888,063 |
| CenturyLink, Inc. | 12,407 | 395,163 |
| Frontier Communications Corp | 21,193 | 98,548 |
| Verizon Communications, Inc. | 60,072 | 2,951,938 |
| Windstream Holdings, Inc | 12,605 | 100,588 |
| | | 7,434,300 |
| |
| Electric Utilities - 1.6% | | |
| American Electric Power Co., Inc. | 10,335 | 483,058 |
| Duke Energy Corp | 14,820 | 1,022,728 |
| Edison International | 6,928 | 320,766 |
| Entergy Corp. | 3,789 | 239,730 |
| Exelon Corp | 18,197 | 498,416 |
| FirstEnergy Corp. | 8,893 | 293,291 |
| NextEra Energy, Inc. | 9,030 | 773,149 |
| Northeast Utilities | 6,690 | 283,589 |
| Pepco Holdings, Inc | 5,289 | 101,179 |
| Pinnacle West Capital Corp | 2,338 | 123,727 |
| PPL Corp | 13,447 | 404,620 |
| The Southern Co. | 18,509 | 760,905 |
| Xcel Energy, Inc | 10,574 | 295,438 |
| | | 5,600,596 |
www.calvert.com CALVERT VP S&P 500 INDEX PORTFOLIO ANNUAL REPORT 11
| | |
| EQUITY SECURITIES - CONT’D | SHARES | VALUE |
| Electrical Equipment - 0.8% | | |
| AMETEK, Inc. | 5,169 | $272,251 |
| Eaton Corp. plc | 9,960 | 758,155 |
| Emerson Electric Co. | 14,777 | 1,037,050 |
| Rockwell Automation, Inc. | 2,970 | 350,935 |
| Roper Industries, Inc | 2,105 | 291,921 |
| | | 2,710,312 |
| |
| Electronic Equipment & Instruments - 0.4% | | |
| Amphenol Corp. | 3,400 | 303,212 |
| Corning, Inc. | 30,379 | 541,354 |
| FLIR Systems, Inc | 3,017 | 90,812 |
| Jabil Circuit, Inc. | 4,017 | 70,056 |
| TE Connectivity Ltd | 8,614 | 474,718 |
| | | 1,480,152 |
| |
| Energy Equipment & Services - 1.8% | | |
| Baker Hughes, Inc. | 9,395 | 519,168 |
| Cameron International Corp.* | 4,993 | 297,233 |
| Diamond Offshore Drilling, Inc. | 1,478 | 84,128 |
| Ensco plc | 4,955 | 283,327 |
| FMC Technologies, Inc.* | 5,046 | 263,452 |
| Halliburton Co. | 17,897 | 908,273 |
| Helmerich & Payne, Inc. | 2,263 | 190,273 |
| Nabors Industries Ltd. | 5,495 | 93,360 |
| National Oilwell Varco, Inc. | 8,986 | 714,656 |
| Noble Corp. plc | 5,386 | 201,813 |
| Rowan Co.’s plc* | 2,641 | 93,386 |
| Schlumberger Ltd | 27,645 | 2,491,091 |
| Transocean Ltd. | 7,200 | 355,824 |
| | | 6,495,984 |
| |
| Food & Staples Retailing - 2.3% | | |
| Costco Wholesale Corp | 9,172 | 1,091,560 |
| CVS Caremark Corp. | 24,985 | 1,788,177 |
| Kroger Co. | 11,059 | 437,162 |
| Safeway, Inc. | 5,127 | 166,986 |
| Sysco Corp | 12,208 | 440,709 |
| Walgreen Co. | 18,335 | 1,053,162 |
| Wal-Mart Stores, Inc. | 33,962 | 2,672,470 |
| Whole Foods Market, Inc. | 7,884 | 455,932 |
| | | 8,106,158 |
| |
| Food Products - 1.5% | | |
| Archer-Daniels-Midland Co | 13,812 | 599,441 |
| Campbell Soup Co | 3,797 | 164,334 |
| ConAgra Foods, Inc | 8,863 | 298,683 |
| General Mills, Inc. | 13,314 | 664,502 |
| Hormel Foods Corp | 2,872 | 129,728 |
| J.M. Smucker Co. | 2,225 | 230,554 |
| Kellogg Co. | 5,396 | 329,534 |
| Kraft Foods Group, Inc. | 12,508 | 674,431 |
| McCormick & Co., Inc. | 2,805 | 193,321 |
| Mead Johnson Nutrition Co | 4,306 | 360,671 |
| Mondelez International, Inc | 36,814 | 1,299,534 |
| The Hershey Co | 3,187 | 309,872 |
| Tyson Foods, Inc. | 5,702 | 190,789 |
| | | 5,445,394 |
12 www.calvert.com CALVERT VP S&P 500 INDEX PORTFOLIO ANNUAL REPORT
| | |
| EQUITY SECURITIES - CONT’D | SHARES | VALUE |
| Gas Utilities - 0.1% | | |
| AGL Resources, Inc. | 2,513 | $118,689 |
| Oneok, Inc | 4,383 | 272,535 |
| | | 391,224 |
| |
| Health Care Equipment & Supplies - 2.0% | | |
| Abbott Laboratories | 32,457 | 1,244,077 |
| Baxter International, Inc. | 11,392 | 792,314 |
| Becton Dickinson & Co. | 4,131 | 456,434 |
| Boston Scientific Corp.* | 28,028 | 336,897 |
| C.R. Bard, Inc | 1,675 | 224,349 |
| CareFusion Corp.* | 4,436 | 176,641 |
| Covidien plc | 9,736 | 663,022 |
| DENTSPLY International, Inc. | 3,045 | 147,622 |
| Edwards Lifesciences Corp.* | 2,402 | 157,955 |
| Intuitive Surgical, Inc.* | 799 | 306,880 |
| Medtronic, Inc. | 20,957 | 1,202,722 |
| St. Jude Medical, Inc. | 6,107 | 378,329 |
| Stryker Corp. | 6,252 | 469,775 |
| Varian Medical Systems, Inc.* | 2,306 | 179,153 |
| Zimmer Holdings, Inc. | 3,580 | 333,620 |
| | | 7,069,790 |
| |
| Health Care Providers & Services - 2.0% | | |
| Aetna, Inc. | 7,714 | 529,103 |
| AmerisourceBergen Corp. | 4,910 | 345,222 |
| Cardinal Health, Inc. | 7,269 | 485,642 |
| CIGNA Corp | 5,802 | 507,559 |
| DaVita HealthCare Partners, Inc.* | 3,735 | 236,687 |
| Express Scripts Holding Co.* | 16,915 | 1,188,110 |
| Humana, Inc | 3,273 | 337,839 |
| Laboratory Corporation of America Holdings* | 1,907 | 174,242 |
| McKesson Corp. | 4,819 | 777,787 |
| Patterson Co.’s, Inc | 1,790 | 73,748 |
| Quest Diagnostics, Inc. | 3,053 | 163,458 |
| Tenet Healthcare Corp.* | 2,151 | 90,600 |
| UnitedHealth Group, Inc. | 21,133 | 1,591,315 |
| WellPoint, Inc. | 6,201 | 572,910 |
| | | 7,074,222 |
| |
| Health Care Technology - 0.1% | | |
| Cerner Corp.* | 6,212 | 346,257 |
| |
| Hotels, Restaurants & Leisure - 1.7% | | |
| Carnival Corp. | 9,265 | 372,175 |
| Chipotle Mexican Grill, Inc.* | 658 | 350,569 |
| Darden Restaurants, Inc | 2,761 | 150,116 |
| International Game Technology | 5,537 | 100,552 |
| Marriott International, Inc | 4,813 | 237,570 |
| McDonald’s Corp. | 20,887 | 2,026,666 |
| Starbucks Corp. | 15,819 | 1,240,051 |
| Starwood Hotels & Resorts Worldwide, Inc. | 4,020 | 319,389 |
| Wyndham Worldwide Corp. | 2,735 | 201,542 |
| Wynn Resorts Ltd | 1,697 | 329,574 |
| Yum! Brands, Inc. | 9,348 | 706,802 |
| | | 6,035,006 |
www.calvert.com CALVERT VP S&P 500 INDEX PORTFOLIO ANNUAL REPORT 13
| | |
| EQUITY SECURITIES - CONT’D | SHARES | VALUE |
| Household Durables - 0.4% | | |
| D.R. Horton, Inc.* | 5,959 | $133,005 |
| Garmin Ltd | 2,604 | 120,357 |
| Harman International Industries, Inc | 1,445 | 118,273 |
| Leggett & Platt, Inc. | 3,039 | 94,027 |
| Lennar Corp. | 3,519 | 139,212 |
| Mohawk Industries, Inc.* | 1,277 | 190,145 |
| Newell Rubbermaid, Inc. | 6,135 | 198,835 |
| PulteGroup, Inc. | 7,252 | 147,723 |
| Whirlpool Corp. | 1,682 | 263,839 |
| | | 1,405,416 |
| |
| Household Products - 2.0% | | |
| Colgate-Palmolive Co. | 18,450 | 1,203,124 |
| Kimberly-Clark Corp. | 8,011 | 836,829 |
| Procter & Gamble Co | 57,209 | 4,657,385 |
| The Clorox Co | 2,709 | 251,287 |
| | | 6,948,625 |
| |
| Independent Power Producers & Energy Traders - 0.1% | | |
| AES Corp | 13,743 | 199,411 |
| NRG Energy, Inc | 6,860 | 197,019 |
| | | 396,430 |
| |
| Industrial Conglomerates - 2.5% | | |
| 3M Co. | 13,426 | 1,882,997 |
| Danaher Corp. | 12,661 | 977,429 |
| General Electric Co | 212,867 | 5,966,662 |
| | | 8,827,088 |
| |
| Insurance - 3.0% | | |
| ACE Ltd. | 7,138 | 738,997 |
| Aflac, Inc | 9,784 | 653,571 |
| Allstate Corp. | 9,548 | 520,748 |
| American International Group, Inc | 30,907 | 1,577,802 |
| Aon plc | 6,319 | 530,101 |
| Assurant, Inc. | 1,587 | 105,329 |
| Cincinnati Financial Corp. | 3,125 | 163,656 |
| Genworth Financial, Inc.* | 10,481 | 162,770 |
| Hartford Financial Services Group, Inc | 9,385 | 340,019 |
| Lincoln National Corp | 5,507 | 284,271 |
| Loews Corp | 6,536 | 315,297 |
| Marsh & McLennan Co.’s, Inc. | 11,520 | 557,107 |
| MetLife, Inc. | 23,532 | 1,268,845 |
| Principal Financial Group, Inc | 5,864 | 289,154 |
| Progressive Corp. | 11,781 | 321,268 |
| Prudential Financial, Inc. | 9,719 | 896,286 |
| The Chubb Corp. | 5,285 | 510,690 |
| The Travelers Co.’s, Inc | 7,642 | 691,907 |
| Torchmark Corp | 1,967 | 153,721 |
| Unum Group | 5,673 | 199,009 |
| XL Group plc | 6,160 | 196,134 |
| | | 10,476,682 |
14 www.calvert.com CALVERT VP S&P 500 INDEX PORTFOLIO ANNUAL REPORT
| | |
| EQUITY SECURITIES - CONT’D | SHARES | VALUE |
| Internet & Catalog Retail - 1.5% | | |
| Amazon.com, Inc.* | 7,783 | $3,103,782 |
| Expedia, Inc. | 2,162 | 150,605 |
| Netflix, Inc.* | 1,247 | 459,108 |
| priceline.com, Inc.* | 1,080 | 1,255,392 |
| TripAdvisor, Inc.* | 2,348 | 194,485 |
| | | 5,163,372 |
| |
| Internet Software & Services - 3.1% | | |
| Akamai Technologies, Inc.* | 3,778 | 178,246 |
| eBay, Inc.* | 24,458 | 1,342,499 |
| Facebook, Inc.* | 34,423 | 1,881,561 |
| Google, Inc.* | 5,908 | 6,621,155 |
| VeriSign, Inc.* | 2,704 | 161,645 |
| Yahoo!, Inc.* | 19,804 | 800,874 |
| | | 10,985,980 |
| |
| IT Services - 3.6% | | |
| Accenture plc | 13,345 | 1,097,226 |
| Alliance Data Systems Corp.* | 1,020 | 268,189 |
| Automatic Data Processing, Inc. | 10,106 | 816,666 |
| Cognizant Technology Solutions Corp.* | 6,414 | 647,686 |
| Computer Sciences Corp. | 3,195 | 178,537 |
| Fidelity National Information Services, Inc | 6,233 | 334,587 |
| Fiserv, Inc.* | 5,506 | 325,129 |
| International Business Machines Corp. | 21,426 | 4,018,875 |
| MasterCard, Inc. | 2,173 | 1,815,454 |
| Paychex, Inc | 6,887 | 313,565 |
| Teradata Corp.* | 3,475 | 158,078 |
| Total System Services, Inc | 3,421 | 113,851 |
| Visa, Inc. | 10,690 | 2,380,449 |
| Western Union Co | 11,846 | 204,343 |
| | | 12,672,635 |
| |
| Leisure Equipment & Products - 0.1% | | |
| Hasbro, Inc. | 2,449 | 134,720 |
| Mattel, Inc. | 7,104 | 338,008 |
| | | 472,728 |
| |
| Life Sciences - Tools & Services - 0.5% | | |
| Agilent Technologies, Inc | 7,024 | 401,703 |
| Life Technologies Corp.* | 3,663 | 277,655 |
| PerkinElmer, Inc | 2,449 | 100,972 |
| Thermo Fisher Scientific, Inc | 7,633 | 849,935 |
| Waters Corp.* | 1,822 | 182,200 |
| | | 1,812,465 |
| |
| Machinery - 1.8% | | |
| Caterpillar, Inc | 13,358 | 1,213,040 |
| Cummins, Inc | 3,685 | 519,474 |
| Deere & Co. | 8,103 | 740,047 |
| Dover Corp | 3,638 | 351,213 |
| Flowserve Corp. | 2,928 | 230,814 |
| Illinois Tool Works, Inc | 8,571 | 720,650 |
| Ingersoll-Rand plc | 5,729 | 352,906 |
| Joy Global, Inc | 2,260 | 132,187 |
| PACCAR, Inc. | 7,522 | 445,077 |
www.calvert.com CALVERT VP S&P 500 INDEX PORTFOLIO ANNUAL REPORT 15
| | |
| EQUITY SECURITIES - CONT’D | SHARES | VALUE |
| Machinery - Cont’d | | |
| Pall Corp | 2,372 | $202,450 |
| Parker Hannifin Corp. | 3,174 | 408,303 |
| Pentair Ltd. | 4,215 | 327,379 |
| Snap-on, Inc. | 1,240 | 135,805 |
| Stanley Black & Decker, Inc. | 3,258 | 262,888 |
| Xylem, Inc. | 3,941 | 136,359 |
| | | 6,178,592 |
| |
| Media - 3.6% | | |
| Cablevision Systems Corp. | 4,778 | 85,670 |
| CBS Corp., Class B | 11,715 | 746,714 |
| Comcast Corp | 54,703 | 2,842,641 |
| DIRECTV* | 10,258 | 708,725 |
| Discovery Communications, Inc.* | 4,737 | 428,320 |
| Gannett Co., Inc | 4,869 | 144,025 |
| News Corp.* | 10,582 | 190,688 |
| Omnicom Group, Inc | 5,498 | 408,886 |
| Scripps Networks Interactive, Inc. | 2,315 | 200,039 |
| The Interpublic Group of Co.’s, Inc. | 9,110 | 161,247 |
| The Walt Disney Co | 34,306 | 2,620,978 |
| Time Warner Cable, Inc. | 5,917 | 801,753 |
| Time Warner, Inc. | 18,991 | 1,324,052 |
| Twenty-First Century Fox, Inc. | 41,192 | 1,449,135 |
| Viacom, Inc., Class B | 8,596 | 750,775 |
| | | 12,863,648 |
| |
| Metals & Mining - 0.5% | | |
| Alcoa, Inc | 22,741 | 241,737 |
| Allegheny Technologies, Inc. | 2,285 | 81,414 |
| Cliffs Natural Resources, Inc | 3,241 | 84,947 |
| Freeport-McMoRan Copper & Gold, Inc | 21,792 | 822,430 |
| Newmont Mining Corp | 10,573 | 243,496 |
| Nucor Corp. | 6,757 | 360,689 |
| United States Steel Corp. | 3,129 | 92,305 |
| | | 1,927,018 |
| |
| Multiline Retail - 0.7% | | |
| Dollar General Corp.* | 6,185 | 373,079 |
| Dollar Tree, Inc.* | 4,459 | 251,577 |
| Family Dollar Stores, Inc. | 2,029 | 131,824 |
| Kohl’s Corp. | 4,333 | 245,898 |
| Macy’s, Inc | 7,735 | 413,049 |
| Nordstrom, Inc. | 3,065 | 189,417 |
| Target Corp. | 13,358 | 845,161 |
| | | 2,450,005 |
| |
| Multi-Utilities - 1.1% | | |
| Ameren Corp. | 5,160 | 186,586 |
| Centerpoint Energy, Inc. | 9,117 | 211,332 |
| CMS Energy Corp. | 5,653 | 151,331 |
| Consolidated Edison, Inc. | 6,227 | 344,228 |
| Dominion Resources, Inc | 12,284 | 794,652 |
| DTE Energy Co | 3,699 | 245,577 |
| Integrys Energy Group, Inc | 1,683 | 91,572 |
| NiSource, Inc | 6,633 | 218,093 |
| PG&E Corp | 9,401 | 378,672 |
16 www.calvert.com CALVERT VP S&P 500 INDEX PORTFOLIO ANNUAL REPORT
| | |
| EQUITY SECURITIES - CONT’D | SHARES | VALUE |
| Multi-Utilities - Cont’d | | |
| Public Service Enterprise Group, Inc. | 10,763 | $344,846 |
| SCANA Corp | 2,966 | 139,194 |
| Sempra Energy | 4,793 | 430,220 |
| TECO Energy, Inc. | 4,324 | 74,546 |
| Wisconsin Energy Corp. | 4,864 | 201,078 |
| | | 3,811,927 |
| |
| Office Electronics - 0.1% | | |
| Xerox Corp. | 24,522 | 298,433 |
| |
| Oil, Gas & Consumable Fuels - 8.3% | | |
| Anadarko Petroleum Corp. | 10,564 | 837,937 |
| Apache Corp. | 8,380 | 720,177 |
| Cabot Oil & Gas Corp. | 8,963 | 347,406 |
| Chesapeake Energy Corp. | 10,723 | 291,022 |
| Chevron Corp | 40,470 | 5,055,108 |
| ConocoPhillips | 25,716 | 1,816,835 |
| Consol Energy, Inc. | 4,862 | 184,951 |
| Denbury Resources, Inc.* | 7,938 | 130,421 |
| Devon Energy Corp. | 8,029 | 496,754 |
| EOG Resources, Inc | 5,730 | 961,723 |
| EQT Corp. | 3,198 | 287,117 |
| Exxon Mobil Corp | 91,916 | 9,301,899 |
| Hess Corp. | 5,971 | 495,593 |
| Kinder Morgan, Inc. | 14,251 | 513,036 |
| Marathon Oil Corp | 14,623 | 516,192 |
| Marathon Petroleum Corp | 6,319 | 579,642 |
| Murphy Oil Corp. | 3,719 | 241,289 |
| Newfield Exploration Co.* | 2,872 | 70,737 |
| Noble Energy, Inc | 7,636 | 520,088 |
| Occidental Petroleum Corp. | 16,920 | 1,609,092 |
| Peabody Energy Corp. | 5,737 | 112,044 |
| Phillips 66 Co. | 12,585 | 970,681 |
| Pioneer Natural Resources Co | 2,985 | 549,449 |
| QEP Resources, Inc. | 3,811 | 116,807 |
| Range Resources Corp. | 3,468 | 292,387 |
| Southwestern Energy Co.* | 7,479 | 294,149 |
| Spectra Energy Corp. | 14,231 | 506,908 |
| Tesoro Corp | 2,888 | 168,948 |
| Valero Energy Corp. | 11,326 | 570,830 |
| Williams Co.’s, Inc. | 14,517 | 559,921 |
| WPX Energy, Inc.* | 4,258 | 86,778 |
| | | 29,205,921 |
| |
| Paper & Forest Products - 0.1% | | |
| International Paper Co | 9,312 | 456,567 |
| |
| Personal Products - 0.2% | | |
| Avon Products, Inc. | 9,210 | 158,596 |
| Estee Lauder Co.’s, Inc. | 5,412 | 407,632 |
| | | 566,228 |
| |
| Pharmaceuticals - 5.7% | | |
| AbbVie, Inc | 33,394 | 1,763,537 |
| Actavis plc* | 3,658 | 614,544 |
| Allergan, Inc | 6,302 | 700,026 |
www.calvert.com CALVERT VP S&P 500 INDEX PORTFOLIO ANNUAL REPORT 17
| | |
| EQUITY SECURITIES - CONT’D | SHARES | VALUE |
| Pharmaceuticals - Cont’d | | |
| Bristol-Myers Squibb Co. | 34,563 | $1,837,023 |
| Eli Lilly & Co. | 20,812 | 1,061,412 |
| Forest Laboratories, Inc.* | 4,991 | 299,610 |
| Hospira, Inc.* | 3,515 | 145,099 |
| Johnson & Johnson | 59,376 | 5,438,248 |
| Merck & Co., Inc. | 61,335 | 3,069,817 |
| Mylan, Inc.* | 8,104 | 351,714 |
| Perrigo Co. plc | 2,792 | 428,460 |
| Pfizer, Inc | 136,046 | 4,167,089 |
| Zoetis, Inc | 10,634 | 347,626 |
| | | 20,224,205 |
| |
| Professional Services - 0.2% | | |
| Equifax, Inc. | 2,565 | 177,216 |
| Nielsen Holdings NV | 5,354 | 245,695 |
| Robert Half International, Inc. | 2,967 | 124,584 |
| The Dun & Bradstreet Corp | 849 | 104,215 |
| | | 651,710 |
| |
| Real Estate Investment Trusts - 1.8% | | |
| American Tower Corp. | 8,284 | 661,229 |
| Apartment Investment & Management Co | 3,103 | 80,399 |
| AvalonBay Communities, Inc. | 2,586 | 305,743 |
| Boston Properties, Inc | 3,225 | 323,693 |
| Equity Residential | 7,093 | 367,914 |
| General Growth Properties, Inc. | 11,285 | 226,490 |
| HCP, Inc. | 9,666 | 351,069 |
| Health Care REIT, Inc. | 6,048 | 323,991 |
| Host Hotels & Resorts, Inc | 15,837 | 307,871 |
| Kimco Realty Corp. | 8,692 | 171,667 |
| Plum Creek Timber Co., Inc. | 3,713 | 172,692 |
| Prologis, Inc. | 10,592 | 391,374 |
| Public Storage | 3,071 | 462,247 |
| Simon Property Group, Inc. | 6,514 | 991,170 |
| The Macerich Co | 2,923 | 172,136 |
| Ventas, Inc | 6,233 | 357,026 |
| Vornado Realty Trust | 3,681 | 326,836 |
| Weyerhaeuser Co. | 12,267 | 387,269 |
| | | 6,380,816 |
| |
| Real Estate Management & Development - 0.0% | | |
| CBRE Group, Inc.* | 5,843 | 153,671 |
| |
| Road & Rail - 0.9% | | |
| CSX Corp. | 21,278 | 612,168 |
| Kansas City Southern | 2,343 | 290,134 |
| Norfolk Southern Corp | 6,484 | 601,910 |
| Ryder System, Inc. | 1,182 | 87,208 |
| Union Pacific Corp | 9,668 | 1,624,224 |
| | | 3,215,644 |
| |
| Semiconductors & Semiconductor Equipment - 2.0% | | |
| Altera Corp. | 6,808 | 221,464 |
| Analog Devices, Inc. | 6,553 | 333,744 |
| Applied Materials, Inc | 25,552 | 452,015 |
| Broadcom Corp. | 11,327 | 335,846 |
18 www.calvert.com CALVERT VP S&P 500 INDEX PORTFOLIO ANNUAL REPORT
| | |
| EQUITY SECURITIES - CONT’D | SHARES | VALUE |
| Semiconductors & Semiconductor Equipment - Cont’d | | |
| First Solar, Inc.* | 1,515 | $82,780 |
| Intel Corp. | 104,348 | 2,708,874 |
| KLA-Tencor Corp. | 3,528 | 227,415 |
| Lam Research Corp.* | 3,460 | 188,397 |
| Linear Technology Corp. | 4,960 | 225,928 |
| LSI Corp | 11,686 | 128,780 |
| Microchip Technology, Inc | 4,192 | 187,592 |
| Micron Technology, Inc.* | 21,898 | 476,500 |
| NVIDIA Corp. | 12,289 | 196,870 |
| Texas Instruments, Inc | 22,976 | 1,008,876 |
| Xilinx, Inc. | 5,612 | 257,703 |
| | | 7,032,784 |
| |
| Software - 3.4% | | |
| Adobe Systems, Inc.* | 9,759 | 584,369 |
| Autodesk, Inc.* | 4,780 | 240,577 |
| CA, Inc. | 6,820 | 229,493 |
| Citrix Systems, Inc.* | 3,980 | 251,735 |
| Electronic Arts, Inc.* | 6,436 | 147,642 |
| Intuit, Inc. | 5,979 | 456,317 |
| Microsoft Corp. | 159,864 | 5,983,710 |
| Oracle Corp. | 73,664 | 2,818,385 |
| Red Hat, Inc.* | 4,032 | 225,953 |
| Salesforce.com, Inc.* | 11,543 | 637,058 |
| Symantec Corp. | 14,811 | 349,243 |
| | | 11,924,482 |
| |
| Specialty Retail - 2.2% | | |
| AutoNation, Inc.* | 1,361 | 67,628 |
| AutoZone, Inc.* | 714 | 341,249 |
| Bed Bath & Beyond, Inc.* | 4,508 | 361,992 |
| Best Buy Co., Inc | 5,709 | 227,675 |
| CarMax, Inc.* | 4,775 | 224,520 |
| GameStop Corp | 2,530 | 124,628 |
| L Brands, Inc. | 5,108 | 315,930 |
| Lowe’s Co.’s, Inc | 21,953 | 1,087,771 |
| O’Reilly Automotive, Inc.* | 2,298 | 295,776 |
| PetSmart, Inc. | 2,197 | 159,832 |
| Ross Stores, Inc | 4,548 | 340,782 |
| Staples, Inc | 14,123 | 224,414 |
| The Gap, Inc. | 5,561 | 217,324 |
| The Home Depot, Inc. | 29,561 | 2,434,053 |
| Tiffany & Co. | 2,329 | 216,085 |
| TJX Co.’s, Inc | 14,929 | 951,425 |
| Urban Outfitters, Inc.* | 2,343 | 86,925 |
| | | 7,678,009 |
| |
| Textiles, Apparel & Luxury Goods - 0.8% | | |
| Coach, Inc. | 5,975 | 335,377 |
| Fossil Group, Inc.* | 1,064 | 127,616 |
| Michael Kors Holdings Ltd.* | 3,800 | 308,522 |
| Nike, Inc., Class B | 15,685 | 1,233,468 |
| PVH Corp. | 1,724 | 234,498 |
| Ralph Lauren Corp. | 1,252 | 221,066 |
| VF Corp. | 7,452 | 464,558 |
| | | 2,925,105 |
www.calvert.com CALVERT VP S&P 500 INDEX PORTFOLIO ANNUAL REPORT 19
| | |
| EQUITY SECURITIES - CONT’D | SHARES | VALUE |
| Thrifts & Mortgage Finance - 0.1% | | |
| Hudson City Bancorp, Inc | 10,462 | $98,657 |
| People’s United Financial, Inc. | 6,760 | 102,211 |
| | | 200,868 |
| |
| Tobacco - 1.5% | | |
| Altria Group, Inc. | 41,983 | 1,611,727 |
| Lorillard, Inc. | 7,732 | 391,858 |
| Philip Morris International, Inc. | 33,632 | 2,930,356 |
| Reynolds American, Inc. | 6,580 | 328,934 |
| | | 5,262,875 |
| |
| Trading Companies & Distributors - 0.2% | | |
| Fastenal Co. | 5,741 | 272,755 |
| W.W. Grainger, Inc | 1,309 | 334,345 |
| | | 607,100 |
| |
| Wireless Telecommunication Services - 0.1% | | |
| Crown Castle International Corp.* | 6,984 | 512,835 |
| |
| |
| Total Equity Securities (Cost $214,508,614) | | 347,268,843 |
| |
| EXCHANGE TRADED PRODUCTS - 0.4% | | |
| SPDR S&P 500 ETF Trust | 8,200 | 1,514,294 |
| |
| Total Exchange Traded Products (Cost $1,489,038) | | 1,514,294 |
| |
| | PRINCIPAL | |
| U.S. TREASURY OBLIGATIONS - 0.3% | AMOUNT | |
| United States Treasury Bills, 0.068%, 6/26/14^ | $1,000,000 | 999,670 |
| |
| Total U.S. Treasury Obligations (Cost $999,670) | | 999,670 |
| |
| TIME DEPOSIT - 1.0% | | |
| State Street Bank Time Deposit, 0.083%, 1/2/14 | 3,573,773 | 3,573,773 |
| |
| Total Time Deposit (Cost $3,573,773) | | 3,573,773 |
| |
| |
| TOTAL INVESTMENTS (Cost $220,571,095) - 99.9% | | 353,356,580 |
| Other assets and liabilities, net - 0.1% | | 331,155 |
| NET ASSETS - 100% | | $353,687,735 |
See notes to financial statements.
20 www.calvert.com CALVERT VP S&P 500 INDEX PORTFOLIO ANNUAL REPORT
| |
| NET ASSETS CONSISTS OF: | |
| Paid-in capital applicable to 3,197,407 shares of common stock outstanding; | |
| $0.10 par value, 30,000,000 shares authorized | $236,652,401 |
| Undistributed net investment income | 778,814 |
| Accumulated net realized gain (loss) | (16,695,930) |
| Net unrealized appreciation (depreciation) | 132,952,450 |
| |
| NET ASSETS | $353,687,735 |
| |
| NET ASSET VALUE PER SHARE | $110.62 |
| | | | UNDERLYING | UNREALIZED |
| | NUMBER OF | EXPIRATION | FACE AMOUNT | APPRECIATION |
| FUTURES | CONTRACTS | DATE | AT VALUE | (DEPRECIATION) |
| Purchased: | | | | |
| S&P 500 Index^ | 10 | 3/14 | $4,602,750 | $151,795 |
| E-Mini S&P 500 Index^ | 5 | 3/14 | 460,275 | 15,170 |
| Total Purchased | | | | $166,965 |
^ Futures collateralized by $1,000,000 par value of U.S. Treasury Bills.
* Non-income producing security.
Abbreviations:
ETF: Exchange Traded Fund
plc: Public Limited Company
REIT: Real Estate Investment Trust
See notes to financial statements.
www.calvert.com CALVERT VP S&P 500 INDEX PORTFOLIO ANNUAL REPORT 21
| |
| STATEMENT OF OPERATIONS |
| YEAR ENDED DECEMBER 31, 2013 |
| |
| NET INVESTMENT INCOME | |
| Investment Income: | |
| Dividend income (net of foreign taxes withheld of $1,269) | $6,961,375 |
| Interest income | 4,919 |
| Total investment income | 6,966,294 |
| |
| |
| Expenses: | |
| Investment advisory fee | 841,371 |
| Transfer agency fees and expenses | 47,723 |
| Accounting fees | 48,042 |
| Directors’ fees and expenses | 54,215 |
| Administrative fees | 331,530 |
| Custodian fees | 44,532 |
| Reports to shareholders | 89,578 |
| Professional fees | 60,837 |
| Miscellaneous | 73,784 |
| Total expenses | 1,591,612 |
| Reimbursement from Advisor | (205,306) |
| Net expenses | 1,386,306 |
| |
| |
| NET INVESTMENT INCOME | 5,579,988 |
| |
| |
| |
| REALIZED AND UNREALIZED GAIN (LOSS) | |
| Net realized gain (loss) on: | |
| Investments | 13,840,077 |
| Futures | 2,045,717 |
| | 15,885,794 |
| |
| Change in unrealized appreciation (depreciation) on: | |
| Investments | 68,185,036 |
| Futures | 179,913 |
| | 68,364,949 |
| |
| |
| NET REALIZED AND UNREALIZED GAIN (LOSS) | 84,250,743 |
| |
| INCREASE (DECREASE) IN NET ASSETS | |
| RESULTING FROM OPERATIONS | $89,830,731 |
See notes to financial statements.
22 www.calvert.com CALVERT VP S&P 500 INDEX PORTFOLIO ANNUAL REPORT
| | |
| STATEMENTS OF CHANGES IN NET ASSETS |
| |
| | YEAR ENDED | YEAR ENDED |
| | DECEMBER 31, | DECEMBER 31, |
| INCREASE (DECREASE) IN NET ASSETS | 2013 | 2012 |
| Operations: | | |
| Net investment income | $5,579,988 | $5,267,452 |
| Net realized gain (loss) | 15,885,794 | 3,464,870 |
| Change in unrealized appreciation (depreciation) | 68,364,949 | 30,895,357 |
| |
| |
| INCREASE (DECREASE) IN NET ASSETS | | |
| RESULTING FROM OPERATIONS | 89,830,731 | 39,627,679 |
| |
| Distributions to shareholders from: | | |
| Net investment income | (6,058,983) | (4,992,328) |
| Net realized gain | (4,919,185) | — |
| Total distributions | (10,978,168) | (4,992,328) |
| |
| |
| Capital share transactions: | | |
| Shares sold | 33,028,527 | 21,280,682 |
| Shares issued from merger (See Note F) | 28,959,426 | — |
| Reinvestment of distributions | 10,978,168 | 4,992,328 |
| Shares redeemed | (83,535,575) | (34,571,324) |
| Total capital share transactions | (10,569,454) | (8,298,314) |
| |
| |
| TOTAL INCREASE (DECREASE) IN NET ASSETS | 68,283,109 | 26,337,037 |
| |
| |
| NET ASSETS | | |
| Beginning of year | 285,404,626 | 259,067,589 |
| End of year (including undistributed net investment | | |
| income of $778,814 and $1,330,624, respectively) | $353,687,735 | $285,404,626 |
| |
| |
| CAPITAL SHARE ACTIVITY | | |
| Shares sold | 327,841 | 252,760 |
| Shares issued from merger (See Note F) | 297,026 | — |
| Reinvestment of distributions | 101,424 | 58,630 |
| Shares redeemed | (823,870) | (411,005) |
| Total capital share activity | (97,579) | (99,615) |
See notes to financial statements.
www.calvert.com CALVERT VP S&P 500 INDEX PORTFOLIO ANNUAL REPORT 23
NOTES TO FINANCIAL STATEMENTS
NOTE A — SIGNIFICANT ACCOUNTING POLICIES
General: Calvert VP S&P 500 Index Portfolio (the “Portfolio”), a series of Calvert Variable Products, Inc. (the “Fund”), is registered under the Investment Company Act of 1940 as a diversified, open-end management investment company. The Fund is comprised of twelve separate portfolios. The operations of each series of the Fund are accounted for separately. Shares of the Portfolio are sold without sales charge to affiliated and unaffiliated insurance companies for allocation to certain of their variable separate accounts.
Security Valuation: Net asset value per share is determined every business day as of the close of the regular session of the New York Stock Exchange (generally 4:00 p.m. Eastern time). The Portfolio uses independent pricing services approved by the Board of Directors (“the Board”) to value its investments wherever possible. Investments for which market quotations are not available or deemed not reliable are fair valued in good faith under the direction of the Board.
The Board has adopted Valuation Procedures (the “Procedures”) to determine the fair value of securities and other financial instruments for which market prices are not readily available or which may not be reliably priced. The Board has delegated the day-to-day responsibility for determining the fair value of assets of the Portfolio to Calvert Investment Management, Inc. (the “Advisor” or “Calvert”) and has provided these Procedures to govern Calvert in its valuation duties.
Calvert has chartered an internal Valuation Committee to oversee the implementation of these Procedures and to assist it in carrying out the valuation responsibilities that the Board has delegated.
The Valuation Committee meets on a regular basis to review illiquid securities and other investments which may not have readily available market prices. The Valuation Committee’s fair valuation determinations are subject to review, approval and ratification by the Board at its next regularly scheduled meeting covering the calendar quarter in which the fair valuation was determined.
The Valuation Committee utilizes various methods to measure the fair value of the Portfolio’s investments. Generally Accepted Accounting Principles (GAAP) establishes a disclosure hierarchy that categorizes the inputs to valuation techniques used to value assets and liabilities at measurement date. These inputs are summarized in the three broad levels listed below:
Level 1 – quoted prices in active markets for identical securities
Level 2 – other significant observable inputs (including quoted prices for similar securities, interest rates, prepayment speeds, credit risk, etc.)
Level 3 – significant unobservable inputs (including the Portfolio’s own assumptions in determining the fair value of investments) The inputs or methodologies used for valuing securities are not necessarily an indication of the risk associated with investing in those securities.
Changes in valuation techniques may result in transfers in or out of an investment’s assigned level within the hierarchy during the period. There were no such transfers during the period. Valuation techniques used to value the Portfolio’s investments by major category are as follows: Equity securities, including restricted securities, for which market quotations are readily available, are valued at the last reported sale price or official closing price as reported by an independent pricing service on the primary market or exchange on which they are traded and are categorized as Level 1 in the hierarchy.
In the event there were no sales during the day or closing prices are not available, securities are valued at the last quoted bid price or may be valued using the last available price and are categorized as Level 2 in the hierarchy. Foreign securities are valued based on quotations from the principal market in which
24 www.calvert.com CALVERT VP S&P 500 INDEX PORTFOLIO ANNUAL REPORT
such securities are normally traded. If events occur after the close of the principal market in which foreign securities are traded, and before the close of business of the Portfolio, that are expected to materially affect the value of those securities, then they are valued at their fair value taking these events into account. For restricted securities and private placements where observable inputs are limited, assumptions about market activity and risk are used and such securities are categorized as Level 3 in the hierarchy.
Exchange traded products are valued at the official closing price as reported by an independent pricing service on the primary market or exchange on which they are traded and are categorized as Level 1 in the hierarchy.
Debt securities, including restricted securities, are valued based on evaluated prices received from independent pricing services or from dealers who make markets in such securities. For U.S. government obligations, pricing services utilize matrix pricing which considers yield or price of bonds of comparable quality, coupon, maturity and type as well as dealer supplied prices and such securities are generally categorized as Level 2 in the hierarchy. Short-term securities of sufficient credit quality with remaining maturities of sixty days or less for which quotations are not readily available are valued at amortized cost, which approximates fair value, and are categorized as Level 2 in the hierarchy.
When independent prices are unavailable or unreliable, debt securities may be valued utilizing pricing matrices which consider similar factors that would be used by independent pricing services. These are generally categorized as Level 2 in the hierarchy but may be Level 3 depending on the circumstances.
If a market value cannot be determined for a security using the methodologies described above, or if, in the good faith opinion of the Advisor, the market value does not constitute a readily available market quotation, or if a significant event has occurred that would materially affect the value of the security, the security will be fair valued as determined in good faith by the Valuation Committee.
The Valuation Committee considers a number of factors, including significant unobservable valuation inputs when arriving at fair value. It considers all significant facts that are reasonably available and relevant to the determination of fair value.
The Valuation Committee primarily employs a market-based approach which may use related or comparable assets or liabilities, recent transactions, market multiples, book values, and other relevant information for the investment to determine the fair value of the investment. When more appropriate, the fund may employ an income-based or cost approach. An income-based valuation approach discounts anticipated future cash flows of the investment to calculate a present amount (discounted). The measurement is based on the value indicated by current market expectations about those future amounts. Discounts may also be applied due to the nature or duration of any restrictions on the disposition of the investments. A cost based approach is based on the amount that currently would be required to replace the service capacity of an asset (current replacement cost). From the seller’s perspective, the price that would be received for the asset is determined based on the cost to a buyer to acquire or construct a substitute asset of comparable utility, adjusted for obsolescence.
The values assigned to fair value investments are based on available information and do not necessarily represent amounts that might ultimately be realized. Further, due to the inherent uncertainty of valuations of such investments, the fair values may differ significantly from the values that would have been used had an active market existed, and the differences could be material. The Valuation Committee employs various methods for calibrating these valuation approaches including a regular review of key inputs and assumptions, transactional back-testing or disposition analysis and reviews of any related market activity.
At December 31, 2013, no securities were fair valued in good faith under the direction of the Board.
www.calvert.com CALVERT VP S&P 500 INDEX PORTFOLIO ANNUAL REPORT 25
The following is a summary of the inputs used to value the Portfolio’s net assets as of December 31, 2013:
| | | VALUATION INPUTS | |
| INVESTMENTS IN SECURITIES | LEVEL 1 | LEVEL 2 | LEVEL 3 | TOTAL |
| Equity securities* | $347,268,843 | — | — | $347,268,843 |
| Exchange traded products | 1,514,294 | — | — | 1,514,294 |
| U.S. government obligations | — | $999,670 | — | 999,670 |
| Other debt obligations | — | 3,573,773 | — | 3,573,773 |
| TOTAL | $348,783,137 | $4,573,443 | — | $353,356,580 |
| Other financial instruments** | $166,965 | — | — | $166,965 |
* For further breakdown of equity securities by industry type, please refer to the Statement of Net Assets.
** Other financial instruments are derivative instruments not reflected in the Total Investments in the Statement of Net Assets, such as futures, which are valued at the unrealized appreciation/depreciation on the instrument.
Futures Contracts: The Portfolio may purchase and sell futures contracts, when, in the judgment of the Advisor, such a position acts as a hedge, or to provide equity market exposure to the Portfolio’s uncommitted cash balances. The Portfolio may not enter into futures contracts for the purpose of speculation or leverage. These futures contracts may include, but are not limited to, market index futures contracts. The Portfolio is subject to market risk in the normal course of pursuing its investment objectives and may use futures contracts to hedge against changes in the value of securities. The Portfolio may enter into futures contracts agreeing to buy or sell a financial instrument for a set price at a future date. Initial margin deposits of either cash or securities as required by the broker are made upon entering into the contract. While the contract is open, daily variation margin payments are made to or received from the broker reflecting the daily change in market value of the contract and are recorded for financial reporting purposes as unrealized gains or losses by the Portfolio. When a futures contract is closed, a realized gain or loss is recorded equal to the difference between the opening and closing value of the contract. The risks associated with entering into futures contracts may include the possible illiquidity of the secondary market which would limit the Portfolio’s ability to close out a futures contract prior to the settlement date, an imperfect correlation between the value of the contracts and the underlying financial instruments, or that the counterparty will fail to perform its obligations under the contracts’ terms. Futures contracts are designed by boards of trade which are designated “contracts markets” by the Commodities Futures Trading Commission. Futures contracts trade on the contracts markets in a manner that is similar to the way a stock trades on a stock exchange and the boards of trade, through their clearing corporations, guarantee the futures contracts against default. As a result, there is minimal counterparty credit risk to the Portfolio. During the year, futures contracts were used to hedge the lack of equity market exposure inherent in a cash position. The Portfolio’s futures contracts at year end are presented in the Statement of Net Assets.
During the year, the Portfolio invested in E-Mini S&P 500 Index and S&P 500 Index futures. The volume of outstanding contracts has varied throughout the period with a weighted average of 43 contracts and $1,973,437 weighted average notional value.
Security Transactions and Investment Income: Security transactions are accounted for on trade date. Realized gains and losses are recorded on an identified cost basis and may include proceeds from litigation. Dividend income is recorded on the ex-dividend date or, in the case of dividends on certain foreign securities, as soon as the Portfolio is informed of the ex-dividend date. Distributions received on securities that represent a return of capital or capital gain are recorded as a reduction of cost of investments and/or as a realized gain. Interest income, which includes amortization of premium and accretion of discount on debt securities, is accrued as earned.
26 www.calvert.com CALVERT VP S&P 500 INDEX PORTFOLIO ANNUAL REPORT
Foreign Currency Transactions: The Portfolio’s accounting records are maintained in U.S. dollars. For valuation of assets and liabilities on each date of net asset value determination, foreign denominations are translated into U.S. dollars using the current exchange rate. Security transactions, income and expenses are translated at the prevailing rate of exchange on the date of the event. The effect of changes in foreign exchange rates on securities and foreign currencies is included with the net realized and unrealized gain or loss on investments.
Distributions to Shareholders: Distributions to shareholders are recorded by the Portfolio on ex-dividend date. Dividends from net investment income and distributions from net realized capital gains, if any, are paid at least annually. Distributions are determined in accordance with income tax regulations which may differ from generally accepted accounting principles; accordingly, periodic reclassifications are made within the Portfolio’s capital accounts to reflect income and gains available for distribution under income tax regulations.
Estimates: The preparation of financial statements in conformity with accounting principles generally accepted in the United States requires management to make estimates and assumptions that affect the reported amounts of assets and liabilities and disclosure of contingent assets and liabilities at the date of the financial statements and the reported amounts of income and expenses during the reporting period. Actual results could differ from those estimates.
Federal Income Taxes: No provision for federal income or excise tax is required since the Portfolio intends to continue to qualify as a regulated investment company under the Internal Revenue Code and to distribute substantially all of its taxable earnings.
Management has analyzed the Portfolio’s tax positions taken for all open federal income tax years and has concluded that no provision for federal income tax is required in the Portfolio’s financial statements. A Portfolio’s federal tax return is subject to examination by the Internal Revenue Service for a period of three years.
NOTE B — RELATED PARTY TRANSACTIONS
Calvert Investment Management, Inc. (the “Advisor”) is wholly-owned by Calvert Investments, Inc., which is indirectly wholly-owned by Ameritas Mutual Holding Company. The Advisor provides investment advisory services and pays the salaries and fees of officers and Directors of the Fund who are employees of the Advisor or its affiliates. For its services, the Advisor receives an annual fee, payable monthly, of .25% of the Portfolio’s average daily net assets. Under the terms of the agreement, $66,378 was payable at year end. In addition, $50,780 was payable at year end for operating expenses paid by the Advisor during December 2013.
The Advisor has contractually agreed to limit net annual portfolio operating expenses through April 30, 2014. The contractual expense cap is .42%. For the purpose of this expense limit, operating expenses do not include interest expense, brokerage commissions, taxes, and extraordinary expenses. This expense limitation does not limit acquired fund fees and expenses, if any. Under the terms of the agreement, $17,156 was receivable at year end.
Calvert Investment Administrative Services, Inc., an affiliate of the Advisor, provides administrative services to the Portfolio for an annual fee, payable monthly, of .10% of the average daily net assets of the Portfolio. Under the terms of the agreement, $26,552 was payable at year end.
Calvert Investment Services, Inc. (“CIS”), an affiliate of the Advisor, acts as shareholder servicing agent for the Portfolio. For its services, CIS received a fee of $29,604 for the year ended December 31, 2013. Under the terms of the agreement, $2,103 was payable at year end. Boston Financial Data Services, Inc. is the transfer and dividend disbursing agent.
Each Director of the Fund who is not an employee of the Advisor or its affiliates receives a fee of $1,500 for each Board and Committee meeting attended plus an annual fee of $40,000. Committee chairs receive an additional $5,000 annual retainer. Directors’ fees are allocated to each of the portfolios served.
www.calvert.com CALVERT VP S&P 500 INDEX PORTFOLIO ANNUAL REPORT 27
NOTE C — INVESTMENT ACTIVITY AND TAX INFORMATION
During the year, the cost of purchases and proceeds from sales of investments, other than short-term securities, were $36,806,264 and $75,637,560, respectively.
| Capital Loss Carryforwards | |
| Expiration Date: | |
| 31-Dec-15 | ($5,635,448) |
| 31-Dec-16 | (5,235,979) |
| 31-Dec-17 | (2,509,534) |
| 31-Dec-18 | (2,611,900) |
| |
| No Expiration Date: | |
| Short-term | ($750,777) |
| Long-term | (1,973,807) |
Under the Regulated Investment Company Modernization Act of 2010, capital losses incurred in taxable years beginning after December 22, 2010 can be carried forward to offset future capital gains for an unlimited period. These losses are required to be utilized prior to the losses incurred in pre-enactment taxable years and will retain their character as either long-term or short-term. Capital losses incurred in pre-enactment taxable years can be utilized until expiration. The portfolio’s use of net capital losses aquired from reorganizations may be limited under certain tax provisions.
The tax character of dividends and distributions paid during the years ended December 31, 2013 and December 31, 2012 was as follows:
| Distributions paid from: | 2013 | 2012 |
| Ordinary income | $6,058,983 | $4,992,328 |
| Long-term capital gain | 4,919,185 | — |
| Total | $10,978,168 | $4,992,328 |
As of December 31, 2013, the tax basis components of distributable earnings/(accumulated losses) and the federal tax cost were as follows:
| Unrealized appreciation | $134,511,644 |
| Unrealized (depreciation) | (8,249,419) |
| Net unrealized appreciation/(depreciation) | $126,262,225 |
| Undistributed ordinary income | $3,049,851 |
| Undistributed long-term capital gain | $6,440,703 |
| Capital loss carryforward | ($18,717,445) |
| Federal income tax cost of investments | $227,094,355 |
The differences between the components of distributable earnings on a tax basis and the amounts reflected in the statement of net assets are primarily due to temporary book-tax differences that will reverse in a subsequent period. These differences are due to wash sales, real estate investment trusts, Section 1256 contracts, and capital loss limitations under Internal Revenue Code Section 382.
28 www.calvert.com CALVERT VP S&P 500 INDEX PORTFOLIO ANNUAL REPORT
Reclassifications, as shown in the table below, have been made to the Portfolio’s components of net assets to reflect income and gains available for distribution (or available capital loss carryovers, as applicable) under income tax law and regulations. These reclassifications are due to permanent book-tax differences and have no impact on net assets. The primary permanent differences causing such reclassifications for the Portfolio are due to real estate investment trusts, partnerships, and expired capital loss carryforwards.
| Undistributed net investment income | ($72,815) |
| Accumulated net realized gain (loss) | 1,678,656 |
| Paid-in capital | (1,605,841) |
NOTE D — LINE OF CREDIT
A financing agreement is in place with the Calvert Funds and State Street Corporation (“SSC”). Under the agreement, SSC provides an unsecured line of credit facility, in the aggregate amount of $50 million ($25 million committed and $25 million uncommitted), accessible by the Funds for temporary or emergency purposes only. Borrowings under the committed facility bear interest at the higher of the London Interbank Offered Rate (LIBOR) or the overnight Federal Funds Rate plus 1.25% per annum. A commitment fee of .11% per annum is incurred on the unused portion of the committed facility, which is allocated to all participating funds. The Portfolio had no loans outstanding pursuant to this line of credit at December 31, 2013. For the year ended December 31, 2013, borrowing information by the Portfolio under the agreement was as follows:
| | WEIGHTED | | MONTH OF |
| AVERAGE | AVERAGE | MAXIMUM | MAXIMUM |
| DAILY | INTEREST | AMOUNT | AMOUNT |
| BALANCE | RATE | BORROWED | BORROWED |
| $1,958 | 1.39% | $238,172 | September 2013 |
NOTE E — SUBSEQUENT EVENTS
In preparing the financial statements as of December 31, 2013, no subsequent events or transactions occurred that would have required recognition or disclosure in these financial statements.
NOTE F — REORGANIZATION
On December 12, 2012, the Board of Directors approved an Agreement and Plan of Reorganization (the “Plan”), providing for the transfer of all of the assets of Calvert VP SRI Strategic Portfolio (“Strategic”) in exchange for shares of the acquiring portfolio, Calvert VP S&P 500 Index Portfolio (“S&P 500”) and the assumption of the liabilities of Strategic. Shareholders approved the Plan at a meeting on April 19, 2013 and the reorganization took place on April 30, 2013.
The acquisition was accomplished by a tax-free exchange of the following shares:
| | | ACQUIRING | | |
| MERGED PORTFOLIO | SHARES | PORTFOLIO | SHARES | VALUE |
| Strategic | 1,451,200 | S&P 500 | 297,026 | $28,959,426 |
For financial reporting purposes, assets received and shares issued by S&P 500 were recorded at fair value; however, the cost basis of the investments received from Strategic were carried forward to align ongoing reporting of S&P 500’s realized and unrealized gains and losses with amounts distributable to shareholders for tax purposes.
www.calvert.com CALVERT VP S&P 500 INDEX PORTFOLIO ANNUAL REPORT 29
The net assets and net unrealized appreciation (depreciation) immediately before the acquisitions were as follows:
| | | UNREALIZED | | |
| | NET | APPRECIATION | ACQUIRING | NET |
| MERGED PORTFOLIO | ASSETS | (DEPRECIATION) | PORTFOLIO | ASSETS |
| Strategic | $28,959,426 | $2,950,144 | S&P 500 | $312,858,280 |
Assuming the acquisition had been completed on January 1, 2013, S&P 500’s results of operations for the year ended December 31, 2013 would have been as follows:
| Net investment income | $5,682,589 | (a) |
| Net realized and change in unrealized gain (loss) on investments | $87,866,008 | (b) |
| Net increase (decrease) in assets from operations | $93,548,597 | |
Because S&P 500 and Strategic sold and redeemed shares throughout the period, it is not practicable to provide pro-forma information on a per-share basis.
Because the combined investment portfolios have been managed as a single integrated portfolio since the acquisition was completed, it is also not practicable to separate the amounts of revenue and earnings of Strategic that have been included in S&P 500’s Statement of Operations since April 30, 2013.
(a) $5,579,988 as reported, plus $102,601 from Strategic pre-merger.
(b) $84,250,743 as reported, plus $3,615,265 from Strategic pre-merger.
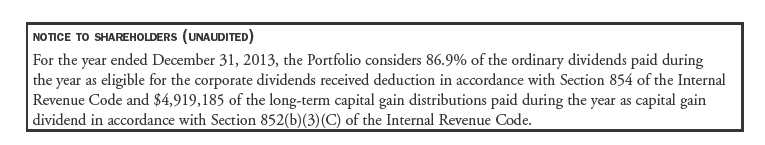
30 www.calvert.com CALVERT VP S&P 500 INDEX PORTFOLIO ANNUAL REPORT
| | | |
| FINANCIAL HIGHLIGHTS |
| |
| | YEARS ENDED |
| | DECEMBER
31, | DECEMBER
31, | DECEMBER
31, |
| | 2013 | 2012 | 2011 |
| Net asset value, beginning | $86.62 | $76.32 | $78.77 |
| Income from investment operations: | | | |
| Net investment income | 1.81 | 1.63 | 1.27 |
| Net realized and unrealized gain (loss) | 25.72 | 10.21 | .11 |
| Total from investment operations | 27.53 | 11.84 | 1.38 |
| Distributions from: | | | |
| Net investment income | (1.95) | (1.54) | (1.25) |
| Net realized gain | (1.58) | — | (2.58) |
| Total distributions | (3.53) | (1.54) | (3.83) |
| Total increase (decrease) in net asset value | 24.00 | 10.30 | (2.45) |
| Net asset value, ending | $110.62 | $86.62 | $76.32 |
| |
| Total return* | 31.87% | 15.55% | 1.73% |
| Ratios to average net assets: A | | | |
| Net investment income | 1.69% | 1.90% | 1.70% |
| Total expenses | .48% | .45% | .46% |
| Expenses before offsets | .42% | .41% | .39% |
| Net expenses | .42% | .41% | .39% |
| Portfolio turnover | 11% | 5% | 7% |
| Net assets, ending (in thousands) | $353,688 | $285,405 | $259,068 |
| |
| | | YEARS ENDED |
| | | DECEMBER
31, | DECEMBER
31, |
| | | 2010 | 2009 |
| Net asset value, beginning | | $71.52 | $58.44 |
| Income from investment operations: | | | |
| Net investment income | | 1.33 | 1.33 |
| Net realized and unrealized gain (loss) | | 9.18 | 13.95 |
| Total from investment operations | | 10.51 | 15.28 |
| Distributions from: | | | |
| Net investment income | | (1.13) | (1.30) |
| Net realized gain | | (2.13) | (.90) |
| Total distributions | | (3.26) | (2.20) |
| Total increase (decrease) in net asset value | | 7.25 | 13.08 |
| Net asset value, ending | | $78.77 | $71.52 |
| |
| Total return* | | 14.69% | 26.11% |
| Ratios to average net assets: A | | | |
| Net investment income | | 1.67% | 1.98% |
| Total expenses | | .46% | .46% |
| Expenses before offsets | | .38% | .38% |
| Net expenses | | .38% | .38% |
| Portfolio turnover | | 9% | 9% |
| Net assets, ending (in thousands) | | $236,086 | $238,077 |
See notes to financial highlights.
www.calvert.com CALVERT VP S&P 500 INDEX PORTFOLIO ANNUAL REPORT 31
A Total expenses do not reflect amounts reimbursed and/or waived by the Advisor or reductions from expense offset arrangements. Expenses before offsets reflect expenses after reimbursement and/or waiver by the Advisor but prior to reductions from expense offset arrangements. Net expenses are net of all reductions and represent the net expenses paid by the portfolio.
* Total return is not annualized for periods of less than one year and does not reflect charges and expenses of the variable annuity or variable universal life contract.
See notes to financial statements.
32 www.calvert.com CALVERT VP S&P 500 INDEX PORTFOLIO ANNUAL REPORT
EXPLANATION OF FINANCIAL TABLES
SCHEDULE OF INVESTMENTS
The Schedule of Investments is a snapshot of all securities held in the fund at their market value, on the last day of the reporting period. Securities are listed by asset type (e.g., common stock, corporate bonds, U.S. government obligations) and may be further broken down into sub-groups and by industry classification.
STATEMENT OF ASSETS AND LIABILITIES
The Statement of Assets and Liabilities is often referred to as the fund’s balance sheet. It lists the value of what the fund owns, is due and owes on the last day of the reporting period. The fund’s assets include the market value of securities owned, cash, receivables for securities sold and shareholder subscriptions, and receivables for dividends and interest payments that have been earned, but not yet received. The fund’s liabilities typically include payables for securities purchased and shareholder redemptions, and expenses owed but not yet paid. The statement also reports the fund’s net asset value (NAV) per share on the last day of the reporting period. The NAV is calculated by dividing the fund’s net assets (assets minus liabilities) by the number of shares outstanding. This statement is accompanied by a Schedule of Investments. Alternatively, if certain conditions are met, a Statement of Net Assets may be presented in lieu of this statement and the Schedule of Investments.
STATEMENT OF NET ASSETS
The Statement of Net Assets provides a detailed list of the fund’s holdings, including each security’s market value on the last day of the reporting period. The Statement of Net Assets includes a Schedule of Investments. Other assets are added and other liabilities subtracted from the investments total to calculate the fund’s net assets. Finally, net assets are divided by the outstanding shares of the fund to arrive at its share price, or Net Asset Value (NAV) per share.
At the end of the Statement of Net Assets is a table displaying the composition of the fund’s net assets. Paid in Capital is the money invested by shareholders and represents the bulk of net assets. Undistributed Net Investment Income and Accumulated Net Realized Gains usually approximate the amounts the fund had available to distribute to shareholders as of the statement date. Accumulated Realized Losses will appear as negative balances. Unrealized Appreciation (Depreciation) is the difference between the market value of the fund’s investments and their cost, and reflects the gains (losses) that would be realized if the fund were to sell all of its investments at their statement-date values.
STATEMENT OF OPERATIONS
The Statement of Operations summarizes the fund’s investment income earned and expenses incurred in operating the fund. Investment income includes dividends earned from stocks and interest earned from interest-bearing securities in the fund. Expenses incurred in operating the fund include the advisory fee paid to the investment advisor, administrative services fees, distribution plan expenses (if applicable), transfer agent fees, shareholder servicing expenses, custodial, legal, and audit fees, and the printing and postage expenses related to shareholder reports. Expense offsets (fees paid indirectly) are also shown. Credits earned from offset arrangements are used to reduce the fund’s expenses. This statement also shows net gains (losses) realized on the sale of investments and the increase or decrease in the unrealized appreciation (depreciation) on investments held during the period.
STATEMENT OF CHANGES IN NET ASSETS
The Statement of Changes in Net Assets shows how the fund’s total net assets changed during the two most recent reporting periods. Changes in the fund’s net assets are attributable to investment operations, distributions and capital share transactions.
The Operations section of the report summarizes information detailed in the Statement of Operations. The Distribution section shows the dividend and capital gain distributions made to shareholders. The amounts
www.calvert.com CALVERT VP S&P 500 INDEX PORTFOLIO ANNUAL REPORT (UNAUDITED) 33
shown as distributions in this section may not match the net investment income and realized gains amounts shown in the Operations section because distributions are determined on a tax basis and certain investments or transactions may be treated differently for financial statement and tax purposes. The Capital Share Transactions section shows the amount shareholders invested in the fund, either by purchasing shares or by reinvesting distributions, and the amounts redeemed. The corresponding numbers of shares issued, reinvested and redeemed are shown at the end of the report.
FINANCIAL HIGHLIGHTS
The Financial Highlights table provides a per-share breakdown by class of the components that affect the fund’s net asset value for current and past reporting periods. The table provides total return, total distributions, expense ratios, portfolio turnover and net assets for the applicable period. Total return is a measure of a fund’s performance that encompasses all elements of return: dividends, capital gain distributions and changes in net asset value. Total return is the change in value of an investment over a given period, assuming reinvestment of any dividends and capital gain distributions, expressed as a percentage of the initial investment. Total distributions include distributions from net investment income and net realized gains. Long-term gains are earned on securities held in the fund more than one year. Short-term gains, on the sale of securities held less than one year, are treated as ordinary dividend income for tax purposes. The expense ratio is a fund’s cost of doing business, expressed as a percentage of net assets. These expenses directly reduce returns to shareholders. Portfolio turnover measures the trading activity in a fund’s investment portfolio – how often securities are bought and sold by a fund. Portfolio turnover is affected by market conditions, changes in the size of the fund, the nature of the fund’s investments and the investment style of the portfolio manager.
PROXY VOTING
The Proxy Voting Guidelines that the Portfolio uses to determine how to vote proxies relating to portfolio securities is provided as an Appendix to the Fund’s Statement of Additional Information. The Statement of Additional Information can be obtained free of charge by calling the Fund at 1-800-368-2745, by visiting the Calvert website at www.calvert.com or by visiting the SEC’s website at www.sec.gov.
Information regarding how the Fund voted proxies relating to portfolio securities during the most recent 12-month period ended June 30 is available by calling the Fund, by visiting the Calvert website at www. calvert.com or visiting the SEC’s website at www.sec.gov.
AVAILABILITY OF QUARTERLY PORTFOLIO HOLDINGS
The Fund files its complete schedule of portfolio holdings with the SEC for the first and third quarters of each fiscal year on Form N-Q. The Fund’s Form N-Q is available on the SEC’s website at www.sec.gov. The Fund’s Form N-Q may be reviewed and copied at the SEC’s Public Reference Room in Washington, DC; information on the operation of the Public Reference Room may be obtained by calling 1-800-SEC-0330.
BASIS FOR BOARD’S APPROVAL OF INVESTMENT ADVISORY CONTRACTS
At a meeting held on December 11, 2013, the Board of Directors, and by a separate vote, the disinterested Directors, approved the continuance of the Investment Advisory Agreement between the Portfolio and the Advisor and the Investment Subadvisory Agreement between the Advisor and the Subadvisor with respect to the Portfolio.
In evaluating the Investment Advisory Agreement, the Board considered a variety of information relating to the Portfolio and the Advisor. The disinterested Directors reviewed a report prepared by the Advisor regarding
34 www.calvert.com CALVERT VP S&P 500 INDEX PORTFOLIO ANNUAL REPORT (UNAUDITED)
various services provided to the Portfolio by the Advisor and its affiliates. Such report included, among other data, information regarding the Advisor’s personnel and the Advisor’s revenue and cost of providing services to the Portfolio, and a separate report prepared by an independent third party, which provided a statistical analysis comparing the Portfolio’s investment performance, expenses, and fees to comparable mutual funds.
The disinterested Directors were separately represented by independent legal counsel with respect to their consideration of the reapproval of the Investment Advisory Agreement and the Investment Subadvisory Agreement. Prior to voting, the disinterested Directors reviewed the proposed continuance of the Investment Advisory Agreement and Investment Subadvisory Agreement with management and also met in private sessions with their counsel at which no representatives of management were present.
In the course of its deliberations regarding the Investment Advisory Agreement, the Board considered the following factors, among others: the nature, extent and quality of the services provided by the Advisor, including the personnel providing such services; the Advisor’s financial condition; the level and method of computing the Portfolio’s advisory fee; comparative performance, fee and expense information for the Portfolio; the profitability of the Calvert Family of Funds to the Advisor and its affiliates; the allocation of the Portfolio’s brokerage, including the Advisor’s process for monitoring “best execution”; the direct and indirect benefits, if any, derived by the Advisor and its affiliates from their relationship with the Portfolio; the effect of the Portfolio’s growth and size on the Portfolio’s performance and expenses; the Advisor’s compliance programs and policies; the Advisor’s performance of substantially similar duties for other funds; and any possible conflicts of interest.
In considering the nature, extent and quality of the services provided by the Advisor under the Investment Advisory Agreement, the Board reviewed information provided by the Advisor relating to its operations and personnel, including, among other information, biographical information on the Advisor’s supervisory and professional staff and descriptions of its organizational and management structure. The Board also took into account similar information provided periodically throughout the previous year by the Advisor, as well as the Board’s familiarity with the Advisor’s management through Board of Directors’ meetings, discussions and other reports. The Board considered the Advisor’s current level of staffing and overall resources. The Board also noted that it reviewed on a quarterly basis information regarding the Advisor’s compliance with applicable policies and procedures, including those related to personal investing. The Advisor’s administrative capabilities, including its ability to supervise the other service providers for the Portfolio, were also considered. The Board discussed the Advisor’s effectiveness in monitoring the performance of the Subadvisor and its timeliness in responding to performance issues. The Board observed that the scope of services provided by the Advisor generally had expanded over time as a result of regulatory, market and other changes. The Board took into consideration, among other factors, the effectiveness of the Portfolio’s and Advisor’s processes, policies and procedures and the Advisor’s personnel. The Board also took into account, among other items, periodic reports received from the Advisor over the past year concerning the Advisor’s ongoing review and enhancement of certain processes, policies and procedures of the Portfolio and the Advisor. The Board concluded that it was satisfied with the nature, extent and quality of services provided to the Portfolio by the Advisor under the Investment Advisory Agreement.
In considering the Portfolio’s performance, the Board noted that it reviewed on a quarterly basis detailed information about the Portfolio’s performance results, portfolio composition and investment strategies. In addition, the Board took into account overall financial market conditions. The Board also reviewed various comparative data provided to it in connection with its consideration of the renewal of the Investment Advisory Agreement, including, among other information, a comparison of the Portfolio’s total return with its Lipper index and with that of other mutual funds deemed to be in its peer group by an independent third party in its report. This comparison indicated that the Portfolio performed below the median of its peer group for the one- and three-year periods ended June 30, 2013 and at the median of its peer group for the five-year period ended June 30, 2013. The data also indicated that the Portfolio underperformed its Lipper index for the one-, three- and five-year periods ended June 30, 2013. The Board took into account management’s discussion of
www.calvert.com CALVERT VP S&P 500 INDEX PORTFOLIO ANNUAL REPORT (UNAUDITED) 35
the Portfolio’s performance, including the impact of differing fees and expenses among the funds in the peer group on the Portfolio’s relative performance. The Board also noted management’s plans with respect to the Portfolio. Based upon its review, the Board concluded that the Portfolio’s performance was satisfactory relative to the performance of passively-managed funds that track the same benchmark index as does the Portfolio.
In considering the Portfolio’s fees and expenses, the Board compared the Portfolio’s fees and total expense ratio with various comparative data for the funds in its peer group. Among other findings, the data indicated that the Portfolio’s advisory fee (after taking into account expense reimbursements) was at the median of its peer group and that total expenses (net of expense reimbursements) were above the median of its peer group. The Board noted that the allocation of advisory and administrative fees may vary among the Portfolio’s peer group. The Board noted that the Advisor had reimbursed a portion of the Portfolio’s expenses. The Board also took into account the Advisor’s current undertaking to maintain expense limitations for the Portfolio. The Board noted that the Advisor paid the Subadvisor’s subadvisory fee under the Investment Subadvisory Agreement with respect to the Portfolio. The Board also took into account management’s discussion of the Portfolio’s expenses and certain factors that affected the level of such expenses, including the current size of the Portfolio. Based upon its review, the Board determined that the advisory fee was reasonable in view of the quality of services received by the Portfolio from the Advisor and the other factors considered.
The Board reviewed the Advisor’s profitability on a portfolio-by-portfolio basis. In reviewing the overall profitability of the advisory fee to the Portfolio’s Advisor, the Board also considered the fact that affiliates of the Advisor provided shareholder servicing and administrative services to the Portfolio for which they received compensation. The information considered by the Board included Calvert’s operating profit margin information both before and after tax expenses with respect to the services that the Advisor and its affiliates provided to the Calvert Family of Funds complex. The Board reviewed the profitability of the Advisor’s relationship with the Portfolio in terms of the total amount of annual advisory fees it received with respect to the Portfolio and whether the Advisor had the financial wherewithal to continue to provide services to the Portfolio. The Board also considered that the Advisor derived benefits to its reputation and other indirect benefits from its relationship with the Portfolio. In addition, the Board took into account that affiliates of the Advisor may benefit from certain indirect tax benefits relating to dividend received deductions and foreign tax credits. The Board also noted that the Advisor paid the subadvisory fee to the Subadvisor, an affiliate of the Advisor, and that the Advisor had reimbursed a portion of the expenses of the Portfolio. Based upon its review, the Board concluded that the Advisor’s and its affiliates’ level of profitability from their relationship with the Portfolio was reasonable.
The Board considered the effect of the Portfolio’s current size and potential growth on its performance and fees. Although the Portfolio’s advisory fee did not contain breakpoints that would reduce the advisory fee rate on assets above specified asset levels, the Board noted that if the Portfolio’s assets increased over time, the Portfolio might realize other economies of scale if assets increased proportionally more than certain other expenses. The Board also noted that given the Portfolio’s current level of assets, the Portfolio would be unlikely to recognize economies of scale by implementing a breakpoint in the advisory fee at this time.
In reapproving the Investment Advisory Agreement, the Board, including the disinterested Directors, did not identify any single factor as controlling, and each Director may have attributed different weight to various factors.
In evaluating the Investment Subadvisory Agreement, the disinterested Directors reviewed information provided by the Subadvisor relating to its operations, personnel, investment philosophy, strategies and techniques. Among other information, the Subadvisor provided biographical information on portfolio management and other professional staff, performance information for itself, and descriptions of its investment philosophies, strategies and techniques, organizational and management structures and brokerage policies and practices.
The Board reapproved the Investment Subadvisory Agreement between the Subadvisor and the Advisor based
36 www.calvert.com CALVERT VP S&P 500 INDEX PORTFOLIO ANNUAL REPORT (UNAUDITED)
on a number of factors relating to the Subadvisor’s ability to perform under the Investment Subadvisory Agreement. In the course of its deliberations, the Board evaluated, among other factors: the nature, extent and the quality of the services to be provided by the Subadvisor; the Subadvisor’s management style and long-term performance record; the Portfolio’s performance record and the Subadvisor’s performance in employing its investment strategies; the Subadvisor’s current level of staffing and its overall resources; the qualifications and experience of the Subadvisor’s personnel; the Subadvisor’s financial condition with respect to its ability to perform the services required under the Investment Subadvisory Agreement; the Subadvisor’s risk management processes; the Subadvisor’s compliance systems, including those related to personal investing; and any disciplinary history. Based upon its review, the Board concluded that it was satisfied with the nature, extent and quality of services provided to the Portfolio by the Subadvisor under the Investment Subadvisory Agreement.
As noted above, the Board considered, among other information, the Portfolio’s performance during the one-, three- and five-year periods ended June 30, 2013 as compared to the Portfolio’s peer group and noted that it reviewed on a quarterly basis detailed information about the Portfolio’s performance results, portfolio composition and investment strategies. The Board noted the Advisor’s expertise and resources in monitoring the performance, investment style and risk adjusted performance of the Subadvisor.
In considering the cost of services to be provided by the Subadvisor and the profitability to the Subadvisor of its relationship with the Portfolio, the Board noted that the Advisor and Subadvisor were affiliated and the subadvisory fee under the Investment Subadvisory Agreement was paid by the Advisor out of the advisory fee that the Advisor received under the Investment Advisory Agreement. Based upon its review, the Board determined that the subadvisory fee was reasonable in view of the quality of services received by the Portfolio from the Subadvisor and the other factors considered. Because the Advisor would pay the Subadvisor’s subadvisory fee, the cost of services to be provided by the Subadvisor and the level of profitability to the Subadvisor from its relationship with the Portfolio were not material factors in the Board’s deliberations. For similar reasons, the Board did not consider the potential economies of scale in the Subadvisor’s management of the Portfolio to be a material factor in its consideration.
In reapproving the Investment Subadvisory Agreement, the Board, including the disinterested Directors, did not identify any single factor as controlling, and each Director may have attributed different weight to various factors.
CONCLUSIONS
The Board reached the following conclusions regarding the Investment Advisory Agreement and the Investment Subadvisory Agreement, among others: (a) the Advisor has demonstrated that it possesses the capability and resources to perform the duties required of it under the Investment Advisory Agreement; (b) the Subadvisor is qualified to manage the Portfolio’s assets in accordance with the Portfolio’s investment objective and policies; (c) the Advisor and Subadvisor maintain appropriate compliance programs; (d) the Subadvisor is likely to execute its investment strategies consistently over time; (e) the performance of the Portfolio is satisfactory relative to the performance of passively-managed funds that track the same benchmark index as does the Portfolio; and (f) the Portfolio’s advisory and subadvisory fees are reasonable in view of the quality of services received by the Portfolio from the Advisor and Subadvisor and the other factors considered. Based on its conclusions, the Board determined that reapproval of the Investment Advisory Agreement and the Investment Subadvisory Agreement would be in the best interests of the Portfolio and its shareholders.
www.calvert.com CALVERT VP S&P 500 INDEX PORTFOLIO ANNUAL REPORT (UNAUDITED) 37
This report is intended to provide fund information to shareholders. It is not authorized for distribution to prospective investors unless preceded or accompanied by a prospectus.
Note: The information on our website is not incorporated by reference into this report; our website address is included as an inactive textual reference only.
Investors should carefully consider the investment objectives, risks, charges and expenses of the Calvert Funds. This and other important information is contained in the fund’s summary prospectus and prospectus, which can be obtained from your financial professional and should be read carefully before investing. You may also call Calvert at 800/368-2745 or visit www. calvert.com.
38 www.calvert.com CALVERT VP S&P 500 INDEX PORTFOLIO ANNUAL REPORT (UNAUDITED)
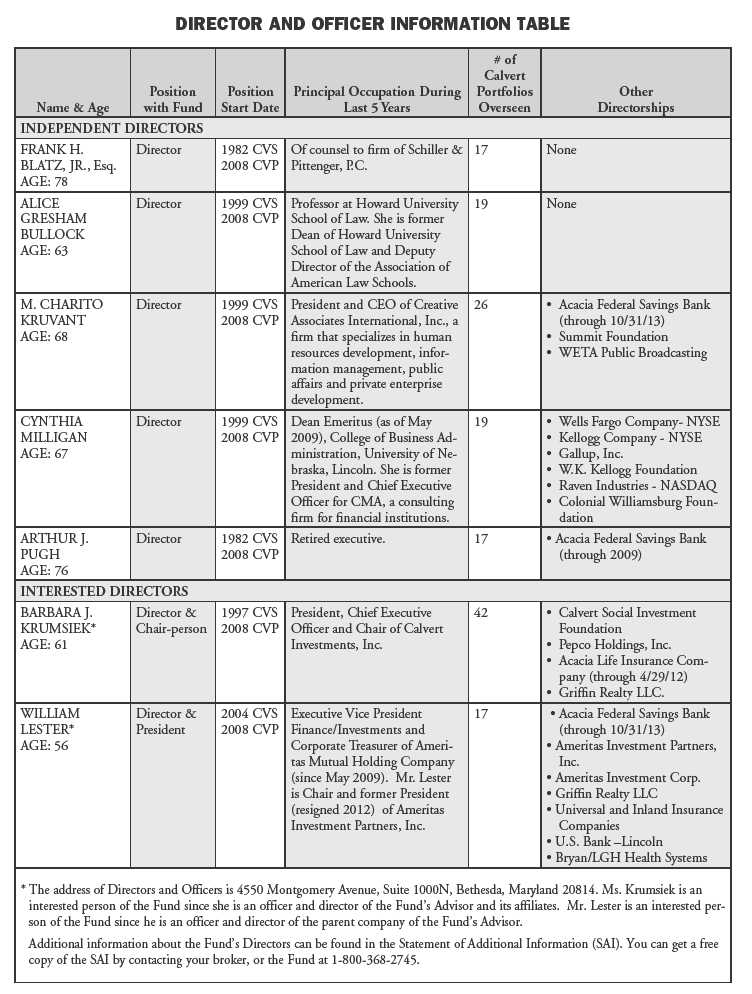
www.calvert.com CALVERT VP S&P 500 INDEX PORTFOLIO ANNUAL REPORT (UNAUDITED) 39

40 www.calvert.com CALVERT VP S&P 500 INDEX PORTFOLIO ANNUAL REPORT (UNAUDITED)
This page intentionally left blank.

CALVERT VP S&P MIDCAP 400 INDEX PORTFOLIO
Portfolio within Calvert Variable Products, Inc.
Managed by Ameritas Investment Partners, Inc., Subadvisor
INVESTMENT PERFORMANCE
For the year ended December 31, 2013, the Calvert VP S&P MidCap 400 Index Portfolio’s Class I shares returned 32.82% compared to 33.50% for the Standard & Poor’s (S&P) MidCap 400 Index. The slight underperformance relative to the Index was largely attributable to fees and operating expenses, which the Index does not have.
INVESTMENT CLIMATE
Equity markets earned strong positive returns in 2013 as the economic recovery in the United States continued to take hold. Within the domestic universe, small-cap stocks provided the highest return in 2013, up 38.82% as measured by the Russell 2000 Index. Mid-cap and large-cap stocks provided slightly lower returns, with the S&P Midcap 400 and S&P 500 Indices returning 33.50% and 32.39%, respectively. Domestic equity markets generally outperformed international equity markets, with emerging markets lagging the most.
The Federal Reserve (Fed) continued its accommodative monetary policy, which provided the fuel to power U.S. stocks higher. Domestic GDP growth improved steadily throughout the year, and inflation remained under control. The housing market continued its recovery—the resulting increases in homeowner equity and consumer confidence and decreases in default rates should benefit the banking industry. The combination of increased home values and the rise in the stock market also had a significant positive impact on household net worth.
PORTFOLIO STRATEGY
The Portfolio seeks to replicate the holdings as closely as possible and match the performance of the S&P MidCap 400 Index. In pursuit of this objective, the fund employs a passive management approach to replicate the Index.
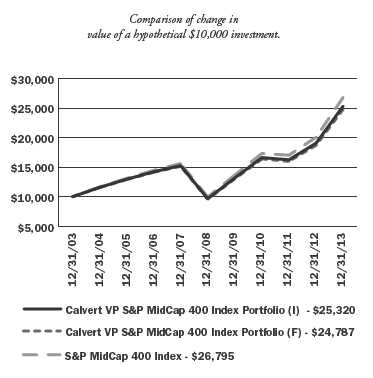
| | AVERAGE ANNUAL TOTAL RETURN |
| | (period ended 12.31.13) |
| | Class I | Class F |
| One year | 32.82% | 32.47% |
| Five year | 21.22% | 20.92% |
| Ten year | 9.74% | 9.50%* |
The performance data shown represents past performance, does not guarantee future results and assumes reinvestment of all dividends and distributions. All performance data reflects fee waivers and/or expense limitations, if any are in effect; in their absence performance would be lower. See Note B in Notes to Financial Statements. The investment return and principal value of an investment will fluctuate so that an investor’s shares, when redeemed, may be worth more or less than their original cost. Current performance may be lower or higher than the performance data quoted.
Visit www.calvert.com/institutional-VP-performance.html for current performance data. The gross expense ratio from the current prospectus for Class I shares is 0.53%. This number may vary from the expense ratio shown elsewhere in this report because it is based on a different time period and, if applicable, does not include fee or expense waivers. The performance data and expense ratio reflect deduction of Portfolio operating expenses, but do not reflect charges and expenses imposed under the variable annuity or life insurance contract.
* Class F share performance prior to October 1, 2007 is based on Class I performance, adjusted to reflect Class F expenses.
4 www.calvert.com CALVERT VP S&P MIDCAP 400 INDEX PORTFOLIO ANNUAL REPORT
| | % OF TOTAL |
| ECONOMIC SECTORS | INVESTMENTS |
| |
| Consumer Discretionary | 13.6% |
| Consumer Staples | 3.9% |
| Energy | 5.2% |
| Exchange Traded Products | 1.3% |
| Financials | 21.4% |
| Government | 0.2% |
| Health Care | 8.2% |
| Industrials | 17.3% |
| Information Technology | 15.2% |
| Materials | 6.8% |
| Short-Term Investments | 2.0% |
| Telecommunication Services | 0.4% |
| Utilities | 4.5% |
| Total | 100% |
At year-end, the Index’s largest exposures were to the Financials and Industrial sectors, at 21.4% and 17.3%, respectively. Other significant weightings included Information Technology and Consumer Discretionary, which ranged from 13.6% to 15.2%. The smallest exposure was to Telecommunication Services at less than 1%.
The top-performing sectors of the Index were Health Care, up 45.9%, and Industrials, up 43.9%. The weakest performing sectors were Telecommunication Services, up 19.4%, and Materials, up 24.6%.
During 2013, the Portfolio continued to meet its investment objective of closely tracking the total return of the Index. Market fluctuation and cash flows may cause the Portfolio to hold a slightly different weighting than the Index. It is not possible to invest directly in an index.
OUTLOOK
Entering 2014, the outlook for equities is mildly positive. The economy continues to recover and corporate earnings remain strong, although valuations have become more stretched and the market is pricing in a fairly optimistic outlook already. The unemployment rate is declining and the economy will not suffer the same fiscal drag that it did last year from the sequester.
The Fed has begun the tapering process. And while the tone in Washington has improved slightly, the government’s inability to function properly does remain a concern. In addition, economic growth in Europe remains sluggish and China’s growth appears to have slowed.
That said, the Fed anticipates keeping short-term rates low for an extended period of time after it ends its asset-purchasing program. Although it is unlikely that 2014 will provide returns similar to 2013, Fed policies should provide a positive backdrop for equities in the year ahead.
January 2014
www.calvert.com CALVERT VP S&P MIDCAP 400 INDEX PORTFOLIO ANNUAL REPORT 5
SHAREHOLDER EXPENSE EXAMPLE
As a shareholder of the Fund, you incur two types of costs: (1) transaction costs, and (2) ongoing costs, including management fees and other Fund expenses. This Example is intended to help you understand your ongoing costs (in dollars) of investing in the Fund and to compare these costs with the ongoing costs of investing in other mutual funds.
This Example is based on an investment of $1,000 invested at the beginning of the period and held for the entire period (July 1, 2013 to December 31, 2013).
Note: Expenses do not reflect charges and expenses of the variable annuity or variable universal life contract.
Actual Expenses
The first line of the table below provides information about actual account values and actual expenses. You may use the information in this line, together with the amount you invested, to estimate the expenses that you paid over the period. Simply divide your account value by $1,000 (for example, an $8,600 account value divided by $1,000 = 8.6), then multiply the result by the number in the first line under the heading entitled “Expenses Paid During Period” to estimate the expenses you paid on your account during this period.
Hypothetical Example for Comparison Purposes
The second line of the table below provides information about hypothetical account values and hypothetical expenses based on the Fund’s actual expense ratio and an assumed rate of return of 5% per year before expenses, which is not the Fund’s actual return. The hypothetical account values and expenses may not be used to estimate the actual ending account balance or expenses you paid for the period. You may use this information to compare the ongoing costs of investing in the Fund and other funds. To do so, compare the 5% hypothetical example with the 5% hypothetical examples that appear in the shareholder reports of the other funds.
Please note that the expenses shown in the table are meant to highlight your ongoing costs only and do not reflect any transactional costs. Therefore, the second line of the table is useful in comparing ongoing costs only, and will not help you determine the relative total costs of owning different funds. In addition, if these transactional costs were included, your costs would have been higher.
| | BEGINNING | ENDING | EXPENSES PAID |
| | ACCOUNT VALUE | ACCOUNT VALUE | DURING PERIOD* |
| | 7/1/13 | 12/31/13 | 7/1/13 - 12/31/13 |
| Class I | | | |
| Actual | $1,000.00 | $1,162.01 | $2.81 |
| |
Hypothetical
(5% return per year before expenses) | $1,000.00 | $1,022.60 | $2.63 |
| |
| Class F | | | |
| Actual | $1,000.00 | $1,160.35 | $4.45 |
| |
Hypothetical
(5% return per year before expenses) | $1,000.00 | $1,021.08 | $4.17 |
* Expenses are equal to the Fund’s annualized expense ratio of 0.52% and 0.82% for Class I and Class F, respectively, multiplied by the average account value over the period, multiplied by 184/365 (to reflect the one-half year period).
6 www.calvert.com CALVERT VP S&P MIDCAP 400 INDEX PORTFOLIO ANNUAL REPORT
REPORT OF INDEPENDENT REGISTERED PUBLIC ACCOUNTING FIRM
The Board of Directors of Calvert Variable Products, Inc. and Shareholders of Calvert VP S&P MidCap 400 Index Portfolio: We have audited the accompanying statement of net assets of the Calvert VP S&P MidCap 400 Index Portfolio (the “Portfolio”), a series of Calvert Variable Products, Inc., as of December 31, 2013, and the related statement of operations for the year then ended, the statements of changes in net assets for each of the years in the two-year period then ended, and the financial highlights for each of the years in the five-year period then ended. These financial statements and financial highlights are the responsibility of the Portfolio’s management. Our responsibility is to express an opinion on these financial statements and financial highlights based on our audits.
We conducted our audits in accordance with the standards of the Public Company Accounting Oversight Board (United States). Those standards require that we plan and perform the audit to obtain reasonable assurance about whether the financial statements and financial highlights are free of material misstatement. An audit includes examining, on a test basis, evidence supporting the amounts and disclosures in the financial statements. Our procedures included confirmation of securities owned as of December 31, 2013, by correspondence with the custodian and brokers or by performing other appropriate auditing procedures. An audit also includes assessing the accounting principles used and significant estimates made by management, as well as evaluating the overall financial statement presentation. We believe that our audits provide a reasonable basis for our opinion.
In our opinion, the financial statements and financial highlights referred to above present fairly, in all material respects, the financial position of the Calvert VP S&P MidCap 400 Index Portfolio as of December 31, 2013, the results of its operations for the year then ended, the changes in its net assets for each of the years in the two-year period then ended, and the financial highlights for each of the years in the five-year period then ended, in conformity with U.S. generally accepted accounting principles.

Philadelphia, Pennsylvania
February 24, 2014
www.calvert.com CALVERT VP S&P MIDCAP 400 INDEX PORTFOLIO ANNUAL REPORT 7
| | |
| STATEMENT OF NET ASSETS |
| DECEMBER 31, 2013 |
| |
| EQUITY SECURITIES - 96.5% | SHARES | VALUE |
| Aerospace & Defense - 1.7% | | |
| Alliant Techsystems, Inc. | 5,017 | $610,469 |
| B/E Aerospace, Inc.* | 15,514 | 1,350,183 |
| Esterline Technologies Corp.* | 4,973 | 507,047 |
| Exelis, Inc | 29,847 | 568,884 |
| Huntington Ingalls Industries, Inc. | 7,778 | 700,098 |
| Triumph Group, Inc. | 8,244 | 627,121 |
| | | 4,363,802 |
| |
| Air Freight & Logistics - 0.1% | | |
| UTi Worldwide, Inc | 14,442 | 253,602 |
| |
| Airlines - 0.4% | | |
| Alaska Air Group, Inc. | 10,947 | 803,181 |
| JetBlue Airways Corp.* | 34,585 | 295,702 |
| | | 1,098,883 |
| |
| Auto Components - 0.3% | | |
| Gentex Corp. | 22,865 | 754,316 |
| |
| Automobiles - 0.2% | | |
| Thor Industries, Inc. | 7,063 | 390,089 |
| |
| Biotechnology - 0.6% | | |
| Cubist Pharmaceuticals, Inc.* | 11,700 | 805,779 |
| United Therapeutics Corp.* | 7,280 | 823,222 |
| | | 1,629,001 |
| |
| Building Products - 1.0% | | |
| A.O. Smith Corp. | 12,071 | 651,110 |
| Fortune Brands Home & Security, Inc | 26,184 | 1,196,609 |
| Lennox International, Inc | 7,175 | 610,305 |
| | | 2,458,024 |
| |
| Capital Markets - 2.6% | | |
| Affiliated Managers Group, Inc.* | 8,346 | 1,810,080 |
| Apollo Investment Corp | 35,621 | 302,066 |
| Eaton Vance Corp. | 19,243 | 823,408 |
| Federated Investors, Inc., Class B | 14,927 | 429,898 |
| Greenhill & Co., Inc | 4,072 | 235,932 |
| Janus Capital Group, Inc. | 23,727 | 293,503 |
| Raymond James Financial, Inc. | 19,506 | 1,018,018 |
| SEI Investments Co. | 22,576 | 784,064 |
| Waddell & Reed Financial, Inc. | 13,456 | 876,255 |
| | | 6,573,224 |
| |
| Chemicals - 2.8% | | |
| Albemarle Corp | 12,898 | 817,604 |
| Ashland, Inc | 11,356 | 1,101,986 |
| Cabot Corp | 9,414 | 483,880 |
| Cytec Industries, Inc. | 5,586 | 520,392 |
| Intrepid Potash, Inc.* | 8,810 | 139,550 |
| Minerals Technologies, Inc. | 5,401 | 324,438 |
| NewMarket Corp. | 1,796 | 600,133 |
8 www.calvert.com CALVERT VP S&P MIDCAP 400 INDEX PORTFOLIO ANNUAL REPORT
| | |
| EQUITY SECURITIES - CONT’D | SHARES | VALUE |
| Chemicals - Cont’d | | |
| Olin Corp. | 12,712 | $366,741 |
| RPM International, Inc | 21,058 | 874,118 |
| Scotts Miracle-Gro Co. | 6,964 | 433,300 |
| Sensient Technologies Corp | 7,932 | 384,861 |
| The Valspar Corp | 12,754 | 909,233 |
| | | 6,956,236 |
| |
| Commercial Banks - 4.5% | | |
| Associated Banc-Corp. | 25,603 | 445,492 |
| BancorpSouth, Inc. | 13,278 | 337,527 |
| Bank of Hawaii Corp. | 7,003 | 414,157 |
| Cathay General Bancorp | 11,629 | 310,843 |
| City National Corp. | 7,497 | 593,912 |
| Commerce Bancshares, Inc. | 12,829 | 576,150 |
| Cullen/Frost Bankers, Inc | 8,306 | 618,216 |
| East West Bancorp, Inc. | 21,826 | 763,255 |
| First Horizon National Corp | 37,229 | 433,718 |
| First Niagara Financial Group, Inc. | 56,108 | 595,867 |
| FirstMerit Corp | 26,159 | 581,515 |
| Fulton Financial Corp | 30,556 | 399,672 |
| Hancock Holding Co | 13,070 | 479,408 |
| International Bancshares Corp. | 9,053 | 238,909 |
| Prosperity Bancshares, Inc. | 8,895 | 563,854 |
| Signature Bank* | 7,491 | 804,683 |
| SVB Financial Group* | 7,220 | 757,089 |
| Synovus Financial Corp | 153,161 | 551,380 |
| TCF Financial Corp | 26,074 | 423,702 |
| Trustmark Corp. | 10,648 | 285,792 |
| Valley National Bancorp | 31,613 | 319,924 |
| Webster Financial Corp | 14,309 | 446,155 |
| Westamerica Bancorporation | 4,183 | 236,172 |
| | | 11,177,392 |
| |
| Commercial Services & Supplies - 1.8% | | |
| Clean Harbors, Inc.* | 8,741 | 524,110 |
| Copart, Inc.* | 17,696 | 648,558 |
| Deluxe Corp. | 7,930 | 413,867 |
| Herman Miller, Inc. | 9,301 | 274,566 |
| HNI Corp | 7,194 | 279,343 |
| Mine Safety Appliances Co. | 5,007 | 256,408 |
| Rollins, Inc | 10,259 | 310,745 |
| RR Donnelley & Sons Co | 28,799 | 584,044 |
| The Brink’s Co. | 7,464 | 254,821 |
| TravelCenters of America LLC (b)* | 60,000 | 10 |
| Waste Connections, Inc. | 19,572 | 853,926 |
| | | 4,400,398 |
| |
| Communications Equipment - 0.9% | | |
| Adtran, Inc | 9,209 | 248,735 |
| Ciena Corp.* | 16,175 | 387,068 |
| InterDigital, Inc. | 6,527 | 192,481 |
| JDS Uniphase Corp.* | 36,679 | 476,093 |
| Plantronics, Inc. | 6,951 | 322,874 |
| Polycom, Inc.* | 22,503 | 252,709 |
| Riverbed Technology, Inc.* | 25,507 | 461,167 |
| | | 2,341,127 |
www.calvert.com CALVERT VP S&P MIDCAP 400 INDEX PORTFOLIO ANNUAL REPORT 9
| | |
| EQUITY SECURITIES - CONT’D | SHARES | VALUE |
| Computers & Peripherals - 1.2% | | |
| 3D Systems Corp.* | 15,058 | $1,399,340 |
| Diebold, Inc | 10,121 | 334,094 |
| Lexmark International, Inc | 9,921 | 352,394 |
| NCR Corp.* | 26,311 | 896,153 |
| | | 2,981,981 |
| |
| Construction & Engineering - 0.8% | | |
| AECOM Technology Corp.* | 15,467 | 455,194 |
| Granite Construction, Inc. | 5,709 | 199,701 |
| KBR, Inc | 23,457 | 748,043 |
| URS Corp. | 11,826 | 626,660 |
| | | 2,029,598 |
| |
| Construction Materials - 0.5% | | |
| Eagle Materials, Inc | 7,857 | 608,368 |
| Martin Marietta Materials, Inc | 7,329 | 732,460 |
| | | 1,340,828 |
| |
| Containers & Packaging - 1.6% | | |
| AptarGroup, Inc | 10,374 | 703,461 |
| Greif, Inc | 4,725 | 247,590 |
| Packaging Corp. of America | 15,450 | 977,676 |
| Rock-Tenn Co | 11,348 | 1,191,653 |
| Silgan Holdings, Inc | 6,934 | 332,971 |
| Sonoco Products Co | 16,061 | 670,065 |
| | | 4,123,416 |
| |
| Distributors - 0.6% | | |
| LKQ Corp.* | 47,357 | 1,558,045 |
| |
| Diversified Consumer Services - 0.8% | | |
| Apollo Education Group, Inc.* | 15,800 | 431,656 |
| DeVry Education Group, Inc. | 8,984 | 318,932 |
| Matthews International Corp. | 4,284 | 182,542 |
| Service Corp. International | 33,594 | 609,059 |
| Sotheby’s | 10,831 | 576,209 |
| | | 2,118,398 |
| |
| Diversified Financial Services - 0.6% | | |
| CBOE Holdings, Inc. | 13,736 | 713,723 |
| MSCI, Inc.* | 18,652 | 815,465 |
| | | 1,529,188 |
| |
| Diversified Telecommunication Services - 0.3% | | |
| tw telecom, Inc.* | 22,695 | 691,517 |
| |
| Electric Utilities - 1.5% | | |
| Cleco Corp | 9,581 | 446,666 |
| Great Plains Energy, Inc. | 24,373 | 590,801 |
| Hawaiian Electric Industries, Inc | 15,712 | 409,455 |
| IDACORP, Inc | 7,962 | 412,750 |
| OGE Energy Corp. | 31,263 | 1,059,816 |
| PNM Resources, Inc. | 12,410 | 299,329 |
| Westar Energy, Inc. | 20,133 | 647,679 |
| | | 3,866,496 |
10 www.calvert.com CALVERT VP S&P MIDCAP 400 INDEX PORTFOLIO ANNUAL REPORT
| | |
| EQUITY SECURITIES - CONT’D | SHARES | VALUE |
| Electrical Equipment - 1.0% | | |
| Acuity Brands, Inc. | 6,789 | $742,173 |
| General Cable Corp. | 7,887 | 231,957 |
| Hubbell, Inc., Class B | 8,474 | 922,819 |
| Regal-Beloit Corp. | 7,142 | 526,508 |
| | | 2,423,457 |
| |
| Electronic Equipment & Instruments - 2.0% | | |
| Arrow Electronics, Inc.* | 15,879 | 861,436 |
| Avnet, Inc. | 21,739 | 958,907 |
| Ingram Micro, Inc.* | 24,212 | 568,013 |
| Itron, Inc.* | 6,108 | 253,054 |
| National Instruments Corp. | 15,429 | 494,037 |
| Tech Data Corp.* | 5,985 | 308,826 |
| Trimble Navigation Ltd.* | 40,690 | 1,411,943 |
| Vishay Intertechnology, Inc.* | 20,941 | 277,678 |
| | | 5,133,894 |
| |
| Energy Equipment & Services - 2.8% | | |
| Atwood Oceanics, Inc.* | 9,124 | 487,130 |
| CARBO Ceramics, Inc | 3,146 | 366,603 |
| Dresser-Rand Group, Inc.* | 12,087 | 720,748 |
| Dril-Quip, Inc.* | 6,433 | 707,179 |
| Helix Energy Solutions Group, Inc.* | 15,589 | 361,353 |
| Oceaneering International, Inc | 17,044 | 1,344,431 |
| Oil States International, Inc.* | 8,742 | 889,236 |
| Patterson-UTI Energy, Inc. | 22,721 | 575,296 |
| Superior Energy Services, Inc.* | 25,290 | 672,967 |
| Tidewater, Inc. | 7,844 | 464,914 |
| Unit Corp.* | 6,927 | 357,572 |
| | | 6,947,429 |
| |
| Food & Staples Retailing - 0.5% | | |
| Harris Teeter Supermarkets, Inc. | 7,839 | 386,855 |
| SUPERVALU, Inc.* | 30,880 | 225,115 |
| United Natural Foods, Inc.* | 7,816 | 589,248 |
| | | 1,201,218 |
| |
| Food Products - 2.3% | | |
| Dean Foods Co.* | 14,891 | 255,976 |
| Flowers Foods, Inc. | 27,736 | 595,492 |
| Green Mountain Coffee Roasters, Inc.* | 20,659 | 1,561,407 |
| Hain Celestial Group, Inc.* | 7,600 | 689,928 |
| Hillshire Brands Co | 19,507 | 652,314 |
| Ingredion, Inc. | 12,079 | 826,928 |
| Lancaster Colony Corp. | 3,075 | 271,061 |
| Post Holdings, Inc.* | 5,181 | 255,268 |
| Tootsie Roll Industries, Inc. | 3,190 | 103,803 |
| WhiteWave Foods Co.* | 27,435 | 629,359 |
| | | 5,841,536 |
| |
| Gas Utilities - 1.3% | | |
| Atmos Energy Corp. | 14,366 | 652,504 |
| National Fuel Gas Co. | 13,253 | 946,264 |
| Questar Corp. | 27,752 | 638,018 |
www.calvert.com CALVERT VP S&P MIDCAP 400 INDEX PORTFOLIO ANNUAL REPORT 11
| | |
| EQUITY SECURITIES - CONT’D | SHARES | VALUE |
| Gas Utilities - Cont’d | | |
| UGI Corp. | 18,084 | $749,763 |
| WGL Holdings, Inc. | 8,201 | 328,532 |
| | | 3,315,081 |
| |
| Health Care Equipment & Supplies - 2.3% | | |
| Hill-Rom Holdings, Inc. | 9,291 | 384,090 |
| Hologic, Inc.* | 42,865 | 958,033 |
| IDEXX Laboratories, Inc.* | 8,175 | 869,575 |
| Masimo Corp.* | 7,974 | 233,080 |
| ResMed, Inc | 22,382 | 1,053,745 |
| STERIS Corp | 9,365 | 449,988 |
| Teleflex, Inc | 6,518 | 611,779 |
| The Cooper Co.’s, Inc | 7,712 | 955,054 |
| Thoratec Corp.* | 9,118 | 333,719 |
| | | 5,849,063 |
| |
| Health Care Providers & Services - 3.1% | | |
| Community Health Systems, Inc.* | 15,026 | 590,071 |
| Health Management Associates, Inc.* | 41,754 | 546,977 |
| Health Net, Inc.* | 12,585 | 373,397 |
| Henry Schein, Inc.* | 13,525 | 1,545,367 |
| LifePoint Hospitals, Inc.* | 7,407 | 391,386 |
| Mednax, Inc.* | 15,846 | 845,859 |
| Omnicare, Inc. | 16,223 | 979,220 |
| Owens & Minor, Inc. | 10,032 | 366,770 |
| Universal Health Services, Inc., Class B | 14,087 | 1,144,710 |
| VCA Antech, Inc.* | 14,046 | 440,483 |
| WellCare Health Plans, Inc.* | 6,903 | 486,109 |
| | | 7,710,349 |
| |
| Health Care Technology - 0.3% | | |
| Allscripts Healthcare Solutions, Inc.* | 25,118 | 388,324 |
| HMS Holdings Corp.* | 13,917 | 316,334 |
| | | 704,658 |
| |
| Hotels, Restaurants & Leisure - 1.5% | | |
| Bally Technologies, Inc.* | 6,164 | 483,566 |
| Bob Evans Farms, Inc | 4,293 | 217,183 |
| Brinker International, Inc | 10,497 | 486,431 |
| Domino’s Pizza, Inc | 8,821 | 614,383 |
| International Speedway Corp. | 4,422 | 156,937 |
| Life Time Fitness, Inc.* | 6,251 | 293,797 |
| Panera Bread Co.* | 4,215 | 744,748 |
| Scientific Games Corp.* | 7,687 | 130,141 |
| The Cheesecake Factory, Inc. | 7,580 | 365,886 |
| Wendy’s Co. | 44,884 | 391,388 |
| | | 3,884,460 |
| |
| Household Durables - 1.8% | | |
| Jarden Corp.* | 18,844 | 1,156,079 |
| KB Home | 13,149 | 240,364 |
| MDC Holdings, Inc.* | 6,197 | 199,791 |
| NVR, Inc.* | 659 | 676,141 |
| Tempur Sealy International, Inc.* | 9,581 | 516,991 |
12 www.calvert.com CALVERT VP S&P MIDCAP 400 INDEX PORTFOLIO ANNUAL REPORT
| | |
| EQUITY SECURITIES - CONT’D | SHARES | VALUE |
| Household Durables - Cont’d | | |
| Toll Brothers, Inc.* | 25,037 | $926,369 |
| Tupperware Brands Corp. | 7,981 | 754,444 |
| | | 4,470,179 |
| |
| Household Products - 1.0% | | |
| Church & Dwight Co., Inc. | 21,873 | 1,449,743 |
| Energizer Holdings, Inc. | 9,810 | 1,061,834 |
| | | 2,511,577 |
| |
| Industrial Conglomerates - 0.3% | | |
| Carlisle Co.’s, Inc. | 10,019 | 795,509 |
| |
| Insurance - 4.8% | | |
| Alleghany Corp.* | 2,641 | 1,056,294 |
| American Financial Group, Inc. | 11,281 | 651,139 |
| Arthur J. Gallagher & Co. | 20,721 | 972,437 |
| Aspen Insurance Holdings Ltd. | 10,338 | 427,063 |
| Brown & Brown, Inc. | 18,833 | 591,168 |
| Everest Re Group Ltd | 7,546 | 1,176,195 |
| Fidelity National Financial, Inc. | 39,339 | 1,276,551 |
| First American Financial Corp. | 16,804 | 473,873 |
| Hanover Insurance Group, Inc | 6,942 | 414,507 |
| HCC Insurance Holdings, Inc. | 15,866 | 732,057 |
| Kemper Corp. | 8,070 | 329,902 |
| Mercury General Corp. | 5,749 | 285,783 |
| Old Republic International Corp. | 38,296 | 661,372 |
| Primerica, Inc | 8,668 | 371,944 |
| Protective Life Corp. | 12,441 | 630,261 |
| Reinsurance Group of America, Inc. | 11,120 | 860,799 |
| StanCorp Financial Group, Inc. | 6,930 | 459,112 |
| WR Berkley Corp. | 17,234 | 747,783 |
| | | 12,118,240 |
| |
| Internet & Catalog Retail - 0.1% | | |
| HSN, Inc. | 5,306 | 330,564 |
| |
| Internet Software & Services - 1.2% | | |
| AOL, Inc.* | 12,362 | 576,317 |
| Equinix, Inc.* | 7,823 | 1,388,191 |
| Rackspace Hosting, Inc.* | 18,058 | 706,610 |
| ValueClick, Inc.* | 9,960 | 232,765 |
| | | 2,903,883 |
| |
| IT Services - 3.2% | | |
| Acxiom Corp.* | 11,738 | 434,071 |
| Broadridge Financial Solutions, Inc | 18,764 | 741,553 |
| Convergys Corp. | 16,023 | 337,284 |
| CoreLogic, Inc.* | 14,764 | 524,565 |
| DST Systems, Inc. | 4,650 | 421,941 |
| Gartner, Inc.* | 14,521 | 1,031,717 |
| Global Payments, Inc. | 11,482 | 746,215 |
| Jack Henry & Associates, Inc. | 13,515 | 800,223 |
| Leidos Holdings, Inc. | 11,543 | 536,634 |
| Lender Processing Services, Inc. | 13,522 | 505,452 |
| Mantech International Corp. | 3,690 | 110,442 |
| NeuStar, Inc.* | 9,864 | 491,819 |
www.calvert.com CALVERT VP S&P MIDCAP 400 INDEX PORTFOLIO ANNUAL REPORT 13
| | |
| EQUITY SECURITIES - CONT’D | SHARES | VALUE |
| IT Services - Cont’d | | |
| Science Applications International Corp. | 6,596 | $218,130 |
| VeriFone Systems, Inc.* | 17,202 | 461,358 |
| WEX, Inc.* | 6,158 | 609,827 |
| | | 7,971,231 |
| |
| Leisure Equipment & Products - 0.8% | | |
| Brunswick Corp. | 14,327 | 659,902 |
| Polaris Industries, Inc. | 10,150 | 1,478,246 |
| | | 2,138,148 |
| |
| Life Sciences - Tools & Services - 1.3% | | |
| Bio-Rad Laboratories, Inc.* | 3,146 | 388,877 |
| Charles River Laboratories International, Inc.* | 7,580 | 402,043 |
| Covance, Inc.* | 8,860 | 780,212 |
| Mettler-Toledo International, Inc.* | 4,676 | 1,134,351 |
| Techne Corp. | 5,256 | 497,585 |
| | | 3,203,068 |
| |
| Machinery - 5.4% | | |
| AGCO Corp. | 14,349 | 849,317 |
| CLARCOR, Inc. | 7,909 | 508,944 |
| Crane Co. | 7,732 | 519,977 |
| Donaldson Co., Inc | 21,193 | 921,048 |
| Graco, Inc. | 9,646 | 753,546 |
| Harsco Corp. | 12,786 | 358,392 |
| IDEX Corp. | 12,779 | 943,729 |
| ITT Corp | 14,313 | 621,470 |
| Kennametal, Inc | 12,339 | 642,492 |
| Lincoln Electric Holdings, Inc. | 12,857 | 917,218 |
| Nordson Corp | 9,567 | 710,828 |
| Oshkosh Corp | 13,610 | 685,672 |
| SPX Corp | 7,145 | 711,713 |
| Terex Corp. | 17,641 | 740,746 |
| Timken Co | 12,523 | 689,642 |
| Trinity Industries, Inc | 12,302 | 670,705 |
| Valmont Industries, Inc | 4,243 | 632,716 |
| Wabtec Corp. | 15,171 | 1,126,750 |
| Woodward, Inc. | 9,598 | 437,765 |
| | | 13,442,670 |
| |
| Marine - 0.4% | | |
| Kirby Corp.* | 8,998 | 893,051 |
| Matson, Inc | 6,642 | 173,423 |
| | | 1,066,474 |
| |
| Media - 1.3% | | |
| AMC Networks, Inc.* | 9,394 | 639,825 |
| Cinemark Holdings, Inc | 16,454 | 548,412 |
| DreamWorks Animation SKG, Inc.* | 11,287 | 400,688 |
| John Wiley & Sons, Inc. | 7,298 | 402,850 |
| Lamar Advertising Co.* | 10,334 | 539,952 |
| Meredith Corp. | 5,865 | 303,807 |
| New York Times Co. | 19,898 | 315,781 |
| Valassis Communications, Inc | 6,028 | 206,459 |
| | | 3,357,774 |
14 www.calvert.com CALVERT VP S&P MIDCAP 400 INDEX PORTFOLIO ANNUAL REPORT
| | |
| EQUITY SECURITIES - CONT’D | SHARES | VALUE |
| Metals & Mining - 1.5% | | |
| Carpenter Technology Corp. | 8,381 | $521,298 |
| Commercial Metals Co. | 18,542 | 376,959 |
| Compass Minerals International, Inc. | 5,303 | 424,505 |
| Reliance Steel & Aluminum Co. | 12,204 | 925,551 |
| Royal Gold, Inc | 10,310 | 474,982 |
| Steel Dynamics, Inc. | 34,996 | 683,822 |
| Worthington Industries, Inc | 8,243 | 346,866 |
| | | 3,753,983 |
| |
| Multiline Retail - 0.3% | | |
| Big Lots, Inc.* | 9,241 | 298,392 |
| J.C. Penney Co., Inc.* | 48,275 | 441,716 |
| | | 740,108 |
| |
| Multi-Utilities - 1.1% | | |
| Alliant Energy Corp. | 17,477 | 901,813 |
| Black Hills Corp. | 7,056 | 370,511 |
| MDU Resources Group, Inc. | 29,930 | 914,362 |
| Vectren Corp | 13,047 | 463,168 |
| | | 2,649,854 |
| |
| Office Electronics - 0.2% | | |
| Zebra Technologies Corp.* | 7,919 | 428,260 |
| |
| Oil, Gas & Consumable Fuels - 2.8% | | |
| Alpha Natural Resources, Inc.* | 35,106 | 250,657 |
| Bill Barrett Corp.* | 7,730 | 207,009 |
| Cimarex Energy Co | 13,711 | 1,438,421 |
| Energen Corp | 11,447 | 809,875 |
| Gulfport Energy Corp.* | 13,300 | 839,895 |
| HollyFrontier Corp. | 31,303 | 1,555,446 |
| Rosetta Resources, Inc.* | 9,687 | 465,364 |
| SM Energy Co. | 10,608 | 881,631 |
| World Fuel Services Corp | 11,383 | 491,290 |
| | | 6,939,588 |
| |
| Paper & Forest Products - 0.4% | | |
| Domtar Corp. | 5,104 | 481,511 |
| Louisiana-Pacific Corp.* | 22,239 | 411,644 |
| | | 893,155 |
| |
| Pharmaceuticals - 1.0% | | |
| Endo Health Solutions, Inc.* | 18,101 | 1,221,093 |
| Mallinckrodt plc* | 9,135 | 477,395 |
| Salix Pharmaceuticals Ltd.* | 9,908 | 891,126 |
| | | 2,589,614 |
| |
| Professional Services - 1.2% | | |
| Corporate Executive Board Co | 5,324 | 412,237 |
| FTI Consulting, Inc.* | 6,460 | 265,764 |
| Manpowergroup, Inc | 12,409 | 1,065,437 |
| Towers Watson & Co | 10,201 | 1,301,750 |
| | | 3,045,188 |
| |
| Real Estate Investment Trusts - 8.0% | | |
| Alexandria Real Estate Equities, Inc. | 11,323 | 720,369 |
www.calvert.com CALVERT VP S&P MIDCAP 400 INDEX PORTFOLIO ANNUAL REPORT 15
| | |
| EQUITY SECURITIES - CONT’D | SHARES | VALUE |
| Real Estate Investment Trusts - Cont’d | | |
| American Campus Communities, Inc. | 16,608 | $534,944 |
| BioMed Realty Trust, Inc. | 30,452 | 551,790 |
| BRE Properties, Inc | 12,231 | 669,158 |
| Camden Property Trust | 13,514 | 768,676 |
| Corporate Office Properties Trust | 13,846 | 328,012 |
| Corrections Corp. of America | 18,339 | 588,132 |
| Duke Realty Corp. | 51,518 | 774,831 |
| Equity One, Inc. | 10,026 | 224,983 |
| Essex Property Trust, Inc | 6,028 | 865,078 |
| Extra Space Storage, Inc. | 17,323 | 729,818 |
| Federal Realty Investment Trust | 10,246 | 1,039,047 |
| Highwoods Properties, Inc. | 14,240 | 515,061 |
| Home Properties, Inc. | 9,013 | 483,277 |
| Hospitality Properties Trust | 23,450 | 633,853 |
| Kilroy Realty Corp. | 12,928 | 648,727 |
| Liberty Property Trust | 23,093 | 782,160 |
| Mack-Cali Realty Corp. | 13,950 | 299,646 |
| Mid-America Apartment Communities, Inc. | 11,800 | 716,732 |
| National Retail Properties, Inc. | 19,209 | 582,609 |
| Omega Healthcare Investors, Inc. | 19,301 | 575,170 |
| Potlatch Corp | 6,424 | 268,138 |
| Rayonier, Inc | 19,990 | 841,579 |
| Realty Income Corp. | 32,471 | 1,212,142 |
| Regency Centers Corp. | 14,628 | 677,276 |
| Senior Housing Properties Trust | 29,812 | 662,721 |
| SL Green Realty Corp. | 14,943 | 1,380,434 |
| Taubman Centers, Inc | 10,012 | 639,967 |
| UDR, Inc | 39,499 | 922,302 |
| Weingarten Realty Investors | 17,780 | 487,528 |
| | | 20,124,160 |
| |
| Real Estate Management & Development - 0.4% | | |
| Alexander & Baldwin, Inc | 6,830 | 285,016 |
| Jones Lang LaSalle, Inc. | 7,043 | 721,133 |
| | | 1,006,149 |
| |
| Road & Rail - 1.4% | | |
| Con-way, Inc | 8,954 | 355,563 |
| Genesee & Wyoming, Inc.* | 8,004 | 768,784 |
| JB Hunt Transport Services, Inc. | 14,473 | 1,118,763 |
| Landstar System, Inc. | 7,240 | 415,938 |
| Old Dominion Freight Line, Inc.* | 10,995 | 582,955 |
| Werner Enterprises, Inc | 7,261 | 179,565 |
| | | 3,421,568 |
| |
| Semiconductors & Semiconductor Equipment - 2.4% | | |
| Advanced Micro Devices, Inc.* | 97,004 | 375,406 |
| Atmel Corp.* | 67,771 | 530,647 |
| Cree, Inc.* | 19,037 | 1,191,145 |
| Cypress Semiconductor Corp.* | 21,766 | 228,543 |
| Fairchild Semiconductor International, Inc.* | 20,225 | 270,004 |
| Integrated Device Technology, Inc.* | 21,617 | 220,277 |
| International Rectifier Corp.* | 11,219 | 292,479 |
| Intersil Corp | 20,177 | 231,430 |
| RF Micro Devices, Inc.* | 44,588 | 230,074 |
| Semtech Corp.* | 10,698 | 270,445 |
16 www.calvert.com CALVERT VP S&P MIDCAP 400 INDEX PORTFOLIO ANNUAL REPORT
| | |
| EQUITY SECURITIES - CONT’D | SHARES | VALUE |
| Semiconductors & Semiconductor Equipment - Cont’d | | |
| Silicon Laboratories, Inc.* | 6,229 | $269,778 |
| Skyworks Solutions, Inc.* | 29,563 | 844,319 |
| SunEdison, Inc.* | 38,639 | 504,239 |
| Teradyne, Inc.* | 30,185 | 531,860 |
| | | 5,990,646 |
| |
| Software - 4.2% | | |
| ACI Worldwide, Inc.* | 6,072 | 394,680 |
| Advent Software, Inc | 6,351 | 222,221 |
| ANSYS, Inc.* | 14,651 | 1,277,567 |
| Cadence Design Systems, Inc.* | 45,004 | 630,956 |
| Commvault Systems, Inc.* | 6,963 | 521,389 |
| Compuware Corp. | 34,022 | 381,387 |
| Concur Technologies, Inc.* | 7,460 | 769,723 |
| FactSet Research Systems, Inc. | 6,315 | 685,683 |
| Fair Isaac Corp. | 5,445 | 342,164 |
| Informatica Corp.* | 17,156 | 711,974 |
| Mentor Graphics Corp | 15,205 | 365,984 |
| MICROS Systems, Inc.* | 11,859 | 680,351 |
| PTC, Inc.* | 18,949 | 670,605 |
| Rovi Corp.* | 16,009 | 315,217 |
| SolarWinds, Inc.* | 10,399 | 393,394 |
| Solera Holdings, Inc | 10,906 | 771,709 |
| Synopsys, Inc.* | 24,324 | 986,825 |
| TIBCO Software, Inc.* | 24,214 | 544,331 |
| | | 10,666,160 |
| |
| Specialty Retail - 4.5% | | |
| Aaron’s, Inc. | 12,044 | 354,094 |
| Abercrombie & Fitch Co. | 12,034 | 396,039 |
| Advance Auto Parts, Inc. | 11,473 | 1,269,832 |
| American Eagle Outfitters, Inc | 26,882 | 387,101 |
| ANN, Inc.* | 7,323 | 267,729 |
| Ascena Retail Group, Inc.* | 20,184 | 427,093 |
| Cabela’s, Inc.* | 7,382 | 492,084 |
| Chico’s FAS, Inc | 25,204 | 474,843 |
| CST Brands, Inc. | 11,986 | 440,126 |
| Dick’s Sporting Goods, Inc. | 16,114 | 936,223 |
| Foot Locker, Inc | 23,496 | 973,674 |
| Guess?, Inc. | 9,444 | 293,425 |
| Murphy USA, Inc.* | 7,036 | 292,416 |
| Office Depot, Inc.* | 75,474 | 399,258 |
| Rent-A-Center, Inc | 8,462 | 282,123 |
| Signet Jewelers Ltd. | 12,636 | 994,453 |
| Tractor Supply Co | 21,989 | 1,705,907 |
| Williams-Sonoma, Inc | 14,111 | 822,389 |
| | | 11,208,809 |
| |
| Textiles, Apparel & Luxury Goods - 1.3% | | |
| Carter’s, Inc | 8,659 | 621,629 |
| Deckers Outdoor Corp.* | 5,467 | 461,743 |
| Hanesbrands, Inc. | 15,692 | 1,102,677 |
| Under Armour, Inc.* | 12,707 | 1,109,321 |
| | | 3,295,370 |
www.calvert.com CALVERT VP S&P MIDCAP 400 INDEX PORTFOLIO ANNUAL REPORT 17
| | |
| EQUITY SECURITIES - CONT’D | SHARES | VALUE |
| Thrifts & Mortgage Finance - 0.7% | | |
| Astoria Financial Corp. | 13,259 | $183,372 |
| New York Community Bancorp, Inc | 69,451 | 1,170,249 |
| Washington Federal, Inc | 16,200 | 377,298 |
| | | 1,730,919 |
| |
| Tobacco - 0.1% | | |
| Universal Corp. | 3,591 | 196,069 |
| |
| Trading Companies & Distributors - 1.0% | | |
| GATX Corp. | 7,222 | 376,772 |
| MSC Industrial Direct Co., Inc. | 7,636 | 617,523 |
| United Rentals, Inc.* | 14,687 | 1,144,852 |
| Watsco, Inc. | 4,260 | 409,215 |
| | | 2,548,362 |
| |
| Water Utilities - 0.3% | | |
| Aqua America, Inc. | 27,969 | 659,789 |
| |
| Wireless Telecommunication Services - 0.2% | | |
| Telephone & Data Systems, Inc. | 15,471 | 398,842 |
| |
| Total Equity Securities (Cost $162,508,636) | | 242,242,616 |
| |
| EXCHANGE TRADED PRODUCTS - 1.3% | | |
| SPDR S&P MidCap 400 ETF Trust | 13,200 | 3,223,440 |
| |
| Total Exchange Traded Products (Cost $2,827,740) | | 3,223,440 |
| | PRINCIPAL | |
| TIME DEPOSIT - 2.0% | AMOUNT | |
| State Street Bank Time Deposit, 0.083%, 1/2/14 | $5,108,316 | 5,108,316 |
| |
| Total Time Deposit (Cost $5,108,316) | | 5,108,316 |
| |
| U.S. TREASURY OBLIGATIONS - 0.2% | | |
| United States Treasury Bills, 0.068%, 6/26/14^ | 500,000 | 499,835 |
| |
| Total U.S. Treasury Obligations (Cost $499,835) | | 499,835 |
| |
| TOTAL INVESTMENTS (Cost $170,944,527) - 100.0% | | 251,074,207 |
| Other assets and liabilities, net - 0.0% | | (23,272) |
| NET ASSETS - 100% | | $251,050,935 |
See notes to financial statements.
18 www.calvert.com CALVERT VP S&P MIDCAP 400 INDEX PORTFOLIO ANNUAL REPORT
| |
| NET ASSETS CONSISTS OF: | |
| Paid-in capital applicable to the following shares of common stock outstanding; | |
| $0.10 par value, 20,000,000 shares authorized: | |
| Class I: 2,548,286 shares outstanding | $167,618,209 |
| Class F: 63,178 shares outstanding | 4,791,568 |
| Undistributed net investment income | 470,971 |
| Accumulated net realized gain (loss) | (2,116,710) |
| Net unrealized appreciation (depreciation) | 80,286,897 |
| |
| NET ASSETS | $251,050,935 |
| |
| NET ASSET VALUE PER SHARE | |
| Class I: (based on net assets of $244,902,687) | $96.10 |
| Class F: (based on net assets of $6,148,248) | $97.32 |
| | | | UNDERLYING | UNREALIZED |
| | NUMBER OF | EXPIRATION | FACE AMOUNT | APPRECIATION |
| FUTURES | CONTRACTS | DATE | AT VALUE | (DEPRECIATION) |
| Purchased: | | | | |
| E-Mini S&P 400 Index^ | 43 | 3/14 | $5,759,420 | $157,217 |
(b) This security was valued under the direction of the Board of Directors. See Note A. ^ Futures collateralized by $500,000 par value of U.S. Treasury Bills.
* Non-income producing security.
Abbreviations:
ETF: Exchange Traded Fund
LLC: Limited Liability Corporation
plc: Public Limited Company
See notes to financial statements.
www.calvert.com CALVERT VP S&P MIDCAP 400 INDEX PORTFOLIO ANNUAL REPORT 19
| |
| STATEMENT OF OPERATIONS |
| YEAR ENDED DECEMBER 31, 2013 |
| |
| NET INVESTMENT INCOME | |
| Investment Income: | |
| Dividend income | $3,425,090 |
| Interest income | 6,462 |
| Total investment income | 3,431,552 |
| |
| |
| |
| Expenses: | |
| Investment advisory fee | 676,195 |
| Transfer agency fees and expenses | 36,565 |
| Administrative fees | 225,398 |
| Distribution Plan expenses: | |
| Class F | 8,851 |
| Directors’ fees and expenses | 36,396 |
| Custodian fees | 45,737 |
| Reports to shareholders | 15,945 |
| Professional fees | 50,042 |
| Accounting fees | 33,817 |
| Miscellaneous | 65,449 |
| Total expenses | 1,194,395 |
| Reimbursement from Advisor: | |
| Class F | (3,856) |
| Net expenses | 1,190,539 |
| |
| |
| NET INVESTMENT INCOME | 2,241,013 |
| |
| |
| REALIZED AND UNREALIZED GAIN (LOSS) | |
| Net realized gain (loss) on: | |
| Investments | 10,918,881 |
| Futures | 1,298,532 |
| | 12,217,413 |
| |
| Change in unrealized appreciation (depreciation) on: | |
| Investments | 48,132,751 |
| Futures | 164,965 |
| | 48,297,716 |
| |
| NET REALIZED AND UNREALIZED GAIN (LOSS) | 60,515,129 |
| |
| INCREASE (DECREASE) IN NET ASSETS | |
| RESULTING FROM OPERATIONS | $62,756,142 |
See notes to financial statements.
20 www.calvert.com CALVERT VP S&P MIDCAP 400 INDEX PORTFOLIO ANNUAL REPORT
| | |
| STATEMENTS OF CHANGES IN NET ASSETS |
| |
| | YEAR ENDED | YEAR ENDED |
| | DECEMBER 31, | DECEMBER 31, |
| INCREASE (DECREASE) IN NET ASSETS | 2013 | 2012 |
| Operations: | | |
| Net investment income | $2,241,013 | $2,207,705 |
| Net realized gain (loss) | 12,217,413 | 8,596,471 |
| Change in unrealized appreciation (depreciation) | 48,297,716 | 19,222,800 |
| |
| |
| INCREASE (DECREASE) IN NET ASSETS | | |
| RESULTING FROM OPERATIONS | 62,756,142 | 30,026,976 |
| |
| Distributions to shareholders from: | | |
| Net investment income: | | |
| Class I shares | (2,027,956) | (1,754,230) |
| Class F shares | (26,053) | (15,568) |
| Net realized gain: | | |
| Class I shares | (7,097,825) | (4,579,609) |
| Class F shares | (172,635) | (64,080) |
| Total distributions | (9,324,469) | (6,413,487) |
| |
| Capital share transactions: | | |
| Shares sold: | | |
| Class I shares | 33,765,505 | 11,388,693 |
| Class F shares | 2,876,512 | 1,170,611 |
| Reinvestment of distributions: | | |
| Class I shares | 9,125,781 | 6,333,839 |
| Class F shares | 198,688 | 79,648 |
| Shares redeemed: | | |
| Class I shares | (39,305,499) | (30,769,083) |
| Class F shares | (590,072) | (529,292) |
| Total capital share transactions | 6,070,915 | (12,325,584) |
| |
| |
| TOTAL INCREASE (DECREASE) IN NET ASSETS | 59,502,588 | 11,287,905 |
| |
| NET ASSETS | | |
| Beginning of year | 191,548,347 | 180,260,442 |
| End of year (including undistributed net investment income | | |
| of $470,971 and $521,647, respectively) | $251,050,935 | $191,548,347 |
| |
| |
| CAPITAL SHARE ACTIVITY | | |
| Shares sold: | | |
| Class I shares | 384,169 | 156,206 |
| Class F shares | 32,355 | 15,880 |
| Reinvestment of distributions: | | |
| Class I shares | 97,769 | 85,569 |
| Class F shares | 2,102 | 1,065 |
| Shares redeemed: | | |
| Class I shares | (444,693) | (420,680) |
| Class F shares | (6,483) | (7,068) |
| Total capital share activity | 65,219 | (169,028) |
See notes to financial statements.
www.calvert.com CALVERT VP S&P MIDCAP 400 INDEX PORTFOLIO ANNUAL REPORT 21
NOTES TO FINANCIAL STATEMENTS
NOTE A –- SIGNIFICANT ACCOUNTING POLICIES
General: Calvert VP S&P MidCap 400 Index Portfolio (the “Portfolio”), a series of Calvert Variable Products, Inc. (the “Fund”), is registered under the Investment Company Act of 1940 as a diversified, open-end management investment company. The Fund is comprised of twelve separate portfolios. The operations of each series of the Fund are accounted for separately. Shares of the Portfolio are sold without sales charge to affiliated and unaffiliated insurance companies for allocation to certain of their variable separate accounts. The Portfolio offers Class F and Class I shares. Class F shares are subject to Distribution Plan Expenses, while Class I shares are not. Each class has different: (a) dividend rates, due to differences in Distribution Plan expenses and other class-specific expenses, (b) exchange privileges; and (c) class-specific voting rights.
Security Valuation: Net asset value per share is determined every business day as of the close of the regular session of the New York Stock Exchange (generally 4:00 p.m. Eastern time). The Portfolio uses independent pricing services approved by the Board of Directors (“the Board”) to value its investments wherever possible. Investments for which market quotations are not available or deemed not reliable are fair valued in good faith under the direction of the Board.
The Board has adopted Valuation Procedures (the “Procedures”) to determine the fair value of securities and other financial instruments for which market prices are not readily available or which may not be reliably priced. The Board has delegated the day-to-day responsibility for determining the fair value of assets of the Portfolio to Calvert Investment Management, Inc. (the “Advisor” or “Calvert”) and has provided these Procedures to govern Calvert in its valuation duties.
Calvert has chartered an internal Valuation Committee to oversee the implementation of these Procedures and to assist it in carrying out the valuation responsibilities that the Board has delegated.
The Valuation Committee meets on a regular basis to review illiquid securities and other investments which may not have readily available market prices. The Valuation Committee’s fair valuation determinations are subject to review, approval and ratification by the Board at its next regularly scheduled meeting covering the calendar quarter in which the fair valuation was determined.
The Valuation Committee utilizes various methods to measure the fair value of the Portfolio’s investments. Generally Accepted Accounting Principles (GAAP) establishes a disclosure hierarchy that categorizes the inputs to valuation techniques used to value assets and liabilities at measurement date. These inputs are summarized in the three broad levels listed below:
Level 1 – quoted prices in active markets for identical securities
Level 2 – other significant observable inputs (including quoted prices for similar securities, interest rates, prepayment speeds, credit risk, etc.)
Level 3 – significant unobservable inputs (including the Portfolio’s own assumptions in determining the fair value of investments) The inputs or methodologies used for valuing securities are not necessarily an indication of the risk associated with investing in those securities.
Changes in valuation techniques may result in transfers in or out of an investment’s assigned level within the hierarchy during the period. There were no such transfers during the period. Valuation techniques used to value the Portfolio’s investments by major category are as follows: Equity securities, including restricted securities, for which market quotations are readily available, are valued at the last reported sale price or official closing price as reported by an independent pricing service on the primary market or exchange on which they are traded and are categorized as Level 1 in the hierarchy.
22 www.calvert.com CALVERT VP S&P MIDCAP 400 INDEX PORTFOLIO ANNUAL REPORT
In the event there were no sales during the day or closing prices are not available, securities are valued at the last quoted bid price or may be valued using the last available price and are categorized as Level 2 in the hierarchy. Foreign securities are valued based on quotations from the principal market in which such securities are normally traded. If events occur after the close of the principal market in which foreign securities are traded, and before the close of business of the Portfolio, that are expected to materially affect the value of those securities, then they are valued at their fair value taking these events into account. For restricted securities and private placements where observable inputs are limited, assumptions about market activity and risk are used and such securities are categorized as Level 3 in the hierarchy.
Exchange traded products are valued at the official closing price as reported by an independent pricing service on the primary market or exchange on which they are traded and are categorized as Level 1 in the hierarchy.
Debt securities, including restricted securities, are valued based on evaluated prices received from independent pricing services or from dealers who make markets in such securities. For U.S. government obligations, pricing services utilize matrix pricing which considers yield or price of bonds of comparable quality, coupon, maturity and type as well as dealer supplied prices and such securities are generally categorized as Level 2 in the hierarchy. Short-term securities of sufficient credit quality with remaining maturities of sixty days or less for which quotations are not readily available are valued at amortized cost, which approximates fair value, and are categorized as Level 2 in the hierarchy.
When independent prices are unavailable or unreliable, debt securities may be valued utilizing pricing matrices which consider similar factors that would be used by independent pricing services. These are generally categorized as Level 2 in the hierarchy but may be Level 3 depending on the circumstances.
If a market value cannot be determined for a security using the methodologies described above, or if, in the good faith opinion of the Advisor, the market value does not constitute a readily available market quotation, or if a significant event has occurred that would materially affect the value of the security, the security will be fair valued as determined in good faith by the Valuation Committee.
The Valuation Committee considers a number of factors, including significant unobservable valuation inputs when arriving at fair value. It considers all significant facts that are reasonably available and relevant to the determination of fair value.
The Valuation Committee primarily employs a market-based approach which may use related or comparable assets or liabilities, recent transactions, market multiples, book values, and other relevant information for the investment to determine the fair value of the investment. When more appropriate, the fund may employ an income-based or cost approach. An income-based valuation approach discounts anticipated future cash flows of the investment to calculate a present amount (discounted). The measurement is based on the value indicated by current market expectations about those future amounts. Discounts may also be applied due to the nature or duration of any restrictions on the disposition of the investments. A cost based approach is based on the amount that currently would be required to replace the service capacity of an asset (current replacement cost). From the seller’s perspective, the price that would be received for the asset is determined based on the cost to a buyer to acquire or construct a substitute asset of comparable utility, adjusted for obsolescence.
The values assigned to fair value investments are based on available information and do not necessarily represent amounts that might ultimately be realized. Further, due to the inherent uncertainty of valuations of such investments, the fair values may differ significantly from the values that would have been used had an active market existed, and the differences could be material. The Valuation Committee employs various methods for calibrating these valuation approaches including a regular review of key inputs and assumptions, transactional back-testing or disposition analysis and reviews of any related market activity.
www.calvert.com CALVERT VP S&P MIDCAP 400 INDEX PORTFOLIO ANNUAL REPORT 23
At December 31, 2013, securities valued at $10, or 0% of net assets, were fair valued in good faith under the direction of the Board.
The following is a summary of the inputs used to value the Portfolio’s net assets as of December 31, 2013:
| | | VALUATION INPUTS | |
| INVESTMENTS IN SECURITIES | LEVEL 1 | LEVEL 2 | LEVEL 3 | TOTAL |
| Equity securities** | $242,242,606 | — | $10 | $242,242,616 |
| Exchange traded products | 3,223,440 | — | — | 3,223,440 |
| U.S. government obligations | — | $499,835 | — | 499,835 |
| Other debt obligations | — | 5,108,316 | — | 5,108,316 |
| TOTAL | $245,466,046 | $5,608,151 | $10* | $251,074,207 |
| Other financial instruments*** | $157,217 | — | — | $157,217 |
* Level 3 securities represent 0.0% of net assets.
** For further breakdown of equity securities by industry type, please refer to the Statement of Net Assets.
***Other financial instruments are derivative instruments not reflected in the Statement of Net Assets, such as futures, which are valued at the unrealized appreciation/depreciation on the instrument.
Futures Contracts: The Portfolio may purchase and sell futures contracts, when, in the judgment of the Advisor, such a position acts as a hedge, or to provide equity market exposure to the Portfolio’s uncommitted cash balances. The Portfolio may not enter into futures contracts for the purpose of speculation or leverage. These futures contracts may include, but are not limited to, market index futures contracts. The Portfolio is subject to market risk in the normal course of pursuing its investment objectives and may use futures contracts to hedge against changes in the value of securities. The Portfolio may enter into futures contracts agreeing to buy or sell a financial instrument for a set price at a future date. Initial margin deposits of either cash or securities as required by the broker are made upon entering into the contract. While the contract is open, daily variation margin payments are made to or received from the broker reflecting the daily change in market value of the contract and are recorded for financial reporting purposes as unrealized gains or losses by the Portfolio. When a futures contract is closed, a realized gain or loss is recorded equal to the difference between the opening and closing value of the contract. The risks associated with entering into futures contracts may include the possible illiquidity of the secondary market which would limit the Portfolio’s ability to close out a futures contract prior to the settlement date, an imperfect correlation between the value of the contracts and the underlying financial instruments, or that the counterparty will fail to perform its obligations under the contracts’ terms. Futures contracts are designed by boards of trade which are designated “contracts markets” by the Commodities Futures Trading Commission. Futures contracts trade on the contracts markets in a manner that is similar to the way a stock trades on a stock exchange and the boards of trade, through their clearing corporations, guarantee the futures contracts against default. As a result, there is minimal counterparty credit risk to the Portfolio. During the year, futures contracts were used to hedge the lack of equity market exposure inherent in a cash position. The Portfolio’s futures contracts at year end are presented in the Statement of Net Assets.
During the year, the Portfolio invested in E-Mini S&P 400 Index futures. The volume of outstanding contracts has varied throughout the period with a weighted average of 14 contracts and $504,317 weighted average notional value.
Security Transactions and Investment Income: Security transactions are accounted for on trade date. Realized gains and losses are recorded on an identified cost basis and may include proceeds from litigation. Dividend income is recorded on the ex-dividend date. Distributions received on securities that represent a
24 www.calvert.com CALVERT VP S&P MIDCAP 400 INDEX PORTFOLIO ANNUAL REPORT
return of capital or capital gain are recorded as a reduction of cost of investments and/or as a realized gain. Interest income, which includes amortization of premium and accretion of discount on debt securities, is accrued as earned. Investment income and realized and unrealized gains and losses are allocated to separate classes of shares based upon the relative net assets of each class. Expenses arising in connection with a specific class are charged directly to that class. Expenses common to the classes are allocated to each class in proportion to their relative net assets.
Distributions to Shareholders: Distributions to shareholders are recorded by the Portfolio on ex-dividend date. Dividends from net investment income and distributions from net realized capital gains, if any, are paid at least annually. Distributions are determined in accordance with income tax regulations which may differ from generally accepted accounting principles; accordingly, periodic reclassifications are made within the Portfolio’s capital accounts to reflect income and gains available for distribution under income tax regulations.
Estimates: The preparation of financial statements in conformity with accounting principles generally accepted in the United States requires management to make estimates and assumptions that affect the reported amounts of assets and liabilities and disclosure of contingent assets and liabilities at the date of the financial statements and the reported amounts of income and expenses during the reporting period. Actual results could differ from those estimates.
Federal Income Taxes: No provision for federal income or excise tax is required since the Portfolio intends to continue to qualify as a regulated investment company under the Internal Revenue Code and to distribute substantially all of its taxable earnings.
Management has analyzed the Portfolio’s tax positions taken for all open federal income tax years and has concluded that no provision for federal income tax is required in the Portfolio’s financial statements. A Portfolio’s federal tax return is subject to examination by the Internal Revenue Service for a period of three years.
NOTE B — RELATED PARTY TRANSACTIONS
Calvert Investment Management, Inc. (the “Advisor”) is wholly-owned by Calvert Investments, Inc., which is indirectly wholly-owned by Ameritas Mutual Holding Company. The Advisor provides investment advisory services and pays the salaries and fees of officers and Directors of the Fund who are employees of the Advisor or its affiliates. For its services, the Advisor receives an annual fee, payable monthly, of .30% of the Portfolio’s average daily net assets. Under the terms of the agreement, $62,544 was payable at year end. In addition, $37,397 was payable at year end for operating expenses paid by the Advisor during December 2013.
The Advisor has contractually agreed to limit net annual portfolio operating expenses through April 30, 2014. The contractual expense caps are .81% for Class F and .57% for Class I, respectively. For the purpose of this expense limit, operating expenses do not include interest expense, brokerage commissions, taxes and extraordinary expenses. This expense limitation does not limit acquired fund fees and expenses, if any. Under the terms of the agreement, $269 was receivable at year end.
The Advisor further voluntarily reimbursed the Porfolio for expenses of $457 for the year ended December 31, 2013.
Calvert Investment Administrative Services, Inc., an affiliate of the Advisor, provides administrative services to the Portfolio for an annual fee, payable monthly, of .10% of the average daily net assets of the Portfolio. Under the terms of the agreement, $20,849 was payable at year end.
Calvert Investment Distributors, Inc. (“CID”), an affiliate of the Advisor, is the distributor and principal underwriter for the Portfolio. Pursuant to Rule 12b-1 under the Investment Company Act of 1940, the Portfolio has adopted a Distribution plan that permits the Portfolio to pay certain expenses associated with the distribution and servicing of its Class F shares. The expenses paid may not exceed 0.20% annually of the average daily net assets of Class F. Under the terms of the agreement, $996 was payable at year end.
www.calvert.com CALVERT VP S&P MIDCAP 400 INDEX PORTFOLIO ANNUAL REPORT 25
Calvert Investment Services, Inc. (“CIS”), an affiliate of the Advisor, acts as shareholder servicing agent for the Portfolio. For its services, CIS received a fee of $18,554 for the year ended December 31, 2013. Under the terms of the agreement, $1,435 was payable at year end. Boston Financial Data Services, Inc. is the transfer and dividend disbursing agent.
Each Director of the Fund who is not an employee of the Advisor or its affiliates receives a fee of $1,500 for each Board and Committee meeting attended plus an annual fee of $40,000. Committee chairs receive an additional $5,000 annual retainer. Directors’ fees are allocated to each of the portfolios served.
NOTE C — INVESTMENT ACTIVITY AND TAX INFORMATION
During the year, the cost of purchases and proceeds from sales of investments, other than short-term securities, were $29,069,087 and $26,225,903, respectively.
| Capital Loss Carryforwards | |
| Expiration Date: | |
| 31-Dec-15 | ($4,406,553) |
| 31-Dec-16 | (3,305,111) |
Under the Regulated Investment Company Modernization Act of 2010, capital losses incurred in taxable years beginning after December 22, 2010 can be carried forward to offset future capital gains for an unlimited period. These losses are required to be utilized prior to the losses incurred in pre-enactment taxable years and will retain their character as either long-term or short-term. Capital losses incurred in pre-enactment taxable years can be utilized until expiration. The Portfolio’s use of net capital losses acquired from reorganizations may be limited under certain tax provisions.
The tax character of dividends and distributions paid during the years ended December 31, 2013 and December 31, 2012 was as follows:
| Distributions paid from: | 2013 | 2012 |
| Ordinary income | $2,054,009 | $1,769,798 |
| Long-term capital gain | 7,270,460 | 4,643,689 |
| Total | $9,324,469 | $6,413,487 |
As of December 31, 2013, the tax basis components of distributable earnings/(accumulated losses) and the federal tax cost were as follows:
| Unrealized appreciation | $84,759,367 |
| Unrealized (depreciation) | (4,591,832) |
| Net unrealized appreciation/(depreciation) | $80,167,535 |
| Undistributed ordinary income | $470,971 |
| Undistributed long-term capital gain | $5,714,316 |
| Capital loss carryforward | ($7,711,664) |
| Federal income tax cost of investments | $170,906,672 |
The differences between the components of distributable earnings on a tax basis and the amounts reflected in the statement of net assets are primarily due to temporary book-tax differences that will reverse in a subsequent period. These differences are due to wash sales, real estate investment trusts, Section 1256 contracts, and capital loss limitations under Internal Revenue Code Section 382.
26 www.calvert.com CALVERT VP S&P MIDCAP 400 INDEX PORTFOLIO ANNUAL REPORT
Reclassifications, as shown in the table below, have been made to the Portfolio’s components of net assets to reflect income and gains available for distribution (or available capital loss carryovers, as applicable) under income tax law and regulations. These reclassifications are due to permanent book-tax differences and have no impact on net assets. The primary permanent differences causing such reclassifications for the Portfolio are due to real estate investment trusts.
| Undistributed net investment income | ($237,680) |
| Accumulated net realized gain (loss) | 237,680 |
NOTE D — LINE OF CREDIT
A financing agreement is in place with the Calvert Funds and State Street Corporation (“SSC”). Under the agreement, SSC provides an unsecured line of credit facility, in the aggregate amount of $50 million ($25 million committed and $25 million uncommitted), accessible by the Funds for temporary or emergency purposes only. Borrowings under the committed facility bear interest at the higher of the London Interbank Offered Rate (LIBOR) or the overnight Federal Funds Rate plus 1.25% per annum. A commitment fee of .11% per annum is incurred on the unused portion of the committed facility, which is allocated to all participating funds. The Portfolio had no borrowings under the agreement during the year ended December 31, 2013.
NOTE E — SUBSEQUENT EVENTS
In preparing the financial statements as of December 31, 2013, no subsequent events or transactions occurred that would have required recognition or disclosure in these financial statements.
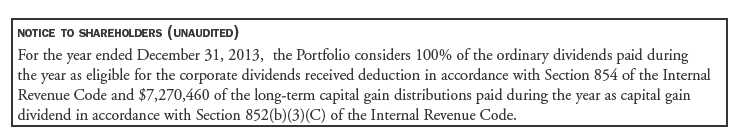
www.calvert.com CALVERT VP S&P MIDCAP 400 INDEX PORTFOLIO ANNUAL REPORT 27
| | | |
| FINANCIAL HIGHLIGHTS |
| |
| | YEARS ENDED |
| | DECEMBER
31, | DECEMBER
31, | DECEMBER
31, |
| CLASS I SHARES | 2013 (z) | 2012 (z) | 2011 (z) |
| Net asset value, beginning | $75.22 | $66.38 | $68.39 |
| Income from investment operations: | | | |
| Net investment income | .88 | .86 | .59 |
| Net realized and unrealized gain (loss) | 23.70 | 10.58 | (2.12) |
| Total from investment operations | 24.58 | 11.44 | (1.53) |
| Distributions from: | | | |
| Net investment income | (.82) | (.72) | (.48) |
| Net realized gain | (2.88) | (1.88) | — |
| Total distributions | (3.70) | (2.60) | (.48) |
| Total increase (decrease) in net asset value | 20.88 | 8.84 | (2.01) |
| Net asset value, ending | $96.10 | $75.22 | $66.38 |
| |
| Total return* | 32.82% | 17.31% | (2.24%) |
| Ratios to average net assets:A | | | |
| Net investment income | 1.00% | 1.17% | .85% |
| Total expenses | .52% | .53% | .56% |
| Expenses before offsets | .52% | .53% | .55% |
| Net expenses | .52% | .53% | .55% |
| Portfolio turnover | 12% | 10% | 16% |
| Net assets, ending (in thousands) | $244,903 | $188,872 | $178,563 |
| |
| | | YEARS ENDED |
| | | DECEMBER
31, | DECEMBER
31, |
| CLASS I SHARES | | 2010 (z) | 2009 |
| Net asset value, beginning | | $54.66 | $40.39 |
| Income from investment operations: | | | |
| Net investment income | | .59 | .60 |
| Net realized and unrealized gain (loss) | | 13.61 | 14.10 |
| Total from investment operations | | 14.20 | 14.70 |
| Distributions from: | | | |
| Net investment income | | (.47) | (.43) |
| Net realized gain | | — | — |
| Total distributions | | (.47) | (.43) |
| Total increase (decrease) in net asset value | | 13.73 | 14.27 |
| Net asset value, ending | | $68.39 | $54.66 |
| |
| Total return* | | 25.98% | 36.38% |
| Ratios to average net assets: A | | | |
| Net investment income | | 1.00% | 1.25% |
| Total expenses | | .59% | .57% |
| Expenses before offsets | | .55% | .55% |
| Net expenses | | .55% | .55% |
| Portfolio turnover | | 17% | 16% |
| Net assets, ending (in thousands) | | $177,819 | $103,825 |
See notes to financial highlights.
28 www.calvert.com CALVERT VP S&P MIDCAP 400 INDEX PORTFOLIO ANNUAL REPORT
| | | |
| FINANCIAL HIGHLIGHTS |
| |
| | YEARS ENDED |
| | DECEMBER
31, | DECEMBER
31, | DECEMBER
31, |
| CLASS F SHARES | 2013 (z) | 2012 (z) | 2011 (z) |
| Net asset value, beginning | $76.04 | $67.03 | $69.00 |
| Income from investment operations: | | | |
| Net investment income | .65 | .71 | .44 |
| Net realized and unrealized gain (loss) | 23.94 | 10.64 | (2.14) |
| Total from investment operations | 24.59 | 11.35 | (1.70) |
| Distributions from: | | | |
| Net investment income | (.43) | (.46) | (.27) |
| Net realized gain | (2.88) | (1.88) | — |
| Total distributions | (3.31) | (2.34) | (.27) |
| Total increase (decrease) in net asset value | 21.28 | 9.01 | (1.97) |
| Net asset value, ending | $97.32 | $76.04 | $67.03 |
| |
| Total return* | 32.47% | 16.99% | (2.47%) |
| Ratios to average net assets: A | | | |
| Net investment income | .73% | .95% | .63% |
| Total expenses | .90% | .86% | .93% |
| Expenses before offsets | .81% | .80% | .79% |
| Net expenses | .81% | .80% | .79% |
| Portfolio turnover | 12% | 10% | 16% |
| Net assets, ending (in thousands) | $6,148 | $2,677 | $1,698 |
| |
| | | YEARS ENDED |
| | | DECEMBER
31, | DECEMBER
31, |
| CLASS F SHARES | | 2010 (z) | 2009 |
| Net asset value, beginning | | $55.10 | $40.65 |
| Income from investment operations: | | | |
| Net investment income | | .46 | .43 |
| Net realized and unrealized gain (loss) | | 13.70 | 14.25 |
| Total from investment operations | | 14.16 | 14.68 |
| Distributions from: | | | |
| Net investment income | | (.26) | (.23) |
| Net realized gain | | — | — |
| Total distributions | | (.26) | (.23) |
| Total increase (decrease) in net asset value | | 13.90 | 14.45 |
| Net asset value, ending | | $69.00 | $55.10 |
| |
| Total return* | | 25.70% | 36.12% |
| Ratios to average net assets:A | | | |
| Net investment income | | .77% | .98% |
| Total expenses | | 1.02% | 1.90% |
| Expenses before offsets | | .79% | .79% |
| Net expenses | | .79% | .79% |
| Portfolio turnover | | 17% | 16% |
| Net assets, ending (in thousands) | | $1,183 | $523 |
See notes to financial highlights.
www.calvert.com CALVERT VP S&P MIDCAP 400 INDEX PORTFOLIO ANNUAL REPORT 29
A Total expenses do not reflect amounts reimbursed and/or waived by the Advisor or reductions from expense offset arrangements. Expenses before offsets reflect expenses after reimbursement and/or waiver by the Advisor but prior to reductions from expense offset arrangements. Net expenses are net of all reductions and represent the net expenses paid by the portfolio.
(z) Per share figures calculated using the Average Shares Method.
* Total return is not annualized for periods of less than one year and does not reflect charges and expenses of the variable annuity or variable universal life contract.
See notes to financial statements.
30 www.calvert.com CALVERT VP S&P MIDCAP 400 INDEX PORTFOLIO ANNUAL REPORT
EXPLANATION OF FINANCIAL TABLES
SCHEDULE OF INVESTMENTS
The Schedule of Investments is a snapshot of all securities held in the fund at their market value, on the last day of the reporting period. Securities are listed by asset type (e.g., common stock, corporate bonds, U.S. government obligations) and may be further broken down into sub-groups and by industry classification.
STATEMENT OF ASSETS AND LIABILITIES
The Statement of Assets and Liabilities is often referred to as the fund’s balance sheet. It lists the value of what the fund owns, is due and owes on the last day of the reporting period. The fund’s assets include the market value of securities owned, cash, receivables for securities sold and shareholder subscriptions, and receivables for dividends and interest payments that have been earned, but not yet received. The fund’s liabilities typically include payables for securities purchased and shareholder redemptions, and expenses owed but not yet paid. The statement also reports the fund’s net asset value (NAV) per share on the last day of the reporting period. The NAV is calculated by dividing the fund’s net assets (assets minus liabilities) by the number of shares outstanding. This statement is accompanied by a Schedule of Investments. Alternatively, if certain conditions are met, a Statement of Net Assets may be presented in lieu of this statement and the Schedule of Investments.
STATEMENT OF NET ASSETS
The Statement of Net Assets provides a detailed list of the fund’s holdings, including each security’s market value on the last day of the reporting period. The Statement of Net Assets includes a Schedule of Investments. Other assets are added and other liabilities subtracted from the investments total to calculate the fund’s net assets. Finally, net assets are divided by the outstanding shares of the fund to arrive at its share price, or Net Asset Value (NAV) per share.
At the end of the Statement of Net Assets is a table displaying the composition of the fund’s net assets. Paid in Capital is the money invested by shareholders and represents the bulk of net assets. Undistributed Net Investment Income and Accumulated Net Realized Gains usually approximate the amounts the fund had available to distribute to shareholders as of the statement date. Accumulated Realized Losses will appear as negative balances. Unrealized Appreciation (Depreciation) is the difference between the market value of the fund’s investments and their cost, and reflects the gains (losses) that would be realized if the fund were to sell all of its investments at their statement-date values.
STATEMENT OF OPERATIONS
The Statement of Operations summarizes the fund’s investment income earned and expenses incurred in operating the fund. Investment income includes dividends earned from stocks and interest earned from interest-bearing securities in the fund. Expenses incurred in operating the fund include the advisory fee paid to the investment advisor, administrative services fees, distribution plan expenses (if applicable), transfer agent fees, shareholder servicing expenses, custodial, legal, and audit fees, and the printing and postage expenses related to shareholder reports. Expense offsets (fees paid indirectly) are also shown. Credits earned from offset arrangements are used to reduce the fund’s expenses. This statement also shows net gains (losses) realized on the sale of investments and the increase or decrease in the unrealized appreciation (depreciation) on investments held during the period.
STATEMENT OF CHANGES IN NET ASSETS
The Statement of Changes in Net Assets shows how the fund’s total net assets changed during the two most recent reporting periods. Changes in the fund’s net assets are attributable to investment operations, distributions and capital share transactions.
The Operations section of the report summarizes information detailed in the Statement of Operations. The Distribution section shows the dividend and capital gain distributions made to shareholders. The amounts
www.calvert.com CALVERT VP S&P MIDCAP 400 INDEX PORTFOLIO ANNUAL REPORT (UNAUDITED) 31
shown as distributions in this section may not match the net investment income and realized gains amounts shown in the Operations section because distributions are determined on a tax basis and certain investments or transactions may be treated differently for financial statement and tax purposes. The Capital Share Transactions section shows the amount shareholders invested in the fund, either by purchasing shares or by reinvesting distributions, and the amounts redeemed. The corresponding numbers of shares issued, reinvested and redeemed are shown at the end of the report.
FINANCIAL HIGHLIGHTS
The Financial Highlights table provides a per-share breakdown by class of the components that affect the fund’s net asset value for current and past reporting periods. The table provides total return, total distributions, expense ratios, portfolio turnover and net assets for the applicable period. Total return is a measure of a fund’s performance that encompasses all elements of return: dividends, capital gain distributions and changes in net asset value. Total return is the change in value of an investment over a given period, assuming reinvestment of any dividends and capital gain distributions, expressed as a percentage of the initial investment. Total distributions include distributions from net investment income and net realized gains. Long-term gains are earned on securities held in the fund more than one year. Short-term gains, on the sale of securities held less than one year, are treated as ordinary dividend income for tax purposes. The expense ratio is a fund’s cost of doing business, expressed as a percentage of net assets. These expenses directly reduce returns to shareholders. Portfolio turnover measures the trading activity in a fund’s investment portfolio – how often securities are bought and sold by a fund. Portfolio turnover is affected by market conditions, changes in the size of the fund, the nature of the fund’s investments and the investment style of the portfolio manager.
PROXY VOTING
The Proxy Voting Guidelines that the Portfolio uses to determine how to vote proxies relating to portfolio securities is provided as an Appendix to the Fund’s Statement of Additional Information. The Statement of Additional Information can be obtained free of charge by calling the Fund at 1-800-368-2745, by visiting the Calvert website at www.calvert.com or by visiting the SEC’s website at www.sec.gov.
Information regarding how the Fund voted proxies relating to portfolio securities during the most recent 12-month period ended June 30 is available by calling the Fund, by visiting the Calvert website at www. calvert.com or visiting the SEC’s website at www.sec.gov.
AVAILABILITY OF QUARTERLY PORTFOLIO HOLDINGS
The Fund files its complete schedule of portfolio holdings with the SEC for the first and third quarters of each fiscal year on Form N-Q. The Fund’s Form N-Q is available on the SEC’s website at www.sec.gov. The Fund’s Form N-Q may be reviewed and copied at the SEC’s Public Reference Room in Washington, DC; information on the operation of the Public Reference Room may be obtained by calling 1-800-SEC-0330.
BASIS FOR BOARD’S APPROVAL OF INVESTMENT ADVISORY CONTRACTS
At a meeting held on December 11, 2013, the Board of Directors, and by a separate vote, the disinterested Directors, approved the continuance of the Investment Advisory Agreement between the Portfolio and the Advisor and the Investment Subadvisory Agreement between the Advisor and the Subadvisor with respect to the Portfolio.
In evaluating the Investment Advisory Agreement, the Board considered a variety of information relating to the Portfolio and the Advisor. The disinterested Directors reviewed a report prepared by the Advisor regarding various services provided to the Portfolio by the Advisor and its affiliates. Such report included, among other
32 www.calvert.com CALVERT VP S&P MIDCAP 400 INDEX PORTFOLIO ANNUAL REPORT (UNAUDITED)
data, information regarding the Advisor’s personnel and the Advisor’s revenue and cost of providing services to the Portfolio, and a separate report prepared by an independent third party, which provided a statistical analysis comparing the Portfolio’s investment performance, expenses, and fees to comparable mutual funds.
The disinterested Directors were separately represented by independent legal counsel with respect to their consideration of the reapproval of the Investment Advisory Agreement and the Investment Subadvisory Agreement. Prior to voting, the disinterested Directors reviewed the proposed continuance of the Investment Advisory Agreement and Investment Subadvisory Agreement with management and also met in private sessions with their counsel at which no representatives of management were present.
In the course of its deliberations regarding the Investment Advisory Agreement, the Board considered the following factors, among others: the nature, extent and quality of the services provided by the Advisor, including the personnel providing such services; the Advisor’s financial condition; the level and method of computing the Portfolio’s advisory fee; comparative performance, fee and expense information for the Portfolio; the profitability of the Calvert Family of Funds to the Advisor and its affiliates; the allocation of the Portfolio’s brokerage, including the Advisor’s process for monitoring “best execution”; the direct and indirect benefits, if any, derived by the Advisor and its affiliates from their relationship with the Portfolio; the effect of the Portfolio’s growth and size on the Portfolio’s performance and expenses; the Advisor’s compliance programs and policies; the Advisor’s performance of substantially similar duties for other funds; and any possible conflicts of interest.
In considering the nature, extent and quality of the services provided by the Advisor under the Investment Advisory Agreement, the Board reviewed information provided by the Advisor relating to its operations and personnel, including, among other information, biographical information on the Advisor’s supervisory and professional staff and descriptions of its organizational and management structure. The Board also took into account similar information provided periodically throughout the previous year by the Advisor, as well as the Board’s familiarity with the Advisor’s management through Board of Directors’ meetings, discussions and other reports. The Board considered the Advisor’s current level of staffing and overall resources. The Board also noted that it reviewed on a quarterly basis information regarding the Advisor’s compliance with applicable policies and procedures, including those related to personal investing. The Advisor’s administrative capabilities, including its ability to supervise the other service providers for the Portfolio, were also considered. The Board discussed the Advisor’s effectiveness in monitoring the performance of the Subadvisor and its timeliness in responding to performance issues. The Board observed that the scope of services provided by the Advisor generally had expanded over time as a result of regulatory, market and other changes. The Board took into consideration, among other factors, the effectiveness of the Portfolio’s and Advisor’s processes, policies and procedures and the Advisor’s personnel. The Board also took into account, among other items, periodic reports received from the Advisor over the past year concerning the Advisor’s ongoing review and enhancement of certain processes, policies and procedures of the Portfolio and the Advisor. The Board concluded that it was satisfied with the nature, extent and quality of services provided to the Portfolio by the Advisor under the Investment Advisory Agreement.
In considering the Portfolio’s performance, the Board noted that it reviewed on a quarterly basis detailed information about the Portfolio’s performance results, portfolio composition and investment strategies. In addition, the Board took into account overall financial market conditions. The Board also reviewed various comparative data provided to it in connection with its consideration of the renewal of the Investment Advisory Agreement, including, among other information, a comparison of the Portfolio’s total return with its Lipper index and with that of other mutual funds deemed to be in its peer group by an independent third party in its report. This comparison indicated that the Portfolio performed below the median of its peer group for the one-, three- and five-year periods ended June 30, 2013. The data also indicated that the Portfolio under-performed its Lipper index for the one-year period and outperformed its Lipper index for the three- and five-year periods ended June 30, 2013. The Board took into account management’s discussion of the Portfolio’s performance, including the impact of differing fees and expenses among the funds in the peer group on the
www.calvert.com CALVERT VP S&P MIDCAP 400 INDEX PORTFOLIO ANNUAL REPORT (UNAUDITED) 33
Portfolio’s relative performance. Based upon its review, the Board concluded that the Portfolio’s performance was satisfactory relative to the performance of passively-managed funds that track the same benchmark index as does the Portfolio.
In considering the Portfolio’s fees and expenses, the Board compared the Portfolio’s fees and total expense ratio with various comparative data for the funds in its peer group. Among other findings, the data indicated that the Portfolio’s advisory fee (after taking into account expense reimbursements) was at the median of its peer group and that total expenses (net of expense reimbursements) were above the median of its peer group. The Board noted that the allocation of advisory and administrative fees may vary among the Portfolio’s peer group. The Board noted that the Advisor had reimbursed a portion of the Portfolio’s expenses. The Board also took into account the Advisor’s current undertaking to maintain expense limitations for the Portfolio. The Board noted that the Advisor paid the Subadvisor’s subadvisory fee under the Investment Subadvisory Agreement with respect to the Portfolio. The Board also took into account management’s discussion of the Portfolio’s expenses and certain factors that affected the level of such expenses, including the current size of the Portfolio. Based upon its review, the Board determined that the advisory fee was reasonable in view of the quality of services received by the Portfolio from the Advisor and the other factors considered.
The Board reviewed the Advisor’s profitability on a portfolio-by-portfolio basis. In reviewing the overall profitability of the advisory fee to the Portfolio’s Advisor, the Board also considered the fact that affiliates of the Advisor provided shareholder servicing, administrative and distribution services to the Portfolio for which they received compensation. The information considered by the Board included Calvert’s operating profit margin information both before and after tax expenses with respect to the services that the Advisor and its affiliates provided to the Calvert Family of Funds complex. The Board reviewed the profitability of the Advisor’s relationship with the Portfolio in terms of the total amount of annual advisory fees it received with respect to the Portfolio and whether the Advisor had the financial wherewithal to continue to provide services to the Portfolio. The Board also considered that the Advisor derived benefits to its reputation and other indirect benefits from its relationship with the Portfolio. In addition, the Board took into account that affiliates of the Advisor may benefit from certain indirect tax benefits relating to dividend received deductions and foreign tax credits. The Board also noted that the Advisor paid the subadvisory fee to the Subadvisor, an affiliate of the Advisor, and that the Advisor had reimbursed a portion of the expenses of the Portfolio. Based upon its review, the Board concluded that the Advisor’s and its affiliates’ level of profitability from their relationship with the Portfolio was reasonable.
The Board considered the effect of the Portfolio’s current size and potential growth on its performance and fees. Although the Portfolio’s advisory fee did not contain breakpoints that would reduce the advisory fee rate on assets above specified asset levels, the Board noted that if the Portfolio’s assets increased over time, the Portfolio might realize other economies of scale if assets increased proportionally more than certain other expenses. The Board also noted that given the Portfolio’s current level of assets, the Portfolio would be unlikely to recognize economies of scale by implementing a breakpoint in the advisory fee at this time.
In reapproving the Investment Advisory Agreement, the Board, including the disinterested Directors, did not identify any single factor as controlling, and each Director may have attributed different weight to various factors.
In evaluating the Investment Subadvisory Agreement, the disinterested Directors reviewed information provided by the Subadvisor relating to its operations, personnel, investment philosophy, strategies and techniques. Among other information, the Subadvisor provided biographical information on portfolio management and other professional staff, performance information for itself, and descriptions of its investment philosophies, strategies and techniques, organizational and management structures and brokerage policies and practices.
The Board reapproved the Investment Subadvisory Agreement between the Subadvisor and the Advisor based on a number of factors relating to the Subadvisor’s ability to perform under the Investment Subadvisory
34 www.calvert.com CALVERT VP S&P MIDCAP 400 INDEX PORTFOLIO ANNUAL REPORT (UNAUDITED)
Agreement. In the course of its deliberations, the Board evaluated, among other factors: the nature, extent and the quality of the services to be provided by the Subadvisor; the Subadvisor’s management style and long-term performance record; the Portfolio’s performance record and the Subadvisor’s performance in employing its investment strategies; the Subadvisor’s current level of staffing and its overall resources; the qualifications and experience of the Subadvisor’s personnel; the Subadvisor’s financial condition with respect to its ability to perform the services required under the Investment Subadvisory Agreement; the Subadvisor’s risk management processes; the Subadvisor’s compliance systems, including those related to personal investing; and any disciplinary history. Based upon its review, the Board concluded that it was satisfied with the nature, extent and quality of services provided to the Portfolio by the Subadvisor under the Investment Subadvisory Agreement.
As noted above, the Board considered, among other information, the Portfolio’s performance during the one-, three and five-year periods ended June 30, 2013 as compared to the Portfolio’s peer group and noted that it reviewed on a quarterly basis detailed information about the Portfolio’s performance results, portfolio composition and investment strategies. The Board noted the Advisor’s expertise and resources in monitoring the performance, investment style and risk adjusted performance of the Subadvisor.
In considering the cost of services to be provided by the Subadvisor and the profitability to the Subadvisor of its relationship with the Portfolio, the Board noted that the Advisor and Subadvisor were affiliated and the subadvisory fee under the Investment Subadvisory Agreement was paid by the Advisor out of the advisory fee that the Advisor received under the Investment Advisory Agreement. Based upon its review, the Board determined that the subadvisory fee was reasonable in view of the quality of services received by the Portfolio from the Subadvisor and the other factors considered. Because the Advisor would pay the Subadvisor’s subadvisory fee, the cost of services to be provided by the Subadvisor and the level of profitability to the Subadvisor from its relationship with the Portfolio were not material factors in the Board’s deliberations. For similar reasons, the Board did not consider the potential economies of scale in the Subadvisor’s management of the Portfolio to be a material factor in its consideration.
In reapproving the Investment Subadvisory Agreement, the Board, including the disinterested Directors, did not identify any single factor as controlling, and each Director may have attributed different weight to various factors.
CONCLUSIONS
The Board reached the following conclusions regarding the Investment Advisory Agreement and the Investment Subadvisory Agreement, among others: (a) the Advisor has demonstrated that it possesses the capability and resources to perform the duties required of it under the Investment Advisory Agreement; (b) the Subadvisor is qualified to manage the Portfolio’s assets in accordance with the Portfolio’s investment objective and policies; (c) the Advisor and Subadvisor maintain appropriate compliance programs; (d) the Subadvisor is likely to execute its investment strategies consistently over time; (e) the performance of the Portfolio is satisfactory relative to the performance of passively-managed funds that track the same benchmark index as does the Portfolio; and (f) the Portfolio’s advisory and subadvisory fees are reasonable in view of the quality of services received by the Portfolio from the Advisor and Subadvisor and the other factors considered. Based on its conclusions, the Board determined that reapproval of the Investment Advisory Agreement and the Investment Subadvisory Agreement would be in the best interests of the Portfolio and its shareholders.
www.calvert.com CALVERT VP S&P MIDCAP 400 INDEX PORTFOLIO ANNUAL REPORT (UNAUDITED) 35
This report is intended to provide fund information to shareholders. It is not authorized for distribution to prospective investors unless preceded or accompanied by a prospectus.
Note: The information on our website is not incorporated by reference into this report; our website address is included as an inactive textual reference only.
Investors should carefully consider the investment objectives, risks, charges and expenses of the Calvert Funds. This and other important information is contained in the fund’s summary prospectus and prospectus, which can be obtained from your financial professional and should be read carefully before investing. You may also call Calvert at 800/368-2745 or visit www. calvert.com.
36 www.calvert.com CALVERT VP S&P MIDCAP 400 INDEX PORTFOLIO ANNUAL REPORT (UNAUDITED)

www.calvert.com CALVERT VP S&P MIDCAP 400 INDEX PORTFOLIO ANNUAL REPORT (UNAUDITED) 37
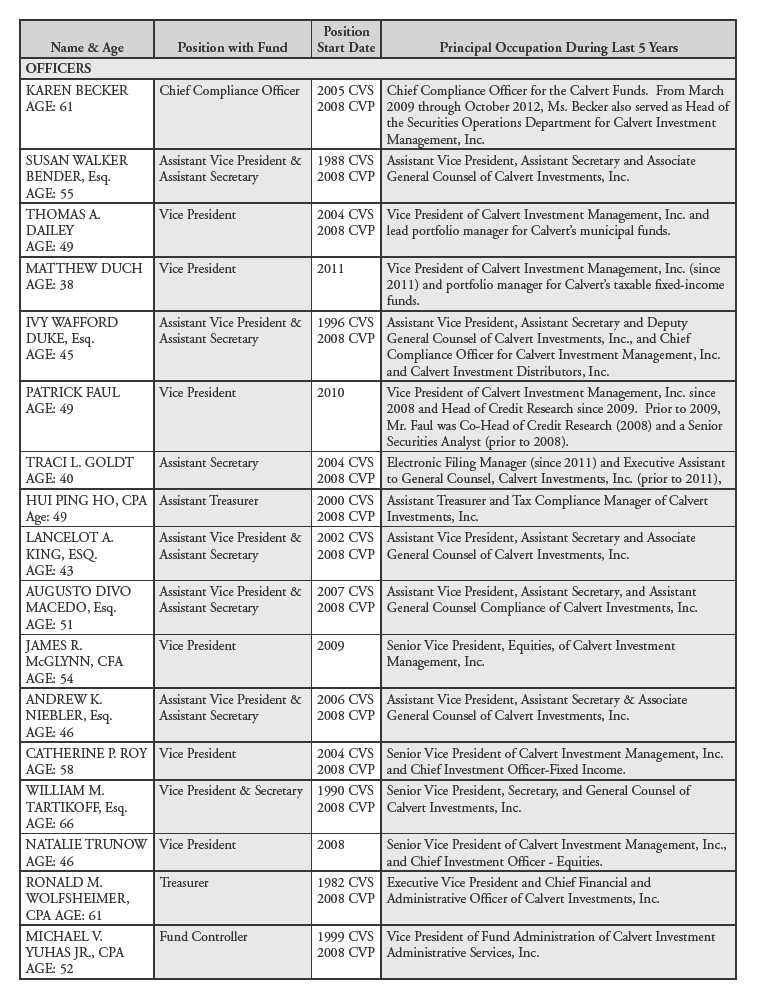
38 www.calvert.com CALVERT VP S&P MIDCAP 400 INDEX PORTFOLIO ANNUAL REPORT (UNAUDITED)
CALVERT VP NASDAQ 100 INDEX PORTFOLIO
Portfolio within Calvert Variable Products, Inc.
Managed by Ameritas Investment Partners, Inc., Subadvisor
INVESTMENT PERFORMANCE
For the year ended December 31, 2013, the Calvert VP Nasdaq 100 Index Portfolio returned 36.05% compared with 36.92% for the Nasdaq 100 Index. The slight under-performance relative to the Index was largely attributable to fees and operating expenses, which the Index does not have.
INVESTMENT CLIMATE
The equity markets earned strong positive returns in 2013 as the economic recovery in the United States continued to take hold. Within the domestic universe, small-cap stocks provided the highest return in 2013, up 38.82% as measured by the Russell 2000 Index. Mid-cap and large-cap stocks provided slightly lower returns, with the S&P Midcap 400 Index and S&P 500 Index returning 33.50% and 32.39%, respectively. Domestic equity markets generally outperformed international equity markets, with emerging markets lagging the most.
The Federal Reserve (Fed) continued its accommodative monetary policy in 2013, which provided the fuel to power U.S. stocks higher. Domestic GDP growth improved steadily throughout the year, and inflation remained under control. The housing market continued its recovery—the resulting increases in homeowner equity and consumer confidence and decreases in default rates should benefit the banking industry. Lastly, the combination of increased home values and the rise in the stock market had a significant positive impact on household net worth.
PORTFOLIO STRATEGY
As an index fund, the Portfolio seeks, as closely as possible, to replicate the holdings and match the performance of the Nasdaq 100 Index. In pursuit of this objective, the Portfolio employs a passive management approach to replicate the Index.
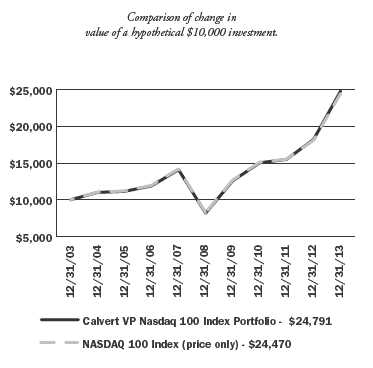
| | AVERAGE ANNUAL TOTAL RETURN |
| | (period ended 12.31.13) |
| One year | 36.05% |
| Five year | 24.80% |
| Ten year | 9.50% |
The performance data shown represents past performance, does not guarantee future results and assumes reinvestment of all dividends and distributions. All performance data reflects fee waivers and/or expense limitations, if any are in effect; in their absence performance would be lower. See Note B in Notes to Financial Statements. The investment return and principal value of an investment will fluctuate so that an investor’s shares, when redeemed, may be worth more or less than their original cost. Current performance may be lower or higher than the performance data quoted.
Visit www.calvert.com/institutional-VP-performance.html for current performance data. The gross expense ratio from the current prospectus for the Portfolio is 0.63%. This number may vary from the expense ratio shown elsewhere in this report because it is based on a different time period and, if applicable, does not include fee or expense waivers. The performance data and expense ratio reflect deduction of Portfolio operating expenses, but do not reflect charges and expenses imposed under the variable annuity or life insurance contract.
4 www.calvert.com CALVERT VP NASDAQ 100 INDEX PORTFOLIO ANNUAL REPORT
| | % OF TOTAL |
| ECONOMIC SECTORS | INVESTMENTS |
| |
| Consumer Discretionary | 20.3% |
| Consumer Staples | 4.6% |
| Exchange Traded Products | 1.1% |
| Government | 0.2% |
| Health Care | 13.1% |
| Industrials | 1.8% |
| Information Technology | 55.1% |
| Materials | 0.3% |
| Short-Term Investments | 1.8% |
| Telecommunication Services | 1.7% |
| Total | 100% |
At year-end, the Index’s largest exposures were to the Information Technology and Consumer Discretionary sectors, at 55.1% and 20.3%, respectively. It also had a significant allocation to Health Care, at 13.1%. The smallest exposure was to Materials, at less than 1% of the Index.
The top-performing sectors in the Index were Health Care, up 66.9%, and Telecommunication, up 48.4%. The weakest-performing sectors were Industrials, up 17.7%, and Materials, up 29.1%.
During 2013, the Portfolio continued to meet its investment objective of closely tracking the total return of the Index. Market fluctuation and cash flows may cause the Portfolio to hold a slightly different weighting than the Index. Since the Nasdaq 100 Index is not an actual mutual fund, it is not possible to invest directly in it. Unlike the Index, the Portfolio incurs operating expenses.
OUTLOOK
Entering 2014, we believe the outlook for equities is mildly positive. The economy continues to recover and corporate earnings remain strong, although valuations have become more stretched and the market is pricing in a fairly optimistic outlook already. The unemployment rate is declining and the economy will not suffer the same fiscal drag that it did last year from the sequester.
The Fed has begun the tapering process. And while the tone in Washington has improved slightly, the government’s inability to function properly does remain a concern. In addition, economic growth in Europe remains sluggish and China’s growth appears to have slowed.
That said, the Fed anticipates keeping short-term rates low for an extended period of time after it ends its asset-purchasing program. Although it is unlikely that 2014 will provide returns similar to 2013, Fed policies should provide a positive backdrop for equities in the year ahead.
January 2014
www.calvert.com CALVERT VP NASDAQ 100 INDEX PORTFOLIO ANNUAL REPORT 5
SHAREHOLDER EXPENSE EXAMPLE
As a shareholder of the Fund, you incur two types of costs: (1) transaction costs, and (2) ongoing costs, including management fees and other Fund expenses. This Example is intended to help you understand your ongoing costs (in dollars) of investing in the Fund and to compare these costs with the ongoing costs of investing in other mutual funds.
This Example is based on an investment of $1,000 invested at the beginning of the period and held for the entire period (July 1, 2013 to December 31, 2013).
Note: Expenses do not reflect charges and expenses of the variable annuity or variable universal life contract.
Actual Expenses
The first line of the table below provides information about actual account values and actual expenses. You may use the information in this line, together with the amount you invested, to estimate the expenses that you paid over the period. Simply divide your account value by $1,000 (for example, an $8,600 account value divided by $1,000 = 8.6), then multiply the result by the number in the first line under the heading entitled “Expenses Paid During Period” to estimate the expenses you paid on your account during this period.
Hypothetical Example for Comparison Purposes
The second line of the table below provides information about hypothetical account values and hypothetical expenses based on the Fund’s actual expense ratio and an assumed rate of return of 5% per year before expenses, which is not the Fund’s actual return. The hypothetical account values and expenses may not be used to estimate the actual ending account balance or expenses you paid for the period. You may use this information to compare the ongoing costs of investing in the Fund and other funds. To do so, compare the 5% hypothetical example with the 5% hypothetical examples that appear in the shareholder reports of the other funds.
Please note that the expenses shown in the table are meant to highlight your ongoing costs only and do not reflect any transactional costs. Therefore, the second line of the table is useful in comparing ongoing costs only, and will not help you determine the relative total costs of owning different funds. In addition, if these transactional costs were included, your costs would have been higher.
| | BEGINNING | ENDING | EXPENSES PAID |
| | ACCOUNT VALUE | ACCOUNT VALUE | DURING PERIOD* |
| | 7/1/13 | 12/31/13 | 7/1/13 - 12/31/13 |
| |
| Actual | $1,000.00 | $1,240.54 | $3.35 |
| |
Hypothetical
(5% return per year before expenses) | $1,000.00 | $1,022.22 | $3.02 |
* Expenses are equal to the Fund’s annualized expense ratio of 0.59%, multiplied by the average account value over the period, multiplied by 184/365 (to reflect the one-half year period).
6 www.calvert.com CALVERT VP NASDAQ 100 INDEX PORTFOLIO ANNUAL REPORT
REPORT OF INDEPENDENT REGISTERED PUBLIC ACCOUNTING FIRM
The Board of Directors of Calvert Variable Products, Inc. and Shareholders of Calvert VP Nasdaq 100 Index Portfolio: We have audited the accompanying statement of net assets of the Calvert VP Nasdaq 100 Index Portfolio (the “Portfolio”), a series of Calvert Variable Products, Inc., as of December 31, 2013, and the related statement of operations for the year then ended, the statements of changes in net assets for each of the years in the two-year period then ended, and the financial highlights for each of the years in the five-year period then ended. These financial statements and financial highlights are the responsibility of the Portfolio’s management. Our responsibility is to express an opinion on these financial statements and financial highlights based on our audits.
We conducted our audits in accordance with the standards of the Public Company Accounting Oversight Board (United States). Those standards require that we plan and perform the audit to obtain reasonable assurance about whether the financial statements and financial highlights are free of material misstatement. An audit includes examining, on a test basis, evidence supporting the amounts and disclosures in the financial statements. Our procedures included confirmation of securities owned as of December 31, 2013, by correspondence with the custodian and brokers or by performing other appropriate auditing procedures. An audit also includes assessing the accounting principles used and significant estimates made by management, as well as evaluating the overall financial statement presentation. We believe that our audits provide a reasonable basis for our opinion.
In our opinion, the financial statements and financial highlights referred to above present fairly, in all material respects, the financial position of the Calvert VP Nasdaq 100 Index Portfolio as of December 31, 2013, the results of its operations for the year then ended, the changes in its net assets for each of the years in the two-year period then ended, and the financial highlights for each of the years in the five-year period then ended, in conformity with U.S. generally accepted accounting principles.

Philadelphia, Pennsylvania
February 24, 2014
www.calvert.com CALVERT VP NASDAQ 100 INDEX PORTFOLIO ANNUAL REPORT 7
| | |
| STATEMENT OF NET ASSETS |
| DECEMBER 31, 2013 |
| |
| EQUITY SECURITIES - 96.9% | SHARES | VALUE |
| Air Freight & Logistics - 0.4% | | |
| C.H. Robinson Worldwide, Inc. | 2,938 | $171,403 |
| Expeditors International of Washington, Inc | 3,983 | 176,248 |
| | | 347,651 |
| |
| Automobiles - 0.5% | | |
| Tesla Motors, Inc.* | 2,390 | 359,408 |
| |
| Beverages - 0.3% | | |
| Monster Beverage Corp.* | 3,256 | 220,659 |
| |
| Biotechnology - 9.8% | | |
| Alexion Pharmaceuticals, Inc.* | 3,799 | 505,495 |
| Amgen, Inc. | 14,596 | 1,666,279 |
| Biogen Idec, Inc.* | 4,575 | 1,279,856 |
| Celgene Corp.* | 7,986 | 1,349,315 |
| Gilead Sciences, Inc.* | 29,706 | 2,232,406 |
| Regeneron Pharmaceuticals, Inc.* | 1,887 | 519,378 |
| Vertex Pharmaceuticals, Inc.* | 4,529 | 336,505 |
| | | 7,889,234 |
| |
| Chemicals - 0.3% | | |
| Sigma-Aldrich Corp. | 2,319 | 218,009 |
| |
| Commercial Services & Supplies - 0.2% | | |
| Stericycle, Inc.* | 1,661 | 192,958 |
| |
| Communications Equipment - 6.1% | | |
| Cisco Systems, Inc. | 103,544 | 2,324,563 |
| F5 Networks, Inc.* | 1,504 | 136,653 |
| QUALCOMM, Inc. | 32,671 | 2,425,822 |
| | | 4,887,038 |
| |
| Computers & Peripherals - 13.7% | | |
| Apple, Inc. | 17,429 | 9,779,586 |
| NetApp, Inc. | 6,603 | 271,647 |
| SanDisk Corp. | 4,377 | 308,754 |
| Seagate Technology plc | 6,322 | 355,044 |
| Western Digital Corp. | 4,583 | 384,514 |
| | | 11,099,545 |
| |
| Food & Staples Retailing - 1.8% | | |
| Costco Wholesale Corp | 8,466 | 1,007,539 |
| Whole Foods Market, Inc. | 7,210 | 416,954 |
| | | 1,424,493 |
| |
| Food Products - 2.5% | | |
| Green Mountain Coffee Roasters, Inc.* | 2,883 | 217,897 |
| Kraft Foods Group, Inc | 11,545 | 622,507 |
| Mondelez International, Inc | 33,980 | 1,199,494 |
| | | 2,039,898 |
8 www.calvert.com CALVERT VP NASDAQ 100 INDEX PORTFOLIO ANNUAL REPORT
| | |
| EQUITY SECURITIES - CONT’D | SHARES | VALUE |
| Health Care Equipment & Supplies - 0.4% | | |
| Intuitive Surgical, Inc.* | 738 | $283,451 |
| |
| Health Care Providers & Services - 1.8% | | |
| Catamaran Corp.* | 4,035 | 191,582 |
| Express Scripts Holding Co.* | 15,604 | 1,096,025 |
| Henry Schein, Inc.* | 1,663 | 190,014 |
| | | 1,477,621 |
| |
| Health Care Technology - 0.5% | | |
| Cerner Corp.* | 6,653 | 370,838 |
| |
| Hotels, Restaurants & Leisure - 2.2% | | |
| Marriott International, Inc | 5,800 | 286,288 |
| Starbucks Corp | 14,601 | 1,144,572 |
| Wynn Resorts Ltd. | 1,960 | 380,652 |
| | | 1,811,512 |
| |
| Household Durables - 0.2% | | |
| Garmin Ltd | 3,782 | 174,804 |
| |
| Internet & Catalog Retail - 7.1% | | |
| Amazon.com, Inc.* | 8,869 | 3,536,869 |
| Expedia, Inc. | 2,278 | 158,686 |
| Liberty Interactive Corp.* | 9,291 | 272,691 |
| Netflix, Inc.* | 1,148 | 422,659 |
| priceline.com, Inc.* | 996 | 1,157,750 |
| TripAdvisor, Inc.* | 2,505 | 207,489 |
| | | 5,756,144 |
| |
| Internet Software & Services - 14.2% | | |
| Akamai Technologies, Inc.* | 3,486 | 164,469 |
| Baidu, Inc. (ADR)* | 5,339 | 949,701 |
| eBay, Inc.* | 25,083 | 1,376,806 |
| Equinix, Inc.* | 959 | 170,175 |
| Facebook, Inc.* | 36,297 | 1,983,994 |
| Google, Inc.* | 5,362 | 6,009,247 |
| Yahoo!, Inc.* | 19,655 | 794,848 |
| | | 11,449,240 |
| |
| IT Services - 2.4% | | |
| Automatic Data Processing, Inc. | 9,328 | 753,796 |
| Cognizant Technology Solutions Corp.* | 5,863 | 592,046 |
| Fiserv, Inc.* | 4,990 | 294,660 |
| Paychex, Inc. | 7,076 | 322,170 |
| | | 1,962,672 |
| |
| Leisure Equipment & Products - 0.4% | | |
| Mattel, Inc. | 6,557 | 311,982 |
| |
| Life Sciences - Tools & Services - 0.3% | | |
| Illumina, Inc.* | 2,449 | 270,908 |
| |
| Machinery - 0.5% | | |
| PACCAR, Inc. | 6,861 | 405,965 |
www.calvert.com CALVERT VP NASDAQ 100 INDEX PORTFOLIO ANNUAL REPORT 9
| | |
| EQUITY SECURITIES - CONT’D | SHARES | VALUE |
| Media - 7.9% | | |
| Charter Communications, Inc.* | 2,018 | $275,982 |
| Comcast Corp | 41,323 | 2,147,350 |
| DIRECTV* | 10,171 | 702,714 |
| Discovery Communications, Inc.* | 2,839 | 256,702 |
| DISH Network Corp.* | 4,250 | 246,160 |
| Liberty Global plc* | 4,294 | 382,123 |
| Liberty Media Corp.* | 2,022 | 296,122 |
| Sirius XM Holdings, Inc.* | 118,878 | 414,884 |
| Twenty-First Century Fox, Inc. | 28,697 | 1,009,561 |
| Viacom, Inc., Class B | 7,651 | 668,238 |
| | | 6,399,836 |
| |
| Multiline Retail - 0.3% | | |
| Dollar Tree, Inc.* | 4,032 | 227,485 |
| |
| Pharmaceuticals - 0.4% | | |
| Mylan, Inc.* | 7,418 | 321,941 |
| |
| Professional Services - 0.3% | | |
| Verisk Analytics, Inc.* | 3,260 | 214,247 |
| |
| Semiconductors & Semiconductor Equipment - 8.1% | | |
| Altera Corp. | 6,280 | 204,288 |
| Analog Devices, Inc | 6,027 | 306,955 |
| Applied Materials, Inc. | 23,305 | 412,266 |
| Avago Technologies Ltd | 4,838 | 255,882 |
| Broadcom Corp. | 10,036 | 297,567 |
| Intel Corp. | 96,334 | 2,500,831 |
| KLA-Tencor Corp. | 3,264 | 210,398 |
| Linear Technology Corp | 4,568 | 208,072 |
| Maxim Integrated Products, Inc | 5,479 | 152,919 |
| Micron Technology, Inc.* | 20,441 | 444,796 |
| NVIDIA Corp. | 11,005 | 176,300 |
| NXP Semiconductor NV* | 4,770 | 219,086 |
| Texas Instruments, Inc. | 21,208 | 931,243 |
| Xilinx, Inc. | 5,241 | 240,667 |
| | | 6,561,270 |
| |
| Software - 10.6% | | |
| Activision Blizzard, Inc | 13,489 | 240,509 |
| Adobe Systems, Inc.* | 9,682 | 579,758 |
| Autodesk, Inc.* | 4,392 | 221,049 |
| CA, Inc. | 8,749 | 294,404 |
| Check Point Software Technologies Ltd.* | 3,806 | 245,563 |
| Citrix Systems, Inc.* | 3,612 | 228,459 |
| Intuit, Inc | 5,520 | 421,286 |
| Microsoft Corp. | 161,613 | 6,049,175 |
| Symantec Corp. | 13,486 | 318,000 |
| | | 8,598,203 |
| |
| Specialty Retail - 1.7% | | |
| Bed Bath & Beyond, Inc.* | 4,161 | 334,128 |
| O’Reilly Automotive, Inc.* | 2,079 | 267,588 |
| Ross Stores, Inc. | 4,198 | 314,556 |
| Staples, Inc | 12,665 | 201,247 |
| Tractor Supply Co | 2,705 | 209,854 |
| | | 1,327,373 |
10 www.calvert.com CALVERT VP NASDAQ 100 INDEX PORTFOLIO ANNUAL REPORT
| | |
| EQUITY SECURITIES - CONT’D | SHARES | VALUE |
| Trading Companies & Distributors - 0.3% | | |
| Fastenal Co. | 5,749 | $273,135 |
| |
| Wireless Telecommunication Services - 1.7% | | |
| SBA Communications Corp.* | 2,494 | 224,061 |
| VimpelCom Ltd. (ADR) | 32,010 | 414,210 |
| Vodafone Group plc (ADR) | 19,133 | 752,118 |
| | | 1,390,389 |
| |
| Total Equity Securities (Cost $43,821,362) | | 78,267,909 |
| |
| EXCHANGE TRADED PRODUCTS - 1.1% | | |
| Powershares QQQ Trust, Series 1 | 10,500 | 923,580 |
| |
| Total Exchange Traded Products (Cost $813,562) | | 923,580 |
| |
| | PRINCIPAL | |
| TIME DEPOSIT - 1.8% | AMOUNT | |
| State Street Bank Time Deposit, 0.083%, 1/2/14 | $1,428,913 | 1,428,913 |
| |
| Total Time Deposit (Cost $1,428,913) | | 1,428,913 |
| |
| U.S. TREASURY OBLIGATIONS - 0.3% | | |
| United States Treasury Bills, 0.068%, 6/26/14^ | 200,000 | 199,934 |
| |
| Total U.S. Treasury Obligations (Cost $199,934) | | 199,934 |
| |
| TOTAL INVESTMENTS (Cost $46,263,771) - 100.1% | | 80,820,336 |
| Other assets and liabilities, net - (0.1%) | | (45,891) |
| NET ASSETS - 100% | | $80,774,445 |
| |
| NET ASSETS CONSISTS OF: | | |
| Paid-in capital applicable to 1,879,281 shares of common stock outstanding; | | |
| $0.10 par value, 20,000,000 shares authorized | | $44,358,010 |
| Undistributed net investment income | | 113,178 |
| Accumulated net realized gain (loss) | | 1,711,234 |
| Net unrealized appreciation (depreciation) | | 34,592,023 |
| |
| NET ASSETS | | $80,774,445 |
| |
| NET ASSET VALUE PER SHARE | | $42.98 |
| | | | UNDERLYING | UNREALIZED |
| | NUMBER OF | EXPIRATION | FACE AMOUNT | APPRECIATION |
| FUTURES | CONTRACTS | DATE | AT VALUE | (DEPRECIATION) |
| Purchased: | | | | |
| E-Mini NASDAQ 100 Index^ | 24 | 3/14 | $1,720,200 | $35,458 |
See notes to financial statements.
www.calvert.com CALVERT VP NASDAQ 100 INDEX PORTFOLIO ANNUAL REPORT 11
^ Futures collateralized by $200,000 par value of U.S. Treasury Bills.
* Non-income producing security.
Abbreviations:
ADR: American Depositary Receipts
plc: Public Limited Company
See notes to financial statements.
12 www.calvert.com CALVERT VP NASDAQ 100 INDEX PORTFOLIO ANNUAL REPORT
| |
| STATEMENT OF OPERATIONS |
| YEAR ENDED DECEMBER 31, 2013 |
| |
| NET INVESTMENT INCOME | |
| Investment Income: | |
| Dividend income (net of foreign taxes withheld of $1,865) | $1,011,436 |
| Interest income | 1,740 |
| Total investment income | 1,013,176 |
| |
| |
| Expenses: | |
| Investment advisory fee | 252,381 |
| Transfer agency fees and expenses | 9,438 |
| Accounting fees | 10,924 |
| Directors’ fees and expenses | 11,794 |
| Administrative fees | 72,109 |
| Custodian fees | 14,986 |
| Reports to shareholders | 13,416 |
| Professional fees | 30,590 |
| Licensing fees | 10,000 |
| Miscellaneous | 11,810 |
| Total expenses | 437,448 |
| |
| |
| NET INVESTMENT INCOME | 575,728 |
| |
| |
| REALIZED AND UNREALIZED GAIN (LOSS) | |
| Net realized gain (loss) on: | |
| Investments | 2,847,136 |
| Futures | 450,726 |
| | 3,297,862 |
| |
| Change in unrealized appreciation (depreciation) on: | |
| Investments | 18,490,448 |
| Futures | 74,343 |
| | 18,564,791 |
| |
| |
| NET REALIZED AND UNREALIZED GAIN (LOSS) | 21,862,653 |
| |
| INCREASE (DECREASE) IN NET ASSETS | |
| RESULTING FROM OPERATIONS | $22,438,381 |
See notes to financial statements.
www.calvert.com CALVERT VP NASDAQ 100 INDEX PORTFOLIO ANNUAL REPORT 13
| | |
| STATEMENTS OF CHANGES IN NET ASSETS |
| |
| | YEAR ENDED | YEAR ENDED |
| | DECEMBER 31, | DECEMBER 31, |
| INCREASE (DECREASE) IN NET ASSETS | 2013 | 2012 |
| Operations: | | |
| Net investment income | $575,728 | $523,280 |
| Net realized gain (loss) | 3,297,862 | 1,892,868 |
| Change in unrealized appreciation (depreciation) | 18,564,791 | 7,121,473 |
| |
| |
| INCREASE (DECREASE) IN NET ASSETS | | |
| RESULTING FROM OPERATIONS | 22,438,381 | 9,537,621 |
| |
| Distributions to shareholders from: | | |
| Net investment income | (580,671) | (440,448) |
| Net realized gain | (1,797,313) | (3,780,270) |
| Total distributions | (2,377,984) | (4,220,718) |
| |
| |
| Capital share transactions: | | |
| Shares sold | 7,710,711 | 10,965,871 |
| Reinvestment of distributions | 2,377,984 | 4,220,718 |
| Shares redeemed | (14,064,022) | (9,797,966) |
| Total capital share transactions | (3,975,327) | 5,388,623 |
| |
| |
| |
| TOTAL INCREASE (DECREASE) IN NET ASSETS | 16,085,070 | 10,705,526 |
| |
| |
| |
| NET ASSETS | | |
| Beginning of year | 64,689,375 | 53,983,849 |
| End of year (including undistributed net investment income | | |
| of $113,178 and $118,121, respectively) | $80,774,445 | $64,689,375 |
| |
| |
| CAPITAL SHARE ACTIVITY | | |
| Shares sold | 209,777 | 317,110 |
| Reinvestment of distributions | 56,795 | 132,311 |
| Shares redeemed | (373,477) | (282,998) |
| Total capital share activity | (106,905) | 166,423 |
See notes to financial statements.
14 www.calvert.com CALVERT VP NASDAQ 100 INDEX PORTFOLIO ANNUAL REPORT
NOTES TO FINANCIAL STATEMENTS
NOTE A –- SIGNIFICANT ACCOUNTING POLICIES
General: Calvert VP Nasdaq 100 Index Portfolio (the “Portfolio”), a series of Calvert Variable Products, Inc. (the “Fund”), is registered under the Investment Company Act of 1940 as a non-diversified, open-end management investment company. The Fund is comprised of twelve separate portfolios. The operations of each series of the Fund are accounted for separately. Shares of the Portfolio are sold without sales charge to affiliated and unaffiliated insurance companies for allocation to certain of their variable separate accounts.
Security Valuation: Net asset value per share is determined every business day as of the close of the regular session of the New York Stock Exchange (generally 4:00 p.m. Eastern time). The Portfolio uses independent pricing services approved by the Board of Directors (“the Board”) to value its investments wherever possible. Investments for which market quotations are not available or deemed not reliable are fair valued in good faith under the direction of the Board.
The Board has adopted Valuation Procedures (the “Procedures”) to determine the fair value of securities and other financial instruments for which market prices are not readily available or which may not be reliably priced. The Board has delegated the day-to-day responsibility for determining the fair value of assets of the Portfolio to Calvert Investment Management, Inc. (the “Advisor” or “Calvert”) and has provided these Procedures to govern Calvert in its valuation duties.
Calvert has chartered an internal Valuation Committee to oversee the implementation of these Procedures and to assist it in carrying out the valuation responsibilities that the Board has delegated.
The Valuation Committee meets on a regular basis to review illiquid securities and other investments which may not have readily available market prices. The Valuation Committee’s fair valuation determinations are subject to review, approval and ratification by the Board at its next regularly scheduled meeting covering the calendar quarter in which the fair valuation was determined.
The Valuation Committee utilizes various methods to measure the fair value of the Portfolio’s investments. Generally Accepted Accounting Principles (GAAP) establishes a disclosure hierarchy that categorizes the inputs to valuation techniques used to value assets and liabilities at measurement date. These inputs are summarized in the three broad levels listed below:
Level 1 – quoted prices in active markets for identical securities
Level 2 – other significant observable inputs (including quoted prices for similar securities, interest rates, prepayment speeds, credit risk, etc.)
Level 3 – significant unobservable inputs (including the Portfolio’s own assumptions in determining the fair value of investments) The inputs or methodologies used for valuing securities are not necessarily an indication of the risk associated with investing in those securities.
Changes in valuation techniques may result in transfers in or out of an investment’s assigned level within the hierarchy during the period. There were no such transfers during the period. Valuation techniques used to value the Portfolio’s investments by major category are as follows: Equity securities, including restricted securities, for which market quotations are readily available, are valued at the last reported sale price or official closing price as reported by an independent pricing service on the primary market or exchange on which they are traded and are categorized as Level 1 in the hierarchy.
In the event there were no sales during the day or closing prices are not available, securities are valued at the last quoted bid price or may be valued using the last available price and are categorized as Level 2 in the hierarchy. Foreign securities are valued based on quotations from the principal market in which
www.calvert.com CALVERT VP NASDAQ 100 INDEX PORTFOLIO ANNUAL REPORT 15
such securities are normally traded. If events occur after the close of the principal market in which foreign securities are traded, and before the close of business of the Portfolio, that are expected to materially affect the value of those securities, then they are valued at their fair value taking these events into account. For restricted securities and private placements where observable inputs are limited, assumptions about market activity and risk are used and such securities are categorized as Level 3 in the hierarchy.
Exchange traded products are valued at the official closing price as reported by an independent pricing service on the primary market or exchange on which they are traded and are categorized as Level 1 in the hierarchy.
Debt securities, including restricted securities, are valued based on evaluated prices received from independent pricing services or from dealers who make markets in such securities. For U.S. government obligations, pricing services utilize matrix pricing which considers yield or price of bonds of comparable quality, coupon, maturity and type as well as dealer supplied prices and such securities are generally categorized as Level 2 in the hierarchy. Short-term securities of sufficient credit quality with remaining maturities of sixty days or less for which quotations are not readily available are valued at amortized cost, which approximates fair value, and are categorized as Level 2 in the hierarchy.
When independent prices are unavailable or unreliable, debt securities may be valued utilizing pricing matrices which consider similar factors that would be used by independent pricing services. These are generally categorized as Level 2 in the hierarchy but may be Level 3 depending on the circumstances.
If a market value cannot be determined for a security using the methodologies described above, or if, in the good faith opinion of the Advisor, the market value does not constitute a readily available market quotation, or if a significant event has occurred that would materially affect the value of the security, the security will be fair valued as determined in good faith by the Valuation Committee.
The Valuation Committee considers a number of factors, including significant unobservable valuation inputs when arriving at fair value. It considers all significant facts that are reasonably available and relevant to the determination of fair value.
The Valuation Committee primarily employs a market-based approach which may use related or comparable assets or liabilities, recent transactions, market multiples, book values, and other relevant information for the investment to determine the fair value of the investment. When more appropriate, the fund may employ an income-based or cost approach. An income-based valuation approach discounts anticipated future cash flows of the investment to calculate a present amount (discounted). The measurement is based on the value indicated by current market expectations about those future amounts. Discounts may also be applied due to the nature or duration of any restrictions on the disposition of the investments. A cost based approach is based on the amount that currently would be required to replace the service capacity of an asset (current replacement cost). From the seller’s perspective, the price that would be received for the asset is determined based on the cost to a buyer to acquire or construct a substitute asset of comparable utility, adjusted for obsolescence.
The values assigned to fair value investments are based on available information and do not necessarily represent amounts that might ultimately be realized. Further, due to the inherent uncertainty of valuations of such investments, the fair values may differ significantly from the values that would have been used had an active market existed, and the differences could be material. The Valuation Committee employs various methods for calibrating these valuation approaches including a regular review of key inputs and assumptions, transactional back-testing or disposition analysis and reviews of any related market activity.
At December 31, 2013, no securities were fair valued in good faith under the direction of the Board.
16 www.calvert.com CALVERT VP NASDAQ 100 INDEX PORTFOLIO ANNUAL REPORT
The following is a summary of the inputs used to value the Portfolio’s net assets as of December 31, 2013:
| | | VALUATION INPUTS | |
| INVESTMENTS IN SECURITIES | LEVEL 1 | LEVEL 2 | LEVEL 3 | TOTAL |
| Equity securities* | $78,267,909 | — | — | $78,267,909 |
| Exchange traded products | 923,580 | — | — | 923,580 |
| U.S. government obligations | — | $199,934 | — | 199,934 |
| Other debt obligations | — | 1,428,913 | — | 1,428,913 |
| TOTAL | $79,191,489 | $1,628,847 | — | $80,820,336 |
| Other financial instruments** | $35,458 | — | — | $35,458 |
* For further breakdown of equity securities by industry type, please refer to the Statement of Net Assets.
** Other financial instruments are derivative instruments not reflected in the Total Investments in the Statement of Net Assets, such as futures, which are valued at the unrealized appreciation/depreciation on the instrument.
Futures Contracts: The Portfolio may purchase and sell futures contracts, when, in the judgment of the Advisor, such a position acts as a hedge, or to provide equity market exposure to the Portfolio’s uncommitted cash balances. The Portfolio may not enter into futures contracts for the purpose of speculation or leverage. These futures contracts may include, but are not limited to, market index futures contracts. The Portfolio is subject to market risk in the normal course of pursuing its investment objectives and may use futures contracts to hedge against changes in the value of securities. The Portfolio may enter into futures contracts agreeing to buy or sell a financial instrument for a set price at a future date. Initial margin deposits of either cash or securities as required by the broker are made upon entering into the contract. While the contract is open, daily variation margin payments are made to or received from the broker reflecting the daily change in market value of the contract and are recorded for financial reporting purposes as unrealized gains or losses by the Portfolio. When a futures contract is closed, a realized gain or loss is recorded equal to the difference between the opening and closing value of the contract. The risks associated with entering into futures contracts may include the possible illiquidity of the secondary market which would limit the Portfolio’s ability to close out a futures contract prior to the settlement date, an imperfect correlation between the value of the contracts and the underlying financial instruments, or that the counterparty will fail to perform its obligations under the contracts’ terms. Futures contracts are designed by boards of trade which are designated “contracts markets” by the Commodities Futures Trading Commission. Futures contracts trade on the contracts markets in a manner that is similar to the way a stock trades on a stock exchange and the boards of trade, through their clearing corporations, guarantee the futures contracts against default. As a result, there is minimal counterparty credit risk to the Portfolio. During the year, futures contracts were used to hedge the lack of equity market exposure inherent in a cash position. The Portfolio’s futures contracts at year end are presented in the Statement of Net Assets.
During the year, the Portfolio invested in E-Mini NASDAQ 100 Index futures. The volume of outstanding contracts has varied throughout the year with a weighted average of 10 contracts and $290,522 weighted average notional value.
Security Transactions and Investment Income: Security transactions are accounted for on trade date. Realized gains and losses are recorded on an identified cost basis and may include proceeds from litigation. Dividend income is recorded on the ex-dividend date or, in the case of dividends on certain foreign securities, as soon as the Portfolio is informed of the ex-dividend date. Withholding taxes on foreign dividends have been provided for in accordance with the Portfolio’s understanding of the applicable country’s tax rules and rates. Distributions received on securities that represent a return of capital or capital gains are recorded as a reduc-
www.calvert.com CALVERT VP NASDAQ 100 INDEX PORTFOLIO ANNUAL REPORT 17
tion of cost of investments and/or as a realized gain. Interest income, which includes amortization of premium and accretion of discount on debt securities, is accrued as earned.
Foreign Currency Transactions: The Portfolio’s accounting records are maintained in U.S. dollars. For valuation of assets and liabilities on each date of net asset value determination, foreign denominations are converted into U.S. dollars using the current exchange rate. Security transactions, income and expenses are translated at the prevailing rate of exchange on the date of the event. The effect of changes in foreign exchange rates on securities is included with the net realized and unrealized gain or loss on investments.
Distributions to Shareholders: Distributions to shareholders are recorded by the Portfolio on ex-dividend date. Dividends from net investment income and distributions from net realized capital gains, if any, are paid at least annually. Distributions are determined in accordance with income tax regulations which may differ from generally accepted accounting principles; accordingly, periodic reclassifications are made within the Portfolio’s capital accounts to reflect income and gains available for distribution under income tax regulations.
Estimates: The preparation of financial statements in conformity with accounting principles generally accepted in the United States requires management to make estimates and assumptions that affect the reported amounts of assets and liabilities and disclosure of contingent assets and liabilities at the date of the financial statements and the reported amounts of income and expenses during the reporting period. Actual results could differ from those estimates.
Federal Income Taxes: No provision for federal income or excise tax is required since the Portfolio intends to continue to qualify as a regulated investment company under the Internal Revenue Code and to distribute substantially all of its taxable earnings.
Management has analyzed the Portfolio’s tax positions taken for all open federal income tax years and has concluded that no provision for federal income tax is required in the Portfolio’s financial statements. A Portfolio’s federal tax return is subject to examination by the Internal Revenue Service for a period of three years.
NOTE B — RELATED PARTY TRANSACTIONS
Calvert Investment Management, Inc. (the “Advisor”) is wholly-owned by Calvert Investments, Inc., which is indirectly wholly-owned by Ameritas Mutual Holding Company. The Advisor provides investment advisory services and pays the salaries and fees of officers and Directors of the Fund who are employees of the Advisor or its affiliates. For its services, the Advisor receives an annual fee, payable monthly, of .35% of the Portfolio’s average daily net assets. Under the terms of the agreement, $21,506 was payable at year end. In addition, $15,174 was payable at year end for operating expenses paid by the Advisor during December 2013.
The Advisor has contractually agreed to limit net annual portfolio operating expenses through April 30, 2014. The contractual expense cap is .69%. For the purpose of this expense limit, operating expenses do not include interest expense, brokerage commissions, taxes and extraordinary expenses. This expense limitation does not limit acquired fund fees and expenses, if any.
Calvert Investment Administrative Services, Inc., an affiliate of the Advisor, provides administrative services to the Portfolio for an annual fee, payable monthly, of .10% of the Portfolio’s average daily net assets. Under the terms of the agreement, $6,144 was payable at year end.
Calvert Investment Services, Inc. (“CIS”), an affiliate of the Advisor, acts as shareholder servicing agent for the Portfolio. For its services, CIS received a fee of $5,559 for the year ended December 31, 2013. Under the terms of the agreement, $459 was payable at year end. Boston Financial Data Services, Inc. is the transfer and dividend disbursing agent.
Each Director of the Fund who is not an employee of the Advisor or its affiliates receives a fee of $1,500 for each Board and Committee meeting attended plus an annual fee of $40,000. Committee chairs receive an additional $5,000 annual retainer. Directors’ fees are allocated to each of the portfolios served.
18 www.calvert.com CALVERT VP NASDAQ 100 INDEX PORTFOLIO ANNUAL REPORT
NOTE C — INVESTMENT ACTIVITY AND TAX INFORMATION
During the year, the cost of purchases and proceeds from sales of investments, other than short-term securities, were $9,207,536 and $13,702,727, respectively.
The tax character of dividends and distributions paid during the years ended December 31, 2013 and December 31, 2012 was as follows:
| Distributions paid from: | 2013 | 2012 |
| Ordinary income | $947,258 | $587,107 |
| Long-term capital gain | 1,430,726 | 3,633,611 |
| Total | $2,377,984 | $4,220,718 |
As of December 31, 2013, the tax basis components of distributable earnings/(accumulated losses) and the federal tax cost were as follows:
| Unrealized appreciation | $34,637,504 |
| Unrealized (depreciation) | (223,425) |
| Net unrealized appreciation/(depreciation) | $34,414,079 |
| Undistributed ordinary income | $354,505 |
| Undistributed long-term capital gain | $1,647,851 |
| Federal income tax cost of investments | $46,406,257 |
The differences between the components of distributable earnings on a tax basis and the amounts reflected in the statement of net assets are primarily due to temporary book-tax differences that will reverse in a subsequent period. These differences are due to wash sales and Section 1256 contracts.
NOTE D — LINE OF CREDIT
A financing agreement is in place with the Calvert Funds and State Street Corporation (“SSC”). Under the agreement, SSC provides an unsecured line of credit facility, in the aggregate amount of $50 million ($25 million committed and $25 million uncommitted), accessible by the Funds for temporary or emergency purposes only. Borrowings under the committed facility bear interest at the higher of the London Interbank Offered Rate (LIBOR) or the overnight Federal Funds Rate plus 1.25% per annum. A commitment fee of .11% per annum is incurred on the unused portion of the committed facility, which is allocated to all participating funds. The Portfolio had no borrowings under the agreement during the year ended December 31, 2013.
NOTE E — SUBSEQUENT EVENTS
In preparing the financial statements as of December 31, 2013, no subsequent events or transactions occurred that would have required recognition or disclosure in these financial statements.
www.calvert.com CALVERT VP NASDAQ 100 INDEX PORTFOLIO ANNUAL REPORT 19
| | | |
| FINANCIAL HIGHLIGHTS |
| |
| | YEARS ENDED |
| | DECEMBER
31, | DECEMBER
31, | DECEMBER
31, |
| | 2013 | 2012 | 2011 |
| Net asset value, beginning | $32.57 | $29.67 | $30.46 |
| Income from investment operations: | | | |
| Net investment income | .32 | .28 | .09 |
| Net realized and unrealized gain (loss) | 11.39 | 4.90 | .83 |
| Total from investment operations | 11.71 | 5.18 | .92 |
| Distributions from: | | | |
| Net investment income | (.32) | (.24) | (.09) |
| Net realized gain | (.98) | (2.04) | (1.62) |
| Total distributions | (1.30) | (2.28) | (1.71) |
| Total increase (decrease) in net asset value | 10.41 | 2.90 | (.79) |
| Net asset value, ending | $42.98 | $32.57 | $29.67 |
| |
| Total return* | 36.05% | 17.62% | 3.02% |
| Ratios to average net assets: A | | | |
| Net investment income | .80% | .84% | .27% |
| Total expenses | .61% | .63% | .67% |
| Expenses before offsets | .61% | .63% | .65% |
| Net expenses | .61% | .63% | .65% |
| Portfolio turnover | 13% | 17% | 23% |
| Net assets, ending (in thousands) | $80,774 | $64,689 | $53,984 |
| |
| | | YEARS ENDED |
| | | DECEMBER
31, | DECEMBER
31, |
| | | 2010 | 2009 |
| Net asset value, beginning | | $25.51 | $16.63 |
| Income from investment operations: | | | |
| Net investment income | | .06 | .02 |
| Net realized and unrealized gain (loss) | | 4.94 | 8.88 |
| Total from investment operations | | 5.00 | 8.90 |
| Distributions from: | | | |
| Net investment income | | (.05) | (.02) |
| Total distributions | | (.05) | (.02) |
| Total increase (decrease) in net asset value | | 4.95 | 8.88 |
| Net asset value, ending | | $30.46 | $25.51 |
| |
| Total return* | | 19.61% | 53.51% |
| Ratios to average net assets:A | | | |
| Net investment income | | .33% | .09% |
| Total expenses | | .68% | .74% |
| Expenses before offsets | | .65% | .65% |
| Net expenses | | .65% | .65% |
| Portfolio turnover | | 26% | 10% |
| Net assets, ending (in thousands) | | $60,435 | $25,637 |
See notes to financial highlights.
20 www.calvert.com CALVERT VP NASDAQ 100 INDEX PORTFOLIO ANNUAL REPORT
A Total expenses do not reflect amounts reimbursed and/or waived by the Advisor or reductions from expense offset arrangements. Expenses before offsets reflect expenses after reimbursement and/or waiver by the Advisor but prior to reductions from expense offset arrangements. Net expenses are net of all reductions and represent the net expenses paid by the portfolio.
* Total return is not annualized for periods of less than one year and does not reflect charges and expenses of the variable annuity or variable universal life contract.
See notes to financial statements.
www.calvert.com CALVERT VP NASDAQ 100 INDEX PORTFOLIO ANNUAL REPORT 21
EXPLANATION OF FINANCIAL TABLES
SCHEDULE OF INVESTMENTS
The Schedule of Investments is a snapshot of all securities held in the fund at their market value, on the last day of the reporting period. Securities are listed by asset type (e.g., common stock, corporate bonds, U.S. government obligations) and may be further broken down into sub-groups and by industry classification.
STATEMENT OF ASSETS AND LIABILITIES
The Statement of Assets and Liabilities is often referred to as the fund’s balance sheet. It lists the value of what the fund owns, is due and owes on the last day of the reporting period. The fund’s assets include the market value of securities owned, cash, receivables for securities sold and shareholder subscriptions, and receivables for dividends and interest payments that have been earned, but not yet received. The fund’s liabilities typically include payables for securities purchased and shareholder redemptions, and expenses owed but not yet paid. The statement also reports the fund’s net asset value (NAV) per share on the last day of the reporting period. The NAV is calculated by dividing the fund’s net assets (assets minus liabilities) by the number of shares outstanding. This statement is accompanied by a Schedule of Investments. Alternatively, if certain conditions are met, a Statement of Net Assets may be presented in lieu of this statement and the Schedule of Investments.
STATEMENT OF NET ASSETS
The Statement of Net Assets provides a detailed list of the fund’s holdings, including each security’s market value on the last day of the reporting period. The Statement of Net Assets includes a Schedule of Investments. Other assets are added and other liabilities subtracted from the investments total to calculate the fund’s net assets. Finally, net assets are divided by the outstanding shares of the fund to arrive at its share price, or Net Asset Value (NAV) per share.
At the end of the Statement of Net Assets is a table displaying the composition of the fund’s net assets. Paid in Capital is the money invested by shareholders and represents the bulk of net assets. Undistributed Net Investment Income and Accumulated Net Realized Gains usually approximate the amounts the fund had available to distribute to shareholders as of the statement date. Accumulated Realized Losses will appear as negative balances. Unrealized Appreciation (Depreciation) is the difference between the market value of the fund’s investments and their cost, and reflects the gains (losses) that would be realized if the fund were to sell all of its investments at their statement-date values.
STATEMENT OF OPERATIONS
The Statement of Operations summarizes the fund’s investment income earned and expenses incurred in operating the fund. Investment income includes dividends earned from stocks and interest earned from interest-bearing securities in the fund. Expenses incurred in operating the fund include the advisory fee paid to the investment advisor, administrative services fees, distribution plan expenses (if applicable), transfer agent fees, shareholder servicing expenses, custodial, legal, and audit fees, and the printing and postage expenses related to shareholder reports. Expense offsets (fees paid indirectly) are also shown. Credits earned from offset arrangements are used to reduce the fund’s expenses. This statement also shows net gains (losses) realized on the sale of investments and the increase or decrease in the unrealized appreciation (depreciation) on investments held during the period.
STATEMENT OF CHANGES IN NET ASSETS
The Statement of Changes in Net Assets shows how the fund’s total net assets changed during the two most recent reporting periods. Changes in the fund’s net assets are attributable to investment operations, distributions and capital share transactions.
The Operations section of the report summarizes information detailed in the Statement of Operations. The Distribution section shows the dividend and capital gain distributions made to shareholders. The amounts
22 www.calvert.com CALVERT VP NASDAQ 100 INDEX PORTFOLIO ANNUAL REPORT (UNAUDITED)
shown as distributions in this section may not match the net investment income and realized gains amounts shown in the Operations section because distributions are determined on a tax basis and certain investments or transactions may be treated differently for financial statement and tax purposes. The Capital Share Transactions section shows the amount shareholders invested in the fund, either by purchasing shares or by reinvesting distributions, and the amounts redeemed. The corresponding numbers of shares issued, reinvested and redeemed are shown at the end of the report.
FINANCIAL HIGHLIGHTS
The Financial Highlights table provides a per-share breakdown by class of the components that affect the fund’s net asset value for current and past reporting periods. The table provides total return, total distributions, expense ratios, portfolio turnover and net assets for the applicable period. Total return is a measure of a fund’s performance that encompasses all elements of return: dividends, capital gain distributions and changes in net asset value. Total return is the change in value of an investment over a given period, assuming reinvestment of any dividends and capital gain distributions, expressed as a percentage of the initial investment. Total distributions include distributions from net investment income and net realized gains. Long-term gains are earned on securities held in the fund more than one year. Short-term gains, on the sale of securities held less than one year, are treated as ordinary dividend income for tax purposes. The expense ratio is a fund’s cost of doing business, expressed as a percentage of net assets. These expenses directly reduce returns to shareholders. Portfolio turnover measures the trading activity in a fund’s investment portfolio – how often securities are bought and sold by a fund. Portfolio turnover is affected by market conditions, changes in the size of the fund, the nature of the fund’s investments and the investment style of the portfolio manager.
PROXY VOTING
The Proxy Voting Guidelines that the Portfolio uses to determine how to vote proxies relating to portfolio securities is provided as an Appendix to the Fund’s Statement of Additional Information. The Statement of Additional Information can be obtained free of charge by calling the Fund at 1-800-368-2745, by visiting the Calvert website at www.calvert.com or by visiting the SEC’s website at www.sec.gov.
Information regarding how the Fund voted proxies relating to portfolio securities during the most recent 12-month period ended June 30 is available by calling the Fund, by visiting the Calvert website at www. calvert.com or visiting the SEC’s website at www.sec.gov.
AVAILABILITY OF QUARTERLY PORTFOLIO HOLDINGS
The Fund files its complete schedule of portfolio holdings with the SEC for the first and third quarters of each fiscal year on Form N-Q. The Fund’s Form N-Q is available on the SEC’s website at www.sec.gov. The Fund’s Form N-Q may be reviewed and copied at the SEC’s Public Reference Room in Washington, DC; information on the operation of the Public Reference Room may be obtained by calling 1-800-SEC-0330.
BASIS FOR BOARD’S APPROVAL OF INVESTMENT ADVISORY CONTRACTS
At a meeting held on December 11, 2013, the Board of Directors, and by a separate vote, the disinterested Directors, approved the continuance of the Investment Advisory Agreement between the Portfolio and the Advisor and the Investment Subadvisory Agreement between the Advisor and the Subadvisor with respect to the Portfolio.
In evaluating the Investment Advisory Agreement, the Board considered a variety of information relating to the Portfolio and the Advisor. The disinterested Directors reviewed a report prepared by the Advisor regarding various services provided to the Portfolio by the Advisor and its affiliates. Such report included, among other
www.calvert.com CALVERT VP NASDAQ 100 INDEX PORTFOLIO ANNUAL REPORT (UNAUDITED) 23
data, information regarding the Advisor’s personnel and the Advisor’s revenue and cost of providing services to the Portfolio, and a separate report prepared by an independent third party, which provided a statistical analysis comparing the Portfolio’s investment performance, expenses, and fees to comparable mutual funds.
The disinterested Directors were separately represented by independent legal counsel with respect to their consideration of the reapproval of the Investment Advisory Agreement and the Investment Subadvisory Agreement. Prior to voting, the disinterested Directors reviewed the proposed continuance of the Investment Advisory Agreement and Investment Subadvisory Agreement with management and also met in private sessions with their counsel at which no representatives of management were present.
In the course of its deliberations regarding the Investment Advisory Agreement, the Board considered the following factors, among others: the nature, extent and quality of the services provided by the Advisor, including the personnel providing such services; the Advisor’s financial condition; the level and method of computing the Portfolio’s advisory fee; comparative performance, fee and expense information for the Portfolio; the profitability of the Calvert Family of Funds to the Advisor and its affiliates; the allocation of the Portfolio’s brokerage, including the Advisor’s process for monitoring “best execution”; the direct and indirect benefits, if any, derived by the Advisor and its affiliates from their relationship with the Portfolio; the effect of the Portfolio’s growth and size on the Portfolio’s performance and expenses; the Advisor’s compliance programs and policies; the Advisor’s performance of substantially similar duties for other funds; and any possible conflicts of interest.
In considering the nature, extent and quality of the services provided by the Advisor under the Investment Advisory Agreement, the Board reviewed information provided by the Advisor relating to its operations and personnel, including, among other information, biographical information on the Advisor’s supervisory and professional staff and descriptions of its organizational and management structure. The Board also took into account similar information provided periodically throughout the previous year by the Advisor, as well as the Board’s familiarity with the Advisor’s management through Board of Directors’ meetings, discussions and other reports. The Board considered the Advisor’s current level of staffing and overall resources. The Board also noted that it reviewed on a quarterly basis information regarding the Advisor’s compliance with applicable policies and procedures, including those related to personal investing. The Advisor’s administrative capabilities, including its ability to supervise the other service providers for the Portfolio, were also considered. The Board discussed the Advisor’s effectiveness in monitoring the performance of the Subadvisor and its timeliness in responding to performance issues. The Board observed that the scope of services provided by the Advisor generally had expanded over time as a result of regulatory, market and other changes. The Board took into consideration, among other factors, the effectiveness of the Portfolio’s and Advisor’s processes, policies and procedures and the Advisor’s personnel. The Board also took into account, among other items, periodic reports received from the Advisor over the past year concerning the Advisor’s ongoing review and enhancement of certain processes, policies and procedures of the Portfolio and the Advisor. The Board concluded that it was satisfied with the nature, extent and quality of services provided to the Portfolio by the Advisor under the Investment Advisory Agreement.
In considering the Portfolio’s performance, the Board noted that it reviewed on a quarterly basis detailed information about the Portfolio’s performance results, portfolio composition and investment strategies. In addition, the Board took into account overall financial market conditions. The Board also reviewed various comparative data provided to it in connection with its consideration of the renewal of the Investment Advisory Agreement, including, among other information, a comparison of the Portfolio’s total return with its Lipper index and with that of other mutual funds deemed to be in its peer universe by an independent third party in its report. This comparison indicated that the Portfolio performed below the median of its peer universe for the one-year period ended June 30, 2013 and above the median of its peer universe for the three- and five-year periods ended June 30, 2013. The data also indicated that the Portfolio underperformed its Lipper index for the one-year period ended June 30, 2013 and outperformed its Lipper index for the three- and five-year periods ended June 30, 2013. Based upon its review, the Board concluded that the Portfolio’s performance
24 www.calvert.com CALVERT VP NASDAQ 100 INDEX PORTFOLIO ANNUAL REPORT (UNAUDITED)
was satisfactory relative to the performance of passively-managed funds that track the same benchmark index as does the Portfolio.
In considering the Portfolio’s fees and expenses, the Board compared the Portfolio’s fees and total expense ratio with various comparative data for the funds in its peer group. Among other findings, the data indicated that the Portfolio’s advisory fee was at the median of its peer group and that total expenses were above the median of its peer group. The Board noted that the allocation of advisory and administrative fees may vary among the Portfolio’s peer group. The Board also took into account the Advisor’s current undertaking to maintain expense limitations for the Portfolio. The Board noted that the Advisor paid the Subadvisor’s subadvisory fee under the Investment Subadvisory Agreement with respect to the Portfolio. The Board also took into account management’s discussion of the Portfolio’s expenses and certain factors that affected the level of such expenses, including the current size of the Portfolio. Based upon its review, the Board determined that the advisory fee was reasonable in view of the quality of services received by the Portfolio from the Advisor and the other factors considered.
The Board reviewed the Advisor’s profitability on a portfolio-by-portfolio basis. In reviewing the overall profitability of the advisory fee to the Portfolio’s Advisor, the Board also considered the fact that affiliates of the Advisor provided shareholder servicing and administrative services to the Portfolio for which they received compensation. The information considered by the Board included Calvert’s operating profit margin information both before and after tax expenses with respect to the services that the Advisor and its affiliates provided to the Calvert Family of Funds complex. The Board reviewed the profitability of the Advisor’s relationship with the Portfolio in terms of the total amount of annual advisory fees it received with respect to the Portfolio and whether the Advisor had the financial wherewithal to continue to provide services to the Portfolio. The Board also considered that the Advisor derived benefits to its reputation and other indirect benefits from its relationship with the Portfolio. In addition, the Board took into account that affiliates of the Advisor may benefit from certain indirect tax benefits relating to dividend received deductions and foreign tax credits. The Board also noted that the Advisor paid the subadvisory fee to the Subadvisor, an affiliate of the Advisor. Based upon its review, the Board concluded that the Advisor’s and its affiliates’ level of profitability from their relationship with the Portfolio was reasonable.
The Board considered the effect of the Portfolio’s current size and potential growth on its performance and fees. Although the Portfolio’s advisory fee did not contain breakpoints that would reduce the advisory fee rate on assets above specified asset levels, the Board noted that if the Portfolio’s assets increased over time, the Portfolio might realize other economies of scale if assets increased proportionally more than certain other expenses. The Board also noted that given the Portfolio’s current level of assets, the Portfolio would be unlikely to recognize economies of scale by implementing a breakpoint in the advisory fee at this time.
In reapproving the Investment Advisory Agreement, the Board, including the disinterested Directors, did not identify any single factor as controlling, and each Director may have attributed different weight to various factors.
In evaluating the Investment Subadvisory Agreement, the disinterested Directors reviewed information provided by the Subadvisor relating to its operations, personnel, investment philosophy, strategies and techniques. Among other information, the Subadvisor provided biographical information on portfolio management and other professional staff, performance information for itself, and descriptions of its investment philosophies, strategies and techniques, organizational and management structures and brokerage policies and practices.
The Board reapproved the Investment Subadvisory Agreement between the Subadvisor and the Advisor based on a number of factors relating to the Subadvisor’s ability to perform under the Investment Subadvisory Agreement. In the course of its deliberations, the Board evaluated, among other factors: the nature, extent and the quality of the services to be provided by the Subadvisor; the Subadvisor’s management style and long-term performance record; the Portfolio’s performance record and the Subadvisor’s performance in employing
www.calvert.com CALVERT VP NASDAQ 100 INDEX PORTFOLIO ANNUAL REPORT (UNAUDITED) 25
its investment strategies; the Subadvisor’s current level of staffing and its overall resources; the qualifications and experience of the Subadvisor’s personnel; the Subadvisor’s financial condition with respect to its ability to perform the services required under the Investment Subadvisory Agreement; the Subadvisor’s risk management processes; the Subadvisor’s compliance systems, including those related to personal investing; and any disciplinary history. Based upon its review, the Board concluded that it was satisfied with the nature, extent and quality of services provided to the Portfolio by the Subadvisor under the Investment Subadvisory Agreement.
As noted above, the Board considered, among other information, the Portfolio’s performance during the one-, three- and five-year periods ended June 30, 2013 as compared to the Portfolio’s peer universe and noted that it reviewed on a quarterly basis detailed information about the Portfolio’s performance results, portfolio composition and investment strategies. The Board noted the Advisor’s expertise and resources in monitoring the performance, investment style and risk adjusted performance of the Subadvisor.
In considering the cost of services to be provided by the Subadvisor and the profitability to the Subadvisor of its relationship with the Portfolio, the Board noted that the Advisor and Subadvisor were affiliated and the subadvisory fee under the Investment Subadvisory Agreement was paid by the Advisor out of the advisory fee that the Advisor received under the Investment Advisory Agreement. Based upon its review, the Board determined that the subadvisory fee was reasonable in view of the quality of services received by the Portfolio from the Subadvisor and the other factors considered. Because the Advisor would pay the Subadvisor’s subadvisory fee, the cost of services to be provided by the Subadvisor and the level of profitability to the Subadvisor from its relationship with the Portfolio were not material factors in the Board’s deliberations. For similar reasons, the Board did not consider the potential economies of scale in the Subadvisor’s management of the Portfolio to be a material factor in its consideration.
In reapproving the Investment Subadvisory Agreement, the Board, including the disinterested Directors, did not identify any single factor as controlling, and each Director may have attributed different weight to various factors.
CONCLUSIONS
The Board reached the following conclusions regarding the Investment Advisory Agreement and the Investment Subadvisory Agreement, among others: (a) the Advisor has demonstrated that it possesses the capability and resources to perform the duties required of it under the Investment Advisory Agreement; (b) the Subadvisor is qualified to manage the Portfolio’s assets in accordance with the Portfolio’s investment objective and policies; (c) the Advisor and Subadvisor maintain appropriate compliance programs; (d) the Subadvisor is likely to execute its investment strategies consistently over time; (e) the performance of the Portfolio is satisfactory relative to the performance of passively-managed funds that track the same benchmark index as does the Portfolio; and (f) the Portfolio’s advisory and subadvisory fees are reasonable in view of the quality of services received by the Portfolio from the Advisor and Subadvisor and the other factors considered. Based on its conclusions, the Board determined that reapproval of the Investment Advisory Agreement and the Investment Subadvisory Agreement would be in the best interests of the Portfolio and its shareholders.
26 www.calvert.com CALVERT VP NASDAQ 100 INDEX PORTFOLIO ANNUAL REPORT (UNAUDITED)
This report is intended to provide fund information to shareholders. It is not authorized for distribution to prospective investors unless preceded or accompanied by a prospectus.
Note: The information on our website is not incorporated by reference into this report; our website address is included as an inactive textual reference only.
Investors should carefully consider the investment objectives, risks, charges and expenses of the Calvert Funds. This and other important information is contained in the fund’s summary prospectus and prospectus, which can be obtained from your financial professional and should be read carefully before investing. You may also call Calvert at 800/368-2745 or visit www. calvert.com.
www.calvert.com CALVERT VP NASDAQ 100 INDEX PORTFOLIO ANNUAL REPORT (UNAUDITED) 27

28 www.calvert.com CALVERT VP NASDAQ 100 INDEX PORTFOLIO ANNUAL REPORT (UNAUDITED)
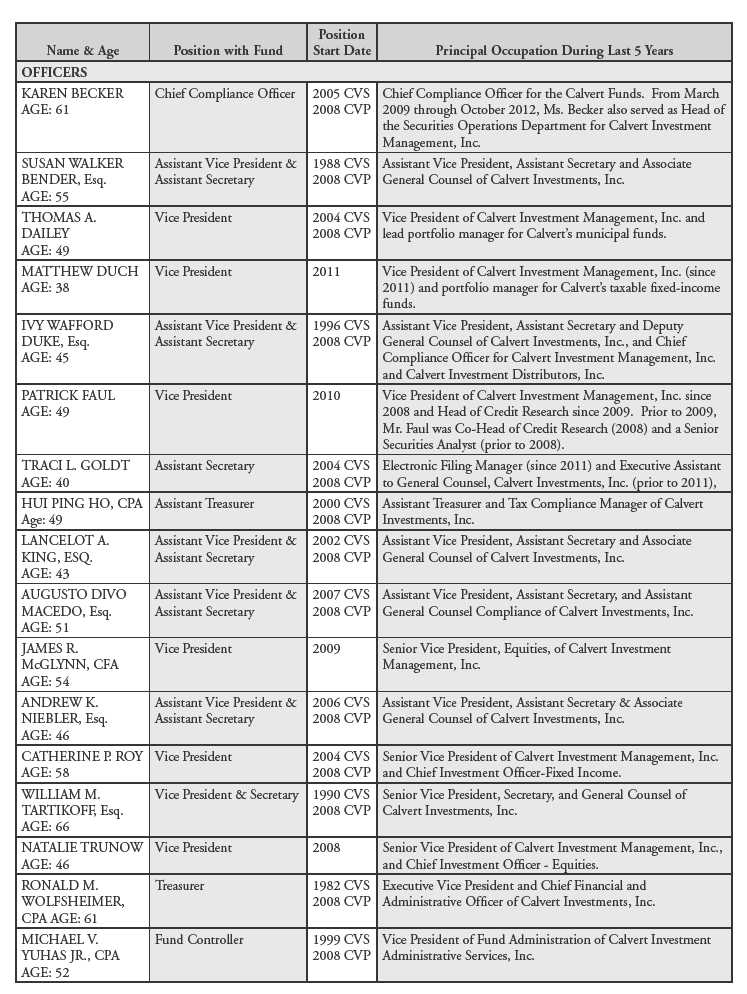
www.calvert.com CALVERT VP NASDAQ 100 INDEX PORTFOLIO ANNUAL REPORT (UNAUDITED) 29
CALVERT VP RUSSELL 2000 SMALL CAP INDEX PORTFOLIO
Portfolio within Calvert Variable Products, Inc.
Managed by Ameritas Investment Partners, Inc., Subadvisor
INVESTMENT PERFORMANCE
For the one-year ended December 31, 2013, Calvert VP Russell 2000 Small Cap Index Portfolio Class I shares returned 37.89% compared with 38.82% for the Russell 2000 Index. The slight underperformance was largely attributable to fees and operating expenses, which the Index does not have.
INVESTMENT CLIMATE
The equity markets earned strong positive returns in 2013 as the U.S. economic recovery continued to take hold. Within the domestic universe, small cap stocks provided the highest return in 2013, up 38.82% as measured by the Russell 2000 Index. Mid-cap and large-cap stocks provided slightly lower returns, with the S&P MidCap 400 Index and S&P 500 Index returning 33.50% and 32.39%, respectively. Domestic equity markets generally outperformed international equity markets, with emerging markets lagging the most.
The Federal Reserve (Fed) continued its accommodative monetary policy in 2013, which provided the fuel to power U.S. stocks higher. Domestic GDP growth improved steadily throughout the year, and inflation remained under control. The housing market continued its recovery—the resulting increases in homeowner equity and consumer confidence and decreases in default rates should benefit the banking industry. Lastly, the combination of increased home values and the rise in the stock market had a significant positive impact on household net worth.
PORTFOLIO STRATEGY
As an index fund, the Portfolio seeks, as closely as possible, to replicate the holdings and match the performance of the Russell 2000 Index. In pursuit of this objective, the Portfolio employs a passive management approach to replicate the Index.
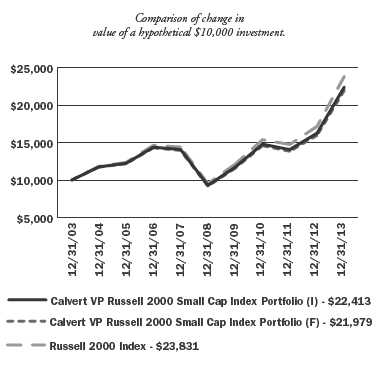
| | AVERAGE ANNUAL TOTAL RETURN |
| | (period ended 12.31.13) |
| | Class I | Class F |
| One year | 37.89% | 37.62% |
| Five year | 19.24% | 19.00% |
| Ten year | 8.41% | 8.19%* |
The performance data shown represents past performance, does not guarantee future results and assumes reinvestment of all dividends and distributions. All performance data reflects fee waivers and/or expense limitations, if any are in effect; in their absence performance would be lower. See Note B in Notes to Financial Statements. The investment return and principal value of an investment will fluctuate so that an investor’s shares, when redeemed, may be worth more or less than their original cost. Current performance may be lower or higher than the performance data quoted.
Visit www.calvert.com/institutional-VP-performance.html for current performance data. The gross expense ratio from the current prospectus for Class I shares is 0.77%. This number may vary from the expense ratio shown elsewhere in this report because it is based on a different time period and, if applicable, does not include fee or expense waivers. The performance data and expense ratio reflect deduction of Portfolio operating expenses, but do not reflect charges and expenses imposed under the variable annuity or life insurance contract.
* Class F share performance prior to October 1, 2007 is based on Class I performance, adjusted to reflect Class F expenses.
4 www.calvert.com CALVERT VP RUSSELL 2000 SMALL CAP INDEX PORTFOLIO ANNUAL REPORT
| |
| | % OF TOTAL |
| ECONOMIC SECTORS | INVESTMENTS |
| |
| Consumer Discretionary | 12.9% |
| Consumer Staples | 3.6% |
| Energy | 5.1% |
| Exchange Traded Products | 3.9% |
| Financials | 21.0% |
| Government | 0.3% |
| Health Care | 12.1% |
| Industrials | 14.3% |
| Information Technology | 15.8% |
| Materials | 4.5% |
| Short-Term Investments | 3.1% |
| Telecommunication Services | 0.7% |
| Utilities | 2.7% |
| Total | 100% |
At year-end, the Index’s largest exposures were to the Financial and Information Technology sectors, at 21.0% and 15.8%, respectively. Other significant weightings included Consumer Discretionary, Health Care, and Industrials, which ranged from 12.1% to 14.3%. The smallest exposures were to Utilities and Telecommunications Services, at 2.7% and 0.7%, respectively. The top performers were Healthcare, up 51.7%, and Consumer Staples, up 47.7%. The weakest performers sectors were Utilities, up 21.8%, and Materials, up 28.0%.
During 2013, the Portfolio continued to meet its investment objective of closely tracking the total return of the Index. Market fluctuation and cash flows may cause the Portfolio to hold a slightly different weighting than the Index. Since the Russell 2000 Index is not an actual mutual fund, it is not possible to invest directly in it. Unlike the Index, the Portfolio incurs operating expenses.
OUTLOOK
Entering 2014, the outlook for equities is mildly positive. The economy continues to recover and corporate earnings remain strong, although valuations have become more stretched and the market is pricing in a fairly optimistic outlook already. The unemployment rate is declining and the economy will not suffer the same fiscal drag that it did last year from the sequester.
The Fed has begun the tapering process. And while the tone in Washington has improved slightly, the government’s inability to function properly does remain a concern. In addition, economic growth in Europe remains sluggish and China’s growth appears to have slowed.
That said, the Fed anticipates keeping short-term rates low for an extended period of time after it ends its asset-purchasing program. Although it is unlikely that 2014 will provide returns similar to 2013, Fed policies should provide a positive backdrop for equities in the year ahead.
January 2014
www.calvert.com CALVERT VP RUSSELL 2000 SMALL CAP INDEX PORTFOLIO ANNUAL REPORT 5
SHAREHOLDER EXPENSE EXAMPLE
As a shareholder of the Fund, you incur two types of costs: (1) transaction costs, and (2) ongoing costs, including management fees and other Fund expenses. This Example is intended to help you understand your ongoing costs (in dollars) of investing in the Fund and to compare these costs with the ongoing costs of investing in other mutual funds.
This Example is based on an investment of $1,000 invested at the beginning of the period and held for the entire period (July 1, 2013 to December 31, 2013).
Note: Expenses do not reflect charges and expenses of the variable annuity or variable universal life contract.
Actual Expenses
The first line of the table below provides information about actual account values and actual expenses. You may use the information in this line, together with the amount you invested, to estimate the expenses that you paid over the period. Simply divide your account value by $1,000 (for example, an $8,600 account value divided by $1,000 = 8.6), then multiply the result by the number in the first line under the heading entitled “Expenses Paid During Period” to estimate the expenses you paid on your account during this period.
Hypothetical Example for Comparison Purposes
The second line of the table below provides information about hypothetical account values and hypothetical expenses based on the Fund’s actual expense ratio and an assumed rate of return of 5% per year before expenses, which is not the Fund’s actual return. The hypothetical account values and expenses may not be used to estimate the actual ending account balance or expenses you paid for the period. You may use this information to compare the ongoing costs of investing in the Fund and other funds. To do so, compare the 5% hypothetical example with the 5% hypothetical examples that appear in the shareholder reports of the other funds.
Please note that the expenses shown in the table are meant to highlight your ongoing costs only and do not reflect any transactional costs. Therefore, the second line of the table is useful in comparing ongoing costs only, and will not help you determine the relative total costs of owning different funds. In addition, if these transactional costs were included, your costs would have been higher.
| | BEGINNING | ENDING | EXPENSES PAID |
| | ACCOUNT VALUE | ACCOUNT VALUE | DURING PERIOD* |
| | 7/1/13 | 12/31/13 | 7/1/13 - 12/31/13 |
| Class I | | | |
| Actual | $1,000.00 | $1,194.69 | $3.71 |
| |
Hypothetical
(5% return per year before expenses) | $1,000.00 | $1,021.82 | $3.42 |
| |
| Class F | | | |
| Actual | $1,000.00 | $1,193.44 | $4.88 |
| |
Hypothetical
(5% return per year before expenses) | $1,000.00 | $1,020.75 | $4.50 |
* Expenses are equal to the Fund’s annualized expense ratio of 0.67% and 0.88%, respectively, multiplied by the average account value over the period, multiplied by 184/365 (to reflect the one-half year period).
6 www.calvert.com CALVERT VP RUSSELL 2000 SMALL CAP INDEX PORTFOLIO ANNUAL REPORT
REPORT OF INDEPENDENT REGISTERED PUBLIC ACCOUNTING FIRM
The Board of Directors of Calvert Variable Products, Inc. and Shareholders of Calvert VP Russell 2000 Small Cap Index Portfolio: We have audited the accompanying statement of net assets of the Calvert VP Russell 2000 Small Cap Index Portfolio (the “Portfolio”), a series of Calvert Variable Products, Inc., as of December 31, 2013, and the related statement of operations for the year then ended, the statements of changes in net assets for each of the years in the two-year period then ended, and the financial highlights for each of the years in the five-year period then ended. These financial statements and financial highlights are the responsibility of the Portfolio’s management. Our responsibility is to express an opinion on these financial statements and financial highlights based on our audits.
We conducted our audits in accordance with the standards of the Public Company Accounting Oversight Board (United States). Those standards require that we plan and perform the audit to obtain reasonable assurance about whether the financial statements and financial highlights are free of material misstatement. An audit includes examining, on a test basis, evidence supporting the amounts and disclosures in the financial statements. Our procedures included confirmation of securities owned as of December 31, 2013, by correspondence with the custodian and brokers or by performing other appropriate auditing procedures. An audit also includes assessing the accounting principles used and significant estimates made by management, as well as evaluating the overall financial statement presentation. We believe that our audits provide a reasonable basis for our opinion.
In our opinion, the financial statements and financial highlights referred to above present fairly, in all material respects, the financial position of the Calvert VP Russell 2000 Small Cap Index Portfolio as of December 31, 2013, the results of its operations for the year then ended, the changes in its net assets for each of the years in the two-year period then ended, and the financial highlights for each of the years in the five-year period then ended, in conformity with U.S. generally accepted accounting principles.

Philadelphia, Pennsylvania
February 24, 2014
www.calvert.com CALVERT VP RUSSELL 2000 SMALL CAP INDEX PORTFOLIO ANNUAL REPORT 7
| | |
| STATEMENT OF NET ASSETS |
| DECEMBER 31, 2013 |
| |
| EQUITY SECURITIES - 92.8% | SHARES | VALUE |
| Aerospace & Defense - 1.6% | | |
| AAR Corp | 3,414 | $95,626 |
| Aerovironment, Inc.* | 1,447 | 42,151 |
| American Science & Engineering, Inc | 703 | 50,553 |
| API Technologies Corp.* | 2,912 | 9,930 |
| Astronics Corp.* | 1,303 | 66,453 |
| Cubic Corp. | 1,711 | 90,101 |
| Curtiss-Wright Corp. | 4,038 | 251,285 |
| DigitalGlobe, Inc.* | 6,423 | 264,306 |
| Ducommun, Inc.* | 914 | 27,246 |
| Engility Holdings, Inc.* | 1,480 | 49,432 |
| Erickson Air-Crane, Inc.* | 325 | 6,757 |
| Esterline Technologies Corp.* | 2,697 | 274,986 |
| GenCorp, Inc.* | 5,118 | 92,226 |
| HEICO Corp | 5,729 | 331,996 |
| Innovative Solutions & Support, Inc.* | 1,085 | 7,910 |
| Kratos Defense & Security Solutions, Inc.* | 3,789 | 29,099 |
| LMI Aerospace, Inc.* | 916 | 13,502 |
| Moog, Inc.* | 3,982 | 270,537 |
| National Presto Industries, Inc.* | 420 | 33,810 |
| Orbital Sciences Corp.* | 5,042 | 117,479 |
| Sparton Corp.* | 882 | 24,652 |
| Taser International, Inc.* | 4,416 | 70,126 |
| Teledyne Technologies, Inc.* | 3,292 | 302,403 |
| The Keyw Holding Corp.* | 2,749 | 36,947 |
| | | 2,559,513 |
| |
| Air Freight & Logistics - 0.4% | | |
| Air Transport Services Group, Inc.* | 4,743 | 38,371 |
| Atlas Air Worldwide Holdings, Inc.* | 2,227 | 91,641 |
| Echo Global Logistics, Inc.* | 1,329 | 28,547 |
| Forward Air Corp | 2,539 | 111,488 |
| HUB Group, Inc.* | 3,189 | 127,177 |
| Pacer International, Inc.* | 3,629 | 29,976 |
| Park-Ohio Holdings Corp.* | 726 | 38,042 |
| UTi Worldwide, Inc | 7,825 | 137,407 |
| XPO Logistics, Inc.* | 2,536 | 66,671 |
| | | 669,320 |
| |
| Airlines - 0.5% | | |
| Allegiant Travel Co | 1,330 | 140,235 |
| Hawaiian Holdings, Inc.* | 4,528 | 43,605 |
| JetBlue Airways Corp.* | 20,251 | 173,146 |
| Republic Airways Holdings, Inc.* | 4,602 | 49,195 |
| Skywest, Inc. | 4,346 | 64,451 |
| Spirit Airlines, Inc.* | 5,200 | 236,132 |
| | | 706,764 |
| |
| Auto Components - 0.9% | | |
| American Axle & Manufacturing Holdings, Inc.* | 6,004 | 122,782 |
| Cooper Tire & Rubber Co. | 5,462 | 131,306 |
| Dana Holding Corp | 12,662 | 248,428 |
| Dorman Products, Inc.* | 2,205 | 123,634 |
8 www.calvert.com CALVERT VP RUSSELL 2000 SMALL CAP INDEX PORTFOLIO ANNUAL REPORT
| | |
| EQUITY SECURITIES - CONT’D | SHARES | VALUE |
| Auto Components - Cont’d | | |
| Drew Industries, Inc. | 1,976 | $101,171 |
| Federal-Mogul Corp.* | 1,665 | 32,767 |
| Fox Factory Holding Corp.* | 848 | 14,942 |
| Fuel Systems Solutions, Inc.* | 1,211 | 16,797 |
| Gentherm, Inc.* | 2,882 | 77,266 |
| Modine Manufacturing Co.* | 4,047 | 51,883 |
| Remy International, Inc. | 1,208 | 28,171 |
| Shiloh Industries, Inc.* | 483 | 9,419 |
| Spartan Motors, Inc. | 3,414 | 22,874 |
| Standard Motor Products, Inc. | 1,820 | 66,976 |
| Stoneridge, Inc.* | 2,174 | 27,719 |
| Superior Industries International, Inc | 2,023 | 41,734 |
| Tenneco, Inc.* | 5,359 | 303,159 |
| Tower International, Inc.* | 681 | 14,573 |
| | | 1,435,601 |
| |
| Automobiles - 0.0% | | |
| Winnebago Industries, Inc.* | 2,545 | 69,860 |
| |
| Beverages - 0.2% | | |
| Coca Cola Bottling Co. Consolidated | 436 | 31,911 |
| Craft Brew Alliance, Inc.* | 855 | 14,039 |
| National Beverage Corp.* | 1,154 | 23,264 |
| The Boston Beer Company, Inc.* | 711 | 171,913 |
| | | 241,127 |
| |
| Biotechnology - 3.8% | | |
| ACADIA Pharmaceuticals, Inc.* | 6,043 | 151,015 |
| Acceleron Pharma, Inc.* | 565 | 22,374 |
| Achillion Pharmaceuticals, Inc.* | 8,327 | 27,646 |
| Acorda Therapeutics, Inc.* | 3,610 | 105,412 |
| Aegerion Pharmaceuticals, Inc.* | 2,503 | 177,613 |
| Agios Pharmaceuticals, Inc.* | 588 | 14,083 |
| Alnylam Pharmaceuticals, Inc.* | 5,119 | 329,305 |
| AMAG Pharmaceuticals, Inc.* | 1,838 | 44,608 |
| Amicus Therapeutics, Inc.* | 2,714 | 6,378 |
| Anacor Pharmaceuticals, Inc.* | 2,185 | 36,664 |
| Arena Pharmaceuticals, Inc.* | 18,780 | 109,863 |
| Arqule, Inc.* | 5,260 | 11,309 |
| Array Biopharma, Inc.* | 10,324 | 51,723 |
| AVEO Pharmaceuticals, Inc.* | 3,503 | 6,446 |
| BIND Therapeutics, Inc.* | 466 | 7,032 |
| Biotime, Inc.* | 3,184 | 11,462 |
| Bluebird Bio, Inc.* | 587 | 12,315 |
| Cell Therapeutics, Inc.* | 9,713 | 18,649 |
| Celldex Therapeutics, Inc.* | 7,854 | 190,145 |
| Cellular Dynamics International, Inc.* | 330 | 5,448 |
| Cepheid, Inc.* | 5,907 | 275,975 |
| Chelsea Therapeutics International Ltd.* | 5,785 | 25,628 |
| ChemoCentryx, Inc.* | 2,120 | 12,275 |
| Chimerix, Inc.* | 732 | 11,061 |
| Clovis Oncology, Inc.* | 1,580 | 95,227 |
| Conatus Pharmaceuticals, Inc.* | 516 | 3,328 |
| Coronado Biosciences, Inc.* | 1,792 | 4,713 |
| Curis, Inc.* | 6,491 | 18,305 |
| Cytokinetics, Inc.* | 2,136 | 13,884 |
www.calvert.com CALVERT VP RUSSELL 2000 SMALL CAP INDEX PORTFOLIO ANNUAL REPORT 9
| | |
| EQUITY SECURITIES - CONT’D | SHARES | VALUE |
| Biotechnology - Cont’d | | |
| Cytori Therapeutics, Inc.* | 4,706 | $12,094 |
| Dendreon Corp.* | 13,865 | 41,456 |
| Durata Therapeutics, Inc.* | 750 | 9,592 |
| Dyax Corp.* | 10,454 | 78,719 |
| Dynavax Technologies Corp.* | 23,389 | 45,842 |
| Emergent Biosolutions, Inc.* | 2,331 | 53,590 |
| Enanta Pharmaceuticals, Inc.* | 314 | 8,566 |
| Enzon Pharmaceuticals, Inc. | 3,403 | 3,947 |
| Epizyme, Inc.* | 510 | 10,608 |
| Esperion Therapeutics, Inc.* | 393 | 5,400 |
| Exact Sciences Corp.* | 6,095 | 71,251 |
| Exelixis, Inc.* | 16,302 | 99,931 |
| Fibrocell Science, Inc.* | 1,454 | 5,903 |
| Five Prime Therapeutics, Inc.* | 495 | 8,311 |
| Foundation Medicine, Inc.* | 605 | 14,411 |
| Galena Biopharma, Inc.* | 8,878 | 44,035 |
| Genomic Health, Inc.* | 1,445 | 42,295 |
| Geron Corp.* | 10,723 | 50,827 |
| GTx, Inc.* | 2,343 | 3,866 |
| Halozyme Therapeutics, Inc.* | 8,079 | 121,104 |
| Harvard Apparatus Regenerative Technology, Inc.* | 473 | 2,247 |
| Hyperion Therapeutics, Inc.* | 724 | 14,639 |
| Idenix Pharmaceuticals, Inc.* | 7,999 | 47,834 |
| Immunogen, Inc.* | 7,409 | 108,690 |
| Immunomedics, Inc.* | 6,814 | 31,344 |
| Infinity Pharmaceuticals, Inc.* | 4,129 | 57,021 |
| Insmed, Inc.* | 2,996 | 50,962 |
| Insys Therapeutics, Inc.* | 437 | 16,916 |
| Intercept Pharmaceuticals, Inc.* | 616 | 42,060 |
| InterMune, Inc.* | 7,879 | 116,058 |
| Intrexon Corp.* | 989 | 23,538 |
| Ironwood Pharmaceuticals, Inc.* | 8,024 | 93,159 |
| Isis Pharmaceuticals, Inc.* | 9,736 | 387,882 |
| KaloBios Pharmaceuticals, Inc.* | 173 | 765 |
| Karyopharm Therapeutics, Inc.* | 689 | 15,792 |
| Keryx Biopharmaceuticals, Inc.* | 7,220 | 93,499 |
| KYTHERA Biopharmaceuticals, Inc.* | 1,038 | 38,666 |
| Lexicon Pharmaceuticals, Inc.* | 17,874 | 32,173 |
| Ligand Pharmaceuticals, Inc., Class B* | 1,536 | 80,794 |
| MacroGenics, Inc.* | 507 | 13,907 |
| MannKind Corp.* | 12,827 | 66,829 |
| MEI Pharma, Inc.* | 828 | 6,632 |
| Merrimack Pharmaceuticals, Inc.* | 7,836 | 41,844 |
| MiMedx Group, Inc.* | 8,019 | 70,086 |
| Momenta Pharmaceuticals, Inc.* | 4,217 | 74,557 |
| Nanosphere, Inc.* | 3,621 | 8,292 |
| Navidea Biopharmaceuticals, Inc.* | 10,313 | 21,348 |
| Neurocrine Biosciences, Inc.* | 5,970 | 55,760 |
| NewLink Genetics Corp.* | 1,456 | 32,047 |
| Novavax, Inc.* | 16,091 | 82,386 |
| NPS Pharmaceuticals, Inc.* | 8,652 | 262,675 |
| OncoGenex Pharmaceutical, Inc.* | 1,309 | 10,917 |
| OncoMed Pharmaceuticals, Inc.* | 404 | 11,926 |
| Onconova Therapeutics, Inc.* | 511 | 5,866 |
| Ophthotech Corp.* | 781 | 25,265 |
| Opko Health, Inc.* | 16,296 | 137,538 |
10 www.calvert.com CALVERT VP RUSSELL 2000 SMALL CAP INDEX PORTFOLIO ANNUAL REPORT
| | |
| EQUITY SECURITIES - CONT’D | SHARES | VALUE |
| Biotechnology - Cont’d | | |
| Orexigen Therapeutics, Inc.* | 8,161 | $45,946 |
| Osiris Therapeutics, Inc.* | 1,445 | 23,236 |
| OvaScience, Inc.* | 773 | 7,065 |
| PDL BioPharma, Inc | 12,211 | 103,061 |
| Peregrine Pharmaceuticals, Inc.* | 11,824 | 16,435 |
| Portola Pharmaceuticals, Inc.* | 835 | 21,501 |
| Progenics Pharmaceuticals, Inc.* | 5,151 | 27,455 |
| Prothena Corp. plc* | 1,253 | 33,230 |
| PTC Therapeutics, Inc.* | 827 | 14,034 |
| Puma Biotechnology, Inc.* | 1,910 | 197,742 |
| Raptor Pharmaceutical Corp.* | 4,911 | 63,941 |
| Receptos, Inc.* | 498 | 14,437 |
| Regulus Therapeutics, Inc.* | 1,151 | 8,506 |
| Repligen Corp.* | 2,777 | 37,878 |
| Rigel Pharmaceuticals, Inc.* | 7,590 | 21,632 |
| Sangamo Biosciences, Inc.* | 5,243 | 72,825 |
| Sarepta Therapeutics, Inc.* | 3,311 | 67,445 |
| SIGA Technologies, Inc.* | 2,826 | 9,241 |
| Spectrum Pharmaceuticals, Inc.* | 5,050 | 44,693 |
| Stemline Therapeutics, Inc.* | 789 | 15,464 |
| Sunesis Pharmaceuticals, Inc.* | 2,400 | 11,376 |
| Synageva BioPharma Corp.* | 1,673 | 108,277 |
| Synergy Pharmaceuticals, Inc.* | 6,947 | 39,112 |
| Synta Pharmaceuticals Corp.* | 3,342 | 17,512 |
| Targacept, Inc.* | 2,414 | 10,018 |
| TESARO, Inc.* | 1,154 | 32,589 |
| Tetraphase Pharmaceuticals, Inc.* | 993 | 13,425 |
| TG Therapeutics, Inc.* | 1,102 | 4,298 |
| Threshold Pharmaceuticals, Inc.* | 4,048 | 18,904 |
| Vanda Pharmaceuticals, Inc.* | 2,587 | 32,105 |
| Verastem, Inc.* | 1,244 | 14,182 |
| Vical, Inc.* | 7,213 | 8,511 |
| XOMA Corp.* | 6,130 | 41,255 |
| ZIOPHARM Oncology, Inc.* | 5,687 | 24,682 |
| | | 5,935,561 |
| |
| Building Products - 0.7% | | |
| AAON, Inc. | 2,368 | 75,658 |
| American Woodmark Corp.* | 938 | 37,079 |
| Apogee Enterprises, Inc | 2,456 | 88,195 |
| Builders FirstSource, Inc.* | 3,852 | 27,503 |
| Gibraltar Industries, Inc.* | 2,647 | 49,208 |
| Griffon Corp | 3,918 | 51,757 |
| Insteel Industries, Inc. | 1,631 | 37,073 |
| NCI Building Systems, Inc.* | 1,877 | 32,923 |
| Norcraft Co.’s, Inc.* | 648 | 12,714 |
| Nortek, Inc.* | 776 | 57,890 |
| Patrick Industries, Inc.* | 575 | 16,635 |
| PGT, Inc.* | 2,861 | 28,953 |
| Ply Gem Holdings, Inc.* | 1,362 | 24,557 |
| Quanex Building Products Corp. | 3,310 | 65,935 |
| Simpson Manufacturing Co., Inc | 3,602 | 132,301 |
| Trex Co., Inc.* | 1,482 | 117,863 |
| Universal Forest Products, Inc. | 1,697 | 88,481 |
| USG Corp.* | 6,671 | 189,323 |
| | | 1,134,048 |
www.calvert.com CALVERT VP RUSSELL 2000 SMALL CAP INDEX PORTFOLIO ANNUAL REPORT 11
| | |
| EQUITY SECURITIES - CONT’D | SHARES | VALUE |
| Capital Markets - 2.6% | | |
| Apollo Investment Corp | 19,381 | $164,351 |
| Arlington Asset Investment Corp. | 1,267 | 33,436 |
| BGC Partners, Inc | 10,956 | 66,393 |
| BlackRock Kelso Capital Corp. | 6,249 | 58,303 |
| Calamos Asset Management, Inc | 1,559 | 18,459 |
| Capital Southwest Corp. | 1,056 | 36,823 |
| Capitala Finance Corp. | 352 | 7,005 |
| CIFC Corp. | 974 | 7,578 |
| Cohen & Steers, Inc | 1,662 | 66,580 |
| Cowen Group, Inc.* | 8,421 | 32,926 |
| Diamond Hill Investment Group, Inc | 250 | 29,585 |
| Evercore Partners, Inc | 2,727 | 163,020 |
| FBR & Co.* | 825 | 21,763 |
| Fidus Investment Corp | 1,213 | 26,371 |
| Fifth Street Finance Corp. | 11,775 | 108,919 |
| Financial Engines, Inc. | 4,308 | 299,320 |
| FXCM, Inc. | 3,154 | 56,267 |
| GAMCO Investors, Inc. | 520 | 45,224 |
| Garrison Capital, Inc. | 518 | 7,190 |
| GFI Group, Inc | 5,807 | 22,705 |
| Gladstone Capital Corp. | 2,184 | 20,966 |
| Gladstone Investment Corp. | 2,292 | 18,473 |
| Golub Capital BDC, Inc | 2,989 | 57,120 |
| Greenhill & Co., Inc | 2,431 | 140,852 |
| GSV Capital Corp.* | 1,740 | 21,037 |
| Hercules Technology Growth Capital, Inc | 5,385 | 88,314 |
| HFF, Inc.* | 2,937 | 78,858 |
| Horizon Technology Finance Corp. | 563 | 8,000 |
| ICG Group, Inc.* | 3,171 | 59,076 |
| Intl. FCStone, Inc.* | 1,181 | 21,896 |
| Investment Technology Group, Inc.* | 3,390 | 69,698 |
| Janus Capital Group, Inc. | 12,867 | 159,165 |
| JMP Group, Inc. | 1,155 | 8,547 |
| KCAP Financial, Inc. | 2,250 | 18,157 |
| KCG Holdings, Inc.* | 6,162 | 73,698 |
| Ladenburg Thalmann Financial Services, Inc.* | 8,462 | 26,486 |
| Main Street Capital Corp | 3,369 | 110,133 |
| Manning & Napier, Inc. | 1,043 | 18,409 |
| Marcus & Millichap, Inc.* | 608 | 9,059 |
| MCG Capital Corp | 6,694 | 29,454 |
| Medallion Financial Corp. | 1,611 | 23,118 |
| Medley Capital Corp | 3,453 | 47,824 |
| MVC Capital, Inc. | 2,126 | 28,701 |
| New Mountain Finance Corp. | 3,978 | 59,829 |
| NGP Capital Resources Co | 2,245 | 16,770 |
| Oppenheimer Holdings, Inc. | 932 | 23,095 |
| PennantPark Floating Rate Capital Ltd. | 1,273 | 17,478 |
| PennantPark Investment Corp. | 5,831 | 67,640 |
| Piper Jaffray Co.’s* | 1,472 | 58,218 |
| Prospect Capital Corp. | 24,074 | 270,110 |
| Pzena Investment Management, Inc | 491 | 5,774 |
| Safeguard Scientifics, Inc.* | 1,902 | 38,211 |
| Silvercrest Asset Management Group, Inc. | 474 | 8,082 |
| Solar Capital Ltd | 3,961 | 89,321 |
| Solar Senior Capital Ltd | 800 | 14,576 |
| Stellus Capital Investment Corp | 1,039 | 15,533 |
12 www.calvert.com CALVERT VP RUSSELL 2000 SMALL CAP INDEX PORTFOLIO ANNUAL REPORT
| | |
| EQUITY SECURITIES - CONT’D | SHARES | VALUE |
| Capital Markets - Cont’d | | |
| Stifel Financial Corp.* | 5,499 | $263,512 |
| SWS Group, Inc.* | 2,652 | 16,124 |
| TCP Capital Corp | 3,135 | 52,605 |
| THL Credit, Inc. | 2,926 | 48,250 |
| TICC Capital Corp. | 4,231 | 43,748 |
| Triangle Capital Corp. | 2,291 | 63,346 |
| Virtus Investment Partners, Inc.* | 581 | 116,229 |
| Walter Investment Management Corp.* | 3,180 | 112,445 |
| Westwood Holdings Group, Inc | 603 | 37,332 |
| WhiteHorse Finance, Inc. | 588 | 8,885 |
| WisdomTree Investments, Inc.* | 8,663 | 153,422 |
| | | 4,009,794 |
| |
| Chemicals - 2.2% | | |
| Advanced Emissions Solutions, Inc.* | 947 | 51,356 |
| American Pacific Corp.* | 510 | 19,003 |
| American Vanguard Corp | 2,506 | 60,871 |
| Arabian American Development Co.* | 1,798 | 22,565 |
| Axiall Corp | 6,149 | 291,709 |
| Balchem Corp. | 2,635 | 154,673 |
| Calgon Carbon Corp.* | 4,914 | 101,081 |
| Chase Corp. | 526 | 18,568 |
| Chemtura Corp.* | 8,478 | 236,706 |
| Ferro Corp.* | 6,247 | 80,149 |
| Flotek Industries, Inc.* | 4,103 | 82,347 |
| FutureFuel Corp. | 1,874 | 29,609 |
| GSE Holding, Inc.* | 707 | 1,463 |
| H.B. Fuller Co. | 4,339 | 225,802 |
| Hawkins, Inc | 759 | 28,227 |
| Innophos Holdings, Inc. | 1,962 | 95,353 |
| Innospec, Inc. | 2,080 | 96,138 |
| Intrepid Potash, Inc.* | 4,719 | 74,749 |
| KMG Chemicals, Inc. | 568 | 9,594 |
| Koppers Holdings, Inc. | 1,798 | 82,258 |
| Kraton Performance Polymers, Inc.* | 2,903 | 66,914 |
| Landec Corp.* | 2,282 | 27,658 |
| LSB Industries, Inc.* | 1,588 | 65,140 |
| Marrone Bio Innovations, Inc.* | 470 | 8,357 |
| Minerals Technologies, Inc. | 3,006 | 180,570 |
| Olin Corp. | 6,924 | 199,757 |
| OM Group, Inc.* | 2,757 | 100,382 |
| Omnova Solutions, Inc.* | 3,910 | 35,620 |
| Penford Corp.* | 829 | 10,653 |
| PolyOne Corp. | 8,753 | 309,419 |
| Quaker Chemical Corp | 1,166 | 89,864 |
| Schulman A, Inc. | 2,537 | 89,455 |
| Sensient Technologies Corp | 4,390 | 213,003 |
| Stepan Co. | 1,626 | 106,714 |
| Taminco Corp.* | 1,362 | 27,526 |
| Tredegar Corp. | 2,145 | 61,797 |
| Zep, Inc. | 1,900 | 34,504 |
| Zoltek Co.’s, Inc.* | 2,577 | 43,165 |
| | | 3,432,719 |
www.calvert.com CALVERT VP RUSSELL 2000 SMALL CAP INDEX PORTFOLIO ANNUAL REPORT 13
| | |
| EQUITY SECURITIES - CONT’D | SHARES | VALUE |
| Commercial Banks - 6.8% | | |
| 1st Source Corp. | 1,417 | $45,259 |
| 1st United Bancorp, Inc. | 2,033 | 15,471 |
| Access National Corp. | 665 | 9,942 |
| American National Bankshares, Inc | 705 | 18,506 |
| Ameris Bancorp* | 2,059 | 43,465 |
| Ames National Corp. | 756 | 16,927 |
| Arrow Financial Corp | 965 | 25,630 |
| Bancfirst Corp | 651 | 36,495 |
| Banco Latinoamericano de Exportaciones SA | 2,403 | 67,332 |
| Bancorp, Inc.* | 2,605 | 46,656 |
| BancorpSouth, Inc. | 8,208 | 208,647 |
| Bank of Kentucky Financial Corp. | 473 | 17,454 |
| Bank of Marin Bancorp | 545 | 23,648 |
| Bank of the Ozarks, Inc. | 2,739 | 155,000 |
| Banner Corp. | 1,639 | 73,460 |
| Bar Harbor Bankshares | 350 | 13,996 |
| BBCN Bancorp, Inc | 6,810 | 112,978 |
| BNC Bancorp | 1,580 | 27,081 |
| Boston Private Financial Holdings, Inc. | 7,038 | 88,820 |
| Bridge Bancorp, Inc. | 963 | 25,038 |
| Bridge Capital Holdings* | 752 | 15,446 |
| Bryn Mawr Bank Corp. | 1,004 | 30,301 |
| C&F Financial Corp. | 289 | 13,199 |
| Camden National Corp | 710 | 29,976 |
| Capital Bank Financial Corp.* | 2,138 | 48,639 |
| Capital City Bank Group, Inc.* | 1,232 | 14,501 |
| Cardinal Financial Corp | 2,513 | 45,234 |
| Cascade Bancorp* | 500 | 2,615 |
| Cathay General Bancorp | 6,801 | 181,791 |
| Center Bancorp, Inc | 993 | 18,629 |
| Centerstate Banks of Florida, Inc. | 2,552 | 25,903 |
| Central Pacific Financial Corp. | 1,947 | 39,096 |
| Century Bancorp, Inc | 277 | 9,210 |
| Chemical Financial Corp. | 2,475 | 78,383 |
| Chemung Financial Corp | 311 | 10,627 |
| Citizens & Northern Corp | 1,125 | 23,209 |
| City Holding Co | 1,381 | 63,982 |
| CNB Financial Corp. | 1,282 | 24,358 |
| CoBiz Financial, Inc | 2,995 | 35,820 |
| Columbia Banking System, Inc | 4,522 | 124,400 |
| Community Bank System, Inc. | 3,552 | 140,943 |
| Community Trust Bancorp, Inc. | 1,197 | 54,057 |
| CommunityOne Bancorp* | 901 | 11,488 |
| ConnectOne Bancorp, Inc.* | 155 | 6,143 |
| CU Bancorp* | 810 | 14,159 |
| Customers Bancorp, Inc.* | 1,722 | 35,232 |
| CVB Financial Corp. | 7,857 | 134,119 |
| Eagle Bancorp, Inc.* | 1,876 | 57,462 |
| Enterprise Bancorp, Inc | 478 | 10,119 |
| Enterprise Financial Services Corp. | 1,698 | 34,673 |
| Farmers Capital Bank Corp.* | 644 | 14,007 |
| Fidelity Southern Corp. | 1,093 | 18,155 |
| Financial Institutions, Inc. | 1,134 | 28,021 |
| First BanCorp* | 6,329 | 39,177 |
| First Bancorp (North Carolina) | 1,553 | 25,811 |
| First Bancorp, Inc. (Maine) | 691 | 12,037 |
14 www.calvert.com CALVERT VP RUSSELL 2000 SMALL CAP INDEX PORTFOLIO ANNUAL REPORT
| | |
| EQUITY SECURITIES - CONT’D | SHARES | VALUE |
| Commercial Banks - Cont’d | | |
| First Busey Corp. | 6,352 | $36,842 |
| First Commonwealth Financial Corp. | 8,442 | 74,458 |
| First Community Bancshares, Inc. | 1,464 | 24,449 |
| First Connecticut Bancorp, Inc. | 1,473 | 23,745 |
| First Financial Bancorp | 5,061 | 88,213 |
| First Financial Bankshares, Inc. | 2,725 | 180,722 |
| First Financial Corp. | 966 | 35,317 |
| First Financial Holdings, Inc. | 2,077 | 138,141 |
| First Interstate Bancsystem, Inc | 1,462 | 41,477 |
| First Merchants Corp. | 3,106 | 70,693 |
| First Midwest Bancorp, Inc. | 6,478 | 113,559 |
| First NBC Bank Holding Co.* | 359 | 11,596 |
| First of Long Island Corp | 601 | 25,765 |
| First Security Group, Inc.* | 5,383 | 12,381 |
| FirstMerit Corp | 14,600 | 324,558 |
| Flushing Financial Corp | 2,726 | 56,428 |
| FNB Corp | 13,233 | 167,000 |
| German American Bancorp, Inc | 1,152 | 32,832 |
| Glacier Bancorp, Inc. | 6,291 | 187,409 |
| Great Southern Bancorp, Inc | 940 | 28,585 |
| Guaranty Bancorp | 1,371 | 19,263 |
| Hampton Roads Bankshares, Inc.* | 2,909 | 5,091 |
| Hancock Holding Co | 7,320 | 268,498 |
| Hanmi Financial Corp. | 2,835 | 62,058 |
| Heartland Financial USA, Inc. | 1,357 | 39,068 |
| Heritage Commerce Corp. | 1,714 | 14,123 |
| Heritage Financial Corp. | 1,400 | 23,954 |
| Heritage Oaks Bancorp* | 1,809 | 13,568 |
| Home Bancshares, Inc | 3,846 | 143,648 |
| Home Federal Bancorp, Inc. | 1,548 | 23,065 |
| HomeTrust Bancshares, Inc.* | 1,850 | 29,581 |
| Horizon Bancorp | 750 | 18,997 |
| Hudson Valley Holding Corp. | 1,336 | 27,188 |
| IBERIABANK Corp. | 2,560 | 160,896 |
| Independent Bank Corp | 2,053 | 80,457 |
| Independent Bank Group, Inc. | 327 | 16,239 |
| International Bancshares Corp. | 4,652 | 122,766 |
| Intervest Bancshares Corp.* | 1,544 | 11,595 |
| Investors Bancorp, Inc | 4,504 | 115,211 |
| Lakeland Bancorp, Inc. | 3,060 | 37,852 |
| Lakeland Financial Corp. | 1,410 | 54,990 |
| LCNB Corp. | 522 | 9,328 |
| Macatawa Bank Corp.* | 2,047 | 10,235 |
| MainSource Financial Group, Inc. | 1,757 | 31,679 |
| MB Financial, Inc. | 4,726 | 151,657 |
| Mercantile Bank Corp | 775 | 16,724 |
| Merchants Bancshares, Inc. | 377 | 12,630 |
| Metro Bancorp, Inc.* | 1,253 | 26,990 |
| MetroCorp Bancshares, Inc | 1,423 | 21,445 |
| Middleburg Financial Corp | 483 | 8,713 |
| Midsouth Bancorp, Inc. | 777 | 13,877 |
| MidWestOne Financial Group, Inc | 611 | 16,619 |
| National Bank Holdings Corp. | 4,004 | 85,686 |
| National Bankshares, Inc | 719 | 26,524 |
www.calvert.com CALVERT VP RUSSELL 2000 SMALL CAP INDEX PORTFOLIO ANNUAL REPORT 15
| | |
| EQUITY SECURITIES - CONT’D | SHARES | VALUE |
| Commercial Banks - Cont’d | | |
| National Penn Bancshares, Inc.: | | |
| Common Stock | 10,092 | $114,342 |
| Fractional Shares (b)* | 25,000 | 5 |
| NBT Bancorp, Inc. | 3,777 | 97,824 |
| NewBridge Bancorp* | 2,178 | 16,335 |
| Northrim BanCorp, Inc. | 582 | 15,272 |
| OFG Bancorp | 4,052 | 70,262 |
| Old National Bancorp | 9,012 | 138,514 |
| OmniAmerican Bancorp, Inc.* | 1,008 | 21,551 |
| Pacific Continental Corp | 1,543 | 24,595 |
| Pacific Premier Bancorp, Inc.* | 1,331 | 20,950 |
| PacWest Bancorp | 3,281 | 138,524 |
| Palmetto Bancshares, Inc.* | 384 | 4,977 |
| Park National Corp. | 1,021 | 86,856 |
| Park Sterling Corp | 3,952 | 28,217 |
| Peapack Gladstone Financial Corp. | 799 | 15,261 |
| Penns Woods Bancorp, Inc | 415 | 21,165 |
| Peoples Bancorp, Inc. | 1,091 | 24,558 |
| Pinnacle Financial Partners, Inc. | 3,094 | 100,648 |
| Preferred Bank* | 1,057 | 21,193 |
| PrivateBancorp, Inc. | 5,704 | 165,017 |
| Prosperity Bancshares, Inc. | 5,310 | 336,601 |
| Renasant Corp. | 2,662 | 83,747 |
| Republic Bancorp, Inc | 907 | 22,258 |
| S&T Bancorp, Inc | 2,603 | 65,882 |
| Sandy Spring Bancorp, Inc | 2,099 | 59,171 |
| Seacoast Banking Corporation of Florida* | 1,191 | 14,533 |
| Sierra Bancorp | 987 | 15,881 |
| Simmons First National Corp. | 1,504 | 55,874 |
| Southside Bancshares, Inc. | 1,599 | 43,717 |
| Southwest Bancorp, Inc.* | 1,698 | 27,032 |
| State Bank Financial Corp | 2,598 | 47,258 |
| StellarOne Corp. | 1,971 | 47,442 |
| Sterling Bancorp | 6,924 | 92,574 |
| Sterling Financial Corp. | 2,930 | 99,854 |
| Suffolk Bancorp* | 896 | 18,637 |
| Sun Bancorp, Inc.* | 3,090 | 10,877 |
| Susquehanna Bancshares, Inc. | 16,080 | 206,467 |
| SY Bancorp, Inc. | 1,229 | 39,230 |
| Taylor Capital Group, Inc.* | 1,466 | 38,966 |
| Texas Capital Bancshares, Inc.* | 3,566 | 221,805 |
| Tompkins Financial Corp | 1,247 | 64,083 |
| TowneBank | 2,117 | 32,581 |
| TriCo Bancshares | 1,295 | 36,739 |
| Tristate Capital Holdings, Inc.* | 565 | 6,701 |
| Trustmark Corp. | 5,831 | 156,504 |
| UMB Financial Corp. | 3,070 | 197,340 |
| Umpqua Holdings Corp. | 9,655 | 184,797 |
| Union First Market Bankshares Corp | 1,561 | 38,728 |
| United Bankshares, Inc. | 4,341 | 136,524 |
| United Community Banks, Inc.* | 3,656 | 64,894 |
| Univest Corp. of Pennsylvania | 1,440 | 29,779 |
| VantageSouth Bancshares, Inc.* | 245 | 1,291 |
| ViewPoint Financial Group, Inc | 3,445 | 94,565 |
| Virginia Commerce Bancorp, Inc.* | 2,414 | 41,014 |
| Washington Banking Co. | 1,588 | 28,155 |
16 www.calvert.com CALVERT VP RUSSELL 2000 SMALL CAP INDEX PORTFOLIO ANNUAL REPORT
| | |
| EQUITY SECURITIES - CONT’D | SHARES | VALUE |
| Commercial Banks - Cont’d | | |
| Washington Trust Bancorp, Inc | 1,232 | $45,855 |
| Webster Financial Corp | 7,783 | 242,674 |
| WesBanco, Inc. | 2,265 | 72,480 |
| West Bancorporation, Inc | 1,387 | 21,942 |
| Westamerica Bancorporation | 2,327 | 131,382 |
| Western Alliance Bancorp* | 6,387 | 152,394 |
| Wilshire Bancorp, Inc. | 5,565 | 60,825 |
| Wintrust Financial Corp. | 3,270 | 150,812 |
| Yadkin Financial Corp.* | 1,240 | 21,130 |
| | | 10,624,173 |
| |
| Commercial Services & Supplies - 2.0% | | |
| ABM Industries, Inc | 4,838 | 138,318 |
| ACCO Brands Corp.* | 10,173 | 68,362 |
| Acorn Energy, Inc. | 1,611 | 6,557 |
| ARC Document Solutions, Inc.* | 3,218 | 26,452 |
| Casella Waste Systems, Inc.* | 3,332 | 19,326 |
| Ceco Environmental Corp. | 1,551 | 25,080 |
| Cenveo, Inc.* | 4,813 | 16,557 |
| Compx International, Inc | 107 | 1,507 |
| Consolidated Graphics, Inc.* | 664 | 44,780 |
| Courier Corp. | 1,060 | 19,175 |
| Deluxe Corp. | 4,386 | 228,905 |
| EnerNOC, Inc.* | 2,044 | 35,177 |
| Ennis, Inc | 2,271 | 40,197 |
| G&K Services, Inc. | 1,722 | 107,160 |
| Healthcare Services Group, Inc. | 6,046 | 171,525 |
| Heritage-Crystal Clean, Inc.* | 692 | 14,179 |
| Herman Miller, Inc. | 5,055 | 149,224 |
| HNI Corp | 3,920 | 152,214 |
| Innerworkings, Inc.* | 3,823 | 29,781 |
| Interface, Inc. | 5,274 | 115,817 |
| Intersections, Inc | 755 | 5,881 |
| Kimball International, Inc., Class B | 2,797 | 42,039 |
| Knoll, Inc | 4,116 | 75,364 |
| Mcgrath RentCorp | 2,093 | 83,301 |
| Mine Safety Appliances Co. | 2,485 | 127,257 |
| Mobile Mini, Inc.* | 3,307 | 136,182 |
| Multi-Color Corp. | 1,079 | 40,721 |
| NL Industries, Inc | 532 | 5,948 |
| Performant Financial Corp.* | 1,926 | 19,838 |
| Quad/Graphics, Inc. | 2,074 | 56,475 |
| Schawk, Inc | 1,200 | 17,844 |
| SP Plus Corp.* | 1,439 | 37,472 |
| Steelcase, Inc. | 7,271 | 115,318 |
| Swisher Hygiene, Inc.* | 10,142 | 5,214 |
| Team, Inc.* | 1,759 | 74,476 |
| Tetra Tech, Inc.* | 5,711 | 159,794 |
| The Brink’s Co. | 4,255 | 145,266 |
| The GEO Group, Inc., Escrow (b)* | 115,200 | 13 |
| TRC Co.’s, Inc.* | 1,457 | 10,403 |
| Unifirst Corp. | 1,290 | 138,030 |
| United Stationers, Inc. | 3,611 | 165,709 |
| US Ecology, Inc. | 1,896 | 70,512 |
| Viad Corp. | 1,798 | 49,948 |
| West Corp | 1,837 | 47,229 |
| | | 3,040,527 |
www.calvert.com CALVERT VP RUSSELL 2000 SMALL CAP INDEX PORTFOLIO ANNUAL REPORT 17
| | |
| EQUITY SECURITIES - CONT’D | SHARES | VALUE |
| Communications Equipment - 1.7% | | |
| Adtran, Inc | 5,252 | $141,856 |
| Alliance Fiber Optic Products, Inc. | 992 | 14,930 |
| Anaren, Inc.* | 1,001 | 28,018 |
| Applied Optoelectronics, Inc.* | 360 | 5,404 |
| ARRIS Group, Inc.* | 10,171 | 247,816 |
| Aruba Networks, Inc.* | 10,068 | 180,217 |
| Aviat Networks, Inc.* | 5,538 | 12,516 |
| Bel Fuse, Inc., Class B | 968 | 20,628 |
| Black Box Corp | 1,535 | 45,743 |
| CalAmp Corp.* | 3,105 | 86,847 |
| Calix, Inc.* | 3,092 | 29,807 |
| Ciena Corp.* | 8,928 | 213,647 |
| Comtech Telecommunications Corp. | 1,501 | 47,311 |
| Digi International, Inc.* | 2,313 | 28,034 |
| Emulex Corp.* | 7,599 | 54,409 |
| Extreme Networks, Inc.* | 8,019 | 56,133 |
| Finisar Corp.* | 8,219 | 196,598 |
| Harmonic, Inc.* | 8,805 | 64,981 |
| Infinera Corp.* | 9,879 | 96,617 |
| InterDigital, Inc. | 3,641 | 107,373 |
| Ixia* | 4,870 | 64,820 |
| KVH Industries, Inc.* | 1,491 | 19,428 |
| Netgear, Inc.* | 3,420 | 112,655 |
| Numerex Corp.* | 1,206 | 15,618 |
| Oplink Communications, Inc.* | 1,692 | 31,471 |
| Parkervision, Inc.* | 6,832 | 31,086 |
| PC-Tel, Inc. | 1,663 | 15,915 |
| Plantronics, Inc. | 3,828 | 177,811 |
| Procera Networks, Inc.* | 1,625 | 24,407 |
| Ruckus Wireless, Inc.* | 3,754 | 53,307 |
| ShoreTel, Inc.* | 5,065 | 47,003 |
| Sonus Networks, Inc.* | 18,211 | 57,365 |
| Tessco Technologies, Inc | 485 | 19,555 |
| Ubiquiti Networks, Inc.* | 1,086 | 49,912 |
| Viasat, Inc.* | 3,496 | 219,024 |
| Westell Technologies, Inc.* | 4,363 | 17,670 |
| | | 2,635,932 |
| |
| Computers & Peripherals - 0.4% | | |
| Avid Technology, Inc.* | 2,537 | 20,676 |
| Cray, Inc.* | 3,293 | 90,426 |
| Datalink Corp.* | 1,373 | 14,966 |
| Electronics for Imaging, Inc.* | 3,961 | 153,409 |
| Fusion-io, Inc.* | 6,558 | 58,432 |
| Hutchinson Technology, Inc.* | 2,019 | 6,461 |
| Imation Corp.* | 3,091 | 14,466 |
| Immersion Corp.* | 2,323 | 24,113 |
| QLogic Corp.* | 8,064 | 95,397 |
| Quantum Corp.* | 19,651 | 23,581 |
| Silicon Graphics International Corp.* | 2,677 | 35,899 |
| Super Micro Computer, Inc.* | 2,622 | 44,993 |
| Violin Memory, Inc.* | 1,643 | 6,506 |
| | | 589,325 |
18 www.calvert.com CALVERT VP RUSSELL 2000 SMALL CAP INDEX PORTFOLIO ANNUAL REPORT
| | |
| EQUITY SECURITIES - CONT’D | SHARES | VALUE |
| Construction & Engineering - 0.8% | | |
| Aegion Corp.* | 3,435 | $75,192 |
| Ameresco, Inc.* | 1,452 | 14,026 |
| Argan, Inc. | 1,205 | 33,210 |
| Comfort Systems USA, Inc. | 3,332 | 64,607 |
| Dycom Industries, Inc.* | 2,851 | 79,229 |
| EMCOR Group, Inc | 5,788 | 245,643 |
| Furmanite Corp.* | 3,036 | 32,242 |
| Granite Construction, Inc. | 3,480 | 121,730 |
| Great Lakes Dredge & Dock Corp.* | 5,123 | 47,132 |
| Layne Christensen Co.* | 1,710 | 29,207 |
| MasTec, Inc.* | 5,123 | 167,625 |
| MYR Group, Inc.* | 1,740 | 43,639 |
| Northwest Pipe Co.* | 959 | 36,212 |
| Orion Marine Group, Inc.* | 2,350 | 28,271 |
| Pike Corp.* | 2,237 | 23,645 |
| Primoris Services Corp. | 3,042 | 94,697 |
| Sterling Construction Co., Inc.* | 1,494 | 17,525 |
| Tutor Perini Corp.* | 3,216 | 84,581 |
| | | 1,238,413 |
| Construction Materials - 0.1% | | |
| Headwaters, Inc.* | 6,432 | 62,969 |
| Texas Industries, Inc.* | 1,876 | 129,031 |
| United States Lime & Minerals, Inc.* | 156 | 9,543 |
| US Concrete, Inc.* | 1,160 | 26,251 |
| | | 227,794 |
| |
| Consumer Finance - 0.7% | | |
| Cash America International, Inc | 2,461 | 94,256 |
| Consumer Portfolio Services, Inc.* | 1,464 | 13,747 |
| Credit Acceptance Corp.* | 613 | 79,684 |
| DFC Global Corp.* | 3,735 | 42,766 |
| Encore Capital Group, Inc.* | 2,162 | 108,662 |
| Ezcorp, Inc.* | 4,319 | 50,489 |
| First Cash Financial Services, Inc.* | 2,538 | 156,950 |
| Green Dot Corp.* | 2,160 | 54,324 |
| Imperial Holdings, Inc.* | 1,488 | 9,732 |
| JGWPT Holdings, Inc.* | 860 | 14,955 |
| Nelnet, Inc. | 1,973 | 83,142 |
| Nicholas Financial, Inc | 799 | 12,576 |
| Portfolio Recovery Associates, Inc.* | 4,374 | 231,122 |
| Regional Management Corp.* | 435 | 14,760 |
| Springleaf Holdings, Inc.* | 2,135 | 53,973 |
| The First Marblehead Corp.* | 575 | 4,248 |
| World Acceptance Corp.* | 802 | 70,199 |
| | | 1,095,585 |
| |
| Containers & Packaging - 0.2% | | |
| AEP Industries, Inc.* | 367 | 19,389 |
| Berry Plastics Group, Inc.* | 4,774 | 113,573 |
| Graphic Packaging Holding Co.* | 17,281 | 165,897 |
| Myers Industries, Inc | 2,431 | 51,343 |
| UFP Technologies, Inc.* | 495 | 12,484 |
| | | 362,686 |
www.calvert.com CALVERT VP RUSSELL 2000 SMALL CAP INDEX PORTFOLIO ANNUAL REPORT 19
| | |
| EQUITY SECURITIES - CONT’D | SHARES | VALUE |
| Distributors - 0.2% | | |
| Core-Mark Holding Co., Inc. | 936 | $71,071 |
| Pool Corp | 4,017 | 233,548 |
| VOXX International Corp.* | 1,390 | 23,213 |
| Weyco Group, Inc | 562 | 16,540 |
| | | 344,372 |
| |
| Diversified Consumer Services - 1.0% | | |
| American Public Education, Inc.* | 1,623 | 70,552 |
| Ascent Capital Group, Inc.* | 1,251 | 107,036 |
| Bridgepoint Education, Inc.* | 1,706 | 30,213 |
| Bright Horizons Family Solutions, Inc.* | 1,042 | 38,283 |
| Capella Education Co. | 953 | 63,317 |
| Career Education Corp.* | 4,661 | 26,568 |
| Carriage Services, Inc. | 1,428 | 27,889 |
| Corinthian Colleges, Inc.* | 7,691 | 13,690 |
| Education Management Corp.* | 2,400 | 24,216 |
| Grand Canyon Education, Inc.* | 3,915 | 170,694 |
| Hillenbrand, Inc | 4,903 | 144,246 |
| Houghton Mifflin Harcourt Co.* | 1,849 | 31,359 |
| ITT Educational Services, Inc.* | 2,015 | 67,664 |
| JTH Holding, Inc.* | 395 | 9,598 |
| K12, Inc.* | 2,402 | 52,243 |
| LifeLock, Inc.* | 5,233 | 85,874 |
| Lincoln Educational Services Corp | 1,856 | 9,243 |
| Mac-Gray Corp | 1,212 | 25,731 |
| Matthews International Corp. | 2,425 | 103,329 |
| Regis Corp. | 4,098 | 59,462 |
| Sotheby’s | 6,015 | 319,998 |
| Steiner Leisure Ltd.* | 1,287 | 63,308 |
| Strayer Education, Inc.* | 932 | 32,126 |
| Universal Technical Institute, Inc. | 1,842 | 25,622 |
| | | 1,602,261 |
| |
| Diversified Financial Services - 0.3% | | |
| California First National Bancorp | 145 | 2,190 |
| Gain Capital Holdings, Inc. | 987 | 7,412 |
| MarketAxess Holdings, Inc. | 3,286 | 219,735 |
| Marlin Business Services Corp. | 795 | 20,034 |
| NewStar Financial, Inc.* | 2,242 | 39,840 |
| PHH Corp.* | 5,100 | 124,185 |
| Pico Holdings, Inc.* | 1,974 | 45,619 |
| Resource America, Inc | 1,082 | 10,128 |
| | | 469,143 |
| |
| Diversified Telecommunication Services - 0.5% | | |
| 8x8, Inc.* | 7,711 | 78,344 |
| Atlantic Tele-Network, Inc. | 816 | 46,161 |
| Cbeyond, Inc.* | 2,347 | 16,194 |
| Cincinnati Bell, Inc.* | 17,650 | 62,834 |
| Cogent Communications Group, Inc | 4,216 | 170,369 |
| Consolidated Communications Holdings, Inc. | 3,570 | 70,079 |
| Fairpoint Communications, Inc.* | 1,772 | 20,041 |
| General Communication, Inc.* | 2,713 | 30,250 |
| Hawaiian Telcom Holdco, Inc.* | 922 | 27,079 |
| HickoryTech Corp. | 1,098 | 14,087 |
| IDT Corp., Class B | 1,313 | 23,463 |
20 www.calvert.com CALVERT VP RUSSELL 2000 SMALL CAP INDEX PORTFOLIO ANNUAL REPORT
| | |
| EQUITY SECURITIES - CONT’D | SHARES | VALUE |
| Diversified Telecommunication Services - Cont’d | | |
| inContact, Inc.* | 4,602 | $35,942 |
| Inteliquent, Inc. | 2,529 | 28,881 |
| Iridium Communications, Inc.* | 5,536 | 34,656 |
| Lumos Networks Corp | 1,286 | 27,006 |
| magicJack VocalTec Ltd.* | 1,359 | 16,199 |
| ORBCOMM, Inc.* | 2,846 | 18,044 |
| Premiere Global Services, Inc.* | 4,149 | 48,087 |
| Straight Path Communications, Inc.* | 656 | 5,373 |
| Towerstream Corp.* | 4,275 | 12,654 |
| Vonage Holdings Corp.* | 14,328 | 47,712 |
| | | 833,455 |
| |
| Electric Utilities - 1.2% | | |
| Allete, Inc | 3,434 | 171,288 |
| Cleco Corp | 5,212 | 242,983 |
| El Paso Electric Co | 3,468 | 121,762 |
| Empire District Electric Co | 3,796 | 86,131 |
| IDACORP, Inc | 4,332 | 224,571 |
| MGE Energy, Inc | 2,022 | 117,074 |
| NRG Yield, Inc. | 1,937 | 77,499 |
| Otter Tail Corp. | 3,144 | 92,025 |
| PNM Resources, Inc. | 6,869 | 165,680 |
| Portland General Electric Co | 6,526 | 197,085 |
| UIL Holdings Corp. | 4,872 | 188,790 |
| Unitil Corp. | 1,238 | 37,747 |
| UNS Energy Corp. | 3,625 | 216,956 |
| | | 1,939,591 |
| |
| Electrical Equipment - 1.5% | | |
| Acuity Brands, Inc. | 3,773 | 412,464 |
| American Superconductor Corp.* | 3,671 | 6,020 |
| AZZ, Inc | 2,174 | 106,222 |
| Brady Corp. | 3,984 | 123,225 |
| Capstone Turbine Corp.* | 26,878 | 34,673 |
| Coleman Cable, Inc. | 735 | 19,272 |
| Encore Wire Corp | 1,782 | 96,584 |
| EnerSys, Inc. | 4,239 | 297,111 |
| Enphase Energy, Inc.* | 1,376 | 8,724 |
| Franklin Electric Co., Inc | 4,080 | 182,131 |
| FuelCell Energy, Inc.* | 13,625 | 19,211 |
| Generac Holdings, Inc. | 4,445 | 251,765 |
| General Cable Corp. | 4,306 | 126,639 |
| Global Power Equipment Group, Inc | 1,548 | 30,294 |
| GrafTech International Ltd.* | 10,077 | 113,165 |
| II-VI, Inc.* | 4,403 | 77,493 |
| LSI Industries, Inc | 1,507 | 13,066 |
| Polypore International, Inc.* | 4,023 | 156,495 |
| Powell Industries, Inc. | 811 | 54,329 |
| Power Solutions International, Inc.* | 166 | 12,467 |
| PowerSecure International, Inc.* | 1,635 | 28,073 |
| Preformed Line Products Co. | 222 | 16,241 |
| Revolution Lighting Technologies, Inc.* | 2,558 | 8,761 |
| Thermon Group Holdings, Inc.* | 2,338 | 63,898 |
| Vicor Corp.* | 1,707 | 22,908 |
| | | 2,281,231 |
www.calvert.com CALVERT VP RUSSELL 2000 SMALL CAP INDEX PORTFOLIO ANNUAL REPORT 21
| | |
| EQUITY SECURITIES - CONT’D | SHARES | VALUE |
| Electronic Equipment & Instruments - 2.5% | | |
| Aeroflex Holding Corp.* | 1,630 | $10,595 |
| Agilysys, Inc.* | 1,316 | 18,319 |
| Anixter International, Inc | 2,337 | 209,956 |
| Audience, Inc.* | 545 | 6,344 |
| Badger Meter, Inc | 1,311 | 71,449 |
| Belden, Inc | 3,797 | 267,499 |
| Benchmark Electronics, Inc.* | 4,688 | 108,199 |
| Checkpoint Systems, Inc.* | 3,461 | 54,580 |
| Cognex Corp.* | 7,655 | 292,268 |
| Coherent, Inc.* | 2,144 | 159,492 |
| Control4 Corp.* | 395 | 6,992 |
| CTS Corp. | 2,987 | 59,471 |
| Daktronics, Inc. | 2,960 | 46,413 |
| DTS, Inc.* | 1,575 | 37,768 |
| Electro Rent Corp. | 1,712 | 31,706 |
| Electro Scientific Industries, Inc | 1,856 | 19,414 |
| Fabrinet* | 2,445 | 50,269 |
| FARO Technologies, Inc.* | 1,524 | 88,849 |
| FEI Co. | 3,677 | 328,577 |
| GSI Group, Inc.* | 2,626 | 29,516 |
| Insight Enterprises, Inc.* | 3,744 | 85,026 |
| InvenSense, Inc.* | 4,895 | 101,718 |
| Itron, Inc.* | 3,409 | 141,235 |
| Kemet Corp.* | 3,628 | 20,462 |
| Littelfuse, Inc. | 1,918 | 178,240 |
| Maxwell Technologies, Inc.* | 2,297 | 17,848 |
| Measurement Specialties, Inc.* | 1,271 | 77,137 |
| Mercury Systems, Inc.* | 2,519 | 27,583 |
| Mesa Laboratories, Inc. | 233 | 18,309 |
| Methode Electronics, Inc. | 3,257 | 111,357 |
| MTS Systems Corp. | 1,363 | 97,114 |
| Multi-Fineline Electronix, Inc.* | 789 | 10,959 |
| Neonode, Inc.* | 2,024 | 12,792 |
| Newport Corp.* | 3,209 | 57,987 |
| OSI Systems, Inc.* | 1,719 | 91,296 |
| Park Electrochemical Corp. | 1,804 | 51,811 |
| PC Connection, Inc. | 756 | 18,787 |
| Plexus Corp.* | 2,941 | 127,316 |
| Radisys Corp.* | 1,596 | 3,655 |
| RealD, Inc.* | 3,490 | 29,805 |
| Richardson Electronics Ltd. | 1,342 | 15,245 |
| Rofin-Sinar Technologies, Inc.* | 2,473 | 66,820 |
| Rogers Corp.* | 1,481 | 91,081 |
| Sanmina Corp.* | 6,955 | 116,147 |
| Scansource, Inc.* | 2,349 | 99,668 |
| Speed Commerce, Inc.* | 3,454 | 16,130 |
| SYNNEX Corp.* | 2,367 | 159,536 |
| TTM Technologies, Inc.* | 4,786 | 41,064 |
| Uni-Pixel, Inc.* | 872 | 8,729 |
| Universal Display Corp.* | 3,577 | 122,906 |
| Viasystems Group, Inc.* | 399 | 5,458 |
| Vishay Precision Group, Inc.* | 1,011 | 15,054 |
| Zygo Corp.* | 1,307 | 19,317 |
| | | 3,955,268 |
22 www.calvert.com CALVERT VP RUSSELL 2000 SMALL CAP INDEX PORTFOLIO ANNUAL REPORT
| | |
| EQUITY SECURITIES - CONT’D | SHARES | VALUE |
| Energy Equipment & Services - 1.7% | | |
| Basic Energy Services, Inc.* | 2,777 | $43,821 |
| Bolt Technology Corp. | 772 | 16,992 |
| Bristow Group, Inc. | 3,117 | 233,962 |
| C&J Energy Services, Inc.* | 4,013 | 92,700 |
| Cal Dive International, Inc.* | 8,254 | 16,591 |
| CARBO Ceramics, Inc | 1,707 | 198,917 |
| Dawson Geophysical Co.* | 671 | 22,693 |
| Era Group, Inc.* | 1,735 | 53,542 |
| Exterran Holdings, Inc.* | 4,965 | 169,803 |
| Forum Energy Technologies, Inc.* | 3,392 | 95,858 |
| Geospace Technologies Corp.* | 1,148 | 108,865 |
| Global Geophysical Services, Inc.* | 1,489 | 2,397 |
| Gulf Island Fabrication, Inc. | 1,328 | 30,836 |
| Gulfmark Offshore, Inc | 2,302 | 108,493 |
| Helix Energy Solutions Group, Inc.* | 9,296 | 215,481 |
| Hercules Offshore, Inc.* | 14,267 | 93,164 |
| Hornbeck Offshore Services, Inc.* | 3,086 | 151,924 |
| ION Geophysical Corp.* | 11,881 | 39,207 |
| Key Energy Services, Inc.* | 13,597 | 107,416 |
| Matrix Service Co.* | 2,442 | 59,756 |
| Mitcham Industries, Inc.* | 1,145 | 20,278 |
| Natural Gas Services Group, Inc.* | 1,066 | 29,390 |
| Newpark Resources, Inc.* | 7,785 | 95,678 |
| Nuverra Environmental Solutions, Inc.* | 1,205 | 20,225 |
| Parker Drilling Co.* | 10,148 | 82,503 |
| PHI, Inc.* | 1,085 | 47,089 |
| Pioneer Energy Services Corp.* | 5,200 | 41,652 |
| RigNet, Inc.* | 1,109 | 53,154 |
| SEACOR Holdings, Inc.* | 1,734 | 158,141 |
| Tesco Corp.* | 2,637 | 52,160 |
| Tetra Technologies, Inc.* | 6,615 | 81,761 |
| TGC Industries, Inc.* | 1,377 | 10,052 |
| Vantage Drilling Co.* | 15,538 | 28,590 |
| Willbros Group, Inc.* | 3,210 | 30,238 |
| | | 2,613,329 |
| |
| Food & Staples Retailing - 1.3% | | |
| Andersons, Inc. | 1,610 | 143,564 |
| Arden Group, Inc | 92 | 11,639 |
| Casey’s General Stores, Inc. | 3,305 | 232,176 |
| Fairway Group Holdings Corp.* | 1,354 | 24,534 |
| Harris Teeter Supermarkets, Inc. | 4,266 | 210,527 |
| Ingles Markets, Inc | 1,087 | 29,458 |
| Natural Grocers by Vitamin Cottage, Inc.* | 764 | 32,432 |
| Pantry, Inc.* | 1,987 | 33,342 |
| Pricesmart, Inc. | 1,637 | 189,139 |
| Rite Aid Corp.* | 64,321 | 325,464 |
| Roundy’s, Inc. | 2,172 | 21,416 |
| Spartan Stores, Inc. | 3,281 | 79,663 |
| SUPERVALU, Inc.* | 17,506 | 127,619 |
| Susser Holdings Corp.* | 1,556 | 101,902 |
| The Chefs’ Warehouse, Inc.* | 1,456 | 42,457 |
| United Natural Foods, Inc.* | 4,344 | 327,494 |
| Village Super Market, Inc. | 640 | 19,846 |
| Weis Markets, Inc. | 958 | 50,353 |
| | | 2,003,025 |
www.calvert.com CALVERT VP RUSSELL 2000 SMALL CAP INDEX PORTFOLIO ANNUAL REPORT 23
| | |
| EQUITY SECURITIES - CONT’D | SHARES | VALUE |
| Food Products - 1.5% | | |
| Alico, Inc. | 267 | $10,378 |
| Annie’s, Inc.* | 1,181 | 50,830 |
| B&G Foods, Inc. | 4,678 | 158,631 |
| Boulder Brands, Inc.* | 5,245 | 83,186 |
| Calavo Growers, Inc | 1,019 | 30,835 |
| Cal-Maine Foods, Inc | 1,233 | 74,264 |
| Chiquita Brands International, Inc.* | 3,926 | 45,934 |
| Darling International, Inc.* | 13,937 | 291,005 |
| Diamond Foods, Inc.* | 1,809 | 46,745 |
| Farmer Bros Co.* | 538 | 12,514 |
| Fresh Del Monte Produce, Inc. | 3,265 | 92,399 |
| Griffin Land & Nurseries, Inc | 267 | 8,912 |
| Hain Celestial Group, Inc.* | 3,384 | 307,200 |
| Inventure Foods, Inc.* | 1,177 | 15,607 |
| J&J Snack Foods Corp | 1,333 | 118,090 |
| John B Sanfilippo & Son, Inc. | 716 | 17,671 |
| Lancaster Colony Corp. | 1,596 | 140,687 |
| Lifeway Foods, Inc. | 385 | 6,152 |
| Limoneira Co | 753 | 20,022 |
| Omega Protein Corp.* | 1,591 | 19,553 |
| Pilgrim’s Pride Corp.* | 5,197 | 84,451 |
| Post Holdings, Inc.* | 2,817 | 138,794 |
| Sanderson Farms, Inc. | 1,985 | 143,575 |
| Seaboard Corp.* | 26 | 72,669 |
| Seneca Foods Corp.* | 794 | 25,321 |
| Snyders-Lance, Inc. | 4,100 | 117,752 |
| Tootsie Roll Industries, Inc. | 1,688 | 54,928 |
| TreeHouse Foods, Inc.* | 3,125 | 215,375 |
| | | 2,403,480 |
| |
| Gas Utilities - 0.8% | | |
| Chesapeake Utilities Corp. | 827 | 49,636 |
| Delta Natural Gas Co., Inc. | 612 | 13,697 |
| Laclede Group, Inc | 2,777 | 126,465 |
| New Jersey Resources Corp. | 3,603 | 166,603 |
| Northwest Natural Gas Co | 2,413 | 103,325 |
| Piedmont Natural Gas Co., Inc | 6,512 | 215,938 |
| South Jersey Industries, Inc. | 2,831 | 158,423 |
| Southwest Gas Corp | 3,995 | 223,360 |
| WGL Holdings, Inc. | 4,459 | 178,627 |
| | | 1,236,074 |
| |
| Health Care Equipment & Supplies - 3.3% | | |
| Abaxis, Inc.* | 1,932 | 77,319 |
| Abiomed, Inc.* | 3,340 | 89,312 |
| Accuray, Inc.* | 6,420 | 55,918 |
| Align Technology, Inc.* | 6,443 | 368,217 |
| Alphatec Holdings, Inc.* | 4,714 | 9,475 |
| Analogic Corp | 1,056 | 93,519 |
| Angiodynamics, Inc.* | 2,155 | 37,044 |
| Anika Therapeutics, Inc.* | 1,061 | 40,488 |
| Antares Pharma, Inc.* | 9,495 | 42,538 |
| ArthroCare Corp.* | 2,356 | 94,805 |
| AtriCure, Inc.* | 1,805 | 33,717 |
| Atrion Corp. | 136 | 40,290 |
| Biolase, Inc.* | 2,764 | 7,821 |
24 www.calvert.com CALVERT VP RUSSELL 2000 SMALL CAP INDEX PORTFOLIO ANNUAL REPORT
| | |
| EQUITY SECURITIES - CONT’D | SHARES | VALUE |
| Health Care Equipment & Supplies - Cont’d | | |
| Cantel Medical Corp | 2,887 | $97,898 |
| Cardiovascular Systems, Inc.* | 2,163 | 74,169 |
| Cerus Corp.* | 6,176 | 39,835 |
| Conmed Corp | 2,391 | 101,617 |
| CryoLife, Inc | 2,420 | 26,838 |
| Cutera, Inc.* | 1,265 | 12,878 |
| Cyberonics, Inc.* | 2,431 | 159,255 |
| Cynosure, Inc.* | 1,668 | 44,502 |
| Derma Sciences, Inc.* | 1,182 | 12,789 |
| DexCom, Inc.* | 6,097 | 215,895 |
| Endologix, Inc.* | 5,415 | 94,438 |
| Exactech, Inc.* | 863 | 20,505 |
| GenMark Diagnostics, Inc.* | 3,096 | 41,208 |
| Globus Medical, Inc.* | 4,711 | 95,068 |
| Greatbatch, Inc.* | 2,031 | 89,851 |
| Haemonetics Corp.* | 4,405 | 185,583 |
| HeartWare International, Inc.* | 1,443 | 135,584 |
| ICU Medical, Inc.* | 1,127 | 71,801 |
| Insulet Corp.* | 4,642 | 172,218 |
| Integra LifeSciences Holdings Corp.* | 2,017 | 96,231 |
| Invacare Corp | 2,865 | 66,497 |
| LDR Holding Corp.* | 507 | 11,965 |
| Masimo Corp.* | 4,317 | 126,186 |
| Medical Action Industries, Inc.* | 1,255 | 10,743 |
| Meridian Bioscience, Inc. | 3,556 | 94,341 |
| Merit Medical Systems, Inc.* | 3,534 | 55,625 |
| Natus Medical, Inc.* | 2,492 | 56,070 |
| Neogen Corp.* | 3,181 | 145,372 |
| NuVasive, Inc.* | 3,888 | 125,699 |
| NxStage Medical, Inc.* | 5,151 | 51,510 |
| OraSure Technologies, Inc.* | 4,811 | 30,261 |
| Orthofix International NV* | 1,686 | 38,475 |
| Oxford Immunotec Global plc* | 543 | 10,523 |
| PhotoMedex, Inc.* | 1,180 | 15,281 |
| Quidel Corp.* | 2,538 | 78,399 |
| Rockwell Medical, Inc.* | 3,471 | 36,237 |
| RTI Surgical, Inc.* | 5,680 | 20,107 |
| Solta Medical, Inc.* | 5,509 | 16,252 |
| Spectranetics Corp.* | 3,602 | 90,050 |
| Staar Surgical Co.* | 3,235 | 52,375 |
| STERIS Corp | 5,083 | 244,238 |
| SurModics, Inc.* | 1,145 | 27,927 |
| Symmetry Medical, Inc.* | 3,142 | 31,671 |
| Tandem Diabetes Care, Inc.* | 810 | 20,874 |
| TearLab Corp.* | 2,205 | 20,595 |
| Thoratec Corp.* | 4,944 | 180,950 |
| Tornier NV* | 2,243 | 42,146 |
| Unilife Corp.* | 8,363 | 36,797 |
| Utah Medical Products, Inc | 296 | 16,919 |
| Vascular Solutions, Inc.* | 1,424 | 32,966 |
| Veracyte, Inc.* | 444 | 6,438 |
| Volcano Corp.* | 4,799 | 104,858 |
| West Pharmaceutical Services, Inc | 6,093 | 298,923 |
| Wright Medical Group, Inc.* | 3,483 | 106,963 |
| Zeltiq Aesthetics, Inc.* | 1,524 | 28,819 |
| | | 5,111,678 |
www.calvert.com CALVERT VP RUSSELL 2000 SMALL CAP INDEX PORTFOLIO ANNUAL REPORT 25
| | |
| EQUITY SECURITIES - CONT’D | SHARES | VALUE |
| Health Care Providers & Services - 2.4% | | |
| Acadia Healthcare Co., Inc.* | 3,054 | $144,546 |
| Accretive Health, Inc.* | 5,072 | 46,460 |
| Addus HomeCare Corp.* | 471 | 10,574 |
| Air Methods Corp.* | 3,465 | 202,113 |
| Alliance HealthCare Services, Inc.* | 430 | 10,638 |
| Almost Family, Inc.* | 759 | 24,538 |
| Amedisys, Inc.* | 2,499 | 36,560 |
| AMN Healthcare Services, Inc.* | 3,946 | 58,006 |
| AmSurg Corp.* | 2,705 | 124,214 |
| Bio-Reference Laboratories, Inc.* | 2,096 | 53,532 |
| BioScrip, Inc.* | 5,028 | 37,207 |
| Capital Senior Living Corp.* | 2,506 | 60,119 |
| Centene Corp.* | 4,794 | 282,606 |
| Chemed Corp. | 1,553 | 118,991 |
| Chindex International, Inc.* | 1,272 | 22,171 |
| Corvel Corp.* | 1,018 | 47,541 |
| Cross Country Healthcare, Inc.* | 2,877 | 28,712 |
| Emeritus Corp.* | 3,476 | 75,186 |
| Ensign Group, Inc | 1,713 | 75,835 |
| ExamWorks Group, Inc.* | 2,633 | 78,648 |
| Five Star Quality Care, Inc.* | 3,773 | 20,714 |
| Gentiva Health Services, Inc.* | 2,612 | 32,415 |
| Hanger, Inc.* | 3,072 | 120,853 |
| Healthsouth Corp. | 7,522 | 250,633 |
| Healthways, Inc.* | 2,984 | 45,804 |
| IPC The Hospitalist Co., Inc.* | 1,420 | 84,334 |
| Kindred Healthcare, Inc | 4,477 | 88,376 |
| Landauer, Inc. | 822 | 43,245 |
| LHC Group, Inc.* | 1,040 | 25,002 |
| Magellan Health Services, Inc.* | 2,407 | 144,203 |
| Molina Healthcare, Inc.* | 2,444 | 84,929 |
| MWI Veterinary Supply, Inc.* | 1,104 | 188,331 |
| National Healthcare Corp. | 949 | 51,161 |
| National Research Corp.* | 681 | 12,816 |
| Owens & Minor, Inc. | 5,461 | 199,654 |
| PharMerica Corp.* | 2,681 | 57,643 |
| Providence Service Corp.* | 915 | 23,534 |
| Select Medical Holdings Corp | 4,196 | 48,716 |
| Skilled Healthcare Group, Inc.* | 1,394 | 6,705 |
| Surgical Care Affiliates, Inc.* | 991 | 34,526 |
| Team Health Holdings, Inc.* | 6,051 | 275,623 |
| Triple-S Management Corp., Class B* | 2,042 | 39,696 |
| U.S. Physical Therapy, Inc. | 1,051 | 37,058 |
| Universal American Corp. | 3,383 | 24,696 |
| USMD Holdings, Inc.* | 93 | 1,870 |
| WellCare Health Plans, Inc.* | 3,748 | 263,934 |
| | | 3,744,668 |
| |
| Health Care Technology - 0.8% | | |
| athenahealth, Inc.* | 3,187 | 428,652 |
| Computer Programs & Systems, Inc. | 938 | 57,978 |
| HealthStream, Inc.* | 1,758 | 57,610 |
| HMS Holdings Corp.* | 7,740 | 175,930 |
| MedAssets, Inc.* | 5,251 | 104,127 |
| Medidata Solutions, Inc.* | 4,684 | 283,710 |
| Merge Healthcare, Inc.* | 4,792 | 11,117 |
26 www.calvert.com CALVERT VP RUSSELL 2000 SMALL CAP INDEX PORTFOLIO ANNUAL REPORT
| | |
| EQUITY SECURITIES - CONT’D | SHARES | VALUE |
| Health Care Technology - Cont’d | | |
| Omnicell, Inc.* | 2,844 | $72,607 |
| Quality Systems, Inc. | 3,561 | 74,995 |
| Vocera Communications, Inc.* | 1,818 | 28,379 |
| | | 1,295,105 |
| |
| Hotels, Restaurants & Leisure - 2.6% | | |
| AFC Enterprises, Inc.* | 2,162 | 83,237 |
| Biglari Holdings, Inc.* | 125 | 63,330 |
| BJ’s Restaurants, Inc.* | 2,209 | 68,612 |
| Bloomin’ Brands, Inc.* | 4,770 | 114,528 |
| Bob Evans Farms, Inc | 2,404 | 121,618 |
| Boyd Gaming Corp.* | 5,992 | 67,470 |
| Bravo Brio Restaurant Group, Inc.* | 1,583 | 25,755 |
| Buffalo Wild Wings, Inc.* | 1,618 | 238,170 |
| Caesars Entertainment Corp.* | 3,317 | 71,448 |
| Carrols Restaurant Group, Inc.* | 2,041 | 13,491 |
| CEC Entertainment, Inc | 1,631 | 72,221 |
| Churchill Downs, Inc. | 1,172 | 105,070 |
| Chuy’s Holdings, Inc.* | 1,400 | 50,428 |
| ClubCorp Holdings, Inc. | 1,823 | 32,340 |
| Cracker Barrel Old Country Store, Inc. | 1,732 | 190,641 |
| Del Frisco’s Restaurant Group, Inc.* | 922 | 21,732 |
| Denny’s Corp.* | 7,914 | 56,902 |
| Diamond Resorts International, Inc.* | 1,533 | 28,299 |
| DineEquity, Inc | 1,457 | 121,732 |
| Diversified Restaurant Holdings, Inc.* | 925 | 4,412 |
| Einstein Noah Restaurant Group, Inc. | 351 | 5,090 |
| Fiesta Restaurant Group, Inc.* | 1,974 | 103,122 |
| Ignite Restaurant Group, Inc.* | 597 | 7,461 |
| International Speedway Corp. | 2,420 | 85,886 |
| Interval Leisure Group, Inc. | 3,495 | 107,995 |
| Isle of Capri Casinos, Inc.* | 1,930 | 17,370 |
| Jack in the Box, Inc.* | 3,836 | 191,877 |
| Jamba, Inc.* | 1,460 | 18,148 |
| Krispy Kreme Doughnuts, Inc.* | 5,647 | 108,931 |
| Life Time Fitness, Inc.* | 3,712 | 174,464 |
| Luby’s, Inc.* | 1,545 | 11,927 |
| Marriott Vacations Worldwide Corp.* | 2,514 | 132,639 |
| Monarch Casino & Resort, Inc.* | 917 | 18,413 |
| Morgans Hotel Group Co.* | 2,245 | 18,252 |
| Multimedia Games Holding Co., Inc.* | 2,465 | 77,302 |
| Nathan’s Famous, Inc.* | 240 | 12,098 |
| Noodles & Co.* | 530 | 19,038 |
| Orient-Express Hotels Ltd.* | 8,261 | 124,824 |
| Papa John’s International, Inc | 2,762 | 125,395 |
| Pinnacle Entertainment, Inc.* | 5,035 | 130,860 |
| Potbelly Corp.* | 760 | 18,453 |
| Red Robin Gourmet Burgers, Inc.* | 1,221 | 89,792 |
| Ruby Tuesday, Inc.* | 5,637 | 39,064 |
| Ruth’s Hospitality Group, Inc. | 3,111 | 44,207 |
| Scientific Games Corp.* | 4,117 | 69,701 |
| Sonic Corp.* | 4,843 | 97,780 |
| Speedway Motorsports, Inc. | 1,049 | 20,823 |
| Texas Roadhouse, Inc. | 5,551 | 154,318 |
| The Cheesecake Factory, Inc. | 4,598 | 221,945 |
| The Marcus Corp | 1,890 | 25,402 |
www.calvert.com CALVERT VP RUSSELL 2000 SMALL CAP INDEX PORTFOLIO ANNUAL REPORT 27
| | |
| EQUITY SECURITIES - CONT’D | SHARES | VALUE |
| Hotels, Restaurants & Leisure - Cont’d | | |
| Town Sports International Holdings, Inc. | 2,088 | $30,819 |
| Vail Resorts, Inc. | 3,157 | 237,501 |
| | | 4,092,333 |
| |
| Household Durables - 1.1% | | |
| Bassett Furniture Industries, Inc | 1,014 | 15,494 |
| Beazer Homes USA, Inc.* | 2,186 | 53,382 |
| Blyth, Inc. | 938 | 10,205 |
| Cavco Industries, Inc.* | 679 | 46,647 |
| CSS Industries, Inc. | 772 | 22,141 |
| Ethan Allen Interiors, Inc | 2,160 | 65,707 |
| EveryWare Global, Inc.* | 843 | 6,980 |
| Flexsteel Industries, Inc. | 405 | 12,446 |
| Helen of Troy Ltd.* | 2,854 | 141,302 |
| Hooker Furniture Corp | 972 | 16,213 |
| Hovnanian Enterprises, Inc.* | 9,758 | 64,598 |
| iRobot Corp.* | 2,473 | 85,986 |
| KB Home | 7,345 | 134,267 |
| La-Z-Boy, Inc | 4,509 | 139,779 |
| LGI Homes, Inc.* | 793 | 14,107 |
| Libbey, Inc.* | 1,811 | 38,031 |
| Lifetime Brands, Inc | 858 | 13,496 |
| M/I Homes, Inc.* | 2,148 | 54,667 |
| MDC Holdings, Inc.* | 3,443 | 111,002 |
| Meritage Homes Corp.* | 3,117 | 149,585 |
| NACCO Industries, Inc | 427 | 26,555 |
| Skullcandy, Inc.* | 1,457 | 10,505 |
| Standard Pacific Corp.* | 12,781 | 115,668 |
| The Ryland Group, Inc | 3,977 | 172,642 |
| TRI Pointe Homes, Inc.* | 1,390 | 27,703 |
| UCP, Inc.* | 666 | 9,750 |
| Universal Electronics, Inc.* | 1,267 | 48,285 |
| WCI Communities, Inc.* | 586 | 11,187 |
| William Lyon Homes* | 1,186 | 26,258 |
| Zagg, Inc.* | 2,293 | 9,975 |
| | | 1,654,563 |
| |
| Household Products - 0.2% | | |
| Central Garden and Pet Co.* | 3,442 | 23,233 |
| Harbinger Group, Inc.* | 2,847 | 33,737 |
| Oil-Dri Corp. of America | 406 | 15,363 |
| Orchids Paper Products Co. | 518 | 17,011 |
| Spectrum Brands Holdings, Inc. | 1,854 | 130,800 |
| WD-40 Co | 1,334 | 99,623 |
| | | 319,767 |
| |
| Independent Power Producers & Energy Traders - 0.2% | | |
| Atlantic Power Corp | 10,236 | 35,621 |
| Dynegy, Inc.* | 8,623 | 185,567 |
| Genie Energy Ltd.* | 1,313 | 13,406 |
| Ormat Technologies, Inc. | 1,475 | 40,135 |
| Pattern Energy Group, Inc. | 1,621 | 49,132 |
| | | 323,861 |
| |
| Industrial Conglomerates - 0.1% | | |
| Raven Industries, Inc | 3,264 | 134,281 |
28 www.calvert.com CALVERT VP RUSSELL 2000 SMALL CAP INDEX PORTFOLIO ANNUAL REPORT
| | |
| EQUITY SECURITIES - CONT’D | SHARES | VALUE |
| Insurance - 2.3% | | |
| Ambac Financial Group, Inc.* | 3,881 | $95,317 |
| American Equity Investment Life Holding Co | 5,597 | 147,649 |
| Amerisafe, Inc. | 1,651 | 69,738 |
| Amtrust Financial Services, Inc. | 2,657 | 86,857 |
| Argo Group International Holdings Ltd. | 2,344 | 108,973 |
| Baldwin & Lyons, Inc., Class B | 853 | 23,304 |
| Blue Capital Reinsurance Holdings Ltd.* | 551 | 10,122 |
| Citizens, Inc.* | 3,380 | 29,575 |
| CNO Financial Group, Inc. | 19,571 | 346,211 |
| Crawford & Co., Class B | 2,478 | 22,897 |
| Donegal Group, Inc. | 916 | 14,564 |
| Eastern Insurance Holdings, Inc. | 597 | 14,621 |
| eHealth, Inc.* | 1,593 | 74,059 |
| EMC Insurance Group, Inc. | 497 | 15,218 |
| Employers Holdings, Inc | 2,669 | 84,474 |
| Enstar Group Ltd.* | 821 | 114,045 |
| FBL Financial Group, Inc. | 766 | 34,309 |
| First American Financial Corp. | 9,329 | 263,078 |
| Fortegra Financial Corp.* | 652 | 5,392 |
| Global Indemnity plc* | 810 | 20,493 |
| Greenlight Capital Re Ltd.* | 2,477 | 83,500 |
| Hallmark Financial Services, Inc.* | 1,205 | 10,706 |
| HCI Group, Inc | 801 | 42,854 |
| Health Insurance Innovations, Inc.* | 391 | 3,953 |
| Hilltop Holdings, Inc.* | 5,351 | 123,769 |
| Horace Mann Educators Corp. | 3,435 | 108,340 |
| Independence Holding Co. | 665 | 8,971 |
| Infinity Property & Casualty Corp | 994 | 71,320 |
| Investors Title Co | 111 | 8,989 |
| Kansas City Life Insurance Co. | 365 | 17,425 |
| Maiden Holdings Ltd | 4,341 | 47,447 |
| Meadowbrook Insurance Group, Inc | 4,743 | 33,011 |
| Montpelier Re Holdings Ltd. | 3,990 | 116,109 |
| National Interstate Corp. | 681 | 15,663 |
| National Western Life Insurance Co. | 193 | 43,145 |
| OneBeacon Insurance Group Ltd. | 1,823 | 28,840 |
| Platinum Underwriters Holdings Ltd | 2,539 | 155,590 |
| Primerica, Inc | 4,914 | 210,860 |
| RLI Corp. | 1,835 | 178,692 |
| Safety Insurance Group, Inc | 1,103 | 62,099 |
| Selective Insurance Group, Inc. | 4,935 | 133,541 |
| State Auto Financial Corp. | 1,338 | 28,419 |
| Stewart Information Services Corp | 1,793 | 57,860 |
| Symetra Financial Corp | 6,970 | 132,151 |
| The Navigators Group, Inc.* | 925 | 58,423 |
| The Phoenix Co.’s, Inc.* | 538 | 33,033 |
| Third Point Reinsurance Ltd.* | 2,182 | 40,432 |
| Tower Group International Ltd | 4,953 | 16,741 |
| United Fire Group, Inc. | 1,786 | 51,187 |
| Universal Insurance Holdings, Inc. | 2,530 | 36,634 |
| | | 3,540,600 |
| |
| Internet & Catalog Retail - 0.4% | | |
| 1-800-FLOWERS.COM, Inc.* | 2,081 | 11,258 |
| Blue Nile, Inc.* | 1,104 | 51,987 |
| FTD Co.’s, Inc.* | 1,526 | 49,717 |
www.calvert.com CALVERT VP RUSSELL 2000 SMALL CAP INDEX PORTFOLIO ANNUAL REPORT 29
| | |
| EQUITY SECURITIES - CONT’D | SHARES | VALUE |
| Internet & Catalog Retail - Cont’d | | |
| HSN, Inc. | 2,917 | $181,729 |
| NutriSystem, Inc | 2,351 | 38,651 |
| Orbitz Worldwide, Inc.* | 2,514 | 18,051 |
| Overstock.com, Inc.* | 951 | 29,281 |
| PetMed Express, Inc | 1,778 | 29,568 |
| RetailMeNot, Inc.* | 808 | 23,262 |
| Shutterfly, Inc.* | 3,275 | 166,796 |
| Valuevision Media, Inc.* | 3,387 | 23,675 |
| Vitacost.com, Inc.* | 1,988 | 11,511 |
| | | 635,486 |
| |
| Internet Software & Services - 2.9% | | |
| Angie’s List, Inc.* | 3,643 | 55,191 |
| Bankrate, Inc.* | 4,159 | 74,612 |
| Bazaarvoice, Inc.* | 4,145 | 32,828 |
| Benefitfocus, Inc.* | 448 | 25,868 |
| Blucora, Inc.* | 3,611 | 105,297 |
| Brightcove, Inc.* | 2,425 | 34,289 |
| Carbonite, Inc.* | 1,044 | 12,351 |
| ChannelAdvisor Corp.* | 517 | 21,564 |
| Chegg, Inc.* | 1,321 | 11,242 |
| comScore, Inc.* | 3,182 | 91,037 |
| Constant Contact, Inc.* | 2,738 | 85,070 |
| Cornerstone OnDemand, Inc.* | 3,481 | 185,677 |
| CoStar Group, Inc.* | 2,514 | 464,034 |
| Cvent, Inc.* | 554 | 20,160 |
| Dealertrack Technologies, Inc.* | 3,821 | 183,714 |
| Demand Media, Inc.* | 2,697 | 15,562 |
| Demandware, Inc.* | 1,625 | 104,195 |
| Dice Holdings, Inc.* | 3,501 | 25,382 |
| Digital River, Inc.* | 2,945 | 54,481 |
| E2open, Inc.* | 1,273 | 30,437 |
| EarthLink Holdings Corp.* | 9,440 | 47,861 |
| eGain Corp.* | 1,127 | 11,540 |
| Endurance International Group Holdings, Inc.* | 1,918 | 27,197 |
| Envestnet, Inc.* | 1,989 | 80,157 |
| Global Eagle Entertainment, Inc.* | 1,851 | 27,524 |
| Gogo, Inc.* | 946 | 23,470 |
| Internap Network Services Corp.* | 4,533 | 34,088 |
| IntraLinks Holdings, Inc.* | 3,311 | 40,096 |
| j2 Global, Inc | 3,961 | 198,090 |
| Limelight Networks, Inc.* | 4,616 | 9,140 |
| Liquidity Services, Inc.* | 2,122 | 48,085 |
| LivePerson, Inc.* | 4,955 | 73,433 |
| LogMeIn, Inc.* | 1,987 | 66,664 |
| Marchex, Inc., Class B* | 1,359 | 11,755 |
| Marin Software, Inc.* | 791 | 8,100 |
| Marketo, Inc.* | 601 | 22,279 |
| Millennial Media, Inc.* | 3,043 | 22,123 |
| Monster Worldwide, Inc.* | 9,238 | 65,867 |
| Move, Inc.* | 3,426 | 54,782 |
| Net Element, Inc.* | 193 | 843 |
| NIC, Inc. | 5,804 | 144,345 |
| OpenTable, Inc.* | 1,965 | 155,962 |
| Perficient, Inc.* | 2,876 | 67,356 |
| QuinStreet, Inc.* | 2,943 | 25,575 |
30 www.calvert.com CALVERT VP RUSSELL 2000 SMALL CAP INDEX PORTFOLIO ANNUAL REPORT
| | |
| EQUITY SECURITIES - CONT’D | SHARES | VALUE |
| Internet Software & Services - Cont’d | | |
| RealNetworks, Inc.* | 1,733 | $13,084 |
| Reis, Inc.* | 719 | 13,826 |
| Responsys, Inc.* | 3,217 | 88,178 |
| Rocket Fuel, Inc.* | 434 | 26,687 |
| SciQuest, Inc.* | 1,964 | 55,935 |
| Shutterstock, Inc.* | 639 | 53,440 |
| Spark Networks, Inc.* | 1,033 | 6,363 |
| SPS Commerce, Inc.* | 1,411 | 92,138 |
| Stamps.com, Inc.* | 1,126 | 47,405 |
| support.com, Inc.* | 4,845 | 18,363 |
| TechTarget, Inc.* | 1,109 | 7,608 |
| Textura Corp.* | 451 | 13,503 |
| Travelzoo, Inc.* | 642 | 13,687 |
| Tremor Video, Inc.* | 645 | 3,741 |
| Trulia, Inc.* | 2,376 | 83,802 |
| United Online, Inc | 1,090 | 14,998 |
| Unwired Planet, Inc.* | 8,707 | 12,016 |
| ValueClick, Inc.* | 5,886 | 137,556 |
| VistaPrint NV* | 2,815 | 160,033 |
| Vocus, Inc.* | 1,857 | 21,151 |
| Web.com Group, Inc.* | 3,615 | 114,921 |
| WebMD Health Corp.* | 2,504 | 98,908 |
| Wix.com Ltd.* | 732 | 19,654 |
| XO Group, Inc.* | 2,474 | 36,764 |
| Xoom Corp.* | 642 | 17,572 |
| Yelp, Inc.* | 2,860 | 197,197 |
| YuMe, Inc.* | 450 | 3,352 |
| Zillow, Inc.* | 2,014 | 164,604 |
| Zix Corp.* | 5,001 | 22,805 |
| | | 4,458,614 |
| |
| IT Services - 2.1% | | |
| Acxiom Corp.* | 6,374 | 235,711 |
| Blackhawk Network Holdings, Inc.* | 992 | 25,058 |
| CACI International, Inc.* | 2,028 | 148,490 |
| Cardtronics, Inc.* | 3,972 | 172,583 |
| Cass Information Systems, Inc. | 943 | 63,511 |
| Ciber, Inc.* | 6,559 | 27,154 |
| Computer Task Group, Inc. | 1,181 | 22,321 |
| Convergys Corp. | 9,060 | 190,713 |
| CSG Systems International, Inc. | 2,979 | 87,583 |
| EPAM Systems, Inc.* | 1,885 | 65,862 |
| Euronet Worldwide, Inc.* | 4,298 | 205,659 |
| EVERTEC, Inc. | 2,544 | 62,735 |
| ExlService Holdings, Inc.* | 2,814 | 77,723 |
| Forrester Research, Inc. | 1,083 | 41,436 |
| Global Cash Access Holdings, Inc.* | 5,479 | 54,735 |
| Heartland Payment Systems, Inc. | 3,133 | 156,149 |
| Higher One Holdings, Inc.* | 2,895 | 28,255 |
| iGate Corp.* | 3,073 | 123,412 |
| Lionbridge Technologies, Inc.* | 5,129 | 30,569 |
| Luxoft Holding, Inc.* | 404 | 15,344 |
| Mantech International Corp. | 1,948 | 58,304 |
| MAXIMUS, Inc | 5,890 | 259,101 |
| ModusLink Global Solutions, Inc.* | 3,259 | 18,674 |
| MoneyGram International, Inc.* | 1,932 | 40,147 |
www.calvert.com CALVERT VP RUSSELL 2000 SMALL CAP INDEX PORTFOLIO ANNUAL REPORT 31
| | |
| EQUITY SECURITIES - CONT’D | SHARES | VALUE |
| IT Services - Cont’d | | |
| Planet Payment, Inc.* | 3,665 | $10,189 |
| PRGX Global, Inc.* | 2,488 | 16,719 |
| Sapient Corp.* | 9,516 | 165,198 |
| ServiceSource International, Inc.* | 5,266 | 44,129 |
| SYKES Enterprises, Inc.* | 3,603 | 78,581 |
| Syntel, Inc.* | 1,390 | 126,419 |
| TeleTech Holdings, Inc.* | 1,717 | 41,105 |
| The Hackett Group, Inc. | 1,931 | 11,991 |
| Unisys Corp.* | 3,725 | 125,048 |
| Virtusa Corp.* | 1,651 | 62,887 |
| WEX, Inc.* | 3,418 | 338,485 |
| | | 3,231,980 |
| |
| Leisure Equipment & Products - 0.5% | | |
| Arctic Cat, Inc. | 1,125 | 64,103 |
| Black Diamond, Inc.* | 1,890 | 25,194 |
| Brunswick Corp. | 7,968 | 367,006 |
| Callaway Golf Co | 5,633 | 47,486 |
| Jakks Pacific, Inc. | 1,960 | 13,191 |
| Johnson Outdoors, Inc | 405 | 10,915 |
| Leapfrog Enterprises, Inc.* | 5,496 | 43,638 |
| Marine Products Corp | 813 | 8,171 |
| Nautilus, Inc.* | 2,675 | 22,550 |
| Smith & Wesson Holding Corp.* | 4,829 | 65,143 |
| Sturm Ruger & Co., Inc. | 1,672 | 122,206 |
| | | 789,603 |
| |
| Life Sciences - Tools & Services - 0.4% | | |
| Accelerate Diagnostics, Inc.* | 896 | 10,931 |
| Affymetrix, Inc.* | 6,207 | 53,194 |
| Albany Molecular Research, Inc.* | 2,006 | 20,221 |
| Cambrex Corp.* | 2,637 | 47,018 |
| Fluidigm Corp.* | 2,157 | 82,656 |
| Furiex Pharmaceuticals, Inc.* | 656 | 27,559 |
| Harvard Bioscience, Inc.* | 1,892 | 8,892 |
| Luminex Corp.* | 3,221 | 62,487 |
| NeoGenomics, Inc.* | 2,836 | 10,266 |
| Pacific Biosciences of California, Inc.* | 4,118 | 21,537 |
| PAREXEL International Corp.* | 4,902 | 221,472 |
| Sequenom, Inc.* | 10,313 | 24,133 |
| | | 590,366 |
| |
| Machinery - 3.1% | | |
| Accuride Corp.* | 4,261 | 15,894 |
| Actuant Corp. | 6,311 | 231,235 |
| Alamo Group, Inc. | 670 | 40,662 |
| Albany International Corp. | 2,370 | 85,154 |
| Altra Industrial Motion Corp | 2,349 | 80,383 |
| American Railcar Industries, Inc. | 842 | 38,522 |
| Ampco-Pittsburgh Corp | 791 | 15,385 |
| Astec Industries, Inc. | 1,736 | 67,062 |
| Barnes Group, Inc. | 4,635 | 177,567 |
| Blount International, Inc.* | 4,185 | 60,557 |
| Briggs & Stratton Corp | 4,154 | 90,391 |
| Chart Industries, Inc.* | 2,615 | 250,099 |
| CIRCOR International, Inc. | 1,493 | 120,605 |
32 www.calvert.com CALVERT VP RUSSELL 2000 SMALL CAP INDEX PORTFOLIO ANNUAL REPORT
| | |
| EQUITY SECURITIES - CONT’D | SHARES | VALUE |
| Machinery - Cont’d | | |
| CLARCOR, Inc. | 4,377 | $281,660 |
| Columbus McKinnon Corp.* | 1,673 | 45,405 |
| Commercial Vehicle Group, Inc.* | 2,272 | 16,517 |
| Douglas Dynamics, Inc. | 1,993 | 33,522 |
| Dynamic Materials Corp | 1,203 | 26,153 |
| Energy Recovery, Inc.* | 4,261 | 23,691 |
| EnPro Industries, Inc.* | 1,799 | 103,712 |
| ESCO Technologies, Inc. | 2,314 | 79,278 |
| Federal Signal Corp.* | 5,446 | 79,784 |
| Flow International Corp.* | 4,867 | 19,663 |
| FreightCar America, Inc | 1,042 | 27,738 |
| Gerber Scientific, Inc. (b)* | 2,334 | — |
| Global Brass & Copper Holdings, Inc. | 694 | 11,486 |
| Gorman-Rupp Co | 1,593 | 53,254 |
| Graham Corp | 863 | 31,318 |
| Hardinge, Inc | 1,051 | 15,208 |
| Hurco Co.’s, Inc | 529 | 13,230 |
| Hyster-Yale Materials Handling, Inc. | 908 | 84,589 |
| John Bean Technologies Corp. | 2,463 | 72,240 |
| Kadant, Inc. | 966 | 39,142 |
| LB Foster Co | 815 | 38,541 |
| Lindsay Corp. | 1,094 | 90,529 |
| Lydall, Inc.* | 1,583 | 27,892 |
| Manitex International, Inc.* | 1,060 | 16,833 |
| Meritor, Inc.* | 8,688 | 90,616 |
| Miller Industries, Inc | 1,050 | 19,562 |
| Mueller Industries, Inc. | 2,425 | 152,799 |
| Mueller Water Products, Inc. | 13,480 | 126,308 |
| NN, Inc. | 1,381 | 27,882 |
| Omega Flex, Inc | 248 | 5,074 |
| PMFG, Inc.* | 1,648 | 14,914 |
| Proto Labs, Inc.* | 1,472 | 104,777 |
| RBC Bearings, Inc.* | 1,997 | 141,288 |
| Rexnord Corp.* | 2,593 | 70,037 |
| Standex International Corp. | 1,092 | 68,665 |
| Sun Hydraulics Corp | 1,860 | 75,944 |
| Tecumseh Products Co.* | 1,594 | 14,426 |
| Tennant Co. | 1,652 | 112,022 |
| The ExOne Co.* | 538 | 32,527 |
| The Greenbrier Co.’s, Inc.* | 2,057 | 67,552 |
| The Middleby Corp.* | 1,656 | 397,390 |
| Titan International, Inc | 4,726 | 84,973 |
| Trimas Corp.* | 3,865 | 154,175 |
| Twin Disc, Inc. | 694 | 17,968 |
| Wabash National Corp.* | 5,981 | 73,865 |
| Watts Water Technologies, Inc. | 2,460 | 152,200 |
| Woodward, Inc. | 5,929 | 270,422 |
| Xerium Technologies, Inc.* | 941 | 15,517 |
| | | 4,795,804 |
| |
| Marine - 0.1% | | |
| International Shipholding Corp. | 583 | 17,198 |
| Matson, Inc | 3,681 | 96,111 |
| Ultrapetrol Bahamas Ltd.* | 1,843 | 6,893 |
| | | 120,202 |
www.calvert.com CALVERT VP RUSSELL 2000 SMALL CAP INDEX PORTFOLIO ANNUAL REPORT 33
| | |
| EQUITY SECURITIES - CONT’D | SHARES | VALUE |
| Media - 1.3% | | |
| AH Belo Corp | 1,629 | $12,169 |
| Beasley Broadcasting Group, Inc. | 396 | 3,457 |
| Carmike Cinemas, Inc.* | 1,988 | 55,346 |
| Central European Media Enterprises Ltd.* | 6,603 | 25,355 |
| Crown Media Holdings, Inc.* | 3,539 | 12,493 |
| Cumulus Media, Inc.* | 7,633 | 59,003 |
| Daily Journal Corp.* | 88 | 16,279 |
| Dex Media, Inc.* | 1,477 | 10,014 |
| Digital Generation, Inc.* | 2,184 | 27,846 |
| Entercom Communications Corp.* | 2,183 | 22,943 |
| Entravision Communications Corp | 4,508 | 27,454 |
| EW Scripps Co.* | 2,937 | 63,792 |
| Global Sources Ltd.* | 1,547 | 12,577 |
| Gray Television, Inc.* | 4,337 | 64,535 |
| Harte-Hanks, Inc. | 4,010 | 31,358 |
| Hemisphere Media Group, Inc.* | 742 | 8,808 |
| Journal Communications, Inc.* | 3,822 | 35,583 |
| Live Nation Entertainment, Inc.* | 12,136 | 239,807 |
| Loral Space & Communications, Inc.* | 1,123 | 90,941 |
| Martha Stewart Living Omnimedia, Inc.* | 2,756 | 11,575 |
| McClatchy Co.* | 5,532 | 18,809 |
| MDC Partners, Inc. | 3,334 | 85,050 |
| Media General, Inc.* | 1,690 | 38,194 |
| Meredith Corp. | 3,080 | 159,544 |
| National CineMedia, Inc. | 5,048 | 100,758 |
| New York Times Co. | 11,125 | 176,554 |
| Nexstar Broadcasting Group, Inc. | 2,532 | 141,108 |
| ReachLocal, Inc.* | 820 | 10,422 |
| Reading International, Inc.* | 1,506 | 11,280 |
| Rentrak Corp.* | 971 | 36,791 |
| Saga Communications, Inc. | 394 | 19,818 |
| Salem Communications Corp. | 911 | 7,926 |
| Scholastic Corp. | 2,251 | 76,556 |
| SFX Entertainment, Inc.* | 1,762 | 21,144 |
| Sinclair Broadcast Group, Inc. | 5,900 | 210,807 |
| Valassis Communications, Inc | 3,348 | 114,669 |
| World Wrestling Entertainment, Inc. | 2,503 | 41,500 |
| | | 2,102,265 |
| |
| Metals & Mining - 1.3% | | |
| AK Steel Holding Corp.* | 12,084 | 99,089 |
| Allied Nevada Gold Corp.* | 8,959 | 31,804 |
| AM Castle & Co.* | 1,549 | 22,879 |
| AMCOL International Corp | 2,453 | 83,353 |
| Century Aluminum Co.* | 4,238 | 44,329 |
| Coeur Mining, Inc.* | 9,023 | 97,900 |
| Commercial Metals Co. | 10,079 | 204,906 |
| General Moly, Inc.* | 6,675 | 8,945 |
| Globe Specialty Metals, Inc | 5,366 | 96,642 |
| Gold Resource Corp | 2,687 | 12,172 |
| Handy & Harman Ltd.* | 480 | 11,621 |
| Haynes International, Inc | 1,062 | 58,665 |
| Hecla Mining Co. | 28,701 | 88,399 |
| Horsehead Holding Corp.* | 4,443 | 72,021 |
| Kaiser Aluminum Corp | 1,630 | 114,491 |
| Materion Corp. | 1,774 | 54,728 |
34 www.calvert.com CALVERT VP RUSSELL 2000 SMALL CAP INDEX PORTFOLIO ANNUAL REPORT
| | |
| EQUITY SECURITIES - CONT’D | SHARES | VALUE |
| Metals & Mining - Cont’d | | |
| Midway Gold Corp.* | 10,276 | $8,324 |
| Molycorp, Inc.* | 12,844 | 72,183 |
| Noranda Aluminum Holding Corp | 3,000 | 9,870 |
| Olympic Steel, Inc. | 846 | 24,517 |
| Paramount Gold and Silver Corp.* | 11,758 | 10,956 |
| RTI International Metals, Inc.* | 2,632 | 90,041 |
| Schnitzer Steel Industries, Inc. | 2,273 | 74,259 |
| Stillwater Mining Co.* | 10,423 | 128,620 |
| SunCoke Energy, Inc.* | 5,999 | 136,837 |
| Universal Stainless & Alloy Products, Inc.* | 703 | 25,350 |
| US Silica Holdings, Inc | 1,849 | 63,069 |
| Walter Energy, Inc | 5,396 | 89,735 |
| Worthington Industries, Inc | 4,540 | 191,043 |
| | | 2,026,748 |
| |
| Multiline Retail - 0.1% | | |
| Bon-Ton Stores, Inc. | 1,090 | 17,745 |
| Burlington Stores, Inc.* | 1,351 | 43,232 |
| Fred’s, Inc | 3,167 | 58,653 |
| Gordmans Stores, Inc | 571 | 4,380 |
| Tuesday Morning Corp.* | 3,766 | 60,105 |
| | | 184,115 |
| |
| Multi-Utilities - 0.3% | | |
| Avista Corp. | 5,283 | 148,928 |
| Black Hills Corp. | 3,833 | 201,271 |
| NorthWestern Corp. | 3,277 | 141,959 |
| | | 492,158 |
| |
| Oil, Gas & Consumable Fuels - 3.4% | | |
| Abraxas Petroleum Corp.* | 7,685 | 25,207 |
| Adams Resources & Energy, Inc | 189 | 12,946 |
| Alon USA Energy, Inc | 2,007 | 33,196 |
| Alpha Natural Resources, Inc.* | 19,041 | 135,953 |
| Amyris, Inc.* | 2,650 | 14,018 |
| Apco Oil and Gas International, Inc.* | 813 | 12,675 |
| Approach Resources, Inc.* | 2,944 | 56,790 |
| Arch Coal, Inc | 19,111 | 85,044 |
| Athlon Energy, Inc.* | 1,562 | 47,250 |
| Bill Barrett Corp.* | 4,332 | 116,011 |
| Bonanza Creek Energy, Inc.* | 2,538 | 110,327 |
| BPZ Resources, Inc.* | 8,517 | 15,501 |
| Callon Petroleum Co.* | 3,669 | 23,959 |
| Carrizo Oil & Gas, Inc.* | 4,001 | 179,125 |
| Clayton Williams Energy, Inc.* | 515 | 42,204 |
| Clean Energy Fuels Corp.* | 5,949 | 76,623 |
| Cloud Peak Energy, Inc.* | 5,496 | 98,928 |
| Comstock Resources, Inc. | 4,332 | 79,232 |
| Contango Oil & Gas Co.* | 1,297 | 61,296 |
| Crosstex Energy, Inc | 4,105 | 148,437 |
| Delek US Holdings, Inc | 3,202 | 110,181 |
| Diamondback Energy, Inc.* | 1,685 | 89,069 |
| Emerald Oil, Inc.* | 4,852 | 37,166 |
| Endeavour International Corp.* | 4,135 | 21,709 |
| Energy XXI Bermuda Ltd. | 6,845 | 185,226 |
| EPL Oil & Gas, Inc.* | 2,531 | 72,135 |
www.calvert.com CALVERT VP RUSSELL 2000 SMALL CAP INDEX PORTFOLIO ANNUAL REPORT 35
| | |
| EQUITY SECURITIES - CONT’D | SHARES | VALUE |
| Oil, Gas & Consumable Fuels - Cont’d | | |
| Equal Energy Ltd. | 3,070 | $16,394 |
| Evolution Petroleum Corp. | 1,370 | 16,906 |
| EXCO Resources, Inc.: | | |
| Common | 14,704 | 78,078 |
| Rights* | 11,704 | 1,873 |
| Forest Oil Corp.* | 10,604 | 38,280 |
| Frontline Ltd.* | 4,236 | 15,843 |
| FX Energy, Inc.* | 4,491 | 16,437 |
| GasLog Ltd. | 2,117 | 36,180 |
| Gastar Exploration, Inc.* | 4,045 | 27,991 |
| Goodrich Petroleum Corp.* | 2,688 | 45,750 |
| Green Plains Renewable Energy, Inc. | 2,245 | 43,531 |
| Halcon Resources Corp.* | 19,991 | 77,165 |
| Hallador Energy Co. | 353 | 2,845 |
| Isramco, Inc.* | 85 | 10,799 |
| Jones Energy, Inc.* | 958 | 13,872 |
| KiOR, Inc.* | 3,784 | 6,357 |
| Knightsbridge Tankers Ltd. | 2,607 | 23,958 |
| Kodiak Oil & Gas Corp.* | 22,890 | 256,597 |
| L&L Energy, Inc. (b)* | 2,592 | 4,355 |
| LinnCo, LLC | 1 | 17 |
| Magnum Hunter Resources Corp.: | | |
| Common* | 14,824 | 108,363 |
| Warrants (strike price $8.50/share, expires 04/15/2016) (b)* | 1,482 | — |
| Matador Resources Co.* | 5,007 | 93,330 |
| Midstates Petroleum Co., Inc.* | 2,163 | 14,319 |
| Miller Energy Resources, Inc.* | 2,624 | 18,473 |
| Nordic American Tankers Ltd. | 6,623 | 64,243 |
| Northern Oil And Gas, Inc.* | 5,718 | 86,170 |
| Panhandle Oil and Gas, Inc. | 744 | 24,857 |
| PDC Energy, Inc.* | 3,060 | 162,853 |
| Penn Virginia Corp.* | 4,752 | 44,811 |
| Petroquest Energy, Inc.* | 4,829 | 20,861 |
| Quicksilver Resources, Inc.* | 10,574 | 32,462 |
| Renewable Energy Group, Inc.* | 1,824 | 20,903 |
| Rentech, Inc.* | 20,009 | 35,016 |
| Resolute Energy Corp.* | 5,964 | 53,855 |
| REX American Resources Corp.* | 472 | 21,103 |
| Rex Energy Corp.* | 3,823 | 75,351 |
| Rosetta Resources, Inc.* | 5,323 | 255,717 |
| Sanchez Energy Corp.* | 3,276 | 80,295 |
| Scorpio Tankers, Inc | 15,938 | 187,909 |
| SemGroup Corp | 3,626 | 236,524 |
| Ship Finance International Ltd | 4,841 | 79,296 |
| Solazyme, Inc.* | 4,124 | 44,910 |
| Stone Energy Corp.* | 4,454 | 154,064 |
| Swift Energy Co.* | 3,858 | 52,083 |
| Synergy Resources Corp.* | 4,393 | 40,679 |
| Targa Resources Corp | 2,837 | 250,138 |
| Teekay Tankers Ltd. | 5,671 | 22,287 |
| Triangle Petroleum Corp.* | 5,850 | 48,672 |
| Uranium Energy Corp.* | 5,621 | 11,242 |
| Ur-Energy, Inc.* | 10,466 | 14,443 |
| Vaalco Energy, Inc.* | 5,208 | 35,883 |
| W&T Offshore, Inc. | 3,057 | 48,912 |
| Warren Resources, Inc.* | 6,571 | 20,633 |
36 www.calvert.com CALVERT VP RUSSELL 2000 SMALL CAP INDEX PORTFOLIO ANNUAL REPORT
| | |
| EQUITY SECURITIES - CONT’D | SHARES | VALUE |
| Oil, Gas & Consumable Fuels - Cont’d | | |
| Western Refining, Inc. | 4,805 | $203,780 |
| Westmoreland Coal Co.* | 813 | 15,683 |
| ZaZa Energy Corp.* | 2,235 | 2,136 |
| | | 5,305,692 |
| |
| Paper & Forest Products - 0.7% | | |
| Boise Cascade Co.* | 1,195 | 35,229 |
| Clearwater Paper Corp.* | 1,915 | 100,538 |
| Deltic Timber Corp. | 942 | 63,999 |
| KapStone Paper and Packaging Corp.* | 3,521 | 196,683 |
| Louisiana-Pacific Corp.* | 12,018 | 222,453 |
| Neenah Paper, Inc. | 1,287 | 55,045 |
| PH Glatfelter Co | 3,701 | 102,296 |
| Resolute Forest Products, Inc.* | 6,020 | 96,440 |
| Schweitzer-Mauduit International, Inc | 2,724 | 140,204 |
| Wausau Paper Corp | 4,288 | 54,372 |
| | | 1,067,259 |
| |
| Personal Products - 0.2% | | |
| Elizabeth Arden, Inc.* | 2,269 | 80,436 |
| Female Health Co. | 1,851 | 15,733 |
| Inter Parfums, Inc. | 1,484 | 53,142 |
| Lifevantage Corp.* | 9,790 | 16,153 |
| Medifast, Inc.* | 1,179 | 30,807 |
| Nature’s Sunshine Products, Inc. | 1,018 | 17,632 |
| Nutraceutical International Corp.* | 861 | 23,058 |
| Revlon, Inc.* | 936 | 23,363 |
| Star Scientific, Inc.* | 13,119 | 15,218 |
| Synutra International, Inc.* | 1,867 | 16,579 |
| USANA Health Sciences, Inc.* | 481 | 36,354 |
| | | 328,475 |
| |
| Pharmaceuticals - 1.6% | | |
| AcelRx Pharmaceuticals, Inc.* | 1,801 | 20,369 |
| Aerie Pharmaceuticals, Inc.* | 681 | 12,231 |
| Akorn, Inc.* | 5,120 | 126,106 |
| Alimera Sciences, Inc.* | 1,462 | 6,886 |
| Ampio Pharmaceuticals, Inc.* | 2,384 | 16,998 |
| Aratana Therapeutics, Inc.* | 569 | 10,868 |
| Auxilium Pharmaceuticals, Inc.* | 4,356 | 90,343 |
| AVANIR Pharmaceuticals, Inc.* | 12,837 | 43,132 |
| BioDelivery Sciences International, Inc.* | 1,915 | 11,279 |
| Cadence Pharmaceuticals, Inc.* | 5,345 | 48,372 |
| Cempra, Inc.* | 1,719 | 21,298 |
| Corcept Therapeutics, Inc.* | 3,942 | 12,693 |
| Cornerstone Therapeutics, Inc.* | 514 | 4,878 |
| Depomed, Inc.* | 4,576 | 48,414 |
| Endocyte, Inc.* | 2,665 | 28,489 |
| Forest Laboratories, Inc. (b)* | 1,024 | — |
| Hi-Tech Pharmacal Co., Inc.* | 922 | 40,006 |
| Horizon Pharma, Inc.* | 4,443 | 33,856 |
| Impax Laboratories, Inc.* | 6,033 | 151,670 |
| Lannett Co., Inc.* | 1,646 | 54,483 |
| Medicines Co.* | 5,457 | 210,749 |
| Nektar Therapeutics* | 9,930 | 112,705 |
| Omeros Corp.* | 2,565 | 28,959 |
www.calvert.com CALVERT VP RUSSELL 2000 SMALL CAP INDEX PORTFOLIO ANNUAL REPORT 37
| | |
| EQUITY SECURITIES - CONT’D | SHARES | VALUE |
| Pharmaceuticals - Cont’d | | |
| Omthera Pharmaceutical CVR (b)* | 508 | — |
| Pacira Pharmaceuticals, Inc.* | 2,377 | $136,654 |
| Pernix Therapeutics Holdings, Inc.* | 1,511 | 3,808 |
| Pozen, Inc.* | 2,758 | 22,174 |
| Prestige Brands Holdings, Inc.* | 4,469 | 159,990 |
| Questcor Pharmaceuticals, Inc. | 4,474 | 243,609 |
| Relypsa, Inc.* | 535 | 13,375 |
| Repros Therapeutics, Inc.* | 1,982 | 36,271 |
| Sagent Pharmaceuticals, Inc.* | 1,439 | 36,522 |
| Santarus, Inc.* | 4,888 | 156,220 |
| Sciclone Pharmaceuticals, Inc.* | 5,114 | 25,775 |
| Sucampo Pharmaceuticals, Inc.* | 729 | 6,853 |
| Supernus Pharmaceuticals, Inc.* | 1,284 | 9,681 |
| TherapeuticsMD, Inc.* | 6,731 | 35,069 |
| Trius Therapeutics, Inc. (b)* | 3,210 | — |
| Viropharma, Inc.* | 5,753 | 286,787 |
| VIVUS, Inc.* | 8,977 | 81,511 |
| XenoPort, Inc.* | 3,819 | 21,959 |
| Zogenix, Inc.* | 8,716 | 29,983 |
| | | 2,441,025 |
| |
| Professional Services - 1.3% | | |
| Acacia Research Corp | 4,242 | 61,679 |
| Advisory Board Co.* | 3,089 | 196,677 |
| Barrett Business Services, Inc. | 606 | 56,200 |
| CBIZ, Inc.* | 3,612 | 32,941 |
| CDI Corp. | 1,164 | 21,569 |
| Corporate Executive Board Co | 2,899 | 224,470 |
| CRA International, Inc.* | 1,024 | 20,275 |
| Exponent, Inc. | 1,204 | 93,238 |
| Franklin Covey Co.* | 1,007 | 20,019 |
| FTI Consulting, Inc.* | 3,476 | 143,003 |
| GP Strategies Corp.* | 1,245 | 37,088 |
| Heidrick & Struggles International, Inc. | 1,525 | 30,713 |
| Huron Consulting Group, Inc.* | 2,037 | 127,761 |
| ICF International, Inc.* | 1,793 | 62,235 |
| Insperity, Inc. | 1,904 | 68,791 |
| Kelly Services, Inc. | 2,314 | 57,711 |
| Kforce, Inc. | 2,335 | 47,774 |
| Korn/Ferry International* | 4,288 | 112,003 |
| Mistras Group, Inc.* | 1,338 | 27,937 |
| Navigant Consulting, Inc.* | 4,439 | 85,229 |
| Odyssey Marine Exploration, Inc.* | 5,528 | 11,167 |
| On Assignment, Inc.* | 3,867 | 135,036 |
| Pendrell Corp.* | 12,424 | 24,972 |
| Resources Connection, Inc | 3,518 | 50,413 |
| RPX Corp.* | 2,794 | 47,219 |
| TrueBlue, Inc.* | 3,417 | 88,090 |
| VSE Corp. | 430 | 20,644 |
| WageWorks, Inc.* | 2,152 | 127,915 |
| | | 2,032,769 |
| |
| Real Estate Investment Trusts - 6.6% | | |
| Acadia Realty Trust | 4,723 | 117,272 |
| AG Mortgage Investment Trust, Inc | 2,395 | 37,458 |
| Agree Realty Corp. | 1,312 | 38,074 |
38 www.calvert.com CALVERT VP RUSSELL 2000 SMALL CAP INDEX PORTFOLIO ANNUAL REPORT
| | |
| EQUITY SECURITIES - CONT’D | SHARES | VALUE |
| Real Estate Investment Trusts - Cont’d | | |
| Alexander’s, Inc. | 180 | $59,400 |
| American Assets Trust, Inc. | 2,814 | 88,444 |
| American Capital Mortgage Investment Corp | 4,660 | 81,364 |
| American Realty Capital Properties, Inc | 13,283 | 170,819 |
| American Residential Properties, Inc.* | 1,182 | 20,283 |
| AmREIT, Inc. | 1,694 | 28,459 |
| Anworth Mortgage Asset Corp | 12,353 | 52,006 |
| Apollo Commercial Real Estate Finance, Inc | 3,180 | 51,675 |
| Apollo Residential Mortgage, Inc. | 2,739 | 40,482 |
| Ares Commercial Real Estate Corp. | 1,858 | 24,340 |
| Armada Hoffler Properties, Inc. | 1,639 | 15,210 |
| ARMOUR Residential REIT, Inc. | 32,262 | 129,371 |
| Ashford Hospitality Prime, Inc | 1,063 | 19,347 |
| Ashford Hospitality Trust, Inc | 5,319 | 44,041 |
| Associated Estates Realty Corp | 4,985 | 80,009 |
| Aviv REIT, Inc. | 992 | 23,510 |
| Campus Crest Communities, Inc | 5,690 | 53,543 |
| Capstead Mortgage Corp. | 8,425 | 101,774 |
| Cedar Realty Trust, Inc. | 5,667 | 35,475 |
| Chambers Street Properties | 20,468 | 156,580 |
| Chatham Lodging Trust | 2,316 | 47,362 |
| Chesapeake Lodging Trust | 4,308 | 108,949 |
| Colony Financial, Inc | 6,738 | 136,714 |
| Coresite Realty Corp. | 1,850 | 59,552 |
| Cousins Properties, Inc. | 14,510 | 149,453 |
| CubeSmart | 11,488 | 183,119 |
| CyrusOne, Inc. | 1,676 | 37,425 |
| CYS Investments, Inc | 15,057 | 111,572 |
| DCT Industrial Trust, Inc | 25,069 | 178,742 |
| DiamondRock Hospitality Co. | 17,217 | 198,856 |
| DuPont Fabros Technology, Inc. | 5,521 | 136,424 |
| Dynex Capital, Inc | 4,570 | 36,560 |
| EastGroup Properties, Inc. | 2,654 | 153,746 |
| Education Realty Trust, Inc | 10,056 | 88,694 |
| Ellington Residential Mortgage REIT | 556 | 8,551 |
| Empire State Realty Trust, Inc | 7,257 | 111,032 |
| EPR Properties | 4,456 | 219,057 |
| Equity One, Inc. | 5,192 | 116,508 |
| Excel Trust, Inc. | 3,973 | 45,252 |
| FelCor Lodging Trust, Inc.* | 10,890 | 88,862 |
| First Industrial Realty Trust, Inc | 9,496 | 165,705 |
| First Potomac Realty Trust | 5,123 | 59,580 |
| Franklin Street Properties Corp. | 7,763 | 92,768 |
| Getty Realty Corp | 2,309 | 42,416 |
| Gladstone Commercial Corp. | 1,212 | 21,780 |
| Glimcher Realty Trust | 12,556 | 117,524 |
| Government Properties Income Trust | 4,714 | 117,143 |
| Gramercy Property Trust, Inc.* | 5,120 | 29,440 |
| Hannon Armstrong Sustainable Infrastructure Capital, Inc | 1,271 | 17,743 |
| Healthcare Realty Trust, Inc. | 8,302 | 176,916 |
| Hersha Hospitality Trust | 17,467 | 97,291 |
| Highwoods Properties, Inc. | 7,914 | 286,249 |
| Hudson Pacific Properties, Inc. | 3,817 | 83,478 |
| Inland Real Estate Corp. | 7,356 | 77,385 |
| Invesco Mortgage Capital, Inc | 11,791 | 173,092 |
| Investors Real Estate Trust | 8,714 | 74,766 |
www.calvert.com CALVERT VP RUSSELL 2000 SMALL CAP INDEX PORTFOLIO ANNUAL REPORT 39
| | |
| EQUITY SECURITIES - CONT’D | SHARES | VALUE |
| Real Estate Investment Trusts - Cont’d | | |
| iStar Financial, Inc.* | 7,508 | $107,139 |
| JAVELIN Mortgage Investment Corp | 1,156 | 16,103 |
| Kite Realty Group Trust | 11,509 | 75,614 |
| LaSalle Hotel Properties | 8,989 | 277,401 |
| Lexington Realty Trust | 15,553 | 158,796 |
| LTC Properties, Inc | 3,077 | 108,895 |
| Medical Properties Trust, Inc | 13,934 | 170,273 |
| Monmouth Real Estate Investment Corp | 4,002 | 36,378 |
| National Health Investors, Inc. | 2,570 | 144,177 |
| New Residential Investment Corp | 21,820 | 145,758 |
| New York Mortgage Trust, Inc. | 5,646 | 39,466 |
| NorthStar Realty Finance Corp | 25,524 | 343,298 |
| One Liberty Properties, Inc | 1,012 | 20,372 |
| Parkway Properties, Inc. | 4,864 | 93,827 |
| Pebblebrook Hotel Trust | 5,402 | 166,166 |
| Pennsylvania Real Estate Investment Trust | 6,022 | 114,298 |
| Pennymac Mortgage Investment Trust | 6,083 | 139,666 |
| Physicians Realty Trust | 1,772 | 22,575 |
| Potlatch Corp | 3,492 | 145,756 |
| PS Business Parks, Inc. | 1,711 | 130,755 |
| QTS Realty Trust, Inc. | 1,241 | 30,752 |
| RAIT Financial Trust | 6,203 | 55,641 |
| Ramco-Gershenson Properties Trust | 5,863 | 92,284 |
| Redwood Trust, Inc | 7,082 | 137,178 |
| Resource Capital Corp. | 11,065 | 65,615 |
| Retail Opportunity Investments Corp | 6,329 | 93,163 |
| Rexford Industrial Realty, Inc | 1,456 | 19,219 |
| RLJ Lodging Trust | 10,843 | 263,702 |
| Rouse Properties, Inc | 1,994 | 44,247 |
| Ryman Hospitality Properties, Inc. | 3,804 | 158,931 |
| Sabra Healthcare REIT, Inc | 3,180 | 83,125 |
| Saul Centers, Inc | 656 | 31,311 |
| Select Income REIT | 1,889 | 50,512 |
| Silver Bay Realty Trust Corp. | 1,310 | 20,947 |
| Sovran Self Storage, Inc | 2,695 | 175,633 |
| STAG Industrial, Inc | 3,607 | 73,547 |
| Strategic Hotels & Resorts, Inc.* | 15,634 | 147,741 |
| Summit Hotel Properties, Inc. | 6,869 | 61,821 |
| Sun Communities, Inc. | 3,168 | 135,084 |
| Sunstone Hotel Investors, Inc. | 16,109 | 215,861 |
| Terreno Realty Corp | 2,161 | 38,250 |
| The GEO Group, Inc. | 6,174 | 198,926 |
| UMH Properties, Inc. | 1,025 | 9,656 |
| Universal Health Realty Income Trust | 985 | 39,459 |
| Urstadt Biddle Properties, Inc. | 2,125 | 39,206 |
| Washington Real Estate Investment Trust | 5,735 | 133,970 |
| Western Asset Mortgage Capital Corp. | 2,096 | 31,188 |
| Whitestone REIT | 1,829 | 24,454 |
| Winthrop Realty Trust | 2,311 | 25,537 |
| ZAIS Financial Corp | 499 | 7,999 |
| | | 10,280,314 |
| |
| Real Estate Management & Development - 0.4% | | |
| Alexander & Baldwin, Inc | 3,712 | 154,902 |
| Altisource Residential Corp | 3,661 | 110,233 |
| AV Homes, Inc.* | 824 | 14,972 |
40 www.calvert.com CALVERT VP RUSSELL 2000 SMALL CAP INDEX PORTFOLIO ANNUAL REPORT
| | |
| EQUITY SECURITIES - CONT’D | SHARES | VALUE |
| Real Estate Management & Development - Cont’d | | |
| Consolidated-Tomoka Land Co. | 504 | $18,290 |
| Forestar Group, Inc.* | 3,184 | 67,724 |
| Kennedy-Wilson Holdings, Inc | 4,874 | 108,445 |
| RE/MAX Holdings, Inc.* | 1,023 | 32,808 |
| Tejon Ranch Co.* | 1,147 | 42,164 |
| | | 549,538 |
| |
| Road & Rail - 0.5% | | |
| Arkansas Best Corp. | 2,213 | 74,534 |
| Celadon Group, Inc. | 1,805 | 35,161 |
| Heartland Express, Inc. | 3,964 | 77,773 |
| Knight Transportation, Inc | 5,197 | 95,313 |
| Marten Transport Ltd | 2,020 | 40,784 |
| Patriot Transportation Holding, Inc.* | 453 | 18,804 |
| Quality Distribution, Inc.* | 1,924 | 24,685 |
| Roadrunner Transportation Systems, Inc.* | 1,521 | 40,991 |
| Saia, Inc.* | 2,163 | 69,324 |
| Swift Transportation Co.* | 7,385 | 164,021 |
| Universal Truckload Services, Inc. | 475 | 14,492 |
| Werner Enterprises, Inc | 3,982 | 98,475 |
| YRC Worldwide, Inc.* | 810 | 14,070 |
| | | 768,427 |
| |
| Semiconductors & Semiconductor Equipment - 3.1% | | |
| Advanced Energy Industries, Inc.* | 3,385 | 77,381 |
| Alpha & Omega Semiconductor Ltd.* | 1,207 | 9,306 |
| Ambarella, Inc.* | 1,595 | 54,118 |
| Amkor Technology, Inc.* | 5,531 | 33,905 |
| Anadigics, Inc.* | 6,771 | 12,459 |
| Applied Micro Circuits Corp.* | 6,307 | 84,388 |
| ATMI, Inc.* | 2,756 | 83,259 |
| Axcelis Technologies, Inc.* | 9,665 | 23,583 |
| Brooks Automation, Inc | 5,690 | 59,688 |
| Cabot Microelectronics Corp.* | 2,121 | 96,930 |
| Cavium, Inc.* | 4,476 | 154,467 |
| Ceva, Inc.* | 1,987 | 30,242 |
| Cirrus Logic, Inc.* | 5,465 | 111,650 |
| Cohu, Inc | 2,037 | 21,387 |
| Cypress Semiconductor Corp.* | 12,680 | 133,140 |
| Diodes, Inc.* | 3,196 | 75,298 |
| DSP Group, Inc.* | 1,705 | 16,556 |
| Entegris, Inc.* | 12,359 | 143,364 |
| Entropic Communications, Inc.* | 7,041 | 33,163 |
| Exar Corp.* | 3,348 | 39,473 |
| Formfactor, Inc.* | 4,374 | 26,331 |
| GSI Technology, Inc.* | 2,002 | 13,293 |
| GT Advanced Technologies, Inc.* | 11,822 | 103,088 |
| Hittite Microwave Corp.* | 2,719 | 167,844 |
| Inphi Corp.* | 2,248 | 28,999 |
| Integrated Device Technology, Inc.* | 11,366 | 115,820 |
| Integrated Silicon Solution, Inc.* | 2,404 | 29,064 |
| Intermolecular, Inc.* | 1,487 | 7,316 |
| International Rectifier Corp.* | 5,989 | 156,133 |
| Intersil Corp | 11,475 | 131,618 |
| IXYS Corp. | 2,094 | 27,159 |
| Kopin Corp.* | 6,180 | 26,080 |
www.calvert.com CALVERT VP RUSSELL 2000 SMALL CAP INDEX PORTFOLIO ANNUAL REPORT 41
| | |
| EQUITY SECURITIES - CONT’D | SHARES | VALUE |
| Semiconductors & Semiconductor Equipment - Cont’d | | |
| Lattice Semiconductor Corp.* | 10,150 | $55,925 |
| LTX-Credence Corp.* | 4,282 | 34,213 |
| M/A-COM Technology Solutions Holdings, Inc.* | 912 | 15,495 |
| MaxLinear, Inc.* | 1,994 | 20,797 |
| Micrel, Inc. | 4,448 | 43,902 |
| Microsemi Corp.* | 8,000 | 199,600 |
| MKS Instruments, Inc. | 4,730 | 141,616 |
| Monolithic Power Systems, Inc.* | 3,171 | 109,907 |
| MoSys, Inc.* | 4,055 | 22,384 |
| Nanometrics, Inc.* | 2,115 | 40,291 |
| NeoPhotonics Corp.* | 1,727 | 12,193 |
| NVE Corp.* | 408 | 23,778 |
| Omnivision Technologies, Inc.* | 4,679 | 80,479 |
| PDF Solutions, Inc.* | 2,096 | 53,700 |
| Peregrine Semiconductor Corp.* | 2,279 | 16,887 |
| Pericom Semiconductor Corp.* | 2,352 | 20,839 |
| Photronics, Inc.* | 5,437 | 49,096 |
| PLX Technology, Inc.* | 3,845 | 25,300 |
| PMC - Sierra, Inc.* | 17,595 | 113,136 |
| Power Integrations, Inc. | 2,555 | 142,620 |
| Rambus, Inc.* | 9,941 | 94,141 |
| RF Micro Devices, Inc.* | 25,044 | 129,227 |
| Rubicon Technology, Inc.* | 1,417 | 14,099 |
| Rudolph Technologies, Inc.* | 2,894 | 33,976 |
| Semtech Corp.* | 5,722 | 144,652 |
| Sigma Designs, Inc.* | 2,722 | 12,848 |
| Silicon Image, Inc.* | 7,111 | 43,733 |
| Spansion, Inc.* | 4,135 | 57,435 |
| SunEdison, Inc.* | 23,472 | 306,310 |
| SunPower Corp.* | 3,580 | 106,720 |
| Supertex, Inc.* | 1,019 | 25,526 |
| Synaptics, Inc.* | 2,801 | 145,120 |
| Tessera Technologies, Inc | 4,394 | 86,606 |
| TriQuint Semiconductor, Inc.* | 14,079 | 117,419 |
| Ultra Clean Holdings, Inc.* | 2,008 | 20,140 |
| Ultratech, Inc.* | 2,360 | 68,440 |
| Veeco Instruments, Inc.* | 3,377 | 111,137 |
| | | 4,866,189 |
| |
| Software - 3.9% | | |
| Accelrys, Inc.* | 4,811 | 45,897 |
| ACI Worldwide, Inc.* | 3,436 | 223,340 |
| Actuate Corp.* | 4,437 | 34,209 |
| Advent Software, Inc | 2,747 | 96,118 |
| American Software, Inc. | 1,795 | 17,717 |
| Aspen Technology, Inc.* | 8,257 | 345,143 |
| AVG Technologies NV* | 2,064 | 35,521 |
| Barracuda Networks, Inc.* | 367 | 14,563 |
| Blackbaud, Inc. | 4,064 | 153,010 |
| Bottomline Technologies, Inc.* | 3,347 | 121,027 |
| BroadSoft, Inc.* | 2,474 | 67,639 |
| Callidus Software, Inc.* | 3,294 | 45,227 |
| Commvault Systems, Inc.* | 4,022 | 301,167 |
| Comverse, Inc.* | 1,972 | 76,514 |
| Covisint Corp.* | 648 | 8,132 |
| Cyan, Inc.* | 690 | 3,650 |
42 www.calvert.com CALVERT VP RUSSELL 2000 SMALL CAP INDEX PORTFOLIO ANNUAL REPORT
| | |
| EQUITY SECURITIES - CONT’D | SHARES | VALUE |
| Software - Cont’d | | |
| Digimarc Corp | 626 | $12,057 |
| Ebix, Inc. | 2,498 | 36,771 |
| Ellie Mae, Inc.* | 2,233 | 60,001 |
| EPIQ Systems, Inc. | 2,837 | 45,988 |
| ePlus, Inc.* | 291 | 16,540 |
| Fair Isaac Corp. | 3,160 | 198,574 |
| FleetMatics Group plc* | 1,409 | 60,939 |
| Gigamon, Inc.* | 668 | 18,757 |
| Glu Mobile, Inc.* | 4,867 | 18,933 |
| Guidance Software, Inc.* | 1,234 | 12,463 |
| Guidewire Software, Inc.* | 4,216 | 206,879 |
| Imperva, Inc.* | 1,741 | 83,794 |
| Infoblox, Inc.* | 4,666 | 154,071 |
| Interactive Intelligence Group, Inc.* | 1,336 | 89,993 |
| Jive Software, Inc.* | 3,414 | 38,407 |
| Manhattan Associates, Inc.* | 1,678 | 197,131 |
| Mavenir Systems, Inc.* | 485 | 5,413 |
| Mentor Graphics Corp | 8,386 | 201,851 |
| MicroStrategy, Inc.* | 767 | 95,292 |
| Mitek Systems, Inc.* | 1,917 | 11,387 |
| Model N, Inc.* | 700 | 8,253 |
| Monotype Imaging Holdings, Inc. | 3,293 | 104,915 |
| Netscout Systems, Inc.* | 3,122 | 92,380 |
| Pegasystems, Inc. | 1,548 | 76,131 |
| Progress Software Corp.* | 4,485 | 115,848 |
| Proofpoint, Inc.* | 1,881 | 62,393 |
| PROS Holdings, Inc.* | 1,967 | 78,483 |
| PTC, Inc.* | 10,537 | 372,904 |
| QAD, Inc | 409 | 7,223 |
| QLIK Technologies, Inc.* | 7,504 | 199,831 |
| Qualys, Inc.* | 1,284 | 29,673 |
| Rally Software Development Corp.* | 595 | 11,573 |
| RealPage, Inc.* | 4,014 | 93,847 |
| Rosetta Stone, Inc.* | 971 | 11,866 |
| Sapiens International Corp. NV | 1,230 | 9,483 |
| Seachange International, Inc.* | 2,824 | 34,340 |
| Silver Spring Networks, Inc.* | 511 | 10,731 |
| SS&C Technologies Holdings, Inc.* | 5,024 | 222,362 |
| Synchronoss Technologies, Inc.* | 2,488 | 77,302 |
| Take-Two Interactive Software, Inc.* | 7,040 | 122,285 |
| Tangoe, Inc.* | 2,685 | 48,357 |
| TeleCommunication Systems, Inc.* | 4,102 | 9,517 |
| TeleNav, Inc.* | 1,354 | 8,923 |
| The Ultimate Software Group, Inc.* | 2,435 | 373,091 |
| TiVo, Inc.* | 11,227 | 147,298 |
| Tyler Technologies, Inc.* | 2,775 | 283,411 |
| VASCO Data Security International, Inc.* | 2,346 | 18,135 |
| Verint Systems, Inc.* | 4,544 | 195,119 |
| VirnetX Holding Corp.* | 3,778 | 73,331 |
| Vringo, Inc.* | 5,782 | 17,115 |
| | | 6,070,235 |
| |
| Specialty Retail - 3.2% | | |
| Aeropostale, Inc.* | 7,078 | 64,339 |
| America’s Car-Mart, Inc.* | 726 | 30,659 |
| ANN, Inc.* | 4,068 | 148,726 |
www.calvert.com CALVERT VP RUSSELL 2000 SMALL CAP INDEX PORTFOLIO ANNUAL REPORT 43
| | |
| EQUITY SECURITIES - CONT’D | SHARES | VALUE |
| Specialty Retail - Cont’d | | |
| Asbury Automotive Group, Inc.* | 2,688 | $144,453 |
| Barnes & Noble, Inc.* | 3,484 | 52,086 |
| Bebe Stores, Inc | 3,035 | 16,146 |
| Big 5 Sporting Goods Corp. | 1,497 | 29,671 |
| Body Central Corp.* | 1,439 | 5,670 |
| Brown Shoe Co., Inc | 3,799 | 106,904 |
| Cato Corp | 2,436 | 77,465 |
| Christopher & Banks Corp.* | 3,132 | 26,747 |
| Citi Trends, Inc.* | 1,298 | 22,066 |
| Conn’s, Inc.* | 1,935 | 152,459 |
| Destination Maternity Corp | 1,034 | 30,896 |
| Destination XL Group, Inc.* | 3,868 | 25,413 |
| Express, Inc.* | 7,361 | 137,430 |
| Finish Line, Inc. | 4,246 | 119,610 |
| Five Below, Inc.* | 2,828 | 122,170 |
| Francesca’s Holdings Corp.* | 3,796 | 69,884 |
| Genesco, Inc.* | 2,071 | 151,307 |
| Group 1 Automotive, Inc | 1,876 | 133,234 |
| Haverty Furniture Co.’s, Inc | 1,689 | 52,866 |
| hhgregg, Inc.* | 1,366 | 19,083 |
| Hibbett Sports, Inc.* | 2,241 | 150,618 |
| Jos A Bank Clothiers, Inc.* | 2,506 | 137,153 |
| Kirkland’s, Inc.* | 1,302 | 30,818 |
| Lithia Motors, Inc | 1,914 | 132,870 |
| Lumber Liquidators Holdings, Inc.* | 2,369 | 243,746 |
| MarineMax, Inc.* | 2,047 | 32,916 |
| Mattress Firm Holding Corp.* | 1,158 | 49,840 |
| Men’s Wearhouse, Inc | 4,181 | 213,565 |
| Monro Muffler, Inc. | 2,782 | 156,794 |
| New York & Co., Inc.* | 1,850 | 8,084 |
| Office Depot, Inc.* | 42,292 | 223,725 |
| Outerwall, Inc.* | 2,477 | 166,628 |
| Pacific Sunwear of California, Inc.* | 3,981 | 13,297 |
| Penske Automotive Group, Inc. | 3,643 | 171,804 |
| Pier 1 Imports, Inc | 8,174 | 188,656 |
| RadioShack Corp.* | 8,952 | 23,275 |
| Rent-A-Center, Inc | 4,627 | 154,264 |
| Restoration Hardware Holdings, Inc.* | 1,525 | 102,631 |
| Sears Hometown and Outlet Stores, Inc.* | 746 | 19,023 |
| Select Comfort Corp.* | 4,799 | 101,211 |
| Shoe Carnival, Inc | 1,423 | 41,281 |
| Sonic Automotive, Inc. | 3,358 | 82,204 |
| Stage Stores, Inc. | 2,907 | 64,594 |
| Stein Mart, Inc | 2,386 | 32,092 |
| Systemax, Inc.* | 1,000 | 11,250 |
| The Buckle, Inc | 2,409 | 126,617 |
| The Childrens Place Retail Stores, Inc.* | 1,993 | 113,541 |
| The Container Store Group, Inc.* | 1,266 | 59,008 |
| The Pep Boys-Manny, Moe & Jack* | 4,589 | 55,710 |
| Tile Shop Holdings, Inc.* | 1,592 | 28,767 |
| Tilly’s, Inc.* | 827 | 9,469 |
| Trans World Entertainment Corp.* | 913 | 4,035 |
| Vitamin Shoppe, Inc.* | 2,651 | 137,879 |
| West Marine, Inc.* | 1,507 | 21,445 |
| Wet Seal, Inc.* | 7,596 | 20,737 |
| Winmark Corp. | 223 | 20,654 |
44 www.calvert.com CALVERT VP RUSSELL 2000 SMALL CAP INDEX PORTFOLIO ANNUAL REPORT
| | |
| EQUITY SECURITIES - CONT’D | SHARES | VALUE |
| Specialty Retail - Cont’d | | |
| Zale Corp.* | 2,800 | $44,156 |
| Zumiez, Inc.* | 1,972 | 51,272 |
| | | 4,984,913 |
| |
| Textiles, Apparel & Luxury Goods - 1.3% | | |
| American Apparel, Inc.* | 4,998 | 6,148 |
| Columbia Sportswear Co. | 1,104 | 86,940 |
| Costa, Inc.* | 787 | 17,101 |
| CROCS, Inc.* | 7,599 | 120,976 |
| Culp, Inc | 785 | 16,053 |
| Fifth & Pacific Co.’s, Inc.* | 10,567 | 338,884 |
| G-III Apparel Group Ltd.* | 1,447 | 106,774 |
| Iconix Brand Group, Inc.* | 4,543 | 180,357 |
| Jones Group, Inc. | 6,907 | 103,329 |
| Movado Group, Inc. | 1,614 | 71,032 |
| Oxford Industries, Inc | 1,160 | 93,577 |
| Perry Ellis International, Inc.* | 933 | 14,732 |
| Quiksilver, Inc.* | 11,336 | 99,417 |
| RG Barry Corp. | 783 | 15,112 |
| Skechers U.S.A., Inc.* | 3,408 | 112,907 |
| Steven Madden Ltd.* | 5,304 | 194,073 |
| Tumi Holdings, Inc.* | 4,129 | 93,109 |
| Unifi, Inc.* | 1,199 | 32,661 |
| Vera Bradley, Inc.* | 1,814 | 43,609 |
| Vince Holding Corp.* | 1,013 | 31,069 |
| Wolverine World Wide, Inc. | 8,698 | 295,384 |
| | | 2,073,244 |
| |
| Thrifts & Mortgage Finance - 1.5% | | |
| Astoria Financial Corp. | 7,553 | 104,458 |
| Banc of California, Inc | 1,409 | 18,895 |
| Bank Mutual Corp | 4,721 | 33,094 |
| BankFinancial Corp. | 1,984 | 18,173 |
| BBX Capital Corp.* | 622 | 9,703 |
| Beneficial Mutual Bancorp, Inc.* | 2,733 | 29,844 |
| Berkshire Hills Bancorp, Inc. | 2,163 | 58,985 |
| BofI Holding, Inc.* | 1,051 | 82,430 |
| Brookline Bancorp, Inc. | 6,306 | 60,348 |
| Capitol Federal Financial, Inc. | 12,845 | 155,553 |
| Charter Financial Corp. | 1,962 | 21,131 |
| Clifton Savings Bancorp, Inc | 836 | 10,701 |
| Dime Community Bancshares, Inc. | 2,830 | 47,884 |
| Doral Financial Corp.* | 523 | 8,190 |
| ESB Financial Corp | 1,045 | 14,839 |
| ESSA Bancorp, Inc | 931 | 10,762 |
| Essent Group Ltd.* | 1,997 | 48,048 |
| EverBank Financial Corp. | 6,941 | 127,298 |
| Federal Agricultural Mortgage Corp., Class C | 895 | 30,654 |
| First Defiance Financial Corp. | 799 | 20,750 |
| First Federal Bancshares of Arkansas, Inc.* | 313 | 2,723 |
| First Financial Northwest, Inc. | 1,441 | 14,943 |
| Flagstar Bancorp, Inc.* | 1,712 | 33,589 |
| Fox Chase Bancorp, Inc. | 1,196 | 20,787 |
| Franklin Financial Corp.* | 1,141 | 22,569 |
| Hingham Institution for Savings | 115 | 9,026 |
| Home Bancorp, Inc.* | 615 | 11,593 |
www.calvert.com CALVERT VP RUSSELL 2000 SMALL CAP INDEX PORTFOLIO ANNUAL REPORT 45
| | |
| EQUITY SECURITIES - CONT’D | SHARES | VALUE |
| Thrifts & Mortgage Finance - Cont’d | | |
| Home Loan Servicing Solutions, Ltd. | 6,153 | $141,334 |
| HomeStreet, Inc | 1,117 | 22,340 |
| Kearny Financial Corp.* | 1,413 | 16,433 |
| Meridian Interstate Bancorp, Inc.* | 838 | 18,922 |
| Meta Financial Group, Inc. | 474 | 19,116 |
| MGIC Investment Corp.* | 28,561 | 241,055 |
| NASB Financial, Inc. | 378 | 11,416 |
| Northfield Bancorp, Inc. | 5,019 | 66,251 |
| Northwest Bancshares, Inc. | 8,083 | 119,467 |
| OceanFirst Financial Corp. | 1,187 | 20,333 |
| Oritani Financial Corp | 3,882 | 62,306 |
| PennyMac Financial Services, Inc.* | 1,102 | 19,340 |
| Provident Financial Holdings, Inc | 876 | 13,140 |
| Provident Financial Services, Inc. | 5,242 | 101,276 |
| Radian Group, Inc. | 14,907 | 210,487 |
| Rockville Financial, Inc. | 2,425 | 34,459 |
| Stonegate Mortgage Corp.* | 719 | 11,885 |
| Territorial Bancorp, Inc | 940 | 21,808 |
| Tree.com, Inc.* | 543 | 17,832 |
| Trustco Bank Corp. NY | 7,825 | 56,185 |
| United Community Financial Corp.* | 3,416 | 12,195 |
| United Financial Bancorp, Inc. | 1,552 | 29,317 |
| Walker & Dunlop, Inc.* | 1,420 | 22,961 |
| Waterstone Financial, Inc.* | 658 | 7,304 |
| Westfield Financial, Inc | 1,965 | 14,659 |
| WSFS Financial Corp. | 686 | 53,186 |
| | | 2,391,977 |
| |
| Tobacco - 0.1% | | |
| Alliance One International, Inc.* | 7,793 | 23,769 |
| Universal Corp. | 2,013 | 109,910 |
| Vector Group Ltd | 5,252 | 85,975 |
| | | 219,654 |
| |
| Trading Companies & Distributors - 0.9% | | |
| Aceto Corp | 2,638 | 65,976 |
| Aircastle Ltd | 5,904 | 113,121 |
| Applied Industrial Technologies, Inc. | 3,712 | 182,222 |
| Beacon Roofing Supply, Inc.* | 4,219 | 169,941 |
| BlueLinx Holdings, Inc.* | 2,953 | 5,758 |
| CAI International, Inc.* | 1,481 | 34,907 |
| DXP Enterprises, Inc.* | 857 | 98,727 |
| H&E Equipment Services, Inc.* | 2,568 | 76,090 |
| Houston Wire & Cable Co. | 1,646 | 22,024 |
| Kaman Corp. | 2,263 | 89,909 |
| Rush Enterprises, Inc.* | 2,992 | 88,713 |
| Stock Building Supply Holdings, Inc.* | 692 | 12,608 |
| TAL International Group, Inc.* | 2,919 | 167,405 |
| Textainer Group Holdings Ltd | 1,837 | 73,884 |
| Titan Machinery, Inc.* | 1,521 | 27,104 |
| Watsco, Inc. | 2,215 | 212,773 |
| | | 1,441,162 |
| |
| Transportation Infrastructure - 0.1% | | |
| Wesco Aircraft Holdings, Inc.* | 3,551 | 77,838 |
46 www.calvert.com CALVERT VP RUSSELL 2000 SMALL CAP INDEX PORTFOLIO ANNUAL REPORT
| | |
| EQUITY SECURITIES - CONT’D | SHARES | VALUE |
| Water Utilities - 0.2% | | |
| American States Water Co | 3,246 | $93,258 |
| Artesian Resources Corp. | 490 | 11,246 |
| California Water Service Group | 4,144 | 95,602 |
| Connecticut Water Service, Inc. | 883 | 31,355 |
| Consolidated Water Co., Inc | 1,510 | 21,291 |
| Middlesex Water Co | 1,560 | 32,666 |
| Pure Cycle Corp.* | 1,485 | 9,400 |
| SJW Corp. | 1,344 | 40,038 |
| York Water Co. | 1,309 | 27,397 |
| | | 362,253 |
| |
| Wireless Telecommunication Services - 0.2% | | |
| Boingo Wireless, Inc.* | 1,422 | 9,115 |
| Leap Wireless International, Inc.* | 4,674 | 81,328 |
| NII Holdings, Inc.* | 14,834 | 40,793 |
| NTELOS Holdings Corp | 1,286 | 26,016 |
| RingCentral, Inc.* | 760 | 13,961 |
| Shenandoah Telecommunications Co | 2,077 | 53,317 |
| USA Mobility, Inc | 1,934 | 27,617 |
| | | 252,147 |
| |
| |
| Total Equity Securities (Cost $101,155,127) | | 144,847,279 |
| |
| |
| |
| CLOSED-END FUNDS - 0.0% | | |
| Firsthand Technology Value Fund, Inc.* | 770 | 17,841 |
| |
| Total Closed-End Funds (Cost $14,653) | | 17,841 |
| |
| EXCHANGE TRADED PRODUCTS - 3.8% | | |
| iShares Russell 2000 ETF | 52,000 | 5,996,120 |
| |
| Total Exchange Traded Products (Cost $4,357,308) | | 5,996,120 |
| |
| | PRINCIPAL | |
| U.S. TREASURY OBLIGATIONS - 0.3% | AMOUNT | |
| United States Treasury Bills, 0.068%, 6/26/14^ | $400,000 | $399,868 |
| |
| Total U.S. Treasury Obligations (Cost $399,868) | | 399,868 |
| |
| TIME DEPOSIT - 3.1% | | |
| State Street Bank Time Deposit, 0.083%, 1/2/14 | 4,891,438 | 4,891,438 |
| |
| Total Time Deposit (Cost $4,891,438) | | 4,891,438 |
| |
| |
| TOTAL INVESTMENTS (Cost $110,818,394) - 100.0% | | 156,152,546 |
| Other assets and liabilities, net - 0.0% | | (34,819) |
| NET ASSETS - 100% | | $156,117,727 |
www.calvert.com CALVERT VP RUSSELL 2000 SMALL CAP INDEX PORTFOLIO ANNUAL REPORT 47
| |
| NET ASSETS CONSIST OF: | |
| Paid-in capital applicable to the following shares of common stock outstanding; | |
| $0.10 par value, 20,000,000 shares authorized: | |
| Class I: 1,713,769 shares outstanding | $96,000,300 |
| Class F: 181,276 shares outstanding | 10,530,300 |
| Undistributed net investment income | 252,548 |
| Accumulated net realized gain (loss) on investments and foreign currency transactions | 3,794,014 |
| Net unrealized appreciation (depreciation) on investments | |
| and assets and liabilities denominated in foreign currencies | 45,540,565 |
| |
| |
| NET ASSETS | $156,117,727 |
| |
| |
| NET ASSET VALUE PER SHARE | |
| Class I (based on net assets of $141,110,729) | $82.34 |
| Class F (based on net assets of $15,006,998) | $82.79 |
| | | | UNDERLYING | UNREALIZED |
| | NUMBER OF | EXPIRATION | FACE AMOUNT | APPRECIATION |
| FUTURES | CONTRACTS | DATE | AT VALUE | (DEPRECIATION) |
| Purchased: | | | | |
| E-Mini Russell 2000 Index^ | 48 | 3/14 | $5,574,720 | $206,412 |
(b) This security was valued by the Board of Directors. See Note A.
^ Futures collateralized by $400,000 par value of U.S. Treasury Bills.
* Non-income producing security.
Abbreviations:
ETF: Exchange Traded Fund
LLC: Limited Liability Corporation
plc: Public Limited Company
REIT: Real Estate Investment Trus
See notes to financial statements.
48 www.calvert.com CALVERT VP RUSSELL 2000 SMALL CAP INDEX PORTFOLIO ANNUAL REPORT
| |
| STATEMENT OF OPERATIONS |
| YEAR ENDED DECEMBER 31, 2013 |
| |
| |
| NET INVESTMENT INCOME | |
| Investment Income: | |
| Dividend income (net of foreign taxes withheld of $1,211) | $1,943,128 |
| Interest income | 4,655 |
| Total investment income | 1,947,783 |
| |
| |
| Expenses: | |
| Investment advisory fee | 475,366 |
| Transfer agency fees and expenses | 18,820 |
| Accounting fees | 20,308 |
| Distribution Plan expenses: | |
| Class F | 24,442 |
| Directors’ fees and expenses | 21,694 |
| Administrative fees | 135,818 |
| Custodian fees | 91,357 |
| Reports to shareholders | 33,535 |
| Professional fees | 37,902 |
| Miscellaneous | 99,875 |
| Total expenses | 959,117 |
| Reimbursement from Advisor: | |
| Class F | (279) |
| Net expenses | 958,838 |
| |
| |
| NET INVESTMENT INCOME | 988,945 |
| |
| |
| REALIZED AND UNREALIZED GAIN (LOSS) | |
| Net realized gain (loss) on: | |
| Investments | 6,405,225 |
| Foreign currency transactions | (44) |
| Futures | 1,435,884 |
| | 7,841,065 |
| |
| |
| Change in unrealized appreciation (depreciation) on: | |
| Investments | 34,315,539 |
| Assets and liabilities denominated in foreign currencies | 1 |
| Futures | 134,480 |
| | 34,450,020 |
| |
| NET REALIZED AND UNREALIZED GAIN (LOSS) | 42,291,085 |
| |
| INCREASE (DECREASE) IN NET ASSETS | |
| RESULTING FROM OPERATIONS | $43,280,030 |
See notes to financial statements.
www.calvert.com CALVERT VP RUSSELL 2000 SMALL CAP INDEX PORTFOLIO ANNUAL REPORT 49
| | |
STATEMENTS OF CHANGES IN NET ASSETS |
| |
| | YEAR ENDED | YEAR ENDED |
| | DECEMBER 31, | DECEMBER 31, |
| INCREASE (DECREASE) IN NET ASSETS | 2013 | 2012 |
| Operations: | | |
| Net investment income | $988,945 | $1,509,535 |
| Net realized gain (loss) | 7,841,065 | 3,123,080 |
| Change in unrealized appreciation (depreciation) | 34,450,020 | 10,743,500 |
| |
| |
| INCREASE (DECREASE) IN NET ASSETS | | |
| RESULTING FROM OPERATIONS | 43,280,030 | 15,376,115 |
| |
| Distributions to shareholders from: | | |
| Net investment income: | | |
| Class I shares | (949,334) | (1,018,220) |
| Class F shares | (62,973) | (67,214) |
| Net realized gain: | | |
| Class I shares | (4,918,577) | (5,221,430) |
| Class F shares | (514,399) | (453,031) |
| Total distributions | (6,445,283) | (6,759,895) |
| |
| Capital share transactions: | | |
| Shares sold: | | |
| Class I shares | 19,185,666 | 16,410,178 |
| Class F shares | 6,536,579 | 3,742,501 |
| Reinvestment of distributions: | | |
| Class I shares | 5,867,912 | 6,239,650 |
| Class F shares | 577,371 | 520,244 |
| Shares redeemed: | | |
| Class I shares | (24,331,514) | (14,211,941) |
| Class F shares | (4,702,410) | (2,130,325) |
| Total capital share transactions | 3,133,604 | 10,570,307 |
| |
| |
| TOTAL INCREASE (DECREASE) IN NET ASSETS | 39,968,351 | 19,186,527 |
| |
| NET ASSETS | | |
| Beginning of year | 116,149,376 | 96,962,849 |
| End of year (including undistributed net investment income | | |
| of $252,548 and $432,795, respectively) | $156,117,727 | $116,149,376 |
| |
| |
| CAPITAL SHARE ACTIVITY | | |
| Shares sold: | | |
| Class I shares | 255,241 | 264,916 |
| Class F shares | 88,956 | 59,388 |
| Reinvestment of distributions: | | |
| Class I shares | 73,708 | 102,122 |
| Class F shares | 7,213 | 8,474 |
| Shares redeemed: | | |
| Class I shares | (327,499) | (227,142) |
| Class F shares | (63,623) | (34,194) |
| Total capital share activity | 33,996 | 173,564 |
See notes to financial statements.
50 www.calvert.com CALVERT VP RUSSELL 2000 SMALL CAP INDEX PORTFOLIO ANNUAL REPORT
NOTES TO FINANCIAL STATEMENTS
NOTE A –- SIGNIFICANT ACCOUNTING POLICIES
General: Calvert VP Russell 2000 Small Cap Index Portfolio (the “Portfolio”), a series of Calvert Variable Products, Inc. (the “Fund”), is registered under the Investment Company Act of 1940 as a diversified, open-end management investment company. The Fund is comprised of twelve separate portfolios. The operations of each series of the Fund are accounted for separately. Shares of the Portfolio are sold without sales charge to affiliated and unaffiliated insurance companies for allocation to certain of their variable separate accounts. The Portfolio offers Class F and Class I shares. Class F shares are subject to Distribution Plan Expenses, while Class I shares are not. Each class has different: (a) dividend rates, due to differences in Distribution Plan expenses and other class-specific expenses, (b) exchange privileges; and (c) class-specific voting rights.
Security Valuation: Net asset value per share is determined every business day as of the close of the regular session of the New York Stock Exchange (generally 4:00 p.m. Eastern time). The Portfolio uses independent pricing services approved by the Board of Directors (“the Board”) to value its investments wherever possible. Investments for which market quotations are not available or deemed not reliable are fair valued in good faith under the direction of the Board.
The Board has adopted Valuation Procedures (the “Procedures”) to determine the fair value of securities and other financial instruments for which market prices are not readily available or which may not be reliably priced. The Board has delegated the day-to-day responsibility for determining the fair value of assets of the Portfolio to Calvert Investment Management, Inc. (the “Advisor” or “Calvert”) and has provided these Procedures to govern Calvert in its valuation duties.
Calvert has chartered an internal Valuation Committee to oversee the implementation of these Procedures and to assist it in carrying out the valuation responsibilities that the Board has delegated.
The Valuation Committee meets on a regular basis to review illiquid securities and other investments which may not have readily available market prices. The Valuation Committee’s fair valuation determinations are subject to review, approval and ratification by the Board at its next regularly scheduled meeting covering the calendar quarter in which the fair valuation was determined.
The Valuation Committee utilizes various methods to measure the fair value of the Portfolio’s investments. Generally Accepted Accounting Principles (GAAP) establishes a disclosure hierarchy that categorizes the inputs to valuation techniques used to value assets and liabilities at measurement date. These inputs are summarized in the three broad levels listed below:
Level 1 – quoted prices in active markets for identical securities
Level 2 – other significant observable inputs (including quoted prices for similar securities, interest rates, prepayment speeds, credit risk, etc.)
Level 3 – significant unobservable inputs (including the Portfolio’s own assumptions in determining the fair value of investments) The inputs or methodologies used for valuing securities are not necessarily an indication of the risk associated with investing in those securities.
Changes in valuation techniques may result in transfers in or out of an investment’s assigned level within the hierarchy during the period. There were no such transfers during the period. Valuation techniques used to value the Portfolio’s investments by major category are as follows: Equity securities, including restricted securities, for which market quotations are readily available, are valued at the last reported sale price or official closing price as reported by an independent pricing service on the primary market or exchange on which they are traded and are categorized as Level 1 in the hierarchy.
www.calvert.com CALVERT VP RUSSELL 2000 SMALL CAP INDEX PORTFOLIO ANNUAL REPORT 51
In the event there were no sales during the day or closing prices are not available, securities are valued at the last quoted bid price or may be valued using the last available price and are categorized as Level 2 in the hierarchy. Foreign securities are valued based on quotations from the principal market in which such securities are normally traded. If events occur after the close of the principal market in which foreign securities are traded, and before the close of business of the Portfolio, that are expected to materially affect the value of those securities, then they are valued at their fair value taking these events into account. For restricted securities and private placements where observable inputs are limited, assumptions about market activity and risk are used and such securities are categorized as Level 3 in the hierarchy.
Exchange traded products and closed-end funds are valued at the official closing price as reported by an independent pricing service on the primary market or exchange on which they are traded and are categorized as Level 1 in the hierarchy.
Debt securities, including restricted securities, are valued based on evaluated prices received from independent pricing services or from dealers who make markets in such securities. For U.S. government obligations, pricing services utilize matrix pricing which considers yield or price of bonds of comparable quality, coupon, maturity and type as well as dealer supplied prices and such securities are generally categorized as Level 2 in the hierarchy. Short-term securities of sufficient credit quality with remaining maturities of sixty days or less for which quotations are not readily available are valued at amortized cost, which approximates fair value, and are categorized as Level 2 in the hierarchy.
When independent prices are unavailable or unreliable, debt securities may be valued utilizing pricing matrices which consider similar factors that would be used by independent pricing services. These are generally categorized as Level 2 in the hierarchy but may be Level 3 depending on the circumstances.
If a market value cannot be determined for a security using the methodologies described above, or if, in the good faith opinion of the Advisor, the market value does not constitute a readily available market quotation, or if a significant event has occurred that would materially affect the value of the security, the security will be fair valued as determined in good faith by the Valuation Committee.
The Valuation Committee considers a number of factors, including significant unobservable valuation inputs when arriving at fair value. It considers all significant facts that are reasonably available and relevant to the determination of fair value.
The Valuation Committee primarily employs a market-based approach which may use related or comparable assets or liabilities, recent transactions, market multiples, book values, and other relevant information for the investment to determine the fair value of the investment. When more appropriate, the fund may employ an income-based or cost approach. An income-based valuation approach discounts anticipated future cash flows of the investment to calculate a present amount (discounted). The measurement is based on the value indicated by current market expectations about those future amounts. Discounts may also be applied due to the nature or duration of any restrictions on the disposition of the investments. A cost based approach is based on the amount that currently would be required to replace the service capacity of an asset (current replacement cost). From the seller’s perspective, the price that would be received for the asset is determined based on the cost to a buyer to acquire or construct a substitute asset of comparable utility, adjusted for obsolescence.
The values assigned to fair value investments are based on available information and do not necessarily represent amounts that might ultimately be realized. Further, due to the inherent uncertainty of valuations of such investments, the fair values may differ significantly from the values that would have been used had an active market existed, and the differences could be material. The Valuation Committee employs various methods for calibrating these valuation approaches including a regular review of key inputs and assumptions, transactional back-testing or disposition analysis and reviews of any related market activity.
52 www.calvert.com CALVERT VP RUSSELL 2000 SMALL CAP INDEX PORTFOLIO ANNUAL REPORT
At December 31, 2013, securities valued at $4,373, or 0% of net assets, were fair valued in good faith under the direction of the Board.
The following is a summary of the inputs used to value the Portfolio’s net assets as of December 31, 2013:
| | | VALUATION INPUTS | |
| INVESTMENTS IN SECURITIES | LEVEL 1 | LEVEL 2 | LEVEL 3 | TOTAL |
| Equity securities** | $144,842,906 | — | $4,373 | $144,847,279 |
| Exchange traded products | 5,996,120 | — | — | 5,996,120 |
| Closed-end funds | 17,841 | — | — | 17,841 |
| U.S. government obligations | — | $399,868 | — | 399,868 |
| Other debt obligations | — | 4,891,438 | — | 4,891,438 |
| TOTAL | $150,856,867 | $5,291,306 | $4,373* | $156,152,546 |
| Other financial instruments*** | $206,412 | — | — | $206,412 |
* Level 3 securities represent 0.0% of net assets.
** For further breakdown of equity securities by industry type, please refer to the Statement of Net Assets.
*** Other financial instruments are derivative instruments not reflected in the Total Investments in the Statement of Net Assets, such as futures, which are valued at the unrealized appreciation/(depreciation) on the instrument.
Futures Contracts: The Portfolio may purchase and sell futures contracts, when, in the judgment of the Advisor, such a position acts as a hedge, or to provide equity market exposure to the Portfolio’s uncommitted cash balances. The Portfolio may not enter into futures contracts for the purpose of speculation or leverage. These futures contracts may include, but are not limited to, market index futures contracts. The Portfolio is subject to market risk in the normal course of pursuing its investment objectives and may use futures contracts to hedge against changes in the value of securities. The Portfolio may enter into futures contracts agreeing to buy or sell a financial instrument for a set price at a future date. Initial margin deposits of either cash or securities as required by the broker are made upon entering into the contract. While the contract is open, daily variation margin payments are made to or received from the broker reflecting the daily change in market value of the contract and are recorded for financial reporting purposes as unrealized gains or losses by the Portfolio. When a futures contract is closed, a realized gain or loss is recorded equal to the difference between the opening and closing value of the contract. The risks associated with entering into futures contracts may include the possible illiquidity of the secondary market which would limit the Portfolio’s ability to close out a futures contract prior to the settlement date, an imperfect correlation between the value of the contracts and the underlying financial instruments, or that the counterparty will fail to perform its obligations under the contracts’ terms. Futures contracts are designed by boards of trade which are designated “contracts markets” by the Commodities Futures Trading Commission. Futures contracts trade on the contracts markets in a manner that is similar to the way a stock trades on a stock exchange and the boards of trade, through their clearing corporations, guarantee the futures contracts against default. As a result, there is minimal counterparty credit risk to the Portfolio. During the year, futures contracts were used to hedge the lack of equity exposure inherent in a cash position. The Portfolio’s futures contracts at year end are presented in the Statement of Net Assets.
During the year, the Portfolio invested in E-Mini Russell 2000 Index futures. The volume of outstanding contracts has varied throughout the period with a weighted average of 5 contracts and $227,870 weighted average notional value.
Security Transactions and Investment Income: Security transactions are accounted for on trade date.
Realized gains and losses are recorded on an identified cost basis and may include proceeds from litigation.
www.calvert.com CALVERT VP RUSSELL 2000 SMALL CAP INDEX PORTFOLIO ANNUAL REPORT 53
Dividend income is recorded on the ex-dividend date or, in the case of certain foreign securities, as soon as the Portfolio is informed of the ex-dividend date. Withholding taxes on foreign dividends have been provided for in accordance with the Portfolio’s understanding of the applicable country’s tax rules and rates. Distributions received on securities that represent a return of capital or capital gain are recorded as a reduction of cost of investments and/or as a realized gain. Interest income, which includes amortization of premium and accretion of discount on debt securities, is accrued as earned. Investment income and realized and unrealized gains and losses are allocated to separate classes of shares based upon the relative net assets of each class. Expenses arising in connection with a specific class are charged directly to that class. Expenses common to the classes are allocated to each class in proportion to their relative net assets.
Foreign Currency Transactions: The Portfolio’s accounting records are maintained in U.S. dollars. For valuation of assets and liabilities on each date of net asset value determination, foreign denominations are converted into U.S. dollars using the current exchange rate. Security transactions, income and expenses are translated at the prevailing rate of exchange on the date of the event. The effect of changes in foreign exchange rates on securities and foreign currencies is included with the net realized and unrealized gain or loss on investments and foreign currencies.
Distributions to Shareholders: Distributions to shareholders are recorded by the Portfolio on ex-dividend date. Dividends from net investment income and distributions from net realized capital gains, if any, are paid at least annually. Distributions are determined in accordance with income tax regulations which may differ from generally accepted accounting principles; accordingly, periodic reclassifications are made within the Portfolio’s capital accounts to reflect income and gains available for distribution under income tax regulations.
Estimates: The preparation of financial statements in conformity with accounting principles generally accepted in the United States requires management to make estimates and assumptions that affect the reported amounts of assets and liabilities and disclosure of contingent assets and liabilities at the date of the financial statements and the reported amounts of income and expenses during the reporting period. Actual results could differ from those estimates.
Federal Income Taxes: No provision for federal income or excise tax is required since the Portfolio intends to continue to qualify as a regulated investment company under the Internal Revenue Code and to distribute substantially all of its taxable earnings.
Management has analyzed the Portfolio’s tax positions taken for all open federal income tax years and has concluded that no provision for federal income tax is required in the Portfolio’s financial statements. A Portfolio’s federal tax return is subject to examination by the Internal Revenue Service for a period of three years.
NOTE B — RELATED PARTY TRANSACTIONS
Calvert Investment Management, Inc. (the “Advisor”) is wholly-owned by Calvert Investments, Inc., which is indirectly wholly-owned by Ameritas Mutual Holding Company. The Advisor provides investment advisory services and pays the salaries and fees of officers and Directors of the Fund who are employees of the Advisor or its affiliates. For its services, the Advisor receives an annual fee, payable monthly, of .35% of the Portfolio’s average daily net assets. Under the terms of the agreement, $45,029 was payable at year end. In addition, $38,376 was payable at year end for operating expenses paid by the Advisor during December 2013.
The Advisor has contractually agreed to limit net annual portfolio operating expenses through April 30, 2014. The contractual expense caps are .95% for Class F and .74% for Class I, respectively. For the purpose of this expense limit, operating expenses do not include interest expense, brokerage commissions, taxes and extraordinary expenses. This expense limitation does not limit acquired fund fees and expenses, if any.
The Advisor further voluntarily reimbursed the Portfolio for expenses of $279 for the year ended December 31, 2013.
54 www.calvert.com CALVERT VP RUSSELL 2000 SMALL CAP INDEX PORTFOLIO ANNUAL REPORT
Calvert Investment Administrative Services, Inc., an affiliate of the Advisor, provides administrative services to the Portfolio for an annual fee, payable monthly, of .10% of the average daily net assets of the Portfolio. Under the terms of the agreement, $12,866 was payable at year end.
Calvert Investment Distributors, Inc. (“CID”), an affiliate of the Advisor, is the distributor and principal underwriter for the Portfolio. Pursuant to Rule 12b-1 under the Investment Company Act of 1940, the Portfolio has adopted a Distribution plan that permits the Portfolio to pay certain expenses associated with the distribution and servicing of its Class F shares. The expenses paid may not exceed .20% annually of the average daily net assets of Class F. Under the terms of the agreement, $2,461 was payable at year end.
Calvert Investment Services, Inc. (“CIS”), an affiliate of the Advisor, acts as shareholder servicing agent for the Portfolio. For its services, CIS received a fee of $10,571 for the year ended December 31, 2013. Under the terms of the agreement, $864 was payable at year end. Boston Financial Data Services, Inc. is the transfer and dividend disbursing agent.
Each Director of the Fund who is not an employee of the Advisor or its affiliates receives a fee of $1,500 for each Board and Committee meeting attended plus an annual fee of $40,000. Committee chairs receive an additional $5,000 annual retainer. Directors’ fees are allocated to each of the portfolios served.
NOTE C — INVESTMENT ACTIVITY AND TAX INFORMATION
During the year, the cost of purchases and proceeds from sales of investments, other than short-term securities, were $18,638,251 and $14,617,948, respectively.
The tax character of dividends and distributions paid during the years ended December 31, 2013 and December 31, 2012 was as follows:
| Distributions paid from: | 2013 | 2012 |
| Ordinary income | $1,440,387 | $1,085,434 |
| Long-term capital gain | 5,004,896 | 5,674,461 |
| Total | $6,445,283 | $6,759,895 |
As of December 31, 2013, the tax basis components of distributable earnings/(accumulated losses) and the federal tax cost were as follows:
| Unrealized appreciation | $53,914,338 |
| Unrealized (depreciation) | (8,576,468) |
| Net unrealized appreciation/(depreciation) | $45,337,870 |
| Undistributed ordinary income | $826,696 |
| Undistributed long-term capital gains | $3,422,560 |
| Federal income tax cost of investments | $110,814,676 |
The differences between the components of distributable earnings on a tax basis and the amounts reflected in the statement of net assets are primarily due to temporary book-tax differences that will reverse in a subsequent period. These differences are due to wash sales, real estate investment trusts, passive foreign investment companies, undistributed capital gains, and Section 1256 contracts.
Reclassifications, as shown in the table below, have been made to the Portfolio’s components of net assets to reflect income and gains available for distribution (or available capital loss carryovers, as applicable) under income tax law and regulations. These reclassifications are due to permanent book-tax differences and have no impact on net assets. The primary permanent differences causing such reclassifications for the Portfolio are due to real estate investment trusts, partnerships, passive foreign investment companies, investment funds, and foreign currency transactions.
www.calvert.com CALVERT VP RUSSELL 2000 SMALL CAP INDEX PORTFOLIO ANNUAL REPORT 55
| Undistributed net investment income | ($156,885) |
| Accumulated net realized gain (loss) | 156,885 |
NOTE D — LINE OF CREDIT
A financing agreement is in place with the Calvert Funds and State Street Corporation (“SSC”). Under the agreement, SSC provides an unsecured line of credit facility, in the aggregate amount of $50 million ($25 million committed and $25 million uncommitted), accessible by the Funds for temporary or emergency purposes only. Borrowings under the committed facility bear interest at the higher of the London Interbank Offered Rate (LIBOR) or the overnight Federal Funds Rate plus 1.25% per annum. A commitment fee of .11% per annum is incurred on the unused portion of the committed facility, which is allocated to all participating funds. The Portfolio had no loans outstanding pursuant to this line of credit at December 31, 2013.
For the year ended December 31, 2013, borrowing information by the Portfolio under the agreement was as follows:
| | WEIGHTED | | MONTH OF |
| AVERAGE | AVERAGE | MAXIMUM | MAXIMUM |
| DAILY | INTEREST | AMOUNT | AMOUNT |
| BALANCE | RATE | BORROWED | BORROWED |
| $83 | 1.44% | $30,307 | January 2013 |
NOTE E — SUBSEQUENT EVENTS
In preparing the financial statements as of December 31, 2013, no subsequent events or transactions occurred that would have required recognition or disclosure in these financial statements.

56 www.calvert.com CALVERT VP RUSSELL 2000 SMALL CAP INDEX PORTFOLIO ANNUAL REPORT
| | | |
| FINANCIAL HIGHLIGHTS |
| |
| | | YEARS ENDED | |
| | DECEMBER
31, | DECEMBER
31, | DECEMBER
31, |
| CLASS I SHARES | 2013 | 2012 (z) | 2011 |
| Net asset value, beginning | $62.39 | $57.44 | $62.98 |
| Income from investment operations: | | | |
| Net investment income | .56 | .87 | .44 |
| Net realized and unrealized gain (loss) | 22.96 | 7.95 | (3.50) |
| Total from investment operations | 23.52 | 8.82 | (3.06) |
| Distributions from: | | | |
| Net investment income | (.58) | (.63) | (.33) |
| Net realized gain | (2.99) | (3.24) | (2.15) |
| Total distributions | (3.57) | (3.87) | (2.48) |
| Total increase (decrease) in net asset value | 19.95 | 4.95 | (5.54) |
| Net asset value, ending | $82.34 | $62.39 | $57.44 |
| |
| Total return* | 37.89% | 15.50% | (4.89%) |
| Ratios to average net assets: A | | | |
| Net investment income | .75% | 1.40% | .60% |
| Total expenses | .69% | .76% | .79% |
| Expenses before offsets | .69% | .73% | .71% |
| Net expenses | .69% | .73% | .71% |
| Portfolio turnover | 11% | 13% | 17% |
| Net assets, ending (in thousands) | $141,111 | $106,827 | $90,325 |
| |
| | | YEARS ENDED |
| | | DECEMBER
31, | DECEMBER
31, |
| CLASS I SHARES | | 2010 (z) | 2009 |
| Net asset value, beginning | | $50.19 | $40.42 |
| Income from investment operations: | | | |
| Net investment income | | .43 | .40 |
| Net realized and unrealized gain (loss) | | 12.66 | 10.19 |
| Total from investment operations | | 13.09 | 10.59 |
| Distributions from: | | | |
| Net investment income | | (.30) | (.27) |
| Net realized gain | | — | (.55) |
| Total distributions | | (.30) | (.82) |
| Total increase (decrease) in net asset value | | 12.79 | 9.77 |
| Net asset value, ending | | $62.98 | $50.19 |
| |
| Total return* | | 26.08% | 26.17% |
| Ratios to average net assets: A | | | |
| Net investment income | | .79% | .83% |
| Total expenses | | .82% | .86% |
| Expenses before offsets | | .70% | .70% |
| Net expenses | | .70% | .70% |
| Portfolio turnover | | 42% | 24% |
| Net assets, ending (in thousands) | | $119,223 | $63,320 |
See notes to financial highlights.
www.calvert.com CALVERT VP RUSSELL 2000 SMALL CAP INDEX PORTFOLIO ANNUAL REPORT 57
| | | |
| FINANCIAL HIGHLIGHTS |
| |
| | | YEARS ENDED | |
| | DECEMBER
31, | DECEMBER
31, | DECEMBER
31, |
| CLASS F SHARES | 2013 | 2012 (z) | 2011 |
| Net asset value, beginning | $62.68 | $57.69 | $63.21 |
| Income from investment operations: | | | |
| Net investment income | .36 | .77 | .25 |
| Net realized and unrealized gain (loss) | 23.11 | 7.94 | (3.44) |
| Total from investment operations | 23.47 | 8.71 | (3.19) |
| Distributions from: | | | |
| Net investment income | (.37) | (.48) | (.18) |
| Net realized gain | (2.99) | (3.24) | (2.15) |
| Total distributions | (3.36) | (3.72) | (2.33) |
| Total increase (decrease) in net asset value | 20.11 | 4.99 | (5.52) |
| Net asset value, ending | $82.79 | $62.68 | $57.69 |
| |
| Total return* | 37.62% | 15.23% | (5.07%) |
| Ratios to average net assets:A | | | |
| Net investment income | .55% | 1.23% | .42% |
| Total expenses | .90% | .99% | 1.03% |
| Expenses before offsets | .90% | .94% | .92% |
| Net expenses | .90% | .94% | .92% |
| Portfolio turnover | 11% | 13% | 17% |
| Net assets, ending (in thousands) | $15,007 | $9,323 | $6,638 |
| |
| | | YEARS ENDED |
| | | DECEMBER
31, | DECEMBER
31, |
| CLASS F SHARES | | 2010 (z) | 2009 |
| Net asset value, beginning | | $50.38 | $40.55 |
| Income from investment operations: | | | |
| Net investment income | | .32 | .19 |
| Net realized and unrealized gain (loss) | | 12.70 | 10.32 |
| Total from investment operations | | 13.02 | 10.51 |
| Distributions from: | | | |
| Net investment income | | (.19) | (.13) |
| Net realized gain | | — | (.55) |
| Total distributions | | (.19) | (.68) |
| Total increase (decrease) in net asset value | | 12.83 | 9.38 |
| Net asset value, ending | | $63.21 | $50.38 |
| |
| Total return* | | 25.83% | 25.91% |
| Ratios to average net assets:A | | | |
| Net investment income | | .58% | .63% |
| Total expenses | | 1.06% | 1.25% |
| Expenses before offsets | | .91% | .91% |
| Net expenses | | .91% | .91% |
| Portfolio turnover | | 42% | 24% |
| Net assets, ending (in thousands) | | $6,085 | $3,299 |
See notes to financial highlights.
58 www.calvert.com CALVERT VP RUSSELL 2000 SMALL CAP INDEX PORTFOLIO ANNUAL REPORT
A Total expenses do not reflect amounts reimbursed and/or waived by the Advisor or reductions from expense offset arrangements. Expenses
before offsets reflect expenses after reimbursement and/or waiver by the Advisor but prior to reductions from expense offset arrangements.
Net expenses are net of all reductions and represent the net expenses paid by the portfolio.
(z) Per share figures are calculated using the Average Shares Method.
* Total return is not annualized for periods of less than one year and does not reflect charges and expenses of the variable annuity or variable
universal life contract.
See notes to financial statements.
www.calvert.com CALVERT VP RUSSELL 2000 SMALL CAP INDEX PORTFOLIO ANNUAL REPORT 59
EXPLANATION OF FINANCIAL TABLES
SCHEDULE OF INVESTMENTS
The Schedule of Investments is a snapshot of all securities held in the fund at their market value, on the last day of the reporting period. Securities are listed by asset type (e.g., common stock, corporate bonds, U.S. government obligations) and may be further broken down into sub-groups and by industry classification.
STATEMENT OF ASSETS AND LIABILITIES
The Statement of Assets and Liabilities is often referred to as the fund’s balance sheet. It lists the value of what the fund owns, is due and owes on the last day of the reporting period. The fund’s assets include the market value of securities owned, cash, receivables for securities sold and shareholder subscriptions, and receivables for dividends and interest payments that have been earned, but not yet received. The fund’s liabilities typically include payables for securities purchased and shareholder redemptions, and expenses owed but not yet paid. The statement also reports the fund’s net asset value (NAV) per share on the last day of the reporting period. The NAV is calculated by dividing the fund’s net assets (assets minus liabilities) by the number of shares outstanding. This statement is accompanied by a Schedule of Investments. Alternatively, if certain conditions are met, a Statement of Net Assets may be presented in lieu of this statement and the Schedule of Investments.
STATEMENT OF NET ASSETS
The Statement of Net Assets provides a detailed list of the fund’s holdings, including each security’s market value on the last day of the reporting period. The Statement of Net Assets includes a Schedule of Investments. Other assets are added and other liabilities subtracted from the investments total to calculate the fund’s net assets. Finally, net assets are divided by the outstanding shares of the fund to arrive at its share price, or Net Asset Value (NAV) per share.
At the end of the Statement of Net Assets is a table displaying the composition of the fund’s net assets. Paid in Capital is the money invested by shareholders and represents the bulk of net assets. Undistributed Net Investment Income and Accumulated Net Realized Gains usually approximate the amounts the fund had available to distribute to shareholders as of the statement date. Accumulated Realized Losses will appear as negative balances. Unrealized Appreciation (Depreciation) is the difference between the market value of the fund’s investments and their cost, and reflects the gains (losses) that would be realized if the fund were to sell all of its investments at their statement-date values.
STATEMENT OF OPERATIONS
The Statement of Operations summarizes the fund’s investment income earned and expenses incurred in operating the fund. Investment income includes dividends earned from stocks and interest earned from interest-bearing securities in the fund. Expenses incurred in operating the fund include the advisory fee paid to the investment advisor, administrative services fees, distribution plan expenses (if applicable), transfer agent fees, shareholder servicing expenses, custodial, legal, and audit fees, and the printing and postage expenses related to shareholder reports. Expense offsets (fees paid indirectly) are also shown. Credits earned from offset arrangements are used to reduce the fund’s expenses. This statement also shows net gains (losses) realized on the sale of investments and the increase or decrease in the unrealized appreciation (depreciation) on investments held during the period.
STATEMENT OF CHANGES IN NET ASSETS
The Statement of Changes in Net Assets shows how the fund’s total net assets changed during the two most recent reporting periods. Changes in the fund’s net assets are attributable to investment operations, distributions and capital share transactions.
The Operations section of the report summarizes information detailed in the Statement of Operations. The
60 www.calvert.com CALVERT VP RUSSELL 2000 SMALL CAP INDEX PORTFOLIO ANNUAL REPORT (UNAUDITED)
Distribution section shows the dividend and capital gain distributions made to shareholders. The amounts shown as distributions in this section may not match the net investment income and realized gains amounts shown in the Operations section because distributions are determined on a tax basis and certain investments or transactions may be treated differently for financial statement and tax purposes. The Capital Share Transactions section shows the amount shareholders invested in the fund, either by purchasing shares or by reinvesting distributions, and the amounts redeemed. The corresponding numbers of shares issued, reinvested and redeemed are shown at the end of the report.
FINANCIAL HIGHLIGHTS
The Financial Highlights table provides a per-share breakdown by class of the components that affect the fund’s net asset value for current and past reporting periods. The table provides total return, total distributions, expense ratios, portfolio turnover and net assets for the applicable period. Total return is a measure of a fund’s performance that encompasses all elements of return: dividends, capital gain distributions and changes in net asset value. Total return is the change in value of an investment over a given period, assuming reinvestment of any dividends and capital gain distributions, expressed as a percentage of the initial investment. Total distributions include distributions from net investment income and net realized gains. Long-term gains are earned on securities held in the fund more than one year. Short-term gains, on the sale of securities held less than one year, are treated as ordinary dividend income for tax purposes. The expense ratio is a fund’s cost of doing business, expressed as a percentage of net assets. These expenses directly reduce returns to shareholders. Portfolio turnover measures the trading activity in a fund’s investment portfolio – how often securities are bought and sold by a fund. Portfolio turnover is affected by market conditions, changes in the size of the fund, the nature of the fund’s investments and the investment style of the portfolio manager.
PROXY VOTING
The Proxy Voting Guidelines that the Portfolio uses to determine how to vote proxies relating to portfolio securities is provided as an Appendix to the Fund’s Statement of Additional Information. The Statement of Additional Information can be obtained free of charge by calling the Fund at 1-800-368-2745, by visiting the Calvert website at www.calvert.com or by visiting the SEC’s website at www.sec.gov.
Information regarding how the Fund voted proxies relating to portfolio securities during the most recent 12-month period ended June 30 is available by calling the Fund, by visiting the Calvert website at www. calvert.com or visiting the SEC’s website at www.sec.gov.
AVAILABILITY OF QUARTERLY PORTFOLIO HOLDINGS
The Fund files its complete schedule of portfolio holdings with the SEC for the first and third quarters of each fiscal year on Form N-Q. The Fund’s Form N-Q is available on the SEC’s website at www.sec.gov. The Fund’s Form N-Q may be reviewed and copied at the SEC’s Public Reference Room in Washington, DC; information on the operation of the Public Reference Room may be obtained by calling 1-800-SEC-0330.
BASIS FOR BOARD’S APPROVAL OF INVESTMENT ADVISORY CONTRACTS
At a meeting held on December 11, 2013, the Board of Directors, and by a separate vote, the disinterested Directors, approved the continuance of the Investment Advisory Agreement between the Portfolio and the Advisor and the Investment Subadvisory Agreement between the Advisor and the Subadvisor with respect to the Portfolio.
In evaluating the Investment Advisory Agreement, the Board considered a variety of information relating to the Portfolio and the Advisor. The disinterested Directors reviewed a report prepared by the Advisor regarding
www.calvert.com CALVERT VP RUSSELL 2000 SMALL CAP INDEX PORTFOLIO ANNUAL REPORT (UNAUDITED) 61
various services provided to the Portfolio by the Advisor and its affiliates. Such report included, among other data, information regarding the Advisor’s personnel and the Advisor’s revenue and cost of providing services to the Portfolio, and a separate report prepared by an independent third party, which provided a statistical analysis comparing the Portfolio’s investment performance, expenses, and fees to comparable mutual funds.
The disinterested Directors were separately represented by independent legal counsel with respect to their consideration of the reapproval of the Investment Advisory Agreement and the Investment Subadvisory Agreement. Prior to voting, the disinterested Directors reviewed the proposed continuance of the Investment Advisory Agreement and Investment Subadvisory Agreement with management and also met in private sessions with their counsel at which no representatives of management were present.
In the course of its deliberations regarding the Investment Advisory Agreement, the Board considered the following factors, among others: the nature, extent and quality of the services provided by the Advisor, including the personnel providing such services; the Advisor’s financial condition; the level and method of computing the Portfolio’s advisory fee; comparative performance, fee and expense information for the Portfolio; the profitability of the Calvert Family of Funds to the Advisor and its affiliates; the allocation of the Portfolio’s brokerage, including the Advisor’s process for monitoring “best execution”; the direct and indirect benefits, if any, derived by the Advisor and its affiliates from their relationship with the Portfolio; the effect of the Portfolio’s growth and size on the Portfolio’s performance and expenses; the Advisor’s compliance programs and policies; the Advisor’s performance of substantially similar duties for other funds; and any possible conflicts of interest.
In considering the nature, extent and quality of the services provided by the Advisor under the Investment Advisory Agreement, the Board reviewed information provided by the Advisor relating to its operations and personnel, including, among other information, biographical information on the Advisor’s supervisory and professional staff and descriptions of its organizational and management structure. The Board also took into account similar information provided periodically throughout the previous year by the Advisor, as well as the Board’s familiarity with the Advisor’s management through Board of Directors’ meetings, discussions and other reports. The Board considered the Advisor’s current level of staffing and overall resources. The Board also noted that it reviewed on a quarterly basis information regarding the Advisor’s compliance with applicable policies and procedures, including those related to personal investing. The Advisor’s administrative capabilities, including its ability to supervise the other service providers for the Portfolio, were also considered. The Board discussed the Advisor’s effectiveness in monitoring the performance of the Subadvisor and its timeliness in responding to performance issues. The Board observed that the scope of services provided by the Advisor generally had expanded over time as a result of regulatory, market and other changes. The Board took into consideration, among other factors, the effectiveness of the Portfolio’s and Advisor’s processes, policies and procedures and the Advisor’s personnel. The Board also took into account, among other items, periodic reports received from the Advisor over the past year concerning the Advisor’s ongoing review and enhancement of certain processes, policies and procedures of the Portfolio and the Advisor. The Board concluded that it was satisfied with the nature, extent and quality of services provided to the Portfolio by the Advisor under the Investment Advisory Agreement.
In considering the Portfolio’s performance, the Board noted that it reviewed on a quarterly basis detailed information about the Portfolio’s performance results, portfolio composition and investment strategies. In addition, the Board took into account overall financial market conditions. The Board also reviewed various comparative data provided to it in connection with its consideration of the renewal of the Investment Advisory Agreement, including, among other information, a comparison of the Portfolio’s total return with its Lipper index and with that of other mutual funds deemed to be in its peer group by an independent third party in its report. This comparison indicated that the Portfolio performed below the median of its peer group for the one-, three- and five-year periods ended June 30, 2013. The data also indicated that the Portfolio under-
62 www.calvert.com CALVERT VP RUSSELL 2000 SMALL CAP INDEX PORTFOLIO ANNUAL REPORT (UNAUDITED)
performed its Lipper index for the one-, three- and five-year periods ended June 30, 2013. The Board took into account management’s discussion of the Portfolio’s performance, including the impact of differing fees and expenses among the portfolios in the peer group on the Portfolio’s relative performance. Based upon its review, the Board concluded that the Portfolio’s performance was satisfactory relative to the performance of passively-managed funds that track the same benchmark index as does the Portfolio.
In considering the Portfolio’s fees and expenses, the Board compared the Portfolio’s fees and total expense ratio with various comparative data for the funds in its peer group. Among other findings, the data indicated that the Portfolio’s advisory fee was at the median of its peer group and that total expenses were above the median of its peer group. The Board noted that the allocation of advisory and administrative fees may vary among the Portfolio’s peer group. The Board also took into account the Advisor’s current undertaking to maintain expense limitations for the Portfolio. The Board noted that the Advisor paid the Subadvisor’s subadvisory fee under the Investment Subadvisory Agreement with respect to the Portfolio. The Board also took into account management’s discussion of the Portfolio’s expenses and certain factors that affected the level of such expenses, including the current size of the Portfolio. Based upon its review, the Board determined that the advisory fee was reasonable in view of the quality of services received by the Portfolio from the Advisor and the other factors considered.
The Board reviewed the Advisor’s profitability on a portfolio-by-portfolio basis. In reviewing the overall profitability of the advisory fee to the Portfolio’s Advisor, the Board also considered the fact that affiliates of the Advisor provided shareholder servicing, administrative and distribution services to the Portfolio for which they received compensation. The information considered by the Board included Calvert’s operating profit margin information both before and after tax expenses with respect to the services that the Advisor and its affiliates provided to the Calvert Family of Funds complex. The Board reviewed the profitability of the Advisor’s relationship with the Portfolio in terms of the total amount of annual advisory fees it received with respect to the Portfolio and whether the Advisor had the financial wherewithal to continue to provide services to the Portfolio. The Board also considered that the Advisor derived benefits to its reputation and other indirect benefits from its relationship with the Portfolio. In addition, the Board took into account that affiliates of the Advisor may benefit from certain indirect tax benefits relating to dividend received deductions and foreign tax credits. The Board also noted that the Advisor paid the subadvisory fee to the Subadvisor, an affiliate of the Advisor. Based upon its review, the Board concluded that the Advisor’s and its affiliates’ level of profitability from their relationship with the Portfolio was reasonable.
The Board considered the effect of the Portfolio’s current size and potential growth on its performance and fees. Although the Portfolio’s advisory fee did not contain breakpoints that would reduce the advisory fee rate on assets above specified asset levels, the Board noted that if the Portfolio’s assets increased over time, the Portfolio might realize other economies of scale if assets increased proportionally more than certain other expenses. The Board also noted that given the Portfolio’s current level of assets, the Portfolio would be unlikely to recognize economies of scale by implementing a breakpoint in the advisory fee at this time.
In reapproving the Investment Advisory Agreement, the Board, including the disinterested Directors, did not identify any single factor as controlling, and each Director may have attributed different weight to various factors.
In evaluating the Investment Subadvisory Agreement, the disinterested Directors reviewed information provided by the Subadvisor relating to its operations, personnel, investment philosophy, strategies and techniques. Among other information, the Subadvisor provided biographical information on portfolio management and other professional staff, performance information for itself, and descriptions of its investment philosophies, strategies and techniques, organizational and management structures and brokerage policies and practices.
The Board reapproved the Investment Subadvisory Agreement between the Subadvisor and the Advisor based on a number of factors relating to the Subadvisor’s ability to perform under the Investment Subadvisory
www.calvert.com CALVERT VP RUSSELL 2000 SMALL CAP INDEX PORTFOLIO ANNUAL REPORT (UNAUDITED) 63
Agreement. In the course of its deliberations, the Board evaluated, among other factors: the nature, extent and the quality of the services to be provided by the Subadvisor; the Subadvisor’s management style and long-term performance record; the Portfolio’s performance record and the Subadvisor’s performance in employing its investment strategies; the Subadvisor’s current level of staffing and its overall resources; the qualifications and experience of the Subadvisor’s personnel; the Subadvisor’s financial condition with respect to its ability to perform the services required under the Investment Subadvisory Agreement; the Subadvisor’s risk management processes; the Subadvisor’s compliance systems, including those related to personal investing; and any disciplinary history. Based upon its review, the Board concluded that it was satisfied with the nature, extent and quality of services provided to the Portfolio by the Subadvisor under the Investment Subadvisory Agreement.
As noted above, the Board considered, among other information, the Portfolio’s performance during the one-, three- and five-year periods ended June 30, 2013 as compared to the Portfolio’s peer group and noted that it reviewed on a quarterly basis detailed information about the Portfolio’s performance results, portfolio composition and investment strategies. The Board noted the Advisor’s expertise and resources in monitoring the performance, investment style and risk adjusted performance of the Subadvisor.
In considering the cost of services to be provided by the Subadvisor and the profitability to the Subadvisor of its relationship with the Portfolio, the Board noted that the Advisor and Subadvisor were affiliated and the subadvisory fee under the Investment Subadvisory Agreement was paid by the Advisor out of the advisory fee that the Advisor received under the Investment Advisory Agreement. Based upon its review, the Board determined that the subadvisory fee was reasonable in view of the quality of services received by the Portfolio from the Subadvisor and the other factors considered. Because the Advisor would pay the Subadvisor’s subadvisory fee, the cost of services to be provided by the Subadvisor and the level of profitability to the Subadvisor from its relationship with the Portfolio were not material factors in the Board’s deliberations. For similar reasons, the Board did not consider the potential economies of scale in the Subadvisor’s management of the Portfolio to be a material factor in its consideration.
In reapproving the Investment Subadvisory Agreement, the Board, including the disinterested Directors, did not identify any single factor as controlling, and each Director may have attributed different weight to various factors.
CONCLUSIONS
The Board reached the following conclusions regarding the Investment Advisory Agreement and the Investment Subadvisory Agreement, among others: (a) the Advisor has demonstrated that it possesses the capability and resources to perform the duties required of it under the Investment Advisory Agreement; (b) the Subadvisor is qualified to manage the Portfolio’s assets in accordance with the Portfolio’s investment objective and policies; (c) the Advisor and Subadvisor maintain appropriate compliance programs; (d) the Subadvisor is likely to execute its investment strategies consistently over time; (e) the performance of the Portfolio is satisfactory relative to the performance of passively-managed funds that track the same benchmark index as does the Portfolio; and (f) the Portfolio’s advisory and subadvisory fees are reasonable in view of the quality of services received by the Portfolio from the Advisor and Subadvisor and the other factors considered. Based on its conclusions, the Board determined that reapproval of the Investment Advisory Agreement and the Investment Subadvisory Agreement would be in the best interests of the Portfolio and its shareholders.
64 www.calvert.com CALVERT VP RUSSELL 2000 SMALL CAP INDEX PORTFOLIO ANNUAL REPORT (UNAUDITED)
This report is intended to provide fund information to shareholders. It is not authorized for distribution to prospective investors unless preceded or accompanied by a prospectus.
Note: The information on our website is not incorporated by reference into this report; our website address is included as an inactive textual reference only.
Investors should carefully consider the investment objectives, risks, charges and expenses of the Calvert Funds. This and other important information is contained in the fund’s summary prospectus and prospectus, which can be obtained from your financial professional and should be read carefully before investing. You may also call Calvert at 800/368-2745 or visit www. calvert.com.
www.calvert.com CALVERT VP RUSSELL 2000 SMALL CAP INDEX PORTFOLIO ANNUAL REPORT (UNAUDITED) 65
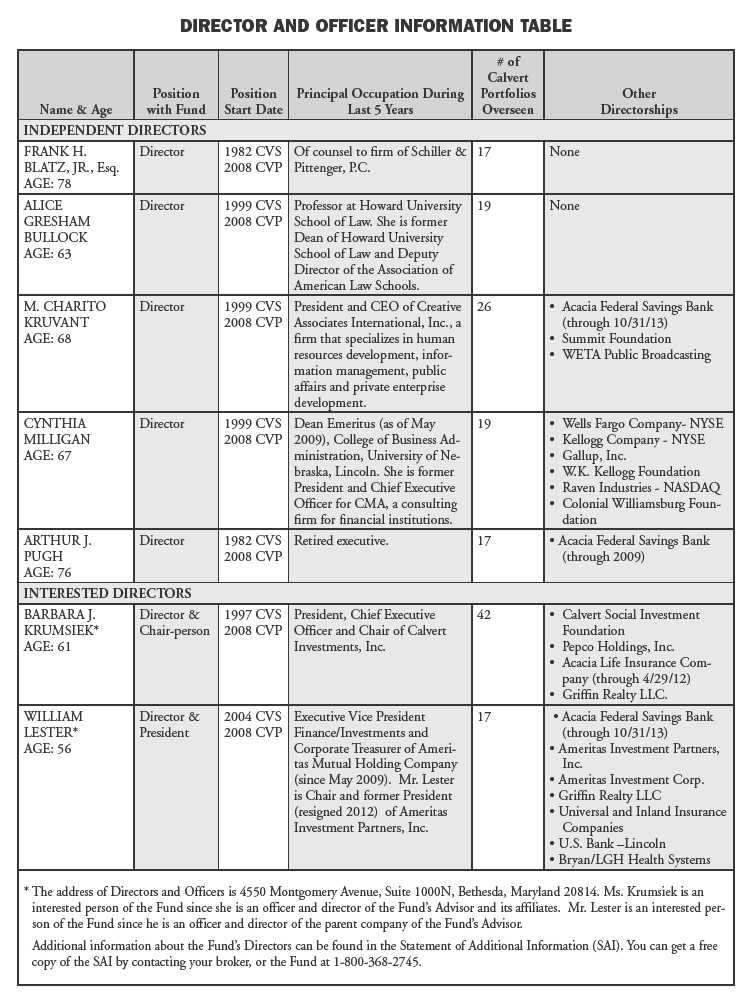
66 www.calvert.com CALVERT VP RUSSELL 2000 SMALL CAP INDEX PORTFOLIO ANNUAL REPORT (UNAUDITED)
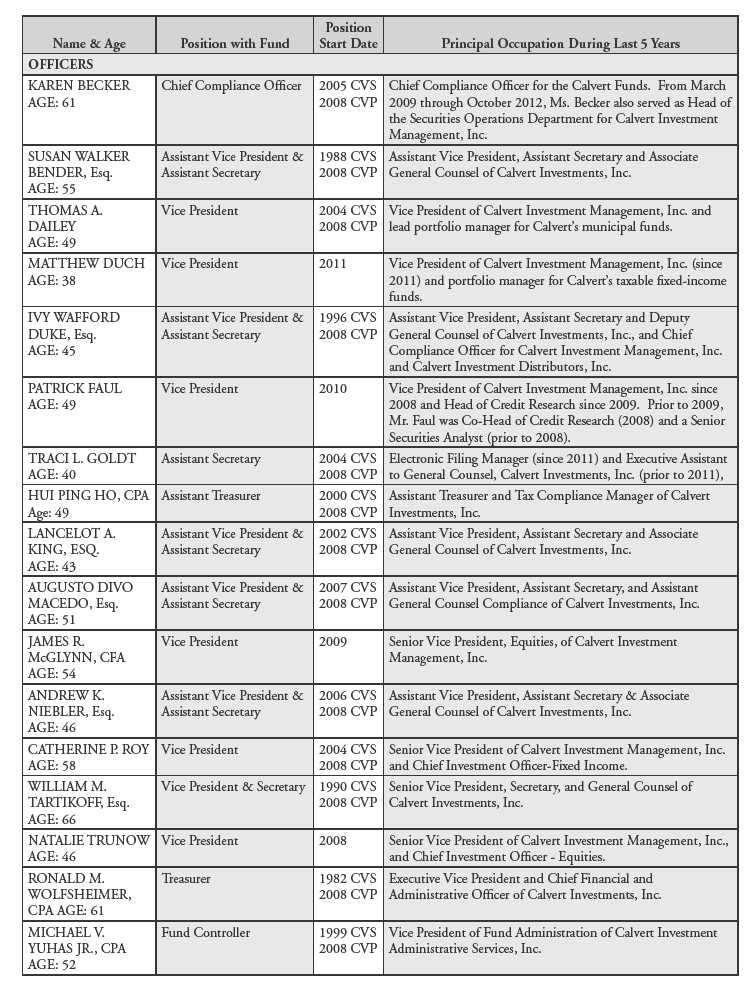
www.calvert.com CALVERT VP RUSSELL 2000 SMALL CAP INDEX PORTFOLIO ANNUAL REPORT (UNAUDITED) 67
This page intentionally left blank.
This page intentionally left blank.

CALVERT VP EAFE INTERNATIONAL INDEX PORTFOLIO
Portfolio within Calvert Variable Products, Inc.
Managed by World Asset Management, Inc., Subadvisor
INVESTMENT PERFORMANCE
For the year ended December 31, 2013, Calvert VP EAFE International Index Portfolio (Class I shares) returned 20.72% compared to 23.29% for the MSCI EAFE Index. The slight relative underperformance was largely attributable to fees and operating expenses, which the Index does not have.
INVESTMENT CLIMATE
Global equities started the year strong and continued to climb as subdued global inflation and a benevolent interest-rate environment together helped economic growth overseas. As a result, corporate profit margins improved worldwide, valuations increased, and earnings multiples expanded. However, commodity prices stayed low, which hurt the commodity-rich emerging market sector. In addition, China’s growth seemed to be weakening, spurring investor concerns about whether China’s economy would have a hard landing.
PORTFOLIO STRATEGY
The Calvert VP EAFE International Index Portfolio seeks to match, as closely as possible before fees and expenses, the performance of the Morgan Stanley Capital International (MSCI) Europe, Australasia, Far East (EAFE) Index (MSCI EAFE Index). As an index fund, the Portfolio uses a passive management approach. All investment decisions are based on the goal of producing returns equivalent to those of the Index. The unmanaged MSCI EAFE Index is comprised of a wide range of foreign securities trading in developed foreign markets, such as Europe, Australia, New Zealand, Singapore and countries in the Far East.
Foreign stock markets had strong absolute returns for the year but were slightly weaker than the U.S.-focused S&P 500 Index. There were 21 countries in the MSCI EAFE universe at year-end. Japan and the United

| | AVERAGE ANNUAL TOTAL RETURN |
| | (period ended 12.31.13) |
| | Class I | Class F |
| One year | 20.72% | 20.47% |
| Five year | 11.02% | 10.77% |
| Ten year | 5.91% | 5.67%* |
The performance data shown represents past performance, does not guarantee future results and assumes reinvestment of all dividends and distributions. All performance data reflects fee waivers and/or expense limitations, if any are in effect; in their absence performance would be lower. See Note B in Notes to Financial Statements. The investment return and principal value of an investment will fluctuate so that an investor’s shares, when redeemed, may be worth more or less than their original cost. Current performance may be lower or higher than the performance data quoted.
Visit www.calvert.com/institutional-VP-performance.html for current performance data. The gross expense ratio from the current prospectus for Class I Shares is 0.96%. This number may vary from the expense ratio shown elsewhere in this report because it is based on a different time period and, if applicable, does not include fee or expense waivers. The performance data and expense ratio reflect deduction of Portfolio operating expenses, but do not reflect charges and expenses imposed under the variable annuity or life insurance contract.
* Class F share performance prior to October 1, 2007 is based on Class I performance, adjusted to reflect Class F expenses.
4 www.calvert.com CALVERT VP EAFE INTERNATIONAL INDEX PORTFOLIO ANNUAL REPORT
| | % OF TOTAL |
| ECONOMIC SECTORS | INVESTMENTS |
| |
| Consumer Discretionary | 12.0% |
| Consumer Staples | 10.6% |
| Energy | 6.7% |
| Exchange Traded Products | 1.3% |
| Financials | 25.2% |
| Health Care | 9.9% |
| Industrials | 12.6% |
| Information Technology | 4.6% |
| Materials | 8.1% |
| Short-Term Investments | 0.1% |
| Telecommunication Services | 5.4% |
| Utilities | 3.5% |
| Total | 100% |
Kingdom were the most heavily weighted, at 20.9% and 21.9%, respectively, accounting for 42.8% of the Index.
The strongest returns came from Finland, Ireland, and Germany, up 47.9%, 41.7%, and 32.4, respectively. Singapore, up 1.7% and Australia, up 4.2%, were the weakest-performing countries. The strongest sector returns were in Consumer Discretionary, followed by Health Care and Industrials.
During 2013, the Portfolio continued to meet its investment objective of closely tracking the total return of the MSCI EAFE Index. Cash flows are invested promptly to minimize their impact on total return. Since the MSCI EAFE Index is not an actual fund, it is not possible to invest directly in it. Unlike the Index, the Portfolio incurs operating expenses. Third party fair value pricing adjustments to local market closing prices at the beginning of the reporting period also contributed to the underperfor-mance, as did foreign government withholding on dividends.
OUTLOOK
We expect continued economic growth in the United States and abroad as the U.S. Federal Reserve (the Fed) continues to maintain a supportive interest-rate environment, which should in turn provide support for the Industrial and Consumer Discretionary sectors. Higher corporate profit margins and lower commodity prices (in particular, energy) will support higher valuations in the United States. However, we do believe U.S. equity markets may become more volatile as the Fed continues to reduce its rate of fixed-income security purchases, pressuring interest rates to move higher. That volatility may spread to foreign markets, particularly Europe.
We believe U.S. economic growth and Fed policies should have a beneficial effect on European markets in 2014, as the region continues to recover from its banking crisis and weak growth. In Asia, efforts to increase Japan’s economic growth will continue for a second year and should successfully support and improve the economic environment, assuming there are no further hostilities over the South China Sea territorial dispute. Overall, we believe 2014 could be another good year for the international equity markets.
January 2014
www.calvert.com CALVERT VP EAFE INTERNATIONAL INDEX PORTFOLIO ANNUAL REPORT 5
SHAREHOLDER EXPENSE EXAMPLE
As a shareholder of the Fund, you incur two types of costs: (1) transaction costs, and (2) ongoing costs, including management fees and other Fund expenses. This Example is intended to help you understand your ongoing costs (in dollars) of investing in the Fund and to compare these costs with the ongoing costs of investing in other mutual funds.
This Example is based on an investment of $1,000 invested at the beginning of the period and held for the entire period (July 1, 2013 to December 31, 2013).
Note: Expenses do not reflect charges and expenses of the variable annuity or variable universal life contract.
Actual Expenses
The first line of the table below provides information about actual account values and actual expenses. You may use the information in this line, together with the amount you invested, to estimate the expenses that you paid over the period. Simply divide your account value by $1,000 (for example, an $8,600 account value divided by $1,000 = 8.6), then multiply the result by the number in the first line under the heading entitled “Expenses Paid During Period” to estimate the expenses you paid on your account during this period.
Hypothetical Example for Comparison Purposes
The second line of the table below provides information about hypothetical account values and hypothetical expenses based on the Fund’s actual expense ratio and an assumed rate of return of 5% per year before expenses, which is not the Fund’s actual return. The hypothetical account values and expenses may not be used to estimate the actual ending account balance or expenses you paid for the period. You may use this information to compare the ongoing costs of investing in the Fund and other funds. To do so, compare the 5% hypothetical example with the 5% hypothetical examples that appear in the shareholder reports of the other funds.
Please note that the expenses shown in the table are meant to highlight your ongoing costs only and do not reflect any transactional costs. Therefore, the second line of the table is useful in comparing ongoing costs only, and will not help you determine the relative total costs of owning different funds. In addition, if these transactional costs were included, your costs would have been higher.
| | BEGINNING | ENDING | EXPENSES PAID |
| | ACCOUNT VALUE | ACCOUNT VALUE | DURING PERIOD* |
| | 7/1/13 | 12/31/13 | 7/1/13 - 12/31/13 |
| Class I | | | |
| Actual | $1,000.00 | $1,170.45 | $5.34 |
| |
Hypothetical
(5% return per year before expenses) | $1,000.00 | $1,020.29 | $4.97 |
| |
| Class F | | | |
| Actual | $1,000.00 | $1,169.08 | $6.57 |
| |
Hypothetical
(5% return per year before expenses) | $1,000.00 | $1,019.15 | $6.12 |
* Expenses are equal to the Fund’s annualized expense ratio of 0.98% and 1.20%, respectively, multiplied by the average account value over the period, multiplied by 184/365 (to reflect the one-half year period).
6 www.calvert.com CALVERT VP EAFE INTERNATIONAL INDEX PORTFOLIO ANNUAL REPORT
REPORT OF INDEPENDENT REGISTERED PUBLIC ACCOUNTING FIRM
The Board of Directors of Calvert Variable Products, Inc. and Shareholders of Calvert VP EAFE International Index Portfolio: We have audited the accompanying statement of net assets of the Calvert VP EAFE International Index Portfolio (the “Portfolio”), a series of Calvert Variable Products, Inc., as of December 31, 2013, and the related statement of operations for the year then ended, the statements of changes in net assets for each of the years in the two-year period then ended, and the financial highlights for each of the years in the five-year period then ended. These financial statements and financial highlights are the responsibility of the Portfolio’s management. Our responsibility is to express an opinion on these financial statements and financial highlights based on our audits.
We conducted our audits in accordance with the standards of the Public Company Accounting Oversight Board (United States). Those standards require that we plan and perform the audit to obtain reasonable assurance about whether the financial statements and financial highlights are free of material misstatement. An audit includes examining, on a test basis, evidence supporting the amounts and disclosures in the financial statements. Our procedures included confirmation of securities owned as of December 31, 2013, by correspondence with the custodian and brokers or by performing other appropriate auditing procedures. An audit also includes assessing the accounting principles used and significant estimates made by management, as well as evaluating the overall financial statement presentation. We believe that our audits provide a reasonable basis for our opinion.
In our opinion, the financial statements and financial highlights referred to above present fairly, in all material respects, the financial position of the Calvert VP EAFE International Index Portfolio as of December 31, 2013, the results of its operations for the year then ended, the changes in its net assets for each of the years in the two-year period then ended, and the financial highlights for each of the years in the five-year period then ended, in conformity with U.S. generally accepted accounting principles.

Philadelphia, Pennsylvania
February 24, 2014
www.calvert.com CALVERT VP EAFE INTERNATIONAL INDEX PORTFOLIO ANNUAL REPORT 7
| | |
| STATEMENT OF NET ASSETS |
| DECEMBER 31, 2013 |
| |
| |
| EQUITY SECURITIES - 98.3% | SHARES | VALUE |
| Australia - 7.3% | | |
| AGL Energy Ltd. | 6,691 | $89,790 |
| ALS Ltd. | 4,630 | 36,420 |
| Alumina Ltd.* | 30,495 | 30,359 |
| Amcor Ltd. | 14,570 | 137,243 |
| AMP Ltd | 35,553 | 139,354 |
| APA Group | 10,091 | 54,058 |
| Asciano Ltd. | 11,777 | 60,567 |
| ASX Ltd. | 2,337 | 76,703 |
| Aurizon Holdings Ltd. | 24,516 | 106,819 |
| Australia & New Zealand Banking Group Ltd | 33,009 | 949,885 |
| Bank of Queensland Ltd. | 3,847 | 41,767 |
| Bendigo and Adelaide Bank Ltd | 4,916 | 51,574 |
| BGP Holdings plc (b)* | 77,172 | — |
| BHP Billiton Ltd. | 38,641 | 1,310,678 |
| Boral Ltd | 9,345 | 39,799 |
| Brambles Ltd | 18,803 | 153,613 |
| Caltex Australia Ltd. | 1,630 | 29,180 |
| CFS Retail Property Trust Group | 25,614 | 44,481 |
| Coca-Cola Amatil Ltd | 6,914 | 74,263 |
| Cochlear Ltd. | 688 | 36,193 |
| Commonwealth Bank of Australia | 19,393 | 1,347,110 |
| Computershare Ltd. | 5,708 | 57,997 |
| Crown Resorts Ltd. | 4,837 | 72,770 |
| CSL Ltd. | 5,860 | 360,806 |
| Dexus Property Group | 56,224 | 50,451 |
| Echo Entertainment Group Ltd. | 9,471 | 20,802 |
| Federation Centres Ltd | 17,237 | 36,013 |
| Flight Centre Travel Group Ltd | 666 | 28,275 |
| Fortescue Metals Group Ltd | 18,798 | 97,682 |
| Goodman Group | 20,686 | 87,361 |
| GPT Group | 20,795 | 63,127 |
| Harvey Norman Holdings Ltd. | 6,413 | 18,094 |
| Iluka Resources Ltd | 5,055 | 38,950 |
| Incitec Pivot Ltd. | 19,665 | 47,055 |
| Insurance Australia Group Ltd. | 25,103 | 130,445 |
| Leighton Holdings Ltd | 2,035 | 29,271 |
| Lend Lease Group | 6,601 | 65,656 |
| Macquarie Group Ltd. | 3,484 | 171,129 |
| Metcash Ltd. | 10,633 | 30,000 |
| Mirvac Group | 44,225 | 66,337 |
| National Australia Bank Ltd | 28,260 | 878,828 |
| Newcrest Mining Ltd. | 9,255 | 64,454 |
| Orica Ltd. | 4,429 | 94,353 |
| Origin Energy Ltd | 13,211 | 165,962 |
| Orora Ltd.* | 14,570 | 15,090 |
| Qantas Airways Ltd.* | 13,263 | 12,967 |
| QBE Insurance Group Ltd | 14,688 | 150,944 |
| Ramsay Health Care Ltd | 1,586 | 61,259 |
| Recall Holdings Ltd.* | 3,761 | 13,632 |
| Rio Tinto Ltd | 5,242 | 319,104 |
| Santos Ltd | 11,672 | 152,464 |
| Seek Ltd. | 3,875 | 46,396 |
8 www.calvert.com CALVERT VP EAFE INTERNATIONAL INDEX PORTFOLIO ANNUAL REPORT
| | |
| EQUITY SECURITIES - CONT’D | SHARES | VALUE |
| Australia - Cont’d | | |
| Sonic Healthcare Ltd | 4,551 | $67,370 |
| SP AusNet | 20,330 | 22,599 |
| Stockland | 27,840 | 89,734 |
| Suncorp Group Ltd | 15,479 | 181,048 |
| Sydney Airport | 13,927 | 47,252 |
| TABCORP Holdings Ltd | 8,994 | 29,150 |
| Tatts Group Ltd. | 16,936 | 46,876 |
| Telstra Corp. Ltd | 52,397 | 245,609 |
| Toll Holdings Ltd. | 8,226 | 41,717 |
| Transurban Group | 16,994 | 103,784 |
| Treasury Wine Estates Ltd | 7,814 | 33,628 |
| Wesfarmers Ltd. | 11,961 | 470,320 |
| Westfield Group | 24,783 | 223,266 |
| Westfield Retail Trust | 36,045 | 95,583 |
| Westpac Banking Corp | 37,342 | 1,079,575 |
| Woodside Petroleum Ltd | 7,930 | 275,424 |
| Woolworths Ltd. | 15,040 | 454,553 |
| WorleyParsons Ltd. | 2,495 | 36,979 |
| | | 11,801,997 |
| |
| Austria - 0.3% | | |
| Andritz AG | 879 | 55,215 |
| Erste Group Bank AG | 3,112 | 108,612 |
| IMMOFINANZ AG* | 11,586 | 53,766 |
| OMV AG | 1,778 | 85,229 |
| Raiffeisen Bank International AG | 590 | 20,827 |
| Telekom Austria AG | 2,674 | 20,279 |
| Vienna Insurance Group AG Wiener Versicherung Gruppe | 463 | 23,110 |
| Voestalpine AG | 1,353 | 65,118 |
| | | 432,156 |
| |
| Belgium - 1.2% | | |
| Ageas SA/NV | 2,668 | 113,775 |
| Anheuser-Busch InBev NV | 9,668 | 1,029,185 |
| Belgacom SA | 1,836 | 54,402 |
| Colruyt SA | 915 | 51,161 |
| Delhaize Group | 1,230 | 73,213 |
| Groupe Bruxelles Lambert SA | 974 | 89,553 |
| KBC Groep NV | 2,769 | 157,380 |
| Solvay SA | 715 | 113,294 |
| Telenet Group Holding NV | 618 | 36,934 |
| UCB SA | 1,328 | 99,065 |
| Umicore SA | 1,376 | 64,376 |
| | | 1,882,338 |
| |
| Denmark - 1.1% | | |
| AP Moeller - Maersk A/S: | | |
| Series A | 6 | 61,948 |
| Series B | 15 | 163,042 |
| Carlsberg A/S, Series B | 1,291 | 143,067 |
| Coloplast A/S | 1,341 | 88,917 |
| Danske Bank A/S* | 7,887 | 181,215 |
| DSV A/S | 2,173 | 71,360 |
| Novo Nordisk A/S, Series B* | 4,791 | 879,578 |
| Novozymes A/S, Series B | 2,729 | 115,375 |
| TDC A/S | 9,769 | 94,907 |
www.calvert.com CALVERT VP EAFE INTERNATIONAL INDEX PORTFOLIO ANNUAL REPORT 9
| | |
| EQUITY SECURITIES - CONT’D | SHARES | VALUE |
| Denmark - Cont’d | | |
| Tryg A/S | 296 | $28,675 |
| William Demant Holding A/S* | 307 | 29,882 |
| | | 1,857,966 |
| |
| Finland - 0.9% | | |
| Elisa Oyj | 1,715 | 45,512 |
| Fortum Oyj | 5,363 | 122,886 |
| Kone Oyj, Series B | 3,762 | 170,018 |
| Metso Oyj | 1,543 | 65,949 |
| Neste Oil Oyj | 1,547 | 30,630 |
| Nokia Oyj* | 45,057 | 361,316 |
| Nokian Renkaat Oyj | 1,361 | 65,390 |
| Orion Oyj, Class B | 1,194 | 33,594 |
| Pohjola Bank plc | 1,673 | 33,701 |
| Sampo Oyj | 5,042 | 248,151 |
| Stora Enso Oyj, Series R | 6,644 | 66,782 |
| UPM-Kymmene Oyj | 6,376 | 107,882 |
| Wartsila Oyj Abp | 2,143 | 105,619 |
| | | 1,457,430 |
| |
| France - 9.3% | | |
| Accor SA | 1,922 | 90,834 |
| Aeroports de Paris | 358 | 40,695 |
| Air Liquide SA | 3,750 | 531,161 |
| Alcatel-Lucent* | 33,495 | 150,360 |
| Alstom SA | 2,604 | 94,990 |
| Arkema SA | 758 | 88,556 |
| Atos SA | 672 | 60,916 |
| AXA SA | 21,586 | 601,092 |
| BNP Paribas SA | 11,978 | 934,946 |
| Bouygues | 2,312 | 87,349 |
| Bureau Veritas SA | 2,667 | 78,070 |
| Cap Gemini SA | 1,723 | 116,636 |
| Carrefour SA | 7,403 | 293,869 |
| Casino Guichard-Perrachon SA | 680 | 78,487 |
| CGG SA* | 1,921 | 33,297 |
| Christian Dior SA | 658 | 124,525 |
| Cie de Saint-Gobain | 4,988 | 274,737 |
| Cie Generale des Etablissements Michelin | 2,252 | 239,701 |
| CNP Assurances SA | 2,072 | 42,538 |
| Credit Agricole SA* | 12,064 | 154,671 |
| Danone SA | 6,832 | 492,513 |
| Dassault Systemes | 757 | 94,113 |
| Edenred | 2,454 | 82,266 |
| Electricite de France SA | 2,902 | 102,702 |
| Essilor International SA | 2,463 | 262,261 |
| Eurazeo SA | 376 | 29,520 |
| Eutelsat Communications SA | 1,727 | 53,932 |
| Fonciere Des Regions | 342 | 29,569 |
| GDF Suez | 15,966 | 376,069 |
| Gecina SA | 265 | 35,063 |
| Groupe Eurotunnel SA | 6,640 | 69,898 |
| Icade SA | 430 | 40,093 |
| Iliad SA | 313 | 64,216 |
| Imerys SA | 409 | 35,621 |
| JC Decaux SA | 804 | 33,201 |
10 www.calvert.com CALVERT VP EAFE INTERNATIONAL INDEX PORTFOLIO ANNUAL REPORT
| | |
| EQUITY SECURITIES - CONT’D | SHARES | VALUE |
| France - Cont’d | | |
| Kering SA | 910 | $192,653 |
| Klepierre SA | 1,204 | 55,881 |
| Lafarge SA | 2,254 | 169,166 |
| Lagardere SCA | 1,345 | 50,074 |
| Legrand SA | 3,186 | 175,857 |
| L’Oreal SA | 2,909 | 511,843 |
| LVMH Moet Hennessy Louis Vuitton SA | 3,054 | 557,975 |
| Natixis | 11,192 | 65,909 |
| Orange SA | 22,308 | 276,634 |
| Pernod-Ricard SA | 2,553 | 291,297 |
| Publicis Groupe | 2,177 | 199,502 |
| Remy Cointreau SA | 307 | 25,799 |
| Renault SA | 2,312 | 186,198 |
| Rexel SA | 2,563 | 67,362 |
| Safran SA | 3,261 | 226,950 |
| Sanofi SA | 14,366 | 1,526,529 |
| Schneider Electric SA | 6,404 | 559,426 |
| SCOR SE | 1,854 | 67,861 |
| Societe BIC SA | 350 | 42,949 |
| Societe Generale SA | 8,648 | 503,079 |
| Sodexo | 1,138 | 115,467 |
| Suez Environnement SA | 3,388 | 60,803 |
| Technip SA | 1,228 | 118,203 |
| Thales SA | 1,099 | 70,867 |
| Total SA | 25,735 | 1,578,989 |
| Unibail-Rodamco SE | 1,169 | 299,994 |
| Valeo SA | 908 | 100,625 |
| Vallourec SA | 1,282 | 69,950 |
| Veolia Environnement SA | 4,292 | 70,107 |
| Vinci SA | 5,765 | 379,055 |
| Vivendi | 14,499 | 382,668 |
| Wendel SA | 388 | 56,642 |
| Zodiac Aerospace | 412 | 73,088 |
| | | 15,047,869 |
| |
| Germany - 9.2% | | |
| adidas AG | 2,517 | 321,280 |
| Allianz SE | 5,485 | 985,122 |
| Axel Springer SE | 477 | 30,693 |
| BASF SE | 11,050 | 1,179,805 |
| Bayer AG | 9,949 | 1,397,555 |
| Bayerische Motoren Werke AG: | | |
| Common | 3,983 | 467,686 |
| Preferred | 651 | 55,694 |
| Beiersdorf AG | 1,217 | 123,483 |
| Brenntag AG | 621 | 115,298 |
| Celesio AG | 1,026 | 32,514 |
| Commerzbank AG* | 11,684 | 188,517 |
| Continental AG | 1,323 | 290,570 |
| Daimler AG | 11,580 | 1,003,602 |
| Deutsche Bank AG | 12,265 | 585,985 |
| Deutsche Boerse AG | 2,330 | 193,266 |
| Deutsche Lufthansa AG* | 2,776 | 58,980 |
| Deutsche Post AG | 10,909 | 398,321 |
| Deutsche Telekom AG | 34,809 | 596,163 |
| Deutsche Wohnen AG | 3,601 | 69,637 |
www.calvert.com CALVERT VP EAFE INTERNATIONAL INDEX PORTFOLIO ANNUAL REPORT 11
| | |
| EQUITY SECURITIES - CONT’D | SHARES | VALUE |
| Germany - Cont’d | | |
| E.ON SE | 21,667 | $400,490 |
| Fraport AG Frankfurt Airport Services Worldwide | 445 | 33,349 |
| Fresenius Medical Care AG & Co. KGaA | 2,599 | 185,247 |
| Fresenius SE & Co. KGaA | 1,507 | 231,729 |
| Fuchs Petrolub SE, Preferred | 428 | 41,894 |
| GEA Group AG | 2,208 | 105,263 |
| Hannover Rueck SE | 728 | 62,572 |
| HeidelbergCement AG | 1,697 | 128,952 |
| Henkel AG & Co. KGaA: | | |
| Common | 1,568 | 163,418 |
| Preferred | 2,143 | 248,945 |
| Hochtief AG | 371 | 31,724 |
| Hugo Boss AG | 382 | 54,476 |
| Infineon Technologies AG | 13,050 | 139,532 |
| K+S AG | 2,079 | 64,094 |
| Kabel Deutschland Holding AG | 267 | 34,662 |
| Lanxess AG | 1,004 | 67,058 |
| Linde AG | 2,236 | 468,447 |
| MAN SE | 425 | 52,264 |
| Merck KGAA | 780 | 139,983 |
| Metro AG | 1,565 | 75,903 |
| Muenchener Rueckversicherungs AG | 2,157 | 475,970 |
| OSRAM Licht AG* | 1,011 | 57,113 |
| Porsche Automobil Holding SE, Preferred | 1,848 | 192,651 |
| RTL Group SA* | 465 | 60,181 |
| RWE AG | 5,887 | 215,804 |
| SAP AG | 11,085 | 951,690 |
| Siemens AG | 9,539 | 1,305,000 |
| Suedzucker AG | 986 | 26,655 |
| ThyssenKrupp AG* | 5,464 | 133,180 |
| United Internet AG | 1,288 | 54,873 |
| Volkswagen AG: | | |
| Common | 356 | 96,582 |
| Preferred | 1,739 | 489,160 |
| | | 14,883,032 |
| |
| Hong Kong - 2.9% | | |
| AIA Group Ltd. | 144,906 | 726,964 |
| ASM Pacific Technology Ltd | 2,892 | 24,169 |
| Bank of East Asia Ltd | 15,020 | 63,633 |
| BOC Hong Kong Holdings Ltd | 44,681 | 143,194 |
| Cathay Pacific Airways Ltd. | 14,249 | 30,211 |
| Cheung Kong Holdings Ltd | 16,719 | 264,133 |
| Cheung Kong Infrastructure Holdings Ltd. | 7,533 | 47,701 |
| CLP Holdings Ltd. | 21,277 | 168,208 |
| First Pacific Co. Ltd. | 28,612 | 32,546 |
| Galaxy Entertainment Group Ltd.* | 25,402 | 227,846 |
| Genting Singapore plc | 73,803 | 87,405 |
| Hang Lung Properties Ltd | 27,035 | 85,771 |
| Hang Seng Bank Ltd | 9,233 | 149,796 |
| Henderson Land Development Co. Ltd. | 12,829 | 73,212 |
| HKT Trust and HKT Ltd. | 27,117 | 26,823 |
| Hong Kong & China Gas Co. Ltd | 69,256 | 159,163 |
| Hong Kong Exchanges and Clearing Ltd. | 13,189 | 219,761 |
| Hopewell Holdings | 6,868 | 23,295 |
| Hutchison Whampoa Ltd. | 25,647 | 348,952 |
12 www.calvert.com CALVERT VP EAFE INTERNATIONAL INDEX PORTFOLIO ANNUAL REPORT
| | |
| EQUITY SECURITIES - CONT’D | SHARES | VALUE |
| Hong Kong - Cont’d | | |
| Hysan Development Co. Ltd. | 7,705 | $33,189 |
| Kerry Logistics Network Ltd.* | 3,911 | 5,548 |
| Kerry Properties Ltd | 7,823 | 27,140 |
| Li & Fung Ltd. | 70,662 | 91,313 |
| Link REIT | 27,803 | 135,179 |
| MGM China Holdings Ltd | 11,470 | 49,037 |
| MTR Corp. Ltd. | 17,498 | 66,233 |
| New World Development Co. Ltd. | 45,725 | 57,908 |
| Noble Group Ltd. | 51,651 | 43,781 |
| NWS Holdings Ltd | 17,752 | 27,061 |
| PCCW Ltd. | 48,294 | 21,612 |
| Power Assets Holdings Ltd | 16,750 | 133,284 |
| Sands China Ltd. | 29,087 | 238,579 |
| Shangri-La Asia Ltd | 18,909 | 36,921 |
| Sino Land Co | 35,908 | 49,088 |
| SJM Holdings Ltd | 23,451 | 78,332 |
| Sun Hung Kai Properties Ltd | 19,281 | 244,682 |
| Swire Pacific Ltd. | 8,200 | 96,393 |
| Swire Properties Ltd. | 14,127 | 35,709 |
| Wharf Holdings Ltd | 18,291 | 139,648 |
| Wheelock & Co. Ltd. | 11,040 | 50,758 |
| Wynn Macau Ltd | 18,790 | 85,299 |
| Yue Yuen Industrial Holdings Ltd. | 8,959 | 29,925 |
| | | 4,679,402 |
| |
| Ireland - 0.3% | | |
| Bank of Ireland* | 254,682 | 88,430 |
| CRH plc | 8,775 | 221,259 |
| James Hardie Industries plc | 5,332 | 61,603 |
| Kerry Group plc | 1,803 | 125,455 |
| Ryanair Holdings plc* | 2,271 | 19,604 |
| | | 516,351 |
| |
| Israel - 0.4% | | |
| Bank Hapoalim BM | 12,737 | 71,466 |
| Bank Leumi Le-Israel BM* | 15,123 | 61,863 |
| Bezeq Israeli Telecommunication Corp. Ltd | 23,033 | 39,103 |
| Delek Group Ltd. | 48 | 18,361 |
| Israel Chemicals Ltd | 5,378 | 44,883 |
| Israel Corp. Ltd.* | 32 | 16,866 |
| Mizrahi Tefahot Bank Ltd. | 1,513 | 19,833 |
| NICE Systems Ltd. | 696 | 28,551 |
| Teva Pharmaceutical Industries Ltd | 10,225 | 409,419 |
| | | 710,345 |
| |
| Italy - 2.0% | | |
| Assicurazioni Generali SpA | 14,048 | 330,988 |
| Atlantia SpA | 3,995 | 89,779 |
| Banca Monte dei Paschi di Siena SpA* | 77,576 | 18,748 |
| Enel Green Power SpA | 21,130 | 53,308 |
| Enel SpA | 79,194 | 346,339 |
| ENI SpA | 30,606 | 737,562 |
| Exor SpA | 1,189 | 47,362 |
| Fiat SpA* | 10,568 | 86,566 |
| Finmeccanica SpA* | 4,886 | 37,061 |
| Intesa Sanpaolo SpA | 139,878 | 345,759 |
www.calvert.com CALVERT VP EAFE INTERNATIONAL INDEX PORTFOLIO ANNUAL REPORT 13
| | |
| EQUITY SECURITIES - CONT’D | SHARES | VALUE |
| Italy - Cont’d | | |
| Luxottica Group SpA | 2,011 | $107,925 |
| Mediobanca SpA* | 6,238 | 54,664 |
| Pirelli & C. SpA | 2,872 | 49,781 |
| Prysmian SpA | 2,461 | 63,444 |
| Saipem SpA | 3,197 | 68,542 |
| Snam SpA | 24,498 | 137,246 |
| Telecom Italia SpA | 121,502 | 120,704 |
| Telecom Italia SpA - RSP | 72,761 | 57,044 |
| Terna Rete Elettrica Nazionale SpA | 18,202 | 91,089 |
| UniCredit SpA | 52,239 | 387,239 |
| Unione di Banche Italiane SCPA | 10,343 | 70,343 |
| | | 3,301,493 |
| |
| Japan - 20.5% | | |
| ABC-Mart, Inc | 318 | 13,883 |
| Acom Co. Ltd.* | 4,728 | 16,036 |
| Advantest Corp. | 1,807 | 22,438 |
| Aeon Co. Ltd. | 7,302 | 98,858 |
| Aeon Financial Service Co. Ltd. | 803 | 21,514 |
| Aeon Mall Co. Ltd | 1,359 | 38,102 |
| Air Water, Inc | 1,799 | 24,339 |
| Aisin Seiki Co. Ltd | 2,312 | 93,794 |
| Ajinomoto Co., Inc | 7,284 | 105,327 |
| Alfresa Holdings Corp | 496 | 24,599 |
| Amada Co. Ltd. | 4,308 | 37,941 |
| ANA Holdings, Inc. | 14,011 | 27,954 |
| Aozora Bank Ltd. | 12,950 | 36,664 |
| Asahi Glass Co. Ltd. | 12,179 | 75,674 |
| Asahi Group Holdings Ltd | 4,671 | 131,536 |
| Asahi Kasei Corp | 15,242 | 119,324 |
| Asics Corp | 1,931 | 32,931 |
| Astellas Pharma, Inc. | 5,223 | 309,147 |
| Bank of Kyoto Ltd. | 3,891 | 32,457 |
| Benesse Holdings, Inc. | 865 | 34,722 |
| Bridgestone Corp. | 7,826 | 295,924 |
| Brother Industries Ltd | 2,848 | 38,882 |
| Calbee, Inc | 872 | 21,167 |
| Canon, Inc. | 13,639 | 431,503 |
| Casio Computer Co. Ltd. | 2,695 | 32,953 |
| Central Japan Railway Co. | 1,734 | 203,951 |
| Chiba Bank Ltd. | 8,985 | 60,523 |
| Chiyoda Corp. | 1,885 | 27,329 |
| Chubu Electric Power Co., Inc. | 7,779 | 100,439 |
| Chugai Pharmaceutical Co. Ltd. | 2,703 | 59,707 |
| Chugoku Bank Ltd. | 1,904 | 24,167 |
| Chugoku Electric Power Co., Inc | 3,584 | 55,707 |
| Citizen Holdings Co. Ltd | 3,191 | 26,861 |
| Coca-Cola West Co. Ltd. | 737 | 15,593 |
| Credit Saison Co. Ltd. | 1,903 | 50,009 |
| Dai Nippon Printing Co. Ltd. | 6,766 | 71,739 |
| Daicel Corp | 3,525 | 28,668 |
| Daido Steel Co. Ltd. | 3,410 | 16,912 |
| Daihatsu Motor Co. Ltd. | 2,320 | 39,278 |
| Dai-ichi Life Insurance Co. Ltd. | 10,263 | 171,318 |
| Daiichi Sankyo Co. Ltd. | 8,132 | 148,571 |
| Daikin Industries Ltd | 2,821 | 175,550 |
14 www.calvert.com CALVERT VP EAFE INTERNATIONAL INDEX PORTFOLIO ANNUAL REPORT
| | |
| EQUITY SECURITIES - CONT’D | SHARES | VALUE |
| Japan - Cont’d | | |
| Dainippon Sumitomo Pharma Co. Ltd | 1,921 | $30,023 |
| Daito Trust Construction Co. Ltd | 875 | 81,718 |
| Daiwa House Industry Co. Ltd | 7,151 | 138,257 |
| Daiwa Securities Group, Inc. | 19,995 | 199,466 |
| Dena Co. Ltd | 1,274 | 26,774 |
| Denso Corp. | 5,850 | 308,465 |
| Dentsu, Inc. | 2,591 | 105,850 |
| Don Quijote Holdings Co. Ltd | 654 | 39,580 |
| East Japan Railway Co. | 4,039 | 321,570 |
| Eisai Co. Ltd. | 3,043 | 117,811 |
| Electric Power Development Co. Ltd. | 1,407 | 40,971 |
| FamilyMart Co. Ltd. | 707 | 32,275 |
| FANUC Corp. | 2,305 | 421,559 |
| Fast Retailing Co. Ltd. | 638 | 263,068 |
| Fuji Electric Co. Ltd. | 6,760 | 31,599 |
| Fuji Heavy Industries Ltd | 7,064 | 202,346 |
| FUJIFILM Holdings Corp | 5,592 | 158,375 |
| Fujitsu Ltd.* | 22,494 | 116,258 |
| Fukuoka Financial Group, Inc. | 9,343 | 40,921 |
| Gree, Inc. | 1,276 | 12,596 |
| GungHo Online Entertainment, Inc.* | 4,100 | 29,487 |
| Gunma Bank Ltd. | 4,587 | 25,581 |
| Hachijuni Bank Ltd. | 5,033 | 29,312 |
| Hakuhodo DY Holdings, Inc | 2,754 | 21,324 |
| Hamamatsu Photonics KK | 859 | 34,318 |
| Hankyu Hanshin Holdings, Inc | 13,816 | 74,557 |
| Hino Motors Ltd. | 3,121 | 48,985 |
| Hirose Electric Co. Ltd. | 362 | 51,520 |
| Hisamitsu Pharmaceutical Co., Inc. | 746 | 37,564 |
| Hitachi Chemical Co. Ltd | 1,257 | 20,027 |
| Hitachi Construction Machinery Co. Ltd. | 1,298 | 27,685 |
| Hitachi High-Technologies Corp. | 748 | 18,768 |
| Hitachi Ltd. | 58,153 | 439,787 |
| Hitachi Metals Ltd. | 2,330 | 32,895 |
| Hokkaido Electric Power Co., Inc.* | 2,209 | 25,373 |
| Hokuhoku Financial Group, Inc. | 13,872 | 27,677 |
| Hokuriku Electric Power Co. | 2,031 | 27,535 |
| Honda Motor Co. Ltd. | 19,614 | 806,884 |
| HOYA Corp. | 5,252 | 145,801 |
| Hulic Co. Ltd. | 3,231 | 47,734 |
| Ibiden Co. Ltd. | 1,366 | 25,515 |
| Idemitsu Kosan Co. Ltd | 1,060 | 24,099 |
| IHI Corp. | 15,942 | 68,763 |
| Iida Group Holdings Co., Ltd. | 1,592 | 31,793 |
| INPEX Corp | 10,594 | 135,677 |
| Isetan Mitsukoshi Holdings Ltd. | 4,290 | 60,933 |
| Isuzu Motors Ltd. | 14,341 | 89,108 |
| ITOCHU Corp. | 18,114 | 223,553 |
| Itochu Techno-Solutions Corp. | 301 | 12,197 |
| Iyo Bank Ltd | 3,127 | 30,630 |
| J Front Retailing Co. Ltd. | 5,827 | 44,067 |
| Japan Airlines Co. Ltd | 722 | 35,601 |
| Japan Exchange Group, Inc | 2,972 | 84,398 |
| Japan Petroleum Exploration Co. | 345 | 13,062 |
| Japan Prime Realty Investment Corp. | 9 | 28,816 |
| Japan Real Estate Investment Corp. | 14 | 75,018 |
www.calvert.com CALVERT VP EAFE INTERNATIONAL INDEX PORTFOLIO ANNUAL REPORT 15
| | |
| EQUITY SECURITIES - CONT’D | SHARES | VALUE |
| Japan - Cont’d | | |
| Japan Retail Fund Investment Corp. | 27 | $54,947 |
| Japan Steel Works Ltd. | 3,812 | 21,295 |
| Japan Tobacco, Inc. | 13,234 | 430,006 |
| JFE Holdings, Inc. | 5,935 | 141,080 |
| JGC Corp. | 2,502 | 98,055 |
| Joyo Bank Ltd. | 8,071 | 41,177 |
| JSR Corp | 2,155 | 41,685 |
| JTEKT Corp | 2,479 | 42,159 |
| JX Holdings, Inc. | 27,118 | 139,384 |
| Kajima Corp. | 10,213 | 38,327 |
| Kakaku.com, Inc. | 1,773 | 31,112 |
| Kamigumi Co. Ltd | 2,815 | 25,782 |
| Kaneka Corp | 3,380 | 22,158 |
| Kansai Electric Power Co., Inc.* | 8,500 | 97,634 |
| Kansai Paint Co. Ltd | 2,798 | 41,337 |
| Kao Corp. | 6,208 | 195,226 |
| Kawasaki Heavy Industries Ltd. | 17,159 | 71,893 |
| KDDI Corp. | 6,475 | 398,017 |
| Keikyu Corp. | 5,660 | 46,622 |
| Keio Corp. | 6,984 | 46,514 |
| Keisei Electric Railway Co. Ltd. | 3,330 | 30,593 |
| Keyence Corp | 548 | 234,288 |
| Kikkoman Corp. | 1,905 | 35,944 |
| Kinden Corp | 1,580 | 16,512 |
| Kintetsu Corp. | 21,577 | 75,644 |
| Kirin Holdings Co. Ltd | 10,486 | 150,732 |
| Kobe Steel Ltd.* | 30,090 | 51,458 |
| Koito Manufacturing Co. Ltd. | 1,164 | 22,195 |
| Komatsu Ltd. | 11,236 | 228,125 |
| Konami Corp. | 1,212 | 27,970 |
| Konica Minolta, Inc. | 5,777 | 57,575 |
| Kubota Corp. | 12,848 | 212,272 |
| Kuraray Co. Ltd. | 4,160 | 49,522 |
| Kurita Water Industries Ltd. | 1,290 | 26,742 |
| Kyocera Corp. | 3,912 | 195,126 |
| Kyowa Hakko Kirin Co. Ltd | 2,784 | 30,656 |
| Kyushu Electric Power Co., Inc.* | 5,152 | 65,688 |
| Lawson, Inc | 787 | 58,845 |
| LIXIL Group Corp. | 3,212 | 87,979 |
| M3, Inc. | 8 | 20,028 |
| Mabuchi Motor Co. Ltd. | 297 | 17,636 |
| Makita Corp. | 1,352 | 70,904 |
| Marubeni Corp. | 19,935 | 143,184 |
| Marui Group Co. Ltd. | 2,693 | 27,325 |
| Maruichi Steel Tube Ltd | 567 | 14,308 |
| Mazda Motor Corp.* | 32,594 | 168,459 |
| McDonald’s Holdings Company (Japan), Ltd. | 802 | 20,474 |
| Medipal Holdings Corp. | 1,623 | 21,403 |
| MEIJI Holdings Co. Ltd | 737 | 47,334 |
| Miraca Holdings, Inc. | 673 | 31,714 |
| Mitsubishi Chemical Holdings Corp. | 16,368 | 75,577 |
| Mitsubishi Corp | 16,909 | 324,027 |
| Mitsubishi Electric Corp. | 23,250 | 291,578 |
| Mitsubishi Estate Co. Ltd. | 15,055 | 449,841 |
| Mitsubishi Gas Chemical Co., Inc. | 4,670 | 34,341 |
| Mitsubishi Heavy Industries Ltd. | 36,530 | 225,937 |
16 www.calvert.com CALVERT VP EAFE INTERNATIONAL INDEX PORTFOLIO ANNUAL REPORT
| | |
| EQUITY SECURITIES - CONT’D | SHARES | VALUE |
| Japan - Cont’d | | |
| Mitsubishi Logistics Corp. | 1,486 | $23,450 |
| Mitsubishi Materials Corp. | 13,495 | 49,746 |
| Mitsubishi Motors Corp.* | 5,222 | 56,013 |
| Mitsubishi Tanabe Pharma Corp | 2,711 | 37,759 |
| Mitsubishi UFJ Financial Group, Inc | 153,368 | 1,011,234 |
| Mitsubishi UFJ Lease & Finance Co. Ltd. | 7,030 | 43,080 |
| Mitsui & Co. Ltd | 20,906 | 290,982 |
| Mitsui Chemicals, Inc. | 9,872 | 23,823 |
| Mitsui Fudosan Co. Ltd | 10,074 | 362,264 |
| Mitsui OSK Lines Ltd. | 13,108 | 59,030 |
| Mizuho Financial Group, Inc | 276,538 | 599,028 |
| MS&AD Insurance Group Holdings | 6,095 | 163,414 |
| Murata Manufacturing Co. Ltd | 2,439 | 216,429 |
| Nabtesco Corp. | 1,316 | 30,320 |
| Namco Bandai Holdings, Inc | 2,144 | 47,543 |
| NEC Corp. | 32,954 | 74,202 |
| Nexon Co. Ltd | 1,318 | 12,171 |
| NGK Insulators Ltd. | 3,260 | 61,883 |
| NGK Spark Plug Co. Ltd. | 2,159 | 51,075 |
| NHK Spring Co. Ltd. | 1,915 | 21,578 |
| Nidec Corp. | 1,226 | 119,973 |
| Nikon Corp. | 4,114 | 78,524 |
| Nintendo Co. Ltd. | 1,282 | 170,641 |
| Nippon Building Fund, Inc. | 16 | 93,031 |
| Nippon Electric Glass Co. Ltd. | 4,506 | 23,631 |
| Nippon Express Co. Ltd. | 9,619 | 46,516 |
| Nippon Meat Packers, Inc | 2,068 | 35,483 |
| Nippon Paint Co. Ltd. | 2,075 | 34,480 |
| Nippon Prologis REIT, Inc. | 3 | 28,673 |
| Nippon Steel & Sumitomo Metal Corp. | 91,469 | 305,896 |
| Nippon Telegraph & Telephone Corp | 4,513 | 242,683 |
| Nippon Yusen KK | 19,506 | 62,268 |
| Nishi-Nippon City Bank Ltd. | 8,177 | 21,986 |
| Nissan Motor Co. Ltd | 29,914 | 251,237 |
| Nisshin Seifun Group, Inc. | 2,500 | 25,818 |
| Nissin Foods Holdings Co. Ltd | 709 | 29,908 |
| Nitori Holdings Co. Ltd. | 414 | 39,215 |
| Nitto Denko Corp. | 1,993 | 83,977 |
| NKSJ Holdings, Inc | 4,012 | 111,454 |
| NOK Corp. | 1,149 | 18,776 |
| Nomura Holdings, Inc. | 43,691 | 335,813 |
| Nomura Real Estate Holdings, Inc | 1,496 | 33,657 |
| Nomura Real Estate Office Fund, Inc. | 4 | 18,583 |
| Nomura Research Institute Ltd. | 1,222 | 38,487 |
| NSK Ltd. | 5,657 | 70,299 |
| NTT Data Corp. | 1,524 | 56,179 |
| NTT DoCoMo, Inc | 18,380 | 301,226 |
| NTT Urban Development Corp. | 1,390 | 15,966 |
| Obayashi Corp. | 7,840 | 44,617 |
| Odakyu Electric Railway Co. Ltd | 7,563 | 68,333 |
| Oji Holdings Corp | 9,638 | 49,355 |
| Olympus Corp.* | 2,896 | 91,622 |
| Omron Corp | 2,468 | 108,915 |
| Ono Pharmaceutical Co. Ltd. | 996 | 87,152 |
| Oracle Corp. Japan | 460 | 16,804 |
| Oriental Land Co. Ltd. | 603 | 86,908 |
www.calvert.com CALVERT VP EAFE INTERNATIONAL INDEX PORTFOLIO ANNUAL REPORT 17
| | |
| EQUITY SECURITIES - CONT’D | SHARES | VALUE |
| Japan - Cont’d | | |
| ORIX Corp | 15,240 | $267,429 |
| Osaka Gas Co. Ltd | 22,640 | 88,835 |
| Otsuka Corp. | 191 | 24,334 |
| Otsuka Holdings Co. Ltd | 4,378 | 126,446 |
| Panasonic Corp. | 26,562 | 308,887 |
| Park24 Co. Ltd. | 1,182 | 22,269 |
| Rakuten, Inc. | 8,775 | 130,389 |
| Resona Holdings, Inc. | 22,369 | 113,912 |
| Ricoh Co. Ltd. | 8,094 | 85,973 |
| Rinnai Corp. | 408 | 31,747 |
| Rohm Co. Ltd | 1,163 | 56,573 |
| Sankyo Co. Ltd. | 648 | 29,859 |
| Sanrio Co. Ltd. | 537 | 22,576 |
| Santen Pharmaceutical Co. Ltd. | 896 | 41,755 |
| SBI Holdings, Inc. | 2,439 | 36,844 |
| Secom Co. Ltd. | 2,535 | 152,695 |
| Sega Sammy Holdings, Inc. | 2,250 | 57,225 |
| Sekisui Chemical Co. Ltd. | 5,143 | 63,032 |
| Sekisui House Ltd. | 6,538 | 91,310 |
| Seven & I Holdings Co. Ltd. | 9,065 | 359,999 |
| Seven Bank Ltd. | 7,189 | 28,072 |
| Sharp Corp.* | 17,287 | 54,856 |
| Shikoku Electric Power Co., Inc.* | 2,154 | 32,232 |
| Shimadzu Corp. | 2,859 | 24,854 |
| Shimamura Co. Ltd. | 267 | 25,012 |
| Shimano, Inc | 951 | 81,588 |
| Shimizu Corp | 7,140 | 36,021 |
| Shin-Etsu Chemical Co. Ltd. | 4,938 | 288,056 |
| Shinsei Bank Ltd | 19,925 | 48,651 |
| Shionogi & Co. Ltd. | 3,603 | 78,047 |
| Shiseido Co. Ltd. | 4,346 | 69,822 |
| Shizuoka Bank Ltd | 6,826 | 72,764 |
| Showa Denko KK | 18,076 | 25,589 |
| Showa Shell Sekiyu KK | 2,275 | 23,084 |
| SMC Corp. | 623 | 156,852 |
| Softbank Corp | 11,556 | 1,010,073 |
| Sojitz Corp | 15,111 | 26,847 |
| Sony Corp | 12,175 | 211,216 |
| Sony Financial Holdings, Inc. | 2,100 | 38,187 |
| Stanley Electric Co. Ltd. | 1,729 | 39,556 |
| Sumco Corp | 1,400 | 12,343 |
| Sumitomo Chemical Co. Ltd. | 17,989 | 70,414 |
| Sumitomo Corp. | 13,541 | 169,946 |
| Sumitomo Electric Industries Ltd | 9,107 | 151,762 |
| Sumitomo Heavy Industries Ltd. | 6,678 | 30,708 |
| Sumitomo Metal Mining Co. Ltd. | 6,320 | 82,681 |
| Sumitomo Mitsui Financial Group, Inc. | 15,311 | 788,424 |
| Sumitomo Mitsui Trust Holdings, Inc. | 39,919 | 210,110 |
| Sumitomo Realty & Development Co. Ltd | 4,295 | 213,414 |
| Sumitomo Rubber Industries, Inc. | 2,064 | 29,297 |
| Suntory Beverage & Food Ltd | 1,492 | 47,557 |
| Suruga Bank Ltd. | 2,181 | 39,080 |
| Suzuken Co. Ltd. | 850 | 27,498 |
| Suzuki Motor Corp. | 4,403 | 118,300 |
| Sysmex Corp. | 874 | 51,566 |
| T&D Holdings, Inc. | 6,994 | 97,612 |
18 www.calvert.com CALVERT VP EAFE INTERNATIONAL INDEX PORTFOLIO ANNUAL REPORT
| | |
| EQUITY SECURITIES - CONT’D | SHARES | VALUE |
| Japan - Cont’d | | |
| Taiheiyo Cement Corp | 14,198 | $54,496 |
| Taisei Corp | 11,702 | 53,143 |
| Taisho Pharmaceutical Holdings Co. Ltd. | 380 | 26,102 |
| Taiyo Nippon Sanso Corp | 2,920 | 20,751 |
| Takashimaya Co. Ltd. | 3,195 | 31,782 |
| Takeda Pharmaceutical Co. Ltd. | 9,500 | 435,490 |
| TDK Corp. | 1,486 | 71,155 |
| Teijin Ltd. | 11,295 | 25,111 |
| Terumo Corp. | 1,834 | 88,341 |
| The Bank of Yokohama Ltd. | 14,236 | 79,258 |
| The Hiroshima Bank Ltd. | 6,039 | 24,958 |
| THK Co. Ltd | 1,373 | 34,229 |
| Tobu Railway Co. Ltd | 12,337 | 59,777 |
| Toho Co. Ltd. | 1,369 | 30,084 |
| Toho Gas Co. Ltd. | 4,944 | 24,049 |
| Tohoku Electric Power Co., Inc.* | 5,464 | 61,412 |
| Tokio Marine Holdings, Inc | 8,332 | 278,248 |
| Tokyo Electric Power Co., Inc.* | 17,463 | 85,776 |
| Tokyo Electron Ltd. | 2,071 | 113,334 |
| Tokyo Gas Co. Ltd | 28,775 | 141,613 |
| Tokyo Tatemono Co. Ltd | 4,967 | 55,118 |
| Tokyu Corp | 13,730 | 88,833 |
| Tokyu Fudosan Holdings Corp. | 6,321 | 59,454 |
| TonenGeneral Sekiyu KK | 3,412 | 31,282 |
| Toppan Printing Co. Ltd | 6,755 | 53,973 |
| Toray Industries, Inc. | 17,729 | 122,623 |
| Toshiba Corp. | 48,435 | 203,394 |
| TOTO Ltd | 3,406 | 53,943 |
| Toyo Seikan Group Holdings Ltd. | 1,972 | 42,323 |
| Toyo Suisan Kaisha Ltd | 1,071 | 32,154 |
| Toyoda Gosei Co. Ltd. | 784 | 18,227 |
| Toyota Boshoku Corp. | 793 | 9,892 |
| Toyota Industries Corp | 1,967 | 88,674 |
| Toyota Motor Corp | 33,187 | 2,024,232 |
| Toyota Tsusho Corp. | 2,565 | 63,434 |
| Trend Micro, Inc | 1,270 | 44,403 |
| Tsumura & Co | 726 | 19,230 |
| Ube Industries Ltd. | 12,823 | 27,411 |
| Unicharm Corp | 1,374 | 78,324 |
| United Urban Investment Corp. | 28 | 40,249 |
| USS Co. Ltd. | 2,647 | 36,314 |
| West Japan Railway Co. | 2,034 | 88,120 |
| Yahoo! Japan Corp. | 17,360 | 96,486 |
| Yakult Honsha Co. Ltd. | 1,062 | 53,577 |
| Yamada Denki Co. Ltd. | 11,086 | 36,232 |
| Yamaguchi Financial Group, Inc. | 2,553 | 23,625 |
| Yamaha Corp. | 1,905 | 30,207 |
| Yamaha Motor Co. Ltd. | 3,378 | 50,611 |
| Yamato Holdings Co. Ltd. | 4,456 | 90,005 |
| Yamato Kogyo Co. Ltd. | 505 | 16,121 |
| Yamazaki Baking Co. Ltd | 1,329 | 13,624 |
| Yaskawa Electric Corp. | 2,589 | 40,905 |
| Yokogawa Electric Corp. | 2,594 | 39,802 |
| Yokohama Rubber Co. Ltd. | 2,482 | 24,359 |
| | | 33,349,423 |
www.calvert.com CALVERT VP EAFE INTERNATIONAL INDEX PORTFOLIO ANNUAL REPORT 19
| | |
| EQUITY SECURITIES - CONT’D | SHARES | VALUE |
| Luxembourg - 0.3% | | |
| ArcelorMittal | 12,022 | $214,842 |
| Millicom International Cellular SA (SDR) | 798 | 79,516 |
| ProSiebenSat.1 Media AG | 2,237 | 110,961 |
| SES SA (FDR) | 3,668 | 118,920 |
| | | 524,239 |
| |
| Netherlands - 4.9% | | |
| Aegon NV | 21,602 | 204,243 |
| Airbus Group NV | 7,104 | 546,282 |
| Akzo Nobel NV | 2,885 | 223,957 |
| ASML Holding NV | 4,300 | 403,121 |
| CNH Industrial NV* | 11,399 | 130,125 |
| Corio NV | 827 | 37,119 |
| Delta Lloyd NV | 2,284 | 56,772 |
| Fugro NV (CVA) | 850 | 50,729 |
| Gemalto NV | 956 | 105,391 |
| Heineken Holding NV | 1,217 | 77,110 |
| Heineken NV | 2,772 | 187,456 |
| ING Groep NV (CVA)* | 46,179 | 642,640 |
| Koninklijke Ahold NV | 12,126 | 218,037 |
| Koninklijke Boskalis Westminster NV | 940 | 49,741 |
| Koninklijke DSM NV | 1,862 | 146,647 |
| Koninklijke KPN NV* | 38,670 | 124,839 |
| Koninklijke Philips NV | 11,738 | 430,935 |
| Koninklijke Vopak NV | 848 | 49,681 |
| OCI NV* | 1,095 | 49,389 |
| QIAGEN NV* | 2,856 | 66,642 |
| Randstad Holding NV | 1,497 | 97,254 |
| Reed Elsevier NV | 8,361 | 177,411 |
| Royal Dutch Shell plc: | | |
| Series A | 45,979 | 1,648,228 |
| Series B | 30,227 | 1,142,171 |
| Tenaris SA | 5,701 | 124,739 |
| TNT Express NV | 4,287 | 39,859 |
| Unilever NV (CVA) | 19,599 | 790,557 |
| Wolters Kluwer NV | 3,645 | 104,187 |
| Ziggo NV | 1,811 | 82,844 |
| | | 8,008,106 |
| |
| New Zealand - 0.1% | | |
| Auckland International Airport Ltd. | 12,777 | 37,108 |
| Contact Energy Ltd | 4,427 | 18,685 |
| Fletcher Building Ltd. | 8,284 | 58,001 |
| Ryman Healthcare Ltd. | 4,489 | 28,993 |
| Telecom Corp. of New Zealand Ltd | 21,940 | 41,608 |
| | | 184,395 |
| |
| Norway - 0.8% | | |
| Aker Solutions ASA | 1,985 | 35,458 |
| DnB ASA | 11,758 | 210,224 |
| Gjensidige Forsikring ASA | 2,414 | 46,025 |
| Norsk Hydro ASA | 16,180 | 72,175 |
| Orkla ASA | 9,227 | 71,949 |
| Seadrill Ltd. | 4,516 | 184,257 |
| StatoilHydro ASA | 13,427 | 325,248 |
| Telenor ASA | 8,211 | 195,651 |
20 www.calvert.com CALVERT VP EAFE INTERNATIONAL INDEX PORTFOLIO ANNUAL REPORT
| | |
| EQUITY SECURITIES - CONT’D | SHARES | VALUE |
| Norway - Cont’d | | |
| Yara International ASA | 2,177 | $93,631 |
| | | 1,234,618 |
| Portugal - 0.2% | | |
| Banco Espirito Santo SA* | 21,831 | 31,253 |
| Energias de Portugal SA | 24,233 | 89,150 |
| Galp Energia SGPS SA, B Shares | 4,190 | 68,788 |
| Jeronimo Martins SGPS SA | 3,039 | 59,522 |
| Portugal Telecom SGPS SA | 7,577 | 32,990 |
| | | 281,703 |
| |
| Singapore - 1.4% | | |
| Ascendas Real Estate Investment Trust | 24,625 | 42,916 |
| CapitaCommercial Trust | 24,179 | 27,773 |
| CapitaLand Ltd | 30,944 | 74,274 |
| CapitaMall Trust | 29,225 | 44,103 |
| CapitaMalls Asia Ltd | 16,451 | 25,543 |
| City Developments Ltd | 4,940 | 37,568 |
| ComfortDelgro Corp. Ltd | 24,293 | 38,681 |
| DBS Group Holdings Ltd | 20,652 | 279,755 |
| Global Logistic Properties Ltd | 37,335 | 85,474 |
| Golden Agri-Resources Ltd. | 85,253 | 36,807 |
| Hutchison Port Holdings Trust | 63,108 | 42,598 |
| Jardine Cycle & Carriage Ltd | 1,288 | 36,680 |
| Keppel Corp. Ltd. | 17,454 | 154,720 |
| Keppel Land Ltd. | 8,399 | 22,223 |
| Olam International Ltd | 17,694 | 21,516 |
| Oversea-Chinese Banking Corp. Ltd | 31,051 | 250,897 |
| SembCorp Industries Ltd. | 11,870 | 51,623 |
| SembCorp Marine Ltd. | 10,093 | 35,580 |
| Singapore Airlines Ltd | 6,519 | 53,759 |
| Singapore Exchange Ltd | 10,351 | 59,530 |
| Singapore Press Holdings Ltd | 19,317 | 63,046 |
| Singapore Technologies Engineering Ltd | 18,733 | 58,766 |
| Singapore Telecommunications Ltd | 95,911 | 278,080 |
| StarHub Ltd | 7,273 | 24,717 |
| United Overseas Bank Ltd. | 15,308 | 257,569 |
| UOL Group Ltd. | 5,580 | 27,362 |
| Wilmar International Ltd | 23,221 | 62,911 |
| Yangzijiang Shipbuilding Holdings Ltd | 23,165 | 21,746 |
| | | 2,216,217 |
| |
| Spain - 3.3% | | |
| Abertis Infraestructuras SA | 4,631 | 103,050 |
| ACS Actividades de Construccion y Servicios SA | 1,746 | 60,191 |
| Amadeus IT Holding SA | 4,593 | 196,847 |
| Banco Bilbao Vizcaya Argentaria SA | 69,711 | 859,468 |
| Banco de Sabadell SA | 41,035 | 107,200 |
| Banco Popular Espanol SA* | 15,516 | 93,746 |
| Banco Santander SA | 136,708 | 1,225,491 |
| Bankia SA* | 48,672 | 82,755 |
| CaixaBank SA | 20,891 | 109,036 |
| Distribuidora Internacional de Alimentacion SA | 7,382 | 66,113 |
| Enagas SA | 2,306 | 60,353 |
| Ferrovial SA | 4,871 | 94,397 |
| Gas Natural SDG SA | 4,228 | 108,909 |
| Grifols SA | 1,800 | 86,222 |
www.calvert.com CALVERT VP EAFE INTERNATIONAL INDEX PORTFOLIO ANNUAL REPORT 21
| | |
| EQUITY SECURITIES - CONT’D | SHARES | VALUE |
| Spain - Cont’d | | |
| Iberdrola SA | 56,306 | $359,589 |
| Inditex SA | 2,624 | 433,135 |
| International Consolidated Airlines Group SA* | 11,432 | 76,222 |
| Mapfre SA | 12,967 | 55,619 |
| Red Electrica de Espana SA | 1,306 | 87,274 |
| Repsol SA: | | |
| Common | 10,185 | 257,092 |
| Rights* | 10,185 | 6,961 |
| Telefonica Deutschland Holding AG | 3,371 | 27,868 |
| Telefonica SA | 49,279 | 803,586 |
| Zardoya Otis SA | 2,012 | 36,455 |
| | | 5,397,579 |
| |
| Sweden - 3.1% | | |
| Alfa Laval AB | 3,798 | 97,492 |
| Assa Abloy AB, Series B | 4,019 | 212,458 |
| Atlas Copco AB: | | |
| Series A | 8,079 | 224,099 |
| Series B | 4,711 | 119,609 |
| Boliden AB | 3,302 | 50,574 |
| Electrolux AB, Series B | 2,904 | 76,125 |
| Elekta AB, Series B | 4,450 | 68,087 |
| Getinge AB, Series B | 2,416 | 82,690 |
| Hennes & Mauritz AB, B Shares | 11,423 | 526,376 |
| Hexagon AB, B Shares | 2,855 | 90,297 |
| Husqvarna AB, Series B | 4,876 | 29,372 |
| Industrivarden AB, C Shares | 1,487 | 28,292 |
| Investment AB Kinnevik, Series B | 2,700 | 125,131 |
| Investor AB, Series B | 5,480 | 188,666 |
| Lundin Petroleum AB* | 2,687 | 52,420 |
| Nordea Bank AB | 36,544 | 492,624 |
| Sandvik AB | 12,828 | 181,008 |
| Scania AB, Series B | 3,863 | 75,663 |
| Securitas AB, Series B | 3,780 | 40,194 |
| Skandinaviska Enskilda Banken AB | 18,275 | 241,093 |
| Skanska AB, Series B | 4,587 | 93,768 |
| SKF AB, Series B | 4,736 | 124,296 |
| Svenska Cellulosa AB SCA, Series B | 7,046 | 217,039 |
| Svenska Handelsbanken AB | 6,003 | 295,112 |
| Swedbank AB | 10,895 | 306,787 |
| Swedish Match AB | 2,439 | 78,430 |
| Tele2 AB, B Shares | 3,845 | 43,577 |
| Telefonaktiebolaget LM Ericsson, Series B | 36,615 | 447,157 |
| TeliaSonera AB | 28,653 | 238,704 |
| Volvo AB, Series B | 18,276 | 240,111 |
| | | 5,087,251 |
| |
| Switzerland - 9.2% | | |
| ABB Ltd.* | 26,457 | 697,636 |
| Actelion Ltd.* | 1,230 | 104,083 |
| Adecco SA* | 1,599 | 126,778 |
| Aryzta AG* | 1,053 | 80,886 |
| Baloise Holding AG | 573 | 73,101 |
| Barry Callebaut AG* | 26 | 32,644 |
| Cie Financiere Richemont SA | 6,280 | 626,272 |
| Coca-Cola HBC AG* | 2,406 | 70,259 |
22 www.calvert.com CALVERT VP EAFE INTERNATIONAL INDEX PORTFOLIO ANNUAL REPORT
| | |
| EQUITY SECURITIES - CONT’D | SHARES | VALUE |
| Switzerland - Cont’d | | |
| Credit Suisse Group AG* | 18,222 | $558,048 |
| EMS-Chemie Holding AG | 98 | 34,888 |
| Geberit AG | 454 | 137,916 |
| Givaudan SA* | 99 | 141,643 |
| Glencore Xstrata plc* | 127,661 | 661,588 |
| Holcim Ltd.* | 2,754 | 206,446 |
| Julius Baer Group Ltd.* | 2,702 | 129,995 |
| Kuehne + Nagel International AG | 652 | 85,742 |
| Lindt & Spruengli AG: | | |
| Participation Certificate | 10 | 45,157 |
| Registered Shares | 1 | 54,018 |
| Lonza Group AG* | 638 | 60,615 |
| Nestle SA | 38,798 | 2,845,201 |
| Novartis AG | 27,675 | 2,212,881 |
| Pargesa Holding SA | 326 | 26,323 |
| Partners Group Holding AG | 209 | 55,838 |
| Roche Holding AG | 8,452 | 2,365,364 |
| Schindler Holding AG: | | |
| Participation Certificates | 555 | 81,837 |
| Registered Shares | 259 | 38,278 |
| SGS SA | 65 | 149,789 |
| Sika AG | 25 | 89,028 |
| Sonova Holding AG* | 602 | 81,128 |
| STMicroelectronics NV* | 7,696 | 61,927 |
| Sulzer AG | 289 | 46,703 |
| Swatch Group AG: | | |
| Bearer Shares | 371 | 245,611 |
| Registered Shares | 524 | 59,082 |
| Swiss Life Holding AG* | 387 | 80,490 |
| Swiss Prime Site AG* | 652 | 50,559 |
| Swiss Re AG* | 4,237 | 390,416 |
| Swisscom AG | 281 | 148,602 |
| Syngenta AG | 1,120 | 446,767 |
| Transocean Ltd.* | 4,336 | 211,529 |
| UBS AG* | 43,883 | 833,848 |
| Zurich Insurance Group AG* | 1,790 | 519,642 |
| | | 14,968,558 |
| |
| United Kingdom - 19.5% | | |
| 3i Group plc | 11,729 | 74,858 |
| Aberdeen Asset Management plc | 11,579 | 95,949 |
| Admiral Group plc | 2,315 | 50,260 |
| Aggreko plc | 3,247 | 91,966 |
| AMEC plc | 3,589 | 64,715 |
| Anglo American plc | 16,773 | 366,932 |
| Antofagasta plc | 4,761 | 65,017 |
| ARM Holdings plc | 16,834 | 306,610 |
| Associated British Foods plc | 4,301 | 174,281 |
| AstraZeneca plc | 15,069 | 892,690 |
| Aviva plc | 35,454 | 264,234 |
| Babcock International Group plc | 4,371 | 98,157 |
| BAE Systems plc | 38,860 | 280,152 |
| Barclays plc | 183,857 | 828,649 |
| BG Group plc | 40,962 | 880,825 |
| BHP Billiton plc | 25,411 | 787,104 |
| BP plc | 226,785 | 1,834,340 |
www.calvert.com CALVERT VP EAFE INTERNATIONAL INDEX PORTFOLIO ANNUAL REPORT 23
| | |
| EQUITY SECURITIES - CONT’D | SHARES | VALUE |
| United Kingdom - Cont’d | | |
| British American Tobacco plc | 22,894 | $1,228,569 |
| British Land Co. plc | 11,381 | 118,640 |
| British Sky Broadcasting Group plc | 12,448 | 174,118 |
| BT Group plc | 95,153 | 598,303 |
| Bunzl plc | 4,016 | 96,508 |
| Burberry Group plc | 5,340 | 134,166 |
| Capita plc | 7,941 | 136,607 |
| Carnival plc | 2,216 | 91,851 |
| Centrica plc | 61,916 | 356,787 |
| Cobham plc | 13,023 | 59,245 |
| Compass Group plc | 21,755 | 349,008 |
| Croda International plc | 1,639 | 66,740 |
| Diageo plc | 30,210 | 1,001,341 |
| Direct Line Insurance Group plc | 13,535 | 55,989 |
| easyJet plc | 1,914 | 48,723 |
| Experian plc | 12,084 | 223,099 |
| Fresnillo plc | 2,224 | 27,478 |
| G4S plc | 18,734 | 81,501 |
| GKN plc | 19,759 | 122,243 |
| GlaxoSmithKline plc | 58,939 | 1,574,107 |
| Hammerson plc | 8,607 | 71,607 |
| Hargreaves Lansdown plc | 2,577 | 57,827 |
| HSBC Holdings plc | 224,456 | 2,464,068 |
| ICAP plc | 6,633 | 49,644 |
| IMI plc | 3,802 | 96,091 |
| Imperial Tobacco Group plc | 11,662 | 451,875 |
| Inmarsat plc | 5,412 | 67,808 |
| InterContinental Hotels Group plc | 3,162 | 105,489 |
| Intertek Group plc | 1,947 | 101,579 |
| Intu Properties plc | 8,082 | 41,509 |
| Invensys plc | 7,878 | 66,391 |
| Investec plc | 6,942 | 50,346 |
| ITV plc | 45,101 | 145,007 |
| J Sainsbury plc | 14,905 | 90,163 |
| Johnson Matthey plc | 2,474 | 134,485 |
| Kingfisher plc | 28,548 | 182,012 |
| Land Securities Group plc | 9,457 | 151,010 |
| Legal & General Group plc | 71,174 | 262,690 |
| Lloyds TSB Group plc* | 601,052 | 785,742 |
| London Stock Exchange Group plc | 2,127 | 61,090 |
| Marks & Spencer Group plc | 19,504 | 139,833 |
| Meggitt plc | 9,525 | 83,270 |
| Melrose Industries plc | 15,293 | 77,480 |
| National Grid plc | 44,876 | 586,059 |
| Next plc | 1,892 | 170,891 |
| Old Mutual plc | 58,913 | 184,631 |
| Pearson plc | 9,870 | 219,355 |
| Persimmon plc* | 3,668 | 75,319 |
| Petrofac Ltd | 3,132 | 63,534 |
| Prudential plc | 30,791 | 683,801 |
| Randgold Resources Ltd | 1,057 | 66,392 |
| Reckitt Benckiser Group plc | 7,781 | 618,079 |
| Reed Elsevier plc | 14,164 | 211,031 |
| Resolution Ltd. | 17,122 | 100,452 |
| Rexam plc | 9,557 | 84,025 |
| Rio Tinto plc | 15,296 | 864,310 |
24 www.calvert.com CALVERT VP EAFE INTERNATIONAL INDEX PORTFOLIO ANNUAL REPORT
| | |
| EQUITY SECURITIES - CONT’D | SHARES | VALUE |
| United Kingdom - Cont’d | | |
| Rolls-Royce Holdings plc* | 22,622 | $478,016 |
| Royal Bank of Scotland Group plc* | 25,863 | 144,919 |
| RSA Insurance Group plc | 44,134 | 66,853 |
| SABMiller plc | 11,574 | 594,821 |
| Sage Group plc | 13,399 | 89,646 |
| Schroders plc | 1,228 | 52,874 |
| Segro plc | 8,961 | 49,603 |
| Serco Group plc | 6,027 | 49,863 |
| Severn Trent plc | 2,884 | 81,493 |
| Shire plc | 6,655 | 314,557 |
| Smith & Nephew plc | 10,814 | 154,309 |
| Smiths Group plc | 4,753 | 116,582 |
| SSE plc | 11,602 | 263,424 |
| Standard Chartered plc | 29,159 | 657,223 |
| Standard Life plc | 28,591 | 170,392 |
| Subsea 7 SA | 3,185 | 60,934 |
| Tate & Lyle plc | 5,630 | 75,485 |
| Tesco plc | 97,231 | 538,775 |
| The Weir Group plc | 2,573 | 90,913 |
| Travis Perkins plc | 2,959 | 91,802 |
| TUI Travel plc | 5,399 | 36,963 |
| Tullow Oil plc | 10,965 | 155,373 |
| Unilever plc | 15,441 | 635,153 |
| United Utilities Group plc | 8,233 | 91,623 |
| Vodafone Group plc | 582,925 | 2,289,614 |
| Whitbread plc | 2,164 | 134,526 |
| William Hill plc | 10,454 | 69,631 |
| William Morrison Supermarkets plc | 26,652 | 115,285 |
| Wolseley plc | 3,204 | 181,867 |
| WPP plc | 16,062 | 367,350 |
| | | 31,586,526 |
| |
| United States - 0.1% | | |
| Perrigo Co. plc | 447 | 68,597 |
| REA Group Ltd. | 633 | 21,341 |
| Sky Deutschland AG* | 5,276 | 58,156 |
| | | 148,094 |
| |
| |
| Total Equity Securities (Cost $119,843,323) | | 159,557,088 |
| |
| EXCHANGE TRADED PRODUCTS - 1.3% | | |
| iShares MSCI EAFE ETF | 32,586 | 2,185,217 |
| |
| Total Exchange Traded Products (Cost $2,163,507) | | 2,185,217 |
www.calvert.com CALVERT VP EAFE INTERNATIONAL INDEX PORTFOLIO ANNUAL REPORT 25
| | |
| | PRINCIPAL | |
| TIME DEPOSIT - 0.1% | AMOUNT | VALUE |
| State Street Bank Time Deposit, 0.083%, 1/2/14 | $104,013 | $104,013 |
| |
| Total Time Deposit (Cost $104,013) | | 104,013 |
| |
| |
| TOTAL INVESTMENTS (Cost $122,110,843) - 99.7% | | 161,846,318 |
| Other assets and liabilities, net - 0.3% | | 466,743 |
| NET ASSETS - 100% | | $162,313,061 |
| |
| |
| |
| NET ASSETS CONSISTS OF: | | |
| Paid-in capital applicable to the following shares of common stock outstanding; | | |
| with 20,000,000 shares of $0.10 par value shares authorized: | | |
| Class I: 1,851,623 shares outstanding | | $140,175,152 |
| Class F: 36,234 shares outstanding | | 2,085,934 |
| Undistributed net investment income | | 226,739 |
| Accumulated net realized gain (loss) on investments and foreign currency transactions | | (19,917,770) |
| Net unrealized appreciation (depreciation) on investments, foreign currencies, | | |
| and assets and liabilities denominated in foreign currencies | | 39,743,006 |
| |
| NET ASSETS | | $162,313,061 |
| |
| NET ASSET VALUE PER SHARE | | |
| Class I (based on net assets of $159,182,079) | | $85.97 |
| Class F (based on net assets of $3,130,982) | | $86.41 |
(b) This security was valued under the direction of the Board of Directors. See Note A.
* Non-income producing security.
Abbreviations:
CVA: Certificaten Van Aandelen
ETF: Exchange Traded Fund
FDR: Fiduciary Depositary Receipts
plc: Public Limited Company
REIT: Real Estate Investment Trust
SDR: Swedish Depositary Receipts
See notes to financial statements.
26 www.calvert.com CALVERT VP EAFE INTERNATIONAL INDEX PORTFOLIO ANNUAL REPORT
| |
| STATEMENT OF OPERATIONS |
| YEAR ENDED DECEMBER 31, 2013 |
| |
| |
| NET INVESTMENT INCOME | |
| Investment Income: | |
| Dividend income (net of foreign taxes withheld of $330,769) | $4,745,107 |
| Interest income | 220 |
| Total investment income | 4,745,327 |
| |
| |
| Expenses: | |
| Investment advisory fee | 853,014 |
| Transfer agency fees and expenses | 24,691 |
| Administrative fees | 152,323 |
| Distribution Plan expenses: | |
| Class F | 5,192 |
| Directors’ fees and expenses | 26,430 |
| Custodian fees | 216,995 |
| Reports to shareholders | 34,591 |
| Professional fees | 40,474 |
| Accounting fees | 24,314 |
| Miscellaneous | 107,201 |
| Total expenses | 1,485,225 |
| Reimbursement from Advisor: | |
| Class F | (1,911) |
| Net expenses | 1,483,314 |
| |
| |
| NET INVESTMENT INCOME | 3,262,013 |
| |
| |
| REALIZED AND UNREALIZED GAIN (LOSS) | |
| Net realized gain (loss) on: | |
| Investments | 1,277,208 |
| Foreign currency transactions | (22,350) |
| | 1,254,858 |
| |
| Change in unrealized appreciation (depreciation) on: | |
| Investments and foreign currencies | 24,337,267 |
| Assets and liabilities denominated in foreign currencies | 10,633 |
| | 24,347,900 |
| |
| NET REALIZED AND UNREALIZED | |
| GAIN (LOSS) | 25,602,758 |
| |
| INCREASE (DECREASE) IN NET ASSETS | |
| RESULTING FROM OPERATIONS | $28,864,771 |
See notes to financial statements.
www.calvert.com CALVERT VP EAFE INTERNATIONAL INDEX PORTFOLIO ANNUAL REPORT 27
| | |
| STATEMENTS OF CHANGES IN NET ASSETS |
| |
| | YEAR ENDED | YEAR ENDED |
| | DECEMBER 31, | DECEMBER 31, |
| INCREASE (DECREASE) IN NET ASSETS | 2013 | 2012 |
| Operations: | | |
| Net investment income | $3,262,013 | $3,393,476 |
| Net realized gain (loss) | 1,254,858 | (1,295,766) |
| Change in unrealized appreciation (depreciation) | 24,347,900 | 19,693,053 |
| |
| |
| INCREASE (DECREASE) IN NET ASSETS | | |
| RESULTING FROM OPERATIONS | 28,864,771 | 21,790,763 |
| |
| Distributions to shareholders from: | | |
| Net investment income: | | |
| Class I shares | (3,511,567) | (3,204,401) |
| Class F shares | (62,016) | (101,535) |
| Total distributions | (3,573,583) | (3,305,936) |
| |
| Capital share transactions: | | |
| Shares sold: | | |
| Class I shares | 16,622,125 | 16,979,320 |
| Class F shares | 916,016 | 1,337,754 |
| Reinvestment of distributions: | | |
| Class I shares | 3,511,567 | 3,204,401 |
| Class F shares | 62,016 | 101,535 |
| Shares redeemed: | | |
| Class I shares | (28,260,195) | (18,055,241) |
| Class F shares | (423,507) | (6,216,322) |
| Total capital share transactions | (7,571,978) | (2,648,553) |
| |
| |
| TOTAL INCREASE (DECREASE) IN NET ASSETS | 17,719,210 | 15,836,274 |
| |
| |
| NET ASSETS | | |
| Beginning of year | 144,593,851 | 128,757,577 |
| End of year (including undistributed net investment income | | |
| of $226,739 and $548,014, respectively) | $162,313,061 | $144,593,851 |
| |
| |
| CAPITAL SHARE ACTIVITY | | |
| Shares sold: | | |
| Class I shares | 207,500 | 248,487 |
| Class F shares | 11,357 | 19,684 |
| Reinvestment of distributions: | | |
| Class I shares | 42,140 | 44,389 |
| Class F shares | 740 | 1,400 |
| Shares redeemed: | | |
| Class I shares | (352,857) | (263,301) |
| Class F shares | (5,244) | (89,611) |
| Total capital share activity | (96,364) | (38,952) |
See notes to financial statements.
28 www.calvert.com CALVERT VP EAFE INTERNATIONAL INDEX PORTFOLIO ANNUAL REPORT
NOTES TO FINANCIAL STATEMENTS
NOTE A –- SIGNIFICANT ACCOUNTING POLICIES
General: Calvert VP EAFE International Index Portfolio (the “Portfolio”), a series of Calvert Variable Products, Inc. (the “Fund”), is registered under the Investment Company Act of 1940 as a diversified, open-end management investment company. The Fund is comprised of twelve separate portfolios. The operations of each series of the Fund are accounted for separately. Shares of the Portfolio are sold without sales charge to affiliated and unaffiliated insurance companies for allocation to certain of their variable separate accounts. The Portfolio offers Class F and Class I shares. Class F shares are subject to Distribution Plan Expenses, while Class I shares are not. Each class has different: (a) dividend rates, due to differences in Distribution Plan expenses and other class-specific expenses, (b) exchange privileges; and (c) class-specific voting rights.
Security Valuation: Net asset value per share is determined every business day as of the close of the regular session of the New York Stock Exchange (generally 4:00 p.m. Eastern time). The Portfolio uses independent pricing services approved by the Board of Directors (“the Board”) to value its investments wherever possible. Investments for which market quotations are not available or deemed not reliable are fair valued in good faith under the direction of the Board.
The Board has adopted Valuation Procedures (the “Procedures”) to determine the fair value of securities and other financial instruments for which market prices are not readily available or which may not be reliably priced. The Board has delegated the day-to-day responsibility for determining the fair value of assets of the Portfolio to Calvert Investment Management, Inc. (the “Advisor” or “Calvert”) and has provided these Procedures to govern Calvert in its valuation duties.
Calvert has chartered an internal Valuation Committee to oversee the implementation of these Procedures and to assist it in carrying out the valuation responsibilities that the Board has delegated.
The Valuation Committee meets on a regular basis to review illiquid securities and other investments which may not have readily available market prices. The Valuation Committee’s fair valuation determinations are subject to review, approval and ratification by the Board at its next regularly scheduled meeting covering the calendar quarter in which the fair valuation was determined.
The Valuation Committee utilizes various methods to measure the fair value of the Portfolio’s investments. Generally Accepted Accounting Principles (GAAP) establishes a disclosure hierarchy that categorizes the inputs to valuation techniques used to value assets and liabilities at measurement date. These inputs are summarized in the three broad levels listed below:
Level 1 – quoted prices in active markets for identical securities
Level 2 – other significant observable inputs (including quoted prices for similar securities, interest rates, prepayment speeds, credit risk, etc.)
Level 3 – significant unobservable inputs (including the Portfolio’s own assumptions in determining the fair value of investments) The inputs or methodologies used for valuing securities are not necessarily an indication of the risk associated with investing in those securities.
Changes in valuation techniques may result in transfers in or out of an investment’s assigned level within the hierarchy during the period. Valuation techniques used to value the Portfolio’s investments by major category are as follows: Equity securities, including restricted securities, for which market quotations are readily available, are valued at the last reported sale price or official closing price as reported by an independent pricing service on the primary market or exchange on which they are traded and are categorized as Level 1 in the hierarchy.
www.calvert.com CALVERT VP EAFE INTERNATIONAL INDEX PORTFOLIO ANNUAL REPORT 29
In the event there were no sales during the day or closing prices are not available, securities are valued at the last quoted bid price or may be valued using the last available price and are categorized as Level 2 in the hierarchy. Foreign securities are valued based on quotations from the principal market in which such securities are normally traded. If events occur after the close of the principal market in which foreign securities are traded, and before the close of business of the Portfolio, that are expected to materially affect the value of those securities, then they are valued at their fair value taking these events into account. The Portfolio has retained a third party fair value pricing service to quantitatively analyze the price movement of its holdings on foreign exchanges and to automatically fair value if the variation from the prior day’s closing price exceeds specified parameters. Such securities would be categorized as Level 2 in the hierarchy in these circumstances. Utilizing this technique may result in transfers between Level 1 and Level 2. For restricted securities and private placements where observable inputs are limited, assumptions about market activity and risk are used and such securities are categorized as Level 3 in the hierarchy.
Exchange traded funds are valued at the official closing price as reported by an independent pricing service on the primary market or exchange on which they are traded and are categorized as Level 1 in the hierarchy.
Short-term securities of sufficient credit quality with remaining maturities of sixty days or less for which quotations are not readily available are valued at amortized cost, which approximates fair value, and are categorized as Level 2 in the hierarchy.
If a market value cannot be determined for a security using the methodologies described above, or if, in the good faith opinion of the Advisor, the market value does not constitute a readily available market quotation, or if a significant event has occurred that would materially affect the value of the security, the security will be fair valued as determined in good faith by the Valuation Committee.
The Valuation Committee considers a number of factors, including significant unobservable valuation inputs when arriving at fair value. It considers all significant facts that are reasonably available and relevant to the determination of fair value.
The Valuation Committee primarily employs a market-based approach which may use related or comparable assets or liabilities, recent transactions, market multiples, book values, and other relevant information for the investment to determine the fair value of the investment. When more appropriate, the fund may employ an income-based or cost approach. An income-based valuation approach discounts anticipated future cash flows of the investment to calculate a present amount (discounted). The measurement is based on the value indicated by current market expectations about those future amounts. Discounts may also be applied due to the nature or duration of any restrictions on the disposition of the investments. A cost based approach is based on the amount that currently would be required to replace the service capacity of an asset (current replacement cost). From the seller’s perspective, the price that would be received for the asset is determined based on the cost to a buyer to acquire or construct a substitute asset of comparable utility, adjusted for obsolescence.
The values assigned to fair value investments are based on available information and do not necessarily represent amounts that might ultimately be realized. Further, due to the inherent uncertainty of valuations of such investments, the fair values may differ significantly from the values that would have been used had an active market existed, and the differences could be material. The Valuation Committee employs various methods for calibrating these valuation approaches including a regular review of key inputs and assumptions, transactional back-testing or disposition analysis and reviews of any related market activity.
At December 31, 2013, securities valued at $0 or 0% of net assets were fair valued in good faith under the direction of the Board.
30 www.calvert.com CALVERT VP EAFE INTERNATIONAL INDEX PORTFOLIO ANNUAL REPORT
The following is a summary of the inputs used to value the Portfolio’s net assets as of December 31, 2013:
| | | VALUATION INPUTS | |
| INVESTMENTS IN SECURITIES | LEVEL 1 | LEVEL 2 | LEVEL 3 | TOTAL |
| Equity securities* | $159,557,088 | — | ** | $159,557,088 |
| Exchange traded products | 2,185,217 | — | — | 2,185,217 |
| Other debt obligations | — | $104,013 | — | 104,013 |
| TOTAL | $161,742,305 | $104,013 | ** | $162,846,318 |
* For further breakdown of equity securities by industry type, please refer to the Statement of Net Assets.
** Level 3 securities represent 0.0% of net assets.
During the year ended December 31, 2013, securities valued at $142,702,807 were transferred out of Level 2 and into Level 1. On December 31, 2012, price movements had exceeded specified parameters and the third party fair pricing service had quantitatively fair valued securities valued at $142,702,807, which were classified as Level 2. On December 31, 2013, price movements did not exceed specified parameters and these securities were not fair valued.
Security Transactions and Investment Income: Security transactions are accounted for on trade date. Realized gains and losses are recorded on an identified cost basis and may include proceeds from litigation. Dividend income is recorded on the ex-dividend date or, in the case of dividends on certain foreign securities, as soon as the Portfolio is informed of the ex-dividend date. Withholding taxes on foreign dividends have been provided for in accordance with the Portfolio’s understanding of the applicable country’s tax rules and rates. Distributions received on securities that represent a return of capital or capital gain are recorded as a reduction of cost of investments and/or as a realized gain. Interest income, which includes amortization of premium and accretion of discount on debt securities, is accrued as earned. Investment income and realized and unrealized gains and losses are allocated to separate classes of shares based upon the relative net assets of each class. Expenses arising in connection with a specific class are charged directly to that class. Expenses common to the classes are allocated to each class in proportion to their relative net assets.
Foreign Currency Transactions: The Portfolio’s accounting records are maintained in U.S. dollars. For valuation of assets and liabilities on each date of net asset value determination, foreign denominations are translated into U.S. dollars using the current exchange rate. Security transactions, income and expenses are translated at the prevailing rate of exchange on the date of the event. The effect of changes in foreign exchange rates on securities and foreign currencies is included with the net realized and unrealized gain or loss on investments and foreign currencies.
Distributions to Shareholders: Distributions to shareholders are recorded by the Portfolio on ex-dividend date. Dividends from net investment income and distributions from net realized capital gains, if any, are paid at least annually. Distributions are determined in accordance with income tax regulations which may differ from generally accepted accounting principles; accordingly, periodic reclassifications are made within the Portfolio’s capital accounts to reflect income and gains available for distribution under income tax regulations.
Estimates: The preparation of financial statements in conformity with accounting principles generally accepted in the United States requires management to make estimates and assumptions that affect the reported amounts of assets and liabilities and disclosure of contingent assets and liabilities at the date of the financial statements and the reported amounts of income and expenses during the reporting period. Actual results could differ from those estimates.
Federal Income Taxes: No provision for federal income or excise tax is required since the Portfolio intends to continue to qualify as a regulated investment company under the Internal Revenue Code and to distribute substantially all of its taxable earnings.
www.calvert.com CALVERT VP EAFE INTERNATIONAL INDEX PORTFOLIO ANNUAL REPORT 31
Management has analyzed the Portfolio’s tax positions taken for all open federal income tax years and has concluded that no provision for federal income tax is required in the Portfolio’s financial statements. A Portfolio’s federal tax return is subject to examination by the Internal Revenue Service for a period of three years.
NOTE B — RELATED PARTY TRANSACTIONS
Calvert Investment Management, Inc. (the “Advisor”) is wholly-owned by Calvert Investments, Inc., which is indirectly wholly-owned by Ameritas Mutual Holding Company. The Advisor provides investment advisory services and pays the salaries and fees of officers and Directors of the Fund who are employees of the Advisor or its affiliates. For its services, the Advisor receives an annual fee, payable monthly, of .56% of the Portfolio’s average daily net assets. Under the terms of the agreement, $74,885 was payable at year end. In addition, $29,974 was payable at year end for operating expenses paid by the Advisor during December 2013.
The Advisor has contractually agreed to limit net annual portfolio operating expenses through April 30, 2014. The contractual expense caps are 1.19% for Class F and .99% for Class I, respectively. For the purpose of this expense limit, operating expenses do not include interest expense, brokerage commissions, taxes and extraordinary expenses. This expense limitation does not limit acquired fund fees and expenses, if any.
The Advisor further voluntarily reimbursed the Porfolio for expenses of $620 for the year ended December 31, 2013.
Calvert Investment Administrative Services, Inc., an affiliate of the Advisor, provides administrative services to the Portfolio for an annual fee, payable monthly, of .10% of the Portfolio’s average daily net assets. Under the terms of the agreement, $13,273 was payable at year end.
Calvert Investment Distributors, Inc. (“CID”), an affiliate of the Advisor, is the distributor and principal underwriter for the Portfolio. Pursuant to Rule 12b-1 under the Investment Company Act of 1940, the Portfolio has adopted a Distribution plan that permits the Portfolio to pay certain expenses associated with the distribution and servicing of its Class F shares. The expenses paid may not exceed .20% annually of the average daily net assets of Class F. Under the terms of the agreement, $522 was payable at year end.
Calvert Investment Services, Inc. (“CIS”), an affiliate of the Advisor, acts as shareholder servicing agent for the Portfolio. For its services, CIS received a fee of $10,410 for the year ended December 31, 2013. Under the terms of the agreement, $970 was payable at year end. Boston Financial Data Services, Inc. is the transfer and dividend disbursing agent.
Each Director of the Fund who is not an employee of the Advisor or its affiliates receives a fee of $1,500 for each Board and Committee meeting attended plus an annual fee of $40,000. Committee chairs receive an additional $5,000 annual retainer. Directors’ fees are allocated to each of the portfolios served.
NOTE C — INVESTMENT ACTIVITY AND TAX INFORMATION
During the year, the cost of purchases and proceeds from sales of investments, other than short-term securities, were $18,422,380 and $27,114,120, respectively.
| Capital Loss Carryforwards | |
| Expiration Date: | |
| 31-Dec-15 | ($186,055) |
| 31-Dec-16 | (15,302,273) |
| 31-Dec-17 | (15,978) |
| |
| No Expiration Date: | |
| Long-term | ($1,707,664) |
32 www.calvert.com CALVERT VP EAFE INTERNATIONAL INDEX PORTFOLIO ANNUAL REPORT
Under the Regulated Investment Company Modernization Act of 2010, capital losses incurred in taxable years beginning after December 22, 2010 can be carried forward to offset future capital gains for an unlimited period. These losses are required to be utilized prior to the losses incurred in pre-enactment taxable years and will retain their character as either long-term or short-term. Capital losses incurred in pre-enactment taxable years can be utilized until expiration. The Portfolio’s use of net capital losses acquired from reorganizations may be limited under certain tax provisions.
The tax character of dividends and distributions paid during the years ended December 31, 2013 and December 31, 2012 was as follows:
| Distributions paid from: | 2013 | 2012 |
| Ordinary income | $3,573,583 | $3,305,936 |
| Total | $3,573,583 | $3,305,936 |
As of December 31, 2013, the tax basis components of distributable earnings/(accumulated losses) and the federal tax cost were as follows:
| Unrealized appreciation | $43,784,604 |
| Unrealized (depreciation) | (7,183,431) |
| Net unrealized appreciation/(depreciation) | $36,601,173 |
| Undistributed ordinary income | $655,241 |
| Capital loss carryforward | ($17,211,970) |
| Federal income tax cost of investments | $125,245,145 |
The differences between the components of distributable earnings on a tax basis and the amounts reflected in the statement of net assets are primarily due to temporary book-tax differences that will reverse in a subsequent period. These differences are due to wash sales, passive foreign investment companies, and capital loss limitations under Internal Revenue Code Section 382.
Reclassifications, as shown in the table below, have been made to the Portfolio’s components of net assets to reflect income and gains available for distribution (or available capital loss carryovers, as applicable) under income tax law and regulations. These reclassifications are due to permanent book-tax differences and have no impact on net assets. The primary permanent differences causing such reclassifications for the Portfolio are due to foreign currency transactions and passive foreign investment companies.
| Undistributed net investment income | ($9,705) |
| Accumulated net realized gain (loss) | 9,705 |
NOTE D — LINE OF CREDIT
A financing agreement is in place with the Calvert Funds and State Street Corporation (“SSC”). Under the agreement, SSC provides an unsecured line of credit facility, in the aggregate amount of $50 million ($25 million committed and $25 million uncommitted), accessible by the Funds for temporary or emergency purposes only. Borrowings under the committed facility bear interest at the higher of the London Interbank Offered Rate (LIBOR) or the overnight Federal Funds Rate plus 1.25% per annum. A commitment fee of .11% per annum is incurred on the unused portion of the committed facility, which is allocated to all participating funds. The Portfolio had no loans outstanding pursuant to this line of credit at December 31, 2013.
www.calvert.com CALVERT VP EAFE INTERNATIONAL INDEX PORTFOLIO ANNUAL REPORT 33
For the year ended December 31, 2013, borrowing information by the Portfolio under the Agreement was as follows:
| | WEIGHTED | | MONTH OF |
| AVERAGE | AVERAGE | MAXIMUM | MAXIMUM |
| DAILY | INTEREST | AMOUNT | AMOUNT |
| BALANCE | RATE | BORROWED | BORROWED |
| $36,496 | 1.40% | $938,301 | October 2013 |
NOTE E — SUBSEQUENT EVENTS
In preparing the financial statements as of December 31, 2013, no subsequent events or transactions occurred that would have required recognition or disclosure in these financial statements.

34 www.calvert.com CALVERT VP EAFE INTERNATIONAL INDEX PORTFOLIO ANNUAL REPORT
| | | |
| FINANCIAL HIGHLIGHTS |
| |
| | YEARS ENDED |
| | DECEMBER
31, | DECEMBER
31, | DECEMBER
31, |
| CLASS I SHARES | 2013 (z) | 2012 (z) | 2011 (z) |
| Net asset value, beginning | $72.87 | $63.54 | $74.78 |
| Income from investment operations: | | | |
| Net investment income | 1.70 | 1.70 | 1.85 |
| Net realized and unrealized gain (loss) | 13.34 | 9.30 | (11.37) |
| Total from investment operations | 15.04 | 11.00 | (9.52) |
| Distributions from: | | | |
| Net investment income | (1.94) | (1.67) | (1.72) |
| Total distributions | (1.94) | (1.67) | (1.72) |
| Total increase (decrease) in net asset value | 13.10 | 9.33 | (11.24) |
| Net asset value, ending | $85.97 | $72.87 | $63.54 |
| |
| Total return* | 20.72% | 17.34% | (12.71%) |
| Ratios to average net assets:A | | | |
| Net investment income | 2.15% | 2.51% | 2.53% |
| Total expenses | .97% | .96% | 1.00% |
| Expenses before offsets | .97% | .96% | .95% |
| Net expenses | .97% | .96% | .95% |
| Portfolio turnover | 12% | 16% | 24% |
| Net assets, ending (in thousands) | $159,182 | $142,443 | $122,329 |
| |
| |
| | | YEARS ENDED |
| | | DECEMBER
31, | DECEMBER
31, |
| CLASS I SHARES | | 2010 (z) | 2009 |
| Net asset value, beginning | | $70.89 | $56.55 |
| Income from investment operations: | | | |
| Net investment income | | 1.27 | 1.33 |
| Net realized and unrealized gain (loss) | | 3.49 | 14.41 |
| Total from investment operations | | 4.76 | 15.74 |
| Distributions from: | | | |
| Net investment income | | (.87) | (1.40) |
| Total distributions | | (.87) | (1.40) |
| Total increase (decrease) in net asset value | | 3.89 | 14.34 |
| Net asset value, ending | | $74.78 | $70.89 |
| |
| Total return* | | 6.71% | 27.83% |
| Ratios to average net assets:A | | | |
| Net investment income | | 1.84% | 2.10% |
| Total expenses | | 1.07% | 1.05% |
| Expenses before offsets | | .95% | .95% |
| Net expenses | | .95% | .95% |
| Portfolio turnover | | 77% | 29% |
| Net assets, ending (in thousands) | | $182,192 | $81,899 |
See notes to financial highlights.
www.calvert.com CALVERT VP EAFE INTERNATIONAL INDEX PORTFOLIO ANNUAL REPORT 35
| | | |
| FINANCIAL HIGHLIGHTS |
| |
| | YEARS ENDED |
| | DECEMBER
31, | DECEMBER
31, | DECEMBER
31, |
| CLASS F SHARES | 2013 (z) | 2012 (z) | 2011 (z) |
| Net asset value, beginning | $73.19 | $65.66 | $76.90 |
| Income from investment operations: | | | |
| Net investment income | 1.49 | 1.80 | 1.67 |
| Net realized and unrealized gain (loss) | 13.44 | 9.36 | (11.60) |
| Total from investment operations | 14.93 | 11.16 | (9.93) |
| Distributions from: | | | |
| Net investment income | (1.71) | (3.63) | (1.31) |
| Total distributions | (1.71) | (3.63) | (1.31) |
| Total increase (decrease) in net asset value | 13.22 | 7.53 | (11.24) |
| Net asset value, ending | $86.41 | $73.19 | $65.66 |
| |
| Total return* | 20.47% | 17.05% | (12.90%) |
| Ratios to average net assets: A | | | |
| Net investment income | 1.85% | 2.66% | 2.24% |
| Total expenses | 1.26% | 1.25% | 1.25% |
| Expenses before offsets | 1.19% | 1.18% | 1.16% |
| Net expenses | 1.19% | 1.18% | 1.16% |
| Portfolio turnover | 12% | 16% | 24% |
| Net assets, ending (in thousands) | $3,131 | $2,150 | $6,429 |
| |
| |
| | | YEARS ENDED |
| | | DECEMBER
31, | DECEMBER
31, |
| CLASS F SHARES | | 2010 (z) | 2009 |
| Net asset value, beginning | | $73.19 | $57.91 |
| Income from investment operations: | | | |
| Net investment income | | 1.33 | .68 |
| Net realized and unrealized gain (loss) | | 3.42 | 15.23 |
| Total from investment operations | | 4.75 | 15.91 |
| Distributions from: | | | |
| Net investment income | | (1.04) | (.63) |
| Total distributions | | (1.04) | (.63) |
| Total increase (decrease) in net asset value | | 3.71 | 15.28 |
| Net asset value, ending | | $76.90 | $73.19 |
| |
| Total return* | | 6.50% | 27.47% |
| Ratios to average net assets:A | | | |
| Net investment income | | 1.86% | 1.67% |
| Total expenses | | 1.30% | 1.42% |
| Expenses before offsets | | 1.15% | 1.15% |
| Net expenses | | 1.15% | 1.15% |
| Portfolio turnover | | 77% | 29% |
| Net assets, ending (in thousands) | | $7,152 | $4,943 |
See notes to financial highlights.
36 www.calvert.com CALVERT VP EAFE INTERNATIONAL INDEX PORTFOLIO ANNUAL REPORT
A Total expenses do not reflect amounts reimbursed and/or waived by the Advisor or reductions from expense offset arrangements. Expenses before offsets reflect expenses after reimbursement and/or waiver by the Advisor but prior to reductions from expense offset arrangements. Net expenses are net of all reductions and represent the net expenses paid by the portfolio.
(z) Per share figures calculated using the Average Shares Method.
* Total return is not annualized for periods of less than one year and does not reflect charges and expenses of the variable annuity or variable universal life contract.
See notes to financial statements.
www.calvert.com CALVERT VP EAFE INTERNATIONAL INDEX PORTFOLIO ANNUAL REPORT 37
EXPLANATION OF FINANCIAL TABLES
SCHEDULE OF INVESTMENTS
The Schedule of Investments is a snapshot of all securities held in the fund at their market value, on the last day of the reporting period. Securities are listed by asset type (e.g., common stock, corporate bonds, U.S. government obligations) and may be further broken down into sub-groups and by industry classification.
STATEMENT OF ASSETS AND LIABILITIES
The Statement of Assets and Liabilities is often referred to as the fund’s balance sheet. It lists the value of what the fund owns, is due and owes on the last day of the reporting period. The fund’s assets include the market value of securities owned, cash, receivables for securities sold and shareholder subscriptions, and receivables for dividends and interest payments that have been earned, but not yet received. The fund’s liabilities typically include payables for securities purchased and shareholder redemptions, and expenses owed but not yet paid. The statement also reports the fund’s net asset value (NAV) per share on the last day of the reporting period. The NAV is calculated by dividing the fund’s net assets (assets minus liabilities) by the number of shares outstanding. This statement is accompanied by a Schedule of Investments. Alternatively, if certain conditions are met, a Statement of Net Assets may be presented in lieu of this statement and the Schedule of Investments.
STATEMENT OF NET ASSETS
The Statement of Net Assets provides a detailed list of the fund’s holdings, including each security’s market value on the last day of the reporting period. The Statement of Net Assets includes a Schedule of Investments. Other assets are added and other liabilities subtracted from the investments total to calculate the fund’s net assets. Finally, net assets are divided by the outstanding shares of the fund to arrive at its share price, or Net Asset Value (NAV) per share.
At the end of the Statement of Net Assets is a table displaying the composition of the fund’s net assets. Paid in Capital is the money invested by shareholders and represents the bulk of net assets. Undistributed Net Investment Income and Accumulated Net Realized Gains usually approximate the amounts the fund had available to distribute to shareholders as of the statement date. Accumulated Realized Losses will appear as negative balances. Unrealized Appreciation (Depreciation) is the difference between the market value of the fund’s investments and their cost, and reflects the gains (losses) that would be realized if the fund were to sell all of its investments at their statement-date values.
STATEMENT OF OPERATIONS
The Statement of Operations summarizes the fund’s investment income earned and expenses incurred in operating the fund. Investment income includes dividends earned from stocks and interest earned from interest-bearing securities in the fund. Expenses incurred in operating the fund include the advisory fee paid to the investment advisor, administrative services fees, distribution plan expenses (if applicable), transfer agent fees, shareholder servicing expenses, custodial, legal, and audit fees, and the printing and postage expenses related to shareholder reports. Expense offsets (fees paid indirectly) are also shown. Credits earned from offset arrangements are used to reduce the fund’s expenses. This statement also shows net gains (losses) realized on the sale of investments and the increase or decrease in the unrealized appreciation (depreciation) on investments held during the period.
STATEMENT OF CHANGES IN NET ASSETS
The Statement of Changes in Net Assets shows how the fund’s total net assets changed during the two most recent reporting periods. Changes in the fund’s net assets are attributable to investment operations, distributions and capital share transactions.
The Operations section of the report summarizes information detailed in the Statement of Operations. The Distribution section shows the dividend and capital gain distributions made to shareholders. The amounts
38 www.calvert.com CALVERT VP EAFE INTERNATIONAL INDEX PORTFOLIO ANNUAL REPORT (UNAUDITED)
shown as distributions in this section may not match the net investment income and realized gains amounts shown in the Operations section because distributions are determined on a tax basis and certain investments or transactions may be treated differently for financial statement and tax purposes. The Capital Share Transactions section shows the amount shareholders invested in the fund, either by purchasing shares or by reinvesting distributions, and the amounts redeemed. The corresponding numbers of shares issued, reinvested and redeemed are shown at the end of the report.
FINANCIAL HIGHLIGHTS
The Financial Highlights table provides a per-share breakdown by class of the components that affect the fund’s net asset value for current and past reporting periods. The table provides total return, total distributions, expense ratios, portfolio turnover and net assets for the applicable period. Total return is a measure of a fund’s performance that encompasses all elements of return: dividends, capital gain distributions and changes in net asset value. Total return is the change in value of an investment over a given period, assuming reinvestment of any dividends and capital gain distributions, expressed as a percentage of the initial investment. Total distributions include distributions from net investment income and net realized gains. Long-term gains are earned on securities held in the fund more than one year. Short-term gains, on the sale of securities held less than one year, are treated as ordinary dividend income for tax purposes. The expense ratio is a fund’s cost of doing business, expressed as a percentage of net assets. These expenses directly reduce returns to shareholders. Portfolio turnover measures the trading activity in a fund’s investment portfolio – how often securities are bought and sold by a fund. Portfolio turnover is affected by market conditions, changes in the size of the fund, the nature of the fund’s investments and the investment style of the portfolio manager.
PROXY VOTING
The Proxy Voting Guidelines that the Portfolio uses to determine how to vote proxies relating to portfolio securities is provided as an Appendix to the Fund’s Statement of Additional Information. The Statement of Additional Information can be obtained free of charge by calling the Fund at 1-800-368-2745, by visiting the Calvert website at www.calvert.com or by visiting the SEC’s website at www.sec.gov.
Information regarding how the Fund voted proxies relating to portfolio securities during the most recent 12-month period ended June 30 is available by calling the Fund, by visiting the Calvert website at www. calvert.com or visiting the SEC’s website at www.sec.gov.
AVAILABILITY OF QUARTERLY PORTFOLIO HOLDINGS
The Fund files its complete schedule of portfolio holdings with the SEC for the first and third quarters of each fiscal year on Form N-Q. The Fund’s Form N-Q is available on the SEC’s website at www.sec.gov. The Fund’s Form N-Q may be reviewed and copied at the SEC’s Public Reference Room in Washington, DC; information on the operation of the Public Reference Room may be obtained by calling 1-800-SEC-0330.
BASIS FOR BOARD’S APPROVAL OF INVESTMENT ADVISORY CONTRACTS
At a meeting held on December 11, 2013, the Board of Directors, and by a separate vote, the disinterested Directors, approved the continuance of the Investment Advisory Agreement between the Portfolio and the Advisor and the Investment Subadvisory Agreement between the Advisor and the Subadvisor with respect to the Portfolio.
In evaluating the Investment Advisory Agreement, the Board considered a variety of information relating to the Portfolio and the Advisor. The disinterested Directors reviewed a report prepared by the Advisor regarding various services provided to the Portfolio by the Advisor and its affiliates. Such report included, among other
www.calvert.com CALVERT VP EAFE INTERNATIONAL INDEX PORTFOLIO ANNUAL REPORT (UNAUDITED) 39
data, information regarding the Advisor’s personnel and the Advisor’s revenue and cost of providing services to the Portfolio, and a separate report prepared by an independent third party, which provided a statistical analysis comparing the Portfolio’s investment performance, expenses, and fees to comparable mutual funds.
The disinterested Directors were separately represented by independent legal counsel with respect to their consideration of the reapproval of the Investment Advisory Agreement and the Investment Subadvisory Agreement. Prior to voting, the disinterested Directors reviewed the proposed continuance of the Investment Advisory Agreement and Investment Subadvisory Agreement with management and also met in private sessions with their counsel at which no representatives of management were present.
In the course of its deliberations regarding the Investment Advisory Agreement, the Board considered the following factors, among others: the nature, extent and quality of the services provided by the Advisor, including the personnel providing such services; the Advisor’s financial condition; the level and method of computing the Portfolio’s advisory fee; comparative performance, fee and expense information for the Portfolio; the profitability of the Calvert Family of Funds to the Advisor and its affiliates; the allocation of the Portfolio’s brokerage, including the Advisor’s process for monitoring “best execution”; the direct and indirect benefits, if any, derived by the Advisor and its affiliates from their relationship with the Portfolio; the effect of the Portfolio’s growth and size on the Portfolio’s performance and expenses; the Advisor’s compliance programs and policies; the Advisor’s performance of substantially similar duties for other funds; and any possible conflicts of interest.
In considering the nature, extent and quality of the services provided by the Advisor under the Investment Advisory Agreement, the Board reviewed information provided by the Advisor relating to its operations and personnel, including, among other information, biographical information on the Advisor’s supervisory and professional staff and descriptions of its organizational and management structure. The Board also took into account similar information provided periodically throughout the previous year by the Advisor, as well as the Board’s familiarity with the Advisor’s management through Board of Directors’ meetings, discussions and other reports. The Board considered the Advisor’s current level of staffing and overall resources. The Board also noted that it reviewed on a quarterly basis information regarding the Advisor’s compliance with applicable policies and procedures, including those related to personal investing. The Advisor’s administrative capabilities, including its ability to supervise the other service providers for the Portfolio, were also considered. The Board discussed the Advisor’s effectiveness in monitoring the performance of the Subadvisor and its timeliness in responding to performance issues. The Board observed that the scope of services provided by the Advisor generally had expanded over time as a result of regulatory, market and other changes. The Board took into consideration, among other factors, the effectiveness of the Portfolio’s and Advisor’s processes, policies and procedures and the Advisor’s personnel. The Board also took into account, among other items, periodic reports received from the Advisor over the past year concerning the Advisor’s ongoing review and enhancement of certain processes, policies and procedures of the Portfolio and the Advisor. The Board concluded that it was satisfied with the nature, extent and quality of services provided to the Portfolio by the Advisor under the Investment Advisory Agreement.
In considering the Portfolio’s performance, the Board noted that it reviewed on a quarterly basis detailed information about the Portfolio’s performance results, portfolio composition and investment strategies. In addition, the Board took into account overall financial market conditions. The Board also reviewed various comparative data provided to it in connection with its consideration of the renewal of the Investment Advisory Agreement, including, among other information, a comparison of the Portfolio’s total return with that of other mutual funds deemed to be in its peer group or peer universe, as applicable, by an independent third party in its report. This comparison indicated that the Portfolio performed below the median of its peer group for the one- and three-year periods ended June 30, 2013, and performed below the median of its peer universe for the five-year period ended June 30, 2013. The data also indicated that the Portfolio outperformed its Lipper index for the one-year period ended June 30, 2013, and underperformed its Lipper index for the three- and five-year periods ended June 30, 2013. The Board took into account management’s discus-
40 www.calvert.com CALVERT VP EAFE INTERNATIONAL INDEX PORTFOLIO ANNUAL REPORT (UNAUDITED)
sion of the Portfolio’s performance, including the impact of Portfolio expenses and fair valuation determinations on the Portfolio’s relative performance. Based upon its review, the Board concluded that the Portfolio’s performance was satisfactory relative to the performance of passively-managed funds that track the same benchmark index as does the Portfolio.
In considering the Portfolio’s fees and expenses, the Board compared the Portfolio’s fees and total expense ratio with various comparative data for the funds in its peer group. Among other findings, the data indicated that the Portfolio’s advisory fee (after taking into account expense reimbursements) was above the median of its peer group and that total expenses (net of expense reimbursements) were above the median of its peer group. The Board noted that the allocation of advisory and administrative fees may vary among the Portfolio’s peer group. The Board noted that the Advisor had reimbursed a portion of the Portfolio’s expenses. The Board also took into account the Advisor’s current undertaking to maintain expense limitations for the Portfolio. The Board noted that the Advisor paid the Subadvisor’s subadvisory fee under the Investment Subadvisory Agreement with respect to the Portfolio. The Board also took into account management’s discussion of the Portfolio’s expenses and certain factors that affected the level of such expenses, including the current size of the Portfolio. Based upon its review, the Board determined that the advisory fee was reasonable in view of the quality of services received by the Portfolio from the Advisor and the other factors considered.
The Board reviewed the Advisor’s profitability on a portfolio-by-portfolio basis. In reviewing the overall profitability of the advisory fee to the Portfolio’s Advisor, the Board also considered the fact that affiliates of the Advisor provided shareholder servicing, administrative and distribution services to the Portfolio for which they received compensation. The information considered by the Board included Calvert’s operating profit margin information both before and after tax expenses with respect to the services that the Advisor and its affiliates provided to the Calvert Family of Funds complex. The Board reviewed the profitability of the Advisor’s relationship with the Portfolio in terms of the total amount of annual advisory fees it received with respect to the Portfolio and whether the Advisor had the financial wherewithal to continue to provide services to the Portfolio. The Board also considered that the Advisor derived benefits to its reputation and other indirect benefits from its relationship with the Portfolio. In addition, the Board took into account that affiliates of the Advisor may benefit from certain indirect tax benefits relating to dividend received deductions and foreign tax credits. The Board also noted that the Advisor paid the subadvisory fee to the Subadvisor and that the Advisor had reimbursed a portion of the expenses of the Portfolio. Based upon its review, the Board concluded that the Advisor’s and its affiliates’ level of profitability from their relationship with the Portfolio was reasonable.
The Board considered the effect of the Portfolio’s current size and potential growth on its performance and fees. Although the Portfolio’s advisory fee did not contain breakpoints that would reduce the advisory fee rate on assets above specified asset levels, the Board noted that if the Portfolio’s assets increased over time, the Portfolio might realize other economies of scale if assets increased proportionally more than certain other expenses. The Board also noted that given the Portfolio’s current level of assets, the Portfolio would be unlikely to recognize economies of scale by implementing a breakpoint in the advisory fee at this time.
In reapproving the Investment Advisory Agreement, the Board, including the disinterested Directors, did not identify any single factor as controlling, and each Director may have attributed different weight to various factors.
In evaluating the Investment Subadvisory Agreement, the disinterested Directors reviewed information provided by the Subadvisor relating to its operations, personnel, investment philosophy, strategies and techniques. Among other information, the Subadvisor provided biographical information on portfolio management and other professional staff, performance information for itself, and descriptions of its investment philosophies, strategies and techniques, organizational and management structures and brokerage policies and practices.
The Board reapproved the Investment Subadvisory Agreement between the Subadvisor and the Advisor based
www.calvert.com CALVERT VP EAFE INTERNATIONAL INDEX PORTFOLIO ANNUAL REPORT (UNAUDITED) 41
on a number of factors relating to the Subadvisor’s ability to perform under the Investment Subadvisory Agreement. In the course of its deliberations, the Board evaluated, among other factors: the nature, extent and the quality of the services to be provided by the Subadvisor; the Subadvisor’s management style and long-term performance record; the Portfolio’s performance record and the Subadvisor’s performance in employing its investment strategies; the Subadvisor’s current level of staffing and its overall resources; the qualifications and experience of the Subadvisor’s personnel; the Subadvisor’s financial condition with respect to its ability to perform the services required under the Investment Subadvisory Agreement; the Subadvisor’s risk management processes; the Subadvisor’s compliance systems, including those related to personal investing; and any disciplinary history. Based upon its review, the Board concluded that it was satisfied with the nature, extent and quality of services provided to the Portfolio by the Subadvisor under the Investment Subadvisory Agreement.
As noted above, the Board considered, among other information, the Portfolio’s performance during the one-, three- and five-year periods ended June 30, 2013 as compared to the Portfolio’s peer group or peer universe, as applicable, and noted that it reviewed on a quarterly basis detailed information about the Portfolio’s performance results, portfolio composition and investment strategies. The Board noted the Advisor’s expertise and resources in monitoring the performance, investment style and risk adjusted performance of the Subadvisor.
In considering the cost of services to be provided by the Subadvisor and the profitability to the Subadvisor of its relationship with the Portfolio, the Board noted that the subadvisory fee under the Investment Subadvisory Agreement was paid by the Advisor out of the advisory fee that the Advisor received under the Investment Advisory Agreement. The Board also relied on the ability of the Advisor to negotiate the Investment Subadvisory Agreement and the corresponding subadvisory fee at arm’s length. In addition, the Board took into account the fees the Subadvisor charged to its other clients and considered these fee comparisons in light of the differences in managing these other accounts. Based upon its review, the Board determined that the subadvisory fee was reasonable in view of the quality of services received by the Portfolio from the Subadvisor and the other factors considered. Because the Advisor pays the Subadvisor’s subadvisory fee and the subad-visory fee was negotiated at arm’s length by the Advisor, the cost of services to be provided by the Subadvisor was not a material factor in the Board’s deliberations. For similar reasons, the Board did not consider the potential economies of scale in the Subadvisor’s management of the Portfolio to be a material factor in its consideration, although the Board noted that the subadvisory fee included breakpoints that would reduce the subadvisory fee on assets above certain specified asset levels.
In reapproving the Investment Subadvisory Agreement, the Board, including the disinterested Directors, did not identify any single factor as controlling, and each Director may have attributed different weight to various factors.
CONCLUSIONS
The Board reached the following conclusions regarding the Investment Advisory Agreement and the Investment Subadvisory Agreement, among others: (a) the Advisor has demonstrated that it possesses the capability and resources to perform the duties required of it under the Investment Advisory Agreement; (b) the Subadvisor is qualified to manage the Portfolio’s assets in accordance with the Portfolio’s investment objective and policies; (c) the Advisor and Subadvisor maintain appropriate compliance programs; (d) the Subadvisor is likely to execute its investment strategies consistently over time; (e) the performance of the Portfolio is satisfactory relative to the performance of passively-managed funds that track the same benchmark index as does the Portfolio; and (f) the Portfolio’s advisory and subadvisory fees are reasonable in view of the quality of services received by the Portfolio from the Advisor and Subadvisor and the other factors considered. Based on its conclusions, the Board determined that reapproval of the Investment Advisory Agreement and the Investment Subadvisory Agreement would be in the best interests of the Portfolio and its shareholders.
42 www.calvert.com CALVERT VP EAFE INTERNATIONAL INDEX PORTFOLIO ANNUAL REPORT (UNAUDITED)
This report is intended to provide fund information to shareholders. It is not authorized for distribution to prospective investors unless preceded or accompanied by a prospectus.
Note: The information on our website is not incorporated by reference into this report; our website address is included as an inactive textual reference only.
Investors should carefully consider the investment objectives, risks, charges and expenses of the Calvert Funds. This and other important information is contained in the fund’s summary prospectus and prospectus, which can be obtained from your financial professional and should be read carefully before investing. You may also call Calvert at 800/368-2745 or visit www. calvert.com.
www.calvert.com CALVERT VP EAFE INTERNATIONAL INDEX PORTFOLIO ANNUAL REPORT (UNAUDITED) 43
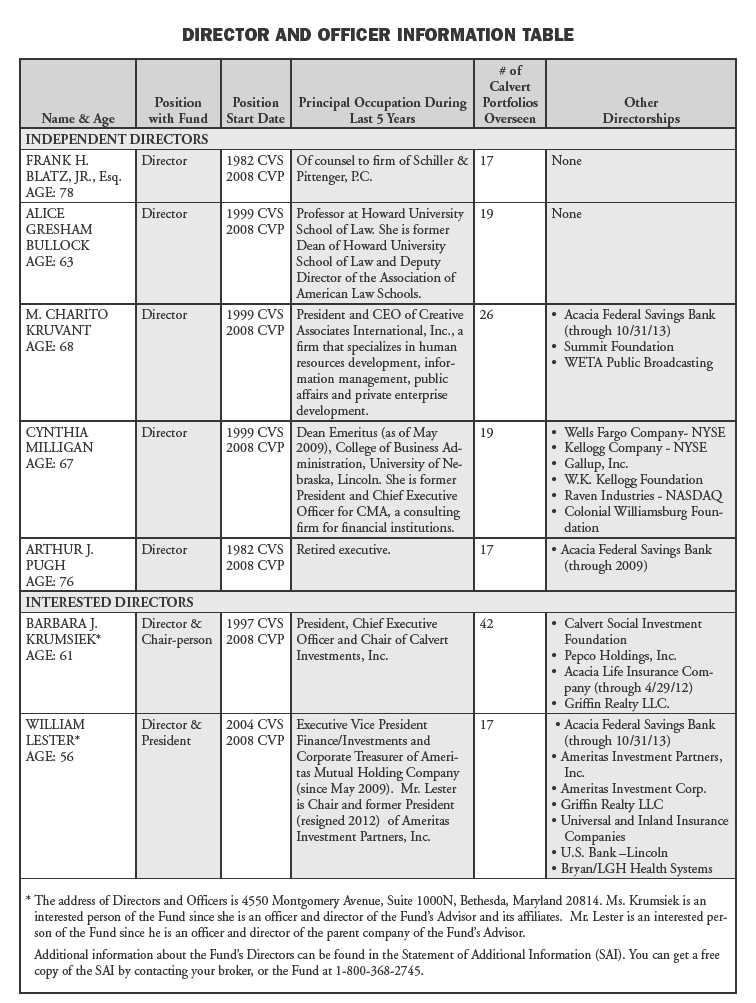
44 www.calvert.com CALVERT VP EAFE INTERNATIONAL INDEX PORTFOLIO ANNUAL REPORT (UNAUDITED)

www.calvert.com CALVERT VP EAFE INTERNATIONAL INDEX PORTFOLIO ANNUAL REPORT (UNAUDITED) 45
CALVERT VP INVESTMENT GRADE BOND INDEX PORTFOLIO
Portfolio within Calvert Variable Products, Inc.
Managed by Ameritas Investment Partners, Inc., Subadvisor
INVESTMENT PERFORMANCE
For the year ended December 31, 2013, the Calvert VP Investment Grade Bond Index Portfolio returned -2.80% compared with -2.02% for the Barclays U.S. Aggregate Bond Index. The underperformance was largely due to fees and operating expenses, which the Index does not incur.
INVESTMENT CLIMATE
The fixed-income markets performed poorly in 2013, as interest rates increased during the year. Beginning in May, speculation that the Federal Reserve (Fed) would begin tapering its quantitative-easing program caused interest rates to start rising. Speculation became reality with the Fed’s announcement in December. As a result, the 10-year Treasury rate increased over the year from 1.76% to 3.03%, delivering negative total returns for fixed-income investors, particularly on the longer end of the yield curve.1 As interest rates rise, the prices of existing bonds decline.
PORTFOLIO STRATEGY
As an index fund, the Portfolio employs a passive management approach in pursuit of its goal to mirror, as closely as possible, the performance of the Barclays U.S. Aggregate Bond Index. However, with more than 8,700 securities, full replication is not feasible.
Therefore, we employ a stratified sampling strategy to create a Portfolio of securities with similar characteristics to the Index, including duration, sector allocation, and quality. Stratified sampling requires the portfolio manager to select securities in each sector to represent sectors in the index. Since the Barclays U.S. Aggregate Bond Index is not an actual mutual fund, it is not possible to invest directly in it. Unlike the Index, the Portfolio incurs operating expenses.
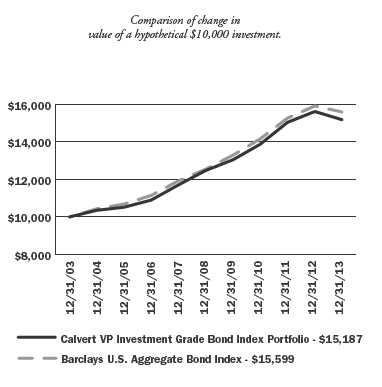
| | AVERAGE ANNUAL TOTAL RETURN |
| | (period ended 12.31.13) |
| One year | -2.80% |
| Five year | 4.01% |
| Ten year | 4.27% |
The performance data shown represents past performance, does not guarantee future results and assumes reinvestment of all dividends and distributions. All performance data reflects fee waivers and/or expense limitations, if any are in effect; in their absence performance would be lower. See Note B in Notes to Financial Statements. The investment return and principal value of an investment will fluctuate so that an investor’s shares, when redeemed, may be worth more or less than their original cost. Current performance may be lower or higher than the performance data quoted.
Visit www.calvert.com/institutional-VP-performance.html for current performance data. The gross expense ratio from the current prospectus for the Portfolio is 0.49%. This number may vary from the expense ratio shown elsewhere in this report because it is based on a different time period and, if applicable, does not include fee or expense waivers. The performance data and expense ratio reflect deduction of Portfolio operating expenses, but do not reflect charges and expenses imposed under the variable annuity or life insurance contract.
4 www.calvert.com CALVERT VP INVESTMENT GRADE BOND INDEX PORTFOLIO ANNUAL REPORT
Securitized bonds, which are primarily mortgage-backed securities, were the top performers within the Index, returning -1.31%. Corporate bonds returned -1.53% for the year, while Treasury securities earned -2.75% within the Index.
OUTLOOK
The outlook for 2014 is for continued economic growth in the United States and moderate growth globally. The Fed is expected to taper throughout the year and end its quantitative easing by year-end. Consensus is for inflation to remain low and the unemployment rate to decline. In this environment, interest rates should normalize when the external influence from the Fed is removed. We expect rates to rise modestly before the yield curve eventually flattens.
Corporate earnings and balance sheets remain healthy, so corporate bonds are expected to outperform. Securitized bonds may underperform due to their negative convexity. Treasury securities are also expected to underperform due to their lack of incremental yield compared to corporate or mortgage-backed securities. In a rising interest-rate environment, short-duration bonds are expected to outperform long-duration bonds.2
January 2014
| | % OF TOTAL |
| ECONOMIC SECTORS | INVESTMENTS |
| |
| Asset Backed Securities | 0.1% |
| Basic Materials | 0.9% |
| Communications | 1.3% |
| Consumer, Cyclical | 1.6% |
| Consumer, Non-cyclical | 1.5% |
| Energy | 2.5% |
| Financials | 8.2% |
| Government | 46.2% |
| Industrials | 3.5% |
| Mortgage Securities | 31.3% |
| Short-Term Investments | 0.5% |
| Technology | 1.0% |
| Utilities | 1.4% |
| Total | 100% |
1. The yield curve refers to the difference between short, intermediate, and long-term interest rates at any point in time.
2. Duration measures a portfolio’s sensitivity to changes in interest rates. Generally, the longer the duration, the greater the change in value in response to a given change in interest rates.
www.calvert.com CALVERT VP INVESTMENT GRADE BOND INDEX PORTFOLIO ANNUAL REPORT 5
SHAREHOLDER EXPENSE EXAMPLE
As a shareholder of the Fund, you incur two types of costs: (1) transaction costs, and (2) ongoing costs, including management fees and other Fund expenses. This Example is intended to help you understand your ongoing costs (in dollars) of investing in the Fund and to compare these costs with the ongoing costs of investing in other mutual funds.
This Example is based on an investment of $1,000 invested at the beginning of the period and held for the entire period (July 1, 2013 to December 31, 2013).
Note: Expenses do not reflect charges and expenses of the variable annuity or variable universal life contract.
Actual Expenses
The first line of the table below provides information about actual account values and actual expenses. You may use the information in this line, together with the amount you invested, to estimate the expenses that you paid over the period. Simply divide your account value by $1,000 (for example, an $8,600 account value divided by $1,000 = 8.6), then multiply the result by the number in the first line under the heading entitled “Expenses Paid During Period” to estimate the expenses you paid on your account during this period.
Hypothetical Example for Comparison Purposes
The second line of the table below provides information about hypothetical account values and hypothetical expenses based on the Fund’s actual expense ratio and an assumed rate of return of 5% per year before expenses, which is not the Fund’s actual return. The hypothetical account values and expenses may not be used to estimate the actual ending account balance or expenses you paid for the period. You may use this information to compare the ongoing costs of investing in the Fund and other funds. To do so, compare the 5% hypothetical example with the 5% hypothetical examples that appear in the shareholder reports of the other funds.
Please note that the expenses shown in the table are meant to highlight your ongoing costs only and do not reflect any transactional costs. Therefore, the second line of the table is useful in comparing ongoing costs only, and will not help you determine the relative total costs of owning different funds. In addition, if these transactional costs were included, your costs would have been higher.
| | BEGINNING | ENDING | EXPENSES PAID |
| | ACCOUNT VALUE | ACCOUNT VALUE | DURING PERIOD* |
| | 7/1/13 | 12/31/13 | 7/1/13 - 12/31/13 |
| |
| Actual | $1,000.00 | $1,000.57 | $2.56 |
| |
Hypothetical
(5% return per year before expenses) | $1,000.00 | $1,022.65 | $2.59 |
* Expenses are equal to the Fund’s annualized expense ratio of 0.51%, multiplied by the average account value over the period, multiplied by 184/365 (to reflect the one-half year period).
6 www.calvert.com CALVERT VP INVESTMENT GRADE BOND INDEX PORTFOLIO ANNUAL REPORT
REPORT OF INDEPENDENT PUBLIC ACCOUNTING FIRM
The Board of Directors of Calvert Variable Products, Inc. and Shareholders of Calvert VP Investment Grade Bond Index Portfolio: We have audited the accompanying statement of net assets of the Calvert VP Investment Grade Bond Index Portfolio, (formerly, Calvert VP Barclays Capital Aggregate Bond Index Portfolio) (the “Portfolio”), a series of Calvert Variable Products, Inc., as of December 31, 2013, and the related statement of operations for the year then ended, the statements of changes in net assets for each of the years in the two-year period then ended, and the financial highlights for each of the years in the five-year period then ended. These financial statements and financial highlights are the responsibility of the Portfolio’s management. Our responsibility is to express an opinion on these financial statements and financial highlights based on our audits.
We conducted our audits in accordance with the standards of the Public Company Accounting Oversight Board (United States). Those standards require that we plan and perform the audit to obtain reasonable assurance about whether the financial statements and financial highlights are free of material misstatement. An audit includes examining, on a test basis, evidence supporting the amounts and disclosures in the financial statements. Our procedures included confirmation of securities owned as of December 31, 2013, by correspondence with the custodian and brokers or by performing other appropriate auditing procedures. An audit also includes assessing the accounting principles used and significant estimates made by management, as well as evaluating the overall financial statement presentation. We believe that our audits provide a reasonable basis for our opinion.
In our opinion, the financial statements and financial highlights referred to above present fairly, in all material respects, the financial position of the Calvert VP Investment Grade Bond Index Portfolio as of December 31, 2013, the results of its operations for the year then ended, the changes in its net assets for each of the years in the two-year period then ended, and the financial highlights for each of the years in the five-year period then ended, in conformity with U.S. generally accepted accounting principles.

Philadelphia, Pennsylvania
February 24, 2014
www.calvert.com CALVERT VP INVESTMENT GRADE BOND INDEX PORTFOLIO ANNUAL REPORT 7
| | |
| STATEMENT OF NET ASSETS |
| DECEMBER 31, 2013 |
| |
| | PRINCIPAL | |
| ASSET-BACKED SECURITIES - 0.1% | AMOUNT | VALUE |
| Citibank Omni Master Trust, 4.90%, 11/15/18 (e) | $100,000 | $103,664 |
| |
| Total Asset-Backed Securities (Cost $105,921) | | 103,664 |
| |
| COMMERCIAL MORTGAGE-BACKED SECURITIES - 1.3% | | |
| Banc of America Commercial Mortgage Trust, 5.623%, 4/10/49 (r) | 550,000 | 609,464 |
| DBUBS Mortgage Trust: | | |
| 3.386%, 7/10/44 (e) | 500,000 | 521,432 |
| 3.742%, 11/10/46 (e) | 874,804 | 919,387 |
| Morgan Stanley Capital I Trust, 3.476%, 6/15/44 (e) | 500,000 | 526,746 |
| |
| Total Commercial Mortgage-Backed Securities (Cost $2,397,282) | | 2,577,029 |
| |
| CORPORATE BONDS - 21.9% | | |
| Alcoa, Inc., 5.72%, 2/23/19 | 149,000 | 158,752 |
| American Express Credit Corp., 2.75%, 9/15/15 | 200,000 | 206,971 |
| Amgen, Inc., 4.10%, 6/15/21 | 700,000 | 729,449 |
| Apache Corp., 5.625%, 1/15/17 | 100,000 | 112,389 |
| AstraZeneca plc, 6.45%, 9/15/37 | 350,000 | 417,935 |
| Australia & New Zealand Banking Group Ltd., 4.875%, 1/12/21 (e) | 800,000 | 870,274 |
| Bank of America Corp.: | | |
| 5.65%, 5/1/18 | 250,000 | 284,567 |
| 3.30%, 1/11/23 | 950,000 | 898,954 |
| Bank of New York Mellon Corp., 1.30%, 1/25/18 | 850,000 | 828,651 |
| Berkshire Hathaway Finance Corp.: | | |
| 2.90%, 10/15/20 | 500,000 | 495,844 |
| 4.30%, 5/15/43 | 1,000,000 | 900,605 |
| BorgWarner, Inc., 5.75%, 11/1/16 | 500,000 | 553,988 |
| BP Capital Markets plc: | | |
| 4.50%, 10/1/20 | 400,000 | 432,166 |
| 2.50%, 11/6/22 | 500,000 | 455,242 |
| 2.75%, 5/10/23 | 1,000,000 | 913,096 |
| British Telecommunications plc, 1.625%, 6/28/16 | 300,000 | 302,644 |
| CA, Inc., 5.375%, 12/1/19 | 100,000 | 111,193 |
| Caterpillar Financial Services Corp., 1.25%, 11/6/17 | 650,000 | 640,688 |
| Cigna Corp., 4.00%, 2/15/22 | 300,000 | 305,361 |
| Cintas Corp. No. 2, 3.25%, 6/1/22 | 200,000 | 190,670 |
| Citigroup, Inc.: | | |
| 1.75%, 5/1/18 | 450,000 | 442,482 |
| 6.125%, 5/15/18 | 200,000 | 231,458 |
| 3.375%, 3/1/23 | 750,000 | 712,886 |
| Colonial Pipeline Co., 6.58%, 8/28/32 (e) | 100,000 | 118,408 |
| Connecticut Light & Power Co., 5.65%, 5/1/18 | 200,000 | 228,452 |
| Deere & Co., 6.55%, 10/1/28 | 250,000 | 301,883 |
| DIRECTV Holdings LLC, 5.20%, 3/15/20 | 1,000,000 | 1,088,972 |
| Discovery Communications LLC, 5.05%, 6/1/20 | 200,000 | 218,309 |
| Emerson Electric Co., 4.75%, 10/15/15 | 200,000 | 213,833 |
| Enbridge Energy Partners LP, 5.20%, 3/15/20 | 200,000 | 214,689 |
| Energizer Holdings, Inc., 4.70%, 5/19/21 | 700,000 | 707,107 |
| Energy Transfer Partners LP, 4.65%, 6/1/21 | 1,000,000 | 1,028,642 |
| Ensco plc, 4.70%, 3/15/21 | 700,000 | 740,419 |
| EOG Resources, Inc., 2.625%, 3/15/23 | 750,000 | 682,327 |
8 www.calvert.com CALVERT VP INVESTMENT GRADE BOND INDEX PORTFOLIO ANNUAL REPORT
| | |
| | PRINCIPAL | |
| CORPORATE BONDS - CONT’D | AMOUNT | VALUE |
| Equifax, Inc., 3.30%, 12/15/22 | $350,000 | $323,093 |
| Florida Gas Transmission Co. LLC, 3.875%, 7/15/22 (e) | 600,000 | 587,993 |
| Ford Motor Credit Co. LLC, 2.375%, 1/16/18 | 1,000,000 | 1,009,960 |
| GATX Corp., 4.85%, 6/1/21 | 700,000 | 714,570 |
| Goldman Sachs Group, Inc.: | | |
| 5.35%, 1/15/16 | 200,000 | 216,435 |
| 5.375%, 3/15/20 | 150,000 | 166,819 |
| GTE Corp., 6.94%, 4/15/28 | 80,000 | 90,811 |
| HCP, Inc., 2.625%, 2/1/20 | 700,000 | 667,232 |
| Health Care REIT, Inc., 5.25%, 1/15/22 | 800,000 | 852,508 |
| Host Hotels & Resorts LP, 3.75%, 10/15/23 | 1,000,000 | 927,181 |
| Intel Corp., 1.35%, 12/15/17 | 750,000 | 741,254 |
| John Deere Capital Corp., 1.20%, 10/10/17 | 250,000 | 243,785 |
| JPMorgan Chase & Co.: | | |
| 4.50%, 1/24/22 | 400,000 | 423,092 |
| 3.375%, 5/1/23 | 700,000 | 652,400 |
| Kennametal, Inc., 2.65%, 11/1/19 | 950,000 | 925,060 |
| Kimco Realty Corp., 4.30%, 2/1/18 | 300,000 | 322,784 |
| L-3 Communications Corp.: | | |
| 5.20%, 10/15/19 | 200,000 | 216,170 |
| 4.75%, 7/15/20 | 800,000 | 830,190 |
| Liberty Property LP, 3.375%, 6/15/23 | 250,000 | 227,532 |
| Lockheed Martin Corp., 4.85%, 9/15/41 | 1,000,000 | 982,738 |
| McCormick & Company, Inc., 3.90%, 7/15/21 | 500,000 | 513,557 |
| MDC Holdings, Inc., 5.625%, 2/1/20 | 200,000 | 209,500 |
| Monongahela Power Co., 5.40%, 12/15/43 (e) | 900,000 | 934,799 |
| Morgan Stanley: | | |
| 5.95%, 12/28/17 | 950,000 | 1,085,394 |
| 4.10%, 5/22/23 | 500,000 | 483,876 |
| Northern Trust Corp., 3.45%, 11/4/20 | 100,000 | 102,849 |
| NYSE Euronext, 2.00%, 10/5/17 | 450,000 | 450,585 |
| Omnicom Group, Inc., 4.45%, 8/15/20 | 500,000 | 530,682 |
| Oracle Corp.: | | |
| 5.75%, 4/15/18 | 250,000 | 288,892 |
| 2.375%, 1/15/19 | 900,000 | 908,057 |
| Pearson Funding Two plc, 4.00%, 5/17/16 (e) | 250,000 | 263,822 |
| PNC Bank NA, 2.70%, 11/1/22 | 850,000 | 770,497 |
| Post Apartment Homes LP, 3.375%, 12/1/22 | 950,000 | 875,139 |
| Precision Castparts Corp., 1.25%, 1/15/18 | 750,000 | 730,126 |
| Public Service Co. of Colorado, 2.25%, 9/15/22 | 250,000 | 226,628 |
| Public Service Electric & Gas Co., 3.95%, 5/1/42 | 1,000,000 | 891,088 |
| Rio Tinto Finance USA Ltd.: | | |
| 2.25%, 9/20/16 | 400,000 | 411,672 |
| 3.75%, 9/20/21 | 400,000 | 403,839 |
| Stanley Black & Decker, Inc., 2.90%, 11/1/22 | 500,000 | 464,514 |
| TCI Communications, Inc., 8.75%, 8/1/15 | 100,000 | 112,466 |
| Teck Resources Ltd., 4.75%, 1/15/22 | 400,000 | 403,831 |
| Texas Eastern Transmission LP, 2.80%, 10/15/22 (e) | 400,000 | 357,681 |
| The Mosaic Co., 5.625%, 11/15/43 | 400,000 | 405,793 |
| Thermo Fisher Scientific, Inc., 3.60%, 8/15/21 | 500,000 | 495,522 |
| Time Warner Cable, Inc., 5.00%, 2/1/20 | 100,000 | 101,536 |
| Time Warner, Inc., 4.875%, 3/15/20 | 100,000 | 109,608 |
| United Parcel Service, Inc., 6.20%, 1/15/38 | 250,000 | 303,868 |
| US Bank, 4.95%, 10/30/14 | 100,000 | 103,804 |
| VF Corp., 3.50%, 9/1/21 | 400,000 | 399,833 |
www.calvert.com CALVERT VP INVESTMENT GRADE BOND INDEX PORTFOLIO ANNUAL REPORT 9
| | |
| | PRINCIPAL | |
| CORPORATE BONDS - CONT’D | AMOUNT | VALUE |
| Wal-Mart Stores, Inc.: | | |
| 6.50%, 8/15/37 | $250,000 | $312,733 |
| 4.00%, 4/11/43 | 500,000 | 444,992 |
| WellPoint, Inc., 3.70%, 8/15/21 | 800,000 | 797,044 |
| Yum! Brands, Inc., 3.75%, 11/1/21 | 1,000,000 | 989,541 |
| |
| Total Corporate Bonds (Cost $43,695,130) | | 43,744,681 |
| |
| U.S. GOVERNMENT AGENCIES AND INSTRUMENTALITIES - 10.3% | | |
| Fannie Mae: | | |
| 2.375%, 7/28/15 | 1,000,000 | 1,031,606 |
| 4.875%, 12/15/16 | 1,000,000 | 1,118,564 |
| 6.25%, 5/15/29 | 1,600,000 | 2,005,829 |
| Federal Home Loan Bank, 4.875%, 5/17/17 | 1,000,000 | 1,128,967 |
| Freddie Mac: | | |
| 5.25%, 4/18/16 | 1,000,000 | 1,107,772 |
| 2.00%, 8/25/16 | 1,000,000 | 1,034,112 |
| 5.00%, 2/16/17 | 1,000,000 | 1,125,518 |
| 5.125%, 11/17/17 | 1,000,000 | 1,140,994 |
| 4.875%, 6/13/18 | 4,000,000 | 4,545,212 |
| 3.75%, 3/27/19 | 3,200,000 | 3,487,901 |
| 2.375%, 1/13/22 | 1,500,000 | 1,433,947 |
| 6.75%, 3/15/31 | 1,000,000 | 1,323,086 |
| |
| Total U.S. Government Agencies and Instrumentalities (Cost $20,214,894) | | 20,483,508 |
| |
| U.S. GOVERNMENT AGENCY MORTGAGE-BACKED SECURITIES - 29.9% | | |
| Fannie Mae: | | |
| 5.00%, 12/1/16 | 138,268 | 147,048 |
| 5.00%, 11/1/17 | 22,364 | 23,795 |
| 5.50%, 8/1/18 | 84,431 | 91,241 |
| 4.61%, 12/1/19 | 472,165 | 487,481 |
| 5.00%, 6/1/20 | 44,941 | 47,853 |
| 6.50%, 4/1/23 | 49,004 | 51,371 |
| 3.50%, 5/1/26 | 942,455 | 985,902 |
| 2.50%, 12/1/27 | 832,210 | 819,219 |
| 4.50%, 5/1/31 | 810,523 | 871,310 |
| 6.50%, 8/1/32 | 92,948 | 103,367 |
| 5.50%, 7/1/33 | 244,065 | 271,988 |
| 5.50%, 7/1/33 | 103,080 | 113,582 |
| 6.00%, 8/1/33 | 57,084 | 64,061 |
| 5.50%, 11/1/33 | 130,575 | 143,903 |
| 5.50%, 3/1/34 | 237,084 | 261,032 |
| 6.00%, 6/1/34 | 158,693 | 176,446 |
| 5.00%, 7/1/34 | 240,227 | 261,016 |
| 5.00%, 10/1/34 | 210,814 | 228,965 |
| 5.50%, 3/1/35 | 287,138 | 315,648 |
| 5.50%, 6/1/35 | 163,543 | 179,554 |
| 5.50%, 9/1/35 | 146,102 | 160,685 |
| 5.50%, 2/1/36 | 68,134 | 74,880 |
| 5.50%, 4/1/36 | 390,090 | 416,340 |
| 5.00%, 7/1/36 | 1,024,346 | 1,114,221 |
| 6.50%, 9/1/36 | 207,236 | 230,104 |
| 5.50%, 11/1/36 | 99,933 | 109,824 |
| 6.00%, 8/1/37 | 1,168,662 | 1,296,230 |
10 www.calvert.com CALVERT VP INVESTMENT GRADE BOND INDEX PORTFOLIO ANNUAL REPORT
| | |
| | | |
| U.S. GOVERNMENT AGENCY MORTGAGE-BACKED SECURITIES - CONT’D | PRINCIPAL
AMOUNT | VALUE |
| Fannie Mae - Cont’d: | | |
| 6.00%, 5/1/38 | $122,184 | $135,189 |
| 5.50%, 6/1/38 | 152,422 | 167,999 |
| 6.00%, 7/1/38 | 658,077 | 737,662 |
| 2.396%, 9/1/38 (r) | 686,065 | 727,332 |
| 4.00%, 3/1/39 | 207,906 | 214,114 |
| 4.50%, 5/1/40 | 882,751 | 937,879 |
| 4.50%, 7/1/40 | 441,093 | 467,491 |
| 4.50%, 10/1/40 | 1,612,276 | 1,708,477 |
| 3.50%, 2/1/41 | 960,615 | 955,351 |
| 4.00%, 2/1/41 | 1,308,005 | 1,347,365 |
| 3.50%, 3/1/41 | 1,000,230 | 994,748 |
| 4.00%, 3/1/41 | 582,039 | 599,550 |
| 3.50%, 3/1/42 | 1,697,885 | 1,689,444 |
| 4.00%, 7/1/42 | 1,026,837 | 1,057,624 |
| 4.00%, 8/1/42 | 1,317,966 | 1,344,604 |
| 3.50%, 12/1/42 | 1,816,394 | 1,807,351 |
| 3.00%, 1/1/43 | 1,827,407 | 1,736,762 |
| 3.00%, 5/1/43 | 2,734,365 | 2,598,623 |
| 3.00%, 8/1/43 | 2,062,896 | 1,960,793 |
| 3.50%, 8/1/43 | 1,882,975 | 1,848,058 |
| Freddie Mac: | | |
| 4.50%, 9/1/18 | 97,114 | 102,973 |
| 5.00%, 11/1/20 | 100,822 | 107,017 |
| 4.00%, 3/1/25 | 838,381 | 885,194 |
| 3.50%, 11/1/25 | 773,439 | 806,840 |
| 3.50%, 7/1/26 | 569,411 | 594,019 |
| 2.50%, 3/1/28 | 280,694 | 278,417 |
| 5.00%, 2/1/33 | 55,658 | 60,012 |
| 5.00%, 4/1/35 | 114,977 | 124,256 |
| 5.00%, 12/1/35 | 266,955 | 288,318 |
| 6.00%, 8/1/36 | 88,602 | 98,304 |
| 5.00%, 10/1/36 | 510,660 | 550,642 |
| 6.50%, 10/1/37 | 81,859 | 88,075 |
| 5.00%, 1/1/38 | 1,034,149 | 1,113,313 |
| 5.00%, 7/1/39 | 357,005 | 386,756 |
| 4.00%, 11/1/39 | 817,274 | 839,745 |
| 4.50%, 1/1/40 | 389,163 | 412,252 |
| 5.00%, 1/1/40 | 1,392,480 | 1,515,087 |
| 4.50%, 4/1/40 | 929,596 | 984,273 |
| 6.00%, 4/1/40 | 198,700 | 219,072 |
| 4.50%, 5/1/40 | 325,996 | 345,499 |
| 4.50%, 5/1/40 | 730,141 | 773,280 |
| 4.00%, 2/1/41 | 547,525 | 562,726 |
| 4.50%, 6/1/41 | 546,482 | 579,301 |
| 3.50%, 10/1/41 | 1,149,749 | 1,142,099 |
| 3.00%, 7/1/42 | 547,092 | 518,981 |
| 3.50%, 7/1/42 | 1,372,687 | 1,363,554 |
| 3.00%, 1/1/43 | 1,779,741 | 1,688,192 |
| Ginnie Mae: | | |
| 4.50%, 7/20/33 | 412,848 | 445,428 |
| 5.50%, 7/20/34 | 193,783 | 215,483 |
| 6.00%, 11/20/37 | 286,354 | 322,512 |
| 6.00%, 10/15/38 | 1,223,794 | 1,360,763 |
| 5.00%, 12/15/38 | 564,625 | 612,516 |
| 5.00%, 5/15/39 | 722,782 | 791,313 |
www.calvert.com CALVERT VP INVESTMENT GRADE BOND INDEX PORTFOLIO ANNUAL REPORT 11
| | |
| | | |
| U.S. GOVERNMENT AGENCY MORTGAGE-BACKED SECURITIES - CONT’D | PRINCIPAL
AMOUNT | VALUE |
| Ginnie Mae - Cont’d: | | |
| 4.50%, 10/15/39 | $515,403 | $552,603 |
| 5.00%, 10/15/39 | $839,057 | $919,116 |
| 4.50%, 8/15/40 | 1,493,249 | 1,614,494 |
| 4.00%, 12/20/40 | 1,513,559 | 1,587,896 |
| 4.00%, 11/20/41 | 1,197,572 | 1,246,810 |
| 4.00%, 8/20/42 | 1,396,750 | 1,454,355 |
| |
| Total U.S. Government Agency Mortgage-Backed Securities (Cost $60,020,725) | | 59,634,968 |
| |
| U.S. TREASURY OBLIGATIONS - 35.7% | | |
| United States Treasury Bonds: | | |
| 8.125%, 5/15/21 | 1,000,000 | 1,384,297 |
| 8.00%, 11/15/21 | 1,000,000 | 1,389,062 |
| 6.25%, 8/15/23 | 2,000,000 | 2,569,062 |
| 5.50%, 8/15/28 | 1,000,000 | 1,232,656 |
| 5.375%, 2/15/31 | 2,000,000 | 2,450,938 |
| 4.50%, 2/15/36 | 1,000,000 | 1,112,656 |
| 4.375%, 11/15/39 | 1,000,000 | 1,086,719 |
| 3.875%, 8/15/40 | 1,000,000 | 1,000,312 |
| 4.375%, 5/15/41 | 1,300,000 | 1,410,500 |
| 3.125%, 11/15/41 | 1,000,000 | 863,750 |
| 3.00%, 5/15/42 | 2,000,000 | 1,677,188 |
| 2.75%, 11/15/42 | 1,000,000 | 790,625 |
| United States Treasury Notes: | | |
| 4.25%, 8/15/14 | 1,000,000 | 1,025,469 |
| 2.375%, 10/31/14 | 1,000,000 | 1,018,320 |
| 2.125%, 11/30/14 | 2,000,000 | 2,035,468 |
| 2.25%, 1/31/15 | 1,000,000 | 1,022,266 |
| 2.375%, 2/28/15 | 2,000,000 | 2,050,078 |
| 2.50%, 4/30/15 | 1,000,000 | 1,030,195 |
| 2.125%, 5/31/15 | 2,000,000 | 2,053,204 |
| 1.75%, 7/31/15 | 1,000,000 | 1,023,320 |
| 1.25%, 8/31/15 | 2,000,000 | 2,031,796 |
| 1.25%, 10/31/15 | 1,000,000 | 1,016,562 |
| 4.50%, 11/15/15 | 1,000,000 | 1,077,305 |
| 2.00%, 1/31/16 | 2,000,000 | 2,065,624 |
| 2.375%, 3/31/16 | 1,000,000 | 1,043,125 |
| 2.00%, 4/30/16 | 2,000,000 | 2,069,062 |
| 1.50%, 7/31/16 | 1,000,000 | 1,022,812 |
| 4.875%, 8/15/16 | 2,000,000 | 2,221,876 |
| 2.75%, 11/30/16 | 1,000,000 | 1,057,109 |
| 0.875%, 1/31/17 | 2,000,000 | 2,001,876 |
| 3.00%, 2/28/17 | 1,000,000 | 1,065,625 |
| 4.50%, 5/15/17 | 2,000,000 | 2,231,876 |
| 2.375%, 7/31/17 | 1,000,000 | 1,044,922 |
| 1.875%, 9/30/17 | 2,000,000 | 2,051,094 |
| 4.25%, 11/15/17 | 1,000,000 | 1,113,438 |
| 2.625%, 1/31/18 | 1,000,000 | 1,051,562 |
| 3.50%, 2/15/18 | 2,000,000 | 2,171,250 |
| 2.375%, 5/31/18 | 1,000,000 | 1,038,047 |
| 4.00%, 8/15/18 | 2,000,000 | 2,218,282 |
| 3.75%, 11/15/18 | 1,000,000 | 1,097,422 |
| 3.125%, 5/15/19 | 2,000,000 | 2,131,250 |
| 3.625%, 8/15/19 | 1,000,000 | 1,089,609 |
| 3.375%, 11/15/19 | 1,000,000 | 1,075,625 |
12 www.calvert.com CALVERT VP INVESTMENT GRADE BOND INDEX PORTFOLIO ANNUAL REPORT
| | |
| | PRINCIPAL | |
| U.S. TREASURY OBLIGATIONS - CONT’D | AMOUNT | VALUE |
| United States Treasury Notes - Cont’d: | | |
| 3.625%, 2/15/20 | $1,000,000 | $1,088,438 |
| 2.625%, 8/15/20 | 1,000,000 | 1,020,312 |
| 2.625%, 11/15/20 | 1,000,000 | 1,016,250 |
| 3.625%, 2/15/21 | 2,000,000 | 2,158,282 |
| 3.125%, 5/15/21 | 1,000,000 | 1,042,422 |
| 1.75%, 5/15/22 | 1,000,000 | 924,688 |
| 1.625%, 11/15/22 | 1,000,000 | 902,656 |
| |
| Total U.S. Treasury Obligations (Cost $71,823,403) | | 71,366,282 |
| |
| TIME DEPOSIT - 0.5% | | |
| State Street Bank Time Deposit, 0.083%, 1/2/14 | 1,067,953 | 1,067,953 |
| |
| Total Time Deposit (Cost $1,067,953) | | 1,067,953 |
| |
| |
| TOTAL INVESTMENTS (Cost $199,325,308) - 99.7% | | 198,978,085 |
| Other assets and liabilities, net - 0.3% | | 654,910 |
| NET ASSETS - 100% | | $199,632,995 |
| |
| |
| NET ASSETS CONSISTS OF: | | |
| Paid-in capital applicable to 3,759,101 shares of common stock outstanding; | | |
| $0.10 par value, 20,000,000 shares authorized | | $200,121,621 |
| Undistributed net investment income | | 477,422 |
| Accumulated net realized gain (loss) | | (618,825) |
| Net unrealized appreciation (depreciation) | | (347,223) |
| |
| NET ASSETS | | $199,632,995 |
| |
| NET ASSET VALUE PER SHARE | | $53.11 |
(e) Security is exempt from registration under Rule 144A of the Securities Act of 1933. These securities may be resold in transactions exempt from registration, normally to qualified institutional buyers.
(r) The coupon rate shown on floating or adjustable rate securities represents the rate at period end.
Abbreviations:
LLC: Limited Liability Corporation
LP: Limited Partnership
plc: Public Limited Company
REIT: Real Estate Investment Trust
See notes to financial statements.
www.calvert.com CALVERT VP INVESTMENT GRADE BOND INDEX PORTFOLIO ANNUAL REPORT 13
| |
| STATEMENT OF OPERATIONS |
| YEAR ENDED DECEMBER 31, 2013 |
| |
| |
| NET INVESTMENT INCOME | |
| Investment Income: | |
| Dividend income | $15,957 |
| Interest income | 4,745,876 |
| Total investment income | 4,761,833 |
| |
| |
| Expenses: | |
| Investment advisory fee | 609,082 |
| Transfer agency fees and expenses | 30,486 |
| Directors’ fees and expenses | 34,665 |
| Administrative fees | 203,027 |
| Accounting fees | 33,024 |
| Custodian fees | 36,559 |
| Reports to shareholders | 17,532 |
| Professional fees | 43,723 |
| Miscellaneous | 14,803 |
| Total expenses | 1,022,901 |
| |
| |
| NET INVESTMENT INCOME | 3,738,932 |
| |
| |
| REALIZED AND UNREALIZED GAIN (LOSS) ON INVESTMENTS | |
| Net realized gain (loss) | 376,010 |
| Change in unrealized appreciation (depreciation) | (9,969,706) |
| |
| NET REALIZED AND UNREALIZED GAIN | |
| (LOSS) ON INVESTMENTS | (9,593,696) |
| |
| INCREASE (DECREASE) IN NET ASSETS | |
| RESULTING FROM OPERATIONS | ($5,854,764) |
See notes to financial statements.
14 www.calvert.com CALVERT VP INVESTMENT GRADE BOND INDEX PORTFOLIO ANNUAL REPORT
| | |
| STATEMENTS OF CHANGES IN NET ASSETS |
| |
| | YEAR ENDED | YEAR ENDED |
| | DECEMBER 31, | DECEMBER 31, |
| INCREASE (DECREASE) IN NET ASSETS | 2013 | 2012 |
| Operations: | | |
| Net investment income | $3,738,932 | $3,870,364 |
| Net realized gain (loss) | 376,010 | 1,442,780 |
| Change in unrealized appreciation (depreciation) | (9,969,706) | 1,634,051 |
| |
| |
| INCREASE (DECREASE) IN NET ASSETS | | |
| RESULTING FROM OPERATIONS | (5,854,764) | 6,947,195 |
| |
| |
| Distributions to shareholders from: | | |
| Net investment income | (4,774,262) | (4,523,142) |
| Net realized gain | (283,516) | (999,300) |
| Total distributions | (5,057,778) | (5,522,442) |
| |
| Capital share transactions: | | |
| Shares sold | 26,901,548 | 48,085,664 |
| Reinvestment of distributions | 5,057,778 | 5,522,442 |
| Shares redeemed | (24,855,975) | (20,420,976) |
| Total capital share transactions | 7,103,351 | 33,187,130 |
| |
| |
| TOTAL INCREASE (DECREASE) IN NET ASSETS | (3,809,191) | 34,611,883 |
| |
| |
| NET ASSETS | | |
| Beginning of year | 203,442,186 | 168,830,303 |
| End of year (including undistributed net investment income of | | |
| $477,422 and $535,919, respectively) | $199,632,995 | $203,442,186 |
| |
| |
| CAPITAL SHARE ACTIVITY | | |
| Shares sold | 487,588 | 848,618 |
| Reinvestment of distributions | 95,071 | 98,404 |
| Shares redeemed | (452,492) | (359,942) |
| Total capital share activity | 130,167 | 587,080 |
See notes to financial statements.
www.calvert.com CALVERT VP INVESTMENT GRADE BOND INDEX PORTFOLIO ANNUAL REPORT 15
NOTES TO FINANCIAL STATEMENTS
NOTE A –- SIGNIFICANT ACCOUNTING POLICIES
General: Calvert VP Investment Grade Bond Index Portfolio (formerly known as Calvert VP Barclays Capital Aggregate Bond Index Portfolio) (the “Portfolio”), a series of Calvert Variable Products, Inc. (the “Fund”), is registered under the Investment Company Act of 1940 as a diversified, open-end management investment company. The Fund is comprised of twelve separate portfolios. The operations of each series of the Fund are accounted for separately. Shares of the Portfolio are sold without sales charge to affiliated and unaffiliated insurance companies for allocation to certain of their variable separate accounts.
Security Valuation: Net asset value per share is determined every business day as of the close of the regular session of the New York Stock Exchange (generally 4:00 p.m. Eastern time). The Portfolio uses independent pricing services approved by the Board of Directors (“the Board”) to value its investments wherever possible. Investments for which market quotations are not available or deemed not reliable are fair valued in good faith under the direction of the Board.
The Board has adopted Valuation Procedures (the “Procedures”) to determine the fair value of securities and other financial instruments for which market prices are not readily available or which may not be reliably priced. The Board has delegated the day-to-day responsibility for determining the fair value of assets of the Portfolio to Calvert Investment Management, Inc. (the “Advisor” or “Calvert”) and has provided these Procedures to govern Calvert in its valuation duties.
Calvert has chartered an internal Valuation Committee to oversee the implementation of these Procedures and to assist it in carrying out the valuation responsibilities that the Board has delegated.
The Valuation Committee meets on a regular basis to review illiquid securities and other investments which may not have readily available market prices. The Valuation Committee’s fair valuation determinations are subject to review, approval and ratification by the Board at its next regularly scheduled meeting covering the calendar quarter in which the fair valuation was determined.
The Valuation Committee utilizes various methods to measure the fair value of the Portfolio’s investments. Generally Accepted Accounting Principles (GAAP) establishes a disclosure hierarchy that categorizes the inputs to valuation techniques used to value assets and liabilities at measurement date. These inputs are summarized in the three broad levels listed below:
Level 1 – quoted prices in active markets for identical securities
Level 2 – other significant observable inputs (including quoted prices for similar securities, interest rates, prepayment speeds, credit risk, etc.)
Level 3 – significant unobservable inputs (including the Portfolio’s own assumptions in determining the fair value of investments) The inputs or methodologies used for valuing securities are not necessarily an indication of the risk associated with investing in those securities.
Changes in valuation techniques may result in transfers in or out of an investment’s assigned level within the hierarchy during the period. There were no such transfers during the period. Valuation techniques used to value the Portfolio’s investments by major category are as follows: Debt securities, including restricted securities, are valued based on evaluated prices received from independent pricing services or from dealers who make markets in such securities. For corporate bonds, sovereign government bonds, and U.S. government and government agency obligations, pricing services utilize matrix pricing which considers yield or price of bonds of comparable quality, coupon, maturity and type as well as dealer supplied prices and such securities are generally categorized as Level 2 in the hierarchy. For
16 www.calvert.com CALVERT VP INVESTMENT GRADE BOND INDEX PORTFOLIO ANNUAL REPORT
asset-backed securities, commercial mortgage-backed securities, and U.S. government agency mortgage-backed securities, pricing services utilize matrix pricing which considers prepayment speed assumptions, attributes of the collateral, yield or price of bonds of comparable quality, coupon, maturity and type as well as dealer supplied prices and, accordingly, such securities are generally categorized as Level 2 in the hierarchy. Short-term securities of sufficient credit quality with remaining maturities of sixty days or less for which quotations are not readily available are valued at amortized cost, which approximates fair value, and are categorized as Level 2 in the hierarchy.
When independent prices are unavailable or unreliable, debt securities may be valued utilizing pricing matrices which consider similar factors that would be used by independent pricing services. These are generally categorized as Level 2 in the hierarchy but may be Level 3 depending on the circumstances.
If a market value cannot be determined for a security using the methodologies described above, or if, in the good faith opinion of the Advisor, the market value does not constitute a readily available market quotation, or if a significant event has occurred that would materially affect the value of the security, the security will be fair valued as determined in good faith by the Valuation Committee.
The Valuation Committee considers a number of factors, including significant unobservable valuation inputs when arriving at fair value. It considers all significant facts that are reasonably available and relevant to the determination of fair value.
The Valuation Committee primarily employs a market-based approach which may use related or comparable assets or liabilities, recent transactions, market multiples, book values, and other relevant information for the investment to determine the fair value of the investment. When more appropriate, the fund may employ an income-based or cost approach. An income-based valuation approach discounts anticipated future cash flows of the investment to calculate a present amount (discounted). The measurement is based on the value indicated by current market expectations about those future amounts. Discounts may also be applied due to the nature or duration of any restrictions on the disposition of the investments. A cost based approach is based on the amount that currently would be required to replace the service capacity of an asset (current replacement cost). From the seller’s perspective, the price that would be received for the asset is determined based on the cost to a buyer to acquire or construct a substitute asset of comparable utility, adjusted for obsolescence.
The values assigned to fair value investments are based on available information and do not necessarily represent amounts that might ultimately be realized. Further, due to the inherent uncertainty of valuations of such investments, the fair values may differ significantly from the values that would have been used had an active market existed, and the differences could be material. The Valuation Committee employs various methods for calibrating these valuation approaches including a regular review of key inputs and assumptions, transactional back-testing or disposition analysis and reviews of any related market activity.
At December 31, 2013, no securities were fair valued in good faith under the direction of the Board.
www.calvert.com CALVERT VP INVESTMENT GRADE BOND INDEX PORTFOLIO ANNUAL REPORT 17
The following is a summary of the inputs used to value the Portfolio’s net assets as of December 31, 2013:
| | | VALUATION INPUTS | |
| INVESTMENTS IN SECURITIES* | LEVEL 1 | LEVEL 2 | LEVEL 3 | TOTAL |
| Asset-backed securities | — | $103,664 | — | $103,664 |
| Commercial mortgage-backed securities | — | 2,577,029 | — | 2,577,029 |
| Corporate debt | — | 43,744,681 | — | 43,744,681 |
| Other debt obligations | — | 1,067,953 | — | 1,067,953 |
| U.S. government obligations | — | 151,484,758 | — | 151,484,758 |
| TOTAL | — | $198,978,085 | — | $198,978,085 |
* For a complete listing of investments, please refer to the Statement of Net Assets.
Security Transactions and Investment Income: Security transactions are accounted for on trade date. Realized gains and losses are recorded on an identified cost basis and may include proceeds from litigation. Dividend income is recorded on the ex-dividend date. Distributions received on securities that represent a return of capital or capital gain are recorded as a reduction of cost of investments and/or as a realized gain. Interest income, which includes amortization of premium and accretion of discount on debt securities, is accrued as earned.
Distributions to Shareholders: Distributions to shareholders are recorded by the Portfolio on ex-dividend date. Dividends from net investment income and distributions from net realized capital gains, if any, are paid at least annually. Distributions are determined in accordance with income tax regulations which may differ from generally accepted accounting principles; accordingly, periodic reclassifications are made within the Portfolio’s capital accounts to reflect income and gains available for distribution under income tax regulations.
Estimates: The preparation of financial statements in conformity with accounting principles generally accepted in the United States requires management to make estimates and assumptions that affect the reported amounts of assets and liabilities and disclosure of contingent assets and liabilities at the date of the financial statements and the reported amounts of income and expenses during the reporting period. Actual results could differ from those estimates.
Federal Income Taxes: No provision for federal income or excise tax is required since the Portfolio intends to continue to qualify as a regulated investment company under the Internal Revenue Code and to distribute substantially all of its taxable earnings.
Management has analyzed the Portfolio’s tax positions taken for all open federal income tax years and has concluded that no provision for federal income tax is required in the Portfolio’s financial statements. A Portfolio’s federal tax return is subject to examination by the Internal Revenue Service for a period of three years.
NOTE B — RELATED PARTY TRANSACTIONS
Calvert Investment Management, Inc. (the “Advisor”) is wholly-owned by Calvert Investments, Inc., which is indirectly wholly-owned by Ameritas Mutual Holding Company. The Advisor provides investment advisory services and pays the salaries and fees of officers and Directors of the Fund who are employees of the Advisor or its affiliates. For its services, the Advisor receives an annual fee, payable monthly, of .30% of the Portfolio’s average daily net assets. Under the terms of the agreement, $45,717 was payable at year end. In addition, $23,837 was payable at year end for operating expenses paid by the Advisor during December 2013.
The Advisor has contractually agreed to limit net annual portfolio operating expenses through April 30, 2014. The contractual expense cap is .60%. For the purpose of this expense limit, operating expenses do not include interest expense, brokerage commissions, taxes, and extraordinary expenses. This expense limitation does not
18 www.calvert.com CALVERT VP INVESTMENT GRADE BOND INDEX PORTFOLIO ANNUAL REPORT
limit acquired fund fees and expenses, if any.
Calvert Investment Administrative Services, Inc., an affiliate of the Advisor, provides administrative services to the Portfolio for an annual fee, payable monthly, of .10% of the Portfolio’s average daily net assets. Under the terms of the agreement, $15,239 was payable at year end.
Calvert Investment Services, Inc. (“CIS”), an affiliate of the Advisor, acts as shareholder servicing agent for the Portfolio. For its services, CIS received a fee of $18,534 for the year ended December 31, 2013. Under the terms of the agreement, $1,293 was payable at year end. Boston Financial Data Services, Inc. is the transfer and dividend disbursing agent.
Each Director of the Fund who is not an employee of the Advisor or its affiliates receives a fee of $1,500 for each Board and Committee meeting attended plus an annual fee of $40,000. Committee chairs receive an additional $5,000 annual retainer. Directors’ fees are allocated to each of the portfolios served.
NOTE C — INVESTMENT ACTIVITY AND TAX INFORMATION
During the year, the cost of purchases and proceeds from sales of investments, other than U.S. government and short-term securities, were $25,351,242 and $23,115,608, respectively. U.S. government security purchases and sales were $65,058,963 and $59,423,168, respectively.
| Capital Loss Carryforwards | |
| No Expiration Date: | |
| Short-term | ($343,440) |
Under the Regulated Investment Company Modernization Act of 2010, capital losses incurred in taxable years beginning after December 22, 2010 can be carried forward to offset future capital gains for an unlimited period. These losses will retain their character as either long-term or short-term.
The tax character of dividends and distributions paid during the years ended December 31, 2013 and December 31, 2012 was as follows:
| Distributions paid from: | 2013 | 2012 |
| Ordinary income | $4,858,697 | $5,129,135 |
| Long-term capital gain | 199,081 | 393,307 |
| Total | $5,057,778 | $5,522,442 |
As of December 31, 2013, the tax basis components of distributable earnings/(accumulated losses) and the federal tax cost were as follows:
| Unrealized appreciation | $3,556,754 |
| Unrealized (depreciation) | (4,179,362) |
| Net unrealized appreciation/(depreciation) | ($622,608) |
| Undistributed ordinary income | $477,422 |
| Capital loss carryforward | ($343,440) |
| Federal income tax cost of investments | $199,600,693 |
The differences between the components of distributable earnings on a tax basis and the amounts reflected in the statement of net assets are primarily due to temporary book-tax differences that will reverse in a subsequent period. These differences are due to wash sales.
www.calvert.com CALVERT VP INVESTMENT GRADE BOND INDEX PORTFOLIO ANNUAL REPORT 19
Reclassifications, as shown in the table below, have been made to the Portfolio’s components of net assets to reflect income and gains available for distribution (or available capital loss carryovers, as applicable) under income tax law and regulations. These reclassifications are due to permanent book-tax differences and have no impact on net assets. The primary permanent differences causing such reclassifications for the Portfolio are due to asset-backed securities.
| Undistributed net investment income | $976,833 |
| Accumulated net realized gain (loss) | (976,833) |
NOTE D — LINE OF CREDIT
A financing agreement is in place with the Calvert Funds and State Street Corporation (“SSC”). Under the agreement, SSC provides an unsecured line of credit facility, in the aggregate amount of $50 million ($25 million committed and $25 million uncommitted), accessible by the Funds for temporary or emergency purposes only. Borrowings under the committed facility bear interest at the higher of the London Interbank Offered Rate (LIBOR) or the overnight Federal Funds Rate plus 1.25% per annum. A commitment fee of .11% per annum is incurred on the unused portion of the committed facility, which is allocated to all participating funds. The Portfolio had no loans outstanding pursuant to this line of credit at December 31, 2013.
For the year ended December 31, 2013, borrowing information by the Portfolio under the agreement was as follows:
| | WEIGHTED | | MONTH OF |
| AVERAGE | AVERAGE | MAXIMUM | MAXIMUM |
| DAILY | INTEREST | AMOUNT | AMOUNT |
| BALANCE | RATE | BORROWED | BORROWED |
| $222 | 1.42% | $41,163 | June 2013 |
NOTE E — SUBSEQUENT EVENTS
In preparing the financial statements as of December 31, 2013, no subsequent events or transactions occurred that would have required recognition or disclosure in these financial statements.
20 www.calvert.com CALVERT VP INVESTMENT GRADE BOND INDEX PORTFOLIO ANNUAL REPORT
| | | |
| FINANCIAL HIGHLIGHTS |
| |
| | YEARS ENDED |
| | DECEMBER
31, | DECEMBER
31, | DECEMBER
31, |
| | 2013 | 2012 | 2011 (z) |
| Net asset value, beginning | $56.06 | $55.50 | $52.80 |
| Income from investment operations: | | | |
| Net investment income | 1.03 | 1.08 | 1.42 |
| Net realized and unrealized gain (loss) | (2.59) | 1.04 | 3.01 |
| Total from investment operations | (1.56) | 2.12 | 4.43 |
| Distributions from: | | | |
| Net investment income | (1.31) | (1.28) | (1.35) |
| Net realized gain | (.08) | (.28) | (.38) |
| Total distributions | (1.39) | (1.56) | (1.73) |
| Total increase (decrease) in net asset value | (2.95) | .56 | 2.70 |
| Net asset value, ending | $53.11 | $56.06 | $55.50 |
| |
| Total return* | (2.80%) | 3.83% | 8.39% |
| Ratios to average net assets: A | | | |
| Net investment income | 1.84% | 2.07% | 2.58% |
| Total expenses | .50% | .49% | .50% |
| Expenses before offsets | .50% | .49% | .50% |
| Net expenses | .50% | .49% | .50% |
| Portfolio turnover | 41% | 43% | 40% |
| Net assets, ending (in thousands) | $199,633 | $203,442 | $168,830 |
| |
| | | YEARS ENDED |
| | | DECEMBER
31, | DECEMBER
31, |
| | | 2010 (z) | 2009 (z) |
| Net asset value, beginning | | $50.82 | $51.17 |
| Income from investment operations: | | | |
| Net investment income | | 1.56 | 2.00 |
| Net realized and unrealized gain (loss) | | 1.67 | .35 |
| Total from investment operations | | 3.23 | 2.35 |
| Distributions from: | | | |
| Net investment income | | (1.08) | (2.50) |
| Net realized gain | | (.17) | (.20) |
| Total distributions | | (1.25) | (2.70) |
| Total increase (decrease) in net asset value | | 1.98 | (.35) |
| Net asset value, ending | | $52.80 | $50.82 |
| |
| Total return* | | 6.37% | 4.59% |
| Ratios to average net assets: A | | | |
| Net investment income | | 2.89% | 3.83% |
| Total expenses | | .53% | .54% |
| Expenses before offsets | | .53% | .54% |
| Net expenses | | .52% | .54% |
| Portfolio turnover | | 99% | 71% |
| Net assets, ending (in thousands) | | $109,616 | $37,629 |
See notes to financial highlights.
www.calvert.com CALVERT VP INVESTMENT GRADE BOND INDEX PORTFOLIO ANNUAL REPORT 21
A Total expenses do not reflect amounts reimbursed and/or waived by the Advisor or reductions from expense offset arrangements. Expenses before offsets reflect expenses after reimbursement and/or waiver by the Advisor but prior to reductions from expense offset arrangements. Net expenses are net of all reductions and represent the net expenses paid by the portfolio.
(z) Per share figures calculated using the Average Shares Method.
* Total return is not annualized for periods of less than one year and does not reflect charges and expenses of the variable annuity or variable universal life contract.
See notes to financial statements.
22 www.calvert.com CALVERT VP INVESTMENT GRADE BOND INDEX PORTFOLIO ANNUAL REPORT
EXPLANATION OF FINANCIAL TABLES
SCHEDULE OF INVESTMENTS
The Schedule of Investments is a snapshot of all securities held in the fund at their market value, on the last day of the reporting period. Securities are listed by asset type (e.g., common stock, corporate bonds, U.S. government obligations) and may be further broken down into sub-groups and by industry classification.
STATEMENT OF ASSETS AND LIABILITIES
The Statement of Assets and Liabilities is often referred to as the fund’s balance sheet. It lists the value of what the fund owns, is due and owes on the last day of the reporting period. The fund’s assets include the market value of securities owned, cash, receivables for securities sold and shareholder subscriptions, and receivables for dividends and interest payments that have been earned, but not yet received. The fund’s liabilities typically include payables for securities purchased and shareholder redemptions, and expenses owed but not yet paid. The statement also reports the fund’s net asset value (NAV) per share on the last day of the reporting period. The NAV is calculated by dividing the fund’s net assets (assets minus liabilities) by the number of shares outstanding. This statement is accompanied by a Schedule of Investments. Alternatively, if certain conditions are met, a Statement of Net Assets may be presented in lieu of this statement and the Schedule of Investments.
STATEMENT OF NET ASSETS
The Statement of Net Assets provides a detailed list of the fund’s holdings, including each security’s market value on the last day of the reporting period. The Statement of Net Assets includes a Schedule of Investments. Other assets are added and other liabilities subtracted from the investments total to calculate the fund’s net assets. Finally, net assets are divided by the outstanding shares of the fund to arrive at its share price, or Net Asset Value (NAV) per share.
At the end of the Statement of Net Assets is a table displaying the composition of the fund’s net assets. Paid in Capital is the money invested by shareholders and represents the bulk of net assets. Undistributed Net Investment Income and Accumulated Net Realized Gains usually approximate the amounts the fund had available to distribute to shareholders as of the statement date. Accumulated Realized Losses will appear as negative balances. Unrealized Appreciation (Depreciation) is the difference between the market value of the fund’s investments and their cost, and reflects the gains (losses) that would be realized if the fund were to sell all of its investments at their statement-date values.
STATEMENT OF OPERATIONS
The Statement of Operations summarizes the fund’s investment income earned and expenses incurred in operating the fund. Investment income includes dividends earned from stocks and interest earned from interest-bearing securities in the fund. Expenses incurred in operating the fund include the advisory fee paid to the investment advisor, administrative services fees, distribution plan expenses (if applicable), transfer agent fees, shareholder servicing expenses, custodial, legal, and audit fees, and the printing and postage expenses related to shareholder reports. Expense offsets (fees paid indirectly) are also shown. Credits earned from offset arrangements are used to reduce the fund’s expenses. This statement also shows net gains (losses) realized on the sale of investments and the increase or decrease in the unrealized appreciation (depreciation) on investments held during the period.
STATEMENT OF CHANGES IN NET ASSETS
The Statement of Changes in Net Assets shows how the fund’s total net assets changed during the two most recent reporting periods. Changes in the fund’s net assets are attributable to investment operations, distributions and capital share transactions.
The Operations section of the report summarizes information detailed in the Statement of Operations. The Distribution section shows the dividend and capital gain distributions made to shareholders. The amounts
www.calvert.com CALVERT VP INVESTMENT GRADE BOND INDEX PORTFOLIO ANNUAL REPORT (UNAUDITED) 23
shown as distributions in this section may not match the net investment income and realized gains amounts shown in the Operations section because distributions are determined on a tax basis and certain investments or transactions may be treated differently for financial statement and tax purposes. The Capital Share Transactions section shows the amount shareholders invested in the fund, either by purchasing shares or by reinvesting distributions, and the amounts redeemed. The corresponding numbers of shares issued, reinvested and redeemed are shown at the end of the report.
FINANCIAL HIGHLIGHTS
The Financial Highlights table provides a per-share breakdown by class of the components that affect the fund’s net asset value for current and past reporting periods. The table provides total return, total distributions, expense ratios, portfolio turnover and net assets for the applicable period. Total return is a measure of a fund’s performance that encompasses all elements of return: dividends, capital gain distributions and changes in net asset value. Total return is the change in value of an investment over a given period, assuming reinvestment of any dividends and capital gain distributions, expressed as a percentage of the initial investment. Total distributions include distributions from net investment income and net realized gains. Long-term gains are earned on securities held in the fund more than one year. Short-term gains, on the sale of securities held less than one year, are treated as ordinary dividend income for tax purposes. The expense ratio is a fund’s cost of doing business, expressed as a percentage of net assets. These expenses directly reduce returns to shareholders. Portfolio turnover measures the trading activity in a fund’s investment portfolio – how often securities are bought and sold by a fund. Portfolio turnover is affected by market conditions, changes in the size of the fund, the nature of the fund’s investments and the investment style of the portfolio manager.
PROXY VOTING
The Proxy Voting Guidelines that the Portfolio uses to determine how to vote proxies relating to portfolio securities is provided as an Appendix to the Fund’s Statement of Additional Information. The Statement of Additional Information can be obtained free of charge by calling the Fund at 1-800-368-2745, by visiting the Calvert website at www.calvert.com or by visiting the SEC’s website at www.sec.gov.
Information regarding how the Fund voted proxies relating to portfolio securities during the most recent 12-month period ended June 30 is available by calling the Fund, by visiting the Calvert website at www. calvert.com or visiting the SEC’s website at www.sec.gov.
AVAILABILITY OF QUARTERLY PORTFOLIO HOLDINGS
The Fund files its complete schedule of portfolio holdings with the SEC for the first and third quarters of each fiscal year on Form N-Q. The Fund’s Form N-Q is available on the SEC’s website at www.sec.gov. The Fund’s Form N-Q may be reviewed and copied at the SEC’s Public Reference Room in Washington, DC; information on the operation of the Public Reference Room may be obtained by calling 1-800-SEC-0330.
BASIS FOR BOARD’S APPROVAL OF INVESTMENT ADVISORY CONTRACTS
At a meeting held on December 11, 2013, the Board of Directors, and by a separate vote, the disinterested Directors, approved the continuance of the Investment Advisory Agreement between the Portfolio and the Advisor and the Investment Subadvisory Agreement between the Advisor and the Subadvisor with respect to the Portfolio.
In evaluating the Investment Advisory Agreement, the Board considered a variety of information relating to the Portfolio and the Advisor. The disinterested Directors reviewed a report prepared by the Advisor regarding various services provided to the Portfolio by the Advisor and its affiliates. Such report included, among other data, information regarding the Advisor’s personnel and the Advisor’s revenue and cost of providing services to
24 www.calvert.com CALVERT VP INVESTMENT GRADE BOND INDEX PORTFOLIO ANNUAL REPORT (UNAUDITED)
the Portfolio, and a separate report prepared by an independent third party, which provided a statistical analysis comparing the Portfolio’s investment performance, expenses, and fees to comparable mutual funds.
The disinterested Directors were separately represented by independent legal counsel with respect to their consideration of the reapproval of the Investment Advisory Agreement and the Investment Subadvisory Agreement. Prior to voting, the disinterested Directors reviewed the proposed continuance of the Investment Advisory Agreement and Investment Subadvisory Agreement with management and also met in private sessions with their counsel at which no representatives of management were present.
In the course of its deliberations regarding the Investment Advisory Agreement, the Board considered the following factors, among others: the nature, extent and quality of the services provided by the Advisor, including the personnel providing such services; the Advisor’s financial condition; the level and method of computing the Portfolio’s advisory fee; comparative performance, fee and expense information for the Portfolio; the profitability of the Calvert Family of Funds to the Advisor and its affiliates; the allocation of the Portfolio’s brokerage, including the Advisor’s process for monitoring “best execution”; the direct and indirect benefits, if any, derived by the Advisor and its affiliates from their relationship with the Portfolio; the effect of the Portfolio’s growth and size on the Portfolio’s performance and expenses; the Advisor’s compliance programs and policies; the Advisor’s performance of substantially similar duties for other funds; and any possible conflicts of interest.
In considering the nature, extent and quality of the services provided by the Advisor under the Investment Advisory Agreement, the Board reviewed information provided by the Advisor relating to its operations and personnel, including, among other information, biographical information on the Advisor’s supervisory and professional staff and descriptions of its organizational and management structure. The Board also took into account similar information provided periodically throughout the previous year by the Advisor, as well as the Board’s familiarity with the Advisor’s management through Board of Directors’ meetings, discussions and other reports. The Board considered the Advisor’s current level of staffing and overall resources. The Board also noted that it reviewed on a quarterly basis information regarding the Advisor’s compliance with applicable policies and procedures, including those related to personal investing. The Advisor’s administrative capabilities, including its ability to supervise the other service providers for the Portfolio, were also considered. The Board discussed the Advisor’s effectiveness in monitoring the performance of the Subadvisor and its timeliness in responding to performance issues. The Board observed that the scope of services provided by the Advisor generally had expanded over time as a result of regulatory, market and other changes. The Board took into consideration, among other factors, the effectiveness of the Portfolio’s and Advisor’s processes, policies and procedures and the Advisor’s personnel. The Board also took into account, among other items, periodic reports received from the Advisor over the past year concerning the Advisor’s ongoing review and enhancement of certain processes, policies and procedures of the Portfolio and the Advisor. The Board concluded that it was satisfied with the nature, extent and quality of services provided to the Portfolio by the Advisor under the Investment Advisory Agreement.
In considering the Portfolio’s performance, the Board noted that it reviewed on a quarterly basis detailed information about the Portfolio’s performance results, portfolio composition and investment strategies. In addition, the Board took into account overall financial market conditions. The Board also reviewed various comparative data provided to it in connection with its consideration of the renewal of the Investment Advisory Agreement, including, among other information, a comparison of the Portfolio’s total return with its Lipper index and with that of other mutual funds deemed to be in its peer universe by an independent third party in its report. This comparison indicated that the Portfolio performed below the median of its peer universe for the one-, three- and five-year periods ended June 30, 2013. The data also indicated that the Portfolio under-performed its Lipper index for the one-, three- and five-year periods ended June 30, 2013. The Board also took into account management’s discussion of the Portfolio’s performance, including the composition of the peer universe against which the Portfolio was being measured. Based upon its review, the Board concluded that the Portfolio’s performance was satisfactory relative to the performance of passively-managed funds that
www.calvert.com CALVERT VP INVESTMENT GRADE BOND INDEX PORTFOLIO ANNUAL REPORT (UNAUDITED) 25
track the same benchmark index as does the Portfolio.
In considering the Portfolio’s fees and expenses, the Board compared the Portfolio’s fees and total expense ratio with various comparative data for the funds in its peer group. Among other findings, the data indicated that the Portfolio’s advisory fee was above the median of its peer group and that total expenses were above the median of its peer group. The Board noted that the allocation of advisory and administrative fees may vary among the Portfolio’s peer group. The Board also took into account the Advisor’s current undertaking to maintain expense limitations for the Portfolio. The Board noted that the Advisor paid the Subadvisor’s sub-advisory fee under the Investment Subadvisory Agreement with respect to the Portfolio. The Board also took into account management’s discussion of the Portfolio’s expenses and certain factors that affected the level of such expenses, including the current size of the Portfolio. Based upon its review, the Board determined that the advisory fee was reasonable in view of the quality of services received by the Portfolio from the Advisor and the other factors considered.
The Board reviewed the Advisor’s profitability on a portfolio-by-portfolio basis. In reviewing the overall profitability of the advisory fee to the Portfolio’s Advisor, the Board also considered the fact that affiliates of the Advisor provided shareholder servicing and administrative services to the Portfolio for which they received compensation. The information considered by the Board included Calvert’s operating profit margin information both before and after tax expenses with respect to the services that the Advisor and its affiliates provided to the Calvert Family of Funds complex. The Board reviewed the profitability of the Advisor’s relationship with the Portfolio in terms of the total amount of annual advisory fees it received with respect to the Portfolio and whether the Advisor had the financial wherewithal to continue to provide services to the Portfolio. The Board also considered that the Advisor derived benefits to its reputation and other indirect benefits from its relationship with the Portfolio. In addition, the Board took into account that affiliates of the Advisor may benefit from certain indirect tax benefits relating to dividend received deductions and foreign tax credits. The Board also noted that the Advisor paid the subadvisory fee to the Subadvisor, an affiliate of the Advisor. Based upon its review, the Board concluded that the Advisor’s and its affiliates’ level of profitability from their relationship with the Portfolio was reasonable.
The Board considered the effect of the Portfolio’s current size and potential growth on its performance and fees. Although the Portfolio’s advisory fee did not contain breakpoints that would reduce the advisory fee rate on assets above specified asset levels, the Board noted that if the Portfolio’s assets increased over time, the Portfolio might realize other economies of scale if assets increased proportionally more than certain other expenses. The Board also noted that given the Portfolio’s current level of assets, the Portfolio would be unlikely to recognize economies of scale by implementing a breakpoint in the advisory fee at this time.
In reapproving the Investment Advisory Agreement, the Board, including the disinterested Directors, did not identify any single factor as controlling, and each Director may have attributed different weight to various factors.
In evaluating the Investment Subadvisory Agreement, the disinterested Directors reviewed information provided by the Subadvisor relating to its operations, personnel, investment philosophy, strategies and techniques. Among other information, the Subadvisor provided biographical information on portfolio management and other professional staff, performance information for itself, and descriptions of its investment philosophies, strategies and techniques, organizational and management structures and brokerage policies and practices.
The Board reapproved the Investment Subadvisory Agreement between the Subadvisor and the Advisor based on a number of factors relating to the Subadvisor’s ability to perform under the Investment Subadvisory Agreement. In the course of its deliberations, the Board evaluated, among other factors: the nature, extent and the quality of the services to be provided by the Subadvisor; the Subadvisor’s management style and long-term performance record; the Portfolio’s performance record and the Subadvisor’s performance in employing its investment strategies; the Subadvisor’s current level of staffing and its overall resources; the qualifications
26 www.calvert.com CALVERT VP INVESTMENT GRADE BOND INDEX PORTFOLIO ANNUAL REPORT (UNAUDITED)
and experience of the Subadvisor’s personnel; the Subadvisor’s financial condition with respect to its ability to perform the services required under the Investment Subadvisory Agreement; the Subadvisor’s risk management processes; the Subadvisor’s compliance systems, including those related to personal investing; and any disciplinary history. Based upon its review, the Board concluded that it was satisfied with the nature, extent and quality of services provided to the Portfolio by the Subadvisor under the Investment Subadvisory Agreement.
As noted above, the Board considered, among other information, the Portfolio’s performance during the one-, three- and five-year periods ended June 30, 2013 as compared to the Portfolio’s peer universe and noted that it reviewed on a quarterly basis detailed information about the Portfolio’s performance results, portfolio composition and investment strategies. The Board noted the Advisor’s expertise and resources in monitoring the performance, investment style and risk adjusted performance of the Subadvisor.
In considering the cost of services to be provided by the Subadvisor and the profitability to the Subadvisor of its relationship with the Portfolio, the Board noted that the Advisor and Subadvisor were affiliated and the subadvisory fee under the Investment Subadvisory Agreement was paid by the Advisor out of the advisory fee that the Advisor received under the Investment Advisory Agreement. Based upon its review, the Board determined that the subadvisory fee was reasonable in view of the quality of services received by the Portfolio from the Subadvisor and the other factors considered. Because the Advisor would pay the Subadvisor’s subadvisory fee, the cost of services to be provided by the Subadvisor and the level of profitability to the Subadvisor from its relationship with the Portfolio were not material factors in the Board’s deliberations. For similar reasons, the Board did not consider the potential economies of scale in the Subadvisor’s management of the Portfolio to be a material factor in its consideration.
In reapproving the Investment Subadvisory Agreement, the Board, including the disinterested Directors, did not identify any single factor as controlling, and each Director may have attributed different weight to various factors.
CONCLUSIONS
The Board reached the following conclusions regarding the Investment Advisory Agreement and the Investment Subadvisory Agreement, among others: (a) the Advisor has demonstrated that it possesses the capability and resources to perform the duties required of it under the Investment Advisory Agreement; (b) the Subadvisor is qualified to manage the Portfolio’s assets in accordance with the Portfolio’s investment objective and policies; (c) the Advisor and Subadvisor maintain appropriate compliance programs; (d) the Subadvisor is likely to execute its investment strategies consistently over time; (e) the performance of the Portfolio is satisfactory relative to the performance of passively-managed funds that track the same benchmark index as does the Portfolio; and (f) the Portfolio’s advisory and subadvisory fees are reasonable in view of the quality of services received by the Portfolio from the Advisor and Subadvisor and the other factors considered. Based on its conclusions, the Board determined that reapproval of the Investment Advisory Agreement and the Investment Subadvisory Agreement would be in the best interests of the Portfolio and its shareholders.
www.calvert.com CALVERT VP INVESTMENT GRADE BOND INDEX PORTFOLIO ANNUAL REPORT (UNAUDITED) 27
This report is intended to provide fund information to shareholders. It is not authorized for distribution to prospective investors unless preceded or accompanied by a prospectus.
Note: The information on our website is not incorporated by reference into this report; our website address is included as an inactive textual reference only.
Investors should carefully consider the investment objectives, risks, charges and expenses of the Calvert Funds. This and other important information is contained in the fund’s summary prospectus and prospectus, which can be obtained from your financial professional and should be read carefully before investing. You may also call Calvert at 800/368-2745 or visit www. calvert.com.
28 www.calvert.com CALVERT VP INVESTMENT GRADE BOND INDEX PORTFOLIO ANNUAL REPORT (UNAUDITED)
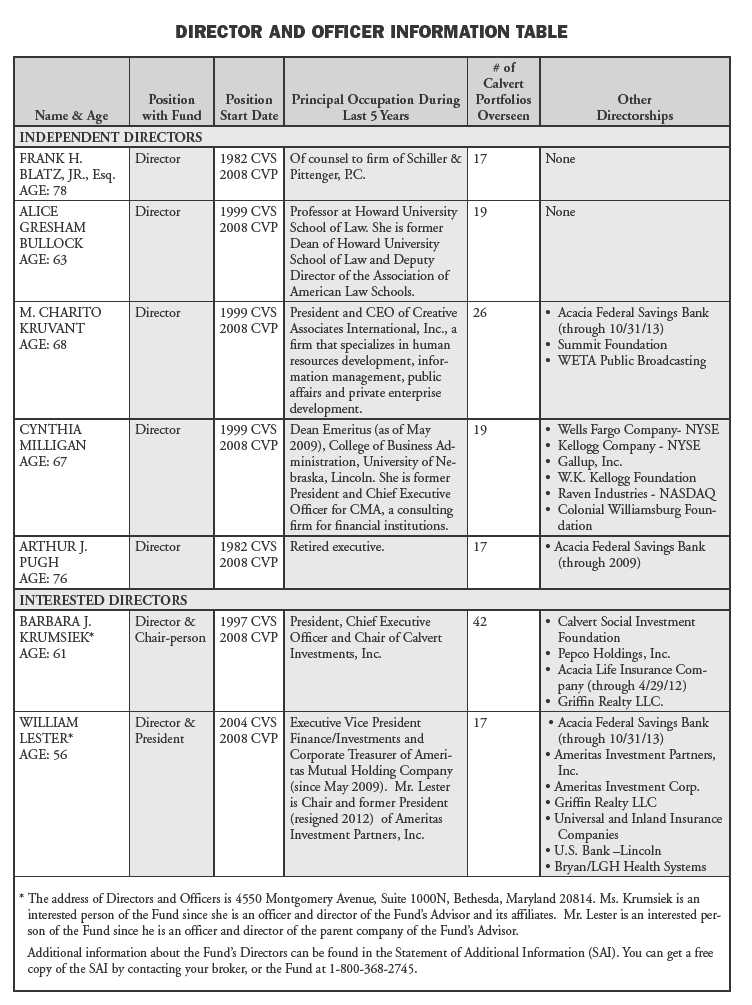
www.calvert.com CALVERT VP INVESTMENT GRADE BOND INDEX PORTFOLIO ANNUAL REPORT (UNAUDITED) 29
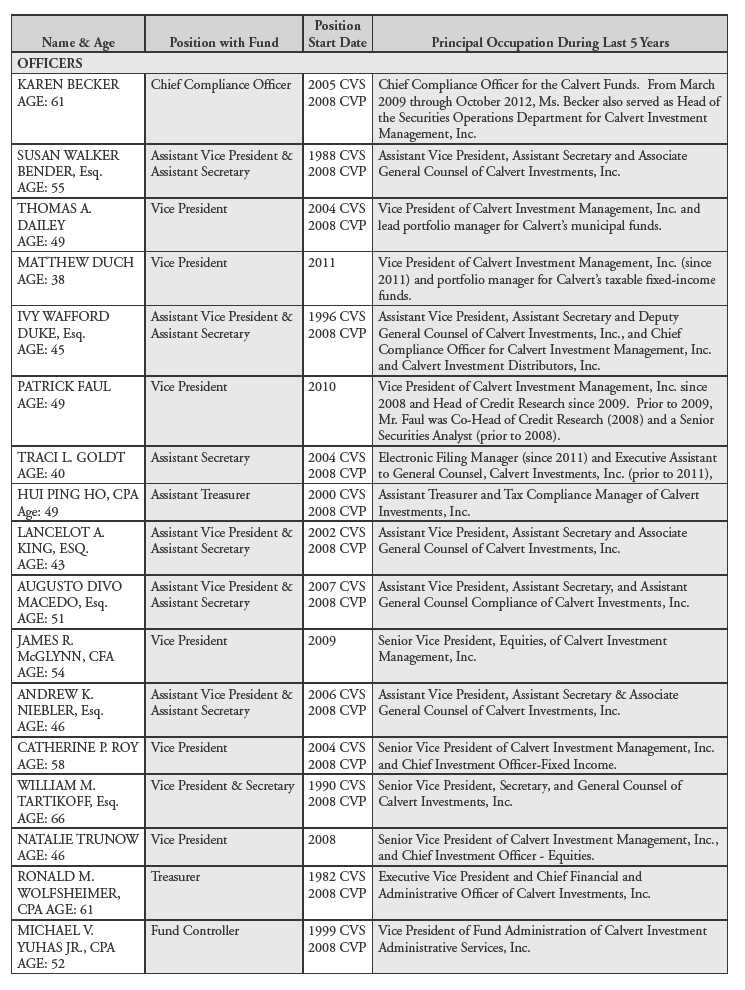
30 www.calvert.com CALVERT VP INVESTMENT GRADE BOND INDEX PORTFOLIO ANNUAL REPORT (UNAUDITED)
CALVERT VP INFLATION PROTECTED PLUS PORTFOLIO
Portfolio within Calvert Variable Products, Inc.
Managed by Ameritas Investment Partners, Inc., Subadvisor
INVESTMENT PERFORMANCE
For the year ended December 31, 2013, the Calvert VP Inflation Protected Plus Portfolio returned -7.41% compared with -8.61% for the Barclays U.S. Treasury Inflation Protected Securities (TIPs) Index. The smaller loss relative to the Index was primarily due to the Portfolio’s exposure to floating-rate securities and higher-yielding corporate bonds.
INVESTMENT CLIMATE
The fixed income markets performed poorly in 2013, as interest rates increased during the year. Beginning in May, speculation that the Federal Reserve (Fed) would begin tapering the quantitative easing (“QE2”) caused interest rates to start rising. Speculation became reality with the Fed’s announcement in December. As a result, the 10-year Treasury rate increased over the year from 1.76% to 3.03%, delivering negative returns for fixed-income investors, particularly on the longer end of the yield curve.
The rate of inflation, as measured by the Consumer Price Index for Urban Consumers, was up 1.2% in 2013 versus 1.7% in 2012. Core inflation, which excludes food and energy, advanced at a rate of 1.7% in 2013 versus 1.9% in 2012. Inflation decreased last year and appears to be under control entering 2014.
The difference between the yield on a 10-year Treasury bond and the 10-year TIPs bond was 2.26% at the end of 2013. This compares with 2.49% at the end of 2012. The smaller spread implies that investor’s expectations of future inflation decreased in 2013.
PORTFOLIO STRATEGY
The Portfolio primarily invests in TIPs and floating-rate securities, as well as a smaller number of fixed-rate corporate and agency bonds. The combination of longer-dated TIPs,
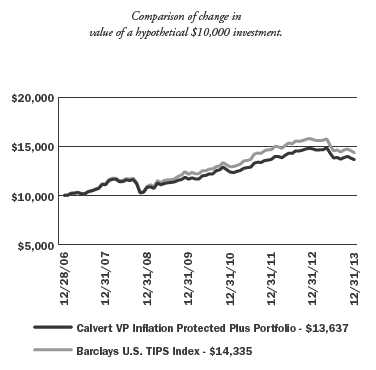
| AVERAGE ANNUAL TOTAL RETURN |
| (period ended 12.31.13) |
| One year | -7.41% |
| Five year | 4.73% |
| Since inception (12/28/2006) | 4.55% |
The performance data shown represents past performance, does not guarantee future results and assumes reinvestment of all dividends and distributions. All performance data reflects fee waivers and/or expense limitations, if any are in effect; in their absence performance would be lower. See Note B in Notes to Financial Statements. The investment return and principal value of an investment will fluctuate so that an investor’s shares, when redeemed, may be worth more or less than their original cost. Current performance may be lower or higher than the performance data quoted.
Visit www.calvert.com/institutional-VP-performance.html for current performance data. The gross expense ratio from the current prospectus for the Portfolio is 0.71%. This number may vary from the expense ratio shown elsewhere in this report because it is based on a different time period and, if applicable, does not include fee or expense waivers. The performance data and expense ratio reflect deduction of Portfolio operating expenses, but do not reflect charges and expenses imposed under the variable annuity or life insurance contract.
4 www.calvert.com CALVERT VP INFLATION PROTECTED PLUS PORTFOLIO ANNUAL REPORT
floating-rate notes, and intermediate-term corporate and agency bonds created an intermediate-duration profile slightly shorter than the Barclays TIPs Index throughout the year.1 The Portfolio continues to hold TIPs to protect against future inflation expectations. It also holds floating-rate securities, which generally provide greater income during times of inflation. Lastly, it selectively holds other fixed-rate securities that, in our opinion, we expect to provide excess relative performance in a stable market.
| | % OF TOTAL |
| INVESTMENT ALLOCATION | INVESTMENTS |
| |
| Long Term | 35% |
| Intermediate Term | 34% |
| Short Term | 31% |
| Total | 100% |
OUTLOOK
The outlook for inflation-protected securities depends heavily on the expected rate of future inflation and general movement of interest rates. The near-term outlook for inflation remains relatively benign entering 2014. However, the general level of interest rates is expected to rise as the Fed ends its quantitative easing. In this environment, floating-rate securities and shorter-dated bonds should outperform longer-dated securities. In the event that inflation expectations increase materially, Treasury inflation-protected securities should outperform securities without that protection.
January 2014
1. Duration measures a portfolio’s sensitivity to changes in interest rates. Generally, the longer the duration, the greater the change in value in response to a given change in interest rates.
www.calvert.com CALVERT VP INFLATION PROTECTED PLUS PORTFOLIO ANNUAL REPORT 5
SHAREHOLDER EXPENSE EXAMPLE
As a shareholder of the Fund, you incur two types of costs: (1) transaction costs, and (2) ongoing costs, including management fees and other Fund expenses. This Example is intended to help you understand your ongoing costs (in dollars) of investing in the Fund and to compare these costs with the ongoing costs of investing in other mutual funds.
This Example is based on an investment of $1,000 invested at the beginning of the period and held for the entire period (July 1, 2013 to December 31, 2013).
Note: Expenses do not reflect charges and expenses of the variable annuity or variable universal life contract.
Actual Expenses
The first line of the table below provides information about actual account values and actual expenses. You may use the information in this line, together with the amount you invested, to estimate the expenses that you paid over the period. Simply divide your account value by $1,000 (for example, an $8,600 account value divided by $1,000 = 8.6), then multiply the result by the number in the first line under the heading entitled “Expenses Paid During Period” to estimate the expenses you paid on your account during this period.
Hypothetical Example for Comparison Purposes
The second line of the table below provides information about hypothetical account values and hypothetical expenses based on the Fund’s actual expense ratio and an assumed rate of return of 5% per year before expenses, which is not the Fund’s actual return. The hypothetical account values and expenses may not be used to estimate the actual ending account balance or expenses you paid for the period. You may use this information to compare the ongoing costs of investing in the Fund and other funds. To do so, compare the 5% hypothetical example with the 5% hypothetical examples that appear in the shareholder reports of the other funds.
Please note that the expenses shown in the table are meant to highlight your ongoing costs only and do not reflect any transactional costs. Therefore, the second line of the table is useful in comparing ongoing costs only, and will not help you determine the relative total costs of owning different funds. In addition, if these transactional costs were included, your costs would have been higher.
| | BEGINNING | ENDING | EXPENSES PAID |
| | ACCOUNT VALUE | ACCOUNT VALUE | DURING PERIOD* |
| | 7/1/13 | 12/31/13 | 7/1/13 - 12/31/13 |
| |
| Actual | $1,000.00 | $987.91 | $3.73 |
| |
Hypothetical
(5% return per year before expenses) | $1,000.00 | $1,021.46 | $3.79 |
* Expenses are equal to the Fund’s annualized expense ratio of 0.74%, multiplied by the average account value over the period, multiplied by 184/365 (to reflect the one-half year period).
6 www.calvert.com CALVERT VP INFLATION PROTECTED PLUS PORTFOLIO ANNUAL REPORT
REPORT OF INDEPENDENT REGISTERED PUBLIC ACCOUNTING FIRM
The Board of Directors of Calvert Variable Products, Inc. and Shareholders of Calvert VP Inflation Protected Plus Portfolio: We have audited the accompanying statement of net assets of the Calvert VP Inflation Protected Plus Portfolio (the “Portfolio”), a series of Calvert Variable Products, Inc., as of December 31, 2013, and the related statement of operations for the year then ended, the statements of changes in net assets for each of the years in the two-year period then ended, and the financial highlights for each of the years in the five-year period then ended. These financial statements and financial highlights are the responsibility of the Portfolio’s management. Our responsibility is to express an opinion on these financial statements and financial highlights based on our audits.
We conducted our audits in accordance with the standards of the Public Company Accounting Oversight Board (United States). Those standards require that we plan and perform the audit to obtain reasonable assurance about whether the financial statements and financial highlights are free of material misstatement. An audit includes examining, on a test basis, evidence supporting the amounts and disclosures in the financial statements. Our procedures included confirmation of securities owned as of December 31, 2013, by correspondence with the custodian and brokers or by performing other appropriate auditing procedures. An audit also includes assessing the accounting principles used and significant estimates made by management, as well as evaluating the overall financial statement presentation. We believe that our audits provide a reasonable basis for our opinion.
In our opinion, the financial statements and financial highlights referred to above present fairly, in all material respects, the financial position of the Calvert VP Inflation Protected Plus Portfolio as of December 31, 2013, the results of its operations for the year then ended, the changes in its net assets for each of the years in the two-year period then ended, and the financial highlights for each of the years in the five-year period then ended, in conformity with U.S. generally accepted accounting principles.

Philadelphia, Pennsylvania
February 24, 2014
www.calvert.com CALVERT VP INFLATION PROTECTED PLUS PORTFOLIO ANNUAL REPORT 7
| | |
| STATEMENT OF NET ASSETS |
| DECEMBER 31, 2013 |
| |
| | PRINCIPAL | |
| U.S. TREASURY OBLIGATIONS - 50.6% | AMOUNT | VALUE |
| United States Treasury Inflation Indexed Bonds: | | |
| 2.375%, 1/15/25 | $1,858,650 | $2,136,431 |
| 2.00%, 1/15/26 | 2,118,222 | 2,344,937 |
| 2.375%, 1/15/27 | 1,968,923 | 2,267,953 |
| 1.75%, 1/15/28 | 2,118,291 | 2,267,895 |
| 3.625%, 4/15/28 | 1,732,896 | 2,292,296 |
| 2.50%, 1/15/29 | 1,849,379 | 2,173,309 |
| 3.875%, 4/15/29 | 1,420,770 | 1,947,121 |
| 3.375%, 4/15/32 | 1,644,825 | 2,188,260 |
| 2.125%, 2/15/40 | 1,945,116 | 2,185,521 |
| 2.125%, 2/15/41 | 1,919,790 | 2,157,065 |
| 0.75%, 2/15/42 | 2,842,565 | 2,285,155 |
| 0.625%, 2/15/43 | 2,946,110 | 2,265,282 |
| United States Treasury Inflation Indexed Notes: | | |
| 1.25%, 7/15/20 | 1,499,372 | 1,604,094 |
| 1.125%, 1/15/21 | 2,135,440 | 2,244,382 |
| 0.625%, 7/15/21 | 2,279,860 | 2,314,236 |
| 0.125%, 1/15/22 | 2,373,485 | 2,281,142 |
| 0.125%, 7/15/22 | 2,336,041 | 2,237,673 |
| 0.125%, 1/15/23 | 2,226,158 | 2,102,502 |
| 0.375%, 7/15/23 | 2,308,372 | 2,226,316 |
| |
| Total U.S. Treasury Obligations (Cost $42,935,759) | | 41,521,570 |
| |
| CORPORATE BONDS - 48.4% | | |
| American Express Co., 0.828%, 5/22/18 (r) | 1,000,000 | 999,308 |
| Amgen, Inc., 4.10%, 6/15/21 | 300,000 | 312,621 |
| AT&T, Inc., 1.146%, 11/27/18 (r) | 1,000,000 | 1,007,618 |
| Australia & New Zealand Banking Group Ltd., 0.853%, 10/6/15 (e)(r) | 1,000,000 | 1,006,576 |
| B/E Aerospace, Inc., 5.25%, 4/1/22 | 250,000 | 253,750 |
| Ball Corp., 4.00%, 11/15/23 | 1,000,000 | 895,000 |
| Bank of America Corp., 1.316%, 3/22/18 (r) | 1,000,000 | 1,013,280 |
| Bank of Montreal, 0.713%, 9/11/15 (r) | 1,000,000 | 1,004,662 |
| Bank of New York Mellon Corp., 0.469%, 10/23/15 (r) | 1,000,000 | 1,000,578 |
| Berkshire Hathaway Finance Corp., 2.90%, 10/15/20 | 100,000 | 99,169 |
| BP Capital Markets plc: | | |
| 0.876%, 9/26/18 (r) | 1,000,000 | 1,001,399 |
| 4.50%, 10/1/20 | 100,000 | 108,042 |
| 2.50%, 11/6/22 | 250,000 | 227,621 |
| CA, Inc., 5.375%, 12/1/19 | 100,000 | 111,193 |
| Capital One Financial Corp., 0.878%, 11/6/15 (r) | 1,000,000 | 1,002,616 |
| CenturyLink, Inc., 5.625%, 4/1/20 | 250,000 | 254,375 |
| Chesapeake Energy Corp., 6.625%, 8/15/20 | 250,000 | 279,375 |
| Cigna Corp., 4.00%, 2/15/22 | 100,000 | 101,787 |
| Cintas Corp. No. 2, 3.25%, 6/1/22 | 150,000 | 143,002 |
| Citigroup, Inc., 0.512%, 6/9/16 (r) | 1,000,000 | 983,779 |
| Constellation Brands, Inc., 6.00%, 5/1/22 | 100,000 | 106,750 |
| Daimler Finance North America LLC, 1.102%, 8/1/18 (e)(r) | 1,000,000 | 1,005,383 |
| DIRECTV Holdings LLC, 5.20%, 3/15/20 | 200,000 | 217,794 |
| Enbridge Energy Partners LP, 5.20%, 3/15/20 | 100,000 | 107,344 |
| Energizer Holdings, Inc., 4.70%, 5/19/21 | 200,000 | 202,031 |
| Energy Transfer Partners LP, 5.20%, 2/1/22 | 500,000 | 526,397 |
| Equifax, Inc., 3.30%, 12/15/22 | 100,000 | 92,312 |
8 www.calvert.com CALVERT VP INFLATION PROTECTED PLUS PORTFOLIO ANNUAL REPORT
| | |
| | PRINCIPAL | |
| CORPORATE BONDS - CONT’D | AMOUNT | VALUE |
| Florida Gas Transmission Co. LLC, 3.875%, 7/15/22 (e) | $200,000 | $195,998 |
| Ford Motor Credit Co. LLC: | | |
| 1.489%, 5/9/16 (r) | 1,000,000 | 1,014,673 |
| 8.125%, 1/15/20 | 400,000 | 500,180 |
| GATX Corp., 4.85%, 6/1/21 | 200,000 | 204,163 |
| General Electric Capital Corp., 0.959%, 4/2/18 (r) | 1,000,000 | 1,007,932 |
| General Mills, Inc.: | | |
| 0.537%, 1/29/16 (r) | 500,000 | 500,433 |
| 5.65%, 2/15/19 | 100,000 | 116,154 |
| General Motors Co., 6.25%, 10/2/43 (e) | 1,000,000 | 1,038,750 |
| Goldman Sachs Group, Inc., 1.436%, 4/30/18 (r) | 1,000,000 | 1,011,814 |
| HCP, Inc., 2.625%, 2/1/20 | 100,000 | 95,319 |
| Hertz Corp., 5.875%, 10/15/20 | 500,000 | 518,125 |
| Hewlett-Packard Co., 0.638%, 5/30/14 (r) | 1,000,000 | 1,000,216 |
| Intelsat Jackson Holdings SA, 7.25%, 10/15/20 | 500,000 | 546,875 |
| Jabil Circuit, Inc., 5.625%, 12/15/20 | 250,000 | 259,375 |
| JPMorgan Chase Bank, 0.574%, 6/13/16 (r) | 1,250,000 | 1,243,431 |
| L-3 Communications Corp., 5.20%, 10/15/19 | 200,000 | 216,170 |
| Liberty Property LP, 3.375%, 6/15/23 | 100,000 | 91,013 |
| MarkWest Energy Partners LP / MarkWest Energy Finance Corp.: | | |
| 6.25%, 6/15/22 | 163,000 | 172,372 |
| 4.50%, 7/15/23 | 500,000 | 468,750 |
| McCormick & Company, Inc., 3.90%, 7/15/21 | 500,000 | 513,557 |
| MDC Holdings, Inc., 5.625%, 2/1/20 | 700,000 | 733,250 |
| Morgan Stanley, 3.10%, 11/9/18 (r) | 1,500,000 | 1,544,727 |
| Mueller Water Products, Inc., 8.75%, 9/1/20 | 297,000 | 332,640 |
| NBCUniversal Enterprise, Inc., 0.929%, 4/15/18 (e)(r) | 1,000,000 | 1,003,661 |
| Northern Trust Corp., 3.45%, 11/4/20 | 100,000 | 102,849 |
| Precision Castparts Corp., 1.25%, 1/15/18 | 200,000 | 194,700 |
| Prudential Financial, Inc., 1.021%, 8/15/18 (r) | 1,000,000 | 1,003,173 |
| Rio Tinto Finance USA Ltd., 3.75%, 9/20/21 | 500,000 | 504,799 |
| Royal Caribbean Cruises Ltd., 5.25%, 11/15/22 | 250,000 | 250,000 |
| Ryland Group, Inc., 5.375%, 10/1/22 | 500,000 | 475,000 |
| SABMiller Holdings, Inc., 0.932%, 8/1/18 (e)(r) | 1,000,000 | 1,004,952 |
| Stanley Black & Decker, Inc., 2.90%, 11/1/22 | 150,000 | 139,354 |
| Steel Dynamics, Inc., 5.25%, 4/15/23 | 500,000 | 500,000 |
| Targa Resources Partners LP / Targa Resources Partners Finance Corp., 4.25%, 11/15/23 (e) | 500,000 | 447,500 |
| Teck Resources Ltd., 4.75%, 1/15/22 | 100,000 | 100,958 |
| The Hertz Corp., 6.25%, 10/15/22 | 100,000 | 103,250 |
| The Valspar Corp., 4.20%, 1/15/22 | 300,000 | 295,857 |
| Time Warner Cable, Inc., 5.00%, 2/1/20 | 200,000 | 203,072 |
| Total Capital Canada Ltd., 0.624%, 1/15/16 (r) | 1,000,000 | 1,005,286 |
| TransCanada PipeLines Ltd., 0.927%, 6/30/16 (r) | 1,000,000 | 1,009,398 |
| Verizon Communications, Inc., 1.993%, 9/14/18 (r) | 500,000 | 525,749 |
| Vulcan Materials Co., 7.50%, 6/15/21 | 600,000 | 684,000 |
| WellPoint, Inc., 3.70%, 8/15/21 | 200,000 | 199,261 |
| Wells Fargo & Co., 1.166%, 6/26/15 (r) | 1,000,000 | 1,011,141 |
| Wynn Las Vegas LLC / Wynn Las Vegas Capital Corp., 5.375%, 3/15/22 | 500,000 | 505,000 |
| Xerox Corp., 1.058%, 5/16/14 (r) | 1,000,000 | 1,000,827 |
| |
| Total Corporate Bonds (Cost $39,255,542) | | 39,659,466 |
www.calvert.com CALVERT VP INFLATION PROTECTED PLUS PORTFOLIO ANNUAL REPORT 9
| | |
| | PRINCIPAL | |
| TIME DEPOSIT - 0.4% | AMOUNT | VALUE |
| State Street Bank Time Deposit, 0.083%, 1/2/14 | $302,224 | $302,224 |
| |
| Total Time Deposit (Cost $302,224) | | 302,224 |
| |
| TOTAL INVESTMENTS (Cost $82,493,525) - 99.4% | | 81,483,260 |
| Other assets and liabilities, net - 0.6% | | 496,916 |
| NET ASSETS - 100% | | $81,980,176 |
| |
| |
| NET ASSETS CONSISTS OF: | | |
| Paid-in capital applicable to 1,453,781 shares of common stock outstanding; | | |
| $0.10 par value, 20,000,000 shares authorized | | $82,367,642 |
| Undistributed net investment income | | 112,379 |
| Accumulated net realized gain (loss) | | 510,420 |
| Net unrealized appreciation (depreciation) | | (1,010,265) |
| |
| NET ASSETS | | $81,980,176 |
| |
| NET ASSET VALUE PER SHARE | | $56.39 |
(e) Security is exempt from registration under Rule 144A of the Securities Act of 1933. These securities may be resold in transactions exempt from
registration, normally to qualified institutional buyers.
(r) The coupon rate shown on floating or adjustable rate securities represents the rate at period end.
Abbreviations:
LLC: Limited Liability Corporation
LP: Limited Partnership
plc: Public Limited Company
See notes to financial statements.
10 www.calvert.com CALVERT VP INFLATION PROTECTED PLUS PORTFOLIO ANNUAL REPORT
| |
| STATEMENT OF OPERATIONS |
| YEAR ENDED DECEMBER 31, 2013 |
| |
| NET INVESTMENT INCOME | |
| Investment Income: | |
| Interest income | $1,414,578 |
| Inflation principal income | 365,582 |
| Total investment income | 1,780,160 |
| |
| |
| Expenses: | |
| Investment advisory fee | 443,035 |
| Transfer agency fees and expenses | 14,633 |
| Accounting fees | 15,043 |
| Directors’ fees and expenses | 15,391 |
| Administrative fees | 88,607 |
| Custodian fees | 17,204 |
| Reports to shareholders | 3,689 |
| Professional fees | 32,489 |
| Miscellaneous | 9,209 |
| Total expenses | 639,300 |
| |
| |
| NET INVESTMENT INCOME | 1,140,860 |
| |
| |
| REALIZED AND UNREALIZED GAIN (LOSS) ON INVESTMENTS | |
| Net realized gain (loss) | 1,225,216 |
| Change in unrealized appreciation (depreciation) | (9,290,007) |
| |
| |
| NET REALIZED AND UNREALIZED GAIN | |
| (LOSS) ON INVESTMENTS | (8,064,791) |
| |
| INCREASE (DECREASE) IN NET ASSETS | |
| RESULTING FROM OPERATIONS | ($6,923,931) |
See notes to financial statements.
www.calvert.com CALVERT VP INFLATION PROTECTED PLUS PORTFOLIO ANNUAL REPORT 11
| | |
| STATEMENTS OF CHANGES IN NET ASSETS |
| |
| | YEAR ENDED | YEAR ENDED |
| | DECEMBER 31, | DECEMBER 31, |
| INCREASE (DECREASE) IN NET ASSETS | 2013 | 2012 |
| Operations: | | |
| Net investment income | $1,140,860 | $1,501,440 |
| Net realized gain (loss) | 1,225,216 | 275,534 |
| Change in unrealized appreciation (depreciation) | (9,290,007) | 3,970,890 |
| |
| |
| INCREASE (DECREASE) IN NET ASSETS | | |
| RESULTING FROM OPERATIONS | (6,923,931) | 5,747,864 |
| |
| Distributions to shareholders from: | | |
| Net investment income | (1,196,712) | (1,451,535) |
| Net realized gain | (825,102) | (263,520) |
| Total distributions | (2,021,814) | (1,715,055) |
| |
| |
| Capital share transactions: | | |
| Shares sold | 10,761,243 | 33,857,069 |
| Reinvestment of distributions | 2,021,814 | 1,715,055 |
| Shares redeemed | (15,741,666) | (8,111,758) |
| Total capital share transactions | (2,958,609) | 27,460,366 |
| |
| |
| TOTAL INCREASE (DECREASE) IN NET ASSETS | (11,904,354) | 31,493,175 |
| |
| |
| NET ASSETS | | |
| Beginning of year | 93,884,530 | 62,391,355 |
| End of year (including undistributed net investment | | |
| income of $112,379 and $168,231, respectively) | $81,980,176 | $93,884,530 |
| |
| |
| CAPITAL SHARE ACTIVITY | | |
| Shares sold | 178,145 | 550,875 |
| Shares reinvested | 35,835 | 27,401 |
| Shares redeemed | (263,898) | (131,473) |
| Total capital share activity | (49,918) | 446,803 |
See notes to financial statements.
12 www.calvert.com CALVERT VP INFLATION PROTECTED PLUS PORTFOLIO ANNUAL REPORT
NOTES TO FINANCIAL STATEMENTS
NOTE A — SIGNIFICANT ACCOUNTING POLICIES
General: Calvert VP Inflation Protected Plus Portfolio (the “Portfolio”), a series of Calvert Variable Products, Inc., (the “Fund”), is registered under the Investment Company Act of 1940 as a diversified, open-end management investment company. The Fund is comprised of twelve separate portfolios. The operations of each series of the Fund are accounted for separately. Shares of the Portfolio are sold without sales charge to affiliated and unaffiliated insurance companies for allocation to certain of their variable separate accounts.
Security Valuation: Net asset value per share is determined every business day as of the close of the regular session of the New York Stock Exchange (generally 4:00 p.m. Eastern time). The Portfolio uses independent pricing services approved by the Board of Directors (“the Board”) to value its investments wherever possible. Investments for which market quotations are not available or deemed not reliable are fair valued in good faith under the direction of the Board.
The Board has adopted Valuation Procedures (the “Procedures”) to determine the fair value of securities and other financial instruments for which market prices are not readily available or which may not be reliably priced. The Board has delegated the day-to-day responsibility for determining the fair value of assets of the Portfolio to Calvert Investment Management, Inc. (the “Advisor” or “Calvert”) and has provided these Procedures to govern Calvert in its valuation duties.
Calvert has chartered an internal Valuation Committee to oversee the implementation of these Procedures and to assist it in carrying out the valuation responsibilities that the Board has delegated.
The Valuation Committee meets on a regular basis to review illiquid securities and other investments which may not have readily available market prices. The Valuation Committee’s fair valuation determinations are subject to review, approval and ratification by the Board at its next regularly scheduled meeting covering the calendar quarter in which the fair valuation was determined.
The Valuation Committee utilizes various methods to measure the fair value of the Portfolio’s investments. Generally Accepted Accounting Principles (GAAP) establishes a disclosure hierarchy that categorizes the inputs to valuation techniques used to value assets and liabilities at measurement date. These inputs are summarized in the three broad levels listed below:
Level 1 – quoted prices in active markets for identical securities
Level 2 – other significant observable inputs (including quoted prices for similar securities, interest rates, prepayment speeds, credit risk, etc.)
Level 3 – significant unobservable inputs (including the Portfolio’s own assumptions in determining the fair value of investments) The inputs or methodologies used for valuing securities are not necessarily an indication of the risk associated with investing in those securities.
Changes in valuation techniques may result in transfers in or out of an investment’s assigned level within the hierarchy during the period. There were no such transfers during the period. Valuation techniques used to value the Portfolio’s investments by major category are as follows: Debt securities, including restricted securities, are valued based on evaluated prices received from independent pricing services or from dealers who make markets in such securities. For corporate bonds and U.S. government and government agency obligations, pricing services utilize matrix pricing which considers yield or price of bonds of comparable quality, coupon, maturity and type as well as dealer supplied prices, and such securities are generally categorized as Level 2 in the hierarchy. Short-term securities of sufficient credit quality with remaining maturities of sixty days or less for which quotations are not readily available
www.calvert.com CALVERT VP INFLATION PROTECTED PLUS PORTFOLIO ANNUAL REPORT 13
are valued at amortized cost, which approximates fair value, and are categorized as Level 2 in the hierarchy.
When independent prices are unavailable or unreliable, debt securities may be valued utilizing pricing matrices which consider similar factors that would be used by independent pricing services. These are generally categorized as Level 2 in the hierarchy but may be Level 3 depending on the circumstances.
If a market value cannot be determined for a security using the methodologies described above, or if, in the good faith opinion of the Advisor, the market value does not constitute a readily available market quotation, or if a significant event has occurred that would materially affect the value of the security, the security will be fair valued as determined in good faith by the Valuation Committee.
The Valuation Committee considers a number of factors, including significant unobservable valuation inputs when arriving at fair value. It considers all significant facts that are reasonably available and relevant to the determination of fair value.
The Valuation Committee primarily employs a market-based approach which may use related or comparable assets or liabilities, recent transactions, market multiples, book values, and other relevant information for the investment to determine the fair value of the investment. When more appropriate, the fund may employ an income-based or cost approach. An income-based valuation approach discounts anticipated future cash flows of the investment to calculate a present amount (discounted). The measurement is based on the value indicated by current market expectations about those future amounts. Discounts may also be applied due to the nature or duration of any restrictions on the disposition of the investments. A cost based approach is based on the amount that currently would be required to replace the service capacity of an asset (current replacement cost). From the seller’s perspective, the price that would be received for the asset is determined based on the cost to a buyer to acquire or construct a substitute asset of comparable utility, adjusted for obsolescence.
The values assigned to fair value investments are based on available information and do not necessarily represent amounts that might ultimately be realized. Further, due to the inherent uncertainty of valuations of such investments, the fair values may differ significantly from the values that would have been used had an active market existed, and the differences could be material. The Valuation Committee employs various methods for calibrating these valuation approaches including a regular review of key inputs and assumptions, transactional back-testing or disposition analysis and reviews of any related market activity.
At December 31, 2013, no securities were fair valued in good faith under the direction of the Board.
The following is a summary of the inputs used to value the Portfolio’s net assets as of December 31, 2013:
| | | VALUATION INPUTS | |
| INVESTMENTS IN SECURITIES* | LEVEL 1 | LEVEL 2 | LEVEL 3 | TOTAL |
| U.S. government obligations | — | $41,521,570 | — | $41,521,570 |
| Corporate debt | — | 39,659,466 | — | 39,659,466 |
| Other debt obligations | — | 302,224 | — | 302,224 |
| TOTAL | — | $81,483,260 | — | $81,483,260 |
*For a complete listing of investments, please refer to the Statement of Net Assets.
Treasury Inflation-Protected Securities: The Portfolio invests in Treasury Inflation-Protected Securities (“TIPS”), in which the principal amount is adjusted daily to keep pace with inflation. Interest is accrued based on the adjusted principal amount. The adjustments to principal due to inflation are reflected as increases or decreases to inflation principal income in the accompanying Statement of Operations. Such adjustments may have a significant impact on the Portfolio’s distributions.
14 www.calvert.com CALVERT VP INFLATION PROTECTED PLUS PORTFOLIO ANNUAL REPORT
Security Transactions and Investment Income: Security transactions are accounted for on trade date. Realized gains and losses are recorded on an identified cost basis. Interest income, which includes amortization of premium and accretion of discount on debt securities, is accrued as earned.
Distributions to Shareholders: Distributions to shareholders are recorded by the Portfolio on ex-dividend date. Dividends from net investment income and distributions from net realized capital gains, if any, are paid at least annually. Distributions are determined in accordance with income tax regulations which may differ from generally accepted accounting principles; accordingly, periodic reclassifications are made within the Portfolio’s capital accounts to reflect income and gains available for distribution under income tax regulations.
Estimates: The preparation of financial statements in conformity with accounting principles generally accepted in the United States requires management to make estimates and assumptions that affect the reported amounts of assets and liabilities and disclosure of contingent assets and liabilities at the date of the financial statements and the reported amounts of income and expenses during the reporting period. Actual results could differ from those estimates.
Federal Income Taxes: No provision for federal income or excise tax is required since the Portfolio intends to continue to qualify as a regulated investment company under the Internal Revenue Code and to distribute substantially all of its taxable earnings.
Management has analyzed the Portfolio’s tax positions taken for all open federal income tax years and has concluded that no provision for federal income tax is required in the Portfolio’s financial statements. A Portfolio’s federal tax return is subject to examination by the Internal Revenue Service for a period of three years.
NOTE B — RELATED PARTY TRANSACTIONS
Calvert Investment Management, Inc. (the “Advisor”) is wholly-owned by Calvert Investments, Inc., which is indirectly wholly-owned by Ameritas Mutual Holding Company. The Advisor provides investment advisory services and pays the salaries and fees of officers and Directors of the Fund who are employees of the Advisor or its affiliates. For its services, the Advisor receives an annual fee, payable monthly, of .50% of the Portfolio’s average daily net assets. Under the terms of the agreement, $31,173 was payable at year end. In addition, $11,566 was payable at year end for operating expenses paid by the Advisor during December 2013.
The Advisor has contractually agreed to limit net annual portfolio operating expenses through April 30, 2014. The contractual expense cap is .79%. For the purpose of this expense limit, operating expenses do not include interest expense, brokerage commissions, taxes, and extraordinary expenses. This expense limitation does not limit acquired fund fees and expenses, if any.
Calvert Investment Administrative Services, Inc., an affiliate of the Advisor, provides administrative services to the Portfolio for an annual fee, payable monthly, of .10% of the Portfolio’s average daily net assets. Under the terms of the agreement, $6,235 was payable at year end.
Calvert Investment Services, Inc. (“CIS”), an affiliate of the Advisor, acts as shareholder servicing agent for the Portfolio. For its services, CIS received a fee of $8,086 for the year ended December 31, 2013. Under the terms of the agreement, $565 was payable at year end. Boston Financial Data Services, Inc. is the transfer and dividend disbursing agent.
Each Director of the Fund who is not an employee of the Advisor or its affiliates receives a fee of $1,500 for each Board and Committee meeting attended plus an annual fee of $40,000. Committee chairs receive an additional $5,000 annual retainer. Directors’ fees are allocated to each of the portfolios served.
NOTE C — INVESTMENT ACTIVITY AND TAX INFORMATION
During the year, the cost of purchases and proceeds from sales of investments, other than short-term and U.S. Government securities, were $24,643,548 and $28,732,355, respectively. U.S. Government security purchases and sales were $16,166,199 and $16,410,843, respectively.
www.calvert.com CALVERT VP INFLATION PROTECTED PLUS PORTFOLIO ANNUAL REPORT 15
The tax character of dividends and distributions paid during the years ended December 31, 2013 and December 31, 2012 was as follows:
| Distributions paid from: | 2013 | 2012 |
| Ordinary income | $1,271,167 | $1,603,858 |
| Long-term capital gain | 750,647 | 111,197 |
| Total | $2,021,814 | $1,715,055 |
As of December 31, 2013, the tax basis components of distributable earnings/(accumulated losses) and the federal tax cost were as follows:
| |
| Unrealized appreciation | $1,354,085 |
| Unrealized (depreciation) | (2,417,831) |
| Net unrealized appreciation/(depreciation) | ($1,063,746) |
| Undistributed ordinary income | $166,375 |
| Undistributed long-term capital gain | $509,905 |
| Federal income tax cost of investments | $82,547,006 |
The differences between the components of distributable earnings on a tax basis and the amounts reflected in the statement of net assets are primarily due to temporary book-tax differences that will reverse in a subsequent period. These differences are due to treasury inflation protected securities and wash sales.
NOTE D — LINE OF CREDIT
A financing agreement is in place with the Calvert Funds and State Street Corporation (“SSC”). Under the agreement, SSC provides an unsecured line of credit facility, in the aggregate amount of $50 million ($25 million committed and $25 million uncommitted), accessible by the Funds for temporary or emergency purposes only. Borrowings under the committed facility bear interest at the higher of the London Interbank Offered Rate (LIBOR) or the overnight Federal Funds Rate plus 1.25% per annum. A commitment fee of .11% per annum is incurred on the unused portion of the committed facility, which is allocated to all participating funds. The Portfolio had no loans outstanding pursuant to this line of credit at December 31, 2013.
For the year ended December 31, 2013, borrowing information by the Portfolio under the agreement was as follows:
| | WEIGHTED | | MONTH OF |
| AVERAGE | AVERAGE | MAXIMUM | MAXIMUM |
| DAILY | INTEREST | AMOUNT | AMOUNT |
| BALANCE | RATE | BORROWED | BORROWED |
| $10,779 | 1.42% | $912,045 | February 2013 |
NOTE E — SUBSEQUENT EVENTS
In preparing the financial statements as of December 31, 2013, no subsequent events or transactions occurred that would have required recognition or disclosure in these financial statements.
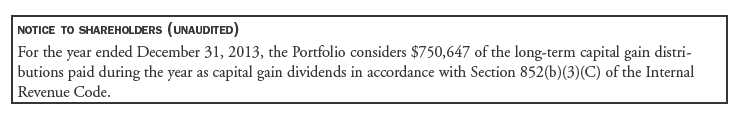
16 www.calvert.com CALVERT VP INFLATION PROTECTED PLUS PORTFOLIO ANNUAL REPORT
| | | |
| FINANCIAL HIGHLIGHTS |
| |
| | | YEARS ENDED | |
| | DECEMBER
31, | DECEMBER
31, | DECEMBER
31, |
| | 2013 | 2012 (z) | 2011 (z) |
| Net asset value, beginning | $62.44 | $59.03 | $54.84 |
| Income from investment operations: | | | |
| Net investment income | .81 | 1.15 | 1.42 |
| Net realized and unrealized gain (loss) | (5.44) | 3.42 | 4.29 |
| Total from investment operations | (4.63) | 4.57 | 5.71 |
| Distributions from: | | | |
| Net investment income | (.84) | (.98) | (1.07) |
| Net realized gain | (.58) | (.18) | (.45) |
| Total distributions | (1.42) | (1.16) | (1.52) |
| Total increase (decrease) in net asset value | (6.05) | 3.41 | 4.19 |
| Net asset value, ending | $56.39 | $62.44 | $59.03 |
| |
| Total return* | (7.41%) | 7.73% | 10.41% |
| Ratios to average net assets:A | | | |
| Net investment income | 1.29% | 1.87% | 2.45% |
| Total expenses | .72% | .71% | .79% |
| Expenses before offsets | .72% | .71% | .77% |
| Net expenses | .72% | .71% | .77% |
| Portfolio turnover | 46% | 24% | 38% |
| Net assets, ending (in thousands) | $81,980 | $93,885 | $62,391 |
| |
| | | YEARS ENDED |
| | | DECEMBER
31, | DECEMBER
31, |
| | | 2010 | 2009 |
| Net asset value, beginning | | $53.29 | $49.69 |
| Income from investment operations: | | | |
| Net investment income | | 1.23 | .22 |
| Net realized and unrealized gain (loss) | | 2.13 | 3.57 |
| Total from investment operations | | 3.36 | 3.79 |
| Distributions from: | | | |
| Net investment income | | (1.13) | (.19) |
| Net realized gain | | (.68) | — |
| Total distributions | | (1.81) | (.19) |
| Total increase (decrease) in net asset value | | 1.55 | 3.60 |
| Net asset value, ending | | $54.84 | $53.29 |
| |
| Total return* | | 6.33% | 7.62% |
| Ratios to average net assets: A | | | |
| Net investment income | | 1.96% | .57% |
| Total expenses | | .82% | .81% |
| Expenses before offsets | | .75% | .75% |
| Net expenses | | .75% | .75% |
| Portfolio turnover | | 96% | 123% |
| Net assets, ending (in thousands) | | $29,773 | $35,525 |
See notes to financial highlights.
www.calvert.com CALVERT VP INFLATION PROTECTED PLUS PORTFOLIO ANNUAL REPORT 17
A Total expenses do not reflect amounts reimbursed and/or waived by the Advisor or reductions from expense offset arrangements. Expenses before offsets reflect expenses after reimbursement and/or waiver by the Advisor but prior to reductions from expense offset arrangements. Net expenses are net of all reductions and represent the net expenses paid by the portfolio.
(z) Per share figures are calculated using Average Shares Method.
* Total return is not annualized for periods of less than one year and does not reflect charges and expenses of the variable annuity or variable universal life contract.
See notes to financial statements.
18 www.calvert.com CALVERT VP INFLATION PROTECTED PLUS PORTFOLIO ANNUAL REPORT
EXPLANATION OF FINANCIAL TABLES
SCHEDULE OF INVESTMENTS
The Schedule of Investments is a snapshot of all securities held in the fund at their market value, on the last day of the reporting period. Securities are listed by asset type (e.g., common stock, corporate bonds, U.S. government obligations) and may be further broken down into sub-groups and by industry classification.
STATEMENT OF ASSETS AND LIABILITIES
The Statement of Assets and Liabilities is often referred to as the fund’s balance sheet. It lists the value of what the fund owns, is due and owes on the last day of the reporting period. The fund’s assets include the market value of securities owned, cash, receivables for securities sold and shareholder subscriptions, and receivables for dividends and interest payments that have been earned, but not yet received. The fund’s liabilities typically include payables for securities purchased and shareholder redemptions, and expenses owed but not yet paid. The statement also reports the fund’s net asset value (NAV) per share on the last day of the reporting period. The NAV is calculated by dividing the fund’s net assets (assets minus liabilities) by the number of shares outstanding. This statement is accompanied by a Schedule of Investments. Alternatively, if certain conditions are met, a Statement of Net Assets may be presented in lieu of this statement and the Schedule of Investments.
STATEMENT OF NET ASSETS
The Statement of Net Assets provides a detailed list of the fund’s holdings, including each security’s market value on the last day of the reporting period. The Statement of Net Assets includes a Schedule of Investments. Other assets are added and other liabilities subtracted from the investments total to calculate the fund’s net assets. Finally, net assets are divided by the outstanding shares of the fund to arrive at its share price, or Net Asset Value (NAV) per share.
At the end of the Statement of Net Assets is a table displaying the composition of the fund’s net assets. Paid in Capital is the money invested by shareholders and represents the bulk of net assets. Undistributed Net Investment Income and Accumulated Net Realized Gains usually approximate the amounts the fund had available to distribute to shareholders as of the statement date. Accumulated Realized Losses will appear as negative balances. Unrealized Appreciation (Depreciation) is the difference between the market value of the fund’s investments and their cost, and reflects the gains (losses) that would be realized if the fund were to sell all of its investments at their statement-date values.
STATEMENT OF OPERATIONS
The Statement of Operations summarizes the fund’s investment income earned and expenses incurred in operating the fund. Investment income includes dividends earned from stocks and interest earned from interest-bearing securities in the fund. Expenses incurred in operating the fund include the advisory fee paid to the investment advisor, administrative services fees, distribution plan expenses (if applicable), transfer agent fees, shareholder servicing expenses, custodial, legal, and audit fees, and the printing and postage expenses related to shareholder reports. Expense offsets (fees paid indirectly) are also shown. Credits earned from offset arrangements are used to reduce the fund’s expenses. This statement also shows net gains (losses) realized on the sale of investments and the increase or decrease in the unrealized appreciation (depreciation) on investments held during the period.
STATEMENT OF CHANGES IN NET ASSETS
The Statement of Changes in Net Assets shows how the fund’s total net assets changed during the two most recent reporting periods. Changes in the fund’s net assets are attributable to investment operations, distributions and capital share transactions.
The Operations section of the report summarizes information detailed in the Statement of Operations. The Distribution section shows the dividend and capital gain distributions made to shareholders. The amounts
www.calvert.com CALVERT VP INFLATION PROTECTED PLUS PORTFOLIO ANNUAL REPORT (UNAUDITED) 19
shown as distributions in this section may not match the net investment income and realized gains amounts shown in the Operations section because distributions are determined on a tax basis and certain investments or transactions may be treated differently for financial statement and tax purposes. The Capital Share Transactions section shows the amount shareholders invested in the fund, either by purchasing shares or by reinvesting distributions, and the amounts redeemed. The corresponding numbers of shares issued, reinvested and redeemed are shown at the end of the report.
FINANCIAL HIGHLIGHTS
The Financial Highlights table provides a per-share breakdown by class of the components that affect the fund’s net asset value for current and past reporting periods. The table provides total return, total distributions, expense ratios, portfolio turnover and net assets for the applicable period. Total return is a measure of a fund’s performance that encompasses all elements of return: dividends, capital gain distributions and changes in net asset value. Total return is the change in value of an investment over a given period, assuming reinvestment of any dividends and capital gain distributions, expressed as a percentage of the initial investment. Total distributions include distributions from net investment income and net realized gains. Long-term gains are earned on securities held in the fund more than one year. Short-term gains, on the sale of securities held less than one year, are treated as ordinary dividend income for tax purposes. The expense ratio is a fund’s cost of doing business, expressed as a percentage of net assets. These expenses directly reduce returns to shareholders. Portfolio turnover measures the trading activity in a fund’s investment portfolio – how often securities are bought and sold by a fund. Portfolio turnover is affected by market conditions, changes in the size of the fund, the nature of the fund’s investments and the investment style of the portfolio manager.
PROXY VOTING
The Proxy Voting Guidelines that the Portfolio uses to determine how to vote proxies relating to portfolio securities is provided as an Appendix to the Fund’s Statement of Additional Information. The Statement of Additional Information can be obtained free of charge by calling the Fund at 1-800-368-2745, by visiting the Calvert website at www.calvert.com or by visiting the SEC’s website at www.sec.gov.
Information regarding how the Fund voted proxies relating to portfolio securities during the most recent 12-month period ended June 30 is available by calling the Fund, by visiting the Calvert website at www. calvert.com or visiting the SEC’s website at www.sec.gov.
AVAILABILITY OF QUARTERLY PORTFOLIO HOLDINGS
The Fund files its complete schedule of portfolio holdings with the SEC for the first and third quarters of each fiscal year on Form N-Q. The Fund’s Form N-Q is available on the SEC’s website at www.sec.gov. The Fund’s Form N-Q may be reviewed and copied at the SEC’s Public Reference Room in Washington, DC; information on the operation of the Public Reference Room may be obtained by calling 1-800-SEC-0330.
BASIS FOR BOARD’S APPROVAL OF INVESTMENT ADVISORY CONTRACTS
At a meeting held on December 11, 2013, the Board of Directors, and by a separate vote, the disinterested Directors, approved the continuance of the Investment Advisory Agreement between the Portfolio and the Advisor and the Investment Subadvisory Agreement between the Advisor and the Subadvisor with respect to the Portfolio.
In evaluating the Investment Advisory Agreement, the Board considered a variety of information relating to the Portfolio and the Advisor. The disinterested Directors reviewed a report prepared by the Advisor regarding various services provided to the Portfolio by the Advisor and its affiliates. Such report included, among other
20 www.calvert.com CALVERT VP INFLATION PROTECTED PLUS PORTFOLIO ANNUAL REPORT (UNAUDITED)
data, information regarding the Advisor’s personnel and the Advisor’s revenue and cost of providing services to the Portfolio, and a separate report prepared by an independent third party, which provided a statistical analysis comparing the Portfolio’s investment performance, expenses, and fees to comparable mutual funds.
The disinterested Directors were separately represented by independent legal counsel with respect to their consideration of the reapproval of the Investment Advisory Agreement and the Investment Subadvisory Agreement. Prior to voting, the disinterested Directors reviewed the proposed continuance of the Investment Advisory Agreement and Investment Subadvisory Agreement with management and also met in private sessions with their counsel at which no representatives of management were present.
In the course of its deliberations regarding the Investment Advisory Agreement, the Board considered the following factors, among others: the nature, extent and quality of the services provided by the Advisor, including the personnel providing such services; the Advisor’s financial condition; the level and method of computing the Portfolio’s advisory fee; comparative performance, fee and expense information for the Portfolio; the profitability of the Calvert Family of Funds to the Advisor and its affiliates; the allocation of the Portfolio’s brokerage, including the Advisor’s process for monitoring “best execution”; the direct and indirect benefits, if any, derived by the Advisor and its affiliates from their relationship with the Portfolio; the effect of the Portfolio’s growth and size on the Portfolio’s performance and expenses; the Advisor’s compliance programs and policies; the Advisor’s performance of substantially similar duties for other funds; and any possible conflicts of interest.
In considering the nature, extent and quality of the services provided by the Advisor under the Investment Advisory Agreement, the Board reviewed information provided by the Advisor relating to its operations and personnel, including, among other information, biographical information on the Advisor’s supervisory and professional staff and descriptions of its organizational and management structure. The Board also took into account similar information provided periodically throughout the previous year by the Advisor, as well as the Board’s familiarity with the Advisor’s management through Board of Directors’ meetings, discussions and other reports. The Board considered the Advisor’s current level of staffing and overall resources. The Board also noted that it reviewed on a quarterly basis information regarding the Advisor’s compliance with applicable policies and procedures, including those related to personal investing. The Advisor’s administrative capabilities, including its ability to supervise the other service providers for the Portfolio, were also considered. The Board discussed the Advisor’s effectiveness in monitoring the performance of the Subadvisor and its timeliness in responding to performance issues. The Board observed that the scope of services provided by the Advisor generally had expanded over time as a result of regulatory, market and other changes. The Board took into consideration, among other factors, the effectiveness of the Portfolio’s and Advisor’s processes, policies and procedures and the Advisor’s personnel. The Board also took into account, among other items, periodic reports received from the Advisor over the past year concerning the Advisor’s ongoing review and enhancement of certain processes, policies and procedures of the Portfolio and the Advisor. The Board concluded that it was satisfied with the nature, extent and quality of services provided to the Portfolio by the Advisor under the Investment Advisory Agreement.
In considering the Portfolio’s performance, the Board noted that it reviewed on a quarterly basis detailed information about the Portfolio’s performance results, portfolio composition and investment strategies. In addition, the Board took into account overall financial market conditions. The Board also reviewed various comparative data provided to it in connection with its consideration of the renewal of the Investment Advisory Agreement, including, among other information, a comparison of the Portfolio’s total return with that of other mutual funds deemed to be in its peer group or peer universe, as applicable, by an independent third party in its report. This comparison indicated that the performance of the Portfolio was above the median of its peer group for the one-year period ended June 30, 2013, below the median of its peer group for the three-year period ended June 30, 2013 and below the median of its peer universe for the five-year period ended June 30, 2013. The data also indicated that the Portfolio outperformed its Lipper index for the one-year period ended June 30, 2013, and underperformed its Lipper index for the three- and five-year periods ended June
www.calvert.com CALVERT VP INFLATION PROTECTED PLUS PORTFOLIO ANNUAL REPORT (UNAUDITED) 21
30, 2013. The Board took into account the Portfolio’s more recent performance. The Board also took into account management’s discussion of the Portfolio’s performance, including the differences in the investment strategies used by the funds in the Portfolio’s peer group that also affect relative performance, and management’s continued monitoring of the Portfolio’s performance. Based upon its review, the Board concluded that appropriate action was being taken with respect to the Portfolio’s performance.
In considering the Portfolio’s fees and expenses, the Board compared the Portfolio’s fees and total expense ratio with various comparative data for the funds in its peer group. Among other findings, the data indicated that the Portfolio’s advisory fee (after taking into account expense reimbursements) was at the median of its peer group and that total expenses (net of expense reimbursements) were above the median of its peer group. The Board noted that the allocation of advisory and administrative fees may vary among the Portfolio’s peer group. The Board also took into account the Advisor’s current undertaking to maintain expense limitations for the Portfolio. The Board noted that the Advisor paid the Subadvisor’s subadvisory fee under the Investment Subadvisory Agreement with respect to the Portfolio. The Board also took into account management’s discussion of the Portfolio’s expenses and certain factors that affected the level of such expenses, including the current size of the Portfolio. Based upon its review, the Board determined that the advisory fee was reasonable in view of the quality of services received by the Portfolio from the Advisor and the other factors considered.
The Board reviewed the Advisor’s profitability on a portfolio-by-portfolio basis. In reviewing the overall profitability of the advisory fee to the Portfolio’s Advisor, the Board also considered the fact that affiliates of the Advisor provided shareholder servicing and administrative services to the Portfolio for which they received compensation. The information considered by the Board included Calvert’s operating profit margin information both before and after tax expenses with respect to the services that the Advisor and its affiliates provided to the Calvert Family of Funds complex. The Board reviewed the profitability of the Advisor’s relationship with the Portfolio in terms of the total amount of annual advisory fees it received with respect to the Portfolio and whether the Advisor had the financial wherewithal to continue to provide services to the Portfolio. The Board also considered that the Advisor derived benefits to its reputation and other indirect benefits from its relationship with the Portfolio. In addition, the Board took into account that affiliates of the Advisor may benefit from certain indirect tax benefits relating to dividend received deductions and foreign tax credits. The Board also noted that the Advisor paid the subadvisory fee to the Subadvisor, an affiliate of the Advisor. Based upon its review, the Board concluded that the Advisor’s and its affiliates’ level of profitability from their relationship with the Portfolio was reasonable.
The Board considered the effect of the Portfolio’s current size and potential growth on its performance and fees. Although the Portfolio’s advisory fee did not contain breakpoints that would reduce the advisory fee rate on assets above specified asset levels, the Board noted that if the Portfolio’s assets increased over time, the Portfolio might realize other economies of scale if assets increased proportionally more than certain other expenses. The Board also noted that given the Portfolio’s current level of assets, the Portfolio would be unlikely to recognize economies of scale by implementing a breakpoint in the advisory fee at this time.
In reapproving the Investment Advisory Agreement, the Board, including the disinterested Directors, did not identify any single factor as controlling, and each Director may have attributed different weight to various factors.
In evaluating the Investment Subadvisory Agreement, the disinterested Directors reviewed information provided by the Subadvisor relating to its operations, personnel, investment philosophy, strategies and techniques. Among other information, the Subadvisor provided biographical information on portfolio management and other professional staff, performance information for itself, and descriptions of its investment philosophies, strategies and techniques, organizational and management structures and brokerage policies and practices.
The Board reapproved the Investment Subadvisory Agreement between the Subadvisor and the Advisor based on a number of factors relating to the Subadvisor’s ability to perform under the Investment Subadvisory
22 www.calvert.com CALVERT VP INFLATION PROTECTED PLUS PORTFOLIO ANNUAL REPORT (UNAUDITED)
Agreement. In the course of its deliberations, the Board evaluated, among other factors: the nature, extent and the quality of the services to be provided by the Subadvisor; the Subadvisor’s management style and long-term performance record; the Portfolio’s performance record and the Subadvisor’s performance in employing its investment strategies; the Subadvisor’s current level of staffing and its overall resources; the qualifications and experience of the Subadvisor’s personnel; the Subadvisor’s financial condition with respect to its ability to perform the services required under the Investment Subadvisory Agreement; the Subadvisor’s risk management processes; the Subadvisor’s compliance systems, including those related to personal investing; and any disciplinary history. Based upon its review, the Board concluded that it was satisfied with the nature, extent and quality of services provided to the Portfolio by the Subadvisor under the Investment Subadvisory Agreement.
As noted above, the Board considered, among other information, the Portfolio’s performance during the one-, three- and five-year periods ended June 30, 2013 as compared to the Portfolio’s peer group or peer universe, as applicable, and noted that it reviewed on a quarterly basis detailed information about the Portfolio’s performance results, portfolio composition and investment strategies. The Board noted the Advisor’s expertise and resources in monitoring the performance, investment style and risk adjusted performance of the Subadvisor.
In considering the cost of services to be provided by the Subadvisor and the profitability to the Subadvisor of its relationship with the Portfolio, the Board noted that the Advisor and Subadvisor were affiliated and the subadvisory fee under the Investment Subadvisory Agreement was paid by the Advisor out of the advisory fee that the Advisor received under the Investment Advisory Agreement. Based upon its review, the Board determined that the subadvisory fee was reasonable in view of the quality of services received by the Portfolio from the Subadvisor and the other factors considered. Because the Advisor would pay the Subadvisor’s subadvisory fee, the cost of services to be provided by the Subadvisor and the level of profitability to the Subadvisor from its relationship with the Portfolio were not material factors in the Board’s deliberations. For similar reasons, the Board did not consider the potential economies of scale in the Subadvisor’s management of the Portfolio to be a material factor in its consideration.
In reapproving the Investment Subadvisory Agreement, the Board, including the disinterested Directors, did not identify any single factor as controlling, and each Director may have attributed different weight to various factors.
CONCLUSIONS
The Board reached the following conclusions regarding the Investment Advisory Agreement and the Investment Subadvisory Agreement, among others: (a) the Advisor has demonstrated that it possesses the capability and resources to perform the duties required of it under the Investment Advisory Agreement; (b) the Subadvisor is qualified to manage the Portfolio’s assets in accordance with the Portfolio’s investment objective and policies; (c) the Advisor and Subadvisor maintain appropriate compliance programs; (d) the Subadvisor is likely to execute its investment strategies consistently over time; (e) appropriate action was being taken with respect to the Portfolio’s performance; and (f) the Portfolio’s advisory and subadvisory fees are reasonable in view of the quality of services received by the Portfolio from the Advisor and Subadvisor and the other factors considered. Based on its conclusions, the Board determined that reapproval of the Investment Advisory Agreement and the Investment Subadvisory Agreement would be in the best interests of the Portfolio and its shareholders.
www.calvert.com CALVERT VP INFLATION PROTECTED PLUS PORTFOLIO ANNUAL REPORT (UNAUDITED) 23
This report is intended to provide fund information to shareholders. It is not authorized for distribution to prospective investors unless preceded or accompanied by a prospectus.
Note: The information on our website is not incorporated by reference into this report; our website address is included as an inactive textual reference only.
Investors should carefully consider the investment objectives, risks, charges and expenses of the Calvert Funds. This and other important information is contained in the fund’s summary prospectus and prospectus, which can be obtained from your financial professional and should be read carefully before investing. You may also call Calvert at 800/368-2745 or visit www. calvert.com.
24 www.calvert.com CALVERT VP INFLATION PROTECTED PLUS PORTFOLIO ANNUAL REPORT (UNAUDITED)
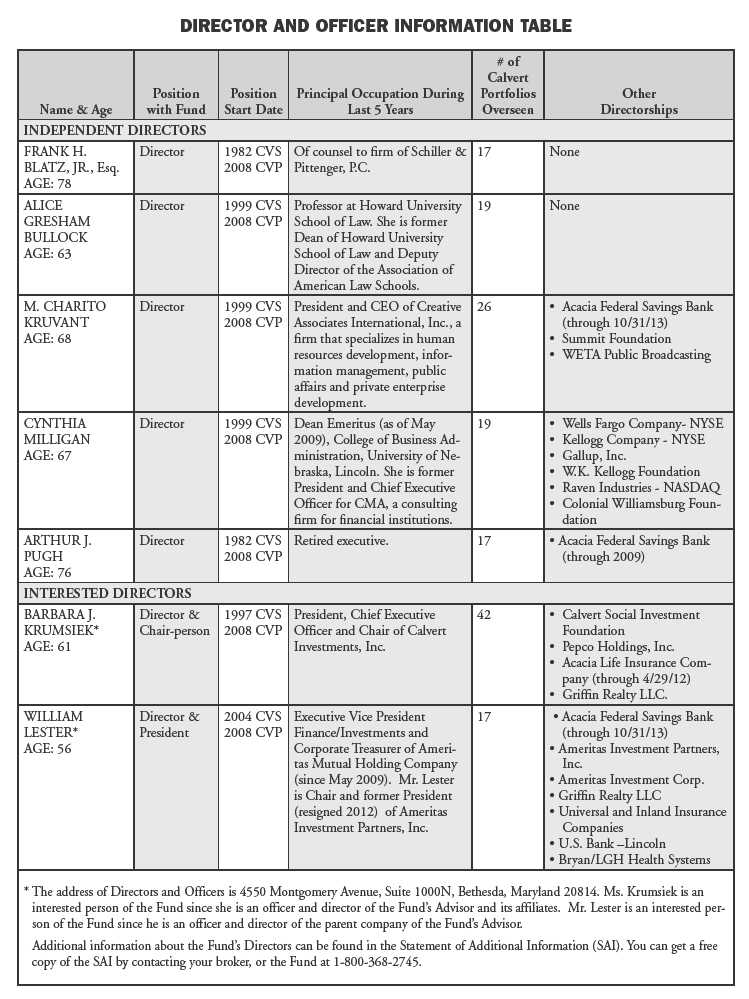
www.calvert.com CALVERT VP INFLATION PROTECTED PLUS PORTFOLIO ANNUAL REPORT (UNAUDITED) 25
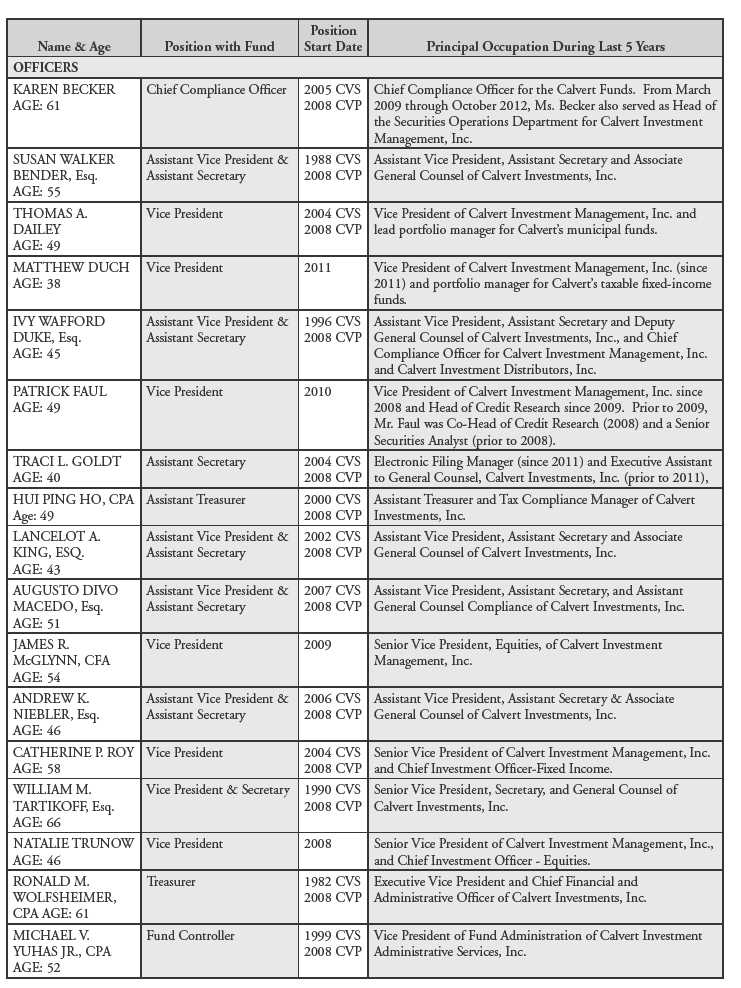
26 www.calvert.com CALVERT VP INFLATION PROTECTED PLUS PORTFOLIO ANNUAL REPORT (UNAUDITED)

CALVERT VP NATURAL RESOURCES PORTFOLIO
Portfolio within Calvert Variable Products, Inc.
Managed by Ameritas Investment Partners, Inc., Subadvisor
INVESTMENT PERFORMANCE
For the year ended December 31, 2013, Calvert VP Natural Resources Portfolio returned 0.72% compared to 32.39% for the benchmark Standard & Poor’s (S&P) 500 Index. Concentrated holdings in the commodity and natural resource sectors caused the Portfolio to underperform the benchmark since the S&P 500 Index has a more diversified allocation of holdings across industry sectors. The blended return from the Natural Resources Composite Benchmark (DJ-UBS Commodity Total Return 50%, S&P North American Sector/Natural Resources 50%), a mix of market indices that more closely reflects the Portfolio’s asset allocation strategy, returned 2.91% for the period.
INVESTMENT CLIMATE
Natural resource stocks, and commodity stocks in particular, underperformed the overall market in 2013. Crude oil prices dropped slightly during the year, as measured by Brent crude. Metal prices also declined, led by gold’s decline of more than 27%. Silver, copper, aluminum and steel prices also decreased during the year, although steel prices recovered nicely during the second half of the year. Despite trillions of dollars of global monetary stimulus from major central banks over the last few years, inflation simply has not materialized, which has kept commodity prices relatively flat.
On the positive side, chemical, water and forest-product stocks and exchange-traded funds (ETFs) performed well in 2013. Power generation and real estate ETFs also provided small positive returns. The U.S. dollar was mostly unchanged relative to other currencies, which provided neither a catalyst nor a headwind for commodity and natural resource prices.
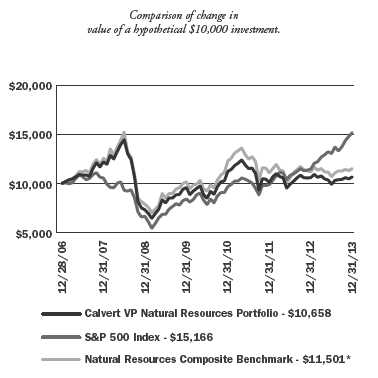
| AVERAGE ANNUAL TOTAL RETURN |
| (period ended 12.31.13) |
| One year | 0.72% |
| Five year | 7.85% |
| Since inception (12/28/2006) | 0.91% |
The performance data shown represents past performance, does not guarantee future results and assumes reinvestment of all dividends and distributions. All performance data reflects fee waivers and/or expense limitations, if any are in effect; in their absence performance would be lower. See Note B in Notes to Financial Statements. The investment return and principal value of an investment will fluctuate so that an investor’s shares, when redeemed, may be worth more or less than their original cost. Current performance may be lower or higher than the performance data quoted.
Visit www.calvert.com/institutional-VP-performance.html for current performance data. The gross expense ratio from the current prospectus for the Portfolio is 1.39%. This number may vary from the expense ratio shown elsewhere in this report because it is based on a different time period and, if applicable, does not include fee or expense waivers. The performance data and expense ratio reflect deduction of Portfolio operating expenses, but do not reflect charges and expenses imposed under the variable annuity or life insurance contract.
* The Narural Resources Composite Benchmark is an internally constructed index comprised of a blend of 50% DJ UBS Commodity Index and 50% S&P North American Natural Resouces Index.
4 www.calvert.com CALVERT VP NATURAL RESOURCES PORTFOLIO ANNUAL REPORT
| |
| | % OF TOTAL |
| ECONOMIC SECTORS | INVESTMENTS |
| |
| Materials Stocks | 17.0% |
| Energy Stocks | 24.3% |
| Forestry Stocks | 6.1% |
| Water Stocks | 10.1% |
| Utilities Stocks | 4.0% |
| Real Estate Stocks | 3.9% |
| Gold Mining Stocks | 2.1% |
| Energy Commodities | 15.0% |
| Grain Commodities | 5.9% |
| Industrial Metals Commodities | 4.9% |
| Precious Metals Commodities | 3.4% |
| Soft Commodities | 2.2% |
| Livestock Commodities | 1.1% |
| Total | 100% |
PORTFOLIO STRATEGY
The Portfolio invests in ETFs and exchange-traded notes (ETNs) that track various commodity, natural resource, raw materials, and utility indices and is constructed to maintain broad exposure to a wide variety of commodities and natural resources. As of December 31, 2013, the Portfolio’s largest exposure was to Energy at 39%, followed by Materials at 17%. Other significant exposures included Water, Metals, and Forest Products, ranging from 6% to 10%.
Since the objective is to maintain broad exposure to a basket of commodities and natural resources, these exposures remained fairly stable throughout 2013. However, we decreased exposure to commodity ETNs and gold ETFs near the end of the year, as both underperformed other sectors of the market.
OUTLOOK
The outlook for commodity and natural resource prices is mixed entering 2014. On the positive side, domestic growth has accelerated and increased global growth will likely follow. And the monetary policy of major central banks will continue to be accommodative in 2014, which should eventually be reflected in higher commodity and natural resource prices.
On the negative side, increased energy production, led by the United States, should keep a lid on energy prices and the performance of energy-related ETFs and ETNs. Also, the U.S. dollar is likely to strengthen in 2014, as the Fed begins to taper while other central banks continue their easy monetary policy. A stronger U.S. dollar would provide a headwind for natural resource and commodity prices.
January 2014
www.calvert.com CALVERT VP NATURAL RESOURCES PORTFOLIO ANNUAL REPORT 5
SHAREHOLDER EXPENSE EXAMPLE
As a shareholder of the Fund, you incur two types of costs: (1) transaction costs, and (2) ongoing costs, including management fees and other Fund expenses. This Example is intended to help you understand your ongoing costs (in dollars) of investing in the Fund and to compare these costs with the ongoing costs of investing in other mutual funds.
This Example is based on an investment of $1,000 invested at the beginning of the period and held for the entire period (July 1, 2013 to December 31, 2013).
Note: Expenses do not reflect charges and expenses of the variable annuity or variable universal life contract.
Actual Expenses
The first line of the table below provides information about actual account values and actual expenses. You may use the information in this line, together with the amount you invested, to estimate the expenses that you paid over the period. Simply divide your account value by $1,000 (for example, an $8,600 account value divided by $1,000 = 8.6), then multiply the result by the number in the first line under the heading entitled “Expenses Paid During Period” to estimate the expenses you paid on your account during this period.
Hypothetical Example for Comparison Purposes
The second line of the table below provides information about hypothetical account values and hypothetical expenses based on the Fund’s actual expense ratio and an assumed rate of return of 5% per year before expenses, which is not the Fund’s actual return. The hypothetical account values and expenses may not be used to estimate the actual ending account balance or expenses you paid for the period. You may use this information to compare the ongoing costs of investing in the Fund and other funds. To do so, compare the 5% hypothetical example with the 5% hypothetical examples that appear in the shareholder reports of the other funds.
Please note that the expenses shown in the table are meant to highlight your ongoing costs only and do not reflect any transactional costs. Therefore, the second line of the table is useful in comparing ongoing costs only, and will not help you determine the relative total costs of owning different funds. In addition, if these transactional costs were included, your costs would have been higher.
| | BEGINNING | ENDING | EXPENSES PAID |
| | ACCOUNT VALUE | ACCOUNT VALUE | DURING PERIOD* |
| | 7/1/13 | 12/31/13 | 7/1/13 - 12/31/13 |
| |
| Actual | $1,000.00 | $1,075.35 | $4.11 |
| |
Hypothetical
(5% return per year before expenses) | $1,000.00 | $1,021.24 | $4.00 |
* Expenses are equal to the Fund’s annualized expense ratio of 0.79%, multiplied by the average account value over the period, multiplied by 184/365 (to reflect the one-half year period). The fees and expenses of the Underlying Funds in which the Portfolio invests are not included in the annualized expense ratios.
6 www.calvert.com CALVERT VP NATURAL RESOURCES PORTFOLIO ANNUAL REPORT
REPORT OF INDEPENDENT REGISTERED PUBLIC ACCOUNTING FIRM
The Board of Directors of Calvert Variable Products, Inc. and Shareholders of Calvert VP Natural Resources Portfolio: We have audited the accompanying statement of net assets of the Calvert VP Natural Resources Portfolio (the “Portfolio”), a series of Calvert Variable Products, Inc., as of December 31, 2013, and the related statement of operations for the year then ended, the statements of changes in net assets for each of the years in the two-year period then ended, and the financial highlights for each of the years in the five-year period then ended. These financial statements and financial highlights are the responsibility of the Portfolio’s management. Our responsibility is to express an opinion on these financial statements and financial highlights based on our audits.
We conducted our audits in accordance with the standards of the Public Company Accounting Oversight Board (United States). Those standards require that we plan and perform the audit to obtain reasonable assurance about whether the financial statements and financial highlights are free of material misstatement. An audit includes examining, on a test basis, evidence supporting the amounts and disclosures in the financial statements. Our procedures included confirmation of securities owned as of December 31, 2013, by correspondence with the custodian and brokers or by performing other appropriate auditing procedures. An audit also includes assessing the accounting principles used and significant estimates made by management, as well as evaluating the overall financial statement presentation. We believe that our audits provide a reasonable basis for our opinion.
In our opinion, the financial statements and financial highlights referred to above present fairly, in all material respects, the financial position of the Calvert VP Natural Resources Portfolio as of December 31, 2013, the results of its operations for the year then ended, the changes in its net assets for each of the years in the two-year period then ended, and the financial highlights for each of the years in the five-year period then ended, in conformity with U.S. generally accepted accounting principles.

Philadelphia, Pennsylvania
February 24, 2014
www.calvert.com CALVERT VP NATURAL RESOURCES PORTFOLIO ANNUAL REPORT 7
| | |
| STATEMENT OF NET ASSETS |
| DECEMBER 31, 2013 |
| |
| EXCHANGE TRADED PRODUCTS - 98.8% | SHARES | VALUE |
| Guggenheim Timber Index ETF | 164,000 | $4,247,600 |
| iPath Dow Jones-UBS Commodity Index Total Return ETN* | 363,000 | 13,340,250 |
| iShares Global Materials ETF | 54,000 | 3,365,820 |
| iShares North American Natural Resources ETF | 387,000 | 16,791,930 |
| iShares US Utilities ETF | 29,000 | 2,779,360 |
| Market Vectors Gold Miners ETF | 67,000 | 1,415,040 |
| PowerShares DB Commodity Index Tracking Fund* | 354,000 | 9,080,100 |
| PowerShares Water Resources Portfolio ETF | 266,000 | 6,974,520 |
| Vanguard Materials ETF | 81,000 | 8,363,250 |
| Vanguard REIT ETF | 42,000 | 2,711,520 |
| |
| Total Exchange Traded Products (Cost $67,728,890) | | 69,069,390 |
| |
| | PRINCIPAL | |
| TIME DEPOSIT - 1.5% | AMOUNT | |
| State Street Bank Time Deposit, 0.083%, 1/2/14 | $1,069,352 | 1,069,352 |
| |
| Total Time Deposit (Cost $1,069,352) | | 1,069,352 |
| |
| |
| |
| TOTAL INVESTMENTS (Cost $68,798,242) - 100.3% | | 70,138,742 |
| Other assets and liabilities, net - (0.3%) | | (189,193) |
| NET ASSETS - 100% | | $69,949,549 |
| |
| |
| NET ASSETS CONSISTS OF: | | |
| Paid-in capital applicable to 1,371,765 shares of common stock outstanding; | | |
| $0.10 par value, 20,000,000 shares authorized | | $69,746,843 |
| Undistributed net investment income | | 96,624 |
| Accumulated net realized gain (loss) | | (1,234,418) |
| Net unrealized appreciation (depreciation) | | 1,340,500 |
| |
| NET ASSETS | | $69,949,549 |
| |
| NET ASSET VALUE PER SHARE | | $50.99 |
* Non-income producing security.
Abbreviations:
ETF: Exchange Traded Fund
ETN: Exchange Traded Note
REIT: Real Estate Investment Trust
See notes to financial statements.
8 www.calvert.com CALVERT VP NATURAL RESOURCES PORTFOLIO ANNUAL REPORT
| |
| STATEMENT OF OPERATIONS |
| YEAR ENDED DECEMBER 31, 2013 |
| |
| NET INVESTMENT INCOME | |
| Investment Income: | |
| Dividend income | $697,206 |
| Interest income | 825 |
| Total investment income | 698,031 |
| |
| |
| Expenses: | |
| Investment advisory fee | 343,198 |
| Transfer agency fees and expenses | 9,044 |
| Accounting fees | 8,932 |
| Directors’ fees and expenses | 9,655 |
| Administrative fees | 62,400 |
| Custodian fees | 6,722 |
| Reports to shareholders | 14,897 |
| Professional fees | 28,330 |
| Miscellaneous | 8,338 |
| Total expenses | 491,516 |
| |
| |
| NET INVESTMENT INCOME | 206,515 |
| |
| |
| REALIZED AND UNREALIZED GAIN (LOSS) ON INVESTMENTS | |
| Net realized gain (loss) | (431,265) |
| Change in unrealized appreciation (depreciation) | 1,077,896 |
| |
| |
| NET REALIZED AND UNREALIZED GAIN (LOSS) ON INVESTMENTS | 646,631 |
| |
| INCREASE (DECREASE) IN NET ASSETS | |
| RESULTING FROM OPERATIONS | $853,146 |
See notes to financial statements.
www.calvert.com CALVERT VP NATURAL RESOURCES PORTFOLIO ANNUAL REPORT 9
| | |
| STATEMENTS OF CHANGES IN NET ASSETS |
| |
| | YEAR ENDED | YEAR ENDED |
| | DECEMBER 31, | DECEMBER 31, |
| INCREASE (DECREASE) IN NET ASSETS | 2013 | 2012 |
| Operations: | | |
| Net investment income | $206,515 | $98,760 |
| Net realized gain (loss) | (431,265) | 2,542,107 |
| Change in unrealized appreciation (depreciation) | 1,077,896 | (21,712) |
| |
| |
| INCREASE (DECREASE) IN NET ASSETS | | |
| RESULTING FROM OPERATIONS | 853,146 | 2,619,155 |
| |
| Distributions to shareholders from: | | |
| Net investment income | — | (9,016) |
| Net realized gain | (478,965) | (1,328,994) |
| Total distributions | (478,965) | (1,338,010) |
| |
| Capital share transactions: | | |
| Shares sold | 21,528,916 | 11,351,075 |
| Reinvestment of distributions | 478,965 | 1,338,010 |
| Shares redeemed | (7,097,036) | (8,051,767) |
| Total capital share transactions | 14,910,845 | 4,637,318 |
| |
| |
| TOTAL INCREASE (DECREASE) IN NET ASSETS | 15,285,026 | 5,918,463 |
| |
| |
| NET ASSETS | | |
| Beginning of year | 54,664,523 | 48,746,060 |
| End of year (including undistributed net investment income | | |
| of $96,624 and $98,758, respectively) | $69,949,549 | $54,664,523 |
| |
| |
| CAPITAL SHARE ACTIVITY | | |
| Shares sold | 430,839 | 223,041 |
| Reinvestment of distributions | 9,541 | 26,590 |
| Shares redeemed | (140,803) | (155,452) |
| Total capital share activity | 299,577 | 94,179 |
See notes to financial statements.
10 www.calvert.com CALVERT VP NATURAL RESOURCES PORTFOLIO ANNUAL REPORT
NOTES TO FINANCIAL STATEMENTS
NOTE A –- SIGNIFICANT ACCOUNTING POLICIES
General: Calvert VP Natural Resources Portfolio (the “Portfolio”), a series of Calvert Variable Products, Inc. (the “Fund”), is registered under the Investment Company Act of 1940 as a non-diversified, open-end management investment company. The Fund is comprised of twelve separate portfolios. The operations of each series of the Fund are accounted for separately. Shares of the Portfolio are sold without sales charge to affiliated and unaffiliated insurance companies for allocation to certain of their variable separate accounts. The Portfolio invests primarily in exchange traded funds and exchange traded notes (the “Underlying Funds”) representing different natural resources exposure.
Security Valuation: Net asset value per share is determined every business day as of the close of the regular session of the New York Stock Exchange (generally 4:00 p.m. Eastern time). The Portfolio uses independent pricing services approved by the Board of Directors (“the Board”) to value its investments wherever possible. Investments for which market quotations are not available or deemed not reliable are fair valued in good faith under the direction of the Board.
The Board has adopted Valuation Procedures (the “Procedures”) to determine the fair value of securities and other financial instruments for which market prices are not readily available or which may not be reliably priced. The Board has delegated the day-to-day responsibility for determining the fair value of assets of the Portfolio to Calvert Investment Management, Inc. (the “Advisor” or “Calvert”) and has provided these Procedures to govern Calvert in its valuation duties.
Calvert has chartered an internal Valuation Committee to oversee the implementation of these Procedures and to assist it in carrying out the valuation responsibilities that the Board has delegated.
The Valuation Committee meets on a regular basis to review illiquid securities and other investments which may not have readily available market prices. The Valuation Committee’s fair valuation determinations are subject to review, approval and ratification by the Board at its next regularly scheduled meeting covering the calendar quarter in which the fair valuation was determined.
The Valuation Committee utilizes various methods to measure the fair value of the Portfolio’s investments. Generally Accepted Accounting Principles (GAAP) establishes a disclosure hierarchy that categorizes the inputs to valuation techniques used to value assets and liabilities at measurement date. These inputs are summarized in the three broad levels listed below:
Level 1 – quoted prices in active markets for identical securities
Level 2 – other significant observable inputs (including quoted prices for similar securities, interest rates, prepayment speeds, credit risk, etc.)
Level 3 – significant unobservable inputs (including the Portfolio’s own assumptions in determining the fair value of investments) The inputs or methodologies used for valuing securities are not necessarily an indication of the risk associated with investing in those securities.
Changes in valuation techniques may result in transfers in or out of an investment’s assigned level within the hierarchy during the period. There were no such transfers during the period. Valuation techniques used to value the Portfolio’s investments by major category are as follows: Exchange traded products are valued at the official closing price as reported by an independent pricing service on the primary market or exchange on which they are traded and are categorized as Level 1 in the hierarchy.
www.calvert.com CALVERT VP NATURAL RESOURCES PORTFOLIO ANNUAL REPORT 11
Short-term securities of sufficient credit quality with remaining maturities of sixty days or less for which quotations are not readily available are valued at amortized cost, which approximates fair value, and are categorized as Level 2 in the hierarchy.
If a market value cannot be determined for a security using the methodologies described above, or if, in the good faith opinion of the Advisor, the market value does not constitute a readily available market quotation, or if a significant event has occurred that would materially affect the value of the security, the security will be fair valued as determined in good faith by the Valuation Committee.
The Valuation Committee considers a number of factors, including significant unobservable valuation inputs when arriving at fair value. It considers all significant facts that are reasonably available and relevant to the determination of fair value.
The Valuation Committee primarily employs a market-based approach which may use related or comparable assets or liabilities, recent transactions, market multiples, book values, and other relevant information for the investment to determine the fair value of the investment. When more appropriate, the fund may employ an income-based or cost approach. An income-based valuation approach discounts anticipated future cash flows of the investment to calculate a present amount (discounted). The measurement is based on the value indicated by current market expectations about those future amounts. Discounts may also be applied due to the nature or duration of any restrictions on the disposition of the investments. A cost based approach is based on the amount that currently would be required to replace the service capacity of an asset (current replacement cost). From the seller’s perspective, the price that would be received for the asset is determined based on the cost to a buyer to acquire or construct a substitute asset of comparable utility, adjusted for obsolescence.
The values assigned to fair value investments are based on available information and do not necessarily represent amounts that might ultimately be realized. Further, due to the inherent uncertainty of valuations of such investments, the fair values may differ significantly from the values that would have been used had an active market existed, and the differences could be material. The Valuation Committee employs various methods for calibrating these valuation approaches including a regular review of key inputs and assumptions, transactional back-testing or disposition analysis and reviews of any related market activity.
At December 31, 2013, no securities were fair valued in good faith under the direction of the Board.
The following is a summary of the inputs used to value the Portfolio’s net assets as of December 31, 2013:
| | | VALUATION INPUTS | |
| INVESTMENTS IN SECURITIES* | LEVEL 1 | LEVEL 2 | LEVEL 3 | TOTAL |
| Exchange traded products | $69,069,390 | — | — | $69,069,390 |
| Other debt obligations | — | $1,069,352 | — | 1,069,352 |
| TOTAL | $69,069,390 | $1,069,352 | — | $70,138,742 |
* For a complete listing of investments, please refer to the Statement of Net Assets.
Security Transactions and Investment Income: Security transactions, normally related to shares of the Underlying Funds, are accounted for on trade date. Realized gains and losses are recorded on an identified cost basis. Income and capital gain distributions from the Underlying Funds, if any, are recorded on ex-dividend date. Distributions received on securities that represent a return of capital or capital gain are recorded as a reduction of cost of investments and/or as a realized gain. Interest income, which includes amortization of premium and accretion of discount on debt securities, is accrued as earned. Expenses included in the accompanying financial statements reflect the expenses of the Portfolio and do not include any expenses associated with the Underlying Funds.
12 www.calvert.com CALVERT VP NATURAL RESOURCES PORTFOLIO ANNUAL REPORT
Distributions to Shareholders: Distributions to shareholders are recorded by the Portfolio on ex-dividend date. Dividends from net investment income and distributions from net realized capital gains, if any, are paid at least annually. Distributions are determined in accordance with income tax regulations which may differ from generally accepted accounting principles; accordingly, periodic reclassifications are made within the Portfolio’s capital accounts to reflect income and gains available for distribution under income tax regulations.
Estimates: The preparation of financial statements in conformity with accounting principles generally accepted in the United States requires management to make estimates and assumptions that affect the reported amounts of assets and liabilities and disclosure of contingent assets and liabilities at the date of the financial statements and the reported amounts of income and expenses during the reporting period. Actual results could differ from those estimates.
Federal Income Taxes: No provision for federal income or excise tax is required since the Portfolio intends to continue to qualify as a regulated investment company under the Internal Revenue Code and to distribute substantially all of its taxable earnings.
Management has analyzed the Portfolio’s tax positions taken for all open federal income tax years and has concluded that no provision for federal income tax is required in the Portfolio’s financial statements. A Portfolio’s federal tax return is subject to examination by the Internal Revenue Service for a period of three years.
NOTE B — RELATED PARTY TRANSACTIONS
Calvert Investment Management, Inc. (the “Advisor”) is wholly-owned by Calvert Investments, Inc., which is indirectly wholly-owned by Ameritas Mutual Holding Company. The Advisor provides investment advisory services and pays the salaries and fees of officers and Directors of the Fund who are employees of the Advisor or its affiliates. For its services, the Advisor receives an annual fee, payable monthly, of .55%, of the Portfolio’s average daily net assets. Under the terms of the agreement, $29,325 was payable at year end. In addition, $13,687 was payable at year end for operating expenses paid by the Advisor during December 2013.
The Advisor has contractually agreed to limit net annual portfolio operating expenses through April 30, 2014. The contractual expense cap is .79%. For the purpose of this expense limit, operating expenses do not include interest expense, brokerage commissions, taxes, and extraordinary expenses. This expense limitation does not limit fees and expenses associated with the Underlying Funds.
Calvert Investment Administrative Services, Inc., an affiliate of the Advisor, provides administrative services to the Portfolio for an annual fee, payable monthly, of .10% of the Portfolio’s average daily net assets. Under the terms of the agreement, $5,332 was payable at year end.
Calvert Investment Services, Inc. (“CIS”), an affiliate of the Advisor, acts as shareholder servicing agent for the Portfolio. For its services, CIS received a fee of $5,063 for the year ended December 31, 2013. Under the terms of the agreement, $397 was payable at year end. Boston Financial Data Services, Inc. is the transfer and dividend disbursing agent.
Each Director of the Fund who is not an employee of the Advisor or its affiliates receives a fee of $1,500 for each Board and Committee meeting attended plus an annual fee of $40,000. Committee chairs receive an additional $5,000 annual retainer. Directors’ fees are allocated to each of the portfolios served.
NOTE C — INVESTMENT ACTIVITY AND TAX INFORMATION
During the year, the cost of purchases and proceeds from sales of investments, other than short-term securities, were $33,737,429 and $19,307,250, respectively.
www.calvert.com CALVERT VP NATURAL RESOURCES PORTFOLIO ANNUAL REPORT 13
| |
| Capital Loss Carryforwards | |
| No Expiration Date: | |
| Short-term | ($553,191) |
| Long-term | (1,149,313) |
Under the Regulated Investment Company Modernization Act of 2010, capital losses incurred in taxable years beginning after December 22, 2010 can be carried forward to offset future capital gains for an unlimited period. These losses will retain their character as either long-term or short-term.
The tax character of dividends and distributions paid during the years ended December 31, 2013 and December 31, 2012 was as follows:
| Distributions paid from: | 2013 | 2012 |
| Ordinary income | $115,402 | $309,960 |
| Long-term capital gain | 363,563 | 1,028,050 |
| Total | $478,965 | $1,338,010 |
As of December 31, 2013, the tax basis components of distributable earnings/(accumulated losses) and the federal tax cost were as follows:
| Unrealized appreciation | $4,598,960 |
| Unrealized (depreciation) | (2,790,374) |
| Net unrealized appreciation/(depreciation) | $1,808,586 |
| Undistributed ordinary income | $96,624 |
| Capital loss carryforward | ($1,702,504) |
| Federal income tax cost of investments | $68,330,156 |
The differences between the components of distributable earnings on a tax basis and the amounts reflected in the statement of net assets are primarily due to temporary book-tax differences that will reverse in a subsequent period. These differences are due to wash sales, partnerships, and exchange traded funds.
Reclassifications, as shown in the table below, have been made to the Portfolio’s components of net assets to reflect income and gains available for distributions (or available capital loss carryforwards, as applicable) under income tax law and regulations. These reclassifications are due to permanent book-tax differences and have no impact on net assets. The primary permanent differences causing such reclassifications for the Portfolio are due to partnerships, exchange traded funds, and prior year net operating losses.
| Undistributed net investment income | ($208,649) |
| Accumulated net realized gain (loss) | 208,647 |
| Paid-in capital | 2 |
NOTE D — LINE OF CREDIT
A financing agreement is in place with the Calvert Funds and State Street Corporation (“SSC”). Under the agreement, SSC provides an unsecured line of credit facility, in the aggregate amount of $50 million ($25 million committed and $25 million uncommitted), accessible by the Funds for temporary or emergency purposes only. Borrowings under the committed facility bear interest at the higher of the London Interbank Offered Rate (LIBOR) or the overnight Federal Funds Rate plus 1.25% per annum. A commitment fee of .11% per
14 www.calvert.com CALVERT VP NATURAL RESOURCES PORTFOLIO ANNUAL REPORT
annum is incurred on the unused portion of the committed facility, which is allocated to all participating funds. The Portfolio had no borrowings under the agreement during the year ended December 31, 2013.
NOTE E — SUBSEQUENT EVENTS
In preparing the financial statements as of December 31, 2013, no subsequent events or transactions occurred that would have required recognition or disclosure in these financial statements.
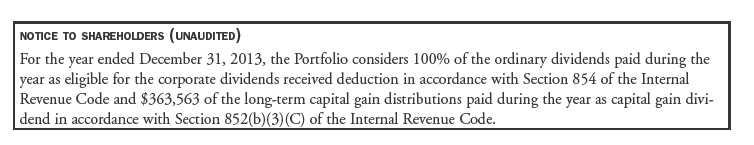
www.calvert.com CALVERT VP NATURAL RESOURCES PORTFOLIO ANNUAL REPORT 15
| | | |
| FINANCIAL HIGHLIGHTS |
| |
| | | YEARS ENDED | |
| | DECEMBER 31, | DECEMBER 31, | DECEMBER 31, |
| | 2013 (z) | 2012 | 2011 |
| Net asset value, beginning | $50.98 | $49.84 | $55.64 |
| Income from investment operations: | | | |
| Net investment income | .17 | .08 | .10 |
| Net realized and unrealized gain (loss) | .19 | 2.35 | (5.74) |
| Total from investment operations | .36 | 2.43 | (5.64) |
| Distributions from: | | | |
| Net investment income | — | (.01) | (.16) |
| Net realized gain | (.35) | (1.28) | — |
| Total distributions | (.35) | (1.29) | (.16) |
| Total increase (decrease) in net asset value | .01 | 1.14 | (5.80) |
| Net asset value, ending | $50.99 | $50.98 | $49.84 |
| |
| Total return* | .72% | 4.90% | (10.13%) |
| Ratios to average net assets:A,B | | | |
| Net investment income | .33% | .19% | .29% |
| Total expenses | .79% | .79% | .84% |
| Expenses before offsets | .79% | .78% | .76% |
| Net expenses | .79% | .78% | .76% |
| Portfolio turnover | 31% | 37% | 28% |
| Net assets, ending (in thousands) | $69,950 | $54,665 | $48,746 |
| |
| | | YEARS ENDED |
| | | DECEMBER 31, | DECEMBER 31, |
| | | 2010 (z) | 2009 (z) |
| Net asset value, beginning | | $47.61 | $36.42 |
| Income from investment operations: | | | |
| Net investment income | | .47 | .08 |
| Net realized and unrealized gain (loss) | | 7.73 | 11.22 |
| Total from investment operations | | 8.20 | 11.30 |
| Distributions from: | | | |
| Net investment income | | (.17) | (.11) |
| Total distributions | | (.17) | (.11) |
| Total increase (decrease) in net asset value | | 8.03 | 11.19 |
| Net asset value, ending | | $55.64 | $47.61 |
| |
| Total return* | | 17.22% | 31.04% |
| Ratios to average net assets: A,B | | | |
| Net investment income | | .98% | .20% |
| Total expenses | | .87% | .90% |
| Expenses before offsets | | .75% | .75% |
| Net expenses | | .75% | .75% |
| Portfolio turnover | | 30% | 35% |
| Net assets, ending (in thousands) | | $42,368 | $17,369 |
See notes to financial highlights.
16 www.calvert.com CALVERT VP NATURAL RESOURCES PORTFOLIO ANNUAL REPORT
A Total expenses do not reflect amounts reimbursed and/or waived by the Advisor or reductions from expense offset arrangements. Expenses before offsets reflect expenses after reimbursement and/or waiver by the Advisor but prior to reductions from expense offset arrangements. Net expenses are net of all reductions and represent the net expenses paid by the portfolio.
B Amounts do not include the activity of the Underlying Funds.
(z) Per share figures are calculated using the Average Shares Method.
* Total return is not annualized for periods of less than one year and does not reflect charges and expenses of the variable annuity or variable universal life contract.
See notes to financial statements.
www.calvert.com CALVERT VP NATURAL RESOURCES PORTFOLIO ANNUAL REPORT 17
EXPLANATION OF FINANCIAL TABLES
SCHEDULE OF INVESTMENTS
The Schedule of Investments is a snapshot of all securities held in the fund at their market value, on the last day of the reporting period. Securities are listed by asset type (e.g., common stock, corporate bonds, U.S. government obligations) and may be further broken down into sub-groups and by industry classification.
STATEMENT OF ASSETS AND LIABILITIES
The Statement of Assets and Liabilities is often referred to as the fund’s balance sheet. It lists the value of what the fund owns, is due and owes on the last day of the reporting period. The fund’s assets include the market value of securities owned, cash, receivables for securities sold and shareholder subscriptions, and receivables for dividends and interest payments that have been earned, but not yet received. The fund’s liabilities typically include payables for securities purchased and shareholder redemptions, and expenses owed but not yet paid. The statement also reports the fund’s net asset value (NAV) per share on the last day of the reporting period. The NAV is calculated by dividing the fund’s net assets (assets minus liabilities) by the number of shares outstanding. This statement is accompanied by a Schedule of Investments. Alternatively, if certain conditions are met, a Statement of Net Assets may be presented in lieu of this statement and the Schedule of Investments.
STATEMENT OF NET ASSETS
The Statement of Net Assets provides a detailed list of the fund’s holdings, including each security’s market value on the last day of the reporting period. The Statement of Net Assets includes a Schedule of Investments. Other assets are added and other liabilities subtracted from the investments total to calculate the fund’s net assets. Finally, net assets are divided by the outstanding shares of the fund to arrive at its share price, or Net Asset Value (NAV) per share.
At the end of the Statement of Net Assets is a table displaying the composition of the fund’s net assets. Paid in Capital is the money invested by shareholders and represents the bulk of net assets. Undistributed Net Investment Income and Accumulated Net Realized Gains usually approximate the amounts the fund had available to distribute to shareholders as of the statement date. Accumulated Realized Losses will appear as negative balances. Unrealized Appreciation (Depreciation) is the difference between the market value of the fund’s investments and their cost, and reflects the gains (losses) that would be realized if the fund were to sell all of its investments at their statement-date values.
STATEMENT OF OPERATIONS
The Statement of Operations summarizes the fund’s investment income earned and expenses incurred in operating the fund. Investment income includes dividends earned from stocks and interest earned from interest-bearing securities in the fund. Expenses incurred in operating the fund include the advisory fee paid to the investment advisor, administrative services fees, distribution plan expenses (if applicable), transfer agent fees, shareholder servicing expenses, custodial, legal, and audit fees, and the printing and postage expenses related to shareholder reports. Expense offsets (fees paid indirectly) are also shown. Credits earned from offset arrangements are used to reduce the fund’s expenses. This statement also shows net gains (losses) realized on the sale of investments and the increase or decrease in the unrealized appreciation (depreciation) on investments held during the period.
STATEMENT OF CHANGES IN NET ASSETS
The Statement of Changes in Net Assets shows how the fund’s total net assets changed during the two most recent reporting periods. Changes in the fund’s net assets are attributable to investment operations, distributions and capital share transactions.
The Operations section of the report summarizes information detailed in the Statement of Operations. The Distribution section shows the dividend and capital gain distributions made to shareholders. The amounts shown as distributions in this section may not match the net investment income and realized gains amounts
18 www.calvert.com CALVERT VP NATURAL RESOURCES PORTFOLIO ANNUAL REPORT (UNAUDITED)
shown in the Operations section because distributions are determined on a tax basis and certain investments or transactions may be treated differently for financial statement and tax purposes. The Capital Share Transactions section shows the amount shareholders invested in the fund, either by purchasing shares or by reinvesting distributions, and the amounts redeemed. The corresponding numbers of shares issued, reinvested and redeemed are shown at the end of the report.
FINANCIAL HIGHLIGHTS
The Financial Highlights table provides a per-share breakdown by class of the components that affect the fund’s net asset value for current and past reporting periods. The table provides total return, total distributions, expense ratios, portfolio turnover and net assets for the applicable period. Total return is a measure of a fund’s performance that encompasses all elements of return: dividends, capital gain distributions and changes in net asset value. Total return is the change in value of an investment over a given period, assuming reinvestment of any dividends and capital gain distributions, expressed as a percentage of the initial investment. Total distributions include distributions from net investment income and net realized gains. Long-term gains are earned on securities held in the fund more than one year. Short-term gains, on the sale of securities held less than one year, are treated as ordinary dividend income for tax purposes. The expense ratio is a fund’s cost of doing business, expressed as a percentage of net assets. These expenses directly reduce returns to shareholders. Portfolio turnover measures the trading activity in a fund’s investment portfolio – how often securities are bought and sold by a fund. Portfolio turnover is affected by market conditions, changes in the size of the fund, the nature of the fund’s investments and the investment style of the portfolio manager.
PROXY VOTING
The Proxy Voting Guidelines that the Portfolio uses to determine how to vote proxies relating to portfolio securities is provided as an Appendix to the Fund’s Statement of Additional Information. The Statement of Additional Information can be obtained free of charge by calling the Fund at 1-800-368-2745, by visiting the Calvert website at www.calvert.com or by visiting the SEC’s website at www.sec.gov.
Information regarding how the Fund voted proxies relating to portfolio securities during the most recent 12-month period ended June 30 is available by calling the Fund, by visiting the Calvert website at www. calvert.com or visiting the SEC’s website at www.sec.gov.
AVAILABILITY OF QUARTERLY PORTFOLIO HOLDINGS
The Fund files its complete schedule of portfolio holdings with the SEC for the first and third quarters of each fiscal year on Form N-Q. The Fund’s Form N-Q is available on the SEC’s website at www.sec.gov. The Fund’s Form N-Q may be reviewed and copied at the SEC’s Public Reference Room in Washington, DC; information on the operation of the Public Reference Room may be obtained by calling 1-800-SEC-0330.
BASIS FOR BOARD’S APPROVAL OF INVESTMENT ADVISORY CONTRACTS
At a meeting held on December 11, 2013, the Board of Directors, and by a separate vote, the disinterested Directors, approved the continuance of the Investment Advisory Agreement between the Portfolio and the Advisor and the Investment Subadvisory Agreement between the Advisor and the Subadvisor with respect to the Portfolio.
In evaluating the Investment Advisory Agreement, the Board considered a variety of information relating to the Portfolio and the Advisor. The disinterested Directors reviewed a report prepared by the Advisor regarding various services provided to the Portfolio by the Advisor and its affiliates. Such report included, among other data, information regarding the Advisor’s personnel and the Advisor’s revenue and cost of providing services to
www.calvert.com CALVERT VP NATURAL RESOURCES PORTFOLIO ANNUAL REPORT (UNAUDITED) 19
the Portfolio, and a separate report prepared by an independent third party, which provided a statistical analysis comparing the Portfolio’s investment performance, expenses, and fees to comparable mutual funds.
The disinterested Directors were separately represented by independent legal counsel with respect to their consideration of the reapproval of the Investment Advisory Agreement and the Investment Subadvisory Agreement. Prior to voting, the disinterested Directors reviewed the proposed continuance of the Investment Advisory Agreement and Investment Subadvisory Agreement with management and also met in private sessions with their counsel at which no representatives of management were present.
In the course of its deliberations regarding the Investment Advisory Agreement, the Board considered the following factors, among others: the nature, extent and quality of the services provided by the Advisor, including the personnel providing such services; the Advisor’s financial condition; the level and method of computing the Portfolio’s advisory fee; comparative performance, fee and expense information for the Portfolio; the profitability of the Calvert Family of Funds to the Advisor and its affiliates; the allocation of the Portfolio’s brokerage, including the Advisor’s process for monitoring “best execution”; the direct and indirect benefits, if any, derived by the Advisor and its affiliates from their relationship with the Portfolio; the effect of the Portfolio’s growth and size on the Portfolio’s performance and expenses; the Advisor’s compliance programs and policies; the Advisor’s performance of substantially similar duties for other funds; and any possible conflicts of interest.
In considering the nature, extent and quality of the services provided by the Advisor under the Investment Advisory Agreement, the Board reviewed information provided by the Advisor relating to its operations and personnel, including, among other information, biographical information on the Advisor’s supervisory and professional staff and descriptions of its organizational and management structure. The Board also took into account similar information provided periodically throughout the previous year by the Advisor, as well as the Board’s familiarity with the Advisor’s management through Board of Directors’ meetings, discussions and other reports. The Board considered the Advisor’s current level of staffing and overall resources. The Board also noted that it reviewed on a quarterly basis information regarding the Advisor’s compliance with applicable policies and procedures, including those related to personal investing. The Advisor’s administrative capabilities, including its ability to supervise the other service providers for the Portfolio, were also considered. The Board discussed the Advisor’s effectiveness in monitoring the performance of the Subadvisor and its timeliness in responding to performance issues. The Board observed that the scope of services provided by the Advisor generally had expanded over time as a result of regulatory, market and other changes. The Board took into consideration, among other factors, the effectiveness of the Portfolio’s and Advisor’s processes, policies and procedures and the Advisor’s personnel. The Board also took into account, among other items, periodic reports received from the Advisor over the past year concerning the Advisor’s ongoing review and enhancement of certain processes, policies and procedures of the Portfolio and the Advisor. The Board concluded that it was satisfied with the nature, extent and quality of services provided to the Portfolio by the Advisor under the Investment Advisory Agreement.
In considering the Portfolio’s performance, the Board noted that it reviewed on a quarterly basis detailed information about the Portfolio’s performance results, portfolio composition and investment strategies. In addition, the Board took into account overall financial market conditions. The Board also reviewed various comparative data provided to it in connection with its consideration of the renewal of the Investment Advisory Agreement, including, among other information, a comparison of the Portfolio’s total return with its Lipper index and with that of other mutual funds deemed to be in its peer universe by an independent third party in its report. This comparison indicated that the Portfolio performed below the median of its peer universe for the one-, three- and five-year periods ended June 30, 2013. The data also indicated that the Portfolio under-performed its Lipper index for the one-, three- and five-year periods ended June 30, 2013. The Board took into account management’s discussion of the Portfolio’s performance and management’s continued monitoring of the Portfolio’s performance. Based upon its review, the Board concluded that appropriate action was being taken with respect to the Portfolio’s performance.
20 www.calvert.com CALVERT VP NATURAL RESOURCES PORTFOLIO ANNUAL REPORT (UNAUDITED)
In considering the Portfolio’s fees and expenses, the Board compared the Portfolio’s fees and total expense ratio with various comparative data for the funds in its peer group. Among other findings, the data indicated that the Portfolio’s advisory fee (after taking into account expense reimbursements) was at the median of its peer group and that total expenses (net of expense reimbursements) were above the median of its peer group. The Board noted that the allocation of advisory and administrative fees may vary among the Portfolio’s peer group. The Board noted that the Advisor had reimbursed a portion of the Portfolio’s expenses. The Board also took into account the Advisor’s current undertaking to maintain expense limitations for the Portfolio. The Board noted that the Advisor paid the Subadvisor’s subadvisory fee under the Investment Subadvisory Agreement with respect to the Portfolio. The Board also took into account management’s discussion of the Portfolio’s expenses and certain factors that affected the level of such expenses, including the current size of the Portfolio. Based upon its review, the Board determined that the advisory fee was reasonable in view of the quality of services received by the Portfolio from the Advisor and the other factors considered.
The Board reviewed the Advisor’s profitability on a portfolio-by-portfolio basis. In reviewing the overall profitability of the advisory fee to the Portfolio’s Advisor, the Board also considered the fact that affiliates of the Advisor provided shareholder servicing and administrative services to the Portfolio for which they received compensation. The information considered by the Board included Calvert’s operating profit margin information both before and after tax expenses with respect to the services that the Advisor and its affiliates provided to the Calvert Family of Funds complex. The Board reviewed the profitability of the Advisor’s relationship with the Portfolio in terms of the total amount of annual advisory fees it received with respect to the Portfolio and whether the Advisor had the financial wherewithal to continue to provide services to the Portfolio. The Board also considered that the Advisor derived benefits to its reputation and other indirect benefits from its relationship with the Portfolio. In addition, the Board took into account that affiliates of the Advisor may benefit from certain indirect tax benefits relating to dividend received deductions and foreign tax credits. The Board also noted that the Advisor paid the subadvisory fee to the Subadvisor, an affiliate of the Advisor, and that the Advisor had reimbursed a portion of the expenses of the Portfolio. Based upon its review, the Board concluded that the Advisor’s and its affiliates’ level of profitability from their relationship with the Portfolio was reasonable.
The Board considered the effect of the Portfolio’s current size and potential growth on its performance and fees. Although the Portfolio’s advisory fee did not contain breakpoints that would reduce the advisory fee rate on assets above specified asset levels, the Board noted that if the Portfolio’s assets increased over time, the Portfolio might realize other economies of scale if assets increased proportionally more than certain other expenses. The Board also noted that given the Portfolio’s current level of assets, the Portfolio would be unlikely to recognize economies of scale by implementing a breakpoint in the advisory fee at this time.
In reapproving the Investment Advisory Agreement, the Board, including the disinterested Directors, did not identify any single factor as controlling, and each Director may have attributed different weight to various factors.
In evaluating the Investment Subadvisory Agreement, the disinterested Directors reviewed information provided by the Subadvisor relating to its operations, personnel, investment philosophy, strategies and techniques. Among other information, the Subadvisor provided biographical information on portfolio management and other professional staff, performance information for itself, and descriptions of its investment philosophies, strategies and techniques, organizational and management structures and brokerage policies and practices.
The Board reapproved the Investment Subadvisory Agreement between the Subadvisor and the Advisor based on a number of factors relating to the Subadvisor’s ability to perform under the Investment Subadvisory Agreement. In the course of its deliberations, the Board evaluated, among other factors: the nature, extent and the quality of the services to be provided by the Subadvisor; the Subadvisor’s management style and long-term performance record; the Portfolio’s performance record and the Subadvisor’s performance in employing
www.calvert.com CALVERT VP NATURAL RESOURCES PORTFOLIO ANNUAL REPORT (UNAUDITED) 21
its investment strategies; the Subadvisor’s current level of staffing and its overall resources; the qualifications and experience of the Subadvisor’s personnel; the Subadvisor’s financial condition with respect to its ability to perform the services required under the Investment Subadvisory Agreement; the Subadvisor’s risk management processes; the Subadvisor’s compliance systems, including those related to personal investing; and any disciplinary history. Based upon its review, the Board concluded that it was satisfied with the nature, extent and quality of services provided to the Portfolio by the Subadvisor under the Investment Subadvisory Agreement.
As noted above, the Board considered, among other information, the Portfolio’s performance during the one-, three- and five-year periods ended June 30, 2013 as compared to the Portfolio’s peer universe and noted that it reviewed on a quarterly basis detailed information about the Portfolio’s performance results, portfolio composition and investment strategies. The Board noted the Advisor’s expertise and resources in monitoring the performance, investment style and risk adjusted performance of the Subadvisor.
In considering the cost of services to be provided by the Subadvisor and the profitability to the Subadvisor of its relationship with the Portfolio, the Board noted that the Advisor and Subadvisor were affiliated and the subadvisory fee under the Investment Subadvisory Agreement was paid by the Advisor out of the advisory fee that the Advisor received under the Investment Advisory Agreement. Based upon its review, the Board determined that the subadvisory fee was reasonable in view of the quality of services received by the Portfolio from the Subadvisor and the other factors considered. Because the Advisor would pay the Subadvisor’s subadvisory fee, the cost of services to be provided by the Subadvisor and the level of profitability to the Subadvisor from its relationship with the Portfolio were not material factors in the Board’s deliberations. For similar reasons, the Board did not consider the potential economies of scale in the Subadvisor’s management of the Portfolio to be a material factor in its consideration.
In reapproving the Investment Subadvisory Agreement, the Board, including the disinterested Directors, did not identify any single factor as controlling, and each Director may have attributed different weight to various factors.
CONCLUSIONS
The Board reached the following conclusions regarding the Investment Advisory Agreement and the Investment Subadvisory Agreement, among others: (a) the Advisor has demonstrated that it possesses the capability and resources to perform the duties required of it under the Investment Advisory Agreement; (b) the Subadvisor is qualified to manage the Portfolio’s assets in accordance with the Portfolio’s investment objective and policies; (c) the Advisor and Subadvisor maintain appropriate compliance programs; (d) the Subadvisor is likely to execute its investment strategies consistently over time; (e) appropriate action is being taken with respect to the Portfolio’s performance; and (f) the Portfolio’s advisory and subadvisory fees are reasonable in view of the quality of services received by the Portfolio from the Advisor and Subadvisor and the other factors considered. Based on its conclusions, the Board determined that reapproval of the Investment Advisory Agreement and the Investment Subadvisory Agreement would be in the best interests of the Portfolio and its shareholders.
22 www.calvert.com CALVERT VP NATURAL RESOURCES PORTFOLIO ANNUAL REPORT (UNAUDITED)
This report is intended to provide fund information to shareholders. It is not authorized for distribution to prospective investors unless preceded or accompanied by a prospectus.
Note: The information on our website is not incorporated by reference into this report; our website address is included as an inactive textual reference only.
Investors should carefully consider the investment objectives, risks, charges and expenses of the Calvert Funds. This and other important information is contained in the fund’s summary prospectus and prospectus, which can be obtained from your financial professional and should be read carefully before investing. You may also call Calvert at 800/368-2745 or visit www. calvert.com.
www.calvert.com CALVERT VP NATURAL RESOURCES PORTFOLIO ANNUAL REPORT (UNAUDITED) 23

24 www.calvert.com CALVERT VP NATURAL RESOURCES PORTFOLIO ANNUAL REPORT (UNAUDITED)

www.calvert.com CALVERT VP NATURAL RESOURCES PORTFOLIO ANNUAL REPORT (UNAUDITED) 25

CALVERT VP VOLATILITY MANAGED MODERATE PORTFOLIO
Portfolio within Calvert Variable Products, Inc.
Managed by Calvert Investment Management, Inc.
INVESTMENT PERFORMANCE
From inception on April 30, 2013 through December 31, 2013, Calvert VP Volatility Managed Moderate Portfolio returned 1.97%, underperforming the S&P 500 Daily Risk Control 7.5% Total Return Index, which returned 10.40%.
Calvert has developed a secondary composite benchmark based on a mix of market indices* that more closely reflect the asset allocation strategy than the single asset class benchmark listed above that is used to capture the impact of the volatility management strategy.
Calvert VP Volatility Managed Moderate Portfolio also underperformed the blended composite benchmark return of 5.78%.
INVESTMENT CLIMATE
The equity markets finished 2013 on a strong note with many indices registering all-time highs despite mixed economic signals and concerns over the Federal Reserve’s (Fed’s) “tapering” of long-term asset purchases and exit from quantitative easing. While much of the market commentary during the year focused on what was happening at the Fed, an important and sometimes overlooked driver of economic activity, and by extension Fed policy, was the improving health of the consumer balance sheet.
As the overall economic recovery stabilized, improvements in the labor and housing markets, coupled with robust equity market performance, all contributed to further strengthen the consumer balance sheet. As a result, U.S. consumer confidence and spending have recovered considerably from post-financial-crisis lows and are now contributing to GDP growth. Growing consumer confidence and reduced risk aversion also helped keep volatility subdued during the year as macro-risks faded from the forefront and investors shifted their attention to nascent signs of growth in the global economy.
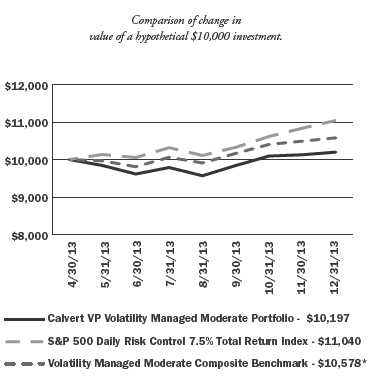
| AVERAGE ANNUAL TOTAL RETURN |
| (period ended 12.31.13) |
| Since Inception (4/30/2013)** | 1.97% |
The performance data shown represents past performance, does not guarantee future results and assumes reinvestment of all dividends and distributions. All performance data reflects fee waivers and/or expense limitations, if any are in effect; in their absence performance would be lower. See Note B in Notes to Financial Statements. The investment return and principal value of an investment will fluctuate so that an investor’s shares, when redeemed, may be worth more or less than their original cost. Current performance may be lower or higher than the performance data quoted.
Visit www.calvert.com/institutional-VP-performance.html for current performance data. The gross expense ratio from the current prospectus for the Portfolio is 1.71% (includes Acquired Fund fees). This number may vary from the expense ratio shown elsewhere in this report because it is based on a different time period and, if applicable, does not include fee or expense waivers. The performance data and expense ratio reflect deduction of Portfolio operating expenses, but do not reflect charges and expenses imposed under the variable annuity or life insurance contract.
* The Volatility Managed Moderate Composite Benchmark is an internally constructed index comprised of a blend of 36% Russell 3000 Index, 2% MSCI US REIT Index, 10% MSCI EAFE Index, 48% Barclays U.S. Aggregate Bond Index and 4% Barclays 3 Month T-Bill Bellwether Index.
** Total Return is not annualized for periods of less than one year.
4 www.calvert.com CALVERT VP VOLATILITY MANAGED MODERATE PORTFOLIO ANNUAL REPORT
| |
| | % OF TOTAL |
| ECONOMIC SECTORS | INVESTMENTS |
| |
| Exchange Traded Products | 94.7% |
| Short-Term Investments | 5.3% |
| Total | 100% |
Stocks were the top performing asset class for the year, led by U.S. equities with the Russell 3000 Index, representing the total U.S. equity market, returning 33.55% and outperforming international stocks as the MSCI EAFE Index returned 23.29%. Bonds produced a negative return for the first time in more than a decade as the Barclays U.S. Aggregate Bond Index returned -2.02%. Low inflation hit Treasury Inflation-Protected Securities particularly hard, with the Barclays U.S. TIPS Index declining 8.61%. The MSCI US REIT Index finished the year at 2.47%, despite the negative impact of tapering on mortgage rates during the second half of the year.
PORTFOLIO STRATEGY
The Portfolio seeks to stabilize portfolio volatility1 around a target level of 7.5% while pursuing current income and modest growth potential, consistent with the preservation of capital. To achieve this objective, the Portfolio invests in a group of exchange traded funds (ETFs) diversified across multiple asset classes and uses a derivative-based risk management strategy, primarily using futures contracts on various market indices. In an effort to manage long-term volatility, the target asset allocation model is designed to reflect the specified target level of risk. Meanwhile, the risk management strategy is employed to mitigate short-term fluctuations in volatility and realize a long-term risk level over a shorter time frame. The risk management strategy combines two components—volatility management and a capital protection strategy—that work together in an effort to reduce the negative effects of high portfolio volatility while seeking to participate in growth during up markets and defend against significant losses during major market downturns.
The historic relationship between rising equity markets and periods of low volatility was on display in 2013 as equity markets rallied throughout the year while the level of equity market risk declined to unusually low levels. Therefore, the risk management strategy sought to increase our equity exposure to achieve the desired 7.5% level of volatility. However, it could not achieve this due to risk controls limiting the Portfolio’s maximum equity exposure. Given the strong performance of U.S. equities, the Portfolio’s lower level of equity market exposure relative to the Index, which does not limit the equity exposure level, was a major contributor to the Portfolio’s underperformance for the period. Holdings of REITS and TIPS also contributed to the Portfolio’s underperformance relative to both the Index and composite benchmark.
OUTLOOK
We expect the U.S. economic recovery to continue to gain strength into 2014 and to provide a firm foundation for continued improvements in growth and employment, even in the face of the Federal Reserve’s tapering activities. It is important to remember that the Fed’s taper is merely an inflection point in its provision of extraordinary post-crisis support. The Fed still provides levels of support far above and beyond historical norms; it merely has switched from expanding to reducing that level gradually over time. Moreover, should the withdrawal of Fed support unexpectedly push the economy back into recession, there is no reason to think the Fed would not slow or even reverse its decisions, unless inflation becomes a serious problem.
A bigger question is whether equity valuations already reflect current growth expectations, or whether there is room for continued price/earnings multiple expansion in 2014. Returns of near 30% in 2013 already include a substantial component of multiple expansion, and so it is possible that financial markets may need to rest a bit in order to digest that expansion before moving any higher. However, we do think that improvements in the consumer balance sheet and employment, in combination with likely continued headwinds in fixed income, mean that more people will be ready to put investment money to work, and especially into equities. In this environment, it seems reasonable to expect continued multiple expansion in 2014, even if at a slower rate than was observed in 2013.
www.calvert.com CALVERT VP VOLATILITY MANAGED MODERATE PORTFOLIO ANNUAL REPORT 5
In a market environment characterized by dominant performance from a single asset class, in this case U.S. stocks, returns from a diversified asset allocation strategy will inevitably trail. However, over a longer time horizon time, the benefits from diversification should produce better risk-adjusted returns than can be had from investing in any single asset class.
January 2014
1. Volatility refers to the annualized standard deviation of daily logarithmic portfolio returns.
6 www.calvert.com CALVERT VP VOLATILITY MANAGED MODERATE PORTFOLIO ANNUAL REPORT
SHAREHOLDER EXPENSE EXAMPLE
As a shareholder of the Fund, you incur two types of costs: (1) transaction costs, and (2) ongoing costs, including management fees and other Fund expenses. This Example is intended to help you understand your ongoing costs (in dollars) of investing in the Fund and to compare these costs with the ongoing costs of investing in other mutual funds.
This Example is based on an investment of $1,000 invested at the beginning of the period and held for the entire period (July 1, 2013 to December 31, 2013).
Note: Expenses do not reflect charges and expenses of the variable annuity or variable universal life contract.
Actual Expenses
The first line of the table below provides information about actual account values and actual expenses. You may use the information in this line, together with the amount you invested, to estimate the expenses that you paid over the period. Simply divide your account value by $1,000 (for example, an $8,600 account value divided by $1,000 = 8.6), then multiply the result by the number in the first line under the heading entitled “Expenses Paid During Period” to estimate the expenses you paid on your account during this period.
Hypothetical Example for Comparison Purposes
The second line of the table below provides information about hypothetical account values and hypothetical expenses based on the Fund’s actual expense ratio and an assumed rate of return of 5% per year before expenses, which is not the Fund’s actual return. The hypothetical account values and expenses may not be used to estimate the actual ending account balance or expenses you paid for the period. You may use this information to compare the ongoing costs of investing in the Fund and other funds. To do so, compare the 5% hypothetical example with the 5% hypothetical examples that appear in the shareholder reports of the other funds.
Please note that the expenses shown in the table are meant to highlight your ongoing costs only and do not reflect any transactional costs. Therefore, the second line of the table is useful in comparing ongoing costs only, and will not help you determine the relative total costs of owning different funds. In addition, if these transactional costs were included, your costs would have been higher.
| | BEGINNING | ENDING | EXPENSES PAID |
| | ACCOUNT VALUE | ACCOUNT VALUE | DURING PERIOD* |
| | 7/1/13 | 12/31/13 | 7/1/13 - 12/31/13 |
| |
| Actual | $1,000.00 | $1,060.69 | $4.31 |
| |
Hypothetical
(5% return per year before expenses) | $1,000.00 | $1,021.02 | $4.23 |
* Expenses are equal to the Fund’s annualized expense ratio of 0.83%, multiplied by the average account value over the period, multiplied by 184/365 (to reflect the one-half year period). The fees and expenses of the Underlying Funds in which the Portfolio invests are not included in the annualized expense ratios.
www.calvert.com CALVERT VP VOLATILITY MANAGED MODERATE PORTFOLIO ANNUAL REPORT 7
REPORT OF INDEPENDENT REGISTERED PUBLIC ACCOUNTING FIRM
The Board of Directors of Calvert Variable Products, Inc. and Shareholders of Calvert VP Volatility Managed Moderate Portfolio: We have audited the accompanying statement of net assets of the Calvert VP Volatility Managed Moderate Portfolio (the “Portfolio”), a series of Calvert Variable Products, Inc., as of December 31, 2013, and the related statement of operations, the statement of changes in net assets, and the financial highlights for the period from Inception April 30, 2013, through December 31, 2013. These financial statements and financial highlights are the responsibility of the Portfolio’s management. Our responsibility is to express an opinion on these financial statements and financial highlights based on our audit.
We conducted our audit in accordance with the standards of the Public Company Accounting Oversight Board (United States). Those standards require that we plan and perform the audit to obtain reasonable assurance about whether the financial statements and financial highlights are free of material misstatement. An audit includes examining, on a test basis, evidence supporting the amounts and disclosures in the financial statements. Our procedures included confirmation of securities owned as of December 31, 2013, by correspondence with the custodian and brokers or by performing other appropriate auditing procedures. An audit also includes assessing the accounting principles used and significant estimates made by management, as well as evaluating the overall financial statement presentation. We believe that our audit provides a reasonable basis for our opinion.
In our opinion, the financial statements and financial highlights referred to above present fairly, in all material respects, the financial position of the Calvert VP Volatility Managed Moderate Portfolio as of December 31, 2013, the results of its operations, the changes in its net assets, and the financial highlights for the period from Inception April 30, 2013, through December 31, 2013, in conformity with U.S. generally accepted accounting principles.

Philadelphia, Pennsylvania
February 24, 2014
8 www.calvert.com CALVERT VP VOLATILITY MANAGED MODERATE PORTFOLIO ANNUAL REPORT
| | |
| STATEMENT OF NET ASSETS |
| DECEMBER 31, 2013 |
| |
| EXCHANGE TRADED PRODUCTS - 93.3% | SHARES | VALUE |
| iShares Core Total US Bond Market ETF | 17,700 | $1,883,811 |
| iShares North American Natural Resources ETF | 4,600 | 199,594 |
| iShares S&P 500 Growth ETF | 4,600 | 454,158 |
| iShares S&P 500 Value ETF | 6,500 | 555,490 |
| iShares TIPS Bond ETF | 8,600 | 945,140 |
| Powershares QQQ Trust, Series 1 | 5,200 | 457,392 |
| SPDR Barclays High Yield Bond ETF | 8,500 | 344,760 |
| Vanguard FTSE Developed Markets ETF | 19,500 | 812,760 |
| Vanguard REIT ETF | 12,100 | 781,176 |
| Vanguard S&P 500 ETF | 4,800 | 811,920 |
| Vanguard Total Bond Market ETF | 13,000 | 1,039,870 |
| Vanguard Total International Stock ETF | 5,100 | 267,138 |
| |
| Total Exchange Traded Products (Cost $8,399,864) | | 8,553,209 |
| |
| | PRINCIPAL | |
| TIME DEPOSIT - 5.2% | AMOUNT | |
| State Street Bank Time Deposit, 0.083%, 1/2/14 | $475,993 | 475,993 |
| |
| Total Time Deposit (Cost $475,993) | | 475,993 |
| |
| |
| TOTAL INVESTMENTS (Cost $8,875,857) - 98.5% | | 9,029,202 |
| Other assets and liabilities, net - 1.5% | | 134,752 |
| NET ASSETS - 100% | | $9,163,954 |
| |
| |
| NET ASSETS CONSISTS OF: | | |
| Paid-in capital applicable to 604,109 shares of common stock outstanding; | | |
| $0.10 par value, 100,000,000 shares authorized | | $9,001,159 |
| Accumulated net realized gain (loss) | | (12,256) |
| Net unrealized appreciation (depreciation) | | 175,051 |
| |
| NET ASSETS | | $9,163,954 |
| |
| NET ASSET VALUE PER SHARE | | $15.17 |
See notes to financial statements.
www.calvert.com CALVERT VP VOLATILITY MANAGED MODERATE PORTFOLIO ANNUAL REPORT 9
| | | | UNDERLYING | UNREALIZED |
| | NUMBER OF | EXPIRATION | FACE AMOUNT | APPRECIATION |
| FUTURES | CONTRACTS | DATE | AT VALUE | (DEPRECIATION) |
| Purchased: | | | | |
| E-Mini S&P 500 Index | 6 | 3/14 | $552,330 | $21,706 |
Abbreviations:
ETF: Exchange Traded Fund
REIT: Real Estate Investment Trust
See notes to financial statements.
10 www.calvert.com CALVERT VP VOLATILITY MANAGED MODERATE PORTFOLIO ANNUAL REPORT
| |
| STATEMENT OF OPERATIONS | |
| FROM INCEPTION APRIL 30, 2013 | |
| THROUGH DECEMBER 31, 2013 | |
| |
| NET INVESTMENT INCOME | |
| Investment Income: | |
| Dividend income | $101,082 |
| Interest income | 217 |
| Total investment income | 101,299 |
| |
| Expenses: | |
| Investment advisory fee | 14,496 |
| Transfer agency fees and expenses | 781 |
| Accounting fees | 518 |
| Directors’ fees and expenses | 691 |
| Administrative fees | 3,452 |
| Distribution Plan expenses | 8,629 |
| Custodian fees | 7,433 |
| Reports to shareholders | 3,106 |
| Professional fees | 16,085 |
| Total expenses | 55,191 |
| Reimbursement from Advisor | (26,540) |
| Net expenses | 28,651 |
| |
| |
| NET INVESTMENT INCOME | 72,648 |
| |
| |
| REALIZED AND UNREALIZED GAIN (LOSS) | |
| Net realized gain (loss) on: | |
| Investments | (8,939) |
| Futures | (3,322) |
| | (12,261) |
| |
| Change in unrealized appreciation (depreciation) on: | |
| Investments | 153,345 |
| Futures | 21,706 |
| | 175,051 |
| |
| |
| |
| NET REALIZED AND UNREALIZED GAIN (LOSS) | 162,790 |
| |
| INCREASE (DECREASE) IN NET ASSETS | |
| RESULTING FROM OPERATIONS | $235,438 |
See notes to financial statements.
www.calvert.com CALVERT VP VOLATILITY MANAGED MODERATE PORTFOLIO ANNUAL REPORT 11
| |
| STATEMENT OF CHANGES IN NET ASSETS |
| |
| | FROM INCEPTION |
| | APRIL 30, 2013 |
| | THROUGH |
| | DECEMBER 31, |
| INCREASE (DECREASE) IN NET ASSETS | 2013 |
| Operations: | |
| Net investment income | $72,648 |
| Net realized gain (loss) | (12,261) |
| Change in unrealized appreciation (depreciation) | 175,051 |
| |
| |
| INCREASE (DECREASE) IN NET ASSETS | |
| RESULTING FROM OPERATIONS | 235,438 |
| |
| Distributions to shareholders from: | |
| Net investment income | (72,643) |
| Total distributions | (72,643) |
| |
| |
| Capital share transactions: | |
| Shares sold | 8,997,652 |
| Reinvestment of distributions | 55,980 |
| Shares redeemed | (52,473) |
| Total capital share transactions | 9,001,159 |
| |
| |
| |
| TOTAL INCREASE (DECREASE) IN NET ASSETS | 9,163,954 |
| |
| |
| NET ASSETS | |
| Beginning of period | — |
| End of period | $9,163,954 |
| |
| |
| CAPITAL SHARE ACTIVITY | |
| Shares sold | 603,948 |
| Reinvestment of distributions | 3,695 |
| Shares redeemed | (3,534) |
| Total capital share activity | 604,109 |
See notes to financial statements.
12 www.calvert.com CALVERT VP VOLATILITY MANAGED MODERATE PORTFOLIO ANNUAL REPORT
NOTES TO FINANCIAL STATEMENTS
NOTE A –- SIGNIFICANT ACCOUNTING POLICIES
General: Calvert VP Volatility Managed Moderate Portfolio (the “Portfolio”), a series of Calvert Variable Products, Inc. (the “Fund”), is registered under the Investment Company Act of 1940 as a diversified, open-end management investment company. The Fund is comprised of twelve separate portfolios. The operations of each series of the Fund are accounted for separately. The Portfolio began operations on April 30, 2013 and offers Class F shares, which are subject to Distribution Plan expenses. Shares of the Portfolio are sold without sales charge to affiliated and unaffiliated insurance companies for allocation to certain of their variable separate accounts. The Portfolio invests primarily in exchange traded funds representing a broad range of asset classes (the “Underlying Funds”) and derivatives to manage overall portfolio volatility.
Security Valuation: Net asset value per share is determined every business day as of the close of the regular session of the New York Stock Exchange (generally 4:00 p.m. Eastern time). The Portfolio uses independent pricing services approved by the Board of Directors (“the Board”) to value its investments wherever possible. Investments for which market quotations are not available or deemed not reliable are fair valued in good faith under the direction of the Board.
The Board has adopted Valuation Procedures (the “Procedures”) to determine the fair value of securities and other financial instruments for which market prices are not readily available or which may not be reliably priced. The Board has delegated the day-to-day responsibility for determining the fair value of assets of the Portfolio to Calvert Investment Management, Inc. (the “Advisor” or “Calvert”) and has provided these Procedures to govern Calvert in its valuation duties.
Calvert has chartered an internal Valuation Committee to oversee the implementation of these Procedures and to assist it in carrying out the valuation responsibilities that the Board has delegated.
The Valuation Committee meets on a regular basis to review illiquid securities and other investments which may not have readily available market prices. The Valuation Committee’s fair valuation determinations are subject to review, approval and ratification by the Board at its next regularly scheduled meeting covering the calendar quarter in which the fair valuation was determined.
The Valuation Committee utilizes various methods to measure the fair value of the Portfolio’s investments. Generally Accepted Accounting Principles (GAAP) establishes a disclosure hierarchy that categorizes the inputs to valuation techniques used to value assets and liabilities at measurement date. These inputs are summarized in the three broad levels listed below:
Level 1 – quoted prices in active markets for identical securities
Level 2 – other significant observable inputs (including quoted prices for similar securities, interest rates, prepayment speeds, credit risk, etc.)
Level 3 – significant unobservable inputs (including the Portfolio’s own assumptions in determining the fair value of investments) The inputs or methodologies used for valuing securities are not necessarily an indication of the risk associated with investing in those securities.
Changes in valuation techniques may result in transfers in or out of an investment’s assigned level within the hierarchy during the period. There were no such transfers during the period. Valuation techniques used to value the Portfolio’s investments by major category are as follows: Exchange traded products are valued at the official closing price as reported by an independent pricing service on the primary market or exchange on which they are traded and are categorized as Level 1 in the hierarchy.
www.calvert.com CALVERT VP VOLATILITY MANAGED MODERATE PORTFOLIO ANNUAL REPORT 13
Short-term securities of sufficient credit quality with remaining maturities of sixty days or less for which quotations are not readily available are valued at amortized cost, which approximates fair value, and are categorized as Level 2 in the hierarchy.
If a market value cannot be determined for a security using the methodologies described above, or if, in the good faith opinion of the Advisor, the market value does not constitute a readily available market quotation, or if a significant event has occurred that would materially affect the value of the security, the security will be fair valued as determined in good faith by the Valuation Committee.
The Valuation Committee considers a number of factors, including significant unobservable valuation inputs when arriving at fair value. It considers all significant facts that are reasonably available and relevant to the determination of fair value.
The Valuation Committee primarily employs a market-based approach which may use related or comparable assets or liabilities, recent transactions, market multiples, book values, and other relevant information for the investment to determine the fair value of the investment. When more appropriate, the fund may employ an income-based or cost approach. An income-based valuation approach discounts anticipated future cash flows of the investment to calculate a present amount (discounted). The measurement is based on the value indicated by current market expectations about those future amounts. Discounts may also be applied due to the nature or duration of any restrictions on the disposition of the investments. A cost based approach is based on the amount that currently would be required to replace the service capacity of an asset (current replacement cost). From the seller’s perspective, the price that would be received for the asset is determined based on the cost to a buyer to acquire or construct a substitute asset of comparable utility, adjusted for obsolescence.
The values assigned to fair value investments are based on available information and do not necessarily represent amounts that might ultimately be realized. Further, due to the inherent uncertainty of valuations of such investments, the fair values may differ significantly from the values that would have been used had an active market existed, and the differences could be material. The Valuation Committee employs various methods for calibrating these valuation approaches including a regular review of key inputs and assumptions, transactional back-testing or disposition analysis and reviews of any related market activity.
At December 31, 2013, no securities were fair valued in good faith under the direction of the Board.
The following is a summary of the inputs used to value the Portfolio’s net assets as of December 31, 2013:
| | | VALUATION INPUTS | |
| INVESTMENTS IN SECURITIES* | LEVEL 1 | LEVEL 2 | LEVEL 3 | TOTAL |
| Exchange traded products | $8,553,209 | — | — | $8,553,209 |
| Other debt obligations | — | $475,993 | — | 475,993 |
| TOTAL | $8,553,209 | $475,993 | — | $9,029,202 |
| Other financial instruments** | $21,706 | — | — | $21,706 |
* For a complete listing of investments, please refer to the Statement of Net Assets.
** Other financial instruments are derivative instruments not reflected in the Total Investments in the Statement of Net Assets, such as futures, which are valued at the unrealized appreciation/depreciation on the instrument.
Futures Contracts: The Portfolio may purchase and sell futures contracts to manage overall portfolio volatility. These futures contracts may include, but are not limited to, market index futures contracts and futures contracts based on U.S. government obligations. The Portfolio may enter into futures contracts agreeing to buy or sell a financial instrument for a set price at a future date. Initial margin deposits of either cash or securities as required by the broker are made upon entering into the contract. While the contract is open,
14 www.calvert.com CALVERT VP VOLATILITY MANAGED MODERATE PORTFOLIO ANNUAL REPORT
daily variation margin payments are made to or received from the broker reflecting the daily change in market value of the contract and are recorded for financial reporting purposes as unrealized gains or losses by the Portfolio. When a futures contract is closed, a realized gain or loss is recorded equal to the difference between the opening and closing value of the contract. The risks associated with entering into futures contracts may include the possible illiquidity of the secondary market which would limit the Portfolio’s ability to close out a futures contract prior to the settlement date, an imperfect correlation between the value of the contracts and the underlying financial instruments, or that the counterparty will fail to perform its obligations under the contracts’ terms. Futures contracts are designed by boards of trade which are designated “contracts markets” by the Commodities Futures Trading Commission. Futures contracts trade on the contracts markets in a manner that is similar to the way a stock trades on a stock exchange and the boards of trade, through their clearing corporations, guarantee the futures contracts against default. As a result, there is minimal counterparty credit risk to the Portfolio. During the period, futures contracts were used to adjust the Portfolio’s overall equity exposure in an effort to stabilize portfolio volatility around a target level. The Portfolio’s futures contracts at period end are presented in the Statement of Net Assets.
During the period from the inception of the Portfolio through December 31, 2013, the Portfolio invested in E-Mini S&P 500 Index futures. The volume of outstanding contracts has varied throughout the period with a weighted average of 7 contracts and $398,191 weighted average notional value.
Security Transactions and Investment Income: Security transactions, normally related to shares of the Underlying Funds, are accounted for on trade date. Realized gains and losses are recorded on an identified cost basis. Income and capital gain distributions from the Underlying Funds, if any, are recorded on the ex-dividend date. Distributions received on securities that represent a return of capital or capital gain are recorded as a reduction of cost of investments and/or as a realized gain. Interest income, which includes amortization of premium and accretion of discount on debt securities, is accrued as earned. Expenses included in the accompanying financial statements reflect the expenses of the Portfolio and do not include any expenses associated with the Underlying Funds.
Distributions to Shareholders: Distributions to shareholders are recorded by the Portfolio on ex-dividend date. Dividends from net investment income and distributions from net realized capital gains, if any, are paid at least annually. Distributions are determined in accordance with income tax regulations which may differ from generally accepted accounting principles; accordingly, periodic reclassifications are made within the Portfolio’s capital accounts to reflect income and gains available for distribution under income tax regulations.
Estimates: The preparation of financial statements in conformity with accounting principles generally accepted in the United States requires management to make estimates and assumptions that affect the reported amounts of assets and liabilities and disclosure of contingent assets and liabilities at the date of the financial statements and the reported amounts of income and expenses during the reporting period. Actual results could differ from those estimates.
Federal Income Taxes: No provision for federal income or excise tax is required since the Portfolio intends to continue to qualify as a regulated investment company under the Internal Revenue Code and to distribute substantially all of its taxable earnings.
Management has analyzed the Portfolio’s tax positions taken for all open federal income tax years and has concluded that no provision for federal income tax is required in the Portfolio’s financial statements. A Portfolio’s federal tax return is subject to examination by the Internal Revenue Service for a period of three years.
NOTE B — RELATED PARTY TRANSACTIONS
Calvert Investment Management, Inc. (the “Advisor”) is wholly-owned by Calvert Investments, Inc., which is indirectly wholly-owned by Ameritas Mutual Holding Company. The Advisor provides investment advisory services and pays the salaries and fees of officers and Directors of the Fund who are employees of the Advisor
www.calvert.com CALVERT VP VOLATILITY MANAGED MODERATE PORTFOLIO ANNUAL REPORT 15
or its affiliates. For its services, the Advisor receives an annual fee, payable monthly, of .42% of the Portfolio’s average daily net assets. Under the terms of the agreement, $3,015 was payable at period end. In addition, $441 was payable at period end for operating expenses paid by the Advisor during December 2013.
The Advisor has contractually agreed to limit net annual portfolio operating expenses through April 30, 2014. The contractual expense cap is .83%. For the purpose of this expense limit, operating expenses do not include interest expense, brokerage commissions, taxes and extraordinary expenses. This expense limitation does not limit fees and expenses associated with the Underlying Funds. Under the terms of the agreement, $14,427 was receivable at period end.
Calvert Investment Administrative Services, Inc., an affiliate of the Advisor, provides administrative services to the Portfolio for an annual fee, payable monthly, of .10% of the average daily net assets of the Portfolio. Under the terms of the agreement, $718 was payable at period end.
Calvert Investment Distributors, Inc. (“CID”), an affiliate of the Advisor, is the distributor and principal underwriter for the Portfolio. Pursuant to Rule 12b-1 under the Investment Company Act of 1940, the Portfolio has adopted a Distribution Plan that permits the Portfolio to pay certain expenses associated with the distribution and servicing of its shares. The expenses paid may not exceed 0.25% annually of the average daily net assets of Class F. Under the terms of the agreement, $1,795 was payable at period end.
Calvert Investment Services, Inc. (“CIS”), an affiliate of the Advisor, acts as shareholder servicing agent for the Portfolio. For its services, CIS received a fee of $286 for the period from the inception of the Portfolio through December 31, 2013. Under the terms of the agreement, $33 was payable at period end. Boston Financial Data Services, Inc. is the transfer and dividend disbursing agent.
Each Director of the Fund who is not an employee of the Advisor or its affiliates receives a fee of $1,500 for each Board and Committee meeting attended plus an annual fee of $40,000. Committee chairs receive an additional $5,000 annual retainer. Directors’ fees are allocated to each of the portfolios served.
NOTE C — INVESTMENT ACTIVITY AND TAX INFORMATION
During the period from the inception of the Portfolio through December 31, 2013, the cost of purchases and proceeds from sales of investments, other than short-term securities, were $8,555,005 and $146,202, respectively.
The tax character of dividends and distributions paid during the period ended December 31, 2013 was as follows:
| Distributions paid from: | 2013 |
| Ordinary income | $72,643 |
| Total | $72,643 |
As of December 31, 2013, the tax basis components of distributable earnings/(accumulated losses) and the federal tax cost were as follows:
| Unrealized appreciation | $305,847 |
| Unrealized (depreciation) | (161,441) |
| Net unrealized appreciation/(depreciation) | $144,406 |
| Undistributed ordinary income | $6,391 |
| Undistributed long-term capital gain | $11,998 |
| Federal income tax cost of investments | $8,884,796 |
16 www.calvert.com CALVERT VP VOLATILITY MANAGED MODERATE PORTFOLIO ANNUAL REPORT
The differences between the components of distributable earnings on a tax basis and the amounts reflected in the statement of net assets are primarily due to temporary book-tax differences that will reverse in a subsequent period. These differences are due to wash sales and Section 1256 contracts.
NOTE D — LINE OF CREDIT
A financing agreement is in place with the Calvert Funds and State Street Corporation (“SSC”). Under the agreement, SSC provides an unsecured line of credit facility, in the aggregate amount of $50 million ($25 million committed and $25 million uncommitted), accessible by the Funds for temporary or emergency purposes only. Borrowings under the committed facility bear interest at the higher of the London Interbank Offered Rate (LIBOR) or the overnight Federal Funds Rate plus 1.25% per annum. A commitment fee of .11% per annum is incurred on the unused portion of the committed facility, which is allocated to all participating funds. The Portfolio had no borrowings under the agreement during the period ended December 31, 2013.
NOTE E — SUBSEQUENT EVENTS
In preparing the financial statements as of December 31, 2013, no subsequent events or transactions occurred that would have required recognition or disclosure in these financial statements.
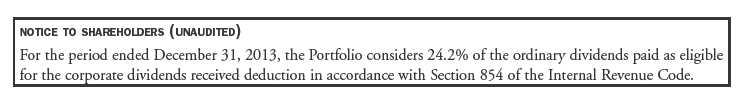
www.calvert.com CALVERT VP VOLATILITY MANAGED MODERATE PORTFOLIO ANNUAL REPORT 17
| |
| FINANCIAL HIGHLIGHTS |
| |
| | PERIOD ENDED |
| | DECEMBER 31, |
| | 2013#(z) |
| Net asset value, beginning | $15.00 |
| Income from investment operations: | |
| Net investment income | .21 |
| Net realized and unrealized gain (loss) | .08 |
| Total from investment operations | .29 |
| Distributions from: | |
| Net investment income | (.12) |
| Total distributions | (.12) |
| Total increase (decrease) in net asset value | .17 |
| Net asset value, ending | $15.17 |
| |
| Total return* | 1.97% |
| Ratios to average net assets: A, B | |
| Net investment income | 2.10% (a) |
| Total expenses | 1.60% (a) |
| Expenses before offsets | .83% (a) |
| Net expenses | .83% (a) |
| Portfolio turnover | 3% |
| Net assets, ending (in thousands) | $9,164 |
A Total expenses do not reflect amounts reimbursed and/or waived by the Advisor or reductions from expense offset arrangments. Expenses before offsets reflect expenses after reimbursement and/or waiver by the Advisor but prior to reductions from expense offset arrangements. Net expenses are net of all reductions and represent the net expenses paid by the portfolio.
B Amounts do not include the activity of the Underlying Funds.
(a) Annualized.
(z) Per share figures are calculated using the Average Shares Method.
# From April 30, 2013 inception.
* Total return is not annualized for periods of less than one year and does not reflect charges and expenses of the variable annuity or variable universal life contract.
See notes to financial statements.
18 www.calvert.com CALVERT VP VOLATILITY MANAGED MODERATE PORTFOLIO ANNUAL REPORT
EXPLANATION OF FINANCIAL TABLES
SCHEDULE OF INVESTMENTS
The Schedule of Investments is a snapshot of all securities held in the fund at their market value, on the last day of the reporting period. Securities are listed by asset type (e.g., common stock, corporate bonds, U.S. government obligations) and may be further broken down into sub-groups and by industry classification.
STATEMENT OF ASSETS AND LIABILITIES
The Statement of Assets and Liabilities is often referred to as the fund’s balance sheet. It lists the value of what the fund owns, is due and owes on the last day of the reporting period. The fund’s assets include the market value of securities owned, cash, receivables for securities sold and shareholder subscriptions, and receivables for dividends and interest payments that have been earned, but not yet received. The fund’s liabilities typically include payables for securities purchased and shareholder redemptions, and expenses owed but not yet paid. The statement also reports the fund’s net asset value (NAV) per share on the last day of the reporting period. The NAV is calculated by dividing the fund’s net assets (assets minus liabilities) by the number of shares outstanding. This statement is accompanied by a Schedule of Investments. Alternatively, if certain conditions are met, a Statement of Net Assets may be presented in lieu of this statement and the Schedule of Investments.
STATEMENT OF NET ASSETS
The Statement of Net Assets provides a detailed list of the fund’s holdings, including each security’s market value on the last day of the reporting period. The Statement of Net Assets includes a Schedule of Investments. Other assets are added and other liabilities subtracted from the investments total to calculate the fund’s net assets. Finally, net assets are divided by the outstanding shares of the fund to arrive at its share price, or Net Asset Value (NAV) per share.
At the end of the Statement of Net Assets is a table displaying the composition of the fund’s net assets. Paid in Capital is the money invested by shareholders and represents the bulk of net assets. Undistributed Net Investment Income and Accumulated Net Realized Gains usually approximate the amounts the fund had available to distribute to shareholders as of the statement date. Accumulated Realized Losses will appear as negative balances. Unrealized Appreciation (Depreciation) is the difference between the market value of the fund’s investments and their cost, and reflects the gains (losses) that would be realized if the fund were to sell all of its investments at their statement-date values.
STATEMENT OF OPERATIONS
The Statement of Operations summarizes the fund’s investment income earned and expenses incurred in operating the fund. Investment income includes dividends earned from stocks and interest earned from interest-bearing securities in the fund. Expenses incurred in operating the fund include the advisory fee paid to the investment advisor, administrative services fees, distribution plan expenses (if applicable), transfer agent fees, shareholder servicing expenses, custodial, legal, and audit fees, and the printing and postage expenses related to shareholder reports. Expense offsets (fees paid indirectly) are also shown. Credits earned from offset arrangements are used to reduce the fund’s expenses. This statement also shows net gains (losses) realized on the sale of investments and the increase or decrease in the unrealized appreciation (depreciation) on investments held during the period.
STATEMENT OF CHANGES IN NET ASSETS
The Statement of Changes in Net Assets shows how the fund’s total net assets changed during the two most recent reporting periods. Changes in the fund’s net assets are attributable to investment operations, distributions and capital share transactions.
The Operations section of the report summarizes information detailed in the Statement of Operations. The Distribution section shows the dividend and capital gain distributions made to shareholders. The amounts
www.calvert.com CALVERT VP VOLATILITY MANAGED MODERATE PORTFOLIO ANNUAL REPORT (UNAUDITED) 19
shown as distributions in this section may not match the net investment income and realized gains amounts shown in the Operations section because distributions are determined on a tax basis and certain investments or transactions may be treated differently for financial statement and tax purposes. The Capital Share Transactions section shows the amount shareholders invested in the fund, either by purchasing shares or by reinvesting distributions, and the amounts redeemed. The corresponding numbers of shares issued, reinvested and redeemed are shown at the end of the report.
FINANCIAL HIGHLIGHTS
The Financial Highlights table provides a per-share breakdown by class of the components that affect the fund’s net asset value for current and past reporting periods. The table provides total return, total distributions, expense ratios, portfolio turnover and net assets for the applicable period. Total return is a measure of a fund’s performance that encompasses all elements of return: dividends, capital gain distributions and changes in net asset value. Total return is the change in value of an investment over a given period, assuming reinvestment of any dividends and capital gain distributions, expressed as a percentage of the initial investment. Total distributions include distributions from net investment income and net realized gains. Long-term gains are earned on securities held in the fund more than one year. Short-term gains, on the sale of securities held less than one year, are treated as ordinary dividend income for tax purposes. The expense ratio is a fund’s cost of doing business, expressed as a percentage of net assets. These expenses directly reduce returns to shareholders. Portfolio turnover measures the trading activity in a fund’s investment portfolio – how often securities are bought and sold by a fund. Portfolio turnover is affected by market conditions, changes in the size of the fund, the nature of the fund’s investments and the investment style of the portfolio manager.
PROXY VOTING
The Proxy Voting Guidelines that the Portfolio uses to determine how to vote proxies relating to portfolio securities is provided as an Appendix to the Fund’s Statement of Additional Information. The Statement of Additional Information can be obtained free of charge by calling the Fund at 1-800-368-2745, by visiting the Calvert website at www.calvert.com or by visiting the SEC’s website at www.sec.gov.
Information regarding how the Fund voted proxies relating to portfolio securities during the most recent 12-month period ended June 30 is available by calling the Fund, by visiting the Calvert website at www. calvert.com or visiting the SEC’s website at www.sec.gov.
AVAILABILITY OF QUARTERLY PORTFOLIO HOLDINGS
The Fund files its complete schedule of portfolio holdings with the SEC for the first and third quarters of each fiscal year on Form N-Q. The Fund’s Form N-Q is available on the SEC’s website at www.sec.gov. The Fund’s Form N-Q may be reviewed and copied at the SEC’s Public Reference Room in Washington, DC; information on the operation of the Public Reference Room may be obtained by calling 1-800-SEC-0330.
This report is intended to provide fund information to shareholders. It is not authorized for distribution to prospective investors unless preceded or accompanied by a prospectus.
Note: The information on our website is not incorporated by reference into this report; our website address is included as an inactive textual reference only.
Investors should carefully consider the investment objectives, risks, charges and expenses of the Calvert Funds. This and other important information is contained in the fund’s summary prospectus and prospectus, which can be obtained from your financial professional and should be read carefully before investing. You may also call Calvert at 800/368-2745 or visit www. calvert.com.
20 www.calvert.com CALVERT VP VOLATILITY MANAGED MODERATE PORTFOLIO ANNUAL REPORT (UNAUDITED)
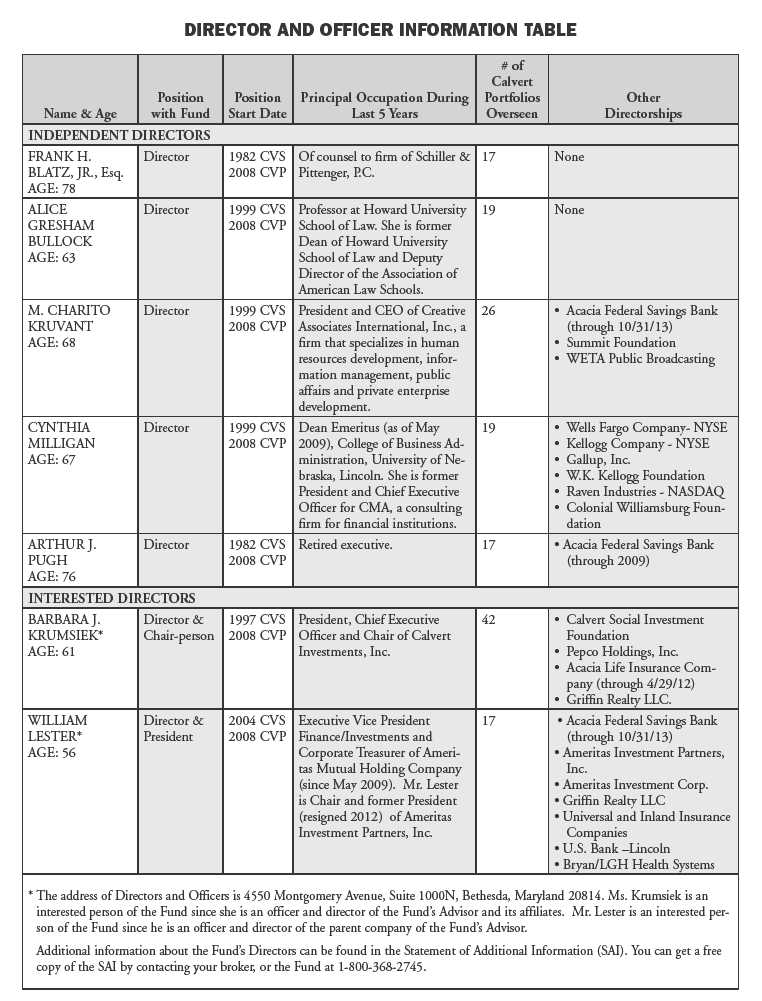
www.calvert.com CALVERT VP VOLATILITY MANAGED MODERATE PORTFOLIO ANNUAL REPORT (UNAUDITED) 21
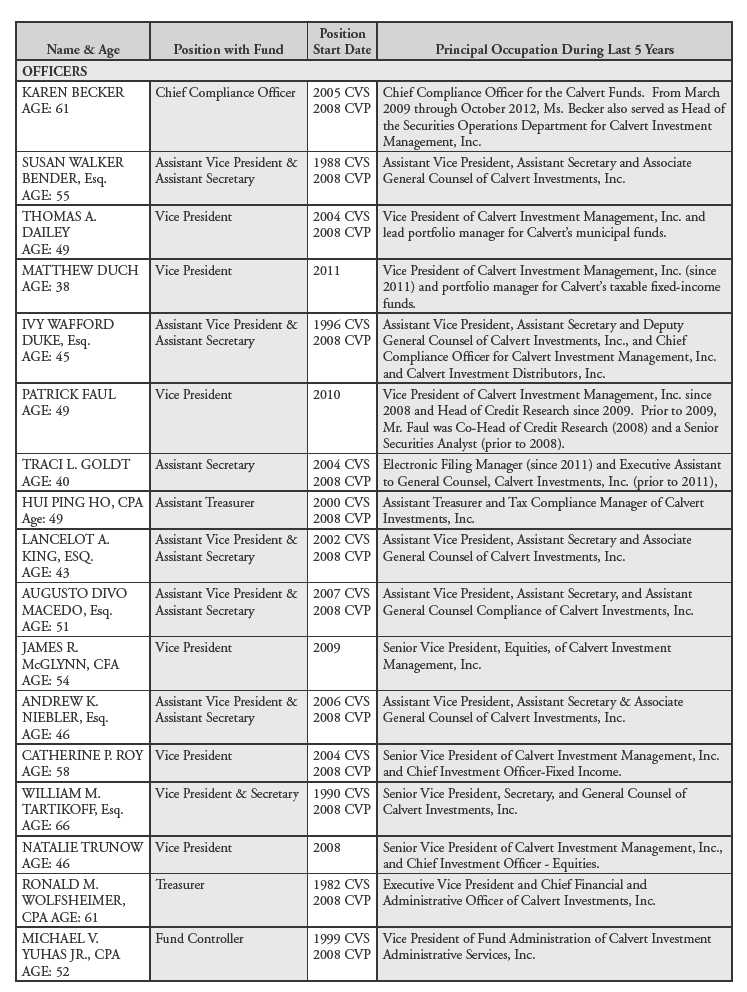
22 www.calvert.com CALVERT VP VOLATILITY MANAGED MODERATE PORTFOLIO ANNUAL REPORT (UNAUDITED)

CALVERT VP VOLATILITY MANAGED MODERATE GROWTH PORTFOLIO
Portfolio within Calvert Variable Products, Inc.
Managed by Calvert Investment Management, Inc.
INVESTMENT PERFORMANCE
From inception on April 30, 2013 through December 31, 2013, Calvert VP Volatility Managed Moderate Growth Portfolio returned 3.94%, underperforming the S&P 500 Daily Risk Control 10% Total Return Index, which returned 13.82%.
Calvert has developed a secondary composite benchmark based on a mix of market indices* that more closely reflect the asset allocation strategy than the single asset class benchmark listed above that is used to capture the impact of the volatility management strategy.
Calvert VP Volatility Managed Moderate Growth Portfolio also underperformed the blended composite benchmark return of 8.46%.
INVESTMENT CLIMATE
The equity markets finished 2013 on a strong note with many indices registering all-time highs despite mixed economic signals and concerns over the Fed’s “tapering” of long-term asset purchases and exit from quantitative easing. While much of the market commentary during the year focused on what was happening at the Federal Reserve, an important and sometimes overlooked driver of economic activity, and by extension Fed policy, was the improving health of the consumer balance sheet. As the overall economic recovery stabilized, improvements in the labor and housing markets, coupled with robust equity market performance, all contributed to further strengthen the consumer balance sheet.
As a result, U.S. consumer confidence and spending have recovered considerably from post-financial-crisis lows and are now contributing to GDP growth. Growing consumer confidence and reduced risk aversion also helped keep volatility subdued during the year as macro-risks faded from the forefront and investors shifted their attention to nascent signs of growth in the global economy.

| AVERAGE ANNUAL TOTAL RETURN |
| (period ended 12.31.13) |
| Since Inception (4/30/2013)** | 3.94% |
The performance data shown represents past performance, does not guarantee future results and assumes reinvestment of all dividends and distributions. All performance data reflects fee waivers and/or expense limitations, if any are in effect; in their absence performance would be lower. See Note B in Notes to Financial Statements. The investment return and principal value of an investment will fluctuate so that an investor’s shares, when redeemed, may be worth more or less than their original cost. Current performance may be lower or higher than the performance data quoted.
Visit www.calvert.com/institutional-VP-performance.html for current performance data. The gross expense ratio from the current prospectus for the Portfolio is 1.71% (includes Acquired Fund fees). This number may vary from the expense ratio shown elsewhere in this report because it is based on a different time period and, if applicable, does not include fee or expense waivers. The performance data and expense ratio reflect deduction of Portfolio operating expenses, but do not reflect charges and expenses imposed under the variable annuity or life insurance contract.
* The Volatility Managed Moderate Growth Composite Benchmark is an internally constructed index comprised of a blend of 47% Russell 3000 Index, 3% MSCI US REIT Index, 13% MSCI EAFE Index, 33% Barclays U.S. Aggregate Bond Index and 4% Barclays 3 Month T-Bill Bellwether Index.
** Total Return is not annualized for periods of less than one year.
4 www.calvert.com CALVERT VP VOLATILITY MANAGED MODERATE GROWTH PORTFOLIO ANNUAL REPORT
| | % OF TOTAL |
| ECONOMIC SECTORS | INVESTMENTS |
| |
| Exchange Traded Products | 96.3% |
| Short-Term Investments | 3.7% |
| Total | 100% |
Stocks were the top performing asset class for the year, led by U.S. equities with the Russell 3000 Index, representing the total U.S. equity market, returning 33.55% and outperforming international stocks as the MSCI EAFE Index returned 23.29%. Bonds produced a negative return for the first time in more than a decade as the Barclays U.S. Aggregate Bond Index returned -2.02%. Low inflation hit Treasury Inflation-Protected Securities particularly hard, with the Barclays U.S. TIPS Index declining 8.61%. The MSCI US REIT Index finished the year at 2.47%, despite the negative impact of tapering on mortgage rates during the second half of the year.
PORTFOLIO STRATEGY
The Portfolio seeks to stabilize portfolio volatility1 around a target level of 10% while pursuing current income and growth potential. To achieve this objective, the Portfolio invests in a group of exchange traded funds (ETFs) diversified across multiple asset classes and uses a derivative-based risk management strategy, primarily using futures contracts on various market indices. In an effort to manage long-term volatility, the target asset allocation model is designed to reflect the specified target level of risk. Meanwhile, the risk management strategy is employed to mitigate short-term fluctuations in volatility and realize a long-term risk level over a shorter time frame. The risk management strategy combines two components—volatility management and a capital protection strategy—that work together in an effort to reduce the negative effects of high portfolio volatility while seeking to participate in growth during up markets and defend against significant losses during major market downturns.
The historic relationship between rising equity markets and periods of low volatility was on display in 2013 as equity markets rallied throughout the year while the level of equity market risk declined to unusually low levels. Therefore, the risk management strategy sought to increase our equity exposure to achieve the desired 10% level of volatility. However, it could not achieve this due to risk controls limiting the Portfolio’s maximum equity exposure. Given the strong performance of U.S. equities, the Portfolio’s lower level of equity market exposure relative to the Index, which does not limit the equity exposure level, was a major contributor to the Portfolio’s underperformance for the period. Holdings of REITS and TIPS also contributed to the Portfolio’s underperformance relative to both the Index and composite benchmark.
OUTLOOK
We expect the U.S. economic recovery to continue to gain strength into 2014 and to provide a firm foundation for continued improvements in growth and employment, even in the face of the Federal Reserve’s tapering activities. It is important to remember that the Fed’s taper is merely an inflection point in its provision of extraordinary post-crisis support. The Fed still provides levels of support far above and beyond historical norms; it merely has switched from expanding to reducing that level gradually over time. Moreover, should the withdrawal of Fed support unexpectedly push the economy back into recession, there is no reason to think the Fed would not slow or even reverse its decisions, unless inflation becomes a serious problem.
A bigger question is whether equity valuations already reflect current growth expectations, or whether there is room for continued price/earnings multiple expansion in 2014. Returns of near 30% in 2013 already include a substantial component of multiple expansion, and so it is possible that financial markets may need to rest a bit in order to digest that expansion before moving any higher. However, we do think that improvements in the consumer balance sheet and employment, in combination with likely continued headwinds in fixed income, mean that more people will be ready to put investment money to work, and especially into equities. In this environment, it seems reasonable to expect continued multiple expansion in 2014, even if at a slower rate than was observed in 2013.
www.calvert.com CALVERT VP VOLATILITY MANAGED MODERATE GROWTH PORTFOLIO ANNUAL REPORT 5
In a market environment characterized by dominant performance from a single asset class, in this case U.S. stocks, returns from a diversified asset allocation strategy will inevitably trail. However, over a longer time horizon time, the benefits from diversification should produce better risk-adjusted returns than can be had from investing in any single asset class.
January 2014
1 Volatility refers to the annualized standard deviation of daily logarithmic portfolio returns.
6 www.calvert.com CALVERT VP VOLATILITY MANAGED MODERATE GROWTH PORTFOLIO ANNUAL REPORT
SHAREHOLDER EXPENSE EXAMPLE
As a shareholder of the Fund, you incur two types of costs: (1) transaction costs, and (2) ongoing costs, including management fees and other Fund expenses. This Example is intended to help you understand your ongoing costs (in dollars) of investing in the Fund and to compare these costs with the ongoing costs of investing in other mutual funds.
This Example is based on an investment of $1,000 invested at the beginning of the period and held for the entire period (July 1, 2013 to December 31, 2013).
Note: Expenses do not reflect charges and expenses of the variable annuity or variable universal life contract.
Actual Expenses
The first line of the table below provides information about actual account values and actual expenses. You may use the information in this line, together with the amount you invested, to estimate the expenses that you paid over the period. Simply divide your account value by $1,000 (for example, an $8,600 account value divided by $1,000 = 8.6), then multiply the result by the number in the first line under the heading entitled “Expenses Paid During Period” to estimate the expenses you paid on your account during this period.
Hypothetical Example for Comparison Purposes
The second line of the table below provides information about hypothetical account values and hypothetical expenses based on the Fund’s actual expense ratio and an assumed rate of return of 5% per year before expenses, which is not the Fund’s actual return. The hypothetical account values and expenses may not be used to estimate the actual ending account balance or expenses you paid for the period. You may use this information to compare the ongoing costs of investing in the Fund and other funds. To do so, compare the 5% hypothetical example with the 5% hypothetical examples that appear in the shareholder reports of the other funds.
Please note that the expenses shown in the table are meant to highlight your ongoing costs only and do not reflect any transactional costs. Therefore, the second line of the table is useful in comparing ongoing costs only, and will not help you determine the relative total costs of owning different funds. In addition, if these transactional costs were included, your costs would have been higher.
| | BEGINNING | ENDING | EXPENSES PAID |
| | ACCOUNT
VALUE | ACCOUNT
VALUE | DURING
PERIOD* |
| | 7/1/13 | 12/31/13 | 7/1/13 - 12/31/13 |
| |
| Actual | $1,000.00 | $1,077.44 | $4.35 |
| |
Hypothetical
(5% return per year before expenses) | $1,000.00 | $1,021.02 | $4.23 |
* Expenses are equal to the Fund’s annualized expense ratio of 0.83%, multiplied by the average account value over the period, multiplied by 184/365 (to reflect the one-half year period). The fees and expenses of the Underlying Funds in which the Portfolio invests are not included in the annualized expense ratios.
www.calvert.com CALVERT VP VOLATILITY MANAGED MODERATE GROWTH PORTFOLIO ANNUAL REPORT 7
REPORT OF INDEPENDENT REGISTERED PUBLIC ACCOUNTING FIRM
The Board of Directors of Calvert Variable Products, Inc. and Shareholders of Calvert VP Volatility Managed Moderate Growth Portfolio: We have audited the accompanying statement of net assets of the Calvert VP Volatility Managed Moderate Growth Portfolio (the “Portfolio”), a series of Calvert Variable Products, Inc., as of December 31, 2013, and the related statement of operations, the statement of changes in net assets, and the financial highlights for the period from Inception April 30, 2013, through December 31, 2013. These financial statements and financial highlights are the responsibility of the Portfolio’s management. Our responsibility is to express an opinion on these financial statements and financial highlights based on our audit.
We conducted our audit in accordance with the standards of the Public Company Accounting Oversight Board (United States). Those standards require that we plan and perform the audit to obtain reasonable assurance about whether the financial statements and financial highlights are free of material misstatement. An audit includes examining, on a test basis, evidence supporting the amounts and disclosures in the financial statements. Our procedures included confirmation of securities owned as of December 31, 2013, by correspondence with the custodian and brokers or by performing other appropriate auditing procedures. An audit also includes assessing the accounting principles used and significant estimates made by management, as well as evaluating the overall financial statement presentation. We believe that our audit provides a reasonable basis for our opinion.
In our opinion, the financial statements and financial highlights referred to above present fairly, in all material respects, the financial position of the Calvert VP Volatility Managed Moderate Growth Portfolio as of December 31, 2013, the results of its operations, the changes in its net assets, and the financial highlights for the period from Inception April 30, 2013, through December 31, 2013, in conformity with U.S. generally accepted accounting principles.

Philadelphia, Pennsylvania
February 24, 2014
8 www.calvert.com CALVERT VP VOLATILITY MANAGED MODERATE GROWTH PORTFOLIO ANNUAL REPORT
| | |
| STATEMENT OF NET ASSETS |
| DECEMBER 31, 2013 |
| |
| EXCHANGE TRADED PRODUCTS - 95.4% | SHARES | VALUE |
| iShares Core S&P Mid-Cap ETF | 6,300 | $843,192 |
| iShares Core Total US Bond Market ETF | 25,300 | 2,692,679 |
| iShares North American Natural Resources ETF | 6,000 | 260,340 |
| iShares Russell 2000 ETF | 2,500 | 288,275 |
| iShares S&P 500 Growth ETF | 7,100 | 700,983 |
| iShares S&P 500 Value ETF | 9,900 | 846,054 |
| iShares S&P Mid-Cap 400 Growth ETF | 900 | 135,315 |
| iShares S&P Mid-Cap 400 Value ETF | 1,100 | 127,853 |
| iShares TIPS Bond ETF | 9,700 | 1,066,030 |
| Powershares QQQ Trust, Series 1 | 4,800 | 422,208 |
| SPDR Barclays High Yield Bond ETF | 16,600 | 673,296 |
| Vanguard FTSE Developed Markets ETF | 35,900 | 1,496,312 |
| Vanguard REIT ETF | 20,200 | 1,304,112 |
| Vanguard S&P 500 ETF | 9,500 | 1,606,925 |
| Vanguard Total International Stock ETF | 10,700 | 560,466 |
| |
| Total Exchange Traded Products (Cost $12,578,628) | | 13,024,040 |
| |
| | PRINCIPAL | |
| TIME DEPOSIT - 3.7% | AMOUNT | |
| State Street Bank Time Deposit, 0.083%, 1/2/14 | $506,126 | 506,126 |
| |
| Total Time Deposit (Cost $506,126) | | 506,126 |
| |
| TOTAL INVESTMENTS (Cost $13,084,754) - 99.1% | | 13,530,166 |
| Other assets and liabilities, net - 0.9% | | 128,786 |
| NET ASSETS - 100% | | $13,658,952 |
| |
| NET ASSETS CONSISTS OF: | | |
| Paid-in capital applicable to 882,727 shares of common stock outstanding; | | |
| $0.10 par value, 100,000,000 shares authorized | | $13,195,078 |
| Accumulated net realized gain (loss) | | (13,701) |
| Net unrealized appreciation (depreciation) | | 477,575 |
| |
| NET ASSETS | | $13,658,952 |
| |
| NET ASSET VALUE PER SHARE | | $15.47 |
| | | | UNDERLYING | UNREALIZED |
| | NUMBER OF | EXPIRATION | FACE AMOUNT | APPRECIATION |
| FUTURES | CONTRACTS | DATE | AT VALUE | (DEPRECIATION) |
| Purchased: | | | | |
| MSCI EAFE Mini Index | 2 | 3/14 | $191,780 | $10,456 |
| E-Mini S&P 500 Index | 6 | 3/14 | 552,330 | 21,707 |
| Total Purchased | | | | $32,163 |
Abbreviations:ETF: Exchange Traded FundREIT: Real Estate Investment TrustSee notes to financial statements.
www.calvert.com CALVERT VP VOLATILITY MANAGED MODERATE GROWTH PORTFOLIO ANNUAL REPORT 9
| |
| STATEMENT OF OPERATIONS | |
| FROM INCEPTION APRIL 30, 2013 | |
| THROUGH DECEMBER 31, 2013 | |
| |
| NET INVESTMENT INCOME | |
| Investment Income: | |
| Dividend income | $146,882 |
| Interest income | 307 |
| Total investment income | 147,189 |
| |
| Expenses: | |
| Investment advisory fee | 21,396 |
| Transfer agency fees and expenses | 990 |
| Accounting fees | 764 |
| Directors’ fees and expenses | 1,019 |
| Administrative fees | 5,094 |
| Distribution Plan expenses | 12,736 |
| Custodian fees | 9,288 |
| Reports to shareholders | 4,585 |
| Professional fees | 16,085 |
| Total expenses | 71,957 |
| Reimbursement from Advisor | (29,671) |
| Net expenses | 42,286 |
| |
| |
| NET INVESTMENT INCOME | 104,903 |
| |
| |
| REALIZED AND UNREALIZED GAIN (LOSS) | |
| Net realized gain (loss) on: | |
| Investments | 13,895 |
| Futures | (27,602) |
| | (13,707) |
| |
| Change in unrealized appreciation (depreciation) on: | |
| Investments | 445,412 |
| Futures | 32,163 |
| | 477,575 |
| |
| |
| |
| NET REALIZED AND UNREALIZED GAIN (LOSS) | 463,868 |
| |
| INCREASE (DECREASE) IN NET ASSETS | |
| RESULTING FROM OPERATIONS | $568,771 |
See notes to financial statements.
10 www.calvert.com CALVERT VP VOLATILITY MANAGED MODERATE GROWTH PORTFOLIO ANNUAL REPORT
| |
| STATEMENT OF CHANGES IN NET ASSETS |
| |
| | FROM INCEPTION |
| | APRIL 30, 2013 |
| | THROUGH |
| | DECEMBER 31, |
| INCREASE (DECREASE) IN NET ASSETS | 2013 |
| Operations: | |
| Net investment income | $104,903 |
| Net realized gain (loss) | (13,707) |
| Change in unrealized appreciation (depreciation) | 477,575 |
| |
| |
| INCREASE (DECREASE) IN NET ASSETS | |
| RESULTING FROM OPERATIONS | 568,771 |
| |
| |
| Distributions to shareholders from: | |
| Net investment income | (104,897) |
| Total distributions | (104,897) |
| |
| |
| Capital share transactions: | |
| Shares sold | 14,201,358 |
| Reinvestment of distributions | 88,850 |
| Shares redeemed | (1,095,130) |
| Total capital share transactions | 13,195,078 |
| |
| |
| |
| TOTAL INCREASE (DECREASE) IN NET ASSETS | 13,658,952 |
| |
| NET ASSETS | |
| Beginning of period | — |
| End of period | $13,658,952 |
| |
| |
| CAPITAL SHARE ACTIVITY | |
| Shares sold | 948,961 |
| Reinvestment of distributions | 5,751 |
| Shares redeemed | (71,985) |
| Total capital share activity | 882,727 |
See notes to financial statements.
www.calvert.com CALVERT VP VOLATILITY MANAGED MODERATE GROWTH PORTFOLIO ANNUAL REPORT 11
NOTES TO FINANCIAL STATEMENTS
NOTE A –- SIGNIFICANT ACCOUNTING POLICIES
General: Calvert VP Volatility Managed Moderate Growth Portfolio (the “Portfolio”), a series of Calvert Variable Products, Inc. (the “Fund”), is registered under the Investment Company Act of 1940 as a diversified, open-end management investment company. The Fund is comprised of twelve separate portfolios. The operations of each series of the Fund are accounted for separately. The Portfolio began operations on April 30, 2013 and offers Class F shares, which are subject to Distribution Plan expenses. Shares of the Portfolio are sold without sales charge to affiliated and unaffiliated insurance companies for allocation to certain of their variable separate accounts. The Portfolio invests primarily in exchange traded funds representing a broad range of asset classes (the “Underlying Funds”) and derivatives to manage overall portfolio volatility.
Security Valuation: Net asset value per share is determined every business day as of the close of the regular session of the New York Stock Exchange (generally 4:00 p.m. Eastern time). The Portfolio uses independent pricing services approved by the Board of Directors (“the Board”) to value its investments wherever possible. Investments for which market quotations are not available or deemed not reliable are fair valued in good faith under the direction of the Board.
The Board has adopted Valuation Procedures (the “Procedures”) to determine the fair value of securities and other financial instruments for which market prices are not readily available or which may not be reliably priced. The Board has delegated the day-to-day responsibility for determining the fair value of assets of the Portfolio to Calvert Investment Management, Inc. (the “Advisor” or “Calvert”) and has provided these Procedures to govern Calvert in its valuation duties.
Calvert has chartered an internal Valuation Committee to oversee the implementation of these Procedures and to assist it in carrying out the valuation responsibilities that the Board has delegated.
The Valuation Committee meets on a regular basis to review illiquid securities and other investments which may not have readily available market prices. The Valuation Committee’s fair valuation determinations are subject to review, approval and ratification by the Board at its next regularly scheduled meeting covering the calendar quarter in which the fair valuation was determined.
The Valuation Committee utilizes various methods to measure the fair value of the Portfolio’s investments. Generally Accepted Accounting Principles (GAAP) establishes a disclosure hierarchy that categorizes the inputs to valuation techniques used to value assets and liabilities at measurement date. These inputs are summarized in the three broad levels listed below:
Level 1 – quoted prices in active markets for identical securities
Level 2 – other significant observable inputs (including quoted prices for similar securities, interest rates, prepayment speeds, credit risk, etc.)
Level 3 – significant unobservable inputs (including the Portfolio’s own assumptions in determining the fair value of investments) The inputs or methodologies used for valuing securities are not necessarily an indication of the risk associated with investing in those securities.
Changes in valuation techniques may result in transfers in or out of an investment’s assigned level within the hierarchy during the period. There were no such transfers during the period. Valuation techniques used to value the Portfolio’s investments by major category are as follows: Exchange traded products are valued at the official closing price as reported by an independent pricing service on the primary market or exchange on which they are traded and are categorized as Level 1 in the hierarchy.
12 www.calvert.com CALVERT VP VOLATILITY MANAGED MODERATE GROWTH PORTFOLIO ANNUAL REPORT
Short-term securities of sufficient credit quality with remaining maturities of sixty days or less for which quotations are not readily available are valued at amortized cost, which approximates fair value, and are categorized as Level 2 in the hierarchy.
If a market value cannot be determined for a security using the methodologies described above, or if, in the good faith opinion of the Advisor, the market value does not constitute a readily available market quotation, or if a significant event has occurred that would materially affect the value of the security, the security will be fair valued as determined in good faith by the Valuation Committee.
The Valuation Committee considers a number of factors, including significant unobservable valuation inputs when arriving at fair value. It considers all significant facts that are reasonably available and relevant to the determination of fair value.
The Valuation Committee primarily employs a market-based approach which may use related or comparable assets or liabilities, recent transactions, market multiples, book values, and other relevant information for the investment to determine the fair value of the investment. When more appropriate, the fund may employ an income-based or cost approach. An income-based valuation approach discounts anticipated future cash flows of the investment to calculate a present amount (discounted). The measurement is based on the value indicated by current market expectations about those future amounts. Discounts may also be applied due to the nature or duration of any restrictions on the disposition of the investments. A cost based approach is based on the amount that currently would be required to replace the service capacity of an asset (current replacement cost). From the seller’s perspective, the price that would be received for the asset is determined based on the cost to a buyer to acquire or construct a substitute asset of comparable utility, adjusted for obsolescence.
The values assigned to fair value investments are based on available information and do not necessarily represent amounts that might ultimately be realized. Further, due to the inherent uncertainty of valuations of such investments, the fair values may differ significantly from the values that would have been used had an active market existed, and the differences could be material. The Valuation Committee employs various methods for calibrating these valuation approaches including a regular review of key inputs and assumptions, transactional back-testing or disposition analysis and reviews of any related market activity.
At December 31, 2013, no securities were fair valued in good faith under the direction of the Board.
The following is a summary of the inputs used to value the Portfolio’s net assets as of December 31, 2013:
| | | VALUATION INPUTS | |
| INVESTMENTS IN SECURITIES* | LEVEL 1 | LEVEL 2 | LEVEL 3 | TOTAL |
| Exchange traded products | $13,024,040 | — | — | $13,024,040 |
| Other debt obligations | — | $506,126 | — | 506,126 |
| TOTAL | $13,024,040 | $506,126 | — | $13,530,166 |
| Other financial instruments** | $32,163 | — | — | $32,163 |
* For a complete listing of investments, please refer to the Statement of Net Assets.
** Other financial instruments are derivative instruments not reflected in the Total Investments in the Statement of Net Assets, such as futures, which are valued at the unrealized appreciation/depreciation on the instrument.
Futures Contracts: The Portfolio may purchase and sell futures contracts to manage overall portfolio volatility. These futures contracts may include, but are not limited to, market index futures contracts and futures contracts based on U.S. government obligations. The Portfolio may enter into futures contracts agreeing to buy or sell a financial instrument for a set price at a future date. Initial margin deposits of either cash or securities as required by the broker are made upon entering into the contract. While the contract is open, daily variation margin pay-
www.calvert.com CALVERT VP VOLATILITY MANAGED MODERATE GROWTH PORTFOLIO ANNUAL REPORT 13
ments are made to or received from the broker reflecting the daily change in market value of the contract and are recorded for financial reporting purposes as unrealized gains or losses by the Portfolio. When a futures contract is closed, a realized gain or loss is recorded equal to the difference between the opening and closing value of the contract. The risks associated with entering into futures contracts may include the possible illiquidity of the secondary market which would limit the Portfolio’s ability to close out a futures contract prior to the settlement date, an imperfect correlation between the value of the contracts and the underlying financial instruments, or that the counterparty will fail to perform its obligations under the contracts’ terms. Futures contracts are designed by boards of trade which are designated “contracts markets” by the Commodities Futures Trading Commission. Futures contracts trade on the contracts markets in a manner that is similar to the way a stock trades on a stock exchange and the boards of trade, through their clearing corporations, guarantee the futures contracts against default. As a result, there is minimal counterparty credit risk to the Portfolio. During the period, futures contracts were used to adjust the Portfolio’s overall equity exposure in an effort to stabilize portfolio volatility around a target level. The Portfolio’s futures contracts at period end are presented in the Statement of Net Assets.
During the period from the inception of the Portfolio through December 31, 2013, the Portfolio invested in E-Mini S&P 500 and MSCI EAFE Mini Index futures. The volume of outstanding contracts has varied throughout the period with a weighted average of 10 contracts and $460,253 weighted average notional value.
Security Transactions and Investment Income: Security transactions, normally related to shares of the Underlying Funds, are accounted for on trade date. Realized gains and losses are recorded on an identified cost basis. Income and capital gain distributions from the Underlying Funds, if any, are recorded on the ex-dividend date. Distributions received on securities that represent a return of capital or capital gain are recorded as a reduction of cost of investments and/or as a realized gain. Interest income, which includes amortization of premium and accretion of discount on debt securities, is accrued as earned. Expenses included in the accompanying financial statements reflect the expenses of the Portfolio and do not include any expenses associated with the Underlying Funds.
Distributions to Shareholders: Distributions to shareholders are recorded by the Portfolio on ex-dividend date. Dividends from net investment income and distributions from net realized capital gains, if any, are paid at least annually. Distributions are determined in accordance with income tax regulations which may differ from generally accepted accounting principles; accordingly, periodic reclassifications are made within the Portfolio’s capital accounts to reflect income and gains available for distribution under income tax regulations.
Estimates: The preparation of financial statements in conformity with accounting principles generally accepted in the United States requires management to make estimates and assumptions that affect the reported amounts of assets and liabilities and disclosure of contingent assets and liabilities at the date of the financial statements and the reported amounts of income and expenses during the reporting period. Actual results could differ from those estimates.
Federal Income Taxes: No provision for federal income or excise tax is required since the Portfolio intends to continue to qualify as a regulated investment company under the Internal Revenue Code and to distribute substantially all of its taxable earnings.
Management has analyzed the Portfolio’s tax positions taken for all open federal income tax years and has concluded that no provision for federal income tax is required in the Portfolio’s financial statements. A Portfolio’s federal tax return is subject to examination by the Internal Revenue Service for a period of three years.
NOTE B — RELATED PARTY TRANSACTIONS
Calvert Investment Management, Inc. (the “Advisor”) is wholly-owned by Calvert Investments, Inc., which is indirectly wholly-owned by Ameritas Mutual Holding Company. The Advisor provides investment advisory services and pays the salaries and fees of officers and Directors of the Fund who are employees of the Advisor or its affiliates. For its services, the Advisor receives an annual fee, payable monthly, of .42% of the Portfolio’s
14 www.calvert.com CALVERT VP VOLATILITY MANAGED MODERATE GROWTH PORTFOLIO ANNUAL REPORT
average daily net assets. Under the terms of the agreement, $4,686 was payable at period end. In addition, $656 was payable at period end for operating expenses paid by the Advisor during December 2013.
The Advisor has contractually agreed to limit net annual portfolio operating expenses through April 30, 2014. The contractual expense cap is .83%. For the purpose of this expense limit, operating expenses do not include interest expense, brokerage commissions, taxes and extraordinary expenses. This expense limitation does not limit fees and expenses associated with the Underlying Funds. Under the terms of the agreement, $21,142 was receivable at period end.
Calvert Investment Administrative Services, Inc., an affiliate of the Advisor, provides administrative services to the Portfolio for an annual fee, payable monthly, of .10% of the average daily net assets of the Portfolio. Under the terms of the agreement, $1,116 was payable at period end.
Calvert Investment Distributors, Inc. (“CID”), an affiliate of the Advisor, is the distributor and principal underwriter for the Portfolio. Pursuant to Rule 12b-1 under the Investment Company Act of 1940, the Portfolio has adopted a Distribution Plan that permits the Portfolio to pay certain expenses associated with the distribution and servicing of its shares. The expenses paid may not exceed 0.25% annually of the average daily net assets of Class F. Under the terms of the agreement, $2,789 was payable at period end.
Calvert Investment Services, Inc. (“CIS”), an affiliate of the Advisor, acts as shareholder servicing agent for the Portfolio. For its services, CIS received a fee of $408 for the period from the inception of the Portfolio through December 31, 2013. Under the terms of the agreement, $48 was payable at period end. Boston Financial Data Services, Inc. is the transfer and dividend disbursing agent.
Each Director of the Fund who is not an employee of the Advisor or its affiliates receives a fee of $1,500 for each Board and Committee meeting attended plus an annual fee of $40,000. Committee chairs receive an additional $5,000 annual retainer. Directors’ fees are allocated to each of the portfolios served.
NOTE C — INVESTMENT ACTIVITY AND TAX INFORMATION
During the period from the inception of the Portfolio through December 31, 2013, the cost of purchases and proceeds from sales of investments, other than short-term securities, were $12,989,492 and $424,760, respectively.
The tax character of dividends and distributions paid during the period ended December 31, 2013 was as follows:
| Distributions paid from: | 2013 |
| Ordinary income | $104,897 |
| Total | $104,897 |
As of December 31, 2013, the tax basis components of distributable earnings/(accumulated losses) and the federal tax cost were as follows:
| Unrealized appreciation | $602,493 |
| Unrealized (depreciation) | (167,870) |
| Net unrealized appreciation/(depreciation) | $434,623 |
| Undistributed ordinary income | $26,245 |
| Undistributed long-term capital gain | $3,006 |
| |
| Federal income tax cost of investments | $13,095,543 |
www.calvert.com CALVERT VP VOLATILITY MANAGED MODERATE GROWTH PORTFOLIO ANNUAL REPORT 15
The differences between the components of distributable earnings on a tax basis and the amounts reflected in the statement of net assets are primarily due to temporary book-tax differences that will reverse in a subsequent period. These differences are due to wash sales and Section 1256 contracts.
NOTE D — LINE OF CREDIT
A financing agreement is in place with the Calvert Funds and State Street Corporation (“SSC”). Under the agreement, SSC provides an unsecured line of credit facility, in the aggregate amount of $50 million ($25 million committed and $25 million uncommitted), accessible by the Funds for temporary or emergency purposes only. Borrowings under the committed facility bear interest at the higher of the London Interbank Offered Rate (LIBOR) or the overnight Federal Funds Rate plus 1.25% per annum. A commitment fee of .11% per annum is incurred on the unused portion of the committed facility, which is allocated to all participating funds. The Portfolio had no borrowings under the agreement during the period ended December 31, 2013.
NOTE E — SUBSEQUENT EVENTS
In preparing the financial statements as of December 31, 2013, no subsequent events or transactions occurred that would have required recognition or disclosure in these financial statements.

16 www.calvert.com CALVERT VP VOLATILITY MANAGED MODERATE GROWTH PORTFOLIO ANNUAL REPORT
| |
| FINANCIAL HIGHLIGHTS |
| |
| | PERIOD ENDED |
| | DECEMBER 31, |
| | 2013#(z) |
| Net asset value, beginning | $15.00 |
| Income from investment operations: | |
| Net investment income | .20 |
| Net realized and unrealized gain (loss) | .39 |
| Total from investment operations | .59 |
| Distributions from: | |
| Net investment income | (.12) |
| Total distributions | (.12) |
| Total increase (decrease) in net asset value | .47 |
| Net asset value, ending | $15.47 |
| |
| Total return* | 3.94% |
| Ratios to average net assets:A, B | |
| Net investment income | 2.06% (a) |
| Total expenses | 1.41% (a) |
| Expenses before offsets | .83% (a) |
| Net expenses | .83% (a) |
| Portfolio turnover | 6% |
| Net assets, ending (in thousands) | $13,659 |
A Total expenses do not reflect amounts reimbursed and/or waived by the Advisor or reductions from expense offset arrangments. Expenses before offsets reflect expenses after reimbursement and/or waiver by the Advisor but prior to reductions from expense offset arrangements. Net expenses are net of all reductions and represent the net expenses paid by the portfolio.
B Amounts do not include the activity of the Underlying Funds.
(a)Annualized.
(z) Per share figures are calculated using the Average Shares Method.
# From April 30, 2013 inception.
* Total return is not annualized for periods of less than one year and does not reflect charges and expenses of the variable annuity or variable universal life contract.
See notes to financial statements.
www.calvert.com CALVERT VP VOLATILITY MANAGED MODERATE GROWTH PORTFOLIO ANNUAL REPORT 17
EXPLANATION OF FINANCIAL TABLES
SCHEDULE OF INVESTMENTS
The Schedule of Investments is a snapshot of all securities held in the fund at their market value, on the last day of the reporting period. Securities are listed by asset type (e.g., common stock, corporate bonds, U.S. government obligations) and may be further broken down into sub-groups and by industry classification.
STATEMENT OF ASSETS AND LIABILITIES
The Statement of Assets and Liabilities is often referred to as the fund’s balance sheet. It lists the value of what the fund owns, is due and owes on the last day of the reporting period. The fund’s assets include the market value of securities owned, cash, receivables for securities sold and shareholder subscriptions, and receivables for dividends and interest payments that have been earned, but not yet received. The fund’s liabilities typically include payables for securities purchased and shareholder redemptions, and expenses owed but not yet paid. The statement also reports the fund’s net asset value (NAV) per share on the last day of the reporting period. The NAV is calculated by dividing the fund’s net assets (assets minus liabilities) by the number of shares outstanding. This statement is accompanied by a Schedule of Investments. Alternatively, if certain conditions are met, a Statement of Net Assets may be presented in lieu of this statement and the Schedule of Investments.
STATEMENT OF NET ASSETS
The Statement of Net Assets provides a detailed list of the fund’s holdings, including each security’s market value on the last day of the reporting period. The Statement of Net Assets includes a Schedule of Investments. Other assets are added and other liabilities subtracted from the investments total to calculate the fund’s net assets. Finally, net assets are divided by the outstanding shares of the fund to arrive at its share price, or Net Asset Value (NAV) per share.
At the end of the Statement of Net Assets is a table displaying the composition of the fund’s net assets. Paid in Capital is the money invested by shareholders and represents the bulk of net assets. Undistributed Net Investment Income and Accumulated Net Realized Gains usually approximate the amounts the fund had available to distribute to shareholders as of the statement date. Accumulated Realized Losses will appear as negative balances. Unrealized Appreciation (Depreciation) is the difference between the market value of the fund’s investments and their cost, and reflects the gains (losses) that would be realized if the fund were to sell all of its investments at their statement-date values.
STATEMENT OF OPERATIONS
The Statement of Operations summarizes the fund’s investment income earned and expenses incurred in operating the fund. Investment income includes dividends earned from stocks and interest earned from interest-bearing securities in the fund. Expenses incurred in operating the fund include the advisory fee paid to the investment advisor, administrative services fees, distribution plan expenses (if applicable), transfer agent fees, shareholder servicing expenses, custodial, legal, and audit fees, and the printing and postage expenses related to shareholder reports. Expense offsets (fees paid indirectly) are also shown. Credits earned from offset arrangements are used to reduce the fund’s expenses. This statement also shows net gains (losses) realized on the sale of investments and the increase or decrease in the unrealized appreciation (depreciation) on investments held during the period.
STATEMENT OF CHANGES IN NET ASSETS
The Statement of Changes in Net Assets shows how the fund’s total net assets changed during the two most recent reporting periods. Changes in the fund’s net assets are attributable to investment operations, distributions and capital share transactions.
The Operations section of the report summarizes information detailed in the Statement of Operations. The Distribution section shows the dividend and capital gain distributions made to shareholders. The amounts
18 www.calvert.com CALVERT VP VOLATILITY MANAGED MODERATE GROWTH PORTFOLIO ANNUAL REPORT (UNAUDITED)
shown as distributions in this section may not match the net investment income and realized gains amounts shown in the Operations section because distributions are determined on a tax basis and certain investments or transactions may be treated differently for financial statement and tax purposes. The Capital Share Transactions section shows the amount shareholders invested in the fund, either by purchasing shares or by reinvesting distributions, and the amounts redeemed. The corresponding numbers of shares issued, reinvested and redeemed are shown at the end of the report.
FINANCIAL HIGHLIGHTS
The Financial Highlights table provides a per-share breakdown by class of the components that affect the fund’s net asset value for current and past reporting periods. The table provides total return, total distributions, expense ratios, portfolio turnover and net assets for the applicable period. Total return is a measure of a fund’s performance that encompasses all elements of return: dividends, capital gain distributions and changes in net asset value. Total return is the change in value of an investment over a given period, assuming reinvestment of any dividends and capital gain distributions, expressed as a percentage of the initial investment. Total distributions include distributions from net investment income and net realized gains. Long-term gains are earned on securities held in the fund more than one year. Short-term gains, on the sale of securities held less than one year, are treated as ordinary dividend income for tax purposes. The expense ratio is a fund’s cost of doing business, expressed as a percentage of net assets. These expenses directly reduce returns to shareholders. Portfolio turnover measures the trading activity in a fund’s investment portfolio – how often securities are bought and sold by a fund. Portfolio turnover is affected by market conditions, changes in the size of the fund, the nature of the fund’s investments and the investment style of the portfolio manager.
PROXY VOTING
The Proxy Voting Guidelines that the Portfolio uses to determine how to vote proxies relating to portfolio securities is provided as an Appendix to the Fund’s Statement of Additional Information. The Statement of Additional Information can be obtained free of charge by calling the Fund at 1-800-368-2745, by visiting the Calvert website at www.calvert.com or by visiting the SEC’s website at www.sec.gov.
Information regarding how the Fund voted proxies relating to portfolio securities during the most recent 12-month period ended June 30 is available by calling the Fund, by visiting the Calvert website at www. calvert.com or visiting the SEC’s website at www.sec.gov.
AVAILABILITY OF QUARTERLY PORTFOLIO HOLDINGS
The Fund files its complete schedule of portfolio holdings with the SEC for the first and third quarters of each fiscal year on Form N-Q. The Fund’s Form N-Q is available on the SEC’s website at www.sec.gov. The Fund’s Form N-Q may be reviewed and copied at the SEC’s Public Reference Room in Washington, DC; information on the operation of the Public Reference Room may be obtained by calling 1-800-SEC-0330.
This report is intended to provide fund information to shareholders. It is not authorized for distribution to prospective investors unless preceded or accompanied by a prospectus.
Note: The information on our website is not incorporated by reference into this report; our website address is included as an inactive textual reference only.
Investors should carefully consider the investment objectives, risks, charges and expenses of the Calvert Funds. This and other important information is contained in the fund’s summary prospectus and prospectus, which can be obtained from your financial professional and should be read carefully before investing. You may also call Calvert at 800/368-2745 or visit www. calvert.com.
www.calvert.com CALVERT VP VOLATILITY MANAGED MODERATE GROWTH PORTFOLIO ANNUAL REPORT (UNAUDITED) 19
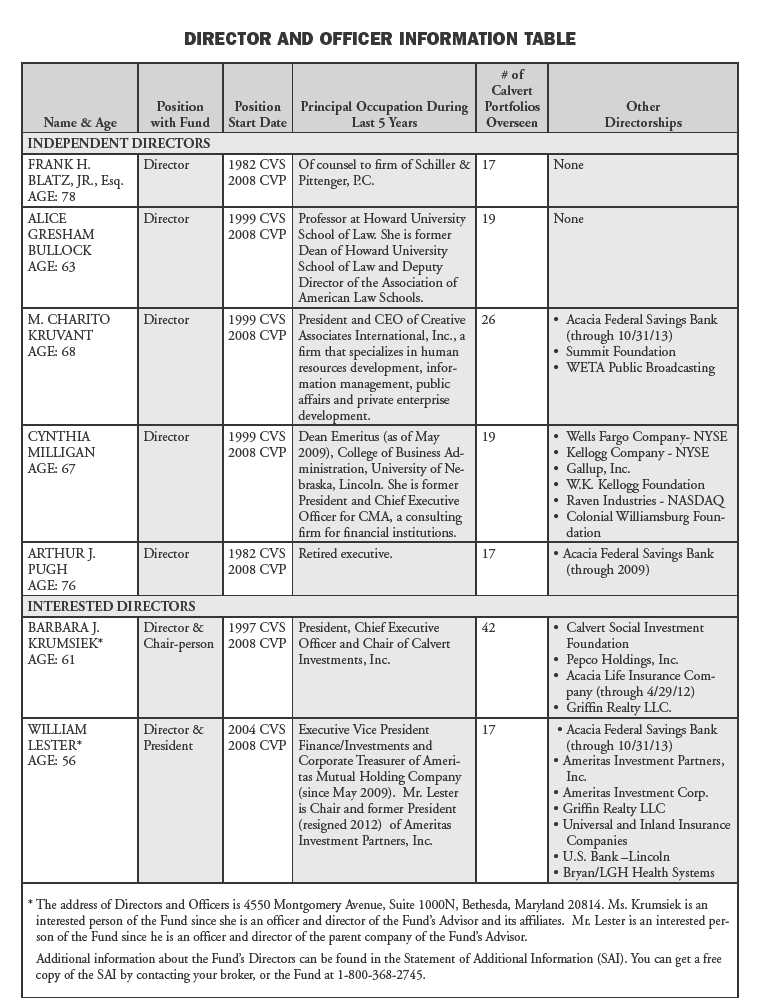
20 www.calvert.com CALVERT VP VOLATILITY MANAGED MODERATE GROWTH PORTFOLIO ANNUAL REPORT (UNAUDITED)
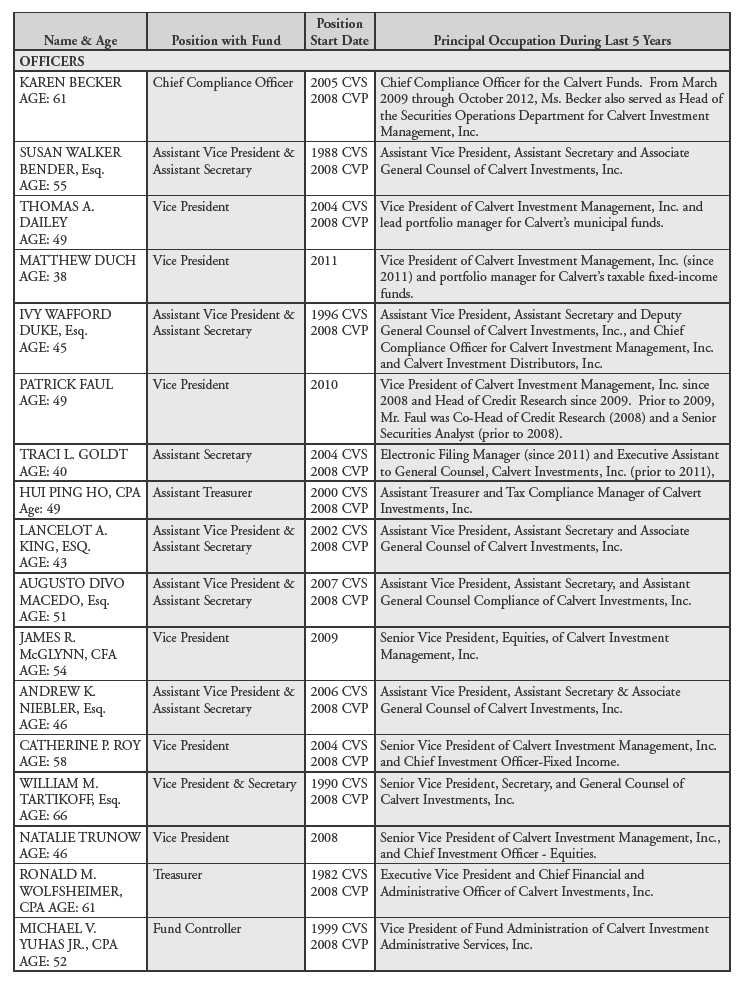
www.calvert.com CALVERT VP VOLATILITY MANAGED MODERATE GROWTH PORTFOLIO ANNUAL REPORT (UNAUDITED) 21
CALVERT VP VOLATILITY MANAGED GROWTH PORTFOLIO
Portfolio within Calvert Variable Products, Inc.
Managed by Calvert Investment Management, Inc.
INVESTMENT PERFORMANCE
From inception on April 30, 2013 through December 31, 2013, Calvert VP Volatility Managed Growth Portfolio returned 6.59%, underperforming the S&P 500 Daily Risk Control 12% Total Return Index, which returned 16.70%.
Calvert has developed a secondary composite benchmark based on a mix of market indices* that more closely reflect the asset allocation strategy than the single asset class benchmark listed above that is used to capture the impact of the volatility management strategy.
Calvert VP Volatility Managed Growth Portfolio also underperformed the blended composite benchmark return of 11.19%.
INVESTMENT CLIMATE
The equity markets finished 2013 on a strong note with many indices registering all-time highs despite mixed economic signals and concerns over the Fed’s “tapering” of long-term asset purchases and exit from quantitative easing. While much of the market commentary during the year focused on what was happening at the Federal Reserve, an important and sometimes overlooked driver of economic activity, and by extension Fed policy, was the improving health of the consumer balance sheet. As the overall economic recovery stabilized, improvements in the labor and housing markets, coupled with robust equity market performance, all contributed to further strengthen the consumer balance sheet.
As a result, U.S. consumer confidence and spending have recovered considerably from post-financial-crisis lows and are now contributing to GDP growth. Growing consumer confidence and reduced risk aversion also helped keep volatility subdued during the year as macro-risks faded from the forefront and investors shifted their attention to nascent signs of growth in the global economy.
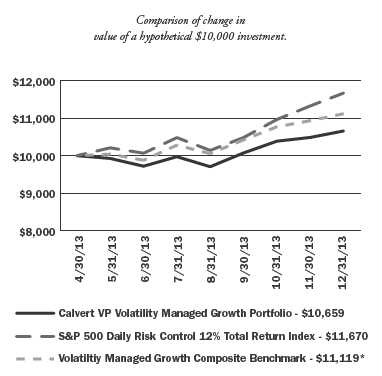
| AVERAGE ANNUAL TOTAL RETURN |
| (period ended 12.31.13) |
| Since Inception (4/30/2013)** | 6.59% |
The performance data shown represents past performance, does not guarantee future results and assumes reinvestment of all dividends and distributions. All performance data reflects fee waivers and/or expense limitations, if any are in effect; in their absence performance would be lower. See Note B in Notes to Financial Statements. The investment return and principal value of an investment will fluctuate so that an investor’s shares, when redeemed, may be worth more or less than their original cost. Current performance may be lower or higher than the performance data quoted.
Visit www.calvert.com/institutional-VP-performance.html for current performance data. The gross expense ratio from the current prospectus for the Portfolio is 1.26% (includes Acquired Fund fees). This number may vary from the expense ratio shown elsewhere in this report because it is based on a different time period and, if applicable, does not include fee or expense waivers. The performance data and expense ratio reflect deduction of Portfolio operating expenses, but do not reflect charges and expenses imposed under the variable annuity or life insurance contract.
* The Volatility Managed Growth Composite Benchmark is an internally constructed index comprised of a blend of 58% Russell 3000 Index, 4% MSCI US REIT Index, 16% MSCI EAFE Index, 18% Barclays U.S. Aggregate Bond Index and 4% Barclays 3 Month T-Bill Bellwether Index.
** Total Return is not annualized for periods of less than one year.
4 www.calvert.com CALVERT VP VOLATILITY MANAGED GROWTH PORTFOLIO ANNUAL REPORT
| |
| | % OF TOTAL |
| ECONOMIC SECTORS | INVESTMENTS |
| |
| Exchange Traded Products | 95.0% |
| Short-Term Investments | 5.0% |
| Total | 100% |
Stocks were the top performing asset class for the year, led by U.S. equities with the Russell 3000 Index, representing the total U.S. equity market, returning 33.55% and outperforming international stocks as the MSCI EAFE Index returned 23.29%. Bonds produced a negative return for the first time in more than a decade as the Barclays U.S. Aggregate Bond Index returned -2.02%. Low inflation hit Treasury Inflation-Protected Securities particularly hard, with the Barclays U.S. TIPS Index declining 8.61%. The MSCI US REIT Index finished the year at 2.47%, despite the negative impact of tapering on mortgage rates during the second half of the year.
PORTFOLIO STRATEGY
The Portfolio seeks to stabilize portfolio volatility1 around a target level of 12% while pursuing growth potential and some current income. To achieve this objective, the Portfolio invests in a group of exchange traded funds (ETFs) diversified across multiple asset classes and uses a derivative-based risk management strategy, primarily using futures contracts on various market indices. In an effort to manage long-term volatility, the target asset allocation model is designed to reflect the specified target level of risk. Meanwhile, the risk management strategy is employed to mitigate short-term fluctuations in volatility and realize a long-term risk level over a shorter time frame. The risk management strategy combines two components--volatility management and a capital protection strategy--that work together in an effort to reduce the negative effects of high portfolio volatility while seeking to participate in growth during up markets and defend against significant losses during major market downturns.
The historic relationship between rising equity markets and periods of low volatility was on display in 2013 as equity markets rallied throughout the year while the level of equity market risk declined to unusually low levels. Therefore, the risk management strategy sought to increase our equity exposure to achieve the desired 12% level of volatility. However, it could not achieve this due to risk controls limiting the Portfolio’s maximum equity exposure. Given the strong performance of U.S. equities, the Portfolio’s lower level of equity market exposure relative to the Index, which does not limit the equity exposure level, was a major contributor to the Portfolio’s underperformance for the period. Holdings of REITS and TIPS also contributed to the Portfolio’s underperformance relative to both the Index and composite benchmark.
OUTLOOK
We expect the U.S. economic recovery to continue to gain strength into 2014 and to provide a firm foundation for continued improvements in growth and employment, even in the face of the Federal Reserve’s tapering activities. It is important to remember that the Fed’s taper is merely an inflection point in its provision of extraordinary post-crisis support. The Fed still provides levels of support far above and beyond historical norms; it merely has switched from expanding to reducing that level gradually over time. Moreover, should the withdrawal of Fed support unexpectedly push the economy back into recession, there is no reason to think the Fed would not slow or even reverse its decisions, unless inflation becomes a serious problem.
A bigger question is whether equity valuations already reflect current growth expectations, or whether there is room for continued price/earnings multiple expansion in 2014. Returns of near 30% in 2013 already include a substantial component of multiple expansion, and so it is possible that financial markets may need to rest a bit in order to digest that expansion before moving any higher. However, we do think that improvements in the consumer balance sheet and employment, in combination with likely continued headwinds in fixed income, mean that more people will be ready to put investment money to work, and especially into equities. In this environment, it seems reasonable to expect continued multiple expansion in 2014, even if at a slower rate than was observed in 2013.
www.calvert.com CALVERT VP VOLATILITY MANAGED GROWTH PORTFOLIO ANNUAL REPORT 5
In a market environment characterized by dominant performance from a single asset class, in this case U.S. stocks, returns from a diversified asset allocation strategy will inevitably trail. However, over a longer time horizon time, the benefits from diversification should produce better risk-adjusted returns than can be had from investing in any single asset class.
January 2014
1 Volatility refers to the annualized standard deviation of daily logarithmic portfolio returns.
6 www.calvert.com CALVERT VP VOLATILITY MANAGED GROWTH PORTFOLIO ANNUAL REPORT
SHAREHOLDER EXPENSE EXAMPLE
As a shareholder of the Fund, you incur two types of costs: (1) transaction costs, and (2) ongoing costs, including management fees and other Fund expenses. This Example is intended to help you understand your ongoing costs (in dollars) of investing in the Fund and to compare these costs with the ongoing costs of investing in other mutual funds.
This Example is based on an investment of $1,000 invested at the beginning of the period and held for the entire period (July 1, 2013 to December 31, 2013).
Note: Expenses do not reflect charges and expenses of the variable annuity or variable universal life contract.
Actual Expenses
The first line of the table below provides information about actual account values and actual expenses. You may use the information in this line, together with the amount you invested, to estimate the expenses that you paid over the period. Simply divide your account value by $1,000 (for example, an $8,600 account value divided by $1,000 = 8.6), then multiply the result by the number in the first line under the heading entitled “Expenses Paid During Period” to estimate the expenses you paid on your account during this period.
Hypothetical Example for Comparison Purposes
The second line of the table below provides information about hypothetical account values and hypothetical expenses based on the Fund’s actual expense ratio and an assumed rate of return of 5% per year before expenses, which is not the Fund’s actual return. The hypothetical account values and expenses may not be used to estimate the actual ending account balance or expenses you paid for the period. You may use this information to compare the ongoing costs of investing in the Fund and other funds. To do so, compare the 5% hypothetical example with the 5% hypothetical examples that appear in the shareholder reports of the other funds.
Please note that the expenses shown in the table are meant to highlight your ongoing costs only and do not reflect any transactional costs. Therefore, the second line of the table is useful in comparing ongoing costs only, and will not help you determine the relative total costs of owning different funds. In addition, if these transactional costs were included, your costs would have been higher.
| | BEGINNING | ENDING | EXPENSES PAID |
| | ACCOUNT VALUE | ACCOUNT VALUE | DURING PERIOD* |
| | 7/1/13 | 12/31/13 | 7/1/13 - 12/31/13 |
| |
| Actual | $1,000.00 | $1,096.56 | $4.39 |
| |
Hypothetical
(5% return per year before expenses) | $1,000.00 | $1,021.02 | $4.23 |
* Expenses are equal to the Fund’s annualized expense ratio of 0.83%, multiplied by the average account value over the period, multiplied by 184/365 (to reflect the one-half year period). The fees and expenses of the Underlying Funds in which the Portfolio invests are not included in the annualized expense ratios.
www.calvert.com CALVERT VP VOLATILITY MANAGED GROWTH PORTFOLIO ANNUAL REPORT 7
REPORT OF INDEPENDENT REGISTERED PUBLIC ACCOUNTING FIRM
The Board of Directors of Calvert Variable Products, Inc. and Shareholders of Calvert VP Volatility Managed Growth Portfolio: We have audited the accompanying statement of net assets of the Calvert VP Volatility Managed Growth Portfolio (the “Portfolio”), a series of Calvert Variable Products, Inc., as of December 31, 2013, and the related statement of operations, the statement of changes in net assets, and the financial highlights for the period from Inception April 30, 2013, through December 31, 2013. These financial statements and financial highlights are the responsibility of the Portfolio’s management. Our responsibility is to express an opinion on these financial statements and financial highlights based on our audit.
We conducted our audit in accordance with the standards of the Public Company Accounting Oversight Board (United States). Those standards require that we plan and perform the audit to obtain reasonable assurance about whether the financial statements and financial highlights are free of material misstatement. An audit includes examining, on a test basis, evidence supporting the amounts and disclosures in the financial statements. Our procedures included confirmation of securities owned as of December 31, 2013, by correspondence with the custodian and brokers or by performing other appropriate auditing procedures. An audit also includes assessing the accounting principles used and significant estimates made by management, as well as evaluating the overall financial statement presentation. We believe that our audit provides a reasonable basis for our opinion.
In our opinion, the financial statements and financial highlights referred to above present fairly, in all material respects, the financial position of the Calvert VP Volatility Managed Growth Portfolio as of December 31, 2013, the results of its operations, the changes in its net assets, and the financial highlights for the period from Inception April 30,2013, through December 31, 2013, in conformity with U.S. generally accepted accounting principles.

Philadelphia, Pennsylvania
February 24, 2014
8 www.calvert.com CALVERT VP VOLATILITY MANAGED GROWTH PORTFOLIO ANNUAL REPORT
| | |
| STATEMENT OF NET ASSETS |
| DECEMBER 31, 2013 |
| |
| EXCHANGE TRADED PRODUCTS - 94.9% | SHARES | VALUE |
| iShares Core S&P Mid-Cap ETF | 11,500 | $1,539,160 |
| iShares Core Total US Bond Market ETF | 26,300 | 2,799,109 |
| iShares North American Natural Resources ETF | 11,100 | 481,629 |
| iShares Russell 2000 ETF | 9,000 | 1,037,790 |
| iShares S&P 500 Growth ETF | 15,600 | 1,540,188 |
| iShares S&P 500 Value ETF | 20,700 | 1,769,022 |
| iShares S&P Mid-Cap 400 Growth ETF | 3,400 | 511,190 |
| iShares S&P Mid-Cap 400 Value ETF | 4,300 | 499,789 |
| iShares TIPS Bond ETF | 6,500 | 714,350 |
| Powershares QQQ Trust, Series 1 | 14,500 | 1,275,420 |
| SPDR Barclays High Yield Bond ETF | 24,800 | 1,005,888 |
| Vanguard FTSE Developed Markets ETF | 79,500 | 3,313,560 |
| Vanguard FTSE Emerging Markets ETF | 18,700 | 769,318 |
| Vanguard REIT ETF | 27,400 | 1,768,944 |
| Vanguard S&P 500 ETF | 25,700 | 4,347,155 |
| Vanguard Total International Stock ETF | 19,500 | 1,021,410 |
| |
| Total Exchange Traded Products (Cost $23,110,002) | | 24,393,922 |
| |
| | PRINCIPAL | |
| TIME DEPOSIT - 5.0% | AMOUNT | |
| State Street Bank Time Deposit, 0.083%, 1/2/14 | $1,287,595 | 1,287,595 |
| |
| Total Time Deposit (Cost $1,287,595) | | 1,287,595 |
| |
| |
| TOTAL INVESTMENTS (Cost $24,397,597) - 99.9% | | 25,681,517 |
| Other assets and liabilities, net - 0.1% | | 27,892 |
| NET ASSETS - 100% | | $25,709,409 |
| |
| |
| NET ASSETS CONSIST OF: | | |
| Paid-in capital applicable to 1,618,919 shares of common stock outstanding; | | |
| $0.10 par value, 100,000,000 shares authorized | | $24,519,476 |
| Undistributed net investment income | | 1,276 |
| Accumulated net realized gain (loss) | | (157,890) |
| Net unrealized appreciation (depreciation) | | 1,346,547 |
| |
| |
| NET ASSETS | | $25,709,409 |
| |
| NET ASSET VALUE PER SHARE | | $15.88 |
See notes to financial statements.
www.calvert.com CALVERT VP VOLATILITY MANAGED GROWTH PORTFOLIO ANNUAL REPORT 9
| | | | |
| | | | UNDERLYING | UNREALIZED |
| | NUMBER OF | EXPIRATION | FACE AMOUNT | APPRECIATION |
| FUTURES | CONTRACTS | DATE | AT VALUE | (DEPRECIATION) |
| Purchased: | | | | |
| MSCI EAFE Mini Index | 4 | 3/14 | $383,560 | $21,031 |
| E-Mini S&P 400 Index | 2 | 3/14 | 267,880 | 7,136 |
| E-Mini Russell 2000 Index | 2 | 3/14 | 232,280 | 9,136 |
| E-Mini S&P 500 Index | 7 | 3/14 | 644,385 | 25,324 |
| Total Purchased | | | | $62,627 |
Abbreviations:
ETF: Exchange Traded Fund
REIT: Real Estate Investment Trust
See notes to financial statements.
10 www.calvert.com CALVERT VP VOLATILITY MANAGED GROWTH PORTFOLIO ANNUAL REPORT
| |
| STATEMENT OF OPERATIONS | |
| FROM INCEPTION APRIL 30, 2013 | |
| THROUGH DECEMBER 31, 2013 | |
| |
| NET INVESTMENT INCOME | |
| Investment Income: | |
| Dividend income | $240,311 |
| Interest income | 547 |
| Total investment income | 240,858 |
| |
| Expenses: | |
| Investment advisory fee | 34,319 |
| Transfer agency fees and expenses | 1,373 |
| Directors’ fees and expenses | 1,634 |
| Administrative fees | 8,171 |
| Distribution Plan expenses | 20,428 |
| Accounting fees | 1,226 |
| Custodian fees | 11,848 |
| Reports to shareholders | 7,354 |
| Professional fees | 16,085 |
| Total expenses | 102,438 |
| Reimbursement from Advisor | (34,616) |
| Net expenses | 67,822 |
| |
| |
| NET INVESTMENT INCOME | 173,036 |
| |
| |
| REALIZED AND UNREALIZED GAIN (LOSS) | |
| Net realized gain (loss) on: | |
| Investments | 111 |
| Futures | (158,262) |
| | (158,151) |
| |
| |
| Change in unrealized appreciation (depreciation) on: | |
| Investments | 1,283,920 |
| Futures | 62,627 |
| | 1,346,547 |
| |
| |
| NET REALIZED AND UNREALIZED GAIN (LOSS) | 1,188,396 |
| |
| INCREASE (DECREASE) IN NET ASSETS | |
| RESULTING FROM OPERATIONS | $1,361,432 |
See notes to financial statements.
www.calvert.com CALVERT VP VOLATILITY MANAGED GROWTH PORTFOLIO ANNUAL REPORT 11
| |
| STATEMENT OF CHANGES IN NET ASSETS |
| |
| | FROM INCEPTION |
| | APRIL 30, 2013 |
| | THROUGH |
| | DECEMBER 31, |
| INCREASE (DECREASE) IN NET ASSETS | 2013 |
| Operations: | |
| Net investment income | $173,036 |
| Net realized gain (loss) | (158,151) |
| Change in unrealized appreciation (depreciation) | 1,346,547 |
| |
| |
| INCREASE (DECREASE) IN NET ASSETS | |
| RESULTING FROM OPERATIONS | 1,361,432 |
| |
| |
| Distributions to shareholders from: | |
| Net investment income | (171,499) |
| Total distributions | (171,499) |
| |
| |
| Capital share transactions: | |
| Shares sold | 24,461,673 |
| Reinvestment of distributions | 157,148 |
| Shares redeemed | (99,345) |
| Total capital share transactions | 24,519,476 |
| |
| |
| TOTAL INCREASE (DECREASE) IN NET ASSETS | 25,709,409 |
| |
| |
| NET ASSETS | |
| Beginning of period | — |
| End of period (including undistributed net investment income of $1,276) | $25,709,409 |
| |
| |
| CAPITAL SHARE ACTIVITY | |
| Shares sold | 1,615,438 |
| Reinvestment of distributions | 9,921 |
| Shares redeemed | (6,440) |
| Total capital share activity | 1,618,919 |
See notes to financial statements.
12 www.calvert.com CALVERT VP VOLATILITY MANAGED GROWTH PORTFOLIO ANNUAL REPORT
NOTES TO FINANCIAL STATEMENTS
NOTE A –- SIGNIFICANT ACCOUNTING POLICIES
General: Calvert VP Volatility Managed Growth Portfolio (the “Portfolio”), a series of Calvert Variable Products, Inc. (the “Fund”), is registered under the Investment Company Act of 1940 as a diversified, open-end management investment company. The Fund is comprised of twelve separate portfolios. The operations of each series of the Fund are accounted for separately. The Portfolio began operations on April 30, 2013 and offers Class F shares, which are subject to Distribution Plan expenses. Shares of the Portfolio are sold without sales charge to affiliated and unaffiliated insurance companies for allocation to certain of their variable separate accounts. The Portfolio invests primarily in exchange traded funds representing a broad range of asset classes (the “Underlying Funds”) and derivatives to manage overall portfolio volatility.
Security Valuation: Net asset value per share is determined every business day as of the close of the regular session of the New York Stock Exchange (generally 4:00 p.m. Eastern time). The Portfolio uses independent pricing services approved by the Board of Directors (“the Board”) to value its investments wherever possible. Investments for which market quotations are not available or deemed not reliable are fair valued in good faith under the direction of the Board.
The Board has adopted Valuation Procedures (the “Procedures”) to determine the fair value of securities and other financial instruments for which market prices are not readily available or which may not be reliably priced. The Board has delegated the day-to-day responsibility for determining the fair value of assets of the Portfolio to Calvert Investment Management, Inc. (the “Advisor” or “Calvert”) and has provided these Procedures to govern Calvert in its valuation duties.
Calvert has chartered an internal Valuation Committee to oversee the implementation of these Procedures and to assist it in carrying out the valuation responsibilities that the Board has delegated.
The Valuation Committee meets on a regular basis to review illiquid securities and other investments which may not have readily available market prices. The Valuation Committee’s fair valuation determinations are subject to review, approval and ratification by the Board at its next regularly scheduled meeting covering the calendar quarter in which the fair valuation was determined.
The Valuation Committee utilizes various methods to measure the fair value of the Portfolio’s investments. Generally Accepted Accounting Principles (GAAP) establishes a disclosure hierarchy that categorizes the inputs to valuation techniques used to value assets and liabilities at measurement date. These inputs are summarized in the three broad levels listed below:
Level 1 – quoted prices in active markets for identical securities
Level 2 – other significant observable inputs (including quoted prices for similar securities, interest rates, prepayment speeds, credit risk, etc.)
Level 3 – significant unobservable inputs (including the Portfolio’s own assumptions in determining the fair value of investments) The inputs or methodologies used for valuing securities are not necessarily an indication of the risk associated with investing in those securities.
Changes in valuation techniques may result in transfers in or out of an investment’s assigned level within the hierarchy during the period. There were no such transfers during the period. Valuation techniques used to value the Portfolio’s investments by major category are as follows: Exchange traded products are valued at the official closing price as reported by an independent pricing service on the primary market or exchange on which they are traded and are categorized as Level 1 in the hierarchy.
www.calvert.com CALVERT VP VOLATILITY MANAGED GROWTH PORTFOLIO ANNUAL REPORT 13
Short-term securities of sufficient credit quality with remaining maturities of sixty days or less for which quotations are not readily available are valued at amortized cost, which approximates fair value, and are categorized as Level 2 in the hierarchy.
If a market value cannot be determined for a security using the methodologies described above, or if, in the good faith opinion of the Advisor, the market value does not constitute a readily available market quotation, or if a significant event has occurred that would materially affect the value of the security, the security will be fair valued as determined in good faith by the Valuation Committee.
The Valuation Committee considers a number of factors, including significant unobservable valuation inputs when arriving at fair value. It considers all significant facts that are reasonably available and relevant to the determination of fair value.
The Valuation Committee primarily employs a market-based approach which may use related or comparable assets or liabilities, recent transactions, market multiples, book values, and other relevant information for the investment to determine the fair value of the investment. When more appropriate, the fund may employ an income-based or cost approach. An income-based valuation approach discounts anticipated future cash flows of the investment to calculate a present amount (discounted). The measurement is based on the value indicated by current market expectations about those future amounts. Discounts may also be applied due to the nature or duration of any restrictions on the disposition of the investments. A cost based approach is based on the amount that currently would be required to replace the service capacity of an asset (current replacement cost). From the seller’s perspective, the price that would be received for the asset is determined based on the cost to a buyer to acquire or construct a substitute asset of comparable utility, adjusted for obsolescence.
The values assigned to fair value investments are based on available information and do not necessarily represent amounts that might ultimately be realized. Further, due to the inherent uncertainty of valuations of such investments, the fair values may differ significantly from the values that would have been used had an active market existed, and the differences could be material. The Valuation Committee employs various methods for calibrating these valuation approaches including a regular review of key inputs and assumptions, transactional back-testing or disposition analysis and reviews of any related market activity.
At December 31, 2013, no securities were fair valued in good faith under the direction of the Board.
The following is a summary of the inputs used to value the Portfolio’s net assets as of December 31, 2013:
| | | VALUATION INPUTS | |
| INVESTMENTS IN SECURITIES* | LEVEL 1 | LEVEL 2 | LEVEL 3 | TOTAL |
| Exchange traded products | $24,393,922 | — | — | $24,393,922 |
| Other debt obligations | — | $1,287,595 | — | 1,287,595 |
| TOTAL | $24,393,922 | $1,287,595 | — | $25,681,517 |
| Other financial instruments** | $62,627 | — | — | $62,627 |
* For a complete listing of investments, please refer to the Statement of Net Assets.
**Other financial instruments are derivative instruments not reflected in the Total Investments in the Statement of Net Assets, such as futures, which are valued at the unrealized appreciation/depreciation on the instrument.
Futures Contracts: The Portfolio may purchase and sell futures contracts to manage overall portfolio volatility. These futures contracts may include, but are not limited to, market index futures contracts and futures contracts based on U.S. government obligations. The Portfolio may enter into futures contracts agreeing to buy or sell a financial instrument for a set price at a future date. Initial margin deposits of either cash or securities as required by the broker are made upon entering into the contract. While the contract is open,
14 www.calvert.com CALVERT VP VOLATILITY MANAGED GROWTH PORTFOLIO ANNUAL REPORT
daily variation margin payments are made to or received from the broker reflecting the daily change in market value of the contract and are recorded for financial reporting purposes as unrealized gains or losses by the Portfolio. When a futures contract is closed, a realized gain or loss is recorded equal to the difference between the opening and closing value of the contract. The risks associated with entering into futures contracts may include the possible illiquidity of the secondary market which would limit the Portfolio’s ability to close out a futures contract prior to the settlement date, an imperfect correlation between the value of the contracts and the underlying financial instruments, or that the counterparty will fail to perform its obligations under the contracts’ terms. Futures contracts are designed by boards of trade which are designated “contracts markets” by the Commodities Futures Trading Commission. Futures contracts trade on the contracts markets in a manner that is similar to the way a stock trades on a stock exchange and the boards of trade, through their clearing corporations, guarantee the futures contracts against default. As a result, there is minimal counterparty credit risk to the Portfolio. During the period, futures contracts were used to adjust the Portfolio’s overall equity exposure in an effort to stabilize portfolio volatility around a target level. The Portfolio’s futures contracts at period end are presented in the Statement of Net Assets.
During the period from the inception of the Portfolio through December 31, 2013, the Portfolio invested in E-Mini S&P 500 Index, MSCI EAFE Mini Index, E-Mini S&P 400 Index and E-Mini Russell 2000 Index futures. The volume of outstanding contracts has varied throughout the period with a weighted average of 18 contracts and $393,493 weighted average notional value.
Security Transactions and Investment Income: Security transactions, normally related to shares of the Underlying Funds, are accounted for on trade date. Realized gains and losses are recorded on an identified cost basis. Income and capital gain distributions from the Underlying Funds, if any, are recorded on the ex-dividend date. Distributions received on securities that represent a return of capital or capital gain are recorded as a reduction of cost of investments and/or as a realized gain. Interest income, which includes amortization of premium and accretion of discount on debt securities, is accrued as earned. Expenses included in the accompanying financial statements reflect the expenses of the Portfolio and do not include any expenses associated with the Underlying Funds.
Distributions to Shareholders: Distributions to shareholders are recorded by the Portfolio on ex-dividend date. Dividends from net investment income and distributions from net realized capital gains, if any, are paid at least annually. Distributions are determined in accordance with income tax regulations which may differ from generally accepted accounting principles; accordingly, periodic reclassifications are made within the Portfolio’s capital accounts to reflect income and gains available for distribution under income tax regulations.
Estimates: The preparation of financial statements in conformity with accounting principles generally accepted in the United States requires management to make estimates and assumptions that affect the reported amounts of assets and liabilities and disclosure of contingent assets and liabilities at the date of the financial statements and the reported amounts of income and expenses during the reporting period. Actual results could differ from those estimates.
Federal Income Taxes: No provision for federal income or excise tax is required since the Portfolio intends to continue to qualify as a regulated investment company under the Internal Revenue Code and to distribute substantially all of its taxable earnings.
Management has analyzed the Portfolio’s tax positions taken for all open federal income tax years and has concluded that no provision for federal income tax is required in the Portfolio’s financial statements. A Portfolio’s federal tax return is subject to examination by the Internal Revenue Service for a period of three years.
NOTE B — RELATED PARTY TRANSACTIONS
Calvert Investment Management, Inc. (the “Advisor”) is wholly-owned by Calvert Investments, Inc., which is indirectly wholly-owned by Ameritas Mutual Holding Company. The Advisor provides investment advisory
www.calvert.com CALVERT VP VOLATILITY MANAGED GROWTH PORTFOLIO ANNUAL REPORT 15
services and pays the salaries and fees of officers and Directors of the Fund who are employees of the Advisor or its affiliates. For its services, the Advisor receives an annual fee, payable monthly, of .42% of the Portfolio’s average daily net assets. Under the terms of the agreement, $8,558 was payable at period end. In addition, $1,032 was payable at period end for operating expenses paid by the Advisor during December 2013.
The Advisor has contractually agreed to limit net annual portfolio operating expenses through April 30, 2014. The contractual expense cap is .83%. For the purpose of this expense limit, operating expenses do not include interest expense, brokerage commissions, taxes and extraordinary expenses. This expense limitation does not limit fees and expenses associated with the Underlying Funds. Under the terms of the agreement, $25,202 was receivable at period end.
Calvert Investment Administrative Services, Inc., an affiliate of the Advisor, provides administrative services to the Portfolio for an annual fee, payable monthly, of .10% of the average daily net assets of the Portfolio. Under the terms of the agreement, $2,038 was payable at period end.
Calvert Investment Distributors, Inc. (“CID”), an affiliate of the Advisor, is the distributor and principal underwriter for the Portfolio. Pursuant to Rule 12b-1 under the Investment Company Act of 1940, the Portfolio has adopted a Distribution Plan that permits the Portfolio to pay certain expenses associated with the distribution and servicing of its shares. The expenses paid may not exceed 0.25% annually of the average daily net assets of Class F. Under the terms of the agreement, $5,094 was payable at period end.
Calvert Investment Services, Inc. (“CIS”), an affiliate of the Advisor, acts as shareholder servicing agent for the Portfolio. For its services, CIS received a fee of $506 for the period from the inception of the Portfolio through December 31, 2013. Under the terms of the agreement, $78 was payable at period end. Boston Financial Data Services, Inc. is the transfer and dividend disbursing agent.
Each Director of the Fund who is not an employee of the Advisor or its affiliates receives a fee of $1,500 for each Board and Committee meeting attended plus an annual fee of $40,000. Committee chairs receive an additional $5,000 annual retainer. Directors’ fees are allocated to each of the portfolios served.
NOTE C — INVESTMENT ACTIVITY AND TAX INFORMATION
During the period from the inception of the Portfolio through December 31, 2013, the cost of purchases and proceeds from sales of investments, other than short-term securities, were $23,284,230 and $174,340, respectively.
| Capital Loss Carryforwards | |
| No Expiration Date: | |
| Short-term | ($34,190) |
| Long-term | (57,120) |
Under the Regulated Investment Company Modernization Act of 2010, capital losses incurred in taxable years beginning after December 22, 2010 can be carried forward to offset future capital gains for an unlimited period. These losses will retain their character as either long-term or short-term.
The tax character of dividends and distributions paid during the period ended December 31, 2013 was as follows:
| Distributions paid from: | 2013 |
| Ordinary income | $171,499 |
| Total | $171,499 |
16 www.calvert.com CALVERT VP VOLATILITY MANAGED GROWTH PORTFOLIO ANNUAL REPORT
As of December 31, 2013, the tax basis components of distributable earnings/(accumulated losses) and the federal tax cost were as follows:
| Unrealized appreciation | $1,419,256 |
| Unrealized (depreciation) | (139,289) |
| Net unrealized appreciation/(depreciation) | $1,279,967 |
| Undistributed ordinary income | $1,276 |
| Capital loss carryforward | ($91,310) |
| |
| Federal income tax cost of investments | $24,401,550 |
The differences between the components of distributable earnings on a tax basis and the amounts reflected in the statement of net assets are primarily due to temporary book-tax differences that will reverse in a subsequent period. These differences are due to wash sales and Section 1256 contracts.
Reclassifications, as shown in the table below, have been made to the Portfolio’s components of net assets to reflect income and gains available for distribution (or available capital loss carryovers, as applicable) under income tax law and regulations. These reclassifications are due to permanent book-tax differences and have no impact on net assets. The primary permanent differences causing such reclassifications for the Portfolio are due to exchange traded funds.
| Undistributed net investment income | ($261) |
| Accumulated net realized gain/(loss) | 261 |
NOTE D — LINE OF CREDIT
A financing agreement is in place with the Calvert Funds and State Street Corporation (“SSC”). Under the agreement, SSC provides an unsecured line of credit facility, in the aggregate amount of $50 million ($25 million committed and $25 million uncommitted), accessible by the Funds for temporary or emergency purposes only. Borrowings under the committed facility bear interest at the higher of the London Interbank Offered Rate (LIBOR) or the overnight Federal Funds Rate plus 1.25% per annum. A commitment fee of .11% per annum is incurred on the unused portion of the committed facility, which is allocated to all participating funds. The Portfolio had no borrowings under the agreement during the period ended December 31, 2013.
NOTE E — SUBSEQUENT EVENTS
In preparing the financial statements as of December 31, 2013, no subsequent events or transactions occurred that would have required recognition or disclosure in these financial statements.
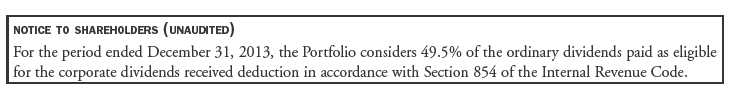
www.calvert.com CALVERT VP VOLATILITY MANAGED GROWTH PORTFOLIO ANNUAL REPORT 17
| |
| FINANCIAL HIGHLIGHTS |
| |
| | PERIOD ENDED |
| | DECEMBER 31 |
| | 2013#(z) |
| Net asset value, beginning | $15.00 |
| Income from investment operations: | |
| Net investment income | .21 |
| Net realized and unrealized gain (loss) | .78 |
| Total from investment operations | .99 |
| Distributions from: | |
| Net investment income | (.11) |
| Total distributions | (.11) |
| Total increase (decrease) in net asset value | .88 |
| Net asset value, ending | $15.88 |
| |
| Total return* | 6.59% |
| Ratios to average net assets: A,B | |
| Net investment income | 2.12% (a) |
| Total expenses | 1.25% (a) |
| Expenses before offsets | .83% (a) |
| Net expenses | .83% (a) |
| Portfolio turnover | 1% |
| Net assets, ending (in thousands) | $25,709 |
A Total expenses do not reflect amounts reimbursed and/or waived by the Advisor or reductions from expense offset arrangments. Expenses before
offsets reflect expenses after reimbursement and/or waiver by the Advisor but prior to reductions from expense offset arrangements. Net expenses
are net of all reductions and represent the net expenses paid by the portfolio.
B Amounts do not include the activity of the Underlying Funds.
(a) Annualized.
(z) Per share figures are calculated using the Average Shares Method.
# From April 30, 2013 inception.
* Total return is not annualized for periods of less than one year and does not reflect charges and expenses of the variable annuity or variable
universal life contract.
See notes to financial statements.
18 www.calvert.com CALVERT VP VOLATILITY MANAGED GROWTH PORTFOLIO ANNUAL REPORT
EXPLANATION OF FINANCIAL TABLES
SCHEDULE OF INVESTMENTS
The Schedule of Investments is a snapshot of all securities held in the fund at their market value, on the last day of the reporting period. Securities are listed by asset type (e.g., common stock, corporate bonds, U.S. government obligations) and may be further broken down into sub-groups and by industry classification.
STATEMENT OF ASSETS AND LIABILITIES
The Statement of Assets and Liabilities is often referred to as the fund’s balance sheet. It lists the value of what the fund owns, is due and owes on the last day of the reporting period. The fund’s assets include the market value of securities owned, cash, receivables for securities sold and shareholder subscriptions, and receivables for dividends and interest payments that have been earned, but not yet received. The fund’s liabilities typically include payables for securities purchased and shareholder redemptions, and expenses owed but not yet paid. The statement also reports the fund’s net asset value (NAV) per share on the last day of the reporting period. The NAV is calculated by dividing the fund’s net assets (assets minus liabilities) by the number of shares outstanding. This statement is accompanied by a Schedule of Investments. Alternatively, if certain conditions are met, a Statement of Net Assets may be presented in lieu of this statement and the Schedule of Investments.
STATEMENT OF NET ASSETS
The Statement of Net Assets provides a detailed list of the fund’s holdings, including each security’s market value on the last day of the reporting period. The Statement of Net Assets includes a Schedule of Investments. Other assets are added and other liabilities subtracted from the investments total to calculate the fund’s net assets. Finally, net assets are divided by the outstanding shares of the fund to arrive at its share price, or Net Asset Value (NAV) per share.
At the end of the Statement of Net Assets is a table displaying the composition of the fund’s net assets. Paid in Capital is the money invested by shareholders and represents the bulk of net assets. Undistributed Net Investment Income and Accumulated Net Realized Gains usually approximate the amounts the fund had available to distribute to shareholders as of the statement date. Accumulated Realized Losses will appear as negative balances. Unrealized Appreciation (Depreciation) is the difference between the market value of the fund’s investments and their cost, and reflects the gains (losses) that would be realized if the fund were to sell all of its investments at their statement-date values.
STATEMENT OF OPERATIONS
The Statement of Operations summarizes the fund’s investment income earned and expenses incurred in operating the fund. Investment income includes dividends earned from stocks and interest earned from interest-bearing securities in the fund. Expenses incurred in operating the fund include the advisory fee paid to the investment advisor, administrative services fees, distribution plan expenses (if applicable), transfer agent fees, shareholder servicing expenses, custodial, legal, and audit fees, and the printing and postage expenses related to shareholder reports. Expense offsets (fees paid indirectly) are also shown. Credits earned from offset arrangements are used to reduce the fund’s expenses. This statement also shows net gains (losses) realized on the sale of investments and the increase or decrease in the unrealized appreciation (depreciation) on investments held during the period.
STATEMENT OF CHANGES IN NET ASSETS
The Statement of Changes in Net Assets shows how the fund’s total net assets changed during the two most recent reporting periods. Changes in the fund’s net assets are attributable to investment operations, distributions and capital share transactions.
The Operations section of the report summarizes information detailed in the Statement of Operations. The Distribution section shows the dividend and capital gain distributions made to shareholders. The amounts
www.calvert.com CALVERT VP VOLATILITY MANAGED GROWTH PORTFOLIO ANNUAL REPORT (UNAUDITED) 19
shown as distributions in this section may not match the net investment income and realized gains amounts shown in the Operations section because distributions are determined on a tax basis and certain investments or transactions may be treated differently for financial statement and tax purposes. The Capital Share Transactions section shows the amount shareholders invested in the fund, either by purchasing shares or by reinvesting distributions, and the amounts redeemed. The corresponding numbers of shares issued, reinvested and redeemed are shown at the end of the report.
FINANCIAL HIGHLIGHTS
The Financial Highlights table provides a per-share breakdown by class of the components that affect the fund’s net asset value for current and past reporting periods. The table provides total return, total distributions, expense ratios, portfolio turnover and net assets for the applicable period. Total return is a measure of a fund’s performance that encompasses all elements of return: dividends, capital gain distributions and changes in net asset value. Total return is the change in value of an investment over a given period, assuming reinvestment of any dividends and capital gain distributions, expressed as a percentage of the initial investment. Total distributions include distributions from net investment income and net realized gains. Long-term gains are earned on securities held in the fund more than one year. Short-term gains, on the sale of securities held less than one year, are treated as ordinary dividend income for tax purposes. The expense ratio is a fund’s cost of doing business, expressed as a percentage of net assets. These expenses directly reduce returns to shareholders. Portfolio turnover measures the trading activity in a fund’s investment portfolio – how often securities are bought and sold by a fund. Portfolio turnover is affected by market conditions, changes in the size of the fund, the nature of the fund’s investments and the investment style of the portfolio manager.
PROXY VOTING
The Proxy Voting Guidelines that the Portfolio uses to determine how to vote proxies relating to portfolio securities is provided as an Appendix to the Fund’s Statement of Additional Information. The Statement of Additional Information can be obtained free of charge by calling the Fund at 1-800-368-2745, by visiting the Calvert website at www.calvert.com or by visiting the SEC’s website at www.sec.gov.
Information regarding how the Fund voted proxies relating to portfolio securities during the most recent 12-month period ended June 30 is available by calling the Fund, by visiting the Calvert website at www. calvert.com or visiting the SEC’s website at www.sec.gov.
AVAILABILITY OF QUARTERLY PORTFOLIO HOLDINGS
The Fund files its complete schedule of portfolio holdings with the SEC for the first and third quarters of each fiscal year on Form N-Q. The Fund’s Form N-Q is available on the SEC’s website at www.sec.gov. The Fund’s Form N-Q may be reviewed and copied at the SEC’s Public Reference Room in Washington, DC; information on the operation of the Public Reference Room may be obtained by calling 1-800-SEC-0330.
This report is intended to provide fund information to shareholders. It is not authorized for distribution to prospective investors unless preceded or accompanied by a prospectus.
Note: The information on our website is not incorporated by reference into this report; our website address is included as an inactive textual reference only.
Investors should carefully consider the investment objectives, risks, charges and expenses of the Calvert Funds. This and other important information is contained in the fund’s summary prospectus and prospectus, which can be obtained from your financial professional and should be read carefully before investing. You may also call Calvert at 800/368-2745 or visit www. calvert.com.
20 www.calvert.com CALVERT VP VOLATILITY MANAGED GROWTH PORTFOLIO ANNUAL REPORT (UNAUDITED)

www.calvert.com CALVERT VP VOLATILITY MANAGED GROWTH PORTFOLIO ANNUAL REPORT (UNAUDITED) 21
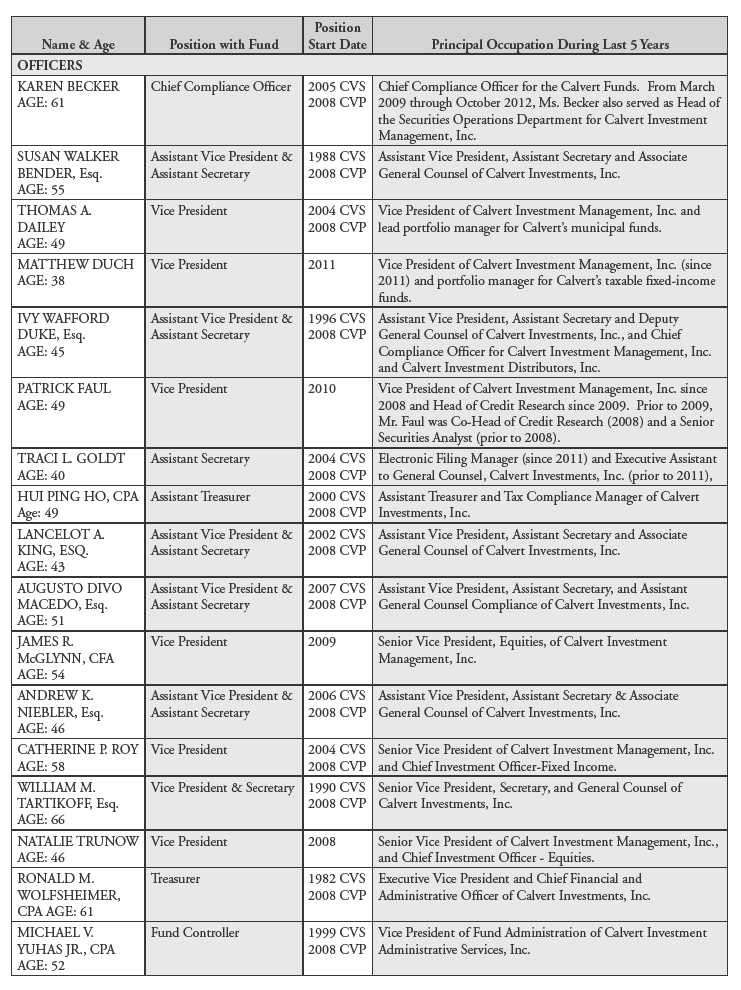
22 www.calvert.com CALVERT VP VOLATILITY MANAGED GROWTH PORTFOLIO ANNUAL REPORT (UNAUDITED)
Item 2. Code of Ethics.
(a) The registrant has adopted a code of ethics (the "Code of Ethics") that applies to its principal executive officer and principal financial officer (also referred to as “principal accounting officer”).
(b) No information need be disclosed under this paragraph.
(c) The registrant has not amended its Code of Ethics during the period covered by the shareholder report presented in Item 1 hereto.
(d) The registrant has not granted a waiver or implicit waiver from a provision of its Code of Ethics during the period covered by the shareholder report presented in Item 1 hereto.
(e) Not applicable.
(f) The registrant's Code of Ethics is attached as an Exhibit hereto.
Item 3. Audit Committee Financial Expert.
The registrant's Board of Trustees/Directors has determined that M. Charito Kruvant, an “independent” Trustee/Director serving on the registrant’s audit committee, is an “audit committee financial expert,” as defined in Item 3 of Form N-CSR. Under applicable securities laws, a person who is determined to be an audit committee financial expert will not be deemed an "expert" for any purpose, including without limitation for the purposes of Section 11 of the Securities Act of 1933, as a result of being designated or identified as an audit committee financial expert. The designation or identification of a person as an audit committee financial expert does not impose on such person any duties, obligations, or liabilities that are greater than the duties, obligations, and liabilities imposed on such person as a member of the audit committee and Board of Trustees in the absence of such designation or identification.
Item 4. Principal Accountant Fees and Services.
Services fees paid to auditing firm:
| Fiscal Year ended 12/31/13 | Fiscal Year ended 12/31/12 |
| $ | %* | $ | % * |
| | | | |
(a) Audit Fees | $209,620 | 0% | $166,320 | 0% |
(b) Audit-Related Fees | $0 | 0% | $0 | 0% |
(c) Tax Fees (tax return preparation and filing for the registrant) | $35,040 | 0% | $25,380 | 0% |
(d) All Other Fees | $0 | 0% | $0 | 0% |
| | | | |
Total | $244,660 | 0% | $191,700 | 0% |
* Percentage of fees approved by the Audit Committee pursuant to (c)(7)(i)(C) of Rule 2-01 of Reg. S-X (statutory de minimis waiver of Committee’s requirement to pre-approve)
(e) Audit Committee pre-approval policies and procedures:
The Audit Committee is required to pre-approve all audit and non-audit services provided to the registrant by the auditors, and to the registrant’s investment advisor, and any entity controlling, controlled by, or under common control with the advisor that provides ongoing services to the registrant. In determining whether to pre-approve non-audit services, the Audit Committee considers whether the services are consistent with maintaining the independence of the auditors. The Committee may delegate its authority to pre-approve certain matters to one or more of its members. In this regard, the Committee has delegated authority jointly to the Audit Committee Chair together with another Committee member with respect to non-audit services not exceeding $25,000 in each instance. In addition, the Committee has pre-approved the retention of the auditors to provide tax-related services related to the tax treatment and tax accounting of newly acquired securities, upon request by the investment advisor in each instance.
(f) Not applicable.
(g) Aggregate non-audit fees billed by the registrant’s accountant for services rendered to the registrant, and rendered to the registrant’s investment advisor, and any entity controlling, controlled by, or under common control with the advisor that provides ongoing services to the registrant for each of the last two fiscal years of the registrant:
Fiscal Year ended 12/31/13 | Fiscal Year ended 12/31/12 |
$ | %* | $ | % * |
| | | |
$292,500 | 0% | $15,000 | 0% |
* Percentage of fees approved by the Audit Committee pursuant to (c)(7)(i)(C) of Rule 2-01 of Reg. S-X (statutory de minimis waiver of Committee’s requirement to pre-approve)
(h) The registrant’s Audit Committee of the Board of Trustees has considered whether the provision of non-audit services that were rendered to the registrant’s investment advisor, and any entity controlling, controlled by, or under common control with the investment advisor that provides ongoing services to the registrant that were not pre-approved pursuant to paragraph (c) (7)(ii) of Rule 2-01 of Reg. S-X is compatible with maintaining the principal accountant’s independence and found that the provision of such services is compatible with maintaining the principal accountant’s independence.
Item 5. Audit Committee of Listed Registrants.
Not applicable.
Item 6. Schedule of Investments.
(a) This Schedule is included as part of the report to shareholders filed under Item 1 of this Form.
(b) Not applicable.
Item 7. Disclosure of Proxy Voting Policies and Procedures for Closed-End Management Investment Companies.
Not applicable.
Item 8. Portfolio Managers of Closed-End Management Investment Companies.
Not applicable.
Item 9. Purchases of Equity Securities by Closed-End Management Investment Company and Affiliated Purchasers.
Not applicable.
Item 10. Submission of Matters to a Vote of Security Holders.
There have been no changes to the procedures by which shareholders may recommend nominees to the registrant's Board of Directors since registrant last provided disclosure in response to this Item.
Item 11. Controls and Procedures.
(a) The principal executive and financial officers concluded that the registrant's disclosure controls and procedures (as defined in Rule 30a-3(c) under the 1940 Act) are effective, based on the evaluation of these controls and procedures required by Rule 30a-3(b) under the 1940 Act and Rules 13a-15(b) or 15d-15(b) under the Exchange Act, as of a date within 90 days of the filing date of this report.
(b) There was no change in the registrant's internal control over financial reporting (as defined in Rule 30a-3(d) under the 1940 Act) that occurred during the registrant's second fiscal quarter of the period covered by this report that has materially affected, or is reasonably likely to materially affect, the registrant's internal control over financial reporting.
Item 12. Exhibits.
(a)(1) A copy of the Registrant’s Code of Ethics.
Attached hereto.
(a)(2) A separate certification for each principal executive officer and principal financial officer of the registrant as required by Rule 30a-2 under the Act (17 CFR 270.30a-2).
Attached hereto.
(a)(3) Not applicable.
(b) A certification for the registrant's Principal Executive Officer and Principal Financial Officer, as required by Rule 30a-2(b) under the Investment Company Act of 1940, is attached hereto. The certification furnished pursuant to this paragraph is not deemed to be "filed" for purposes of Section 18 of the Securities Exchange Act of 1934, or otherwise subject to the liability of that section. Such certification is not deemed to be incorporated by reference into any filing under the Securities Act of 1933 or the Securities Exchange Act of 1934, except to the extent that the registrant specifically incorporates it by reference.
Pursuant to the requirements of the Securities Exchange Act of 1934 and the Investment Act of 1940, the registrant has duly caused this report to be signed on its behalf by the undersigned, thereunto duly authorized.
CALVERT VARIABLE PRODUCTS, INC.
By: /s/ Barbara J. Krumsiek
Barbara J. Krumsiek
Chairman -- Principal Executive Officer
Date: March 4, 2014
Pursuant to the requirements of the Securities Exchange Act of 1934 and the Investment Act of 1940, this report has been signed below by the following persons on behalf of the registrant and in the capacities and on the dates indicated.
/s/ Barbara J. Krumsiek
Barbara J. Krumsiek
Chairman -- Principal Executive Officer
Date: March 4, 2014
/s/ Ronald M. Wolfsheimer
Ronald M. Wolfsheimer
Treasurer -- Principal Financial Officer
Date: March 4, 2014