UNITED STATES
SECURITIES AND EXCHANGE COMMISSION
Washington, D.C. 20549
FORM N-CSR
CERTIFIED SHAREHOLDER REPORT OF REGISTERED
MANAGEMENT INVESTMENT COMPANIES
Investment Company Act file number 811-4008
Fidelity Investment Trust
(Exact name of registrant as specified in charter)
245 Summer St., Boston, Massachusetts 02210
(Address of principal executive offices) (Zip code)
Marc Bryant, Secretary
245 Summer St.
Boston, Massachusetts 02210
(Name and address of agent for service)
Registrant's telephone number, including area code:
617-563-7000
| |
Date of fiscal year end: | October 31 |
| |
Date of reporting period: | October 31, 2017 |
This report on Form N-CSR relates solely to the Registrant’s Fidelity Diversified International K6 Fund, Fidelity Emerging Europe, Middle East, Africa (EMEA) Fund, Fidelity Emerging Markets Discovery Fund, Fidelity Flex International Fund, Fidelity Global Commodity Stock Fund, Fidelity Global Equity Income Fund, Fidelity International Capital Appreciation K6 Fund, Fidelity International Discovery Fund, Fidelity International Growth Fund, Fidelity International Small Cap Fund, Fidelity International Small Cap Opportunities Fund, Fidelity International Value Fund, Fidelity Series Canada Fund, Fidelity Series Emerging Markets Fund, Fidelity Series International Growth Fund, Fidelity Series International Small Cap Fund, Fidelity Series International Value Fund, Fidelity Total Emerging Markets Fund, and Fidelity Total International Equity Fund (each, a “Fund” and collectively, the “Funds”).
Item 1.
Reports to Stockholders
Fidelity Advisor® Emerging Markets Discovery Fund - Class A, Class M (formerly Class T), Class C and Class I
Annual Report October 31, 2017 Class A, Class M, Class C and Class I are classes of Fidelity® Emerging Markets Discovery Fund |
 |
Contents
To view a fund's proxy voting guidelines and proxy voting record for the 12-month period ended June 30, visit http://www.fidelity.com/proxyvotingresults or visit the Securities and Exchange Commission's (SEC) web site at http://www.sec.gov.
You may also call 1-877-208-0098 to request a free copy of the proxy voting guidelines.
Standard & Poor's, S&P and S&P 500 are registered service marks of The McGraw-Hill Companies, Inc. and have been licensed for use by Fidelity Distributors Corporation.
Other third-party marks appearing herein are the property of their respective owners.
All other marks appearing herein are registered or unregistered trademarks or service marks of FMR LLC or an affiliated company. © 2017 FMR LLC. All rights reserved.
This report and the financial statements contained herein are submitted for the general information of the shareholders of the Fund. This report is not authorized for distribution to prospective investors in the Fund unless preceded or accompanied by an effective prospectus.
A fund files its complete schedule of portfolio holdings with the SEC for the first and third quarters of each fiscal year on Form N-Q. Forms N-Q are available on the SEC’s web site at http://www.sec.gov. A fund's Forms N-Q may be reviewed and copied at the SEC’s Public Reference Room in Washington, DC. Information regarding the operation of the SEC's Public Reference Room may be obtained by calling 1-800-SEC-0330.
For a complete list of a fund's portfolio holdings, view the most recent holdings listing, semiannual report, or annual report on Fidelity's web site at http://www.fidelity.com, http://www.institutional.fidelity.com, or http://www.401k.com, as applicable.
NOT FDIC INSURED •MAY LOSE VALUE •NO BANK GUARANTEE
Neither the Fund nor Fidelity Distributors Corporation is a bank.
Performance: The Bottom Line
Average annual total return reflects the change in the value of an investment, assuming reinvestment of distributions from dividend income and capital gains (the profits earned upon the sale of securities that have grown in value, if any) and assuming a constant rate of performance each year. The hypothetical investment and the average annual total returns do not reflect the deduction of taxes that a shareholder would pay on fund distributions or the redemption of fund shares. During periods of reimbursement by Fidelity, a fund’s total return will be greater than it would be had the reimbursement not occurred. How a fund did yesterday is no guarantee of how it will do tomorrow.
Average Annual Total Returns
| For the periods ended October 31, 2017 | Past 1 year | Past 5 years | Life of fundA |
| Class A (incl. 5.75% sales charge) | 16.77% | 4.93% | 7.15% |
| Class M (incl. 3.50% sales charge) | 19.31% | 5.16% | 7.30% |
| Class C (incl. contingent deferred sales charge) | 22.02% | 5.38% | 7.41% |
| Class I | 24.25% | 6.46% | 8.50% |
A From November 1, 2011
Class C shares' contingent deferred sales charges included in the past one year and life of fund total return figures are 1% and 0%, respectively.
Class C shares' contingent deferred sales charges included in the past one year, past five years, and life of fund total return figures are 1%, 0%, and 0%, respectively.
$10,000 Over Life of Fund
Let's say hypothetically that $10,000 was invested in Fidelity Advisor® Emerging Markets Discovery Fund - Class A on November 1, 2011, when the fund started, and the current 5.75% sales charge was paid.
The chart shows how the value of your investment would have changed, and also shows how the MSCI Emerging Markets SMID Cap Index performed over the same period.
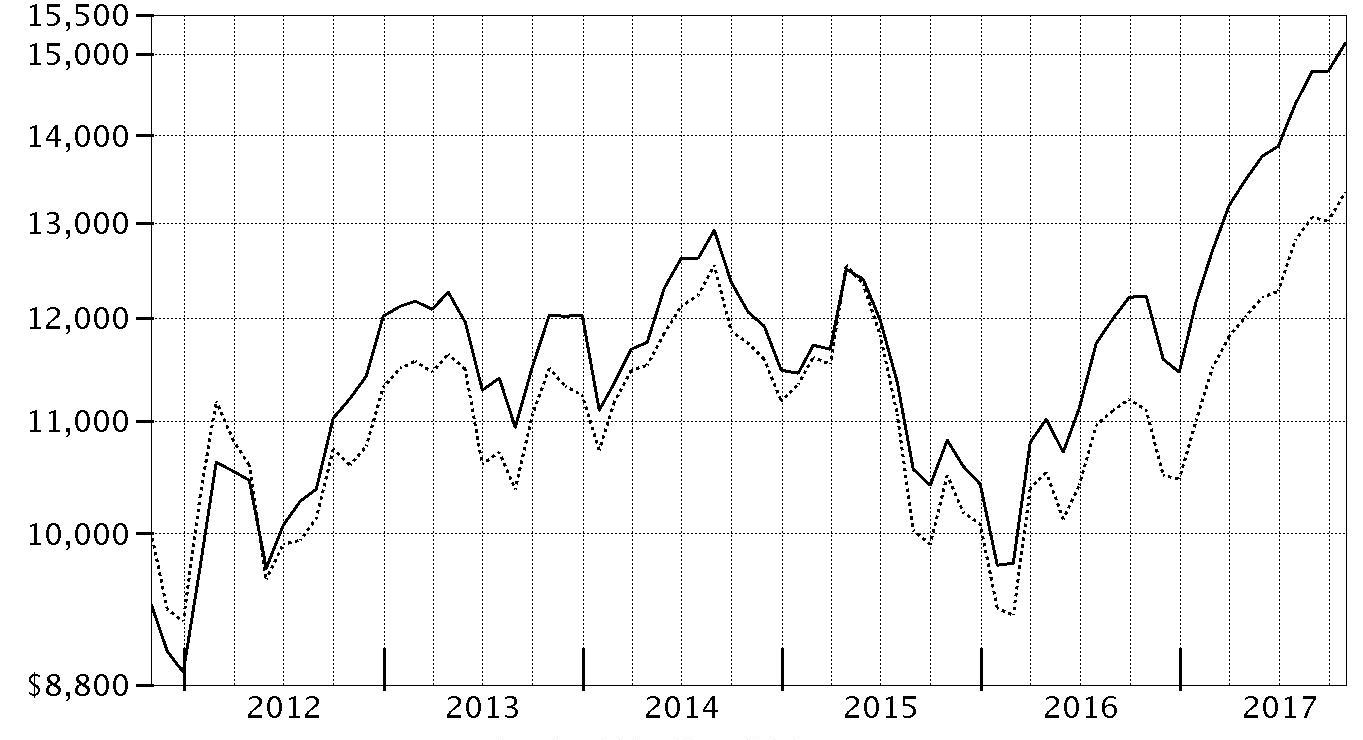
| Period Ending Values |
| $15,140 | Fidelity Advisor® Emerging Markets Discovery Fund - Class A |
| $13,346 | MSCI Emerging Markets SMID Cap Index |
Management's Discussion of Fund Performance
Market Recap: The MSCI ACWI (All Country World Index) ex USA Index returned 23.85% for the 12 months ending October 31, 2017, helped partly by a generally weak U.S. dollar. Some favorable election results in continental Europe (+30%) suggested ebbing political uncertainty and near-term risk there, but the U.K. (+20%) faced more-mixed conditions ahead of its expected exit from the European Union. Despite central-bank easing – and pressured recently by yen strength – Japan (+18%) lagged the rest of the Asia-Pacific group (+22%). Commodity-price volatility slowed Canada (+17%), but the emerging-markets group (+26%) sped ahead. Sector-wise, information technology (+47%) was driven by a surge among several Chinese internet-related names. Financials (+27%) rode rising interest rates that, at the same time, weighed on real estate (+17%), utilities (+16%), consumer staples (+14%) and telecommunication services (+9%) – so-called “bond proxy” sectors. Materials (+28%) and industrials (+27%) responded to demand from China and price gains for certain commodities. In the energy sector (+20%), oil prices lost ground in the spring before rebounding through October 31 to end well above where they started 12 months ago. Lastly, health care (+14%) was hurt by early-period turmoil around drug pricing and health care legislation.
Comments from Co-Portfolio Managers Gregory Lee and Timothy Gannon: For the year, the fund’s share classes (excluding sales charges, if applicable) advanced about 24%, outpacing the 20.24% return of the benchmark MSCI Emerging Markets SMID Cap Index. Security selection drove the fund's outperformance of its benchmark, as stock picking in most of the fund’s 11 sector sleeves was positive. Choices among industrials and consumer stocks helped the most. Conversely, security selection in the health care and information technology sectors detracted. The fund’s top individual contributors were two China-based consumer discretionary names: consumer electronics and household appliance maker Qingdao Haier and high-end hotel operator Shangri-La Asia. Shares of Haier gained due to management’s efforts to integrate its 2016 purchase of General Electric’s appliance division and its goal to double the firm’s revenue and profit in the next five years. Shangri-La’s stock benefited from improving RevPAR (revenue per available room) in China. Conversely, not owning index component Sunac China Holdings, one of the leading residential property developers in China, was the fund’s biggest individual detractor. Shares of Sunac partly were lifted by the firm’s report that it would slow its rate of land purchases to boost profit and cut its debt ratio.
The views expressed above reflect those of the portfolio manager(s) only through the end of the period as stated on the cover of this report and do not necessarily represent the views of Fidelity or any other person in the Fidelity organization. Any such views are subject to change at any time based upon market or other conditions and Fidelity disclaims any responsibility to update such views. These views may not be relied on as investment advice and, because investment decisions for a Fidelity fund are based on numerous factors, may not be relied on as an indication of trading intent on behalf of any Fidelity fund.
Investment Summary (Unaudited)
Top Five Stocks as of October 31, 2017
| | % of fund's net assets | % of fund's net assets 6 months ago |
| Hyundai Motor Co. Series 2 (Korea (South), Automobiles) | 1.9 | 2.0 |
| Shangri-La Asia Ltd. (Bermuda, Hotels, Restaurants & Leisure) | 1.6 | 1.3 |
| Qingdao Haier Co. Ltd. (China, Household Durables) | 1.6 | 1.6 |
| Arvind Mills Ltd. (India, Textiles, Apparel & Luxury Goods) | 1.5 | 1.4 |
| Yandex NV Series A (Netherlands, Internet Software & Services) | 1.5 | 1.9 |
| | 8.1 | |
Top Five Market Sectors as of October 31, 2017
| | % of fund's net assets | % of fund's net assets 6 months ago |
| Information Technology | 18.7 | 14.8 |
| Consumer Discretionary | 17.6 | 16.2 |
| Industrials | 11.7 | 11.3 |
| Financials | 11.5 | 9.9 |
| Materials | 10.2 | 9.4 |
Top Five Countries as of October 31, 2017
| (excluding cash equivalents) | % of fund's net assets | % of fund's net assets 6 months ago |
| Brazil | 11.8 | 8.9 |
| India | 11.5 | 9.2 |
| Korea (South) | 11.1 | 12.3 |
| Cayman Islands | 9.9 | 9.0 |
| Taiwan | 8.1 | 7.2 |
Percentages are adjusted for the effect of futures contracts, if applicable.
Asset Allocation (% of fund's net assets)
| As of October 31, 2017 |
| | Stocks | 98.1% |
| | Short-Term Investments and Net Other Assets (Liabilities) | 1.9% |

| As of April 30, 2017 |
| | Stocks and Equity Futures | 95.1% |
| | Short-Term Investments and Net Other Assets (Liabilities) | 4.9% |

Investments October 31, 2017
Showing Percentage of Net Assets
| Common Stocks - 93.7% | | | |
| | | Shares | Value |
| Argentina - 1.4% | | | |
| BBVA Banco Frances SA sponsored ADR (a) | | 104,300 | $2,298,772 |
| Inversiones y Representaciones SA ADR(a) | | 77,310 | 2,251,267 |
| YPF SA Class D sponsored ADR (b) | | 36,000 | 884,160 |
|
| TOTAL ARGENTINA | | | 5,434,199 |
|
| Bailiwick of Jersey - 0.3% | | | |
| Atrium European Real Estate Ltd. | | 149,637 | 700,705 |
| WNS Holdings Ltd. sponsored ADR (b) | | 15,500 | 587,760 |
|
| TOTAL BAILIWICK OF JERSEY | | | 1,288,465 |
|
| Bangladesh - 0.2% | | | |
| BRAC Bank Ltd. | | 669,772 | 812,236 |
| Bermuda - 3.2% | | | |
| Joy City Property Ltd. | | 12,443,000 | 2,169,159 |
| Pacific Basin Shipping Ltd. (b) | | 9,274,000 | 2,115,995 |
| PAX Global Technology Ltd. | | 1,224,000 | 619,735 |
| Shangri-La Asia Ltd. | | 3,122,000 | 6,210,865 |
| Tai Cheung Holdings Ltd. | | 653,000 | 753,326 |
| VimpelCom Ltd. sponsored ADR | | 157,100 | 614,261 |
|
| TOTAL BERMUDA | | | 12,483,341 |
|
| Brazil - 10.5% | | | |
| Arezzo Industria e Comercio SA | | 278,800 | 4,308,177 |
| Azul SA sponsored ADR | | 81,200 | 2,053,548 |
| BTG Pactual Participations Ltd. unit | | 185,500 | 1,248,083 |
| Centrais Eletricas Brasileiras SA (Electrobras) (b) | | 90,700 | 611,358 |
| Cia. Hering SA | | 528,700 | 4,719,237 |
| Companhia de Saneamento de Minas Gerais | | 65,720 | 791,541 |
| Construtora Tenda SA (b) | | 183,200 | 957,638 |
| Cosan SA Industria e Comercio | | 163,700 | 1,871,543 |
| Direcional Engenharia SA (b) | | 361,000 | 645,569 |
| Equatorial Energia SA | | 78,600 | 1,465,656 |
| Estacio Participacoes SA | | 247,600 | 2,219,946 |
| Fibria Celulose SA | | 229,500 | 3,671,944 |
| Hypermarcas SA | | 300,338 | 3,139,901 |
| Instituto Hermes Pardini SA | | 138,100 | 1,302,352 |
| Localiza Rent A Car SA | | 150,495 | 2,662,289 |
| LPS Brasil Consultoria de Imoveis SA (b) | | 361,100 | 623,671 |
| Minerva SA | | 311,500 | 1,095,054 |
| QGEP Participacoes SA | | 1,100,700 | 2,843,186 |
| Smiles Fidelidade SA | | 77,600 | 2,028,185 |
| Tegma Gestao Logistica SA | | 362,100 | 1,992,419 |
|
| TOTAL BRAZIL | | | 40,251,297 |
|
| British Virgin Islands - 1.0% | | | |
| Dolphin Capital Investors Ltd. (b) | | 8,361,857 | 746,865 |
| Mail.Ru Group Ltd. GDR (Reg. S) (b) | | 93,764 | 3,047,330 |
|
| TOTAL BRITISH VIRGIN ISLANDS | | | 3,794,195 |
|
| Canada - 1.0% | | | |
| Pan American Silver Corp. | | 121,800 | 1,988,994 |
| Torex Gold Resources, Inc. (b) | | 129,070 | 1,779,827 |
|
| TOTAL CANADA | | | 3,768,821 |
|
| Cayman Islands - 9.9% | | | |
| 58.com, Inc. ADR (b) | | 59,200 | 3,976,464 |
| ASM Pacific Technology Ltd. | | 163,300 | 2,375,798 |
| Changyou.com Ltd. (A Shares) ADR (b) | | 43,200 | 1,673,568 |
| Cheetah Mobile, Inc. ADR (a)(b) | | 56,600 | 510,532 |
| China Medical System Holdings Ltd. | | 1,480,000 | 2,735,612 |
| Daqo New Energy Corp. ADR (b) | | 17,500 | 659,750 |
| General Interface Solution Holding Ltd. | | 231,000 | 2,119,301 |
| Haitian International Holdings Ltd. | | 1,138,000 | 3,406,094 |
| IGG, Inc. | | 1,372,000 | 1,839,557 |
| JA Solar Holdings Co. Ltd. ADR (b) | | 64,300 | 479,035 |
| Lee's Pharmaceutical Holdings Ltd. | | 1,039,000 | 930,937 |
| Longfor Properties Co. Ltd. | | 307,500 | 718,160 |
| Silicon Motion Technology Corp. sponsored ADR | | 11,600 | 561,672 |
| SITC International Holdings Co. Ltd. | | 3,521,500 | 3,394,478 |
| Sunny Optical Technology Group Co. Ltd. | | 354,000 | 5,181,993 |
| TPK Holding Co. Ltd. (b) | | 394,000 | 1,300,783 |
| Uni-President China Holdings Ltd. | | 2,747,000 | 2,295,798 |
| Yirendai Ltd. sponsored ADR (a)�� | | 25,500 | 1,106,445 |
| YY, Inc. ADR (b) | | 29,300 | 2,648,427 |
|
| TOTAL CAYMAN ISLANDS | | | 37,914,404 |
|
| Chile - 1.0% | | | |
| Compania Cervecerias Unidas SA sponsored ADR (a) | | 96,300 | 2,742,624 |
| Sociedad Quimica y Minera de Chile SA (PN-B) sponsored ADR | | 19,500 | 1,164,930 |
|
| TOTAL CHILE | | | 3,907,554 |
|
| China - 5.3% | | | |
| BBMG Corp. (H Shares) | | 2,591,000 | 1,291,946 |
| China Longyuan Power Grid Corp. Ltd. (H Shares) | | 3,575,200 | 2,648,839 |
| Huangshan Tourism Development Co. Ltd. | | 621,800 | 932,078 |
| Qingdao Haier Co. Ltd. | | 2,301,454 | 6,000,867 |
| Shanghai International Airport Co. Ltd. (A Shares) | | 184,880 | 1,219,084 |
| Suofeiya Home Collection Co. Ltd. Class A | | 402,720 | 2,361,122 |
| TravelSky Technology Ltd. (H Shares) | | 591,000 | 1,530,264 |
| Tsingtao Brewery Co. Ltd. (H Shares) | | 382,000 | 1,598,726 |
| Zhengzhou Yutong Bus Co. Ltd. | | 744,444 | 2,854,400 |
|
| TOTAL CHINA | | | 20,437,326 |
|
| Colombia - 0.2% | | | |
| Organizacion Terpel SA | | 129,619 | 588,006 |
| Cyprus - 1.0% | | | |
| Etalon Group PLC GDR (Reg. S) | | 533,800 | 2,161,890 |
| Globaltrans Investment PLC GDR (Reg. S) | | 203,300 | 1,878,492 |
|
| TOTAL CYPRUS | | | 4,040,382 |
|
| Egypt - 1.4% | | | |
| Credit Agricole Egypt | | 346,080 | 824,348 |
| Egyptian Kuwaiti Holding | | 2,135,200 | 1,686,808 |
| Six of October Development & Investment Co. (b) | | 2,633,500 | 2,768,372 |
|
| TOTAL EGYPT | | | 5,279,528 |
|
| Greece - 0.7% | | | |
| Titan Cement Co. SA (Reg.) | | 119,300 | 2,879,388 |
| Hong Kong - 3.7% | | | |
| China Resources Beer Holdings Co. Ltd. | | 740,000 | 2,134,232 |
| CSPC Pharmaceutical Group Ltd. | | 2,384,000 | 4,143,749 |
| Far East Horizon Ltd. | | 1,739,584 | 1,728,123 |
| Techtronic Industries Co. Ltd. | | 421,500 | 2,471,816 |
| Winteam Pharmaceutical Group Ltd. | | 4,380,000 | 2,509,626 |
| Yuexiu Property Co. Ltd. | | 5,728,000 | 1,108,683 |
|
| TOTAL HONG KONG | | | 14,096,229 |
|
| India - 11.5% | | | |
| Adani Ports & Special Economic Zone Ltd. | | 485,430 | 3,226,329 |
| Arvind Mills Ltd. | | 939,817 | 5,821,060 |
| Bharat Petroleum Corp. Ltd. | | 342,806 | 2,867,394 |
| Deccan Cements Ltd. | | 169,565 | 1,521,109 |
| EIH Ltd. | | 1,957,903 | 4,656,634 |
| Federal Bank Ltd. | | 1,097,432 | 2,063,511 |
| Gujarat Gas Ltd. | | 1,008 | 14,205 |
| InterGlobe Aviation Ltd. | | 125,550 | 2,419,576 |
| JK Cement Ltd. | | 103,712 | 1,605,574 |
| LIC Housing Finance Ltd. | | 251,279 | 2,323,409 |
| Manappuram General Finance & Leasing Ltd. | | 672,319 | 1,046,637 |
| Oberoi Realty Ltd. | | 207,366 | 1,520,417 |
| PC Jeweller Ltd. | | 310,401 | 1,681,678 |
| Phoenix Mills Ltd. | | 206,136 | 1,673,283 |
| Solar Industries India Ltd. | | 211,003 | 3,347,697 |
| South Indian Bank Ltd. | | 2,662,871 | 1,256,382 |
| Steel Authority of India Ltd. (b) | | 1,242,558 | 1,496,827 |
| The Jammu & Kashmir Bank Ltd. (b) | | 807,734 | 1,032,902 |
| The Ramco Cements Ltd. | | 161,475 | 1,797,672 |
| Torrent Pharmaceuticals Ltd. | | 150,821 | 2,957,839 |
|
| TOTAL INDIA | | | 44,330,135 |
|
| Indonesia - 2.5% | | | |
| PT Bank Danamon Indonesia Tbk Series A | | 2,728,400 | 1,025,979 |
| PT Cikarang Listrindo Tbk | | 8,154,600 | 658,381 |
| PT Holcim Indonesia Tbk (b) | | 3,273,100 | 199,101 |
| PT Lippo Karawaci Tbk | | 25,046,600 | 1,274,260 |
| PT Media Nusantara Citra Tbk | | 7,412,300 | 852,585 |
| PT Pakuwon Jati Tbk | | 36,295,700 | 1,685,994 |
| PT Panin Life Tbk (b) | | 41,908,100 | 729,240 |
| PT Semen Gresik (Persero) Tbk | | 3,751,000 | 3,014,629 |
|
| TOTAL INDONESIA | | | 9,440,169 |
|
| Israel - 0.2% | | | |
| Bezeq The Israel Telecommunication Corp. Ltd. | | 454,300 | 678,370 |
| Kenya - 0.2% | | | |
| KCB Group Ltd. | | 1,707,500 | 625,398 |
| Korea (South) - 8.4% | | | |
| AMOREPACIFIC Group, Inc. | | 29,149 | 3,741,096 |
| BS Financial Group, Inc. | | 275,006 | 2,444,848 |
| Com2uS Corp. | | 13,986 | 1,668,678 |
| Daou Technology, Inc. | | 44,357 | 727,983 |
| Dongbu HiTek Co. Ltd. (b) | | 115,629 | 1,478,857 |
| DOUBLEUGAMES Co. Ltd. | | 18,038 | 827,616 |
| Fila Korea Ltd. | | 5,802 | 351,309 |
| HB Technology Co. Ltd. | | 281,967 | 1,079,357 |
| Hyundai Fire & Marine Insurance Co. Ltd. | | 30,564 | 1,239,683 |
| Hyundai Glovis Co. Ltd. | | 13,782 | 1,861,283 |
| Hyundai Industrial Development & Construction Co. | | 59,538 | 2,135,315 |
| Hyundai Wia Corp. | | 26,397 | 1,522,781 |
| KEPCO Plant Service & Engineering Co. Ltd. | | 36,790 | 1,358,949 |
| Korea Express Co. Ltd. (b) | | 11,560 | 1,623,232 |
| Korean Reinsurance Co. | | 82,467 | 826,079 |
| Loen Entertainment, Inc. | | 1,381 | 131,543 |
| Minwise Co. Ltd. | | 59,433 | 1,286,371 |
| NCSOFT Corp. | | 3,138 | 1,197,003 |
| Samjin Pharmaceutical Co. Ltd. | | 72,815 | 2,155,619 |
| Silicon Works Co. Ltd. | | 33,796 | 1,357,172 |
| Tera Semicon Co. Ltd. | | 67,847 | 1,790,094 |
| Toptec Co. Ltd. | | 65,209 | 1,641,758 |
|
| TOTAL KOREA (SOUTH) | | | 32,446,626 |
|
| Malaysia - 1.2% | | | |
| Matrix Concepts Holdings Bhd | | 1,883,700 | 1,001,495 |
| Top Glove Corp. Bhd | | 2,363,800 | 3,574,745 |
|
| TOTAL MALAYSIA | | | 4,576,240 |
|
| Mexico - 1.9% | | | |
| Credito Real S.A.B. de CV | | 819,900 | 1,314,628 |
| Fibra Uno Administracion SA de CV | | 1,311,700 | 2,064,182 |
| Industrias Penoles SA de CV | | 108,250 | 2,516,512 |
| Qualitas Controladora S.A.B. de CV | | 741,200 | 1,226,715 |
| Tenedora Nemak SA de CV | | 104,653 | 78,660 |
|
| TOTAL MEXICO | | | 7,200,697 |
|
| Netherlands - 1.8% | | | |
| X5 Retail Group NV GDR (Reg. S) (b) | | 32,900 | 1,352,190 |
| Yandex NV Series A (b) | | 168,840 | 5,711,857 |
|
| TOTAL NETHERLANDS | | | 7,064,047 |
|
| Pakistan - 0.2% | | | |
| Habib Bank Ltd. | | 555,800 | 846,825 |
| Panama - 0.7% | | | |
| Copa Holdings SA Class A | | 21,500 | 2,648,585 |
| Philippines - 1.9% | | | |
| International Container Terminal Services, Inc. | | 981,610 | 2,015,150 |
| Metro Pacific Investments Corp. | | 17,193,300 | 2,266,421 |
| Metropolitan Bank & Trust Co. | | 946,390 | 1,588,768 |
| Pilipinas Shell Petroleum Corp. | | 702,480 | 847,707 |
| Robinsons Land Corp. | | 1,562,400 | 763,247 |
|
| TOTAL PHILIPPINES | | | 7,481,293 |
|
| Poland - 0.1% | | | |
| Asseco Poland SA | | 28,700 | 376,101 |
| Russia - 2.0% | | | |
| Bank St. Petersburg PJSC (b) | | 1,263,200 | 1,158,869 |
| Inter Rao Ues JSC | | 18,565,913 | 1,136,242 |
| LSR Group OJSC | | 89,364 | 1,245,411 |
| PhosAgro OJSC GDR (Reg. S) | | 151,500 | 2,083,125 |
| RusHydro PJSC | | 154,100,400 | 2,152,873 |
|
| TOTAL RUSSIA | | | 7,776,520 |
|
| Singapore - 0.6% | | | |
| First Resources Ltd. | | 1,600,200 | 2,312,665 |
| South Africa - 3.2% | | | |
| Bidvest Group Ltd. | | 193,100 | 2,342,262 |
| Discovery Ltd. | | 55,000 | 570,082 |
| EOH Holdings Ltd. | | 76,700 | 571,829 |
| Imperial Holdings Ltd. | | 266,600 | 3,820,787 |
| Pick 'n Pay Stores Ltd. | | 131,400 | 551,111 |
| Reunert Ltd. | | 266,900 | 1,312,720 |
| Sanlam Ltd. | | 150,100 | 750,566 |
| Tiger Brands Ltd. | | 89,600 | 2,446,157 |
|
| TOTAL SOUTH AFRICA | | | 12,365,514 |
|
| Sri Lanka - 0.5% | | | |
| Dialog Axiata PLC | | 8,714,824 | 765,827 |
| Hatton National Bank PLC | | 594,135 | 1,043,434 |
|
| TOTAL SRI LANKA | | | 1,809,261 |
|
| Taiwan - 8.1% | | | |
| Advantech Co. Ltd. | | 156,693 | 1,071,032 |
| Alpha Networks, Inc. | | 1,230,000 | 955,007 |
| Chipbond Technology Corp. | | 416,000 | 811,627 |
| Cleanaway Co. Ltd. | | 277,000 | 1,594,648 |
| CTCI Corp. | | 1,052,000 | 1,631,860 |
| Elite Advanced Laser Corp. | | 247,200 | 1,004,778 |
| Everlight Electronics Co. Ltd. | | 438,000 | 669,251 |
| FLEXium Interconnect, Inc. | | 322,256 | 1,235,005 |
| Hu Lane Associate, Inc. | | 346,000 | 1,974,650 |
| Innolux Corp. | | 1,705,000 | 746,765 |
| Inventec Corp. | | 1,951,000 | 1,514,812 |
| Largan Precision Co. Ltd. | | 9,000 | 1,706,649 |
| Lite-On Technology Corp. | | 1,507,220 | 2,127,952 |
| Long Chen Paper Co. Ltd. | | 1,636,000 | 2,410,193 |
| Powertech Technology, Inc. | | 389,000 | 1,217,158 |
| Radiant Opto-Electronics Corp. | | 903,000 | 2,007,466 |
| St.Shine Optical Co. Ltd. | | 35,000 | 855,896 |
| Sunrex Technology Corp. | | 745,680 | 440,411 |
| Synnex Technology International Corp. | | 1,096,100 | 1,389,310 |
| TCI Co. Ltd. | | 290,851 | 1,978,381 |
| Tong Hsing Electronics Industries Ltd. | | 211,000 | 903,146 |
| Tripod Technology Corp. | | 439,000 | 1,616,862 |
| Vanguard International Semiconductor Corp. | | 313,000 | 594,054 |
| Yuanta Financial Holding Co. Ltd. | | 1,460,000 | 649,147 |
|
| TOTAL TAIWAN | | | 31,106,060 |
|
| Thailand - 2.3% | | | |
| Beauty Community PCL | | 2,594,200 | 1,397,838 |
| Delta Electronics PCL (For. Reg.) | | 277,500 | 718,393 |
| PTT Global Chemical PCL (For. Reg.) | | 1,534,100 | 3,694,401 |
| Star Petroleum Refining PCL | | 6,034,000 | 3,160,494 |
|
| TOTAL THAILAND | | | 8,971,126 |
|
| Turkey - 3.0% | | | |
| Aksa Akrilik Kimya Sanayii | | 1,273,000 | 4,479,854 |
| Bim Birlesik Magazalar A/S JSC | | 99,000 | 2,018,597 |
| Tupras Turkiye Petrol Rafinerileri A/S | | 92,828 | 3,340,149 |
| Turkcell Iletisim Hizmet A/S | | 163,000 | 608,852 |
| Turkiye Garanti Bankasi A/S | | 369,000 | 1,014,530 |
|
| TOTAL TURKEY | | | 11,461,982 |
|
| United Arab Emirates - 0.7% | | | |
| Emaar Properties PJSC | | 1,187,988 | 2,681,557 |
| United Kingdom - 1.5% | | | |
| BGEO Group PLC | | 15,240 | 720,580 |
| NMC Health PLC | | 74,100 | 2,846,188 |
| Shanghai International Airport Co. Ltd. ELS (UBS Warrant Programme) warrants 5/11/18 (c) | | 181,300 | 1,195,478 |
| TBC Bank Group PLC | | 52,053 | 1,183,577 |
|
| TOTAL UNITED KINGDOM | | | 5,945,823 |
|
| United States of America - 0.3% | | | |
| China Rapid Finance Ltd. ADR | | 74,000 | 597,920 |
| Net 1 UEPS Technologies, Inc. (b) | | 39,900 | 364,287 |
|
| TOTAL UNITED STATES OF AMERICA | | | 962,207 |
|
| Vietnam - 0.1% | | | |
| FTP Corp. | | 188,588 | 418,485 |
| TOTAL COMMON STOCKS | | | |
| (Cost $319,119,652) | | | 360,501,057 |
|
| Nonconvertible Preferred Stocks - 4.4% | | | |
| Brazil - 1.3% | | | |
| Banco ABC Brasil SA | | 309,744 | 1,699,601 |
| Banco do Estado Rio Grande do Sul SA | | 170,600 | 794,774 |
| Companhia Paranaense de Energia-Copel (PN-B) sponsored ADR (a) | | 330,320 | 2,540,161 |
|
| TOTAL BRAZIL | | | 5,034,536 |
|
| Korea (South) - 2.7% | | | |
| Hyundai Motor Co. Series 2 | | 71,679 | 7,244,250 |
| LG Chemical Ltd. | | 11,598 | 2,691,806 |
| Samsung Fire & Marine Insurance Co. Ltd. | | 4,066 | 652,762 |
|
| TOTAL KOREA (SOUTH) | | | 10,588,818 |
|
| Russia - 0.4% | | | |
| Sberbank of Russia | | 498,400 | 1,350,998 |
| TOTAL NONCONVERTIBLE PREFERRED STOCKS | | | |
| (Cost $15,084,943) | | | 16,974,352 |
| | | Principal Amount | Value |
|
| Government Obligations - 0.1% | | | |
| United States of America - 0.1% | | | |
| U.S. Treasury Bills, yield at date of purchase 1.01% to 1.07% 12/14/17 to 1/18/18(d) | | | |
| (Cost $469,266) | | 470,000 | 469,287 |
| | | Shares | Value |
|
| Money Market Funds - 5.1% | | | |
| Fidelity Cash Central Fund, 1.10% (e) | | 14,256,928 | 14,259,779 |
| Fidelity Securities Lending Cash Central Fund 1.11% (e)(f) | | 5,240,106 | 5,240,630 |
| TOTAL MONEY MARKET FUNDS | | | |
| (Cost $19,499,398) | | | 19,500,409 |
| TOTAL INVESTMENT IN SECURITIES - 103.3% | | | |
| (Cost $354,173,259) | | | 397,445,105 |
| NET OTHER ASSETS (LIABILITIES) - (3.3)% | | | (12,529,085) |
| NET ASSETS - 100% | | | $384,916,020 |
Security Type Abbreviations
ELS – Equity-Linked Security
Categorizations in the Schedule of Investments are based on country or territory of incorporation.
Legend
(a) Security or a portion of the security is on loan at period end.
(b) Non-income producing
(c) Security exempt from registration under Rule 144A of the Securities Act of 1933. These securities may be resold in transactions exempt from registration, normally to qualified institutional buyers. At the end of the period, the value of these securities amounted to $1,195,478 or 0.3% of net assets.
(d) Security or a portion of the security was pledged to cover margin requirements for futures contracts. At period end, the value of securities pledged amounted to $208,638.
(e) Affiliated fund that is generally available only to investment companies and other accounts managed by Fidelity Investments. The rate quoted is the annualized seven-day yield of the fund at period end. A complete unaudited listing of the fund's holdings as of its most recent quarter end is available upon request. In addition, each Fidelity Central Fund's financial statements, which are not covered by the Fund's Report of Independent Registered Public Accounting Firm, are available on the SEC's website or upon request.
(f) Investment made with cash collateral received from securities on loan.
Affiliated Central Funds
Information regarding fiscal year to date income earned by the Fund from investments in Fidelity Central Funds is as follows:
| Fund | Income earned |
| Fidelity Cash Central Fund | $164,046 |
| Fidelity Securities Lending Cash Central Fund | 90,589 |
| Total | $254,635 |
Investment Valuation
The following is a summary of the inputs used, as of October 31, 2017, involving the Fund's assets and liabilities carried at fair value. The inputs or methodology used for valuing securities may not be an indication of the risk associated with investing in those securities. For more information on valuation inputs, and their aggregation into the levels used below, please refer to the Investment Valuation section in the accompanying Notes to Financial Statements.
| | Valuation Inputs at Reporting Date: |
| Description | Total | Level 1 | Level 2 | Level 3 |
| Investments in Securities: | | | | |
| Equities: | | | | |
| Consumer Discretionary | $67,457,135 | $67,457,135 | $-- | $-- |
| Consumer Staples | 24,266,631 | 24,266,631 | -- | -- |
| Energy | 15,814,633 | 15,814,633 | -- | -- |
| Financials | 43,968,176 | 42,772,698 | 1,195,478 | -- |
| Health Care | 27,152,464 | 27,152,464 | -- | -- |
| Industrials | 45,746,708 | 45,746,708 | -- | -- |
| Information Technology | 71,315,477 | 71,315,477 | -- | -- |
| Materials | 39,155,675 | 39,155,675 | -- | -- |
| Real Estate | 27,911,944 | 27,911,944 | -- | -- |
| Telecommunication Services | 2,667,310 | 2,667,310 | -- | -- |
| Utilities | 12,019,256 | 12,019,256 | -- | -- |
| Government Obligations | 469,287 | -- | 469,287 | -- |
| Money Market Funds | 19,500,409 | 19,500,409 | -- | -- |
| Total Investments in Securities: | $397,445,105 | $395,780,340 | $1,664,765 | $-- |
See accompanying notes which are an integral part of the financial statements.
Financial Statements
Statement of Assets and Liabilities
| | | October 31, 2017 |
| Assets | | |
Investment in securities, at value (including securities loaned of $5,121,917) — See accompanying schedule:
Unaffiliated issuers (cost $334,673,861) | $377,944,696 | |
| Fidelity Central Funds (cost $19,499,398) | 19,500,409 | |
| Total Investment in Securities (cost $354,173,259) | | $397,445,105 |
| Cash | | 72,507 |
| Foreign currency held at value (cost $187,194) | | 187,194 |
| Receivable for investments sold | | 437,179 |
| Receivable for fund shares sold | | 639,686 |
| Dividends receivable | | 107,477 |
| Distributions receivable from Fidelity Central Funds | | 23,847 |
| Receivable for daily variation margin on futures contracts | | 37,257 |
| Prepaid expenses | | 712 |
| Other receivables | | 67,666 |
| Total assets | | 399,018,630 |
| Liabilities | | |
| Payable for investments purchased | $6,393,204 | |
| Payable for fund shares redeemed | 1,320,878 | |
| Accrued management fee | 271,675 | |
| Distribution and service plan fees payable | 18,513 | |
| Other affiliated payables | 81,679 | |
| Other payables and accrued expenses | 776,186 | |
| Collateral on securities loaned | 5,240,475 | |
| Total liabilities | | 14,102,610 |
| Net Assets | | $384,916,020 |
| Net Assets consist of: | | |
| Paid in capital | | $336,513,781 |
| Undistributed net investment income | | 2,568,661 |
| Accumulated undistributed net realized gain (loss) on investments and foreign currency transactions | | 3,187,397 |
| Net unrealized appreciation (depreciation) on investments and assets and liabilities in foreign currencies | | 42,646,181 |
| Net Assets | | $384,916,020 |
| Calculation of Maximum Offering Price | | |
| Class A: | | |
| Net Asset Value and redemption price per share ($16,061,739 ÷ 1,068,936 shares) | | $15.03 |
| Maximum offering price per share (100/94.25 of $15.03) | | $15.95 |
| Class M: | | |
| Net Asset Value and redemption price per share ($9,392,565 ÷ 628,889 shares) | | $14.94 |
| Maximum offering price per share (100/96.50 of $14.94) | | $15.48 |
| Class C: | | |
| Net Asset Value and offering price per share ($14,168,018 ÷ 967,701 shares)(a) | | $14.64 |
| Emerging Markets Discovery: | | |
| Net Asset Value, offering price and redemption price per share ($248,123,708 ÷ 16,412,386 shares) | | $15.12 |
| Class I: | | |
| Net Asset Value, offering price and redemption price per share ($97,169,990 ÷ 6,412,820 shares) | | $15.15 |
(a) Redemption price per share is equal to net asset value less any applicable contingent deferred sales charge.
See accompanying notes which are an integral part of the financial statements.
Statement of Operations
| | | Year ended October 31, 2017 |
| Investment Income | | |
| Dividends | | $6,098,741 |
| Interest | | 4,780 |
| Income from Fidelity Central Funds | | 254,635 |
| Income before foreign taxes withheld | | 6,358,156 |
| Less foreign taxes withheld | | (514,794) |
| Total income | | 5,843,362 |
| Expenses | | |
| Management fee | $1,849,026 | |
| Transfer agent fees | 468,824 | |
| Distribution and service plan fees | 125,838 | |
| Accounting and security lending fees | 114,042 | |
| Custodian fees and expenses | 319,103 | |
| Independent trustees' fees and expenses | 749 | |
| Registration fees | 138,598 | |
| Audit | 93,370 | |
| Legal | 255 | |
| Miscellaneous | 1,586 | |
| Total expenses before reductions | 3,111,391 | |
| Expense reductions | (35,474) | 3,075,917 |
| Net investment income (loss) | | 2,767,445 |
| Realized and Unrealized Gain (Loss) | | |
| Net realized gain (loss) on: | | |
| Investment securities: | | |
| Unaffiliated issuers (net of foreign taxes of $1,306) | 6,434,526 | |
| Fidelity Central Funds | (56) | |
| Foreign currency transactions | (155,885) | |
| Futures contracts | 2,813,041 | |
| Total net realized gain (loss) | | 9,091,626 |
| Change in net unrealized appreciation (depreciation) on: | | |
| Unaffiliated issuers (net of increase in deferred foreign taxes of $382,523) | 38,809,170 | |
| Fidelity Central Funds | (942) | |
| Assets and liabilities in foreign currencies | (3,037) | |
| Futures contracts | 33,134 | |
| Total change in net unrealized appreciation (depreciation) | | 38,838,325 |
| Net gain (loss) | | 47,929,951 |
| Net increase (decrease) in net assets resulting from operations | | $50,697,396 |
See accompanying notes which are an integral part of the financial statements.
Statement of Changes in Net Assets
| | Year ended October 31, 2017 | Year ended October 31, 2016 |
| Increase (Decrease) in Net Assets | | |
| Operations | | |
| Net investment income (loss) | $2,767,445 | $715,896 |
| Net realized gain (loss) | 9,091,626 | (2,841,874) |
| Change in net unrealized appreciation (depreciation) | 38,838,325 | 10,693,560 |
| Net increase (decrease) in net assets resulting from operations | 50,697,396 | 8,567,582 |
| Distributions to shareholders from net investment income | (659,806) | (490,717) |
| Distributions to shareholders from net realized gain | (485,420) | – |
| Total distributions | (1,145,226) | (490,717) |
| Share transactions - net increase (decrease) | 249,358,868 | 6,360,074 |
| Redemption fees | 166,495 | 41,424 |
| Total increase (decrease) in net assets | 299,077,533 | 14,478,363 |
| Net Assets | | |
| Beginning of period | 85,838,487 | 71,360,124 |
| End of period | $384,916,020 | $85,838,487 |
| Other Information | | |
| Undistributed net investment income end of period | $2,568,661 | $593,159 |
See accompanying notes which are an integral part of the financial statements.
Financial Highlights
Fidelity Emerging Markets Discovery Fund Class A
| Years ended October 31, | 2017 | 2016 | 2015 | 2014 | 2013 |
| Selected Per–Share Data | | | | | |
| Net asset value, beginning of period | $12.27 | $10.92 | $12.17 | $12.49 | $11.89 |
| Income from Investment Operations | | | | | |
| Net investment income (loss)A | .14 | .09 | .09B | .04 | .08 |
| Net realized and unrealized gain (loss) | 2.74 | 1.30 | (1.34) | (.01) | .75 |
| Total from investment operations | 2.88 | 1.39 | (1.25) | .03 | .83 |
| Distributions from net investment income | (.07) | (.05) | – | (.06) | (.04) |
| Distributions from net realized gain | (.06) | – | – | (.30) | (.20) |
| Total distributions | (.13) | (.05) | – | (.36) | (.25)C |
| Redemption fees added to paid in capitalA | .01 | .01 | –D | .01 | .02 |
| Net asset value, end of period | $15.03 | $12.27 | $10.92 | $12.17 | $12.49 |
| Total ReturnE,F | 23.89% | 12.93% | (10.27)% | .31% | 7.20% |
| Ratios to Average Net AssetsG,H | | | | | |
| Expenses before reductions | 1.63% | 1.89% | 1.88% | 1.82% | 1.87% |
| Expenses net of fee waivers, if any | 1.63% | 1.70% | 1.70% | 1.70% | 1.70% |
| Expenses net of all reductions | 1.62% | 1.70% | 1.69% | 1.70% | 1.64% |
| Net investment income (loss) | 1.03% | .85% | .76%B | .29% | .62% |
| Supplemental Data | | | | | |
| Net assets, end of period (000 omitted) | $16,062 | $5,252 | $4,660 | $4,362 | $5,065 |
| Portfolio turnover rateI | 58% | 60% | 103% | 148% | 179% |
A Calculated based on average shares outstanding during the period.
B Net Investment income per share reflects a large, non-recurring dividend which amounted to $.06 per share. Excluding this non-recurring dividend, the ratio of net investment income (loss) to average net assets would have been .22%.
C Total distributions of $.25 per share is comprised of distributions from net investment income of $.044 and distributions from net realized gain of $.203 per share.
D Amount represents less than $.005 per share.
E Total returns would have been lower if certain expenses had not been reduced during the applicable periods shown.
F Total returns do not include the effect of the sales charges.
G Fees and expenses of any underlying Fidelity Central Funds are not included in the Fund's expense ratio. The Fund indirectly bears its proportionate share of the expenses of any underlying Fidelity Central Funds.
H Expense ratios reflect operating expenses of the class. Expenses before reductions do not reflect amounts reimbursed by the investment adviser or reductions from brokerage service arrangements or reductions from other expense offset arrangements and do not represent the amount paid by the class during periods when reimbursements or reductions occur. Expenses net of fee waivers reflect expenses after reimbursement by the investment adviser but prior to reductions from brokerage service arrangements or other expense offset arrangements. Expenses net of all reductions represent the net expenses paid by the class.
I Amount does not include the portfolio activity of any underlying Fidelity Central Funds.
See accompanying notes which are an integral part of the financial statements.
Fidelity Emerging Markets Discovery Fund Class M
| Years ended October 31, | 2017 | 2016 | 2015 | 2014 | 2013 |
| Selected Per–Share Data | | | | | |
| Net asset value, beginning of period | $12.20 | $10.86 | $12.13 | $12.44 | $11.87 |
| Income from Investment Operations | | | | | |
| Net investment income (loss)A | .10 | .07 | .06B | –C | .05 |
| Net realized and unrealized gain (loss) | 2.74 | 1.28 | (1.33) | –C | .74 |
| Total from investment operations | 2.84 | 1.35 | (1.27) | –C | .79 |
| Distributions from net investment income | (.04) | (.02) | – | (.02) | (.03) |
| Distributions from net realized gain | (.06) | – | – | (.30) | (.20) |
| Total distributions | (.11)D | (.02) | – | (.32) | (.24)E |
| Redemption fees added to paid in capitalA | .01 | .01 | –C | .01 | .02 |
| Net asset value, end of period | $14.94 | $12.20 | $10.86 | $12.13 | $12.44 |
| Total ReturnF,G | 23.63% | 12.58% | (10.47)% | .05% | 6.87% |
| Ratios to Average Net AssetsH,I | | | | | |
| Expenses before reductions | 1.92% | 2.17% | 2.16% | 2.10% | 2.19% |
| Expenses net of fee waivers, if any | 1.92% | 1.95% | 1.95% | 1.95% | 1.95% |
| Expenses net of all reductions | 1.90% | 1.94% | 1.94% | 1.95% | 1.89% |
| Net investment income (loss) | .74% | .60% | .51%B | .04% | .37% |
| Supplemental Data | | | | | |
| Net assets, end of period (000 omitted) | $9,393 | $2,868 | $2,015 | $2,031 | $1,914 |
| Portfolio turnover rateJ | 58% | 60% | 103% | 148% | 179% |
A Calculated based on average shares outstanding during the period.
B Net Investment income per share reflects a large, non-recurring dividend which amounted to $.06 per share. Excluding this non-recurring dividend, the ratio of net investment income (loss) to average net assets would have been (.03) %.
C Amount represents less than $.005 per share.
D Total distributions of $.11 per share is comprised of distributions from net investment income of $.044 and distributions from net realized gain of $.064 per share.
E Total distributions of $.24 per share is comprised of distributions from net investment income of $.034 and distributions from net realized gain of $.203 per share.
F Total returns would have been lower if certain expenses had not been reduced during the applicable periods shown.
G Total returns do not include the effect of the sales charges.
H Fees and expenses of any underlying Fidelity Central Funds are not included in the Fund's expense ratio. The Fund indirectly bears its proportionate share of the expenses of any underlying Fidelity Central Funds.
I Expense ratios reflect operating expenses of the class. Expenses before reductions do not reflect amounts reimbursed by the investment adviser or reductions from brokerage service arrangements or reductions from other expense offset arrangements and do not represent the amount paid by the class during periods when reimbursements or reductions occur. Expenses net of fee waivers reflect expenses after reimbursement by the investment adviser but prior to reductions from brokerage service arrangements or other expense offset arrangements. Expenses net of all reductions represent the net expenses paid by the class.
J Amount does not include the portfolio activity of any underlying Fidelity Central Funds.
See accompanying notes which are an integral part of the financial statements.
Fidelity Emerging Markets Discovery Fund Class C
| Years ended October 31, | 2017 | 2016 | 2015 | 2014 | 2013 |
| Selected Per–Share Data | | | | | |
| Net asset value, beginning of period | $11.97 | $10.69 | $12.00 | $12.35 | $11.82 |
| Income from Investment Operations | | | | | |
| Net investment income (loss)A | .04 | .01 | –B,C | (.06) | (.02) |
| Net realized and unrealized gain (loss) | 2.69 | 1.26 | (1.31) | –C | .74 |
| Total from investment operations | 2.73 | 1.27 | (1.31) | (.06) | .72 |
| Distributions from net investment income | (.01) | – | – | – | (.01) |
| Distributions from net realized gain | (.06) | – | – | (.30) | (.20) |
| Total distributions | (.07) | – | – | (.30) | (.21) |
| Redemption fees added to paid in capitalA | .01 | .01 | –C | .01 | .02 |
| Net asset value, end of period | $14.64 | $11.97 | $10.69 | $12.00 | $12.35 |
| Total ReturnD,E | 23.02% | 11.97% | (10.92)% | (.42)% | 6.32% |
| Ratios to Average Net AssetsF,G | | | | | |
| Expenses before reductions | 2.38% | 2.63% | 2.64% | 2.58% | 2.70% |
| Expenses net of fee waivers, if any | 2.38% | 2.45% | 2.45% | 2.45% | 2.45% |
| Expenses net of all reductions | 2.37% | 2.44% | 2.44% | 2.45% | 2.39% |
| Net investment income (loss) | .28% | .10% | .01%B | (.46)% | (.13)% |
| Supplemental Data | | | | | |
| Net assets, end of period (000 omitted) | $14,168 | $2,203 | $1,675 | $1,750 | $2,082 |
| Portfolio turnover rateH | 58% | 60% | 103% | 148% | 179% |
A Calculated based on average shares outstanding during the period.
B Net Investment income per share reflects a large, non-recurring dividend which amounted to $.06 per share. Excluding this non-recurring dividend, the ratio of net investment income (loss) to average net assets would have been (.52) %.
C Amount represents less than $.005 per share.
D Total returns would have been lower if certain expenses had not been reduced during the applicable periods shown.
E Total returns do not include the effect of the contingent deferred sales charge.
F Fees and expenses of any underlying Fidelity Central Funds are not included in the Fund's expense ratio. The Fund indirectly bears its proportionate share of the expenses of any underlying Fidelity Central Funds.
G Expense ratios reflect operating expenses of the class. Expenses before reductions do not reflect amounts reimbursed by the investment adviser or reductions from brokerage service arrangements or reductions from other expense offset arrangements and do not represent the amount paid by the class during periods when reimbursements or reductions occur. Expenses net of fee waivers reflect expenses after reimbursement by the investment adviser but prior to reductions from brokerage service arrangements or other expense offset arrangements. Expenses net of all reductions represent the net expenses paid by the class.
H Amount does not include the portfolio activity of any underlying Fidelity Central Funds.
See accompanying notes which are an integral part of the financial statements.
Fidelity Emerging Markets Discovery Fund
| Years ended October 31, | 2017 | 2016 | 2015 | 2014 | 2013 |
| Selected Per–Share Data | | | | | |
| Net asset value, beginning of period | $12.33 | $10.98 | $12.21 | $12.52 | $11.92 |
| Income from Investment Operations | | | | | |
| Net investment income (loss)A | .18 | .12 | .12B | .07 | .11 |
| Net realized and unrealized gain (loss) | 2.76 | 1.31 | (1.35) | –C | .74 |
| Total from investment operations | 2.94 | 1.43 | (1.23) | .07 | .85 |
| Distributions from net investment income | (.09) | (.09) | – | (.09) | (.07) |
| Distributions from net realized gain | (.06) | – | – | (.30) | (.20) |
| Total distributions | (.16)D | (.09) | – | (.39) | (.27) |
| Redemption fees added to paid in capitalA | .01 | .01 | –C | .01 | .02 |
| Net asset value, end of period | $15.12 | $12.33 | $10.98 | $12.21 | $12.52 |
| Total ReturnE | 24.30% | 13.19% | (10.07)% | .61% | 7.37% |
| Ratios to Average Net AssetsF,G | | | | | |
| Expenses before reductions | 1.35% | 1.55% | 1.56% | 1.48% | 1.57% |
| Expenses net of fee waivers, if any | 1.35% | 1.45% | 1.45% | 1.45% | 1.45% |
| Expenses net of all reductions | 1.34% | 1.44% | 1.44% | 1.45% | 1.39% |
| Net investment income (loss) | 1.31% | 1.10% | 1.01%B | .54% | .87% |
| Supplemental Data | | | | | |
| Net assets, end of period (000 omitted) | $248,124 | $67,178 | $61,601 | $78,377 | $96,731 |
| Portfolio turnover rateH | 58% | 60% | 103% | 148% | 179% |
A Calculated based on average shares outstanding during the period.
B Net Investment income per share reflects a large, non-recurring dividend which amounted to $.06 per share. Excluding this non-recurring dividend, the ratio of net investment income (loss) to average net assets would have been .48%.
C Amount represents less than $.005 per share.
D Total distributions of $.16 per share is comprised of distributions from net investment income of $.091 and distributions from net realized gain of $.064 per share.
E Total returns would have been lower if certain expenses had not been reduced during the applicable periods shown.
F Fees and expenses of any underlying Fidelity Central Funds are not included in the Fund's expense ratio. The Fund indirectly bears its proportionate share of the expenses of any underlying Fidelity Central Funds.
G Expense ratios reflect operating expenses of the class. Expenses before reductions do not reflect amounts reimbursed by the investment adviser or reductions from brokerage service arrangements or reductions from other expense offset arrangements and do not represent the amount paid by the class during periods when reimbursements or reductions occur. Expenses net of fee waivers reflect expenses after reimbursement by the investment adviser but prior to reductions from brokerage service arrangements or other expense offset arrangements. Expenses net of all reductions represent the net expenses paid by the class.
H Amount does not include the portfolio activity of any underlying Fidelity Central Funds.
See accompanying notes which are an integral part of the financial statements.
Fidelity Emerging Markets Discovery Fund Class I
| Years ended October 31, | 2017 | 2016 | 2015 | 2014 | 2013 |
| Selected Per–Share Data | | | | | |
| Net asset value, beginning of period | $12.37 | $11.02 | $12.25 | $12.53 | $11.92 |
| Income from Investment Operations | | | | | |
| Net investment income (loss)A | .19 | .13 | .12B | .07 | .11 |
| Net realized and unrealized gain (loss) | 2.75 | 1.30 | (1.35) | –C | .75 |
| Total from investment operations | 2.94 | 1.43 | (1.23) | .07 | .86 |
| Distributions from net investment income | (.10) | (.09) | – | (.06) | (.07) |
| Distributions from net realized gain | (.06) | – | – | (.30) | (.20) |
| Total distributions | (.17)D | (.09) | – | (.36) | (.27) |
| Redemption fees added to paid in capitalA | .01 | .01 | –C | .01 | .02 |
| Net asset value, end of period | $15.15 | $12.37 | $11.02 | $12.25 | $12.53 |
| Total ReturnE | 24.25% | 13.16% | (10.04)% | .61% | 7.45% |
| Ratios to Average Net AssetsF,G | | | | | |
| Expenses before reductions | 1.32% | 1.59% | 1.54% | 1.56% | 1.60% |
| Expenses net of fee waivers, if any | 1.32% | 1.45% | 1.45% | 1.45% | 1.45% |
| Expenses net of all reductions | 1.30% | 1.44% | 1.43% | 1.45% | 1.39% |
| Net investment income (loss) | 1.34% | 1.10% | 1.01%B | .54% | .87% |
| Supplemental Data | | | | | |
| Net assets, end of period (000 omitted) | $97,170 | $8,337 | $1,410 | $481 | $1,076 |
| Portfolio turnover rateH | 58% | 60% | 103% | 148% | 179% |
A Calculated based on average shares outstanding during the period.
B Net Investment income per share reflects a large, non-recurring dividend which amounted to $.06 per share. Excluding this non-recurring dividend, the ratio of net investment income (loss) to average net assets would have been .48%.
C Amount represents less than $.005 per share.
D Total distributions of $.17 per share is comprised of distributions from net investment income of $.101 distributions from net realized gain of $.064 per share.
E Total returns would have been lower if certain expenses had not been reduced during the applicable periods shown.
F Fees and expenses of any underlying Fidelity Central Funds are not included in the Fund's expense ratio. The Fund indirectly bears its proportionate share of the expenses of any underlying Fidelity Central Funds.
G Expense ratios reflect operating expenses of the class. Expenses before reductions do not reflect amounts reimbursed by the investment adviser or reductions from brokerage service arrangements or reductions from other expense offset arrangements and do not represent the amount paid by the class during periods when reimbursements or reductions occur. Expenses net of fee waivers reflect expenses after reimbursement by the investment adviser but prior to reductions from brokerage service arrangements or other expense offset arrangements. Expenses net of all reductions represent the net expenses paid by the class.
H Amount does not include the portfolio activity of any underlying Fidelity Central Funds.
See accompanying notes which are an integral part of the financial statements.
Notes to Financial Statements
For the period ended October 31, 2017
1. Organization.
Fidelity Emerging Markets Discovery Fund (the Fund) is a fund of Fidelity Investment Trust (the Trust) and is authorized to issue an unlimited number of shares. The Trust is registered under the Investment Company Act of 1940, as amended (the 1940 Act), as an open-end management investment company organized as a Massachusetts business trust. The Fund offers Class A, Class M (formerly Class T), Class C, Emerging Markets Discovery and Class I shares, each of which has equal rights as to assets and voting privileges. Each class has exclusive voting rights with respect to matters that affect that class. The Fund's investments in emerging markets can be subject to social, economic, regulatory, and political uncertainties and can be extremely volatile.
2. Investments in Fidelity Central Funds.
The Fund invests in Fidelity Central Funds, which are open-end investment companies generally available only to other investment companies and accounts managed by the investment adviser and its affiliates. The Fund's Schedule of Investments lists each of the Fidelity Central Funds held as of period end, if any, as an investment of the Fund, but does not include the underlying holdings of each Fidelity Central Fund. As an Investing Fund, the Fund indirectly bears its proportionate share of the expenses of the underlying Fidelity Central Funds.
The Money Market Central Funds seek preservation of capital and current income and are managed by Fidelity Investments Money Management, Inc. (FIMM), an affiliate of the investment adviser. Annualized expenses of the Money Market Central Funds as of their most recent shareholder report date are less than .005%.
A complete unaudited list of holdings for each Fidelity Central Fund is available upon request or at the Securities and Exchange Commission (the SEC) website at www.sec.gov. In addition, the financial statements of the Fidelity Central Funds, which are not covered by the Fund's Report of Independent Registered Public Accounting Firm, are available on the SEC website or upon request.
3. Significant Accounting Policies.
The Fund is an investment company and applies the accounting and reporting guidance of the Financial Accounting Standards Board (FASB) Accounting Standards Codification Topic 946 Financial Services – Investments Companies. The financial statements have been prepared in conformity with accounting principles generally accepted in the United States of America (GAAP), which require management to make certain estimates and assumptions at the date of the financial statements. Actual results could differ from those estimates. Subsequent events, if any, through the date that the financial statements were issued have been evaluated in the preparation of the financial statements. The following summarizes the significant accounting policies of the Fund:
Investment Valuation. Investments are valued as of 4:00 p.m. Eastern time on the last calendar day of the period. The Board of Trustees (the Board) has delegated the day to day responsibility for the valuation of the Fund's investments to the Fair Value Committee (the Committee) established by the Fund's investment adviser. In accordance with valuation policies and procedures approved by the Board, the Fund attempts to obtain prices from one or more third party pricing vendors or brokers to value its investments. When current market prices, quotations or currency exchange rates are not readily available or reliable, investments will be fair valued in good faith by the Committee, in accordance with procedures adopted by the Board. Factors used in determining fair value vary by investment type and may include market or investment specific events, changes in interest rates and credit quality. The frequency with which these procedures are used cannot be predicted and they may be utilized to a significant extent. The Committee oversees the Fund's valuation policies and procedures and reports to the Board on the Committee's activities and fair value determinations. The Board monitors the appropriateness of the procedures used in valuing the Fund's investments and ratifies the fair value determinations of the Committee.
The Fund categorizes the inputs to valuation techniques used to value its investments into a disclosure hierarchy consisting of three levels as shown below:
- Level 1 – quoted prices in active markets for identical investments
- Level 2 – other significant observable inputs (including quoted prices for similar investments, interest rates, prepayment speeds, etc.)
- Level 3 – unobservable inputs (including the Fund's own assumptions based on the best information available)
Valuation techniques used to value the Fund's investments by major category are as follows:
Equity securities, including restricted securities, for which market quotations are readily available, are valued at the last reported sale price or official closing price as reported by a third party pricing vendor on the primary market or exchange on which they are traded and are categorized as Level 1 in the hierarchy. In the event there were no sales during the day or closing prices are not available, securities are valued at the last quoted bid price or may be valued using the last available price and are generally categorized as Level 2 in the hierarchy. For foreign equity securities, when market or security specific events arise, comparisons to the valuation of American Depositary Receipts (ADRs), futures contracts, Exchange-Traded Funds (ETFs) and certain indexes as well as quoted prices for similar securities may be used and would be categorized as Level 2 in the hierarchy. Utilizing these techniques may result in transfers between Level 1 and Level 2. For equity securities, including restricted securities, where observable inputs are limited, assumptions about market activity and risk are used and these securities may be categorized as Level 3 in the hierarchy.
Debt securities, including restricted securities, are valued based on evaluated prices received from third party pricing vendors or from brokers who make markets in such securities. U.S. government and government agency obligations are valued by pricing vendors who utilize matrix pricing which considers yield or price of bonds of comparable quality, coupon, maturity and type or by broker-supplied prices. When independent prices are unavailable or unreliable, debt securities may be valued utilizing pricing methodologies which consider similar factors that would be used by third party pricing vendors. Debt securities are generally categorized as Level 2 in the hierarchy but may be Level 3 depending on the circumstances.
Investments in open-end mutual funds, including the Fidelity Central Funds, are valued at their closing net asset value (NAV) each business day and are categorized as Level 1 in the hierarchy.
Changes in valuation techniques may result in transfers in or out of an assigned level within the disclosure hierarchy. The aggregate value of investments by input level as of October 31, 2017, is included at the end of the Fund's Schedule of Investments.
Foreign Currency. The Fund may use foreign currency contracts to facilitate transactions in foreign-denominated securities. Gains and losses from these transactions may arise from changes in the value of the foreign currency or if the counterparties do not perform under the contracts' terms.
Foreign-denominated assets, including investment securities, and liabilities are translated into U.S. dollars at the exchange rates at period end. Purchases and sales of investment securities, income and dividends received and expenses denominated in foreign currencies are translated into U.S. dollars at the exchange rate in effect on the transaction date.
The effects of exchange rate fluctuations on investments are included with the net realized and unrealized gain (loss) on investment securities. Other foreign currency transactions resulting in realized and unrealized gain (loss) are disclosed separately.
Investment Transactions and Income. For financial reporting purposes, the Fund's investment holdings and NAV include trades executed through the end of the last business day of the period. The NAV per share for processing shareholder transactions is calculated as of the close of business of the New York Stock Exchange (NYSE), normally 4:00 p.m. Eastern time and includes trades executed through the end of the prior business day. Gains and losses on securities sold are determined on the basis of identified cost. Dividend income is recorded on the ex-dividend date, except for certain dividends from foreign securities where the ex-dividend date may have passed, which are recorded as soon as the Fund is informed of the ex-dividend date. Non-cash dividends included in dividend income, if any, are recorded at the fair market value of the securities received. Income and capital gain distributions from Fidelity Central Funds, if any, are recorded on the ex-dividend date. Interest income is accrued as earned and includes coupon interest and amortization of premium and accretion of discount on debt securities as applicable. Investment income is recorded net of foreign taxes withheld where recovery of such taxes is uncertain.
Class Allocations and Expenses. Investment income, realized and unrealized capital gains and losses, common expenses of the Fund, and certain fund-level expense reductions, if any, are allocated daily on a pro-rata basis to each class based on the relative net assets of each class to the total net assets of the Fund. Each class differs with respect to transfer agent and distribution and service plan fees incurred. Certain expense reductions may also differ by class. For the reporting period, the allocated portion of income and expenses to each class as a percent of its average net assets may vary due to the timing of recording these transactions in relation to fluctuating net assets of the classes. Expenses directly attributable to a fund are charged to that fund. Expenses attributable to more than one fund are allocated among the respective funds on the basis of relative net assets or other appropriate methods. Expense estimates are accrued in the period to which they relate and adjustments are made when actual amounts are known.
Income Tax Information and Distributions to Shareholders. Each year, the Fund intends to qualify as a regulated investment company under Subchapter M of the Internal Revenue Code, including distributing substantially all of its taxable income and realized gains. As a result, no provision for U.S. Federal income taxes is required. As of October 31, 2017, the Fund did not have any unrecognized tax benefits in the financial statements; nor is the Fund aware of any tax positions for which it is reasonably possible that the total amounts of unrecognized tax benefits will significantly change in the next twelve months. The Fund files a U.S. federal tax return, in addition to state and local tax returns as required. The Fund's federal income tax returns are subject to examination by the Internal Revenue Service (IRS) for a period of three fiscal years after they are filed. State and local tax returns may be subject to examination for an additional fiscal year depending on the jurisdiction. Foreign taxes are provided for based on the Fund's understanding of the tax rules and rates that exist in the foreign markets in which it invests. The Fund is subject to a tax imposed on capital gains by certain countries in which it invests. An estimated deferred tax liability for net unrealized appreciation on the applicable securities is included in Other payables and accrued expenses on the Statement of Assets & Liabilities.
Distributions are declared and recorded on the ex-dividend date. Income dividends and capital gain distributions are declared separately for each class. Income and capital gain distributions are determined in accordance with income tax regulations, which may differ from GAAP. In addition, the Fund claimed a portion of the payment made to redeeming shareholders as a distribution for income tax purposes.
Capital accounts within the financial statements are adjusted for permanent book-tax differences. These adjustments have no impact on net assets or the results of operations. Capital accounts are not adjusted for temporary book-tax differences which will reverse in a subsequent period.
Book-tax differences are primarily due to foreign currency transactions, futures transactions, certain foreign taxes, passive foreign investment companies (PFIC), market discount, capital loss carryforwards and losses deferred due to wash sales.
As of period end, the cost and unrealized appreciation (depreciation) in securities, and derivatives if applicable, for federal income tax purposes were as follows:
| Gross unrealized appreciation | $49,938,309 |
| Gross unrealized depreciation | (9,946,639) |
| Net unrealized appreciation (depreciation) | $39,991,670 |
| Tax Cost | $357,453,435 |
The tax-based components of distributable earnings as of period end were as follows:
| Undistributed ordinary income | $6,457,523 |
| Undistributed long-term capital gain | $2,579,433 |
| Net unrealized appreciation (depreciation) on securities and other investments | $39,989,357 |
The tax character of distributions paid was as follows:
| | October 31, 2017 | October 31, 2016 |
| Ordinary Income | $1,145,226 | $ 490,717 |
Short-Term Trading (Redemption) Fees. Shares held by investors in the Fund less than 90 days may have been subject to a redemption fee equal to 2.00% of the NAV of shares redeemed. All redemption fees, which reduce the proceeds of the shareholder redemption, are retained by the Fund and accounted for as an addition to paid in capital. In November 2017, the Board of Trustees approved the elimination of these redemption fees effective December 18, 2017.
Restricted Securities. The Fund may invest in securities that are subject to legal or contractual restrictions on resale. These securities generally may be resold in transactions exempt from registration or to the public if the securities are registered. Disposal of these securities may involve time-consuming negotiations and expense, and prompt sale at an acceptable price may be difficult. Information regarding restricted securities is included at the end of the Fund's Schedule of Investments.
4. Derivative Instruments.
Risk Exposures and the Use of Derivative Instruments. The Fund's investment objective allows the Fund to enter into various types of derivative contracts, including futures contracts. Derivatives are investments whose value is primarily derived from underlying assets, indices or reference rates and may be transacted on an exchange or over-the-counter (OTC). Derivatives may involve a future commitment to buy or sell a specified asset based on specified terms, to exchange future cash flows at periodic intervals based on a notional principal amount, or for one party to make one or more payments upon the occurrence of specified events in exchange for periodic payments from the other party.
The Fund used derivatives to increase returns and to manage exposure to certain risks as defined below. The success of any strategy involving derivatives depends on analysis of numerous economic factors, and if the strategies for investment do not work as intended, the Fund may not achieve its objectives.
The Fund's use of derivatives increased or decreased its exposure to the following risk:
| Equity Risk | Equity risk relates to the fluctuations in the value of financial instruments as a result of changes in market prices (other than those arising from interest rate risk or foreign exchange risk), whether caused by factors specific to an individual investment, its issuer, or all factors affecting all instruments traded in a market or market segment.
|
The Fund is also exposed to additional risks from investing in derivatives, such as liquidity risk and counterparty credit risk. Liquidity risk is the risk that the Fund will be unable to close out the derivative in the open market in a timely manner. Counterparty credit risk is the risk that the counterparty will not be able to fulfill its obligation to the Fund. Counterparty credit risk related to exchange-traded futures contracts may be mitigated by the protection provided by the exchange on which they trade.
Investing in derivatives may involve greater risks than investing in the underlying assets directly and, to varying degrees, may involve risk of loss in excess of any initial investment and collateral received and amounts recognized in the Statement of Assets and Liabilities. In addition, there may be the risk that the change in value of the derivative contract does not correspond to the change in value of the underlying instrument.
Futures Contracts. A futures contract is an agreement between two parties to buy or sell a specified underlying instrument for a fixed price at a specified future date. The Fund used futures contracts to manage its exposure to the stock market.
Upon entering into a futures contract, a fund is required to deposit either cash or securities (initial margin) with a clearing broker in an amount equal to a certain percentage of the face value of the contract. Futures contracts are marked-to-market daily and subsequent daily payments (variation margin) are made or received by a fund depending on the daily fluctuations in the value of the futures contracts and are recorded as unrealized appreciation or (depreciation). This receivable and/or payable, if any, is included in daily variation margin on futures contracts in the Statement of Assets and Liabilities. Realized gain or (loss) is recorded upon the expiration or closing of a futures contract. The net realized gain (loss) and change in net unrealized appreciation (depreciation) on futures contracts during the period is presented in the Statement of Operations.
Any open futures contracts at period end are presented in the Schedule of Investments under the caption "Futures Contracts". The notional amount at value reflects each contract's exposure to the underlying instrument or index at period end. For the period, the average monthly notional amount at value for futures contracts in the aggregate was $8,804,090.
5. Purchases and Sales of Investments.
Purchases and sales of securities, other than short-term securities, aggregated $371,838,027 and $117,421,083, respectively.
6. Fees and Other Transactions with Affiliates.
Management Fee. Fidelity Management & Research Company (the investment adviser) and its affiliates provide the Fund with investment management related services for which the Fund pays a monthly management fee. The management fee is the sum of an individual fund fee rate that is based on an annual rate of .60% of the Fund's average net assets and an annualized group fee rate that averaged .25% during the period. The group fee rate is based upon the average net assets of all the mutual funds advised by the investment adviser, including any mutual funds previously advised by the investment adviser that are currently advised by Fidelity SelectCo, LLC, an affiliate of the investment adviser. The group fee rate decreases as assets under management increase and increases as assets under management decrease. For the reporting period, the total annual management fee rate was .84% of the Fund's average net assets.
Distribution and Service Plan Fees. In accordance with Rule 12b-1 of the 1940 Act, the Fund has adopted separate Distribution and Service Plans for each class of shares. Certain classes pay Fidelity Distributors Corporation (FDC), an affiliate of the investment adviser, separate Distribution and Service Fees, each of which is based on an annual percentage of each class' average net assets. In addition, FDC may pay financial intermediaries for selling shares of the Fund and providing shareholder support services. For the period, the Distribution and Service Fee rates, total fees and amounts retained by FDC were as follows:
| | Distribution
Fee | Service
Fee | Total Fees | Retained
by FDC |
| Class A | -% | .25% | $24,747 | $854 |
| Class M | .25% | .25% | 30,468 | – |
| Class C | .75% | .25% | 70,623 | 29,035 |
| | | | $125,838 | $29,889 |
Sales Load. FDC may receive a front-end sales charge of up to 5.75% for selling Class A shares and 3.50% for selling Class M shares, some of which is paid to financial intermediaries for selling shares of the Fund. Depending on the holding period, FDC may receive contingent deferred sales charges levied on Class A, Class M and Class C redemptions. The deferred sales charges are 1.00% for Class C shares, 1.00% for certain purchases of Class A shares and .25% for certain purchases of Class M shares.
For the period, sales charge amounts retained by FDC were as follows:
| | Retained
by FDC |
| Class A | $22,237 |
| Class M | 3,137 |
| Class C(a) | 1,515 |
| | $26,889 |
(a) When Class C shares are initially sold, FDC pays commissions from its own resources to financial intermediaries through which the sales are made.
Transfer Agent Fees. Fidelity Investments Institutional Operations Company, Inc., (FIIOC), an affiliate of the investment adviser, is the transfer, dividend disbursing and shareholder servicing agent for each class of the Fund. FIIOC receives account fees and asset-based fees that vary according to the account size and type of account of the shareholders of the respective classes of the Fund. FIIOC pays for typesetting, printing and mailing of shareholder reports, except proxy statements.
For the period, transfer agent fees for each class were as follows:
| | Amount | % of
Class-Level Average
Net Assets |
| Class A | $24,552 | .25 |
| Class M | 17,370 | .28 |
| Class C | 18,268 | .26 |
| Emerging Markets Discovery | 327,388 | .21 |
| Class I | 81,246 | .18 |
| | $468,824 | |
Accounting and Security Lending Fees. Fidelity Service Company, Inc. (FSC), an affiliate of the investment adviser, maintains the Fund's accounting records. The accounting fee is based on the level of average net assets for each month. Under a separate contract, FSC administers the security lending program. The security lending fee is based on the number and duration of lending transactions.
Brokerage Commissions. The Fund placed a portion of its portfolio transactions with brokerage firms which are affiliates of the investment adviser. Brokerage commissions are included in net realized gain (loss) and change in net unrealized appreciation (depreciation) in the Statement of Operations. The commissions paid to these affiliated firms were $1,597 for the period.
Interfund Trades. The Fund may purchase from or sell securities to other Fidelity Funds under procedures adopted by the Board. The procedures have been designed to ensure these interfund trades are executed in accordance with Rule 17a-7 of the 1940 Act. Interfund trades are included within the respective purchases and sales amounts shown in the Purchases and Sales of Investments note.
7. Committed Line of Credit.
The Fund participates with other funds managed by the investment adviser or an affiliate in a $4.25 billion credit facility (the "line of credit") to be utilized for temporary or emergency purposes to fund shareholder redemptions or for other short-term liquidity purposes. The Fund has agreed to pay commitment fees on its pro-rata portion of the line of credit, which amounted to $586 and is reflected in Miscellaneous expenses on the Statement of Operations. During the period, the Fund did not borrow on this line of credit.
8. Security Lending.
The Fund lends portfolio securities through a lending agent from time to time in order to earn additional income. For equity securities, a lending agent is used and may loan securities to certain qualified borrowers, including Fidelity Capital Markets (FCM), a broker-dealer affiliated with the Fund. On the settlement date of the loan, the Fund receives collateral (in the form of U.S. Treasury obligations, letters of credit and/or cash) against the loaned securities and maintains collateral in an amount not less than 100% of the market value of the loaned securities during the period of the loan. The market value of the loaned securities is determined at the close of business of the Fund and any additional required collateral is delivered to the Fund on the next business day. The Fund or borrower may terminate the loan at any time, and if the borrower defaults on its obligation to return the securities loaned because of insolvency or other reasons, the Fund may apply collateral received from the borrower against the obligation. The Fund may experience delays and costs in recovering the securities loaned. Any cash collateral received is invested in the Fidelity Securities Lending Cash Central Fund. The value of loaned securities and cash collateral at period end are disclosed on the Fund's Statement of Assets and Liabilities. At period end, there were no security loans outstanding with FCM. Security lending income represents the income earned on investing cash collateral, less rebates paid to borrowers and any lending agent fees associated with the loan, plus any premium payments received for lending certain types of securities. Security lending income is presented in the Statement of Operations as a component of income from Fidelity Central Funds. Total security lending income during the period amounted to $90,589, including $3 from securities loaned to FCM.
9. Expense Reductions.
Commissions paid to certain brokers with whom the investment adviser, or its affiliates, places trades on behalf of the Fund include an amount in addition to trade execution, which may be rebated back to the Fund to offset certain expenses. This amount totaled $34,680 for the period.
In addition, during the period the investment adviser reimbursed and/or waived a portion of fund-level operating expenses in the amount of $794.
10. Distributions to Shareholders.
Distributions to shareholders of each class were as follows:
| | Year ended
October 31, 2017 | Year ended October 31, 2016 |
| From net investment income | | |
| Class A | $29,900 | $22,428 |
| Class M | 10,789 | 4,316 |
| Class C | 1,070 | – |
| Emerging Markets Discovery | 534,294 | 453,104 |
| Class I | 83,753 | 10,869 |
| Total | $659,806 | $490,717 |
| From net realized gain | | |
| Class A | $29,370 | $– |
| Class M | 15,653 | – |
| Class C | 12,406 | – |
| Emerging Markets Discovery | 375,874 | – |
| Class I | 52,117 | – |
| Total | $485,420 | $– |
11. Share Transactions.
Share transactions for each class were as follows and may contain automatic conversions between classes or exchanges between affiliated funds:
| | Shares | Shares | Dollars | Dollars |
| | Year ended
October 31, 2017 | Year ended October 31, 2016 | Year ended
October 31, 2017 | Year ended October 31, 2016 |
| Class A | | | | |
| Shares sold | 938,873 | 131,085 | $12,644,829 | $1,473,088 |
| Reinvestment of distributions | 4,936 | 1,944 | 55,853 | 20,757 |
| Shares redeemed | (303,068) | (131,586) | (4,070,793) | (1,425,583) |
| Net increase (decrease) | 640,741 | 1,443 | $8,629,889 | $68,262 |
| Class M | | | | |
| Shares sold | 451,879 | 74,898 | $5,910,208 | $869,903 |
| Reinvestment of distributions | 2,312 | 389 | 26,067 | 4,146 |
| Shares redeemed | (60,393) | (25,757) | (796,878) | (281,676) |
| Net increase (decrease) | 393,798 | 49,530 | $5,139,397 | $592,373 |
| Class C | | | | |
| Shares sold | 856,704 | 58,882 | $11,379,958 | $655,298 |
| Reinvestment of distributions | 1,203 | – | 13,340 | – |
| Shares redeemed | (74,143) | (31,638) | (999,641) | (342,535) |
| Net increase (decrease) | 783,764 | 27,244 | $10,393,657 | $312,763 |
| Emerging Markets Discovery | | | | |
| Shares sold | 14,972,932 | 2,003,183 | $202,173,147 | $22,538,095 |
| Reinvestment of distributions | 74,929 | 39,922 | 850,905 | 427,569 |
| Shares redeemed | (4,082,672) | (2,204,224) | (56,381,917) | (24,359,570) |
| Net increase (decrease) | 10,965,189 | (161,119) | $146,642,135 | $(1,393,906) |
| Class I | | | | |
| Shares sold | 6,604,470 | 642,732 | $89,627,624 | $7,808,576 |
| Reinvestment of distributions | 11,894 | 981 | 135,413 | 10,531 |
| Shares redeemed | (877,747) | (97,475) | (11,209,247) | (1,038,525) |
| Net increase (decrease) | 5,738,617 | 546,238 | $78,553,790 | $6,780,582 |
12. Other.
The Fund's organizational documents provide former and current trustees and officers with a limited indemnification against liabilities arising in connection with the performance of their duties to the Fund. In the normal course of business, the Fund may also enter into contracts that provide general indemnifications. The Fund's maximum exposure under these arrangements is unknown as this would be dependent on future claims that may be made against the Fund. The risk of material loss from such claims is considered remote.
Report of Independent Registered Public Accounting Firm
To the Trustees of Fidelity Investment Trust and Shareholders of Fidelity Emerging Markets Discovery Fund:
In our opinion, the accompanying statement of assets and liabilities, including the schedule of investments, and the related statements of operations and of changes in net assets and the financial highlights present fairly, in all material respects, the financial position of Fidelity Emerging Markets Discovery Fund (a fund of Fidelity Investment Trust) as of October 31, 2017, the results of its operations for the year then ended, the changes in its net assets for each of the two years in the period then ended and the financial highlights for each of the five years in the period then ended, in conformity with accounting principles generally accepted in the United States of America. These financial statements and financial highlights (hereafter referred to as “financial statements”) are the responsibility of the Fidelity Emerging Markets Discovery Fund’s management. Our responsibility is to express an opinion on these financial statements based on our audits. We conducted our audits of these financial statements in accordance with the standards of the Public Company Accounting Oversight Board (United States). Those standards require that we plan and perform the audit to obtain reasonable assurance about whether the financial statements are free of material misstatement. An audit includes examining, on a test basis, evidence supporting the amounts and disclosures in the financial statements, assessing the accounting principles used and significant estimates made by management, and evaluating the overall financial statement presentation. Our procedures included confirmation of securities owned as of October 31, 2017 by correspondence with the custodian and brokers; when replies were not received from brokers, we performed other auditing procedures. We believe that our audits provide a reasonable basis for our opinion.
PricewaterhouseCoopers LLP
Boston, Massachusetts
December 18, 2017
Trustees and Officers
The Trustees, Members of the Advisory Board (if any), and officers of the trust and fund, as applicable, are listed below. The Board of Trustees governs the fund and is responsible for protecting the interests of shareholders. The Trustees are experienced executives who meet periodically throughout the year to oversee the fund's activities, review contractual arrangements with companies that provide services to the fund, oversee management of the risks associated with such activities and contractual arrangements, and review the fund's performance. Except for Jonathan Chiel, each of the Trustees oversees 190 funds. Mr. Chiel oversees 143 funds.
The Trustees hold office without limit in time except that (a) any Trustee may resign; (b) any Trustee may be removed by written instrument, signed by at least two-thirds of the number of Trustees prior to such removal; (c) any Trustee who requests to be retired or who has become incapacitated by illness or injury may be retired by written instrument signed by a majority of the other Trustees; and (d) any Trustee may be removed at any special meeting of shareholders by a two-thirds vote of the outstanding voting securities of the trust. Each Trustee who is not an interested person (as defined in the 1940 Act) of the trust and the fund is referred to herein as an Independent Trustee. Each Independent Trustee shall retire not later than the last day of the calendar year in which his or her 75th birthday occurs. The Independent Trustees may waive this mandatory retirement age policy with respect to individual Trustees. Officers and Advisory Board Members hold office without limit in time, except that any officer or Advisory Board Member may resign or may be removed by a vote of a majority of the Trustees at any regular meeting or any special meeting of the Trustees. Except as indicated, each individual has held the office shown or other offices in the same company for the past five years.
The fund’s Statement of Additional Information (SAI) includes more information about the Trustees. To request a free copy, call Fidelity at 1-877-208-0098.
Experience, Skills, Attributes, and Qualifications of the Trustees. The Governance and Nominating Committee has adopted a statement of policy that describes the experience, qualifications, attributes, and skills that are necessary and desirable for potential Independent Trustee candidates (Statement of Policy). The Board believes that each Trustee satisfied at the time he or she was initially elected or appointed a Trustee, and continues to satisfy, the standards contemplated by the Statement of Policy. The Governance and Nominating Committee also engages professional search firms to help identify potential Independent Trustee candidates who have the experience, qualifications, attributes, and skills consistent with the Statement of Policy. From time to time, additional criteria based on the composition and skills of the current Independent Trustees, as well as experience or skills that may be appropriate in light of future changes to board composition, business conditions, and regulatory or other developments, have also been considered by the professional search firms and the Governance and Nominating Committee. In addition, the Board takes into account the Trustees' commitment and participation in Board and committee meetings, as well as their leadership of standing and ad hoc committees throughout their tenure.
In determining that a particular Trustee was and continues to be qualified to serve as a Trustee, the Board has considered a variety of criteria, none of which, in isolation, was controlling. The Board believes that, collectively, the Trustees have balanced and diverse experience, qualifications, attributes, and skills, which allow the Board to operate effectively in governing the fund and protecting the interests of shareholders. Information about the specific experience, skills, attributes, and qualifications of each Trustee, which in each case led to the Board's conclusion that the Trustee should serve (or continue to serve) as a trustee of the fund, is provided below.
Board Structure and Oversight Function. James C. Curvey is an interested person and currently serves as Chairman. The Trustees have determined that an interested Chairman is appropriate and benefits shareholders because an interested Chairman has a personal and professional stake in the quality and continuity of services provided to the fund. Independent Trustees exercise their informed business judgment to appoint an individual of their choosing to serve as Chairman, regardless of whether the Trustee happens to be independent or a member of management. The Independent Trustees have determined that they can act independently and effectively without having an Independent Trustee serve as Chairman and that a key structural component for assuring that they are in a position to do so is for the Independent Trustees to constitute a substantial majority for the Board. The Independent Trustees also regularly meet in executive session. Ned C. Lautenbach serves as Chairman of the Independent Trustees and as such (i) acts as a liaison between the Independent Trustees and management with respect to matters important to the Independent Trustees and (ii) with management prepares agendas for Board meetings.
Fidelity® funds are overseen by different Boards of Trustees. The fund's Board oversees Fidelity's high income and certain equity funds, and other Boards oversee Fidelity's investment-grade bond, money market, asset allocation, and sector funds. The asset allocation funds may invest in Fidelity® funds overseen by the fund's Board. The use of separate Boards, each with its own committee structure, allows the Trustees of each group of Fidelity® funds to focus on the unique issues of the funds they oversee, including common research, investment, and operational issues. On occasion, the separate Boards establish joint committees to address issues of overlapping consequences for the Fidelity® funds overseen by each Board.
The Trustees operate using a system of committees to facilitate the timely and efficient consideration of all matters of importance to the Trustees, the fund, and fund shareholders and to facilitate compliance with legal and regulatory requirements and oversight of the fund's activities and associated risks. The Board, acting through its committees, has charged FMR and its affiliates with (i) identifying events or circumstances the occurrence of which could have demonstrably adverse effects on the fund's business and/or reputation; (ii) implementing processes and controls to lessen the possibility that such events or circumstances occur or to mitigate the effects of such events or circumstances if they do occur; and (iii) creating and maintaining a system designed to evaluate continuously business and market conditions in order to facilitate the identification and implementation processes described in (i) and (ii) above. Because the day-to-day operations and activities of the fund are carried out by or through FMR, its affiliates, and other service providers, the fund's exposure to risks is mitigated but not eliminated by the processes overseen by the Trustees. While each of the Board's committees has responsibility for overseeing different aspects of the fund's activities, oversight is exercised primarily through the Operations, Audit, and Compliance Committees. In addition, the Independent Trustees have worked with FMR to enhance the Board's oversight of investment and financial risks, legal and regulatory risks, technology risks, and operational risks, including the development of additional risk reporting to the Board. For example, a working group comprised of Independent Trustees and FMR has worked and continues to work to review the Fidelity® funds' valuation-related activities, reporting and risk management. Appropriate personnel, including but not limited to the fund's Chief Compliance Officer (CCO), FMR's internal auditor, the independent accountants, the fund's Treasurer and portfolio management personnel, make periodic reports to the Board's committees, as appropriate, including an annual review of Fidelity's risk management program for the Fidelity® funds. The responsibilities of each standing committee, including their oversight responsibilities, are described further under "Standing Committees of the Trustees."
Interested Trustees*:
Correspondence intended for a Trustee who is an interested person may be sent to Fidelity Investments, 245 Summer Street, Boston, Massachusetts 02210.
Name, Year of Birth; Principal Occupations and Other Relevant Experience+
Jonathan Chiel (1957)
Year of Election or Appointment: 2016
Trustee
Mr. Chiel also serves as Trustee of other Fidelity® funds. Mr. Chiel is Executive Vice President and General Counsel for FMR LLC (diversified financial services company, 2012-present). Previously, Mr. Chiel served as general counsel (2004-2012) and senior vice president and deputy general counsel (2000-2004) for John Hancock Financial Services; a partner with Choate, Hall & Stewart (1996-2000) (law firm); and an Assistant United States Attorney for the United States Attorney’s Office of the District of Massachusetts (1986-95), including Chief of the Criminal Division (1993-1995). Mr. Chiel is a director on the boards of the Boston Bar Foundation and the Maimonides School.
James C. Curvey (1935)
Year of Election or Appointment: 2007
Trustee
Chairman of the Board of Trustees
Mr. Curvey also serves as Trustee of other Fidelity® funds. Mr. Curvey is a Director of Fidelity Research & Analysis Co. (investment adviser firm, 2009-present), and Vice Chairman (2007-present) and Director of FMR LLC (diversified financial services company). In addition, Mr. Curvey serves as an Overseer for the Boston Symphony Orchestra and a member of the board of Artis-Naples, Naples, Florida, and as a Trustee for Brewster Academy, Wolfeboro, New Hampshire. Previously, Mr. Curvey served as a Director of Fidelity Investments Money Management, Inc. (investment adviser firm, 2009-2014) and a Director of FMR and FMR Co., Inc. (investment adviser firms, 2007-2014).
Charles S. Morrison (1960)
Year of Election or Appointment: 2014
Trustee
Mr. Morrison also serves as Trustee of other funds. He serves as President of Fidelity Management & Research Company (FMR) (investment adviser firm, 2016-present), a Director of Fidelity Investments Money Management, Inc. (FIMM) (investment adviser firm, 2014-present), Director of Fidelity SelectCo, LLC (investment adviser firm, 2014-present), President, Asset Management (2014-present), and is an employee of Fidelity Investments. Previously, Mr. Morrison served as Vice President of Fidelity's Fixed Income and Asset Allocation Funds (2012-2014), President, Fixed Income (2011-2014), Vice President of Fidelity's Money Market Funds (2005-2009), President, Money Market Group Leader of FMR (investment adviser firm, 2009), and Senior Vice President, Money Market Group of FMR (2004-2009). Mr. Morrison also served as Vice President of Fidelity's Bond Funds (2002-2005), certain Balanced Funds (2002-2005), and certain Asset Allocation Funds (2002-2007), and as Senior Vice President (2002-2005) of Fidelity's Bond Division.
* Determined to be an “Interested Trustee” by virtue of, among other things, his or her affiliation with the trust[s] or various entities under common control with FMR.
+ The information includes the Trustee's principal occupation during the last five years and other information relating to the experience, attributes, and skills relevant to the Trustee's qualifications to serve as a Trustee, which led to the conclusion that the Trustee should serve as a Trustee for the fund.
Independent Trustees:
Correspondence intended for an Independent Trustee may be sent to Fidelity Investments, P.O. Box 55235, Boston, Massachusetts 02205-5235.
Name, Year of Birth; Principal Occupations and Other Relevant Experience+
Dennis J. Dirks (1948)
Year of Election or Appointment: 2005
Trustee
Mr. Dirks also serves as Trustee of other Fidelity® funds. Prior to his retirement in May 2003, Mr. Dirks was Chief Operating Officer and a member of the Board of The Depository Trust & Clearing Corporation (DTCC). He also served as President, Chief Operating Officer, and Board member of The Depository Trust Company (DTC) and President and Board member of the National Securities Clearing Corporation (NSCC). In addition, Mr. Dirks served as Chief Executive Officer and Board member of the Government Securities Clearing Corporation, Chief Executive Officer and Board member of the Mortgage-Backed Securities Clearing Corporation, as a Trustee and a member of the Finance Committee of Manhattan College (2005-2008), as a Trustee and a member of the Finance Committee of AHRC of Nassau County (2006-2008), as a member of the Independent Directors Council (IDC) Governing Council (2010-2015), and as a member of the Board of Directors for The Brookville Center for Children’s Services, Inc. (2009-2017). Mr. Dirks is a member of the Finance Committee (2016-present) and Board of Directors (2017-present) of the Asolo Repertory Theatre.
Alan J. Lacy (1953)
Year of Election or Appointment: 2008
Trustee
Mr. Lacy also serves as Trustee of other Fidelity® funds. Mr. Lacy serves as a Director of Bristol-Myers Squibb Company (global pharmaceuticals, 2008-present). He is a Trustee of the California Chapter of The Nature Conservancy (2015-present) and a Director of the Center for Advanced Study in the Behavioral Sciences at Stanford University (2015-present). In addition, Mr. Lacy served as Senior Adviser (2007-2014) of Oak Hill Capital Partners, L.P. (private equity) and also served as Chief Executive Officer (2005) and Vice Chairman (2005-2006) of Sears Holdings Corporation (retail) and Chief Executive Officer and Chairman of the Board of Sears, Roebuck and Co. (retail, 2000-2005). Previously, Mr. Lacy served as Chairman (2014-2017) and a member (2010-2017) of the Board of Directors of Dave & Buster’s Entertainment, Inc. (restaurant and entertainment complexes), as Chairman (2008-2011) and a member (2006-2015) of the Board of Trustees of the National Parks Conservation Association, and as a member of the Board of Directors for The Hillman Companies, Inc. (hardware wholesalers, 2010-2014), Earth Fare, Inc. (retail grocery, 2010-2014), and The Western Union Company (global money transfer, 2006-2011).
Ned C. Lautenbach (1944)
Year of Election or Appointment: 2000
Trustee
Chairman of the Independent Trustees
Mr. Lautenbach also serves as Trustee of other Fidelity® funds. Mr. Lautenbach currently serves as Vice Chair of the Board of Governors, State University System of Florida (2013-present) and is a member of the Council on Foreign Relations (1994-present). He is also a member and has most recently served as Chairman of the Board of Directors of Artis-Naples (2012-present). Previously, Mr. Lautenbach served as a member and then Lead Director of the Board of Directors of Eaton Corporation (diversified industrial, 1997-2016). He was also a Partner and Advisory Partner at Clayton, Dubilier & Rice, LLC (private equity investment, 1998-2010), as well as a Director of Sony Corporation (2006-2007). In addition, Mr. Lautenbach also had a 30-year career with IBM (technology company) during which time he served as Senior Vice President and a member of the Corporate Executive Committee (1968-1998).
Joseph Mauriello (1944)
Year of Election or Appointment: 2008
Trustee
Mr. Mauriello also serves as Trustee of other Fidelity® funds. Prior to his retirement in January 2006, Mr. Mauriello served in numerous senior management positions including Deputy Chairman and Chief Operating Officer (2004-2005), and Vice Chairman of Financial Services (2002-2004) of KPMG LLP US (professional services, 1965-2005). Mr. Mauriello currently serves as a member of the Board of Directors of XL Group plc. (global insurance and re-insurance, 2006-present) and the Independent Directors Council (IDC) Governing Council (2015-present). Previously, Mr. Mauriello served as a Director of the Hamilton Funds of the Bank of New York (2006-2007) and of Arcadia Resources Inc. (health care services and products, 2007-2012).
Cornelia M. Small (1944)
Year of Election or Appointment: 2005
Trustee
Ms. Small also serves as Trustee of other Fidelity® funds. Ms. Small is a member of the Board of Directors (2009-present) and Chair of the Investment Committee (2010-present) of the Teagle Foundation. Ms. Small also serves on the Investment Committee of the Berkshire Taconic Community Foundation (2008-present). Previously, Ms. Small served as Chairperson (2002-2008) and a member of the Investment Committee and Chairperson (2008-2012) and a member of the Board of Trustees of Smith College. In addition, Ms. Small served as Chief Investment Officer, Director of Global Equity Investments, and a member of the Board of Directors of Scudder, Stevens & Clark and Scudder Kemper Investments.
William S. Stavropoulos (1939)
Year of Election or Appointment: 2001
Trustee
Vice Chairman of the Independent Trustees
Mr. Stavropoulos also serves as Trustee of other Fidelity® funds. Mr. Stavropoulos serves as President and Founder of the Michigan Baseball Foundation, the Great Lakes Loons (2007-present). Mr. Stavropoulos is Chairman Emeritus of the Board of Directors of The Dow Chemical Company, where he previously served in numerous senior management positions, including President, CEO (1995-2000; 2002-2004), Chairman of the Executive Committee (2000-2006), and as a member of the Board of Directors (1990-2006). Currently, Mr. Stavropoulos is Chairman of the Board of Directors of Univar Inc. (global distributor of commodity and specialty chemicals), a Director of Teradata Corporation (data warehousing and technology solutions), and a member of the Advisory Board for Metalmark Capital LLC (private equity investment, 2005-present). Mr. Stavropoulos is an operating advisor to Clayton, Dubilier & Rice, LLC (private equity investment). In addition, Mr. Stavropoulos is a member of the University of Notre Dame Advisory Council for the College of Science, a Trustee of the Rollin L. Gerstacker Foundation, and a Director of Artis-Naples in Naples, Florida. Previously, Mr. Stavropoulos served as a Director of Chemical Financial Corporation (bank holding company, 1993-2012) and Tyco International, Ltd. (multinational manufacturing and services, 2007-2012).
David M. Thomas (1949)
Year of Election or Appointment: 2008
Trustee
Mr. Thomas also serves as Trustee of other Fidelity® funds. Mr. Thomas serves as Non-Executive Chairman of the Board of Directors of Fortune Brands Home and Security (home and security products, 2011-present), as a member of the Board of Directors (2004-present) and Presiding Director (2013-present) of Interpublic Group of Companies, Inc. (marketing communication), and as a member of the Board of Trustees of the University of Florida (2013-present). Previously, Mr. Thomas served as Executive Chairman (2005-2006) and Chairman and Chief Executive Officer (2000-2005) of IMS Health, Inc. (pharmaceutical and healthcare information solutions), and a Director of Fortune Brands, Inc. (consumer products, 2000-2011).
+ The information includes the Trustee's principal occupation during the last five years and other information relating to the experience, attributes, and skills relevant to the Trustee's qualifications to serve as a Trustee, which led to the conclusion that the Trustee should serve as a Trustee for the fund.
Advisory Board Members and Officers:
Correspondence intended for an officer or Peter S. Lynch may be sent to Fidelity Investments, 245 Summer Street, Boston, Massachusetts 02210. Officers appear below in alphabetical order.
Name, Year of Birth; Principal Occupation
Peter S. Lynch (1944)
Year of Election or Appointment: 2003
Member of the Advisory Board
Mr. Lynch also serves as Member of the Advisory Board of other Fidelity® funds. Mr. Lynch is Vice Chairman and a Director of FMR (investment adviser firm) and FMR Co., Inc. (investment adviser firm). In addition, Mr. Lynch serves as a Trustee of Boston College and as the Chairman of the Inner-City Scholarship Fund. Previously, Mr. Lynch served on the Special Olympics International Board of Directors (1997-2006).
Elizabeth Paige Baumann (1968)
Year of Election or Appointment: 2017
Anti-Money Laundering (AML) Officer
Ms. Baumann also serves as AML Officer of other funds. She is Chief AML Officer (2012-present) and Senior Vice President (2014-present) of FMR LLC (diversified financial services company) and is an employee of Fidelity Investments. Previously, Ms. Baumann served as AML Officer of the funds (2012-2016), and Vice President (2007-2014) and Deputy Anti-Money Laundering Officer (2007-2012) of FMR LLC.
Marc R. Bryant (1966)
Year of Election or Appointment: 2015
Secretary and Chief Legal Officer (CLO)
Mr. Bryant also serves as Secretary and CLO of other funds. Mr. Bryant serves as CLO, Secretary, and Senior Vice President of Fidelity Management & Research Company (investment adviser firm, 2015-present) and FMR Co., Inc. (investment adviser firm, 2015-present); Secretary of Fidelity SelectCo, LLC (investment adviser firm, 2015-present) and Fidelity Investments Money Management, Inc. (investment adviser firm, 2015-present); and CLO of Fidelity Management & Research (Hong Kong) Limited and FMR Investment Management (UK) Limited (investment adviser firms, 2015-present) and Fidelity Management & Research (Japan) Limited (investment adviser firm, 2016-present). He is Senior Vice President and Deputy General Counsel of FMR LLC (diversified financial services company). Previously, Mr. Bryant served as Secretary and CLO of Fidelity Rutland Square Trust II (2010-2014) and Assistant Secretary of Fidelity's Fixed Income and Asset Allocation Funds (2013-2015). Prior to joining Fidelity Investments, Mr. Bryant served as a Senior Vice President and the Head of Global Retail Legal for AllianceBernstein L.P. (2006-2010), and as the General Counsel for ProFund Advisors LLC (2001-2006).
William C. Coffey (1969)
Year of Election or Appointment: 2009
Assistant Secretary
Mr. Coffey also serves as Assistant Secretary of other funds. He is Senior Vice President and Deputy General Counsel of FMR LLC (diversified financial services company, 2010-present), and is an employee of Fidelity Investments. Previously, Mr. Coffey served as Vice President and Associate General Counsel of FMR LLC (2005-2009).
Jonathan Davis (1968)
Year of Election or Appointment: 2010
Assistant Treasurer
Mr. Davis also serves as Assistant Treasurer of other funds, and is an employee of Fidelity Investments. Previously, Mr. Davis served as Vice President and Associate General Counsel of FMR LLC (diversified financial services company, 2003-2010).
Adrien E. Deberghes (1967)
Year of Election or Appointment: 2016
Assistant Treasurer
Mr. Deberghes also serves as an officer of other funds. He serves as Executive Vice President of Fidelity Investments Money Management, Inc. (FIMM) (investment adviser firm, 2016-present) and is an employee of Fidelity Investments (2008-present). Prior to joining Fidelity Investments, Mr. Deberghes was Senior Vice President of Mutual Fund Administration at State Street Corporation (2007-2008), Senior Director of Mutual Fund Administration at Investors Bank & Trust (2005-2007), and Director of Finance for Dunkin' Brands (2000-2005). Previously, Mr. Deberghes served in other fund officer roles.
Joseph DeSantis (1959)
Year of Election or Appointment: 2017
Vice President
Mr. DeSantis also serves as Vice President of other funds. Mr. DeSantis serves as a Director of Fidelity Management & Research (Japan) Limited (investment adviser firm, 2016-present), Chief Investment Officer, Equities (2010-present) and is an employee of Fidelity Investments.
Stephanie J. Dorsey (1969)
Year of Election or Appointment: 2010
Assistant Treasurer
Ms. Dorsey also serves as an officer of other funds. She is an employee of Fidelity Investments (2008-present) and has served in other fund officer roles. Prior to joining Fidelity Investments, Ms. Dorsey served as Treasurer (2004-2008) of the JPMorgan Mutual Funds and Vice President (2004-2008) of JPMorgan Chase Bank.
Howard J. Galligan III (1966)
Year of Election or Appointment: 2014
Chief Financial Officer
Mr. Galligan also serves as Chief Financial Officer of other funds. Mr. Galligan serves as President of Fidelity Pricing and Cash Management Services (FPCMS) (2014-present) and as a Director of Strategic Advisers, Inc. (investment adviser firm, 2008-present). Previously, Mr. Galligan served as Chief Administrative Officer of Asset Management (2011-2014) and Chief Operating Officer and Senior Vice President of Investment Support for Strategic Advisers, Inc. (2003-2011).
Brian B. Hogan (1964)
Year of Election or Appointment: 2009
Vice President
Mr. Hogan also serves as Trustee or Vice President of other funds. Mr. Hogan serves as a Director of FMR Investment Management (UK) Limited (investment adviser firm, 2015-present) and Fidelity SelectCo, LLC (investment adviser firm, 2014-present) and President of the Equity Division of FMR (investment adviser firm, 2009-present). Previously, Mr. Hogan served as Senior Vice President, Equity Research of FMR (2006-2009) and as a portfolio manager. Mr. Brian B. Hogan is not related to Mr. Colm A. Hogan.
Colm A. Hogan (1973)
Year of Election or Appointment: 2016
Deputy Treasurer
Mr. Hogan also serves as an officer of other funds. Mr. Hogan is an employee of Fidelity Investments (2005-present). Mr. Colm A. Hogan is not related to Mr. Brian B. Hogan.
Chris Maher (1972)
Year of Election or Appointment: 2013
Assistant Treasurer
Mr. Maher serves as Assistant Treasurer of other funds. Mr. Maher is Vice President of Valuation Oversight and is an employee of Fidelity Investments. Previously, Mr. Maher served as Vice President of Asset Management Compliance (2013), Vice President of the Program Management Group of FMR (investment adviser firm, 2010-2013), and Vice President of Valuation Oversight (2008-2010).
Rieco E. Mello (1969)
Year of Election or Appointment: 2017
Assistant Treasurer
Mr. Mello also serves as Assistant Treasurer of other funds. Mr. Mello is an employee of Fidelity Investments (1995-present).
Kenneth B. Robins (1969)
Year of Election or Appointment: 2016
Chief Compliance Officer
Mr. Robins also serves as an officer of other funds. Mr. Robins serves as Compliance Officer of Fidelity Management & Research Company and FMR Co., Inc. (investment adviser firms, 2016-present) and is an employee of Fidelity Investments (2004-present). Previously, Mr. Robins served as Executive Vice President of Fidelity Investments Money Management, Inc. (investment adviser firm, 2013-2016) and served in other fund officer roles.
Stacie M. Smith (1974)
Year of Election or Appointment: 2016
President and Treasurer
Ms. Smith also serves as an officer of other funds. She is an employee of Fidelity Investments (2009-present) and has served in other fund officer roles. Prior to joining Fidelity Investments, Ms. Smith served as Senior Audit Manager of Ernst & Young LLP (accounting firm, 1996-2009). Previously, Ms. Smith served as Deputy Treasurer of certain Fidelity® funds (2013-2016).
Marc L. Spector (1972)
Year of Election or Appointment: 2016
Assistant Treasurer
Mr. Spector also serves as an officer of other funds. Mr. Spector is an employee of Fidelity Investments (2016-present). Prior to joining Fidelity Investments, Mr. Spector served as Director at the Siegfried Group (accounting firm, 2013-2016), and prior to Siegfried Group as audit senior manager at Deloitte & Touche (accounting firm, 2005-2013).
Renee Stagnone (1975)
Year of Election or Appointment: 2016
Assistant Treasurer
Ms. Stagnone also serves as an officer of other funds. Ms. Stagnone is an employee of Fidelity Investments (1997-present). Previously, Ms. Stagnone served as Deputy Treasurer of certain Fidelity® funds (2013-2016).
Shareholder Expense Example
As a shareholder of the Fund, you incur two types of costs: (1) transaction costs, including sales charges (loads) on purchase payments or redemption proceeds, redemption fees and (2) ongoing costs, including management fees, distribution and/or service (12b-1) fees and other Fund expenses. This Example is intended to help you understand your ongoing costs (in dollars) of investing in the Fund and to compare these costs with the ongoing costs of investing in other mutual funds.
The Example is based on an investment of $1,000 invested at the beginning of the period and held for the entire period (May 1, 2017 to October 31, 2017).
Actual Expenses
The first line of the accompanying table for each class of the Fund provides information about actual account values and actual expenses. You may use the information in this line, together with the amount you invested, to estimate the expenses that you paid over the period. Simply divide your account value by $1,000.00 (for example, an $8,600 account value divided by $1,000.00 = 8.6), then multiply the result by the number in the first line for a class of the Fund under the heading entitled "Expenses Paid During Period" to estimate the expenses you paid on your account during this period. A small balance maintenance fee of $12.00 that is charged once a year may apply for certain accounts with a value of less than $2,000. This fee is not included in the table below. If it was, the estimate of expenses you paid during the period would be higher, and your ending account value lower, by this amount. In addition, the Fund, as a shareholder in the underlying Fidelity Central Funds, will indirectly bear its pro-rata share of the fees and expenses incurred by the underlying Fidelity Central Funds. These fees and expenses are not included in the Fund's annualized expense ratio used to calculate the expense estimate in the table below.
Hypothetical Example for Comparison Purposes
The second line of the accompanying table for each class of the Fund provides information about hypothetical account values and hypothetical expenses based on a Class' actual expense ratio and an assumed rate of return of 5% per year before expenses, which is not the Class' actual return. The hypothetical account values and expenses may not be used to estimate the actual ending account balance or expenses you paid for the period. You may use this information to compare the ongoing costs of investing in the Fund and other funds. To do so, compare this 5% hypothetical example with the 5% hypothetical examples that appear in the shareholder reports of the other funds. A small balance maintenance fee of $12.00 that is charged once a year may apply for certain accounts with a value of less than $2,000. This fee is not included in the table below. If it was, the estimate of expenses you paid during the period would be higher, and your ending account value lower, by this amount. In addition, the Fund, as a shareholder in the underlying Fidelity Central Funds, will indirectly bear its pro-rata share of the fees and expenses incurred by the underlying Fidelity Central Funds. These fees and expenses are not included in the Fund's annualized expense ratio used to calculate the expense estimate in the table below.
Please note that the expenses shown in the table are meant to highlight your ongoing costs only and do not reflect any transaction costs. Therefore, the second line of the table is useful in comparing ongoing costs only, and will not help you determine the relative total costs of owning different funds. In addition, if these transactional costs were included, your costs would have been higher.
| | Annualized Expense Ratio-A | Beginning
Account Value
May 1, 2017 | Ending
Account Value
October 31, 2017 | Expenses Paid
During Period-B
May 1, 2017
to October 31, 2017 |
| Class A | 1.63% | | | |
| Actual | | $1,000.00 | $1,123.30 | $8.72 |
| Hypothetical-C | | $1,000.00 | $1,016.99 | $8.29 |
| Class M | 1.93% | | | |
| Actual | | $1,000.00 | $1,122.50 | $10.33 |
| Hypothetical-C | | $1,000.00 | $1,015.48 | $9.80 |
| Class C | 2.41% | | | |
| Actual | | $1,000.00 | $1,119.30 | $12.87 |
| Hypothetical-C | | $1,000.00 | $1,013.06 | $12.23 |
| Emerging Markets Discovery | 1.34% | | | |
| Actual | | $1,000.00 | $1,125.00 | $7.18 |
| Hypothetical-C | | $1,000.00 | $1,018.45 | $6.82 |
| Class I | 1.33% | | | |
| Actual | | $1,000.00 | $1,124.70 | $7.12 |
| Hypothetical-C | | $1,000.00 | $1,018.50 | $6.77 |
A Annualized expense ratio reflects expenses net of applicable fee waivers.
B Expenses are equal to each Class' annualized expense ratio, multiplied by the average account value over the period, multiplied by 184/365 (to reflect the one-half year period).
C 5% return per year before expenses
Distributions (Unaudited)
The Board of Trustees of Fidelity Emerging Markets Discovery Fund voted to pay to shareholders of record at the opening of business on record date, the following distributions per share derived from capital gains realized from sales of portfolio securities and dividends derived from net investment income:
| | Pay Date | Record Date | Dividends | Capital Gains |
| Fidelity Emerging Markets Discovery Fund | | | | |
| Class A | 12/18/17 | 12/15/17 | $0.082 | $0.230 |
| Class M | 12/18/17 | 12/15/17 | $0.044 | $0.230 |
| Class C | 12/18/17 | 12/15/17 | $0.020 | $0.230 |
| Emerging Markets Discovery | 12/18/17 | 12/15/17 | $0.114 | $0.230 |
| Class I | 12/18/17 | 12/15/17 | $0.116 | $0.230 |
|
The fund hereby designates as a capital gain dividend with respect to the taxable year ended October 31, 2017, $2,579,433, or, if subsequently determined to be different, the net capital gain of such year.
Class A designates 68% and 100%; Class M designates 79% and 100%; Class C designates 100% and 100%; Emerging Markets Discovery designates 58% and 100%; and Class I designates 55% and 100%; of the dividends distributed on December 16, 2016, and December 27, 2016, respectively during the fiscal year as amounts which may be taken into account as a dividend for purposes of the maximum rate under section 1(h)(11) of the Internal Revenue Code.
The amounts per share which represent income derived from sources within, and taxes paid to, foreign countries or possessions of the United States are as follows:
| | Pay Date | Income | Taxes |
| Fidelity Emerging Markets Discovery Fund | | | |
| Class A | 12/19/16 | $0.1459 | $0.0219 |
| Class A | 12/28/16 | $0.0050 | $0.0000 |
| Class M | 12/19/16 | $0.1249 | $0.0219 |
| Class M | 12/28/16 | $0.0050 | $0.0000 |
| Class C | 12/19/16 | $0.0819 | $0.0219 |
| Class C | 12/28/16 | $0.0050 | $0.0000 |
| Emerging Markets Discovery | 12/19/16 | $0.1719 | $0.0219 |
| Emerging Markets Discovery | 12/28/16 | $0.0050 | $0.0000 |
| Class I | 12/19/16 | $0.1819 | $0.0219 |
| Class I | 12/28/16 | $0.0050 | $0.0000 |
|
The fund will notify shareholders in January 2018 of amounts for use in preparing 2017 income tax returns.
Board Approval of Investment Advisory Contracts and Management Fees
Fidelity Emerging Markets Discovery Fund
Each year, the Board of Trustees, including the Independent Trustees (together, the Board), votes on the renewal of the management contract with Fidelity Management & Research Company (FMR) and the sub-advisory agreements (together, the Advisory Contracts) for the fund. FMR and the sub-advisers are referred to herein as the Investment Advisers. The Board, assisted by the advice of fund counsel and Independent Trustees' counsel, requests and considers a broad range of information relevant to the renewal of the Advisory Contracts throughout the year.
The Board meets regularly and, at each of its meetings, covers an extensive agenda of topics and materials and considers factors that are relevant to its annual consideration of the renewal of the fund's Advisory Contracts, including the services and support provided to the fund and its shareholders. The Board has established various standing committees (Committees), each composed of and chaired by Independent Trustees with varying backgrounds, to which the Board has assigned specific subject matter responsibilities in order to enhance effective decision-making by the Board. The Board, acting directly and through its Committees, requests and receives information concerning the annual consideration of the renewal of the fund's Advisory Contracts. The Board also meets as needed to review matters specifically related to the Board's annual consideration of the renewal of the Advisory Contracts. Members of the Board may also meet with trustees of other Fidelity funds through ad hoc joint committees to discuss certain matters relevant to all of the Fidelity funds.
At its July 2017 meeting, the Board unanimously determined to renew the fund's Advisory Contracts. In reaching its determination, the Board considered all factors it believed relevant, including (i) the nature, extent, and quality of the services to be provided to the fund and its shareholders (including the investment performance of the fund); (ii) the competitiveness of the fund's management fee and total expense ratio relative to peer funds; (iii) the total costs of the services to be provided by and the profits to be realized by Fidelity from its relationships with the fund; and (iv) the extent to which, if any, economies of scale exist and would be realized as the fund grows, and whether any economies of scale are appropriately shared with fund shareholders.
In considering whether to renew the Advisory Contracts for the fund, the Board reached a determination, with the assistance of fund counsel and Independent Trustees' counsel and through the exercise of its business judgment, that the renewal of the Advisory Contracts was in the best interests of the fund and its shareholders and that the compensation payable under the Advisory Contracts was fair and reasonable. The Board's decision to renew the Advisory Contracts was not based on any single factor, but rather was based on a comprehensive consideration of all the information provided to the Board at its meetings throughout the year. The Board, in reaching its determination to renew the Advisory Contracts, was aware that shareholders of the fund have a broad range of investment choices available to them, including a wide choice among funds offered by Fidelity's competitors, and that the fund's shareholders, who have the opportunity to review and weigh the disclosure provided by the fund in its prospectus and other public disclosures, have chosen to invest in this fund, which is part of the Fidelity family of funds.
Amendment to Group Fee Rate. The Board also approved an amendment to the management contract for the fund to add an additional breakpoint to the group fee schedule, effective October 1, 2017. The Board noted that the additional breakpoint would result in lower management fee rates as Fidelity's assets under management increase.
Nature, Extent, and Quality of Services Provided. The Board considered Fidelity's staffing as it relates to the fund, including the backgrounds of investment personnel of Fidelity, and also considered the fund's investment objective, strategies, and related investment philosophy. The Independent Trustees also had discussions with senior management of Fidelity's investment operations and investment groups. The Board considered the structure of the investment personnel compensation program and whether this structure provides appropriate incentives to act in the best interests of the fund. Additionally, the Board considered the portfolio managers' investments, if any, in the funds that they manage.
Resources Dedicated to Investment Management and Support Services. The Board and the Fund Oversight and Research Committees reviewed the general qualifications and capabilities of Fidelity's investment staff, including its size, education, experience, and resources, as well as Fidelity's approach to recruiting, training, managing, and compensating investment personnel. The Board noted that Fidelity has continued to increase the resources devoted to non-U.S. offices, including expansion of Fidelity's global investment organization. The Board also noted that Fidelity's analysts have extensive resources, tools and capabilities that allow them to conduct sophisticated quantitative and fundamental analysis, as well as credit analysis of issuers, counterparties and guarantors. Further, the Board considered that Fidelity's investment professionals have sufficient access to global information and data so as to provide competitive investment results over time, and that those professionals also have access to sophisticated tools that permit them to assess portfolio construction and risk and performance attribution characteristics continuously, as well as to transmit new information and research conclusions rapidly around the world. Additionally, in its deliberations, the Board considered Fidelity's trading, risk management, compliance, and technology and operations capabilities and resources, which are integral parts of the investment management process.
Shareholder and Administrative Services. The Board considered (i) the nature, extent, quality, and cost of advisory, administrative, and shareholder services performed by the Investment Advisers and their affiliates under the Advisory Contracts and under separate agreements covering transfer agency, pricing and bookkeeping, and securities lending services for the fund; (ii) the nature and extent of the supervision of third party service providers, principally custodians, subcustodians, and pricing vendors; and (iii) the resources devoted to, and the record of compliance with, the fund's compliance policies and procedures. The Board also reviewed the allocation of fund brokerage, including allocations to brokers affiliated with the Investment Advisers, the use of brokerage commissions to pay fund expenses, and the use of "soft" commission dollars to pay for research services.
The Board noted that the growth of fund assets over time across the complex allows Fidelity to reinvest in the development of services designed to enhance the value or convenience of the Fidelity funds as investment vehicles. These services include 24-hour access to account information and market information through telephone representatives and over the Internet, investor education materials and asset allocation tools, and the expanded availability of Fidelity Investor Centers.
In 2014, the Board formed an ad hoc Committee on Transfer Agency Fees to review the variety of transfer agency fee structures throughout the industry and Fidelity's competitive positioning with respect to industry participants.
Investment in a Large Fund Family. The Board considered the benefits to shareholders of investing in a Fidelity fund, including the benefits of investing in a fund that is part of a large family of funds offering a variety of investment disciplines and providing a large variety of mutual fund investor services. The Board noted that Fidelity had taken, or had made recommendations that resulted in the Fidelity funds taking, a number of actions over the previous year that benefited particular funds, including: (i) continuing to dedicate additional resources to Fidelity's investment research process, and to the support of the senior management team that oversees asset management; (ii) continuing efforts to enhance Fidelity's global research capabilities; (iii) launching new funds and making other enhancements to meet client needs; (iv) launching new share classes of existing funds; (v) eliminating purchase minimums and broadening eligibility requirements for certain lower-priced share classes; (vi) reducing management fees and total expenses for certain growth equity funds and index funds; (vii) lowering expense caps for certain existing funds and classes to reduce expenses borne by shareholders; (viii) eliminating short-term redemption fees for certain funds; (ix) introducing a new pricing structure for certain funds of funds that is expected to reduce overall expenses paid by shareholders; (x) rationalizing product lines and gaining increased efficiencies through proposals for fund mergers and share class consolidations; (xi) continuing to develop, acquire and implement systems and technology to improve services to the funds and shareholders, strengthen information security, and increase efficiency; and (xii) implementing enhancements to further strengthen Fidelity's product line to increase investors' probability of success in achieving their investment goals, including retirement income goals.
Investment Performance. The Board considered whether the fund has operated in accordance with its investment objective, as well as its record of compliance with its investment restrictions and its performance history. The Board noted that there was a portfolio management change for the fund in June 2014.
The Board took into account discussions with representatives of the Investment Advisers about fund investment performance that occur at Board meetings throughout the year. In this regard the Board noted that as part of regularly scheduled fund reviews and other reports to the Board on fund performance, the Board considers annualized return information for the fund for different time periods, measured against a securities market index ("benchmark index") and a peer group of funds with similar objectives ("peer group"), if any. In its evaluation of fund investment performance, the Board gave particular attention to information indicating changes in performance of certain Fidelity funds for specific time periods and discussed with the Investment Advisers the reasons for any overperformance or underperformance.
In addition to reviewing absolute and relative fund performance, the Independent Trustees periodically consider the appropriateness of fund performance metrics in evaluating the results achieved. In general, the Independent Trustees believe that fund performance should be evaluated based on net performance (after fees and expenses) of both the highest performing and lowest performing fund share classes, where applicable, compared to appropriate benchmark indices, over appropriate time periods that may include full market cycles, and compared to peer groups, as applicable, over the same periods, taking into account relevant factors including the following: general market conditions; issuer-specific information; and fund cash flows and other factors.
The Independent Trustees recognize that shareholders evaluate performance on a net basis over their own holding periods, for which one-, three-, and five-year periods are often used as a proxy. For this reason, the performance information reviewed by the Board also included net cumulative calendar year total return information for the fund and an appropriate benchmark index and peer group for the most recent one-, three-, and five-year periods, as shown below. Returns are shown compared to the 25th percentile (top of box, 75% beaten) and 75th percentile (bottom of box, 25% beaten) of the peer universe.
Fidelity Emerging Markets Discovery Fund
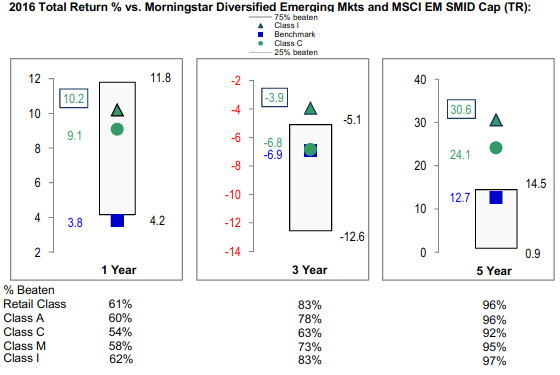
Based on its review, the Board concluded that the nature, extent, and quality of services provided to the fund under the Advisory Contracts should continue to benefit the shareholders of the fund.
Competitiveness of Management Fee and Total Expense Ratio. The Board considered the fund's management fee and total expense ratio compared to "mapped groups" of competitive funds and classes created for the purpose of facilitating the Trustees' competitive analysis of management fees and total expenses. Fidelity creates "mapped groups" by combining similar Lipper investment objective categories that have comparable investment mandates. Combining Lipper investment objective categories aids the Board's management fee and total expense ratio comparisons by broadening the competitive group used for comparison.
Management Fee. The Board considered two proprietary management fee comparisons for the 12-month periods shown in basis points (BP) in the chart below. The group of Lipper funds used by the Board for management fee comparisons is referred to below as the "Total Mapped Group." The Total Mapped Group comparison focuses on a fund's standing in terms of gross management fees before expense reimbursements or caps relative to the total universe of funds with comparable investment mandates, regardless of whether their management fee structures also are comparable. Funds with comparable investment mandates offer exposure to similar types of securities. Funds with comparable management fee structures have similar management fee contractual arrangements (
e.g., flat rate charged for advisory services, all-inclusive fee rate,
etc.). "TMG %" represents the percentage of funds in the Total Mapped Group that had management fees that were lower than the fund's. For example, a hypothetical TMG % of 20% would mean that 80% of the funds in the Total Mapped Group had higher, and 20% had lower, management fees than the fund. The fund's actual TMG %s and the number of funds in the Total Mapped Group are in the chart below. The "Asset-Size Peer Group" (ASPG) comparison focuses on a fund's standing relative to a subset of non-Fidelity funds within the Total Mapped Group that are similar in size and management fee structure. For example, if a fund is in the first quartile of the ASPG, the fund's management fee ranks in the least expensive or lowest 25% of funds in the ASPG. The ASPG represents at least 15% of the funds in the Total Mapped Group with comparable asset size and management fee structures, subject to a minimum of 50 funds (or all funds in the Total Mapped Group if fewer than 50). Additional information, such as the ASPG quartile in which the fund's management fee rate ranked, is also included in the chart and considered by the Board.
Fidelity Emerging Markets Discovery Fund

The Board noted that the fund's management fee rate ranked below the median of its Total Mapped Group and below the median of its ASPG for 2016.
The Board noted that, in 2014, the Board and the boards of other Fidelity funds formed the ad hoc Committee on Group Fee to conduct an in-depth review of the "group fee" component of the management fee of funds with such management fee structures. The Committee's focus included the mechanics of the group fee, the competitive landscape of group fee structures, Fidelity funds with no group fee component and investment products not included in group fee assets. The Board also considered that, for funds subject to the group fee, FMR agreed to voluntarily waive fees over a specified period of time in amounts designed to account for assets converted from certain funds to certain collective investment trusts.
The Board also noted that, in 2013, the ad hoc Committee on Management Fees was formed to conduct an in-depth review of the management fee rates of Fidelity's active equity mutual funds. The Committee focused on the following areas: (i) standard fee structures; (ii) research consumption and trading evolution; (iii) management fee competitiveness/profitability by category; and (iv) factors that drive institutional pricing.
Based on its review, the Board concluded that the fund's management fee is fair and reasonable in light of the services that the fund receives and the other factors considered.
Total Expense Ratio. In its review of each class's total expense ratio, the Board considered the fund's management fee rate as well as other fund or class expenses, as applicable, such as transfer agent fees, pricing and bookkeeping fees, fund-paid 12b-1 fees, and custodial, legal, and audit fees. The Board also noted that Fidelity may agree to waive fees and expenses from time to time, and the extent to which, if any, it has done so for the fund. As part of its review, the Board also considered the current and historical total expense ratios of each class of the fund compared to competitive fund median expenses. Each class of the fund is compared to those funds and classes in the Total Mapped Group (used by the Board for management fee comparisons) that have a similar sales load structure.
The Board noted that the total expense ratio of each class ranked above the competitive median for 2016. The Board considered that, in general, various factors can affect total expense ratios. The Board noted that the total expense ratio of each class was above the competitive median because of relatively higher other expenses due to low asset levels. The Board noted that the total expense ratio of Class M (formerly Class T) was also above the competitive median because of higher 12b-1 fees on Class M as compared to most competitor funds. Class M has a higher 12b-1 fee, but a lower front-end sales charge, than traditionally priced front-end sales charge classes. The Board considered that Class M is primarily sold load-waived in the retirement plan market where its 0.50% 12b-1 fee is comparable to competing no-load, higher 12b-1 fee classes designed specifically for retirement plans. The Board noted that the total expense ratio of Class C was also above the competitive median because of its 12b-1 fees. The Board also noted that, although Class I is categorized by Lipper as an institutional class, Class I has a significantly lower investment minimum than most other funds and classes categorized as institutional. As a result, FMR believes Class I is generally more comparable to retail funds and classes. The Board noted that the fund offers multiple classes, each of which has a different sales load and 12b-1 fee structure, and that the multiple structures are intended to offer a range of pricing options for the intermediary market. The Board also noted that the total expense ratios of the classes of the fund vary primarily by the level of their 12b-1 fees, although differences in transfer agent fees may also cause expenses to vary from class to class.
The Board further considered that FMR has contractually agreed to reimburse Class A, Class M, Class C, Class I, and the retail class of the fund to the extent that total operating expenses (excluding interest, certain taxes, certain securities lending costs, brokerage commissions, fees and expenses of the Independent Trustees, proxy and shareholder meeting expenses, extraordinary expenses, and acquired fund fees and expenses, if any), as a percentage of their respective average net assets, exceed 1.70%, 1.95%, 2.45%, 1.45%, and 1.45% through December 31, 2017.
Fees Charged to Other Fidelity Clients. The Board also considered Fidelity fee structures and other information with respect to clients of Fidelity, such as other funds advised or subadvised by Fidelity, pension plan clients, and other institutional clients with similar mandates. The Board noted that an ad hoc joint committee created by it and the boards of other Fidelity funds periodically (most recently in 2013) reviews and compares Fidelity's institutional investment advisory business with its business of providing services to the Fidelity funds, including the differences in services provided, fees charged, and costs incurred, as well as competition in their respective marketplaces.
Based on its review of total expense ratios and fees charged to other Fidelity clients, the Board concluded that, although some classes were above the median of the universe presented for comparison, the total expense ratio of each class of the fund was reasonable in light of the services that the fund and its shareholders receive and the other factors considered.
Costs of the Services and Profitability. The Board considered the revenues earned and the expenses incurred by Fidelity in conducting the business of developing, marketing, distributing, managing, administering and servicing the fund and servicing the fund's shareholders. The Board also considered the level of Fidelity's profits in respect of all the Fidelity funds.
On an annual basis, Fidelity presents to the Board information about the profitability of its relationships with the fund. Fidelity calculates profitability information for each fund, as well as aggregate profitability information for groups of Fidelity funds and all Fidelity funds, using a series of detailed revenue and cost allocation methodologies which originate with the books and records of Fidelity on which Fidelity's audited financial statements are based. The Audit Committee of the Board reviews any significant changes from the prior year's methodologies.
PricewaterhouseCoopers LLP (PwC), independent registered public accounting firm and auditor to Fidelity and certain Fidelity funds, has been engaged annually by the Board as part of the Board's assessment of Fidelity's profitability analysis. PwC's engagement includes the review and assessment of the methodologies used by Fidelity in determining the revenues and expenses attributable to Fidelity's mutual fund business, and completion of agreed-upon procedures in respect of the mathematical accuracy of the fund profitability information and its conformity to established allocation methodologies. After considering PwC's reports issued under the engagement and information provided by Fidelity, the Board concluded that while other allocation methods may also be reasonable, Fidelity's profitability methodologies are reasonable in all material respects.
The Board also reviewed Fidelity's non-fund businesses and potential fall-out benefits related to the mutual fund business as well as cases where Fidelity's affiliates may benefit from or be related to the fund's business.
The Board considered the costs of the services provided by and the profits realized by Fidelity in connection with the operation of the fund and was satisfied that the profitability was not excessive.
Economies of Scale. The Board considered whether there have been economies of scale in respect of the management of the Fidelity funds, whether the Fidelity funds (including the fund) have appropriately benefited from any such economies of scale, and whether there is potential for realization of any further economies of scale. The Board considered the extent to which the fund will benefit from economies of scale as assets grow through increased services to the fund, through waivers or reimbursements, or through fee or expense ratio reductions. The Board also noted that a committee (the Economies of Scale Committee) created by it and the boards of other Fidelity funds periodically (most recently in 2013) analyzes whether Fidelity attains economies of scale in respect of the management and servicing of the Fidelity funds, whether the Fidelity funds have appropriately benefited from such economies of scale, and whether there is potential for realization of any further economies of scale.
The Board recognized that the fund's management contract incorporates a "group fee" structure, which provides for lower group fee rates as total group assets increase, and for higher group fee rates as total group assets decrease (with "group assets" defined to include fund assets under FMR's management plus the assets of sector funds previously under FMR's management). FMR calculates the group fee rates based on a tiered asset "breakpoint" schedule that varies based on asset class. The Board considered that the group fee is designed to deliver the benefits of economies of scale to fund shareholders when total Fidelity fund assets increase, even if assets of any particular fund are unchanged or have declined, because some portion of Fidelity's costs are attributable to services provided to all Fidelity funds, and all funds benefit if those costs can be allocated among more assets. The Board concluded that, given the group fee structure, fund shareholders will benefit from lower management fees as group assets increase at the fund complex level, regardless of whether Fidelity achieves any such economies of scale.
The Board concluded, taking into account the analysis of the Economies of Scale Committee, that economies of scale, if any, are being appropriately shared between fund shareholders and Fidelity.
Additional Information Requested by the Board. In order to develop fully the factual basis for consideration of the Fidelity funds' advisory contracts, the Board requested and received additional information on certain topics, including: (i) fund performance trends, in particular the underperformance of certain funds, and Fidelity's long-term strategies for certain funds; (ii) Fidelity's fund profitability methodology, profitability trends for certain funds, and the impact of certain factors on fund profitability results, including the impact of market trends on actively managed funds; (iii) the use of performance fees and the calculation of performance adjustments, including the impact of underperformance and fund outflows on performance adjustments; (iv) metrics for evaluating index fund performance; (v) Fidelity's group fee structure, including the group fee breakpoint schedules; (vi) the terms of Fidelity's contractual and voluntary expense cap arrangements with the funds; (vii) the methodology with respect to evaluating competitive fund data and peer group classifications and fee comparisons; (viii) the expense structures for different funds and classes; (ix) Fidelity's arrangements with affiliated sub-advisers on behalf of the funds; (x) information regarding other accounts managed by Fidelity, including institutional accounts and collective investment trusts; (xi) recent changes to the fee structure for certain funds of funds; and (xii) the impact of the Department of Labor's new fiduciary rule on the funds' comparative expense information.
Based on its evaluation of all of the conclusions noted above, and after considering all factors it believed relevant, the Board concluded that the advisory fee structures are fair and reasonable, and that the fund's Advisory Contracts should be renewed.

AEMD-ANN-1217
1.931250.105
Fidelity Advisor® International Discovery Fund - Class A, Class M (formerly Class T), Class C, Class I and Class Z
Annual Report October 31, 2017 Class A, Class M, Class C, Class I and Class Z are classes of Fidelity® International Discovery Fund |
|
Contents
To view a fund's proxy voting guidelines and proxy voting record for the 12-month period ended June 30, visit http://www.fidelity.com/proxyvotingresults or visit the Securities and Exchange Commission's (SEC) web site at http://www.sec.gov.
You may also call 1-877-208-0098 to request a free copy of the proxy voting guidelines.
Standard & Poor's, S&P and S&P 500 are registered service marks of The McGraw-Hill Companies, Inc. and have been licensed for use by Fidelity Distributors Corporation.
Other third-party marks appearing herein are the property of their respective owners.
All other marks appearing herein are registered or unregistered trademarks or service marks of FMR LLC or an affiliated company. © 2017 FMR LLC. All rights reserved.
This report and the financial statements contained herein are submitted for the general information of the shareholders of the Fund. This report is not authorized for distribution to prospective investors in the Fund unless preceded or accompanied by an effective prospectus.
A fund files its complete schedule of portfolio holdings with the SEC for the first and third quarters of each fiscal year on Form N-Q. Forms N-Q are available on the SEC’s web site at http://www.sec.gov. A fund's Forms N-Q may be reviewed and copied at the SEC’s Public Reference Room in Washington, DC. Information regarding the operation of the SEC's Public Reference Room may be obtained by calling 1-800-SEC-0330.
For a complete list of a fund's portfolio holdings, view the most recent holdings listing, semiannual report, or annual report on Fidelity's web site at http://www.fidelity.com, http://www.institutional.fidelity.com, or http://www.401k.com, as applicable.
NOT FDIC INSURED •MAY LOSE VALUE •NO BANK GUARANTEE
Neither the Fund nor Fidelity Distributors Corporation is a bank.
Performance: The Bottom Line
Average annual total return reflects the change in the value of an investment, assuming reinvestment of distributions from dividend income and capital gains (the profits earned upon the sale of securities that have grown in value, if any) and assuming a constant rate of performance each year. The hypothetical investment and the average annual total returns do not reflect the deduction of taxes that a shareholder would pay on fund distributions or the redemption of fund shares. During periods of reimbursement by Fidelity, a fund’s total return will be greater than it would be had the reimbursement not occurred. How a fund did yesterday is no guarantee of how it will do tomorrow.
Average Annual Total Returns
| For the periods ended October 31, 2017 | Past 1 year | Past 5 years | Past 10 years |
| Class A (incl. 5.75% sales charge) | 18.63% | 7.98% | 0.77% |
| Class M (incl. 3.50% sales charge) | 21.17% | 8.24% | 0.74% |
| Class C (incl. contingent deferred sales charge) | 23.93% | 8.45% | 0.60% |
| Class I | 26.29% | 9.64% | 1.71% |
| Class Z | 26.44% | 9.76% | 1.76% |
Class C shares' contingent deferred sales charges included in the past one year, past five years and past ten years total return figures are 1%, 0% and 0%, respectively.
The initial offering of Class Z shares took place on August 13, 2013. Returns prior to August 13, 2013, are those of Class I.
$10,000 Over 10 Years
Let's say hypothetically that $10,000 was invested in Fidelity Advisor® International Discovery Fund - Class A on October 31, 2007, and the current 5.75% sales charge was paid.
The chart shows how the value of your investment would have changed, and also shows how the MSCI EAFE Index performed over the same period.
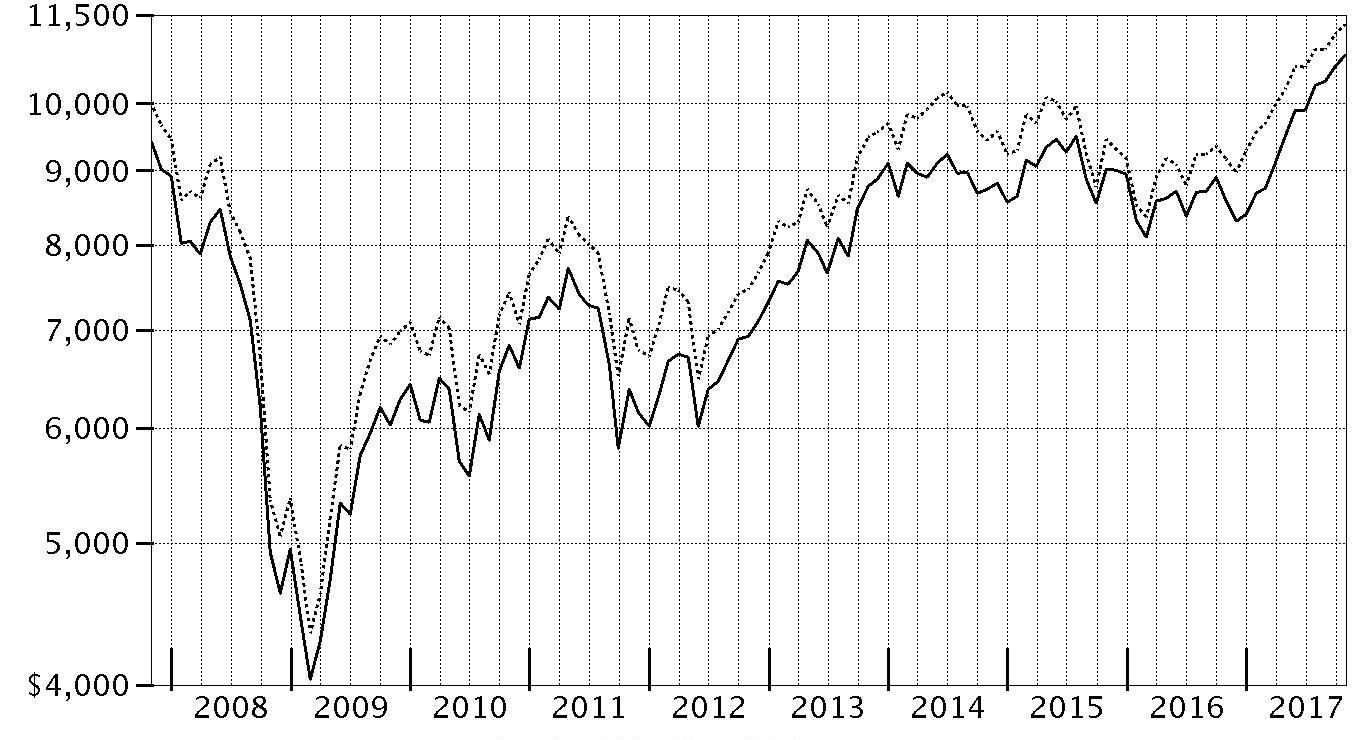
| Period Ending Values |
| $10,797 | Fidelity Advisor® International Discovery Fund - Class A |
| $11,334 | MSCI EAFE Index |
Management's Discussion of Fund Performance
Market Recap: The MSCI ACWI (All Country World Index) ex USA Index returned 23.85% for the 12 months ending October 31, 2017, helped partly by a generally weak U.S. dollar. Some favorable election results in continental Europe (+30%) suggested ebbing political uncertainty and near-term risk there, but the U.K. (+20%) faced more-mixed conditions ahead of its expected exit from the European Union. Despite central-bank easing – and pressured recently by yen strength – Japan (+18%) lagged the rest of the Asia-Pacific group (+22%). Commodity-price volatility slowed Canada (+17%), but the emerging-markets group (+26%) sped ahead. Sector-wise, information technology (+47%) was driven by a surge among several Chinese internet-related names. Financials (+27%) rode rising interest rates that, at the same time, weighed on real estate (+17%), utilities (+16%), consumer staples (+14%) and telecommunication services (+9%) – so-called “bond proxy” sectors. Materials (+28%) and industrials (+27%) responded to demand from China and price gains for certain commodities. In the energy sector (+20%), oil prices lost ground in the spring before rebounding through October 31 to end well above where they started 12 months ago. Lastly, health care (+14%) was hurt by early-period turmoil around drug pricing and health care legislation.
Comments from Portfolio Manager William Kennedy: For the fiscal year, the fund’s share classes (excluding sales charges, if applicable) gained about 25% to 26%, beating the 23.69% return of the benchmark MSCI EAFE Index. Versus the benchmark, security selection, most notably in industrials, and sector allocations, especially an overweighting in the top-performing information technology sector, helped relative performance. Geographically, investments in emerging markets, which are outside the benchmark, as well as in picks in Japan and continental Europe aided fund results the most. Top individual relative contributors included China-based e-commerce giant Alibaba Group Holding. Its stock price surged as expanding e-commerce sales worldwide and the firm's broad offerings drove strong earnings growth. Shares of educational company New Oriental Education & Technology gained as China’s growing middle class invested in their children’s education. On the downside, security selection in the energy sector and, geographically, in out-of-index Canada and the U.S. nicked relative performance. Stock-level detractors included telecommunications-services company KDDI in Japan, which fell from favor as investors shifted toward more economically sensitive names after the Trump election. A non-benchmark stake in Canada's Cenovus Energy and a small cash position also hurt.
The views expressed above reflect those of the portfolio manager(s) only through the end of the period as stated on the cover of this report and do not necessarily represent the views of Fidelity or any other person in the Fidelity organization. Any such views are subject to change at any time based upon market or other conditions and Fidelity disclaims any responsibility to update such views. These views may not be relied on as investment advice and, because investment decisions for a Fidelity fund are based on numerous factors, may not be relied on as an indication of trading intent on behalf of any Fidelity fund.
Investment Summary (Unaudited)
Geographic Diversification (% of fund's net assets)
| As of October 31, 2017 |
| | Japan | 17.8% |
| | United Kingdom | 13.7% |
| | France | 10.3% |
| | Germany | 6.7% |
| | Switzerland | 6.3% |
| | Netherlands | 5.3% |
| | Spain | 4.6% |
| | India | 3.6% |
| | Sweden | 3.2% |
| | Other* | 28.5% |

* Includes Short-Term Investments and Net Other Assets (Liabilities).
| As of April 30, 2017 |
| | Japan | 17.6% |
| | United Kingdom | 15.4% |
| | France | 8.6% |
| | Switzerland | 5.8% |
| | Netherlands | 5.7% |
| | Germany | 5.7% |
| | Sweden | 4.2% |
| | Spain | 4.1% |
| | United States of America* | 3.4% |
| | Other | 29.5% |

* Includes Short-Term Investments and Net Other Assets (Liabilities).
Percentages are based on country or territory of incorporation and are adjusted for the effect of futures contracts, if applicable.
Asset Allocation as of October 31, 2017
| | % of fund's net assets | % of fund's net assets 6 months ago |
| Stocks and Equity Futures | 97.6 | 98.3 |
| Short-Term Investments and Net Other Assets (Liabilities) | 2.4 | 1.7 |
Top Ten Stocks as of October 31, 2017
| | % of fund's net assets | % of fund's net assets 6 months ago |
| Total SA (France, Oil, Gas & Consumable Fuels) | 2.0 | 2.1 |
| Unilever NV (Certificaten Van Aandelen) (Bearer) (Netherlands, Personal Products) | 1.7 | 1.2 |
| SAP SE (Germany, Software) | 1.6 | 1.7 |
| Statoil ASA (Norway, Oil, Gas & Consumable Fuels) | 1.5 | 1.3 |
| ORIX Corp. (Japan, Diversified Financial Services) | 1.2 | 1.1 |
| VINCI SA (France, Construction & Engineering) | 1.2 | 0.9 |
| Sony Corp. (Japan, Household Durables) | 1.2 | 1.1 |
| Micro Focus International PLC (United Kingdom, Software) | 1.0 | 1.4 |
| KBC Groep NV (Belgium, Banks) | 1.0 | 1.0 |
| British American Tobacco PLC (United Kingdom, Tobacco) | 1.0 | 1.2 |
| | 13.4 | |
Top Market Sectors as of October 31, 2017
| | % of fund's net assets | % of fund's net assets 6 months ago |
| Financials | 21.0 | 20.8 |
| Industrials | 14.0 | 16.4 |
| Consumer Discretionary | 13.0 | 13.9 |
| Health Care | 11.0 | 7.7 |
| Information Technology | 10.7 | 13.3 |
| Consumer Staples | 10.4 | 10.0 |
| Materials | 5.6 | 6.2 |
| Energy | 5.3 | 4.8 |
| Telecommunication Services | 2.9 | 2.8 |
| Real Estate | 1.9 | 1.1 |
Investments October 31, 2017
Showing Percentage of Net Assets
| Common Stocks - 95.3% | | | |
| | | Shares | Value (000s) |
| Australia - 2.0% | | | |
| Altium Ltd. | | 1,569,213 | $14,388 |
| Australia & New Zealand Banking Group Ltd. | | 2,498,457 | 57,213 |
| Bapcor Ltd. | | 8,747,451 | 36,420 |
| Magellan Financial Group Ltd. | | 1,204,177 | 22,368 |
| Ramsay Health Care Ltd. | | 1,002,986 | 51,362 |
| Spark Infrastructure Group unit | | 18,522,715 | 36,008 |
|
| TOTAL AUSTRALIA | | | 217,759 |
|
| Austria - 1.0% | | | |
| Erste Group Bank AG | | 1,238,700 | 53,229 |
| Wienerberger AG | | 2,081,200 | 53,480 |
|
| TOTAL AUSTRIA | | | 106,709 |
|
| Bailiwick of Jersey - 1.4% | | | |
| Glencore Xstrata PLC | | 20,685,349 | 99,728 |
| Randgold Resources Ltd. sponsored ADR | | 189,614 | 18,633 |
| Shire PLC | | 552,000 | 27,189 |
|
| TOTAL BAILIWICK OF JERSEY | | | 145,550 |
|
| Belgium - 1.5% | | | |
| Anheuser-Busch InBev SA NV | | 423,027 | 51,872 |
| KBC Groep NV | | 1,297,261 | 107,758 |
|
| TOTAL BELGIUM | | | 159,630 |
|
| Bermuda - 0.3% | | | |
| Hiscox Ltd. | | 1,872,000 | 35,504 |
| British Virgin Islands - 0.1% | | | |
| Mail.Ru Group Ltd. GDR (Reg. S) (a) | | 219,200 | 7,124 |
| Canada - 1.9% | | | |
| Alimentation Couche-Tard, Inc. Class B (sub. vtg.) | | 725,100 | 33,998 |
| Cenovus Energy, Inc. | | 3,404,200 | 33,037 |
| Constellation Software, Inc. | | 76,000 | 43,239 |
| Franco-Nevada Corp. | | 227,700 | 18,088 |
| PrairieSky Royalty Ltd. (b) | | 1,763,973 | 46,954 |
| Suncor Energy, Inc. | | 676,200 | 22,958 |
|
| TOTAL CANADA | | | 198,274 |
|
| Cayman Islands - 1.5% | | | |
| Alibaba Group Holding Ltd. sponsored ADR (a) | | 446,500 | 82,553 |
| ASM Pacific Technology Ltd. | | 1,577,700 | 22,953 |
| JD.com, Inc. sponsored ADR (a) | | 762,600 | 28,613 |
| New Oriental Education & Technology Group, Inc. sponsored ADR | | 255,900 | 21,301 |
|
| TOTAL CAYMAN ISLANDS | | | 155,420 |
|
| China - 1.4% | | | |
| Kweichow Moutai Co. Ltd. (A Shares) | | 607,482 | 56,586 |
| Qingdao Port International Co. Ltd. | | 11,154,000 | 7,878 |
| Shanghai International Airport Co. Ltd. (A Shares) | | 5,861,900 | 38,653 |
| Wuliangye Yibin Co. Ltd. Class A | | 4,443,400 | 44,615 |
|
| TOTAL CHINA | | | 147,732 |
|
| Denmark - 0.7% | | | |
| Novo Nordisk A/S Series B | | 966,145 | 48,103 |
| Novozymes A/S Series B | | 393,200 | 21,715 |
|
| TOTAL DENMARK | | | 69,818 |
|
| Finland - 0.5% | | | |
| Sampo Oyj (A Shares) | | 929,800 | 48,717 |
| France - 10.3% | | | |
| Accor SA | | 664,400 | 33,151 |
| ALTEN | | 336,259 | 29,436 |
| Altran Technologies SA | | 1,492,300 | 27,604 |
| Amundi SA | | 567,258 | 48,091 |
| Atos Origin SA | | 252,720 | 39,270 |
| AXA SA | | 1,278,800 | 38,605 |
| BNP Paribas SA | | 774,100 | 60,451 |
| Capgemini SA | | 486,200 | 59,099 |
| Cegedim SA (a) | | 536,390 | 20,869 |
| Elis SA | | 1,199,800 | 31,299 |
| Kaufman & Broad SA | | 454,247 | 20,070 |
| Maisons du Monde SA | | 1,122,200 | 48,562 |
| Rexel SA | | 1,540,100 | 27,493 |
| Sanofi SA | | 952,591 | 90,198 |
| Sartorius Stedim Biotech | | 306,000 | 20,856 |
| SMCP S.A.S. | | 644,668 | 16,250 |
| Societe Generale Series A | | 1,243,700 | 69,218 |
| Sodexo SA | | 558,700 | 71,100 |
| Total SA | | 3,896,574 | 217,042 |
| VINCI SA (b) | | 1,321,700 | 129,402 |
|
| TOTAL FRANCE | | | 1,098,066 |
|
| Germany - 6.7% | | | |
| adidas AG | | 360,212 | 80,163 |
| Aumann AG | | 133,851 | 12,411 |
| Deutsche Borse AG | | 164,581 | 17,045 |
| Deutsche Post AG | | 2,254,367 | 103,254 |
| Deutsche Telekom AG | | 1,845,500 | 33,417 |
| Fresenius SE & Co. KGaA | | 429,100 | 35,843 |
| Henkel AG & Co. KGaA | | 333,900 | 42,084 |
| MTU Aero Engines Holdings AG | | 380,800 | 64,207 |
| Muenchener Rueckversicherungs AG | | 122,700 | 27,449 |
| Nexus AG | | 604,505 | 18,347 |
| Rational AG | | 76,305 | 50,042 |
| Rheinmetall AG | | 313,900 | 37,022 |
| SAP SE | | 1,522,370 | 173,950 |
| Wirecard AG | | 222,600 | 21,923 |
|
| TOTAL GERMANY | | | 717,157 |
|
| Hong Kong - 1.2% | | | |
| AIA Group Ltd. | | 9,260,800 | 69,681 |
| Techtronic Industries Co. Ltd. | | 10,229,000 | 59,986 |
|
| TOTAL HONG KONG | | | 129,667 |
|
| India - 3.6% | | | |
| Avenue Supermarts Ltd. | | 595,148 | 10,484 |
| Bharat Petroleum Corp. Ltd. | | 3,495,188 | 29,235 |
| Bharti Infratel Ltd. | | 8,217,708 | 56,115 |
| HDFC Bank Ltd. | | 1,034,409 | 28,953 |
| HDFC Bank Ltd. sponsored ADR | | 694,884 | 64,138 |
| Housing Development Finance Corp. Ltd. | | 3,719,156 | 98,071 |
| Kajaria Ceramics Ltd. | | 2,444,763 | 25,682 |
| Kotak Mahindra Bank Ltd. | | 1,211,049 | 19,172 |
| Petronet LNG Ltd. | | 6,098,248 | 24,473 |
| PNB Housing Finance Ltd. | | 838,105 | 18,420 |
| PVR Ltd. | | 442,801 | 9,486 |
|
| TOTAL INDIA | | | 384,229 |
|
| Indonesia - 0.6% | | | |
| PT Bank Central Asia Tbk | | 16,688,600 | 25,717 |
| PT Bank Rakyat Indonesia Tbk | | 32,624,300 | 37,525 |
|
| TOTAL INDONESIA | | | 63,242 |
|
| Ireland - 3.1% | | | |
| Allied Irish Banks PLC | | 2,202,142 | 13,016 |
| Cairn Homes PLC (a) | | 20,930,170 | 43,458 |
| CRH PLC | | 2,162,910 | 81,395 |
| DCC PLC (United Kingdom) | | 366,900 | 34,793 |
| Glenveagh Properties PLC | | 13,703,776 | 17,958 |
| Green REIT PLC | | 9,492,200 | 16,696 |
| James Hardie Industries PLC CDI | | 1,790,532 | 27,257 |
| Kerry Group PLC Class A | | 571,300 | 57,531 |
| Ryanair Holdings PLC sponsored ADR (a) | | 355,466 | 39,851 |
|
| TOTAL IRELAND | | | 331,955 |
|
| Israel - 0.5% | | | |
| Frutarom Industries Ltd. | | 692,800 | 57,037 |
| Italy - 0.9% | | | |
| De Longhi SpA | | 734,500 | 24,085 |
| Intesa Sanpaolo SpA | | 22,174,600 | 74,549 |
|
| TOTAL ITALY | | | 98,634 |
|
| Japan - 16.3% | | | |
| AEON Financial Service Co. Ltd. | | 1,637,700 | 35,172 |
| Daito Trust Construction Co. Ltd. | | 170,800 | 29,862 |
| Hoya Corp. | | 1,466,200 | 79,660 |
| Investors Cloud Co. Ltd. (b) | | 442,100 | 26,961 |
| KDDI Corp. | | 3,906,500 | 104,079 |
| Keyence Corp. | | 137,820 | 76,521 |
| Komatsu Ltd. | | 1,572,500 | 51,383 |
| Misumi Group, Inc. | | 1,138,800 | 31,200 |
| Mitsubishi UFJ Financial Group, Inc. | | 13,323,000 | 90,372 |
| Monex Group, Inc. | | 10,069,949 | 32,115 |
| Morinaga & Co. Ltd. | | 578,200 | 32,847 |
| Nidec Corp. | | 324,300 | 43,126 |
| Nintendo Co. Ltd. | | 109,300 | 42,404 |
| Nitori Holdings Co. Ltd. | | 490,500 | 71,285 |
| Olympus Corp. | | 2,074,600 | 77,206 |
| ORIX Corp. | | 7,596,400 | 130,610 |
| Panasonic Corp. | | 6,185,200 | 93,393 |
| Recruit Holdings Co. Ltd. | | 951,600 | 23,331 |
| Relo Holdings Corp. | | 2,579,800 | 63,870 |
| Renesas Electronics Corp. (a) | | 6,360,600 | 82,237 |
| SMC Corp. | | 135,700 | 51,913 |
| SMS Co., Ltd. | | 1,148,500 | 34,598 |
| SoftBank Corp. | | 816,200 | 72,333 |
| Sony Corp. | | 2,969,500 | 124,228 |
| Start Today Co. Ltd. | | 1,828,300 | 50,076 |
| Sundrug Co. Ltd. | | 870,200 | 37,870 |
| Toto Ltd. | | 61,000 | 2,987 |
| Tsuruha Holdings, Inc. | | 468,800 | 58,123 |
| VT Holdings Co. Ltd. | | 3,872,500 | 21,080 |
| Welcia Holdings Co. Ltd. | | 1,666,500 | 63,247 |
|
| TOTAL JAPAN | | | 1,734,089 |
|
| Korea (South) - 0.3% | | | |
| Hyundai Fire & Marine Insurance Co. Ltd. | | 331,774 | 13,457 |
| KB Financial Group, Inc. | | 437,375 | 22,914 |
|
| TOTAL KOREA (SOUTH) | | | 36,371 |
|
| Luxembourg - 0.7% | | | |
| Eurofins Scientific SA | | 122,139 | 76,401 |
| Marshall Islands - 0.1% | | | |
| Hoegh LNG Partners LP | | 715,655 | 13,562 |
| Netherlands - 5.3% | | | |
| ASML Holding NV (Netherlands) | | 438,700 | 79,154 |
| Basic-Fit NV (a) | | 579,100 | 13,299 |
| IMCD Group BV | | 1,264,300 | 79,527 |
| ING Groep NV (Certificaten Van Aandelen) | | 4,861,400 | 89,836 |
| Intertrust NV (b) | | 715,684 | 11,004 |
| Koninklijke Philips Electronics NV | | 2,599,026 | 105,918 |
| Unilever NV (Certificaten Van Aandelen) (Bearer) | | 3,031,776 | 176,116 |
| Van Lanschot NV (Bearer) | | 223,700 | 6,789 |
|
| TOTAL NETHERLANDS | | | 561,643 |
|
| New Zealand - 1.1% | | | |
| EBOS Group Ltd. | | 3,154,998 | 37,998 |
| Fisher & Paykel Healthcare Corp. | | 3,744,125 | 33,948 |
| Ryman Healthcare Group Ltd. | | 6,393,204 | 40,686 |
|
| TOTAL NEW ZEALAND | | | 112,632 |
|
| Norway - 1.5% | | | |
| Statoil ASA (b) | | 7,822,109 | 158,926 |
| Philippines - 0.3% | | | |
| SM Investments Corp. | | 1,974,665 | 36,557 |
| Romania - 0.3% | | | |
| Banca Transilvania SA | | 63,057,091 | 35,103 |
| Russia - 0.4% | | | |
| Sberbank of Russia sponsored ADR | | 3,048,700 | 43,749 |
| South Africa - 0.9% | | | |
| Aspen Pharmacare Holdings Ltd. | | 656,700 | 14,837 |
| Naspers Ltd. Class N | | 320,800 | 78,165 |
|
| TOTAL SOUTH AFRICA | | | 93,002 |
|
| Spain - 4.6% | | | |
| Aedas Homes SAU | | 406,831 | 14,217 |
| Amadeus IT Holding SA Class A | | 790,100 | 53,610 |
| Atresmedia Corporacion de Medios de Comunicacion SA | | 1,229,800 | 12,635 |
| CaixaBank SA (b) | | 18,391,133 | 86,077 |
| Grifols SA ADR | | 2,461,958 | 58,225 |
| Hispania Activos Inmobiliarios SA | | 1,424,325 | 24,563 |
| Inditex SA (b) | | 1,333,256 | 49,845 |
| Masmovil Ibercom SA (a)(b) | | 323,297 | 26,708 |
| Mediaset Espana Comunicacion SA | | 2,378,700 | 25,857 |
| Neinor Homes SLU | | 2,255,500 | 46,359 |
| Prosegur Cash SA | | 19,469,700 | 63,502 |
| Zardoya Otis SA | | 2,111,573 | 22,875 |
|
| TOTAL SPAIN | | | 484,473 |
|
| Sweden - 3.2% | | | |
| ASSA ABLOY AB (B Shares) | | 3,321,800 | 70,033 |
| Com Hem Holding AB | | 847,200 | 12,721 |
| Essity AB Class B | | 2,669,400 | 79,811 |
| HEXPOL AB (B Shares) | | 1,872,700 | 18,947 |
| Indutrade AB | | 1,342,200 | 37,228 |
| Nordea Bank AB | | 4,487,200 | 54,243 |
| Saab AB (B Shares) | | 650,800 | 33,257 |
| Svenska Cellulosa AB (SCA) (B Shares) | | 4,118,900 | 38,672 |
|
| TOTAL SWEDEN | | | 344,912 |
|
| Switzerland - 6.3% | | | |
| ABB Ltd. (Reg.) | | 3,695,570 | 96,510 |
| Credit Suisse Group AG | | 3,492,359 | 55,036 |
| Forbo Holding AG (Reg.) | | 20,130 | 30,428 |
| Julius Baer Group Ltd. | | 868,620 | 51,377 |
| Kaba Holding AG (B Shares) (Reg.) | | 41,400 | 40,958 |
| Lonza Group AG | | 204,259 | 54,256 |
| Nestle SA (Reg. S) | | 821,706 | 69,137 |
| Partners Group Holding AG | | 77,036 | 51,813 |
| Roche Holding AG (participation certificate) | | 305,286 | 70,561 |
| Schindler Holding AG (participation certificate) | | 170,348 | 38,606 |
| Swatch Group AG (Bearer) | | 155,600 | 60,983 |
| UBS Group AG | | 3,179,340 | 54,112 |
|
| TOTAL SWITZERLAND | | | 673,777 |
|
| Taiwan - 0.5% | | | |
| Taiwan Semiconductor Manufacturing Co. Ltd. | | 2,732,000 | 22,102 |
| United Microelectronics Corp. | | 62,100,000 | 32,073 |
|
| TOTAL TAIWAN | | | 54,175 |
|
| United Kingdom - 13.7% | | | |
| Anglo American PLC (United Kingdom) | | 1,384,500 | 26,111 |
| AstraZeneca PLC (United Kingdom) | | 1,048,809 | 70,963 |
| BAE Systems PLC | | 4,102,004 | 32,313 |
| Barclays PLC | | 58,542 | 144 |
| BCA Marketplace PLC | | 7,762,300 | 21,470 |
| BHP Billiton PLC | | 3,418,385 | 61,892 |
| Booker Group PLC | | 17,550,700 | 46,900 |
| British American Tobacco PLC (United Kingdom) | | 1,219,764 | 78,809 |
| Bunzl PLC | | 1,995,172 | 62,140 |
| Cineworld Group PLC | | 2,055,200 | 18,138 |
| CMC Markets PLC | | 12,570,100 | 26,628 |
| Compass Group PLC | | 1,853,606 | 40,695 |
| Conviviality PLC | | 3,508,273 | 19,815 |
| Countryside Properties PLC | | 3,344,076 | 15,785 |
| Cranswick PLC | | 1,341,488 | 54,876 |
| GlaxoSmithKline PLC | | 3,585,419 | 64,349 |
| Hastings Group Holdings PLC | | 3,610,729 | 15,111 |
| Imperial Tobacco Group PLC | | 865,288 | 35,287 |
| Jiangsu Yanghe Brewery JSC Ltd. ELS (HSBC Warrant Program) warrants 9/19/19 (a)(c) | | 2,466,200 | 40,976 |
| John Wood Group PLC | | 2,221,100 | 20,989 |
| Liberty Global PLC Class A (a) | | 1,294,500 | 39,935 |
| LivaNova PLC (a) | | 682,328 | 50,424 |
| London Stock Exchange Group PLC | | 949,236 | 47,416 |
| Melrose Industries PLC | | 23,769,234 | 69,420 |
| Micro Focus International PLC | | 3,150,505 | 110,676 |
| Moneysupermarket.com Group PLC | | 5,256,022 | 22,681 |
| NCC Group Ltd. (b) | | 9,151,300 | 27,955 |
| Reckitt Benckiser Group PLC | | 769,819 | 68,873 |
| Rex Bionics PLC (a)(d)(e) | | 1,297,286 | 30 |
| Rio Tinto PLC | | 922,450 | 43,596 |
| Senior Engineering Group PLC | | 7,132,100 | 27,309 |
| Spirax-Sarco Engineering PLC | | 312,000 | 23,413 |
| St. James's Place Capital PLC | | 2,427,309 | 37,944 |
| Standard Chartered PLC (United Kingdom) (a) | | 9,043,920 | 90,136 |
| Zpg PLC | | 8,675,409 | 40,328 |
|
| TOTAL UNITED KINGDOM | | | 1,453,527 |
|
| United States of America - 0.6% | | | |
| British American Tobacco PLC sponsored ADR | | 423,000 | 27,241 |
| Monsanto Co. | | 287,400 | 34,804 |
| MSCI, Inc. | | 42,200 | 4,953 |
|
| TOTAL UNITED STATES OF AMERICA | | | 66,998 |
|
| TOTAL COMMON STOCKS | | | |
| (Cost $7,887,727) | | | 10,152,121 |
|
| Preferred Stocks - 0.8% | | | |
| Convertible Preferred Stocks - 0.3% | | | |
| Cayman Islands - 0.3% | | | |
| China Internet Plus Holdings Ltd. Series A-11 (a)(e)(f) | | 5,958,244 | 33,301 |
| Nonconvertible Preferred Stocks - 0.5% | | | |
| Brazil - 0.5% | | | |
| Itausa-Investimentos Itau SA (PN) | | 16,420,200 | 52,604 |
| TOTAL PREFERRED STOCKS | | | |
| (Cost $76,501) | | | 85,905 |
| | | Principal Amount (000s) | Value (000s) |
|
| Government Obligations - 0.0% | | | |
| United States of America - 0.0% | | | |
U.S. Treasury Bills, yield at date of purchase 0.99% to 1.04% 11/30/17 to 12/7/17
(Cost $4,516)(g) | | 4,520 | 4,516 |
| | | Shares | Value (000s) |
|
| Money Market Funds - 7.6% | | | |
| Fidelity Cash Central Fund, 1.10% (h) | | 388,022,983 | 388,101 |
| Fidelity Securities Lending Cash Central Fund 1.11% (h)(i) | | 417,529,962 | 417,572 |
| TOTAL MONEY MARKET FUNDS | | | |
| (Cost $805,681) | | | 805,673 |
| TOTAL INVESTMENT IN SECURITIES - 103.7% | | | |
| (Cost $8,774,425) | | | 11,048,215 |
| NET OTHER ASSETS (LIABILITIES) - (3.7)% | | | (398,953) |
| NET ASSETS - 100% | | | $10,649,262 |
| Futures Contracts | | | | | |
| | Number of contracts | Expiration Date | Notional Amount (000s) | Value (000s) | Unrealized Appreciation/(Depreciation) (000s) |
| Purchased | | | | | |
| Equity Index Contracts | | | | | |
| TSE TOPIX Index Contracts (Japan) | 1,035 | Dec. 2017 | $160,477 | $16,840 | $16,840 |
The notional amount of futures purchased as a percentage of Net Assets is 1.5%
Security Type Abbreviations
ELS – Equity-Linked Security
Categorizations in the Schedule of Investments are based on country or territory of incorporation.
Legend
(a) Non-income producing
(b) Security or a portion of the security is on loan at period end.
(c) Security exempt from registration under Rule 144A of the Securities Act of 1933. These securities may be resold in transactions exempt from registration, normally to qualified institutional buyers. At the end of the period, the value of these securities amounted to $40,976,000 or 0.4% of net assets.
(d) Affiliated company
(e) Level 3 security
(f) Restricted securities - Investment in securities not registered under the Securities Act of 1933 (excluding 144A issues). At the end of the period, the value of restricted securities (excluding 144A issues) amounted to $33,301,000 or 0.3% of net assets.
(g) Security or a portion of the security was pledged to cover margin requirements for futures contracts. At period end, the value of securities pledged amounted to $4,516,000.
(h) Affiliated fund that is generally available only to investment companies and other accounts managed by Fidelity Investments. The rate quoted is the annualized seven-day yield of the fund at period end. A complete unaudited listing of the fund's holdings as of its most recent quarter end is available upon request. In addition, each Fidelity Central Fund's financial statements, which are not covered by the Fund's Report of Independent Registered Public Accounting Firm, are available on the SEC's website or upon request.
(i) Investment made with cash collateral received from securities on loan.
Additional information on each restricted holding is as follows:
| Security | Acquisition Date | Acquisition Cost (000s) |
| China Internet Plus Holdings Ltd. Series A-11 | 1/26/15 | $18,833 |
Affiliated Central Funds
Information regarding fiscal year to date income earned by the Fund from investments in Fidelity Central Funds is as follows:
| Fund | Income earned |
| | (Amounts in thousands) |
| Fidelity Cash Central Fund | $1,715 |
| Fidelity Securities Lending Cash Central Fund | 4,300 |
| Total | $6,015 |
Other Affiliated Issuers
An affiliated company is a company in which the Fund has ownership of at least 5% of the voting securities. Fiscal year to date transactions with companies which are or were affiliates are as follows:
| Affiliate (Amounts in thousands) | Value, beginning of period | Purchases | Sales Proceeds | Dividend Income | Realized Gain (loss) | Change in Unrealized appreciation (depreciation) | Value, end of period |
| Hoegh LNG Partners LP | $12,739 | $-- | $-- | $975 | $-- | $1,746 | $-- |
| Rex Bionics PLC | 357 | -- | -- | -- | -- | (327) | 30 |
| Total | $13,096 | $-- | $-- | $975 | $-- | $1,419 | $30 |
Investment Valuation
The following is a summary of the inputs used, as of October 31, 2017, involving the Fund's assets and liabilities carried at fair value. The inputs or methodology used for valuing securities may not be an indication of the risk associated with investing in those securities. For more information on valuation inputs, and their aggregation into the levels used below, please refer to the Investment Valuation section in the accompanying Notes to Financial Statements.
| | Valuation Inputs at Reporting Date: |
| Description | Total | Level 1 | Level 2 | Level 3 |
| (Amounts in thousands) | | | | |
| Investments in Securities: | | | | |
| Equities: | | | | |
| Consumer Discretionary | $1,350,086 | $956,723 | $360,062 | $33,301 |
| Consumer Staples | 1,135,638 | 498,744 | 636,894 | -- |
| Energy | 567,176 | 191,208 | 375,968 | -- |
| Financials | 2,267,079 | 1,490,157 | 776,922 | -- |
| Health Care | 1,148,229 | 514,052 | 634,147 | 30 |
| Industrials | 1,487,077 | 1,084,281 | 402,796 | -- |
| Information Technology | 1,145,878 | 602,839 | 543,039 | -- |
| Materials | 601,355 | 414,472 | 186,883 | -- |
| Real Estate | 194,127 | 73,434 | 120,693 | -- |
| Telecommunication Services | 305,373 | 95,544 | 209,829 | -- |
| Utilities | 36,008 | 36,008 | -- | -- |
| Government Obligations | 4,516 | -- | 4,516 | -- |
| Money Market Funds | 805,673 | 805,673 | -- | -- |
| Total Investments in Securities: | $11,048,215 | $6,763,135 | $4,251,749 | $33,331 |
| Derivative Instruments: | | | | |
| Assets | | | | |
| Futures Contracts | $16,840 | $16,840 | $-- | $-- |
| Total Assets | $16,840 | $16,840 | $-- | $-- |
| Total Derivative Instruments: | $16,840 | $16,840 | $-- | $-- |
The following is a summary of transfers between Level 1 and Level 2 for the period ended October 31, 2017. Transfers are assumed to have occurred at the beginning of the period, and are primarily attributable to the valuation techniques used for foreign equity securities, as discussed in the accompanying Notes to Financial Statements:
| Transfers | Total (000s) |
| Level 1 to Level 2 | $1,142,021 |
| Level 2 to Level 1 | $181,730 |
Value of Derivative Instruments
The following table is a summary of the Fund's value of derivative instruments by primary risk exposure as of October 31, 2017. For additional information on derivative instruments, please refer to the Derivative Instruments section in the accompanying Notes to Financial Statements.
| Primary Risk Exposure / Derivative Type | Value |
| | Asset | Liability |
| (Amounts in thousands) | | |
| Equity Risk | | |
| Futures Contracts(a) | $16,840 | $0 |
| Total Equity Risk | 16,840 | 0 |
| Total Value of Derivatives | $16,840 | $0 |
(a) Reflects gross cumulative appreciation (depreciation) on futures contracts as presented in the Schedule of Investments. In the Statement of Assets and Liabilities, the period end daily variation margin is included in receivable or payable for daily variation margin on futures contracts, and the net cumulative appreciation (depreciation) is included in net unrealized appreciation (depreciation).
See accompanying notes which are an integral part of the financial statements.
Financial Statements
Statement of Assets and Liabilities
| Amounts in thousands (except per-share amounts) | | October 31, 2017 |
| Assets | | |
Investment in securities, at value (including securities loaned of $394,457) — See accompanying schedule:
Unaffiliated issuers (cost $7,964,803) | $10,242,512 | |
| Fidelity Central Funds (cost $805,681) | 805,673 | |
| Other affiliated issuers (cost $3,941) | 30 | |
| Total Investment in Securities (cost $8,774,425) | | $11,048,215 |
| Foreign currency held at value (cost $10) | | 10 |
| Receivable for investments sold | | 12,605 |
| Receivable for fund shares sold | | 6,444 |
| Dividends receivable | | 26,726 |
| Distributions receivable from Fidelity Central Funds | | 696 |
| Prepaid expenses | | 23 |
| Other receivables | | 4,694 |
| Total assets | | 11,099,413 |
| Liabilities | | |
| Payable to custodian bank | $19 | |
| Payable for investments purchased | 11,110 | |
| Payable for fund shares redeemed | 11,664 | |
| Accrued management fee | 6,647 | |
| Distribution and service plan fees payable | 89 | |
| Payable for daily variation margin on futures contracts | 683 | |
| Other affiliated payables | 1,374 | |
| Other payables and accrued expenses | 966 | |
| Collateral on securities loaned | 417,599 | |
| Total liabilities | | 450,151 |
| Net Assets | | $10,649,262 |
| Net Assets consist of: | | |
| Paid in capital | | $7,869,998 |
| Undistributed net investment income | | 108,446 |
| Accumulated undistributed net realized gain (loss) on investments and foreign currency transactions | | 381,985 |
| Net unrealized appreciation (depreciation) on investments and assets and liabilities in foreign currencies | | 2,288,833 |
| Net Assets | | $10,649,262 |
| Calculation of Maximum Offering Price | | |
| Class A: | | |
| Net Asset Value and redemption price per share ($247,565 ÷ 5,306.0 shares) | | $46.66 |
| Maximum offering price per share (100/94.25 of $46.66) | | $49.51 |
| Class M: | | |
| Net Asset Value and redemption price per share ($34,856 ÷ 752.0 shares) | | $46.35 |
| Maximum offering price per share (100/96.50 of $46.35) | | $48.03 |
| Class C: | | |
| Net Asset Value and offering price per share ($28,404 ÷ 618.3 shares)(a) | | $45.94 |
| International Discovery: | | |
| Net Asset Value, offering price and redemption price per share ($7,350,693 ÷ 156,279.9 shares) | | $47.04 |
| Class K: | | |
| Net Asset Value, offering price and redemption price per share ($2,228,308 ÷ 47,456.1 shares) | | $46.96 |
| Class I: | | |
| Net Asset Value, offering price and redemption price per share ($658,324 ÷ 14,031.2 shares) | | $46.92 |
| Class Z: | | |
| Net Asset Value, offering price and redemption price per share ($101,112 ÷ 2,154.8 shares) | | $46.92 |
(a) Redemption price per share is equal to net asset value less any applicable contingent deferred sales charge.
See accompanying notes which are an integral part of the financial statements.
Statement of Operations
| Amounts in thousands | | Year ended October 31, 2017 |
| Investment Income | | |
| Dividends (including $975 earned from other affiliated issuers) | | $219,771 |
| Interest | | 20 |
| Income from Fidelity Central Funds | | 6,015 |
| Income before foreign taxes withheld | | 225,806 |
| Less foreign taxes withheld | | (19,098) |
| Total income | | 206,708 |
| Expenses | | |
| Management fee | | |
| Basic fee | $64,306 | |
| Performance adjustment | 6,041 | |
| Transfer agent fees | 14,185 | |
| Distribution and service plan fees | 1,008 | |
| Accounting and security lending fees | 1,784 | |
| Custodian fees and expenses | 1,428 | |
| Independent trustees' fees and expenses | 38 | |
| Registration fees | 173 | |
| Audit | 122 | |
| Legal | 48 | |
| Miscellaneous | 81 | |
| Total expenses before reductions | 89,214 | |
| Expense reductions | (1,429) | 87,785 |
| Net investment income (loss) | | 118,923 |
| Realized and Unrealized Gain (Loss) | | |
| Net realized gain (loss) on: | | |
| Investment securities: | | |
| Unaffiliated issuers | 1,016,110 | |
| Fidelity Central Funds | (12) | |
| Foreign currency transactions | (163) | |
| Futures contracts | 14,541 | |
| Total net realized gain (loss) | | 1,030,476 |
| Change in net unrealized appreciation (depreciation) on: | | |
| Investment securities: | | |
| Unaffiliated issuers | 1,087,126 | |
| Fidelity Central Funds | (36) | |
| Other affiliated issuers | 1,419 | |
| Assets and liabilities in foreign currencies | 858 | |
| Futures contracts | 13,054 | |
| Total change in net unrealized appreciation (depreciation) | | 1,102,421 |
| Net gain (loss) | | 2,132,897 |
| Net increase (decrease) in net assets resulting from operations | | $2,251,820 |
See accompanying notes which are an integral part of the financial statements.
Statement of Changes in Net Assets
| Amounts in thousands | Year ended October 31, 2017 | Year ended October 31, 2016 |
| Increase (Decrease) in Net Assets | | |
| Operations | | |
| Net investment income (loss) | $118,923 | $162,246 |
| Net realized gain (loss) | 1,030,476 | (541,847) |
| Change in net unrealized appreciation (depreciation) | 1,102,421 | (131,024) |
| Net increase (decrease) in net assets resulting from operations | 2,251,820 | (510,625) |
| Distributions to shareholders from net investment income | (150,174) | (113,434) |
| Distributions to shareholders from net realized gain | (11,939) | (1,362) |
| Total distributions | (162,113) | (114,796) |
| Share transactions - net increase (decrease) | (822,002) | (960,274) |
| Redemption fees | 9 | 70 |
| Total increase (decrease) in net assets | 1,267,714 | (1,585,625) |
| Net Assets | | |
| Beginning of period | 9,381,548 | 10,967,173 |
| End of period | $10,649,262 | $9,381,548 |
| Other Information | | |
| Undistributed net investment income end of period | $108,446 | $142,052 |
See accompanying notes which are an integral part of the financial statements.
Financial Highlights
Fidelity International Discovery Fund Class A
| Years ended October 31, | 2017 | 2016 | 2015 | 2014 | 2013 |
| Selected Per–Share Data | | | | | |
| Net asset value, beginning of period | $37.60 | $39.78 | $38.70 | $39.49 | $31.66 |
| Income from Investment Operations | | | | | |
| Net investment income (loss)A | .36 | .47B | .40C | .53D | .34 |
| Net realized and unrealized gain (loss) | 9.22 | (2.38) | .79 | (.67) | 7.97 |
| Total from investment operations | 9.58 | (1.91) | 1.19 | (.14) | 8.31 |
| Distributions from net investment income | (.47) | (.27) | (.11) | (.33) | (.45) |
| Distributions from net realized gain | (.05) | (.01) | – | (.31) | (.03) |
| Total distributions | (.52) | (.27)E | (.11) | (.65)F | (.48) |
| Redemption fees added to paid in capitalA,G | – | – | – | – | – |
| Net asset value, end of period | $46.66 | $37.60 | $39.78 | $38.70 | $39.49 |
| Total ReturnH,I | 25.87% | (4.83)% | 3.09% | (.36)% | 26.59% |
| Ratios to Average Net AssetsJ,K | | | | | |
| Expenses before reductions | 1.29% | 1.35% | 1.33% | 1.28% | 1.35% |
| Expenses net of fee waivers, if any | 1.29% | 1.35% | 1.33% | 1.28% | 1.35% |
| Expenses net of all reductions | 1.27% | 1.34% | 1.32% | 1.28% | 1.33% |
| Net investment income (loss) | .88% | 1.26%B | 1.00%C | 1.35%D | .97% |
| Supplemental Data | | | | | |
| Net assets, end of period (in millions) | $248 | $236 | $283 | $297 | $347 |
| Portfolio turnover rateL | 42% | 50%M | 60%M | 57% | 65% |
A Calculated based on average shares outstanding during the period.
B Net Investment income per share reflects a large, non-recurring dividend which amounted to $.14 per share. Excluding this non-recurring dividend, the ratio of net investment income (loss) to average net assets would have been .88%.
C Net Investment income per share reflects a large, non-recurring dividend which amounted to $.12 per share. Excluding this non-recurring dividend, the ratio of net investment income (loss) to average net assets would have been .69%.
D Net Investment income per share reflects a large, non-recurring dividend which amounted to $.22 per share. Excluding this non-recurring dividend, the ratio of net investment income (loss) to average net assets would have been .80%.
E Total distributions of $.27 per share is comprised of distributions from net investment income of $.269 and distributions from net realized gain of $.005 per share.
F Total distributions of $.65 per share is comprised of distributions from net investment income of $.334 and distributions from net realized gain of $.311 per share.
G Amount represents less than $.005 per share.
H Total returns would have been lower if certain expenses had not been reduced during the applicable periods shown.
I Total returns do not include the effect of the sales charges.
J Fees and expenses of any underlying Fidelity Central Funds are not included in the Fund's expense ratio. The Fund indirectly bears its proportionate share of the expenses of any underlying Fidelity Central Funds.
K Expense ratios reflect operating expenses of the class. Expenses before reductions do not reflect amounts reimbursed by the investment adviser or reductions from brokerage service arrangements or reductions from other expense offset arrangements and do not represent the amount paid by the class during periods when reimbursements or reductions occur. Expenses net of fee waivers reflect expenses after reimbursement by the investment adviser but prior to reductions from brokerage service arrangements or other expense offset arrangements. Expenses net of all reductions represent the net expenses paid by the class.
L Amount does not include the portfolio activity of any underlying Fidelity Central Funds.
M Portfolio turnover rate excludes securities received or delivered in-kind.
See accompanying notes which are an integral part of the financial statements.
Fidelity International Discovery Fund Class M
| Years ended October 31, | 2017 | 2016 | 2015 | 2014 | 2013 |
| Selected Per–Share Data | | | | | |
| Net asset value, beginning of period | $37.34 | $39.51 | $38.43 | $39.23 | $31.42 |
| Income from Investment Operations | | | | | |
| Net investment income (loss)A | .26 | .38B | .30C | .44D | .26 |
| Net realized and unrealized gain (loss) | 9.17 | (2.37) | .80 | (.68) | 7.92 |
| Total from investment operations | 9.43 | (1.99) | 1.10 | (.24) | 8.18 |
| Distributions from net investment income | (.37) | (.17) | (.02) | (.25) | (.34) |
| Distributions from net realized gain | (.05) | (.01) | – | (.31) | (.03) |
| Total distributions | (.42) | (.18) | (.02) | (.56) | (.37) |
| Redemption fees added to paid in capitalA,E | – | – | – | – | – |
| Net asset value, end of period | $46.35 | $37.34 | $39.51 | $38.43 | $39.23 |
| Total ReturnF,G | 25.57% | (5.07)% | 2.86% | (.60)% | 26.31% |
| Ratios to Average Net AssetsH,I | | | | | |
| Expenses before reductions | 1.53% | 1.58% | 1.57% | 1.51% | 1.59% |
| Expenses net of fee waivers, if any | 1.52% | 1.58% | 1.57% | 1.51% | 1.59% |
| Expenses net of all reductions | 1.51% | 1.57% | 1.56% | 1.51% | 1.57% |
| Net investment income (loss) | .64% | 1.02%B | .76%C | 1.11%D | .73% |
| Supplemental Data | | | | | |
| Net assets, end of period (in millions) | $35 | $35 | $43 | $49 | $53 |
| Portfolio turnover rateJ | 42% | 50%K | 60%K | 57% | 65% |
A Calculated based on average shares outstanding during the period.
B Net Investment income per share reflects a large, non-recurring dividend which amounted to $.14 per share. Excluding this non-recurring dividend, the ratio of net investment income (loss) to average net assets would have been .64%.
C Net Investment income per share reflects a large, non-recurring dividend which amounted to $.12 per share. Excluding this non-recurring dividend, the ratio of net investment income (loss) to average net assets would have been .45%.
D Net Investment income per share reflects a large, non-recurring dividend which amounted to $.21 per share. Excluding this non-recurring dividend, the ratio of net investment income (loss) to average net assets would have been .56%.
E Amount represents less than $.005 per share.
F Total returns would have been lower if certain expenses had not been reduced during the applicable periods shown.
G Total returns do not include the effect of the sales charges.
H Fees and expenses of any underlying Fidelity Central Funds are not included in the Fund's expense ratio. The Fund indirectly bears its proportionate share of the expenses of any underlying Fidelity Central Funds.
I Expense ratios reflect operating expenses of the class. Expenses before reductions do not reflect amounts reimbursed by the investment adviser or reductions from brokerage service arrangements or reductions from other expense offset arrangements and do not represent the amount paid by the class during periods when reimbursements or reductions occur. Expenses net of fee waivers reflect expenses after reimbursement by the investment adviser but prior to reductions from brokerage service arrangements or other expense offset arrangements. Expenses net of all reductions represent the net expenses paid by the class.
J Amount does not include the portfolio activity of any underlying Fidelity Central Funds.
K Portfolio turnover rate excludes securities received or delivered in-kind.
See accompanying notes which are an integral part of the financial statements.
Fidelity International Discovery Fund Class C
| Years ended October 31, | 2017 | 2016 | 2015 | 2014 | 2013 |
| Selected Per–Share Data | | | | | |
| Net asset value, beginning of period | $36.96 | $39.14 | $38.25 | $39.07 | $31.32 |
| Income from Investment Operations | | | | | |
| Net investment income (loss)A | .04 | .19B | .10C | .23D | .08 |
| Net realized and unrealized gain (loss) | 9.12 | (2.37) | .79 | (.66) | 7.90 |
| Total from investment operations | 9.16 | (2.18) | .89 | (.43) | 7.98 |
| Distributions from net investment income | (.13) | – | – | (.08) | (.20) |
| Distributions from net realized gain | (.05) | – | – | (.31) | (.03) |
| Total distributions | (.18) | – | – | (.39) | (.23) |
| Redemption fees added to paid in capitalA,E | – | – | – | – | – |
| Net asset value, end of period | $45.94 | $36.96 | $39.14 | $38.25 | $39.07 |
| Total ReturnF,G | 24.93% | (5.57)% | 2.33% | (1.10)% | 25.65% |
| Ratios to Average Net AssetsH,I | | | | | |
| Expenses before reductions | 2.05% | 2.10% | 2.09% | 2.03% | 2.10% |
| Expenses net of fee waivers, if any | 2.05% | 2.10% | 2.09% | 2.03% | 2.09% |
| Expenses net of all reductions | 2.04% | 2.09% | 2.08% | 2.02% | 2.07% |
| Net investment income (loss) | .11% | .50%B | .24%C | .60%D | .23% |
| Supplemental Data | | | | | |
| Net assets, end of period (in millions) | $28 | $26 | $32 | $35 | $36 |
| Portfolio turnover rateJ | 42% | 50%K | 60%K | 57% | 65% |
A Calculated based on average shares outstanding during the period.
B Net Investment income per share reflects a large, non-recurring dividend which amounted to $.14 per share. Excluding this non-recurring dividend, the ratio of net investment income (loss) to average net assets would have been .13%.
C Net Investment income per share reflects a large, non-recurring dividend which amounted to $.12 per share. Excluding this non-recurring dividend, the ratio of net investment income (loss) to average net assets would have been (.06) %.
D Net Investment income per share reflects a large, non-recurring dividend which amounted to $.21 per share. Excluding this non-recurring dividend, the ratio of net investment income (loss) to average net assets would have been .05%.
E Amount represents less than $.005 per share.
F Total returns would have been lower if certain expenses had not been reduced during the applicable periods shown.
G Total returns do not include the effect of the contingent deferred sales charge.
H Fees and expenses of any underlying Fidelity Central Funds are not included in the Fund's expense ratio. The Fund indirectly bears its proportionate share of the expenses of any underlying Fidelity Central Funds.
I Expense ratios reflect operating expenses of the class. Expenses before reductions do not reflect amounts reimbursed by the investment adviser or reductions from brokerage service arrangements or reductions from other expense offset arrangements and do not represent the amount paid by the class during periods when reimbursements or reductions occur. Expenses net of fee waivers reflect expenses after reimbursement by the investment adviser but prior to reductions from brokerage service arrangements or other expense offset arrangements. Expenses net of all reductions represent the net expenses paid by the class.
J Amount does not include the portfolio activity of any underlying Fidelity Central Funds.
K Portfolio turnover rate excludes securities received or delivered in-kind.
See accompanying notes which are an integral part of the financial statements.
Fidelity International Discovery Fund
| Years ended October 31, | 2017 | 2016 | 2015 | 2014 | 2013 |
| Selected Per–Share Data | | | | | |
| Net asset value, beginning of period | $37.91 | $40.12 | $39.03 | $39.82 | $31.91 |
| Income from Investment Operations | | | | | |
| Net investment income (loss)A | .50 | .61B | .54C | .67D | .47 |
| Net realized and unrealized gain (loss) | 9.29 | (2.41) | .81 | (.68) | 8.02 |
| Total from investment operations | 9.79 | (1.80) | 1.35 | (.01) | 8.49 |
| Distributions from net investment income | (.61) | (.41) | (.26) | (.47) | (.55) |
| Distributions from net realized gain | (.05) | (.01) | – | (.31) | (.03) |
| Total distributions | (.66) | (.41)E | (.26) | (.78) | (.58) |
| Redemption fees added to paid in capitalA,F | – | – | – | – | – |
| Net asset value, end of period | $47.04 | $37.91 | $40.12 | $39.03 | $39.82 |
| Total ReturnG | 26.33% | (4.53)% | 3.47% | (.01)% | 27.03% |
| Ratios to Average Net AssetsH,I | | | | | |
| Expenses before reductions | .94% | 1.00% | .99% | .93% | 1.00% |
| Expenses net of fee waivers, if any | .94% | 1.00% | .99% | .93% | 1.00% |
| Expenses net of all reductions | .92% | .99% | .98% | .93% | .98% |
| Net investment income (loss) | 1.22% | 1.61%B | 1.34%C | 1.69%D | 1.32% |
| Supplemental Data | | | | | |
| Net assets, end of period (in millions) | $7,351 | $6,421 | $7,209 | $7,464 | $7,800 |
| Portfolio turnover rateJ | 42% | 50%K | 60%K | 57% | 65% |
A Calculated based on average shares outstanding during the period.
B Net Investment income per share reflects a large, non-recurring dividend which amounted to $.14 per share. Excluding this non-recurring dividend, the ratio of net investment income (loss) to average net assets would have been 1.23%.
C Net Investment income per share reflects a large, non-recurring dividend which amounted to $.12 per share. Excluding this non-recurring dividend, the ratio of net investment income (loss) to average net assets would have been 1.03%.
D Net Investment income per share reflects a large, non-recurring dividend which amounted to $.22 per share. Excluding this non-recurring dividend, the ratio of net investment income (loss) to average net assets would have been 1.15%.
E Total distributions of $.41 per share is comprised of distributions from net investment income of $.409 and distributions from net realized gain of $.005 per share.
F Amount represents less than $.005 per share.
G Total returns would have been lower if certain expenses had not been reduced during the applicable periods shown.
H Fees and expenses of any underlying Fidelity Central Funds are not included in the Fund's expense ratio. The Fund indirectly bears its proportionate share of the expenses of any underlying Fidelity Central Funds.
I Expense ratios reflect operating expenses of the class. Expenses before reductions do not reflect amounts reimbursed by the investment adviser or reductions from brokerage service arrangements or reductions from other expense offset arrangements and do not represent the amount paid by the class during periods when reimbursements or reductions occur. Expenses net of fee waivers reflect expenses after reimbursement by the investment adviser but prior to reductions from brokerage service arrangements or other expense offset arrangements. Expenses net of all reductions represent the net expenses paid by the class.
J Amount does not include the portfolio activity of any underlying Fidelity Central Funds.
K Portfolio turnover rate excludes securities received or delivered in-kind.
See accompanying notes which are an integral part of the financial statements.
Fidelity International Discovery Fund Class K
| Years ended October 31, | 2017 | 2016 | 2015 | 2014 | 2013 |
| Selected Per–Share Data | | | | | |
| Net asset value, beginning of period | $37.86 | $40.06 | $38.97 | $39.76 | $31.87 |
| Income from Investment Operations | | | | | |
| Net investment income (loss)A | .55 | .66B | .59C | .72D | .52 |
| Net realized and unrealized gain (loss) | 9.26 | (2.39) | .81 | (.67) | 8.01 |
| Total from investment operations | 9.81 | (1.73) | 1.40 | .05 | 8.53 |
| Distributions from net investment income | (.66) | (.46) | (.31) | (.53) | (.61) |
| Distributions from net realized gain | (.05) | (.01) | – | (.31) | (.03) |
| Total distributions | (.71) | (.47) | (.31) | (.84) | (.64) |
| Redemption fees added to paid in capitalA,E | – | – | – | – | – |
| Net asset value, end of period | $46.96 | $37.86 | $40.06 | $38.97 | $39.76 |
| Total ReturnF | 26.47% | (4.38)% | 3.61% | .13% | 27.23% |
| Ratios to Average Net AssetsG,H | | | | | |
| Expenses before reductions | .82% | .86% | .86% | .80% | .85% |
| Expenses net of fee waivers, if any | .82% | .86% | .86% | .80% | .85% |
| Expenses net of all reductions | .80% | .85% | .85% | .79% | .83% |
| Net investment income (loss) | 1.35% | 1.74%B | 1.47%C | 1.83%D | 1.47% |
| Supplemental Data | | | | | |
| Net assets, end of period (in millions) | $2,228 | $1,880 | $2,308 | $2,464 | $2,576 |
| Portfolio turnover rateI | 42% | 50%J | 60%J | 57% | 65% |
A Calculated based on average shares outstanding during the period.
B Net Investment income per share reflects a large, non-recurring dividend which amounted to $.14 per share. Excluding this non-recurring dividend, the ratio of net investment income (loss) to average net assets would have been 1.36%.
C Net Investment income per share reflects a large, non-recurring dividend which amounted to $.12 per share. Excluding this non-recurring dividend, the ratio of net investment income (loss) to average net assets would have been 1.16%.
D Net Investment income per share reflects a large, non-recurring dividend which amounted to $.22 per share. Excluding this non-recurring dividend, the ratio of net investment income (loss) to average net assets would have been 1.28%.
E Amount represents less than $.005 per share.
F Total returns would have been lower if certain expenses had not been reduced during the applicable periods shown.
G Fees and expenses of any underlying Fidelity Central Funds are not included in the Fund's expense ratio. The Fund indirectly bears its proportionate share of the expenses of any underlying Fidelity Central Funds.
H Expense ratios reflect operating expenses of the class. Expenses before reductions do not reflect amounts reimbursed by the investment adviser or reductions from brokerage service arrangements or reductions from other expense offset arrangements and do not represent the amount paid by the class during periods when reimbursements or reductions occur. Expenses net of fee waivers reflect expenses after reimbursement by the investment adviser but prior to reductions from brokerage service arrangements or other expense offset arrangements. Expenses net of all reductions represent the net expenses paid by the class.
I Amount does not include the portfolio activity of any underlying Fidelity Central Funds.
J Portfolio turnover rate excludes securities received or delivered in-kind.
See accompanying notes which are an integral part of the financial statements.
Fidelity International Discovery Fund Class I
| Years ended October 31, | 2017 | 2016 | 2015 | 2014 | 2013 |
| Selected Per–Share Data | | | | | |
| Net asset value, beginning of period | $37.82 | $40.03 | $38.96 | $39.76 | $31.87 |
| Income from Investment Operations | | | | | |
| Net investment income (loss)A | .49 | .61B | .53C | .67D | .47 |
| Net realized and unrealized gain (loss) | 9.27 | (2.40) | .80 | (.68) | 8.01 |
| Total from investment operations | 9.76 | (1.79) | 1.33 | (.01) | 8.48 |
| Distributions from net investment income | (.61) | (.42) | (.26) | (.48) | (.56) |
| Distributions from net realized gain | (.05) | (.01) | – | (.31) | (.03) |
| Total distributions | (.66) | (.42)E | (.26) | (.79) | (.59) |
| Redemption fees added to paid in capitalA,F | – | – | – | – | – |
| Net asset value, end of period | $46.92 | $37.82 | $40.03 | $38.96 | $39.76 |
| Total ReturnG | 26.29% | (4.52)% | 3.44% | (.01)% | 27.03% |
| Ratios to Average Net AssetsH,I | | | | | |
| Expenses before reductions | .96% | 1.00% | 1.00% | .93% | 1.00% |
| Expenses net of fee waivers, if any | .96% | 1.00% | .99% | .93% | 1.00% |
| Expenses net of all reductions | .94% | .99% | .98% | .93% | .97% |
| Net investment income (loss) | 1.21% | 1.60%B | 1.33%C | 1.69%D | 1.33% |
| Supplemental Data | | | | | |
| Net assets, end of period (in millions) | $658 | $745 | $1,061 | $650 | $476 |
| Portfolio turnover rateJ | 42% | 50%K | 60%K | 57% | 65% |
A Calculated based on average shares outstanding during the period.
B Net Investment income per share reflects a large, non-recurring dividend which amounted to $.14 per share. Excluding this non-recurring dividend, the ratio of net investment income (loss) to average net assets would have been 1.22%.
C Net Investment income per share reflects a large, non-recurring dividend which amounted to $.12 per share. Excluding this non-recurring dividend, the ratio of net investment income (loss) to average net assets would have been 1.03%.
D Net Investment income per share reflects a large, non-recurring dividend which amounted to $.22 per share. Excluding this non-recurring dividend, the ratio of net investment income (loss) to average net assets would have been 1.14%.
E Total distributions of $.42 per share is comprised of distributions from net investment income of $.418 and distributions from net realized gain of $.005 per share.
F Amount represents less than $.005 per share.
G Total returns would have been lower if certain expenses had not been reduced during the applicable periods shown.
H Fees and expenses of any underlying Fidelity Central Funds are not included in the Fund's expense ratio. The Fund indirectly bears its proportionate share of the expenses of any underlying Fidelity Central Funds.
I Expense ratios reflect operating expenses of the class. Expenses before reductions do not reflect amounts reimbursed by the investment adviser or reductions from brokerage service arrangements or reductions from other expense offset arrangements and do not represent the amount paid by the class during periods when reimbursements or reductions occur. Expenses net of fee waivers reflect expenses after reimbursement by the investment adviser but prior to reductions from brokerage service arrangements or other expense offset arrangements. Expenses net of all reductions represent the net expenses paid by the class.
J Amount does not include the portfolio activity of any underlying Fidelity Central Funds.
K Portfolio turnover rate excludes securities received or delivered in-kind.
See accompanying notes which are an integral part of the financial statements.
Fidelity International Discovery Fund Class Z
| Years ended October 31, | 2017 | 2016 | 2015 | 2014 | 2013 A |
| Selected Per–Share Data | | | | | |
| Net asset value, beginning of period | $37.84 | $40.03 | $38.96 | $39.77 | $37.22 |
| Income from Investment Operations | | | | | |
| Net investment income (loss)B | .56 | .66C | .59D | .72E | .07 |
| Net realized and unrealized gain (loss) | 9.24 | (2.38) | .80 | (.68) | 2.48 |
| Total from investment operations | 9.80 | (1.72) | 1.39 | .04 | 2.55 |
| Distributions from net investment income | (.67) | (.46) | (.32) | (.54) | – |
| Distributions from net realized gain | (.05) | (.01) | – | (.31) | – |
| Total distributions | (.72) | (.47) | (.32) | (.85) | – |
| Redemption fees added to paid in capitalB,F | – | – | – | – | – |
| Net asset value, end of period | $46.92 | $37.84 | $40.03 | $38.96 | $39.77 |
| Total ReturnG,H | 26.44% | (4.36)% | 3.58% | .12% | 6.85% |
| Ratios to Average Net AssetsI,J | | | | | |
| Expenses before reductions | .82% | .86% | .86% | .80% | .85%K |
| Expenses net of fee waivers, if any | .82% | .86% | .86% | .80% | .85%K |
| Expenses net of all reductions | .80% | .85% | .85% | .79% | .83%K |
| Net investment income (loss) | 1.35% | 1.74%C | 1.47%D | 1.83%E | .76%K |
| Supplemental Data | | | | | |
| Net assets, end of period (in millions) | $101 | $38 | $30 | $35 | $– |
| Portfolio turnover rateL | 42% | 50%M | 60%M | 57% | 65% |
A For the period August 13, 2013 (commencement of sale of shares) to October 31, 2013.
B Calculated based on average shares outstanding during the period.
C Net Investment income per share reflects a large, non-recurring dividend which amounted to $.14 per share. Excluding this non-recurring dividend, the ratio of net investment income (loss) to average net assets would have been 1.36%.
D Net Investment income per share reflects a large, non-recurring dividend which amounted to $.12 per share. Excluding this non-recurring dividend, the ratio of net investment income (loss) to average net assets would have been 1.16%.
E Net Investment income per share reflects a large, non-recurring dividend which amounted to $.21 per share. Excluding this non-recurring dividend, the ratio of net investment income (loss) to average net assets would have been 1.28%.
F Amount represents less than $.005 per share.
G Total returns for periods of less than one year are not annualized.
H Total returns would have been lower if certain expenses had not been reduced during the applicable periods shown.
I Fees and expenses of any underlying Fidelity Central Funds are not included in the Fund's expense ratio. The Fund indirectly bears its proportionate share of the expenses of any underlying Fidelity Central Funds.
J Expense ratios reflect operating expenses of the class. Expenses before reductions do not reflect amounts reimbursed by the investment adviser or reductions from brokerage service arrangements or reductions from other expense offset arrangements and do not represent the amount paid by the class during periods when reimbursements or reductions occur. Expense ratios before reductions for start-up periods may not be representative of longer-term operating periods. Expenses net of fee waivers reflect expenses after reimbursement by the investment adviser but prior to reductions from brokerage service arrangements or other expense offset arrangements. Expenses net of all reductions represent the net expenses paid by the class.
K Annualized
L Amount does not include the portfolio activity of any underlying Fidelity Central Funds.
M Portfolio turnover rate excludes securities received or delivered in-kind.
See accompanying notes which are an integral part of the financial statements.
Notes to Financial Statements
For the period ended October 31, 2017
(Amounts in thousands except percentages)
1. Organization.
Fidelity International Discovery Fund (the Fund) is a fund of Fidelity Investment Trust (the Trust) and is authorized to issue an unlimited number of shares. The Trust is registered under the Investment Company Act of 1940, as amended (the 1940 Act), as an open-end management investment company organized as a Massachusetts business trust. The Fund offers Class A, Class M (formerly Class T), Class C, International Discovery, Class K, Class I and Class Z shares, each of which has equal rights as to assets and voting privileges. Each class has exclusive voting rights with respect to matters that affect that class.
After the close of business on June 24, 2016, all outstanding Class B shares were converted to Class A shares. All prior fiscal period dollar and share amounts for Class B presented in the Notes to Financial Statements are for the period November 1, 2015 through June 24, 2016.
2. Investments in Fidelity Central Funds.
The Fund invests in Fidelity Central Funds, which are open-end investment companies generally available only to other investment companies and accounts managed by the investment adviser and its affiliates. The Fund's Schedule of Investments lists each of the Fidelity Central Funds held as of period end, if any, as an investment of the Fund, but does not include the underlying holdings of each Fidelity Central Fund. As an Investing Fund, the Fund indirectly bears its proportionate share of the expenses of the underlying Fidelity Central Funds.
The Money Market Central Funds seek preservation of capital and current income and are managed by Fidelity Investments Money Management, Inc. (FIMM), an affiliate of the investment adviser. Annualized expenses of the Money Market Central Funds as of their most recent shareholder report date are less than .005%.
A complete unaudited list of holdings for each Fidelity Central Fund is available upon request or at the Securities and Exchange Commission (the SEC) website at www.sec.gov. In addition, the financial statements of the Fidelity Central Funds, which are not covered by the Fund's Report of Independent Registered Public Accounting Firm, are available on the SEC website or upon request.
3. Significant Accounting Policies.
The Fund is an investment company and applies the accounting and reporting guidance of the Financial Accounting Standards Board (FASB) Accounting Standards Codification Topic 946 Financial Services – Investments Companies. The financial statements have been prepared in conformity with accounting principles generally accepted in the United States of America (GAAP), which require management to make certain estimates and assumptions at the date of the financial statements. Actual results could differ from those estimates. Subsequent events, if any, through the date that the financial statements were issued have been evaluated in the preparation of the financial statements. The following summarizes the significant accounting policies of the Fund:
Investment Valuation. Investments are valued as of 4:00 p.m. Eastern time on the last calendar day of the period. The Board of Trustees (the Board) has delegated the day to day responsibility for the valuation of the Fund's investments to the Fair Value Committee (the Committee) established by the Fund's investment adviser. In accordance with valuation policies and procedures approved by the Board, the Fund attempts to obtain prices from one or more third party pricing vendors or brokers to value its investments. When current market prices, quotations or currency exchange rates are not readily available or reliable, investments will be fair valued in good faith by the Committee, in accordance with procedures adopted by the Board. Factors used in determining fair value vary by investment type and may include market or investment specific events, changes in interest rates and credit quality. The frequency with which these procedures are used cannot be predicted and they may be utilized to a significant extent. The Committee oversees the Fund's valuation policies and procedures and reports to the Board on the Committee's activities and fair value determinations. The Board monitors the appropriateness of the procedures used in valuing the Fund's investments and ratifies the fair value determinations of the Committee.
The Fund categorizes the inputs to valuation techniques used to value its investments into a disclosure hierarchy consisting of three levels as shown below:
- Level 1 – quoted prices in active markets for identical investments
- Level 2 – other significant observable inputs (including quoted prices for similar investments, interest rates, prepayment speeds, etc.)
- Level 3 – unobservable inputs (including the Fund's own assumptions based on the best information available)
Valuation techniques used to value the Fund's investments by major category are as follows:
Equity securities, including restricted securities, for which market quotations are readily available, are valued at the last reported sale price or official closing price as reported by a third party pricing vendor on the primary market or exchange on which they are traded and are categorized as Level 1 in the hierarchy. In the event there were no sales during the day or closing prices are not available, securities are valued at the last quoted bid price or may be valued using the last available price and are generally categorized as Level 2 in the hierarchy. For foreign equity securities, when market or security specific events arise, comparisons to the valuation of American Depositary Receipts (ADRs), futures contracts, Exchange-Traded Funds (ETFs) and certain indexes as well as quoted prices for similar securities may be used and would be categorized as Level 2 in the hierarchy. Utilizing these techniques may result in transfers between Level 1 and Level 2. For equity securities, including restricted securities, where observable inputs are limited, assumptions about market activity and risk are used and these securities may be categorized as Level 3 in the hierarchy.
Debt securities, including restricted securities, are valued based on evaluated prices received from third party pricing vendors or from brokers who make markets in such securities. U.S. government and government agency obligations are valued by pricing vendors who utilize matrix pricing which considers yield or price of bonds of comparable quality, coupon, maturity and type or by broker-supplied prices. When independent prices are unavailable or unreliable, debt securities may be valued utilizing pricing methodologies which consider similar factors that would be used by third party pricing vendors. Debt securities are generally categorized as Level 2 in the hierarchy but may be Level 3 depending on the circumstances.
Futures contracts are valued at the settlement price established each day by the board of trade or exchange on which they are traded and are categorized as Level 1 in the hierarchy. Investments in open-end mutual funds, including the Fidelity Central Funds, are valued at their closing net asset value (NAV) each business day and are categorized as Level 1 in the hierarchy.
Changes in valuation techniques may result in transfers in or out of an assigned level within the disclosure hierarchy. The aggregate value of investments by input level as of October 31, 2017, including information on transfers between Levels 1 and 2, is included at the end of the Fund's Schedule of Investments.
Foreign Currency. The Fund may use foreign currency contracts to facilitate transactions in foreign-denominated securities. Gains and losses from these transactions may arise from changes in the value of the foreign currency or if the counterparties do not perform under the contracts' terms.
Foreign-denominated assets, including investment securities, and liabilities are translated into U.S. dollars at the exchange rates at period end. Purchases and sales of investment securities, income and dividends received and expenses denominated in foreign currencies are translated into U.S. dollars at the exchange rate in effect on the transaction date.
The effects of exchange rate fluctuations on investments are included with the net realized and unrealized gain (loss) on investment securities. Other foreign currency transactions resulting in realized and unrealized gain (loss) are disclosed separately.
Investment Transactions and Income. For financial reporting purposes, the Fund's investment holdings and NAV include trades executed through the end of the last business day of the period. The NAV per share for processing shareholder transactions is calculated as of the close of business of the New York Stock Exchange (NYSE), normally 4:00 p.m. Eastern time and includes trades executed through the end of the prior business day. Gains and losses on securities sold are determined on the basis of identified cost and proceeds received from litigation. Dividend income is recorded on the ex-dividend date, except for certain dividends from foreign securities where the ex-dividend date may have passed, which are recorded as soon as the Fund is informed of the ex-dividend date. Non-cash dividends included in dividend income, if any, are recorded at the fair market value of the securities received. Income and capital gain distributions from Fidelity Central Funds, if any, are recorded on the ex-dividend date. Certain distributions received by the Fund represent a return of capital or capital gain. The Fund determines the components of these distributions subsequent to the ex-dividend date, based upon receipt of tax filings or other correspondence relating to the underlying investment. These distributions are recorded as a reduction of cost of investments and/or as a realized gain. Interest income is accrued as earned and includes coupon interest and amortization of premium and accretion of discount on debt securities as applicable. Investment income is recorded net of foreign taxes withheld where recovery of such taxes is uncertain.
Class Allocations and Expenses. Investment income, realized and unrealized capital gains and losses, common expenses of the Fund, and certain fund-level expense reductions, if any, are allocated daily on a pro-rata basis to each class based on the relative net assets of each class to the total net assets of the Fund. Each class differs with respect to transfer agent and distribution and service plan fees incurred. Certain expense reductions may also differ by class. For the reporting period, the allocated portion of income and expenses to each class as a percent of its average net assets may vary due to the timing of recording these transactions in relation to fluctuating net assets of the classes. Expenses directly attributable to a fund are charged to that fund. Expenses attributable to more than one fund are allocated among the respective funds on the basis of relative net assets or other appropriate methods. Expense estimates are accrued in the period to which they relate and adjustments are made when actual amounts are known.
Deferred Trustee Compensation. Under a Deferred Compensation Plan (the Plan), independent Trustees may elect to defer receipt of a portion of their annual compensation. Deferred amounts are invested in a cross-section of Fidelity funds, are marked-to-market and remain in the Fund until distributed in accordance with the Plan. The investment of deferred amounts and the offsetting payable to the Trustees are included in the accompanying Statement of Assets and Liabilities.
Income Tax Information and Distributions to Shareholders. Each year, the Fund intends to qualify as a regulated investment company under Subchapter M of the Internal Revenue Code, including distributing substantially all of its taxable income and realized gains. As a result, no provision for U.S. Federal income taxes is required. As of October 31, 2017, the Fund did not have any unrecognized tax benefits in the financial statements; nor is the Fund aware of any tax positions for which it is reasonably possible that the total amounts of unrecognized tax benefits will significantly change in the next twelve months. The Fund files a U.S. federal tax return, in addition to state and local tax returns as required. The Fund's federal income tax returns are subject to examination by the Internal Revenue Service (IRS) for a period of three fiscal years after they are filed. State and local tax returns may be subject to examination for an additional fiscal year depending on the jurisdiction. Foreign taxes are provided for based on the Fund's understanding of the tax rules and rates that exist in the foreign markets in which it invests.
Distributions are declared and recorded on the ex-dividend date. Income dividends and capital gain distributions are declared separately for each class. Income and capital gain distributions are determined in accordance with income tax regulations, which may differ from GAAP. In addition, the Fund claimed a portion of the payment made to redeeming shareholders as a distribution for income tax purposes.
Capital accounts within the financial statements are adjusted for permanent book-tax differences. These adjustments have no impact on net assets or the results of operations. Capital accounts are not adjusted for temporary book-tax differences which will reverse in a subsequent period.
Book-tax differences are primarily due to foreign currency transactions, passive foreign investment companies (PFIC), market discount, deferred trustees compensation and losses deferred due to wash sales.
As of period end, the cost and unrealized appreciation (depreciation) in securities, and derivatives if applicable, for federal income tax purposes were as follows:
| Gross unrealized appreciation | $2,412,009 |
| Gross unrealized depreciation | (158,816) |
| Net unrealized appreciation (depreciation) | $2,253,193 |
| Tax Cost | $8,811,862 |
The tax-based components of distributable earnings as of period end were as follows:
| Undistributed ordinary income | $115,404 |
| Undistributed long-term capital gain | $412,934 |
| Net unrealized appreciation (depreciation) on securities and other investments | $2,251,367 |
The tax character of distributions paid was as follows:
| | October 31, 2017 | October 31, 2016 |
| Ordinary Income | $162,113 | $ 114,796 |
Short-Term Trading (Redemption) Fees. Shares held by investors in the Fund less than 30 days may have been subject to a redemption fee equal to 1.00% of the NAV of shares redeemed. All redemption fees, which reduce the proceeds of the shareholder redemption, are retained by the Fund and accounted for as an addition to paid in capital. In November 2016, the Board of Trustees approved the elimination of these redemption fees effective December 12, 2016.
Restricted Securities. The Fund may invest in securities that are subject to legal or contractual restrictions on resale. These securities generally may be resold in transactions exempt from registration or to the public if the securities are registered. Disposal of these securities may involve time-consuming negotiations and expense, and prompt sale at an acceptable price may be difficult. Information regarding restricted securities is included at the end of the Fund's Schedule of Investments.
4. Derivative Instruments.
Risk Exposures and the Use of Derivative Instruments. The Fund's investment objective allows the Fund to enter into various types of derivative contracts, including futures contracts. Derivatives are investments whose value is primarily derived from underlying assets, indices or reference rates and may be transacted on an exchange or over-the-counter (OTC). Derivatives may involve a future commitment to buy or sell a specified asset based on specified terms, to exchange future cash flows at periodic intervals based on a notional principal amount, or for one party to make one or more payments upon the occurrence of specified events in exchange for periodic payments from the other party.
The Fund used derivatives to increase returns and to manage exposure to certain risks as defined below. The success of any strategy involving derivatives depends on analysis of numerous economic factors, and if the strategies for investment do not work as intended, the Fund may not achieve its objectives.
The Fund's use of derivatives increased or decreased its exposure to the following risk:
| Equity Risk | Equity risk relates to the fluctuations in the value of financial instruments as a result of changes in market prices (other than those arising from interest rate risk or foreign exchange risk), whether caused by factors specific to an individual investment, its issuer, or all factors affecting all instruments traded in a market or market segment.
|
The Fund is also exposed to additional risks from investing in derivatives, such as liquidity risk and counterparty credit risk. Liquidity risk is the risk that the Fund will be unable to close out the derivative in the open market in a timely manner. Counterparty credit risk is the risk that the counterparty will not be able to fulfill its obligation to the Fund. Counterparty credit risk related to exchange-traded futures contracts may be mitigated by the protection provided by the exchange on which they trade.
Investing in derivatives may involve greater risks than investing in the underlying assets directly and, to varying degrees, may involve risk of loss in excess of any initial investment and collateral received and amounts recognized in the Statement of Assets and Liabilities. In addition, there may be the risk that the change in value of the derivative contract does not correspond to the change in value of the underlying instrument.
Futures Contracts. A futures contract is an agreement between two parties to buy or sell a specified underlying instrument for a fixed price at a specified future date. The Fund used futures contracts to manage its exposure to the stock market.
Upon entering into a futures contract, a fund is required to deposit either cash or securities (initial margin) with a clearing broker in an amount equal to a certain percentage of the face value of the contract. Futures contracts are marked-to-market daily and subsequent daily payments (variation margin) are made or received by a fund depending on the daily fluctuations in the value of the futures contracts and are recorded as unrealized appreciation or (depreciation). This receivable and/or payable, if any, is included in daily variation margin on futures contracts in the Statement of Assets and Liabilities. Realized gain or (loss) is recorded upon the expiration or closing of a futures contract. The net realized gain (loss) and change in net unrealized appreciation (depreciation) on futures contracts during the period is presented in the Statement of Operations.
Any open futures contracts at period end are presented in the Schedule of Investments under the caption "Futures Contracts". The notional amount at value reflects each contract's exposure to the underlying instrument or index at period end and is representative of volume of activity during the period. Securities deposited to meet initial margin requirements are identified in the Schedule of Investments.
5. Purchases and Sales of Investments.
Purchases and sales of securities, other than short-term securities, aggregated $3,991,057 and $5,033,189, respectively.
Prior Fiscal Year Redemptions In-Kind. During the prior period, 1,487 shares of the Fund held by an unaffiliated entity were redeemed for investments and cash with a value of $55,670. The Fund had a net gain of $10,064 on investments delivered through the in-kind redemptions. The amount of the redemptions is included in share transactions activity shown in the accompanying Statement of Changes in Net Assets as well as the Notes to Financial Statements. The Fund recognized no gain or loss for federal income tax purposes.
6. Fees and Other Transactions with Affiliates.
Management Fee. Fidelity Management & Research Company (the investment adviser) and its affiliates provide the Fund with investment management related services for which the Fund pays a monthly management fee. The management fee is the sum of an individual fund fee rate that is based on an annual rate of .424% of the Fund's average net assets and an annualized group fee rate that averaged .25% during the period. The group fee rate is based upon the average net assets of all the mutual funds advised by the investment adviser, including any mutual funds previously advised by the investment adviser that are currently advised by Fidelity SelectCo, LLC, an affiliate of the investment adviser. The group fee rate decreases as assets under management increase and increases as assets under management decrease. In addition, the management fee is subject to a performance adjustment (up to a maximum of +/- .20% of the Fund's average net assets over a 36 month performance period). The upward or downward adjustment to the management fee is based on the relative investment performance of International Discovery as compared to its benchmark index, the MSCI EAFE Index, over the same 36 month performance period. For the reporting period, the total annual management fee rate, including the performance adjustment, was .73% of the Fund's average net assets. The performance adjustment included in the management fee rate may be higher or lower than the maximum performance adjustment rate due to the difference between the average net assets for the reporting and performance periods.
Distribution and Service Plan Fees. In accordance with Rule 12b-1 of the 1940 Act, the Fund has adopted separate Distribution and Service Plans for each class of shares. Certain classes pay Fidelity Distributors Corporation (FDC), an affiliate of the investment adviser, separate Distribution and Service Fees, each of which is based on an annual percentage of each class' average net assets. In addition, FDC may pay financial intermediaries for selling shares of the Fund and providing shareholder support services. For the period, the Distribution and Service Fee rates, total fees and amounts retained by FDC were as follows:
| | Distribution
Fee | Service
Fee | Total Fees | Retained
by FDC |
| Class A | -% | .25% | $585 | $3 |
| Class M | .25% | .25% | 166 | – |
| Class C | .75% | .25% | 257 | 17 |
| | | | $1,008 | $20 |
Sales Load. FDC may receive a front-end sales charge of up to 5.75% for selling Class A shares and 3.50% for selling Class M shares, some of which is paid to financial intermediaries for selling shares of the Fund. Depending on the holding period, FDC may receive contingent deferred sales charges levied on Class A, Class M and Class C redemptions. The deferred sales charges are 1.00% for Class C shares, 1.00% for certain purchases of Class A shares and .25% for certain purchases of Class M shares.
For the period, sales charge amounts retained by FDC were as follows:
| | Retained
by FDC |
| Class A | $30 |
| Class M | 2 |
| Class C(a) | 3 |
| | $35 |
(a) When Class C shares are initially sold, FDC pays commissions from its own resources to financial intermediaries through which the sales are made.
Transfer Agent Fees. Fidelity Investments Institutional Operations Company, Inc., (FIIOC), an affiliate of the investment adviser, is the transfer, dividend disbursing and shareholder servicing agent for each class of the Fund. FIIOC receives account fees and asset-based fees that vary according to the account size and type of account of the shareholders of the respective classes of the Fund, except for Class K and Class Z. FIIOC receives an asset-based fee of Class K's and Class Z's average net assets. FIIOC pays for typesetting, printing and mailing of shareholder reports, except proxy statements.
For the period, transfer agent fees for each class were as follows:
| | Amount | % of
Class-Level Average
Net Assets |
| Class A | $627 | .27 |
| Class M | 85 | .26 |
| Class C | 73 | .28 |
| International Discovery | 11,267 | .17 |
| Class K | 916 | .05 |
| Class I | 1,182 | .19 |
| Class Z | 35 | .05 |
| | $14,185 | |
Accounting and Security Lending Fees. Fidelity Service Company, Inc. (FSC), an affiliate of the investment adviser, maintains the Fund's accounting records. The accounting fee is based on the level of average net assets for each month. Under a separate contract, FSC administers the security lending program. The security lending fee is based on the number and duration of lending transactions.
Brokerage Commissions. The Fund placed a portion of its portfolio transactions with brokerage firms which are affiliates of the investment adviser. Brokerage commissions are included in net realized gain (loss) and change in net unrealized appreciation (depreciation) in the Statement of Operations. The commissions paid to these affiliated firms were $13 for the period.
Interfund Trades. The Fund may purchase from or sell securities to other Fidelity Funds under procedures adopted by the Board. The procedures have been designed to ensure these interfund trades are executed in accordance with Rule 17a-7 of the 1940 Act. Interfund trades are included within the respective purchases and sales amounts shown in the Purchases and Sales of Investments note.
7. Committed Line of Credit.
The Fund participates with other funds managed by the investment adviser or an affiliate in a $4.25 billion credit facility (the "line of credit") to be utilized for temporary or emergency purposes to fund shareholder redemptions or for other short-term liquidity purposes. The Fund has agreed to pay commitment fees on its pro-rata portion of the line of credit, which amounted to $30 and is reflected in Miscellaneous expenses on the Statement of Operations. During the period, the Fund did not borrow on this line of credit.
8. Security Lending.
The Fund lends portfolio securities through a lending agent from time to time in order to earn additional income. For equity securities, a lending agent is used and may loan securities to certain qualified borrowers, including Fidelity Capital Markets (FCM), a broker-dealer affiliated with the Fund. On the settlement date of the loan, the Fund receives collateral (in the form of U.S. Treasury obligations, letters of credit and/or cash) against the loaned securities and maintains collateral in an amount not less than 100% of the market value of the loaned securities during the period of the loan. The market value of the loaned securities is determined at the close of business of the Fund and any additional required collateral is delivered to the Fund on the next business day. The Fund or borrower may terminate the loan at any time, and if the borrower defaults on its obligation to return the securities loaned because of insolvency or other reasons, the Fund may apply collateral received from the borrower against the obligation. The Fund may experience delays and costs in recovering the securities loaned. Any cash collateral received is invested in the Fidelity Securities Lending Cash Central Fund. The value of loaned securities and cash collateral at period end are disclosed on the Fund's Statement of Assets and Liabilities. Security lending income represents the income earned on investing cash collateral, less rebates paid to borrowers and any lending agent fees associated with the loan, plus any premium payments received for lending certain types of securities. Security lending income is presented in the Statement of Operations as a component of income from Fidelity Central Funds. Total security lending income during the period amounted to $4,300. During the period, there were no securities loaned to FCM.
9. Expense Reductions.
Commissions paid to certain brokers with whom the investment adviser, or its affiliates, places trades on behalf of the Fund include an amount in addition to trade execution, which may be rebated back to the Fund to offset certain expenses. This amount totaled $1,346 for the period. In addition, through arrangements with the Fund's custodian, credits realized as a result of certain uninvested cash balances were used to reduce the Fund's expenses. During the period, these credits reduced the Fund's custody expenses by $2.
In addition, during the period the investment adviser reimbursed and/or waived a portion of fund-level operating expenses in the amount of $81.
10. Distributions to Shareholders.
Distributions to shareholders of each class were as follows:
| | Year ended October 31, 2017 | Year ended October 31, 2016 |
| From net investment income | | |
| Class A | $2,894 | $1,912 |
| Class M | 333 | 184 |
| Class C | 92 | – |
| International Discovery | 102,284 | 73,519 |
| Class K | 32,411 | 26,239 |
| Class I | 11,493 | 11,205 |
| Class Z | 667 | 375 |
| Total | $150,174 | $113,434 |
| From net realized gain | | |
| Class A | $302 | $36 |
| Class M | 44 | 5 |
| Class C | 33 | – |
| International Discovery | 8,190 | 899 |
| Class K | 2,392 | 284 |
| Class I | 929 | 134 |
| Class Z | 49 | 4 |
| Total | $11,939 | $1,362 |
11. Share Transactions.
Share transactions for each class were as follows and may contain automatic conversions between classes or exchanges between affiliated funds:
| | Shares | Shares | Dollars | Dollars |
| | Year ended October 31, 2017 | Year ended October 31, 2016 | Year ended October 31, 2017 | Year ended October 31, 2016 |
| Class A | | | | |
| Shares sold | 712 | 885 | $29,106 | $33,250 |
| Reinvestment of distributions | 87 | 48 | 3,152 | 1,922 |
| Shares redeemed | (1,774) | (1,758) | (71,253) | (66,337) |
| Net increase (decrease) | (975) | (825) | $(38,995) | $(31,165) |
| Class M | | | | |
| Shares sold | 80 | 126 | $3,246 | $4,736 |
| Reinvestment of distributions | 10 | 5 | 365 | 183 |
| Shares redeemed | (274) | (282) | (10,830) | (10,546) |
| Net increase (decrease) | (184) | (151) | $(7,219) | $(5,627) |
| Class B | | | | |
| Shares sold | – | 1 | $– | $16 |
| Shares redeemed | – | (58) | – | (2,118) |
| Net increase (decrease) | – | (57) | $– | $(2,102) |
| Class C | | | | |
| Shares sold | 83 | 193 | $3,499 | $7,216 |
| Reinvestment of distributions | 3 | – | 116 | – |
| Shares redeemed | (174) | (298) | (6,878) | (11,125) |
| Net increase (decrease) | (88) | (105) | $(3,263) | $(3,909) |
| International Discovery | | | | |
| Shares sold | 19,989 | 18,319 | $812,564 | $696,598 |
| Reinvestment of distributions | 2,884 | 1,781 | 105,223 | 70,961 |
| Shares redeemed | (35,967) | (30,424) | (1,442,640) | (1,154,409) |
| Net increase (decrease) | (13,094) | (10,324) | $(524,853) | $(386,850) |
| Class K | | | | |
| Shares sold | 10,877 | 12,391 | $448,875 | $466,861 |
| Reinvestment of distributions | 957 | 667 | 34,802 | 26,523 |
| Shares redeemed | (14,039) | (21,012)(a) | (560,342) | (800,081)(a) |
| Net increase (decrease) | (2,205) | (7,954) | $(76,665) | $(306,697) |
| Class I | | | | |
| Shares sold | 3,202 | 8,874 | $130,302 | $334,588 |
| Reinvestment of distributions | 82 | 52 | 2,985 | 2,069 |
| Shares redeemed | (8,961) | (15,719) | (349,072) | (569,974) |
| Net increase (decrease) | (5,677) | (6,793) | $(215,785) | $(233,317) |
| Class Z | | | | |
| Shares sold | 1,483 | 497 | $58,502 | $18,760 |
| Reinvestment of distributions | 20 | 10 | 716 | 379 |
| Shares redeemed | (351) | (256) | (14,440) | (9,746) |
| Net increase (decrease) | 1,152 | 251 | $44,778 | $9,393 |
(a) Amount includes in-kind redemptions (see the prior Redemptions In-Kind note for additional details).
12. Other.
The Fund's organizational documents provide former and current trustees and officers with a limited indemnification against liabilities arising in connection with the performance of their duties to the Fund. In the normal course of business, the Fund may also enter into contracts that provide general indemnifications. The Fund's maximum exposure under these arrangements is unknown as this would be dependent on future claims that may be made against the Fund. The risk of material loss from such claims is considered remote.
At the end of the period, Strategic Advisers International Fund was the owner of record of approximately 12% of the total outstanding shares of the Fund.
Report of Independent Registered Public Accounting Firm
To the Trustees of Fidelity Investment Trust and Shareholders of Fidelity International Discovery Fund:
In our opinion, the accompanying statement of assets and liabilities, including the schedule of investments, and the related statements of operations and of changes in net assets and the financial highlights present fairly, in all material respects, the financial position of Fidelity International Discovery Fund (a fund of Fidelity Investment Trust) as of October 31, 2017, the results of its operations for the year then ended, the changes in its net assets for each of the two years in the period then ended and the financial highlights for each of the periods indicated, in conformity with accounting principles generally accepted in the United States of America. These financial statements and financial highlights (hereafter referred to as “financial statements”) are the responsibility of the Fidelity International Discovery Fund’s management. Our responsibility is to express an opinion on these financial statements based on our audits. We conducted our audits of these financial statements in accordance with the standards of the Public Company Accounting Oversight Board (United States). Those standards require that we plan and perform the audit to obtain reasonable assurance about whether the financial statements are free of material misstatement. An audit includes examining, on a test basis, evidence supporting the amounts and disclosures in the financial statements, assessing the accounting principles used and significant estimates made by management, and evaluating the overall financial statement presentation. Our procedures included confirmation of securities owned as of October 31, 2017 by correspondence with the custodian and brokers; when replies were not received from brokers, we performed other auditing procedures. We believe that our audits provide a reasonable basis for our opinion.
PricewaterhouseCoopers LLP
Boston, Massachusetts
December 12, 2017
Trustees and Officers
The Trustees, Members of the Advisory Board (if any), and officers of the trust and fund, as applicable, are listed below. The Board of Trustees governs the fund and is responsible for protecting the interests of shareholders. The Trustees are experienced executives who meet periodically throughout the year to oversee the fund's activities, review contractual arrangements with companies that provide services to the fund, oversee management of the risks associated with such activities and contractual arrangements, and review the fund's performance. Except for Jonathan Chiel, each of the Trustees oversees 190 funds. Mr. Chiel oversees 143 funds.
The Trustees hold office without limit in time except that (a) any Trustee may resign; (b) any Trustee may be removed by written instrument, signed by at least two-thirds of the number of Trustees prior to such removal; (c) any Trustee who requests to be retired or who has become incapacitated by illness or injury may be retired by written instrument signed by a majority of the other Trustees; and (d) any Trustee may be removed at any special meeting of shareholders by a two-thirds vote of the outstanding voting securities of the trust. Each Trustee who is not an interested person (as defined in the 1940 Act) of the trust and the fund is referred to herein as an Independent Trustee. Each Independent Trustee shall retire not later than the last day of the calendar year in which his or her 75th birthday occurs. The Independent Trustees may waive this mandatory retirement age policy with respect to individual Trustees. Officers and Advisory Board Members hold office without limit in time, except that any officer or Advisory Board Member may resign or may be removed by a vote of a majority of the Trustees at any regular meeting or any special meeting of the Trustees. Except as indicated, each individual has held the office shown or other offices in the same company for the past five years.
The fund’s Statement of Additional Information (SAI) includes more information about the Trustees. To request a free copy, call Fidelity at 1-877-208-0098.
Experience, Skills, Attributes, and Qualifications of the Trustees. The Governance and Nominating Committee has adopted a statement of policy that describes the experience, qualifications, attributes, and skills that are necessary and desirable for potential Independent Trustee candidates (Statement of Policy). The Board believes that each Trustee satisfied at the time he or she was initially elected or appointed a Trustee, and continues to satisfy, the standards contemplated by the Statement of Policy. The Governance and Nominating Committee also engages professional search firms to help identify potential Independent Trustee candidates who have the experience, qualifications, attributes, and skills consistent with the Statement of Policy. From time to time, additional criteria based on the composition and skills of the current Independent Trustees, as well as experience or skills that may be appropriate in light of future changes to board composition, business conditions, and regulatory or other developments, have also been considered by the professional search firms and the Governance and Nominating Committee. In addition, the Board takes into account the Trustees' commitment and participation in Board and committee meetings, as well as their leadership of standing and ad hoc committees throughout their tenure.
In determining that a particular Trustee was and continues to be qualified to serve as a Trustee, the Board has considered a variety of criteria, none of which, in isolation, was controlling. The Board believes that, collectively, the Trustees have balanced and diverse experience, qualifications, attributes, and skills, which allow the Board to operate effectively in governing the fund and protecting the interests of shareholders. Information about the specific experience, skills, attributes, and qualifications of each Trustee, which in each case led to the Board's conclusion that the Trustee should serve (or continue to serve) as a trustee of the fund, is provided below.
Board Structure and Oversight Function. James C. Curvey is an interested person and currently serves as Chairman. The Trustees have determined that an interested Chairman is appropriate and benefits shareholders because an interested Chairman has a personal and professional stake in the quality and continuity of services provided to the fund. Independent Trustees exercise their informed business judgment to appoint an individual of their choosing to serve as Chairman, regardless of whether the Trustee happens to be independent or a member of management. The Independent Trustees have determined that they can act independently and effectively without having an Independent Trustee serve as Chairman and that a key structural component for assuring that they are in a position to do so is for the Independent Trustees to constitute a substantial majority for the Board. The Independent Trustees also regularly meet in executive session. Ned C. Lautenbach serves as Chairman of the Independent Trustees and as such (i) acts as a liaison between the Independent Trustees and management with respect to matters important to the Independent Trustees and (ii) with management prepares agendas for Board meetings.
Fidelity® funds are overseen by different Boards of Trustees. The fund's Board oversees Fidelity's high income and certain equity funds, and other Boards oversee Fidelity's investment-grade bond, money market, asset allocation, and sector funds. The asset allocation funds may invest in Fidelity® funds overseen by the fund's Board. The use of separate Boards, each with its own committee structure, allows the Trustees of each group of Fidelity® funds to focus on the unique issues of the funds they oversee, including common research, investment, and operational issues. On occasion, the separate Boards establish joint committees to address issues of overlapping consequences for the Fidelity® funds overseen by each Board.
The Trustees operate using a system of committees to facilitate the timely and efficient consideration of all matters of importance to the Trustees, the fund, and fund shareholders and to facilitate compliance with legal and regulatory requirements and oversight of the fund's activities and associated risks. The Board, acting through its committees, has charged FMR and its affiliates with (i) identifying events or circumstances the occurrence of which could have demonstrably adverse effects on the fund's business and/or reputation; (ii) implementing processes and controls to lessen the possibility that such events or circumstances occur or to mitigate the effects of such events or circumstances if they do occur; and (iii) creating and maintaining a system designed to evaluate continuously business and market conditions in order to facilitate the identification and implementation processes described in (i) and (ii) above. Because the day-to-day operations and activities of the fund are carried out by or through FMR, its affiliates, and other service providers, the fund's exposure to risks is mitigated but not eliminated by the processes overseen by the Trustees. While each of the Board's committees has responsibility for overseeing different aspects of the fund's activities, oversight is exercised primarily through the Operations, Audit, and Compliance Committees. In addition, the Independent Trustees have worked with FMR to enhance the Board's oversight of investment and financial risks, legal and regulatory risks, technology risks, and operational risks, including the development of additional risk reporting to the Board. For example, a working group comprised of Independent Trustees and FMR has worked and continues to work to review the Fidelity® funds' valuation-related activities, reporting and risk management. Appropriate personnel, including but not limited to the fund's Chief Compliance Officer (CCO), FMR's internal auditor, the independent accountants, the fund's Treasurer and portfolio management personnel, make periodic reports to the Board's committees, as appropriate, including an annual review of Fidelity's risk management program for the Fidelity® funds. The responsibilities of each standing committee, including their oversight responsibilities, are described further under "Standing Committees of the Trustees."
Interested Trustees*:
Correspondence intended for a Trustee who is an interested person may be sent to Fidelity Investments, 245 Summer Street, Boston, Massachusetts 02210.
Name, Year of Birth; Principal Occupations and Other Relevant Experience+
Jonathan Chiel (1957)
Year of Election or Appointment: 2016
Trustee
Mr. Chiel also serves as Trustee of other Fidelity® funds. Mr. Chiel is Executive Vice President and General Counsel for FMR LLC (diversified financial services company, 2012-present). Previously, Mr. Chiel served as general counsel (2004-2012) and senior vice president and deputy general counsel (2000-2004) for John Hancock Financial Services; a partner with Choate, Hall & Stewart (1996-2000) (law firm); and an Assistant United States Attorney for the United States Attorney’s Office of the District of Massachusetts (1986-95), including Chief of the Criminal Division (1993-1995). Mr. Chiel is a director on the boards of the Boston Bar Foundation and the Maimonides School.
James C. Curvey (1935)
Year of Election or Appointment: 2007
Trustee
Chairman of the Board of Trustees
Mr. Curvey also serves as Trustee of other Fidelity® funds. Mr. Curvey is a Director of Fidelity Research & Analysis Co. (investment adviser firm, 2009-present), and Vice Chairman (2007-present) and Director of FMR LLC (diversified financial services company). In addition, Mr. Curvey serves as an Overseer for the Boston Symphony Orchestra and a member of the board of Artis-Naples, Naples, Florida, and as a Trustee for Brewster Academy, Wolfeboro, New Hampshire. Previously, Mr. Curvey served as a Director of Fidelity Investments Money Management, Inc. (investment adviser firm, 2009-2014) and a Director of FMR and FMR Co., Inc. (investment adviser firms, 2007-2014).
Charles S. Morrison (1960)
Year of Election or Appointment: 2014
Trustee
Mr. Morrison also serves as Trustee of other funds. He serves as President of Fidelity Management & Research Company (FMR) (investment adviser firm, 2016-present), a Director of Fidelity Investments Money Management, Inc. (FIMM) (investment adviser firm, 2014-present), Director of Fidelity SelectCo, LLC (investment adviser firm, 2014-present), President, Asset Management (2014-present), and is an employee of Fidelity Investments. Previously, Mr. Morrison served as Vice President of Fidelity's Fixed Income and Asset Allocation Funds (2012-2014), President, Fixed Income (2011-2014), Vice President of Fidelity's Money Market Funds (2005-2009), President, Money Market Group Leader of FMR (investment adviser firm, 2009), and Senior Vice President, Money Market Group of FMR (2004-2009). Mr. Morrison also served as Vice President of Fidelity's Bond Funds (2002-2005), certain Balanced Funds (2002-2005), and certain Asset Allocation Funds (2002-2007), and as Senior Vice President (2002-2005) of Fidelity's Bond Division.
* Determined to be an “Interested Trustee” by virtue of, among other things, his or her affiliation with the trust or various entities under common control with FMR.
+ The information includes the Trustee's principal occupation during the last five years and other information relating to the experience, attributes, and skills relevant to the Trustee's qualifications to serve as a Trustee, which led to the conclusion that the Trustee should serve as a Trustee for the fund.
Independent Trustees:
Correspondence intended for an Independent Trustee may be sent to Fidelity Investments, P.O. Box 55235, Boston, Massachusetts 02205-5235.
Name, Year of Birth; Principal Occupations and Other Relevant Experience+
Dennis J. Dirks (1948)
Year of Election or Appointment: 2005
Trustee
Mr. Dirks also serves as Trustee of other Fidelity® funds. Prior to his retirement in May 2003, Mr. Dirks was Chief Operating Officer and a member of the Board of The Depository Trust & Clearing Corporation (DTCC). He also served as President, Chief Operating Officer, and Board member of The Depository Trust Company (DTC) and President and Board member of the National Securities Clearing Corporation (NSCC). In addition, Mr. Dirks served as Chief Executive Officer and Board member of the Government Securities Clearing Corporation, Chief Executive Officer and Board member of the Mortgage-Backed Securities Clearing Corporation, as a Trustee and a member of the Finance Committee of Manhattan College (2005-2008), as a Trustee and a member of the Finance Committee of AHRC of Nassau County (2006-2008), as a member of the Independent Directors Council (IDC) Governing Council (2010-2015), and as a member of the Board of Directors for The Brookville Center for Children’s Services, Inc. (2009-2017). Mr. Dirks is a member of the Finance Committee (2016-present) and Board of Directors (2017-present) of the Asolo Repertory Theatre.
Alan J. Lacy (1953)
Year of Election or Appointment: 2008
Trustee
Mr. Lacy also serves as Trustee of other Fidelity® funds. Mr. Lacy serves as a Director of Bristol-Myers Squibb Company (global pharmaceuticals, 2008-present). He is a Trustee of the California Chapter of The Nature Conservancy (2015-present) and a Director of the Center for Advanced Study in the Behavioral Sciences at Stanford University (2015-present). In addition, Mr. Lacy served as Senior Adviser (2007-2014) of Oak Hill Capital Partners, L.P. (private equity) and also served as Chief Executive Officer (2005) and Vice Chairman (2005-2006) of Sears Holdings Corporation (retail) and Chief Executive Officer and Chairman of the Board of Sears, Roebuck and Co. (retail, 2000-2005). Previously, Mr. Lacy served as Chairman (2014-2017) and a member (2010-2017) of the Board of Directors of Dave & Buster’s Entertainment, Inc. (restaurant and entertainment complexes), as Chairman (2008-2011) and a member (2006-2015) of the Board of Trustees of the National Parks Conservation Association, and as a member of the Board of Directors for The Hillman Companies, Inc. (hardware wholesalers, 2010-2014), Earth Fare, Inc. (retail grocery, 2010-2014), and The Western Union Company (global money transfer, 2006-2011).
Ned C. Lautenbach (1944)
Year of Election or Appointment: 2000
Trustee
Chairman of the Independent Trustees
Mr. Lautenbach also serves as Trustee of other Fidelity® funds. Mr. Lautenbach currently serves as Vice Chair of the Board of Governors, State University System of Florida (2013-present) and is a member of the Council on Foreign Relations (1994-present). He is also a member and has most recently served as Chairman of the Board of Directors of Artis-Naples (2012-present). Previously, Mr. Lautenbach served as a member and then Lead Director of the Board of Directors of Eaton Corporation (diversified industrial, 1997-2016). He was also a Partner and Advisory Partner at Clayton, Dubilier & Rice, LLC (private equity investment, 1998-2010), as well as a Director of Sony Corporation (2006-2007). In addition, Mr. Lautenbach also had a 30-year career with IBM (technology company) during which time he served as Senior Vice President and a member of the Corporate Executive Committee (1968-1998).
Joseph Mauriello (1944)
Year of Election or Appointment: 2008
Trustee
Mr. Mauriello also serves as Trustee of other Fidelity® funds. Prior to his retirement in January 2006, Mr. Mauriello served in numerous senior management positions including Deputy Chairman and Chief Operating Officer (2004-2005), and Vice Chairman of Financial Services (2002-2004) of KPMG LLP US (professional services, 1965-2005). Mr. Mauriello currently serves as a member of the Board of Directors of XL Group plc. (global insurance and re-insurance, 2006-present) and the Independent Directors Council (IDC) Governing Council (2015-present). Previously, Mr. Mauriello served as a Director of the Hamilton Funds of the Bank of New York (2006-2007) and of Arcadia Resources Inc. (health care services and products, 2007-2012).
Cornelia M. Small (1944)
Year of Election or Appointment: 2005
Trustee
Ms. Small also serves as Trustee of other Fidelity® funds. Ms. Small is a member of the Board of Directors (2009-present) and Chair of the Investment Committee (2010-present) of the Teagle Foundation. Ms. Small also serves on the Investment Committee of the Berkshire Taconic Community Foundation (2008-present). Previously, Ms. Small served as Chairperson (2002-2008) and a member of the Investment Committee and Chairperson (2008-2012) and a member of the Board of Trustees of Smith College. In addition, Ms. Small served as Chief Investment Officer, Director of Global Equity Investments, and a member of the Board of Directors of Scudder, Stevens & Clark and Scudder Kemper Investments.
William S. Stavropoulos (1939)
Year of Election or Appointment: 2001
Trustee
Vice Chairman of the Independent Trustees
Mr. Stavropoulos also serves as Trustee of other Fidelity® funds. Mr. Stavropoulos serves as President and Founder of the Michigan Baseball Foundation, the Great Lakes Loons (2007-present). Mr. Stavropoulos is Chairman Emeritus of the Board of Directors of The Dow Chemical Company, where he previously served in numerous senior management positions, including President, CEO (1995-2000; 2002-2004), Chairman of the Executive Committee (2000-2006), and as a member of the Board of Directors (1990-2006). Currently, Mr. Stavropoulos is Chairman of the Board of Directors of Univar Inc. (global distributor of commodity and specialty chemicals), a Director of Teradata Corporation (data warehousing and technology solutions), and a member of the Advisory Board for Metalmark Capital LLC (private equity investment, 2005-present). Mr. Stavropoulos is an operating advisor to Clayton, Dubilier & Rice, LLC (private equity investment). In addition, Mr. Stavropoulos is a member of the University of Notre Dame Advisory Council for the College of Science, a Trustee of the Rollin L. Gerstacker Foundation, and a Director of Artis-Naples in Naples, Florida. Previously, Mr. Stavropoulos served as a Director of Chemical Financial Corporation (bank holding company, 1993-2012) and Tyco International, Ltd. (multinational manufacturing and services, 2007-2012).
David M. Thomas (1949)
Year of Election or Appointment: 2008
Trustee
Mr. Thomas also serves as Trustee of other Fidelity® funds. Mr. Thomas serves as Non-Executive Chairman of the Board of Directors of Fortune Brands Home and Security (home and security products, 2011-present), as a member of the Board of Directors (2004-present) and Presiding Director (2013-present) of Interpublic Group of Companies, Inc. (marketing communication), and as a member of the Board of Trustees of the University of Florida (2013-present). Previously, Mr. Thomas served as Executive Chairman (2005-2006) and Chairman and Chief Executive Officer (2000-2005) of IMS Health, Inc. (pharmaceutical and healthcare information solutions), and a Director of Fortune Brands, Inc. (consumer products, 2000-2011).
+ The information includes the Trustee's principal occupation during the last five years and other information relating to the experience, attributes, and skills relevant to the Trustee's qualifications to serve as a Trustee, which led to the conclusion that the Trustee should serve as a Trustee for the fund.
Advisory Board Members and Officers:
Correspondence intended for an officer or Peter S. Lynch may be sent to Fidelity Investments, 245 Summer Street, Boston, Massachusetts 02210. Officers appear below in alphabetical order.
Name, Year of Birth; Principal Occupation
Peter S. Lynch (1944)
Year of Election or Appointment: 2003
Member of the Advisory Board
Mr. Lynch also serves as Member of the Advisory Board of other Fidelity® funds. Mr. Lynch is Vice Chairman and a Director of FMR (investment adviser firm) and FMR Co., Inc. (investment adviser firm). In addition, Mr. Lynch serves as a Trustee of Boston College and as the Chairman of the Inner-City Scholarship Fund. Previously, Mr. Lynch served on the Special Olympics International Board of Directors (1997-2006).
Elizabeth Paige Baumann (1968)
Year of Election or Appointment: 2017
Anti-Money Laundering (AML) Officer
Ms. Baumann also serves as AML Officer of other funds. She is Chief AML Officer (2012-present) and Senior Vice President (2014-present) of FMR LLC (diversified financial services company) and is an employee of Fidelity Investments. Previously, Ms. Baumann served as AML Officer of the funds (2012-2016), and Vice President (2007-2014) and Deputy Anti-Money Laundering Officer (2007-2012) of FMR LLC.
Marc R. Bryant (1966)
Year of Election or Appointment: 2015
Secretary and Chief Legal Officer (CLO)
Mr. Bryant also serves as Secretary and CLO of other funds. Mr. Bryant serves as CLO, Secretary, and Senior Vice President of Fidelity Management & Research Company (investment adviser firm, 2015-present) and FMR Co., Inc. (investment adviser firm, 2015-present); Secretary of Fidelity SelectCo, LLC (investment adviser firm, 2015-present) and Fidelity Investments Money Management, Inc. (investment adviser firm, 2015-present); and CLO of Fidelity Management & Research (Hong Kong) Limited and FMR Investment Management (UK) Limited (investment adviser firms, 2015-present) and Fidelity Management & Research (Japan) Limited (investment adviser firm, 2016-present). He is Senior Vice President and Deputy General Counsel of FMR LLC (diversified financial services company). Previously, Mr. Bryant served as Secretary and CLO of Fidelity Rutland Square Trust II (2010-2014) and Assistant Secretary of Fidelity's Fixed Income and Asset Allocation Funds (2013-2015). Prior to joining Fidelity Investments, Mr. Bryant served as a Senior Vice President and the Head of Global Retail Legal for AllianceBernstein L.P. (2006-2010), and as the General Counsel for ProFund Advisors LLC (2001-2006).
William C. Coffey (1969)
Year of Election or Appointment: 2009
Assistant Secretary
Mr. Coffey also serves as Assistant Secretary of other funds. He is Senior Vice President and Deputy General Counsel of FMR LLC (diversified financial services company, 2010-present), and is an employee of Fidelity Investments. Previously, Mr. Coffey served as Vice President and Associate General Counsel of FMR LLC (2005-2009).
Jonathan Davis (1968)
Year of Election or Appointment: 2010
Assistant Treasurer
Mr. Davis also serves as Assistant Treasurer of other funds, and is an employee of Fidelity Investments. Previously, Mr. Davis served as Vice President and Associate General Counsel of FMR LLC (diversified financial services company, 2003-2010).
Adrien E. Deberghes (1967)
Year of Election or Appointment: 2016
Assistant Treasurer
Mr. Deberghes also serves as an officer of other funds. He serves as Executive Vice President of Fidelity Investments Money Management, Inc. (FIMM) (investment adviser firm, 2016-present) and is an employee of Fidelity Investments (2008-present). Prior to joining Fidelity Investments, Mr. Deberghes was Senior Vice President of Mutual Fund Administration at State Street Corporation (2007-2008), Senior Director of Mutual Fund Administration at Investors Bank & Trust (2005-2007), and Director of Finance for Dunkin' Brands (2000-2005). Previously, Mr. Deberghes served in other fund officer roles.
Joseph DeSantis (1959)
Year of Election or Appointment: 2017
Vice President
Mr. DeSantis also serves as Vice President of other funds. Mr. DeSantis serves as a Director of Fidelity Management & Research (Japan) Limited (investment adviser firm, 2016-present), Chief Investment Officer, Equities (2010-present) and is an employee of Fidelity Investments.
Stephanie J. Dorsey (1969)
Year of Election or Appointment: 2010
Assistant Treasurer
Ms. Dorsey also serves as an officer of other funds. She is an employee of Fidelity Investments (2008-present) and has served in other fund officer roles. Prior to joining Fidelity Investments, Ms. Dorsey served as Treasurer (2004-2008) of the JPMorgan Mutual Funds and Vice President (2004-2008) of JPMorgan Chase Bank.
Howard J. Galligan III (1966)
Year of Election or Appointment: 2014
Chief Financial Officer
Mr. Galligan also serves as Chief Financial Officer of other funds. Mr. Galligan serves as President of Fidelity Pricing and Cash Management Services (FPCMS) (2014-present) and as a Director of Strategic Advisers, Inc. (investment adviser firm, 2008-present). Previously, Mr. Galligan served as Chief Administrative Officer of Asset Management (2011-2014) and Chief Operating Officer and Senior Vice President of Investment Support for Strategic Advisers, Inc. (2003-2011).
Brian B. Hogan (1964)
Year of Election or Appointment: 2009
Vice President
Mr. Hogan also serves as Trustee or Vice President of other funds. Mr. Hogan serves as a Director of FMR Investment Management (UK) Limited (investment adviser firm, 2015-present) and Fidelity SelectCo, LLC (investment adviser firm, 2014-present) and President of the Equity Division of FMR (investment adviser firm, 2009-present). Previously, Mr. Hogan served as Senior Vice President, Equity Research of FMR (2006-2009) and as a portfolio manager. Mr. Brian B. Hogan is not related to Mr. Colm A. Hogan.
Colm A. Hogan (1973)
Year of Election or Appointment: 2016
Deputy Treasurer
Mr. Hogan also serves as an officer of other funds. Mr. Hogan is an employee of Fidelity Investments (2005-present). Mr. Colm A. Hogan is not related to Mr. Brian B. Hogan.
Chris Maher (1972)
Year of Election or Appointment: 2013
Assistant Treasurer
Mr. Maher serves as Assistant Treasurer of other funds. Mr. Maher is Vice President of Valuation Oversight and is an employee of Fidelity Investments. Previously, Mr. Maher served as Vice President of Asset Management Compliance (2013), Vice President of the Program Management Group of FMR (investment adviser firm, 2010-2013), and Vice President of Valuation Oversight (2008-2010).
Rieco E. Mello (1969)
Year of Election or Appointment: 2017
Assistant Treasurer
Mr. Mello also serves as Assistant Treasurer of other funds. Mr. Mello is an employee of Fidelity Investments (1995-present).
Kenneth B. Robins (1969)
Year of Election or Appointment: 2016
Chief Compliance Officer
Mr. Robins also serves as an officer of other funds. Mr. Robins serves as Compliance Officer of Fidelity Management & Research Company and FMR Co., Inc. (investment adviser firms, 2016-present) and is an employee of Fidelity Investments (2004-present). Previously, Mr. Robins served as Executive Vice President of Fidelity Investments Money Management, Inc. (investment adviser firm, 2013-2016) and served in other fund officer roles.
Stacie M. Smith (1974)
Year of Election or Appointment: 2016
President and Treasurer
Ms. Smith also serves as an officer of other funds. She is an employee of Fidelity Investments (2009-present) and has served in other fund officer roles. Prior to joining Fidelity Investments, Ms. Smith served as Senior Audit Manager of Ernst & Young LLP (accounting firm, 1996-2009). Previously, Ms. Smith served as Deputy Treasurer of certain Fidelity® funds (2013-2016).
Marc L. Spector (1972)
Year of Election or Appointment: 2016
Assistant Treasurer
Mr. Spector also serves as an officer of other funds. Mr. Spector is an employee of Fidelity Investments (2016-present). Prior to joining Fidelity Investments, Mr. Spector served as Director at the Siegfried Group (accounting firm, 2013-2016), and prior to Siegfried Group as audit senior manager at Deloitte & Touche (accounting firm, 2005-2013).
Renee Stagnone (1975)
Year of Election or Appointment: 2016
Assistant Treasurer
Ms. Stagnone also serves as an officer of other funds. Ms. Stagnone is an employee of Fidelity Investments (1997-present). Previously, Ms. Stagnone served as Deputy Treasurer of certain Fidelity® funds (2013-2016).
Shareholder Expense Example
As a shareholder of the Fund, you incur two types of costs: (1) transaction costs, including sales charges (loads) on purchase payments or redemption proceeds, redemption fees and (2) ongoing costs, including management fees, distribution and/or service (12b-1) fees and other Fund expenses. This Example is intended to help you understand your ongoing costs (in dollars) of investing in the Fund and to compare these costs with the ongoing costs of investing in other mutual funds.
The Example is based on an investment of $1,000 invested at the beginning of the period and held for the entire period (May 1, 2017 to October 31, 2017).
Actual Expenses
The first line of the accompanying table for each class of the Fund provides information about actual account values and actual expenses. You may use the information in this line, together with the amount you invested, to estimate the expenses that you paid over the period. Simply divide your account value by $1,000.00 (for example, an $8,600 account value divided by $1,000.00 = 8.6), then multiply the result by the number in the first line for a class of the Fund under the heading entitled "Expenses Paid During Period" to estimate the expenses you paid on your account during this period. A small balance maintenance fee of $12.00 that is charged once a year may apply for certain accounts with a value of less than $2,000. This fee is not included in the table below. If it was, the estimate of expenses you paid during the period would be higher, and your ending account value lower, by this amount. In addition, the Fund, as a shareholder in the underlying Fidelity Central Funds, will indirectly bear its pro-rata share of the fees and expenses incurred by the underlying Fidelity Central Funds. These fees and expenses are not included in the Fund's annualized expense ratio used to calculate the expense estimate in the table below.
Hypothetical Example for Comparison Purposes
The second line of the accompanying table for each class of the Fund provides information about hypothetical account values and hypothetical expenses based on a Class' actual expense ratio and an assumed rate of return of 5% per year before expenses, which is not the Class' actual return. The hypothetical account values and expenses may not be used to estimate the actual ending account balance or expenses you paid for the period. You may use this information to compare the ongoing costs of investing in the Fund and other funds. To do so, compare this 5% hypothetical example with the 5% hypothetical examples that appear in the shareholder reports of the other funds. A small balance maintenance fee of $12.00 that is charged once a year may apply for certain accounts with a value of less than $2,000. This fee is not included in the table below. If it was, the estimate of expenses you paid during the period would be higher, and your ending account value lower, by this amount. In addition, the Fund, as a shareholder in the underlying Fidelity Central Funds, will indirectly bear its pro-rata share of the fees and expenses incurred by the underlying Fidelity Central Funds. These fees and expenses are not included in the Fund's annualized expense ratio used to calculate the expense estimate in the table below.
Please note that the expenses shown in the table are meant to highlight your ongoing costs only and do not reflect any transaction costs. Therefore, the second line of the table is useful in comparing ongoing costs only, and will not help you determine the relative total costs of owning different funds. In addition, if these transactional costs were included, your costs would have been higher.
| | Annualized Expense Ratio-A | Beginning
Account Value
May 1, 2017 | Ending
Account Value
October 31, 2017 | Expenses Paid
During Period-B
May 1, 2017
to October 31, 2017 |
| Class A | 1.33% | | | |
| Actual | | $1,000.00 | $1,136.90 | $7.16 |
| Hypothetical-C | | $1,000.00 | $1,018.50 | $6.77 |
| Class M | 1.57% | | | |
| Actual | | $1,000.00 | $1,135.50 | $8.45 |
| Hypothetical-C | | $1,000.00 | $1,017.29 | $7.98 |
| Class C | 2.10% | | | |
| Actual | | $1,000.00 | $1,132.60 | $11.29 |
| Hypothetical-C | | $1,000.00 | $1,014.62 | $10.66 |
| International Discovery | .98% | | | |
| Actual | | $1,000.00 | $1,139.00 | $5.28 |
| Hypothetical-C | | $1,000.00 | $1,020.27 | $4.99 |
| Class K | .87% | | | |
| Actual | | $1,000.00 | $1,139.50 | $4.69 |
| Hypothetical-C | | $1,000.00 | $1,020.82 | $4.43 |
| Class I | 1.01% | | | |
| Actual | | $1,000.00 | $1,138.80 | $5.44 |
| Hypothetical-C | | $1,000.00 | $1,020.11 | $5.14 |
| Class Z | .86% | | | |
| Actual | | $1,000.00 | $1,139.40 | $4.64 |
| Hypothetical-C | | $1,000.00 | $1,020.87 | $4.38 |
A Annualized expense ratio reflects expenses net of applicable fee waivers.
B Expenses are equal to each Class' annualized expense ratio, multiplied by the average account value over the period, multiplied by 184/365 (to reflect the one-half year period).
C 5% return per year before expenses
Distributions (Unaudited)
The Board of Trustees of Fidelity International Discovery fund voted to pay to shareholders of record at the opening of business on record date, the following distributions per share derived from capital gains realized from sales of portfolio securities, and dividends derived from net investment income:
| | Pay Date | Record Date | Dividends | Capital Gains |
| Fidelity International Discovery Fund | | | | |
| Class A | 12/11/17 | 12/08/17 | $0.340 | $1.832 |
| Class M | 12/11/17 | 12/08/17 | $0.240 | $1.832 |
| Class C | 12/11/17 | 12/08/17 | $0.022 | $1.832 |
| International Discovery | 12/11/17 | 12/08/17 | $0.502 | $1.832 |
| Class K | 12/11/17 | 12/08/17 | $0.554 | $1.832 |
| Class I | 12/11/17 | 12/08/17 | $0.490 | $1.832 |
| Class Z | 12/11/17 | 12/08/17 | $0.555 | $1.832 |
|
The fund hereby designates as a capital gain dividend with respect to the taxable year ended October 31, 2017, $412,933,613, or, if subsequently determined to be different, the net capital gain of such year.
Class A designates 2%; Class M designates 3%; Class C designates 5%; International Discovery designates 2%; Class K designates 2%; Class I designates 2% and Class Z designates 2% of the dividends distributed in during the fiscal year as qualifying for the dividends–received deduction for corporate shareholders.
Class A, Class M, Class C, International Discovery, Class K, Class I and Class Z designate 100% of dividends distributed during the fiscal year as amounts which may be taken into account as a dividend for purposes of the maximum rate under section 1(h)(11) of the Internal Revenue Code.
The amounts per share which represent income derived from sources within, and taxes paid to, foreign countries or possessions of the United States are as follows:
| | Pay Date | Income | Taxes |
| Fidelity International Discovery Fund | | | |
| Class A | 12/12/16 | $0.5749 | $0.0559 |
| Class M | 12/12/16 | $0.4739 | $0.0559 |
| Class C | 12/12/16 | $0.2389 | $0.0559 |
| International Discovery | 12/12/16 | $0.7169 | $0.0559 |
| Class K | 12/12/16 | $0.7689 | $0.0559 |
| Class I | 12/12/16 | $0.7109 | $0.0559 |
| Class Z | 12/12/16 | $0.7729 | $0.0559 |
|
The fund will notify shareholders in January 2018 of amounts for use in preparing 2017 income tax returns.
Board Approval of Investment Advisory Contracts and Management Fees
Fidelity International Discovery Fund
Each year, the Board of Trustees, including the Independent Trustees (together, the Board), votes on the renewal of the management contract with Fidelity Management & Research Company (FMR) and the sub-advisory agreements (together, the Advisory Contracts) for the fund. FMR and the sub-advisers are referred to herein as the Investment Advisers. The Board, assisted by the advice of fund counsel and Independent Trustees' counsel, requests and considers a broad range of information relevant to the renewal of the Advisory Contracts throughout the year.
The Board meets regularly and, at each of its meetings, covers an extensive agenda of topics and materials and considers factors that are relevant to its annual consideration of the renewal of the fund's Advisory Contracts, including the services and support provided to the fund and its shareholders. The Board has established various standing committees (Committees), each composed of and chaired by Independent Trustees with varying backgrounds, to which the Board has assigned specific subject matter responsibilities in order to enhance effective decision-making by the Board. The Board, acting directly and through its Committees, requests and receives information concerning the annual consideration of the renewal of the fund's Advisory Contracts. The Board also meets as needed to review matters specifically related to the Board's annual consideration of the renewal of the Advisory Contracts. Members of the Board may also meet with trustees of other Fidelity funds through ad hoc joint committees to discuss certain matters relevant to all of the Fidelity funds.
At its July 2017 meeting, the Board unanimously determined to renew the fund's Advisory Contracts. In reaching its determination, the Board considered all factors it believed relevant, including (i) the nature, extent, and quality of the services to be provided to the fund and its shareholders (including the investment performance of the fund); (ii) the competitiveness of the fund's management fee and total expense ratio relative to peer funds; (iii) the total costs of the services to be provided by and the profits to be realized by Fidelity from its relationships with the fund; and (iv) the extent to which, if any, economies of scale exist and would be realized as the fund grows, and whether any economies of scale are appropriately shared with fund shareholders.
In considering whether to renew the Advisory Contracts for the fund, the Board reached a determination, with the assistance of fund counsel and Independent Trustees' counsel and through the exercise of its business judgment, that the renewal of the Advisory Contracts was in the best interests of the fund and its shareholders and that the compensation payable under the Advisory Contracts was fair and reasonable. The Board's decision to renew the Advisory Contracts was not based on any single factor, but rather was based on a comprehensive consideration of all the information provided to the Board at its meetings throughout the year. The Board, in reaching its determination to renew the Advisory Contracts, was aware that shareholders of the fund have a broad range of investment choices available to them, including a wide choice among funds offered by Fidelity's competitors, and that the fund's shareholders, who have the opportunity to review and weigh the disclosure provided by the fund in its prospectus and other public disclosures, have chosen to invest in this fund, which is part of the Fidelity family of funds.
Amendment to Group Fee Rate. The Board also approved an amendment to the management contract for the fund to add an additional breakpoint to the group fee schedule, effective October 1, 2017. The Board noted that the additional breakpoint would result in lower management fee rates as Fidelity's assets under management increase.
Nature, Extent, and Quality of Services Provided. The Board considered Fidelity's staffing as it relates to the fund, including the backgrounds of investment personnel of Fidelity, and also considered the fund's investment objective, strategies, and related investment philosophy. The Independent Trustees also had discussions with senior management of Fidelity's investment operations and investment groups. The Board considered the structure of the investment personnel compensation program and whether this structure provides appropriate incentives to act in the best interests of the fund. Additionally, the Board considered the portfolio managers' investments, if any, in the funds that they manage.
Resources Dedicated to Investment Management and Support Services. The Board and the Fund Oversight and Research Committees reviewed the general qualifications and capabilities of Fidelity's investment staff, including its size, education, experience, and resources, as well as Fidelity's approach to recruiting, training, managing, and compensating investment personnel. The Board noted that Fidelity has continued to increase the resources devoted to non-U.S. offices, including expansion of Fidelity's global investment organization. The Board also noted that Fidelity's analysts have extensive resources, tools and capabilities that allow them to conduct sophisticated quantitative and fundamental analysis, as well as credit analysis of issuers, counterparties and guarantors. Further, the Board considered that Fidelity's investment professionals have sufficient access to global information and data so as to provide competitive investment results over time, and that those professionals also have access to sophisticated tools that permit them to assess portfolio construction and risk and performance attribution characteristics continuously, as well as to transmit new information and research conclusions rapidly around the world. Additionally, in its deliberations, the Board considered Fidelity's trading, risk management, compliance, and technology and operations capabilities and resources, which are integral parts of the investment management process.
Shareholder and Administrative Services. The Board considered (i) the nature, extent, quality, and cost of advisory, administrative, and shareholder services performed by the Investment Advisers and their affiliates under the Advisory Contracts and under separate agreements covering transfer agency, pricing and bookkeeping, and securities lending services for the fund; (ii) the nature and extent of the supervision of third party service providers, principally custodians, subcustodians, and pricing vendors; and (iii) the resources devoted to, and the record of compliance with, the fund's compliance policies and procedures. The Board also reviewed the allocation of fund brokerage, including allocations to brokers affiliated with the Investment Advisers, the use of brokerage commissions to pay fund expenses, and the use of "soft" commission dollars to pay for research services.
The Board noted that the growth of fund assets over time across the complex allows Fidelity to reinvest in the development of services designed to enhance the value or convenience of the Fidelity funds as investment vehicles. These services include 24-hour access to account information and market information through telephone representatives and over the Internet, investor education materials and asset allocation tools, and the expanded availability of Fidelity Investor Centers.
In 2014, the Board formed an ad hoc Committee on Transfer Agency Fees to review the variety of transfer agency fee structures throughout the industry and Fidelity's competitive positioning with respect to industry participants.
Investment in a Large Fund Family. The Board considered the benefits to shareholders of investing in a Fidelity fund, including the benefits of investing in a fund that is part of a large family of funds offering a variety of investment disciplines and providing a large variety of mutual fund investor services. The Board noted that Fidelity had taken, or had made recommendations that resulted in the Fidelity funds taking, a number of actions over the previous year that benefited particular funds, including: (i) continuing to dedicate additional resources to Fidelity's investment research process, and to the support of the senior management team that oversees asset management; (ii) continuing efforts to enhance Fidelity's global research capabilities; (iii) launching new funds and making other enhancements to meet client needs; (iv) launching new share classes of existing funds; (v) eliminating purchase minimums and broadening eligibility requirements for certain lower-priced share classes; (vi) reducing management fees and total expenses for certain growth equity funds and index funds; (vii) lowering expense caps for certain existing funds and classes to reduce expenses borne by shareholders; (viii) eliminating short-term redemption fees for certain funds; (ix) introducing a new pricing structure for certain funds of funds that is expected to reduce overall expenses paid by shareholders; (x) rationalizing product lines and gaining increased efficiencies through proposals for fund mergers and share class consolidations; (xi) continuing to develop, acquire and implement systems and technology to improve services to the funds and shareholders, strengthen information security, and increase efficiency; and (xii) implementing enhancements to further strengthen Fidelity's product line to increase investors' probability of success in achieving their investment goals, including retirement income goals.
Investment Performance. The Board considered whether the fund has operated in accordance with its investment objective, as well as its record of compliance with its investment restrictions and its performance history.
The Board took into account discussions with representatives of the Investment Advisers about fund investment performance that occur at Board meetings throughout the year. In this regard the Board noted that as part of regularly scheduled fund reviews and other reports to the Board on fund performance, the Board considers annualized return information for the fund for different time periods, measured against a securities market index ("benchmark index") and a peer group of funds with similar objectives ("peer group"), if any. In its evaluation of fund investment performance, the Board gave particular attention to information indicating changes in performance of certain Fidelity funds for specific time periods and discussed with the Investment Advisers the reasons for any overperformance or underperformance.
In addition to reviewing absolute and relative fund performance, the Independent Trustees periodically consider the appropriateness of fund performance metrics in evaluating the results achieved. In general, the Independent Trustees believe that fund performance should be evaluated based on net performance (after fees and expenses) of both the highest performing and lowest performing fund share classes, where applicable, compared to appropriate benchmark indices, over appropriate time periods that may include full market cycles, and compared to peer groups, as applicable, over the same periods, taking into account relevant factors including the following: general market conditions; issuer-specific information; and fund cash flows and other factors.
The Independent Trustees recognize that shareholders evaluate performance on a net basis over their own holding periods, for which one-, three-, and five-year periods are often used as a proxy. For this reason, the performance information reviewed by the Board also included net cumulative calendar year total return information for the fund and an appropriate benchmark index and peer group for the most recent one-, three-, and five-year periods, as shown below. Returns are shown compared to the 25th percentile (top of box, 75% beaten) and 75th percentile (bottom of box, 25% beaten) of the peer universe. Returns of the benchmark index are "net MA,"
i.e., adjusted for tax withholding rates applicable to U.S.-based funds organized as Massachusetts business trusts.
Fidelity International Discovery Fund
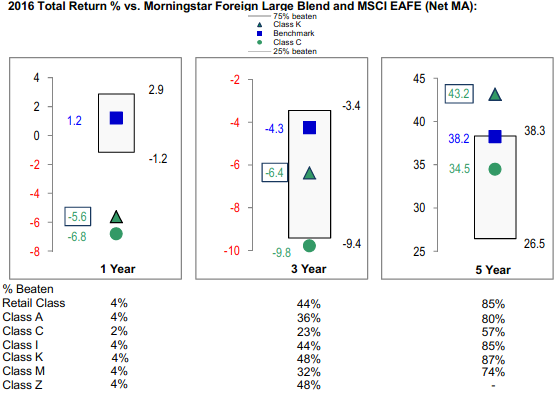
The Board has discussed the fund's underperformance (based on the December 31, 2016 data presented herein) with FMR, including the fund's investment strategy, the portfolio management team, and broader trends in the market that may have impacted the fund's performance, and has engaged with FMR to consider what steps might be taken to remediate the fund's underperformance. The Board noted that the fund's performance has improved since the period shown.
The Board also considered that the fund's management fee is subject to upward or downward adjustment depending upon whether, and to what extent, the fund's investment performance for the performance period (a rolling 36-month period) exceeds, or is exceeded by, a securities index, thus leading to a performance adjustment for the same period. The Board noted that the performance adjustment provides FMR with a strong economic incentive to seek to achieve superior long-term performance for the fund's shareholders and helps to more closely align the interests of FMR and the shareholders of the fund.
Based on its review, the Board concluded that the nature, extent, and quality of services provided to the fund under the Advisory Contracts should continue to benefit the shareholders of the fund.
Competitiveness of Management Fee and Total Expense Ratio. The Board considered the fund's management fee and total expense ratio compared to "mapped groups" of competitive funds and classes created for the purpose of facilitating the Trustees' competitive analysis of management fees and total expenses. Fidelity creates "mapped groups" by combining similar Lipper investment objective categories that have comparable investment mandates. Combining Lipper investment objective categories aids the Board's management fee and total expense ratio comparisons by broadening the competitive group used for comparison.
Management Fee. The Board considered two proprietary management fee comparisons for the 12-month periods shown in basis points (BP) in the chart below. The group of Lipper funds used by the Board for management fee comparisons is referred to below as the "Total Mapped Group." The Total Mapped Group comparison focuses on a fund's standing in terms of gross management fees before expense reimbursements or caps, and without giving effect to the fund's performance adjustment, relative to the total universe of funds with comparable investment mandates, regardless of whether their management fee structures also are comparable. Funds with comparable investment mandates offer exposure to similar types of securities. Funds with comparable management fee structures have similar management fee contractual arrangements (
e.g., flat rate charged for advisory services, all-inclusive fee rate,
etc.). "TMG %" represents the percentage of funds in the Total Mapped Group that had management fees that were lower than the fund's. For example, a hypothetical TMG % of 20% would mean that 80% of the funds in the Total Mapped Group had higher, and 20% had lower, management fees than the fund. The fund's actual TMG %s and the number of funds in the Total Mapped Group are in the chart below. The "Asset-Size Peer Group" (ASPG) comparison focuses on a fund's standing relative to a subset of non-Fidelity funds within the Total Mapped Group that are similar in size and management fee structure without taking into account performance adjustments, if any. For example, if a fund is in the first quartile of the ASPG, the fund's management fee ranks in the least expensive or lowest 25% of funds in the ASPG. The ASPG represents at least 15% of the funds in the Total Mapped Group with comparable asset size and management fee structures, subject to a minimum of 50 funds (or all funds in the Total Mapped Group if fewer than 50). Additional information, such as the ASPG quartile in which the fund's management fee rate ranked and the impact of the fund's performance adjustment, is also included in the chart and considered by the Board.
Fidelity International Discovery Fund
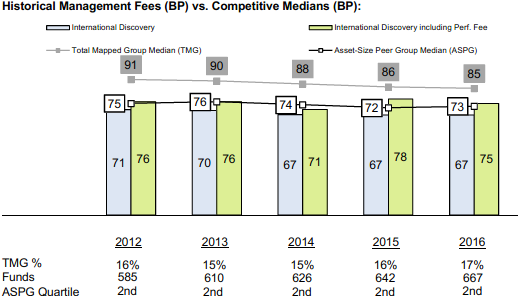
The Board noted that the fund's management fee rate ranked below the median of its Total Mapped Group and below the median of its ASPG for 2016. The Board also noted the effect of the fund's performance adjustment, if any, on the fund's management fee ranking.
Furthermore, the Board considered that it had approved a reduction (effective August 1, 2014) in the individual fund fee rate component of the management fee rate for the fund from 0.450% to 0.424%. The Board considered that the chart reflects the fund's lower management fee rate for 2014, as if the lower fee rate were in effect for the entire year.
The Board noted that, in 2014, the Board and the boards of other Fidelity funds formed the ad hoc Committee on Group Fee to conduct an in-depth review of the "group fee" component of the management fee of funds with such management fee structures. The Committee's focus included the mechanics of the group fee, the competitive landscape of group fee structures, Fidelity funds with no group fee component and investment products not included in group fee assets. The Board also considered that, for funds subject to the group fee, FMR agreed to voluntarily waive fees over a specified period of time in amounts designed to account for assets converted from certain funds to certain collective investment trusts.
The Board also noted that, in 2013, the ad hoc Committee on Management Fees was formed to conduct an in-depth review of the management fee rates of Fidelity's active equity mutual funds. The Committee focused on the following areas: (i) standard fee structures; (ii) research consumption and trading evolution; (iii) management fee competitiveness/profitability by category; and (iv) factors that drive institutional pricing.
Based on its review, the Board concluded that the fund's management fee is fair and reasonable in light of the services that the fund receives and the other factors considered.
Total Expense Ratio. In its review of each class's total expense ratio, the Board considered the fund's management fee rate as well as other fund or class expenses, as applicable, such as transfer agent fees, pricing and bookkeeping fees, fund-paid 12b-1 fees, and custodial, legal, and audit fees. The Board noted the impact of the fund's performance adjustment. The Board also noted that Fidelity may agree to waive fees and expenses from time to time, and the extent to which, if any, it has done so for the fund. As part of its review, the Board also considered the current and historical total expense ratios of each class of the fund compared to competitive fund median expenses. Each class of the fund is compared to those funds and classes in the Total Mapped Group (used by the Board for management fee comparisons) that have a similar sales load structure.
The Board noted that the total expense ratio of each of Class A, Class I, Class Z, the retail class, and Class K ranked below the competitive median for 2016 and the total expense ratio of each of Class M (formerly Class T) and Class C ranked above the competitive median for 2016. The Board considered that, in general, various factors can affect total expense ratios. The Board noted that the total expense ratio of Class M was above the competitive median primarily because of higher 12b-1 fees on Class M as compared to most competitor funds. Class M has a higher 12b-1 fee, but a lower front-end sales charge, than traditionally priced front-end sales charge classes. The Board considered that Class M is primarily sold load-waived in the retirement plan market where its 0.50% 12b-1 fee is comparable to competing no-load, higher 12b-1 fee classes designed specifically for retirement plans. The Board noted that the total expense ratio of Class C was above the competitive median primarily because of its 12b-1 fees. The Board noted that the fund offers multiple classes, each of which has a different sales load and 12b-1 fee structure, and that the multiple structures are intended to offer a range of pricing options for the intermediary market. The Board also noted that the total expense ratios of the classes vary primarily by the level of their 12b-1 fees, although differences in transfer agent fees may also cause expenses to vary from class to class.
Fees Charged to Other Fidelity Clients. The Board also considered Fidelity fee structures and other information with respect to clients of Fidelity, such as other funds advised or subadvised by Fidelity, pension plan clients, and other institutional clients with similar mandates. The Board noted that an ad hoc joint committee created by it and the boards of other Fidelity funds periodically (most recently in 2013) reviews and compares Fidelity's institutional investment advisory business with its business of providing services to the Fidelity funds, including the differences in services provided, fees charged, and costs incurred, as well as competition in their respective marketplaces.
Based on its review of total expense ratios and fees charged to other Fidelity clients, the Board concluded that, although some classes were above the median of the universe presented for comparison, the total expense ratio of each class of the fund was reasonable in light of the services that the fund and its shareholders receive and the other factors considered.
Costs of the Services and Profitability. The Board considered the revenues earned and the expenses incurred by Fidelity in conducting the business of developing, marketing, distributing, managing, administering and servicing the fund and servicing the fund's shareholders. The Board also considered the level of Fidelity's profits in respect of all the Fidelity funds.
On an annual basis, Fidelity presents to the Board information about the profitability of its relationships with the fund. Fidelity calculates profitability information for each fund, as well as aggregate profitability information for groups of Fidelity funds and all Fidelity funds, using a series of detailed revenue and cost allocation methodologies which originate with the books and records of Fidelity on which Fidelity's audited financial statements are based. The Audit Committee of the Board reviews any significant changes from the prior year's methodologies.
PricewaterhouseCoopers LLP (PwC), independent registered public accounting firm and auditor to Fidelity and certain Fidelity funds, has been engaged annually by the Board as part of the Board's assessment of Fidelity's profitability analysis. PwC's engagement includes the review and assessment of the methodologies used by Fidelity in determining the revenues and expenses attributable to Fidelity's mutual fund business, and completion of agreed-upon procedures in respect of the mathematical accuracy of the fund profitability information and its conformity to established allocation methodologies. After considering PwC's reports issued under the engagement and information provided by Fidelity, the Board concluded that while other allocation methods may also be reasonable, Fidelity's profitability methodologies are reasonable in all material respects.
The Board also reviewed Fidelity's non-fund businesses and potential fall-out benefits related to the mutual fund business as well as cases where Fidelity's affiliates may benefit from or be related to the fund's business.
The Board considered the costs of the services provided by and the profits realized by Fidelity in connection with the operation of the fund and was satisfied that the profitability was not excessive.
Economies of Scale. The Board considered whether there have been economies of scale in respect of the management of the Fidelity funds, whether the Fidelity funds (including the fund) have appropriately benefited from any such economies of scale, and whether there is potential for realization of any further economies of scale. The Board considered the extent to which the fund will benefit from economies of scale as assets grow through increased services to the fund, through waivers or reimbursements, or through fee or expense ratio reductions. The Board also noted that a committee (the Economies of Scale Committee) created by it and the boards of other Fidelity funds periodically (most recently in 2013) analyzes whether Fidelity attains economies of scale in respect of the management and servicing of the Fidelity funds, whether the Fidelity funds have appropriately benefited from such economies of scale, and whether there is potential for realization of any further economies of scale.
The Board recognized that the fund's management contract incorporates a "group fee" structure, which provides for lower group fee rates as total group assets increase, and for higher group fee rates as total group assets decrease (with "group assets" defined to include fund assets under FMR's management plus the assets of sector funds previously under FMR's management). FMR calculates the group fee rates based on a tiered asset "breakpoint" schedule that varies based on asset class. The Board considered that the group fee is designed to deliver the benefits of economies of scale to fund shareholders when total Fidelity fund assets increase, even if assets of any particular fund are unchanged or have declined, because some portion of Fidelity's costs are attributable to services provided to all Fidelity funds, and all funds benefit if those costs can be allocated among more assets. The Board concluded that, given the group fee structure, fund shareholders will benefit from lower management fees as group assets increase at the fund complex level, regardless of whether Fidelity achieves any such economies of scale.
The Board concluded, taking into account the analysis of the Economies of Scale Committee, that economies of scale, if any, are being appropriately shared between fund shareholders and Fidelity.
Additional Information Requested by the Board. In order to develop fully the factual basis for consideration of the Fidelity funds' advisory contracts, the Board requested and received additional information on certain topics, including: (i) fund performance trends, in particular the underperformance of certain funds, and Fidelity's long-term strategies for certain funds; (ii) Fidelity's fund profitability methodology, profitability trends for certain funds, and the impact of certain factors on fund profitability results, including the impact of market trends on actively managed funds; (iii) the use of performance fees and the calculation of performance adjustments, including the impact of underperformance and fund outflows on performance adjustments; (iv) metrics for evaluating index fund performance; (v) Fidelity's group fee structure, including the group fee breakpoint schedules; (vi) the terms of Fidelity's contractual and voluntary expense cap arrangements with the funds; (vii) the methodology with respect to evaluating competitive fund data and peer group classifications and fee comparisons; (viii) the expense structures for different funds and classes; (ix) Fidelity's arrangements with affiliated sub-advisers on behalf of the funds; (x) information regarding other accounts managed by Fidelity, including institutional accounts and collective investment trusts; (xi) recent changes to the fee structure for certain funds of funds; and (xii) the impact of the Department of Labor's new fiduciary rule on the funds' comparative expense information.
Based on its evaluation of all of the conclusions noted above, and after considering all factors it believed relevant, the Board concluded that the advisory fee structures are fair and reasonable, and that the fund's Advisory Contracts should be renewed.
AID-ANN-1217
1.806659.112
Fidelity® International Growth Fund
Annual Report October 31, 2017 |
|
Contents
To view a fund's proxy voting guidelines and proxy voting record for the 12-month period ended June 30, visit http://www.fidelity.com/proxyvotingresults or visit the Securities and Exchange Commission's (SEC) web site at http://www.sec.gov.
You may also call 1-800-544-8544 to request a free copy of the proxy voting guidelines.
Standard & Poor's, S&P and S&P 500 are registered service marks of The McGraw-Hill Companies, Inc. and have been licensed for use by Fidelity Distributors Corporation.
Other third-party marks appearing herein are the property of their respective owners.
All other marks appearing herein are registered or unregistered trademarks or service marks of FMR LLC or an affiliated company. © 2017 FMR LLC. All rights reserved.
This report and the financial statements contained herein are submitted for the general information of the shareholders of the Fund. This report is not authorized for distribution to prospective investors in the Fund unless preceded or accompanied by an effective prospectus.
A fund files its complete schedule of portfolio holdings with the SEC for the first and third quarters of each fiscal year on Form N-Q. Forms N-Q are available on the SEC’s web site at http://www.sec.gov. A fund's Forms N-Q may be reviewed and copied at the SEC’s Public Reference Room in Washington, DC. Information regarding the operation of the SEC's Public Reference Room may be obtained by calling 1-800-SEC-0330.
For a complete list of a fund's portfolio holdings, view the most recent holdings listing, semiannual report, or annual report on Fidelity's web site at http://www.fidelity.com, http://www.institutional.fidelity.com, or http://www.401k.com, as applicable.
NOT FDIC INSURED •MAY LOSE VALUE •NO BANK GUARANTEE
Neither the Fund nor Fidelity Distributors Corporation is a bank.
Performance: The Bottom Line
Average annual total return reflects the change in the value of an investment, assuming reinvestment of distributions from dividend income and capital gains (the profits earned upon the sale of securities that have grown in value, if any) and assuming a constant rate of performance each year. The hypothetical investment and the average annual total returns do not reflect the deduction of taxes that a shareholder would pay on fund distributions or the redemption of fund shares. During periods of reimbursement by Fidelity, a fund’s total return will be greater than it would be had the reimbursement not occurred. How a fund did yesterday is no guarantee of how it will do tomorrow.
Average Annual Total Returns
| For the periods ended October 31, 2017 | Past 1 year | Past 5 years | Life of fundA |
| Fidelity® International Growth Fund | 24.14% | 9.46% | 3.92% |
A From November 1, 2007
$10,000 Over Life of Fund
Let's say hypothetically that $10,000 was invested in Fidelity® International Growth Fund, a class of the fund, on November 1, 2007, when the fund started.
The chart shows how the value of your investment would have changed, and also shows how the MSCI EAFE Growth Index performed over the same period.
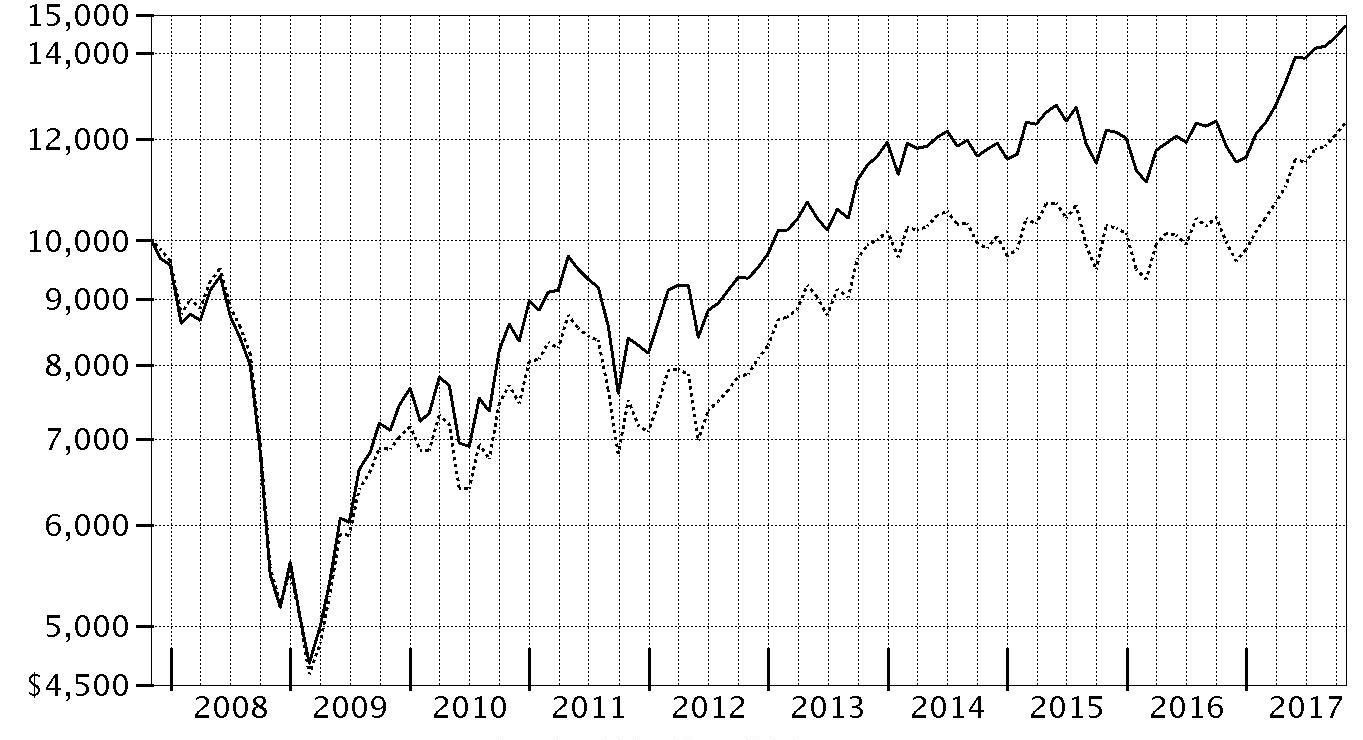
| Period Ending Values |
| $14,697 | Fidelity® International Growth Fund |
| $12,349 | MSCI EAFE Growth Index |
Management's Discussion of Fund Performance
Market Recap: The MSCI ACWI (All Country World Index) ex USA Index returned 23.85% for the 12 months ending October 31, 2017, helped partly by a generally weak U.S. dollar. Some favorable election results in continental Europe (+30%) suggested ebbing political uncertainty and near-term risk there, but the U.K. (+20%) faced more-mixed conditions ahead of its expected exit from the European Union. Despite central-bank easing – and pressured recently by yen strength – Japan (+18%) lagged the rest of the Asia-Pacific group (+22%). Commodity-price volatility slowed Canada (+17%), but the emerging-markets group (+26%) sped ahead. Sector-wise, information technology (+47%) was driven by a surge among several Chinese internet-related names. Financials (+27%) rode rising interest rates that, at the same time, weighed on real estate (+17%), utilities (+16%), consumer staples (+14%) and telecom services (+9%) – so-called “bond proxy” sectors. Materials (+28%) and industrials (+27%) responded to demand from China and gains in certain commodity prices. In energy (+20%), oil prices lost ground in the spring before rebounding through October 31 to end well above where they started 12 months ago. Lastly, health care (+14%) was hurt by early-period turmoil around drug pricing and health care legislation.
Comments from Portfolio Manager Jed Weiss: For the fiscal year, the fund’s share classes (excluding sales charges, if applicable) gained about 23% to 24%, roughly in line with the 23.83% return of the MSCI EAFE Growth Index. Versus the benchmark, the fund was helped by favorable out-of-index U.S. selections. Picks in Australia, Japan and the U.K. also contributed. On the negative side, an underweighting in continental Europe weighed on relative results. Individually, our top relative contributor was ASML Holding, a Dutch semiconductor-equipment maker. Out-of-index Chinese e-commerce firm Alibaba Group and Italy's Interpump Group, an maker of specialty pumps whose shares more than doubled this period, both helped. In contrast, our biggest individual detraction came from not owning French luxury goods company and index component LVMH Moet Hennessy Louis Vuitton. Overweighting Belgian brewery Anheuser-Busch InBev also detracted, as the company struggled with weaker-than-expected earnings. U.K.-based consumer goods company Reckitt Benckiser Group also detracted.
The views expressed above reflect those of the portfolio manager(s) only through the end of the period as stated on the cover of this report and do not necessarily represent the views of Fidelity or any other person in the Fidelity organization. Any such views are subject to change at any time based upon market or other conditions and Fidelity disclaims any responsibility to update such views. These views may not be relied on as investment advice and, because investment decisions for a Fidelity fund are based on numerous factors, may not be relied on as an indication of trading intent on behalf of any Fidelity fund.
Note to shareholders: Following a roughly five-month leave of absence, Jed Weiss returned to Fidelity on November 29, 2017, and resumed his day-to-day responsibilities as Portfolio Manager. In his stead, Vincent Montemaggiore served as interim manager of the fund.
Investment Summary (Unaudited)
Geographic Diversification (% of fund's net assets)
| As of October 31, 2017 |
| | United States of America* | 19.7% |
| | Japan | 13.1% |
| | United Kingdom | 10.7% |
| | Switzerland | 8.0% |
| | Sweden | 5.7% |
| | Germany | 5.2% |
| | Belgium | 4.1% |
| | Spain | 4.1% |
| | Australia | 3.7% |
| | Other | 25.7% |

* Includes Short-Term investments and Net Other Assets (Liabilities).
Percentages are based on country or territory of incorporation and are adjusted for the effect of futures contracts, if applicable.
| As of April 30, 2017 |
| | United States of America* | 20.3% |
| | Japan | 11.7% |
| | United Kingdom | 11.5% |
| | Switzerland | 10.7% |
| | Sweden | 5.9% |
| | Germany | 4.8% |
| | Spain | 4.6% |
| | Belgium | 3.9% |
| | Australia | 3.6% |
| | Other | 23.0% |
* Includes Short-Term investments and Net Other Assets (Liabilities).
Percentages are based on country or territory of incorporation and are adjusted for the effect of futures contracts, if applicable.
Asset Allocation as of October 31, 2017
| | % of fund's net assets | % of fund's net assets 6 months ago |
| Stocks | 98.0 | 97.0 |
| Short-Term Investments and Net Other Assets (Liabilities) | 2.0 | 3.0 |
Top Ten Stocks as of October 31, 2017
| | % of fund's net assets | % of fund's net assets 6 months ago |
| Nestle SA (Reg. S) (Switzerland, Food Products) | 4.9 | 5.7 |
| Anheuser-Busch InBev SA NV (Belgium, Beverages) | 3.4 | 3.4 |
| SAP SE (Germany, Software) | 3.1 | 2.7 |
| CSL Ltd. (Australia, Biotechnology) | 3.0 | 2.9 |
| Keyence Corp. (Japan, Electronic Equipment & Components) | 2.8 | 2.1 |
| Visa, Inc. Class A (United States of America, IT Services) | 2.7 | 2.4 |
| ASML Holding NV (Netherlands) (Netherlands, Semiconductors & Semiconductor Equipment) | 2.5 | 2.0 |
| MasterCard, Inc. Class A (United States of America, IT Services) | 2.4 | 2.0 |
| AIA Group Ltd. (Hong Kong, Insurance) | 2.3 | 2.2 |
| Reckitt Benckiser Group PLC (United Kingdom, Household Products) | 2.2 | 2.3 |
| | 29.3 | |
Top Market Sectors as of October 31, 2017
| | % of fund's net assets | % of fund's net assets 6 months ago |
| Information Technology | 21.8 | 18.1 |
| Consumer Staples | 17.4 | 19.0 |
| Industrials | 15.0 | 14.0 |
| Health Care | 12.0 | 14.5 |
| Financials | 11.4 | 10.7 |
| Consumer Discretionary | 10.4 | 10.7 |
| Materials | 6.6 | 6.9 |
| Real Estate | 2.2 | 2.1 |
| Energy | 0.6 | 0.6 |
| Telecommunication Services | 0.6 | 0.4 |
Investments October 31, 2017
Showing Percentage of Net Assets
| Common Stocks - 97.6% | | | |
| | | Shares | Value |
| Australia - 3.7% | | | |
| CSL Ltd. | | 655,271 | $69,675,015 |
| Transurban Group unit | | 1,676,102 | 15,560,421 |
|
| TOTAL AUSTRALIA | | | 85,235,436 |
|
| Austria - 1.7% | | | |
| Andritz AG | | 483,121 | 27,316,540 |
| BUWOG-Gemeinnuetzige Wohnung | | 423,932 | 12,226,914 |
|
| TOTAL AUSTRIA | | | 39,543,454 |
|
| Belgium - 4.1% | | | |
| Anheuser-Busch InBev SA NV | | 643,591 | 78,917,931 |
| KBC Groep NV | | 201,125 | 16,706,539 |
|
| TOTAL BELGIUM | | | 95,624,470 |
|
| Brazil - 0.1% | | | |
| Itau Unibanco Holding SA | | 167,700 | 1,969,564 |
| Canada - 1.3% | | | |
| Alimentation Couche-Tard, Inc. Class B (sub. vtg.) | | 201,400 | 9,443,211 |
| Franco-Nevada Corp. | | 157,400 | 12,508,060 |
| Pason Systems, Inc. | | 280,500 | 4,072,370 |
| PrairieSky Royalty Ltd. | | 194,500 | 5,177,219 |
|
| TOTAL CANADA | | | 31,200,860 |
|
| Cayman Islands - 1.8% | | | |
| 58.com, Inc. ADR (a) | | 155,270 | 10,429,486 |
| Alibaba Group Holding Ltd. sponsored ADR (a) | | 171,200 | 31,653,168 |
| China Biologic Products Holdings, Inc. | | 10,919 | 848,515 |
|
| TOTAL CAYMAN ISLANDS | | | 42,931,169 |
|
| Denmark - 1.3% | | | |
| Jyske Bank A/S (Reg.) | | 220,000 | 12,432,200 |
| Novo Nordisk A/S Series B sponsored ADR | | 380,100 | 18,925,179 |
|
| TOTAL DENMARK | | | 31,357,379 |
|
| Finland - 0.3% | | | |
| Tikkurila Oyj | | 298,300 | 5,896,647 |
| France - 1.7% | | | |
| Edenred SA | | 339,600 | 9,790,681 |
| Elis SA | | 426,436 | 11,124,357 |
| Essilor International SA | | 149,655 | 18,949,196 |
|
| TOTAL FRANCE | | | 39,864,234 |
|
| Germany - 5.2% | | | |
| Bayer AG | | 376,200 | 48,935,712 |
| SAP SE | | 637,605 | 72,854,421 |
|
| TOTAL GERMANY | | | 121,790,133 |
|
| Hong Kong - 2.3% | | | |
| AIA Group Ltd. | | 7,006,800 | 52,721,199 |
| India - 1.0% | | | |
| Housing Development Finance Corp. Ltd. | | 908,566 | 23,958,079 |
| Ireland - 3.3% | | | |
| CRH PLC sponsored ADR | | 1,207,666 | 45,311,628 |
| James Hardie Industries PLC CDI | | 2,046,151 | 31,148,171 |
|
| TOTAL IRELAND | | | 76,459,799 |
|
| Isle of Man - 0.6% | | | |
| Playtech Ltd. | | 1,024,895 | 13,394,349 |
| Israel - 0.2% | | | |
| Azrieli Group | | 91,600 | 5,168,880 |
| Italy - 1.1% | | | |
| Azimut Holding SpA | | 234,600 | 4,634,724 |
| Interpump Group SpA | | 600,426 | 20,219,834 |
|
| TOTAL ITALY | | | 24,854,558 |
|
| Japan - 13.1% | | | |
| Astellas Pharma, Inc. | | 1,080,100 | 14,374,897 |
| DENSO Corp. | | 443,300 | 24,414,298 |
| East Japan Railway Co. | | 242,000 | 23,469,067 |
| Hoya Corp. | | 486,000 | 26,404,740 |
| Keyence Corp. | | 117,824 | 65,418,826 |
| Komatsu Ltd. | | 754,300 | 24,647,334 |
| Misumi Group, Inc. | | 934,700 | 25,608,492 |
| Mitsui Fudosan Co. Ltd. | | 654,800 | 15,283,679 |
| Nintendo Co. Ltd. | | 30,800 | 11,949,223 |
| Olympus Corp. | | 405,000 | 15,071,943 |
| OSG Corp. | | 546,500 | 11,828,887 |
| SHO-BOND Holdings Co. Ltd. | | 202,400 | 12,455,362 |
| USS Co. Ltd. | | 1,632,400 | 32,998,656 |
|
| TOTAL JAPAN | | | 303,925,404 |
|
| Kenya - 0.6% | | | |
| Safaricom Ltd. | | 53,165,000 | 13,067,060 |
| Korea (South) - 1.1% | | | |
| BGFretail Co. Ltd. (b) | | 210,338 | 14,880,498 |
| NAVER Corp. | | 12,551 | 10,035,502 |
|
| TOTAL KOREA (SOUTH) | | | 24,916,000 |
|
| Mexico - 0.4% | | | |
| Fomento Economico Mexicano S.A.B. de CV sponsored ADR | | 110,855 | 9,727,526 |
| Netherlands - 2.5% | | | |
| ASML Holding NV (Netherlands) | | 319,300 | 57,611,132 |
| New Zealand - 0.3% | | | |
| Auckland International Airport Ltd. | | 1,415,434 | 6,034,263 |
| South Africa - 2.4% | | | |
| Clicks Group Ltd. | | 1,089,883 | 12,212,548 |
| Naspers Ltd. Class N | | 182,500 | 44,467,333 |
|
| TOTAL SOUTH AFRICA | | | 56,679,881 |
|
| Spain - 4.1% | | | |
| Amadeus IT Holding SA Class A | | 582,200 | 39,503,733 |
| Hispania Activos Inmobiliarios SA | | 381,324 | 6,576,163 |
| Inditex SA (c) | | 824,288 | 30,816,716 |
| Merlin Properties Socimi SA | | 429,900 | 5,673,713 |
| Prosegur Compania de Seguridad SA (Reg.) | | 1,572,649 | 11,998,946 |
|
| TOTAL SPAIN | | | 94,569,271 |
|
| Sweden - 5.7% | | | |
| ASSA ABLOY AB (B Shares) | | 2,231,483 | 47,046,050 |
| Atlas Copco AB (A Shares) | | 829,200 | 36,370,637 |
| Essity AB Class B | | 425,800 | 12,730,793 |
| Fagerhult AB | | 1,081,632 | 13,727,688 |
| Svenska Cellulosa AB (SCA) (B Shares) | | 393,600 | 3,695,444 |
| Svenska Handelsbanken AB (A Shares) | | 1,253,220 | 17,963,771 |
|
| TOTAL SWEDEN | | | 131,534,383 |
|
| Switzerland - 8.0% | | | |
| Nestle SA (Reg. S) | | 1,352,697 | 113,813,938 |
| Roche Holding AG (participation certificate) | | 206,237 | 47,667,788 |
| Schindler Holding AG: | | | |
| (participation certificate) | | 91,239 | 20,677,731 |
| (Reg.) | | 18,350 | 4,052,027 |
|
| TOTAL SWITZERLAND | | | 186,211,484 |
|
| Taiwan - 1.1% | | | |
| Taiwan Semiconductor Manufacturing Co. Ltd. | | 3,210,000 | 25,969,126 |
| Turkey - 0.2% | | | |
| Tupras Turkiye Petrol Rafinerileri A/S | | 143,012 | 5,145,876 |
| United Kingdom - 10.7% | | | |
| BAE Systems PLC | | 2,435,000 | 19,181,320 |
| British American Tobacco PLC (United Kingdom) | | 767,100 | 49,562,202 |
| Elementis PLC | | 1,307,100 | 4,935,519 |
| Howden Joinery Group PLC | | 844,500 | 4,599,775 |
| Informa PLC | | 2,469,039 | 22,856,402 |
| InterContinental Hotel Group PLC ADR (c) | | 668,922 | 37,185,374 |
| Prudential PLC | | 1,698,906 | 41,700,287 |
| Reckitt Benckiser Group PLC | | 577,945 | 51,706,811 |
| Rightmove PLC | | 93,000 | 5,130,936 |
| Shaftesbury PLC | | 393,933 | 5,179,701 |
| Spectris PLC | | 208,000 | 7,072,133 |
|
| TOTAL UNITED KINGDOM | | | 249,110,460 |
|
| United States of America - 17.7% | | | |
| Alphabet, Inc. Class A (a) | | 38,636 | 39,912,533 |
| Autoliv, Inc. (c) | | 203,269 | 25,380,167 |
| Berkshire Hathaway, Inc. Class B (a) | | 158,084 | 29,552,223 |
| Martin Marietta Materials, Inc. | | 100,100 | 21,706,685 |
| MasterCard, Inc. Class A | | 369,000 | 54,896,130 |
| Mohawk Industries, Inc. (a) | | 91,800 | 24,029,568 |
| Molson Coors Brewing Co. Class B | | 128,400 | 10,383,708 |
| Moody's Corp. | | 103,200 | 14,696,712 |
| MSCI, Inc. | | 161,000 | 18,894,960 |
| Philip Morris International, Inc. | | 312,208 | 32,669,445 |
| PriceSmart, Inc. | | 91,600 | 7,676,080 |
| ResMed, Inc. | | 239,800 | 20,186,364 |
| S&P Global, Inc. | | 129,900 | 20,325,453 |
| Sherwin-Williams Co. | | 71,000 | 28,055,650 |
| Visa, Inc. Class A | | 578,260 | 63,597,035 |
|
| TOTAL UNITED STATES OF AMERICA | | | 411,962,713 |
|
| TOTAL COMMON STOCKS | | | |
| (Cost $1,751,995,818) | | | 2,268,434,789 |
|
| Nonconvertible Preferred Stocks - 0.4% | | | |
| Brazil - 0.4% | | | |
| Itau Unibanco Holding SA | | | |
| (Cost $9,347,831) | | 731,700 | 9,405,431 |
|
| Money Market Funds - 2.8% | | | |
| Fidelity Cash Central Fund, 1.10% (d) | | 39,775,219 | 39,783,174 |
| Fidelity Securities Lending Cash Central Fund 1.11% (d)(e) | | 24,257,197 | 24,259,622 |
| TOTAL MONEY MARKET FUNDS | | | |
| (Cost $64,042,796) | | | 64,042,796 |
| TOTAL INVESTMENT IN SECURITIES - 100.8% | | | |
| (Cost $1,825,386,445) | | | 2,341,883,016 |
| NET OTHER ASSETS (LIABILITIES) - (0.8)% | | | (18,508,909) |
| NET ASSETS - 100% | | | $2,323,374,107 |
Categorizations in the Schedule of Investments are based on country or territory of incorporation.
Legend
(a) Non-income producing
(b) Level 3 security
(c) Security or a portion of the security is on loan at period end.
(d) Affiliated fund that is generally available only to investment companies and other accounts managed by Fidelity Investments. The rate quoted is the annualized seven-day yield of the fund at period end. A complete unaudited listing of the fund's holdings as of its most recent quarter end is available upon request. In addition, each Fidelity Central Fund's financial statements, which are not covered by the Fund's Report of Independent Registered Public Accounting Firm, are available on the SEC's website or upon request.
(e) Investment made with cash collateral received from securities on loan.
Affiliated Central Funds
Information regarding fiscal year to date income earned by the Fund from investments in Fidelity Central Funds is as follows:
| Fund | Income earned |
| Fidelity Cash Central Fund | $470,145 |
| Fidelity Securities Lending Cash Central Fund | 310,638 |
| Total | $780,783 |
Investment Valuation
The following is a summary of the inputs used, as of October 31, 2017, involving the Fund's assets and liabilities carried at fair value. The inputs or methodology used for valuing securities may not be an indication of the risk associated with investing in those securities. For more information on valuation inputs, and their aggregation into the levels used below, please refer to the Investment Valuation section in the accompanying Notes to Financial Statements.
| | Valuation Inputs at Reporting Date: |
| Description | Total | Level 1 | Level 2 | Level 3 |
| Investments in Securities: | | | | |
| Equities: | | | | |
| Consumer Discretionary | $242,148,514 | $184,735,560 | $57,412,954 | $-- |
| Consumer Staples | 403,724,691 | 94,843,311 | 294,000,882 | 14,880,498 |
| Energy | 14,395,465 | 14,395,465 | -- | -- |
| Financials | 264,961,142 | 223,260,855 | 41,700,287 | -- |
| Health Care | 281,039,349 | 128,584,269 | 152,455,080 | -- |
| Industrials | 345,709,412 | 181,472,900 | 164,236,512 | -- |
| Information Technology | 509,427,733 | 275,625,005 | 233,802,728 | -- |
| Materials | 153,257,804 | 153,257,804 | -- | -- |
| Real Estate | 50,109,050 | 34,825,371 | 15,283,679 | -- |
| Telecommunication Services | 13,067,060 | 13,067,060 | -- | -- |
| Money Market Funds | 64,042,796 | 64,042,796 | -- | -- |
| Total Investments in Securities: | $2,341,883,016 | $1,368,110,396 | $958,892,122 | $14,880,498 |
The following is a summary of transfers between Level 1 and Level 2 for the period ended October 31, 2017. Transfers are assumed to have occurred at the beginning of the period, and are primarily attributable to the valuation techniques used for foreign equity securities, as discussed in the accompanying Notes to Financial Statements:
| Transfers | Total |
| Level 1 to Level 2 | $230,223,518 |
| Level 2 to Level 1 | $12,340,977 |
See accompanying notes which are an integral part of the financial statements.
Financial Statements
Statement of Assets and Liabilities
| | | October 31, 2017 |
| Assets | | |
Investment in securities, at value (including securities loaned of $23,182,483) — See accompanying schedule:
Unaffiliated issuers (cost $1,761,343,649) | $2,277,840,220 | |
| Fidelity Central Funds (cost $64,042,796) | 64,042,796 | |
| Total Investment in Securities (cost $1,825,386,445) | | $2,341,883,016 |
| Receivable for investments sold | | 56,805 |
| Receivable for fund shares sold | | 2,687,806 |
| Dividends receivable | | 7,179,203 |
| Distributions receivable from Fidelity Central Funds | | 74,434 |
| Prepaid expenses | | 4,833 |
| Other receivables | | 14,807 |
| Total assets | | 2,351,900,904 |
| Liabilities | | |
| Payable for fund shares redeemed | $2,332,810 | |
| Accrued management fee | 1,125,222 | |
| Distribution and service plan fees payable | 103,640 | |
| Other affiliated payables | 435,489 | |
| Other payables and accrued expenses | 276,686 | |
| Collateral on securities loaned | 24,252,950 | |
| Total liabilities | | 28,526,797 |
| Net Assets | | $2,323,374,107 |
| Net Assets consist of: | | |
| Paid in capital | | $1,885,257,908 |
| Undistributed net investment income | | 13,559,706 |
| Accumulated undistributed net realized gain (loss) on investments and foreign currency transactions | | (91,847,153) |
| Net unrealized appreciation (depreciation) on investments and assets and liabilities in foreign currencies | | 516,403,646 |
| Net Assets | | $2,323,374,107 |
| Calculation of Maximum Offering Price | | |
| Class A: | | |
| Net Asset Value and redemption price per share ($156,988,361 ÷ 11,764,958 shares) | | $13.34 |
| Maximum offering price per share (100/94.25 of $13.34) | | $14.15 |
| Class M: | | |
| Net Asset Value and redemption price per share ($33,596,929 ÷ 2,526,067 shares) | | $13.30 |
| Maximum offering price per share (100/96.50 of $13.30) | | $13.78 |
| Class C: | | |
| Net Asset Value and offering price per share ($68,908,490 ÷ 5,261,486 shares)(a) | | $13.10 |
| International Growth: | | |
| Net Asset Value, offering price and redemption price per share ($961,774,920 ÷ 71,508,398 shares) | | $13.45 |
| Class I: | | |
| Net Asset Value, offering price and redemption price per share ($728,227,135 ÷ 54,222,002 shares) | | $13.43 |
| Class Z: | | |
| Net Asset Value, offering price and redemption price per share ($373,878,272 ÷ 27,789,983 shares) | | $13.45 |
(a) Redemption price per share is equal to net asset value less any applicable contingent deferred sales charge.
See accompanying notes which are an integral part of the financial statements.
Statement of Operations
| | | Year ended October 31, 2017 |
| Investment Income | | |
| Dividends | | $39,440,989 |
| Income from Fidelity Central Funds | | 780,783 |
| Income before foreign taxes withheld | | 40,221,772 |
| Less foreign taxes withheld | | (3,582,639) |
| Total income | | 36,639,133 |
| Expenses | | |
| Management fee | | |
| Basic fee | $13,410,683 | |
| Performance adjustment | 639,599 | |
| Transfer agent fees | 3,844,948 | |
| Distribution and service plan fees | 1,178,125 | |
| Accounting and security lending fees | 860,326 | |
| Custodian fees and expenses | 221,061 | |
| Independent trustees' fees and expenses | 7,449 | |
| Registration fees | 174,535 | |
| Audit | 80,806 | |
| Legal | 4,691 | |
| Interest | 942 | |
| Miscellaneous | 15,419 | |
| Total expenses before reductions | 20,438,584 | |
| Expense reductions | (77,306) | 20,361,278 |
| Net investment income (loss) | | 16,277,855 |
| Realized and Unrealized Gain (Loss) | | |
| Net realized gain (loss) on: | | |
| Investment securities: | | |
| Unaffiliated issuers | (12,719,470) | |
| Fidelity Central Funds | 4,213 | |
| Foreign currency transactions | 163,886 | |
| Total net realized gain (loss) | | (12,551,371) |
| Change in net unrealized appreciation (depreciation) on: | | |
| Unaffiliated issuers (net of decrease in deferred foreign taxes of $53,568) | 409,309,148 | |
| Fidelity Central Funds | (18,423) | |
| Assets and liabilities in foreign currencies | 98,641 | |
| Total change in net unrealized appreciation (depreciation) | | 409,389,366 |
| Net gain (loss) | | 396,837,995 |
| Net increase (decrease) in net assets resulting from operations | | $413,115,850 |
See accompanying notes which are an integral part of the financial statements.
Statement of Changes in Net Assets
| | Year ended October 31, 2017 | Year ended October 31, 2016 |
| Increase (Decrease) in Net Assets | | |
| Operations | | |
| Net investment income (loss) | $16,277,855 | $20,404,064 |
| Net realized gain (loss) | (12,551,371) | (41,385,367) |
| Change in net unrealized appreciation (depreciation) | 409,389,366 | (23,170,403) |
| Net increase (decrease) in net assets resulting from operations | 413,115,850 | (44,151,706) |
| Distributions to shareholders from net investment income | (18,629,181) | (9,313,588) |
| Distributions to shareholders from net realized gain | – | (1,062,130) |
| Total distributions | (18,629,181) | (10,375,718) |
| Share transactions - net increase (decrease) | 210,891,938 | 298,573,554 |
| Redemption fees | 6,903 | 63,422 |
| Total increase (decrease) in net assets | 605,385,510 | 244,109,552 |
| Net Assets | | |
| Beginning of period | 1,717,988,597 | 1,473,879,045 |
| End of period | $2,323,374,107 | $1,717,988,597 |
| Other Information | | |
| Undistributed net investment income end of period | $13,559,706 | $17,435,692 |
See accompanying notes which are an integral part of the financial statements.
Financial Highlights
Fidelity International Growth Fund Class A
| Years ended October 31, | 2017 | 2016 | 2015 | 2014 | 2013 |
| Selected Per–Share Data | | | | | |
| Net asset value, beginning of period | $10.88 | $11.30 | $11.01 | $10.78 | $8.91 |
| Income from Investment Operations | | | | | |
| Net investment income (loss)A | .07 | .12B | .07 | .09 | .08 |
| Net realized and unrealized gain (loss) | 2.49 | (.48) | .28 | .18 | 1.88 |
| Total from investment operations | 2.56 | (.36) | .35 | .27 | 1.96 |
| Distributions from net investment income | (.10) | (.05) | (.06) | (.03) | (.08) |
| Distributions from net realized gain | – | (.01) | – | (.01) | (.01) |
| Total distributions | (.10) | (.06) | (.06) | (.04) | (.09) |
| Redemption fees added to paid in capitalA,C | – | – | – | – | – |
| Net asset value, end of period | $13.34 | $10.88 | $11.30 | $11.01 | $10.78 |
| Total ReturnD,E | 23.80% | (3.22)% | 3.20% | 2.54% | 22.18% |
| Ratios to Average Net AssetsF,G | | | | | |
| Expenses before reductions | 1.28% | 1.27% | 1.26% | 1.35% | 1.44% |
| Expenses net of fee waivers, if any | 1.28% | 1.27% | 1.26% | 1.35% | 1.43% |
| Expenses net of all reductions | 1.27% | 1.27% | 1.25% | 1.34% | 1.42% |
| Net investment income (loss) | .62% | 1.05%B | .66% | .84% | .80% |
| Supplemental Data | | | | | |
| Net assets, end of period (000 omitted) | $156,988 | $221,861 | $184,878 | $119,017 | $74,595 |
| Portfolio turnover rateH | 22% | 29% | 26% | 27% | 32% |
A Calculated based on average shares outstanding during the period.
B Net Investment income per share reflects a large, non-recurring dividend which amounted to $.04 per share. Excluding this non-recurring dividend, the ratio of net investment income (loss) to average net assets would have been .68%.
C Amount represents less than $.005 per share.
D Total returns would have been lower if certain expenses had not been reduced during the applicable periods shown.
E Total returns do not include the effect of the sales charges.
F Fees and expenses of any underlying Fidelity Central Funds are not included in the Fund's expense ratio. The Fund indirectly bears its proportionate share of the expenses of any underlying Fidelity Central Funds.
G Expense ratios reflect operating expenses of the class. Expenses before reductions do not reflect amounts reimbursed by the investment adviser or reductions from brokerage service arrangements or reductions from other expense offset arrangements and do not represent the amount paid by the class during periods when reimbursements or reductions occur. Expenses net of fee waivers reflect expenses after reimbursement by the investment adviser but prior to reductions from brokerage service arrangements or other expense offset arrangements. Expenses net of all reductions represent the net expenses paid by the class.
H Amount does not include the portfolio activity of any underlying Fidelity Central Funds.
See accompanying notes which are an integral part of the financial statements.
Fidelity International Growth Fund Class M
| Years ended October 31, | 2017 | 2016 | 2015 | 2014 | 2013 |
| Selected Per–Share Data | | | | | |
| Net asset value, beginning of period | $10.84 | $11.26 | $10.96 | $10.75 | $8.89 |
| Income from Investment Operations | | | | | |
| Net investment income (loss)A | .04 | .08B | .04 | .06 | .05 |
| Net realized and unrealized gain (loss) | 2.49 | (.48) | .27 | .18 | 1.88 |
| Total from investment operations | 2.53 | (.40) | .31 | .24 | 1.93 |
| Distributions from net investment income | (.07) | (.01) | (.01) | (.02) | (.07) |
| Distributions from net realized gain | – | (.01) | – | (.01) | (.01) |
| Total distributions | (.07) | (.02) | (.01) | (.03) | (.07)C |
| Redemption fees added to paid in capitalA,D | – | – | – | – | – |
| Net asset value, end of period | $13.30 | $10.84 | $11.26 | $10.96 | $10.75 |
| Total ReturnE,F | 23.51% | (3.58)% | 2.85% | 2.21% | 21.91% |
| Ratios to Average Net AssetsG,H | | | | | |
| Expenses before reductions | 1.59% | 1.61% | 1.58% | 1.65% | 1.69% |
| Expenses net of fee waivers, if any | 1.59% | 1.61% | 1.58% | 1.65% | 1.69% |
| Expenses net of all reductions | 1.58% | 1.61% | 1.58% | 1.65% | 1.68% |
| Net investment income (loss) | .31% | .71%B | .33% | .53% | .54% |
| Supplemental Data | | | | | |
| Net assets, end of period (000 omitted) | $33,597 | $27,966 | $28,833 | $26,369 | $23,118 |
| Portfolio turnover rateI | 22% | 29% | 26% | 27% | 32% |
A Calculated based on average shares outstanding during the period.
B Net Investment income per share reflects a large, non-recurring dividend which amounted to $.04 per share. Excluding this non-recurring dividend, the ratio of net investment income (loss) to average net assets would have been .34%.
C Total distributions of $0.07 per share is comprised of distributions from net investment income of $0.69 and distributions from net realized gain of $0.005 per share.
D Amount represents less than $.005 per share.
E Total returns would have been lower if certain expenses had not been reduced during the applicable periods shown.
F Total returns do not include the effect of the sales charges.
G Fees and expenses of any underlying Fidelity Central Funds are not included in the Fund's expense ratio. The Fund indirectly bears its proportionate share of the expenses of any underlying Fidelity Central Funds.
H Expense ratios reflect operating expenses of the class. Expenses before reductions do not reflect amounts reimbursed by the investment adviser or reductions from brokerage service arrangements or reductions from other expense offset arrangements and do not represent the amount paid by the class during periods when reimbursements or reductions occur. Expenses net of fee waivers reflect expenses after reimbursement by the investment adviser but prior to reductions from brokerage service arrangements or other expense offset arrangements. Expenses net of all reductions represent the net expenses paid by the class.
I Amount does not include the portfolio activity of any underlying Fidelity Central Funds.
See accompanying notes which are an integral part of the financial statements.
Fidelity International Growth Fund Class C
| Years ended October 31, | 2017 | 2016 | 2015 | 2014 | 2013 |
| Selected Per–Share Data | | | | | |
| Net asset value, beginning of period | $10.67 | $11.12 | $10.87 | $10.69 | $8.84 |
| Income from Investment Operations | | | | | |
| Net investment income (loss)A | (.02) | .03B | (.02) | .01 | .01 |
| Net realized and unrealized gain (loss) | 2.47 | (.47) | .27 | .18 | 1.87 |
| Total from investment operations | 2.45 | (.44) | .25 | .19 | 1.88 |
| Distributions from net investment income | (.02) | – | – | – | (.02) |
| Distributions from net realized gain | – | (.01) | – | (.01) | (.01) |
| Total distributions | (.02) | (.01) | – | (.01) | (.03) |
| Redemption fees added to paid in capitalA,C | – | – | – | – | – |
| Net asset value, end of period | $13.10 | $10.67 | $11.12 | $10.87 | $10.69 |
| Total ReturnD,E | 22.96% | (3.98)% | 2.30% | 1.77% | 21.29% |
| Ratios to Average Net AssetsF,G | | | | | |
| Expenses before reductions | 2.04% | 2.07% | 2.06% | 2.12% | 2.19% |
| Expenses net of fee waivers, if any | 2.04% | 2.07% | 2.06% | 2.12% | 2.18% |
| Expenses net of all reductions | 2.04% | 2.06% | 2.05% | 2.12% | 2.17% |
| Net investment income (loss) | (.15)% | .26%B | (.15)% | .06% | .05% |
| Supplemental Data | | | | | |
| Net assets, end of period (000 omitted) | $68,908 | $52,738 | $52,378 | $32,737 | $17,196 |
| Portfolio turnover rateH | 22% | 29% | 26% | 27% | 32% |
A Calculated based on average shares outstanding during the period.
B Net Investment income per share reflects a large, non-recurring dividend which amounted to $.04 per share. Excluding this non-recurring dividend, the ratio of net investment income (loss) to average net assets would have been (.12)%.
C Amount represents less than $.005 per share.
D Total returns would have been lower if certain expenses had not been reduced during the applicable periods shown.
E Total returns do not include the effect of the contingent deferred sales charge.
F Fees and expenses of any underlying Fidelity Central Funds are not included in the Fund's expense ratio. The Fund indirectly bears its proportionate share of the expenses of any underlying Fidelity Central Funds.
G Expense ratios reflect operating expenses of the class. Expenses before reductions do not reflect amounts reimbursed by the investment adviser or reductions from brokerage service arrangements or reductions from other expense offset arrangements and do not represent the amount paid by the class during periods when reimbursements or reductions occur. Expenses net of fee waivers reflect expenses after reimbursement by the investment adviser but prior to reductions from brokerage service arrangements or other expense offset arrangements. Expenses net of all reductions represent the net expenses paid by the class.
H Amount does not include the portfolio activity of any underlying Fidelity Central Funds.
See accompanying notes which are an integral part of the financial statements.
Fidelity International Growth Fund
| Years ended October 31, | 2017 | 2016 | 2015 | 2014 | 2013 |
| Selected Per–Share Data | | | | | |
| Net asset value, beginning of period | $10.97 | $11.38 | $11.10 | $10.84 | $8.95 |
| Income from Investment Operations | | | | | |
| Net investment income (loss)A | .10 | .15B | .11 | .13 | .11 |
| Net realized and unrealized gain (loss) | 2.51 | (.47) | .26 | .19 | 1.88 |
| Total from investment operations | 2.61 | (.32) | .37 | .32 | 1.99 |
| Distributions from net investment income | (.13) | (.08) | (.09) | (.05) | (.10) |
| Distributions from net realized gain | – | (.01) | – | (.01) | (.01) |
| Total distributions | (.13) | (.09) | (.09) | (.06) | (.10)C |
| Redemption fees added to paid in capitalA,D | – | – | – | – | – |
| Net asset value, end of period | $13.45 | $10.97 | $11.38 | $11.10 | $10.84 |
| Total ReturnE | 24.14% | (2.87)% | 3.36% | 2.96% | 22.48% |
| Ratios to Average Net AssetsF,G | | | | | |
| Expenses before reductions | 1.03% | .99% | .97% | 1.04% | 1.13% |
| Expenses net of fee waivers, if any | 1.03% | .99% | .97% | 1.04% | 1.13% |
| Expenses net of all reductions | 1.03% | .98% | .96% | 1.04% | 1.11% |
| Net investment income (loss) | .87% | 1.34%B | .94% | 1.14% | 1.11% |
| Supplemental Data | | | | | |
| Net assets, end of period (000 omitted) | $961,775 | $1,038,771 | $938,348 | $635,607 | $430,914 |
| Portfolio turnover rateH | 22% | 29% | 26% | 27% | 32% |
A Calculated based on average shares outstanding during the period.
B Net Investment income per share reflects a large, non-recurring dividend which amounted to $.04 per share. Excluding this non-recurring dividend, the ratio of net investment income (loss) to average net assets would have been .96%.
C Total distributions of $.10 per share is comprised of distributions from net investment income of $.097 and distributions from net realized gain of $.005 per share.
D Amount represents less than $.005 per share.
E Total returns would have been lower if certain expenses had not been reduced during the applicable periods shown.
F Fees and expenses of any underlying Fidelity Central Funds are not included in the Fund's expense ratio. The Fund indirectly bears its proportionate share of the expenses of any underlying Fidelity Central Funds.
G Expense ratios reflect operating expenses of the class. Expenses before reductions do not reflect amounts reimbursed by the investment adviser or reductions from brokerage service arrangements or reductions from other expense offset arrangements and do not represent the amount paid by the class during periods when reimbursements or reductions occur. Expenses net of fee waivers reflect expenses after reimbursement by the investment adviser but prior to reductions from brokerage service arrangements or other expense offset arrangements. Expenses net of all reductions represent the net expenses paid by the class.
H Amount does not include the portfolio activity of any underlying Fidelity Central Funds.
See accompanying notes which are an integral part of the financial statements.
Fidelity International Growth Fund Class I
| Years ended October 31, | 2017 | 2016 | 2015 | 2014 | 2013 |
| Selected Per–Share Data | | | | | |
| Net asset value, beginning of period | $10.95 | $11.36 | $11.08 | $10.84 | $8.94 |
| Income from Investment Operations | | | | | |
| Net investment income (loss)A | .11 | .15B | .11 | .13 | .11 |
| Net realized and unrealized gain (loss) | 2.51 | (.47) | .27 | .18 | 1.90 |
| Total from investment operations | 2.62 | (.32) | .38 | .31 | 2.01 |
| Distributions from net investment income | (.14) | (.08) | (.10) | (.06) | (.10) |
| Distributions from net realized gain | – | (.01) | – | (.01) | (.01) |
| Total distributions | (.14) | (.09) | (.10) | (.07) | (.11) |
| Redemption fees added to paid in capitalA,C | – | – | – | – | – |
| Net asset value, end of period | $13.43 | $10.95 | $11.36 | $11.08 | $10.84 |
| Total ReturnD | 24.23% | (2.87)% | 3.41% | 2.84% | 22.66% |
| Ratios to Average Net AssetsE,F | | | | | |
| Expenses before reductions | .98% | .98% | .98% | 1.04% | 1.11% |
| Expenses net of fee waivers, if any | .98% | .98% | .98% | 1.04% | 1.11% |
| Expenses net of all reductions | .97% | .98% | .97% | 1.04% | 1.09% |
| Net investment income (loss) | .92% | 1.34%B | .94% | 1.14% | 1.13% |
| Supplemental Data | | | | | |
| Net assets, end of period (000 omitted) | $728,227 | $359,676 | $267,745 | $121,554 | $38,771 |
| Portfolio turnover rateG | 22% | 29% | 26% | 27% | 32% |
A Calculated based on average shares outstanding during the period.
B Net Investment income per share reflects a large, non-recurring dividend which amounted to $.04 per share. Excluding this non-recurring dividend, the ratio of net investment income (loss) to average net assets would have been .97%.
C Amount represents less than $.005 per share.
D Total returns would have been lower if certain expenses had not been reduced during the applicable periods shown.
E Fees and expenses of any underlying Fidelity Central Funds are not included in the Fund's expense ratio. The Fund indirectly bears its proportionate share of the expenses of any underlying Fidelity Central Funds.
F Expense ratios reflect operating expenses of the class. Expenses before reductions do not reflect amounts reimbursed by the investment adviser or reductions from brokerage service arrangements or reductions from other expense offset arrangements and do not represent the amount paid by the class during periods when reimbursements or reductions occur. Expenses net of fee waivers reflect expenses after reimbursement by the investment adviser but prior to reductions from brokerage service arrangements or other expense offset arrangements. Expenses net of all reductions represent the net expenses paid by the class.
G Amount does not include the portfolio activity of any underlying Fidelity Central Funds.
See accompanying notes which are an integral part of the financial statements.
Fidelity International Growth Fund Class Z
| Years ended October 31, | 2017 | 2016 | 2015 | 2014 | 2013 A |
| Selected Per–Share Data | | | | | |
| Net asset value, beginning of period | $10.97 | $11.38 | $11.10 | $10.84 | $10.26 |
| Income from Investment Operations | | | | | |
| Net investment income (loss)B | .13 | .16C | .12 | .14 | .02 |
| Net realized and unrealized gain (loss) | 2.50 | (.47) | .27 | .19 | .56 |
| Total from investment operations | 2.63 | (.31) | .39 | .33 | .58 |
| Distributions from net investment income | (.15) | (.09) | (.11) | (.06) | – |
| Distributions from net realized gain | – | (.01) | – | (.01) | – |
| Total distributions | (.15) | (.10) | (.11) | (.07) | – |
| Redemption fees added to paid in capitalB,D | – | – | – | – | – |
| Net asset value, end of period | $13.45 | $10.97 | $11.38 | $11.10 | $10.84 |
| Total ReturnE,F | 24.33% | (2.73)% | 3.52% | 3.07% | 5.65% |
| Ratios to Average Net AssetsG,H | | | | | |
| Expenses before reductions | .84% | .85% | .84% | .88% | .94%I |
| Expenses net of fee waivers, if any | .84% | .85% | .84% | .88% | .94%I |
| Expenses net of all reductions | .84% | .84% | .83% | .88% | .93%I |
| Net investment income (loss) | 1.05% | 1.48%C | 1.07% | 1.30% | .65%I |
| Supplemental Data | | | | | |
| Net assets, end of period (000 omitted) | $373,878 | $16,977 | $897 | $104 | $106 |
| Portfolio turnover rateJ | 22% | 29% | 26% | 27% | 32% |
A For the period August 13, 2013 (commencement of sale of shares) to October 31, 2013.
B Calculated based on average shares outstanding during the period.
C Net Investment income per share reflects a large, non-recurring dividend which amounted to $.04 per share. Excluding this non-recurring dividend, the ratio of net investment income (loss) to average net assets would have been 1.10%.
D Amount represents less than $.005 per share.
E Total returns for periods of less than one year are not annualized.
F Total returns would have been lower if certain expenses had not been reduced during the applicable periods shown.
G Fees and expenses of any underlying Fidelity Central Funds are not included in the Fund's expense ratio. The Fund indirectly bears its proportionate share of the expenses of any underlying Fidelity Central Funds.
H Expense ratios reflect operating expenses of the class. Expenses before reductions do not reflect amounts reimbursed by the investment adviser or reductions from brokerage service arrangements or reductions from other expense offset arrangements and do not represent the amount paid by the class during periods when reimbursements or reductions occur. Expense ratios before reductions for start-up periods may not be representative of longer-term operating periods. Expenses net of fee waivers reflect expenses after reimbursement by the investment adviser but prior to reductions from brokerage service arrangements or other expense offset arrangements. Expenses net of all reductions represent the net expenses paid by the class.
I Annualized
J Amount does not include the portfolio activity of any underlying Fidelity Central Funds.
See accompanying notes which are an integral part of the financial statements.
Notes to Financial Statements
For the period ended October 31, 2017
1. Organization.
Fidelity International Growth Fund (the Fund) is a fund of Fidelity Investment Trust (the Trust) and is authorized to issue an unlimited number of shares. The Trust is registered under the Investment Company Act of 1940, as amended (the 1940 Act), as an open-end management investment company organized as a Massachusetts business trust. The Fund offers Class A, Class M (formerly Class T), Class C, International Growth, Class I and Class Z shares, each of which has equal rights as to assets and voting privileges. Each class has exclusive voting rights with respect to matters that affect that class.
After the close of business on June 24, 2016, all outstanding Class B shares were converted to Class A shares. All prior fiscal period dollar and share amounts for Class B presented in the Notes to Financial Statements are for the period November 1, 2015 through June 24, 2016.
2. Investments in Fidelity Central Funds.
The Fund invests in Fidelity Central Funds, which are open-end investment companies generally available only to other investment companies and accounts managed by the investment adviser and its affiliates. The Fund's Schedule of Investments lists each of the Fidelity Central Funds held as of period end, if any, as an investment of the Fund, but does not include the underlying holdings of each Fidelity Central Fund. As an Investing Fund, the Fund indirectly bears its proportionate share of the expenses of the underlying Fidelity Central Funds.
The Money Market Central Funds seek preservation of capital and current income and are managed by Fidelity Investments Money Management, Inc. (FIMM), an affiliate of the investment adviser. Annualized expenses of the Money Market Central Funds as of their most recent shareholder report date are less than .005%.
A complete unaudited list of holdings for each Fidelity Central Fund is available upon request or at the Securities and Exchange Commission (the SEC) website at www.sec.gov. In addition, the financial statements of the Fidelity Central Funds, which are not covered by the Fund's Report of Independent Registered Public Accounting Firm, are available on the SEC website or upon request.
3. Significant Accounting Policies.
The Fund is an investment company and applies the accounting and reporting guidance of the Financial Accounting Standards Board (FASB) Accounting Standards Codification Topic 946 Financial Services – Investments Companies. The financial statements have been prepared in conformity with accounting principles generally accepted in the United States of America (GAAP), which require management to make certain estimates and assumptions at the date of the financial statements. Actual results could differ from those estimates. Subsequent events, if any, through the date that the financial statements were issued have been evaluated in the preparation of the financial statements. The following summarizes the significant accounting policies of the Fund:
Investment Valuation. Investments are valued as of 4:00 p.m. Eastern time on the last calendar day of the period. The Board of Trustees (the Board) has delegated the day to day responsibility for the valuation of the Fund's investments to the Fair Value Committee (the Committee) established by the Fund's investment adviser. In accordance with valuation policies and procedures approved by the Board, the Fund attempts to obtain prices from one or more third party pricing vendors or brokers to value its investments. When current market prices, quotations or currency exchange rates are not readily available or reliable, investments will be fair valued in good faith by the Committee, in accordance with procedures adopted by the Board. Factors used in determining fair value vary by investment type and may include market or investment specific events. The frequency with which these procedures are used cannot be predicted and they may be utilized to a significant extent. The Committee oversees the Fund's valuation policies and procedures and reports to the Board on the Committee's activities and fair value determinations. The Board monitors the appropriateness of the procedures used in valuing the Fund's investments and ratifies the fair value determinations of the Committee.
The Fund categorizes the inputs to valuation techniques used to value its investments into a disclosure hierarchy consisting of three levels as shown below:
- Level 1 – quoted prices in active markets for identical investments
- Level 2 – other significant observable inputs (including quoted prices for similar investments, interest rates, prepayment speeds, etc.)
- Level 3 – unobservable inputs (including the Fund's own assumptions based on the best information available)
Valuation techniques used to value the Fund's investments by major category are as follows:
Equity securities, including restricted securities, for which market quotations are readily available, are valued at the last reported sale price or official closing price as reported by a third party pricing vendor on the primary market or exchange on which they are traded and are categorized as Level 1 in the hierarchy. In the event there were no sales during the day or closing prices are not available, securities are valued at the last quoted bid price or may be valued using the last available price and are generally categorized as Level 2 in the hierarchy. For foreign equity securities, when market or security specific events arise, comparisons to the valuation of American Depositary Receipts (ADRs), futures contracts, Exchange-Traded Funds (ETFs) and certain indexes as well as quoted prices for similar securities may be used and would be categorized as Level 2 in the hierarchy. Utilizing these techniques may result in transfers between Level 1 and Level 2. For equity securities, including restricted securities, where observable inputs are limited, assumptions about market activity and risk are used and these securities may be categorized as Level 3 in the hierarchy.
Investments in open-end mutual funds, including the Fidelity Central Funds, are valued at their closing net asset value (NAV) each business day and are categorized as Level 1 in the hierarchy.
Changes in valuation techniques may result in transfers in or out of an assigned level within the disclosure hierarchy. The aggregate value of investments by input level as of October 31, 2017, including information on transfers between Levels 1 and 2 is included at the end of the Fund's Schedule of Investments.
Foreign Currency. The Fund may use foreign currency contracts to facilitate transactions in foreign-denominated securities. Gains and losses from these transactions may arise from changes in the value of the foreign currency or if the counterparties do not perform under the contracts' terms.
Foreign-denominated assets, including investment securities, and liabilities are translated into U.S. dollars at the exchange rates at period end. Purchases and sales of investment securities, income and dividends received and expenses denominated in foreign currencies are translated into U.S. dollars at the exchange rate in effect on the transaction date.
The effects of exchange rate fluctuations on investments are included with the net realized and unrealized gain (loss) on investment securities. Other foreign currency transactions resulting in realized and unrealized gain (loss) are disclosed separately.
Investment Transactions and Income. For financial reporting purposes, the Fund's investment holdings and NAV include trades executed through the end of the last business day of the period. The NAV per share for processing shareholder transactions is calculated as of the close of business of the New York Stock Exchange (NYSE), normally 4:00 p.m. Eastern time and includes trades executed through the end of the prior business day. Gains and losses on securities sold are determined on the basis of identified cost and includes proceeds received from litigation. Dividend income is recorded on the ex-dividend date, except for certain dividends from foreign securities where the ex-dividend date may have passed, which are recorded as soon as the Fund is informed of the ex-dividend date. Non-cash dividends included in dividend income, if any, are recorded at the fair market value of the securities received. Income and capital gain distributions from Fidelity Central Funds, if any, are recorded on the ex-dividend date. Certain distributions received by the Fund represent a return of capital or capital gain. The Fund determines the components of these distributions subsequent to the ex-dividend date, based upon receipt of tax filings or other correspondence relating to the underlying investment. These distributions are recorded as a reduction of cost of investments and/or as a realized gain. Investment income is recorded net of foreign taxes withheld where recovery of such taxes is uncertain.
Class Allocations and Expenses. Investment income, realized and unrealized capital gains and losses, common expenses of the Fund, and certain fund-level expense reductions, if any, are allocated daily on a pro-rata basis to each class based on the relative net assets of each class to the total net assets of the Fund. Each class differs with respect to transfer agent and distribution and service plan fees incurred. Certain expense reductions may also differ by class. For the reporting period, the allocated portion of income and expenses to each class as a percent of its average net assets may vary due to the timing of recording these transactions in relation to fluctuating net assets of the classes. Expenses directly attributable to a fund are charged to that fund. Expenses attributable to more than one fund are allocated among the respective funds on the basis of relative net assets or other appropriate methods. Expense estimates are accrued in the period to which they relate and adjustments are made when actual amounts are known.
Income Tax Information and Distributions to Shareholders. Each year, the Fund intends to qualify as a regulated investment company under Subchapter M of the Internal Revenue Code, including distributing substantially all of its taxable income and realized gains. As a result, no provision for U.S. Federal income taxes is required. As of October 31, 2017, the Fund did not have any unrecognized tax benefits in the financial statements; nor is the Fund aware of any tax positions for which it is reasonably possible that the total amounts of unrecognized tax benefits will significantly change in the next twelve months. The Fund files a U.S. federal tax return, in addition to state and local tax returns as required. The Fund's federal income tax returns are subject to examination by the Internal Revenue Service (IRS) for a period of three fiscal years after they are filed. State and local tax returns may be subject to examination for an additional fiscal year depending on the jurisdiction. Foreign taxes are provided for based on the Fund's understanding of the tax rules and rates that exist in the foreign markets in which it invests. The Fund is subject to a tax imposed on capital gains by certain countries in which it invests. An estimated deferred tax liability for net unrealized appreciation on the applicable securities is included in Other payables and accrued expenses on the Statement of Assets & Liabilities.
Distributions are declared and recorded on the ex-dividend date. Income dividends and capital gain distributions are declared separately for each class. Income and capital gain distributions are determined in accordance with income tax regulations, which may differ from GAAP. In addition, the Fund claimed a portion of the payment made to redeeming shareholders as a distribution for income tax purposes.
Capital accounts within the financial statements are adjusted for permanent book-tax differences. These adjustments have no impact on net assets or the results of operations. Capital accounts are not adjusted for temporary book-tax differences which will reverse in a subsequent period.
Book-tax differences are primarily due to foreign currency transactions, certain foreign taxes, passive foreign investment companies (PFIC), capital loss carryforwards and losses deferred due to wash sales.
As of period end, the cost and unrealized appreciation (depreciation) in securities, and derivatives if applicable, for federal income tax purposes were as follows:
| Gross unrealized appreciation | $533,960,602 |
| Gross unrealized depreciation | (25,054,953) |
| Net unrealized appreciation (depreciation) | $508,905,649 |
| Tax Cost | $1,832,977,367 |
The tax-based components of distributable earnings as of period end were as follows:
| Undistributed ordinary income | $15,853,902 |
| Capital loss carryforward | $(86,550,430) |
| Net unrealized appreciation (depreciation) on securities and other investments | $508,856,315 |
Capital loss carryforwards are only available to offset future capital gains of the Fund to the extent provided by regulations and may be limited. Under the Regulated Investment Company Modernization Act of 2010 (the Act), the Fund is permitted to carry forward capital losses incurred in taxable years beginning after December 22, 2010 for an unlimited period and such capital losses are required to be used prior to any losses that expire. The capital loss carryforward information presented below, including any applicable limitation, is estimated as of fiscal period end and is subject to adjustment.
| No expiration | |
| Short-term | $(60,492,711) |
| Long-term | (26,057,719) |
| Total no expiration | $(86,550,430) |
The tax character of distributions paid was as follows:
| | October 31, 2017 | October 31, 2016 |
| Ordinary Income | $18,629,181 | $ 10,375,718 |
Short-Term Trading (Redemption) Fees. Shares held by investors in the Fund less than 30 days may have been subject to a redemption fee equal to 1.00% of the NAV of shares redeemed. All redemption fees, which reduce the proceeds of the shareholder redemption, are retained by the Fund and accounted for as an addition to paid in capital. In November 2016, the Board of Trustees approved the elimination of these redemption fees effective December 12, 2016.
4. Purchases and Sales of Investments.
Purchases and sales of securities, other than short-term securities, aggregated $647,344,576 and $405,685,095, respectively.
5. Fees and Other Transactions with Affiliates.
Management Fee. Fidelity Management & Research Company (the investment adviser) and its affiliates provide the Fund with investment management related services for which the Fund pays a monthly management fee. The management fee is the sum of an individual fund fee rate that is based on an annual rate of .45% of the Fund's average net assets and an annualized group fee rate that averaged .25% during the period. The group fee rate is based upon the average net assets of all the mutual funds advised by the investment adviser, including any mutual funds previously advised by the investment adviser that are currently advised by Fidelity SelectCo, LLC, an affiliate of the investment adviser. The group fee rate decreases as assets under management increase and increases as assets under management decrease. In addition, the management fee is subject to a performance adjustment (up to a maximum of +/- .20% of the Fund's average net assets over a 36 month performance period). The upward or downward adjustment to the management fee is based on the relative investment performance of International Growth as compared to its benchmark index, the MSCI EAFE Growth Index, over the same 36 month performance period. For the reporting period, the total annual management fee rate, including the performance adjustment, was .74% of the Fund's average net assets. The performance adjustment included in the management fee rate may be higher or lower than the maximum performance adjustment rate due to the difference between the average net assets for the reporting and performance periods.
Distribution and Service Plan Fees. In accordance with Rule 12b-1 of the 1940 Act, the Fund has adopted separate Distribution and Service Plans for each class of shares. Certain classes pay Fidelity Distributors Corporation (FDC), an affiliate of the investment adviser, separate Distribution and Service Fees, each of which is based on an annual percentage of each class' average net assets. In addition, FDC may pay financial intermediaries for selling shares of the Fund and providing shareholder support services. For the period, the Distribution and Service Fee rates, total fees and amounts retained by FDC were as follows:
| | Distribution
Fee | Service
Fee | Total Fees | Retained
by FDC |
| Class A | -% | .25% | $429,475 | $– |
| Class M | .25% | .25% | 155,134 | 297 |
| Class C | .75% | .25% | 593,516 | 108,001 |
| | | | $1,178,125 | $108,298 |
Sales Load. FDC may receive a front-end sales charge of up to 5.75% for selling Class A shares and 3.50% for selling Class M shares, some of which is paid to financial intermediaries for selling shares of the Fund. Depending on the holding period, FDC may receive contingent deferred sales charges levied on Class A, Class M and Class C redemptions. The deferred sales charges are 1.00% for Class C shares, 1.00% for certain purchases of Class A shares and .25% for certain purchases of Class M shares.
For the period, sales charge amounts retained by FDC were as follows:
| | Retained
by FDC |
| Class A | $61,423 |
| Class M | 4,669 |
| Class C(a) | 3,805 |
| | $69,897 |
(a) When Class C shares are initially sold, FDC pays commissions from its own resources to financial intermediaries through which the sales are made.
Transfer Agent Fees. Fidelity Investments Institutional Operations Company, Inc., (FIIOC), an affiliate of the investment adviser, is the transfer, dividend disbursing and shareholder servicing agent for each class of the Fund. FIIOC receives account fees and asset-based fees that vary according to the account size and type of account of the shareholders of the respective classes of the Fund, except for Class Z. FIIOC receives an asset-based fee of Class Z's average net assets. FIIOC pays for typesetting, printing and mailing of shareholder reports, except proxy statements.
For the period, transfer agent fees for each class were as follows:
| | Amount | % of
Class-Level Average
Net Assets |
| Class A | $394,534 | .23 |
| Class M | 90,194 | .29 |
| Class C | 147,763 | .25 |
| International Growth | 2,156,207 | .24 |
| Class I | 952,849 | .18 |
| Class Z | 103,401 | .05 |
| | $3,844,948 | |
Accounting and Security Lending Fees. Fidelity Service Company, Inc. (FSC), an affiliate of the investment adviser, maintains the Fund's accounting records. The accounting fee is based on the level of average net assets for each month. Under a separate contract, FSC administers the security lending program. The security lending fee is based on the number and duration of lending transactions.
Brokerage Commissions. The Fund placed a portion of its portfolio transactions with brokerage firms which are affiliates of the investment adviser. Brokerage commissions are included in net realized gain (loss) and change in net unrealized appreciation (depreciation) in the Statement of Operations. The commissions paid to these affiliated firms were $1,404 for the period.
Interfund Lending Program. Pursuant to an Exemptive Order issued by the SEC, the Fund, along with other registered investment companies having management contracts with Fidelity Management & Research Company (FMR) or other affiliated entities of FMR, may participate in an interfund lending program. This program provides an alternative credit facility allowing the funds to borrow from, or lend money to, other participating affiliated funds. At period end, there were no interfund loans outstanding. The Fund's activity in this program during the period for which loans were outstanding was as follows:
| Borrower or Lender | Average Loan Balance | Weighted Average Interest Rate | Interest Expense |
| Borrower | $10,417,333 | 1.09% | $942 |
Interfund Trades. The Fund may purchase from or sell securities to other Fidelity Funds under procedures adopted by the Board. The procedures have been designed to ensure these interfund trades are executed in accordance with Rule 17a-7 of the 1940 Act. Interfund trades are included within the respective purchases and sales amounts shown in the Purchases and Sales of Investments note.
6. Committed Line of Credit.
The Fund participates with other funds managed by the investment adviser or an affiliate in a $4.25 billion credit facility (the "line of credit") to be utilized for temporary or emergency purposes to fund shareholder redemptions or for other short-term liquidity purposes. The Fund has agreed to pay commitment fees on its pro-rata portion of the line of credit, which amounted to $5,966 and is reflected in Miscellaneous expenses on the Statement of Operations. During the period, the Fund did not borrow on this line of credit.
7. Security Lending.
The Fund lends portfolio securities through a lending agent from time to time in order to earn additional income. For equity securities, a lending agent is used and may loan securities to certain qualified borrowers, including Fidelity Capital Markets (FCM), a broker-dealer affiliated with the Fund. On the settlement date of the loan, the Fund receives collateral (in the form of U.S. Treasury obligations, letters of credit and/or cash) against the loaned securities and maintains collateral in an amount not less than 100% of the market value of the loaned securities during the period of the loan. The market value of the loaned securities is determined at the close of business of the Fund and any additional required collateral is delivered to the Fund on the next business day. The Fund or borrower may terminate the loan at any time, and if the borrower defaults on its obligation to return the securities loaned because of insolvency or other reasons, the Fund may apply collateral received from the borrower against the obligation. The Fund may experience delays and costs in recovering the securities loaned. Any cash collateral received is invested in the Fidelity Securities Lending Cash Central Fund. The value of loaned securities and cash collateral at period end are disclosed on the Fund's Statement of Assets and Liabilities. At period end, there were no security loans outstanding with FCM. Security lending income represents the income earned on investing cash collateral, less rebates paid to borrowers and any lending agent fees associated with the loan, plus any premium payments received for lending certain types of securities. Security lending income is presented in the Statement of Operations as a component of income from Fidelity Central Funds. Total security lending income during the period amounted to $310,638, including $1,580 from securities loaned to FCM.
8. Expense Reductions.
Commissions paid to certain brokers with whom the investment adviser, or its affiliates, places trades on behalf of the Fund include an amount in addition to trade execution, which may be rebated back to the Fund to offset certain expenses. This amount totaled $62,744 for the period. Through arrangements with the Fund's custodian credits realized as a result of certain uninvested cash balances were used to reduce the Fund's expenses. During the period, these credits reduced the Fund's custody expenses by $103.
In addition, during the period the investment adviser reimbursed and/or waived a portion of fund-level operating expenses in the amount of $14,459.
9. Distributions to Shareholders.
Distributions to shareholders of each class were as follows:
| | Year ended October 31, 2017 | Year ended October 31, 2016 |
| From net investment income | | |
| Class A | $1,997,030 | $857,372 |
| Class M | 186,824 | 25,900 |
| Class C | 77,926 | – |
| International Growth | 11,653,320 | 6,508,406 |
| Class I | 4,492,180 | 1,913,593 |
| Class Z | 221,901 | 8,317 |
| Total | $18,629,181 | $9,313,588 |
| From net realized gain | | |
| Class A | $– | $137,180 |
| Class M | – | 20,720 |
| Class B | – | 561 |
| Class C | – | 39,156 |
| International Growth | – | 667,539 |
| Class I | – | 196,266 |
| Class Z | – | 708 |
| Total | $– | $1,062,130 |
10. Share Transactions.
Share transactions for each class were as follows and may contain automatic conversions between classes or exchanges between affiliated funds:
| | Shares | Shares | Dollars | Dollars |
| | Year ended October 31, 2017 | Year ended October 31, 2016 | Year ended October 31, 2017 | Year ended October 31, 2016 |
| Class A | | | | |
| Shares sold | 4,137,031 | 9,759,153 | $48,223,768 | $106,168,466 |
| Reinvestment of distributions | 187,295 | 86,347 | 1,972,221 | 970,544 |
| Shares redeemed | (12,953,360) | (5,818,948) | (147,524,032) | (63,754,387) |
| Net increase (decrease) | (8,629,034) | 4,026,552 | $(97,328,043) | $43,384,623 |
| Class M | | | | |
| Shares sold | 634,763 | 648,968 | $7,389,758 | $7,086,728 |
| Reinvestment of distributions | 17,518 | 4,067 | 184,470 | 45,714 |
| Shares redeemed | (705,137) | (635,077) | (8,346,528) | (6,841,439) |
| Net increase (decrease) | (52,856) | 17,958 | $(772,300) | $291,003 |
| Class B | | | | |
| Shares sold | – | 1,881 | $– | $19,626 |
| Reinvestment of distributions | – | 50 | – | 556 |
| Shares redeemed | – | (73,599) | – | (781,848) |
| Net increase (decrease) | – | (71,668) | $– | $(761,666) |
| Class C | | | | |
| Shares sold | 1,572,029 | 1,353,782 | $18,704,209 | $14,583,875 |
| Reinvestment of distributions | 7,327 | 3,485 | 76,279 | 38,678 |
| Shares redeemed | (1,259,133) | (1,125,675) | (14,766,822) | (12,076,750) |
| Net increase (decrease) | 320,223 | 231,592 | $4,013,666 | $2,545,803 |
| International Growth | | | | |
| Shares sold | 28,743,527 | 31,953,739 | $341,195,764 | $351,819,134 |
| Reinvestment of distributions | 929,056 | 515,203 | 9,838,706 | 5,821,794 |
| Shares redeemed | (52,869,764) | (20,188,262) | (601,819,958) | (220,612,157) |
| Net increase (decrease) | (23,197,181) | 12,280,680 | $(250,785,488) | $137,028,771 |
| Class I | | | | |
| Shares sold | 38,959,806 | 22,905,807 | $465,525,076 | $249,584,348 |
| Reinvestment of distributions | 415,087 | 177,277 | 4,387,467 | 1,999,688 |
| Shares redeemed | (17,997,694) | (13,798,950) | (214,014,368) | (151,305,009) |
| Net increase (decrease) | 21,377,199 | 9,284,134 | $255,898,175 | $100,279,027 |
| Class Z | | | | |
| Shares sold | 35,134,319 | 1,706,835 | $405,268,628 | $18,446,844 |
| Reinvestment of distributions | 20,974 | 799 | 221,901 | 9,025 |
| Shares redeemed | (8,913,102) | (238,655) | (105,624,601) | (2,649,876) |
| Net increase (decrease) | 26,242,191 | 1,468,979 | $299,865,928 | $15,805,993 |
11. Other.
The Fund's organizational documents provide former and current trustees and officers with a limited indemnification against liabilities arising in connection with the performance of their duties to the Fund. In the normal course of business, the Fund may also enter into contracts that provide general indemnifications. The Fund's maximum exposure under these arrangements is unknown as this would be dependent on future claims that may be made against the Fund. The risk of material loss from such claims is considered remote.
Report of Independent Registered Public Accounting Firm
To the Trustees of Fidelity Investment Trust and Shareholders of Fidelity International Growth Fund:
In our opinion, the accompanying statement of assets and liabilities, including the schedule of investments, and the related statements of operations and of changes in net assets and the financial highlights present fairly, in all material respects, the financial position of Fidelity International Growth Fund (a fund of Fidelity Investment Trust) as of October 31, 2017, the results of its operations for the year then ended, the changes in its net assets for each of the two years in the period then ended and the financial highlights for each of the periods indicated, in conformity with accounting principles generally accepted in the United States of America. These financial statements and financial highlights (hereafter referred to as “financial statements”) are the responsibility of the Fidelity International Growth Fund’s management. Our responsibility is to express an opinion on these financial statements based on our audits. We conducted our audits of these financial statements in accordance with the standards of the Public Company Accounting Oversight Board (United States). Those standards require that we plan and perform the audit to obtain reasonable assurance about whether the financial statements are free of material misstatement. An audit includes examining, on a test basis, evidence supporting the amounts and disclosures in the financial statements, assessing the accounting principles used and significant estimates made by management, and evaluating the overall financial statement presentation. Our procedures included confirmation of securities owned as of October 31, 2017 by correspondence with the custodian and brokers; when replies were not received from brokers, we performed other auditing procedures. We believe that our audits provide a reasonable basis for our opinion.
PricewaterhouseCoopers LLP
Boston, Massachusetts
December 13, 2017
Trustees and Officers
The Trustees, Members of the Advisory Board (if any), and officers of the trust and fund, as applicable, are listed below. The Board of Trustees governs the fund and is responsible for protecting the interests of shareholders. The Trustees are experienced executives who meet periodically throughout the year to oversee the fund's activities, review contractual arrangements with companies that provide services to the fund, oversee management of the risks associated with such activities and contractual arrangements, and review the fund's performance. Except for Jonathan Chiel, each of the Trustees oversees 190 funds. Mr. Chiel oversees 143 funds.
The Trustees hold office without limit in time except that (a) any Trustee may resign; (b) any Trustee may be removed by written instrument, signed by at least two-thirds of the number of Trustees prior to such removal; (c) any Trustee who requests to be retired or who has become incapacitated by illness or injury may be retired by written instrument signed by a majority of the other Trustees; and (d) any Trustee may be removed at any special meeting of shareholders by a two-thirds vote of the outstanding voting securities of the trust. Each Trustee who is not an interested person (as defined in the 1940 Act) of the trust and the fund is referred to herein as an Independent Trustee. Each Independent Trustee shall retire not later than the last day of the calendar year in which his or her 75th birthday occurs. The Independent Trustees may waive this mandatory retirement age policy with respect to individual Trustees. Officers and Advisory Board Members hold office without limit in time, except that any officer or Advisory Board Member may resign or may be removed by a vote of a majority of the Trustees at any regular meeting or any special meeting of the Trustees. Except as indicated, each individual has held the office shown or other offices in the same company for the past five years.
The fund’s Statement of Additional Information (SAI) includes more information about the Trustees. To request a free copy, call Fidelity at 1-800-544-8544.
Experience, Skills, Attributes, and Qualifications of the Trustees. The Governance and Nominating Committee has adopted a statement of policy that describes the experience, qualifications, attributes, and skills that are necessary and desirable for potential Independent Trustee candidates (Statement of Policy). The Board believes that each Trustee satisfied at the time he or she was initially elected or appointed a Trustee, and continues to satisfy, the standards contemplated by the Statement of Policy. The Governance and Nominating Committee also engages professional search firms to help identify potential Independent Trustee candidates who have the experience, qualifications, attributes, and skills consistent with the Statement of Policy. From time to time, additional criteria based on the composition and skills of the current Independent Trustees, as well as experience or skills that may be appropriate in light of future changes to board composition, business conditions, and regulatory or other developments, have also been considered by the professional search firms and the Governance and Nominating Committee. In addition, the Board takes into account the Trustees' commitment and participation in Board and committee meetings, as well as their leadership of standing and ad hoc committees throughout their tenure.
In determining that a particular Trustee was and continues to be qualified to serve as a Trustee, the Board has considered a variety of criteria, none of which, in isolation, was controlling. The Board believes that, collectively, the Trustees have balanced and diverse experience, qualifications, attributes, and skills, which allow the Board to operate effectively in governing the fund and protecting the interests of shareholders. Information about the specific experience, skills, attributes, and qualifications of each Trustee, which in each case led to the Board's conclusion that the Trustee should serve (or continue to serve) as a trustee of the fund, is provided below.
Board Structure and Oversight Function. James C. Curvey is an interested person and currently serves as Chairman. The Trustees have determined that an interested Chairman is appropriate and benefits shareholders because an interested Chairman has a personal and professional stake in the quality and continuity of services provided to the fund. Independent Trustees exercise their informed business judgment to appoint an individual of their choosing to serve as Chairman, regardless of whether the Trustee happens to be independent or a member of management. The Independent Trustees have determined that they can act independently and effectively without having an Independent Trustee serve as Chairman and that a key structural component for assuring that they are in a position to do so is for the Independent Trustees to constitute a substantial majority for the Board. The Independent Trustees also regularly meet in executive session. Ned C. Lautenbach serves as Chairman of the Independent Trustees and as such (i) acts as a liaison between the Independent Trustees and management with respect to matters important to the Independent Trustees and (ii) with management prepares agendas for Board meetings.
Fidelity® funds are overseen by different Boards of Trustees. The fund's Board oversees Fidelity's high income and certain equity funds, and other Boards oversee Fidelity's investment-grade bond, money market, asset allocation, and sector funds. The asset allocation funds may invest in Fidelity® funds overseen by the fund's Board. The use of separate Boards, each with its own committee structure, allows the Trustees of each group of Fidelity® funds to focus on the unique issues of the funds they oversee, including common research, investment, and operational issues. On occasion, the separate Boards establish joint committees to address issues of overlapping consequences for the Fidelity® funds overseen by each Board.
The Trustees operate using a system of committees to facilitate the timely and efficient consideration of all matters of importance to the Trustees, the fund, and fund shareholders and to facilitate compliance with legal and regulatory requirements and oversight of the fund's activities and associated risks. The Board, acting through its committees, has charged FMR and its affiliates with (i) identifying events or circumstances the occurrence of which could have demonstrably adverse effects on the fund's business and/or reputation; (ii) implementing processes and controls to lessen the possibility that such events or circumstances occur or to mitigate the effects of such events or circumstances if they do occur; and (iii) creating and maintaining a system designed to evaluate continuously business and market conditions in order to facilitate the identification and implementation processes described in (i) and (ii) above. Because the day-to-day operations and activities of the fund are carried out by or through FMR, its affiliates, and other service providers, the fund's exposure to risks is mitigated but not eliminated by the processes overseen by the Trustees. While each of the Board's committees has responsibility for overseeing different aspects of the fund's activities, oversight is exercised primarily through the Operations, Audit, and Compliance Committees. In addition, the Independent Trustees have worked with FMR to enhance the Board's oversight of investment and financial risks, legal and regulatory risks, technology risks, and operational risks, including the development of additional risk reporting to the Board. For example, a working group comprised of Independent Trustees and FMR has worked and continues to work to review the Fidelity® funds' valuation-related activities, reporting and risk management. Appropriate personnel, including but not limited to the fund's Chief Compliance Officer (CCO), FMR's internal auditor, the independent accountants, the fund's Treasurer and portfolio management personnel, make periodic reports to the Board's committees, as appropriate, including an annual review of Fidelity's risk management program for the Fidelity® funds. The responsibilities of each standing committee, including their oversight responsibilities, are described further under "Standing Committees of the Trustees."
Interested Trustees*:
Correspondence intended for a Trustee who is an interested person may be sent to Fidelity Investments, 245 Summer Street, Boston, Massachusetts 02210.
Name, Year of Birth; Principal Occupations and Other Relevant Experience+
Jonathan Chiel (1957)
Year of Election or Appointment: 2016
Trustee
Mr. Chiel also serves as Trustee of other Fidelity® funds. Mr. Chiel is Executive Vice President and General Counsel for FMR LLC (diversified financial services company, 2012-present). Previously, Mr. Chiel served as general counsel (2004-2012) and senior vice president and deputy general counsel (2000-2004) for John Hancock Financial Services; a partner with Choate, Hall & Stewart (1996-2000) (law firm); and an Assistant United States Attorney for the United States Attorney’s Office of the District of Massachusetts (1986-95), including Chief of the Criminal Division (1993-1995). Mr. Chiel is a director on the boards of the Boston Bar Foundation and the Maimonides School.
James C. Curvey (1935)
Year of Election or Appointment: 2007
Trustee
Chairman of the Board of Trustees
Mr. Curvey also serves as Trustee of other Fidelity® funds. Mr. Curvey is a Director of Fidelity Research & Analysis Co. (investment adviser firm, 2009-present), and Vice Chairman (2007-present) and Director of FMR LLC (diversified financial services company). In addition, Mr. Curvey serves as an Overseer for the Boston Symphony Orchestra and a member of the board of Artis-Naples, Naples, Florida, and as a Trustee for Brewster Academy, Wolfeboro, New Hampshire. Previously, Mr. Curvey served as a Director of Fidelity Investments Money Management, Inc. (investment adviser firm, 2009-2014) and a Director of FMR and FMR Co., Inc. (investment adviser firms, 2007-2014).
Charles S. Morrison (1960)
Year of Election or Appointment: 2014
Trustee
Mr. Morrison also serves as Trustee of other funds. He serves as President of Fidelity Management & Research Company (FMR) (investment adviser firm, 2016-present), a Director of Fidelity Investments Money Management, Inc. (FIMM) (investment adviser firm, 2014-present), Director of Fidelity SelectCo, LLC (investment adviser firm, 2014-present), President, Asset Management (2014-present), and is an employee of Fidelity Investments. Previously, Mr. Morrison served as Vice President of Fidelity's Fixed Income and Asset Allocation Funds (2012-2014), President, Fixed Income (2011-2014), Vice President of Fidelity's Money Market Funds (2005-2009), President, Money Market Group Leader of FMR (investment adviser firm, 2009), and Senior Vice President, Money Market Group of FMR (2004-2009). Mr. Morrison also served as Vice President of Fidelity's Bond Funds (2002-2005), certain Balanced Funds (2002-2005), and certain Asset Allocation Funds (2002-2007), and as Senior Vice President (2002-2005) of Fidelity's Bond Division.
* Determined to be an “Interested Trustee” by virtue of, among other things, his or her affiliation with the trust or various entities under common control with FMR.
+ The information includes the Trustee's principal occupation during the last five years and other information relating to the experience, attributes, and skills relevant to the Trustee's qualifications to serve as a Trustee, which led to the conclusion that the Trustee should serve as a Trustee for the fund.
Independent Trustees:
Correspondence intended for an Independent Trustee may be sent to Fidelity Investments, P.O. Box 55235, Boston, Massachusetts 02205-5235.
Name, Year of Birth; Principal Occupations and Other Relevant Experience+
Dennis J. Dirks (1948)
Year of Election or Appointment: 2005
Trustee
Mr. Dirks also serves as Trustee of other Fidelity® funds. Prior to his retirement in May 2003, Mr. Dirks was Chief Operating Officer and a member of the Board of The Depository Trust & Clearing Corporation (DTCC). He also served as President, Chief Operating Officer, and Board member of The Depository Trust Company (DTC) and President and Board member of the National Securities Clearing Corporation (NSCC). In addition, Mr. Dirks served as Chief Executive Officer and Board member of the Government Securities Clearing Corporation, Chief Executive Officer and Board member of the Mortgage-Backed Securities Clearing Corporation, as a Trustee and a member of the Finance Committee of Manhattan College (2005-2008), as a Trustee and a member of the Finance Committee of AHRC of Nassau County (2006-2008), as a member of the Independent Directors Council (IDC) Governing Council (2010-2015), and as a member of the Board of Directors for The Brookville Center for Children’s Services, Inc. (2009-2017). Mr. Dirks is a member of the Finance Committee (2016-present) and Board of Directors (2017-present) of the Asolo Repertory Theatre.
Alan J. Lacy (1953)
Year of Election or Appointment: 2008
Trustee
Mr. Lacy also serves as Trustee of other Fidelity® funds. Mr. Lacy serves as a Director of Bristol-Myers Squibb Company (global pharmaceuticals, 2008-present). He is a Trustee of the California Chapter of The Nature Conservancy (2015-present) and a Director of the Center for Advanced Study in the Behavioral Sciences at Stanford University (2015-present). In addition, Mr. Lacy served as Senior Adviser (2007-2014) of Oak Hill Capital Partners, L.P. (private equity) and also served as Chief Executive Officer (2005) and Vice Chairman (2005-2006) of Sears Holdings Corporation (retail) and Chief Executive Officer and Chairman of the Board of Sears, Roebuck and Co. (retail, 2000-2005). Previously, Mr. Lacy served as Chairman (2014-2017) and a member (2010-2017) of the Board of Directors of Dave & Buster’s Entertainment, Inc. (restaurant and entertainment complexes), as Chairman (2008-2011) and a member (2006-2015) of the Board of Trustees of the National Parks Conservation Association, and as a member of the Board of Directors for The Hillman Companies, Inc. (hardware wholesalers, 2010-2014), Earth Fare, Inc. (retail grocery, 2010-2014), and The Western Union Company (global money transfer, 2006-2011).
Ned C. Lautenbach (1944)
Year of Election or Appointment: 2000
Trustee
Chairman of the Independent Trustees
Mr. Lautenbach also serves as Trustee of other Fidelity® funds. Mr. Lautenbach currently serves as Vice Chair of the Board of Governors, State University System of Florida (2013-present) and is a member of the Council on Foreign Relations (1994-present). He is also a member and has most recently served as Chairman of the Board of Directors of Artis-Naples (2012-present). Previously, Mr. Lautenbach served as a member and then Lead Director of the Board of Directors of Eaton Corporation (diversified industrial, 1997-2016). He was also a Partner and Advisory Partner at Clayton, Dubilier & Rice, LLC (private equity investment, 1998-2010), as well as a Director of Sony Corporation (2006-2007). In addition, Mr. Lautenbach also had a 30-year career with IBM (technology company) during which time he served as Senior Vice President and a member of the Corporate Executive Committee (1968-1998).
Joseph Mauriello (1944)
Year of Election or Appointment: 2008
Trustee
Mr. Mauriello also serves as Trustee of other Fidelity® funds. Prior to his retirement in January 2006, Mr. Mauriello served in numerous senior management positions including Deputy Chairman and Chief Operating Officer (2004-2005), and Vice Chairman of Financial Services (2002-2004) of KPMG LLP US (professional services, 1965-2005). Mr. Mauriello currently serves as a member of the Board of Directors of XL Group plc. (global insurance and re-insurance, 2006-present) and the Independent Directors Council (IDC) Governing Council (2015-present). Previously, Mr. Mauriello served as a Director of the Hamilton Funds of the Bank of New York (2006-2007) and of Arcadia Resources Inc. (health care services and products, 2007-2012).
Cornelia M. Small (1944)
Year of Election or Appointment: 2005
Trustee
Ms. Small also serves as Trustee of other Fidelity® funds. Ms. Small is a member of the Board of Directors (2009-present) and Chair of the Investment Committee (2010-present) of the Teagle Foundation. Ms. Small also serves on the Investment Committee of the Berkshire Taconic Community Foundation (2008-present). Previously, Ms. Small served as Chairperson (2002-2008) and a member of the Investment Committee and Chairperson (2008-2012) and a member of the Board of Trustees of Smith College. In addition, Ms. Small served as Chief Investment Officer, Director of Global Equity Investments, and a member of the Board of Directors of Scudder, Stevens & Clark and Scudder Kemper Investments.
William S. Stavropoulos (1939)
Year of Election or Appointment: 2001
Trustee
Vice Chairman of the Independent Trustees
Mr. Stavropoulos also serves as Trustee of other Fidelity® funds. Mr. Stavropoulos serves as President and Founder of the Michigan Baseball Foundation, the Great Lakes Loons (2007-present). Mr. Stavropoulos is Chairman Emeritus of the Board of Directors of The Dow Chemical Company, where he previously served in numerous senior management positions, including President, CEO (1995-2000; 2002-2004), Chairman of the Executive Committee (2000-2006), and as a member of the Board of Directors (1990-2006). Currently, Mr. Stavropoulos is Chairman of the Board of Directors of Univar Inc. (global distributor of commodity and specialty chemicals), a Director of Teradata Corporation (data warehousing and technology solutions), and a member of the Advisory Board for Metalmark Capital LLC (private equity investment, 2005-present). Mr. Stavropoulos is an operating advisor to Clayton, Dubilier & Rice, LLC (private equity investment). In addition, Mr. Stavropoulos is a member of the University of Notre Dame Advisory Council for the College of Science, a Trustee of the Rollin L. Gerstacker Foundation, and a Director of Artis-Naples in Naples, Florida. Previously, Mr. Stavropoulos served as a Director of Chemical Financial Corporation (bank holding company, 1993-2012) and Tyco International, Ltd. (multinational manufacturing and services, 2007-2012).
David M. Thomas (1949)
Year of Election or Appointment: 2008
Trustee
Mr. Thomas also serves as Trustee of other Fidelity® funds. Mr. Thomas serves as Non-Executive Chairman of the Board of Directors of Fortune Brands Home and Security (home and security products, 2011-present), as a member of the Board of Directors (2004-present) and Presiding Director (2013-present) of Interpublic Group of Companies, Inc. (marketing communication), and as a member of the Board of Trustees of the University of Florida (2013-present). Previously, Mr. Thomas served as Executive Chairman (2005-2006) and Chairman and Chief Executive Officer (2000-2005) of IMS Health, Inc. (pharmaceutical and healthcare information solutions), and a Director of Fortune Brands, Inc. (consumer products, 2000-2011).
+ The information includes the Trustee's principal occupation during the last five years and other information relating to the experience, attributes, and skills relevant to the Trustee's qualifications to serve as a Trustee, which led to the conclusion that the Trustee should serve as a Trustee for the fund.
Advisory Board Members and Officers:
Correspondence intended for an officer or Peter S. Lynch may be sent to Fidelity Investments, 245 Summer Street, Boston, Massachusetts 02210. Officers appear below in alphabetical order.
Name, Year of Birth; Principal Occupation
Peter S. Lynch (1944)
Year of Election or Appointment: 2003
Member of the Advisory Board
Mr. Lynch also serves as Member of the Advisory Board of other Fidelity® funds. Mr. Lynch is Vice Chairman and a Director of FMR (investment adviser firm) and FMR Co., Inc. (investment adviser firm). In addition, Mr. Lynch serves as a Trustee of Boston College and as the Chairman of the Inner-City Scholarship Fund. Previously, Mr. Lynch served on the Special Olympics International Board of Directors (1997-2006).
Elizabeth Paige Baumann (1968)
Year of Election or Appointment: 2017
Anti-Money Laundering (AML) Officer
Ms. Baumann also serves as AML Officer of other funds. She is Chief AML Officer (2012-present) and Senior Vice President (2014-present) of FMR LLC (diversified financial services company) and is an employee of Fidelity Investments. Previously, Ms. Baumann served as AML Officer of the funds (2012-2016), and Vice President (2007-2014) and Deputy Anti-Money Laundering Officer (2007-2012) of FMR LLC.
Marc R. Bryant (1966)
Year of Election or Appointment: 2015
Secretary and Chief Legal Officer (CLO)
Mr. Bryant also serves as Secretary and CLO of other funds. Mr. Bryant serves as CLO, Secretary, and Senior Vice President of Fidelity Management & Research Company (investment adviser firm, 2015-present) and FMR Co., Inc. (investment adviser firm, 2015-present); Secretary of Fidelity SelectCo, LLC (investment adviser firm, 2015-present) and Fidelity Investments Money Management, Inc. (investment adviser firm, 2015-present); and CLO of Fidelity Management & Research (Hong Kong) Limited and FMR Investment Management (UK) Limited (investment adviser firms, 2015-present) and Fidelity Management & Research (Japan) Limited (investment adviser firm, 2016-present). He is Senior Vice President and Deputy General Counsel of FMR LLC (diversified financial services company). Previously, Mr. Bryant served as Secretary and CLO of Fidelity Rutland Square Trust II (2010-2014) and Assistant Secretary of Fidelity's Fixed Income and Asset Allocation Funds (2013-2015). Prior to joining Fidelity Investments, Mr. Bryant served as a Senior Vice President and the Head of Global Retail Legal for AllianceBernstein L.P. (2006-2010), and as the General Counsel for ProFund Advisors LLC (2001-2006).
William C. Coffey (1969)
Year of Election or Appointment: 2009
Assistant Secretary
Mr. Coffey also serves as Assistant Secretary of other funds. He is Senior Vice President and Deputy General Counsel of FMR LLC (diversified financial services company, 2010-present), and is an employee of Fidelity Investments. Previously, Mr. Coffey served as Vice President and Associate General Counsel of FMR LLC (2005-2009).
Jonathan Davis (1968)
Year of Election or Appointment: 2010
Assistant Treasurer
Mr. Davis also serves as Assistant Treasurer of other funds, and is an employee of Fidelity Investments. Previously, Mr. Davis served as Vice President and Associate General Counsel of FMR LLC (diversified financial services company, 2003-2010).
Adrien E. Deberghes (1967)
Year of Election or Appointment: 2016
Assistant Treasurer
Mr. Deberghes also serves as an officer of other funds. He serves as Executive Vice President of Fidelity Investments Money Management, Inc. (FIMM) (investment adviser firm, 2016-present) and is an employee of Fidelity Investments (2008-present). Prior to joining Fidelity Investments, Mr. Deberghes was Senior Vice President of Mutual Fund Administration at State Street Corporation (2007-2008), Senior Director of Mutual Fund Administration at Investors Bank & Trust (2005-2007), and Director of Finance for Dunkin' Brands (2000-2005). Previously, Mr. Deberghes served in other fund officer roles.
Joseph DeSantis (1959)
Year of Election or Appointment: 2017
Vice President
Mr. DeSantis also serves as Vice President of other funds. Mr. DeSantis serves as a Director of Fidelity Management & Research (Japan) Limited (investment adviser firm, 2016-present), Chief Investment Officer, Equities (2010-present) and is an employee of Fidelity Investments.
Stephanie J. Dorsey (1969)
Year of Election or Appointment: 2010
Assistant Treasurer
Ms. Dorsey also serves as an officer of other funds. She is an employee of Fidelity Investments (2008-present) and has served in other fund officer roles. Prior to joining Fidelity Investments, Ms. Dorsey served as Treasurer (2004-2008) of the JPMorgan Mutual Funds and Vice President (2004-2008) of JPMorgan Chase Bank.
Howard J. Galligan III (1966)
Year of Election or Appointment: 2014
Chief Financial Officer
Mr. Galligan also serves as Chief Financial Officer of other funds. Mr. Galligan serves as President of Fidelity Pricing and Cash Management Services (FPCMS) (2014-present) and as a Director of Strategic Advisers, Inc. (investment adviser firm, 2008-present). Previously, Mr. Galligan served as Chief Administrative Officer of Asset Management (2011-2014) and Chief Operating Officer and Senior Vice President of Investment Support for Strategic Advisers, Inc. (2003-2011).
Brian B. Hogan (1964)
Year of Election or Appointment: 2009
Vice President
Mr. Hogan also serves as Trustee or Vice President of other funds. Mr. Hogan serves as a Director of FMR Investment Management (UK) Limited (investment adviser firm, 2015-present) and Fidelity SelectCo, LLC (investment adviser firm, 2014-present) and President of the Equity Division of FMR (investment adviser firm, 2009-present). Previously, Mr. Hogan served as Senior Vice President, Equity Research of FMR (2006-2009) and as a portfolio manager. Mr. Brian B. Hogan is not related to Mr. Colm A. Hogan.
Colm A. Hogan (1973)
Year of Election or Appointment: 2016
Deputy Treasurer
Mr. Hogan also serves as an officer of other funds. Mr. Hogan is an employee of Fidelity Investments (2005-present). Mr. Colm A. Hogan is not related to Mr. Brian B. Hogan.
Chris Maher (1972)
Year of Election or Appointment: 2013
Assistant Treasurer
Mr. Maher serves as Assistant Treasurer of other funds. Mr. Maher is Vice President of Valuation Oversight and is an employee of Fidelity Investments. Previously, Mr. Maher served as Vice President of Asset Management Compliance (2013), Vice President of the Program Management Group of FMR (investment adviser firm, 2010-2013), and Vice President of Valuation Oversight (2008-2010).
Rieco E. Mello (1969)
Year of Election or Appointment: 2017
Assistant Treasurer
Mr. Mello also serves as Assistant Treasurer of other funds. Mr. Mello is an employee of Fidelity Investments (1995-present).
Kenneth B. Robins (1969)
Year of Election or Appointment: 2016
Chief Compliance Officer
Mr. Robins also serves as an officer of other funds. Mr. Robins serves as Compliance Officer of Fidelity Management & Research Company and FMR Co., Inc. (investment adviser firms, 2016-present) and is an employee of Fidelity Investments (2004-present). Previously, Mr. Robins served as Executive Vice President of Fidelity Investments Money Management, Inc. (investment adviser firm, 2013-2016) and served in other fund officer roles.
Stacie M. Smith (1974)
Year of Election or Appointment: 2016
President and Treasurer
Ms. Smith also serves as an officer of other funds. She is an employee of Fidelity Investments (2009-present) and has served in other fund officer roles. Prior to joining Fidelity Investments, Ms. Smith served as Senior Audit Manager of Ernst & Young LLP (accounting firm, 1996-2009). Previously, Ms. Smith served as Deputy Treasurer of certain Fidelity® funds (2013-2016).
Marc L. Spector (1972)
Year of Election or Appointment: 2016
Assistant Treasurer
Mr. Spector also serves as an officer of other funds. Mr. Spector is an employee of Fidelity Investments (2016-present). Prior to joining Fidelity Investments, Mr. Spector served as Director at the Siegfried Group (accounting firm, 2013-2016), and prior to Siegfried Group as audit senior manager at Deloitte & Touche (accounting firm, 2005-2013).
Renee Stagnone (1975)
Year of Election or Appointment: 2016
Assistant Treasurer
Ms. Stagnone also serves as an officer of other funds. Ms. Stagnone is an employee of Fidelity Investments (1997-present). Previously, Ms. Stagnone served as Deputy Treasurer of certain Fidelity® funds (2013-2016).
Shareholder Expense Example
As a shareholder of the Fund, you incur two types of costs: (1) transaction costs, including sales charges (loads) on purchase payments or redemption proceeds, redemption fees and (2) ongoing costs, including management fees, distribution and/or service (12b-1) fees and other Fund expenses. This Example is intended to help you understand your ongoing costs (in dollars) of investing in the Fund and to compare these costs with the ongoing costs of investing in other mutual funds.
The Example is based on an investment of $1,000 invested at the beginning of the period and held for the entire period (May 1, 2017 to October 31, 2017).
Actual Expenses
The first line of the accompanying table for each class of the Fund provides information about actual account values and actual expenses. You may use the information in this line, together with the amount you invested, to estimate the expenses that you paid over the period. Simply divide your account value by $1,000.00 (for example, an $8,600 account value divided by $1,000.00 = 8.6), then multiply the result by the number in the first line for a class of the Fund under the heading entitled "Expenses Paid During Period" to estimate the expenses you paid on your account during this period. A small balance maintenance fee of $12.00 that is charged once a year may apply for certain accounts with a value of less than $2,000. This fee is not included in the table below. If it was, the estimate of expenses you paid during the period would be higher, and your ending account value lower, by this amount. In addition, the Fund, as a shareholder in the underlying Fidelity Central Funds, will indirectly bear its pro-rata share of the fees and expenses incurred by the underlying Fidelity Central Funds. These fees and expenses are not included in the Fund's annualized expense ratio used to calculate the expense estimate in the table below.
Hypothetical Example for Comparison Purposes
The second line of the accompanying table for each class of the Fund provides information about hypothetical account values and hypothetical expenses based on a Class' actual expense ratio and an assumed rate of return of 5% per year before expenses, which is not the Class' actual return. The hypothetical account values and expenses may not be used to estimate the actual ending account balance or expenses you paid for the period. You may use this information to compare the ongoing costs of investing in the Fund and other funds. To do so, compare this 5% hypothetical example with the 5% hypothetical examples that appear in the shareholder reports of the other funds. A small balance maintenance fee of $12.00 that is charged once a year may apply for certain accounts with a value of less than $2,000. This fee is not included in the table below. If it was, the estimate of expenses you paid during the period would be higher, and your ending account value lower, by this amount. In addition, the Fund, as a shareholder in the underlying Fidelity Central Funds, will indirectly bear its pro-rata share of the fees and expenses incurred by the underlying Fidelity Central Funds. These fees and expenses are not included in the Fund's annualized expense ratio used to calculate the expense estimate in the table below.
Please note that the expenses shown in the table are meant to highlight your ongoing costs only and do not reflect any transaction costs. Therefore, the second line of the table is useful in comparing ongoing costs only, and will not help you determine the relative total costs of owning different funds. In addition, if these transactional costs were included, your costs would have been higher.
| | Annualized Expense Ratio-A | Beginning
Account Value
May 1, 2017 | Ending
Account Value
October 31, 2017 | Expenses Paid
During Period-B
May 1, 2017
to October 31, 2017 |
| Class A | 1.26% | | | |
| Actual | | $1,000.00 | $1,106.10 | $6.69 |
| Hypothetical-C | | $1,000.00 | $1,018.85 | $6.41 |
| Class M | 1.57% | | | |
| Actual | | $1,000.00 | $1,104.70 | $8.33 |
| Hypothetical-C | | $1,000.00 | $1,017.29 | $7.98 |
| Class C | 2.03% | | | |
| Actual | | $1,000.00 | $1,102.70 | $10.76 |
| Hypothetical-C | | $1,000.00 | $1,014.97 | $10.31 |
| International Growth | 1.02% | | | |
| Actual | | $1,000.00 | $1,107.90 | $5.42 |
| Hypothetical-C | | $1,000.00 | $1,020.06 | $5.19 |
| Class I | .98% | | | |
| Actual | | $1,000.00 | $1,108.10 | $5.21 |
| Hypothetical-C | | $1,000.00 | $1,020.27 | $4.99 |
| Class Z | .85% | | | |
| Actual | | $1,000.00 | $1,108.80 | $4.52 |
| Hypothetical-C | | $1,000.00 | $1,020.92 | $4.33 |
A Annualized expense ratio reflects expenses net of applicable fee waivers.
B Expenses are equal to each Class' annualized expense ratio, multiplied by the average account value over the period, multiplied by 184/365 (to reflect the one-half year period).
C 5% return per year before expenses
Distributions (Unaudited)
The Board of Trustees of Fidelity International Growth Fund voted to pay to shareholders of record at the opening of business on record date, the following distributions per share derived from capital gains realized from sales of portfolio securities, and dividends derived from net investment income:
| | Pay Date | Record Date | Dividends | Capital Gains |
| Fidelity International Growth Fund | | | | |
| Class A | 12/11/17 | 12/08/17 | $0.040 | $0.015 |
| Class M | 12/11/17 | 12/08/17 | $0.003 | $0.015 |
| Class C | 12/11/17 | 12/08/17 | $0.000 | $0.000 |
| International Growth | 12/11/17 | 12/08/17 | $0.077 | $0.015 |
| Class I | 12/11/17 | 12/08/17 | $0.087 | $0.015 |
| Class Z | 12/11/17 | 12/08/17 | $0.102 | $0.015 |
|
Class A designates 19%; Class M designates 26%; Class C designates 66%; International Growth designates 15%; Class I designates 15%; and Class Z designates 13% of the dividends distributed in December 2016 as qualifying for the dividends–received deduction for corporate shareholders.
Class A, Class M, Class C, International Growth, Class I, and Class Z designate 100% of the dividends distributed in December 2016 as amounts which may be taken into account as a dividend for purposes of the maximum rate under section 1(h)(11) of the Internal Revenue Code.
The amounts per share which represent income derived from sources within, and taxes paid to, foreign countries or possessions of the United States are as follows:
| | Pay Date | Income | Taxes |
| Fidelity International Growth Fund | | | |
| Class A | 12/12/16 | $0.1202 | $0.0182 |
| Class M | 12/12/16 | $0.0882 | $0.0182 |
| Class C | 12/12/16 | $0.0342 | $0.0182 |
| International Growth | 12/12/16 | $0.1502 | $0.0182 |
| Class I | 12/12/16 | $0.1542 | $0.0182 |
| Class Z | 12/12/16 | $0.1672 | $0.0182 |
|
The fund will notify shareholders in January 2018 of amounts for use in preparing 2017 income tax returns.
Board Approval of Investment Advisory Contracts and Management Fees
Fidelity International Growth Fund
Each year, the Board of Trustees, including the Independent Trustees (together, the Board), votes on the renewal of the management contract with Fidelity Management & Research Company (FMR) and the sub-advisory agreements (together, the Advisory Contracts) for the fund. FMR and the sub-advisers are referred to herein as the Investment Advisers. The Board, assisted by the advice of fund counsel and Independent Trustees' counsel, requests and considers a broad range of information relevant to the renewal of the Advisory Contracts throughout the year.
The Board meets regularly and, at each of its meetings, covers an extensive agenda of topics and materials and considers factors that are relevant to its annual consideration of the renewal of the fund's Advisory Contracts, including the services and support provided to the fund and its shareholders. The Board has established various standing committees (Committees), each composed of and chaired by Independent Trustees with varying backgrounds, to which the Board has assigned specific subject matter responsibilities in order to enhance effective decision-making by the Board. The Board, acting directly and through its Committees, requests and receives information concerning the annual consideration of the renewal of the fund's Advisory Contracts. The Board also meets as needed to review matters specifically related to the Board's annual consideration of the renewal of the Advisory Contracts. Members of the Board may also meet with trustees of other Fidelity funds through ad hoc joint committees to discuss certain matters relevant to all of the Fidelity funds.
At its July 2017 meeting, the Board unanimously determined to renew the fund's Advisory Contracts. In reaching its determination, the Board considered all factors it believed relevant, including (i) the nature, extent, and quality of the services to be provided to the fund and its shareholders (including the investment performance of the fund); (ii) the competitiveness of the fund's management fee and total expense ratio relative to peer funds; (iii) the total costs of the services to be provided by and the profits to be realized by Fidelity from its relationships with the fund; and (iv) the extent to which, if any, economies of scale exist and would be realized as the fund grows, and whether any economies of scale are appropriately shared with fund shareholders.
In considering whether to renew the Advisory Contracts for the fund, the Board reached a determination, with the assistance of fund counsel and Independent Trustees' counsel and through the exercise of its business judgment, that the renewal of the Advisory Contracts was in the best interests of the fund and its shareholders and that the compensation payable under the Advisory Contracts was fair and reasonable. The Board's decision to renew the Advisory Contracts was not based on any single factor, but rather was based on a comprehensive consideration of all the information provided to the Board at its meetings throughout the year. The Board, in reaching its determination to renew the Advisory Contracts, was aware that shareholders of the fund have a broad range of investment choices available to them, including a wide choice among funds offered by Fidelity's competitors, and that the fund's shareholders, who have the opportunity to review and weigh the disclosure provided by the fund in its prospectus and other public disclosures, have chosen to invest in this fund, which is part of the Fidelity family of funds.
Amendment to Group Fee Rate. The Board also approved an amendment to the management contract for the fund to add an additional breakpoint to the group fee schedule, effective October 1, 2017. The Board noted that the additional breakpoint would result in lower management fee rates as Fidelity's assets under management increase.
Nature, Extent, and Quality of Services Provided. The Board considered Fidelity's staffing as it relates to the fund, including the backgrounds of investment personnel of Fidelity, and also considered the fund's investment objective, strategies, and related investment philosophy. The Independent Trustees also had discussions with senior management of Fidelity's investment operations and investment groups. The Board considered the structure of the investment personnel compensation program and whether this structure provides appropriate incentives to act in the best interests of the fund. Additionally, the Board considered the portfolio managers' investments, if any, in the funds that they manage.
Resources Dedicated to Investment Management and Support Services. The Board and the Fund Oversight and Research Committees reviewed the general qualifications and capabilities of Fidelity's investment staff, including its size, education, experience, and resources, as well as Fidelity's approach to recruiting, training, managing, and compensating investment personnel. The Board noted that Fidelity has continued to increase the resources devoted to non-U.S. offices, including expansion of Fidelity's global investment organization. The Board also noted that Fidelity's analysts have extensive resources, tools and capabilities that allow them to conduct sophisticated quantitative and fundamental analysis, as well as credit analysis of issuers, counterparties and guarantors. Further, the Board considered that Fidelity's investment professionals have sufficient access to global information and data so as to provide competitive investment results over time, and that those professionals also have access to sophisticated tools that permit them to assess portfolio construction and risk and performance attribution characteristics continuously, as well as to transmit new information and research conclusions rapidly around the world. Additionally, in its deliberations, the Board considered Fidelity's trading, risk management, compliance, and technology and operations capabilities and resources, which are integral parts of the investment management process.
Shareholder and Administrative Services. The Board considered (i) the nature, extent, quality, and cost of advisory, administrative, and shareholder services performed by the Investment Advisers and their affiliates under the Advisory Contracts and under separate agreements covering transfer agency, pricing and bookkeeping, and securities lending services for the fund; (ii) the nature and extent of the supervision of third party service providers, principally custodians, subcustodians, and pricing vendors; and (iii) the resources devoted to, and the record of compliance with, the fund's compliance policies and procedures. The Board also reviewed the allocation of fund brokerage, including allocations to brokers affiliated with the Investment Advisers, the use of brokerage commissions to pay fund expenses, and the use of "soft" commission dollars to pay for research services.
The Board noted that the growth of fund assets over time across the complex allows Fidelity to reinvest in the development of services designed to enhance the value or convenience of the Fidelity funds as investment vehicles. These services include 24-hour access to account information and market information through telephone representatives and over the Internet, investor education materials and asset allocation tools, and the expanded availability of Fidelity Investor Centers.
In 2014, the Board formed an ad hoc Committee on Transfer Agency Fees to review the variety of transfer agency fee structures throughout the industry and Fidelity's competitive positioning with respect to industry participants.
Investment in a Large Fund Family. The Board considered the benefits to shareholders of investing in a Fidelity fund, including the benefits of investing in a fund that is part of a large family of funds offering a variety of investment disciplines and providing a large variety of mutual fund investor services. The Board noted that Fidelity had taken, or had made recommendations that resulted in the Fidelity funds taking, a number of actions over the previous year that benefited particular funds, including: (i) continuing to dedicate additional resources to Fidelity's investment research process, and to the support of the senior management team that oversees asset management; (ii) continuing efforts to enhance Fidelity's global research capabilities; (iii) launching new funds and making other enhancements to meet client needs; (iv) launching new share classes of existing funds; (v) eliminating purchase minimums and broadening eligibility requirements for certain lower-priced share classes; (vi) reducing management fees and total expenses for certain growth equity funds and index funds; (vii) lowering expense caps for certain existing funds and classes to reduce expenses borne by shareholders; (viii) eliminating short-term redemption fees for certain funds; (ix) introducing a new pricing structure for certain funds of funds that is expected to reduce overall expenses paid by shareholders; (x) rationalizing product lines and gaining increased efficiencies through proposals for fund mergers and share class consolidations; (xi) continuing to develop, acquire and implement systems and technology to improve services to the funds and shareholders, strengthen information security, and increase efficiency; and (xii) implementing enhancements to further strengthen Fidelity's product line to increase investors' probability of success in achieving their investment goals, including retirement income goals.
Investment Performance. The Board considered whether the fund has operated in accordance with its investment objective, as well as its record of compliance with its investment restrictions and its performance history.
The Board took into account discussions with representatives of the Investment Advisers about fund investment performance that occur at Board meetings throughout the year. In this regard the Board noted that as part of regularly scheduled fund reviews and other reports to the Board on fund performance, the Board considers annualized return information for the fund for different time periods, measured against a securities market index ("benchmark index") and a peer group of funds with similar objectives ("peer group"), if any. In its evaluation of fund investment performance, the Board gave particular attention to information indicating changes in performance of certain Fidelity funds for specific time periods and discussed with the Investment Advisers the reasons for any overperformance or underperformance.
In addition to reviewing absolute and relative fund performance, the Independent Trustees periodically consider the appropriateness of fund performance metrics in evaluating the results achieved. In general, the Independent Trustees believe that fund performance should be evaluated based on net performance (after fees and expenses) of both the highest performing and lowest performing fund share classes, where applicable, compared to appropriate benchmark indices, over appropriate time periods that may include full market cycles, and compared to peer groups, as applicable, over the same periods, taking into account relevant factors including the following: general market conditions; issuer-specific information; and fund cash flows and other factors.
The Independent Trustees recognize that shareholders evaluate performance on a net basis over their own holding periods, for which one-, three-, and five-year periods are often used as a proxy. For this reason, the performance information reviewed by the Board also included net cumulative calendar year total return information for the fund and an appropriate benchmark index and peer group for the most recent one-, three-, and five-year periods, as shown below. Returns are shown compared to the 25th percentile (top of box, 75% beaten) and 75th percentile (bottom of box, 25% beaten) of the peer universe. Returns of the benchmark index are "net MA,"
i.e., adjusted for tax withholding rates applicable to U.S.-based funds organized as Massachusetts business trusts.
Fidelity International Growth Fund
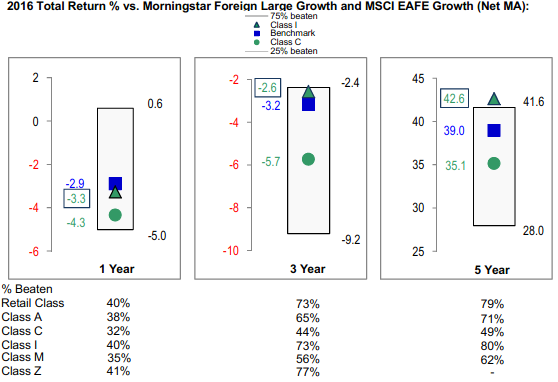
The Board also considered that the fund's management fee is subject to upward or downward adjustment depending upon whether, and to what extent, the fund's investment performance for the performance period (a rolling 36-month period) exceeds, or is exceeded by, a securities index, thus leading to a performance adjustment for the same period. The Board noted that the performance adjustment provides FMR with a strong economic incentive to seek to achieve superior long-term performance for the fund's shareholders and helps to more closely align the interests of FMR and the shareholders of the fund.
Based on its review, the Board concluded that the nature, extent, and quality of services provided to the fund under the Advisory Contracts should continue to benefit the shareholders of the fund.
Competitiveness of Management Fee and Total Expense Ratio. The Board considered the fund's management fee and total expense ratio compared to "mapped groups" of competitive funds and classes created for the purpose of facilitating the Trustees' competitive analysis of management fees and total expenses. Fidelity creates "mapped groups" by combining similar Lipper investment objective categories that have comparable investment mandates. Combining Lipper investment objective categories aids the Board's management fee and total expense ratio comparisons by broadening the competitive group used for comparison.
Management Fee. The Board considered two proprietary management fee comparisons for the 12-month periods shown in basis points (BP) in the chart below. The group of Lipper funds used by the Board for management fee comparisons is referred to below as the "Total Mapped Group." The Total Mapped Group comparison focuses on a fund's standing in terms of gross management fees before expense reimbursements or caps, and without giving effect to the fund's performance adjustment, relative to the total universe of funds with comparable investment mandates, regardless of whether their management fee structures also are comparable. Funds with comparable investment mandates offer exposure to similar types of securities. Funds with comparable management fee structures have similar management fee contractual arrangements (
e.g., flat rate charged for advisory services, all-inclusive fee rate,
etc.). "TMG %" represents the percentage of funds in the Total Mapped Group that had management fees that were lower than the fund's. For example, a hypothetical TMG % of 20% would mean that 80% of the funds in the Total Mapped Group had higher, and 20% had lower, management fees than the fund. The fund's actual TMG %s and the number of funds in the Total Mapped Group are in the chart below. The "Asset-Size Peer Group" (ASPG) comparison focuses on a fund's standing relative to a subset of non-Fidelity funds within the Total Mapped Group that are similar in size and management fee structure without taking into account performance adjustments, if any. For example, if a fund is in the first quartile of the ASPG, the fund's management fee ranks in the least expensive or lowest 25% of funds in the ASPG. The ASPG represents at least 15% of the funds in the Total Mapped Group with comparable asset size and management fee structures, subject to a minimum of 50 funds (or all funds in the Total Mapped Group if fewer than 50). Additional information, such as the ASPG quartile in which the fund's management fee rate ranked and the impact of the fund's performance adjustment, is also included in the chart and considered by the Board.
Fidelity International Growth Fund
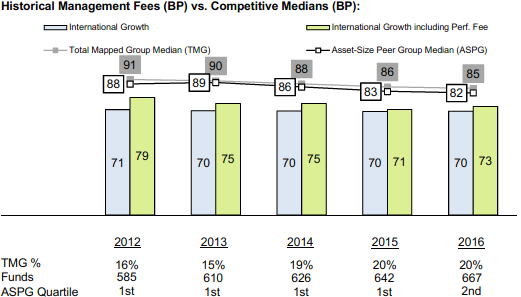
The Board noted that the fund's management fee rate ranked below the median of its Total Mapped Group and below the median of its ASPG for 2016. The Board also noted the effect of the fund's performance adjustment, if any, on the fund's management fee ranking.
The Board noted that, in 2014, the Board and the boards of other Fidelity funds formed the ad hoc Committee on Group Fee to conduct an in-depth review of the "group fee" component of the management fee of funds with such management fee structures. The Committee's focus included the mechanics of the group fee, the competitive landscape of group fee structures, Fidelity funds with no group fee component and investment products not included in group fee assets. The Board also considered that, for funds subject to the group fee, FMR agreed to voluntarily waive fees over a specified period of time in amounts designed to account for assets converted from certain funds to certain collective investment trusts.
The Board also noted that, in 2013, the ad hoc Committee on Management Fees was formed to conduct an in-depth review of the management fee rates of Fidelity's active equity mutual funds. The Committee focused on the following areas: (i) standard fee structures; (ii) research consumption and trading evolution; (iii) management fee competitiveness/profitability by category; and (iv) factors that drive institutional pricing.
Based on its review, the Board concluded that the fund's management fee is fair and reasonable in light of the services that the fund receives and the other factors considered.
Total Expense Ratio. In its review of each class's total expense ratio, the Board considered the fund's management fee rate as well as other fund or class expenses, as applicable, such as transfer agent fees, pricing and bookkeeping fees, fund-paid 12b-1 fees, and custodial, legal, and audit fees. The Board noted the impact of the fund's performance adjustment. The Board also noted that Fidelity may agree to waive fees and expenses from time to time, and the extent to which, if any, it has done so for the fund. As part of its review, the Board also considered the current and historical total expense ratios of each class of the fund compared to competitive fund median expenses. Each class of the fund is compared to those funds and classes in the Total Mapped Group (used by the Board for management fee comparisons) that have a similar sales load structure.
The Board noted that the total expense ratio of each of Class A, Class I, Class Z, and the retail class ranked below the competitive median for 2016 and the total expense ratio of each of Class M (formerly Class T) and Class C ranked above the competitive median for 2016. The Board considered that, in general, various factors can affect total expense ratios. The Board noted that the total expense ratio of Class M was above the competitive median primarily because of higher 12b-1 fees on Class M as compared to most competitor funds. Class M has a higher 12b-1 fee, but a lower front-end sales charge, than traditionally priced front-end sales charge classes. The Board considered that Class M is primarily sold load-waived in the retirement plan market where its 0.50% 12b-1 fee is comparable to competing no-load, higher 12b-1 fee classes designed specifically for retirement plans. The Board noted that the total expense ratio of Class C was above the competitive median primarily because of its 12b-1 fees. The Board noted that the fund offers multiple classes, each of which has a different sales load and 12b-1 fee structure, and that the multiple structures are intended to offer a range of pricing options for the intermediary market. The Board also noted that the total expense ratios of the classes vary primarily by the level of their 12b-1 fees, although differences in transfer agent fees may also cause expenses to vary from class to class.
Fees Charged to Other Fidelity Clients. The Board also considered Fidelity fee structures and other information with respect to clients of Fidelity, such as other funds advised or subadvised by Fidelity, pension plan clients, and other institutional clients with similar mandates. The Board noted that an ad hoc joint committee created by it and the boards of other Fidelity funds periodically (most recently in 2013) reviews and compares Fidelity's institutional investment advisory business with its business of providing services to the Fidelity funds, including the differences in services provided, fees charged, and costs incurred, as well as competition in their respective marketplaces.
Based on its review of total expense ratios and fees charged to other Fidelity clients, the Board concluded that, although some classes were above the median of the universe presented for comparison, the total expense ratio of each class of the fund was reasonable in light of the services that the fund and its shareholders receive and the other factors considered.
Costs of the Services and Profitability. The Board considered the revenues earned and the expenses incurred by Fidelity in conducting the business of developing, marketing, distributing, managing, administering and servicing the fund and servicing the fund's shareholders. The Board also considered the level of Fidelity's profits in respect of all the Fidelity funds.
On an annual basis, Fidelity presents to the Board information about the profitability of its relationships with the fund. Fidelity calculates profitability information for each fund, as well as aggregate profitability information for groups of Fidelity funds and all Fidelity funds, using a series of detailed revenue and cost allocation methodologies which originate with the books and records of Fidelity on which Fidelity's audited financial statements are based. The Audit Committee of the Board reviews any significant changes from the prior year's methodologies.
PricewaterhouseCoopers LLP (PwC), independent registered public accounting firm and auditor to Fidelity and certain Fidelity funds, has been engaged annually by the Board as part of the Board's assessment of Fidelity's profitability analysis. PwC's engagement includes the review and assessment of the methodologies used by Fidelity in determining the revenues and expenses attributable to Fidelity's mutual fund business, and completion of agreed-upon procedures in respect of the mathematical accuracy of the fund profitability information and its conformity to established allocation methodologies. After considering PwC's reports issued under the engagement and information provided by Fidelity, the Board concluded that while other allocation methods may also be reasonable, Fidelity's profitability methodologies are reasonable in all material respects.
The Board also reviewed Fidelity's non-fund businesses and potential fall-out benefits related to the mutual fund business as well as cases where Fidelity's affiliates may benefit from or be related to the fund's business.
The Board considered the costs of the services provided by and the profits realized by Fidelity in connection with the operation of the fund and was satisfied that the profitability was not excessive.
Economies of Scale. The Board considered whether there have been economies of scale in respect of the management of the Fidelity funds, whether the Fidelity funds (including the fund) have appropriately benefited from any such economies of scale, and whether there is potential for realization of any further economies of scale. The Board considered the extent to which the fund will benefit from economies of scale as assets grow through increased services to the fund, through waivers or reimbursements, or through fee or expense ratio reductions. The Board also noted that a committee (the Economies of Scale Committee) created by it and the boards of other Fidelity funds periodically (most recently in 2013) analyzes whether Fidelity attains economies of scale in respect of the management and servicing of the Fidelity funds, whether the Fidelity funds have appropriately benefited from such economies of scale, and whether there is potential for realization of any further economies of scale.
The Board recognized that the fund's management contract incorporates a "group fee" structure, which provides for lower group fee rates as total group assets increase, and for higher group fee rates as total group assets decrease (with "group assets" defined to include fund assets under FMR's management plus the assets of sector funds previously under FMR's management). FMR calculates the group fee rates based on a tiered asset "breakpoint" schedule that varies based on asset class. The Board considered that the group fee is designed to deliver the benefits of economies of scale to fund shareholders when total Fidelity fund assets increase, even if assets of any particular fund are unchanged or have declined, because some portion of Fidelity's costs are attributable to services provided to all Fidelity funds, and all funds benefit if those costs can be allocated among more assets. The Board concluded that, given the group fee structure, fund shareholders will benefit from lower management fees as group assets increase at the fund complex level, regardless of whether Fidelity achieves any such economies of scale.
The Board concluded, taking into account the analysis of the Economies of Scale Committee, that economies of scale, if any, are being appropriately shared between fund shareholders and Fidelity.
Additional Information Requested by the Board. In order to develop fully the factual basis for consideration of the Fidelity funds' advisory contracts, the Board requested and received additional information on certain topics, including: (i) fund performance trends, in particular the underperformance of certain funds, and Fidelity's long-term strategies for certain funds; (ii) Fidelity's fund profitability methodology, profitability trends for certain funds, and the impact of certain factors on fund profitability results, including the impact of market trends on actively managed funds; (iii) the use of performance fees and the calculation of performance adjustments, including the impact of underperformance and fund outflows on performance adjustments; (iv) metrics for evaluating index fund performance; (v) Fidelity's group fee structure, including the group fee breakpoint schedules; (vi) the terms of Fidelity's contractual and voluntary expense cap arrangements with the funds; (vii) the methodology with respect to evaluating competitive fund data and peer group classifications and fee comparisons; (viii) the expense structures for different funds and classes; (ix) Fidelity's arrangements with affiliated sub-advisers on behalf of the funds; (x) information regarding other accounts managed by Fidelity, including institutional accounts and collective investment trusts; (xi) recent changes to the fee structure for certain funds of funds; and (xii) the impact of the Department of Labor's new fiduciary rule on the funds' comparative expense information.
Based on its evaluation of all of the conclusions noted above, and after considering all factors it believed relevant, the Board concluded that the advisory fee structures are fair and reasonable, and that the fund's Advisory Contracts should be renewed.
Corporate Headquarters
245 Summer St.
Boston, MA 02210
www.fidelity.com
IGF-ANN-1217
1.912350.107
Fidelity Advisor® International Growth Fund - Class A, Class M (formerly Class T), Class C, Class I and Class Z
Annual Report October 31, 2017 Class A, Class M, Class C, Class I and Class Z are classes of Fidelity® International Growth Fund |
|
Contents
To view a fund's proxy voting guidelines and proxy voting record for the 12-month period ended June 30, visit http://www.fidelity.com/proxyvotingresults or visit the Securities and Exchange Commission's (SEC) web site at http://www.sec.gov.
You may also call 1-877-208-0098 to request a free copy of the proxy voting guidelines.
Standard & Poor's, S&P and S&P 500 are registered service marks of The McGraw-Hill Companies, Inc. and have been licensed for use by Fidelity Distributors Corporation.
Other third-party marks appearing herein are the property of their respective owners.
All other marks appearing herein are registered or unregistered trademarks or service marks of FMR LLC or an affiliated company. © 2017 FMR LLC. All rights reserved.
This report and the financial statements contained herein are submitted for the general information of the shareholders of the Fund. This report is not authorized for distribution to prospective investors in the Fund unless preceded or accompanied by an effective prospectus.
A fund files its complete schedule of portfolio holdings with the SEC for the first and third quarters of each fiscal year on Form N-Q. Forms N-Q are available on the SEC’s web site at http://www.sec.gov. A fund's Forms N-Q may be reviewed and copied at the SEC’s Public Reference Room in Washington, DC. Information regarding the operation of the SEC's Public Reference Room may be obtained by calling 1-800-SEC-0330.
For a complete list of a fund's portfolio holdings, view the most recent holdings listing, semiannual report, or annual report on Fidelity's web site at http://www.fidelity.com, http://www.institutional.fidelity.com, or http://www.401k.com, as applicable.
NOT FDIC INSURED •MAY LOSE VALUE •NO BANK GUARANTEE
Neither the Fund nor Fidelity Distributors Corporation is a bank.
Performance: The Bottom Line
Average annual total return reflects the change in the value of an investment, assuming reinvestment of distributions from dividend income and capital gains (the profits earned upon the sale of securities that have grown in value, if any) and assuming a constant rate of performance each year. The hypothetical investment and the average annual total returns do not reflect the deduction of taxes that a shareholder would pay on fund distributions or the redemption of fund shares. During periods of reimbursement by Fidelity, a fund’s total return will be greater than it would be had the reimbursement not occurred. How a fund did yesterday is no guarantee of how it will do tomorrow.
Average Annual Total Returns
| For the periods ended October 31, 2017 | Past 1 year | Past 5 years | Life of fundA |
| Class A (incl. 5.75% sales charge) | 16.68% | 7.86% | 3.03% |
| Class M (incl. 3.50% sales charge) | 19.19% | 8.05% | 2.99% |
| Class C (incl. contingent deferred sales charge) | 21.96% | 8.32% | 2.86% |
| Class I | 24.23% | 9.50% | 3.93% |
| Class Z | 24.33% | 9.62% | 3.99% |
A From November 1, 2007
Class C shares' contingent deferred sales charges included in the past one year, past five years, and life of fund total return figures are 1%, 0%, and 0%, respectively.
The initial offering of Class Z shares took place on August 13, 2013. Returns prior to August 13, 2013, are those of Class I.
$10,000 Over Life of Fund
Let's say hypothetically that $10,000 was invested in Fidelity Advisor® International Growth Fund - Class A on November 1, 2007, when the fund started, and the current 5.75% sales charge was paid.
The chart shows how the value of your investment would have changed, and also shows how the MSCI EAFE Growth Index performed over the same period.
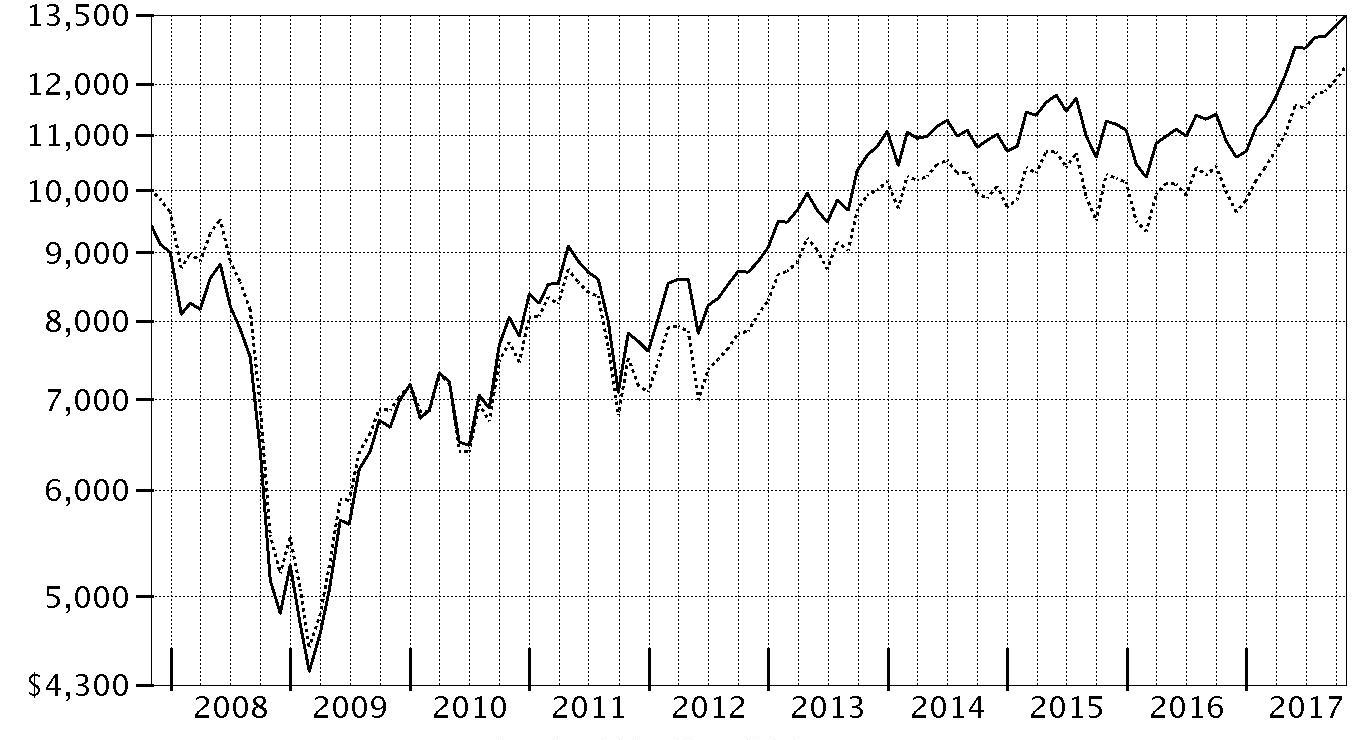
| Period Ending Values |
| $13,482 | Fidelity Advisor® International Growth Fund - Class A |
| $12,349 | MSCI EAFE Growth Index |
Management's Discussion of Fund Performance
Market Recap: The MSCI ACWI (All Country World Index) ex USA Index returned 23.85% for the 12 months ending October 31, 2017, helped partly by a generally weak U.S. dollar. Some favorable election results in continental Europe (+30%) suggested ebbing political uncertainty and near-term risk there, but the U.K. (+20%) faced more-mixed conditions ahead of its expected exit from the European Union. Despite central-bank easing – and pressured recently by yen strength – Japan (+18%) lagged the rest of the Asia-Pacific group (+22%). Commodity-price volatility slowed Canada (+17%), but the emerging-markets group (+26%) sped ahead. Sector-wise, information technology (+47%) was driven by a surge among several Chinese internet-related names. Financials (+27%) rode rising interest rates that, at the same time, weighed on real estate (+17%), utilities (+16%), consumer staples (+14%) and telecom services (+9%) – so-called “bond proxy” sectors. Materials (+28%) and industrials (+27%) responded to demand from China and gains in certain commodity prices. In energy (+20%), oil prices lost ground in the spring before rebounding through October 31 to end well above where they started 12 months ago. Lastly, health care (+14%) was hurt by early-period turmoil around drug pricing and health care legislation.
Comments from Portfolio Manager Jed Weiss: For the fiscal year, the fund’s share classes (excluding sales charges, if applicable) gained about 23% to 24%, roughly in line with the 23.83% return of the MSCI EAFE Growth Index. Versus the benchmark, the fund was helped by favorable out-of-index U.S. selections. Picks in Australia, Japan and the U.K. also contributed. On the negative side, an underweighting in continental Europe weighed on relative results. Individually, our top relative contributor was ASML Holding, a Dutch semiconductor-equipment maker. Out-of-index Chinese e-commerce firm Alibaba Group and Italy's Interpump Group, an maker of specialty pumps whose shares more than doubled this period, both helped. In contrast, our biggest individual detraction came from not owning French luxury goods company and index component LVMH Moet Hennessy Louis Vuitton. Overweighting Belgian brewery Anheuser-Busch InBev also detracted, as the company struggled with weaker-than-expected earnings. U.K.-based consumer goods company Reckitt Benckiser Group also detracted.
The views expressed above reflect those of the portfolio manager(s) only through the end of the period as stated on the cover of this report and do not necessarily represent the views of Fidelity or any other person in the Fidelity organization. Any such views are subject to change at any time based upon market or other conditions and Fidelity disclaims any responsibility to update such views. These views may not be relied on as investment advice and, because investment decisions for a Fidelity fund are based on numerous factors, may not be relied on as an indication of trading intent on behalf of any Fidelity fund.
Note to shareholders: Following a roughly five-month leave of absence, Jed Weiss returned to Fidelity on November 29, 2017, and resumed his day-to-day responsibilities as Portfolio Manager. In his stead, Vincent Montemaggiore served as interim manager of the fund.
Investment Summary (Unaudited)
Geographic Diversification (% of fund's net assets)
| As of October 31, 2017 |
| | United States of America* | 19.7% |
| | Japan | 13.1% |
| | United Kingdom | 10.7% |
| | Switzerland | 8.0% |
| | Sweden | 5.7% |
| | Germany | 5.2% |
| | Belgium | 4.1% |
| | Spain | 4.1% |
| | Australia | 3.7% |
| | Other | 25.7% |
* Includes Short-Term investments and Net Other Assets (Liabilities).
Percentages are based on country or territory of incorporation and are adjusted for the effect of futures contracts, if applicable.
| As of April 30, 2017 |
| | United States of America* | 20.3% |
| | Japan | 11.7% |
| | United Kingdom | 11.5% |
| | Switzerland | 10.7% |
| | Sweden | 5.9% |
| | Germany | 4.8% |
| | Spain | 4.6% |
| | Belgium | 3.9% |
| | Australia | 3.6% |
| | Other | 23.0% |

* Includes Short-Term investments and Net Other Assets (Liabilities).
Percentages are based on country or territory of incorporation and are adjusted for the effect of futures contracts, if applicable.
Asset Allocation as of October 31, 2017
| | % of fund's net assets | % of fund's net assets 6 months ago |
| Stocks | 98.0 | 97.0 |
| Short-Term Investments and Net Other Assets (Liabilities) | 2.0 | 3.0 |
Top Ten Stocks as of October 31, 2017
| | % of fund's net assets | % of fund's net assets 6 months ago |
| Nestle SA (Reg. S) (Switzerland, Food Products) | 4.9 | 5.7 |
| Anheuser-Busch InBev SA NV (Belgium, Beverages) | 3.4 | 3.4 |
| SAP SE (Germany, Software) | 3.1 | 2.7 |
| CSL Ltd. (Australia, Biotechnology) | 3.0 | 2.9 |
| Keyence Corp. (Japan, Electronic Equipment & Components) | 2.8 | 2.1 |
| Visa, Inc. Class A (United States of America, IT Services) | 2.7 | 2.4 |
| ASML Holding NV (Netherlands) (Netherlands, Semiconductors & Semiconductor Equipment) | 2.5 | 2.0 |
| MasterCard, Inc. Class A (United States of America, IT Services) | 2.4 | 2.0 |
| AIA Group Ltd. (Hong Kong, Insurance) | 2.3 | 2.2 |
| Reckitt Benckiser Group PLC (United Kingdom, Household Products) | 2.2 | 2.3 |
| | 29.3 | |
Top Market Sectors as of October 31, 2017
| | % of fund's net assets | % of fund's net assets 6 months ago |
| Information Technology | 21.8 | 18.1 |
| Consumer Staples | 17.4 | 19.0 |
| Industrials | 15.0 | 14.0 |
| Health Care | 12.0 | 14.5 |
| Financials | 11.4 | 10.7 |
| Consumer Discretionary | 10.4 | 10.7 |
| Materials | 6.6 | 6.9 |
| Real Estate | 2.2 | 2.1 |
| Energy | 0.6 | 0.6 |
| Telecommunication Services | 0.6 | 0.4 |
Investments October 31, 2017
Showing Percentage of Net Assets
| Common Stocks - 97.6% | | | |
| | | Shares | Value |
| Australia - 3.7% | | | |
| CSL Ltd. | | 655,271 | $69,675,015 |
| Transurban Group unit | | 1,676,102 | 15,560,421 |
|
| TOTAL AUSTRALIA | | | 85,235,436 |
|
| Austria - 1.7% | | | |
| Andritz AG | | 483,121 | 27,316,540 |
| BUWOG-Gemeinnuetzige Wohnung | | 423,932 | 12,226,914 |
|
| TOTAL AUSTRIA | | | 39,543,454 |
|
| Belgium - 4.1% | | | |
| Anheuser-Busch InBev SA NV | | 643,591 | 78,917,931 |
| KBC Groep NV | | 201,125 | 16,706,539 |
|
| TOTAL BELGIUM | | | 95,624,470 |
|
| Brazil - 0.1% | | | |
| Itau Unibanco Holding SA | | 167,700 | 1,969,564 |
| Canada - 1.3% | | | |
| Alimentation Couche-Tard, Inc. Class B (sub. vtg.) | | 201,400 | 9,443,211 |
| Franco-Nevada Corp. | | 157,400 | 12,508,060 |
| Pason Systems, Inc. | | 280,500 | 4,072,370 |
| PrairieSky Royalty Ltd. | | 194,500 | 5,177,219 |
|
| TOTAL CANADA | | | 31,200,860 |
|
| Cayman Islands - 1.8% | | | |
| 58.com, Inc. ADR (a) | | 155,270 | 10,429,486 |
| Alibaba Group Holding Ltd. sponsored ADR (a) | | 171,200 | 31,653,168 |
| China Biologic Products Holdings, Inc. | | 10,919 | 848,515 |
|
| TOTAL CAYMAN ISLANDS | | | 42,931,169 |
|
| Denmark - 1.3% | | | |
| Jyske Bank A/S (Reg.) | | 220,000 | 12,432,200 |
| Novo Nordisk A/S Series B sponsored ADR | | 380,100 | 18,925,179 |
|
| TOTAL DENMARK | | | 31,357,379 |
|
| Finland - 0.3% | | | |
| Tikkurila Oyj | | 298,300 | 5,896,647 |
| France - 1.7% | | | |
| Edenred SA | | 339,600 | 9,790,681 |
| Elis SA | | 426,436 | 11,124,357 |
| Essilor International SA | | 149,655 | 18,949,196 |
|
| TOTAL FRANCE | | | 39,864,234 |
|
| Germany - 5.2% | | | |
| Bayer AG | | 376,200 | 48,935,712 |
| SAP SE | | 637,605 | 72,854,421 |
|
| TOTAL GERMANY | | | 121,790,133 |
|
| Hong Kong - 2.3% | | | |
| AIA Group Ltd. | | 7,006,800 | 52,721,199 |
| India - 1.0% | | | |
| Housing Development Finance Corp. Ltd. | | 908,566 | 23,958,079 |
| Ireland - 3.3% | | | |
| CRH PLC sponsored ADR | | 1,207,666 | 45,311,628 |
| James Hardie Industries PLC CDI | | 2,046,151 | 31,148,171 |
|
| TOTAL IRELAND | | | 76,459,799 |
|
| Isle of Man - 0.6% | | | |
| Playtech Ltd. | | 1,024,895 | 13,394,349 |
| Israel - 0.2% | | | |
| Azrieli Group | | 91,600 | 5,168,880 |
| Italy - 1.1% | | | |
| Azimut Holding SpA | | 234,600 | 4,634,724 |
| Interpump Group SpA | | 600,426 | 20,219,834 |
|
| TOTAL ITALY | | | 24,854,558 |
|
| Japan - 13.1% | | | |
| Astellas Pharma, Inc. | | 1,080,100 | 14,374,897 |
| DENSO Corp. | | 443,300 | 24,414,298 |
| East Japan Railway Co. | | 242,000 | 23,469,067 |
| Hoya Corp. | | 486,000 | 26,404,740 |
| Keyence Corp. | | 117,824 | 65,418,826 |
| Komatsu Ltd. | | 754,300 | 24,647,334 |
| Misumi Group, Inc. | | 934,700 | 25,608,492 |
| Mitsui Fudosan Co. Ltd. | | 654,800 | 15,283,679 |
| Nintendo Co. Ltd. | | 30,800 | 11,949,223 |
| Olympus Corp. | | 405,000 | 15,071,943 |
| OSG Corp. | | 546,500 | 11,828,887 |
| SHO-BOND Holdings Co. Ltd. | | 202,400 | 12,455,362 |
| USS Co. Ltd. | | 1,632,400 | 32,998,656 |
|
| TOTAL JAPAN | | | 303,925,404 |
|
| Kenya - 0.6% | | | |
| Safaricom Ltd. | | 53,165,000 | 13,067,060 |
| Korea (South) - 1.1% | | | |
| BGFretail Co. Ltd. (b) | | 210,338 | 14,880,498 |
| NAVER Corp. | | 12,551 | 10,035,502 |
|
| TOTAL KOREA (SOUTH) | | | 24,916,000 |
|
| Mexico - 0.4% | | | |
| Fomento Economico Mexicano S.A.B. de CV sponsored ADR | | 110,855 | 9,727,526 |
| Netherlands - 2.5% | | | |
| ASML Holding NV (Netherlands) | | 319,300 | 57,611,132 |
| New Zealand - 0.3% | | | |
| Auckland International Airport Ltd. | | 1,415,434 | 6,034,263 |
| South Africa - 2.4% | | | |
| Clicks Group Ltd. | | 1,089,883 | 12,212,548 |
| Naspers Ltd. Class N | | 182,500 | 44,467,333 |
|
| TOTAL SOUTH AFRICA | | | 56,679,881 |
|
| Spain - 4.1% | | | |
| Amadeus IT Holding SA Class A | | 582,200 | 39,503,733 |
| Hispania Activos Inmobiliarios SA | | 381,324 | 6,576,163 |
| Inditex SA (c) | | 824,288 | 30,816,716 |
| Merlin Properties Socimi SA | | 429,900 | 5,673,713 |
| Prosegur Compania de Seguridad SA (Reg.) | | 1,572,649 | 11,998,946 |
|
| TOTAL SPAIN | | | 94,569,271 |
|
| Sweden - 5.7% | | | |
| ASSA ABLOY AB (B Shares) | | 2,231,483 | 47,046,050 |
| Atlas Copco AB (A Shares) | | 829,200 | 36,370,637 |
| Essity AB Class B | | 425,800 | 12,730,793 |
| Fagerhult AB | | 1,081,632 | 13,727,688 |
| Svenska Cellulosa AB (SCA) (B Shares) | | 393,600 | 3,695,444 |
| Svenska Handelsbanken AB (A Shares) | | 1,253,220 | 17,963,771 |
|
| TOTAL SWEDEN | | | 131,534,383 |
|
| Switzerland - 8.0% | | | |
| Nestle SA (Reg. S) | | 1,352,697 | 113,813,938 |
| Roche Holding AG (participation certificate) | | 206,237 | 47,667,788 |
| Schindler Holding AG: | | | |
| (participation certificate) | | 91,239 | 20,677,731 |
| (Reg.) | | 18,350 | 4,052,027 |
|
| TOTAL SWITZERLAND | | | 186,211,484 |
|
| Taiwan - 1.1% | | | |
| Taiwan Semiconductor Manufacturing Co. Ltd. | | 3,210,000 | 25,969,126 |
| Turkey - 0.2% | | | |
| Tupras Turkiye Petrol Rafinerileri A/S | | 143,012 | 5,145,876 |
| United Kingdom - 10.7% | | | |
| BAE Systems PLC | | 2,435,000 | 19,181,320 |
| British American Tobacco PLC (United Kingdom) | | 767,100 | 49,562,202 |
| Elementis PLC | | 1,307,100 | 4,935,519 |
| Howden Joinery Group PLC | | 844,500 | 4,599,775 |
| Informa PLC | | 2,469,039 | 22,856,402 |
| InterContinental Hotel Group PLC ADR (c) | | 668,922 | 37,185,374 |
| Prudential PLC | | 1,698,906 | 41,700,287 |
| Reckitt Benckiser Group PLC | | 577,945 | 51,706,811 |
| Rightmove PLC | | 93,000 | 5,130,936 |
| Shaftesbury PLC | | 393,933 | 5,179,701 |
| Spectris PLC | | 208,000 | 7,072,133 |
|
| TOTAL UNITED KINGDOM | | | 249,110,460 |
|
| United States of America - 17.7% | | | |
| Alphabet, Inc. Class A (a) | | 38,636 | 39,912,533 |
| Autoliv, Inc. (c) | | 203,269 | 25,380,167 |
| Berkshire Hathaway, Inc. Class B (a) | | 158,084 | 29,552,223 |
| Martin Marietta Materials, Inc. | | 100,100 | 21,706,685 |
| MasterCard, Inc. Class A | | 369,000 | 54,896,130 |
| Mohawk Industries, Inc. (a) | | 91,800 | 24,029,568 |
| Molson Coors Brewing Co. Class B | | 128,400 | 10,383,708 |
| Moody's Corp. | | 103,200 | 14,696,712 |
| MSCI, Inc. | | 161,000 | 18,894,960 |
| Philip Morris International, Inc. | | 312,208 | 32,669,445 |
| PriceSmart, Inc. | | 91,600 | 7,676,080 |
| ResMed, Inc. | | 239,800 | 20,186,364 |
| S&P Global, Inc. | | 129,900 | 20,325,453 |
| Sherwin-Williams Co. | | 71,000 | 28,055,650 |
| Visa, Inc. Class A | | 578,260 | 63,597,035 |
|
| TOTAL UNITED STATES OF AMERICA | | | 411,962,713 |
|
| TOTAL COMMON STOCKS | | | |
| (Cost $1,751,995,818) | | | 2,268,434,789 |
|
| Nonconvertible Preferred Stocks - 0.4% | | | |
| Brazil - 0.4% | | | |
| Itau Unibanco Holding SA | | | |
| (Cost $9,347,831) | | 731,700 | 9,405,431 |
|
| Money Market Funds - 2.8% | | | |
| Fidelity Cash Central Fund, 1.10% (d) | | 39,775,219 | 39,783,174 |
| Fidelity Securities Lending Cash Central Fund 1.11% (d)(e) | | 24,257,197 | 24,259,622 |
| TOTAL MONEY MARKET FUNDS | | | |
| (Cost $64,042,796) | | | 64,042,796 |
| TOTAL INVESTMENT IN SECURITIES - 100.8% | | | |
| (Cost $1,825,386,445) | | | 2,341,883,016 |
| NET OTHER ASSETS (LIABILITIES) - (0.8)% | | | (18,508,909) |
| NET ASSETS - 100% | | | $2,323,374,107 |
Categorizations in the Schedule of Investments are based on country or territory of incorporation.
Legend
(a) Non-income producing
(b) Level 3 security
(c) Security or a portion of the security is on loan at period end.
(d) Affiliated fund that is generally available only to investment companies and other accounts managed by Fidelity Investments. The rate quoted is the annualized seven-day yield of the fund at period end. A complete unaudited listing of the fund's holdings as of its most recent quarter end is available upon request. In addition, each Fidelity Central Fund's financial statements, which are not covered by the Fund's Report of Independent Registered Public Accounting Firm, are available on the SEC's website or upon request.
(e) Investment made with cash collateral received from securities on loan.
Affiliated Central Funds
Information regarding fiscal year to date income earned by the Fund from investments in Fidelity Central Funds is as follows:
| Fund | Income earned |
| Fidelity Cash Central Fund | $470,145 |
| Fidelity Securities Lending Cash Central Fund | 310,638 |
| Total | $780,783 |
Investment Valuation
The following is a summary of the inputs used, as of October 31, 2017, involving the Fund's assets and liabilities carried at fair value. The inputs or methodology used for valuing securities may not be an indication of the risk associated with investing in those securities. For more information on valuation inputs, and their aggregation into the levels used below, please refer to the Investment Valuation section in the accompanying Notes to Financial Statements.
| | Valuation Inputs at Reporting Date: |
| Description | Total | Level 1 | Level 2 | Level 3 |
| Investments in Securities: | | | | |
| Equities: | | | | |
| Consumer Discretionary | $242,148,514 | $184,735,560 | $57,412,954 | $-- |
| Consumer Staples | 403,724,691 | 94,843,311 | 294,000,882 | 14,880,498 |
| Energy | 14,395,465 | 14,395,465 | -- | -- |
| Financials | 264,961,142 | 223,260,855 | 41,700,287 | -- |
| Health Care | 281,039,349 | 128,584,269 | 152,455,080 | -- |
| Industrials | 345,709,412 | 181,472,900 | 164,236,512 | -- |
| Information Technology | 509,427,733 | 275,625,005 | 233,802,728 | -- |
| Materials | 153,257,804 | 153,257,804 | -- | -- |
| Real Estate | 50,109,050 | 34,825,371 | 15,283,679 | -- |
| Telecommunication Services | 13,067,060 | 13,067,060 | -- | -- |
| Money Market Funds | 64,042,796 | 64,042,796 | -- | -- |
| Total Investments in Securities: | $2,341,883,016 | $1,368,110,396 | $958,892,122 | $14,880,498 |
The following is a summary of transfers between Level 1 and Level 2 for the period ended October 31, 2017. Transfers are assumed to have occurred at the beginning of the period, and are primarily attributable to the valuation techniques used for foreign equity securities, as discussed in the accompanying Notes to Financial Statements:
| Transfers | Total |
| Level 1 to Level 2 | $230,223,518 |
| Level 2 to Level 1 | $12,340,977 |
See accompanying notes which are an integral part of the financial statements.
Financial Statements
Statement of Assets and Liabilities
| | | October 31, 2017 |
| Assets | | |
Investment in securities, at value (including securities loaned of $23,182,483) — See accompanying schedule:
Unaffiliated issuers (cost $1,761,343,649) | $2,277,840,220 | |
| Fidelity Central Funds (cost $64,042,796) | 64,042,796 | |
| Total Investment in Securities (cost $1,825,386,445) | | $2,341,883,016 |
| Receivable for investments sold | | 56,805 |
| Receivable for fund shares sold | | 2,687,806 |
| Dividends receivable | | 7,179,203 |
| Distributions receivable from Fidelity Central Funds | | 74,434 |
| Prepaid expenses | | 4,833 |
| Other receivables | | 14,807 |
| Total assets | | 2,351,900,904 |
| Liabilities | | |
| Payable for fund shares redeemed | $2,332,810 | |
| Accrued management fee | 1,125,222 | |
| Distribution and service plan fees payable | 103,640 | |
| Other affiliated payables | 435,489 | |
| Other payables and accrued expenses | 276,686 | |
| Collateral on securities loaned | 24,252,950 | |
| Total liabilities | | 28,526,797 |
| Net Assets | | $2,323,374,107 |
| Net Assets consist of: | | |
| Paid in capital | | $1,885,257,908 |
| Undistributed net investment income | | 13,559,706 |
| Accumulated undistributed net realized gain (loss) on investments and foreign currency transactions | | (91,847,153) |
| Net unrealized appreciation (depreciation) on investments and assets and liabilities in foreign currencies | | 516,403,646 |
| Net Assets | | $2,323,374,107 |
| Calculation of Maximum Offering Price | | |
| Class A: | | |
| Net Asset Value and redemption price per share ($156,988,361 ÷ 11,764,958 shares) | | $13.34 |
| Maximum offering price per share (100/94.25 of $13.34) | | $14.15 |
| Class M: | | |
| Net Asset Value and redemption price per share ($33,596,929 ÷ 2,526,067 shares) | | $13.30 |
| Maximum offering price per share (100/96.50 of $13.30) | | $13.78 |
| Class C: | | |
| Net Asset Value and offering price per share ($68,908,490 ÷ 5,261,486 shares)(a) | | $13.10 |
| International Growth: | | |
| Net Asset Value, offering price and redemption price per share ($961,774,920 ÷ 71,508,398 shares) | | $13.45 |
| Class I: | | |
| Net Asset Value, offering price and redemption price per share ($728,227,135 ÷ 54,222,002 shares) | | $13.43 |
| Class Z: | | |
| Net Asset Value, offering price and redemption price per share ($373,878,272 ÷ 27,789,983 shares) | | $13.45 |
(a) Redemption price per share is equal to net asset value less any applicable contingent deferred sales charge.
See accompanying notes which are an integral part of the financial statements.
Statement of Operations
| | | Year ended October 31, 2017 |
| Investment Income | | |
| Dividends | | $39,440,989 |
| Income from Fidelity Central Funds | | 780,783 |
| Income before foreign taxes withheld | | 40,221,772 |
| Less foreign taxes withheld | | (3,582,639) |
| Total income | | 36,639,133 |
| Expenses | | |
| Management fee | | |
| Basic fee | $13,410,683 | |
| Performance adjustment | 639,599 | |
| Transfer agent fees | 3,844,948 | |
| Distribution and service plan fees | 1,178,125 | |
| Accounting and security lending fees | 860,326 | |
| Custodian fees and expenses | 221,061 | |
| Independent trustees' fees and expenses | 7,449 | |
| Registration fees | 174,535 | |
| Audit | 80,806 | |
| Legal | 4,691 | |
| Interest | 942 | |
| Miscellaneous | 15,419 | |
| Total expenses before reductions | 20,438,584 | |
| Expense reductions | (77,306) | 20,361,278 |
| Net investment income (loss) | | 16,277,855 |
| Realized and Unrealized Gain (Loss) | | |
| Net realized gain (loss) on: | | |
| Investment securities: | | |
| Unaffiliated issuers | (12,719,470) | |
| Fidelity Central Funds | 4,213 | |
| Foreign currency transactions | 163,886 | |
| Total net realized gain (loss) | | (12,551,371) |
| Change in net unrealized appreciation (depreciation) on: | | |
| Unaffiliated issuers (net of decrease in deferred foreign taxes of $53,568) | 409,309,148 | |
| Fidelity Central Funds | (18,423) | |
| Assets and liabilities in foreign currencies | 98,641 | |
| Total change in net unrealized appreciation (depreciation) | | 409,389,366 |
| Net gain (loss) | | 396,837,995 |
| Net increase (decrease) in net assets resulting from operations | | $413,115,850 |
See accompanying notes which are an integral part of the financial statements.
Statement of Changes in Net Assets
| | Year ended October 31, 2017 | Year ended October 31, 2016 |
| Increase (Decrease) in Net Assets | | |
| Operations | | |
| Net investment income (loss) | $16,277,855 | $20,404,064 |
| Net realized gain (loss) | (12,551,371) | (41,385,367) |
| Change in net unrealized appreciation (depreciation) | 409,389,366 | (23,170,403) |
| Net increase (decrease) in net assets resulting from operations | 413,115,850 | (44,151,706) |
| Distributions to shareholders from net investment income | (18,629,181) | (9,313,588) |
| Distributions to shareholders from net realized gain | – | (1,062,130) |
| Total distributions | (18,629,181) | (10,375,718) |
| Share transactions - net increase (decrease) | 210,891,938 | 298,573,554 |
| Redemption fees | 6,903 | 63,422 |
| Total increase (decrease) in net assets | 605,385,510 | 244,109,552 |
| Net Assets | | |
| Beginning of period | 1,717,988,597 | 1,473,879,045 |
| End of period | $2,323,374,107 | $1,717,988,597 |
| Other Information | | |
| Undistributed net investment income end of period | $13,559,706 | $17,435,692 |
See accompanying notes which are an integral part of the financial statements.
Financial Highlights
Fidelity International Growth Fund Class A
| Years ended October 31, | 2017 | 2016 | 2015 | 2014 | 2013 |
| Selected Per–Share Data | | | | | |
| Net asset value, beginning of period | $10.88 | $11.30 | $11.01 | $10.78 | $8.91 |
| Income from Investment Operations | | | | | |
| Net investment income (loss)A | .07 | .12B | .07 | .09 | .08 |
| Net realized and unrealized gain (loss) | 2.49 | (.48) | .28 | .18 | 1.88 |
| Total from investment operations | 2.56 | (.36) | .35 | .27 | 1.96 |
| Distributions from net investment income | (.10) | (.05) | (.06) | (.03) | (.08) |
| Distributions from net realized gain | – | (.01) | – | (.01) | (.01) |
| Total distributions | (.10) | (.06) | (.06) | (.04) | (.09) |
| Redemption fees added to paid in capitalA,C | – | – | – | – | – |
| Net asset value, end of period | $13.34 | $10.88 | $11.30 | $11.01 | $10.78 |
| Total ReturnD,E | 23.80% | (3.22)% | 3.20% | 2.54% | 22.18% |
| Ratios to Average Net AssetsF,G | | | | | |
| Expenses before reductions | 1.28% | 1.27% | 1.26% | 1.35% | 1.44% |
| Expenses net of fee waivers, if any | 1.28% | 1.27% | 1.26% | 1.35% | 1.43% |
| Expenses net of all reductions | 1.27% | 1.27% | 1.25% | 1.34% | 1.42% |
| Net investment income (loss) | .62% | 1.05%B | .66% | .84% | .80% |
| Supplemental Data | | | | | |
| Net assets, end of period (000 omitted) | $156,988 | $221,861 | $184,878 | $119,017 | $74,595 |
| Portfolio turnover rateH | 22% | 29% | 26% | 27% | 32% |
A Calculated based on average shares outstanding during the period.
B Net Investment income per share reflects a large, non-recurring dividend which amounted to $.04 per share. Excluding this non-recurring dividend, the ratio of net investment income (loss) to average net assets would have been .68%.
C Amount represents less than $.005 per share.
D Total returns would have been lower if certain expenses had not been reduced during the applicable periods shown.
E Total returns do not include the effect of the sales charges.
F Fees and expenses of any underlying Fidelity Central Funds are not included in the Fund's expense ratio. The Fund indirectly bears its proportionate share of the expenses of any underlying Fidelity Central Funds.
G Expense ratios reflect operating expenses of the class. Expenses before reductions do not reflect amounts reimbursed by the investment adviser or reductions from brokerage service arrangements or reductions from other expense offset arrangements and do not represent the amount paid by the class during periods when reimbursements or reductions occur. Expenses net of fee waivers reflect expenses after reimbursement by the investment adviser but prior to reductions from brokerage service arrangements or other expense offset arrangements. Expenses net of all reductions represent the net expenses paid by the class.
H Amount does not include the portfolio activity of any underlying Fidelity Central Funds.
See accompanying notes which are an integral part of the financial statements.
Fidelity International Growth Fund Class M
| Years ended October 31, | 2017 | 2016 | 2015 | 2014 | 2013 |
| Selected Per–Share Data | | | | | |
| Net asset value, beginning of period | $10.84 | $11.26 | $10.96 | $10.75 | $8.89 |
| Income from Investment Operations | | | | | |
| Net investment income (loss)A | .04 | .08B | .04 | .06 | .05 |
| Net realized and unrealized gain (loss) | 2.49 | (.48) | .27 | .18 | 1.88 |
| Total from investment operations | 2.53 | (.40) | .31 | .24 | 1.93 |
| Distributions from net investment income | (.07) | (.01) | (.01) | (.02) | (.07) |
| Distributions from net realized gain | – | (.01) | – | (.01) | (.01) |
| Total distributions | (.07) | (.02) | (.01) | (.03) | (.07)C |
| Redemption fees added to paid in capitalA,D | – | – | – | – | – |
| Net asset value, end of period | $13.30 | $10.84 | $11.26 | $10.96 | $10.75 |
| Total ReturnE,F | 23.51% | (3.58)% | 2.85% | 2.21% | 21.91% |
| Ratios to Average Net AssetsG,H | | | | | |
| Expenses before reductions | 1.59% | 1.61% | 1.58% | 1.65% | 1.69% |
| Expenses net of fee waivers, if any | 1.59% | 1.61% | 1.58% | 1.65% | 1.69% |
| Expenses net of all reductions | 1.58% | 1.61% | 1.58% | 1.65% | 1.68% |
| Net investment income (loss) | .31% | .71%B | .33% | .53% | .54% |
| Supplemental Data | | | | | |
| Net assets, end of period (000 omitted) | $33,597 | $27,966 | $28,833 | $26,369 | $23,118 |
| Portfolio turnover rateI | 22% | 29% | 26% | 27% | 32% |
A Calculated based on average shares outstanding during the period.
B Net Investment income per share reflects a large, non-recurring dividend which amounted to $.04 per share. Excluding this non-recurring dividend, the ratio of net investment income (loss) to average net assets would have been .34%.
C Total distributions of $0.07 per share is comprised of distributions from net investment income of $0.69 and distributions from net realized gain of $0.005 per share.
D Amount represents less than $.005 per share.
E Total returns would have been lower if certain expenses had not been reduced during the applicable periods shown.
F Total returns do not include the effect of the sales charges.
G Fees and expenses of any underlying Fidelity Central Funds are not included in the Fund's expense ratio. The Fund indirectly bears its proportionate share of the expenses of any underlying Fidelity Central Funds.
H Expense ratios reflect operating expenses of the class. Expenses before reductions do not reflect amounts reimbursed by the investment adviser or reductions from brokerage service arrangements or reductions from other expense offset arrangements and do not represent the amount paid by the class during periods when reimbursements or reductions occur. Expenses net of fee waivers reflect expenses after reimbursement by the investment adviser but prior to reductions from brokerage service arrangements or other expense offset arrangements. Expenses net of all reductions represent the net expenses paid by the class.
I Amount does not include the portfolio activity of any underlying Fidelity Central Funds.
See accompanying notes which are an integral part of the financial statements.
Fidelity International Growth Fund Class C
| Years ended October 31, | 2017 | 2016 | 2015 | 2014 | 2013 |
| Selected Per–Share Data | | | | | |
| Net asset value, beginning of period | $10.67 | $11.12 | $10.87 | $10.69 | $8.84 |
| Income from Investment Operations | | | | | |
| Net investment income (loss)A | (.02) | .03B | (.02) | .01 | .01 |
| Net realized and unrealized gain (loss) | 2.47 | (.47) | .27 | .18 | 1.87 |
| Total from investment operations | 2.45 | (.44) | .25 | .19 | 1.88 |
| Distributions from net investment income | (.02) | – | – | – | (.02) |
| Distributions from net realized gain | – | (.01) | – | (.01) | (.01) |
| Total distributions | (.02) | (.01) | – | (.01) | (.03) |
| Redemption fees added to paid in capitalA,C | – | – | – | – | – |
| Net asset value, end of period | $13.10 | $10.67 | $11.12 | $10.87 | $10.69 |
| Total ReturnD,E | 22.96% | (3.98)% | 2.30% | 1.77% | 21.29% |
| Ratios to Average Net AssetsF,G | | | | | |
| Expenses before reductions | 2.04% | 2.07% | 2.06% | 2.12% | 2.19% |
| Expenses net of fee waivers, if any | 2.04% | 2.07% | 2.06% | 2.12% | 2.18% |
| Expenses net of all reductions | 2.04% | 2.06% | 2.05% | 2.12% | 2.17% |
| Net investment income (loss) | (.15)% | .26%B | (.15)% | .06% | .05% |
| Supplemental Data | | | | | |
| Net assets, end of period (000 omitted) | $68,908 | $52,738 | $52,378 | $32,737 | $17,196 |
| Portfolio turnover rateH | 22% | 29% | 26% | 27% | 32% |
A Calculated based on average shares outstanding during the period.
B Net Investment income per share reflects a large, non-recurring dividend which amounted to $.04 per share. Excluding this non-recurring dividend, the ratio of net investment income (loss) to average net assets would have been (.12)%.
C Amount represents less than $.005 per share.
D Total returns would have been lower if certain expenses had not been reduced during the applicable periods shown.
E Total returns do not include the effect of the contingent deferred sales charge.
F Fees and expenses of any underlying Fidelity Central Funds are not included in the Fund's expense ratio. The Fund indirectly bears its proportionate share of the expenses of any underlying Fidelity Central Funds.
G Expense ratios reflect operating expenses of the class. Expenses before reductions do not reflect amounts reimbursed by the investment adviser or reductions from brokerage service arrangements or reductions from other expense offset arrangements and do not represent the amount paid by the class during periods when reimbursements or reductions occur. Expenses net of fee waivers reflect expenses after reimbursement by the investment adviser but prior to reductions from brokerage service arrangements or other expense offset arrangements. Expenses net of all reductions represent the net expenses paid by the class.
H Amount does not include the portfolio activity of any underlying Fidelity Central Funds.
See accompanying notes which are an integral part of the financial statements.
Fidelity International Growth Fund
| Years ended October 31, | 2017 | 2016 | 2015 | 2014 | 2013 |
| Selected Per–Share Data | | | | | |
| Net asset value, beginning of period | $10.97 | $11.38 | $11.10 | $10.84 | $8.95 |
| Income from Investment Operations | | | | | |
| Net investment income (loss)A | .10 | .15B | .11 | .13 | .11 |
| Net realized and unrealized gain (loss) | 2.51 | (.47) | .26 | .19 | 1.88 |
| Total from investment operations | 2.61 | (.32) | .37 | .32 | 1.99 |
| Distributions from net investment income | (.13) | (.08) | (.09) | (.05) | (.10) |
| Distributions from net realized gain | – | (.01) | – | (.01) | (.01) |
| Total distributions | (.13) | (.09) | (.09) | (.06) | (.10)C |
| Redemption fees added to paid in capitalA,D | – | – | – | – | – |
| Net asset value, end of period | $13.45 | $10.97 | $11.38 | $11.10 | $10.84 |
| Total ReturnE | 24.14% | (2.87)% | 3.36% | 2.96% | 22.48% |
| Ratios to Average Net AssetsF,G | | | | | |
| Expenses before reductions | 1.03% | .99% | .97% | 1.04% | 1.13% |
| Expenses net of fee waivers, if any | 1.03% | .99% | .97% | 1.04% | 1.13% |
| Expenses net of all reductions | 1.03% | .98% | .96% | 1.04% | 1.11% |
| Net investment income (loss) | .87% | 1.34%B | .94% | 1.14% | 1.11% |
| Supplemental Data | | | | | |
| Net assets, end of period (000 omitted) | $961,775 | $1,038,771 | $938,348 | $635,607 | $430,914 |
| Portfolio turnover rateH | 22% | 29% | 26% | 27% | 32% |
A Calculated based on average shares outstanding during the period.
B Net Investment income per share reflects a large, non-recurring dividend which amounted to $.04 per share. Excluding this non-recurring dividend, the ratio of net investment income (loss) to average net assets would have been .96%.
C Total distributions of $.10 per share is comprised of distributions from net investment income of $.097 and distributions from net realized gain of $.005 per share.
D Amount represents less than $.005 per share.
E Total returns would have been lower if certain expenses had not been reduced during the applicable periods shown.
F Fees and expenses of any underlying Fidelity Central Funds are not included in the Fund's expense ratio. The Fund indirectly bears its proportionate share of the expenses of any underlying Fidelity Central Funds.
G Expense ratios reflect operating expenses of the class. Expenses before reductions do not reflect amounts reimbursed by the investment adviser or reductions from brokerage service arrangements or reductions from other expense offset arrangements and do not represent the amount paid by the class during periods when reimbursements or reductions occur. Expenses net of fee waivers reflect expenses after reimbursement by the investment adviser but prior to reductions from brokerage service arrangements or other expense offset arrangements. Expenses net of all reductions represent the net expenses paid by the class.
H Amount does not include the portfolio activity of any underlying Fidelity Central Funds.
See accompanying notes which are an integral part of the financial statements.
Fidelity International Growth Fund Class I
| Years ended October 31, | 2017 | 2016 | 2015 | 2014 | 2013 |
| Selected Per–Share Data | | | | | |
| Net asset value, beginning of period | $10.95 | $11.36 | $11.08 | $10.84 | $8.94 |
| Income from Investment Operations | | | | | |
| Net investment income (loss)A | .11 | .15B | .11 | .13 | .11 |
| Net realized and unrealized gain (loss) | 2.51 | (.47) | .27 | .18 | 1.90 |
| Total from investment operations | 2.62 | (.32) | .38 | .31 | 2.01 |
| Distributions from net investment income | (.14) | (.08) | (.10) | (.06) | (.10) |
| Distributions from net realized gain | – | (.01) | – | (.01) | (.01) |
| Total distributions | (.14) | (.09) | (.10) | (.07) | (.11) |
| Redemption fees added to paid in capitalA,C | – | – | – | – | – |
| Net asset value, end of period | $13.43 | $10.95 | $11.36 | $11.08 | $10.84 |
| Total ReturnD | 24.23% | (2.87)% | 3.41% | 2.84% | 22.66% |
| Ratios to Average Net AssetsE,F | | | | | |
| Expenses before reductions | .98% | .98% | .98% | 1.04% | 1.11% |
| Expenses net of fee waivers, if any | .98% | .98% | .98% | 1.04% | 1.11% |
| Expenses net of all reductions | .97% | .98% | .97% | 1.04% | 1.09% |
| Net investment income (loss) | .92% | 1.34%B | .94% | 1.14% | 1.13% |
| Supplemental Data | | | | | |
| Net assets, end of period (000 omitted) | $728,227 | $359,676 | $267,745 | $121,554 | $38,771 |
| Portfolio turnover rateG | 22% | 29% | 26% | 27% | 32% |
A Calculated based on average shares outstanding during the period.
B Net Investment income per share reflects a large, non-recurring dividend which amounted to $.04 per share. Excluding this non-recurring dividend, the ratio of net investment income (loss) to average net assets would have been .97%.
C Amount represents less than $.005 per share.
D Total returns would have been lower if certain expenses had not been reduced during the applicable periods shown.
E Fees and expenses of any underlying Fidelity Central Funds are not included in the Fund's expense ratio. The Fund indirectly bears its proportionate share of the expenses of any underlying Fidelity Central Funds.
F Expense ratios reflect operating expenses of the class. Expenses before reductions do not reflect amounts reimbursed by the investment adviser or reductions from brokerage service arrangements or reductions from other expense offset arrangements and do not represent the amount paid by the class during periods when reimbursements or reductions occur. Expenses net of fee waivers reflect expenses after reimbursement by the investment adviser but prior to reductions from brokerage service arrangements or other expense offset arrangements. Expenses net of all reductions represent the net expenses paid by the class.
G Amount does not include the portfolio activity of any underlying Fidelity Central Funds.
See accompanying notes which are an integral part of the financial statements.
Fidelity International Growth Fund Class Z
| Years ended October 31, | 2017 | 2016 | 2015 | 2014 | 2013 A |
| Selected Per–Share Data | | | | | |
| Net asset value, beginning of period | $10.97 | $11.38 | $11.10 | $10.84 | $10.26 |
| Income from Investment Operations | | | | | |
| Net investment income (loss)B | .13 | .16C | .12 | .14 | .02 |
| Net realized and unrealized gain (loss) | 2.50 | (.47) | .27 | .19 | .56 |
| Total from investment operations | 2.63 | (.31) | .39 | .33 | .58 |
| Distributions from net investment income | (.15) | (.09) | (.11) | (.06) | – |
| Distributions from net realized gain | – | (.01) | – | (.01) | – |
| Total distributions | (.15) | (.10) | (.11) | (.07) | – |
| Redemption fees added to paid in capitalB,D | – | – | – | – | – |
| Net asset value, end of period | $13.45 | $10.97 | $11.38 | $11.10 | $10.84 |
| Total ReturnE,F | 24.33% | (2.73)% | 3.52% | 3.07% | 5.65% |
| Ratios to Average Net AssetsG,H | | | | | |
| Expenses before reductions | .84% | .85% | .84% | .88% | .94%I |
| Expenses net of fee waivers, if any | .84% | .85% | .84% | .88% | .94%I |
| Expenses net of all reductions | .84% | .84% | .83% | .88% | .93%I |
| Net investment income (loss) | 1.05% | 1.48%C | 1.07% | 1.30% | .65%I |
| Supplemental Data | | | | | |
| Net assets, end of period (000 omitted) | $373,878 | $16,977 | $897 | $104 | $106 |
| Portfolio turnover rateJ | 22% | 29% | 26% | 27% | 32% |
A For the period August 13, 2013 (commencement of sale of shares) to October 31, 2013.
B Calculated based on average shares outstanding during the period.
C Net Investment income per share reflects a large, non-recurring dividend which amounted to $.04 per share. Excluding this non-recurring dividend, the ratio of net investment income (loss) to average net assets would have been 1.10%.
D Amount represents less than $.005 per share.
E Total returns for periods of less than one year are not annualized.
F Total returns would have been lower if certain expenses had not been reduced during the applicable periods shown.
G Fees and expenses of any underlying Fidelity Central Funds are not included in the Fund's expense ratio. The Fund indirectly bears its proportionate share of the expenses of any underlying Fidelity Central Funds.
H Expense ratios reflect operating expenses of the class. Expenses before reductions do not reflect amounts reimbursed by the investment adviser or reductions from brokerage service arrangements or reductions from other expense offset arrangements and do not represent the amount paid by the class during periods when reimbursements or reductions occur. Expense ratios before reductions for start-up periods may not be representative of longer-term operating periods. Expenses net of fee waivers reflect expenses after reimbursement by the investment adviser but prior to reductions from brokerage service arrangements or other expense offset arrangements. Expenses net of all reductions represent the net expenses paid by the class.
I Annualized
J Amount does not include the portfolio activity of any underlying Fidelity Central Funds.
See accompanying notes which are an integral part of the financial statements.
Notes to Financial Statements
For the period ended October 31, 2017
1. Organization.
Fidelity International Growth Fund (the Fund) is a fund of Fidelity Investment Trust (the Trust) and is authorized to issue an unlimited number of shares. The Trust is registered under the Investment Company Act of 1940, as amended (the 1940 Act), as an open-end management investment company organized as a Massachusetts business trust. The Fund offers Class A, Class M (formerly Class T), Class C, International Growth, Class I and Class Z shares, each of which has equal rights as to assets and voting privileges. Each class has exclusive voting rights with respect to matters that affect that class.
After the close of business on June 24, 2016, all outstanding Class B shares were converted to Class A shares. All prior fiscal period dollar and share amounts for Class B presented in the Notes to Financial Statements are for the period November 1, 2015 through June 24, 2016.
2. Investments in Fidelity Central Funds.
The Fund invests in Fidelity Central Funds, which are open-end investment companies generally available only to other investment companies and accounts managed by the investment adviser and its affiliates. The Fund's Schedule of Investments lists each of the Fidelity Central Funds held as of period end, if any, as an investment of the Fund, but does not include the underlying holdings of each Fidelity Central Fund. As an Investing Fund, the Fund indirectly bears its proportionate share of the expenses of the underlying Fidelity Central Funds.
The Money Market Central Funds seek preservation of capital and current income and are managed by Fidelity Investments Money Management, Inc. (FIMM), an affiliate of the investment adviser. Annualized expenses of the Money Market Central Funds as of their most recent shareholder report date are less than .005%.
A complete unaudited list of holdings for each Fidelity Central Fund is available upon request or at the Securities and Exchange Commission (the SEC) website at www.sec.gov. In addition, the financial statements of the Fidelity Central Funds, which are not covered by the Fund's Report of Independent Registered Public Accounting Firm, are available on the SEC website or upon request.
3. Significant Accounting Policies.
The Fund is an investment company and applies the accounting and reporting guidance of the Financial Accounting Standards Board (FASB) Accounting Standards Codification Topic 946 Financial Services – Investments Companies. The financial statements have been prepared in conformity with accounting principles generally accepted in the United States of America (GAAP), which require management to make certain estimates and assumptions at the date of the financial statements. Actual results could differ from those estimates. Subsequent events, if any, through the date that the financial statements were issued have been evaluated in the preparation of the financial statements. The following summarizes the significant accounting policies of the Fund:
Investment Valuation. Investments are valued as of 4:00 p.m. Eastern time on the last calendar day of the period. The Board of Trustees (the Board) has delegated the day to day responsibility for the valuation of the Fund's investments to the Fair Value Committee (the Committee) established by the Fund's investment adviser. In accordance with valuation policies and procedures approved by the Board, the Fund attempts to obtain prices from one or more third party pricing vendors or brokers to value its investments. When current market prices, quotations or currency exchange rates are not readily available or reliable, investments will be fair valued in good faith by the Committee, in accordance with procedures adopted by the Board. Factors used in determining fair value vary by investment type and may include market or investment specific events. The frequency with which these procedures are used cannot be predicted and they may be utilized to a significant extent. The Committee oversees the Fund's valuation policies and procedures and reports to the Board on the Committee's activities and fair value determinations. The Board monitors the appropriateness of the procedures used in valuing the Fund's investments and ratifies the fair value determinations of the Committee.
The Fund categorizes the inputs to valuation techniques used to value its investments into a disclosure hierarchy consisting of three levels as shown below:
- Level 1 – quoted prices in active markets for identical investments
- Level 2 – other significant observable inputs (including quoted prices for similar investments, interest rates, prepayment speeds, etc.)
- Level 3 – unobservable inputs (including the Fund's own assumptions based on the best information available)
Valuation techniques used to value the Fund's investments by major category are as follows:
Equity securities, including restricted securities, for which market quotations are readily available, are valued at the last reported sale price or official closing price as reported by a third party pricing vendor on the primary market or exchange on which they are traded and are categorized as Level 1 in the hierarchy. In the event there were no sales during the day or closing prices are not available, securities are valued at the last quoted bid price or may be valued using the last available price and are generally categorized as Level 2 in the hierarchy. For foreign equity securities, when market or security specific events arise, comparisons to the valuation of American Depositary Receipts (ADRs), futures contracts, Exchange-Traded Funds (ETFs) and certain indexes as well as quoted prices for similar securities may be used and would be categorized as Level 2 in the hierarchy. Utilizing these techniques may result in transfers between Level 1 and Level 2. For equity securities, including restricted securities, where observable inputs are limited, assumptions about market activity and risk are used and these securities may be categorized as Level 3 in the hierarchy.
Investments in open-end mutual funds, including the Fidelity Central Funds, are valued at their closing net asset value (NAV) each business day and are categorized as Level 1 in the hierarchy.
Changes in valuation techniques may result in transfers in or out of an assigned level within the disclosure hierarchy. The aggregate value of investments by input level as of October 31, 2017, including information on transfers between Levels 1 and 2 is included at the end of the Fund's Schedule of Investments.
Foreign Currency. The Fund may use foreign currency contracts to facilitate transactions in foreign-denominated securities. Gains and losses from these transactions may arise from changes in the value of the foreign currency or if the counterparties do not perform under the contracts' terms.
Foreign-denominated assets, including investment securities, and liabilities are translated into U.S. dollars at the exchange rates at period end. Purchases and sales of investment securities, income and dividends received and expenses denominated in foreign currencies are translated into U.S. dollars at the exchange rate in effect on the transaction date.
The effects of exchange rate fluctuations on investments are included with the net realized and unrealized gain (loss) on investment securities. Other foreign currency transactions resulting in realized and unrealized gain (loss) are disclosed separately.
Investment Transactions and Income. For financial reporting purposes, the Fund's investment holdings and NAV include trades executed through the end of the last business day of the period. The NAV per share for processing shareholder transactions is calculated as of the close of business of the New York Stock Exchange (NYSE), normally 4:00 p.m. Eastern time and includes trades executed through the end of the prior business day. Gains and losses on securities sold are determined on the basis of identified cost and includes proceeds received from litigation. Dividend income is recorded on the ex-dividend date, except for certain dividends from foreign securities where the ex-dividend date may have passed, which are recorded as soon as the Fund is informed of the ex-dividend date. Non-cash dividends included in dividend income, if any, are recorded at the fair market value of the securities received. Income and capital gain distributions from Fidelity Central Funds, if any, are recorded on the ex-dividend date. Certain distributions received by the Fund represent a return of capital or capital gain. The Fund determines the components of these distributions subsequent to the ex-dividend date, based upon receipt of tax filings or other correspondence relating to the underlying investment. These distributions are recorded as a reduction of cost of investments and/or as a realized gain. Investment income is recorded net of foreign taxes withheld where recovery of such taxes is uncertain.
Class Allocations and Expenses. Investment income, realized and unrealized capital gains and losses, common expenses of the Fund, and certain fund-level expense reductions, if any, are allocated daily on a pro-rata basis to each class based on the relative net assets of each class to the total net assets of the Fund. Each class differs with respect to transfer agent and distribution and service plan fees incurred. Certain expense reductions may also differ by class. For the reporting period, the allocated portion of income and expenses to each class as a percent of its average net assets may vary due to the timing of recording these transactions in relation to fluctuating net assets of the classes. Expenses directly attributable to a fund are charged to that fund. Expenses attributable to more than one fund are allocated among the respective funds on the basis of relative net assets or other appropriate methods. Expense estimates are accrued in the period to which they relate and adjustments are made when actual amounts are known.
Income Tax Information and Distributions to Shareholders. Each year, the Fund intends to qualify as a regulated investment company under Subchapter M of the Internal Revenue Code, including distributing substantially all of its taxable income and realized gains. As a result, no provision for U.S. Federal income taxes is required. As of October 31, 2017, the Fund did not have any unrecognized tax benefits in the financial statements; nor is the Fund aware of any tax positions for which it is reasonably possible that the total amounts of unrecognized tax benefits will significantly change in the next twelve months. The Fund files a U.S. federal tax return, in addition to state and local tax returns as required. The Fund's federal income tax returns are subject to examination by the Internal Revenue Service (IRS) for a period of three fiscal years after they are filed. State and local tax returns may be subject to examination for an additional fiscal year depending on the jurisdiction. Foreign taxes are provided for based on the Fund's understanding of the tax rules and rates that exist in the foreign markets in which it invests. The Fund is subject to a tax imposed on capital gains by certain countries in which it invests. An estimated deferred tax liability for net unrealized appreciation on the applicable securities is included in Other payables and accrued expenses on the Statement of Assets & Liabilities.
Distributions are declared and recorded on the ex-dividend date. Income dividends and capital gain distributions are declared separately for each class. Income and capital gain distributions are determined in accordance with income tax regulations, which may differ from GAAP. In addition, the Fund claimed a portion of the payment made to redeeming shareholders as a distribution for income tax purposes.
Capital accounts within the financial statements are adjusted for permanent book-tax differences. These adjustments have no impact on net assets or the results of operations. Capital accounts are not adjusted for temporary book-tax differences which will reverse in a subsequent period.
Book-tax differences are primarily due to foreign currency transactions, certain foreign taxes, passive foreign investment companies (PFIC), capital loss carryforwards and losses deferred due to wash sales.
As of period end, the cost and unrealized appreciation (depreciation) in securities, and derivatives if applicable, for federal income tax purposes were as follows:
| Gross unrealized appreciation | $533,960,602 |
| Gross unrealized depreciation | (25,054,953) |
| Net unrealized appreciation (depreciation) | $508,905,649 |
| Tax Cost | $1,832,977,367 |
The tax-based components of distributable earnings as of period end were as follows:
| Undistributed ordinary income | $15,853,902 |
| Capital loss carryforward | $(86,550,430) |
| Net unrealized appreciation (depreciation) on securities and other investments | $508,856,315 |
Capital loss carryforwards are only available to offset future capital gains of the Fund to the extent provided by regulations and may be limited. Under the Regulated Investment Company Modernization Act of 2010 (the Act), the Fund is permitted to carry forward capital losses incurred in taxable years beginning after December 22, 2010 for an unlimited period and such capital losses are required to be used prior to any losses that expire. The capital loss carryforward information presented below, including any applicable limitation, is estimated as of fiscal period end and is subject to adjustment.
| No expiration | |
| Short-term | $(60,492,711) |
| Long-term | (26,057,719) |
| Total no expiration | $(86,550,430) |
The tax character of distributions paid was as follows:
| | October 31, 2017 | October 31, 2016 |
| Ordinary Income | $18,629,181 | $ 10,375,718 |
Short-Term Trading (Redemption) Fees. Shares held by investors in the Fund less than 30 days may have been subject to a redemption fee equal to 1.00% of the NAV of shares redeemed. All redemption fees, which reduce the proceeds of the shareholder redemption, are retained by the Fund and accounted for as an addition to paid in capital. In November 2016, the Board of Trustees approved the elimination of these redemption fees effective December 12, 2016.
4. Purchases and Sales of Investments.
Purchases and sales of securities, other than short-term securities, aggregated $647,344,576 and $405,685,095, respectively.
5. Fees and Other Transactions with Affiliates.
Management Fee. Fidelity Management & Research Company (the investment adviser) and its affiliates provide the Fund with investment management related services for which the Fund pays a monthly management fee. The management fee is the sum of an individual fund fee rate that is based on an annual rate of .45% of the Fund's average net assets and an annualized group fee rate that averaged .25% during the period. The group fee rate is based upon the average net assets of all the mutual funds advised by the investment adviser, including any mutual funds previously advised by the investment adviser that are currently advised by Fidelity SelectCo, LLC, an affiliate of the investment adviser. The group fee rate decreases as assets under management increase and increases as assets under management decrease. In addition, the management fee is subject to a performance adjustment (up to a maximum of +/- .20% of the Fund's average net assets over a 36 month performance period). The upward or downward adjustment to the management fee is based on the relative investment performance of International Growth as compared to its benchmark index, the MSCI EAFE Growth Index, over the same 36 month performance period. For the reporting period, the total annual management fee rate, including the performance adjustment, was .74% of the Fund's average net assets. The performance adjustment included in the management fee rate may be higher or lower than the maximum performance adjustment rate due to the difference between the average net assets for the reporting and performance periods.
Distribution and Service Plan Fees. In accordance with Rule 12b-1 of the 1940 Act, the Fund has adopted separate Distribution and Service Plans for each class of shares. Certain classes pay Fidelity Distributors Corporation (FDC), an affiliate of the investment adviser, separate Distribution and Service Fees, each of which is based on an annual percentage of each class' average net assets. In addition, FDC may pay financial intermediaries for selling shares of the Fund and providing shareholder support services. For the period, the Distribution and Service Fee rates, total fees and amounts retained by FDC were as follows:
| | Distribution
Fee | Service
Fee | Total Fees | Retained
by FDC |
| Class A | -% | .25% | $429,475 | $– |
| Class M | .25% | .25% | 155,134 | 297 |
| Class C | .75% | .25% | 593,516 | 108,001 |
| | | | $1,178,125 | $108,298 |
Sales Load. FDC may receive a front-end sales charge of up to 5.75% for selling Class A shares and 3.50% for selling Class M shares, some of which is paid to financial intermediaries for selling shares of the Fund. Depending on the holding period, FDC may receive contingent deferred sales charges levied on Class A, Class M and Class C redemptions. The deferred sales charges are 1.00% for Class C shares, 1.00% for certain purchases of Class A shares and .25% for certain purchases of Class M shares.
For the period, sales charge amounts retained by FDC were as follows:
| | Retained
by FDC |
| Class A | $61,423 |
| Class M | 4,669 |
| Class C(a) | 3,805 |
| | $69,897 |
(a) When Class C shares are initially sold, FDC pays commissions from its own resources to financial intermediaries through which the sales are made.
Transfer Agent Fees. Fidelity Investments Institutional Operations Company, Inc., (FIIOC), an affiliate of the investment adviser, is the transfer, dividend disbursing and shareholder servicing agent for each class of the Fund. FIIOC receives account fees and asset-based fees that vary according to the account size and type of account of the shareholders of the respective classes of the Fund, except for Class Z. FIIOC receives an asset-based fee of Class Z's average net assets. FIIOC pays for typesetting, printing and mailing of shareholder reports, except proxy statements.
For the period, transfer agent fees for each class were as follows:
| | Amount | % of
Class-Level Average
Net Assets |
| Class A | $394,534 | .23 |
| Class M | 90,194 | .29 |
| Class C | 147,763 | .25 |
| International Growth | 2,156,207 | .24 |
| Class I | 952,849 | .18 |
| Class Z | 103,401 | .05 |
| | $3,844,948 | |
Accounting and Security Lending Fees. Fidelity Service Company, Inc. (FSC), an affiliate of the investment adviser, maintains the Fund's accounting records. The accounting fee is based on the level of average net assets for each month. Under a separate contract, FSC administers the security lending program. The security lending fee is based on the number and duration of lending transactions.
Brokerage Commissions. The Fund placed a portion of its portfolio transactions with brokerage firms which are affiliates of the investment adviser. Brokerage commissions are included in net realized gain (loss) and change in net unrealized appreciation (depreciation) in the Statement of Operations. The commissions paid to these affiliated firms were $1,404 for the period.
Interfund Lending Program. Pursuant to an Exemptive Order issued by the SEC, the Fund, along with other registered investment companies having management contracts with Fidelity Management & Research Company (FMR) or other affiliated entities of FMR, may participate in an interfund lending program. This program provides an alternative credit facility allowing the funds to borrow from, or lend money to, other participating affiliated funds. At period end, there were no interfund loans outstanding. The Fund's activity in this program during the period for which loans were outstanding was as follows:
| Borrower or Lender | Average Loan Balance | Weighted Average Interest Rate | Interest Expense |
| Borrower | $10,417,333 | 1.09% | $942 |
Interfund Trades. The Fund may purchase from or sell securities to other Fidelity Funds under procedures adopted by the Board. The procedures have been designed to ensure these interfund trades are executed in accordance with Rule 17a-7 of the 1940 Act. Interfund trades are included within the respective purchases and sales amounts shown in the Purchases and Sales of Investments note.
6. Committed Line of Credit.
The Fund participates with other funds managed by the investment adviser or an affiliate in a $4.25 billion credit facility (the "line of credit") to be utilized for temporary or emergency purposes to fund shareholder redemptions or for other short-term liquidity purposes. The Fund has agreed to pay commitment fees on its pro-rata portion of the line of credit, which amounted to $5,966 and is reflected in Miscellaneous expenses on the Statement of Operations. During the period, the Fund did not borrow on this line of credit.
7. Security Lending.
The Fund lends portfolio securities through a lending agent from time to time in order to earn additional income. For equity securities, a lending agent is used and may loan securities to certain qualified borrowers, including Fidelity Capital Markets (FCM), a broker-dealer affiliated with the Fund. On the settlement date of the loan, the Fund receives collateral (in the form of U.S. Treasury obligations, letters of credit and/or cash) against the loaned securities and maintains collateral in an amount not less than 100% of the market value of the loaned securities during the period of the loan. The market value of the loaned securities is determined at the close of business of the Fund and any additional required collateral is delivered to the Fund on the next business day. The Fund or borrower may terminate the loan at any time, and if the borrower defaults on its obligation to return the securities loaned because of insolvency or other reasons, the Fund may apply collateral received from the borrower against the obligation. The Fund may experience delays and costs in recovering the securities loaned. Any cash collateral received is invested in the Fidelity Securities Lending Cash Central Fund. The value of loaned securities and cash collateral at period end are disclosed on the Fund's Statement of Assets and Liabilities. At period end, there were no security loans outstanding with FCM. Security lending income represents the income earned on investing cash collateral, less rebates paid to borrowers and any lending agent fees associated with the loan, plus any premium payments received for lending certain types of securities. Security lending income is presented in the Statement of Operations as a component of income from Fidelity Central Funds. Total security lending income during the period amounted to $310,638, including $1,580 from securities loaned to FCM.
8. Expense Reductions.
Commissions paid to certain brokers with whom the investment adviser, or its affiliates, places trades on behalf of the Fund include an amount in addition to trade execution, which may be rebated back to the Fund to offset certain expenses. This amount totaled $62,744 for the period. Through arrangements with the Fund's custodian credits realized as a result of certain uninvested cash balances were used to reduce the Fund's expenses. During the period, these credits reduced the Fund's custody expenses by $103.
In addition, during the period the investment adviser reimbursed and/or waived a portion of fund-level operating expenses in the amount of $14,459.
9. Distributions to Shareholders.
Distributions to shareholders of each class were as follows:
| | Year ended October 31, 2017 | Year ended October 31, 2016 |
| From net investment income | | |
| Class A | $1,997,030 | $857,372 |
| Class M | 186,824 | 25,900 |
| Class C | 77,926 | – |
| International Growth | 11,653,320 | 6,508,406 |
| Class I | 4,492,180 | 1,913,593 |
| Class Z | 221,901 | 8,317 |
| Total | $18,629,181 | $9,313,588 |
| From net realized gain | | |
| Class A | $– | $137,180 |
| Class M | – | 20,720 |
| Class B | – | 561 |
| Class C | – | 39,156 |
| International Growth | – | 667,539 |
| Class I | – | 196,266 |
| Class Z | – | 708 |
| Total | $– | $1,062,130 |
10. Share Transactions.
Share transactions for each class were as follows and may contain automatic conversions between classes or exchanges between affiliated funds:
| | Shares | Shares | Dollars | Dollars |
| | Year ended October 31, 2017 | Year ended October 31, 2016 | Year ended October 31, 2017 | Year ended October 31, 2016 |
| Class A | | | | |
| Shares sold | 4,137,031 | 9,759,153 | $48,223,768 | $106,168,466 |
| Reinvestment of distributions | 187,295 | 86,347 | 1,972,221 | 970,544 |
| Shares redeemed | (12,953,360) | (5,818,948) | (147,524,032) | (63,754,387) |
| Net increase (decrease) | (8,629,034) | 4,026,552 | $(97,328,043) | $43,384,623 |
| Class M | | | | |
| Shares sold | 634,763 | 648,968 | $7,389,758 | $7,086,728 |
| Reinvestment of distributions | 17,518 | 4,067 | 184,470 | 45,714 |
| Shares redeemed | (705,137) | (635,077) | (8,346,528) | (6,841,439) |
| Net increase (decrease) | (52,856) | 17,958 | $(772,300) | $291,003 |
| Class B | | | | |
| Shares sold | – | 1,881 | $– | $19,626 |
| Reinvestment of distributions | – | 50 | – | 556 |
| Shares redeemed | – | (73,599) | – | (781,848) |
| Net increase (decrease) | – | (71,668) | $– | $(761,666) |
| Class C | | | | |
| Shares sold | 1,572,029 | 1,353,782 | $18,704,209 | $14,583,875 |
| Reinvestment of distributions | 7,327 | 3,485 | 76,279 | 38,678 |
| Shares redeemed | (1,259,133) | (1,125,675) | (14,766,822) | (12,076,750) |
| Net increase (decrease) | 320,223 | 231,592 | $4,013,666 | $2,545,803 |
| International Growth | | | | |
| Shares sold | 28,743,527 | 31,953,739 | $341,195,764 | $351,819,134 |
| Reinvestment of distributions | 929,056 | 515,203 | 9,838,706 | 5,821,794 |
| Shares redeemed | (52,869,764) | (20,188,262) | (601,819,958) | (220,612,157) |
| Net increase (decrease) | (23,197,181) | 12,280,680 | $(250,785,488) | $137,028,771 |
| Class I | | | | |
| Shares sold | 38,959,806 | 22,905,807 | $465,525,076 | $249,584,348 |
| Reinvestment of distributions | 415,087 | 177,277 | 4,387,467 | 1,999,688 |
| Shares redeemed | (17,997,694) | (13,798,950) | (214,014,368) | (151,305,009) |
| Net increase (decrease) | 21,377,199 | 9,284,134 | $255,898,175 | $100,279,027 |
| Class Z | | | | |
| Shares sold | 35,134,319 | 1,706,835 | $405,268,628 | $18,446,844 |
| Reinvestment of distributions | 20,974 | 799 | 221,901 | 9,025 |
| Shares redeemed | (8,913,102) | (238,655) | (105,624,601) | (2,649,876) |
| Net increase (decrease) | 26,242,191 | 1,468,979 | $299,865,928 | $15,805,993 |
11. Other.
The Fund's organizational documents provide former and current trustees and officers with a limited indemnification against liabilities arising in connection with the performance of their duties to the Fund. In the normal course of business, the Fund may also enter into contracts that provide general indemnifications. The Fund's maximum exposure under these arrangements is unknown as this would be dependent on future claims that may be made against the Fund. The risk of material loss from such claims is considered remote.
Report of Independent Registered Public Accounting Firm
To the Trustees of Fidelity Investment Trust and Shareholders of Fidelity International Growth Fund:
In our opinion, the accompanying statement of assets and liabilities, including the schedule of investments, and the related statements of operations and of changes in net assets and the financial highlights present fairly, in all material respects, the financial position of Fidelity International Growth Fund (a fund of Fidelity Investment Trust) as of October 31, 2017, the results of its operations for the year then ended, the changes in its net assets for each of the two years in the period then ended and the financial highlights for each of the periods indicated, in conformity with accounting principles generally accepted in the United States of America. These financial statements and financial highlights (hereafter referred to as “financial statements”) are the responsibility of the Fidelity International Growth Fund’s management. Our responsibility is to express an opinion on these financial statements based on our audits. We conducted our audits of these financial statements in accordance with the standards of the Public Company Accounting Oversight Board (United States). Those standards require that we plan and perform the audit to obtain reasonable assurance about whether the financial statements are free of material misstatement. An audit includes examining, on a test basis, evidence supporting the amounts and disclosures in the financial statements, assessing the accounting principles used and significant estimates made by management, and evaluating the overall financial statement presentation. Our procedures included confirmation of securities owned as of October 31, 2017 by correspondence with the custodian and brokers; when replies were not received from brokers, we performed other auditing procedures. We believe that our audits provide a reasonable basis for our opinion.
PricewaterhouseCoopers LLP
Boston, Massachusetts
December 13, 2017
Trustees and Officers
The Trustees, Members of the Advisory Board (if any), and officers of the trust and fund, as applicable, are listed below. The Board of Trustees governs the fund and is responsible for protecting the interests of shareholders. The Trustees are experienced executives who meet periodically throughout the year to oversee the fund's activities, review contractual arrangements with companies that provide services to the fund, oversee management of the risks associated with such activities and contractual arrangements, and review the fund's performance. Except for Jonathan Chiel, each of the Trustees oversees 190 funds. Mr. Chiel oversees 143 funds.
The Trustees hold office without limit in time except that (a) any Trustee may resign; (b) any Trustee may be removed by written instrument, signed by at least two-thirds of the number of Trustees prior to such removal; (c) any Trustee who requests to be retired or who has become incapacitated by illness or injury may be retired by written instrument signed by a majority of the other Trustees; and (d) any Trustee may be removed at any special meeting of shareholders by a two-thirds vote of the outstanding voting securities of the trust. Each Trustee who is not an interested person (as defined in the 1940 Act) of the trust and the fund is referred to herein as an Independent Trustee. Each Independent Trustee shall retire not later than the last day of the calendar year in which his or her 75th birthday occurs. The Independent Trustees may waive this mandatory retirement age policy with respect to individual Trustees. Officers and Advisory Board Members hold office without limit in time, except that any officer or Advisory Board Member may resign or may be removed by a vote of a majority of the Trustees at any regular meeting or any special meeting of the Trustees. Except as indicated, each individual has held the office shown or other offices in the same company for the past five years.
The fund’s Statement of Additional Information (SAI) includes more information about the Trustees. To request a free copy, call Fidelity at 1-877-208-0098.
Experience, Skills, Attributes, and Qualifications of the Trustees. The Governance and Nominating Committee has adopted a statement of policy that describes the experience, qualifications, attributes, and skills that are necessary and desirable for potential Independent Trustee candidates (Statement of Policy). The Board believes that each Trustee satisfied at the time he or she was initially elected or appointed a Trustee, and continues to satisfy, the standards contemplated by the Statement of Policy. The Governance and Nominating Committee also engages professional search firms to help identify potential Independent Trustee candidates who have the experience, qualifications, attributes, and skills consistent with the Statement of Policy. From time to time, additional criteria based on the composition and skills of the current Independent Trustees, as well as experience or skills that may be appropriate in light of future changes to board composition, business conditions, and regulatory or other developments, have also been considered by the professional search firms and the Governance and Nominating Committee. In addition, the Board takes into account the Trustees' commitment and participation in Board and committee meetings, as well as their leadership of standing and ad hoc committees throughout their tenure.
In determining that a particular Trustee was and continues to be qualified to serve as a Trustee, the Board has considered a variety of criteria, none of which, in isolation, was controlling. The Board believes that, collectively, the Trustees have balanced and diverse experience, qualifications, attributes, and skills, which allow the Board to operate effectively in governing the fund and protecting the interests of shareholders. Information about the specific experience, skills, attributes, and qualifications of each Trustee, which in each case led to the Board's conclusion that the Trustee should serve (or continue to serve) as a trustee of the fund, is provided below.
Board Structure and Oversight Function. James C. Curvey is an interested person and currently serves as Chairman. The Trustees have determined that an interested Chairman is appropriate and benefits shareholders because an interested Chairman has a personal and professional stake in the quality and continuity of services provided to the fund. Independent Trustees exercise their informed business judgment to appoint an individual of their choosing to serve as Chairman, regardless of whether the Trustee happens to be independent or a member of management. The Independent Trustees have determined that they can act independently and effectively without having an Independent Trustee serve as Chairman and that a key structural component for assuring that they are in a position to do so is for the Independent Trustees to constitute a substantial majority for the Board. The Independent Trustees also regularly meet in executive session. Ned C. Lautenbach serves as Chairman of the Independent Trustees and as such (i) acts as a liaison between the Independent Trustees and management with respect to matters important to the Independent Trustees and (ii) with management prepares agendas for Board meetings.
Fidelity® funds are overseen by different Boards of Trustees. The fund's Board oversees Fidelity's high income and certain equity funds, and other Boards oversee Fidelity's investment-grade bond, money market, asset allocation, and sector funds. The asset allocation funds may invest in Fidelity® funds overseen by the fund's Board. The use of separate Boards, each with its own committee structure, allows the Trustees of each group of Fidelity® funds to focus on the unique issues of the funds they oversee, including common research, investment, and operational issues. On occasion, the separate Boards establish joint committees to address issues of overlapping consequences for the Fidelity® funds overseen by each Board.
The Trustees operate using a system of committees to facilitate the timely and efficient consideration of all matters of importance to the Trustees, the fund, and fund shareholders and to facilitate compliance with legal and regulatory requirements and oversight of the fund's activities and associated risks. The Board, acting through its committees, has charged FMR and its affiliates with (i) identifying events or circumstances the occurrence of which could have demonstrably adverse effects on the fund's business and/or reputation; (ii) implementing processes and controls to lessen the possibility that such events or circumstances occur or to mitigate the effects of such events or circumstances if they do occur; and (iii) creating and maintaining a system designed to evaluate continuously business and market conditions in order to facilitate the identification and implementation processes described in (i) and (ii) above. Because the day-to-day operations and activities of the fund are carried out by or through FMR, its affiliates, and other service providers, the fund's exposure to risks is mitigated but not eliminated by the processes overseen by the Trustees. While each of the Board's committees has responsibility for overseeing different aspects of the fund's activities, oversight is exercised primarily through the Operations, Audit, and Compliance Committees. In addition, the Independent Trustees have worked with FMR to enhance the Board's oversight of investment and financial risks, legal and regulatory risks, technology risks, and operational risks, including the development of additional risk reporting to the Board. For example, a working group comprised of Independent Trustees and FMR has worked and continues to work to review the Fidelity® funds' valuation-related activities, reporting and risk management. Appropriate personnel, including but not limited to the fund's Chief Compliance Officer (CCO), FMR's internal auditor, the independent accountants, the fund's Treasurer and portfolio management personnel, make periodic reports to the Board's committees, as appropriate, including an annual review of Fidelity's risk management program for the Fidelity® funds. The responsibilities of each standing committee, including their oversight responsibilities, are described further under "Standing Committees of the Trustees."
Interested Trustees*:
Correspondence intended for a Trustee who is an interested person may be sent to Fidelity Investments, 245 Summer Street, Boston, Massachusetts 02210.
Name, Year of Birth; Principal Occupations and Other Relevant Experience+
Jonathan Chiel (1957)
Year of Election or Appointment: 2016
Trustee
Mr. Chiel also serves as Trustee of other Fidelity® funds. Mr. Chiel is Executive Vice President and General Counsel for FMR LLC (diversified financial services company, 2012-present). Previously, Mr. Chiel served as general counsel (2004-2012) and senior vice president and deputy general counsel (2000-2004) for John Hancock Financial Services; a partner with Choate, Hall & Stewart (1996-2000) (law firm); and an Assistant United States Attorney for the United States Attorney’s Office of the District of Massachusetts (1986-95), including Chief of the Criminal Division (1993-1995). Mr. Chiel is a director on the boards of the Boston Bar Foundation and the Maimonides School.
James C. Curvey (1935)
Year of Election or Appointment: 2007
Trustee
Chairman of the Board of Trustees
Mr. Curvey also serves as Trustee of other Fidelity® funds. Mr. Curvey is a Director of Fidelity Research & Analysis Co. (investment adviser firm, 2009-present), and Vice Chairman (2007-present) and Director of FMR LLC (diversified financial services company). In addition, Mr. Curvey serves as an Overseer for the Boston Symphony Orchestra and a member of the board of Artis-Naples, Naples, Florida, and as a Trustee for Brewster Academy, Wolfeboro, New Hampshire. Previously, Mr. Curvey served as a Director of Fidelity Investments Money Management, Inc. (investment adviser firm, 2009-2014) and a Director of FMR and FMR Co., Inc. (investment adviser firms, 2007-2014).
Charles S. Morrison (1960)
Year of Election or Appointment: 2014
Trustee
Mr. Morrison also serves as Trustee of other funds. He serves as President of Fidelity Management & Research Company (FMR) (investment adviser firm, 2016-present), a Director of Fidelity Investments Money Management, Inc. (FIMM) (investment adviser firm, 2014-present), Director of Fidelity SelectCo, LLC (investment adviser firm, 2014-present), President, Asset Management (2014-present), and is an employee of Fidelity Investments. Previously, Mr. Morrison served as Vice President of Fidelity's Fixed Income and Asset Allocation Funds (2012-2014), President, Fixed Income (2011-2014), Vice President of Fidelity's Money Market Funds (2005-2009), President, Money Market Group Leader of FMR (investment adviser firm, 2009), and Senior Vice President, Money Market Group of FMR (2004-2009). Mr. Morrison also served as Vice President of Fidelity's Bond Funds (2002-2005), certain Balanced Funds (2002-2005), and certain Asset Allocation Funds (2002-2007), and as Senior Vice President (2002-2005) of Fidelity's Bond Division.
* Determined to be an “Interested Trustee” by virtue of, among other things, his or her affiliation with the trust or various entities under common control with FMR.
+ The information includes the Trustee's principal occupation during the last five years and other information relating to the experience, attributes, and skills relevant to the Trustee's qualifications to serve as a Trustee, which led to the conclusion that the Trustee should serve as a Trustee for the fund.
Independent Trustees:
Correspondence intended for an Independent Trustee may be sent to Fidelity Investments, P.O. Box 55235, Boston, Massachusetts 02205-5235.
Name, Year of Birth; Principal Occupations and Other Relevant Experience+
Dennis J. Dirks (1948)
Year of Election or Appointment: 2005
Trustee
Mr. Dirks also serves as Trustee of other Fidelity® funds. Prior to his retirement in May 2003, Mr. Dirks was Chief Operating Officer and a member of the Board of The Depository Trust & Clearing Corporation (DTCC). He also served as President, Chief Operating Officer, and Board member of The Depository Trust Company (DTC) and President and Board member of the National Securities Clearing Corporation (NSCC). In addition, Mr. Dirks served as Chief Executive Officer and Board member of the Government Securities Clearing Corporation, Chief Executive Officer and Board member of the Mortgage-Backed Securities Clearing Corporation, as a Trustee and a member of the Finance Committee of Manhattan College (2005-2008), as a Trustee and a member of the Finance Committee of AHRC of Nassau County (2006-2008), as a member of the Independent Directors Council (IDC) Governing Council (2010-2015), and as a member of the Board of Directors for The Brookville Center for Children’s Services, Inc. (2009-2017). Mr. Dirks is a member of the Finance Committee (2016-present) and Board of Directors (2017-present) of the Asolo Repertory Theatre.
Alan J. Lacy (1953)
Year of Election or Appointment: 2008
Trustee
Mr. Lacy also serves as Trustee of other Fidelity® funds. Mr. Lacy serves as a Director of Bristol-Myers Squibb Company (global pharmaceuticals, 2008-present). He is a Trustee of the California Chapter of The Nature Conservancy (2015-present) and a Director of the Center for Advanced Study in the Behavioral Sciences at Stanford University (2015-present). In addition, Mr. Lacy served as Senior Adviser (2007-2014) of Oak Hill Capital Partners, L.P. (private equity) and also served as Chief Executive Officer (2005) and Vice Chairman (2005-2006) of Sears Holdings Corporation (retail) and Chief Executive Officer and Chairman of the Board of Sears, Roebuck and Co. (retail, 2000-2005). Previously, Mr. Lacy served as Chairman (2014-2017) and a member (2010-2017) of the Board of Directors of Dave & Buster’s Entertainment, Inc. (restaurant and entertainment complexes), as Chairman (2008-2011) and a member (2006-2015) of the Board of Trustees of the National Parks Conservation Association, and as a member of the Board of Directors for The Hillman Companies, Inc. (hardware wholesalers, 2010-2014), Earth Fare, Inc. (retail grocery, 2010-2014), and The Western Union Company (global money transfer, 2006-2011).
Ned C. Lautenbach (1944)
Year of Election or Appointment: 2000
Trustee
Chairman of the Independent Trustees
Mr. Lautenbach also serves as Trustee of other Fidelity® funds. Mr. Lautenbach currently serves as Vice Chair of the Board of Governors, State University System of Florida (2013-present) and is a member of the Council on Foreign Relations (1994-present). He is also a member and has most recently served as Chairman of the Board of Directors of Artis-Naples (2012-present). Previously, Mr. Lautenbach served as a member and then Lead Director of the Board of Directors of Eaton Corporation (diversified industrial, 1997-2016). He was also a Partner and Advisory Partner at Clayton, Dubilier & Rice, LLC (private equity investment, 1998-2010), as well as a Director of Sony Corporation (2006-2007). In addition, Mr. Lautenbach also had a 30-year career with IBM (technology company) during which time he served as Senior Vice President and a member of the Corporate Executive Committee (1968-1998).
Joseph Mauriello (1944)
Year of Election or Appointment: 2008
Trustee
Mr. Mauriello also serves as Trustee of other Fidelity® funds. Prior to his retirement in January 2006, Mr. Mauriello served in numerous senior management positions including Deputy Chairman and Chief Operating Officer (2004-2005), and Vice Chairman of Financial Services (2002-2004) of KPMG LLP US (professional services, 1965-2005). Mr. Mauriello currently serves as a member of the Board of Directors of XL Group plc. (global insurance and re-insurance, 2006-present) and the Independent Directors Council (IDC) Governing Council (2015-present). Previously, Mr. Mauriello served as a Director of the Hamilton Funds of the Bank of New York (2006-2007) and of Arcadia Resources Inc. (health care services and products, 2007-2012).
Cornelia M. Small (1944)
Year of Election or Appointment: 2005
Trustee
Ms. Small also serves as Trustee of other Fidelity® funds. Ms. Small is a member of the Board of Directors (2009-present) and Chair of the Investment Committee (2010-present) of the Teagle Foundation. Ms. Small also serves on the Investment Committee of the Berkshire Taconic Community Foundation (2008-present). Previously, Ms. Small served as Chairperson (2002-2008) and a member of the Investment Committee and Chairperson (2008-2012) and a member of the Board of Trustees of Smith College. In addition, Ms. Small served as Chief Investment Officer, Director of Global Equity Investments, and a member of the Board of Directors of Scudder, Stevens & Clark and Scudder Kemper Investments.
William S. Stavropoulos (1939)
Year of Election or Appointment: 2001
Trustee
Vice Chairman of the Independent Trustees
Mr. Stavropoulos also serves as Trustee of other Fidelity® funds. Mr. Stavropoulos serves as President and Founder of the Michigan Baseball Foundation, the Great Lakes Loons (2007-present). Mr. Stavropoulos is Chairman Emeritus of the Board of Directors of The Dow Chemical Company, where he previously served in numerous senior management positions, including President, CEO (1995-2000; 2002-2004), Chairman of the Executive Committee (2000-2006), and as a member of the Board of Directors (1990-2006). Currently, Mr. Stavropoulos is Chairman of the Board of Directors of Univar Inc. (global distributor of commodity and specialty chemicals), a Director of Teradata Corporation (data warehousing and technology solutions), and a member of the Advisory Board for Metalmark Capital LLC (private equity investment, 2005-present). Mr. Stavropoulos is an operating advisor to Clayton, Dubilier & Rice, LLC (private equity investment). In addition, Mr. Stavropoulos is a member of the University of Notre Dame Advisory Council for the College of Science, a Trustee of the Rollin L. Gerstacker Foundation, and a Director of Artis-Naples in Naples, Florida. Previously, Mr. Stavropoulos served as a Director of Chemical Financial Corporation (bank holding company, 1993-2012) and Tyco International, Ltd. (multinational manufacturing and services, 2007-2012).
David M. Thomas (1949)
Year of Election or Appointment: 2008
Trustee
Mr. Thomas also serves as Trustee of other Fidelity® funds. Mr. Thomas serves as Non-Executive Chairman of the Board of Directors of Fortune Brands Home and Security (home and security products, 2011-present), as a member of the Board of Directors (2004-present) and Presiding Director (2013-present) of Interpublic Group of Companies, Inc. (marketing communication), and as a member of the Board of Trustees of the University of Florida (2013-present). Previously, Mr. Thomas served as Executive Chairman (2005-2006) and Chairman and Chief Executive Officer (2000-2005) of IMS Health, Inc. (pharmaceutical and healthcare information solutions), and a Director of Fortune Brands, Inc. (consumer products, 2000-2011).
+ The information includes the Trustee's principal occupation during the last five years and other information relating to the experience, attributes, and skills relevant to the Trustee's qualifications to serve as a Trustee, which led to the conclusion that the Trustee should serve as a Trustee for the fund.
Advisory Board Members and Officers:
Correspondence intended for an officer or Peter S. Lynch may be sent to Fidelity Investments, 245 Summer Street, Boston, Massachusetts 02210. Officers appear below in alphabetical order.
Name, Year of Birth; Principal Occupation
Peter S. Lynch (1944)
Year of Election or Appointment: 2003
Member of the Advisory Board
Mr. Lynch also serves as Member of the Advisory Board of other Fidelity® funds. Mr. Lynch is Vice Chairman and a Director of FMR (investment adviser firm) and FMR Co., Inc. (investment adviser firm). In addition, Mr. Lynch serves as a Trustee of Boston College and as the Chairman of the Inner-City Scholarship Fund. Previously, Mr. Lynch served on the Special Olympics International Board of Directors (1997-2006).
Elizabeth Paige Baumann (1968)
Year of Election or Appointment: 2017
Anti-Money Laundering (AML) Officer
Ms. Baumann also serves as AML Officer of other funds. She is Chief AML Officer (2012-present) and Senior Vice President (2014-present) of FMR LLC (diversified financial services company) and is an employee of Fidelity Investments. Previously, Ms. Baumann served as AML Officer of the funds (2012-2016), and Vice President (2007-2014) and Deputy Anti-Money Laundering Officer (2007-2012) of FMR LLC.
Marc R. Bryant (1966)
Year of Election or Appointment: 2015
Secretary and Chief Legal Officer (CLO)
Mr. Bryant also serves as Secretary and CLO of other funds. Mr. Bryant serves as CLO, Secretary, and Senior Vice President of Fidelity Management & Research Company (investment adviser firm, 2015-present) and FMR Co., Inc. (investment adviser firm, 2015-present); Secretary of Fidelity SelectCo, LLC (investment adviser firm, 2015-present) and Fidelity Investments Money Management, Inc. (investment adviser firm, 2015-present); and CLO of Fidelity Management & Research (Hong Kong) Limited and FMR Investment Management (UK) Limited (investment adviser firms, 2015-present) and Fidelity Management & Research (Japan) Limited (investment adviser firm, 2016-present). He is Senior Vice President and Deputy General Counsel of FMR LLC (diversified financial services company). Previously, Mr. Bryant served as Secretary and CLO of Fidelity Rutland Square Trust II (2010-2014) and Assistant Secretary of Fidelity's Fixed Income and Asset Allocation Funds (2013-2015). Prior to joining Fidelity Investments, Mr. Bryant served as a Senior Vice President and the Head of Global Retail Legal for AllianceBernstein L.P. (2006-2010), and as the General Counsel for ProFund Advisors LLC (2001-2006).
William C. Coffey (1969)
Year of Election or Appointment: 2009
Assistant Secretary
Mr. Coffey also serves as Assistant Secretary of other funds. He is Senior Vice President and Deputy General Counsel of FMR LLC (diversified financial services company, 2010-present), and is an employee of Fidelity Investments. Previously, Mr. Coffey served as Vice President and Associate General Counsel of FMR LLC (2005-2009).
Jonathan Davis (1968)
Year of Election or Appointment: 2010
Assistant Treasurer
Mr. Davis also serves as Assistant Treasurer of other funds, and is an employee of Fidelity Investments. Previously, Mr. Davis served as Vice President and Associate General Counsel of FMR LLC (diversified financial services company, 2003-2010).
Adrien E. Deberghes (1967)
Year of Election or Appointment: 2016
Assistant Treasurer
Mr. Deberghes also serves as an officer of other funds. He serves as Executive Vice President of Fidelity Investments Money Management, Inc. (FIMM) (investment adviser firm, 2016-present) and is an employee of Fidelity Investments (2008-present). Prior to joining Fidelity Investments, Mr. Deberghes was Senior Vice President of Mutual Fund Administration at State Street Corporation (2007-2008), Senior Director of Mutual Fund Administration at Investors Bank & Trust (2005-2007), and Director of Finance for Dunkin' Brands (2000-2005). Previously, Mr. Deberghes served in other fund officer roles.
Joseph DeSantis (1959)
Year of Election or Appointment: 2017
Vice President
Mr. DeSantis also serves as Vice President of other funds. Mr. DeSantis serves as a Director of Fidelity Management & Research (Japan) Limited (investment adviser firm, 2016-present), Chief Investment Officer, Equities (2010-present) and is an employee of Fidelity Investments.
Stephanie J. Dorsey (1969)
Year of Election or Appointment: 2010
Assistant Treasurer
Ms. Dorsey also serves as an officer of other funds. She is an employee of Fidelity Investments (2008-present) and has served in other fund officer roles. Prior to joining Fidelity Investments, Ms. Dorsey served as Treasurer (2004-2008) of the JPMorgan Mutual Funds and Vice President (2004-2008) of JPMorgan Chase Bank.
Howard J. Galligan III (1966)
Year of Election or Appointment: 2014
Chief Financial Officer
Mr. Galligan also serves as Chief Financial Officer of other funds. Mr. Galligan serves as President of Fidelity Pricing and Cash Management Services (FPCMS) (2014-present) and as a Director of Strategic Advisers, Inc. (investment adviser firm, 2008-present). Previously, Mr. Galligan served as Chief Administrative Officer of Asset Management (2011-2014) and Chief Operating Officer and Senior Vice President of Investment Support for Strategic Advisers, Inc. (2003-2011).
Brian B. Hogan (1964)
Year of Election or Appointment: 2009
Vice President
Mr. Hogan also serves as Trustee or Vice President of other funds. Mr. Hogan serves as a Director of FMR Investment Management (UK) Limited (investment adviser firm, 2015-present) and Fidelity SelectCo, LLC (investment adviser firm, 2014-present) and President of the Equity Division of FMR (investment adviser firm, 2009-present). Previously, Mr. Hogan served as Senior Vice President, Equity Research of FMR (2006-2009) and as a portfolio manager. Mr. Brian B. Hogan is not related to Mr. Colm A. Hogan.
Colm A. Hogan (1973)
Year of Election or Appointment: 2016
Deputy Treasurer
Mr. Hogan also serves as an officer of other funds. Mr. Hogan is an employee of Fidelity Investments (2005-present). Mr. Colm A. Hogan is not related to Mr. Brian B. Hogan.
Chris Maher (1972)
Year of Election or Appointment: 2013
Assistant Treasurer
Mr. Maher serves as Assistant Treasurer of other funds. Mr. Maher is Vice President of Valuation Oversight and is an employee of Fidelity Investments. Previously, Mr. Maher served as Vice President of Asset Management Compliance (2013), Vice President of the Program Management Group of FMR (investment adviser firm, 2010-2013), and Vice President of Valuation Oversight (2008-2010).
Rieco E. Mello (1969)
Year of Election or Appointment: 2017
Assistant Treasurer
Mr. Mello also serves as Assistant Treasurer of other funds. Mr. Mello is an employee of Fidelity Investments (1995-present).
Kenneth B. Robins (1969)
Year of Election or Appointment: 2016
Chief Compliance Officer
Mr. Robins also serves as an officer of other funds. Mr. Robins serves as Compliance Officer of Fidelity Management & Research Company and FMR Co., Inc. (investment adviser firms, 2016-present) and is an employee of Fidelity Investments (2004-present). Previously, Mr. Robins served as Executive Vice President of Fidelity Investments Money Management, Inc. (investment adviser firm, 2013-2016) and served in other fund officer roles.
Stacie M. Smith (1974)
Year of Election or Appointment: 2016
President and Treasurer
Ms. Smith also serves as an officer of other funds. She is an employee of Fidelity Investments (2009-present) and has served in other fund officer roles. Prior to joining Fidelity Investments, Ms. Smith served as Senior Audit Manager of Ernst & Young LLP (accounting firm, 1996-2009). Previously, Ms. Smith served as Deputy Treasurer of certain Fidelity® funds (2013-2016).
Marc L. Spector (1972)
Year of Election or Appointment: 2016
Assistant Treasurer
Mr. Spector also serves as an officer of other funds. Mr. Spector is an employee of Fidelity Investments (2016-present). Prior to joining Fidelity Investments, Mr. Spector served as Director at the Siegfried Group (accounting firm, 2013-2016), and prior to Siegfried Group as audit senior manager at Deloitte & Touche (accounting firm, 2005-2013).
Renee Stagnone (1975)
Year of Election or Appointment: 2016
Assistant Treasurer
Ms. Stagnone also serves as an officer of other funds. Ms. Stagnone is an employee of Fidelity Investments (1997-present). Previously, Ms. Stagnone served as Deputy Treasurer of certain Fidelity® funds (2013-2016).
Shareholder Expense Example
As a shareholder of the Fund, you incur two types of costs: (1) transaction costs, including sales charges (loads) on purchase payments or redemption proceeds, redemption fees and (2) ongoing costs, including management fees, distribution and/or service (12b-1) fees and other Fund expenses. This Example is intended to help you understand your ongoing costs (in dollars) of investing in the Fund and to compare these costs with the ongoing costs of investing in other mutual funds.
The Example is based on an investment of $1,000 invested at the beginning of the period and held for the entire period (May 1, 2017 to October 31, 2017).
Actual Expenses
The first line of the accompanying table for each class of the Fund provides information about actual account values and actual expenses. You may use the information in this line, together with the amount you invested, to estimate the expenses that you paid over the period. Simply divide your account value by $1,000.00 (for example, an $8,600 account value divided by $1,000.00 = 8.6), then multiply the result by the number in the first line for a class of the Fund under the heading entitled "Expenses Paid During Period" to estimate the expenses you paid on your account during this period. A small balance maintenance fee of $12.00 that is charged once a year may apply for certain accounts with a value of less than $2,000. This fee is not included in the table below. If it was, the estimate of expenses you paid during the period would be higher, and your ending account value lower, by this amount. In addition, the Fund, as a shareholder in the underlying Fidelity Central Funds, will indirectly bear its pro-rata share of the fees and expenses incurred by the underlying Fidelity Central Funds. These fees and expenses are not included in the Fund's annualized expense ratio used to calculate the expense estimate in the table below.
Hypothetical Example for Comparison Purposes
The second line of the accompanying table for each class of the Fund provides information about hypothetical account values and hypothetical expenses based on a Class' actual expense ratio and an assumed rate of return of 5% per year before expenses, which is not the Class' actual return. The hypothetical account values and expenses may not be used to estimate the actual ending account balance or expenses you paid for the period. You may use this information to compare the ongoing costs of investing in the Fund and other funds. To do so, compare this 5% hypothetical example with the 5% hypothetical examples that appear in the shareholder reports of the other funds. A small balance maintenance fee of $12.00 that is charged once a year may apply for certain accounts with a value of less than $2,000. This fee is not included in the table below. If it was, the estimate of expenses you paid during the period would be higher, and your ending account value lower, by this amount. In addition, the Fund, as a shareholder in the underlying Fidelity Central Funds, will indirectly bear its pro-rata share of the fees and expenses incurred by the underlying Fidelity Central Funds. These fees and expenses are not included in the Fund's annualized expense ratio used to calculate the expense estimate in the table below.
Please note that the expenses shown in the table are meant to highlight your ongoing costs only and do not reflect any transaction costs. Therefore, the second line of the table is useful in comparing ongoing costs only, and will not help you determine the relative total costs of owning different funds. In addition, if these transactional costs were included, your costs would have been higher.
| | Annualized Expense Ratio-A | Beginning
Account Value
May 1, 2017 | Ending
Account Value
October 31, 2017 | Expenses Paid
During Period-B
May 1, 2017
to October 31, 2017 |
| Class A | 1.26% | | | |
| Actual | | $1,000.00 | $1,106.10 | $6.69 |
| Hypothetical-C | | $1,000.00 | $1,018.85 | $6.41 |
| Class M | 1.57% | | | |
| Actual | | $1,000.00 | $1,104.70 | $8.33 |
| Hypothetical-C | | $1,000.00 | $1,017.29 | $7.98 |
| Class C | 2.03% | | | |
| Actual | | $1,000.00 | $1,102.70 | $10.76 |
| Hypothetical-C | | $1,000.00 | $1,014.97 | $10.31 |
| International Growth | 1.02% | | | |
| Actual | | $1,000.00 | $1,107.90 | $5.42 |
| Hypothetical-C | | $1,000.00 | $1,020.06 | $5.19 |
| Class I | .98% | | | |
| Actual | | $1,000.00 | $1,108.10 | $5.21 |
| Hypothetical-C | | $1,000.00 | $1,020.27 | $4.99 |
| Class Z | .85% | | | |
| Actual | | $1,000.00 | $1,108.80 | $4.52 |
| Hypothetical-C | | $1,000.00 | $1,020.92 | $4.33 |
A Annualized expense ratio reflects expenses net of applicable fee waivers.
B Expenses are equal to each Class' annualized expense ratio, multiplied by the average account value over the period, multiplied by 184/365 (to reflect the one-half year period).
C 5% return per year before expenses
Distributions (Unaudited)
The Board of Trustees of Fidelity International Growth Fund voted to pay to shareholders of record at the opening of business on record date, the following distributions per share derived from capital gains realized from sales of portfolio securities, and dividends derived from net investment income:
| | Pay Date | Record Date | Dividends | Capital Gains |
| Fidelity International Growth Fund | | | | |
| Class A | 12/11/17 | 12/08/17 | $0.040 | $0.015 |
| Class M | 12/11/17 | 12/08/17 | $0.003 | $0.015 |
| Class C | 12/11/17 | 12/08/17 | $0.000 | $0.000 |
| International Growth | 12/11/17 | 12/08/17 | $0.077 | $0.015 |
| Class I | 12/11/17 | 12/08/17 | $0.087 | $0.015 |
| Class Z | 12/11/17 | 12/08/17 | $0.102 | $0.015 |
|
Class A designates 19%; Class M designates 26%; Class C designates 66%; International Growth designates 15%; Class I designates 15%; and Class Z designates 13% of the dividends distributed in December 2016 as qualifying for the dividends–received deduction for corporate shareholders.
Class A, Class M, Class C, International Growth, Class I, and Class Z designate 100% of the dividends distributed in December 2016 as amounts which may be taken into account as a dividend for purposes of the maximum rate under section 1(h)(11) of the Internal Revenue Code.
The amounts per share which represent income derived from sources within, and taxes paid to, foreign countries or possessions of the United States are as follows:
| | Pay Date | Income | Taxes |
| Fidelity International Growth Fund | | | |
| Class A | 12/12/16 | $0.1202 | $0.0182 |
| Class M | 12/12/16 | $0.0882 | $0.0182 |
| Class C | 12/12/16 | $0.0342 | $0.0182 |
| International Growth | 12/12/16 | $0.1502 | $0.0182 |
| Class I | 12/12/16 | $0.1542 | $0.0182 |
| Class Z | 12/12/16 | $0.1672 | $0.0182 |
|
The fund will notify shareholders in January 2018 of amounts for use in preparing 2017 income tax returns.
Board Approval of Investment Advisory Contracts and Management Fees
Fidelity International Growth Fund
Each year, the Board of Trustees, including the Independent Trustees (together, the Board), votes on the renewal of the management contract with Fidelity Management & Research Company (FMR) and the sub-advisory agreements (together, the Advisory Contracts) for the fund. FMR and the sub-advisers are referred to herein as the Investment Advisers. The Board, assisted by the advice of fund counsel and Independent Trustees' counsel, requests and considers a broad range of information relevant to the renewal of the Advisory Contracts throughout the year.
The Board meets regularly and, at each of its meetings, covers an extensive agenda of topics and materials and considers factors that are relevant to its annual consideration of the renewal of the fund's Advisory Contracts, including the services and support provided to the fund and its shareholders. The Board has established various standing committees (Committees), each composed of and chaired by Independent Trustees with varying backgrounds, to which the Board has assigned specific subject matter responsibilities in order to enhance effective decision-making by the Board. The Board, acting directly and through its Committees, requests and receives information concerning the annual consideration of the renewal of the fund's Advisory Contracts. The Board also meets as needed to review matters specifically related to the Board's annual consideration of the renewal of the Advisory Contracts. Members of the Board may also meet with trustees of other Fidelity funds through ad hoc joint committees to discuss certain matters relevant to all of the Fidelity funds.
At its July 2017 meeting, the Board unanimously determined to renew the fund's Advisory Contracts. In reaching its determination, the Board considered all factors it believed relevant, including (i) the nature, extent, and quality of the services to be provided to the fund and its shareholders (including the investment performance of the fund); (ii) the competitiveness of the fund's management fee and total expense ratio relative to peer funds; (iii) the total costs of the services to be provided by and the profits to be realized by Fidelity from its relationships with the fund; and (iv) the extent to which, if any, economies of scale exist and would be realized as the fund grows, and whether any economies of scale are appropriately shared with fund shareholders.
In considering whether to renew the Advisory Contracts for the fund, the Board reached a determination, with the assistance of fund counsel and Independent Trustees' counsel and through the exercise of its business judgment, that the renewal of the Advisory Contracts was in the best interests of the fund and its shareholders and that the compensation payable under the Advisory Contracts was fair and reasonable. The Board's decision to renew the Advisory Contracts was not based on any single factor, but rather was based on a comprehensive consideration of all the information provided to the Board at its meetings throughout the year. The Board, in reaching its determination to renew the Advisory Contracts, was aware that shareholders of the fund have a broad range of investment choices available to them, including a wide choice among funds offered by Fidelity's competitors, and that the fund's shareholders, who have the opportunity to review and weigh the disclosure provided by the fund in its prospectus and other public disclosures, have chosen to invest in this fund, which is part of the Fidelity family of funds.
Amendment to Group Fee Rate. The Board also approved an amendment to the management contract for the fund to add an additional breakpoint to the group fee schedule, effective October 1, 2017. The Board noted that the additional breakpoint would result in lower management fee rates as Fidelity's assets under management increase.
Nature, Extent, and Quality of Services Provided. The Board considered Fidelity's staffing as it relates to the fund, including the backgrounds of investment personnel of Fidelity, and also considered the fund's investment objective, strategies, and related investment philosophy. The Independent Trustees also had discussions with senior management of Fidelity's investment operations and investment groups. The Board considered the structure of the investment personnel compensation program and whether this structure provides appropriate incentives to act in the best interests of the fund. Additionally, the Board considered the portfolio managers' investments, if any, in the funds that they manage.
Resources Dedicated to Investment Management and Support Services. The Board and the Fund Oversight and Research Committees reviewed the general qualifications and capabilities of Fidelity's investment staff, including its size, education, experience, and resources, as well as Fidelity's approach to recruiting, training, managing, and compensating investment personnel. The Board noted that Fidelity has continued to increase the resources devoted to non-U.S. offices, including expansion of Fidelity's global investment organization. The Board also noted that Fidelity's analysts have extensive resources, tools and capabilities that allow them to conduct sophisticated quantitative and fundamental analysis, as well as credit analysis of issuers, counterparties and guarantors. Further, the Board considered that Fidelity's investment professionals have sufficient access to global information and data so as to provide competitive investment results over time, and that those professionals also have access to sophisticated tools that permit them to assess portfolio construction and risk and performance attribution characteristics continuously, as well as to transmit new information and research conclusions rapidly around the world. Additionally, in its deliberations, the Board considered Fidelity's trading, risk management, compliance, and technology and operations capabilities and resources, which are integral parts of the investment management process.
Shareholder and Administrative Services. The Board considered (i) the nature, extent, quality, and cost of advisory, administrative, and shareholder services performed by the Investment Advisers and their affiliates under the Advisory Contracts and under separate agreements covering transfer agency, pricing and bookkeeping, and securities lending services for the fund; (ii) the nature and extent of the supervision of third party service providers, principally custodians, subcustodians, and pricing vendors; and (iii) the resources devoted to, and the record of compliance with, the fund's compliance policies and procedures. The Board also reviewed the allocation of fund brokerage, including allocations to brokers affiliated with the Investment Advisers, the use of brokerage commissions to pay fund expenses, and the use of "soft" commission dollars to pay for research services.
The Board noted that the growth of fund assets over time across the complex allows Fidelity to reinvest in the development of services designed to enhance the value or convenience of the Fidelity funds as investment vehicles. These services include 24-hour access to account information and market information through telephone representatives and over the Internet, investor education materials and asset allocation tools, and the expanded availability of Fidelity Investor Centers.
In 2014, the Board formed an ad hoc Committee on Transfer Agency Fees to review the variety of transfer agency fee structures throughout the industry and Fidelity's competitive positioning with respect to industry participants.
Investment in a Large Fund Family. The Board considered the benefits to shareholders of investing in a Fidelity fund, including the benefits of investing in a fund that is part of a large family of funds offering a variety of investment disciplines and providing a large variety of mutual fund investor services. The Board noted that Fidelity had taken, or had made recommendations that resulted in the Fidelity funds taking, a number of actions over the previous year that benefited particular funds, including: (i) continuing to dedicate additional resources to Fidelity's investment research process, and to the support of the senior management team that oversees asset management; (ii) continuing efforts to enhance Fidelity's global research capabilities; (iii) launching new funds and making other enhancements to meet client needs; (iv) launching new share classes of existing funds; (v) eliminating purchase minimums and broadening eligibility requirements for certain lower-priced share classes; (vi) reducing management fees and total expenses for certain growth equity funds and index funds; (vii) lowering expense caps for certain existing funds and classes to reduce expenses borne by shareholders; (viii) eliminating short-term redemption fees for certain funds; (ix) introducing a new pricing structure for certain funds of funds that is expected to reduce overall expenses paid by shareholders; (x) rationalizing product lines and gaining increased efficiencies through proposals for fund mergers and share class consolidations; (xi) continuing to develop, acquire and implement systems and technology to improve services to the funds and shareholders, strengthen information security, and increase efficiency; and (xii) implementing enhancements to further strengthen Fidelity's product line to increase investors' probability of success in achieving their investment goals, including retirement income goals.
Investment Performance. The Board considered whether the fund has operated in accordance with its investment objective, as well as its record of compliance with its investment restrictions and its performance history.
The Board took into account discussions with representatives of the Investment Advisers about fund investment performance that occur at Board meetings throughout the year. In this regard the Board noted that as part of regularly scheduled fund reviews and other reports to the Board on fund performance, the Board considers annualized return information for the fund for different time periods, measured against a securities market index ("benchmark index") and a peer group of funds with similar objectives ("peer group"), if any. In its evaluation of fund investment performance, the Board gave particular attention to information indicating changes in performance of certain Fidelity funds for specific time periods and discussed with the Investment Advisers the reasons for any overperformance or underperformance.
In addition to reviewing absolute and relative fund performance, the Independent Trustees periodically consider the appropriateness of fund performance metrics in evaluating the results achieved. In general, the Independent Trustees believe that fund performance should be evaluated based on net performance (after fees and expenses) of both the highest performing and lowest performing fund share classes, where applicable, compared to appropriate benchmark indices, over appropriate time periods that may include full market cycles, and compared to peer groups, as applicable, over the same periods, taking into account relevant factors including the following: general market conditions; issuer-specific information; and fund cash flows and other factors.
The Independent Trustees recognize that shareholders evaluate performance on a net basis over their own holding periods, for which one-, three-, and five-year periods are often used as a proxy. For this reason, the performance information reviewed by the Board also included net cumulative calendar year total return information for the fund and an appropriate benchmark index and peer group for the most recent one-, three-, and five-year periods, as shown below. Returns are shown compared to the 25th percentile (top of box, 75% beaten) and 75th percentile (bottom of box, 25% beaten) of the peer universe. Returns of the benchmark index are "net MA,"
i.e., adjusted for tax withholding rates applicable to U.S.-based funds organized as Massachusetts business trusts.
Fidelity International Growth Fund
The Board also considered that the fund's management fee is subject to upward or downward adjustment depending upon whether, and to what extent, the fund's investment performance for the performance period (a rolling 36-month period) exceeds, or is exceeded by, a securities index, thus leading to a performance adjustment for the same period. The Board noted that the performance adjustment provides FMR with a strong economic incentive to seek to achieve superior long-term performance for the fund's shareholders and helps to more closely align the interests of FMR and the shareholders of the fund.
Based on its review, the Board concluded that the nature, extent, and quality of services provided to the fund under the Advisory Contracts should continue to benefit the shareholders of the fund.
Competitiveness of Management Fee and Total Expense Ratio. The Board considered the fund's management fee and total expense ratio compared to "mapped groups" of competitive funds and classes created for the purpose of facilitating the Trustees' competitive analysis of management fees and total expenses. Fidelity creates "mapped groups" by combining similar Lipper investment objective categories that have comparable investment mandates. Combining Lipper investment objective categories aids the Board's management fee and total expense ratio comparisons by broadening the competitive group used for comparison.
Management Fee. The Board considered two proprietary management fee comparisons for the 12-month periods shown in basis points (BP) in the chart below. The group of Lipper funds used by the Board for management fee comparisons is referred to below as the "Total Mapped Group." The Total Mapped Group comparison focuses on a fund's standing in terms of gross management fees before expense reimbursements or caps, and without giving effect to the fund's performance adjustment, relative to the total universe of funds with comparable investment mandates, regardless of whether their management fee structures also are comparable. Funds with comparable investment mandates offer exposure to similar types of securities. Funds with comparable management fee structures have similar management fee contractual arrangements (
e.g., flat rate charged for advisory services, all-inclusive fee rate,
etc.). "TMG %" represents the percentage of funds in the Total Mapped Group that had management fees that were lower than the fund's. For example, a hypothetical TMG % of 20% would mean that 80% of the funds in the Total Mapped Group had higher, and 20% had lower, management fees than the fund. The fund's actual TMG %s and the number of funds in the Total Mapped Group are in the chart below. The "Asset-Size Peer Group" (ASPG) comparison focuses on a fund's standing relative to a subset of non-Fidelity funds within the Total Mapped Group that are similar in size and management fee structure without taking into account performance adjustments, if any. For example, if a fund is in the first quartile of the ASPG, the fund's management fee ranks in the least expensive or lowest 25% of funds in the ASPG. The ASPG represents at least 15% of the funds in the Total Mapped Group with comparable asset size and management fee structures, subject to a minimum of 50 funds (or all funds in the Total Mapped Group if fewer than 50). Additional information, such as the ASPG quartile in which the fund's management fee rate ranked and the impact of the fund's performance adjustment, is also included in the chart and considered by the Board.
Fidelity International Growth Fund
The Board noted that the fund's management fee rate ranked below the median of its Total Mapped Group and below the median of its ASPG for 2016. The Board also noted the effect of the fund's performance adjustment, if any, on the fund's management fee ranking.
The Board noted that, in 2014, the Board and the boards of other Fidelity funds formed the ad hoc Committee on Group Fee to conduct an in-depth review of the "group fee" component of the management fee of funds with such management fee structures. The Committee's focus included the mechanics of the group fee, the competitive landscape of group fee structures, Fidelity funds with no group fee component and investment products not included in group fee assets. The Board also considered that, for funds subject to the group fee, FMR agreed to voluntarily waive fees over a specified period of time in amounts designed to account for assets converted from certain funds to certain collective investment trusts.
The Board also noted that, in 2013, the ad hoc Committee on Management Fees was formed to conduct an in-depth review of the management fee rates of Fidelity's active equity mutual funds. The Committee focused on the following areas: (i) standard fee structures; (ii) research consumption and trading evolution; (iii) management fee competitiveness/profitability by category; and (iv) factors that drive institutional pricing.
Based on its review, the Board concluded that the fund's management fee is fair and reasonable in light of the services that the fund receives and the other factors considered.
Total Expense Ratio. In its review of each class's total expense ratio, the Board considered the fund's management fee rate as well as other fund or class expenses, as applicable, such as transfer agent fees, pricing and bookkeeping fees, fund-paid 12b-1 fees, and custodial, legal, and audit fees. The Board noted the impact of the fund's performance adjustment. The Board also noted that Fidelity may agree to waive fees and expenses from time to time, and the extent to which, if any, it has done so for the fund. As part of its review, the Board also considered the current and historical total expense ratios of each class of the fund compared to competitive fund median expenses. Each class of the fund is compared to those funds and classes in the Total Mapped Group (used by the Board for management fee comparisons) that have a similar sales load structure.
The Board noted that the total expense ratio of each of Class A, Class I, Class Z, and the retail class ranked below the competitive median for 2016 and the total expense ratio of each of Class M (formerly Class T) and Class C ranked above the competitive median for 2016. The Board considered that, in general, various factors can affect total expense ratios. The Board noted that the total expense ratio of Class M was above the competitive median primarily because of higher 12b-1 fees on Class M as compared to most competitor funds. Class M has a higher 12b-1 fee, but a lower front-end sales charge, than traditionally priced front-end sales charge classes. The Board considered that Class M is primarily sold load-waived in the retirement plan market where its 0.50% 12b-1 fee is comparable to competing no-load, higher 12b-1 fee classes designed specifically for retirement plans. The Board noted that the total expense ratio of Class C was above the competitive median primarily because of its 12b-1 fees. The Board noted that the fund offers multiple classes, each of which has a different sales load and 12b-1 fee structure, and that the multiple structures are intended to offer a range of pricing options for the intermediary market. The Board also noted that the total expense ratios of the classes vary primarily by the level of their 12b-1 fees, although differences in transfer agent fees may also cause expenses to vary from class to class.
Fees Charged to Other Fidelity Clients. The Board also considered Fidelity fee structures and other information with respect to clients of Fidelity, such as other funds advised or subadvised by Fidelity, pension plan clients, and other institutional clients with similar mandates. The Board noted that an ad hoc joint committee created by it and the boards of other Fidelity funds periodically (most recently in 2013) reviews and compares Fidelity's institutional investment advisory business with its business of providing services to the Fidelity funds, including the differences in services provided, fees charged, and costs incurred, as well as competition in their respective marketplaces.
Based on its review of total expense ratios and fees charged to other Fidelity clients, the Board concluded that, although some classes were above the median of the universe presented for comparison, the total expense ratio of each class of the fund was reasonable in light of the services that the fund and its shareholders receive and the other factors considered.
Costs of the Services and Profitability. The Board considered the revenues earned and the expenses incurred by Fidelity in conducting the business of developing, marketing, distributing, managing, administering and servicing the fund and servicing the fund's shareholders. The Board also considered the level of Fidelity's profits in respect of all the Fidelity funds.
On an annual basis, Fidelity presents to the Board information about the profitability of its relationships with the fund. Fidelity calculates profitability information for each fund, as well as aggregate profitability information for groups of Fidelity funds and all Fidelity funds, using a series of detailed revenue and cost allocation methodologies which originate with the books and records of Fidelity on which Fidelity's audited financial statements are based. The Audit Committee of the Board reviews any significant changes from the prior year's methodologies.
PricewaterhouseCoopers LLP (PwC), independent registered public accounting firm and auditor to Fidelity and certain Fidelity funds, has been engaged annually by the Board as part of the Board's assessment of Fidelity's profitability analysis. PwC's engagement includes the review and assessment of the methodologies used by Fidelity in determining the revenues and expenses attributable to Fidelity's mutual fund business, and completion of agreed-upon procedures in respect of the mathematical accuracy of the fund profitability information and its conformity to established allocation methodologies. After considering PwC's reports issued under the engagement and information provided by Fidelity, the Board concluded that while other allocation methods may also be reasonable, Fidelity's profitability methodologies are reasonable in all material respects.
The Board also reviewed Fidelity's non-fund businesses and potential fall-out benefits related to the mutual fund business as well as cases where Fidelity's affiliates may benefit from or be related to the fund's business.
The Board considered the costs of the services provided by and the profits realized by Fidelity in connection with the operation of the fund and was satisfied that the profitability was not excessive.
Economies of Scale. The Board considered whether there have been economies of scale in respect of the management of the Fidelity funds, whether the Fidelity funds (including the fund) have appropriately benefited from any such economies of scale, and whether there is potential for realization of any further economies of scale. The Board considered the extent to which the fund will benefit from economies of scale as assets grow through increased services to the fund, through waivers or reimbursements, or through fee or expense ratio reductions. The Board also noted that a committee (the Economies of Scale Committee) created by it and the boards of other Fidelity funds periodically (most recently in 2013) analyzes whether Fidelity attains economies of scale in respect of the management and servicing of the Fidelity funds, whether the Fidelity funds have appropriately benefited from such economies of scale, and whether there is potential for realization of any further economies of scale.
The Board recognized that the fund's management contract incorporates a "group fee" structure, which provides for lower group fee rates as total group assets increase, and for higher group fee rates as total group assets decrease (with "group assets" defined to include fund assets under FMR's management plus the assets of sector funds previously under FMR's management). FMR calculates the group fee rates based on a tiered asset "breakpoint" schedule that varies based on asset class. The Board considered that the group fee is designed to deliver the benefits of economies of scale to fund shareholders when total Fidelity fund assets increase, even if assets of any particular fund are unchanged or have declined, because some portion of Fidelity's costs are attributable to services provided to all Fidelity funds, and all funds benefit if those costs can be allocated among more assets. The Board concluded that, given the group fee structure, fund shareholders will benefit from lower management fees as group assets increase at the fund complex level, regardless of whether Fidelity achieves any such economies of scale.
The Board concluded, taking into account the analysis of the Economies of Scale Committee, that economies of scale, if any, are being appropriately shared between fund shareholders and Fidelity.
Additional Information Requested by the Board. In order to develop fully the factual basis for consideration of the Fidelity funds' advisory contracts, the Board requested and received additional information on certain topics, including: (i) fund performance trends, in particular the underperformance of certain funds, and Fidelity's long-term strategies for certain funds; (ii) Fidelity's fund profitability methodology, profitability trends for certain funds, and the impact of certain factors on fund profitability results, including the impact of market trends on actively managed funds; (iii) the use of performance fees and the calculation of performance adjustments, including the impact of underperformance and fund outflows on performance adjustments; (iv) metrics for evaluating index fund performance; (v) Fidelity's group fee structure, including the group fee breakpoint schedules; (vi) the terms of Fidelity's contractual and voluntary expense cap arrangements with the funds; (vii) the methodology with respect to evaluating competitive fund data and peer group classifications and fee comparisons; (viii) the expense structures for different funds and classes; (ix) Fidelity's arrangements with affiliated sub-advisers on behalf of the funds; (x) information regarding other accounts managed by Fidelity, including institutional accounts and collective investment trusts; (xi) recent changes to the fee structure for certain funds of funds; and (xii) the impact of the Department of Labor's new fiduciary rule on the funds' comparative expense information.
Based on its evaluation of all of the conclusions noted above, and after considering all factors it believed relevant, the Board concluded that the advisory fee structures are fair and reasonable, and that the fund's Advisory Contracts should be renewed.
AIGF-ANN-1217
1.853349.109
Fidelity Advisor® Total International Equity Fund - Class A, Class M (formerly Class T), Class C, Class I and Class Z
Annual Report October 31, 2017 Class A, Class M, Class C, Class I and Class Z are classes of Fidelity® Total International Equity Fund |
|
Contents
To view a fund's proxy voting guidelines and proxy voting record for the 12-month period ended June 30, visit http://www.fidelity.com/proxyvotingresults or visit the Securities and Exchange Commission's (SEC) web site at http://www.sec.gov.
You may also call 1-877-208-0098 to request a free copy of the proxy voting guidelines.
Standard & Poor's, S&P and S&P 500 are registered service marks of The McGraw-Hill Companies, Inc. and have been licensed for use by Fidelity Distributors Corporation.
Other third-party marks appearing herein are the property of their respective owners.
All other marks appearing herein are registered or unregistered trademarks or service marks of FMR LLC or an affiliated company. © 2017 FMR LLC. All rights reserved.
This report and the financial statements contained herein are submitted for the general information of the shareholders of the Fund. This report is not authorized for distribution to prospective investors in the Fund unless preceded or accompanied by an effective prospectus.
A fund files its complete schedule of portfolio holdings with the SEC for the first and third quarters of each fiscal year on Form N-Q. Forms N-Q are available on the SEC’s web site at http://www.sec.gov. A fund's Forms N-Q may be reviewed and copied at the SEC’s Public Reference Room in Washington, DC. Information regarding the operation of the SEC's Public Reference Room may be obtained by calling 1-800-SEC-0330.
For a complete list of a fund's portfolio holdings, view the most recent holdings listing, semiannual report, or annual report on Fidelity's web site at http://www.fidelity.com, http://www.institutional.fidelity.com, or http://www.401k.com, as applicable.
NOT FDIC INSURED •MAY LOSE VALUE •NO BANK GUARANTEE
Neither the Fund nor Fidelity Distributors Corporation is a bank.
Performance: The Bottom Line
Average annual total return reflects the change in the value of an investment, assuming reinvestment of distributions from dividend income and capital gains (the profits earned upon the sale of securities that have grown in value, if any) and assuming a constant rate of performance each year. The hypothetical investment and the average annual total returns do not reflect the deduction of taxes that a shareholder would pay on fund distributions or the redemption of fund shares. During periods of reimbursement by Fidelity, a fund’s total return will be greater than it would be had the reimbursement not occurred. How a fund did yesterday is no guarantee of how it will do tomorrow.
Average Annual Total Returns
| For the periods ended October 31, 2017 | Past 1 year | Past 5 years | Life of fundA |
| Class A (incl. 5.75% sales charge) | 16.67% | 6.47% | 0.61% |
| Class M (incl. 3.50% sales charge) | 19.09% | 6.70% | 0.60% |
| Class C (incl. contingent deferred sales charge) | 21.70% | 6.93% | 0.45% |
| Class I | 24.08% | 8.03% | 1.48% |
| Class Z | 24.21% | 8.05% | 1.49% |
A From November 1, 2007
Class C shares' contingent deferred sales charges included in the past one year, past five years, and life of fund total return figures are 1%, 0%, and 0%, respectively.
The initial offering of Class Z shares took place on February 1, 2017. Returns prior to February 1, 2017, are those of Class I.
$10,000 Over Life of Fund
Let's say hypothetically that $10,000 was invested in Fidelity Advisor® Total International Equity Fund - Class A on November 1, 2007, when the fund started, and the current 5.75% sales charge was paid.
The chart shows how the value of your investment would have changed, and also shows how the MSCI ACWI (All Country World Index) ex USA Index performed over the same period.
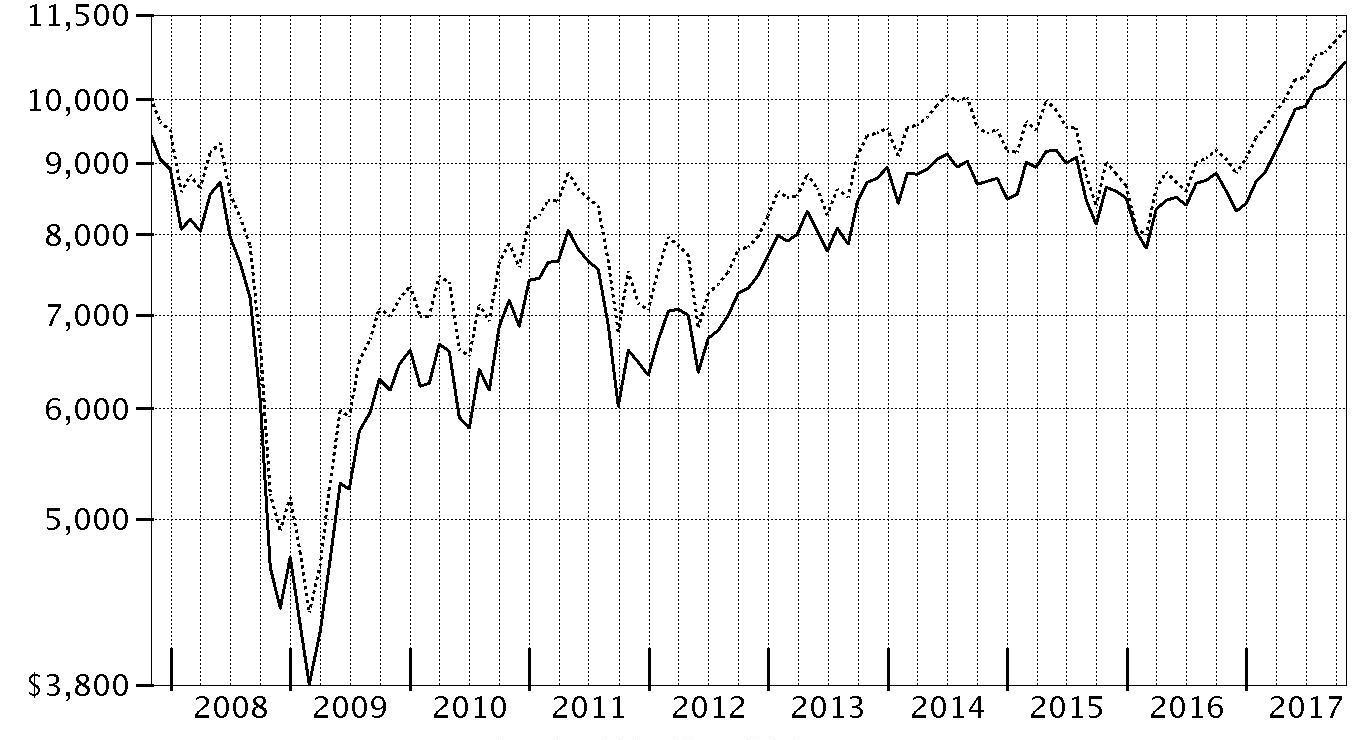
| Period Ending Values |
| $10,631 | Fidelity Advisor® Total International Equity Fund - Class A |
| $11,218 | MSCI ACWI (All Country World Index) ex USA Index |
Management's Discussion of Fund Performance
Market Recap: The MSCI ACWI (All Country World Index) ex USA Index returned 23.85% for the 12 months ending October 31, 2017, helped partly by a generally weak U.S. dollar. Some favorable election results in continental Europe (+30%) suggested ebbing political uncertainty and near-term risk there, but the U.K. (+20%) faced more-mixed conditions ahead of its expected exit from the European Union. Despite central-bank easing – and pressured recently by yen strength – Japan (+18%) lagged the rest of the Asia-Pacific group (+22%). Commodity-price volatility slowed Canada (+17%), but the emerging-markets group (+26%) sped ahead. Sector-wise, information technology (+47%) was driven by a surge among several Chinese internet-related names. Financials (+27%) rode rising interest rates that, at the same time, weighed on real estate (+17%), utilities (+16%), consumer staples (+14%) and telecom services (+9%) – so-called “bond proxy” sectors. Materials (+28%) and industrials (+27%) responded to demand from China and gains in certain commodity prices. In energy (+20%), oil prices lost ground in the spring before rebounding through October 31 to end well above where they started 12 months ago. Lastly, health care (+14%) was hurt by early-period turmoil around drug pricing and health care legislation.
Comments from Co-Portfolio Manager Alex Zavratsky: For the fiscal year, the fund’s share classes (excluding sales charges, if applicable) posted gains of about 23% to 24%, roughly in line with the 23.85% return of the MSCI ACWI (All Country World Index) ex USA Index. Versus the benchmark, the fund was helped by favorable stock picks in emerging markets, especially India, China and South Africa. Selection in Japan and the rest of Asia-Pacific also added value. In contrast, the fund was hampered by out-of-index U.S. picks. Individually , our top contributor was a non-index stake in a convertible security issued by Indian jewelry retailer PC Jeweller (+58%). Out-of-index Interpump Group, an Italian maker of specialty pumps, also helped; its value more than doubled this period. Other contributors were ASML Holding (+74%), a Dutch manufacturer of semiconductor equipment, and Intercontinental Hotels Group (+54%), a U.K.-based hotel operator. In contrast, our biggest individual detractor was an overweighting in Canadian quick-mart operator Alimentation-Couche Tard (-6%). Weaker-than-expected earnings guidance weighed on shares of out-of-index U.S.-based Molson Coors Brewing (-21%). U.K.-based consumer goods company Reckitt Benckiser Group (+2%) also detracted.
The views expressed above reflect those of the portfolio manager(s) only through the end of the period as stated on the cover of this report and do not necessarily represent the views of Fidelity or any other person in the Fidelity organization. Any such views are subject to change at any time based upon market or other conditions and Fidelity disclaims any responsibility to update such views. These views may not be relied on as investment advice and, because investment decisions for a Fidelity fund are based on numerous factors, may not be relied on as an indication of trading intent on behalf of any Fidelity fund.
Note to Shareholders: Following a roughly five-month leave of absence, Jed Weiss returned to Fidelity on November 29, 2017, and resumed his day-to-day responsibilities as Co-Portfolio Manager. In his stead, Vincent Montemaggiore served as interim manager of the fund's developed-growth subportfolio, while Patrick Drouot and Patrick Buchanan served (and remain) as co-managers of the developed small-cap sleeve.
Investment Summary (Unaudited)
Geographic Diversification (% of fund's net assets)
| As of October 31, 2017 |
| | Japan | 12.9% |
| | United States of America* | 10.1% |
| | United Kingdom | 9.8% |
| | France | 5.9% |
| | Switzerland | 5.8% |
| | Cayman Islands | 5.3% |
| | Canada | 4.9% |
| | Germany | 4.6% |
| | India | 4.1% |
| | Other | 36.6% |
* Includes Short-Term investments and Net Other Assets (Liabilities).
| As of April 30, 2017 |
| | Japan | 12.7% |
| | United States of America* | 11.3% |
| | United Kingdom | 11.0% |
| | Switzerland | 5.9% |
| | France | 5.5% |
| | Canada | 4.8% |
| | Germany | 4.4% |
| | Sweden | 3.5% |
| | India | 3.3% |
| | Other | 37.6% |
* Includes Short-Term investments and Net Other Assets (Liabilities).
Percentages are based on country or territory of incorporation and are adjusted for the effect of futures contracts, if applicable.
Asset Allocation as of October 31, 2017
| | % of fund's net assets | % of fund's net assets 6 months ago |
| Stocks | 98.0 | 97.5 |
| Investment Companies | 0.0 | 0.4 |
| Short-Term Investments and Net Other Assets (Liabilities) | 2.0 | 2.1 |
Top Ten Stocks as of October 31, 2017
| | % of fund's net assets | % of fund's net assets 6 months ago |
| Nestle SA (Reg. S) (Switzerland, Food Products) | 2.1 | 2.1 |
| Alibaba Group Holding Ltd. sponsored ADR (Cayman Islands, Internet Software & Services) | 1.7 | 1.1 |
| Samsung Electronics Co. Ltd. (Korea (South), Technology Hardware, Storage & Peripherals) | 1.6 | 1.3 |
| Taiwan Semiconductor Manufacturing Co. Ltd. (Taiwan, Semiconductors & Semiconductor Equipment) | 1.5 | 1.3 |
| Tencent Holdings Ltd. (Cayman Islands, Internet Software & Services) | 1.4 | 1.1 |
| Naspers Ltd. Class N (South Africa, Media) | 1.3 | 1.1 |
| SAP SE (Germany, Software) | 1.2 | 1.2 |
| Anheuser-Busch InBev SA NV (Belgium, Beverages) | 1.0 | 1.3 |
| Total SA (France, Oil, Gas & Consumable Fuels) | 1.0 | 1.0 |
| British American Tobacco PLC (United Kingdom) (United Kingdom, Tobacco) | 1.0 | 1.1 |
| | 13.8 | |
Top Market Sectors as of October 31, 2017
| | % of fund's net assets | % of fund's net assets 6 months ago |
| Financials | 20.0 | 19.3 |
| Information Technology | 18.4 | 15.5 |
| Industrials | 13.4 | 12.9 |
| Consumer Discretionary | 10.5 | 10.0 |
| Consumer Staples | 10.1 | 12.2 |
| Health Care | 8.8 | 9.9 |
| Materials | 7.7 | 8.9 |
| Energy | 4.6 | 4.2 |
| Real Estate | 1.8 | 1.8 |
| Telecommunication Services | 1.7 | 1.8 |
Percentages shown as 0.0% may reflect amounts less than 0.05%.
Investments October 31, 2017
Showing Percentage of Net Assets
| Common Stocks - 97.3% | | | |
| | | Shares | Value |
| Argentina - 0.4% | | | |
| Banco Macro SA sponsored ADR | | 1,200 | $151,104 |
| IRSA Propiedades Comerciales SA sponsored ADR | | 2,700 | 151,200 |
| Telecom Argentina SA Class B sponsored ADR (a) | | 4,800 | 156,528 |
|
| TOTAL ARGENTINA | | | 458,832 |
|
| Australia - 2.6% | | | |
| Adelaide Brighton Ltd. | | 4,581 | 21,773 |
| Amcor Ltd. | | 12,834 | 155,588 |
| Australia & New Zealand Banking Group Ltd. | | 30,502 | 698,474 |
| Beacon Lighting Group Ltd. | | 12,420 | 13,878 |
| CSL Ltd. | | 10,376 | 1,103,281 |
| DuluxGroup Ltd. | | 9,609 | 54,201 |
| Imdex Ltd. (a) | | 41,011 | 30,446 |
| Insurance Australia Group Ltd. | | 40,136 | 201,511 |
| Macquarie Group Ltd. | | 4,936 | 371,543 |
| Magellan Financial Group Ltd. | | 6,475 | 120,273 |
| RCG Corp. Ltd. | | 28,933 | 16,608 |
| Transurban Group unit | | 26,542 | 246,408 |
|
| TOTAL AUSTRALIA | | | 3,033,984 |
|
| Austria - 0.9% | | | |
| Andritz AG | | 8,572 | 484,676 |
| BUWOG-Gemeinnuetzige Wohnung | | 8,698 | 250,865 |
| Erste Group Bank AG | | 7,000 | 300,799 |
|
| TOTAL AUSTRIA | | | 1,036,340 |
|
| Bailiwick of Jersey - 0.3% | | | |
| Integrated Diagnostics Holdings PLC | | 7,500 | 29,250 |
| Shire PLC | | 2,700 | 132,990 |
| Wolseley PLC | | 3,068 | 214,536 |
|
| TOTAL BAILIWICK OF JERSEY | | | 376,776 |
|
| Belgium - 1.8% | | | |
| Anheuser-Busch InBev SA NV | | 10,171 | 1,247,181 |
| KBC Ancora | | 1,311 | 78,188 |
| KBC Groep NV | | 9,616 | 798,757 |
|
| TOTAL BELGIUM | | | 2,124,126 |
|
| Bermuda - 0.1% | | | |
| Credicorp Ltd. (United States) | | 212 | 44,401 |
| Vostok New Ventures Ltd. (depositary receipt) (a) | | 3,860 | 31,815 |
|
| TOTAL BERMUDA | | | 76,216 |
|
| Brazil - 1.2% | | | |
| BM&F BOVESPA SA | | 32,900 | 240,366 |
| BTG Pactual Participations Ltd. unit | | 24,400 | 164,168 |
| Equatorial Energia SA | | 8,900 | 165,958 |
| Estacio Participacoes SA | | 17,300 | 155,109 |
| IRB Brasil Resseguros SA | | 16,100 | 161,477 |
| Itau Unibanco Holding SA | | 3,000 | 35,234 |
| Kroton Educacional SA | | 33,100 | 182,028 |
| Qualicorp SA | | 15,200 | 162,626 |
| Smiles Fidelidade SA | | 6,088 | 159,118 |
|
| TOTAL BRAZIL | | | 1,426,084 |
|
| Canada - 4.9% | | | |
| Alimentation Couche-Tard, Inc. Class B (sub. vtg.) | | 19,222 | 901,278 |
| Canadian National Railway Co. | | 9,763 | 785,596 |
| Canadian Pacific Railway Ltd. | | 1,853 | 321,277 |
| CCL Industries, Inc. Class B | | 12,890 | 621,270 |
| Constellation Software, Inc. | | 1,157 | 658,255 |
| Franco-Nevada Corp. | | 6,859 | 545,062 |
| Imperial Oil Ltd. | | 15,284 | 495,566 |
| McCoy Global, Inc. (a) | | 7,100 | 9,961 |
| New Look Vision Group, Inc. | | 1,300 | 34,644 |
| Pason Systems, Inc. | | 17,691 | 256,842 |
| Potash Corp. of Saskatchewan, Inc. | | 38,414 | 747,675 |
| PrairieSky Royalty Ltd. | | 12,173 | 324,022 |
| ShawCor Ltd. Class A | | 800 | 17,338 |
|
| TOTAL CANADA | | | 5,718,786 |
|
| Cayman Islands - 5.3% | | | |
| 58.com, Inc. ADR (a) | | 6,100 | 409,737 |
| Alibaba Group Holding Ltd. sponsored ADR (a) | | 10,482 | 1,938,017 |
| Baidu.com, Inc. sponsored ADR (a) | | 2,300 | 561,062 |
| China Biologic Products Holdings, Inc. | | 300 | 23,313 |
| China Literature Ltd. | | 29 | 204 |
| Ctrip.com International Ltd. ADR (a) | | 5,180 | 248,070 |
| JD.com, Inc. sponsored ADR (a) | | 8,000 | 300,160 |
| Melco Crown Entertainment Ltd. sponsored ADR | | 6,600 | 166,848 |
| NetEase, Inc. ADR | | 1,053 | 296,862 |
| New Oriental Education & Technology Group, Inc. sponsored ADR | | 2,660 | 221,418 |
| Sands China Ltd. | | 31,600 | 148,858 |
| Shenzhou International Group Holdings Ltd. | | 22,000 | 187,812 |
| Tencent Holdings Ltd. | | 37,700 | 1,694,431 |
| Value Partners Group Ltd. | | 20,000 | 19,817 |
|
| TOTAL CAYMAN ISLANDS | | | 6,216,609 |
|
| China - 2.1% | | | |
| Gree Electric Appliances, Inc. of Zhuhai Class A | | 25,100 | 160,968 |
| Hangzhou Hikvision Digital Technology Co. Ltd. Class A | | 31,400 | 185,895 |
| Hangzhou Robam Appliances Co. Ltd. Class A | | 24,600 | 172,295 |
| Inner Mongoli Yili Industries Co. Ltd. (A Shares) | | 36,182 | 161,145 |
| Jiangsu Yanghe Brewery Joint-Stock Co. Ltd. Class A | | 9,400 | 156,183 |
| Kweichow Moutai Co. Ltd. (A Shares) | | 1,694 | 157,793 |
| Midea Group Co. Ltd. Class A | | 22,700 | 174,486 |
| Ping An Insurance (Group) Co. of China Ltd. (H Shares) | | 50,500 | 443,414 |
| Shanghai International Airport Co. Ltd. (A Shares) | | 26,800 | 176,717 |
| Shenzhen Inovance Technology Co. Ltd. Class A | | 35,900 | 166,977 |
| Tonghua Dongbao Pharmaceutical Co. Ltd. Class A | | 46,800 | 152,499 |
| Wuliangye Yibin Co. Ltd. Class A | | 18,000 | 180,735 |
| Yunnan Baiyao Group Co. Ltd. | | 10,400 | 164,333 |
|
| TOTAL CHINA | | | 2,453,440 |
|
| Denmark - 0.5% | | | |
| Jyske Bank A/S (Reg.) | | 4,554 | 257,347 |
| Novo Nordisk A/S Series B sponsored ADR | | 6,200 | 308,698 |
| Scandinavian Tobacco Group A/S | | 1,711 | 28,926 |
| Spar Nord Bank A/S | | 3,631 | 46,181 |
|
| TOTAL DENMARK | | | 641,152 |
|
| Finland - 0.5% | | | |
| Sampo Oyj (A Shares) | | 7,453 | 390,500 |
| Tikkurila Oyj | | 7,680 | 151,814 |
|
| TOTAL FINLAND | | | 542,314 |
|
| France - 5.9% | | | |
| Atos Origin SA | | 3,047 | 473,476 |
| AXA SA | | 19,306 | 582,818 |
| Bouygues SA | | 4,344 | 208,552 |
| Capgemini SA | | 2,802 | 340,589 |
| Compagnie de St. Gobain | | 3,900 | 228,781 |
| Dassault Systemes SA | | 1,484 | 157,600 |
| Edenred SA | | 5,300 | 152,799 |
| Elis SA | | 12,251 | 319,590 |
| Essilor International SA | | 2,370 | 300,087 |
| Kering SA | | 400 | 183,347 |
| Laurent-Perrier Group SA | | 259 | 24,290 |
| LVMH Moet Hennessy - Louis Vuitton SA | | 577 | 172,098 |
| Natixis SA | | 29,300 | 229,764 |
| Rubis | | 2,400 | 150,629 |
| Sanofi SA | | 4,403 | 416,905 |
| Societe Generale Series A | | 9,900 | 550,980 |
| SR Teleperformance SA | | 2,000 | 292,144 |
| Total SA | | 21,791 | 1,214,590 |
| Vetoquinol SA | | 600 | 38,727 |
| VINCI SA | | 5,200 | 509,109 |
| Virbac SA (a) | | 190 | 24,467 |
| Vivendi SA | | 13,052 | 324,217 |
|
| TOTAL FRANCE | | | 6,895,559 |
|
| Germany - 4.5% | | | |
| adidas AG | | 643 | 143,096 |
| BASF AG | | 6,450 | 703,394 |
| Bayer AG | | 6,000 | 780,474 |
| Brenntag AG | | 3,000 | 169,888 |
| CompuGroup Medical AG | | 2,146 | 123,314 |
| CTS Eventim AG | | 1,994 | 82,363 |
| Deutsche Post AG | | 6,383 | 292,354 |
| Deutsche Telekom AG | | 19,900 | 360,336 |
| Fielmann AG | | 358 | 31,380 |
| Fresenius SE & Co. KGaA | | 2,200 | 183,769 |
| HeidelbergCement Finance AG | | 2,500 | 254,724 |
| Linde AG (a) | | 1,300 | 280,071 |
| Nexus AG | | 1,120 | 33,992 |
| SAP SE | | 12,710 | 1,452,278 |
| Vonovia SE | | 8,265 | 363,534 |
|
| TOTAL GERMANY | | | 5,254,967 |
|
| Greece - 0.1% | | | |
| Titan Cement Co. SA (Reg.) | | 5,600 | 135,160 |
| Hong Kong - 1.4% | | | |
| AIA Group Ltd. | | 144,800 | 1,089,517 |
| CSPC Pharmaceutical Group Ltd. | | 120,000 | 208,578 |
| Guangdong Investment Ltd. | | 120,000 | 173,815 |
| Techtronic Industries Co. Ltd. | | 29,500 | 172,998 |
|
| TOTAL HONG KONG | | | 1,644,908 |
|
| Hungary - 0.2% | | | |
| OTP Bank PLC | | 5,600 | 225,836 |
| India - 4.1% | | | |
| Adani Ports & Special Economic Zone Ltd. | | 31,097 | 206,681 |
| Asian Paints Ltd. | | 10,640 | 194,042 |
| Bharat Petroleum Corp. Ltd. | | 24,563 | 205,457 |
| Eicher Motors Ltd. | | 361 | 179,711 |
| Godrej Consumer Products Ltd. | | 12,509 | 180,419 |
| HDFC Bank Ltd. | | 5,555 | 155,486 |
| Hero Motocorp Ltd. | | 2,965 | 176,293 |
| Housing Development Finance Corp. Ltd. | | 29,517 | 778,337 |
| Indraprastha Gas Ltd. | | 6,474 | 158,491 |
| IndusInd Bank Ltd. | | 5,761 | 144,772 |
| ITC Ltd. | | 58,599 | 240,460 |
| Jyothy Laboratories Ltd. | | 6,583 | 39,996 |
| Kotak Mahindra Bank Ltd. | | 10,458 | 165,559 |
| LIC Housing Finance Ltd. | | 18,425 | 170,364 |
| Maruti Suzuki India Ltd. | | 1,921 | 243,611 |
| PC Jeweller Ltd. | | 54,116 | 293,188 |
| Power Grid Corp. of India Ltd. | | 48,058 | 157,237 |
| Reliance Industries Ltd. | | 28,137 | 408,845 |
| Shree Cement Ltd. | | 590 | 172,493 |
| Ultratech Cemco Ltd. | | 2,998 | 203,774 |
| UPL Ltd. | | 14,531 | 179,377 |
| Vakrangee Ltd. | | 18,723 | 162,594 |
|
| TOTAL INDIA | | | 4,817,187 |
|
| Indonesia - 0.8% | | | |
| PT Bank Central Asia Tbk | | 170,000 | 261,972 |
| PT Bank Rakyat Indonesia Tbk | | 414,700 | 477,001 |
| PT Telkomunikasi Indonesia Tbk Series B | | 836,100 | 249,465 |
|
| TOTAL INDONESIA | | | 988,438 |
|
| Ireland - 1.5% | | | |
| Allergan PLC | | 800 | 141,784 |
| CRH PLC | | 6,548 | 246,414 |
| CRH PLC sponsored ADR | | 19,129 | 717,720 |
| FBD Holdings PLC (a) | | 2,272 | 23,687 |
| James Hardie Industries PLC CDI | | 37,351 | 568,587 |
| Medtronic PLC | | 1,400 | 112,728 |
|
| TOTAL IRELAND | | | 1,810,920 |
|
| Isle of Man - 0.2% | | | |
| Playtech Ltd. | | 21,343 | 278,932 |
| Israel - 0.7% | | | |
| Azrieli Group | | 2,196 | 123,918 |
| Check Point Software Technologies Ltd. (a) | | 1,334 | 157,025 |
| Elbit Systems Ltd. (Israel) | | 1,100 | 163,067 |
| Frutarom Industries Ltd. | | 1,900 | 156,425 |
| Ituran Location & Control Ltd. | | 1,861 | 66,066 |
| Strauss Group Ltd. | | 2,659 | 54,143 |
| Teva Pharmaceutical Industries Ltd. sponsored ADR | | 2,809 | 38,764 |
|
| TOTAL ISRAEL | | | 759,408 |
|
| Italy - 0.9% | | | |
| Azimut Holding SpA | | 6,614 | 130,665 |
| Beni Stabili SpA SIIQ | | 36,526 | 32,336 |
| Interpump Group SpA | | 13,191 | 444,218 |
| Intesa Sanpaolo SpA | | 139,300 | 468,314 |
|
| TOTAL ITALY | | | 1,075,533 |
|
| Japan - 12.9% | | | |
| AEON Financial Service Co. Ltd. | | 7,000 | 150,335 |
| Ai Holdings Corp. | | 1,100 | 27,007 |
| Aoki Super Co. Ltd. | | 2,000 | 22,910 |
| Artnature, Inc. | | 3,300 | 21,680 |
| Asahi Co. Ltd. | | 1,900 | 23,097 |
| Astellas Pharma, Inc. | | 17,100 | 227,581 |
| Aucnet, Inc. | | 400 | 5,290 |
| Azbil Corp. | | 3,400 | 148,467 |
| Broadleaf Co. Ltd. | | 3,900 | 32,020 |
| Central Automotive Products Ltd. | | 2,400 | 39,054 |
| Coca-Cola West Co. Ltd. | | 1,000 | 34,989 |
| Daiichikosho Co. Ltd. | | 1,200 | 56,547 |
| Daikokutenbussan Co. Ltd. | | 1,000 | 45,527 |
| DENSO Corp. | | 7,000 | 385,518 |
| East Japan Railway Co. | | 5,900 | 572,180 |
| Fujitsu Ltd. | | 16,000 | 124,680 |
| Funai Soken Holdings, Inc. | | 1,300 | 47,764 |
| GCA Savvian Group Corp. | | 3,100 | 28,375 |
| Goldcrest Co. Ltd. | | 2,960 | 64,130 |
| Hoya Corp. | | 13,600 | 738,898 |
| Itochu Corp. | | 25,400 | 444,923 |
| Japan Tobacco, Inc. | | 8,420 | 278,704 |
| Kao Corp. | | 3,500 | 211,523 |
| KDDI Corp. | | 13,500 | 359,676 |
| Keyence Corp. | | 1,842 | 1,022,724 |
| Kobayashi Pharmaceutical Co. Ltd. | | 1,200 | 69,385 |
| Komatsu Ltd. | | 11,900 | 388,842 |
| Koshidaka Holdings Co. Ltd. | | 1,200 | 48,542 |
| Kusuri No Aoki Holdings Co. Ltd. | | 500 | 27,749 |
| Lasertec Corp. | | 2,900 | 63,805 |
| Makita Corp. | | 6,100 | 255,643 |
| Medikit Co. Ltd. | | 500 | 24,174 |
| Miroku Jyoho Service Co., Ltd. | | 1,200 | 28,024 |
| Misumi Group, Inc. | | 17,500 | 479,457 |
| Mitsubishi UFJ Financial Group, Inc. | | 121,500 | 824,152 |
| Mitsui Fudosan Co. Ltd. | | 10,400 | 242,746 |
| Nabtesco Corp. | | 1,400 | 55,617 |
| Nagaileben Co. Ltd. | | 2,800 | 69,865 |
| Nakano Refrigerators Co. Ltd. | | 700 | 24,938 |
| ND Software Co. Ltd. | | 1,300 | 15,836 |
| Nihon Parkerizing Co. Ltd. | | 6,900 | 113,113 |
| Nintendo Co. Ltd. | | 1,100 | 426,758 |
| Nippon Telegraph & Telephone Corp. | | 6,700 | 323,928 |
| Nomura Holdings, Inc. | | 34,600 | 198,008 |
| NS Tool Co. Ltd. | | 1,000 | 19,560 |
| OBIC Co. Ltd. | | 5,600 | 370,671 |
| Olympus Corp. | | 12,100 | 450,298 |
| Oracle Corp. Japan | | 2,200 | 186,154 |
| ORIX Corp. | | 23,900 | 410,927 |
| OSG Corp. | | 12,800 | 277,054 |
| Panasonic Corp. | | 18,000 | 271,789 |
| Paramount Bed Holdings Co. Ltd. | | 1,300 | 57,329 |
| ProNexus, Inc. | | 2,900 | 35,194 |
| Recruit Holdings Co. Ltd. | | 10,800 | 264,791 |
| San-Ai Oil Co. Ltd. | | 3,500 | 41,802 |
| Seven & i Holdings Co. Ltd. | | 5,400 | 217,644 |
| Shin-Etsu Chemical Co. Ltd. | | 3,500 | 369,114 |
| Shinsei Bank Ltd. | | 11,000 | 185,633 |
| SHO-BOND Holdings Co. Ltd. | | 6,040 | 371,692 |
| Shoei Co. Ltd. | | 1,700 | 57,075 |
| SK Kaken Co. Ltd. | | 100 | 8,308 |
| Software Service, Inc. | | 500 | 23,035 |
| Sony Corp. | | 5,900 | 246,825 |
| Sony Financial Holdings, Inc. | | 12,300 | 204,346 |
| Subaru Corp. | | 4,500 | 155,471 |
| Taiheiyo Cement Corp. | | 4,900 | 195,848 |
| Techno Medica Co. Ltd. | | 500 | 8,692 |
| The Monogatari Corp. | | 480 | 35,367 |
| TKC Corp. | | 1,200 | 37,771 |
| Tocalo Co. Ltd. | | 300 | 12,106 |
| Tokio Marine Holdings, Inc. | | 7,400 | 318,993 |
| Toyota Motor Corp. | | 12,600 | 781,529 |
| USS Co. Ltd. | | 31,800 | 642,831 |
| Welcia Holdings Co. Ltd. | | 1,000 | 37,952 |
| Workman Co. Ltd. | | 1,300 | 40,522 |
| Yamada Consulting Group Co. Ltd. | | 2,400 | 46,367 |
| Yamato Kogyo Co. Ltd. | | 600 | 16,049 |
|
| TOTAL JAPAN | | | 15,192,920 |
|
| Kenya - 0.3% | | | |
| Safaricom Ltd. | | 1,502,200 | 369,215 |
| Korea (South) - 2.0% | | | |
| BGFretail Co. Ltd. (b) | | 4,677 | 330,877 |
| Leeno Industrial, Inc. | | 349 | 15,982 |
| NAVER Corp. | | 195 | 155,918 |
| Samsung Electronics Co. Ltd. | | 757 | 1,864,589 |
|
| TOTAL KOREA (SOUTH) | | | 2,367,366 |
|
| Mexico - 1.4% | | | |
| CEMEX S.A.B. de CV sponsored ADR | | 29,543 | 239,594 |
| Consorcio ARA S.A.B. de CV | | 61,255 | 21,663 |
| Embotelladoras Arca S.A.B. de CV | | 26,100 | 166,102 |
| Fomento Economico Mexicano S.A.B. de CV: | | | |
| unit | | 29,600 | 258,409 |
| sponsored ADR | | 1,733 | 152,071 |
| Gruma S.A.B. de CV Series B | | 12,315 | 161,314 |
| Grupo Aeroportuario del Pacifico S.A.B. de CV Series B | | 18,500 | 175,459 |
| Grupo Aeroportuario del Sureste S.A.B. de CV Series B | | 10,565 | 188,422 |
| Grupo Aeroportuario Norte S.A.B. de CV | | 29,900 | 150,874 |
| Grupo Cementos de Chihuahua S.A.B. de CV | | 29,900 | 142,811 |
|
| TOTAL MEXICO | | | 1,656,719 |
|
| Netherlands - 2.4% | | | |
| Aalberts Industries NV | | 1,700 | 83,853 |
| ASML Holding NV (Netherlands) | | 5,900 | 1,064,534 |
| ING Groep NV (Certificaten Van Aandelen) | | 30,676 | 566,877 |
| Koninklijke Philips Electronics NV | | 5,800 | 236,367 |
| RELX NV | | 15,085 | 340,716 |
| Takeaway.com Holding BV (a)(c) | | 500 | 23,632 |
| VastNed Retail NV | | 596 | 26,090 |
| Wolters Kluwer NV | | 4,100 | 200,969 |
| X5 Retail Group NV GDR (Reg. S) (a) | | 3,700 | 152,070 |
| Yandex NV Series A (a) | | 4,897 | 165,666 |
|
| TOTAL NETHERLANDS | | | 2,860,774 |
|
| New Zealand - 0.1% | | | |
| Auckland International Airport Ltd. | | 23,280 | 99,247 |
| Norway - 0.5% | | | |
| Kongsberg Gruppen ASA | | 1,800 | 32,835 |
| Skandiabanken ASA | | 1,800 | 18,236 |
| Statoil ASA (d) | | 27,056 | 549,711 |
|
| TOTAL NORWAY | | | 600,782 |
|
| Panama - 0.1% | | | |
| Copa Holdings SA Class A | | 1,200 | 147,828 |
| Philippines - 0.7% | | | |
| Ayala Corp. | | 9,625 | 192,368 |
| Ayala Land, Inc. | | 241,200 | 201,992 |
| Jollibee Food Corp. | | 7,250 | 34,995 |
| SM Investments Corp. | | 10,920 | 202,161 |
| SM Prime Holdings, Inc. | | 287,900 | 206,498 |
|
| TOTAL PHILIPPINES | | | 838,014 |
|
| Portugal - 0.2% | | | |
| Galp Energia SGPS SA Class B | | 12,041 | 223,854 |
| Russia - 0.3% | | | |
| Sberbank of Russia | | 111,140 | 368,277 |
| South Africa - 2.5% | | | |
| Bidcorp Ltd. | | 9,145 | 201,156 |
| Capitec Bank Holdings Ltd. | | 2,624 | 174,424 |
| Clicks Group Ltd. | | 22,157 | 248,278 |
| Discovery Ltd. | | 16,422 | 170,216 |
| FirstRand Ltd. | | 58,250 | 211,144 |
| Mondi Ltd. | | 7,214 | 173,044 |
| Naspers Ltd. Class N | | 6,218 | 1,515,057 |
| Sanlam Ltd. | | 37,926 | 189,647 |
|
| TOTAL SOUTH AFRICA | | | 2,882,966 |
|
| Spain - 2.9% | | | |
| Amadeus IT Holding SA Class A | | 11,600 | 787,089 |
| Banco Santander SA (Spain) | | 117,340 | 795,485 |
| Banco Santander SA (Spain) rights 11/1/17 (a) | | 111,640 | 5,332 |
| CaixaBank SA | | 59,006 | 276,170 |
| Hispania Activos Inmobiliarios SA | | 8,395 | 144,777 |
| Iberdrola SA | | 41,454 | 335,020 |
| Inditex SA | | 13,057 | 488,147 |
| Merlin Properties Socimi SA | | 10,300 | 135,937 |
| Prosegur Compania de Seguridad SA (Reg.) | | 35,876 | 273,726 |
| Unicaja Banco SA | | 81,600 | 118,815 |
|
| TOTAL SPAIN | | | 3,360,498 |
|
| Sweden - 3.5% | | | |
| Addlife AB | | 1,000 | 19,709 |
| AddTech AB (B Shares) | | 2,400 | 53,179 |
| Alfa Laval AB | | 11,100 | 281,224 |
| ASSA ABLOY AB (B Shares) | | 35,300 | 744,225 |
| Atlas Copco AB (A Shares) | | 13,100 | 574,596 |
| Essity AB Class B | | 6,700 | 200,320 |
| Fagerhult AB | | 26,325 | 334,108 |
| Investor AB (B Shares) | | 7,589 | 376,112 |
| Lagercrantz Group AB (B Shares) | | 3,800 | 40,398 |
| Loomis AB (B Shares) | | 1,200 | 48,148 |
| Nordea Bank AB | | 46,267 | 559,295 |
| Saab AB (B Shares) | | 1,200 | 61,321 |
| Svenska Cellulosa AB (SCA) (B Shares) | | 6,700 | 62,905 |
| Svenska Handelsbanken AB (A Shares) | | 19,845 | 284,460 |
| Swedbank AB (A Shares) | | 15,200 | 377,292 |
| Telefonaktiebolaget LM Ericsson (B Shares) | | 15,000 | 94,396 |
|
| TOTAL SWEDEN | | | 4,111,688 |
|
| Switzerland - 5.8% | | | |
| Compagnie Financiere Richemont SA Series A | | 1,617 | 149,065 |
| Credit Suisse Group AG | | 27,727 | 436,945 |
| Lafargeholcim Ltd. (Reg.) | | 3,810 | 215,199 |
| Nestle SA (Reg. S) | | 29,232 | 2,459,536 |
| Novartis AG | | 13,309 | 1,097,717 |
| Roche Holding AG (participation certificate) | | 3,262 | 753,950 |
| Schindler Holding AG: | | | |
| (participation certificate) | | 1,445 | 327,484 |
| (Reg.) | | 324 | 71,545 |
| Sika AG | | 20 | 148,048 |
| Tecan Group AG | | 190 | 40,184 |
| UBS Group AG | | 32,889 | 559,442 |
| Zurich Insurance Group AG | | 1,674 | 510,934 |
|
| TOTAL SWITZERLAND | | | 6,770,049 |
|
| Taiwan - 1.9% | | | |
| Addcn Technology Co. Ltd. | | 2,772 | 25,110 |
| Advantech Co. Ltd. | | 24,599 | 168,140 |
| Taiwan Semiconductor Manufacturing Co. Ltd. | | 222,035 | 1,796,279 |
| United Microelectronics Corp. | | 381,000 | 196,776 |
|
| TOTAL TAIWAN | | | 2,186,305 |
|
| Thailand - 0.2% | | | |
| Airports of Thailand PCL (For. Reg.) | | 114,000 | 204,184 |
| Turkey - 0.7% | | | |
| Koc Holding A/S | | 41,000 | 183,301 |
| Tofas Turk Otomobil Fabrikasi A/S | | 18,167 | 147,882 |
| Tupras Turkiye Petrol Rafinerileri A/S | | 9,000 | 323,839 |
| Turkcell Iletisim Hizmet A/S | | 48,000 | 179,294 |
|
| TOTAL TURKEY | | | 834,316 |
|
| United Arab Emirates - 0.1% | | | |
| DP World Ltd. | | 7,131 | 169,361 |
| United Kingdom - 9.8% | | | |
| Alliance Pharma PLC | | 18,714 | 14,851 |
| AstraZeneca PLC (United Kingdom) | | 8,942 | 605,024 |
| Aviva PLC | | 48,053 | 322,299 |
| Avon Rubber PLC | | 900 | 11,702 |
| BAE Systems PLC | | 77,102 | 607,359 |
| BHP Billiton PLC | | 28,081 | 508,425 |
| BP PLC | | 148,377 | 1,006,391 |
| British American Tobacco PLC (United Kingdom) | | 18,475 | 1,193,667 |
| Bunzl PLC | | 9,846 | 306,655 |
| Compass Group PLC | | 14,092 | 309,380 |
| Dechra Pharmaceuticals PLC | | 2,900 | 79,190 |
| Diageo PLC | | 4,325 | 147,694 |
| DP Poland PLC (a) | | 40,100 | 22,369 |
| Elementis PLC | | 39,008 | 147,291 |
| GlaxoSmithKline PLC | | 24,823 | 445,507 |
| Great Portland Estates PLC | | 5,388 | 44,475 |
| Hilton Food Group PLC (e) | | 2,654 | 31,442 |
| Howden Joinery Group PLC | | 23,600 | 128,543 |
| HSBC Holdings PLC sponsored ADR | | 7,489 | 365,239 |
| Imperial Tobacco Group PLC | | 4,636 | 189,060 |
| Informa PLC | | 76,509 | 708,260 |
| InterContinental Hotel Group PLC | | 3,000 | 166,231 |
| InterContinental Hotel Group PLC ADR | | 11,191 | 622,108 |
| ITE Group PLC | | 19,600 | 46,271 |
| Micro Focus International PLC | | 8,058 | 283,074 |
| NMC Health PLC | | 4,262 | 163,704 |
| Prudential PLC | | 33,087 | 812,133 |
| Reckitt Benckiser Group PLC | | 9,151 | 818,709 |
| Rightmove PLC | | 2,500 | 137,928 |
| Shaftesbury PLC | | 11,837 | 155,641 |
| Spectris PLC | | 7,470 | 253,985 |
| Spirax-Sarco Engineering PLC | | 1,899 | 142,502 |
| Standard Chartered PLC (United Kingdom) (a) | | 34,876 | 347,589 |
| Standard Life PLC | | 55,579 | 317,267 |
| Topps Tiles PLC | | 19,600 | 18,157 |
| Ultra Electronics Holdings PLC | | 2,101 | 50,898 |
| Unite Group PLC | | 3,751 | 35,023 |
|
| TOTAL UNITED KINGDOM | | | 11,566,043 |
|
| United States of America - 8.1% | | | |
| A.O. Smith Corp. | | 2,662 | 157,590 |
| Alphabet, Inc.: | | | |
| Class A (a) | | 612 | 632,220 |
| Class C (a) | | 162 | 164,696 |
| American Tower Corp. | | 1,100 | 158,037 |
| Amgen, Inc. | | 1,100 | 192,742 |
| Amphenol Corp. Class A | | 1,840 | 160,080 |
| Autoliv, Inc. | | 3,524 | 440,007 |
| Berkshire Hathaway, Inc. Class B (a) | | 2,516 | 470,341 |
| ConocoPhillips Co. | | 7,100 | 363,165 |
| Edgewell Personal Care Co. (a) | | 1,200 | 77,916 |
| Facebook, Inc. Class A (a) | | 878 | 158,093 |
| Martin Marietta Materials, Inc. | | 1,760 | 381,656 |
| MasterCard, Inc. Class A | | 6,953 | 1,034,398 |
| Mohawk Industries, Inc. (a) | | 1,595 | 417,507 |
| Molson Coors Brewing Co. Class B | | 3,200 | 258,784 |
| Moody's Corp. | | 2,739 | 390,061 |
| MSCI, Inc. | | 3,851 | 451,953 |
| Philip Morris International, Inc. | | 4,900 | 512,736 |
| PriceSmart, Inc. | | 1,985 | 166,343 |
| ResMed, Inc. | | 4,260 | 358,607 |
| S&P Global, Inc. | | 4,501 | 704,271 |
| Sherwin-Williams Co. | | 1,100 | 434,665 |
| Visa, Inc. Class A | | 10,531 | 1,158,199 |
| Yum China Holdings, Inc. | | 6,300 | 254,205 |
|
| TOTAL UNITED STATES OF AMERICA | | | 9,498,272 |
|
| TOTAL COMMON STOCKS | | | |
| (Cost $98,406,189) | | | 114,300,185 |
|
| Nonconvertible Preferred Stocks - 0.7% | | | |
| Brazil - 0.5% | | | |
| Itau Unibanco Holding SA | | 42,770 | 549,775 |
| Germany - 0.1% | | | |
| Sartorius AG (non-vtg.) | | 1,200 | 111,840 |
| Spain - 0.1% | | | |
| Grifols SA Class B | | 8,300 | 194,948 |
| TOTAL NONCONVERTIBLE PREFERRED STOCKS | | | |
| (Cost $741,463) | | | 856,563 |
|
| Money Market Funds - 1.5% | | | |
| Fidelity Cash Central Fund, 1.10% (f) | | 1,243,426 | 1,243,675 |
| Fidelity Securities Lending Cash Central Fund 1.11% (f)(g) | | 539,946 | 540,000 |
| TOTAL MONEY MARKET FUNDS | | | |
| (Cost $1,783,675) | | | 1,783,675 |
| TOTAL INVESTMENT IN SECURITIES - 99.5% | | | |
| (Cost $100,931,327) | | | 116,940,423 |
| NET OTHER ASSETS (LIABILITIES) - 0.5% | | | 556,077 |
| NET ASSETS - 100% | | | $117,496,500 |
Categorizations in the Schedule of Investments are based on country or territory of incorporation.
Legend
(a) Non-income producing
(b) Level 3 security
(c) Security exempt from registration under Rule 144A of the Securities Act of 1933. These securities may be resold in transactions exempt from registration, normally to qualified institutional buyers. At the end of the period, the value of these securities amounted to $23,632 or 0.0% of net assets.
(d) Security or a portion of the security is on loan at period end.
(e) Security or a portion of the security purchased on a delayed delivery or when-issued basis.
(f) Affiliated fund that is generally available only to investment companies and other accounts managed by Fidelity Investments. The rate quoted is the annualized seven-day yield of the fund at period end. A complete unaudited listing of the fund's holdings as of its most recent quarter end is available upon request. In addition, each Fidelity Central Fund's financial statements, which are not covered by the Fund's Report of Independent Registered Public Accounting Firm, are available on the SEC's website or upon request.
(g) Investment made with cash collateral received from securities on loan.
Affiliated Central Funds
Information regarding fiscal year to date income earned by the Fund from investments in Fidelity Central Funds is as follows:
| Fund | Income earned |
| Fidelity Cash Central Fund | $35,828 |
| Fidelity Securities Lending Cash Central Fund | 32,511 |
| Total | $68,339 |
Investment Valuation
The following is a summary of the inputs used, as of October 31, 2017, involving the Fund's assets and liabilities carried at fair value. The inputs or methodology used for valuing securities may not be an indication of the risk associated with investing in those securities. For more information on valuation inputs, and their aggregation into the levels used below, please refer to the Investment Valuation section in the accompanying Notes to Financial Statements.
| | Valuation Inputs at Reporting Date: |
| Description | Total | Level 1 | Level 2 | Level 3 |
| Investments in Securities: | | | | |
| Equities: | | | | |
| Consumer Discretionary | $12,334,198 | $9,228,664 | $3,105,534 | $-- |
| Consumer Staples | 12,038,170 | 4,872,443 | 6,834,850 | 330,877 |
| Energy | 5,441,383 | 2,628,889 | 2,812,494 | -- |
| Financials | 23,282,535 | 16,224,451 | 7,058,084 | -- |
| Health Care | 10,410,627 | 4,131,037 | 6,279,590 | -- |
| Industrials | 15,213,224 | 10,565,512 | 4,647,712 | -- |
| Information Technology | 21,663,740 | 12,891,675 | 8,772,065 | -- |
| Materials | 9,296,080 | 7,838,809 | 1,457,271 | -- |
| Real Estate | 2,337,199 | 2,030,323 | 306,876 | -- |
| Telecommunication Services | 1,998,442 | 705,037 | 1,293,405 | -- |
| Utilities | 1,141,150 | 1,141,150 | -- | -- |
| Money Market Funds | 1,783,675 | 1,783,675 | -- | -- |
| Total Investments in Securities: | $116,940,423 | $74,041,665 | $42,567,881 | $330,877 |
The following is a summary of transfers between Level 1 and Level 2 for the period ended October 31, 2017. Transfers are assumed to have occurred at the beginning of the period, and are primarily attributable to the valuation techniques used for foreign equity securities, as discussed in the accompanying Notes to Financial Statements:
| Transfers | Total |
| Level 1 to Level 2 | $30,739,338 |
| Level 2 to Level 1 | $7,101,750 |
See accompanying notes which are an integral part of the financial statements.
Financial Statements
Statement of Assets and Liabilities
| | | October 31, 2017 |
| Assets | | |
Investment in securities, at value (including securities loaned of $505,384) — See accompanying schedule:
Unaffiliated issuers (cost $99,147,652) | $115,156,748 | |
| Fidelity Central Funds (cost $1,783,675) | 1,783,675 | |
| Total Investment in Securities (cost $100,931,327) | | $116,940,423 |
| Cash | | 84,270 |
| Foreign currency held at value (cost $81,421) | | 81,756 |
| Receivable for investments sold | | 745,745 |
| Receivable for fund shares sold | | 180,701 |
| Dividends receivable | | 648,567 |
| Distributions receivable from Fidelity Central Funds | | 2,497 |
| Prepaid expenses | | 252 |
| Receivable from investment adviser for expense reductions | | 17,073 |
| Other receivables | | 31,130 |
| Total assets | | 118,732,414 |
| Liabilities | | |
| Payable for investments purchased | | |
| Regular delivery | $351,006 | |
| Delayed delivery | 3,009 | |
| Payable for fund shares redeemed | 19,907 | |
| Accrued management fee | 87,436 | |
| Distribution and service plan fees payable | 11,233 | |
| Audit fee payable | 55,327 | |
| Custody fee payable | 33,451 | |
| Other affiliated payables | 23,284 | |
| Other payables and accrued expenses | 111,261 | |
| Collateral on securities loaned | 540,000 | |
| Total liabilities | | 1,235,914 |
| Net Assets | | $117,496,500 |
| Net Assets consist of: | | |
| Paid in capital | | $103,427,287 |
| Undistributed net investment income | | 1,842,046 |
| Accumulated undistributed net realized gain (loss) on investments and foreign currency transactions | | (3,670,677) |
| Net unrealized appreciation (depreciation) on investments and assets and liabilities in foreign currencies | | 15,897,844 |
| Net Assets | | $117,496,500 |
| Calculation of Maximum Offering Price | | |
| Class A: | | |
| Net Asset Value and redemption price per share ($9,292,066 ÷ 989,520 shares) | | $9.39 |
| Maximum offering price per share (100/94.25 of $9.39) | | $9.96 |
| Class M: | | |
| Net Asset Value and redemption price per share ($15,894,100 ÷ 1,687,456 shares) | | $9.42 |
| Maximum offering price per share (100/96.50 of $9.42) | | $9.76 |
| Class C: | | |
| Net Asset Value and offering price per share ($3,211,229 ÷ 342,534 shares)(a) | | $9.37 |
| Total International Equity: | | |
| Net Asset Value, offering price and redemption price per share ($82,076,663 ÷ 8,731,279 shares) | | $9.40 |
| Class I: | | |
| Net Asset Value, offering price and redemption price per share ($6,776,051 ÷ 722,430 shares) | | $9.38 |
| Class Z: | | |
| Net Asset Value, offering price and redemption price per share ($246,391 ÷ 26,227 shares) | | $9.39 |
(a) Redemption price per share is equal to net asset value less any applicable contingent deferred sales charge.
See accompanying notes which are an integral part of the financial statements.
Statement of Operations
| | | Year ended October 31, 2017 |
| Investment Income | | |
| Dividends | | $5,867,168 |
| Income from Fidelity Central Funds | | 68,339 |
| Income before foreign taxes withheld | | 5,935,507 |
| Less foreign taxes withheld | | (515,820) |
| Total income | | 5,419,687 |
| Expenses | | |
| Management fee | | |
| Basic fee | $1,550,378 | |
| Performance adjustment | 258,769 | |
| Transfer agent fees | 318,550 | |
| Distribution and service plan fees | 125,353 | |
| Accounting and security lending fees | 115,549 | |
| Custodian fees and expenses | 171,686 | |
| Independent trustees' fees and expenses | 966 | |
| Registration fees | 90,840 | |
| Audit | 110,411 | |
| Legal | 2,730 | |
| Miscellaneous | 2,692 | |
| Total expenses before reductions | 2,747,924 | |
| Expense reductions | (115,152) | 2,632,772 |
| Net investment income (loss) | | 2,786,915 |
| Realized and Unrealized Gain (Loss) | | |
| Net realized gain (loss) on: | | |
| Investment securities: | | |
| Unaffiliated issuers | 19,411,497 | |
| Redemptions in-kind with affiliated entities | 51,686,661 | |
| Fidelity Central Funds | (1,147) | |
| Foreign currency transactions | (126,503) | |
| Futures contracts | (206,898) | |
| Total net realized gain (loss) | | 70,763,610 |
| Change in net unrealized appreciation (depreciation) on: | | |
| Unaffiliated issuers (net of increase in deferred foreign taxes of $111,264) | (21,965,474) | |
| Assets and liabilities in foreign currencies | 34,164 | |
| Total change in net unrealized appreciation (depreciation) | | (21,931,310) |
| Net gain (loss) | | 48,832,300 |
| Net increase (decrease) in net assets resulting from operations | | $51,619,215 |
See accompanying notes which are an integral part of the financial statements.
Statement of Changes in Net Assets
| | Year ended October 31, 2017 | Year ended October 31, 2016 |
| Increase (Decrease) in Net Assets | | |
| Operations | | |
| Net investment income (loss) | $2,786,915 | $4,368,676 |
| Net realized gain (loss) | 70,763,610 | 3,239,278 |
| Change in net unrealized appreciation (depreciation) | (21,931,310) | (10,501,802) |
| Net increase (decrease) in net assets resulting from operations | 51,619,215 | (2,893,848) |
| Distributions to shareholders from net investment income | (4,227,310) | (3,869,339) |
| Share transactions - net increase (decrease) | (237,908,011) | (21,421,371) |
| Redemption fees | 2,629 | 1,162 |
| Total increase (decrease) in net assets | (190,513,477) | (28,183,396) |
| Net Assets | | |
| Beginning of period | 308,009,977 | 336,193,373 |
| End of period | $117,496,500 | $308,009,977 |
| Other Information | | |
| Undistributed net investment income end of period | $1,842,046 | $3,810,969 |
See accompanying notes which are an integral part of the financial statements.
Financial Highlights
Fidelity Total International Equity Fund Class A
| Years ended October 31, | 2017 | 2016 | 2015 | 2014 | 2013 |
| Selected Per–Share Data | | | | | |
| Net asset value, beginning of period | $7.67 | $7.79 | $8.00 | $8.27 | $7.31 |
| Income from Investment Operations | | | | | |
| Net investment income (loss)A | .09 | .08 | .07 | .13 | .09 |
| Net realized and unrealized gain (loss) | 1.71 | (.14) | (.14) | (.12) | 1.24 |
| Total from investment operations | 1.80 | (.06) | (.07) | .01 | 1.33 |
| Distributions from net investment income | (.08) | (.06) | (.10) | (.10) | (.13) |
| Distributions from net realized gain | – | – | (.04) | (.18) | (.25) |
| Total distributions | (.08) | (.06) | (.14) | (.28) | (.37)B |
| Redemption fees added to paid in capitalA,C | – | – | – | – | – |
| Net asset value, end of period | $9.39 | $7.67 | $7.79 | $8.00 | $8.27 |
| Total ReturnD,E | 23.78% | (.76)% | (.89)% | .19% | 19.00% |
| Ratios to Average Net AssetsF,G | | | | | |
| Expenses before reductions | 1.67% | 1.52% | 1.48% | 1.44% | 1.50% |
| Expenses net of fee waivers, if any | 1.45% | 1.45% | 1.45% | 1.44% | 1.45% |
| Expenses net of all reductions | 1.43% | 1.45% | 1.44% | 1.44% | 1.43% |
| Net investment income (loss) | 1.02% | 1.10% | .86% | 1.63% | 1.21% |
| Supplemental Data | | | | | |
| Net assets, end of period (000 omitted) | $9,292 | $8,576 | $9,163 | $9,164 | $9,034 |
| Portfolio turnover rateH | 66%I | 51% | 53% | 85% | 89% |
A Calculated based on average shares outstanding during the period.
B Total distributions of $.37 per share is comprised of distributions from net investment income of $.126 and distributions from net realized gain of $.245 per share.
C Amount represents less than $.005 per share.
D Total returns would have been lower if certain expenses had not been reduced during the applicable periods shown.
E Total returns do not include the effect of the sales charges.
F Fees and expenses of any underlying Fidelity Central Funds are not included in the Fund's expense ratio. The Fund indirectly bears its proportionate share of the expenses of any underlying Fidelity Central Funds.
G Expense ratios reflect operating expenses of the class. Expenses before reductions do not reflect amounts reimbursed by the investment adviser or reductions from brokerage service arrangements or reductions from other expense offset arrangements and do not represent the amount paid by the class during periods when reimbursements or reductions occur. Expenses net of fee waivers reflect expenses after reimbursement by the investment adviser but prior to reductions from brokerage service arrangements or other expense offset arrangements. Expenses net of all reductions represent the net expenses paid by the class.
H Amount does not include the portfolio activity of any underlying Fidelity Central Funds.
I Portfolio turnover rate excludes securities received or delivered in-kind.
See accompanying notes which are an integral part of the financial statements.
Fidelity Total International Equity Fund Class M
| Years ended October 31, | 2017 | 2016 | 2015 | 2014 | 2013 |
| Selected Per–Share Data | | | | | |
| Net asset value, beginning of period | $7.70 | $7.81 | $8.04 | $8.32 | $7.37 |
| Income from Investment Operations | | | | | |
| Net investment income (loss)A | .06 | .06 | .05 | .11 | .07 |
| Net realized and unrealized gain (loss) | 1.73 | (.13) | (.15) | (.12) | 1.25 |
| Total from investment operations | 1.79 | (.07) | (.10) | (.01) | 1.32 |
| Distributions from net investment income | (.07) | (.04) | (.09) | (.09) | (.13) |
| Distributions from net realized gain | – | – | (.04) | (.18) | (.25) |
| Total distributions | (.07) | (.04) | (.13) | (.27) | (.37)B |
| Redemption fees added to paid in capitalA,C | – | – | – | – | – |
| Net asset value, end of period | $9.42 | $7.70 | $7.81 | $8.04 | $8.32 |
| Total ReturnD,E | 23.41% | (.86)% | (1.26)% | (.06)% | 18.73% |
| Ratios to Average Net AssetsF,G | | | | | |
| Expenses before reductions | 1.90% | 1.73% | 1.70% | 1.68% | 1.75% |
| Expenses net of fee waivers, if any | 1.70% | 1.70% | 1.70% | 1.68% | 1.70% |
| Expenses net of all reductions | 1.68% | 1.69% | 1.69% | 1.68% | 1.67% |
| Net investment income (loss) | .77% | .85% | .61% | 1.38% | .96% |
| Supplemental Data | | | | | |
| Net assets, end of period (000 omitted) | $15,894 | $13,893 | $13,962 | $10,282 | $7,909 |
| Portfolio turnover rateH | 66%I | 51% | 53% | 85% | 89% |
A Calculated based on average shares outstanding during the period.
B Total distributions of $.37 per share is comprised of distributions from net investment income of $.128 and distributions from net realized gain of $.245 per share.
C Amount represents less than $.005 per share.
D Total returns would have been lower if certain expenses had not been reduced during the applicable periods shown.
E Total returns do not include the effect of the sales charges.
F Fees and expenses of any underlying Fidelity Central Funds are not included in the Fund's expense ratio. The Fund indirectly bears its proportionate share of the expenses of any underlying Fidelity Central Funds.
G Expense ratios reflect operating expenses of the class. Expenses before reductions do not reflect amounts reimbursed by the investment adviser or reductions from brokerage service arrangements or reductions from other expense offset arrangements and do not represent the amount paid by the class during periods when reimbursements or reductions occur. Expenses net of fee waivers reflect expenses after reimbursement by the investment adviser but prior to reductions from brokerage service arrangements or other expense offset arrangements. Expenses net of all reductions represent the net expenses paid by the class.
H Amount does not include the portfolio activity of any underlying Fidelity Central Funds.
I Portfolio turnover rate excludes securities received or delivered in-kind.
See accompanying notes which are an integral part of the financial statements.
Fidelity Total International Equity Fund Class C
| Years ended October 31, | 2017 | 2016 | 2015 | 2014 | 2013 |
| Selected Per–Share Data | | | | | |
| Net asset value, beginning of period | $7.66 | $7.77 | $8.00 | $8.28 | $7.31 |
| Income from Investment Operations | | | | | |
| Net investment income (loss)A | .02 | .03 | .01 | .07 | .04 |
| Net realized and unrealized gain (loss) | 1.71 | (.14) | (.15) | (.12) | 1.25 |
| Total from investment operations | 1.73 | (.11) | (.14) | (.05) | 1.29 |
| Distributions from net investment income | (.02) | – | (.05) | (.05) | (.08) |
| Distributions from net realized gain | – | – | (.04) | (.18) | (.25) |
| Total distributions | (.02) | – | (.09) | (.23) | (.32)B |
| Redemption fees added to paid in capitalA,C | – | – | – | – | – |
| Net asset value, end of period | $9.37 | $7.66 | $7.77 | $8.00 | $8.28 |
| Total ReturnD,E | 22.70% | (1.42)% | (1.73)% | (.57)% | 18.30% |
| Ratios to Average Net AssetsF,G | | | | | |
| Expenses before reductions | 2.48% | 2.30% | 2.26% | 2.22% | 2.26% |
| Expenses net of fee waivers, if any | 2.20% | 2.20% | 2.20% | 2.20% | 2.20% |
| Expenses net of all reductions | 2.18% | 2.20% | 2.19% | 2.20% | 2.18% |
| Net investment income (loss) | .27% | .35% | .11% | .87% | .46% |
| Supplemental Data | | | | | |
| Net assets, end of period (000 omitted) | $3,211 | $2,713 | $3,311 | $4,028 | $3,584 |
| Portfolio turnover rateH | 66%I | 51% | 53% | 85% | 89% |
A Calculated based on average shares outstanding during the period.
B Total distributions of $.32 per share is comprised of distributions from net investment income of $.075 and distributions from net realized gain of $.245 per share.
C Amount represents less than $.005 per share.
D Total returns would have been lower if certain expenses had not been reduced during the applicable periods shown.
E Total returns do not include the effect of the contingent deferred sales charge.
F Fees and expenses of any underlying Fidelity Central Funds are not included in the Fund's expense ratio. The Fund indirectly bears its proportionate share of the expenses of any underlying Fidelity Central Funds.
G Expense ratios reflect operating expenses of the class. Expenses before reductions do not reflect amounts reimbursed by the investment adviser or reductions from brokerage service arrangements or reductions from other expense offset arrangements and do not represent the amount paid by the class during periods when reimbursements or reductions occur. Expenses net of fee waivers reflect expenses after reimbursement by the investment adviser but prior to reductions from brokerage service arrangements or other expense offset arrangements. Expenses net of all reductions represent the net expenses paid by the class.
H Amount does not include the portfolio activity of any underlying Fidelity Central Funds.
I Portfolio turnover rate excludes securities received or delivered in-kind.
See accompanying notes which are an integral part of the financial statements.
Fidelity Total International Equity Fund
| Years ended October 31, | 2017 | 2016 | 2015 | 2014 | 2013 |
| Selected Per–Share Data | | | | | |
| Net asset value, beginning of period | $7.70 | $7.82 | $8.03 | $8.29 | $7.32 |
| Income from Investment Operations | | | | | |
| Net investment income (loss)A | .11 | .11 | .10 | .16 | .12 |
| Net realized and unrealized gain (loss) | 1.70 | (.13) | (.14) | (.12) | 1.24 |
| Total from investment operations | 1.81 | (.02) | (.04) | .04 | 1.36 |
| Distributions from net investment income | (.11) | (.10) | (.13) | (.12) | (.15) |
| Distributions from net realized gain | – | – | (.04) | (.18) | (.25) |
| Total distributions | (.11) | (.10) | (.17) | (.30) | (.39)B |
| Redemption fees added to paid in capitalA,C | – | – | – | – | – |
| Net asset value, end of period | $9.40 | $7.70 | $7.82 | $8.03 | $8.29 |
| Total ReturnD | 23.86% | (.32)% | (.51)% | .55% | 19.48% |
| Ratios to Average Net AssetsE,F | | | | | |
| Expenses before reductions | 1.15% | 1.11% | 1.07% | 1.04% | 1.09% |
| Expenses net of fee waivers, if any | 1.14% | 1.11% | 1.07% | 1.04% | 1.09% |
| Expenses net of all reductions | 1.13% | 1.10% | 1.06% | 1.04% | 1.07% |
| Net investment income (loss) | 1.33% | 1.44% | 1.24% | 2.03% | 1.57% |
| Supplemental Data | | | | | |
| Net assets, end of period (000 omitted) | $82,077 | $280,672 | $307,035 | $324,438 | $324,395 |
| Portfolio turnover rateG | 66%H | 51% | 53% | 85% | 89% |
A Calculated based on average shares outstanding during the period.
B Total distributions of $.39 per share is comprised of distributions from net investment income of $.148 and distributions from net realized gain of $.245 per share.
C Amount represents less than $.005 per share.
D Total returns would have been lower if certain expenses had not been reduced during the applicable periods shown.
E Fees and expenses of any underlying Fidelity Central Funds are not included in the Fund's expense ratio. The Fund indirectly bears its proportionate share of the expenses of any underlying Fidelity Central Funds.
F Expense ratios reflect operating expenses of the class. Expenses before reductions do not reflect amounts reimbursed by the investment adviser or reductions from brokerage service arrangements or reductions from other expense offset arrangements and do not represent the amount paid by the class during periods when reimbursements or reductions occur. Expenses net of fee waivers reflect expenses after reimbursement by the investment adviser but prior to reductions from brokerage service arrangements or other expense offset arrangements. Expenses net of all reductions represent the net expenses paid by the class.
G Amount does not include the portfolio activity of any underlying Fidelity Central Funds.
H Portfolio turnover rate excludes securities received or delivered in-kind.
See accompanying notes which are an integral part of the financial statements.
Fidelity Total International Equity Fund Class I
| Years ended October 31, | 2017 | 2016 | 2015 | 2014 | 2013 |
| Selected Per–Share Data | | | | | |
| Net asset value, beginning of period | $7.66 | $7.78 | $7.99 | $8.26 | $7.30 |
| Income from Investment Operations | | | | | |
| Net investment income (loss)A | .11 | .10 | .09 | .15 | .11 |
| Net realized and unrealized gain (loss) | 1.71 | (.13) | (.14) | (.12) | 1.24 |
| Total from investment operations | 1.82 | (.03) | (.05) | .03 | 1.35 |
| Distributions from net investment income | (.10) | (.09) | (.12) | (.12) | (.15) |
| Distributions from net realized gain | – | – | (.04) | (.18) | (.25) |
| Total distributions | (.10) | (.09) | (.16) | (.30) | (.39)B |
| Redemption fees added to paid in capitalA,C | – | – | – | – | – |
| Net asset value, end of period | $9.38 | $7.66 | $7.78 | $7.99 | $8.26 |
| Total ReturnD | 24.08% | (.43)% | (.64)% | .37% | 19.40% |
| Ratios to Average Net AssetsE,F | | | | | |
| Expenses before reductions | 1.42% | 1.22% | 1.17% | 1.15% | 1.21% |
| Expenses net of fee waivers, if any | 1.20% | 1.20% | 1.17% | 1.15% | 1.20% |
| Expenses net of all reductions | 1.18% | 1.20% | 1.16% | 1.15% | 1.18% |
| Net investment income (loss) | 1.28% | 1.35% | 1.14% | 1.91% | 1.46% |
| Supplemental Data | | | | | |
| Net assets, end of period (000 omitted) | $6,776 | $2,156 | $2,602 | $2,240 | $2,372 |
| Portfolio turnover rateG | 66%H | 51% | 53% | 85% | 89% |
A Calculated based on average shares outstanding during the period.
B Total distributions of $.39 per share is comprised of distributions from net investment income of $.148 and distributions from net realized gain of $.245 per share.
C Amount represents less than $.005 per share.
D Total returns would have been lower if certain expenses had not been reduced during the applicable periods shown.
E Fees and expenses of any underlying Fidelity Central Funds are not included in the Fund's expense ratio. The Fund indirectly bears its proportionate share of the expenses of any underlying Fidelity Central Funds.
F Expense ratios reflect operating expenses of the class. Expenses before reductions do not reflect amounts reimbursed by the investment adviser or reductions from brokerage service arrangements or reductions from other expense offset arrangements and do not represent the amount paid by the class during periods when reimbursements or reductions occur. Expenses net of fee waivers reflect expenses after reimbursement by the investment adviser but prior to reductions from brokerage service arrangements or other expense offset arrangements. Expenses net of all reductions represent the net expenses paid by the class.
G Amount does not include the portfolio activity of any underlying Fidelity Central Funds.
H Portfolio turnover rate excludes securities received or delivered in-kind.
See accompanying notes which are an integral part of the financial statements.
Fidelity Total International Equity Fund Class Z
| Years ended October 31, | 2017 A |
| Selected Per–Share Data | |
| Net asset value, beginning of period | $7.73 |
| Income from Investment Operations | |
| Net investment income (loss)B | .08 |
| Net realized and unrealized gain (loss) | 1.58 |
| Total from investment operations | 1.66 |
| Distributions from net investment income | – |
| Distributions from net realized gain | – |
| Total distributions | – |
| Redemption fees added to paid in capitalB,C | – |
| Net asset value, end of period | $9.39 |
| Total ReturnD,E | 21.47% |
| Ratios to Average Net AssetsF,G | |
| Expenses before reductions | 1.32%H |
| Expenses net of fee waivers, if any | 1.05%H |
| Expenses net of all reductions | 1.04%H |
| Net investment income (loss) | 1.27%H |
| Supplemental Data | |
| Net assets, end of period (000 omitted) | $246 |
| Portfolio turnover rateI | 66%J |
A For the period February 1, 2017 (commencement of sale of shares) to October 31, 2017.
B Calculated based on average shares outstanding during the period.
C Amount represents less than $.005 per share.
D Total returns for periods of less than one year are not annualized.
E Total returns would have been lower if certain expenses had not been reduced during the applicable periods shown.
F Fees and expenses of any underlying Fidelity Central Funds are not included in the Fund's expense ratio. The Fund indirectly bears its proportionate share of the expenses of any underlying Fidelity Central Funds.
G Expense ratios reflect operating expenses of the class. Expenses before reductions do not reflect amounts reimbursed by the investment adviser or reductions from brokerage service arrangements or reductions from other expense offset arrangements and do not represent the amount paid by the class during periods when reimbursements or reductions occur. Expense ratios before reductions for start-up periods may not be representative of longer-term operating periods. Expenses net of fee waivers reflect expenses after reimbursement by the investment adviser but prior to reductions from brokerage service arrangements or other expense offset arrangements. Expenses net of all reductions represent the net expenses paid by the class.
H Annualized
I Amount does not include the portfolio activity of any underlying Fidelity Central Funds.
J Portfolio turnover rate excludes securities received or delivered in-kind.
See accompanying notes which are an integral part of the financial statements.
Notes to Financial Statements
For the period ended October 31, 2017
1. Organization.
Fidelity Total International Equity Fund (the Fund) is a fund of Fidelity Investment Trust (the Trust) and is authorized to issue an unlimited number of shares. The Trust is registered under the Investment Company Act of 1940, as amended (the 1940 Act), as an open-end management investment company organized as a Massachusetts business trust. The Fund commenced sale of Class Z shares on February 1, 2017. The Fund offers Class A, Class M (formerly Class T), Class C, Total International Equity, Class I and Class Z shares, each of which has equal rights as to assets and voting privileges. Each class has exclusive voting rights with respect to matters that affect that class. The Fund's investments in emerging markets can be subject to social, economic, regulatory and political uncertainties and can be extremely volatile.
After the close of business on June 24, 2016, all outstanding Class B shares were converted to Class A shares. All prior fiscal period dollar and share amounts for Class B presented in the Notes to Financial Statements are for the period November 1, 2015 through June 24, 2016.
2. Investments in Fidelity Central Funds.
The Fund invests in Fidelity Central Funds, which are open-end investment companies generally available only to other investment companies and accounts managed by the investment adviser and its affiliates. The Fund's Schedule of Investments lists each of the Fidelity Central Funds held as of period end, if any, as an investment of the Fund, but does not include the underlying holdings of each Fidelity Central Fund. As an Investing Fund, the Fund indirectly bears its proportionate share of the expenses of the underlying Fidelity Central Funds.
The Money Market Central Funds seek preservation of capital and current income and are managed by Fidelity Investments Money Management, Inc. (FIMM), an affiliate of the investment adviser. Annualized expenses of the Money Market Central Funds as of their most recent shareholder report date are less than .005%.
A complete unaudited list of holdings for each Fidelity Central Fund is available upon request or at the Securities and Exchange Commission (the SEC) website at www.sec.gov. In addition, the financial statements of the Fidelity Central Funds, which are not covered by the Fund's Report of Independent Registered Public Accounting Firm, are available on the SEC website or upon request.
3. Significant Accounting Policies.
The Fund is an investment company and applies the accounting and reporting guidance of the Financial Accounting Standards Board (FASB) Accounting Standards Codification Topic 946 Financial Services – Investments Companies. The financial statements have been prepared in conformity with accounting principles generally accepted in the United States of America (GAAP), which require management to make certain estimates and assumptions at the date of the financial statements. Actual results could differ from those estimates. Subsequent events, if any, through the date that the financial statements were issued have been evaluated in the preparation of the financial statements. The following summarizes the significant accounting policies of the Fund:
Investment Valuation. Investments are valued as of 4:00 p.m. Eastern time on the last calendar day of the period. The Board of Trustees (the Board) has delegated the day to day responsibility for the valuation of the Fund's investments to the Fair Value Committee (the Committee) established by the Fund's investment adviser. In accordance with valuation policies and procedures approved by the Board, the Fund attempts to obtain prices from one or more third party pricing vendors or brokers to value its investments. When current market prices, quotations or currency exchange rates are not readily available or reliable, investments will be fair valued in good faith by the Committee, in accordance with procedures adopted by the Board. Factors used in determining fair value vary by investment type and may include market or investment specific events. The frequency with which these procedures are used cannot be predicted and they may be utilized to a significant extent. The Committee oversees the Fund's valuation policies and procedures and reports to the Board on the Committee's activities and fair value determinations. The Board monitors the appropriateness of the procedures used in valuing the Fund's investments and ratifies the fair value determinations of the Committee.
The Fund categorizes the inputs to valuation techniques used to value its investments into a disclosure hierarchy consisting of three levels as shown below:
- Level 1 – quoted prices in active markets for identical investments
- Level 2 – other significant observable inputs (including quoted prices for similar investments, interest rates, prepayment speeds, etc.)
- Level 3 – unobservable inputs (including the Fund's own assumptions based on the best information available)
Valuation techniques used to value the Fund's investments by major category are as follows:
Equity securities, including restricted securities, for which market quotations are readily available, are valued at the last reported sale price or official closing price as reported by a third party pricing vendor on the primary market or exchange on which they are traded and are categorized as Level 1 in the hierarchy. In the event there were no sales during the day or closing prices are not available, securities are valued at the last quoted bid price or may be valued using the last available price and are generally categorized as Level 2 in the hierarchy. For foreign equity securities, when market or security specific events arise, comparisons to the valuation of American Depositary Receipts (ADRs), futures contracts, Exchange-Traded Funds (ETFs) and certain indexes as well as quoted prices for similar securities may be used and would be categorized as Level 2 in the hierarchy. Utilizing these techniques may result in transfers between Level 1 and Level 2. For equity securities, including restricted securities, where observable inputs are limited, assumptions about market activity and risk are used and these securities may be categorized as Level 3 in the hierarchy.
Investments in open-end mutual funds, including the Fidelity Central Funds, are valued at their closing net asset value (NAV) each business day and are categorized as Level 1 in the hierarchy.
Changes in valuation techniques may result in transfers in or out of an assigned level within the disclosure hierarchy. The aggregate value of investments by input level as of October 31, 2017, including information on transfers between Levels 1 and 2 is included at the end of the Fund's Schedule of Investments.
Foreign Currency. The Fund may use foreign currency contracts to facilitate transactions in foreign-denominated securities. Gains and losses from these transactions may arise from changes in the value of the foreign currency or if the counterparties do not perform under the contracts' terms.
Foreign-denominated assets, including investment securities, and liabilities are translated into U.S. dollars at the exchange rates at period end. Purchases and sales of investment securities, income and dividends received and expenses denominated in foreign currencies are translated into U.S. dollars at the exchange rate in effect on the transaction date.
The effects of exchange rate fluctuations on investments are included with the net realized and unrealized gain (loss) on investment securities. Other foreign currency transactions resulting in realized and unrealized gain (loss) are disclosed separately.
Investment Transactions and Income. For financial reporting purposes, the Fund's investment holdings and NAV include trades executed through the end of the last business day of the period. The NAV per share for processing shareholder transactions is calculated as of the close of business of the New York Stock Exchange (NYSE), normally 4:00 p.m. Eastern time and includes trades executed through the end of the prior business day. Gains and losses on securities sold are determined on the basis of identified cost and includes proceeds received from litigation. Dividend income is recorded on the ex-dividend date, except for certain dividends from foreign securities where the ex-dividend date may have passed, which are recorded as soon as the Fund is informed of the ex-dividend date. Non-cash dividends included in dividend income, if any, are recorded at the fair market value of the securities received. Income and capital gain distributions from Fidelity Central Funds, if any, are recorded on the ex-dividend date. Certain distributions received by the Fund represent a return of capital or capital gain. The Fund determines the components of these distributions subsequent to the ex-dividend date, based upon receipt of tax filings or other correspondence relating to the underlying investment. These distributions are recorded as a reduction of cost of investments and/or as a realized gain. Investment income is recorded net of foreign taxes withheld where recovery of such taxes is uncertain.
Class Allocations and Expenses. Investment income, realized and unrealized capital gains and losses, common expenses of the Fund, and certain fund-level expense reductions, if any, are allocated daily on a pro-rata basis to each class based on the relative net assets of each class to the total net assets of the Fund. Each class differs with respect to transfer agent and distribution and service plan fees incurred. Certain expense reductions may also differ by class. For the reporting period, the allocated portion of income and expenses to each class as a percent of its average net assets may vary due to the timing of recording these transactions in relation to fluctuating net assets of the classes. Expenses directly attributable to a fund are charged to that fund. Expenses attributable to more than one fund are allocated among the respective funds on the basis of relative net assets or other appropriate methods. Expense estimates are accrued in the period to which they relate and adjustments are made when actual amounts are known.
Income Tax Information and Distributions to Shareholders. Each year, the Fund intends to qualify as a regulated investment company under Subchapter M of the Internal Revenue Code, including distributing substantially all of its taxable income and realized gains. As a result, no provision for U.S. Federal income taxes is required. As of October 31, 2017, the Fund did not have any unrecognized tax benefits in the financial statements; nor is the Fund aware of any tax positions for which it is reasonably possible that the total amounts of unrecognized tax benefits will significantly change in the next twelve months. The Fund files a U.S. federal tax return, in addition to state and local tax returns as required. The Fund's federal income tax returns are subject to examination by the Internal Revenue Service (IRS) for a period of three fiscal years after they are filed. State and local tax returns may be subject to examination for an additional fiscal year depending on the jurisdiction. Foreign taxes are provided for based on the Fund's understanding of the tax rules and rates that exist in the foreign markets in which it invests. The Fund is subject to a tax imposed on capital gains by certain countries in which it invests. An estimated deferred tax liability for net unrealized appreciation on the applicable securities is included in Other payables and accrued expenses on the Statement of Assets & Liabilities.
Distributions are declared and recorded on the ex-dividend date. Income dividends and capital gain distributions are declared separately for each class. Income and capital gain distributions are determined in accordance with income tax regulations, which may differ from GAAP. In addition, the Fund claimed a portion of the payment made to redeeming shareholders as a distribution for income tax purposes.
Capital accounts within the financial statements are adjusted for permanent book-tax differences. These adjustments have no impact on net assets or the results of operations. Capital accounts are not adjusted for temporary book-tax differences which will reverse in a subsequent period.
Book-tax differences are primarily due to futures contracts, foreign currency transactions, certain foreign taxes, passive foreign investment companies (PFIC), redemptions in kind, partnerships, capital loss carryforwards and losses due to deferred wash sales.
As of period end, the cost and unrealized appreciation (depreciation) in securities for federal income tax purposes were as follows:
| Gross unrealized appreciation | $17,687,403 |
| Gross unrealized depreciation | (2,713,505) |
| Net unrealized appreciation (depreciation) | $14,973,898 |
| Tax Cost | $101,966,525 |
The tax-based components of distributable earnings as of period end were as follows:
| Undistributed ordinary income | $2,925,944 |
| Undistributed long-term capital gain | $1,715,912 |
| Capital loss carryforward | $(5,453,268) |
| Net unrealized appreciation (depreciation) on securities and other investments | $14,973,891 |
Capital loss carryforwards are only available to offset future capital gains of the Fund to the extent provided by regulations and may be limited. Under the Regulated Investment Company Modernization Act of 2010 (the Act), the Fund is permitted to carry forward capital losses incurred in taxable years beginning after December 22, 2010 for an unlimited period and such capital losses are required to be used prior to any losses that expire. The capital loss carryforward information presented below, including any applicable limitation, is estimated as of fiscal period end and is subject to adjustment.
| Fiscal year of expiration | |
| 2019 | $(5,453,268) |
As a result of a large redemption in May 2017, the Fund had an "ownership change" under the Internal Revenue Code, which limits capital losses that will be available to offset future capital gains to approximately $2,189,706 per year. As a result, at least $3,402,729 of the Fund's capital loss carryforward will expire unused and is not included in the capital loss carryforward amounts disclosed in the table above.
The tax character of distributions paid was as follows:
| | October 31, 2017 | October 31, 2016 |
| Ordinary Income | $4,227,310 | $ 3,869,339 |
Short-Term Trading (Redemption) Fees. Shares held by investors in the Fund less than 30 days may have been subject to a redemption fee equal to 1.00% of the NAV of shares redeemed. All redemption fees, which reduce the proceeds of the shareholder redemption, are retained by the Fund and accounted for as an addition to paid in capital. In November 2017, the Board of Trustees approved the elimination of these redemption fees effective December 18, 2017.
Delayed Delivery Transactions and When-Issued Securities. During the period, the Fund transacted in securities on a delayed delivery or when-issued basis. Payment and delivery may take place after the customary settlement period for that security. The price of the underlying securities and the date when the securities will be delivered and paid for are fixed at the time the transaction is negotiated. The securities purchased on a delayed delivery or when-issued basis are identified as such in the Fund's Schedule of Investments. With respect to purchase commitments, the Fund identifies securities as segregated in its records with a value at least equal to the amount of the commitment. Losses may arise due to changes in the value of the underlying securities or if the counterparty does not perform under the contract's terms, or if the issuer does not issue the securities due to political, economic, or other factors.
Restricted Securities. The Fund may invest in securities that are subject to legal or contractual restrictions on resale. These securities generally may be resold in transactions exempt from registration or to the public if the securities are registered. Disposal of these securities may involve time-consuming negotiations and expense, and prompt sale at an acceptable price may be difficult. Information regarding restricted securities is included at the end of the Fund's Schedule of Investments.
4. Derivative Instruments.
Risk Exposures and the Use of Derivative Instruments. The Fund's investment objective allows the Fund to enter into various types of derivative contracts, including futures contracts. Derivatives are investments whose value is primarily derived from underlying assets, indices or reference rates and may be transacted on an exchange or over-the-counter (OTC). Derivatives may involve a future commitment to buy or sell a specified asset based on specified terms, to exchange future cash flows at periodic intervals based on a notional principal amount, or for one party to make one or more payments upon the occurrence of specified events in exchange for periodic payments from the other party.
The Fund used derivatives to increase returns and to manage exposure to certain risks as defined below. The success of any strategy involving derivatives depends on analysis of numerous economic factors, and if the strategies for investment do not work as intended, the Fund may not achieve its objectives.
The Fund's use of derivatives increased or decreased its exposure to the following risk:
| Equity Risk | Equity risk relates to the fluctuations in the value of financial instruments as a result of changes in market prices (other than those arising from interest rate risk or foreign exchange risk), whether caused by factors specific to an individual investment, its issuer, or all factors affecting all instruments traded in a market or market segment.
|
The Fund is also exposed to additional risks from investing in derivatives, such as liquidity risk and counterparty credit risk. Liquidity risk is the risk that the Fund will be unable to close out the derivative in the open market in a timely manner. Counterparty credit risk is the risk that the counterparty will not be able to fulfill its obligation to the Fund. Counterparty credit risk related to exchange-traded futures contracts may be mitigated by the protection provided by the exchange on which they trade.
Investing in derivatives may involve greater risks than investing in the underlying assets directly and, to varying degrees, may involve risk of loss in excess of any initial investment and collateral received and amounts recognized in the Statement of Assets and Liabilities. In addition, there may be the risk that the change in value of the derivative contract does not correspond to the change in value of the underlying instrument.
Futures Contracts. A futures contract is an agreement between two parties to buy or sell a specified underlying instrument for a fixed price at a specified future date. The Fund used futures contracts to manage its exposure to the stock market.
Upon entering into a futures contract, a fund is required to deposit either cash or securities (initial margin) with a clearing broker in an amount equal to a certain percentage of the face value of the contract. Futures contracts are marked-to-market daily and subsequent daily payments (variation margin) are made or received by a fund depending on the daily fluctuations in the value of the futures contracts and are recorded as unrealized appreciation or (depreciation). This receivable and/or payable, if any, is included in daily variation margin on futures contracts in the Statement of Assets and Liabilities. Realized gain or (loss) is recorded upon the expiration or closing of a futures contract. The net realized gain (loss) and change in net unrealized appreciation (depreciation) on futures contracts during the period is presented in the Statement of Operations.
5. Purchases and Sales of Investments.
Purchases and sales of securities, other than short-term securities and in-kind transactions, aggregated $146,392,579 and $148,721,164, respectively.
6. Fees and Other Transactions with Affiliates.
Management Fee. Fidelity Management & Research Company (the investment adviser) and its affiliates provide the Fund with investment management related services for which the Fund pays a monthly management fee. The management fee is the sum of an individual fund fee rate that is based on an annual rate of .45% of the Fund's average net assets and an annualized group fee rate that averaged .25% during the period. The group fee rate is based upon the average net assets of all the mutual funds advised by the investment adviser, including any mutual funds previously advised by the investment adviser that are currently advised by Fidelity SelectCo, LLC, an affiliate of the investment adviser. The group fee rate decreases as assets under management increase and increases as assets under management decrease. In addition, the management fee is subject to a performance adjustment (up to a maximum of +/- .20% of the Fund's average net assets over a 36 month performance period). The upward or downward adjustment to the management fee is based on relative investment performance of Total International Equity as compared to its benchmark index, the MSCI All Country World ex USA Index, over the same 36 month performance period. For the reporting period, the total annual management fee rate, including the performance adjustment, was .82% of the Fund's average net assets. The performance adjustment included in the management fee rate may be higher or lower than the maximum performance adjustment rate due to the difference between the average net assets for the reporting and performance periods.
Distribution and Service Plan Fees. In accordance with Rule 12b-1 of the 1940 Act, the Fund has adopted separate Distribution and Service Plans for each class of shares. Certain classes pay Fidelity Distributors Corporation (FDC), an affiliate of the investment adviser, separate Distribution and Service Fees, each of which is based on an annual percentage of each class' average net assets. In addition, FDC may pay financial intermediaries for selling shares of the Fund and providing shareholder support services. For the period, the Distribution and Service Fee rates, total fees and amounts retained by FDC were as follows:
| | Distribution
Fee | Service
Fee | Total Fees | Retained
by FDC |
| Class A | -% | .25% | $21,944 | $2,040 |
| Class M | .25% | .25% | 73,878 | – |
| Class C | .75% | .25% | 29,531 | 5,011 |
| | | | $125,353 | $7,051 |
Sales Load. FDC may receive a front-end sales charge of up to 5.75% for selling Class A shares and 3.50% for selling Class M shares, some of which is paid to financial intermediaries for selling shares of the Fund. Depending on the holding period, FDC may receive contingent deferred sales charges levied on Class A, Class M and Class C redemptions. The deferred sales charges are 1.00% for Class C shares, 1.00% for certain purchases of Class A shares and .25% for certain purchases of Class M shares.
For the period, sales charge amounts retained by FDC were as follows:
| | Retained
by FDC |
| Class A | $2,125 |
| Class M | 819 |
| Class C(a) | 563 |
| | $3,507 |
(a) When Class C shares are initially sold, FDC pays commissions from its own resources to financial intermediaries through which the sales are made.
Transfer Agent Fees. Fidelity Investments Institutional Operations Company, Inc., (FIIOC), an affiliate of the investment adviser, is the transfer, dividend disbursing and shareholder servicing agent for each class of the Fund. FIIOC receives account fees and asset-based fees that vary according to the account size and type of account of the shareholders of the respective classes of the Fund, except for Class Z. FIIOC receives an asset-based fee of Class Z's average net assets. FIIOC pays for typesetting, printing and mailing of shareholder reports, except proxy statements.
For the period, transfer agent fees for each class were as follows:
| | Amount | % of
Class-Level Average
Net Assets |
| Class A | $22,313 | .25 |
| Class M | 34,354 | .23 |
| Class C | 9,141 | .31 |
| Total International Equity | 245,274 | .13 |
| Class I | 7,410 | .19 |
| Class Z | 58 | .05(a) |
| | $318,550 | |
(a) Annualized
Accounting and Security Lending Fees. Fidelity Service Company, Inc. (FSC), an affiliate of the investment adviser, maintains the Fund's accounting records. The accounting fee is based on the level of average net assets for each month. Under a separate contract, FSC administers the security lending program. The security lending fee is based on the number and duration of lending transactions.
Brokerage Commissions. The Fund placed a portion of its portfolio transactions with brokerage firms which are affiliates of the investment adviser. Brokerage commissions are included in net realized gain (loss) and change in net unrealized appreciation (depreciation) in the Statement of Operations. The commissions paid to these affiliated firms were $597 for the period.
Interfund Trades. The Fund may purchase from or sell securities to other Fidelity Funds under procedures adopted by the Board. The procedures have been designed to ensure these interfund trades are executed in accordance with Rule 17a-7 of the 1940 Act. Interfund trades are included within the respective purchases and sales amounts shown in the Purchases and Sales of Investments note.
Redemptions In-Kind. During the period, 30,358,599 shares of the Fund held by an affiliated entity were redeemed in-kind for investments and cash with a value of $259,566,026. The net realized gain of $51,686,661 on investments delivered through the in-kind redemptions is included in the accompanying Statement of Operations. The amount of the redemptions is included in share transactions activity shown in the accompanying Statement of Changes in Net Assets as well as the Notes to Financial Statements. The Fund recognized no gain or loss for federal income tax purposes.
Other. During the period, the investment adviser reimbursed the Fund for certain losses in the amount of $3,206.
7. Committed Line of Credit.
The Fund participates with other funds managed by the investment adviser or an affiliate in a $4.25 billion credit facility (the "line of credit") to be utilized for temporary or emergency purposes to fund shareholder redemptions or for other short-term liquidity purposes. The Fund has agreed to pay commitment fees on its pro-rata portion of the line of credit, which amounted to $779 and is reflected in Miscellaneous expenses on the Statement of Operations. During the period, the Fund did not borrow on this line of credit.
8. Security Lending.
The Fund lends portfolio securities through a lending agent from time to time in order to earn additional income. For equity securities, a lending agent is used and may loan securities to certain qualified borrowers, including Fidelity Capital Markets (FCM), a broker-dealer affiliated with the Fund. On the settlement date of the loan, the Fund receives collateral (in the form of U.S. Treasury obligations, letters of credit and/or cash) against the loaned securities and maintains collateral in an amount not less than 100% of the market value of the loaned securities during the period of the loan. The market value of the loaned securities is determined at the close of business of the Fund and any additional required collateral is delivered to the Fund on the next business day. The Fund or borrower may terminate the loan at any time, and if the borrower defaults on its obligation to return the securities loaned because of insolvency or other reasons, the Fund may apply collateral received from the borrower against the obligation. The Fund may experience delays and costs in recovering the securities loaned. Any cash collateral received is invested in the Fidelity Securities Lending Cash Central Fund. The value of loaned securities and cash collateral at period end are disclosed on the Fund's Statement of Assets and Liabilities. Security lending income represents the income earned on investing cash collateral, less rebates paid to borrowers and any lending agent fees associated with the loan, plus any premium payments received for lending certain types of securities. Security lending income is presented in the Statement of Operations as a component of income from Fidelity Central Funds. Total security lending income during the period amounted to $32,511. During the period, there were no securities loaned to FCM.
9. Expense Reductions.
The investment adviser contractually agreed to reimburse each class to the extent annual operating expenses exceeded certain levels of average net assets as noted in the table below. This reimbursement will remain in place through December 31, 2018. Some expenses, for example the compensation of the independent Trustees, and certain miscellaneous expenses such as proxy and shareholder meeting expenses, are excluded from this reimbursement.
The following classes were in reimbursement during the period:
| | Expense
Limitations | Reimbursement |
| Class A | 1.45% | $19,402 |
| Class M | 1.70% | 29,290 |
| Class C | 2.20% | 8,273 |
| Total International Equity | 1.20% | 15,515 |
| Class I | 1.20% | 8,992 |
| Class Z | 1.05% | 333 |
| | | $81,805 |
Commissions paid to certain brokers with whom the investment adviser, or its affiliates, places trades on behalf of the Fund include an amount in addition to trade execution, which may be rebated back to the Fund to offset certain expenses. This amount totaled $30,620 for the period.
In addition, during the period the investment adviser reimbursed and/or waived a portion of fund-level operating expenses in the amount of $2,727.
10. Distributions to Shareholders.
Distributions to shareholders of each class were as follows:
| | Year ended
October 31, 2017 | Year ended
October 31, 2016 |
| From net investment income | | |
| Class A | $92,173 | $72,361 |
| Class M | 119,902 | 77,358 |
| Class C | 8,223 | – |
| Total International Equity | 3,979,536 | 3,691,251 |
| Class I | 27,476 | 28,369 |
| Total | $4,227,310 | $3,869,339 |
11. Share Transactions.
Share transactions for each class were as follows and may contain automatic conversions between classes or exchanges between affiliated funds:
| | Shares | Shares | Dollars | Dollars |
| | Year ended October 31, 2017(a) | Year ended October 31, 2016 | Year ended October 31, 2017(a) | Year ended October 31, 2016 |
| Class A | | | | |
| Shares sold | 192,334 | 221,277 | $1,631,763 | $1,661,593 |
| Reinvestment of distributions | 12,257 | 9,322 | 91,682 | 71,782 |
| Shares redeemed | (332,738) | (289,523) | (2,778,571) | (2,176,317) |
| Net increase (decrease) | (128,147) | (58,924) | $(1,055,126) | $(442,942) |
| Class M | | | | |
| Shares sold | 238,813 | 459,219 | $1,896,741 | $3,481,274 |
| Reinvestment of distributions | 15,944 | 9,988 | 119,902 | 77,308 |
| Shares redeemed | (372,174) | (451,150) | (3,041,931) | (3,381,486) |
| Net increase (decrease) | (117,417) | 18,057 | $(1,025,288) | $177,096 |
| Class B | | | | |
| Shares sold | – | 1,078 | $– | $7,665 |
| Shares redeemed | – | (16,441) | – | (122,211) |
| Net increase (decrease) | – | (15,363) | $– | $(114,546) |
| Class C | | | | |
| Shares sold | 96,785 | 91,061 | $808,355 | $684,626 |
| Reinvestment of distributions | 1,070 | – | 8,046 | – |
| Shares redeemed | (109,698) | (162,991) | (920,097) | (1,228,823) |
| Net increase (decrease) | (11,843) | (71,930) | $(103,696) | $(544,197) |
| Total International Equity | | | | |
| Shares sold | 6,763,065 | 4,801,342 | $53,465,510 | $36,478,674 |
| Reinvestment of distributions | 523,250 | 471,692 | 3,913,907 | 3,632,026 |
| Shares redeemed | (35,028,420)(b) | (8,073,720) | (297,076,095)(b) | (60,183,392) |
| Net increase (decrease) | (27,742,105) | (2,800,686) | $(239,696,678) | $(20,072,692) |
| Class I | | | | |
| Shares sold | 604,657 | 155,879 | $5,121,757 | $1,165,295 |
| Reinvestment of distributions | 3,621 | 3,671 | 27,016 | 28,160 |
| Shares redeemed | (167,386) | (212,465) | (1,392,556) | (1,617,545) |
| Net increase (decrease) | 440,892 | (52,915) | $3,756,217 | $(424,090) |
| Class Z | | | | |
| Shares sold | 26,796 | – | $221,657 | $– |
| Shares redeemed | (569) | – | (5,097) | – |
| Net increase (decrease) | 26,227 | – | $216,560 | $– |
(a) Share transactions for Class Z are for the period February 1, 2017 (commencement of sale of shares) to October 31, 2017
(b) Amounts include in-kind redemption (see the Redemptions In-Kind note for additional details).
12. Other.
The Fund's organizational documents provide former and current trustees and officers with a limited indemnification against liabilities arising in connection with the performance of their duties to the Fund. In the normal course of business, the Fund may also enter into contracts that provide general indemnifications. The Fund's maximum exposure under these arrangements is unknown as this would be dependent on future claims that may be made against the Fund. The risk of material loss from such claims is considered remote.
Report of Independent Registered Public Accounting Firm
To the Trustees of Fidelity Investment Trust and Shareholders of Fidelity Total International Equity Fund:
We have audited the accompanying statement of assets and liabilities of Fidelity Total International Equity Fund (the Fund), a fund of Fidelity Investment Trust, including the schedule of investments, as of October 31, 2017, and the related statement of operations for the year then ended, the statement of changes in net assets for each of the two years in the period then ended, and the financial highlights for each of the periods presented. These financial statements and financial highlights are the responsibility of the Fund's management. Our responsibility is to express an opinion on these financial statements and financial highlights based on our audits.
We conducted our audits in accordance with the standards of the Public Company Accounting Oversight Board (United States). Those standards require that we plan and perform the audit to obtain reasonable assurance about whether the financial statements and financial highlights are free of material misstatement. The Fund is not required to have, nor were we engaged to perform, an audit of its internal control over financial reporting. Our audits included consideration of internal control over financial reporting as a basis for designing audit procedures that are appropriate in the circumstances, but not for the purpose of expressing an opinion on the effectiveness of the Fund's internal control over financial reporting. Accordingly, we express no such opinion. An audit also includes examining, on a test basis, evidence supporting the amounts and disclosures in the financial statements, assessing the accounting principles used and significant estimates made by management, as well as evaluating the overall financial statement presentation. Our procedures included confirmation of securities owned as of October 31, 2017, by correspondence with the custodians and brokers; when replies were not received from brokers, we performed other auditing procedures. We believe that our audits provide a reasonable basis for our opinion.
In our opinion, such financial statements and financial highlights referred to above present fairly, in all material respects, the financial position of Fidelity Total International Equity Fund as of October 31, 2017, the results of its operations for the year then ended, the changes in its net assets for each of the two years in the period then ended, and the financial highlights for each of the periods presented, in conformity with accounting principles generally accepted in the United States of America.
DELOITTE & TOUCHE LLP
Boston, Massachusetts
December 15, 2017
Trustees and Officers
The Trustees, Members of the Advisory Board (if any), and officers of the trust and fund, as applicable, are listed below. The Board of Trustees governs the fund and is responsible for protecting the interests of shareholders. The Trustees are experienced executives who meet periodically throughout the year to oversee the fund's activities, review contractual arrangements with companies that provide services to the fund, oversee management of the risks associated with such activities and contractual arrangements, and review the fund's performance. Except for Jonathan Chiel, each of the Trustees oversees 190 funds. Mr. Chiel oversees 143 funds.
The Trustees hold office without limit in time except that (a) any Trustee may resign; (b) any Trustee may be removed by written instrument, signed by at least two-thirds of the number of Trustees prior to such removal; (c) any Trustee who requests to be retired or who has become incapacitated by illness or injury may be retired by written instrument signed by a majority of the other Trustees; and (d) any Trustee may be removed at any special meeting of shareholders by a two-thirds vote of the outstanding voting securities of the trust. Each Trustee who is not an interested person (as defined in the 1940 Act) of the trust and the fund is referred to herein as an Independent Trustee. Each Independent Trustee shall retire not later than the last day of the calendar year in which his or her 75th birthday occurs. The Independent Trustees may waive this mandatory retirement age policy with respect to individual Trustees. Officers and Advisory Board Members hold office without limit in time, except that any officer or Advisory Board Member may resign or may be removed by a vote of a majority of the Trustees at any regular meeting or any special meeting of the Trustees. Except as indicated, each individual has held the office shown or other offices in the same company for the past five years.
The fund’s Statement of Additional Information (SAI) includes more information about the Trustees. To request a free copy, call Fidelity at 1-877-208-0098.
Experience, Skills, Attributes, and Qualifications of the Trustees. The Governance and Nominating Committee has adopted a statement of policy that describes the experience, qualifications, attributes, and skills that are necessary and desirable for potential Independent Trustee candidates (Statement of Policy). The Board believes that each Trustee satisfied at the time he or she was initially elected or appointed a Trustee, and continues to satisfy, the standards contemplated by the Statement of Policy. The Governance and Nominating Committee also engages professional search firms to help identify potential Independent Trustee candidates who have the experience, qualifications, attributes, and skills consistent with the Statement of Policy. From time to time, additional criteria based on the composition and skills of the current Independent Trustees, as well as experience or skills that may be appropriate in light of future changes to board composition, business conditions, and regulatory or other developments, have also been considered by the professional search firms and the Governance and Nominating Committee. In addition, the Board takes into account the Trustees' commitment and participation in Board and committee meetings, as well as their leadership of standing and ad hoc committees throughout their tenure.
In determining that a particular Trustee was and continues to be qualified to serve as a Trustee, the Board has considered a variety of criteria, none of which, in isolation, was controlling. The Board believes that, collectively, the Trustees have balanced and diverse experience, qualifications, attributes, and skills, which allow the Board to operate effectively in governing the fund and protecting the interests of shareholders. Information about the specific experience, skills, attributes, and qualifications of each Trustee, which in each case led to the Board's conclusion that the Trustee should serve (or continue to serve) as a trustee of the fund, is provided below.
Board Structure and Oversight Function. James C. Curvey is an interested person and currently serves as Chairman. The Trustees have determined that an interested Chairman is appropriate and benefits shareholders because an interested Chairman has a personal and professional stake in the quality and continuity of services provided to the fund. Independent Trustees exercise their informed business judgment to appoint an individual of their choosing to serve as Chairman, regardless of whether the Trustee happens to be independent or a member of management. The Independent Trustees have determined that they can act independently and effectively without having an Independent Trustee serve as Chairman and that a key structural component for assuring that they are in a position to do so is for the Independent Trustees to constitute a substantial majority for the Board. The Independent Trustees also regularly meet in executive session. Ned C. Lautenbach serves as Chairman of the Independent Trustees and as such (i) acts as a liaison between the Independent Trustees and management with respect to matters important to the Independent Trustees and (ii) with management prepares agendas for Board meetings.
Fidelity® funds are overseen by different Boards of Trustees. The fund's Board oversees Fidelity's high income and certain equity funds, and other Boards oversee Fidelity's investment-grade bond, money market, asset allocation, and sector funds. The asset allocation funds may invest in Fidelity® funds overseen by the fund's Board. The use of separate Boards, each with its own committee structure, allows the Trustees of each group of Fidelity® funds to focus on the unique issues of the funds they oversee, including common research, investment, and operational issues. On occasion, the separate Boards establish joint committees to address issues of overlapping consequences for the Fidelity® funds overseen by each Board.
The Trustees operate using a system of committees to facilitate the timely and efficient consideration of all matters of importance to the Trustees, the fund, and fund shareholders and to facilitate compliance with legal and regulatory requirements and oversight of the fund's activities and associated risks. The Board, acting through its committees, has charged FMR and its affiliates with (i) identifying events or circumstances the occurrence of which could have demonstrably adverse effects on the fund's business and/or reputation; (ii) implementing processes and controls to lessen the possibility that such events or circumstances occur or to mitigate the effects of such events or circumstances if they do occur; and (iii) creating and maintaining a system designed to evaluate continuously business and market conditions in order to facilitate the identification and implementation processes described in (i) and (ii) above. Because the day-to-day operations and activities of the fund are carried out by or through FMR, its affiliates, and other service providers, the fund's exposure to risks is mitigated but not eliminated by the processes overseen by the Trustees. While each of the Board's committees has responsibility for overseeing different aspects of the fund's activities, oversight is exercised primarily through the Operations, Audit, and Compliance Committees. In addition, the Independent Trustees have worked with FMR to enhance the Board's oversight of investment and financial risks, legal and regulatory risks, technology risks, and operational risks, including the development of additional risk reporting to the Board. For example, a working group comprised of Independent Trustees and FMR has worked and continues to work to review the Fidelity® funds' valuation-related activities, reporting and risk management. Appropriate personnel, including but not limited to the fund's Chief Compliance Officer (CCO), FMR's internal auditor, the independent accountants, the fund's Treasurer and portfolio management personnel, make periodic reports to the Board's committees, as appropriate, including an annual review of Fidelity's risk management program for the Fidelity® funds. The responsibilities of each standing committee, including their oversight responsibilities, are described further under "Standing Committees of the Trustees."
Interested Trustees*:
Correspondence intended for a Trustee who is an interested person may be sent to Fidelity Investments, 245 Summer Street, Boston, Massachusetts 02210.
Name, Year of Birth; Principal Occupations and Other Relevant Experience+
Jonathan Chiel (1957)
Year of Election or Appointment: 2016
Trustee
Mr. Chiel also serves as Trustee of other Fidelity® funds. Mr. Chiel is Executive Vice President and General Counsel for FMR LLC (diversified financial services company, 2012-present). Previously, Mr. Chiel served as general counsel (2004-2012) and senior vice president and deputy general counsel (2000-2004) for John Hancock Financial Services; a partner with Choate, Hall & Stewart (1996-2000) (law firm); and an Assistant United States Attorney for the United States Attorney’s Office of the District of Massachusetts (1986-95), including Chief of the Criminal Division (1993-1995). Mr. Chiel is a director on the boards of the Boston Bar Foundation and the Maimonides School.
James C. Curvey (1935)
Year of Election or Appointment: 2007
Trustee
Chairman of the Board of Trustees
Mr. Curvey also serves as Trustee of other Fidelity® funds. Mr. Curvey is a Director of Fidelity Research & Analysis Co. (investment adviser firm, 2009-present), and Vice Chairman (2007-present) and Director of FMR LLC (diversified financial services company). In addition, Mr. Curvey serves as an Overseer for the Boston Symphony Orchestra and a member of the board of Artis-Naples, Naples, Florida, and as a Trustee for Brewster Academy, Wolfeboro, New Hampshire. Previously, Mr. Curvey served as a Director of Fidelity Investments Money Management, Inc. (investment adviser firm, 2009-2014) and a Director of FMR and FMR Co., Inc. (investment adviser firms, 2007-2014).
Charles S. Morrison (1960)
Year of Election or Appointment: 2014
Trustee
Mr. Morrison also serves as Trustee of other funds. He serves as President of Fidelity Management & Research Company (FMR) (investment adviser firm, 2016-present), a Director of Fidelity Investments Money Management, Inc. (FIMM) (investment adviser firm, 2014-present), Director of Fidelity SelectCo, LLC (investment adviser firm, 2014-present), President, Asset Management (2014-present), and is an employee of Fidelity Investments. Previously, Mr. Morrison served as Vice President of Fidelity's Fixed Income and Asset Allocation Funds (2012-2014), President, Fixed Income (2011-2014), Vice President of Fidelity's Money Market Funds (2005-2009), President, Money Market Group Leader of FMR (investment adviser firm, 2009), and Senior Vice President, Money Market Group of FMR (2004-2009). Mr. Morrison also served as Vice President of Fidelity's Bond Funds (2002-2005), certain Balanced Funds (2002-2005), and certain Asset Allocation Funds (2002-2007), and as Senior Vice President (2002-2005) of Fidelity's Bond Division.
* Determined to be an “Interested Trustee” by virtue of, among other things, his or her affiliation with the trust or various entities under common control with FMR.
+ The information includes the Trustee's principal occupation during the last five years and other information relating to the experience, attributes, and skills relevant to the Trustee's qualifications to serve as a Trustee, which led to the conclusion that the Trustee should serve as a Trustee for the fund.
Independent Trustees:
Correspondence intended for an Independent Trustee may be sent to Fidelity Investments, P.O. Box 55235, Boston, Massachusetts 02205-5235.
Name, Year of Birth; Principal Occupations and Other Relevant Experience+
Dennis J. Dirks (1948)
Year of Election or Appointment: 2005
Trustee
Mr. Dirks also serves as Trustee of other Fidelity® funds. Prior to his retirement in May 2003, Mr. Dirks was Chief Operating Officer and a member of the Board of The Depository Trust & Clearing Corporation (DTCC). He also served as President, Chief Operating Officer, and Board member of The Depository Trust Company (DTC) and President and Board member of the National Securities Clearing Corporation (NSCC). In addition, Mr. Dirks served as Chief Executive Officer and Board member of the Government Securities Clearing Corporation, Chief Executive Officer and Board member of the Mortgage-Backed Securities Clearing Corporation, as a Trustee and a member of the Finance Committee of Manhattan College (2005-2008), as a Trustee and a member of the Finance Committee of AHRC of Nassau County (2006-2008), as a member of the Independent Directors Council (IDC) Governing Council (2010-2015), and as a member of the Board of Directors for The Brookville Center for Children’s Services, Inc. (2009-2017). Mr. Dirks is a member of the Finance Committee (2016-present) and Board of Directors (2017-present) of the Asolo Repertory Theatre.
Alan J. Lacy (1953)
Year of Election or Appointment: 2008
Trustee
Mr. Lacy also serves as Trustee of other Fidelity® funds. Mr. Lacy serves as a Director of Bristol-Myers Squibb Company (global pharmaceuticals, 2008-present). He is a Trustee of the California Chapter of The Nature Conservancy (2015-present) and a Director of the Center for Advanced Study in the Behavioral Sciences at Stanford University (2015-present). In addition, Mr. Lacy served as Senior Adviser (2007-2014) of Oak Hill Capital Partners, L.P. (private equity) and also served as Chief Executive Officer (2005) and Vice Chairman (2005-2006) of Sears Holdings Corporation (retail) and Chief Executive Officer and Chairman of the Board of Sears, Roebuck and Co. (retail, 2000-2005). Previously, Mr. Lacy served as Chairman (2014-2017) and a member (2010-2017) of the Board of Directors of Dave & Buster’s Entertainment, Inc. (restaurant and entertainment complexes), as Chairman (2008-2011) and a member (2006-2015) of the Board of Trustees of the National Parks Conservation Association, and as a member of the Board of Directors for The Hillman Companies, Inc. (hardware wholesalers, 2010-2014), Earth Fare, Inc. (retail grocery, 2010-2014), and The Western Union Company (global money transfer, 2006-2011).
Ned C. Lautenbach (1944)
Year of Election or Appointment: 2000
Trustee
Chairman of the Independent Trustees
Mr. Lautenbach also serves as Trustee of other Fidelity® funds. Mr. Lautenbach currently serves as Vice Chair of the Board of Governors, State University System of Florida (2013-present) and is a member of the Council on Foreign Relations (1994-present). He is also a member and has most recently served as Chairman of the Board of Directors of Artis-Naples (2012-present). Previously, Mr. Lautenbach served as a member and then Lead Director of the Board of Directors of Eaton Corporation (diversified industrial, 1997-2016). He was also a Partner and Advisory Partner at Clayton, Dubilier & Rice, LLC (private equity investment, 1998-2010), as well as a Director of Sony Corporation (2006-2007). In addition, Mr. Lautenbach also had a 30-year career with IBM (technology company) during which time he served as Senior Vice President and a member of the Corporate Executive Committee (1968-1998).
Joseph Mauriello (1944)
Year of Election or Appointment: 2008
Trustee
Mr. Mauriello also serves as Trustee of other Fidelity® funds. Prior to his retirement in January 2006, Mr. Mauriello served in numerous senior management positions including Deputy Chairman and Chief Operating Officer (2004-2005), and Vice Chairman of Financial Services (2002-2004) of KPMG LLP US (professional services, 1965-2005). Mr. Mauriello currently serves as a member of the Board of Directors of XL Group plc. (global insurance and re-insurance, 2006-present) and the Independent Directors Council (IDC) Governing Council (2015-present). Previously, Mr. Mauriello served as a Director of the Hamilton Funds of the Bank of New York (2006-2007) and of Arcadia Resources Inc. (health care services and products, 2007-2012).
Cornelia M. Small (1944)
Year of Election or Appointment: 2005
Trustee
Ms. Small also serves as Trustee of other Fidelity® funds. Ms. Small is a member of the Board of Directors (2009-present) and Chair of the Investment Committee (2010-present) of the Teagle Foundation. Ms. Small also serves on the Investment Committee of the Berkshire Taconic Community Foundation (2008-present). Previously, Ms. Small served as Chairperson (2002-2008) and a member of the Investment Committee and Chairperson (2008-2012) and a member of the Board of Trustees of Smith College. In addition, Ms. Small served as Chief Investment Officer, Director of Global Equity Investments, and a member of the Board of Directors of Scudder, Stevens & Clark and Scudder Kemper Investments.
William S. Stavropoulos (1939)
Year of Election or Appointment: 2001
Trustee
Vice Chairman of the Independent Trustees
Mr. Stavropoulos also serves as Trustee of other Fidelity® funds. Mr. Stavropoulos serves as President and Founder of the Michigan Baseball Foundation, the Great Lakes Loons (2007-present). Mr. Stavropoulos is Chairman Emeritus of the Board of Directors of The Dow Chemical Company, where he previously served in numerous senior management positions, including President, CEO (1995-2000; 2002-2004), Chairman of the Executive Committee (2000-2006), and as a member of the Board of Directors (1990-2006). Currently, Mr. Stavropoulos is Chairman of the Board of Directors of Univar Inc. (global distributor of commodity and specialty chemicals), a Director of Teradata Corporation (data warehousing and technology solutions), and a member of the Advisory Board for Metalmark Capital LLC (private equity investment, 2005-present). Mr. Stavropoulos is an operating advisor to Clayton, Dubilier & Rice, LLC (private equity investment). In addition, Mr. Stavropoulos is a member of the University of Notre Dame Advisory Council for the College of Science, a Trustee of the Rollin L. Gerstacker Foundation, and a Director of Artis-Naples in Naples, Florida. Previously, Mr. Stavropoulos served as a Director of Chemical Financial Corporation (bank holding company, 1993-2012) and Tyco International, Ltd. (multinational manufacturing and services, 2007-2012).
David M. Thomas (1949)
Year of Election or Appointment: 2008
Trustee
Mr. Thomas also serves as Trustee of other Fidelity® funds. Mr. Thomas serves as Non-Executive Chairman of the Board of Directors of Fortune Brands Home and Security (home and security products, 2011-present), as a member of the Board of Directors (2004-present) and Presiding Director (2013-present) of Interpublic Group of Companies, Inc. (marketing communication), and as a member of the Board of Trustees of the University of Florida (2013-present). Previously, Mr. Thomas served as Executive Chairman (2005-2006) and Chairman and Chief Executive Officer (2000-2005) of IMS Health, Inc. (pharmaceutical and healthcare information solutions), and a Director of Fortune Brands, Inc. (consumer products, 2000-2011).
+ The information includes the Trustee's principal occupation during the last five years and other information relating to the experience, attributes, and skills relevant to the Trustee's qualifications to serve as a Trustee, which led to the conclusion that the Trustee should serve as a Trustee for the fund.
Advisory Board Members and Officers:
Correspondence intended for an officer or Peter S. Lynch may be sent to Fidelity Investments, 245 Summer Street, Boston, Massachusetts 02210. Officers appear below in alphabetical order.
Name, Year of Birth; Principal Occupation
Peter S. Lynch (1944)
Year of Election or Appointment: 2003
Member of the Advisory Board
Mr. Lynch also serves as Member of the Advisory Board of other Fidelity® funds. Mr. Lynch is Vice Chairman and a Director of FMR (investment adviser firm) and FMR Co., Inc. (investment adviser firm). In addition, Mr. Lynch serves as a Trustee of Boston College and as the Chairman of the Inner-City Scholarship Fund. Previously, Mr. Lynch served on the Special Olympics International Board of Directors (1997-2006).
Elizabeth Paige Baumann (1968)
Year of Election or Appointment: 2017
Anti-Money Laundering (AML) Officer
Ms. Baumann also serves as AML Officer of other funds. She is Chief AML Officer (2012-present) and Senior Vice President (2014-present) of FMR LLC (diversified financial services company) and is an employee of Fidelity Investments. Previously, Ms. Baumann served as AML Officer of the funds (2012-2016), and Vice President (2007-2014) and Deputy Anti-Money Laundering Officer (2007-2012) of FMR LLC.
Marc R. Bryant (1966)
Year of Election or Appointment: 2015
Secretary and Chief Legal Officer (CLO)
Mr. Bryant also serves as Secretary and CLO of other funds. Mr. Bryant serves as CLO, Secretary, and Senior Vice President of Fidelity Management & Research Company (investment adviser firm, 2015-present) and FMR Co., Inc. (investment adviser firm, 2015-present); Secretary of Fidelity SelectCo, LLC (investment adviser firm, 2015-present) and Fidelity Investments Money Management, Inc. (investment adviser firm, 2015-present); and CLO of Fidelity Management & Research (Hong Kong) Limited and FMR Investment Management (UK) Limited (investment adviser firms, 2015-present) and Fidelity Management & Research (Japan) Limited (investment adviser firm, 2016-present). He is Senior Vice President and Deputy General Counsel of FMR LLC (diversified financial services company). Previously, Mr. Bryant served as Secretary and CLO of Fidelity Rutland Square Trust II (2010-2014) and Assistant Secretary of Fidelity's Fixed Income and Asset Allocation Funds (2013-2015). Prior to joining Fidelity Investments, Mr. Bryant served as a Senior Vice President and the Head of Global Retail Legal for AllianceBernstein L.P. (2006-2010), and as the General Counsel for ProFund Advisors LLC (2001-2006).
William C. Coffey (1969)
Year of Election or Appointment: 2009
Assistant Secretary
Mr. Coffey also serves as Assistant Secretary of other funds. He is Senior Vice President and Deputy General Counsel of FMR LLC (diversified financial services company, 2010-present), and is an employee of Fidelity Investments. Previously, Mr. Coffey served as Vice President and Associate General Counsel of FMR LLC (2005-2009).
Jonathan Davis (1968)
Year of Election or Appointment: 2010
Assistant Treasurer
Mr. Davis also serves as Assistant Treasurer of other funds, and is an employee of Fidelity Investments. Previously, Mr. Davis served as Vice President and Associate General Counsel of FMR LLC (diversified financial services company, 2003-2010).
Adrien E. Deberghes (1967)
Year of Election or Appointment: 2016
Assistant Treasurer
Mr. Deberghes also serves as an officer of other funds. He serves as Executive Vice President of Fidelity Investments Money Management, Inc. (FIMM) (investment adviser firm, 2016-present) and is an employee of Fidelity Investments (2008-present). Prior to joining Fidelity Investments, Mr. Deberghes was Senior Vice President of Mutual Fund Administration at State Street Corporation (2007-2008), Senior Director of Mutual Fund Administration at Investors Bank & Trust (2005-2007), and Director of Finance for Dunkin' Brands (2000-2005). Previously, Mr. Deberghes served in other fund officer roles.
Joseph DeSantis (1959)
Year of Election or Appointment: 2017
Vice President
Mr. DeSantis also serves as Vice President of other funds. Mr. DeSantis serves as a Director of Fidelity Management & Research (Japan) Limited (investment adviser firm, 2016-present), Chief Investment Officer, Equities (2010-present) and is an employee of Fidelity Investments.
Stephanie J. Dorsey (1969)
Year of Election or Appointment: 2010
Assistant Treasurer
Ms. Dorsey also serves as an officer of other funds. She is an employee of Fidelity Investments (2008-present) and has served in other fund officer roles. Prior to joining Fidelity Investments, Ms. Dorsey served as Treasurer (2004-2008) of the JPMorgan Mutual Funds and Vice President (2004-2008) of JPMorgan Chase Bank.
Howard J. Galligan III (1966)
Year of Election or Appointment: 2014
Chief Financial Officer
Mr. Galligan also serves as Chief Financial Officer of other funds. Mr. Galligan serves as President of Fidelity Pricing and Cash Management Services (FPCMS) (2014-present) and as a Director of Strategic Advisers, Inc. (investment adviser firm, 2008-present). Previously, Mr. Galligan served as Chief Administrative Officer of Asset Management (2011-2014) and Chief Operating Officer and Senior Vice President of Investment Support for Strategic Advisers, Inc. (2003-2011).
Brian B. Hogan (1964)
Year of Election or Appointment: 2009
Vice President
Mr. Hogan also serves as Trustee or Vice President of other funds. Mr. Hogan serves as a Director of FMR Investment Management (UK) Limited (investment adviser firm, 2015-present) and Fidelity SelectCo, LLC (investment adviser firm, 2014-present) and President of the Equity Division of FMR (investment adviser firm, 2009-present). Previously, Mr. Hogan served as Senior Vice President, Equity Research of FMR (2006-2009) and as a portfolio manager. Mr. Brian B. Hogan is not related to Mr. Colm A. Hogan.
Colm A. Hogan (1973)
Year of Election or Appointment: 2016
Deputy Treasurer
Mr. Hogan also serves as an officer of other funds. Mr. Hogan is an employee of Fidelity Investments (2005-present). Mr. Colm A. Hogan is not related to Mr. Brian B. Hogan.
Chris Maher (1972)
Year of Election or Appointment: 2013
Assistant Treasurer
Mr. Maher serves as Assistant Treasurer of other funds. Mr. Maher is Vice President of Valuation Oversight and is an employee of Fidelity Investments. Previously, Mr. Maher served as Vice President of Asset Management Compliance (2013), Vice President of the Program Management Group of FMR (investment adviser firm, 2010-2013), and Vice President of Valuation Oversight (2008-2010).
Rieco E. Mello (1969)
Year of Election or Appointment: 2017
Assistant Treasurer
Mr. Mello also serves as Assistant Treasurer of other funds. Mr. Mello is an employee of Fidelity Investments (1995-present).
Kenneth B. Robins (1969)
Year of Election or Appointment: 2016
Chief Compliance Officer
Mr. Robins also serves as an officer of other funds. Mr. Robins serves as Compliance Officer of Fidelity Management & Research Company and FMR Co., Inc. (investment adviser firms, 2016-present) and is an employee of Fidelity Investments (2004-present). Previously, Mr. Robins served as Executive Vice President of Fidelity Investments Money Management, Inc. (investment adviser firm, 2013-2016) and served in other fund officer roles.
Stacie M. Smith (1974)
Year of Election or Appointment: 2016
President and Treasurer
Ms. Smith also serves as an officer of other funds. She is an employee of Fidelity Investments (2009-present) and has served in other fund officer roles. Prior to joining Fidelity Investments, Ms. Smith served as Senior Audit Manager of Ernst & Young LLP (accounting firm, 1996-2009). Previously, Ms. Smith served as Deputy Treasurer of certain Fidelity® funds (2013-2016).
Marc L. Spector (1972)
Year of Election or Appointment: 2016
Assistant Treasurer
Mr. Spector also serves as an officer of other funds. Mr. Spector is an employee of Fidelity Investments (2016-present). Prior to joining Fidelity Investments, Mr. Spector served as Director at the Siegfried Group (accounting firm, 2013-2016), and prior to Siegfried Group as audit senior manager at Deloitte & Touche (accounting firm, 2005-2013).
Renee Stagnone (1975)
Year of Election or Appointment: 2016
Assistant Treasurer
Ms. Stagnone also serves as an officer of other funds. Ms. Stagnone is an employee of Fidelity Investments (1997-present). Previously, Ms. Stagnone served as Deputy Treasurer of certain Fidelity® funds (2013-2016).
Shareholder Expense Example
As a shareholder of the Fund, you incur two types of costs: (1) transaction costs, including sales charges (loads) on purchase payments or redemption proceeds, redemption fees and (2) ongoing costs, including management fees, distribution and/or service (12b-1) fees and other Fund expenses. This Example is intended to help you understand your ongoing costs (in dollars) of investing in the Fund and to compare these costs with the ongoing costs of investing in other mutual funds.
The Example is based on an investment of $1,000 invested at the beginning of the period and held for the entire period (May 1, 2017 to October 31, 2017).
Actual Expenses
The first line of the accompanying table for each class of the Fund provides information about actual account values and actual expenses. You may use the information in this line, together with the amount you invested, to estimate the expenses that you paid over the period. Simply divide your account value by $1,000.00 (for example, an $8,600 account value divided by $1,000.00 = 8.6), then multiply the result by the number in the first line for a class of the Fund under the heading entitled "Expenses Paid During Period" to estimate the expenses you paid on your account during this period. A small balance maintenance fee of $12.00 that is charged once a year may apply for certain accounts with a value of less than $2,000. This fee is not included in the table below. If it was, the estimate of expenses you paid during the period would be higher, and your ending account value lower, by this amount. In addition, the Fund, as a shareholder in the underlying Fidelity Central Funds, will indirectly bear its pro-rata share of the fees and expenses incurred by the underlying Fidelity Central Funds. These fees and expenses are not included in the Fund's annualized expense ratio used to calculate the expense estimate in the table below.
Hypothetical Example for Comparison Purposes
The second line of the accompanying table for each class of the Fund provides information about hypothetical account values and hypothetical expenses based on a Class' actual expense ratio and an assumed rate of return of 5% per year before expenses, which is not the Class' actual return. The hypothetical account values and expenses may not be used to estimate the actual ending account balance or expenses you paid for the period. You may use this information to compare the ongoing costs of investing in the Fund and other funds. To do so, compare this 5% hypothetical example with the 5% hypothetical examples that appear in the shareholder reports of the other funds. A small balance maintenance fee of $12.00 that is charged once a year may apply for certain accounts with a value of less than $2,000. This fee is not included in the table below. If it was, the estimate of expenses you paid during the period would be higher, and your ending account value lower, by this amount. In addition, the Fund, as a shareholder in the underlying Fidelity Central Funds, will indirectly bear its pro-rata share of the fees and expenses incurred by the underlying Fidelity Central Funds. These fees and expenses are not included in the Fund's annualized expense ratio used to calculate the expense estimate in the table below.
Please note that the expenses shown in the table are meant to highlight your ongoing costs only and do not reflect any transaction costs. Therefore, the second line of the table is useful in comparing ongoing costs only, and will not help you determine the relative total costs of owning different funds. In addition, if these transactional costs were included, your costs would have been higher.
| | Annualized Expense Ratio-A | Beginning
Account Value
May 1, 2017 | Ending
Account Value
October 31, 2017 | Expenses Paid
During Period-B
May 1, 2017
to October 31, 2017 |
| Class A | 1.45% | | | |
| Actual | | $1,000.00 | $1,120.50 | $7.75 |
| Hypothetical-C | | $1,000.00 | $1,017.90 | $7.38 |
| Class M | 1.70% | | | |
| Actual | | $1,000.00 | $1,120.10 | $9.08 |
| Hypothetical-C | | $1,000.00 | $1,016.64 | $8.64 |
| Class C | 2.20% | | | |
| Actual | | $1,000.00 | $1,116.80 | $11.74 |
| Hypothetical-C | | $1,000.00 | $1,014.12 | $11.17 |
| Total International Equity | 1.20% | | | |
| Actual | | $1,000.00 | $1,120.40 | $6.41 |
| Hypothetical-C | | $1,000.00 | $1,019.16 | $6.11 |
| Class I | 1.20% | | | |
| Actual | | $1,000.00 | $1,122.00 | $6.42 |
| Hypothetical-C | | $1,000.00 | $1,019.16 | $6.11 |
| Class Z | 1.05% | | | |
| Actual | | $1,000.00 | $1,121.90 | $5.62 |
| Hypothetical-C | | $1,000.00 | $1,019.91 | $5.35 |
A Annualized expense ratio reflects expenses net of applicable fee waivers.
B Expenses are equal to each Class' annualized expense ratio, multiplied by the average account value over the period, multiplied by 184/365 (to reflect the one-half year period).
C 5% return per year before expenses
Distributions (Unaudited)
The Board of Trustees of Fidelity Total International Equity Fund voted to pay to shareholders of record at the opening of business on record date, the following distributions per share derived from capital gains realized from sales of portfolio securities, and dividends derived from net investment income:
| | Pay Date | Record Date | Dividends | Capital Gains |
| Fidelity Total International Equity Fund | | | | |
| Class A | 12/11/17 | 12/08/17 | $0.152 | $0.226 |
| Class M | 12/11/17 | 12/08/17 | $0.133 | $0.226 |
| Class C | 12/11/17 | 12/08/17 | $0.097 | $0.226 |
| Total International Equity | 12/11/17 | 12/08/17 | $0.149 | $0.226 |
| Class I | 12/11/17 | 12/08/17 | $0.171 | $0.226 |
| Class Z | 12/11/17 | 12/08/17 | $0.171 | $0.226 |
|
The fund hereby designates as a capital gain dividend with respect to the taxable year ended October 31, 2017, $2,209,744 or, if subsequently determined to be different, the net capital gain of such year.
Class A designates 11%, Class M designates 13%, Class C designates 29%, Total International Equity designates 9%, and Class I designates 10% of the dividend distributed during the fiscal year as qualifying for the dividends–received deduction for corporate shareholders.
Class A, Class M, Class C, Total International Equity, and Class I designate 100% of the dividend distributed during the fiscal year as amounts which may be taken into account as a dividend for purposes of the maximum rate under section 1(h)(11) of the Internal Revenue Code.
The amounts per share which represent income derived from sources within, and taxes paid to, foreign countries or possessions of the United States are as follows:
| | Pay Date | Income | Taxes |
| Fidelity Total International Equity Fund | | | |
| Class A | 12/12/16 | $0.0973 | $0.0143 |
| Class M | 12/12/16 | $0.0803 | $0.0143 |
| Class C | 12/12/16 | $0.0373 | $0.0143 |
| Total International Equity | 12/12/16 | $0.1233 | $0.0143 |
| Class I | 12/12/16 | $0.1133 | $0.0143 |
|
The fund will notify shareholders in January 2018 of amounts for use in preparing 2017 income tax returns.
Board Approval of Investment Advisory Contracts and Management Fees
Fidelity Total International Equity Fund
Each year, the Board of Trustees, including the Independent Trustees (together, the Board), votes on the renewal of the management contract with Fidelity Management & Research Company (FMR) and the sub-advisory agreements (together, the Advisory Contracts) for the fund. FMR and the sub-advisers are referred to herein as the Investment Advisers. The Board, assisted by the advice of fund counsel and Independent Trustees' counsel, requests and considers a broad range of information relevant to the renewal of the Advisory Contracts throughout the year.
The Board meets regularly and, at each of its meetings, covers an extensive agenda of topics and materials and considers factors that are relevant to its annual consideration of the renewal of the fund's Advisory Contracts, including the services and support provided to the fund and its shareholders. The Board has established various standing committees (Committees), each composed of and chaired by Independent Trustees with varying backgrounds, to which the Board has assigned specific subject matter responsibilities in order to enhance effective decision-making by the Board. The Board, acting directly and through its Committees, requests and receives information concerning the annual consideration of the renewal of the fund's Advisory Contracts. The Board also meets as needed to review matters specifically related to the Board's annual consideration of the renewal of the Advisory Contracts. Members of the Board may also meet with trustees of other Fidelity funds through ad hoc joint committees to discuss certain matters relevant to all of the Fidelity funds.
At its July 2017 meeting, the Board unanimously determined to renew the fund's Advisory Contracts. In reaching its determination, the Board considered all factors it believed relevant, including (i) the nature, extent, and quality of the services to be provided to the fund and its shareholders (including the investment performance of the fund); (ii) the competitiveness of the fund's management fee and total expense ratio relative to peer funds; (iii) the total costs of the services to be provided by and the profits to be realized by Fidelity from its relationships with the fund; and (iv) the extent to which, if any, economies of scale exist and would be realized as the fund grows, and whether any economies of scale are appropriately shared with fund shareholders.
In considering whether to renew the Advisory Contracts for the fund, the Board reached a determination, with the assistance of fund counsel and Independent Trustees' counsel and through the exercise of its business judgment, that the renewal of the Advisory Contracts was in the best interests of the fund and its shareholders and that the compensation payable under the Advisory Contracts was fair and reasonable. The Board's decision to renew the Advisory Contracts was not based on any single factor, but rather was based on a comprehensive consideration of all the information provided to the Board at its meetings throughout the year. The Board, in reaching its determination to renew the Advisory Contracts, was aware that shareholders of the fund have a broad range of investment choices available to them, including a wide choice among funds offered by Fidelity's competitors, and that the fund's shareholders, who have the opportunity to review and weigh the disclosure provided by the fund in its prospectus and other public disclosures, have chosen to invest in this fund, which is part of the Fidelity family of funds.
Amendment to Group Fee Rate. The Board also approved an amendment to the management contract for the fund to add an additional breakpoint to the group fee schedule, effective October 1, 2017. The Board noted that the additional breakpoint would result in lower management fee rates as Fidelity's assets under management increase.
Nature, Extent, and Quality of Services Provided. The Board considered Fidelity's staffing as it relates to the fund, including the backgrounds of investment personnel of Fidelity, and also considered the fund's investment objective, strategies, and related investment philosophy. The Independent Trustees also had discussions with senior management of Fidelity's investment operations and investment groups. The Board considered the structure of the investment personnel compensation program and whether this structure provides appropriate incentives to act in the best interests of the fund. Additionally, the Board considered the portfolio managers' investments, if any, in the funds that they manage.
Resources Dedicated to Investment Management and Support Services. The Board and the Fund Oversight and Research Committees reviewed the general qualifications and capabilities of Fidelity's investment staff, including its size, education, experience, and resources, as well as Fidelity's approach to recruiting, training, managing, and compensating investment personnel. The Board noted that Fidelity has continued to increase the resources devoted to non-U.S. offices, including expansion of Fidelity's global investment organization. The Board also noted that Fidelity's analysts have extensive resources, tools and capabilities that allow them to conduct sophisticated quantitative and fundamental analysis, as well as credit analysis of issuers, counterparties and guarantors. Further, the Board considered that Fidelity's investment professionals have sufficient access to global information and data so as to provide competitive investment results over time, and that those professionals also have access to sophisticated tools that permit them to assess portfolio construction and risk and performance attribution characteristics continuously, as well as to transmit new information and research conclusions rapidly around the world. Additionally, in its deliberations, the Board considered Fidelity's trading, risk management, compliance, and technology and operations capabilities and resources, which are integral parts of the investment management process.
Shareholder and Administrative Services. The Board considered (i) the nature, extent, quality, and cost of advisory, administrative, and shareholder services performed by the Investment Advisers and their affiliates under the Advisory Contracts and under separate agreements covering transfer agency, pricing and bookkeeping, and securities lending services for the fund; (ii) the nature and extent of the supervision of third party service providers, principally custodians, subcustodians, and pricing vendors; and (iii) the resources devoted to, and the record of compliance with, the fund's compliance policies and procedures. The Board also reviewed the allocation of fund brokerage, including allocations to brokers affiliated with the Investment Advisers, the use of brokerage commissions to pay fund expenses, and the use of "soft" commission dollars to pay for research services.
The Board noted that the growth of fund assets over time across the complex allows Fidelity to reinvest in the development of services designed to enhance the value or convenience of the Fidelity funds as investment vehicles. These services include 24-hour access to account information and market information through telephone representatives and over the Internet, investor education materials and asset allocation tools, and the expanded availability of Fidelity Investor Centers.
In 2014, the Board formed an ad hoc Committee on Transfer Agency Fees to review the variety of transfer agency fee structures throughout the industry and Fidelity's competitive positioning with respect to industry participants.
Investment in a Large Fund Family. The Board considered the benefits to shareholders of investing in a Fidelity fund, including the benefits of investing in a fund that is part of a large family of funds offering a variety of investment disciplines and providing a large variety of mutual fund investor services. The Board noted that Fidelity had taken, or had made recommendations that resulted in the Fidelity funds taking, a number of actions over the previous year that benefited particular funds, including: (i) continuing to dedicate additional resources to Fidelity's investment research process, and to the support of the senior management team that oversees asset management; (ii) continuing efforts to enhance Fidelity's global research capabilities; (iii) launching new funds and making other enhancements to meet client needs; (iv) launching new share classes of existing funds; (v) eliminating purchase minimums and broadening eligibility requirements for certain lower-priced share classes; (vi) reducing management fees and total expenses for certain growth equity funds and index funds; (vii) lowering expense caps for certain existing funds and classes to reduce expenses borne by shareholders; (viii) eliminating short-term redemption fees for certain funds; (ix) introducing a new pricing structure for certain funds of funds that is expected to reduce overall expenses paid by shareholders; (x) rationalizing product lines and gaining increased efficiencies through proposals for fund mergers and share class consolidations; (xi) continuing to develop, acquire and implement systems and technology to improve services to the funds and shareholders, strengthen information security, and increase efficiency; and (xii) implementing enhancements to further strengthen Fidelity's product line to increase investors' probability of success in achieving their investment goals, including retirement income goals.
Investment Performance. The Board considered whether the fund has operated in accordance with its investment objective, as well as its record of compliance with its investment restrictions and its performance history. The Board noted that there was a portfolio management change for the fund in June 2014.
The Board took into account discussions with representatives of the Investment Advisers about fund investment performance that occur at Board meetings throughout the year. In this regard the Board noted that as part of regularly scheduled fund reviews and other reports to the Board on fund performance, the Board considers annualized return information for the fund for different time periods, measured against a securities market index ("benchmark index") and a peer group of funds with similar objectives ("peer group"), if any. In its evaluation of fund investment performance, the Board gave particular attention to information indicating changes in performance of certain Fidelity funds for specific time periods and discussed with the Investment Advisers the reasons for any overperformance or underperformance.
In addition to reviewing absolute and relative fund performance, the Independent Trustees periodically consider the appropriateness of fund performance metrics in evaluating the results achieved. In general, the Independent Trustees believe that fund performance should be evaluated based on net performance (after fees and expenses) of both the highest performing and lowest performing fund share classes, where applicable, compared to appropriate benchmark indices, over appropriate time periods that may include full market cycles, and compared to peer groups, as applicable, over the same periods, taking into account relevant factors including the following: general market conditions; issuer-specific information; and fund cash flows and other factors.
The Independent Trustees recognize that shareholders evaluate performance on a net basis over their own holding periods, for which one-, three-, and five-year periods are often used as a proxy. For this reason, the performance information reviewed by the Board also included net cumulative calendar year total return information for the fund and an appropriate benchmark index and peer group for the most recent one-, three-, and five-year periods, as shown below. Returns are shown compared to the 25th percentile (top of box, 75% beaten) and 75th percentile (bottom of box, 25% beaten) of the peer universe. Returns of the benchmark index are "net MA,"
i.e., adjusted for tax withholding rates applicable to U.S.-based funds organized as Massachusetts business trusts.
Fidelity Total International Equity Fund
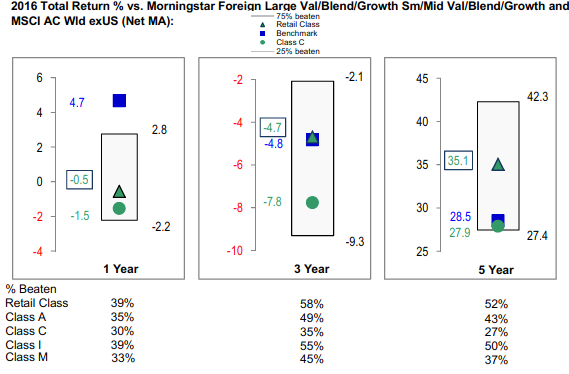
The Board also considered that the fund's management fee is subject to upward or downward adjustment depending upon whether, and to what extent, the fund's investment performance for the performance period (a rolling 36-month period) exceeds, or is exceeded by, a securities index, thus leading to a performance adjustment for the same period. The Board noted that the performance adjustment provides FMR with a strong economic incentive to seek to achieve superior long-term performance for the fund's shareholders and helps to more closely align the interests of FMR and the shareholders of the fund.
Based on its review, the Board concluded that the nature, extent, and quality of services provided to the fund under the Advisory Contracts should continue to benefit the shareholders of the fund.
Competitiveness of Management Fee and Total Expense Ratio. The Board considered the fund's management fee and total expense ratio compared to "mapped groups" of competitive funds and classes created for the purpose of facilitating the Trustees' competitive analysis of management fees and total expenses. Fidelity creates "mapped groups" by combining similar Lipper investment objective categories that have comparable investment mandates. Combining Lipper investment objective categories aids the Board's management fee and total expense ratio comparisons by broadening the competitive group used for comparison.
Management Fee. The Board considered two proprietary management fee comparisons for the 12-month periods shown in basis points (BP) in the chart below. The group of Lipper funds used by the Board for management fee comparisons is referred to below as the "Total Mapped Group." The Total Mapped Group comparison focuses on a fund's standing in terms of gross management fees before expense reimbursements or caps, and without giving effect to the fund's performance adjustment, relative to the total universe of funds with comparable investment mandates, regardless of whether their management fee structures also are comparable. Funds with comparable investment mandates offer exposure to similar types of securities. Funds with comparable management fee structures have similar management fee contractual arrangements (
e.g., flat rate charged for advisory services, all-inclusive fee rate,
etc.). "TMG %" represents the percentage of funds in the Total Mapped Group that had management fees that were lower than the fund's. For example, a hypothetical TMG % of 20% would mean that 80% of the funds in the Total Mapped Group had higher, and 20% had lower, management fees than the fund. The fund's actual TMG %s and the number of funds in the Total Mapped Group are in the chart below. The "Asset-Size Peer Group" (ASPG) comparison focuses on a fund's standing relative to a subset of non-Fidelity funds within the Total Mapped Group that are similar in size and management fee structure without taking into account performance adjustments, if any. For example, if a fund is in the first quartile of the ASPG, the fund's management fee ranks in the least expensive or lowest 25% of funds in the ASPG. The ASPG represents at least 15% of the funds in the Total Mapped Group with comparable asset size and management fee structures, subject to a minimum of 50 funds (or all funds in the Total Mapped Group if fewer than 50). Additional information, such as the ASPG quartile in which the fund's management fee rate ranked and the impact of the fund's performance adjustment, is also included in the chart and considered by the Board.
Fidelity Total International Equity Fund
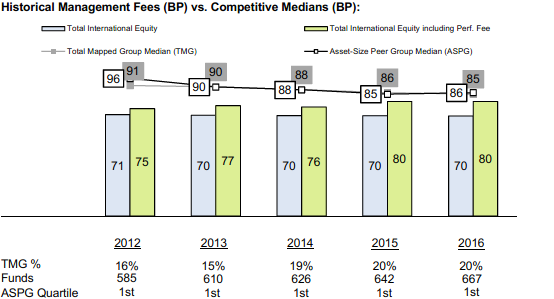
The Board noted that the fund's management fee rate ranked below the median of its Total Mapped Group and below the median of its ASPG for 2016. The Board also noted the effect of the fund's performance adjustment, if any, on the fund's management fee ranking.
The Board noted that, in 2014, the Board and the boards of other Fidelity funds formed the ad hoc Committee on Group Fee to conduct an in-depth review of the "group fee" component of the management fee of funds with such management fee structures. The Committee's focus included the mechanics of the group fee, the competitive landscape of group fee structures, Fidelity funds with no group fee component and investment products not included in group fee assets. The Board also considered that, for funds subject to the group fee, FMR agreed to voluntarily waive fees over a specified period of time in amounts designed to account for assets converted from certain funds to certain collective investment trusts.
The Board also noted that, in 2013, the ad hoc Committee on Management Fees was formed to conduct an in-depth review of the management fee rates of Fidelity's active equity mutual funds. The Committee focused on the following areas: (i) standard fee structures; (ii) research consumption and trading evolution; (iii) management fee competitiveness/profitability by category; and (iv) factors that drive institutional pricing.
Based on its review, the Board concluded that the fund's management fee is fair and reasonable in light of the services that the fund receives and the other factors considered.
Total Expense Ratio. In its review of each class's total expense ratio, the Board considered the fund's management fee rate as well as other fund or class expenses, as applicable, such as transfer agent fees, pricing and bookkeeping fees, fund-paid 12b-1 fees, and custodial, legal, and audit fees. The Board noted the impact of the fund's performance adjustment. The Board also noted that Fidelity may agree to waive fees and expenses from time to time, and the extent to which, if any, it has done so for the fund. As part of its review, the Board also considered the current and historical total expense ratios of each class of the fund compared to competitive fund median expenses. Each class of the fund is compared to those funds and classes in the Total Mapped Group (used by the Board for management fee comparisons) that have a similar sales load structure.
The Board noted that the total expense ratio of the retail class ranked below the competitive median for 2016 and the total expense ratio of each of Class A, Class M (formerly Class T), Class C, and Class I ranked above the competitive median for 2016. The Board considered that, in general, various factors can affect total expense ratios. The Board noted that the total expense ratio of each of Class A, Class M, Class C, and Class I was above the competitive median because of a positive performance fee adjustment in 2016 and relatively higher other expenses due to low asset levels. The Board noted that the total expense ratio of Class M was also above the competitive median because of higher 12b-1 fees on Class M as compared to most competitor funds. Class M has a higher 12b-1 fee, but a lower front-end sales charge, than traditionally priced front-end sales charge classes. The Board considered that Class M is primarily sold load-waived in the retirement plan market where its 0.50% 12b-1 fee is comparable to competing no-load, higher 12b-1 fee classes designed specifically for retirement plans. The Board noted that the total expense ratio of Class C was also above the competitive median because of its 12b-1 fees. The Board also noted that, although Class I is categorized by Lipper as an institutional class, Class I has a significantly lower investment minimum than most other funds and classes categorized as institutional. As a result, FMR believes Class I is generally more comparable to retail funds and classes. The Board noted that the fund offers multiple classes, each of which has a different sales load and 12b-1 fee structure, and that the multiple structures are intended to offer a range of pricing options for the intermediary market. The Board also noted that the total expense ratios of the classes vary primarily by the level of their 12b-1 fees, although differences in transfer agent fees may also cause expenses to vary from class to class.
The Board further considered that FMR has contractually agreed to reimburse Class A, Class M, Class C, Class I, and the retail class of the fund to the extent that total operating expenses (excluding interest, certain taxes, certain securities lending costs, brokerage commissions, fees and expenses of the Independent Trustees, proxy and shareholder meeting expenses, extraordinary expenses, and acquired fund fees and expenses, if any), as a percentage of their respective average net assets, exceed 1.45%, 1.70%, 2.20%, 1.20%, and 1.20% through December 31, 2018.
Fees Charged to Other Fidelity Clients. The Board also considered Fidelity fee structures and other information with respect to clients of Fidelity, such as other funds advised or subadvised by Fidelity, pension plan clients, and other institutional clients with similar mandates. The Board noted that an ad hoc joint committee created by it and the boards of other Fidelity funds periodically (most recently in 2013) reviews and compares Fidelity's institutional investment advisory business with its business of providing services to the Fidelity funds, including the differences in services provided, fees charged, and costs incurred, as well as competition in their respective marketplaces.
Based on its review of total expense ratios and fees charged to other Fidelity clients, the Board concluded that, although some classes were above the median of the universe presented for comparison, the total expense ratio of each class of the fund was reasonable in light of the services that the fund and its shareholders receive and the other factors considered.
Costs of the Services and Profitability. The Board considered the revenues earned and the expenses incurred by Fidelity in conducting the business of developing, marketing, distributing, managing, administering and servicing the fund and servicing the fund's shareholders. The Board also considered the level of Fidelity's profits in respect of all the Fidelity funds.
On an annual basis, Fidelity presents to the Board information about the profitability of its relationships with the fund. Fidelity calculates profitability information for each fund, as well as aggregate profitability information for groups of Fidelity funds and all Fidelity funds, using a series of detailed revenue and cost allocation methodologies which originate with the books and records of Fidelity on which Fidelity's audited financial statements are based. The Audit Committee of the Board reviews any significant changes from the prior year's methodologies.
PricewaterhouseCoopers LLP (PwC), independent registered public accounting firm and auditor to Fidelity and certain Fidelity funds, has been engaged annually by the Board as part of the Board's assessment of Fidelity's profitability analysis. PwC's engagement includes the review and assessment of the methodologies used by Fidelity in determining the revenues and expenses attributable to Fidelity's mutual fund business, and completion of agreed-upon procedures in respect of the mathematical accuracy of the fund profitability information and its conformity to established allocation methodologies. After considering PwC's reports issued under the engagement and information provided by Fidelity, the Board concluded that while other allocation methods may also be reasonable, Fidelity's profitability methodologies are reasonable in all material respects.
The Board also reviewed Fidelity's non-fund businesses and potential fall-out benefits related to the mutual fund business as well as cases where Fidelity's affiliates may benefit from or be related to the fund's business.
The Board considered the costs of the services provided by and the profits realized by Fidelity in connection with the operation of the fund and was satisfied that the profitability was not excessive.
Economies of Scale. The Board considered whether there have been economies of scale in respect of the management of the Fidelity funds, whether the Fidelity funds (including the fund) have appropriately benefited from any such economies of scale, and whether there is potential for realization of any further economies of scale. The Board considered the extent to which the fund will benefit from economies of scale as assets grow through increased services to the fund, through waivers or reimbursements, or through fee or expense ratio reductions. The Board also noted that a committee (the Economies of Scale Committee) created by it and the boards of other Fidelity funds periodically (most recently in 2013) analyzes whether Fidelity attains economies of scale in respect of the management and servicing of the Fidelity funds, whether the Fidelity funds have appropriately benefited from such economies of scale, and whether there is potential for realization of any further economies of scale.
The Board recognized that the fund's management contract incorporates a "group fee" structure, which provides for lower group fee rates as total group assets increase, and for higher group fee rates as total group assets decrease (with "group assets" defined to include fund assets under FMR's management plus the assets of sector funds previously under FMR's management). FMR calculates the group fee rates based on a tiered asset "breakpoint" schedule that varies based on asset class. The Board considered that the group fee is designed to deliver the benefits of economies of scale to fund shareholders when total Fidelity fund assets increase, even if assets of any particular fund are unchanged or have declined, because some portion of Fidelity's costs are attributable to services provided to all Fidelity funds, and all funds benefit if those costs can be allocated among more assets. The Board concluded that, given the group fee structure, fund shareholders will benefit from lower management fees as group assets increase at the fund complex level, regardless of whether Fidelity achieves any such economies of scale.
The Board concluded, taking into account the analysis of the Economies of Scale Committee, that economies of scale, if any, are being appropriately shared between fund shareholders and Fidelity.
Additional Information Requested by the Board. In order to develop fully the factual basis for consideration of the Fidelity funds' advisory contracts, the Board requested and received additional information on certain topics, including: (i) fund performance trends, in particular the underperformance of certain funds, and Fidelity's long-term strategies for certain funds; (ii) Fidelity's fund profitability methodology, profitability trends for certain funds, and the impact of certain factors on fund profitability results, including the impact of market trends on actively managed funds; (iii) the use of performance fees and the calculation of performance adjustments, including the impact of underperformance and fund outflows on performance adjustments; (iv) metrics for evaluating index fund performance; (v) Fidelity's group fee structure, including the group fee breakpoint schedules; (vi) the terms of Fidelity's contractual and voluntary expense cap arrangements with the funds; (vii) the methodology with respect to evaluating competitive fund data and peer group classifications and fee comparisons; (viii) the expense structures for different funds and classes; (ix) Fidelity's arrangements with affiliated sub-advisers on behalf of the funds; (x) information regarding other accounts managed by Fidelity, including institutional accounts and collective investment trusts; (xi) recent changes to the fee structure for certain funds of funds; and (xii) the impact of the Department of Labor's new fiduciary rule on the funds' comparative expense information.
Based on its evaluation of all of the conclusions noted above, and after considering all factors it believed relevant, the Board concluded that the advisory fee structures are fair and reasonable, and that the fund's Advisory Contracts should be renewed.
ATIE-ANN-1217
1.853364.109
Fidelity® Emerging Markets Discovery Fund
Fidelity® Total Emerging Markets Fund
Annual Report October 31, 2017 |
|
Contents
To view a fund's proxy voting guidelines and proxy voting record for the 12-month period ended June 30, visit http://www.fidelity.com/proxyvotingresults or visit the Securities and Exchange Commission's (SEC) web site at http://www.sec.gov.
You may also call 1-800-544-8544 to request a free copy of the proxy voting guidelines.
Standard & Poor's, S&P and S&P 500 are registered service marks of The McGraw-Hill Companies, Inc. and have been licensed for use by Fidelity Distributors Corporation.
Other third-party marks appearing herein are the property of their respective owners.
All other marks appearing herein are registered or unregistered trademarks or service marks of FMR LLC or an affiliated company. © 2017 FMR LLC. All rights reserved.
This report and the financial statements contained herein are submitted for the general information of the shareholders of the Funds. This report is not authorized for distribution to prospective investors in the Funds unless preceded or accompanied by an effective prospectus.
A fund files its complete schedule of portfolio holdings with the SEC for the first and third quarters of each fiscal year on Form N-Q. Forms N-Q are available on the SEC’s web site at http://www.sec.gov. A fund's Forms N-Q may be reviewed and copied at the SEC’s Public Reference Room in Washington, DC. Information regarding the operation of the SEC's Public Reference Room may be obtained by calling 1-800-SEC-0330.
For a complete list of a fund's portfolio holdings, view the most recent holdings listing, semiannual report, or annual report on Fidelity's web site at http://www.fidelity.com, http://www.institutional.fidelity.com, or http://www.401k.com, as applicable.
NOT FDIC INSURED •MAY LOSE VALUE •NO BANK GUARANTEE
Neither the Funds nor Fidelity Distributors Corporation is a bank.
Fidelity® Emerging Markets Discovery Fund
Performance: The Bottom Line
Average annual total return reflects the change in the value of an investment, assuming reinvestment of distributions from dividend income and capital gains (the profits earned upon the sale of securities that have grown in value, if any) and assuming a constant rate of performance each year. The hypothetical investment and the average annual total returns do not reflect the deduction of taxes that a shareholder would pay on fund distributions or the redemption of fund shares. During periods of reimbursement by Fidelity, a fund’s total return will be greater than it would be had the reimbursement not occurred. How a fund did yesterday is no guarantee of how it will do tomorrow.
Average Annual Total Returns
| For the periods ended October 31, 2017 | Past 1 year | Past 5 years | Life of fundA |
| Fidelity® Emerging Markets Discovery Fund | 24.30% | 6.45% | 8.49% |
A From November 1, 2011
$10,000 Over Life of Fund
Let's say hypothetically that $10,000 was invested in Fidelity® Emerging Markets Discovery Fund, a class of the fund, on November 1, 2011, when the fund started.
The chart shows how the value of your investment would have changed, and also shows how the MSCI Emerging Markets SMID Cap Index performed over the same period.
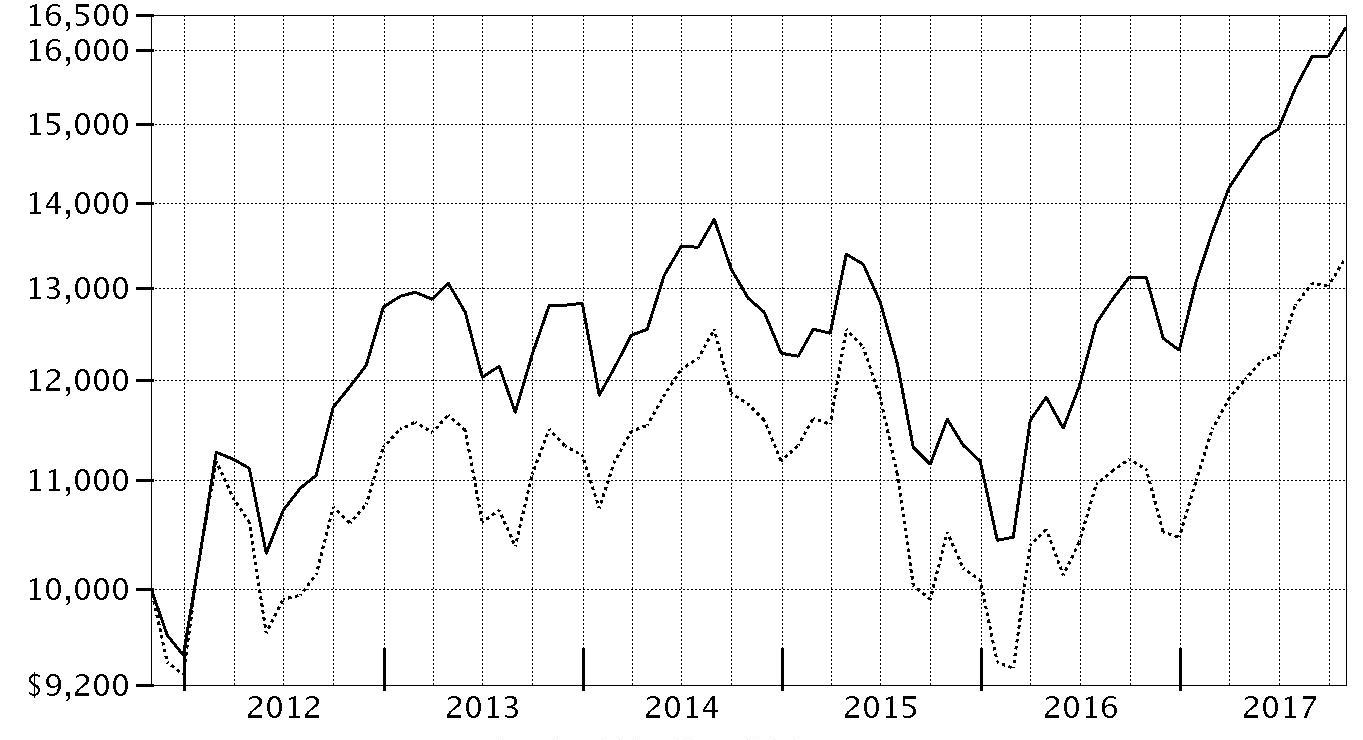
| Period Ending Values |
| $16,312 | Fidelity® Emerging Markets Discovery Fund |
| $13,346 | MSCI Emerging Markets SMID Cap Index |
Fidelity® Emerging Markets Discovery Fund
Management's Discussion of Fund Performance
Market Recap: The MSCI ACWI (All Country World Index) ex USA Index returned 23.85% for the 12 months ending October 31, 2017, helped partly by a generally weak U.S. dollar. Some favorable election results in continental Europe (+30%) suggested ebbing political uncertainty and near-term risk there, but the U.K. (+20%) faced more-mixed conditions ahead of its expected exit from the European Union. Despite central-bank easing – and pressured recently by yen strength – Japan (+18%) lagged the rest of the Asia-Pacific group (+22%). Commodity-price volatility slowed Canada (+17%), but the emerging-markets group (+26%) sped ahead. Sector-wise, information technology (+47%) was driven by a surge among several Chinese internet-related names. Financials (+27%) rode rising interest rates that, at the same time, weighed on real estate (+17%), utilities (+16%), consumer staples (+14%) and telecommunication services (+9%) – so-called “bond proxy” sectors. Materials (+28%) and industrials (+27%) responded to demand from China and price gains for certain commodities. In the energy sector (+20%), oil prices lost ground in the spring before rebounding through October 31 to end well above where they started 12 months ago. Lastly, health care (+14%) was hurt by early-period turmoil around drug pricing and health care legislation.
Comments from Co-Portfolio Managers Gregory Lee and Timothy Gannon: For the year, the fund’s share classes (excluding sales charges, if applicable) advanced about 24%, outpacing the 20.24% return of the benchmark MSCI Emerging Markets SMID Cap Index. Security selection drove the fund's outperformance of its benchmark, as stock picking in most of the fund’s 11 sector sleeves was positive. Choices among industrials and consumer stocks helped the most. Conversely, security selection in the health care and information technology sectors detracted. The fund’s top individual contributors were two China-based consumer discretionary names: consumer electronics and household appliance maker Qingdao Haier and high-end hotel operator Shangri-La Asia. Shares of Haier gained due to management’s efforts to integrate its 2016 purchase of General Electric’s appliance division and its goal to double the firm’s revenue and profit in the next five years. Shangri-La’s stock benefited from improving RevPAR (revenue per available room) in China. Conversely, not owning index component Sunac China Holdings, one of the leading residential property developers in China, was the fund’s biggest individual detractor. Shares of Sunac partly were lifted by the firm’s report that it would slow its rate of land purchases to boost profit and cut its debt ratio.
The views expressed above reflect those of the portfolio manager(s) only through the end of the period as stated on the cover of this report and do not necessarily represent the views of Fidelity or any other person in the Fidelity organization. Any such views are subject to change at any time based upon market or other conditions and Fidelity disclaims any responsibility to update such views. These views may not be relied on as investment advice and, because investment decisions for a Fidelity fund are based on numerous factors, may not be relied on as an indication of trading intent on behalf of any Fidelity fund.
Fidelity® Emerging Markets Discovery Fund
Investment Summary (Unaudited)
Top Five Stocks as of October 31, 2017
| | % of fund's net assets | % of fund's net assets 6 months ago |
| Hyundai Motor Co. Series 2 (Korea (South), Automobiles) | 1.9 | 2.0 |
| Shangri-La Asia Ltd. (Bermuda, Hotels, Restaurants & Leisure) | 1.6 | 1.3 |
| Qingdao Haier Co. Ltd. (China, Household Durables) | 1.6 | 1.6 |
| Arvind Mills Ltd. (India, Textiles, Apparel & Luxury Goods) | 1.5 | 1.4 |
| Yandex NV Series A (Netherlands, Internet Software & Services) | 1.5 | 1.9 |
| | 8.1 | |
Top Five Market Sectors as of October 31, 2017
| | % of fund's net assets | % of fund's net assets 6 months ago |
| Information Technology | 18.7 | 14.8 |
| Consumer Discretionary | 17.6 | 16.2 |
| Industrials | 11.7 | 11.3 |
| Financials | 11.5 | 9.9 |
| Materials | 10.2 | 9.4 |
Top Five Countries as of October 31, 2017
| (excluding cash equivalents) | % of fund's net assets | % of fund's net assets 6 months ago |
| Brazil | 11.8 | 8.9 |
| India | 11.5 | 9.2 |
| Korea (South) | 11.1 | 12.3 |
| Cayman Islands | 9.9 | 9.0 |
| Taiwan | 8.1 | 7.2 |
Percentages are adjusted for the effect of futures contracts, if applicable.
Asset Allocation (% of fund's net assets)
| As of October 31, 2017 |
| | Stocks | 98.1% |
| | Short-Term Investments and Net Other Assets (Liabilities) | 1.9% |

| As of April 30, 2017 |
| | Stocks and Equity Futures | 95.1% |
| | Short-Term Investments and Net Other Assets (Liabilities) | 4.9% |

Fidelity® Emerging Markets Discovery Fund
Investments October 31, 2017
Showing Percentage of Net Assets
| Common Stocks - 93.7% | | | |
| | | Shares | Value |
| Argentina - 1.4% | | | |
| BBVA Banco Frances SA sponsored ADR (a) | | 104,300 | $2,298,772 |
| Inversiones y Representaciones SA ADR(a) | | 77,310 | 2,251,267 |
| YPF SA Class D sponsored ADR (b) | | 36,000 | 884,160 |
|
| TOTAL ARGENTINA | | | 5,434,199 |
|
| Bailiwick of Jersey - 0.3% | | | |
| Atrium European Real Estate Ltd. | | 149,637 | 700,705 |
| WNS Holdings Ltd. sponsored ADR (b) | | 15,500 | 587,760 |
|
| TOTAL BAILIWICK OF JERSEY | | | 1,288,465 |
|
| Bangladesh - 0.2% | | | |
| BRAC Bank Ltd. | | 669,772 | 812,236 |
| Bermuda - 3.2% | | | |
| Joy City Property Ltd. | | 12,443,000 | 2,169,159 |
| Pacific Basin Shipping Ltd. (b) | | 9,274,000 | 2,115,995 |
| PAX Global Technology Ltd. | | 1,224,000 | 619,735 |
| Shangri-La Asia Ltd. | | 3,122,000 | 6,210,865 |
| Tai Cheung Holdings Ltd. | | 653,000 | 753,326 |
| VimpelCom Ltd. sponsored ADR | | 157,100 | 614,261 |
|
| TOTAL BERMUDA | | | 12,483,341 |
|
| Brazil - 10.5% | | | |
| Arezzo Industria e Comercio SA | | 278,800 | 4,308,177 |
| Azul SA sponsored ADR | | 81,200 | 2,053,548 |
| BTG Pactual Participations Ltd. unit | | 185,500 | 1,248,083 |
| Centrais Eletricas Brasileiras SA (Electrobras) (b) | | 90,700 | 611,358 |
| Cia. Hering SA | | 528,700 | 4,719,237 |
| Companhia de Saneamento de Minas Gerais | | 65,720 | 791,541 |
| Construtora Tenda SA (b) | | 183,200 | 957,638 |
| Cosan SA Industria e Comercio | | 163,700 | 1,871,543 |
| Direcional Engenharia SA (b) | | 361,000 | 645,569 |
| Equatorial Energia SA | | 78,600 | 1,465,656 |
| Estacio Participacoes SA | | 247,600 | 2,219,946 |
| Fibria Celulose SA | | 229,500 | 3,671,944 |
| Hypermarcas SA | | 300,338 | 3,139,901 |
| Instituto Hermes Pardini SA | | 138,100 | 1,302,352 |
| Localiza Rent A Car SA | | 150,495 | 2,662,289 |
| LPS Brasil Consultoria de Imoveis SA (b) | | 361,100 | 623,671 |
| Minerva SA | | 311,500 | 1,095,054 |
| QGEP Participacoes SA | | 1,100,700 | 2,843,186 |
| Smiles Fidelidade SA | | 77,600 | 2,028,185 |
| Tegma Gestao Logistica SA | | 362,100 | 1,992,419 |
|
| TOTAL BRAZIL | | | 40,251,297 |
|
| British Virgin Islands - 1.0% | | | |
| Dolphin Capital Investors Ltd. (b) | | 8,361,857 | 746,865 |
| Mail.Ru Group Ltd. GDR (Reg. S) (b) | | 93,764 | 3,047,330 |
|
| TOTAL BRITISH VIRGIN ISLANDS | | | 3,794,195 |
|
| Canada - 1.0% | | | |
| Pan American Silver Corp. | | 121,800 | 1,988,994 |
| Torex Gold Resources, Inc. (b) | | 129,070 | 1,779,827 |
|
| TOTAL CANADA | | | 3,768,821 |
|
| Cayman Islands - 9.9% | | | |
| 58.com, Inc. ADR (b) | | 59,200 | 3,976,464 |
| ASM Pacific Technology Ltd. | | 163,300 | 2,375,798 |
| Changyou.com Ltd. (A Shares) ADR (b) | | 43,200 | 1,673,568 |
| Cheetah Mobile, Inc. ADR (a)(b) | | 56,600 | 510,532 |
| China Medical System Holdings Ltd. | | 1,480,000 | 2,735,612 |
| Daqo New Energy Corp. ADR (b) | | 17,500 | 659,750 |
| General Interface Solution Holding Ltd. | | 231,000 | 2,119,301 |
| Haitian International Holdings Ltd. | | 1,138,000 | 3,406,094 |
| IGG, Inc. | | 1,372,000 | 1,839,557 |
| JA Solar Holdings Co. Ltd. ADR (b) | | 64,300 | 479,035 |
| Lee's Pharmaceutical Holdings Ltd. | | 1,039,000 | 930,937 |
| Longfor Properties Co. Ltd. | | 307,500 | 718,160 |
| Silicon Motion Technology Corp. sponsored ADR | | 11,600 | 561,672 |
| SITC International Holdings Co. Ltd. | | 3,521,500 | 3,394,478 |
| Sunny Optical Technology Group Co. Ltd. | | 354,000 | 5,181,993 |
| TPK Holding Co. Ltd. (b) | | 394,000 | 1,300,783 |
| Uni-President China Holdings Ltd. | | 2,747,000 | 2,295,798 |
| Yirendai Ltd. sponsored ADR (a) | | 25,500 | 1,106,445 |
| YY, Inc. ADR (b) | | 29,300 | 2,648,427 |
|
| TOTAL CAYMAN ISLANDS | | | 37,914,404 |
|
| Chile - 1.0% | | | |
| Compania Cervecerias Unidas SA sponsored ADR (a) | | 96,300 | 2,742,624 |
| Sociedad Quimica y Minera de Chile SA (PN-B) sponsored ADR | | 19,500 | 1,164,930 |
|
| TOTAL CHILE | | | 3,907,554 |
|
| China - 5.3% | | | |
| BBMG Corp. (H Shares) | | 2,591,000 | 1,291,946 |
| China Longyuan Power Grid Corp. Ltd. (H Shares) | | 3,575,200 | 2,648,839 |
| Huangshan Tourism Development Co. Ltd. | | 621,800 | 932,078 |
| Qingdao Haier Co. Ltd. | | 2,301,454 | 6,000,867 |
| Shanghai International Airport Co. Ltd. (A Shares) | | 184,880 | 1,219,084 |
| Suofeiya Home Collection Co. Ltd. Class A | | 402,720 | 2,361,122 |
| TravelSky Technology Ltd. (H Shares) | | 591,000 | 1,530,264 |
| Tsingtao Brewery Co. Ltd. (H Shares) | | 382,000 | 1,598,726 |
| Zhengzhou Yutong Bus Co. Ltd. | | 744,444 | 2,854,400 |
|
| TOTAL CHINA | | | 20,437,326 |
|
| Colombia - 0.2% | | | |
| Organizacion Terpel SA | | 129,619 | 588,006 |
| Cyprus - 1.0% | | | |
| Etalon Group PLC GDR (Reg. S) | | 533,800 | 2,161,890 |
| Globaltrans Investment PLC GDR (Reg. S) | | 203,300 | 1,878,492 |
|
| TOTAL CYPRUS | | | 4,040,382 |
|
| Egypt - 1.4% | | | |
| Credit Agricole Egypt | | 346,080 | 824,348 |
| Egyptian Kuwaiti Holding | | 2,135,200 | 1,686,808 |
| Six of October Development & Investment Co. (b) | | 2,633,500 | 2,768,372 |
|
| TOTAL EGYPT | | | 5,279,528 |
|
| Greece - 0.7% | | | |
| Titan Cement Co. SA (Reg.) | | 119,300 | 2,879,388 |
| Hong Kong - 3.7% | | | |
| China Resources Beer Holdings Co. Ltd. | | 740,000 | 2,134,232 |
| CSPC Pharmaceutical Group Ltd. | | 2,384,000 | 4,143,749 |
| Far East Horizon Ltd. | | 1,739,584 | 1,728,123 |
| Techtronic Industries Co. Ltd. | | 421,500 | 2,471,816 |
| Winteam Pharmaceutical Group Ltd. | | 4,380,000 | 2,509,626 |
| Yuexiu Property Co. Ltd. | | 5,728,000 | 1,108,683 |
|
| TOTAL HONG KONG | | | 14,096,229 |
|
| India - 11.5% | | | |
| Adani Ports & Special Economic Zone Ltd. | | 485,430 | 3,226,329 |
| Arvind Mills Ltd. | | 939,817 | 5,821,060 |
| Bharat Petroleum Corp. Ltd. | | 342,806 | 2,867,394 |
| Deccan Cements Ltd. | | 169,565 | 1,521,109 |
| EIH Ltd. | | 1,957,903 | 4,656,634 |
| Federal Bank Ltd. | | 1,097,432 | 2,063,511 |
| Gujarat Gas Ltd. | | 1,008 | 14,205 |
| InterGlobe Aviation Ltd. | | 125,550 | 2,419,576 |
| JK Cement Ltd. | | 103,712 | 1,605,574 |
| LIC Housing Finance Ltd. | | 251,279 | 2,323,409 |
| Manappuram General Finance & Leasing Ltd. | | 672,319 | 1,046,637 |
| Oberoi Realty Ltd. | | 207,366 | 1,520,417 |
| PC Jeweller Ltd. | | 310,401 | 1,681,678 |
| Phoenix Mills Ltd. | | 206,136 | 1,673,283 |
| Solar Industries India Ltd. | | 211,003 | 3,347,697 |
| South Indian Bank Ltd. | | 2,662,871 | 1,256,382 |
| Steel Authority of India Ltd. (b) | | 1,242,558 | 1,496,827 |
| The Jammu & Kashmir Bank Ltd. (b) | | 807,734 | 1,032,902 |
| The Ramco Cements Ltd. | | 161,475 | 1,797,672 |
| Torrent Pharmaceuticals Ltd. | | 150,821 | 2,957,839 |
|
| TOTAL INDIA | | | 44,330,135 |
|
| Indonesia - 2.5% | | | |
| PT Bank Danamon Indonesia Tbk Series A | | 2,728,400 | 1,025,979 |
| PT Cikarang Listrindo Tbk | | 8,154,600 | 658,381 |
| PT Holcim Indonesia Tbk (b) | | 3,273,100 | 199,101 |
| PT Lippo Karawaci Tbk | | 25,046,600 | 1,274,260 |
| PT Media Nusantara Citra Tbk | | 7,412,300 | 852,585 |
| PT Pakuwon Jati Tbk | | 36,295,700 | 1,685,994 |
| PT Panin Life Tbk (b) | | 41,908,100 | 729,240 |
| PT Semen Gresik (Persero) Tbk | | 3,751,000 | 3,014,629 |
|
| TOTAL INDONESIA | | | 9,440,169 |
|
| Israel - 0.2% | | | |
| Bezeq The Israel Telecommunication Corp. Ltd. | | 454,300 | 678,370 |
| Kenya - 0.2% | | | |
| KCB Group Ltd. | | 1,707,500 | 625,398 |
| Korea (South) - 8.4% | | | |
| AMOREPACIFIC Group, Inc. | | 29,149 | 3,741,096 |
| BS Financial Group, Inc. | | 275,006 | 2,444,848 |
| Com2uS Corp. | | 13,986 | 1,668,678 |
| Daou Technology, Inc. | | 44,357 | 727,983 |
| Dongbu HiTek Co. Ltd. (b) | | 115,629 | 1,478,857 |
| DOUBLEUGAMES Co. Ltd. | | 18,038 | 827,616 |
| Fila Korea Ltd. | | 5,802 | 351,309 |
| HB Technology Co. Ltd. | | 281,967 | 1,079,357 |
| Hyundai Fire & Marine Insurance Co. Ltd. | | 30,564 | 1,239,683 |
| Hyundai Glovis Co. Ltd. | | 13,782 | 1,861,283 |
| Hyundai Industrial Development & Construction Co. | | 59,538 | 2,135,315 |
| Hyundai Wia Corp. | | 26,397 | 1,522,781 |
| KEPCO Plant Service & Engineering Co. Ltd. | | 36,790 | 1,358,949 |
| Korea Express Co. Ltd. (b) | | 11,560 | 1,623,232 |
| Korean Reinsurance Co. | | 82,467 | 826,079 |
| Loen Entertainment, Inc. | | 1,381 | 131,543 |
| Minwise Co. Ltd. | | 59,433 | 1,286,371 |
| NCSOFT Corp. | | 3,138 | 1,197,003 |
| Samjin Pharmaceutical Co. Ltd. | | 72,815 | 2,155,619 |
| Silicon Works Co. Ltd. | | 33,796 | 1,357,172 |
| Tera Semicon Co. Ltd. | | 67,847 | 1,790,094 |
| Toptec Co. Ltd. | | 65,209 | 1,641,758 |
|
| TOTAL KOREA (SOUTH) | | | 32,446,626 |
|
| Malaysia - 1.2% | | | |
| Matrix Concepts Holdings Bhd | | 1,883,700 | 1,001,495 |
| Top Glove Corp. Bhd | | 2,363,800 | 3,574,745 |
|
| TOTAL MALAYSIA | | | 4,576,240 |
|
| Mexico - 1.9% | | | |
| Credito Real S.A.B. de CV | | 819,900 | 1,314,628 |
| Fibra Uno Administracion SA de CV | | 1,311,700 | 2,064,182 |
| Industrias Penoles SA de CV | | 108,250 | 2,516,512 |
| Qualitas Controladora S.A.B. de CV | | 741,200 | 1,226,715 |
| Tenedora Nemak SA de CV | | 104,653 | 78,660 |
|
| TOTAL MEXICO | | | 7,200,697 |
|
| Netherlands - 1.8% | | | |
| X5 Retail Group NV GDR (Reg. S) (b) | | 32,900 | 1,352,190 |
| Yandex NV Series A (b) | | 168,840 | 5,711,857 |
|
| TOTAL NETHERLANDS | | | 7,064,047 |
|
| Pakistan - 0.2% | | | |
| Habib Bank Ltd. | | 555,800 | 846,825 |
| Panama - 0.7% | | | |
| Copa Holdings SA Class A | | 21,500 | 2,648,585 |
| Philippines - 1.9% | | | |
| International Container Terminal Services, Inc. | | 981,610 | 2,015,150 |
| Metro Pacific Investments Corp. | | 17,193,300 | 2,266,421 |
| Metropolitan Bank & Trust Co. | | 946,390 | 1,588,768 |
| Pilipinas Shell Petroleum Corp. | | 702,480 | 847,707 |
| Robinsons Land Corp. | | 1,562,400 | 763,247 |
|
| TOTAL PHILIPPINES | | | 7,481,293 |
|
| Poland - 0.1% | | | |
| Asseco Poland SA | | 28,700 | 376,101 |
| Russia - 2.0% | | | |
| Bank St. Petersburg PJSC (b) | | 1,263,200 | 1,158,869 |
| Inter Rao Ues JSC | | 18,565,913 | 1,136,242 |
| LSR Group OJSC | | 89,364 | 1,245,411 |
| PhosAgro OJSC GDR (Reg. S) | | 151,500 | 2,083,125 |
| RusHydro PJSC | | 154,100,400 | 2,152,873 |
|
| TOTAL RUSSIA | | | 7,776,520 |
|
| Singapore - 0.6% | | | |
| First Resources Ltd. | | 1,600,200 | 2,312,665 |
| South Africa - 3.2% | | | |
| Bidvest Group Ltd. | | 193,100 | 2,342,262 |
| Discovery Ltd. | | 55,000 | 570,082 |
| EOH Holdings Ltd. | | 76,700 | 571,829 |
| Imperial Holdings Ltd. | | 266,600 | 3,820,787 |
| Pick 'n Pay Stores Ltd. | | 131,400 | 551,111 |
| Reunert Ltd. | | 266,900 | 1,312,720 |
| Sanlam Ltd. | | 150,100 | 750,566 |
| Tiger Brands Ltd. | | 89,600 | 2,446,157 |
|
| TOTAL SOUTH AFRICA | | | 12,365,514 |
|
| Sri Lanka - 0.5% | | | |
| Dialog Axiata PLC | | 8,714,824 | 765,827 |
| Hatton National Bank PLC | | 594,135 | 1,043,434 |
|
| TOTAL SRI LANKA | | | 1,809,261 |
|
| Taiwan - 8.1% | | | |
| Advantech Co. Ltd. | | 156,693 | 1,071,032 |
| Alpha Networks, Inc. | | 1,230,000 | 955,007 |
| Chipbond Technology Corp. | | 416,000 | 811,627 |
| Cleanaway Co. Ltd. | | 277,000 | 1,594,648 |
| CTCI Corp. | | 1,052,000 | 1,631,860 |
| Elite Advanced Laser Corp. | | 247,200 | 1,004,778 |
| Everlight Electronics Co. Ltd. | | 438,000 | 669,251 |
| FLEXium Interconnect, Inc. | | 322,256 | 1,235,005 |
| Hu Lane Associate, Inc. | | 346,000 | 1,974,650 |
| Innolux Corp. | | 1,705,000 | 746,765 |
| Inventec Corp. | | 1,951,000 | 1,514,812 |
| Largan Precision Co. Ltd. | | 9,000 | 1,706,649 |
| Lite-On Technology Corp. | | 1,507,220 | 2,127,952 |
| Long Chen Paper Co. Ltd. | | 1,636,000 | 2,410,193 |
| Powertech Technology, Inc. | | 389,000 | 1,217,158 |
| Radiant Opto-Electronics Corp. | | 903,000 | 2,007,466 |
| St.Shine Optical Co. Ltd. | | 35,000 | 855,896 |
| Sunrex Technology Corp. | | 745,680 | 440,411 |
| Synnex Technology International Corp. | | 1,096,100 | 1,389,310 |
| TCI Co. Ltd. | | 290,851 | 1,978,381 |
| Tong Hsing Electronics Industries Ltd. | | 211,000 | 903,146 |
| Tripod Technology Corp. | | 439,000 | 1,616,862 |
| Vanguard International Semiconductor Corp. | | 313,000 | 594,054 |
| Yuanta Financial Holding Co. Ltd. | | 1,460,000 | 649,147 |
|
| TOTAL TAIWAN | | | 31,106,060 |
|
| Thailand - 2.3% | | | |
| Beauty Community PCL | | 2,594,200 | 1,397,838 |
| Delta Electronics PCL (For. Reg.) | | 277,500 | 718,393 |
| PTT Global Chemical PCL (For. Reg.) | | 1,534,100 | 3,694,401 |
| Star Petroleum Refining PCL | | 6,034,000 | 3,160,494 |
|
| TOTAL THAILAND | | | 8,971,126 |
|
| Turkey - 3.0% | | | |
| Aksa Akrilik Kimya Sanayii | | 1,273,000 | 4,479,854 |
| Bim Birlesik Magazalar A/S JSC | | 99,000 | 2,018,597 |
| Tupras Turkiye Petrol Rafinerileri A/S | | 92,828 | 3,340,149 |
| Turkcell Iletisim Hizmet A/S | | 163,000 | 608,852 |
| Turkiye Garanti Bankasi A/S | | 369,000 | 1,014,530 |
|
| TOTAL TURKEY | | | 11,461,982 |
|
| United Arab Emirates - 0.7% | | | |
| Emaar Properties PJSC | | 1,187,988 | 2,681,557 |
| United Kingdom - 1.5% | | | |
| BGEO Group PLC | | 15,240 | 720,580 |
| NMC Health PLC | | 74,100 | 2,846,188 |
| Shanghai International Airport Co. Ltd. ELS (UBS Warrant Programme) warrants 5/11/18 (c) | | 181,300 | 1,195,478 |
| TBC Bank Group PLC | | 52,053 | 1,183,577 |
|
| TOTAL UNITED KINGDOM | | | 5,945,823 |
|
| United States of America - 0.3% | | | |
| China Rapid Finance Ltd. ADR | | 74,000 | 597,920 |
| Net 1 UEPS Technologies, Inc. (b) | | 39,900 | 364,287 |
|
| TOTAL UNITED STATES OF AMERICA | | | 962,207 |
|
| Vietnam - 0.1% | | | |
| FTP Corp. | | 188,588 | 418,485 |
| TOTAL COMMON STOCKS | | | |
| (Cost $319,119,652) | | | 360,501,057 |
|
| Nonconvertible Preferred Stocks - 4.4% | | | |
| Brazil - 1.3% | | | |
| Banco ABC Brasil SA | | 309,744 | 1,699,601 |
| Banco do Estado Rio Grande do Sul SA | | 170,600 | 794,774 |
| Companhia Paranaense de Energia-Copel (PN-B) sponsored ADR (a) | | 330,320 | 2,540,161 |
|
| TOTAL BRAZIL | | | 5,034,536 |
|
| Korea (South) - 2.7% | | | |
| Hyundai Motor Co. Series 2 | | 71,679 | 7,244,250 |
| LG Chemical Ltd. | | 11,598 | 2,691,806 |
| Samsung Fire & Marine Insurance Co. Ltd. | | 4,066 | 652,762 |
|
| TOTAL KOREA (SOUTH) | | | 10,588,818 |
|
| Russia - 0.4% | | | |
| Sberbank of Russia | | 498,400 | 1,350,998 |
| TOTAL NONCONVERTIBLE PREFERRED STOCKS | | | |
| (Cost $15,084,943) | | | 16,974,352 |
| | | Principal Amount | Value |
|
| Government Obligations - 0.1% | | | |
| United States of America - 0.1% | | | |
| U.S. Treasury Bills, yield at date of purchase 1.01% to 1.07% 12/14/17 to 1/18/18(d) | | | |
| (Cost $469,266) | | 470,000 | 469,287 |
| | | Shares | Value |
|
| Money Market Funds - 5.1% | | | |
| Fidelity Cash Central Fund, 1.10% (e) | | 14,256,928 | 14,259,779 |
| Fidelity Securities Lending Cash Central Fund 1.11% (e)(f) | | 5,240,106 | 5,240,630 |
| TOTAL MONEY MARKET FUNDS | | | |
| (Cost $19,499,398) | | | 19,500,409 |
| TOTAL INVESTMENT IN SECURITIES - 103.3% | | | |
| (Cost $354,173,259) | | | 397,445,105 |
| NET OTHER ASSETS (LIABILITIES) - (3.3)% | | | (12,529,085) |
| NET ASSETS - 100% | | | $384,916,020 |
Security Type Abbreviations
ELS – Equity-Linked Security
Categorizations in the Schedule of Investments are based on country or territory of incorporation.
Legend
(a) Security or a portion of the security is on loan at period end.
(b) Non-income producing
(c) Security exempt from registration under Rule 144A of the Securities Act of 1933. These securities may be resold in transactions exempt from registration, normally to qualified institutional buyers. At the end of the period, the value of these securities amounted to $1,195,478 or 0.3% of net assets.
(d) Security or a portion of the security was pledged to cover margin requirements for futures contracts. At period end, the value of securities pledged amounted to $208,638.
(e) Affiliated fund that is generally available only to investment companies and other accounts managed by Fidelity Investments. The rate quoted is the annualized seven-day yield of the fund at period end. A complete unaudited listing of the fund's holdings as of its most recent quarter end is available upon request. In addition, each Fidelity Central Fund's financial statements, which are not covered by the Fund's Report of Independent Registered Public Accounting Firm, are available on the SEC's website or upon request.
(f) Investment made with cash collateral received from securities on loan.
Affiliated Central Funds
Information regarding fiscal year to date income earned by the Fund from investments in Fidelity Central Funds is as follows:
| Fund | Income earned |
| Fidelity Cash Central Fund | $164,046 |
| Fidelity Securities Lending Cash Central Fund | 90,589 |
| Total | $254,635 |
Investment Valuation
The following is a summary of the inputs used, as of October 31, 2017, involving the Fund's assets and liabilities carried at fair value. The inputs or methodology used for valuing securities may not be an indication of the risk associated with investing in those securities. For more information on valuation inputs, and their aggregation into the levels used below, please refer to the Investment Valuation section in the accompanying Notes to Financial Statements.
| | Valuation Inputs at Reporting Date: |
| Description | Total | Level 1 | Level 2 | Level 3 |
| Investments in Securities: | | | | |
| Equities: | | | | |
| Consumer Discretionary | $67,457,135 | $67,457,135 | $-- | $-- |
| Consumer Staples | 24,266,631 | 24,266,631 | -- | -- |
| Energy | 15,814,633 | 15,814,633 | -- | -- |
| Financials | 43,968,176 | 42,772,698 | 1,195,478 | -- |
| Health Care | 27,152,464 | 27,152,464 | -- | -- |
| Industrials | 45,746,708 | 45,746,708 | -- | -- |
| Information Technology | 71,315,477 | 71,315,477 | -- | -- |
| Materials | 39,155,675 | 39,155,675 | -- | -- |
| Real Estate | 27,911,944 | 27,911,944 | -- | -- |
| Telecommunication Services | 2,667,310 | 2,667,310 | -- | -- |
| Utilities | 12,019,256 | 12,019,256 | -- | -- |
| Government Obligations | 469,287 | -- | 469,287 | -- |
| Money Market Funds | 19,500,409 | 19,500,409 | -- | -- |
| Total Investments in Securities: | $397,445,105 | $395,780,340 | $1,664,765 | $-- |
See accompanying notes which are an integral part of the financial statements.
Fidelity® Emerging Markets Discovery Fund
Financial Statements
Statement of Assets and Liabilities
| | | October 31, 2017 |
| Assets | | |
Investment in securities, at value (including securities loaned of $5,121,917) — See accompanying schedule:
Unaffiliated issuers (cost $334,673,861) | $377,944,696 | |
| Fidelity Central Funds (cost $19,499,398) | 19,500,409 | |
| Total Investment in Securities (cost $354,173,259) | | $397,445,105 |
| Cash | | 72,507 |
| Foreign currency held at value (cost $187,194) | | 187,194 |
| Receivable for investments sold | | 437,179 |
| Receivable for fund shares sold | | 639,686 |
| Dividends receivable | | 107,477 |
| Distributions receivable from Fidelity Central Funds | | 23,847 |
| Receivable for daily variation margin on futures contracts | | 37,257 |
| Prepaid expenses | | 712 |
| Other receivables | | 67,666 |
| Total assets | | 399,018,630 |
| Liabilities | | |
| Payable for investments purchased | $6,393,204 | |
| Payable for fund shares redeemed | 1,320,878 | |
| Accrued management fee | 271,675 | |
| Distribution and service plan fees payable | 18,513 | |
| Other affiliated payables | 81,679 | |
| Other payables and accrued expenses | 776,186 | |
| Collateral on securities loaned | 5,240,475 | |
| Total liabilities | | 14,102,610 |
| Net Assets | | $384,916,020 |
| Net Assets consist of: | | |
| Paid in capital | | $336,513,781 |
| Undistributed net investment income | | 2,568,661 |
| Accumulated undistributed net realized gain (loss) on investments and foreign currency transactions | | 3,187,397 |
| Net unrealized appreciation (depreciation) on investments and assets and liabilities in foreign currencies | | 42,646,181 |
| Net Assets | | $384,916,020 |
| Calculation of Maximum Offering Price | | |
| Class A: | | |
| Net Asset Value and redemption price per share ($16,061,739 ÷ 1,068,936 shares) | | $15.03 |
| Maximum offering price per share (100/94.25 of $15.03) | | $15.95 |
| Class M: | | |
| Net Asset Value and redemption price per share ($9,392,565 ÷ 628,889 shares) | | $14.94 |
| Maximum offering price per share (100/96.50 of $14.94) | | $15.48 |
| Class C: | | |
| Net Asset Value and offering price per share ($14,168,018 ÷ 967,701 shares)(a) | | $14.64 |
| Emerging Markets Discovery: | | |
| Net Asset Value, offering price and redemption price per share ($248,123,708 ÷ 16,412,386 shares) | | $15.12 |
| Class I: | | |
| Net Asset Value, offering price and redemption price per share ($97,169,990 ÷ 6,412,820 shares) | | $15.15 |
(a) Redemption price per share is equal to net asset value less any applicable contingent deferred sales charge.
See accompanying notes which are an integral part of the financial statements.
Statement of Operations
| | | Year ended October 31, 2017 |
| Investment Income | | |
| Dividends | | $6,098,741 |
| Interest | | 4,780 |
| Income from Fidelity Central Funds | | 254,635 |
| Income before foreign taxes withheld | | 6,358,156 |
| Less foreign taxes withheld | | (514,794) |
| Total income | | 5,843,362 |
| Expenses | | |
| Management fee | $1,849,026 | |
| Transfer agent fees | 468,824 | |
| Distribution and service plan fees | 125,838 | |
| Accounting and security lending fees | 114,042 | |
| Custodian fees and expenses | 319,103 | |
| Independent trustees' fees and expenses | 749 | |
| Registration fees | 138,598 | |
| Audit | 93,370 | |
| Legal | 255 | |
| Miscellaneous | 1,586 | |
| Total expenses before reductions | 3,111,391 | |
| Expense reductions | (35,474) | 3,075,917 |
| Net investment income (loss) | | 2,767,445 |
| Realized and Unrealized Gain (Loss) | | |
| Net realized gain (loss) on: | | |
| Investment securities: | | |
| Unaffiliated issuers (net of foreign taxes of $1,306) | 6,434,526 | |
| Fidelity Central Funds | (56) | |
| Foreign currency transactions | (155,885) | |
| Futures contracts | 2,813,041 | |
| Total net realized gain (loss) | | 9,091,626 |
| Change in net unrealized appreciation (depreciation) on: | | |
| Unaffiliated issuers (net of increase in deferred foreign taxes of $382,523) | 38,809,170 | |
| Fidelity Central Funds | (942) | |
| Assets and liabilities in foreign currencies | (3,037) | |
| Futures contracts | 33,134 | |
| Total change in net unrealized appreciation (depreciation) | | 38,838,325 |
| Net gain (loss) | | 47,929,951 |
| Net increase (decrease) in net assets resulting from operations | | $50,697,396 |
See accompanying notes which are an integral part of the financial statements.
Statement of Changes in Net Assets
| | Year ended October 31, 2017 | Year ended October 31, 2016 |
| Increase (Decrease) in Net Assets | | |
| Operations | | |
| Net investment income (loss) | $2,767,445 | $715,896 |
| Net realized gain (loss) | 9,091,626 | (2,841,874) |
| Change in net unrealized appreciation (depreciation) | 38,838,325 | 10,693,560 |
| Net increase (decrease) in net assets resulting from operations | 50,697,396 | 8,567,582 |
| Distributions to shareholders from net investment income | (659,806) | (490,717) |
| Distributions to shareholders from net realized gain | (485,420) | – |
| Total distributions | (1,145,226) | (490,717) |
| Share transactions - net increase (decrease) | 249,358,868 | 6,360,074 |
| Redemption fees | 166,495 | 41,424 |
| Total increase (decrease) in net assets | 299,077,533 | 14,478,363 |
| Net Assets | | |
| Beginning of period | 85,838,487 | 71,360,124 |
| End of period | $384,916,020 | $85,838,487 |
| Other Information | | |
| Undistributed net investment income end of period | $2,568,661 | $593,159 |
See accompanying notes which are an integral part of the financial statements.
Financial Highlights
Fidelity Emerging Markets Discovery Fund Class A
| Years ended October 31, | 2017 | 2016 | 2015 | 2014 | 2013 |
| Selected Per–Share Data | | | | | |
| Net asset value, beginning of period | $12.27 | $10.92 | $12.17 | $12.49 | $11.89 |
| Income from Investment Operations | | | | | |
| Net investment income (loss)A | .14 | .09 | .09B | .04 | .08 |
| Net realized and unrealized gain (loss) | 2.74 | 1.30 | (1.34) | (.01) | .75 |
| Total from investment operations | 2.88 | 1.39 | (1.25) | .03 | .83 |
| Distributions from net investment income | (.07) | (.05) | – | (.06) | (.04) |
| Distributions from net realized gain | (.06) | – | – | (.30) | (.20) |
| Total distributions | (.13) | (.05) | – | (.36) | (.25)C |
| Redemption fees added to paid in capitalA | .01 | .01 | –D | .01 | .02 |
| Net asset value, end of period | $15.03 | $12.27 | $10.92 | $12.17 | $12.49 |
| Total ReturnE,F | 23.89% | 12.93% | (10.27)% | .31% | 7.20% |
| Ratios to Average Net AssetsG,H | | | | | |
| Expenses before reductions | 1.63% | 1.89% | 1.88% | 1.82% | 1.87% |
| Expenses net of fee waivers, if any | 1.63% | 1.70% | 1.70% | 1.70% | 1.70% |
| Expenses net of all reductions | 1.62% | 1.70% | 1.69% | 1.70% | 1.64% |
| Net investment income (loss) | 1.03% | .85% | .76%B | .29% | .62% |
| Supplemental Data | | | | | |
| Net assets, end of period (000 omitted) | $16,062 | $5,252 | $4,660 | $4,362 | $5,065 |
| Portfolio turnover rateI | 58% | 60% | 103% | 148% | 179% |
A Calculated based on average shares outstanding during the period.
B Net Investment income per share reflects a large, non-recurring dividend which amounted to $.06 per share. Excluding this non-recurring dividend, the ratio of net investment income (loss) to average net assets would have been .22%.
C Total distributions of $.25 per share is comprised of distributions from net investment income of $.044 and distributions from net realized gain of $.203 per share.
D Amount represents less than $.005 per share.
E Total returns would have been lower if certain expenses had not been reduced during the applicable periods shown.
F Total returns do not include the effect of the sales charges.
G Fees and expenses of any underlying Fidelity Central Funds are not included in the Fund's expense ratio. The Fund indirectly bears its proportionate share of the expenses of any underlying Fidelity Central Funds.
H Expense ratios reflect operating expenses of the class. Expenses before reductions do not reflect amounts reimbursed by the investment adviser or reductions from brokerage service arrangements or reductions from other expense offset arrangements and do not represent the amount paid by the class during periods when reimbursements or reductions occur. Expenses net of fee waivers reflect expenses after reimbursement by the investment adviser but prior to reductions from brokerage service arrangements or other expense offset arrangements. Expenses net of all reductions represent the net expenses paid by the class.
I Amount does not include the portfolio activity of any underlying Fidelity Central Funds.
See accompanying notes which are an integral part of the financial statements.
Fidelity Emerging Markets Discovery Fund Class M
| Years ended October 31, | 2017 | 2016 | 2015 | 2014 | 2013 |
| Selected Per–Share Data | | | | | |
| Net asset value, beginning of period | $12.20 | $10.86 | $12.13 | $12.44 | $11.87 |
| Income from Investment Operations | | | | | |
| Net investment income (loss)A | .10 | .07 | .06B | –C | .05 |
| Net realized and unrealized gain (loss) | 2.74 | 1.28 | (1.33) | –C | .74 |
| Total from investment operations | 2.84 | 1.35 | (1.27) | –C | .79 |
| Distributions from net investment income | (.04) | (.02) | – | (.02) | (.03) |
| Distributions from net realized gain | (.06) | – | – | (.30) | (.20) |
| Total distributions | (.11)D | (.02) | – | (.32) | (.24)E |
| Redemption fees added to paid in capitalA | .01 | .01 | –C | .01 | .02 |
| Net asset value, end of period | $14.94 | $12.20 | $10.86 | $12.13 | $12.44 |
| Total ReturnF,G | 23.63% | 12.58% | (10.47)% | .05% | 6.87% |
| Ratios to Average Net AssetsH,I | | | | | |
| Expenses before reductions | 1.92% | 2.17% | 2.16% | 2.10% | 2.19% |
| Expenses net of fee waivers, if any | 1.92% | 1.95% | 1.95% | 1.95% | 1.95% |
| Expenses net of all reductions | 1.90% | 1.94% | 1.94% | 1.95% | 1.89% |
| Net investment income (loss) | .74% | .60% | .51%B | .04% | .37% |
| Supplemental Data | | | | | |
| Net assets, end of period (000 omitted) | $9,393 | $2,868 | $2,015 | $2,031 | $1,914 |
| Portfolio turnover rateJ | 58% | 60% | 103% | 148% | 179% |
A Calculated based on average shares outstanding during the period.
B Net Investment income per share reflects a large, non-recurring dividend which amounted to $.06 per share. Excluding this non-recurring dividend, the ratio of net investment income (loss) to average net assets would have been (.03) %.
C Amount represents less than $.005 per share.
D Total distributions of $.11 per share is comprised of distributions from net investment income of $.044 and distributions from net realized gain of $.064 per share.
E Total distributions of $.24 per share is comprised of distributions from net investment income of $.034 and distributions from net realized gain of $.203 per share.
F Total returns would have been lower if certain expenses had not been reduced during the applicable periods shown.
G Total returns do not include the effect of the sales charges.
H Fees and expenses of any underlying Fidelity Central Funds are not included in the Fund's expense ratio. The Fund indirectly bears its proportionate share of the expenses of any underlying Fidelity Central Funds.
I Expense ratios reflect operating expenses of the class. Expenses before reductions do not reflect amounts reimbursed by the investment adviser or reductions from brokerage service arrangements or reductions from other expense offset arrangements and do not represent the amount paid by the class during periods when reimbursements or reductions occur. Expenses net of fee waivers reflect expenses after reimbursement by the investment adviser but prior to reductions from brokerage service arrangements or other expense offset arrangements. Expenses net of all reductions represent the net expenses paid by the class.
J Amount does not include the portfolio activity of any underlying Fidelity Central Funds.
See accompanying notes which are an integral part of the financial statements.
Fidelity Emerging Markets Discovery Fund Class C
| Years ended October 31, | 2017 | 2016 | 2015 | 2014 | 2013 |
| Selected Per–Share Data | | | | | |
| Net asset value, beginning of period | $11.97 | $10.69 | $12.00 | $12.35 | $11.82 |
| Income from Investment Operations | | | | | |
| Net investment income (loss)A | .04 | .01 | –B,C | (.06) | (.02) |
| Net realized and unrealized gain (loss) | 2.69 | 1.26 | (1.31) | –C | .74 |
| Total from investment operations | 2.73 | 1.27 | (1.31) | (.06) | .72 |
| Distributions from net investment income | (.01) | – | – | – | (.01) |
| Distributions from net realized gain | (.06) | – | – | (.30) | (.20) |
| Total distributions | (.07) | – | – | (.30) | (.21) |
| Redemption fees added to paid in capitalA | .01 | .01 | –C | .01 | .02 |
| Net asset value, end of period | $14.64 | $11.97 | $10.69 | $12.00 | $12.35 |
| Total ReturnD,E | 23.02% | 11.97% | (10.92)% | (.42)% | 6.32% |
| Ratios to Average Net AssetsF,G | | | | | |
| Expenses before reductions | 2.38% | 2.63% | 2.64% | 2.58% | 2.70% |
| Expenses net of fee waivers, if any | 2.38% | 2.45% | 2.45% | 2.45% | 2.45% |
| Expenses net of all reductions | 2.37% | 2.44% | 2.44% | 2.45% | 2.39% |
| Net investment income (loss) | .28% | .10% | .01%B | (.46)% | (.13)% |
| Supplemental Data | | | | | |
| Net assets, end of period (000 omitted) | $14,168 | $2,203 | $1,675 | $1,750 | $2,082 |
| Portfolio turnover rateH | 58% | 60% | 103% | 148% | 179% |
A Calculated based on average shares outstanding during the period.
B Net Investment income per share reflects a large, non-recurring dividend which amounted to $.06 per share. Excluding this non-recurring dividend, the ratio of net investment income (loss) to average net assets would have been (.52) %.
C Amount represents less than $.005 per share.
D Total returns would have been lower if certain expenses had not been reduced during the applicable periods shown.
E Total returns do not include the effect of the contingent deferred sales charge.
F Fees and expenses of any underlying Fidelity Central Funds are not included in the Fund's expense ratio. The Fund indirectly bears its proportionate share of the expenses of any underlying Fidelity Central Funds.
G Expense ratios reflect operating expenses of the class. Expenses before reductions do not reflect amounts reimbursed by the investment adviser or reductions from brokerage service arrangements or reductions from other expense offset arrangements and do not represent the amount paid by the class during periods when reimbursements or reductions occur. Expenses net of fee waivers reflect expenses after reimbursement by the investment adviser but prior to reductions from brokerage service arrangements or other expense offset arrangements. Expenses net of all reductions represent the net expenses paid by the class.
H Amount does not include the portfolio activity of any underlying Fidelity Central Funds.
See accompanying notes which are an integral part of the financial statements.
Fidelity Emerging Markets Discovery Fund
| Years ended October 31, | 2017 | 2016 | 2015 | 2014 | 2013 |
| Selected Per–Share Data | | | | | |
| Net asset value, beginning of period | $12.33 | $10.98 | $12.21 | $12.52 | $11.92 |
| Income from Investment Operations | | | | | |
| Net investment income (loss)A | .18 | .12 | .12B | .07 | .11 |
| Net realized and unrealized gain (loss) | 2.76 | 1.31 | (1.35) | –C | .74 |
| Total from investment operations | 2.94 | 1.43 | (1.23) | .07 | .85 |
| Distributions from net investment income | (.09) | (.09) | – | (.09) | (.07) |
| Distributions from net realized gain | (.06) | – | – | (.30) | (.20) |
| Total distributions | (.16)D | (.09) | – | (.39) | (.27) |
| Redemption fees added to paid in capitalA | .01 | .01 | –C | .01 | .02 |
| Net asset value, end of period | $15.12 | $12.33 | $10.98 | $12.21 | $12.52 |
| Total ReturnE | 24.30% | 13.19% | (10.07)% | .61% | 7.37% |
| Ratios to Average Net AssetsF,G | | | | | |
| Expenses before reductions | 1.35% | 1.55% | 1.56% | 1.48% | 1.57% |
| Expenses net of fee waivers, if any | 1.35% | 1.45% | 1.45% | 1.45% | 1.45% |
| Expenses net of all reductions | 1.34% | 1.44% | 1.44% | 1.45% | 1.39% |
| Net investment income (loss) | 1.31% | 1.10% | 1.01%B | .54% | .87% |
| Supplemental Data | | | | | |
| Net assets, end of period (000 omitted) | $248,124 | $67,178 | $61,601 | $78,377 | $96,731 |
| Portfolio turnover rateH | 58% | 60% | 103% | 148% | 179% |
A Calculated based on average shares outstanding during the period.
B Net Investment income per share reflects a large, non-recurring dividend which amounted to $.06 per share. Excluding this non-recurring dividend, the ratio of net investment income (loss) to average net assets would have been .48%.
C Amount represents less than $.005 per share.
D Total distributions of $.16 per share is comprised of distributions from net investment income of $.091 and distributions from net realized gain of $.064 per share.
E Total returns would have been lower if certain expenses had not been reduced during the applicable periods shown.
F Fees and expenses of any underlying Fidelity Central Funds are not included in the Fund's expense ratio. The Fund indirectly bears its proportionate share of the expenses of any underlying Fidelity Central Funds.
G Expense ratios reflect operating expenses of the class. Expenses before reductions do not reflect amounts reimbursed by the investment adviser or reductions from brokerage service arrangements or reductions from other expense offset arrangements and do not represent the amount paid by the class during periods when reimbursements or reductions occur. Expenses net of fee waivers reflect expenses after reimbursement by the investment adviser but prior to reductions from brokerage service arrangements or other expense offset arrangements. Expenses net of all reductions represent the net expenses paid by the class.
H Amount does not include the portfolio activity of any underlying Fidelity Central Funds.
See accompanying notes which are an integral part of the financial statements.
Fidelity Emerging Markets Discovery Fund Class I
| Years ended October 31, | 2017 | 2016 | 2015 | 2014 | 2013 |
| Selected Per–Share Data | | | | | |
| Net asset value, beginning of period | $12.37 | $11.02 | $12.25 | $12.53 | $11.92 |
| Income from Investment Operations | | | | | |
| Net investment income (loss)A | .19 | .13 | .12B | .07 | .11 |
| Net realized and unrealized gain (loss) | 2.75 | 1.30 | (1.35) | –C | .75 |
| Total from investment operations | 2.94 | 1.43 | (1.23) | .07 | .86 |
| Distributions from net investment income | (.10) | (.09) | – | (.06) | (.07) |
| Distributions from net realized gain | (.06) | – | – | (.30) | (.20) |
| Total distributions | (.17)D | (.09) | – | (.36) | (.27) |
| Redemption fees added to paid in capitalA | .01 | .01 | –C | .01 | .02 |
| Net asset value, end of period | $15.15 | $12.37 | $11.02 | $12.25 | $12.53 |
| Total ReturnE | 24.25% | 13.16% | (10.04)% | .61% | 7.45% |
| Ratios to Average Net AssetsF,G | | | | | |
| Expenses before reductions | 1.32% | 1.59% | 1.54% | 1.56% | 1.60% |
| Expenses net of fee waivers, if any | 1.32% | 1.45% | 1.45% | 1.45% | 1.45% |
| Expenses net of all reductions | 1.30% | 1.44% | 1.43% | 1.45% | 1.39% |
| Net investment income (loss) | 1.34% | 1.10% | 1.01%B | .54% | .87% |
| Supplemental Data | | | | | |
| Net assets, end of period (000 omitted) | $97,170 | $8,337 | $1,410 | $481 | $1,076 |
| Portfolio turnover rateH | 58% | 60% | 103% | 148% | 179% |
A Calculated based on average shares outstanding during the period.
B Net Investment income per share reflects a large, non-recurring dividend which amounted to $.06 per share. Excluding this non-recurring dividend, the ratio of net investment income (loss) to average net assets would have been .48%.
C Amount represents less than $.005 per share.
D Total distributions of $.17 per share is comprised of distributions from net investment income of $.101 distributions from net realized gain of $.064 per share.
E Total returns would have been lower if certain expenses had not been reduced during the applicable periods shown.
F Fees and expenses of any underlying Fidelity Central Funds are not included in the Fund's expense ratio. The Fund indirectly bears its proportionate share of the expenses of any underlying Fidelity Central Funds.
G Expense ratios reflect operating expenses of the class. Expenses before reductions do not reflect amounts reimbursed by the investment adviser or reductions from brokerage service arrangements or reductions from other expense offset arrangements and do not represent the amount paid by the class during periods when reimbursements or reductions occur. Expenses net of fee waivers reflect expenses after reimbursement by the investment adviser but prior to reductions from brokerage service arrangements or other expense offset arrangements. Expenses net of all reductions represent the net expenses paid by the class.
H Amount does not include the portfolio activity of any underlying Fidelity Central Funds.
See accompanying notes which are an integral part of the financial statements.
Notes to Financial Statements
For the period ended October 31, 2017
1. Organization.
Fidelity Emerging Markets Discovery Fund (the Fund) is a fund of Fidelity Investment Trust (the Trust) and is authorized to issue an unlimited number of shares. The Trust is registered under the Investment Company Act of 1940, as amended (the 1940 Act), as an open-end management investment company organized as a Massachusetts business trust. The Fund offers Class A, Class M (formerly Class T), Class C, Emerging Markets Discovery and Class I shares, each of which has equal rights as to assets and voting privileges. Each class has exclusive voting rights with respect to matters that affect that class. The Fund's investments in emerging markets can be subject to social, economic, regulatory, and political uncertainties and can be extremely volatile.
2. Investments in Fidelity Central Funds.
The Fund invests in Fidelity Central Funds, which are open-end investment companies generally available only to other investment companies and accounts managed by the investment adviser and its affiliates. The Fund's Schedule of Investments lists each of the Fidelity Central Funds held as of period end, if any, as an investment of the Fund, but does not include the underlying holdings of each Fidelity Central Fund. As an Investing Fund, the Fund indirectly bears its proportionate share of the expenses of the underlying Fidelity Central Funds.
The Money Market Central Funds seek preservation of capital and current income and are managed by Fidelity Investments Money Management, Inc. (FIMM), an affiliate of the investment adviser. Annualized expenses of the Money Market Central Funds as of their most recent shareholder report date are less than .005%.
A complete unaudited list of holdings for each Fidelity Central Fund is available upon request or at the Securities and Exchange Commission (the SEC) website at www.sec.gov. In addition, the financial statements of the Fidelity Central Funds, which are not covered by the Fund's Report of Independent Registered Public Accounting Firm, are available on the SEC website or upon request.
3. Significant Accounting Policies.
The Fund is an investment company and applies the accounting and reporting guidance of the Financial Accounting Standards Board (FASB) Accounting Standards Codification Topic 946 Financial Services – Investments Companies. The financial statements have been prepared in conformity with accounting principles generally accepted in the United States of America (GAAP), which require management to make certain estimates and assumptions at the date of the financial statements. Actual results could differ from those estimates. Subsequent events, if any, through the date that the financial statements were issued have been evaluated in the preparation of the financial statements. The following summarizes the significant accounting policies of the Fund:
Investment Valuation. Investments are valued as of 4:00 p.m. Eastern time on the last calendar day of the period. The Board of Trustees (the Board) has delegated the day to day responsibility for the valuation of the Fund's investments to the Fair Value Committee (the Committee) established by the Fund's investment adviser. In accordance with valuation policies and procedures approved by the Board, the Fund attempts to obtain prices from one or more third party pricing vendors or brokers to value its investments. When current market prices, quotations or currency exchange rates are not readily available or reliable, investments will be fair valued in good faith by the Committee, in accordance with procedures adopted by the Board. Factors used in determining fair value vary by investment type and may include market or investment specific events, changes in interest rates and credit quality. The frequency with which these procedures are used cannot be predicted and they may be utilized to a significant extent. The Committee oversees the Fund's valuation policies and procedures and reports to the Board on the Committee's activities and fair value determinations. The Board monitors the appropriateness of the procedures used in valuing the Fund's investments and ratifies the fair value determinations of the Committee.
The Fund categorizes the inputs to valuation techniques used to value its investments into a disclosure hierarchy consisting of three levels as shown below:
- Level 1 – quoted prices in active markets for identical investments
- Level 2 – other significant observable inputs (including quoted prices for similar investments, interest rates, prepayment speeds, etc.)
- Level 3 – unobservable inputs (including the Fund's own assumptions based on the best information available)
Valuation techniques used to value the Fund's investments by major category are as follows:
Equity securities, including restricted securities, for which market quotations are readily available, are valued at the last reported sale price or official closing price as reported by a third party pricing vendor on the primary market or exchange on which they are traded and are categorized as Level 1 in the hierarchy. In the event there were no sales during the day or closing prices are not available, securities are valued at the last quoted bid price or may be valued using the last available price and are generally categorized as Level 2 in the hierarchy. For foreign equity securities, when market or security specific events arise, comparisons to the valuation of American Depositary Receipts (ADRs), futures contracts, Exchange-Traded Funds (ETFs) and certain indexes as well as quoted prices for similar securities may be used and would be categorized as Level 2 in the hierarchy. Utilizing these techniques may result in transfers between Level 1 and Level 2. For equity securities, including restricted securities, where observable inputs are limited, assumptions about market activity and risk are used and these securities may be categorized as Level 3 in the hierarchy.
Debt securities, including restricted securities, are valued based on evaluated prices received from third party pricing vendors or from brokers who make markets in such securities. U.S. government and government agency obligations are valued by pricing vendors who utilize matrix pricing which considers yield or price of bonds of comparable quality, coupon, maturity and type or by broker-supplied prices. When independent prices are unavailable or unreliable, debt securities may be valued utilizing pricing methodologies which consider similar factors that would be used by third party pricing vendors. Debt securities are generally categorized as Level 2 in the hierarchy but may be Level 3 depending on the circumstances.
Investments in open-end mutual funds, including the Fidelity Central Funds, are valued at their closing net asset value (NAV) each business day and are categorized as Level 1 in the hierarchy.
Changes in valuation techniques may result in transfers in or out of an assigned level within the disclosure hierarchy. The aggregate value of investments by input level as of October 31, 2017, is included at the end of the Fund's Schedule of Investments.
Foreign Currency. The Fund may use foreign currency contracts to facilitate transactions in foreign-denominated securities. Gains and losses from these transactions may arise from changes in the value of the foreign currency or if the counterparties do not perform under the contracts' terms.
Foreign-denominated assets, including investment securities, and liabilities are translated into U.S. dollars at the exchange rates at period end. Purchases and sales of investment securities, income and dividends received and expenses denominated in foreign currencies are translated into U.S. dollars at the exchange rate in effect on the transaction date.
The effects of exchange rate fluctuations on investments are included with the net realized and unrealized gain (loss) on investment securities. Other foreign currency transactions resulting in realized and unrealized gain (loss) are disclosed separately.
Investment Transactions and Income. For financial reporting purposes, the Fund's investment holdings and NAV include trades executed through the end of the last business day of the period. The NAV per share for processing shareholder transactions is calculated as of the close of business of the New York Stock Exchange (NYSE), normally 4:00 p.m. Eastern time and includes trades executed through the end of the prior business day. Gains and losses on securities sold are determined on the basis of identified cost. Dividend income is recorded on the ex-dividend date, except for certain dividends from foreign securities where the ex-dividend date may have passed, which are recorded as soon as the Fund is informed of the ex-dividend date. Non-cash dividends included in dividend income, if any, are recorded at the fair market value of the securities received. Income and capital gain distributions from Fidelity Central Funds, if any, are recorded on the ex-dividend date. Interest income is accrued as earned and includes coupon interest and amortization of premium and accretion of discount on debt securities as applicable. Investment income is recorded net of foreign taxes withheld where recovery of such taxes is uncertain.
Class Allocations and Expenses. Investment income, realized and unrealized capital gains and losses, common expenses of the Fund, and certain fund-level expense reductions, if any, are allocated daily on a pro-rata basis to each class based on the relative net assets of each class to the total net assets of the Fund. Each class differs with respect to transfer agent and distribution and service plan fees incurred. Certain expense reductions may also differ by class. For the reporting period, the allocated portion of income and expenses to each class as a percent of its average net assets may vary due to the timing of recording these transactions in relation to fluctuating net assets of the classes. Expenses directly attributable to a fund are charged to that fund. Expenses attributable to more than one fund are allocated among the respective funds on the basis of relative net assets or other appropriate methods. Expense estimates are accrued in the period to which they relate and adjustments are made when actual amounts are known.
Income Tax Information and Distributions to Shareholders. Each year, the Fund intends to qualify as a regulated investment company under Subchapter M of the Internal Revenue Code, including distributing substantially all of its taxable income and realized gains. As a result, no provision for U.S. Federal income taxes is required. As of October 31, 2017, the Fund did not have any unrecognized tax benefits in the financial statements; nor is the Fund aware of any tax positions for which it is reasonably possible that the total amounts of unrecognized tax benefits will significantly change in the next twelve months. The Fund files a U.S. federal tax return, in addition to state and local tax returns as required. The Fund's federal income tax returns are subject to examination by the Internal Revenue Service (IRS) for a period of three fiscal years after they are filed. State and local tax returns may be subject to examination for an additional fiscal year depending on the jurisdiction. Foreign taxes are provided for based on the Fund's understanding of the tax rules and rates that exist in the foreign markets in which it invests. The Fund is subject to a tax imposed on capital gains by certain countries in which it invests. An estimated deferred tax liability for net unrealized appreciation on the applicable securities is included in Other payables and accrued expenses on the Statement of Assets & Liabilities.
Distributions are declared and recorded on the ex-dividend date. Income dividends and capital gain distributions are declared separately for each class. Income and capital gain distributions are determined in accordance with income tax regulations, which may differ from GAAP. In addition, the Fund claimed a portion of the payment made to redeeming shareholders as a distribution for income tax purposes.
Capital accounts within the financial statements are adjusted for permanent book-tax differences. These adjustments have no impact on net assets or the results of operations. Capital accounts are not adjusted for temporary book-tax differences which will reverse in a subsequent period.
Book-tax differences are primarily due to foreign currency transactions, futures transactions, certain foreign taxes, passive foreign investment companies (PFIC), market discount, capital loss carryforwards and losses deferred due to wash sales.
As of period end, the cost and unrealized appreciation (depreciation) in securities, and derivatives if applicable, for federal income tax purposes were as follows:
| Gross unrealized appreciation | $49,938,309 |
| Gross unrealized depreciation | (9,946,639) |
| Net unrealized appreciation (depreciation) | $39,991,670 |
| Tax Cost | $357,453,435 |
The tax-based components of distributable earnings as of period end were as follows:
| Undistributed ordinary income | $6,457,523 |
| Undistributed long-term capital gain | $2,579,433 |
| Net unrealized appreciation (depreciation) on securities and other investments | $39,989,357 |
The tax character of distributions paid was as follows:
| | October 31, 2017 | October 31, 2016 |
| Ordinary Income | $1,145,226 | $ 490,717 |
Short-Term Trading (Redemption) Fees. Shares held by investors in the Fund less than 90 days may have been subject to a redemption fee equal to 2.00% of the NAV of shares redeemed. All redemption fees, which reduce the proceeds of the shareholder redemption, are retained by the Fund and accounted for as an addition to paid in capital. In November 2017, the Board of Trustees approved the elimination of these redemption fees effective December 18, 2017.
Restricted Securities. The Fund may invest in securities that are subject to legal or contractual restrictions on resale. These securities generally may be resold in transactions exempt from registration or to the public if the securities are registered. Disposal of these securities may involve time-consuming negotiations and expense, and prompt sale at an acceptable price may be difficult. Information regarding restricted securities is included at the end of the Fund's Schedule of Investments.
4. Derivative Instruments.
Risk Exposures and the Use of Derivative Instruments. The Fund's investment objective allows the Fund to enter into various types of derivative contracts, including futures contracts. Derivatives are investments whose value is primarily derived from underlying assets, indices or reference rates and may be transacted on an exchange or over-the-counter (OTC). Derivatives may involve a future commitment to buy or sell a specified asset based on specified terms, to exchange future cash flows at periodic intervals based on a notional principal amount, or for one party to make one or more payments upon the occurrence of specified events in exchange for periodic payments from the other party.
The Fund used derivatives to increase returns and to manage exposure to certain risks as defined below. The success of any strategy involving derivatives depends on analysis of numerous economic factors, and if the strategies for investment do not work as intended, the Fund may not achieve its objectives.
The Fund's use of derivatives increased or decreased its exposure to the following risk:
| Equity Risk | Equity risk relates to the fluctuations in the value of financial instruments as a result of changes in market prices (other than those arising from interest rate risk or foreign exchange risk), whether caused by factors specific to an individual investment, its issuer, or all factors affecting all instruments traded in a market or market segment.
|
The Fund is also exposed to additional risks from investing in derivatives, such as liquidity risk and counterparty credit risk. Liquidity risk is the risk that the Fund will be unable to close out the derivative in the open market in a timely manner. Counterparty credit risk is the risk that the counterparty will not be able to fulfill its obligation to the Fund. Counterparty credit risk related to exchange-traded futures contracts may be mitigated by the protection provided by the exchange on which they trade.
Investing in derivatives may involve greater risks than investing in the underlying assets directly and, to varying degrees, may involve risk of loss in excess of any initial investment and collateral received and amounts recognized in the Statement of Assets and Liabilities. In addition, there may be the risk that the change in value of the derivative contract does not correspond to the change in value of the underlying instrument.
Futures Contracts. A futures contract is an agreement between two parties to buy or sell a specified underlying instrument for a fixed price at a specified future date. The Fund used futures contracts to manage its exposure to the stock market.
Upon entering into a futures contract, a fund is required to deposit either cash or securities (initial margin) with a clearing broker in an amount equal to a certain percentage of the face value of the contract. Futures contracts are marked-to-market daily and subsequent daily payments (variation margin) are made or received by a fund depending on the daily fluctuations in the value of the futures contracts and are recorded as unrealized appreciation or (depreciation). This receivable and/or payable, if any, is included in daily variation margin on futures contracts in the Statement of Assets and Liabilities. Realized gain or (loss) is recorded upon the expiration or closing of a futures contract. The net realized gain (loss) and change in net unrealized appreciation (depreciation) on futures contracts during the period is presented in the Statement of Operations.
Any open futures contracts at period end are presented in the Schedule of Investments under the caption "Futures Contracts". The notional amount at value reflects each contract's exposure to the underlying instrument or index at period end. For the period, the average monthly notional amount at value for futures contracts in the aggregate was $8,804,090.
5. Purchases and Sales of Investments.
Purchases and sales of securities, other than short-term securities, aggregated $371,838,027 and $117,421,083, respectively.
6. Fees and Other Transactions with Affiliates.
Management Fee. Fidelity Management & Research Company (the investment adviser) and its affiliates provide the Fund with investment management related services for which the Fund pays a monthly management fee. The management fee is the sum of an individual fund fee rate that is based on an annual rate of .60% of the Fund's average net assets and an annualized group fee rate that averaged .25% during the period. The group fee rate is based upon the average net assets of all the mutual funds advised by the investment adviser, including any mutual funds previously advised by the investment adviser that are currently advised by Fidelity SelectCo, LLC, an affiliate of the investment adviser. The group fee rate decreases as assets under management increase and increases as assets under management decrease. For the reporting period, the total annual management fee rate was .84% of the Fund's average net assets.
Distribution and Service Plan Fees. In accordance with Rule 12b-1 of the 1940 Act, the Fund has adopted separate Distribution and Service Plans for each class of shares. Certain classes pay Fidelity Distributors Corporation (FDC), an affiliate of the investment adviser, separate Distribution and Service Fees, each of which is based on an annual percentage of each class' average net assets. In addition, FDC may pay financial intermediaries for selling shares of the Fund and providing shareholder support services. For the period, the Distribution and Service Fee rates, total fees and amounts retained by FDC were as follows:
| | Distribution
Fee | Service
Fee | Total Fees | Retained
by FDC |
| Class A | -% | .25% | $24,747 | $854 |
| Class M | .25% | .25% | 30,468 | – |
| Class C | .75% | .25% | 70,623 | 29,035 |
| | | | $125,838 | $29,889 |
Sales Load. FDC may receive a front-end sales charge of up to 5.75% for selling Class A shares and 3.50% for selling Class M shares, some of which is paid to financial intermediaries for selling shares of the Fund. Depending on the holding period, FDC may receive contingent deferred sales charges levied on Class A, Class M and Class C redemptions. The deferred sales charges are 1.00% for Class C shares, 1.00% for certain purchases of Class A shares and .25% for certain purchases of Class M shares.
For the period, sales charge amounts retained by FDC were as follows:
| | Retained
by FDC |
| Class A | $22,237 |
| Class M | 3,137 |
| Class C(a) | 1,515 |
| | $26,889 |
(a) When Class C shares are initially sold, FDC pays commissions from its own resources to financial intermediaries through which the sales are made.
Transfer Agent Fees. Fidelity Investments Institutional Operations Company, Inc., (FIIOC), an affiliate of the investment adviser, is the transfer, dividend disbursing and shareholder servicing agent for each class of the Fund. FIIOC receives account fees and asset-based fees that vary according to the account size and type of account of the shareholders of the respective classes of the Fund. FIIOC pays for typesetting, printing and mailing of shareholder reports, except proxy statements.
For the period, transfer agent fees for each class were as follows:
| | Amount | % of
Class-Level Average
Net Assets |
| Class A | $24,552 | .25 |
| Class M | 17,370 | .28 |
| Class C | 18,268 | .26 |
| Emerging Markets Discovery | 327,388 | .21 |
| Class I | 81,246 | .18 |
| | $468,824 | |
Accounting and Security Lending Fees. Fidelity Service Company, Inc. (FSC), an affiliate of the investment adviser, maintains the Fund's accounting records. The accounting fee is based on the level of average net assets for each month. Under a separate contract, FSC administers the security lending program. The security lending fee is based on the number and duration of lending transactions.
Brokerage Commissions. The Fund placed a portion of its portfolio transactions with brokerage firms which are affiliates of the investment adviser. Brokerage commissions are included in net realized gain (loss) and change in net unrealized appreciation (depreciation) in the Statement of Operations. The commissions paid to these affiliated firms were $1,597 for the period.
Interfund Trades. The Fund may purchase from or sell securities to other Fidelity Funds under procedures adopted by the Board. The procedures have been designed to ensure these interfund trades are executed in accordance with Rule 17a-7 of the 1940 Act. Interfund trades are included within the respective purchases and sales amounts shown in the Purchases and Sales of Investments note.
7. Committed Line of Credit.
The Fund participates with other funds managed by the investment adviser or an affiliate in a $4.25 billion credit facility (the "line of credit") to be utilized for temporary or emergency purposes to fund shareholder redemptions or for other short-term liquidity purposes. The Fund has agreed to pay commitment fees on its pro-rata portion of the line of credit, which amounted to $586 and is reflected in Miscellaneous expenses on the Statement of Operations. During the period, the Fund did not borrow on this line of credit.
8. Security Lending.
The Fund lends portfolio securities through a lending agent from time to time in order to earn additional income. For equity securities, a lending agent is used and may loan securities to certain qualified borrowers, including Fidelity Capital Markets (FCM), a broker-dealer affiliated with the Fund. On the settlement date of the loan, the Fund receives collateral (in the form of U.S. Treasury obligations, letters of credit and/or cash) against the loaned securities and maintains collateral in an amount not less than 100% of the market value of the loaned securities during the period of the loan. The market value of the loaned securities is determined at the close of business of the Fund and any additional required collateral is delivered to the Fund on the next business day. The Fund or borrower may terminate the loan at any time, and if the borrower defaults on its obligation to return the securities loaned because of insolvency or other reasons, the Fund may apply collateral received from the borrower against the obligation. The Fund may experience delays and costs in recovering the securities loaned. Any cash collateral received is invested in the Fidelity Securities Lending Cash Central Fund. The value of loaned securities and cash collateral at period end are disclosed on the Fund's Statement of Assets and Liabilities. At period end, there were no security loans outstanding with FCM. Security lending income represents the income earned on investing cash collateral, less rebates paid to borrowers and any lending agent fees associated with the loan, plus any premium payments received for lending certain types of securities. Security lending income is presented in the Statement of Operations as a component of income from Fidelity Central Funds. Total security lending income during the period amounted to $90,589, including $3 from securities loaned to FCM.
9. Expense Reductions.
Commissions paid to certain brokers with whom the investment adviser, or its affiliates, places trades on behalf of the Fund include an amount in addition to trade execution, which may be rebated back to the Fund to offset certain expenses. This amount totaled $34,680 for the period.
In addition, during the period the investment adviser reimbursed and/or waived a portion of fund-level operating expenses in the amount of $794.
10. Distributions to Shareholders.
Distributions to shareholders of each class were as follows:
| | Year ended
October 31, 2017 | Year ended October 31, 2016 |
| From net investment income | | |
| Class A | $29,900 | $22,428 |
| Class M | 10,789 | 4,316 |
| Class C | 1,070 | – |
| Emerging Markets Discovery | 534,294 | 453,104 |
| Class I | 83,753 | 10,869 |
| Total | $659,806 | $490,717 |
| From net realized gain | | |
| Class A | $29,370 | $– |
| Class M | 15,653 | – |
| Class C | 12,406 | – |
| Emerging Markets Discovery | 375,874 | – |
| Class I | 52,117 | – |
| Total | $485,420 | $– |
11. Share Transactions.
Share transactions for each class were as follows and may contain automatic conversions between classes or exchanges between affiliated funds:
| | Shares | Shares | Dollars | Dollars |
| | Year ended
October 31, 2017 | Year ended October 31, 2016 | Year ended
October 31, 2017 | Year ended October 31, 2016 |
| Class A | | | | |
| Shares sold | 938,873 | 131,085 | $12,644,829 | $1,473,088 |
| Reinvestment of distributions | 4,936 | 1,944 | 55,853 | 20,757 |
| Shares redeemed | (303,068) | (131,586) | (4,070,793) | (1,425,583) |
| Net increase (decrease) | 640,741 | 1,443 | $8,629,889 | $68,262 |
| Class M | | | | |
| Shares sold | 451,879 | 74,898 | $5,910,208 | $869,903 |
| Reinvestment of distributions | 2,312 | 389 | 26,067 | 4,146 |
| Shares redeemed | (60,393) | (25,757) | (796,878) | (281,676) |
| Net increase (decrease) | 393,798 | 49,530 | $5,139,397 | $592,373 |
| Class C | | | | |
| Shares sold | 856,704 | 58,882 | $11,379,958 | $655,298 |
| Reinvestment of distributions | 1,203 | – | 13,340 | – |
| Shares redeemed | (74,143) | (31,638) | (999,641) | (342,535) |
| Net increase (decrease) | 783,764 | 27,244 | $10,393,657 | $312,763 |
| Emerging Markets Discovery | | | | |
| Shares sold | 14,972,932 | 2,003,183 | $202,173,147 | $22,538,095 |
| Reinvestment of distributions | 74,929 | 39,922 | 850,905 | 427,569 |
| Shares redeemed | (4,082,672) | (2,204,224) | (56,381,917) | (24,359,570) |
| Net increase (decrease) | 10,965,189 | (161,119) | $146,642,135 | $(1,393,906) |
| Class I | | | | |
| Shares sold | 6,604,470 | 642,732 | $89,627,624 | $7,808,576 |
| Reinvestment of distributions | 11,894 | 981 | 135,413 | 10,531 |
| Shares redeemed | (877,747) | (97,475) | (11,209,247) | (1,038,525) |
| Net increase (decrease) | 5,738,617 | 546,238 | $78,553,790 | $6,780,582 |
12. Other.
The Fund's organizational documents provide former and current trustees and officers with a limited indemnification against liabilities arising in connection with the performance of their duties to the Fund. In the normal course of business, the Fund may also enter into contracts that provide general indemnifications. The Fund's maximum exposure under these arrangements is unknown as this would be dependent on future claims that may be made against the Fund. The risk of material loss from such claims is considered remote.
Fidelity® Total Emerging Markets Fund
Performance: The Bottom Line
Average annual total return reflects the change in the value of an investment, assuming reinvestment of distributions from dividend income and capital gains (the profits earned upon the sale of securities that have grown in value, if any) and assuming a constant rate of performance each year. The hypothetical investment and the average annual total returns do not reflect the deduction of taxes that a shareholder would pay on fund distributions or the redemption of fund shares. During periods of reimbursement by Fidelity, a fund’s total return will be greater than it would be had the reimbursement not occurred. How a fund did yesterday is no guarantee of how it will do tomorrow.
Average Annual Total Returns
| For the periods ended October 31, 2017 | Past 1 year | Past 5 years | Life of fundA |
| Fidelity® Total Emerging Markets Fund | 21.37% | 6.54% | 6.97% |
A From November 1, 2011
$10,000 Over Life of Fund
Let's say hypothetically that $10,000 was invested in Fidelity® Total Emerging Markets Fund, a class of the fund, on November 1, 2011, when the fund started.
The chart shows how the value of your investment would have changed, and also shows how the MSCI Emerging Markets Index performed over the same period.
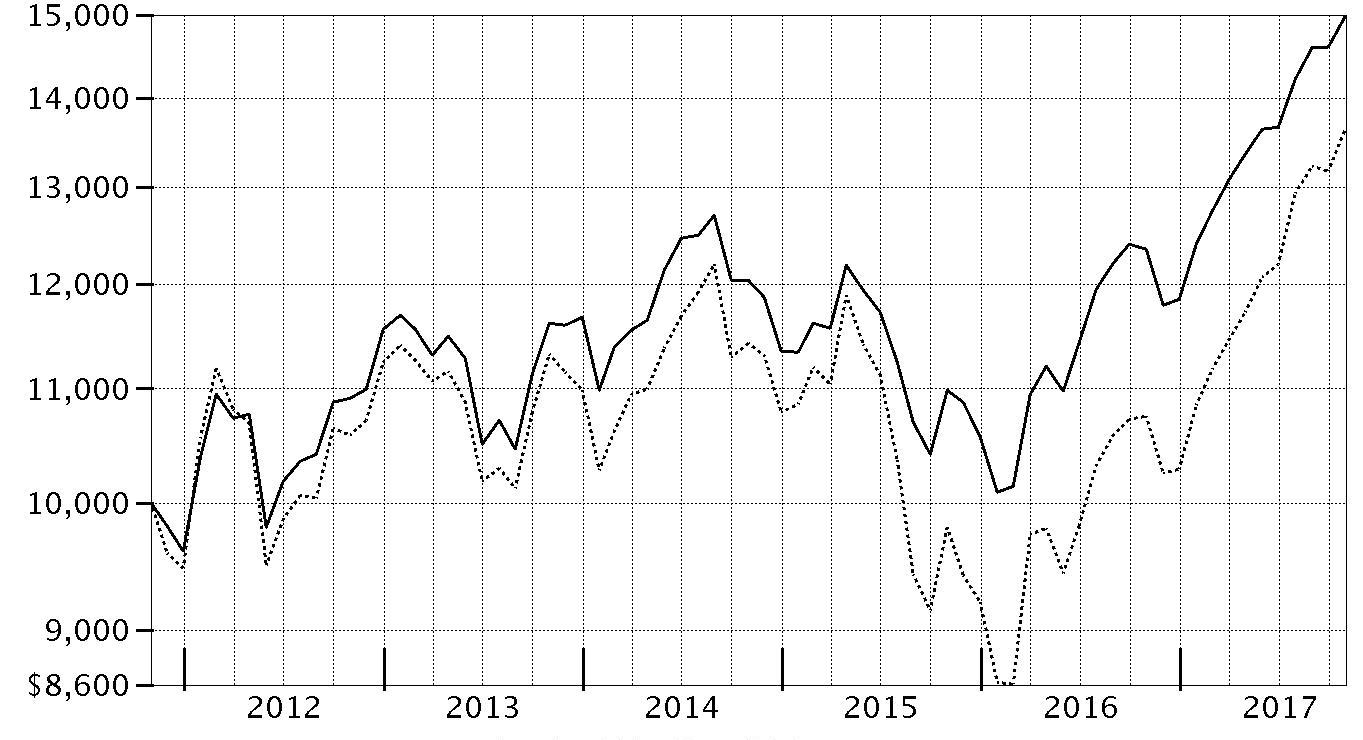
| Period Ending Values |
| $14,984 | Fidelity® Total Emerging Markets Fund |
| $13,639 | MSCI Emerging Markets Index |
Fidelity® Total Emerging Markets Fund
Management's Discussion of Fund Performance
Market Recap: For the 12 months ending October 31, 2017, the Fidelity Total Emerging Markets Composite Index – consisting of 60% equities and 40% debt – gained 18.14%. Separately, emerging-markets (EM) equity gained 26.91%, as measured by the MSCI Emerging Markets Index. EM debt rose 5.89%, according to the J.P. Morgan Emerging Markets Bond Index Global. Both asset classes generally benefited from continued synchronized expansion in global economic activity, which sustained investors' appetite for risk assets. Moreover, a continued flattening of the yield curve – partly the result of a decline in 30-year interest rates – also supported EM debt. EM equities were bolstered by China (+41%) and South Korea (+41%). Improved economic growth supported Chinese stocks, while a widespread technology rally lifted both markets. Turning to EM debt, Ukrainian bonds advanced about 17%. The country issued its first sovereign bond since restructuring its debt in 2015, drawing widespread demand. In addition, reforms progressed due to the influence of the International Monetary Fund, which provided financing support. One of the few countries in the EM debt index to decline was Venezuela (-1%), which suffered amid geopolitical tension and U.S.-issued sanctions.
Comments from Lead Portfolio Manager John Carlson: For the year, the fund’s share classes (excluding sales charges, if applicable) advanced about 21%, outpacing the Composite index. Versus the Composite, successful security selection within both the EM equity and debt subportfolios lifted relative performance, as did asset allocation. The debt sleeve outperformed its benchmark, mainly due to helpful decisions in Ukraine, Venezuela, China and Argentina. Successful security selection overwhelmingly drove the equity sleeve's strong outperformance of its benchmark, with choices among consumer discretionary, industrials, consumer staples and information technology stocks helping the most. Conversely, choices in the health care and real estate sectors detracted. Among individual stocks, an overweighting in Taiwan-based GlobalWafers was our biggest individual contributor. The firm makes silicon wafers upon which semiconductors are made. The stock benefited from the integration of a key acquisition last year, as well as continued growth in global chip manufacturing, led by China. However, underexposure to a few strong-performing South Korea-based technology names, namely chipmakers Samsung Electronics and SK Hynix, hurt the relative result.
The views expressed above reflect those of the portfolio manager(s) only through the end of the period as stated on the cover of this report and do not necessarily represent the views of Fidelity or any other person in the Fidelity organization. Any such views are subject to change at any time based upon market or other conditions and Fidelity disclaims any responsibility to update such views. These views may not be relied on as investment advice and, because investment decisions for a Fidelity fund are based on numerous factors, may not be relied on as an indication of trading intent on behalf of any Fidelity fund.
Fidelity® Total Emerging Markets Fund
Investment Summary (Unaudited)
Top Five Stocks as of October 31, 2017
| | % of fund's net assets | % of fund's net assets 6 months ago |
| Tencent Holdings Ltd. (Cayman Islands, Internet Software & Services) | 4.0 | 2.7 |
| Alibaba Group Holding Ltd. sponsored ADR (Cayman Islands, Internet Software & Services) | 3.5 | 1.5 |
| Naspers Ltd. Class N (South Africa, Media) | 1.9 | 2.6 |
| Sberbank of Russia (Russia, Banks) | 1.7 | 1.4 |
| Taiwan Semiconductor Manufacturing Co. Ltd. (Taiwan, Semiconductors & Semiconductor Equipment) | 1.5 | 2.1 |
| | 12.6 | |
Top Five Market Sectors as of October 31, 2017
| | % of fund's net assets | % of fund's net assets 6 months ago |
| Financials | 18.2 | 16.3 |
| Information Technology | 17.9 | 14.6 |
| Consumer Discretionary | 10.2 | 9.6 |
| Energy | 9.5 | 9.3 |
| Materials | 5.9 | 5.3 |
Top Five Countries as of October 31, 2017
| (excluding cash equivalents) | % of fund's net assets | % of fund's net assets 6 months ago |
| Cayman Islands | 10.9 | 10.3 |
| Korea (South) | 9.3 | 8.0 |
| Brazil | 7.1 | 6.4 |
| India | 6.6 | 5.1 |
| China | 6.3 | 4.7 |
Percentages are adjusted for the effect of futures contracts, if applicable.
Asset Allocation (% of fund's net assets)
| As of October 31, 2017 |
| | Stocks | 71.5% |
| | Bonds | 25.6% |
| | Short-Term Investments and Net Other Assets (Liabilities) | 2.9% |

| As of April 30, 2017 |
| | Stocks and Equity Futures | 68.6% |
| | Bonds | 27.4% |
| | Short-Term Investments and Net Other Assets (Liabilities) | 4.0% |

Fidelity® Total Emerging Markets Fund
Investments October 31, 2017
Showing Percentage of Net Assets
| Common Stocks - 66.8% | | | |
| | | Shares | Value |
| Argentina - 0.3% | | | |
| Grupo Superveille SA sponsored ADR | | 29,700 | $796,257 |
| Telecom Argentina SA Class B sponsored ADR (a) | | 14,934 | 486,998 |
| YPF SA Class D sponsored ADR | | 44,700 | 1,097,832 |
|
| TOTAL ARGENTINA | | | 2,381,087 |
|
| Australia - 0.0% | | | |
| Frontier Digital Ventures Ltd. (a) | | 419,187 | 208,536 |
| Austria - 0.2% | | | |
| Erste Group Bank AG | | 23,655 | 1,016,486 |
| Bermuda - 1.1% | | | |
| AGTech Holdings Ltd. (a) | | 1,920,000 | 334,709 |
| Credicorp Ltd. (United States) | | 10,500 | 2,199,120 |
| GP Investments Ltd. Class A (depositary receipt) (a) | | 22,922 | 40,991 |
| Shangri-La Asia Ltd. | | 2,102,000 | 4,181,690 |
| VimpelCom Ltd. sponsored ADR | | 343,660 | 1,343,711 |
|
| TOTAL BERMUDA | | | 8,100,221 |
|
| Brazil - 3.2% | | | |
| Azul SA sponsored ADR | | 33,600 | 849,744 |
| B2W Companhia Global do Varejo (a) | | 928,517 | 6,025,866 |
| Banco do Brasil SA | | 200,400 | 2,109,796 |
| BR Malls Participacoes SA | | 262,923 | 1,019,125 |
| Centrais Eletricas Brasileiras SA (Electrobras) (a) | | 64,540 | 435,028 |
| Companhia de Saneamento de Minas Gerais | | 99,636 | 1,200,030 |
| Cosan SA Industria e Comercio | | 108,255 | 1,237,654 |
| Direcional Engenharia SA (a) | | 326,900 | 584,589 |
| Localiza Rent A Car SA | | 79,895 | 1,413,360 |
| Minerva SA | | 294,800 | 1,036,346 |
| Smiles Fidelidade SA | | 97,200 | 2,540,458 |
| Vale SA sponsored ADR | | 506,868 | 4,962,238 |
|
| TOTAL BRAZIL | | | 23,414,234 |
|
| British Virgin Islands - 0.9% | | | |
| Despegar.com Corp. | | 37,900 | 1,167,320 |
| Mail.Ru Group Ltd. GDR (Reg. S) (a) | | 174,266 | 5,663,645 |
|
| TOTAL BRITISH VIRGIN ISLANDS | | | 6,830,965 |
|
| Canada - 0.3% | | | |
| Pan American Silver Corp. | | 88,200 | 1,440,306 |
| Torex Gold Resources, Inc. (a) | | 50,530 | 696,790 |
|
| TOTAL CANADA | | | 2,137,096 |
|
| Cayman Islands - 10.9% | | | |
| 58.com, Inc. ADR (a) | | 45,150 | 3,032,726 |
| Alibaba Group Holding Ltd. sponsored ADR (a) | | 139,400 | 25,773,666 |
| BizLink Holding, Inc. | | 66,294 | 664,304 |
| China Biologic Products Holdings, Inc. | | 7,700 | 598,367 |
| China Literature Ltd. | | 4,366 | 30,780 |
| Ctrip.com International Ltd. ADR (a) | | 21,100 | 1,010,479 |
| Haitian International Holdings Ltd. | | 446,000 | 1,334,901 |
| JD.com, Inc. sponsored ADR (a) | | 251,500 | 9,436,280 |
| NetEase, Inc. ADR | | 9,900 | 2,791,008 |
| Qudian, Inc. ADR | | 400 | 9,960 |
| Sea Ltd. ADR (b) | | 24,400 | 367,952 |
| Secoo Holding Ltd. ADR | | 22,000 | 159,280 |
| Silergy Corp. | | 9,000 | 194,406 |
| Silicon Motion Technology Corp. sponsored ADR | | 14,900 | 721,458 |
| Tencent Holdings Ltd. | | 645,350 | 29,005,318 |
| Uni-President China Holdings Ltd. | | 2,725,600 | 2,277,913 |
| Vipshop Holdings Ltd. ADR (a) | | 180,600 | 1,426,740 |
| ZTO Express (Cayman), Inc. sponsored ADR | | 52,900 | 845,871 |
|
| TOTAL CAYMAN ISLANDS | | | 79,681,409 |
|
| Chile - 0.8% | | | |
| Compania Cervecerias Unidas SA sponsored ADR | | 72,800 | 2,073,344 |
| Enersis SA | | 5,152,627 | 1,105,089 |
| Inversiones La Construccion SA | | 59,428 | 1,013,017 |
| Sociedad Quimica y Minera de Chile SA (PN-B) sponsored ADR | | 16,500 | 985,710 |
| Vina Concha y Toro SA | | 519,858 | 917,113 |
|
| TOTAL CHILE | | | 6,094,273 |
|
| China - 6.3% | | | |
| BBMG Corp. (H Shares) | | 2,286,000 | 1,139,865 |
| China Life Insurance Co. Ltd. (H Shares) | | 2,124,834 | 7,044,468 |
| China Longyuan Power Grid Corp. Ltd. (H Shares) | | 2,281,960 | 1,690,687 |
| China Molybdenum Co. Ltd. (H Shares) | | 420,000 | 272,951 |
| China Pacific Insurance (Group) Co. Ltd. (H Shares) | | 869,706 | 4,286,435 |
| China Petroleum & Chemical Corp. (H Shares) | | 1,714,000 | 1,258,622 |
| China Telecom Corp. Ltd. (H Shares) | | 2,803,949 | 1,405,317 |
| Conch Cement Co. Ltd. (H Shares) | | 388,000 | 1,658,651 |
| Guangzhou Automobile Group Co. Ltd. (H Shares) | | 1,812,000 | 4,505,960 |
| Hangzhou Hikvision Digital Technology Co. Ltd. Class A | | 201,100 | 1,190,554 |
| Industrial & Commercial Bank of China Ltd. (H Shares) | | 13,029,160 | 10,337,952 |
| Kweichow Moutai Co. Ltd. (A Shares) | | 7,499 | 698,519 |
| Maanshan Iron & Steel Ltd. (H Shares) (a) | | 866,000 | 406,281 |
| PICC Property & Casualty Co. Ltd. (H Shares) | | 1,046,580 | 2,074,003 |
| Qingdao Haier Co. Ltd. | | 1,286,251 | 3,353,802 |
| Shanghai International Airport Co. Ltd. (A Shares) | | 235,114 | 1,550,323 |
| Tsingtao Brewery Co. Ltd. (H Shares) | | 390,000 | 1,632,207 |
| Zhengzhou Yutong Bus Co. Ltd. | | 335,590 | 1,286,743 |
|
| TOTAL CHINA | | | 45,793,340 |
|
| Colombia - 0.1% | | | |
| Bancolombia SA sponsored ADR | | 15,395 | 581,161 |
| Cyprus - 0.1% | | | |
| Etalon Group PLC GDR (Reg. S) | | 162,600 | 658,530 |
| Egypt - 0.0% | | | |
| Six of October Development & Investment Co. (a) | | 149,100 | 156,736 |
| Greece - 0.2% | | | |
| Titan Cement Co. SA (Reg.) | | 63,700 | 1,537,444 |
| Hong Kong - 3.3% | | | |
| AIA Group Ltd. | | 95,120 | 715,711 |
| China Mobile Ltd. | | 12,950 | 130,256 |
| China Mobile Ltd. sponsored ADR | | 49,252 | 2,484,763 |
| China Overseas Land and Investment Ltd. | | 648,500 | 2,103,090 |
| China Resources Beer Holdings Co. Ltd. | | 1,090,666 | 3,145,587 |
| China Resources Power Holdings Co. Ltd. | | 740,009 | 1,422,839 |
| China Unicom Ltd. (a) | | 132,500 | 187,999 |
| China Unicom Ltd. sponsored ADR (a) | | 104,520 | 1,476,868 |
| CNOOC Ltd. | | 3,119,000 | 4,258,662 |
| CSPC Pharmaceutical Group Ltd. | | 1,192,000 | 2,071,874 |
| Far East Horizon Ltd. | | 3,371,980 | 3,349,764 |
| Sinotruk Hong Kong Ltd. | | 1,095,000 | 1,454,124 |
| Techtronic Industries Co. Ltd. | | 216,500 | 1,269,628 |
|
| TOTAL HONG KONG | | | 24,071,165 |
|
| India - 6.6% | | | |
| Adani Ports & Special Economic Zone Ltd. | | 297,696 | 1,978,586 |
| Axis Bank Ltd. | | 345,946 | 2,795,083 |
| Bharat Petroleum Corp. Ltd. | | 327,667 | 2,740,764 |
| Bharti Infratel Ltd. | | 249,464 | 1,703,483 |
| Coal India Ltd. | | 344,413 | 1,523,662 |
| Eicher Motors Ltd. | | 1,595 | 794,012 |
| Federal Bank Ltd. | | 745,104 | 1,401,026 |
| ICICI Bank Ltd. | | 334,745 | 1,569,742 |
| ICICI Bank Ltd. sponsored ADR | | 342,840 | 3,136,986 |
| Indraprastha Gas Ltd. | | 49,828 | 1,219,843 |
| InterGlobe Aviation Ltd. | | 48,086 | 926,704 |
| ITC Ltd. | | 432,498 | 1,774,745 |
| JK Cement Ltd. | | 79,550 | 1,231,520 |
| Larsen & Toubro Ltd. | | 105,092 | 1,983,845 |
| LIC Housing Finance Ltd. | | 257,628 | 2,382,114 |
| Lupin Ltd. | | 167,037 | 2,652,083 |
| Petronet LNG Ltd. | | 325,459 | 1,306,108 |
| Phoenix Mills Ltd. | | 201,080 | 1,632,242 |
| Power Grid Corp. of India Ltd. | | 314,674 | 1,029,555 |
| Reliance Industries Ltd. | | 438,986 | 6,378,687 |
| SREI Infrastructure Finance Ltd. | | 116,223 | 205,881 |
| State Bank of India | | 431,823 | 2,039,405 |
| Sun Pharmaceutical Industries Ltd. | | 367,195 | 3,135,477 |
| Tata Motors Ltd. (a) | | 367,301 | 2,430,143 |
| Tejas Networks Ltd. | | 37,582 | 189,303 |
|
| TOTAL INDIA | | | 48,160,999 |
|
| Indonesia - 1.9% | | | |
| PT Astra International Tbk | | 6,130,200 | 3,615,971 |
| PT Bank Mandiri (Persero) Tbk | | 4,384,100 | 2,278,924 |
| PT Bank Rakyat Indonesia Tbk | | 2,610,000 | 3,002,101 |
| PT Indocement Tunggal Prakarsa Tbk | | 644,300 | 1,066,509 |
| PT Kalbe Farma Tbk | | 6,587,100 | 777,096 |
| PT Link Net Tbk | | 1,521,900 | 559,947 |
| PT Lippo Karawaci Tbk | | 5,578,500 | 283,809 |
| PT Media Nusantara Citra Tbk | | 4,697,700 | 540,344 |
| PT Semen Gresik (Persero) Tbk | | 1,856,400 | 1,491,964 |
|
| TOTAL INDONESIA | | | 13,616,665 |
|
| Israel - 0.2% | | | |
| Bezeq The Israel Telecommunication Corp. Ltd. | | 1,055,255 | 1,575,728 |
| Japan - 0.5% | | | |
| Minebea Mitsumi, Inc. | | 28,500 | 522,494 |
| Panasonic Corp. | | 58,800 | 887,843 |
| Sumco Corp. | | 78,200 | 1,722,477 |
| TDK Corp. | | 6,500 | 499,456 |
|
| TOTAL JAPAN | | | 3,632,270 |
|
| Korea (South) - 7.8% | | | |
| AMOREPACIFIC Group, Inc. | | 22,985 | 2,949,984 |
| BS Financial Group, Inc. | | 306,417 | 2,724,096 |
| Daou Technology, Inc. | | 97,211 | 1,595,419 |
| Duk San Neolux Co. Ltd. | | 12,583 | 247,026 |
| Fila Korea Ltd. | | 934 | 56,553 |
| Hanon Systems | | 99,944 | 1,162,046 |
| Hyundai Fire & Marine Insurance Co. Ltd. | | 50,621 | 2,053,200 |
| Hyundai Glovis Co. Ltd. | | 9,908 | 1,338,093 |
| Hyundai Industrial Development & Construction Co. | | 17,529 | 628,673 |
| Hyundai Mipo Dockyard Co. Ltd. (a) | | 9,923 | 962,933 |
| Hyundai Mobis | | 27,350 | 6,518,952 |
| InterPark INT Corp. | | 29,545 | 246,541 |
| KB Financial Group, Inc. | | 121,436 | 6,362,031 |
| KEPCO Plant Service & Engineering Co. Ltd. | | 15,493 | 572,280 |
| Korea Electric Power Corp. | | 28,583 | 1,004,133 |
| Korea Express Co. Ltd. (a) | | 10,300 | 1,446,306 |
| Korean Reinsurance Co. | | 140,421 | 1,406,609 |
| KT Corp. | | 11,630 | 305,858 |
| KT Corp. sponsored ADR | | 18,890 | 271,827 |
| LG Chemical Ltd. | | 13,541 | 4,886,721 |
| LG Telecom Ltd. | | 66,519 | 764,490 |
| NAVER Corp. | | 2,379 | 1,902,196 |
| Samsung Electronics Co. Ltd. | | 2,356 | 5,803,132 |
| Samsung Life Insurance Co. Ltd. | | 16,190 | 1,954,807 |
| Samsung SDI Co. Ltd. | | 18,150 | 3,344,006 |
| Shinhan Financial Group Co. Ltd. | | 141,551 | 6,371,067 |
|
| TOTAL KOREA (SOUTH) | | | 56,878,979 |
|
| Mauritius - 0.1% | | | |
| MakeMyTrip Ltd. (a) | | 30,500 | 832,650 |
| Mexico - 1.7% | | | |
| America Movil S.A.B. de CV Series L sponsored ADR | | 24,600 | 421,152 |
| CEMEX S.A.B. de CV sponsored ADR | | 272,583 | 2,210,648 |
| Grupo Aeroportuario del Pacifico S.A.B. de CV Series B | | 114,400 | 1,085,000 |
| Grupo Financiero Banorte S.A.B. de CV Series O | | 537,529 | 3,190,113 |
| Infraestructura Energetica Nova S.A.B. de CV | | 25,284 | 129,099 |
| Macquarie Mexican (REIT) | | 1,979,270 | 2,374,494 |
| Promotora y Operadora de Infraestructura S.A.B. de CV | | 90,110 | 855,708 |
| Tenedora Nemak SA de CV | | 31,814 | 23,912 |
| Wal-Mart de Mexico SA de CV Series V | | 1,028,900 | 2,299,116 |
|
| TOTAL MEXICO | | | 12,589,242 |
|
| Netherlands - 0.9% | | | |
| Hangzhou Hikvision Digital Technology Co. Ltd. ELS (BNP Paribas Warrant Program) warrants 9/5/18 (a)(c) | | 99,825 | 590,985 |
| X5 Retail Group NV GDR (Reg. S) (a) | | 20,300 | 834,330 |
| Yandex NV Series A (a) | | 157,987 | 5,344,700 |
|
| TOTAL NETHERLANDS | | | 6,770,015 |
|
| Nigeria - 0.3% | | | |
| Guaranty Trust Bank PLC | | 3,465,183 | 404,271 |
| Guaranty Trust Bank PLC GDR (Reg. S) | | 124,480 | 746,880 |
| Transnational Corp. of Nigeria PLC (a) | | 41,804,033 | 167,216 |
| Zenith Bank PLC | | 16,215,469 | 1,148,145 |
|
| TOTAL NIGERIA | | | 2,466,512 |
|
| Pakistan - 0.2% | | | |
| Habib Bank Ltd. | | 953,200 | 1,452,310 |
| Panama - 0.2% | | | |
| Copa Holdings SA Class A | | 11,149 | 1,373,445 |
| Peru - 0.2% | | | |
| Compania de Minas Buenaventura SA sponsored ADR | | 101,200 | 1,395,548 |
| Philippines - 0.6% | | | |
| International Container Terminal Services, Inc. | | 390,620 | 801,905 |
| Metropolitan Bank & Trust Co. | | 1,507,081 | 2,530,037 |
| Robinsons Land Corp. | | 2,417,880 | 1,181,157 |
|
| TOTAL PHILIPPINES | | | 4,513,099 |
|
| Russia - 3.7% | | | |
| Lukoil PJSC sponsored ADR | | 80,200 | 4,258,620 |
| MegaFon PJSC | | 46,200 | 458,208 |
| MegaFon PJSC GDR | | 32,060 | 335,027 |
| MMC Norilsk Nickel PJSC sponsored ADR | | 215,400 | 3,963,360 |
| Mobile TeleSystems OJSC | | 253,962 | 1,223,700 |
| NOVATEK OAO GDR (Reg. S) | | 21,600 | 2,464,560 |
| RusHydro PJSC | | 76,654,300 | 1,070,906 |
| Sberbank of Russia | | 1,638,160 | 5,428,258 |
| Sberbank of Russia sponsored ADR | | 490,284 | 7,035,575 |
| Unipro PJSC | | 20,261,700 | 888,701 |
|
| TOTAL RUSSIA | | | 27,126,915 |
|
| Singapore - 0.2% | | | |
| First Resources Ltd. | | 799,500 | 1,155,465 |
| South Africa - 4.5% | | | |
| Aspen Pharmacare Holdings Ltd. | | 94,261 | 2,129,727 |
| Barclays Africa Group Ltd. | | 152,614 | 1,512,674 |
| Bidvest Group Ltd. | | 107,056 | 1,298,566 |
| FirstRand Ltd. | | 553,500 | 2,006,321 |
| Imperial Holdings Ltd. | | 215,464 | 3,087,930 |
| Life Healthcare Group Holdings Ltd. | | 634,300 | 1,175,398 |
| MTN Group Ltd. | | 240,600 | 2,089,185 |
| Naspers Ltd. Class N | | 56,545 | 13,777,563 |
| Nedbank Group Ltd. | | 80,580 | 1,181,850 |
| Sasol Ltd. | | 52,800 | 1,542,699 |
| Tiger Brands Ltd. | | 98,900 | 2,700,055 |
|
| TOTAL SOUTH AFRICA | | | 32,501,968 |
|
| Taiwan - 5.7% | | | |
| Advantech Co. Ltd. | | 83,897 | 573,455 |
| Chroma ATE, Inc. | | 166,000 | 809,675 |
| eMemory Technology, Inc. | | 7,995 | 98,021 |
| Genius Electronic Optical Co. Ltd. (a) | | 28,000 | 315,416 |
| GlobalWafers Co. Ltd. | | 374,300 | 4,328,209 |
| Hon Hai Precision Industry Co. Ltd. (Foxconn) | | 270,000 | 1,003,384 |
| King's Town Bank | | 400,600 | 437,978 |
| LandMark Optoelectronics Corp. | | 72,000 | 918,575 |
| Largan Precision Co. Ltd. | | 55,403 | 10,505,944 |
| MediaTek, Inc. | | 57,000 | 647,770 |
| Nanya Technology Corp. | | 517,000 | 1,403,232 |
| PChome Online, Inc. | | 71,032 | 411,278 |
| Quanta Computer, Inc. | | 696,000 | 1,639,658 |
| Taiwan Fertilizer Co. Ltd. | | 387,000 | 505,933 |
| Taiwan Semiconductor Manufacturing Co. Ltd. | | 1,338,000 | 10,824,514 |
| Taiwan Semiconductor Manufacturing Co. Ltd. sponsored ADR | | 11,342 | 480,107 |
| Unified-President Enterprises Corp. | | 1,234,000 | 2,579,534 |
| United Microelectronics Corp. | | 3,770,000 | 1,947,105 |
| Universal Cement Corp. | | 374,219 | 289,933 |
| Wistron NeWeb Corp. | | 30,728 | 88,193 |
| Yuanta Financial Holding Co. Ltd. | | 4,066,231 | 1,807,933 |
|
| TOTAL TAIWAN | | | 41,615,847 |
|
| Thailand - 0.6% | | | |
| Delta Electronics PCL (For. Reg.) | | 236,800 | 613,028 |
| PTT Global Chemical PCL (For. Reg.) | | 1,143,600 | 2,754,004 |
| Star Petroleum Refining PCL | | 1,910,800 | 1,000,840 |
|
| TOTAL THAILAND | | | 4,367,872 |
|
| Turkey - 1.4% | | | |
| Bim Birlesik Magazalar A/S JSC | | 102,000 | 2,079,767 |
| Tupras Turkiye Petrol Rafinerileri A/S | | 74,200 | 2,669,874 |
| Turkcell Iletisim Hizmet A/S | | 554,300 | 2,070,470 |
| Turkcell Iletisim Hizmet A/S sponsored ADR (b) | | 19,500 | 183,105 |
| Turkiye Garanti Bankasi A/S | | 1,213,000 | 3,335,027 |
|
| TOTAL TURKEY | | | 10,338,243 |
|
| United Arab Emirates - 1.2% | | | |
| DP World Ltd. | | 65,964 | 1,566,645 |
| Emaar Properties PJSC | | 1,999,013 | 4,512,224 |
| National Bank of Abu Dhabi PJSC | | 863,602 | 2,433,741 |
|
| TOTAL UNITED ARAB EMIRATES | | | 8,512,610 |
|
| United Kingdom - 0.2% | | | |
| Fresnillo PLC | | 61,500 | 1,063,490 |
| Shanghai International Airport Co. Ltd. ELS (UBS Warrant Programme) warrants 5/11/18 (c) | | 9,200 | 60,664 |
|
| TOTAL UNITED KINGDOM | | | 1,124,154 |
|
| United States of America - 0.4% | | | |
| Cognizant Technology Solutions Corp. Class A | | 25,200 | 1,906,884 |
| MercadoLibre, Inc. | | 3,400 | 817,054 |
|
| TOTAL UNITED STATES OF AMERICA | | | 2,723,938 |
|
| TOTAL COMMON STOCKS | | | |
| (Cost $414,136,019) | | | 487,387,157 |
|
| Nonconvertible Preferred Stocks - 4.7% | | | |
| Brazil - 3.2% | | | |
| Ambev SA sponsored ADR | | 554,300 | 3,508,719 |
| Banco do Estado Rio Grande do Sul SA | | 213,320 | 993,794 |
| Companhia Paranaense de Energia-Copel: | | | |
| (PN-B) | | 4,015 | 30,671 |
| (PN-B) sponsored ADR | | 168,852 | 1,298,472 |
| Fibria Celulose SA sponsored ADR | | 161,700 | 2,577,498 |
| Itau Unibanco Holding SA sponsored ADR | | 515,141 | 6,598,956 |
| Metalurgica Gerdau SA (PN) (a) | | 925,170 | 1,445,180 |
| Petroleo Brasileiro SA - Petrobras (PN) sponsored ADR (non-vtg.) (a) | | 462,406 | 4,739,662 |
| Telefonica Brasil SA | | 150,743 | 2,327,063 |
|
| TOTAL BRAZIL | | | 23,520,015 |
|
| Korea (South) - 1.5% | | | |
| Hyundai Motor Co. Series 2 | | 51,644 | 5,219,412 |
| Samsung Electronics Co. Ltd. | | 1,991 | 3,988,802 |
| Samsung Fire & Marine Insurance Co. Ltd. | | 9,832 | 1,578,445 |
|
| TOTAL KOREA (SOUTH) | | | 10,786,659 |
|
| TOTAL NONCONVERTIBLE PREFERRED STOCKS | | | |
| (Cost $29,356,617) | | | 34,306,674 |
| | | Principal Amount(d) | Value |
|
| Nonconvertible Bonds - 7.4% | | | |
| Azerbaijan - 0.8% | | | |
| Southern Gas Corridor CJSC 6.875% 3/24/26 (c) | | 2,330,000 | 2,632,993 |
| State Oil Co. of Azerbaijan Republic 6.95% 3/18/30 (Reg. S) | | 3,225,000 | 3,544,739 |
|
| TOTAL AZERBAIJAN | | | 6,177,732 |
|
| Bahrain - 0.1% | | | |
| The Oil and Gas Holding Co. 7.5% 10/25/27 (c) | | 455,000 | 472,081 |
| British Virgin Islands - 0.1% | | | |
| 1MDB Global Investments Ltd. 4.4% 3/9/23 | | 1,000,000 | 960,765 |
| Canada - 0.3% | | | |
| First Quantum Minerals Ltd.: | | | |
| 7.25% 5/15/22 (c) | | 450,000 | 470,250 |
| 7.25% 4/1/23 (c) | | 1,700,000 | 1,797,750 |
| 7.5% 4/1/25 (c) | | 200,000 | 211,750 |
|
| TOTAL CANADA | | | 2,479,750 |
|
| Cayman Islands - 0.0% | | | |
| Sparc Em Spc 0% 12/5/22 (c) | | 200,000 | 182,500 |
| Georgia - 0.6% | | | |
| Georgian Oil & Gas Corp. 6.75% 4/26/21 (c) | | 2,000,000 | 2,140,000 |
| JSC BGEO Group 6% 7/26/23 (c) | | 850,000 | 873,511 |
| JSC Georgian Railway 7.75% 7/11/22 (c) | | 1,250,000 | 1,395,338 |
|
| TOTAL GEORGIA | | | 4,408,849 |
|
| Indonesia - 0.2% | | | |
| PT Pertamina Persero 6.5% 5/27/41 (c) | | 1,000,000 | 1,206,769 |
| Ireland - 0.5% | | | |
| Vnesheconombank Via VEB Finance PLC: | | | |
| 6.025% 7/5/22 (c) | | 900,000 | 976,597 |
| 6.8% 11/22/25 (c) | | 2,075,000 | 2,359,420 |
|
| TOTAL IRELAND | | | 3,336,017 |
|
| Israel - 0.0% | | | |
| Israel Electric Corp. Ltd. 7.75% 12/15/27 (Reg. S) | | 275,000 | 353,374 |
| Kazakhstan - 0.1% | | | |
| KazMunaiGaz Finance Sub BV 5.75% 4/19/47 (c) | | 490,000 | 492,450 |
| Mexico - 1.6% | | | |
| Pemex Project Funding Master Trust: | | | |
| 6.625% 6/15/35 | | 3,875,000 | 4,092,000 |
| 8.625% 2/1/22 | | 300,000 | 350,609 |
| Petroleos Mexicanos: | | | |
| 6.5% 3/13/27 (c) | | 500,000 | 546,000 |
| 6.5% 3/13/27 (c) | | 1,505,000 | 1,643,460 |
| 6.5% 6/2/41 | | 3,550,000 | 3,594,375 |
| 6.875% 8/4/26 | | 1,200,000 | 1,348,200 |
|
| TOTAL MEXICO | | | 11,574,644 |
|
| Mongolia - 0.1% | | | |
| Trade and Development Bank of Mongolia LLC 9.375% 5/19/20 (Reg. S) | | 850,000 | 933,738 |
| Morocco - 0.1% | | | |
| OCP SA 6.875% 4/25/44 (c) | | 775,000 | 873,735 |
| Netherlands - 0.4% | | | |
| Petrobras Global Finance BV: | | | |
| 7.25% 3/17/44 | | 705,000 | 739,369 |
| 8.75% 5/23/26 | | 1,675,000 | 2,028,844 |
|
| TOTAL NETHERLANDS | | | 2,768,213 |
|
| Oman - 0.1% | | | |
| Oman Sovereign Sukuk SAOC 4.397% 6/1/24 (c) | | 1,000,000 | 1,000,000 |
| Peru - 0.1% | | | |
| Petroleos Del Peru Petroperu SA: | | | |
| 4.75% 6/19/32 (c) | | 205,000 | 209,551 |
| 5.625% 6/19/47 (c) | | 275,000 | 289,438 |
|
| TOTAL PERU | | | 498,989 |
|
| South Africa - 0.4% | | | |
| Eskom Holdings SOC Ltd. 6.75% 8/6/23 (c) | | 2,825,000 | 2,888,563 |
| Trinidad & Tobago - 0.2% | | | |
| Petroleum Co. of Trinidad & Tobago Ltd.: | | | |
| 6% 5/8/22 (c) | | 285,417 | 288,271 |
| 9.75% 8/14/19 (c) | | 750,000 | 798,750 |
|
| TOTAL TRINIDAD & TOBAGO | | | 1,087,021 |
|
| Tunisia - 0.3% | | | |
| Banque Centrale de Tunisie 5.75% 1/30/25 (c) | | 2,500,000 | 2,478,730 |
| United Arab Emirates - 0.3% | | | |
| Abu Dhabi Crude Oil Pipeline 4.6% 11/2/47 (c) | | 570,000 | 582,434 |
| Dolphin Energy Ltd.: | | | |
| 5.5% 12/15/21 (c) | | 340,000 | 371,422 |
| 5.888% 6/15/19 (c) | | 750,250 | 772,622 |
| DP World Ltd. 6.85% 7/2/37 (Reg. S) | | 500,000 | 618,750 |
|
| TOTAL UNITED ARAB EMIRATES | | | 2,345,228 |
|
| United Kingdom - 0.4% | | | |
| Biz Finance PLC 9.625% 4/27/22 (c) | | 2,450,000 | 2,646,196 |
| Venezuela - 0.7% | | | |
| Petroleos de Venezuela SA: | | | |
| 5.375% 4/12/27 | | 1,750,000 | 505,750 |
| 5.5% 4/12/37 | | 1,000,000 | 287,500 |
| 6% 5/16/24 (c) | | 3,600,000 | 1,017,000 |
| 6% 11/15/26 (Reg. S) | | 2,450,000 | 679,875 |
| 8.5% 10/27/20 (Reg. S) | | 2,625,000 | 2,182,688 |
| 9% 11/17/21 (Reg. S) | | 550,000 | 243,375 |
| 12.75% 2/17/22 (c) | | 600,000 | 271,500 |
|
| TOTAL VENEZUELA | | | 5,187,688 |
|
| TOTAL NONCONVERTIBLE BONDS | | | |
| (Cost $54,219,152) | | | 54,353,032 |
|
| Government Obligations - 18.4% | | | |
| Argentina - 1.6% | | | |
| Argentine Republic: | | | |
| 6.875% 1/26/27 | | 1,800,000 | 1,962,000 |
| 7.125% 7/6/36 | | 400,000 | 430,200 |
| 7.5% 4/22/26 | | 5,960,000 | 6,734,800 |
| 7.82% 12/31/33 | EUR | 1,685,727 | 2,255,904 |
|
| TOTAL ARGENTINA | | | 11,382,904 |
|
| Armenia - 0.3% | | | |
| Republic of Armenia 7.15% 3/26/25 (c) | | 1,820,000 | 2,032,485 |
| Barbados - 0.2% | | | |
| Barbados Government 7% 8/4/22 (c) | | 1,313,000 | 1,185,481 |
| Belarus - 0.2% | | | |
| Belarus Republic: | | | |
| 6.875% 2/28/23 (c) | | 290,000 | 308,183 |
| 7.625% 6/29/27 (c) | | 1,265,000 | 1,394,663 |
|
| TOTAL BELARUS | | | 1,702,846 |
|
| Bolivia - 0.2% | | | |
| Plurinational State of Bolivia 4.5% 3/20/28 (c) | | 1,300,000 | 1,264,250 |
| Brazil - 0.7% | | | |
| Brazilian Federative Republic: | | | |
| 4.625% 1/13/28 | | 500,000 | 496,500 |
| 5% 1/27/45 | | 600,000 | 555,230 |
| 5.625% 2/21/47 | | 800,000 | 815,200 |
| 7.125% 1/20/37 | | 700,000 | 836,150 |
| 8.25% 1/20/34 | | 1,600,000 | 2,079,200 |
| 12.25% 3/6/30 | | 100,000 | 165,750 |
|
| TOTAL BRAZIL | | | 4,948,030 |
|
| Cameroon - 0.3% | | | |
| Cameroon Republic 9.5% 11/19/25 (c) | | 2,050,000 | 2,429,578 |
| Colombia - 0.2% | | | |
| Colombian Republic: | | | |
| 6.125% 1/18/41 | | 575,000 | 676,775 |
| 7.375% 9/18/37 | | 550,000 | 726,000 |
|
| TOTAL COLOMBIA | | | 1,402,775 |
|
| Dominican Republic - 0.3% | | | |
| Dominican Republic: | | | |
| 5.95% 1/25/27 (c) | | 750,000 | 807,375 |
| 6.85% 1/27/45 (c) | | 550,000 | 613,250 |
| 7.45% 4/30/44 (c) | | 425,000 | 504,688 |
|
| TOTAL DOMINICAN REPUBLIC | | | 1,925,313 |
|
| Ecuador - 0.3% | | | |
| Ecuador Republic: | | | |
| 7.95% 6/20/24 (c) | | 200,000 | 202,000 |
| 8.75% 6/2/23 (c) | | 800,000 | 839,200 |
| 8.875% 10/23/27 (c) | | 460,000 | 469,163 |
| 9.625% 6/2/27 (c) | | 200,000 | 215,000 |
| 9.65% 12/13/26 (c) | | 200,000 | 217,000 |
| 10.75% 3/28/22 (c) | | 450,000 | 508,500 |
|
| TOTAL ECUADOR | | | 2,450,863 |
|
| Egypt - 0.8% | | | |
| Arab Republic of Egypt: | | | |
| , yield at date of purchase 20.3492% 12/26/17 | EGP | 11,000,000 | 607,191 |
| 6.125% 1/31/22 (c) | | 800,000 | 834,179 |
| 7.5% 1/31/27 (c) | | 1,250,000 | 1,385,738 |
| 8.5% 1/31/47 (c) | | 2,600,000 | 2,940,787 |
|
| TOTAL EGYPT | | | 5,767,895 |
|
| El Salvador - 0.9% | | | |
| El Salvador Republic: | | | |
| 6.375% 1/18/27 (c) | | 900,000 | 895,500 |
| 7.375% 12/1/19 | | 775,000 | 804,063 |
| 7.625% 2/1/41 (c) | | 1,450,000 | 1,511,625 |
| 7.65% 6/15/35 (Reg. S) | | 900,000 | 938,250 |
| 8.625% 2/28/29 (c) | | 2,160,000 | 2,446,200 |
|
| TOTAL EL SALVADOR | | | 6,595,638 |
|
| Ethiopia - 0.3% | | | |
| Federal Democratic Republic of Ethiopia 6.625% 12/11/24 (c) | | 2,050,000 | 2,111,500 |
| Gabon - 0.2% | | | |
| Gabonese Republic: | | | |
| 6.375% 12/12/24 (c) | | 850,000 | 833,136 |
| 6.95% 6/16/25 (c) | | 800,000 | 800,978 |
|
| TOTAL GABON | | | 1,634,114 |
|
| Ghana - 0.8% | | | |
| Ghana Republic: | | | |
| 7.875% 8/7/23 (Reg.S) | | 1,950,000 | 2,108,535 |
| 8.125% 1/18/26 (c) | | 1,200,000 | 1,302,000 |
| 9.25% 9/15/22 (c) | | 1,350,000 | 1,523,880 |
| 10.75% 10/14/30 (c) | | 600,000 | 799,440 |
|
| TOTAL GHANA | | | 5,733,855 |
|
| Guatemala - 0.2% | | | |
| Guatemalan Republic: | | | |
| 4.375% 6/5/27 (c) | | 800,000 | 796,000 |
| 4.875% 2/13/28 (c) | | 300,000 | 307,842 |
|
| TOTAL GUATEMALA | | | 1,103,842 |
|
| Honduras - 0.2% | | | |
| Republic of Honduras 6.25% 1/19/27 | | 1,150,000 | 1,240,126 |
| Indonesia - 0.1% | | | |
| Indonesian Republic 8.5% 10/12/35 (c) | | 650,000 | 972,540 |
| Iraq - 0.4% | | | |
| Republic of Iraq: | | | |
| 5.8% 1/15/28 (Reg. S) | | 2,600,000 | 2,447,110 |
| 6.752% 3/9/23 (c) | | 385,000 | 385,742 |
|
| TOTAL IRAQ | | | 2,832,852 |
|
| Ivory Coast - 0.2% | | | |
| Ivory Coast: | | | |
| 5.75% 12/31/32 | | 723,750 | 713,560 |
| 6.125% 6/15/33 (c) | | 730,000 | 719,853 |
|
| TOTAL IVORY COAST | | | 1,433,413 |
|
| Jamaica - 0.0% | | | |
| Jamaican Government 8% 3/15/39 | | 200,000 | 249,500 |
| Jordan - 0.7% | | | |
| Jordanian Kingdom: | | | |
| 5.75% 1/31/27 (c) | | 1,050,000 | 1,050,000 |
| 6.125% 1/29/26 (c) | | 2,650,000 | 2,742,750 |
| 7.375% 10/10/47 (c) | | 1,585,000 | 1,658,703 |
|
| TOTAL JORDAN | | | 5,451,453 |
|
| Kuwait - 0.5% | | | |
| State of Kuwait 3.5% 3/20/27 (c) | | 3,740,000 | 3,814,800 |
| Lebanon - 1.7% | | | |
| Lebanese Republic: | | | |
| 4% 12/31/17 | | 98,500 | 98,273 |
| 5.15% 6/12/18 | | 2,050,000 | 2,057,392 |
| 5.15% 11/12/18 | | 100,000 | 100,600 |
| 5.45% 11/28/19 | | 1,750,000 | 1,752,030 |
| 6% 5/20/19 | | 2,675,000 | 2,707,929 |
| 6.1% 10/4/22 | | 2,135,000 | 2,109,619 |
| 6.375% 3/9/20 | | 1,125,000 | 1,142,555 |
| 6.6% 11/27/26 | | 570,000 | 549,695 |
| 6.65% 2/26/30 (Reg. S) | | 680,000 | 636,831 |
| 6.85% 3/23/27 | | 1,000,000 | 973,712 |
|
| TOTAL LEBANON | | | 12,128,636 |
|
| Mongolia - 0.1% | | | |
| Mongolia Government 5.625% 5/1/23 (c) | | 350,000 | 350,913 |
| Mongolian People's Republic 8.75% 3/9/24 (c) | | 450,000 | 517,025 |
|
| TOTAL MONGOLIA | | | 867,938 |
|
| Namibia - 0.1% | | | |
| Republic of Namibia 5.25% 10/29/25 (c) | | 400,000 | 406,320 |
| Nigeria - 0.1% | | | |
| Republic of Nigeria: | | | |
| 6.375% 7/12/23 (c) | | 200,000 | 209,874 |
| 7.875% 2/16/32 (c) | | 400,000 | 439,392 |
|
| TOTAL NIGERIA | | | 649,266 |
|
| Oman - 0.2% | | | |
| Sultanate of Oman: | | | |
| 4.75% 6/15/26 (c) | | 400,000 | 394,480 |
| 5.375% 3/8/27 (c) | | 335,000 | 343,839 |
| 6.5% 3/8/47 (c) | | 780,000 | 802,770 |
|
| TOTAL OMAN | | | 1,541,089 |
|
| Paraguay - 0.2% | | | |
| Republic of Paraguay: | | | |
| 4.7% 3/27/27 (c) | | 800,000 | 840,000 |
| 6.1% 8/11/44 (c) | | 785,000 | 896,863 |
|
| TOTAL PARAGUAY | | | 1,736,863 |
|
| Qatar - 0.5% | | | |
| State of Qatar: | | | |
| 2.375% 6/2/21 | | 850,000 | 831,300 |
| 3.25% 6/2/26 | | 450,000 | 439,650 |
| 9.75% 6/15/30 (Reg. S) | | 1,430,000 | 2,230,800 |
|
| TOTAL QATAR | | | 3,501,750 |
|
| Russia - 0.8% | | | |
| Ministry of Finance Russian Federation 4.75% 5/27/26 (c) | | 1,000,000 | 1,055,560 |
| Russian Federation: | | | |
| 4.25% 6/23/27 (c) | | 800,000 | 815,336 |
| 5.25% 6/23/47 (c) | | 3,000,000 | 3,071,250 |
| 5.625% 4/4/42 (c) | | 600,000 | 661,752 |
|
| TOTAL RUSSIA | | | 5,603,898 |
|
| Rwanda - 0.2% | | | |
| Rwanda Republic 6.625% 5/2/23 (c) | | 1,625,000 | 1,686,055 |
| Saudi Arabia - 0.7% | | | |
| Saudi Arabia Kingdom of: | | | |
| 3.625% 3/4/28 (c) | | 2,225,000 | 2,208,313 |
| 4.5% 10/26/46 (c) | | 2,010,000 | 2,013,513 |
| 4.625% 10/4/47 (c) | | 1,075,000 | 1,100,237 |
|
| TOTAL SAUDI ARABIA | | | 5,322,063 |
|
| Senegal - 0.2% | | | |
| Republic of Senegal 6.25% 5/23/33 (c) | | 1,300,000 | 1,343,745 |
| Sri Lanka - 0.3% | | | |
| Democratic Socialist Republic of Sri Lanka: | | | |
| 6.2% 5/11/27 (c) | | 1,750,000 | 1,859,809 |
| 6.85% 11/3/25 (c) | | 500,000 | 554,993 |
|
| TOTAL SRI LANKA | | | 2,414,802 |
|
| Suriname - 0.3% | | | |
| Republic of Suriname 9.25% 10/26/26 (c) | | 2,350,000 | 2,546,813 |
| Tajikistan - 0.0% | | | |
| Tajikistan Republic 7.125% 9/14/27 (c) | | 275,000 | 264,413 |
| Turkey - 1.3% | | | |
| Turkish Republic: | | | |
| 4.875% 10/9/26 | | 400,000 | 390,613 |
| 5.75% 3/22/24 | | 550,000 | 579,159 |
| 5.75% 5/11/47 | | 1,115,000 | 1,062,595 |
| 6% 3/25/27 | | 2,050,000 | 2,159,060 |
| 6.25% 9/26/22 | | 850,000 | 922,502 |
| 6.875% 3/17/36 | | 1,975,000 | 2,175,107 |
| 7.25% 3/5/38 | | 550,000 | 631,552 |
| 7.375% 2/5/25 | | 350,000 | 401,232 |
| 8% 2/14/34 | | 950,000 | 1,159,846 |
| 11.875% 1/15/30 | | 165,000 | 256,873 |
|
| TOTAL TURKEY | | | 9,738,539 |
|
| Ukraine - 1.4% | | | |
| Ukraine Government: | | | |
| 0% 5/31/40 (c)(e) | | 430,000 | 245,196 |
| 7.375% 9/25/32 (c) | | 1,000,000 | 985,872 |
| 7.75% 9/1/20 (c) | | 1,940,000 | 2,068,137 |
| 7.75% 9/1/21 (c) | | 1,900,000 | 2,028,326 |
| 7.75% 9/1/22 (c) | | 2,200,000 | 2,351,153 |
| 7.75% 9/1/24 (c) | | 500,000 | 524,098 |
| 7.75% 9/1/27 (c) | | 1,650,000 | 1,699,629 |
|
| TOTAL UKRAINE | | | 9,902,411 |
|
| United States of America - 0.2% | | | |
| U.S. Treasury Bills, yield at date of purchase 0.99% to 1.09% 11/24/17 to 1/25/18 (f) | | 1,260,000 | 1,258,271 |
| Uruguay - 0.3% | | | |
| Uruguay Republic: | | | |
| 7.625% 3/21/36 | | 375,000 | 529,688 |
| 7.875% 1/15/33 pay-in-kind | | 930,000 | 1,318,275 |
|
| TOTAL URUGUAY | | | 1,847,963 |
|
| Venezuela - 0.2% | | | |
| Venezuelan Republic: | | | |
| 7% 12/1/18 (Reg. S) | | 200,000 | 124,500 |
| 7% 3/31/38 | | 650,000 | 211,250 |
| 7.75% 10/13/19 (Reg. S) | | 300,000 | 140,250 |
| 9% 5/7/23 (Reg. S) | | 300,000 | 102,750 |
| 9.25% 9/15/27 | | 650,000 | 238,875 |
| 9.25% 5/7/28 (Reg. S) | | 1,000,000 | 330,000 |
| 12.75% 8/23/22 | | 325,000 | 143,000 |
|
| TOTAL VENEZUELA | | | 1,290,625 |
|
| Zambia - 0.0% | | | |
| Republic of Zambia 8.97% 7/30/27 (c) | | 200,000 | 218,040 |
| TOTAL GOVERNMENT OBLIGATIONS | | | |
| (Cost $130,853,342) | | | 133,935,553 |
| | | Shares | Value |
|
| Money Market Funds - 3.2% | | | |
| Fidelity Cash Central Fund, 1.10% (g) | | 22,519,273 | 22,523,777 |
| Fidelity Securities Lending Cash Central Fund 1.11% (g)(h) | | 530,259 | 530,312 |
| TOTAL MONEY MARKET FUNDS | | | |
| (Cost $23,052,369) | | | 23,054,089 |
| TOTAL INVESTMENT IN SECURITIES - 100.5% | | | |
| (Cost $651,617,499) | | | 733,036,505 |
| NET OTHER ASSETS (LIABILITIES) - (0.5)% | | | (3,583,275) |
| NET ASSETS - 100% | | | $729,453,230 |
Currency Abbreviations
EGP – Egyptian pound
EUR – European Monetary Unit
Security Type Abbreviations
ELS – Equity-Linked Security
Categorizations in the Schedule of Investments are based on country or territory of incorporation.
Legend
(a) Non-income producing
(b) Security or a portion of the security is on loan at period end.
(c) Security exempt from registration under Rule 144A of the Securities Act of 1933. These securities may be resold in transactions exempt from registration, normally to qualified institutional buyers. At the end of the period, the value of these securities amounted to $109,868,455 or 15.1% of net assets.
(d) Amount is stated in United States dollars unless otherwise noted.
(e) Coupon rates for floating and adjustable rate securities reflect the rates in effect at period end.
(f) Security or a portion of the security was pledged to cover margin requirements for futures contracts. At period end, the value of securities pledged amounted to $22,986.
(g) Affiliated fund that is generally available only to investment companies and other accounts managed by Fidelity Investments. The rate quoted is the annualized seven-day yield of the fund at period end. A complete unaudited listing of the fund's holdings as of its most recent quarter end is available upon request. In addition, each Fidelity Central Fund's financial statements, which are not covered by the Fund's Report of Independent Registered Public Accounting Firm, are available on the SEC's website or upon request.
(h) Investment made with cash collateral received from securities on loan.
Affiliated Central Funds
Information regarding fiscal year to date income earned by the Fund from investments in Fidelity Central Funds is as follows:
| Fund | Income earned |
| Fidelity Cash Central Fund | $244,061 |
| Fidelity Securities Lending Cash Central Fund | 844 |
| Total | $244,905 |
Investment Valuation
The following is a summary of the inputs used, as of October 31, 2017, involving the Fund's assets and liabilities carried at fair value. The inputs or methodology used for valuing securities may not be an indication of the risk associated with investing in those securities. For more information on valuation inputs, and their aggregation into the levels used below, please refer to the Investment Valuation section in the accompanying Notes to Financial Statements.
| | Valuation Inputs at Reporting Date: |
| Description | Total | Level 1 | Level 2 | Level 3 |
| Investments in Securities: | | | | |
| Equities: | | | | |
| Consumer Discretionary | $75,704,394 | $74,785,771 | $918,623 | $-- |
| Consumer Staples | 31,662,744 | 31,662,744 | -- | -- |
| Energy | 34,935,547 | 29,418,263 | 5,517,284 | -- |
| Financials | 121,317,609 | 93,890,394 | 27,427,215 | -- |
| Health Care | 12,540,022 | 12,540,022 | -- | -- |
| Industrials | 26,688,694 | 26,166,200 | 522,494 | -- |
| Information Technology | 130,653,721 | 86,654,851 | 43,998,870 | -- |
| Materials | 39,772,269 | 38,229,570 | 1,542,699 | -- |
| Real Estate | 13,921,407 | 13,921,407 | -- | -- |
| Telecommunication Services | 21,805,155 | 19,957,342 | 1,847,813 | -- |
| Utilities | 12,692,269 | 11,688,136 | 1,004,133 | -- |
| Corporate Bonds | 54,353,032 | -- | 54,353,032 | -- |
| Government Obligations | 133,935,553 | -- | 133,935,553 | -- |
| Money Market Funds | 23,054,089 | 23,054,089 | -- | -- |
| Total Investments in Securities: | $733,036,505 | $461,968,789 | $271,067,716 | $-- |
Other Information
The composition of credit quality ratings as a percentage of Total Net Assets is as follows (Unaudited):
| AAA,AA,A | 1.9% |
| BBB | 3.1% |
| BB | 5.5% |
| B | 9.2% |
| CCC,CC,C | 4.1% |
| Not Rated | 1.8% |
| Equities | 71.5% |
| Short-Term Investments and Net Other Assets | 2.9% |
| | 100% |
We have used ratings from Moody's Investors Service, Inc. Where Moody's® ratings are not available, we have used S&P® ratings. All ratings are as of the date indicated and do not reflect subsequent changes.
See accompanying notes which are an integral part of the financial statements.
Fidelity® Total Emerging Markets Fund
Financial Statements
Statement of Assets and Liabilities
| | | October 31, 2017 |
| Assets | | |
Investment in securities, at value (including securities loaned of $537,513) — See accompanying schedule:
Unaffiliated issuers (cost $628,565,130) | $709,982,416 | |
| Fidelity Central Funds (cost $23,052,369) | 23,054,089 | |
| Total Investment in Securities (cost $651,617,499) | | $733,036,505 |
| Cash | | 113,914 |
| Foreign currency held at value (cost $3,570,444) | | 3,570,533 |
| Receivable for investments sold | | 2,599,057 |
| Receivable for fund shares sold | | 1,390,868 |
| Dividends receivable | | 240,266 |
| Interest receivable | | 3,247,865 |
| Distributions receivable from Fidelity Central Funds | | 27,038 |
| Receivable for daily variation margin on futures contracts | | 2,451 |
| Prepaid expenses | | 1,338 |
| Other receivables | | 58,074 |
| Total assets | | 744,287,909 |
| Liabilities | | |
| Payable for investments purchased | $12,215,399 | |
| Payable for fund shares redeemed | 592,970 | |
| Accrued management fee | 473,747 | |
| Distribution and service plan fees payable | 40,200 | |
| Other affiliated payables | 143,675 | |
| Other payables and accrued expenses | 838,363 | |
| Collateral on securities loaned | 530,325 | |
| Total liabilities | | 14,834,679 |
| Net Assets | | $729,453,230 |
| Net Assets consist of: | | |
| Paid in capital | | $633,979,823 |
| Undistributed net investment income | | 8,176,283 |
| Accumulated undistributed net realized gain (loss) on investments and foreign currency transactions | | 6,528,325 |
| Net unrealized appreciation (depreciation) on investments and assets and liabilities in foreign currencies | | 80,768,799 |
| Net Assets | | $729,453,230 |
| Calculation of Maximum Offering Price | | |
| Class A: | | |
| Net Asset Value and redemption price per share ($42,213,197 ÷ 3,113,526 shares) | | $13.56 |
| Maximum offering price per share (100/94.25 of $13.56) | | $14.39 |
| Class M: | | |
| Net Asset Value and redemption price per share ($8,751,133 ÷ 645,717 shares) | | $13.55 |
| Maximum offering price per share (100/96.50 of $13.55) | | $14.04 |
| Class C: | | |
| Net Asset Value and offering price per share ($34,869,073 ÷ 2,593,161 shares)(a) | | $13.45 |
| Total Emerging Markets: | | |
| Net Asset Value, offering price and redemption price per share ($272,002,329 ÷ 20,025,803 shares) | | $13.58 |
| Class I: | | |
| Net Asset Value, offering price and redemption price per share ($371,617,498 ÷ 27,372,128 shares) | | $13.58 |
(a) Redemption price per share is equal to net asset value less any applicable contingent deferred sales charge.
See accompanying notes which are an integral part of the financial statements.
Statement of Operations
| | | Year ended October 31, 2017 |
| Investment Income | | |
| Dividends | | $6,855,253 |
| Interest | | 8,087,674 |
| Income from Fidelity Central Funds | | 244,905 |
| Income before foreign taxes withheld | | 15,187,832 |
| Less foreign taxes withheld | | (730,979) |
| Total income | | 14,456,853 |
| Expenses | | |
| Management fee | $3,323,128 | |
| Transfer agent fees | 918,799 | |
| Distribution and service plan fees | 296,574 | |
| Accounting and security lending fees | 210,959 | |
| Custodian fees and expenses | 452,198 | |
| Independent trustees' fees and expenses | 1,431 | |
| Registration fees | 142,124 | |
| Audit | 114,128 | |
| Legal | 1,055 | |
| Miscellaneous | 2,176 | |
| Total expenses before reductions | 5,462,572 | |
| Expense reductions | (57,073) | 5,405,499 |
| Net investment income (loss) | | 9,051,354 |
| Realized and Unrealized Gain (Loss) | | |
| Net realized gain (loss) on: | | |
| Investment securities: | | |
| Unaffiliated issuers (net of foreign taxes of $73,623) | 7,876,815 | |
| Fidelity Central Funds | (456) | |
| Foreign currency transactions | (25,456) | |
| Futures contracts | 2,923,167 | |
| Total net realized gain (loss) | | 10,774,070 |
| Change in net unrealized appreciation (depreciation) on: | | |
| Unaffiliated issuers (net of increase in deferred foreign taxes of $590,231) | 71,407,533 | |
| Fidelity Central Funds | (994) | |
| Assets and liabilities in foreign currencies | 6,395 | |
| Futures contracts | (14,320) | |
| Total change in net unrealized appreciation (depreciation) | | 71,398,614 |
| Net gain (loss) | | 82,172,684 |
| Net increase (decrease) in net assets resulting from operations | | $91,224,038 |
See accompanying notes which are an integral part of the financial statements.
Statement of Changes in Net Assets
| | Year ended October 31, 2017 | Year ended October 31, 2016 |
| Increase (Decrease) in Net Assets | | |
| Operations | | |
| Net investment income (loss) | $9,051,354 | $2,170,894 |
| Net realized gain (loss) | 10,774,070 | (1,751,096) |
| Change in net unrealized appreciation (depreciation) | 71,398,614 | 9,508,420 |
| Net increase (decrease) in net assets resulting from operations | 91,224,038 | 9,928,218 |
| Distributions to shareholders from net investment income | (1,957,793) | (1,715,467) |
| Distributions to shareholders from net realized gain | (138,064) | – |
| Total distributions | (2,095,857) | (1,715,467) |
| Share transactions - net increase (decrease) | 485,742,909 | 80,624,262 |
| Redemption fees | 215,914 | 36,372 |
| Total increase (decrease) in net assets | 575,087,004 | 88,873,385 |
| Net Assets | | |
| Beginning of period | 154,366,226 | 65,492,841 |
| End of period | $729,453,230 | $154,366,226 |
| Other Information | | |
| Undistributed net investment income end of period | $8,176,283 | $1,743,575 |
See accompanying notes which are an integral part of the financial statements.
Financial Highlights
Fidelity Total Emerging Markets Fund Class A
| Years ended October 31, | 2017 | 2016 | 2015 | 2014 | 2013 |
| Selected Per–Share Data | | | | | |
| Net asset value, beginning of period | $11.33 | $10.35 | $11.56 | $11.37 | $10.86 |
| Income from Investment Operations | | | | | |
| Net investment income (loss)A | .24 | .26 | .28 | .18 | .18 |
| Net realized and unrealized gain (loss) | 2.11 | .96 | (1.30) | .19 | .48 |
| Total from investment operations | 2.35 | 1.22 | (1.02) | .37 | .66 |
| Distributions from net investment income | (.12) | (.24) | (.17) | (.18) | (.15) |
| Distributions from net realized gain | (.01) | – | (.02) | – | (.01) |
| Total distributions | (.13) | (.24) | (.19) | (.18) | (.16) |
| Redemption fees added to paid in capitalA | .01 | –B | –B | –B | .01 |
| Net asset value, end of period | $13.56 | $11.33 | $10.35 | $11.56 | $11.37 |
| Total ReturnC,D | 21.13% | 12.13% | (8.92)% | 3.30% | 6.23% |
| Ratios to Average Net AssetsE,F | | | | | |
| Expenses before reductions | 1.47% | 1.87% | 1.93% | 1.98% | 1.89% |
| Expenses net of fee waivers, if any | 1.47% | 1.65% | 1.65% | 1.65% | 1.65% |
| Expenses net of all reductions | 1.46% | 1.64% | 1.64% | 1.65% | 1.62% |
| Net investment income (loss) | 1.97% | 2.47% | 2.58% | 1.61% | 1.61% |
| Supplemental Data | | | | | |
| Net assets, end of period (000 omitted) | $42,213 | $15,206 | $10,164 | $13,627 | $18,837 |
| Portfolio turnover rateG | 59% | 57% | 80% | 102% | 120% |
A Calculated based on average shares outstanding during the period.
B Amount represents less than $.005 per share.
C Total returns would have been lower if certain expenses had not been reduced during the applicable periods shown.
D Total returns do not include the effect of the sales charges.
E Fees and expenses of any underlying Fidelity Central Funds are not included in the Fund's expense ratio. The Fund indirectly bears its proportionate share of the expenses of any underlying Fidelity Central Funds.
F Expense ratios reflect operating expenses of the class. Expenses before reductions do not reflect amounts reimbursed by the investment adviser or reductions from brokerage service arrangements or reductions from other expense offset arrangements and do not represent the amount paid by the class during periods when reimbursements or reductions occur. Expenses net of fee waivers reflect expenses after reimbursement by the investment adviser but prior to reductions from brokerage service arrangements or other expense offset arrangements. Expenses net of all reductions represent the net expenses paid by the class.
G Amount does not include the portfolio activity of any underlying Fidelity Central Funds.
See accompanying notes which are an integral part of the financial statements.
Fidelity Total Emerging Markets Fund Class M
| Years ended October 31, | 2017 | 2016 | 2015 | 2014 | 2013 |
| Selected Per–Share Data | | | | | |
| Net asset value, beginning of period | $11.33 | $10.33 | $11.54 | $11.34 | $10.84 |
| Income from Investment Operations | | | | | |
| Net investment income (loss)A | .20 | .23 | .25 | .15 | .15 |
| Net realized and unrealized gain (loss) | 2.11 | .97 | (1.30) | .19 | .48 |
| Total from investment operations | 2.31 | 1.20 | (1.05) | .34 | .63 |
| Distributions from net investment income | (.09) | (.20) | (.14) | (.14) | (.12) |
| Distributions from net realized gain | (.01) | – | (.02) | – | (.01) |
| Total distributions | (.10) | (.20) | (.16) | (.14) | (.14)B |
| Redemption fees added to paid in capitalA | .01 | –C | –C | –C | .01 |
| Net asset value, end of period | $13.55 | $11.33 | $10.33 | $11.54 | $11.34 |
| Total ReturnD,E | 20.66% | 11.92% | (9.18)% | 3.04% | 5.93% |
| Ratios to Average Net AssetsF,G | | | | | |
| Expenses before reductions | 1.82% | 2.22% | 2.27% | 2.32% | 2.13% |
| Expenses net of fee waivers, if any | 1.82% | 1.90% | 1.90% | 1.90% | 1.90% |
| Expenses net of all reductions | 1.81% | 1.90% | 1.89% | 1.90% | 1.88% |
| Net investment income (loss) | 1.62% | 2.22% | 2.33% | 1.36% | 1.36% |
| Supplemental Data | | | | | |
| Net assets, end of period (000 omitted) | $8,751 | $3,019 | $3,331 | $5,277 | $5,967 |
| Portfolio turnover rateH | 59% | 57% | 80% | 102% | 120% |
A Calculated based on average shares outstanding during the period.
B Total distributions of $.14 per share is comprised of distributions from net investment income of $.124 and distributions from net realized gain of $.014 per share.
C Amount represents less than $.005 per share.
D Total returns would have been lower if certain expenses had not been reduced during the applicable periods shown.
E Total returns do not include the effect of the sales charges.
F Fees and expenses of any underlying Fidelity Central Funds are not included in the Fund's expense ratio. The Fund indirectly bears its proportionate share of the expenses of any underlying Fidelity Central Funds.
G Expense ratios reflect operating expenses of the class. Expenses before reductions do not reflect amounts reimbursed by the investment adviser or reductions from brokerage service arrangements or reductions from other expense offset arrangements and do not represent the amount paid by the class during periods when reimbursements or reductions occur. Expenses net of fee waivers reflect expenses after reimbursement by the investment adviser but prior to reductions from brokerage service arrangements or other expense offset arrangements. Expenses net of all reductions represent the net expenses paid by the class.
H Amount does not include the portfolio activity of any underlying Fidelity Central Funds.
See accompanying notes which are an integral part of the financial statements.
Fidelity Total Emerging Markets Fund Class C
| Years ended October 31, | 2017 | 2016 | 2015 | 2014 | 2013 |
| Selected Per–Share Data | | | | | |
| Net asset value, beginning of period | $11.25 | $10.25 | $11.47 | $11.29 | $10.80 |
| Income from Investment Operations | | | | | |
| Net investment income (loss)A | .15 | .18 | .20 | .10 | .09 |
| Net realized and unrealized gain (loss) | 2.11 | .97 | (1.30) | .19 | .47 |
| Total from investment operations | 2.26 | 1.15 | (1.10) | .29 | .56 |
| Distributions from net investment income | (.06) | (.15) | (.10) | (.11) | (.07) |
| Distributions from net realized gain | (.01) | – | (.02) | – | (.01) |
| Total distributions | (.07) | (.15) | (.12) | (.11) | (.08) |
| Redemption fees added to paid in capitalA | .01 | –B | –B | –B | .01 |
| Net asset value, end of period | $13.45 | $11.25 | $10.25 | $11.47 | $11.29 |
| Total ReturnC,D | 20.29% | 11.36% | (9.68)% | 2.56% | 5.31% |
| Ratios to Average Net AssetsE,F | | | | | |
| Expenses before reductions | 2.21% | 2.62% | 2.68% | 2.72% | 2.65% |
| Expenses net of fee waivers, if any | 2.21% | 2.40% | 2.40% | 2.40% | 2.40% |
| Expenses net of all reductions | 2.20% | 2.39% | 2.39% | 2.40% | 2.37% |
| Net investment income (loss) | 1.23% | 1.72% | 1.83% | .86% | .86% |
| Supplemental Data | | | | | |
| Net assets, end of period (000 omitted) | $34,869 | $10,710 | $7,736 | $10,104 | $7,436 |
| Portfolio turnover rateG | 59% | 57% | 80% | 102% | 120% |
A Calculated based on average shares outstanding during the period.
B Amount represents less than $.005 per share.
C Total returns would have been lower if certain expenses had not been reduced during the applicable periods shown.
D Total returns do not include the effect of the contingent deferred sales charge.
E Fees and expenses of any underlying Fidelity Central Funds are not included in the Fund's expense ratio. The Fund indirectly bears its proportionate share of the expenses of any underlying Fidelity Central Funds.
F Expense ratios reflect operating expenses of the class. Expenses before reductions do not reflect amounts reimbursed by the investment adviser or reductions from brokerage service arrangements or reductions from other expense offset arrangements and do not represent the amount paid by the class during periods when reimbursements or reductions occur. Expenses net of fee waivers reflect expenses after reimbursement by the investment adviser but prior to reductions from brokerage service arrangements or other expense offset arrangements. Expenses net of all reductions represent the net expenses paid by the class.
G Amount does not include the portfolio activity of any underlying Fidelity Central Funds.
See accompanying notes which are an integral part of the financial statements.
Fidelity Total Emerging Markets Fund
| Years ended October 31, | 2017 | 2016 | 2015 | 2014 | 2013 |
| Selected Per–Share Data | | | | | |
| Net asset value, beginning of period | $11.34 | $10.38 | $11.60 | $11.40 | $10.89 |
| Income from Investment Operations | | | | | |
| Net investment income (loss)A | .27 | .28 | .31 | .21 | .21 |
| Net realized and unrealized gain (loss) | 2.10 | .97 | (1.31) | .19 | .47 |
| Total from investment operations | 2.37 | 1.25 | (1.00) | .40 | .68 |
| Distributions from net investment income | (.14) | (.29) | (.20) | (.20) | (.17) |
| Distributions from net realized gain | (.01) | – | (.02) | – | (.01) |
| Total distributions | (.14)B | (.29) | (.22) | (.20) | (.18) |
| Redemption fees added to paid in capitalA | .01 | –C | –C | –C | .01 |
| Net asset value, end of period | $13.58 | $11.34 | $10.38 | $11.60 | $11.40 |
| Total ReturnD | 21.37% | 12.44% | (8.74)% | 3.56% | 6.44% |
| Ratios to Average Net AssetsE,F | | | | | |
| Expenses before reductions | 1.26% | 1.62% | 1.72% | 1.73% | 1.56% |
| Expenses net of fee waivers, if any | 1.26% | 1.40% | 1.40% | 1.40% | 1.40% |
| Expenses net of all reductions | 1.24% | 1.39% | 1.39% | 1.40% | 1.38% |
| Net investment income (loss) | 2.18% | 2.72% | 2.83% | 1.86% | 1.85% |
| Supplemental Data | | | | | |
| Net assets, end of period (000 omitted) | $272,002 | $104,332 | $37,918 | $45,763 | $49,959 |
| Portfolio turnover rateG | 59% | 57% | 80% | 102% | 120% |
A Calculated based on average shares outstanding during the period.
B Total distributions of $.14 per share is comprised of distributions from net investment income of $.135 and distributions from net realized gain of $.009 per share.
C Amount represents less than $.005 per share.
D Total returns would have been lower if certain expenses had not been reduced during the applicable periods shown.
E Fees and expenses of any underlying Fidelity Central Funds are not included in the Fund's expense ratio. The Fund indirectly bears its proportionate share of the expenses of any underlying Fidelity Central Funds.
F Expense ratios reflect operating expenses of the class. Expenses before reductions do not reflect amounts reimbursed by the investment adviser or reductions from brokerage service arrangements or reductions from other expense offset arrangements and do not represent the amount paid by the class during periods when reimbursements or reductions occur. Expenses net of fee waivers reflect expenses after reimbursement by the investment adviser but prior to reductions from brokerage service arrangements or other expense offset arrangements. Expenses net of all reductions represent the net expenses paid by the class.
G Amount does not include the portfolio activity of any underlying Fidelity Central Funds.
See accompanying notes which are an integral part of the financial statements.
Fidelity Total Emerging Markets Fund Class I
| Years ended October 31, | 2017 | 2016 | 2015 | 2014 | 2013 |
| Selected Per–Share Data | | | | | |
| Net asset value, beginning of period | $11.33 | $10.37 | $11.59 | $11.40 | $10.89 |
| Income from Investment Operations | | | | | |
| Net investment income (loss)A | .28 | .29 | .31 | .21 | .20 |
| Net realized and unrealized gain (loss) | 2.11 | .96 | (1.31) | .18 | .48 |
| Total from investment operations | 2.39 | 1.25 | (1.00) | .39 | .68 |
| Distributions from net investment income | (.14) | (.29) | (.20) | (.20) | (.17) |
| Distributions from net realized gain | (.01) | – | (.02) | – | (.01) |
| Total distributions | (.15) | (.29) | (.22) | (.20) | (.18) |
| Redemption fees added to paid in capitalA | .01 | –B | –B | –B | .01 |
| Net asset value, end of period | $13.58 | $11.33 | $10.37 | $11.59 | $11.40 |
| Total ReturnC | 21.51% | 12.48% | (8.74)% | 3.51% | 6.44% |
| Ratios to Average Net AssetsD,E | | | | | |
| Expenses before reductions | 1.19% | 1.54% | 1.58% | 1.71% | 1.63% |
| Expenses net of fee waivers, if any | 1.19% | 1.40% | 1.40% | 1.40% | 1.40% |
| Expenses net of all reductions | 1.17% | 1.39% | 1.39% | 1.40% | 1.37% |
| Net investment income (loss) | 2.25% | 2.72% | 2.83% | 1.86% | 1.86% |
| Supplemental Data | | | | | |
| Net assets, end of period (000 omitted) | $371,617 | $21,099 | $6,343 | $4,773 | $5,354 |
| Portfolio turnover rateF | 59% | 57% | 80% | 102% | 120% |
A Calculated based on average shares outstanding during the period.
B Amount represents less than $.005 per share.
C Total returns would have been lower if certain expenses had not been reduced during the applicable periods shown.
D Fees and expenses of any underlying Fidelity Central Funds are not included in the Fund's expense ratio. The Fund indirectly bears its proportionate share of the expenses of any underlying Fidelity Central Funds.
E Expense ratios reflect operating expenses of the class. Expenses before reductions do not reflect amounts reimbursed by the investment adviser or reductions from brokerage service arrangements or reductions from other expense offset arrangements and do not represent the amount paid by the class during periods when reimbursements or reductions occur. Expenses net of fee waivers reflect expenses after reimbursement by the investment adviser but prior to reductions from brokerage service arrangements or other expense offset arrangements. Expenses net of all reductions represent the net expenses paid by the class.
F Amount does not include the portfolio activity of any underlying Fidelity Central Funds.
See accompanying notes which are an integral part of the financial statements.
Notes to Financial Statements
For the period ended October 31, 2017
1. Organization.
Fidelity Total Emerging Markets Fund (the Fund) is a fund of Fidelity Investment Trust (the Trust) and is authorized to issue an unlimited number of shares. The Trust is registered under the Investment Company Act of 1940, as amended (the 1940 Act), as an open-end management investment company organized as a Massachusetts business trust. The Fund offers Class A, Class M (formerly Class T), Class C, Total Emerging Markets and Class I shares, each of which has equal rights as to assets and voting privileges. Each class has exclusive voting rights with respect to matters that affect that class. The Fund's investments in emerging markets can be subject to social, economic, regulatory, and political uncertainties and can be extremely volatile.
2. Investments in Fidelity Central Funds.
The Fund invests in Fidelity Central Funds, which are open-end investment companies generally available only to other investment companies and accounts managed by the investment adviser and its affiliates. The Fund's Schedule of Investments lists each of the Fidelity Central Funds held as of period end, if any, as an investment of the Fund, but does not include the underlying holdings of each Fidelity Central Fund. As an Investing Fund, the Fund indirectly bears its proportionate share of the expenses of the underlying Fidelity Central Funds.
The Money Market Central Funds seek preservation of capital and current income and are managed by Fidelity Investments Money Management, Inc. (FIMM), an affiliate of the investment adviser. Annualized expenses of the Money Market Central Funds as of their most recent shareholder report date are less than .005%.
A complete unaudited list of holdings for each Fidelity Central Fund is available upon request or at the Securities and Exchange Commission (the SEC) website at www.sec.gov. In addition, the financial statements of the Fidelity Central Funds, which are not covered by the Fund's Report of Independent Registered Public Accounting Firm, are available on the SEC website or upon request.
3. Significant Accounting Policies.
The Fund is an investment company and applies the accounting and reporting guidance of the Financial Accounting Standards Board (FASB) Accounting Standards Codification Topic 946 Financial Services – Investments Companies. The financial statements have been prepared in conformity with accounting principles generally accepted in the United States of America (GAAP), which require management to make certain estimates and assumptions at the date of the financial statements. Actual results could differ from those estimates. Subsequent events, if any, through the date that the financial statements were issued have been evaluated in the preparation of the financial statements. The following summarizes the significant accounting policies of the Fund:
Investment Valuation. Investments are valued as of 4:00 p.m. Eastern time on the last calendar day of the period. The Board of Trustees (the Board) has delegated the day to day responsibility for the valuation of the Fund's investments to the Fair Value Committee (the Committee) established by the Fund's investment adviser. In accordance with valuation policies and procedures approved by the Board, the Fund attempts to obtain prices from one or more third party pricing vendors or brokers to value its investments. When current market prices, quotations or currency exchange rates are not readily available or reliable, investments will be fair valued in good faith by the Committee, in accordance with procedures adopted by the Board. Factors used in determining fair value vary by investment type and may include market or investment specific events, changes in interest rates and credit quality. The frequency with which these procedures are used cannot be predicted and they may be utilized to a significant extent. The Committee oversees the Fund's valuation policies and procedures and reports to the Board on the Committee's activities and fair value determinations. The Board monitors the appropriateness of the procedures used in valuing the Fund's investments and ratifies the fair value determinations of the Committee.
The Fund categorizes the inputs to valuation techniques used to value its investments into a disclosure hierarchy consisting of three levels as shown below:
- Level 1 – quoted prices in active markets for identical investments
- Level 2 – other significant observable inputs (including quoted prices for similar investments, interest rates, prepayment speeds, etc.)
- Level 3 – unobservable inputs (including the Fund's own assumptions based on the best information available)
Valuation techniques used to value the Fund's investments by major category are as follows:
Equity securities, including restricted securities, for which market quotations are readily available, are valued at the last reported sale price or official closing price as reported by a third party pricing vendor on the primary market or exchange on which they are traded and are categorized as Level 1 in the hierarchy. In the event there were no sales during the day or closing prices are not available, securities are valued at the last quoted bid price or may be valued using the last available price and are generally categorized as Level 2 in the hierarchy. For foreign equity securities, when market or security specific events arise, comparisons to the valuation of American Depositary Receipts (ADRs), futures contracts, Exchange-Traded Funds (ETFs) and certain indexes as well as quoted prices for similar securities may be used and would be categorized as Level 2 in the hierarchy. Utilizing these techniques may result in transfers between Level 1 and Level 2. For equity securities, including restricted securities, where observable inputs are limited, assumptions about market activity and risk are used and these securities may be categorized as Level 3 in the hierarchy.
Debt securities, including restricted securities, are valued based on evaluated prices received from third party pricing vendors or from brokers who make markets in such securities. Corporate bonds, foreign government and government agency obligations and U.S. government and government agency obligations are valued by pricing vendors who utilize matrix pricing which considers yield or price of bonds of comparable quality, coupon, maturity and type or by broker-supplied prices. When independent prices are unavailable or unreliable, debt securities may be valued utilizing pricing methodologies which consider similar factors that would be used by third party pricing vendors. Debt securities are generally categorized as Level 2 in the hierarchy but may be Level 3 depending on the circumstances.
Investments in open-end mutual funds, including the Fidelity Central Funds, are valued at their closing net asset value (NAV) each business day and are categorized as Level 1 in the hierarchy.
Changes in valuation techniques may result in transfers in or out of an assigned level within the disclosure hierarchy. The aggregate value of investments by input level as of October 31, 2017 is included at the end of the Fund's Schedule of Investments.
Foreign Currency. The Fund may use foreign currency contracts to facilitate transactions in foreign-denominated securities. Gains and losses from these transactions may arise from changes in the value of the foreign currency or if the counterparties do not perform under the contracts' terms.
Foreign-denominated assets, including investment securities, and liabilities are translated into U.S. dollars at the exchange rates at period end. Purchases and sales of investment securities, income and dividends received and expenses denominated in foreign currencies are translated into U.S. dollars at the exchange rate in effect on the transaction date.
The effects of exchange rate fluctuations on investments are included with the net realized and unrealized gain (loss) on investment securities. Other foreign currency transactions resulting in realized and unrealized gain (loss) are disclosed separately.
Investment Transactions and Income. For financial reporting purposes, the Fund's investment holdings and NAV include trades executed through the end of the last business day of the period. The NAV per share for processing shareholder transactions is calculated as of the close of business of the New York Stock Exchange (NYSE), normally 4:00 p.m. Eastern time and includes trades executed through the end of the prior business day. Gains and losses on securities sold are determined on the basis of identified cost and includes proceeds received from litigation. Dividend income is recorded on the ex-dividend date, except for certain dividends from foreign securities where the ex-dividend date may have passed, which are recorded as soon as the Fund is informed of the ex-dividend date. Non-cash dividends included in dividend income, if any, are recorded at the fair market value of the securities received. Income and capital gain distributions from Fidelity Central Funds, if any, are recorded on the ex-dividend date. Certain distributions received by the Fund represent a return of capital or capital gain. The Fund determines the components of these distributions subsequent to the ex-dividend date, based upon receipt of tax filings or other correspondence relating to the underlying investment. These distributions are recorded as a reduction of cost of investments and/or as a realized gain. Interest income is accrued as earned and includes coupon interest and amortization of premium and accretion of discount on debt securities as applicable. Paid in Kind (PIK) income is recorded at the fair market value of the securities received. Investment income is recorded net of foreign taxes withheld where recovery of such taxes is uncertain. Debt obligations may be placed on non-accrual status and related interest income may be reduced by ceasing current accruals and writing off interest receivables when the collection of all or a portion of interest has become doubtful based on consistently applied procedures. A debt obligation is removed from non-accrual status when the issuer resumes interest payments or when collectability of interest is reasonably assured.
Class Allocations and Expenses. Investment income, realized and unrealized capital gains and losses, common expenses of the Fund, and certain fund-level expense reductions, if any, are allocated daily on a pro-rata basis to each class based on the relative net assets of each class to the total net assets of the Fund. Each class differs with respect to transfer agent and distribution and service plan fees incurred. Certain expense reductions may also differ by class. For the reporting period, the allocated portion of income and expenses to each class as a percent of its average net assets may vary due to the timing of recording these transactions in relation to fluctuating net assets of the classes. Expenses directly attributable to a fund are charged to that fund. Expenses attributable to more than one fund are allocated among the respective funds on the basis of relative net assets or other appropriate methods. Expense estimates are accrued in the period to which they relate and adjustments are made when actual amounts are known.
Income Tax Information and Distributions to Shareholders. Each year, the Fund intends to qualify as a regulated investment company under Subchapter M of the Internal Revenue Code, including distributing substantially all of its taxable income and realized gains. As a result, no provision for U.S. Federal income taxes is required. As of October 31, 2017, the Fund did not have any unrecognized tax benefits in the financial statements; nor is the Fund aware of any tax positions for which it is reasonably possible that the total amounts of unrecognized tax benefits will significantly change in the next twelve months. The Fund files a U.S. federal tax return, in addition to state and local tax returns as required. The Fund's federal income tax returns are subject to examination by the Internal Revenue Service (IRS) for a period of three fiscal years after they are filed. State and local tax returns may be subject to examination for an additional fiscal year depending on the jurisdiction. Foreign taxes are provided for based on the Fund's understanding of the tax rules and rates that exist in the foreign markets in which it invests. The Fund is subject to a tax imposed on capital gains by certain countries in which it invests. An estimated deferred tax liability for net unrealized appreciation on the applicable securities is included in Other payables and accrued expenses on the Statement of Assets & Liabilities.
Distributions are declared and recorded on the ex-dividend date. Income dividends and capital gain distributions are declared separately for each class. Income and capital gain distributions are determined in accordance with income tax regulations, which may differ from GAAP. In addition, the Fund claimed a portion of the payment made to redeeming shareholders as a distribution for income tax purposes.
Capital accounts within the financial statements are adjusted for permanent book-tax differences. These adjustments have no impact on net assets or the results of operations. Capital accounts are not adjusted for temporary book-tax differences which will reverse in a subsequent period.
Book-tax differences are primarily due to foreign currency transactions, futures contracts, certain foreign taxes, market discount, passive foreign investment companies (PFIC), capital loss carryforwards and losses deferred due to wash sales.
As of period end, the cost and unrealized appreciation (depreciation) in securities, and derivatives if applicable, for federal income tax purposes were as follows:
| Gross unrealized appreciation | $91,467,171 |
| Gross unrealized depreciation | (13,204,240) |
| Net unrealized appreciation (depreciation) | $78,262,931 |
| Tax Cost | $654,773,574 |
The tax-based components of distributable earnings as of period end were as follows:
| Undistributed ordinary income | $13,651,307 |
| Undistributed long-term capital gain | $4,214,487 |
| Net unrealized appreciation (depreciation) on securities and other investments | $78,261,164 |
The tax character of distributions paid was as follows:
| | October 31, 2017 | October 31, 2016 |
| Ordinary Income | $2,095,857 | $ 1,715,467 |
Short-Term Trading (Redemption) Fees. Shares held by investors in the Fund less than 90 days may have been subject to a redemption fee equal to 1.50% of the NAV of shares redeemed. All redemption fees, which reduce the proceeds of the shareholder redemption, are retained by the Fund and accounted for as an addition to paid in capital. In November 2017, the Board of Trustees approved the elimination of these redemption fees effective December 18, 2017.
Restricted Securities. The Fund may invest in securities that are subject to legal or contractual restrictions on resale. These securities generally may be resold in transactions exempt from registration or to the public if the securities are registered. Disposal of these securities may involve time-consuming negotiations and expense, and prompt sale at an acceptable price may be difficult. Information regarding restricted securities is included at the end of the Fund's Schedule of Investments.
4. Derivative Instruments.
Risk Exposures and the Use of Derivative Instruments. The Fund's investment objective allows the Fund to enter into various types of derivative contracts, including futures contracts. Derivatives are investments whose value is primarily derived from underlying assets, indices or reference rates and may be transacted on an exchange or over-the-counter (OTC). Derivatives may involve a future commitment to buy or sell a specified asset based on specified terms, to exchange future cash flows at periodic intervals based on a notional principal amount, or for one party to make one or more payments upon the occurrence of specified events in exchange for periodic payments from the other party.
The Fund used derivatives to increase returns and to manage exposure to certain risks as defined below. The success of any strategy involving derivatives depends on analysis of numerous economic factors, and if the strategies for investment do not work as intended, the Fund may not achieve its objectives.
The Fund's use of derivatives increased or decreased its exposure to the following risk:
| Equity Risk | Equity risk relates to the fluctuations in the value of financial instruments as a result of changes in market prices (other than those arising from interest rate risk or foreign exchange risk), whether caused by factors specific to an individual investment, its issuer, or all factors affecting all instruments traded in a market or market segment.
|
The Fund is also exposed to additional risks from investing in derivatives, such as liquidity risk and counterparty credit risk. Liquidity risk is the risk that the Fund will be unable to close out the derivative in the open market in a timely manner. Counterparty credit risk is the risk that the counterparty will not be able to fulfill its obligation to the Fund. Counterparty credit risk related to exchange-traded futures contracts may be mitigated by the protection provided by the exchange on which they trade.
Investing in derivatives may involve greater risks than investing in the underlying assets directly and, to varying degrees, may involve risk of loss in excess of any initial investment and collateral received and amounts recognized in the Statement of Assets and Liabilities. In addition, there may be the risk that the change in value of the derivative contract does not correspond to the change in value of the underlying instrument.
Futures Contracts. A futures contract is an agreement between two parties to buy or sell a specified underlying instrument for a fixed price at a specified future date. The Fund used futures contracts to manage its exposure to the stock market.
Upon entering into a futures contract, a fund is required to deposit either cash or securities (initial margin) with a clearing broker in an amount equal to a certain percentage of the face value of the contract. Futures contracts are marked-to-market daily and subsequent daily payments (variation margin) are made or received by a fund depending on the daily fluctuations in the value of the futures contracts and are recorded as unrealized appreciation or (depreciation). This receivable and/or payable, if any, is included in daily variation margin on futures contracts in the Statement of Assets and Liabilities. Realized gain or (loss) is recorded upon the expiration or closing of a futures contract. The net realized gain (loss) and change in net unrealized appreciation (depreciation) on futures contracts during the period is presented in the Statement of Operations.
Any open futures contracts at period end are presented in the Schedule of Investments under the caption "Futures Contracts". The notional amount at value reflects each contract's exposure to the underlying instrument or index at period end.
5. Purchases and Sales of Investments.
Purchases and sales of securities, other than short-term securities and U.S. government securities, aggregated $708,020,325 and $220,828,305, respectively.
6. Fees and Other Transactions with Affiliates.
Management Fee. Fidelity Management & Research Company (the investment adviser) and its affiliates provide the Fund with investment management related services for which the Fund pays a monthly management fee. The management fee is the sum of an individual fund fee rate that is based on an annual rate of .55% of the Fund's average net assets and an annualized group fee rate that averaged .25% during the period. The group fee rate is based upon the average net assets of all the mutual funds advised by the investment adviser, including any mutual funds previously advised by the investment adviser that are currently advised by Fidelity SelectCo, LLC, an affiliate of the investment adviser. The group fee rate decreases as assets under management increase and increases as assets under management decrease. For the reporting period, the total annual management fee rate was .79% of the Fund's average net assets.
Distribution and Service Plan Fees. In accordance with Rule 12b-1 of the 1940 Act, the Fund has adopted separate Distribution and Service Plans for each class of shares. Certain classes pay Fidelity Distributors Corporation (FDC), an affiliate of the investment adviser, separate Distribution and Service Fees, each of which is based on an annual percentage of each class' average net assets. In addition, FDC may pay financial intermediaries for selling shares of the Fund and providing shareholder support services. For the period, the Distribution and Service Fee rates, total fees and amounts retained by FDC were as follows:
| | Distribution
Fee | Service
Fee | Total Fees | Retained
by FDC |
| Class A | -% | .25% | $67,523 | $4,812 |
| Class M | .25% | .25% | 23,450 | – |
| Class C | .75% | .25% | 205,601 | 104,911 |
| | | | $296,574 | $109,723 |
Sales Load. FDC may receive a front-end sales charge of up to 5.75% for selling Class A shares and 3.50% for selling Class M shares, some of which is paid to financial intermediaries for selling shares of the Fund. Depending on the holding period, FDC may receive contingent deferred sales charges levied on Class A, Class M and Class C redemptions. The deferred sales charges are 1.00% for Class C shares, 1.00% for certain purchases of Class A shares and .25% for certain purchases of Class M shares.
For the period, sales charge amounts retained by FDC were as follows:
| | Retained
by FDC |
| Class A | $38,049 |
| Class M | 4,735 |
| Class C(a) | 6,809 |
| | $49,593 |
(a) When Class C shares are initially sold, FDC pays commissions from its own resources to financial intermediaries through which the sales are made.
Transfer Agent Fees. Fidelity Investments Institutional Operations Company, Inc., (FIIOC), an affiliate of the investment adviser, is the transfer, dividend disbursing and shareholder servicing agent for each class of the Fund. FIIOC receives account fees and asset-based fees that vary according to the account size and type of account of the shareholders of the respective classes of the Fund. FIIOC pays for typesetting, printing and mailing of shareholder reports, except proxy statements.
For the period, transfer agent fees for each class were as follows:
| | Amount | % of
Class-Level Average
Net Assets |
| Class A | $58,594 | .22 |
| Class M | 14,868 | .32 |
| Class C | 43,747 | .21 |
| Total Emerging Markets | 476,257 | .25 |
| Class I | 325,333 | .18 |
| | $918,799 | |
Accounting and Security Lending Fees. Fidelity Service Company, Inc. (FSC), an affiliate of the investment adviser, maintains the Fund's accounting records. The accounting fee is based on the level of average net assets for each month. Under a separate contract, FSC administers the security lending program. The security lending fee is based on the number and duration of lending transactions.
Brokerage Commissions. The Fund placed a portion of its portfolio transactions with brokerage firms which are affiliates of the investment adviser. Brokerage commissions are included in net realized gain (loss) and change in net unrealized appreciation (depreciation) in the Statement of Operations. The commissions paid to these affiliated firms were $4,114 for the period.
Interfund Trades. The Fund may purchase from or sell securities to other Fidelity Funds under procedures adopted by the Board. The procedures have been designed to ensure these interfund trades are executed in accordance with Rule 17a-7 of the 1940 Act. Interfund trades are included within the respective purchases and sales amounts shown in the Purchases and Sales of Investments note.
7. Committed Line of Credit.
The Fund participates with other funds managed by the investment adviser or an affiliate in a $4.25 billion credit facility (the "line of credit") to be utilized for temporary or emergency purposes to fund shareholder redemptions or for other short-term liquidity purposes. The Fund has agreed to pay commitment fees on its pro-rata portion of the line of credit, which amounted to $1,127 and is reflected in Miscellaneous expenses on the Statement of Operations. During the period, the Fund did not borrow on this line of credit.
8. Security Lending.
The Fund lends portfolio securities through a lending agent from time to time in order to earn additional income. For equity securities, a lending agent is used and may loan securities to certain qualified borrowers, including Fidelity Capital Markets (FCM), a broker-dealer affiliated with the Fund. On the settlement date of the loan, the Fund receives collateral (in the form of U.S. Treasury obligations, letters of credit and/or cash) against the loaned securities and maintains collateral in an amount not less than 100% of the market value of the loaned securities during the period of the loan. The market value of the loaned securities is determined at the close of business of the Fund and any additional required collateral is delivered to the Fund on the next business day. The Fund or borrower may terminate the loan at any time, and if the borrower defaults on its obligation to return the securities loaned because of insolvency or other reasons, the Fund may apply collateral received from the borrower against the obligation. The Fund may experience delays and costs in recovering the securities loaned. Any cash collateral received is invested in the Fidelity Securities Lending Cash Central Fund. The value of loaned securities and cash collateral at period end are disclosed on the Fund's Statement of Assets and Liabilities. Security lending income represents the income earned on investing cash collateral, less rebates paid to borrowers and any lending agent fees associated with the loan, plus any premium payments received for lending certain types of securities. Security lending income is presented in the Statement of Operations as a component of income from Fidelity Central Funds. Total security lending income during the period amounted to $844. During the period, there were no securities loaned to FCM.
9. Expense Reductions.
Commissions paid to certain brokers with whom the investment adviser, or its affiliates, places trades on behalf of the Fund include an amount in addition to trade execution, which may be rebated back to the Fund to offset certain expenses. This amount totaled $51,538 for the period. Through arrangements with the Fund's custodian, credits realized as a result of certain uninvested cash balances were used to reduce the Fund's expenses. During the period, these credits reduced the Fund's custody expenses by $4,047.
In addition, during the period the investment adviser reimbursed and/or waived a portion of fund-level operating expenses in the amount of $1,488.
10. Distributions to Shareholders.
Distributions to shareholders of each class were as follows:
| | Year ended
October 31, 2017 | Year ended October 31, 2016 |
| From net investment income | | |
| Class A | $195,255 | $214,855 |
| Class M | 23,027 | 63,597 |
| Class C | 57,828 | 107,081 |
| Total Emerging Markets | 1,274,142 | 1,155,874 |
| Class I | 407,541 | 174,060 |
| Total | $1,957,793 | $1,715,467 |
| From net realized gain | | |
| Class A | $14,644 | $– |
| Class M | 2,410 | – |
| Class C | 9,294 | – |
| Total Emerging Markets | 84,943 | – |
| Class I | 26,773 | – |
| Total | $138,064 | $– |
11. Share Transactions.
Share transactions for each class were as follows and may contain automatic conversions between classes or exchanges between affiliated funds:
| | Shares | Shares | Dollars | Dollars |
| | Year ended
October 31, 2017 | Year ended October 31, 2016 | Year ended
October 31, 2017 | Year ended October 31, 2016 |
| Class A | | | | |
| Shares sold | 3,615,728 | 982,236 | $43,198,307 | $10,454,988 |
| Reinvestment of distributions | 19,523 | 21,375 | 207,918 | 212,465 |
| Shares redeemed | (1,863,978) | (643,855) | (21,909,724) | (6,609,703) |
| Net increase (decrease) | 1,771,273 | 359,756 | $21,496,501 | $4,057,750 |
| Class M | | | | |
| Shares sold | 451,431 | 99,943 | $5,673,545 | $1,053,182 |
| Reinvestment of distributions | 2,361 | 6,356 | 25,216 | 63,302 |
| Shares redeemed | (74,567) | (162,291) | (886,466) | (1,643,320) |
| Net increase (decrease) | 379,225 | (55,992) | $4,812,295 | $(526,836) |
| Class C | | | | |
| Shares sold | 1,907,365 | 381,071 | $23,252,010 | $4,073,862 |
| Reinvestment of distributions | 6,299 | 10,753 | 66,954 | 106,882 |
| Shares redeemed | (272,258) | (194,422) | (3,283,907) | (1,922,472) |
| Net increase (decrease) | 1,641,406 | 197,402 | $20,035,057 | $2,258,272 |
| Total Emerging Markets | | | | |
| Shares sold | 17,602,916 | 7,221,843 | $212,356,677 | $77,958,709 |
| Reinvestment of distributions | 124,771 | 112,410 | 1,328,813 | 1,116,229 |
| Shares redeemed | (6,900,916) | (1,787,997) | (84,713,141) | (18,222,997) |
| Net increase (decrease) | 10,826,771 | 5,546,256 | $128,972,349 | $60,851,941 |
| Class I | | | | |
| Shares sold | 29,232,950 | 1,936,878 | $357,207,778 | $21,178,679 |
| Reinvestment of distributions | 38,174 | 14,612 | 405,784 | 144,954 |
| Shares redeemed | (3,761,001) | (700,942) | (47,186,855) | (7,340,498) |
| Net increase (decrease) | 25,510,123 | 1,250,548 | $310,426,707 | $13,983,135 |
12. Other.
The Fund's organizational documents provide former and current trustees and officers with a limited indemnification against liabilities arising in connection with the performance of their duties to the Fund. In the normal course of business, the Fund may also enter into contracts that provide general indemnifications. The Fund's maximum exposure under these arrangements is unknown as this would be dependent on future claims that may be made against the Fund. The risk of material loss from such claims is considered remote.
Report of Independent Registered Public Accounting Firm
To the Trustees of Fidelity Investment Trust and the Shareholders of Fidelity Total Emerging Markets Fund and Fidelity Emerging Markets Discovery Fund:
In our opinion, the accompanying statements of assets and liabilities, including the schedules of investments, and the related statements of operations and of changes in net assets and the financial highlights present fairly, in all material respects, the financial position of Fidelity Total Emerging Markets Fund and Fidelity Emerging Markets Discovery Fund (each a fund of Fidelity Investment Trust) (the"Funds") as of October 31, 2017, the results of each of their operations for the year then ended, the changes in each of their net assets for each of the two years in the period then ended and the financial highlights for each of the five years in the period then ended, in conformity with accounting principles generally accepted in the United States of America. These financial statements and financial highlights (hereafter referred to as “financial statements”) are the responsibility of the Funds' management. Our responsibility is to express an opinion on these financial statements based on our audits. We conducted our audits of these financial statements in accordance with the standards of the Public Company Accounting Oversight Board (United States). Those standards require that we plan and perform the audit to obtain reasonable assurance about whether the financial statements are free of material misstatement. An audit includes examining, on a test basis, evidence supporting the amounts and disclosures in the financial statements, assessing the accounting principles used and significant estimates made by management, and evaluating the overall financial statement presentation. Our procedures included confirmation of securities owned as of October 31, 2017 by correspondence with the custodian and brokers; when replies were not received from brokers, we performed other auditing procedures. We believe that our audits provide a reasonable basis for our opinion.
PricewaterhouseCoopers LLP
Boston, Massachusetts
December 18, 2017
Trustees and Officers
The Trustees, Members of the Advisory Board (if any), and officers of the trust and funds, as applicable, are listed below. The Board of Trustees governs each fund and is responsible for protecting the interests of shareholders. The Trustees are experienced executives who meet periodically throughout the year to oversee each fund's activities, review contractual arrangements with companies that provide services to each fund, oversee management of the risks associated with such activities and contractual arrangements, and review each fund's performance. Except for Jonathan Chiel, each of the Trustees oversees 190 funds. Mr. Chiel oversees 143 funds.
The Trustees hold office without limit in time except that (a) any Trustee may resign; (b) any Trustee may be removed by written instrument, signed by at least two-thirds of the number of Trustees prior to such removal; (c) any Trustee who requests to be retired or who has become incapacitated by illness or injury may be retired by written instrument signed by a majority of the other Trustees; and (d) any Trustee may be removed at any special meeting of shareholders by a two-thirds vote of the outstanding voting securities of the trust. Each Trustee who is not an interested person (as defined in the 1940 Act) of the trust and the funds is referred to herein as an Independent Trustee. Each Independent Trustee shall retire not later than the last day of the calendar year in which his or her 75th birthday occurs. The Independent Trustees may waive this mandatory retirement age policy with respect to individual Trustees. Officers and Advisory Board Members hold office without limit in time, except that any officer or Advisory Board Member may resign or may be removed by a vote of a majority of the Trustees at any regular meeting or any special meeting of the Trustees. Except as indicated, each individual has held the office shown or other offices in the same company for the past five years.
Each fund’s Statement of Additional Information (SAI) includes more information about the Trustees. To request a free copy, call Fidelity at 1-800-544-8544.
Experience, Skills, Attributes, and Qualifications of the Trustees. The Governance and Nominating Committee has adopted a statement of policy that describes the experience, qualifications, attributes, and skills that are necessary and desirable for potential Independent Trustee candidates (Statement of Policy). The Board believes that each Trustee satisfied at the time he or she was initially elected or appointed a Trustee, and continues to satisfy, the standards contemplated by the Statement of Policy. The Governance and Nominating Committee also engages professional search firms to help identify potential Independent Trustee candidates who have the experience, qualifications, attributes, and skills consistent with the Statement of Policy. From time to time, additional criteria based on the composition and skills of the current Independent Trustees, as well as experience or skills that may be appropriate in light of future changes to board composition, business conditions, and regulatory or other developments, have also been considered by the professional search firms and the Governance and Nominating Committee. In addition, the Board takes into account the Trustees' commitment and participation in Board and committee meetings, as well as their leadership of standing and ad hoc committees throughout their tenure.
In determining that a particular Trustee was and continues to be qualified to serve as a Trustee, the Board has considered a variety of criteria, none of which, in isolation, was controlling. The Board believes that, collectively, the Trustees have balanced and diverse experience, qualifications, attributes, and skills, which allow the Board to operate effectively in governing each fund and protecting the interests of shareholders. Information about the specific experience, skills, attributes, and qualifications of each Trustee, which in each case led to the Board's conclusion that the Trustee should serve (or continue to serve) as a trustee of the funds, is provided below.
Board Structure and Oversight Function. James C. Curvey is an interested person and currently serves as Chairman. The Trustees have determined that an interested Chairman is appropriate and benefits shareholders because an interested Chairman has a personal and professional stake in the quality and continuity of services provided to the funds. Independent Trustees exercise their informed business judgment to appoint an individual of their choosing to serve as Chairman, regardless of whether the Trustee happens to be independent or a member of management. The Independent Trustees have determined that they can act independently and effectively without having an Independent Trustee serve as Chairman and that a key structural component for assuring that they are in a position to do so is for the Independent Trustees to constitute a substantial majority for the Board. The Independent Trustees also regularly meet in executive session. Ned C. Lautenbach serves as Chairman of the Independent Trustees and as such (i) acts as a liaison between the Independent Trustees and management with respect to matters important to the Independent Trustees and (ii) with management prepares agendas for Board meetings.
Fidelity® funds are overseen by different Boards of Trustees. The funds' Board oversees Fidelity's high income and certain equity funds, and other Boards oversee Fidelity's investment-grade bond, money market, asset allocation, and sector funds. The asset allocation funds may invest in Fidelity® funds overseen by the funds' Board. The use of separate Boards, each with its own committee structure, allows the Trustees of each group of Fidelity® funds to focus on the unique issues of the funds they oversee, including common research, investment, and operational issues. On occasion, the separate Boards establish joint committees to address issues of overlapping consequences for the Fidelity® funds overseen by each Board.
The Trustees operate using a system of committees to facilitate the timely and efficient consideration of all matters of importance to the Trustees, each fund, and fund shareholders and to facilitate compliance with legal and regulatory requirements and oversight of the funds' activities and associated risks. The Board, acting through its committees, has charged FMR and its affiliates with (i) identifying events or circumstances the occurrence of which could have demonstrably adverse effects on the funds' business and/or reputation; (ii) implementing processes and controls to lessen the possibility that such events or circumstances occur or to mitigate the effects of such events or circumstances if they do occur; and (iii) creating and maintaining a system designed to evaluate continuously business and market conditions in order to facilitate the identification and implementation processes described in (i) and (ii) above. Because the day-to-day operations and activities of the funds are carried out by or through FMR, its affiliates, and other service providers, the funds' exposure to risks is mitigated but not eliminated by the processes overseen by the Trustees. While each of the Board's committees has responsibility for overseeing different aspects of the funds' activities, oversight is exercised primarily through the Operations, Audit, and Compliance Committees. In addition, the Independent Trustees have worked with FMR to enhance the Board's oversight of investment and financial risks, legal and regulatory risks, technology risks, and operational risks, including the development of additional risk reporting to the Board. For example, a working group comprised of Independent Trustees and FMR has worked and continues to work to review the Fidelity® funds' valuation-related activities, reporting and risk management. Appropriate personnel, including but not limited to the funds' Chief Compliance Officer (CCO), FMR's internal auditor, the independent accountants, the funds' Treasurer and portfolio management personnel, make periodic reports to the Board's committees, as appropriate, including an annual review of Fidelity's risk management program for the Fidelity® funds. The responsibilities of each standing committee, including their oversight responsibilities, are described further under "Standing Committees of the Trustees."
Interested Trustees*:
Correspondence intended for a Trustee who is an interested person may be sent to Fidelity Investments, 245 Summer Street, Boston, Massachusetts 02210.
Name, Year of Birth; Principal Occupations and Other Relevant Experience+
Jonathan Chiel (1957)
Year of Election or Appointment: 2016
Trustee
Mr. Chiel also serves as Trustee of other Fidelity® funds. Mr. Chiel is Executive Vice President and General Counsel for FMR LLC (diversified financial services company, 2012-present). Previously, Mr. Chiel served as general counsel (2004-2012) and senior vice president and deputy general counsel (2000-2004) for John Hancock Financial Services; a partner with Choate, Hall & Stewart (1996-2000) (law firm); and an Assistant United States Attorney for the United States Attorney’s Office of the District of Massachusetts (1986-95), including Chief of the Criminal Division (1993-1995). Mr. Chiel is a director on the boards of the Boston Bar Foundation and the Maimonides School.
James C. Curvey (1935)
Year of Election or Appointment: 2007
Trustee
Chairman of the Board of Trustees
Mr. Curvey also serves as Trustee of other Fidelity® funds. Mr. Curvey is a Director of Fidelity Research & Analysis Co. (investment adviser firm, 2009-present), and Vice Chairman (2007-present) and Director of FMR LLC (diversified financial services company). In addition, Mr. Curvey serves as an Overseer for the Boston Symphony Orchestra and a member of the board of Artis-Naples, Naples, Florida, and as a Trustee for Brewster Academy, Wolfeboro, New Hampshire. Previously, Mr. Curvey served as a Director of Fidelity Investments Money Management, Inc. (investment adviser firm, 2009-2014) and a Director of FMR and FMR Co., Inc. (investment adviser firms, 2007-2014).
Charles S. Morrison (1960)
Year of Election or Appointment: 2014
Trustee
Mr. Morrison also serves as Trustee of other funds. He serves as President of Fidelity Management & Research Company (FMR) (investment adviser firm, 2016-present), a Director of Fidelity Investments Money Management, Inc. (FIMM) (investment adviser firm, 2014-present), Director of Fidelity SelectCo, LLC (investment adviser firm, 2014-present), President, Asset Management (2014-present), and is an employee of Fidelity Investments. Previously, Mr. Morrison served as Vice President of Fidelity's Fixed Income and Asset Allocation Funds (2012-2014), President, Fixed Income (2011-2014), Vice President of Fidelity's Money Market Funds (2005-2009), President, Money Market Group Leader of FMR (investment adviser firm, 2009), and Senior Vice President, Money Market Group of FMR (2004-2009). Mr. Morrison also served as Vice President of Fidelity's Bond Funds (2002-2005), certain Balanced Funds (2002-2005), and certain Asset Allocation Funds (2002-2007), and as Senior Vice President (2002-2005) of Fidelity's Bond Division.
* Determined to be an “Interested Trustee” by virtue of, among other things, his or her affiliation with the trust[s] or various entities under common control with FMR.
+ The information includes the Trustee's principal occupation during the last five years and other information relating to the experience, attributes, and skills relevant to the Trustee's qualifications to serve as a Trustee, which led to the conclusion that the Trustee should serve as a Trustee for each fund.
Independent Trustees:
Correspondence intended for an Independent Trustee may be sent to Fidelity Investments, P.O. Box 55235, Boston, Massachusetts 02205-5235.
Name, Year of Birth; Principal Occupations and Other Relevant Experience+
Dennis J. Dirks (1948)
Year of Election or Appointment: 2005
Trustee
Mr. Dirks also serves as Trustee of other Fidelity® funds. Prior to his retirement in May 2003, Mr. Dirks was Chief Operating Officer and a member of the Board of The Depository Trust & Clearing Corporation (DTCC). He also served as President, Chief Operating Officer, and Board member of The Depository Trust Company (DTC) and President and Board member of the National Securities Clearing Corporation (NSCC). In addition, Mr. Dirks served as Chief Executive Officer and Board member of the Government Securities Clearing Corporation, Chief Executive Officer and Board member of the Mortgage-Backed Securities Clearing Corporation, as a Trustee and a member of the Finance Committee of Manhattan College (2005-2008), as a Trustee and a member of the Finance Committee of AHRC of Nassau County (2006-2008), as a member of the Independent Directors Council (IDC) Governing Council (2010-2015), and as a member of the Board of Directors for The Brookville Center for Children’s Services, Inc. (2009-2017). Mr. Dirks is a member of the Finance Committee (2016-present) and Board of Directors (2017-present) of the Asolo Repertory Theatre.
Alan J. Lacy (1953)
Year of Election or Appointment: 2008
Trustee
Mr. Lacy also serves as Trustee of other Fidelity® funds. Mr. Lacy serves as a Director of Bristol-Myers Squibb Company (global pharmaceuticals, 2008-present). He is a Trustee of the California Chapter of The Nature Conservancy (2015-present) and a Director of the Center for Advanced Study in the Behavioral Sciences at Stanford University (2015-present). In addition, Mr. Lacy served as Senior Adviser (2007-2014) of Oak Hill Capital Partners, L.P. (private equity) and also served as Chief Executive Officer (2005) and Vice Chairman (2005-2006) of Sears Holdings Corporation (retail) and Chief Executive Officer and Chairman of the Board of Sears, Roebuck and Co. (retail, 2000-2005). Previously, Mr. Lacy served as Chairman (2014-2017) and a member (2010-2017) of the Board of Directors of Dave & Buster’s Entertainment, Inc. (restaurant and entertainment complexes), as Chairman (2008-2011) and a member (2006-2015) of the Board of Trustees of the National Parks Conservation Association, and as a member of the Board of Directors for The Hillman Companies, Inc. (hardware wholesalers, 2010-2014), Earth Fare, Inc. (retail grocery, 2010-2014), and The Western Union Company (global money transfer, 2006-2011).
Ned C. Lautenbach (1944)
Year of Election or Appointment: 2000
Trustee
Chairman of the Independent Trustees
Mr. Lautenbach also serves as Trustee of other Fidelity® funds. Mr. Lautenbach currently serves as Vice Chair of the Board of Governors, State University System of Florida (2013-present) and is a member of the Council on Foreign Relations (1994-present). He is also a member and has most recently served as Chairman of the Board of Directors of Artis-Naples (2012-present). Previously, Mr. Lautenbach served as a member and then Lead Director of the Board of Directors of Eaton Corporation (diversified industrial, 1997-2016). He was also a Partner and Advisory Partner at Clayton, Dubilier & Rice, LLC (private equity investment, 1998-2010), as well as a Director of Sony Corporation (2006-2007). In addition, Mr. Lautenbach also had a 30-year career with IBM (technology company) during which time he served as Senior Vice President and a member of the Corporate Executive Committee (1968-1998).
Joseph Mauriello (1944)
Year of Election or Appointment: 2008
Trustee
Mr. Mauriello also serves as Trustee of other Fidelity® funds. Prior to his retirement in January 2006, Mr. Mauriello served in numerous senior management positions including Deputy Chairman and Chief Operating Officer (2004-2005), and Vice Chairman of Financial Services (2002-2004) of KPMG LLP US (professional services, 1965-2005). Mr. Mauriello currently serves as a member of the Board of Directors of XL Group plc. (global insurance and re-insurance, 2006-present) and the Independent Directors Council (IDC) Governing Council (2015-present). Previously, Mr. Mauriello served as a Director of the Hamilton Funds of the Bank of New York (2006-2007) and of Arcadia Resources Inc. (health care services and products, 2007-2012).
Cornelia M. Small (1944)
Year of Election or Appointment: 2005
Trustee
Ms. Small also serves as Trustee of other Fidelity® funds. Ms. Small is a member of the Board of Directors (2009-present) and Chair of the Investment Committee (2010-present) of the Teagle Foundation. Ms. Small also serves on the Investment Committee of the Berkshire Taconic Community Foundation (2008-present). Previously, Ms. Small served as Chairperson (2002-2008) and a member of the Investment Committee and Chairperson (2008-2012) and a member of the Board of Trustees of Smith College. In addition, Ms. Small served as Chief Investment Officer, Director of Global Equity Investments, and a member of the Board of Directors of Scudder, Stevens & Clark and Scudder Kemper Investments.
William S. Stavropoulos (1939)
Year of Election or Appointment: 2001
Trustee
Vice Chairman of the Independent Trustees
Mr. Stavropoulos also serves as Trustee of other Fidelity® funds. Mr. Stavropoulos serves as President and Founder of the Michigan Baseball Foundation, the Great Lakes Loons (2007-present). Mr. Stavropoulos is Chairman Emeritus of the Board of Directors of The Dow Chemical Company, where he previously served in numerous senior management positions, including President, CEO (1995-2000; 2002-2004), Chairman of the Executive Committee (2000-2006), and as a member of the Board of Directors (1990-2006). Currently, Mr. Stavropoulos is Chairman of the Board of Directors of Univar Inc. (global distributor of commodity and specialty chemicals), a Director of Teradata Corporation (data warehousing and technology solutions), and a member of the Advisory Board for Metalmark Capital LLC (private equity investment, 2005-present). Mr. Stavropoulos is an operating advisor to Clayton, Dubilier & Rice, LLC (private equity investment). In addition, Mr. Stavropoulos is a member of the University of Notre Dame Advisory Council for the College of Science, a Trustee of the Rollin L. Gerstacker Foundation, and a Director of Artis-Naples in Naples, Florida. Previously, Mr. Stavropoulos served as a Director of Chemical Financial Corporation (bank holding company, 1993-2012) and Tyco International, Ltd. (multinational manufacturing and services, 2007-2012).
David M. Thomas (1949)
Year of Election or Appointment: 2008
Trustee
Mr. Thomas also serves as Trustee of other Fidelity® funds. Mr. Thomas serves as Non-Executive Chairman of the Board of Directors of Fortune Brands Home and Security (home and security products, 2011-present), as a member of the Board of Directors (2004-present) and Presiding Director (2013-present) of Interpublic Group of Companies, Inc. (marketing communication), and as a member of the Board of Trustees of the University of Florida (2013-present). Previously, Mr. Thomas served as Executive Chairman (2005-2006) and Chairman and Chief Executive Officer (2000-2005) of IMS Health, Inc. (pharmaceutical and healthcare information solutions), and a Director of Fortune Brands, Inc. (consumer products, 2000-2011).
+ The information includes the Trustee's principal occupation during the last five years and other information relating to the experience, attributes, and skills relevant to the Trustee's qualifications to serve as a Trustee, which led to the conclusion that the Trustee should serve as a Trustee for each fund.
Advisory Board Members and Officers:
Correspondence intended for an officer or Peter S. Lynch may be sent to Fidelity Investments, 245 Summer Street, Boston, Massachusetts 02210. Officers appear below in alphabetical order.
Name, Year of Birth; Principal Occupation
Peter S. Lynch (1944)
Year of Election or Appointment: 2003
Member of the Advisory Board
Mr. Lynch also serves as Member of the Advisory Board of other Fidelity® funds. Mr. Lynch is Vice Chairman and a Director of FMR (investment adviser firm) and FMR Co., Inc. (investment adviser firm). In addition, Mr. Lynch serves as a Trustee of Boston College and as the Chairman of the Inner-City Scholarship Fund. Previously, Mr. Lynch served on the Special Olympics International Board of Directors (1997-2006).
Elizabeth Paige Baumann (1968)
Year of Election or Appointment: 2017
Anti-Money Laundering (AML) Officer
Ms. Baumann also serves as AML Officer of other funds. She is Chief AML Officer (2012-present) and Senior Vice President (2014-present) of FMR LLC (diversified financial services company) and is an employee of Fidelity Investments. Previously, Ms. Baumann served as AML Officer of the funds (2012-2016), and Vice President (2007-2014) and Deputy Anti-Money Laundering Officer (2007-2012) of FMR LLC.
Marc R. Bryant (1966)
Year of Election or Appointment: 2015
Secretary and Chief Legal Officer (CLO)
Mr. Bryant also serves as Secretary and CLO of other funds. Mr. Bryant serves as CLO, Secretary, and Senior Vice President of Fidelity Management & Research Company (investment adviser firm, 2015-present) and FMR Co., Inc. (investment adviser firm, 2015-present); Secretary of Fidelity SelectCo, LLC (investment adviser firm, 2015-present) and Fidelity Investments Money Management, Inc. (investment adviser firm, 2015-present); and CLO of Fidelity Management & Research (Hong Kong) Limited and FMR Investment Management (UK) Limited (investment adviser firms, 2015-present) and Fidelity Management & Research (Japan) Limited (investment adviser firm, 2016-present). He is Senior Vice President and Deputy General Counsel of FMR LLC (diversified financial services company). Previously, Mr. Bryant served as Secretary and CLO of Fidelity Rutland Square Trust II (2010-2014) and Assistant Secretary of Fidelity's Fixed Income and Asset Allocation Funds (2013-2015). Prior to joining Fidelity Investments, Mr. Bryant served as a Senior Vice President and the Head of Global Retail Legal for AllianceBernstein L.P. (2006-2010), and as the General Counsel for ProFund Advisors LLC (2001-2006).
William C. Coffey (1969)
Year of Election or Appointment: 2009
Assistant Secretary
Mr. Coffey also serves as Assistant Secretary of other funds. He is Senior Vice President and Deputy General Counsel of FMR LLC (diversified financial services company, 2010-present), and is an employee of Fidelity Investments. Previously, Mr. Coffey served as Vice President and Associate General Counsel of FMR LLC (2005-2009).
Jonathan Davis (1968)
Year of Election or Appointment: 2010
Assistant Treasurer
Mr. Davis also serves as Assistant Treasurer of other funds, and is an employee of Fidelity Investments. Previously, Mr. Davis served as Vice President and Associate General Counsel of FMR LLC (diversified financial services company, 2003-2010).
Adrien E. Deberghes (1967)
Year of Election or Appointment: 2016
Assistant Treasurer
Mr. Deberghes also serves as an officer of other funds. He serves as Executive Vice President of Fidelity Investments Money Management, Inc. (FIMM) (investment adviser firm, 2016-present) and is an employee of Fidelity Investments (2008-present). Prior to joining Fidelity Investments, Mr. Deberghes was Senior Vice President of Mutual Fund Administration at State Street Corporation (2007-2008), Senior Director of Mutual Fund Administration at Investors Bank & Trust (2005-2007), and Director of Finance for Dunkin' Brands (2000-2005). Previously, Mr. Deberghes served in other fund officer roles.
Joseph DeSantis (1959)
Year of Election or Appointment: 2017
Vice President
Mr. DeSantis also serves as Vice President of other funds. Mr. DeSantis serves as a Director of Fidelity Management & Research (Japan) Limited (investment adviser firm, 2016-present), Chief Investment Officer, Equities (2010-present) and is an employee of Fidelity Investments.
Stephanie J. Dorsey (1969)
Year of Election or Appointment: 2010
Assistant Treasurer
Ms. Dorsey also serves as an officer of other funds. She is an employee of Fidelity Investments (2008-present) and has served in other fund officer roles. Prior to joining Fidelity Investments, Ms. Dorsey served as Treasurer (2004-2008) of the JPMorgan Mutual Funds and Vice President (2004-2008) of JPMorgan Chase Bank.
Howard J. Galligan III (1966)
Year of Election or Appointment: 2014
Chief Financial Officer
Mr. Galligan also serves as Chief Financial Officer of other funds. Mr. Galligan serves as President of Fidelity Pricing and Cash Management Services (FPCMS) (2014-present) and as a Director of Strategic Advisers, Inc. (investment adviser firm, 2008-present). Previously, Mr. Galligan served as Chief Administrative Officer of Asset Management (2011-2014) and Chief Operating Officer and Senior Vice President of Investment Support for Strategic Advisers, Inc. (2003-2011).
Brian B. Hogan (1964)
Year of Election or Appointment: 2009
Vice President
Mr. Hogan also serves as Trustee or Vice President of other funds. Mr. Hogan serves as a Director of FMR Investment Management (UK) Limited (investment adviser firm, 2015-present) and Fidelity SelectCo, LLC (investment adviser firm, 2014-present) and President of the Equity Division of FMR (investment adviser firm, 2009-present). Previously, Mr. Hogan served as Senior Vice President, Equity Research of FMR (2006-2009) and as a portfolio manager. Mr. Brian B. Hogan is not related to Mr. Colm A. Hogan.
Colm A. Hogan (1973)
Year of Election or Appointment: 2016
Deputy Treasurer
Mr. Hogan also serves as an officer of other funds. Mr. Hogan is an employee of Fidelity Investments (2005-present). Mr. Colm A. Hogan is not related to Mr. Brian B. Hogan.
Chris Maher (1972)
Year of Election or Appointment: 2013
Assistant Treasurer
Mr. Maher serves as Assistant Treasurer of other funds. Mr. Maher is Vice President of Valuation Oversight and is an employee of Fidelity Investments. Previously, Mr. Maher served as Vice President of Asset Management Compliance (2013), Vice President of the Program Management Group of FMR (investment adviser firm, 2010-2013), and Vice President of Valuation Oversight (2008-2010).
Rieco E. Mello (1969)
Year of Election or Appointment: 2017
Assistant Treasurer
Mr. Mello also serves as Assistant Treasurer of other funds. Mr. Mello is an employee of Fidelity Investments (1995-present).
Kenneth B. Robins (1969)
Year of Election or Appointment: 2016
Chief Compliance Officer
Mr. Robins also serves as an officer of other funds. Mr. Robins serves as Compliance Officer of Fidelity Management & Research Company and FMR Co., Inc. (investment adviser firms, 2016-present) and is an employee of Fidelity Investments (2004-present). Previously, Mr. Robins served as Executive Vice President of Fidelity Investments Money Management, Inc. (investment adviser firm, 2013-2016) and served in other fund officer roles.
Stacie M. Smith (1974)
Year of Election or Appointment: 2016
President and Treasurer
Ms. Smith also serves as an officer of other funds. She is an employee of Fidelity Investments (2009-present) and has served in other fund officer roles. Prior to joining Fidelity Investments, Ms. Smith served as Senior Audit Manager of Ernst & Young LLP (accounting firm, 1996-2009). Previously, Ms. Smith served as Deputy Treasurer of certain Fidelity® funds (2013-2016).
Marc L. Spector (1972)
Year of Election or Appointment: 2016
Assistant Treasurer
Mr. Spector also serves as an officer of other funds. Mr. Spector is an employee of Fidelity Investments (2016-present). Prior to joining Fidelity Investments, Mr. Spector served as Director at the Siegfried Group (accounting firm, 2013-2016), and prior to Siegfried Group as audit senior manager at Deloitte & Touche (accounting firm, 2005-2013).
Renee Stagnone (1975)
Year of Election or Appointment: 2016
Assistant Treasurer
Ms. Stagnone also serves as an officer of other funds. Ms. Stagnone is an employee of Fidelity Investments (1997-present). Previously, Ms. Stagnone served as Deputy Treasurer of certain Fidelity® funds (2013-2016).
Shareholder Expense Example
As a shareholder of the Fund, you incur two types of costs: (1) transaction costs, including sales charges (loads) on purchase payments or redemption proceeds, redemption fees and (2) ongoing costs, including management fees, distribution and/or service (12b-1) fees and other Fund expenses. This Example is intended to help you understand your ongoing costs (in dollars) of investing in the Fund and to compare these costs with the ongoing costs of investing in other mutual funds.
The Example is based on an investment of $1,000 invested at the beginning of the period and held for the entire period (May 1, 2017 to October 31, 2017).
Actual Expenses
The first line of the accompanying table for each class of the Fund provides information about actual account values and actual expenses. You may use the information in this line, together with the amount you invested, to estimate the expenses that you paid over the period. Simply divide your account value by $1,000.00 (for example, an $8,600 account value divided by $1,000.00 = 8.6), then multiply the result by the number in the first line for a class of the Fund under the heading entitled "Expenses Paid During Period" to estimate the expenses you paid on your account during this period. A small balance maintenance fee of $12.00 that is charged once a year may apply for certain accounts with a value of less than $2,000. This fee is not included in the table below. If it was, the estimate of expenses you paid during the period would be higher, and your ending account value lower, by this amount. In addition, the Fund, as a shareholder in the underlying Fidelity Central Funds, will indirectly bear its pro-rata share of the fees and expenses incurred by the underlying Fidelity Central Funds. These fees and expenses are not included in the Fund's annualized expense ratio used to calculate the expense estimate in the table below.
The first line of the accompanying table for each Class of each fund provides information about actual account values and actual expenses. You may use the information in this line, together with the amount you invested, to estimate the expenses that you paid over the period. Simply divide your account value by $1,000.00 (for example, an $8,600 account value divided by $1,000.00 = 8.6), then multiply the result by the number in the first line for a Class of the fund under the heading entitled "Expenses Paid During Period" to estimate the expenses you paid on your account during this period. A small balance maintenance fee of $12.00 that is charged once a year may apply for certain accounts with a value of less than $2,000. This fee is not included in the table below. If it was, the estimate of expenses you paid during the period would be higher, and your ending account value lower, by this amount. In addition, each Fund, as a shareholder in the underlying Fidelity Central Funds, will indirectly bear its pro-rata share of the fees and expenses incurred by the underlying Fidelity Central Funds. These fees and expenses are not included in the Fund's annualized expense ratio used to calculate the expense estimate in the table below.
Hypothetical Example for Comparison Purposes
The second line of the accompanying table for each class of the Fund provides information about hypothetical account values and hypothetical expenses based on a Class' actual expense ratio and an assumed rate of return of 5% per year before expenses, which is not the Class' actual return. The hypothetical account values and expenses may not be used to estimate the actual ending account balance or expenses you paid for the period. You may use this information to compare the ongoing costs of investing in the Fund and other funds. To do so, compare this 5% hypothetical example with the 5% hypothetical examples that appear in the shareholder reports of the other funds. A small balance maintenance fee of $12.00 that is charged once a year may apply for certain accounts with a value of less than $2,000. This fee is not included in the table below. If it was, the estimate of expenses you paid during the period would be higher, and your ending account value lower, by this amount. In addition, the Fund, as a shareholder in the underlying Fidelity Central Funds, will indirectly bear its pro-rata share of the fees and expenses incurred by the underlying Fidelity Central Funds. These fees and expenses are not included in the Fund's annualized expense ratio used to calculate the expense estimate in the table below.
The second line of the accompanying table for each Class of each fund provides information about hypothetical account values and hypothetical expenses based on a Class' actual expense ratio and an assumed rate of return of 5% per year before expenses, which is not the Class' actual return. The hypothetical account values and expenses may not be used to estimate the actual ending account balance or expenses you paid for the period. You may use this information to compare the ongoing costs of investing in the Fund and other funds. To do so, compare this 5% hypothetical example with the 5% hypothetical examples that appear in the shareholder reports of the other funds. A small balance maintenance fee of $12.00 that is charged once a year may apply for certain accounts with a value of less than $2,000. This fee is not included in the table below. If it was, the estimate of expenses you paid during the period would be higher, and your ending account value lower, by this amount. In addition, each Fund, as a shareholder in the underlying Fidelity Central Funds, will indirectly bear its pro-rata share of the fees and expenses incurred by the underlying Fidelity Central Funds. These fees and expenses are not included in the Fund's annualized expense ratio used to calculate the expense estimate in the table below.
Please note that the expenses shown in the table are meant to highlight your ongoing costs only and do not reflect any transaction costs. Therefore, the second line of the table is useful in comparing ongoing costs only, and will not help you determine the relative total costs of owning different funds. In addition, if these transactional costs were included, your costs would have been higher.
| | Annualized Expense Ratio-A | Beginning
Account Value
May 1, 2017 | Ending
Account Value
October 31, 2017 | Expenses Paid
During Period-B
May 1, 2017
to October 31, 2017 |
| Fidelity Emerging Markets Discovery Fund | | | | |
| Class A | 1.63% | | | |
| Actual | | $1,000.00 | $1,123.30 | $8.72 |
| Hypothetical-C | | $1,000.00 | $1,016.99 | $8.29 |
| Class M | 1.93% | | | |
| Actual | | $1,000.00 | $1,122.50 | $10.33 |
| Hypothetical-C | | $1,000.00 | $1,015.48 | $9.80 |
| Class C | 2.41% | | | |
| Actual | | $1,000.00 | $1,119.30 | $12.87 |
| Hypothetical-C | | $1,000.00 | $1,013.06 | $12.23 |
| Emerging Markets Discovery | 1.34% | | | |
| Actual | | $1,000.00 | $1,125.00 | $7.18 |
| Hypothetical-C | | $1,000.00 | $1,018.45 | $6.82 |
| Class I | 1.33% | | | |
| Actual | | $1,000.00 | $1,124.70 | $7.12 |
| Hypothetical-C | | $1,000.00 | $1,018.50 | $6.77 |
| Fidelity Total Emerging Markets Fund | | | | |
| Class A | 1.41% | | | |
| Actual | | $1,000.00 | $1,120.70 | $7.54 |
| Hypothetical-C | | $1,000.00 | $1,018.10 | $7.17 |
| Class M | 1.80% | | | |
| Actual | | $1,000.00 | $1,118.00 | $9.61 |
| Hypothetical-C | | $1,000.00 | $1,016.13 | $9.15 |
| Class C | 2.18% | | | |
| Actual | | $1,000.00 | $1,117.10 | $11.63 |
| Hypothetical-C | | $1,000.00 | $1,014.22 | $11.07 |
| Total Emerging Markets | 1.20% | | | |
| Actual | | $1,000.00 | $1,121.40 | $6.42 |
| Hypothetical-C | | $1,000.00 | $1,019.16 | $6.11 |
| Class I | 1.19% | | | |
| Actual | | $1,000.00 | $1,122.30 | $6.37 |
| Hypothetical-C | | $1,000.00 | $1,019.21 | $6.06 |
A Annualized expense ratio reflects expenses net of applicable fee waivers.
B Expenses are equal to each Class' annualized expense ratio, multiplied by the average account value over the period, multiplied by 184/ 365 (to reflect the one-half year period).
C 5% return per year before expenses
Distributions (Unaudited)
The Board of Trustees of each fund voted to pay to shareholders of record at the opening of business on record date, the following distributions per share derived from capital gains realized from sales of portfolio securities and dividends derived from net investment income:
| | Pay Date | Record Date | Dividends | Capital Gains |
| Fidelity Emerging Markets Discovery Fund | | | | |
| Class A | 12/18/17 | 12/15/17 | $0.082 | $0.230 |
| Class M | 12/18/17 | 12/15/17 | $0.044 | $0.230 |
| Class C | 12/18/17 | 12/15/17 | $0.020 | $0.230 |
| Emerging Markets Discovery | 12/18/17 | 12/15/17 | $0.114 | $0.230 |
| Class I | 12/18/17 | 12/15/17 | $0.116 | $0.230 |
| Fidelity Total Emerging Markets Fund | | | | |
| Class A | 12/18/17 | 12/15/17 | $0.157 | $0.185 |
| Class M | 12/18/17 | 12/15/17 | $0.130 | $0.185 |
| Class C | 12/18/17 | 12/15/17 | $0.093 | $0.185 |
| Total Emerging Markets | 12/18/17 | 12/15/17 | $0.174 | $0.185 |
| Class I | 12/18/17 | 12/15/17 | $0.185 | $0.185 |
|
The funds hereby designate as capital gain dividend the amounts noted below for the taxable year ended October 31, 2017, or, if subsequently determined to be different, the net capital gain of such year.
| Fidelity Emerging Markets Discovery Fund | $2,579,433.00 |
| Fidelity Total Emerging Markets Fund | $4,214,487.00 |
|
A percentage of the dividends distributed during the fiscal year for the following funds may be taken into account as a dividend for purposes of the maximum rate under section 1(h)(11) of the Internal Revenue Code.
| | Class A | Class M | Class C | Retail Class | Class I |
| Fidelity Emerging Markets Discovery Fund | | | | | |
| December 16, 2016 | 68% | 79% | 100% | 58% | 55% |
| December 27, 2016 | 100% | 100% | 100% | 100% | 100% |
| Fidelity Total Emerging Markets Fund | | | | | |
| December 16, 2016 | 54% | 72% | 100% | 49% | 48% |
|
The amounts per share which represent income derived from sources within, and taxes paid to, foreign countries or possessions of the United States are as follows:
| | Pay Date | Income | Taxes |
| Fidelity Emerging Markets Discovery Fund | | | |
| Class A | 12/19/16 | $0.1459 | $0.0219 |
| Class A | 12/28/16 | $0.0050 | $0.0000 |
| Class M | 12/19/16 | $0.1249 | $0.0219 |
| Class M | 12/28/16 | $0.0050 | $0.0000 |
| Class C | 12/19/16 | $0.0819 | $0.0219 |
| Class C | 12/28/16 | $0.0050 | $0.0000 |
| Emerging Markets Discovery | 12/19/16 | $0.1719 | $0.0219 |
| Emerging Markets Discovery | 12/28/16 | $0.0050 | $0.0000 |
| Class I | 12/19/16 | $0.1819 | $0.0219 |
| Class I | 12/28/16 | $0.0050 | $0.0000 |
| Fidelity Total Emerging Markets Fund | | | |
| Class A | 12/19/16 | $0.1369 | $0.0079 |
| Class M | 12/19/16 | $0.1029 | $0.0079 |
| Class C | 12/19/16 | $0.0729 | $0.0079 |
| Total Emerging Markets | 12/19/16 | $0.1519 | $0.0079 |
| Class I | 12/19/16 | $0.1539 | $0.0079 |
|
The funds will notify shareholders in January 2018 of amounts for use in preparing 2017 income tax returns.
Board Approval of Investment Advisory Contracts and Management Fees
Fidelity Emerging Markets Discovery Fund
Fidelity Total Emerging Markets Fund
Each year, the Board of Trustees, including the Independent Trustees (together, the Board), votes on the renewal of the management contract with Fidelity Management & Research Company (FMR) and the sub-advisory agreements (together, the Advisory Contracts) for the fund. FMR and the sub-advisers are referred to herein as the Investment Advisers. The Board, assisted by the advice of fund counsel and Independent Trustees' counsel, requests and considers a broad range of information relevant to the renewal of the Advisory Contracts throughout the year.
The Board meets regularly and, at each of its meetings, covers an extensive agenda of topics and materials and considers factors that are relevant to its annual consideration of the renewal of each fund's Advisory Contracts, including the services and support provided to each fund and its shareholders. The Board has established various standing committees (Committees), each composed of and chaired by Independent Trustees with varying backgrounds, to which the Board has assigned specific subject matter responsibilities in order to enhance effective decision-making by the Board. The Board, acting directly and through its Committees, requests and receives information concerning the annual consideration of the renewal of each fund's Advisory Contracts. The Board also meets as needed to review matters specifically related to the Board's annual consideration of the renewal of the Advisory Contracts. Members of the Board may also meet with trustees of other Fidelity funds through ad hoc joint committees to discuss certain matters relevant to all of the Fidelity funds.
At its July 2017 meeting, the Board unanimously determined to renew each fund's Advisory Contracts. In reaching its determination, the Board considered all factors it believed relevant, including (i) the nature, extent, and quality of the services to be provided to each fund and its shareholders (including the investment performance of each fund); (ii) the competitiveness of each fund's management fee and total expense ratio relative to peer funds; (iii) the total costs of the services to be provided by and the profits to be realized by Fidelity from its relationships with each fund; and (iv) the extent to which, if any, economies of scale exist and would be realized as each fund grows, and whether any economies of scale are appropriately shared with fund shareholders.
In considering whether to renew the Advisory Contracts for each fund, the Board reached a determination, with the assistance of fund counsel and Independent Trustees' counsel and through the exercise of its business judgment, that the renewal of the Advisory Contracts was in the best interests of each fund and its shareholders and that the compensation payable under the Advisory Contracts was fair and reasonable. The Board's decision to renew the Advisory Contracts was not based on any single factor, but rather was based on a comprehensive consideration of all the information provided to the Board at its meetings throughout the year. The Board, in reaching its determination to renew the Advisory Contracts, was aware that shareholders of each fund have a broad range of investment choices available to them, including a wide choice among funds offered by Fidelity's competitors, and that each fund's shareholders, who have the opportunity to review and weigh the disclosure provided by the fund in its prospectus and other public disclosures, have chosen to invest in that fund, which is part of the Fidelity family of funds.
Amendment to Group Fee Rate. The Board also approved an amendment to the management contract for each fund to add an additional breakpoint to the group fee schedule, effective October 1, 2017. The Board noted that the additional breakpoint would result in lower management fee rates as Fidelity's assets under management increase.
Nature, Extent, and Quality of Services Provided. The Board considered Fidelity's staffing as it relates to the funds, including the backgrounds of investment personnel of Fidelity, and also considered the funds' investment objectives, strategies, and related investment philosophies. The Independent Trustees also had discussions with senior management of Fidelity's investment operations and investment groups. The Board considered the structure of the investment personnel compensation program and whether this structure provides appropriate incentives to act in the best interests of each fund. Additionally, the Board considered the portfolio managers' investments, if any, in the funds that they manage.
Resources Dedicated to Investment Management and Support Services. The Board and the Fund Oversight and Research Committees reviewed the general qualifications and capabilities of Fidelity's investment staff, including its size, education, experience, and resources, as well as Fidelity's approach to recruiting, training, managing, and compensating investment personnel. The Board noted that Fidelity has continued to increase the resources devoted to non-U.S. offices, including expansion of Fidelity's global investment organization. The Board also noted that Fidelity's analysts have extensive resources, tools and capabilities that allow them to conduct sophisticated quantitative and fundamental analysis, as well as credit analysis of issuers, counterparties and guarantors. Further, the Board considered that Fidelity's investment professionals have sufficient access to global information and data so as to provide competitive investment results over time, and that those professionals also have access to sophisticated tools that permit them to assess portfolio construction and risk and performance attribution characteristics continuously, as well as to transmit new information and research conclusions rapidly around the world. Additionally, in its deliberations, the Board considered Fidelity's trading, risk management, compliance, and technology and operations capabilities and resources, which are integral parts of the investment management process.
Shareholder and Administrative Services. The Board considered (i) the nature, extent, quality, and cost of advisory, administrative, and shareholder services performed by the Investment Advisers and their affiliates under the Advisory Contracts and under separate agreements covering transfer agency, pricing and bookkeeping, and securities lending services for each fund; (ii) the nature and extent of the supervision of third party service providers, principally custodians, subcustodians, and pricing vendors; and (iii) the resources devoted to, and the record of compliance with, each fund's compliance policies and procedures. The Board also reviewed the allocation of fund brokerage, including allocations to brokers affiliated with the Investment Advisers, the use of brokerage commissions to pay fund expenses, and the use of "soft" commission dollars to pay for research services.
The Board noted that the growth of fund assets over time across the complex allows Fidelity to reinvest in the development of services designed to enhance the value or convenience of the Fidelity funds as investment vehicles. These services include 24-hour access to account information and market information through telephone representatives and over the Internet, investor education materials and asset allocation tools, and the expanded availability of Fidelity Investor Centers.
In 2014, the Board formed an ad hoc Committee on Transfer Agency Fees to review the variety of transfer agency fee structures throughout the industry and Fidelity's competitive positioning with respect to industry participants.
Investment in a Large Fund Family. The Board considered the benefits to shareholders of investing in a Fidelity fund, including the benefits of investing in a fund that is part of a large family of funds offering a variety of investment disciplines and providing a large variety of mutual fund investor services. The Board noted that Fidelity had taken, or had made recommendations that resulted in the Fidelity funds taking, a number of actions over the previous year that benefited particular funds, including: (i) continuing to dedicate additional resources to Fidelity's investment research process, and to the support of the senior management team that oversees asset management; (ii) continuing efforts to enhance Fidelity's global research capabilities; (iii) launching new funds and making other enhancements to meet client needs; (iv) launching new share classes of existing funds; (v) eliminating purchase minimums and broadening eligibility requirements for certain lower-priced share classes; (vi) reducing management fees and total expenses for certain growth equity funds and index funds; (vii) lowering expense caps for certain existing funds and classes to reduce expenses borne by shareholders; (viii) eliminating short-term redemption fees for certain funds; (ix) introducing a new pricing structure for certain funds of funds that is expected to reduce overall expenses paid by shareholders; (x) rationalizing product lines and gaining increased efficiencies through proposals for fund mergers and share class consolidations; (xi) continuing to develop, acquire and implement systems and technology to improve services to the funds and shareholders, strengthen information security, and increase efficiency; and (xii) implementing enhancements to further strengthen Fidelity's product line to increase investors' probability of success in achieving their investment goals, including retirement income goals.
Investment Performance. The Board considered whether each fund has operated in accordance with its investment objective, as well as its record of compliance with its investment restrictions and its performance history. The Board noted that there were portfolio management changes for Fidelity Emerging Markets Discovery Fund in June 2014 and for Fidelity Total Emerging Markets Fund in September 2014, October 2015, and January 2017.
The Board took into account discussions with representatives of the Investment Advisers about fund investment performance that occur at Board meetings throughout the year. In this regard the Board noted that as part of regularly scheduled fund reviews and other reports to the Board on fund performance, the Board considers annualized return information for each fund for different time periods, measured against a securities market index ("benchmark index") and a peer group of funds with similar objectives ("peer group"), if any. In its evaluation of fund investment performance, the Board gave particular attention to information indicating changes in performance of certain Fidelity funds for specific time periods and discussed with the Investment Advisers the reasons for any overperformance or underperformance.
In addition to reviewing absolute and relative fund performance, the Independent Trustees periodically consider the appropriateness of fund performance metrics in evaluating the results achieved. In general, the Independent Trustees believe that fund performance should be evaluated based on net performance (after fees and expenses) of both the highest performing and lowest performing fund share classes, where applicable, compared to appropriate benchmark indices, over appropriate time periods that may include full market cycles, and compared to peer groups, as applicable, over the same periods, taking into account relevant factors including the following: general market conditions; issuer-specific information; and fund cash flows and other factors.
The Independent Trustees recognize that shareholders evaluate performance on a net basis over their own holding periods, for which one-, three-, and five-year periods are often used as a proxy. For this reason, the performance information reviewed by the Board also included net cumulative calendar year total return information for each fund and an appropriate benchmark index and, in the case of Fidelity Emerging Markets Discovery Fund, peer group for the most recent one-, three-, and five-year periods, as shown below. Returns are shown compared to the 25th percentile (top of box, 75% beaten) and 75th percentile (bottom of box, 25% beaten) of the peer universe. For Fidelity Total Emerging Markets Fund, a peer group is not shown below because the fund does not generally utilize a peer group for performance comparison purposes.
Fidelity Emerging Markets Discovery Fund

Fidelity Total Emerging Markets Fund
Based on its review, the Board concluded that the nature, extent, and quality of services provided to each fund under the Advisory Contracts should continue to benefit the shareholders of each fund.
Competitiveness of Management Fee and Total Expense Ratio. The Board considered each fund's management fee and total expense ratio compared to "mapped groups" of competitive funds and classes created for the purpose of facilitating the Trustees' competitive analysis of management fees and total expenses. Fidelity creates "mapped groups" by combining similar Lipper investment objective categories that have comparable investment mandates. Combining Lipper investment objective categories aids the Board's management fee and total expense ratio comparisons by broadening the competitive group used for comparison.
Management Fee. The Board considered two proprietary management fee comparisons for the 12-month periods shown in basis points (BP) in the charts below. The group of Lipper funds used by the Board for management fee comparisons is referred to below as the "Total Mapped Group." The Total Mapped Group comparison focuses on a fund's standing in terms of gross management fees before expense reimbursements or caps relative to the total universe of funds with comparable investment mandates, regardless of whether their management fee structures also are comparable. Funds with comparable investment mandates offer exposure to similar types of securities. Funds with comparable management fee structures have similar management fee contractual arrangements (
e.g., flat rate charged for advisory services, all-inclusive fee rate,
etc.). "TMG %" represents the percentage of funds in the Total Mapped Group that had management fees that were lower than a fund's. For example, a hypothetical TMG % of 20% would mean that 80% of the funds in the Total Mapped Group had higher, and 20% had lower, management fees than a fund. The funds' actual TMG %s and the number of funds in the Total Mapped Group are in the charts below. The "Asset-Size Peer Group" (ASPG) comparison focuses on a fund's standing relative to a subset of non-Fidelity funds within the Total Mapped Group that are similar in size and management fee structure. For example, if a fund is in the first quartile of the ASPG, the fund's management fee ranks in the least expensive or lowest 25% of funds in the ASPG. The ASPG represents at least 15% of the funds in the Total Mapped Group with comparable asset size and management fee structures, subject to a minimum of 50 funds (or all funds in the Total Mapped Group if fewer than 50). Additional information, such as the ASPG quartile in which a fund's management fee rate ranked, is also included in the charts and considered by the Board.
Fidelity Emerging Markets Discovery Fund
Fidelity Emerging Markets Discovery Fund
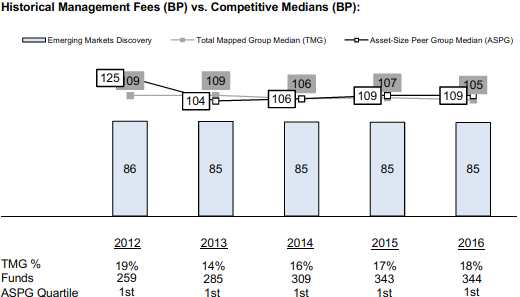
Fidelity Total Emerging Markets Fund
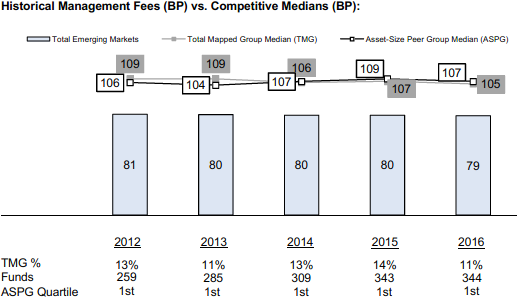
The Board noted that each fund's management fee rate ranked below the median of its Total Mapped Group and below the median of its ASPG for 2016.
The Board noted that, in 2014, the Board and the boards of other Fidelity funds formed the ad hoc Committee on Group Fee to conduct an in-depth review of the "group fee" component of the management fee of funds with such management fee structures. The Committee's focus included the mechanics of the group fee, the competitive landscape of group fee structures, Fidelity funds with no group fee component and investment products not included in group fee assets. The Board also considered that, for funds subject to the group fee, FMR agreed to voluntarily waive fees over a specified period of time in amounts designed to account for assets converted from certain funds to certain collective investment trusts.
The Board also noted that, in 2013, the ad hoc Committee on Management Fees was formed to conduct an in-depth review of the management fee rates of Fidelity's active equity mutual funds. The Committee focused on the following areas: (i) standard fee structures; (ii) research consumption and trading evolution; (iii) management fee competitiveness/profitability by category; and (iv) factors that drive institutional pricing.
Based on its review, the Board concluded that each fund's management fee is fair and reasonable in light of the services that the fund receives and the other factors considered.
Total Expense Ratio. In its review of the total expense ratio of each class of each fund, the Board considered the fund's management fee rate as well as other fund or class expenses, as applicable, such as transfer agent fees, pricing and bookkeeping fees, fund-paid 12b-1 fees, and custodial, legal, and audit fees. The Board also noted that Fidelity may agree to waive fees and expenses from time to time, and the extent to which, if any, it has done so for each fund. As part of its review, the Board also considered the current and historical total expense ratios of each class of each fund compared to competitive fund median expenses. Each class of each fund is compared to those funds and classes in the Total Mapped Group (used by the Board for management fee comparisons) that have a similar sales load structure.
The Board noted that each fund offers multiple classes, each of which has a different sales load and 12b-1 fee structure, and that the multiple structures are intended to offer a range of pricing options for the intermediary market. The Board also noted that the total expense ratios of the classes of each fund vary primarily by the level of their 12b-1 fees, although differences in transfer agent fees may also cause expenses to vary from class to class.
The Board noted that the total expense ratio of each class of Fidelity Emerging Markets Discovery Fund ranked above the competitive median for 2016. The Board considered that, in general, various factors can affect total expense ratios. The Board noted that the total expense ratio of each class was above the competitive median because of relatively higher other expenses due to low asset levels. The Board noted that the total expense ratio of Class M (formerly Class T) was also above the competitive median because of higher 12b-1 fees on Class M as compared to most competitor funds. Class M has a higher 12b-1 fee, but a lower front-end sales charge, than traditionally priced front-end sales charge classes. The Board considered that Class M is primarily sold load-waived in the retirement plan market where its 0.50% 12b-1 fee is comparable to competing no-load, higher 12b-1 fee classes designed specifically for retirement plans. The Board noted that the total expense ratio of Class C was also above the competitive median because of its 12b-1 fees. The Board also noted that, although Class I is categorized by Lipper as an institutional class, Class I has a significantly lower investment minimum than most other funds and classes categorized as institutional. As a result, FMR believes Class I is generally more comparable to retail funds and classes.
The Board noted that the total expense ratio of the retail class of Fidelity Total Emerging Markets Fund ranked below the competitive median for 2016 and the total expense ratio of each of Class A, Class M, Class C, and Class I ranked above the competitive median for 2016. The Board considered that, in general, various factors can affect total expense ratios. The Board noted that the total expense ratio of Class A, Class M, Class C, and Class I was above the competitive median because of relatively higher other expenses due to low asset levels. The Board noted that the total expense ratio of Class M was also above the competitive median because of higher 12b-1 fees on Class M as compared to most competitor funds. Class M has a higher 12b-1 fee, but a lower front-end sales charge, than traditionally priced front-end sales charge classes. The Board considered that Class M is primarily sold load-waived in the retirement plan market where its 0.50% 12b-1 fee is comparable to competing no-load, higher 12b-1 fee classes designed specifically for retirement plans. The Board noted that the total expense ratio of Class C was also above the competitive median because of its 12b-1 fees. The Board also noted that, although Class I is categorized by Lipper as an institutional class, Class I has a significantly lower investment minimum than most other funds and classes categorized as institutional. As a result, FMR believes Class I is generally more comparable to retail funds and classes.
The Board further considered that FMR has contractually agreed to reimburse Class A, Class M, Class C, Class I, and the retail class of Fidelity Emerging Markets Discovery Fund to the extent that total operating expenses (excluding interest, certain taxes, certain securities lending costs, brokerage commissions, fees and expenses of the Independent Trustees, proxy and shareholder meeting expenses, extraordinary expenses, and acquired fund fees and expenses, if any), as a percentage of their respective average net assets, exceed 1.70%, 1.95%, 2.45%, 1.45%, and 1.45% through December 31, 2017.
The Board further considered that FMR has contractually agreed to reimburse Class A, Class M, Class C, Class I, and the retail class of Fidelity Total Emerging Markets Fund to the extent that total operating expenses (excluding interest, certain taxes, certain securities lending costs, brokerage commissions, fees and expenses of the Independent Trustees, proxy and shareholder meeting expenses, extraordinary expenses, and acquired fund fees and expenses, if any), as a percentage of their respective average net assets, exceed 1.65%, 1.90%, 2.40%, 1.40%, and 1.40% through December 31, 2017.
Fees Charged to Other Fidelity Clients. The Board also considered Fidelity fee structures and other information with respect to clients of Fidelity, such as other funds advised or subadvised by Fidelity, pension plan clients, and other institutional clients with similar mandates. The Board noted that an ad hoc joint committee created by it and the boards of other Fidelity funds periodically (most recently in 2013) reviews and compares Fidelity's institutional investment advisory business with its business of providing services to the Fidelity funds, including the differences in services provided, fees charged, and costs incurred, as well as competition in their respective marketplaces.
Based on its review of total expense ratios and fees charged to other Fidelity clients, the Board concluded that, although some classes were above the median of the universe presented for comparison, the total expense ratio of each class of each fund was reasonable in light of the services that the fund and its shareholders receive and the other factors considered.
Costs of the Services and Profitability. The Board considered the revenues earned and the expenses incurred by Fidelity in conducting the business of developing, marketing, distributing, managing, administering and servicing each fund and servicing each fund's shareholders. The Board also considered the level of Fidelity's profits in respect of all the Fidelity funds.
On an annual basis, Fidelity presents to the Board information about the profitability of its relationships with each fund. Fidelity calculates profitability information for each fund, as well as aggregate profitability information for groups of Fidelity funds and all Fidelity funds, using a series of detailed revenue and cost allocation methodologies which originate with the books and records of Fidelity on which Fidelity's audited financial statements are based. The Audit Committee of the Board reviews any significant changes from the prior year's methodologies.
PricewaterhouseCoopers LLP (PwC), independent registered public accounting firm and auditor to Fidelity and certain Fidelity funds, has been engaged annually by the Board as part of the Board's assessment of Fidelity's profitability analysis. PwC's engagement includes the review and assessment of the methodologies used by Fidelity in determining the revenues and expenses attributable to Fidelity's mutual fund business, and completion of agreed-upon procedures in respect of the mathematical accuracy of the fund profitability information and its conformity to established allocation methodologies. After considering PwC's reports issued under the engagement and information provided by Fidelity, the Board concluded that while other allocation methods may also be reasonable, Fidelity's profitability methodologies are reasonable in all material respects.
The Board also reviewed Fidelity's non-fund businesses and potential fall-out benefits related to the mutual fund business as well as cases where Fidelity's affiliates may benefit from or be related to the funds' business.
The Board considered the costs of the services provided by and the profits realized by Fidelity in connection with the operation of each fund and was satisfied that the profitability was not excessive.
Economies of Scale. The Board considered whether there have been economies of scale in respect of the management of the Fidelity funds, whether the Fidelity funds (including each fund) have appropriately benefited from any such economies of scale, and whether there is potential for realization of any further economies of scale. The Board considered the extent to which each fund will benefit from economies of scale as assets grow through increased services to the fund, through waivers or reimbursements, or through fee or expense ratio reductions. The Board also noted that a committee (the Economies of Scale Committee) created by it and the boards of other Fidelity funds periodically (most recently in 2013) analyzes whether Fidelity attains economies of scale in respect of the management and servicing of the Fidelity funds, whether the Fidelity funds have appropriately benefited from such economies of scale, and whether there is potential for realization of any further economies of scale.
The Board recognized that each fund's management contract incorporates a "group fee" structure, which provides for lower group fee rates as total group assets increase, and for higher group fee rates as total group assets decrease (with "group assets" defined to include fund assets under FMR's management plus the assets of sector funds previously under FMR's management). FMR calculates the group fee rates based on a tiered asset "breakpoint" schedule that varies based on asset class. The Board considered that the group fee is designed to deliver the benefits of economies of scale to fund shareholders when total Fidelity fund assets increase, even if assets of any particular fund are unchanged or have declined, because some portion of Fidelity's costs are attributable to services provided to all Fidelity funds, and all funds benefit if those costs can be allocated among more assets. The Board concluded that, given the group fee structure, fund shareholders will benefit from lower management fees as group assets increase at the fund complex level, regardless of whether Fidelity achieves any such economies of scale.
The Board concluded, taking into account the analysis of the Economies of Scale Committee, that economies of scale, if any, are being appropriately shared between fund shareholders and Fidelity.
Additional Information Requested by the Board. In order to develop fully the factual basis for consideration of the Fidelity funds' advisory contracts, the Board requested and received additional information on certain topics, including: (i) fund performance trends, in particular the underperformance of certain funds, and Fidelity's long-term strategies for certain funds; (ii) Fidelity's fund profitability methodology, profitability trends for certain funds, and the impact of certain factors on fund profitability results, including the impact of market trends on actively managed funds; (iii) the use of performance fees and the calculation of performance adjustments, including the impact of underperformance and fund outflows on performance adjustments; (iv) metrics for evaluating index fund performance; (v) Fidelity's group fee structure, including the group fee breakpoint schedules; (vi) the terms of Fidelity's contractual and voluntary expense cap arrangements with the funds; (vii) the methodology with respect to evaluating competitive fund data and peer group classifications and fee comparisons; (viii) the expense structures for different funds and classes; (ix) Fidelity's arrangements with affiliated sub-advisers on behalf of the funds; (x) information regarding other accounts managed by Fidelity, including institutional accounts and collective investment trusts; (xi) recent changes to the fee structure for certain funds of funds; and (xii) the impact of the Department of Labor's new fiduciary rule on the funds' comparative expense information.
Based on its evaluation of all of the conclusions noted above, and after considering all factors it believed relevant, the Board concluded that the advisory fee structures are fair and reasonable, and that each fund's Advisory Contracts should be renewed.
EMD-TEK-ANN-1217
1.931237.105
Fidelity® International Value Fund
Annual Report October 31, 2017 |
|
Contents
To view a fund's proxy voting guidelines and proxy voting record for the 12-month period ended June 30, visit http://www.fidelity.com/proxyvotingresults or visit the Securities and Exchange Commission's (SEC) web site at http://www.sec.gov.
You may also call 1-800-544-8544 to request a free copy of the proxy voting guidelines.
Standard & Poor's, S&P and S&P 500 are registered service marks of The McGraw-Hill Companies, Inc. and have been licensed for use by Fidelity Distributors Corporation.
Other third-party marks appearing herein are the property of their respective owners.
All other marks appearing herein are registered or unregistered trademarks or service marks of FMR LLC or an affiliated company. © 2017 FMR LLC. All rights reserved.
This report and the financial statements contained herein are submitted for the general information of the shareholders of the Fund. This report is not authorized for distribution to prospective investors in the Fund unless preceded or accompanied by an effective prospectus.
A fund files its complete schedule of portfolio holdings with the SEC for the first and third quarters of each fiscal year on Form N-Q. Forms N-Q are available on the SEC’s web site at http://www.sec.gov. A fund's Forms N-Q may be reviewed and copied at the SEC’s Public Reference Room in Washington, DC. Information regarding the operation of the SEC's Public Reference Room may be obtained by calling 1-800-SEC-0330.
For a complete list of a fund's portfolio holdings, view the most recent holdings listing, semiannual report, or annual report on Fidelity's web site at http://www.fidelity.com, http://www.institutional.fidelity.com, or http://www.401k.com, as applicable.
NOT FDIC INSURED •MAY LOSE VALUE •NO BANK GUARANTEE
Neither the Fund nor Fidelity Distributors Corporation is a bank.
Performance: The Bottom Line
Average annual total return reflects the change in the value of an investment, assuming reinvestment of distributions from dividend income and capital gains (the profits earned upon the sale of securities that have grown in value, if any) and assuming a constant rate of performance each year. The hypothetical investment and the average annual total returns do not reflect the deduction of taxes that a shareholder would pay on fund distributions or the redemption of fund shares. During periods of reimbursement by Fidelity, a fund’s total return will be greater than it would be had the reimbursement not occurred. How a fund did yesterday is no guarantee of how it will do tomorrow.
Average Annual Total Returns
| For the periods ended October 31, 2017 | Past 1 year | Past 5 years | Past 10 years |
| Fidelity® International Value Fund | 19.83% | 7.10% | (0.54)% |
$10,000 Over 10 Years
Let's say hypothetically that $10,000 was invested in Fidelity® International Value Fund, a class of the fund, on October 31, 2007.
The chart shows how the value of your investment would have changed, and also shows how the MSCI EAFE Value Index performed over the same period.
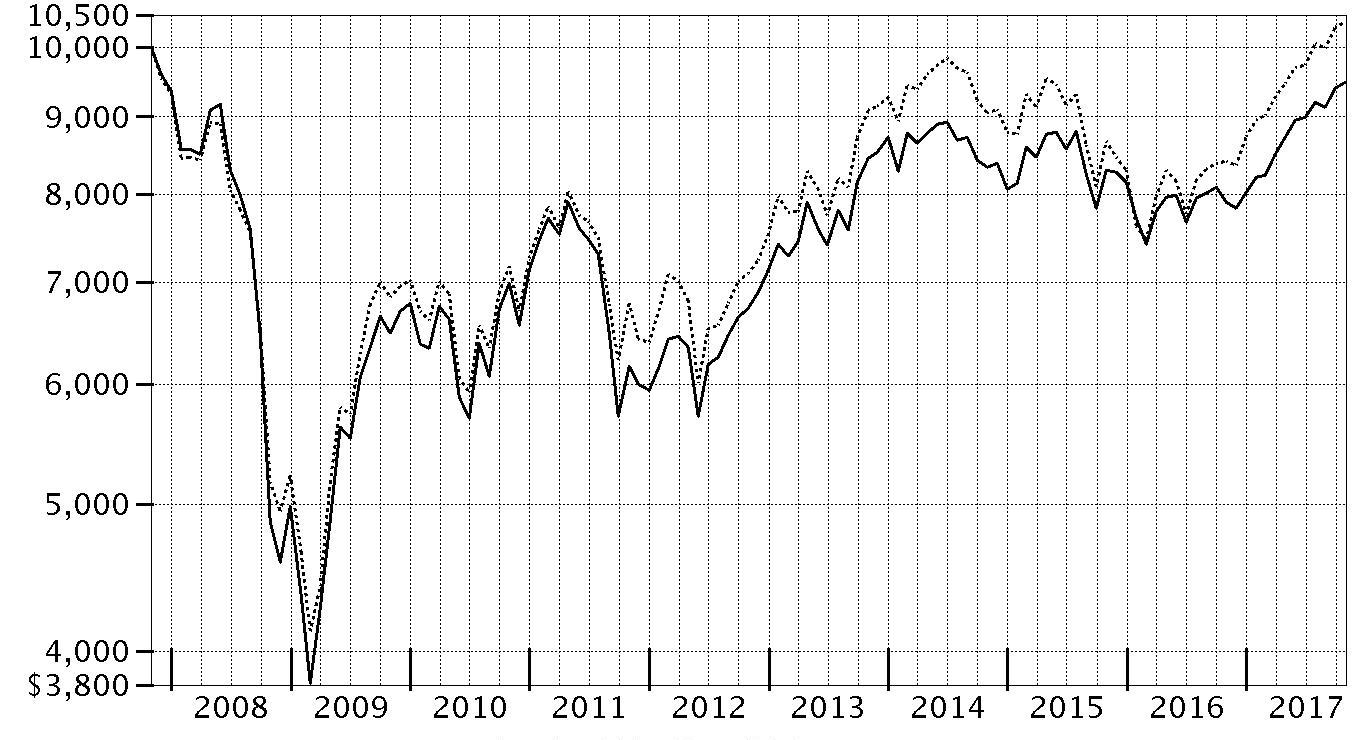
| Period Ending Values |
| $9,476 | Fidelity® International Value Fund |
| $10,380 | MSCI EAFE Value Index |
Management's Discussion of Fund Performance
Market Recap: The MSCI ACWI (All Country World Index) ex USA Index returned 23.85% for the 12 months ending October 31, 2017, helped partly by a generally weak U.S. dollar. Some favorable election results in continental Europe (+30%) suggested ebbing political uncertainty and near-term risk there, but the U.K. (+20%) faced more-mixed conditions ahead of its expected exit from the European Union. Despite central-bank easing – and pressured recently by yen strength – Japan (+18%) lagged the rest of the Asia-Pacific group (+22%). Commodity-price volatility slowed Canada (+17%), but the emerging-markets group (+26%) sped ahead. Sector-wise, information technology (+47%) was driven by a surge among several Chinese internet-related names. Financials (+27%) rode rising interest rates that, at the same time, weighed on real estate (+17%), utilities (+16%), consumer staples (+14%) and telecommunication services (+9%) – so-called “bond proxy” sectors. Materials (+28%) and industrials (+27%) responded to demand from China and price gains for certain commodities. In the energy sector (+20%), oil prices lost ground in the spring before rebounding through October 31 to end well above where they started 12 months ago. Lastly, health care (+14%) was hurt by early-period turmoil around drug pricing and health care legislation.
Comments from Portfolio Manager Alexander Zavratsky: For the fiscal year, the fund’s share class (excluding sales charges, if applicable) gained about 18% to 20%, trailing the 23.50% return of the benchmark MSCI EAFE Value Index. Versus the benchmark, the biggest detractors included choices in the U.K. and non-benchmark exposure to the United States. Among individual stocks, untimely positioning in Royal Dutch Shell hurt most. Shares of the Anglo-Dutch multinational oil and gas giant recovered in the second half of the period on positive financial results and an uptick in oil prices, but we missed out because I eliminated our stake in May. Avoiding German financial services company and benchmark stock Allianz also hurt relative results. Its shares benefited from the firm’s stock buyback program. Elsewhere, it hurt to own U.K. cigarette maker Imperial Brands – a stock that was removed from the benchmark in December 2016. Shares of Imperial Brands fell along with the broader tobacco industry. Conversely, the biggest relative contributor was a non-benchmark stake in French software & services firm Atos. Shares of Atos benefited from the firm’s increasing growth and merger-and-acquisition activity. Lastly, it helped to establish a non-benchmark position this period in Recruit Holdings, a Japan-based staffing agency. Recruit's stock was helped by a tightening labor market in Japan.
The views expressed above reflect those of the portfolio manager(s) only through the end of the period as stated on the cover of this report and do not necessarily represent the views of Fidelity or any other person in the Fidelity organization. Any such views are subject to change at any time based upon market or other conditions and Fidelity disclaims any responsibility to update such views. These views may not be relied on as investment advice and, because investment decisions for a Fidelity fund are based on numerous factors, may not be relied on as an indication of trading intent on behalf of any Fidelity fund.
Investment Summary (Unaudited)
Geographic Diversification (% of fund's net assets)
| As of October 31, 2017 |
| | Japan | 22.0% |
| | United Kingdom | 15.7% |
| | France | 14.4% |
| | Switzerland | 9.3% |
| | Germany | 7.8% |
| | Spain | 4.6% |
| | Sweden | 4.5% |
| | United States of America* | 3.8% |
| | Australia | 3.8% |
| | Other | 14.1% |

* Includes Short-Term investments and Net Other Assets (Liabilities).
| As of April 30, 2017 |
| | Japan | 22.6% |
| | United Kingdom | 17.2% |
| | France | 15.3% |
| | Germany | 7.4% |
| | Switzerland | 7.0% |
| | Australia | 5.7% |
| | Spain | 4.2% |
| | United States of America* | 4.1% |
| | Netherlands | 3.8% |
| | Other | 12.7% |

* Includes Short-Term investments and Net Other Assets (Liabilities).
Percentages are based on country or territory of incorporation and are adjusted for the effect of futures contracts, if applicable.
Asset Allocation as of October 31, 2017
| | % of fund's net assets | % of fund's net assets 6 months ago |
| Stocks | 98.8 | 98.9 |
| Short-Term Investments and Net Other Assets (Liabilities) | 1.2 | 1.1 |
Top Ten Stocks as of October 31, 2017
| | % of fund's net assets | % of fund's net assets 6 months ago |
| Total SA (France, Oil, Gas & Consumable Fuels) | 3.2 | 3.0 |
| Novartis AG (Switzerland, Pharmaceuticals) | 3.0 | 1.2 |
| BP PLC (United Kingdom, Oil, Gas & Consumable Fuels) | 2.7 | 1.9 |
| Mitsubishi UFJ Financial Group, Inc. (Japan, Banks) | 2.2 | 2.5 |
| Banco Santander SA (Spain) (Spain, Banks) | 2.1 | 1.4 |
| Toyota Motor Corp. (Japan, Automobiles) | 2.1 | 2.2 |
| BASF AG (Germany, Chemicals) | 1.9 | 1.7 |
| Australia & New Zealand Banking Group Ltd. (Australia, Banks) | 1.9 | 1.7 |
| Nestle SA (Reg. S) (Switzerland, Food Products) | 1.6 | 0.6 |
| AstraZeneca PLC (United Kingdom) (United Kingdom, Pharmaceuticals) | 1.6 | 1.4 |
| | 22.3 | |
Top Market Sectors as of October 31, 2017
| | % of fund's net assets | % of fund's net assets 6 months ago |
| Financials | 35.9 | 36.5 |
| Industrials | 12.2 | 13.4 |
| Health Care | 11.4 | 9.6 |
| Energy | 9.0 | 7.4 |
| Materials | 7.9 | 7.7 |
| Consumer Discretionary | 6.3 | 8.5 |
| Information Technology | 6.1 | 5.2 |
| Consumer Staples | 5.3 | 4.8 |
| Telecommunication Services | 2.8 | 3.4 |
| Real Estate | 1.0 | 0.6 |
Investments October 31, 2017
Showing Percentage of Net Assets
| Common Stocks - 98.3% | | | |
| | | Shares | Value |
| Australia - 3.8% | | | |
| Australia & New Zealand Banking Group Ltd. | | 314,052 | $7,191,562 |
| Insurance Australia Group Ltd. | | 413,965 | 2,078,392 |
| Macquarie Group Ltd. | | 50,807 | 3,824,353 |
| Magellan Financial Group Ltd. | | 68,954 | 1,280,824 |
|
| TOTAL AUSTRALIA | | | 14,375,131 |
|
| Austria - 0.8% | | | |
| Erste Group Bank AG | | 71,700 | 3,081,043 |
| Bailiwick of Jersey - 0.9% | | | |
| Shire PLC | | 27,700 | 1,364,380 |
| Wolseley PLC | | 31,628 | 2,211,654 |
|
| TOTAL BAILIWICK OF JERSEY | | | 3,576,034 |
|
| Belgium - 1.5% | | | |
| KBC Groep NV | | 68,291 | 5,672,623 |
| Canada - 0.4% | | | |
| Potash Corp. of Saskatchewan, Inc. | | 85,600 | 1,666,085 |
| Finland - 1.1% | | | |
| Sampo Oyj (A Shares) | | 79,334 | 4,156,701 |
| France - 14.4% | | | |
| Atos Origin SA | | 31,108 | 4,833,903 |
| AXA SA | | 198,521 | 5,993,037 |
| Bouygues SA | | 44,720 | 2,146,976 |
| Capgemini SA | | 28,993 | 3,524,160 |
| Compagnie de St. Gobain | | 39,700 | 2,328,875 |
| Natixis SA | | 301,500 | 2,364,294 |
| Sanofi SA | | 45,359 | 4,294,892 |
| Societe Generale Series A | | 101,600 | 5,654,500 |
| SR Teleperformance SA | | 20,600 | 3,009,087 |
| Total SA | | 223,894 | 12,479,434 |
| VINCI SA (a) | | 53,300 | 5,218,371 |
| Vivendi SA | | 136,492 | 3,390,519 |
|
| TOTAL FRANCE | | | 55,238,048 |
|
| Germany - 7.8% | | | |
| BASF AG | | 66,485 | 7,250,406 |
| Brenntag AG | | 30,700 | 1,738,516 |
| Deutsche Post AG | | 65,710 | 3,009,643 |
| Deutsche Telekom AG | | 201,100 | 3,641,384 |
| Fresenius SE & Co. KGaA | | 22,800 | 1,904,516 |
| HeidelbergCement Finance AG | | 26,100 | 2,659,314 |
| Linde AG (b) | | 13,300 | 2,865,339 |
| SAP SE | | 27,883 | 3,185,985 |
| Vonovia SE | | 85,465 | 3,759,155 |
|
| TOTAL GERMANY | | | 30,014,258 |
|
| Hong Kong - 0.3% | | | |
| AIA Group Ltd. | | 143,600 | 1,080,488 |
| Indonesia - 0.7% | | | |
| PT Bank Rakyat Indonesia Tbk | | 2,171,600 | 2,497,840 |
| Ireland - 1.3% | | | |
| Allergan PLC | | 7,680 | 1,361,126 |
| CRH PLC | | 67,571 | 2,542,829 |
| Medtronic PLC | | 14,600 | 1,175,592 |
|
| TOTAL IRELAND | | | 5,079,547 |
|
| Israel - 0.1% | | | |
| Teva Pharmaceutical Industries Ltd. sponsored ADR | | 29,199 | 402,946 |
| Italy - 1.3% | | | |
| Intesa Sanpaolo SpA | | 1,433,400 | 4,818,958 |
| Japan - 22.0% | | | |
| AEON Financial Service Co. Ltd. | | 72,600 | 1,559,193 |
| East Japan Railway Co. | | 22,000 | 2,133,552 |
| Fujitsu Ltd. | | 169,000 | 1,316,932 |
| Hoya Corp. | | 60,100 | 3,265,278 |
| Itochu Corp. | | 259,800 | 4,550,824 |
| Japan Tobacco, Inc. | | 87,100 | 2,883,028 |
| Kao Corp. | | 36,400 | 2,199,839 |
| KDDI Corp. | | 138,200 | 3,682,013 |
| Makita Corp. | | 62,700 | 2,627,672 |
| Mitsubishi UFJ Financial Group, Inc. | | 1,250,400 | 8,481,644 |
| Nintendo Co. Ltd. | | 6,100 | 2,366,567 |
| Nippon Telegraph & Telephone Corp. | | 68,400 | 3,306,971 |
| Nomura Holdings, Inc. | | 356,100 | 2,037,879 |
| OBIC Co. Ltd. | | 39,500 | 2,614,551 |
| Olympus Corp. | | 56,600 | 2,106,351 |
| Oracle Corp. Japan | | 22,500 | 1,903,849 |
| ORIX Corp. | | 246,500 | 4,238,226 |
| Panasonic Corp. | | 185,300 | 2,797,912 |
| Recruit Holdings Co. Ltd. | | 109,800 | 2,692,038 |
| Seven & i Holdings Co. Ltd. | | 55,500 | 2,236,898 |
| Shin-Etsu Chemical Co. Ltd. | | 35,500 | 3,743,874 |
| Shinsei Bank Ltd. | | 114,800 | 1,937,338 |
| Sony Corp. | | 61,100 | 2,556,100 |
| Sony Financial Holdings, Inc. | | 126,200 | 2,096,621 |
| Subaru Corp. | | 46,700 | 1,613,444 |
| Taiheiyo Cement Corp. | | 49,900 | 1,994,453 |
| Tokio Marine Holdings, Inc. | | 76,100 | 3,280,460 |
| Toyota Motor Corp. | | 127,600 | 7,914,528 |
|
| TOTAL JAPAN | | | 84,138,035 |
|
| Netherlands - 3.6% | | | |
| ING Groep NV (Certificaten Van Aandelen) | | 316,390 | 5,846,725 |
| Koninklijke Philips Electronics NV | | 60,400 | 2,461,478 |
| RELX NV | | 155,456 | 3,511,198 |
| Wolters Kluwer NV | | 41,955 | 2,056,504 |
|
| TOTAL NETHERLANDS | | | 13,875,905 |
|
| Norway - 1.5% | | | |
| Statoil ASA (a) | | 278,796 | 5,664,444 |
| Portugal - 0.6% | | | |
| Galp Energia SGPS SA Class B | | 124,067 | 2,306,530 |
| Spain - 4.1% | | | |
| Banco Santander SA (Spain) | | 1,208,830 | 8,195,040 |
| Banco Santander SA (Spain) rights 11/1/17 (b) | | 1,149,030 | 54,876 |
| CaixaBank SA | | 607,297 | 2,842,373 |
| Iberdrola SA | | 426,962 | 3,450,591 |
| Unicaja Banco SA | | 743,300 | 1,082,291 |
|
| TOTAL SPAIN | | | 15,625,171 |
|
| Sweden - 4.5% | | | |
| Alfa Laval AB | | 114,400 | 2,898,382 |
| Investor AB (B Shares) | | 78,042 | 3,867,771 |
| Nordea Bank AB | | 478,000 | 5,778,264 |
| Swedbank AB (A Shares) | | 156,442 | 3,883,183 |
| Telefonaktiebolaget LM Ericsson (B Shares) | | 155,300 | 977,315 |
|
| TOTAL SWEDEN | | | 17,404,915 |
|
| Switzerland - 9.3% | | | |
| Credit Suisse Group AG | | 285,372 | 4,497,131 |
| Lafargeholcim Ltd. (Reg.) | | 39,930 | 2,255,356 |
| Nestle SA (Reg. S) | | 74,857 | 6,298,358 |
| Novartis AG | | 136,938 | 11,294,550 |
| UBS Group AG | | 339,158 | 5,769,078 |
| Zurich Insurance Group AG | | 17,430 | 5,319,937 |
|
| TOTAL SWITZERLAND | | | 35,434,410 |
|
| United Kingdom - 15.7% | | | |
| AstraZeneca PLC (United Kingdom) | | 92,000 | 6,224,809 |
| Aviva PLC | | 494,942 | 3,319,654 |
| BAE Systems PLC | | 397,078 | 3,127,918 |
| BHP Billiton PLC | | 289,005 | 5,232,623 |
| BP PLC | | 1,525,547 | 10,347,267 |
| British American Tobacco PLC (United Kingdom) | | 41,417 | 2,675,945 |
| Bunzl PLC | | 104,556 | 3,256,409 |
| Compass Group PLC | | 145,591 | 3,196,351 |
| GlaxoSmithKline PLC | | 255,788 | 4,590,716 |
| HSBC Holdings PLC sponsored ADR | | 77,933 | 3,800,792 |
| Imperial Tobacco Group PLC | | 47,698 | 1,945,165 |
| Informa PLC | | 289,422 | 2,679,239 |
| Micro Focus International PLC | | 82,904 | 2,912,382 |
| Standard Chartered PLC (United Kingdom) (b) | | 371,353 | 3,701,067 |
| Standard Life PLC | | 571,609 | 3,262,966 |
|
| TOTAL UNITED KINGDOM | | | 60,273,303 |
|
| United States of America - 2.6% | | | |
| Amgen, Inc. | | 11,100 | 1,944,942 |
| ConocoPhillips Co. | | 73,900 | 3,779,985 |
| Edgewell Personal Care Co. (b) | | 12,500 | 811,625 |
| Molson Coors Brewing Co. Class B | | 12,800 | 1,035,136 |
| S&P Global, Inc. | | 14,400 | 2,253,168 |
|
| TOTAL UNITED STATES OF AMERICA | | | 9,824,856 |
|
| TOTAL COMMON STOCKS | | | |
| (Cost $341,482,659) | | | 376,207,271 |
|
| Nonconvertible Preferred Stocks - 0.5% | | | |
| Spain - 0.5% | | | |
| Grifols SA Class B | | | |
| (Cost $1,380,896) | | 85,300 | 2,003,504 |
|
| Money Market Funds - 3.3% | | | |
| Fidelity Cash Central Fund, 1.10% (c) | | 1,400,762 | 1,401,042 |
| Fidelity Securities Lending Cash Central Fund 1.11% (c)(d) | | 11,056,381 | 11,057,487 |
| TOTAL MONEY MARKET FUNDS | | | |
| (Cost $12,458,542) | | | 12,458,529 |
| TOTAL INVESTMENT IN SECURITIES - 102.1% | | | |
| (Cost $355,322,097) | | | 390,669,304 |
| NET OTHER ASSETS (LIABILITIES) - (2.1)% | | �� | (7,874,656) |
| NET ASSETS - 100% | | | $382,794,648 |
Categorizations in the Schedule of Investments are based on country or territory of incorporation.
Legend
(a) Security or a portion of the security is on loan at period end.
(b) Non-income producing
(c) Affiliated fund that is generally available only to investment companies and other accounts managed by Fidelity Investments. The rate quoted is the annualized seven-day yield of the fund at period end. A complete unaudited listing of the fund's holdings as of its most recent quarter end is available upon request. In addition, each Fidelity Central Fund's financial statements, which are not covered by the Fund's Report of Independent Registered Public Accounting Firm, are available on the SEC's website or upon request.
(d) Investment made with cash collateral received from securities on loan.
Affiliated Central Funds
Information regarding fiscal year to date income earned by the Fund from investments in Fidelity Central Funds is as follows:
| Fund | Income earned |
| Fidelity Cash Central Fund | $14,718 |
| Fidelity Securities Lending Cash Central Fund | 181,569 |
| Total | $196,287 |
Investment Valuation
The following is a summary of the inputs used, as of October 31, 2017, involving the Fund's assets and liabilities carried at fair value. The inputs or methodology used for valuing securities may not be an indication of the risk associated with investing in those securities. For more information on valuation inputs, and their aggregation into the levels used below, please refer to the Investment Valuation section in the accompanying Notes to Financial Statements.
| | Valuation Inputs at Reporting Date: |
| Description | Total | Level 1 | Level 2 | Level 3 |
| Investments in Securities: | | | | |
| Equities: | | | | |
| Consumer Discretionary | $24,148,093 | $9,266,109 | $14,881,984 | $-- |
| Consumer Staples | 20,085,994 | 3,791,926 | 16,294,068 | -- |
| Energy | 34,577,660 | 6,086,515 | 28,491,145 | -- |
| Financials | 136,800,292 | 78,163,540 | 58,636,752 | -- |
| Health Care | 44,395,080 | 6,789,122 | 37,605,958 | -- |
| Industrials | 46,517,619 | 31,385,615 | 15,132,004 | -- |
| Information Technology | 23,635,644 | 11,270,445 | 12,365,199 | -- |
| Materials | 30,210,279 | 16,696,500 | 13,513,779 | -- |
| Real Estate | 3,759,155 | 3,759,155 | -- | -- |
| Telecommunication Services | 10,630,368 | -- | 10,630,368 | -- |
| Utilities | 3,450,591 | 3,450,591 | -- | -- |
| Money Market Funds | 12,458,529 | 12,458,529 | -- | -- |
| Total Investments in Securities: | $390,669,304 | $183,118,047 | $207,551,257 | $-- |
The following is a summary of transfers between Level 1 and Level 2 for the period ended October 31, 2017. Transfers are assumed to have occurred at the beginning of the period, and are primarily attributable to the valuation techniques used for foreign equity securities, as discussed in the accompanying Notes to Financial Statements:
| Transfers | Total |
| Level 1 to Level 2 | $32,292,093 |
| Level 2 to Level 1 | $19,946,287 |
See accompanying notes which are an integral part of the financial statements.
Financial Statements
Statement of Assets and Liabilities
| | | October 31, 2017 |
| Assets | | |
Investment in securities, at value (including securities loaned of $10,454,924) — See accompanying schedule:
Unaffiliated issuers (cost $342,863,555) | $378,210,775 | |
| Fidelity Central Funds (cost $12,458,542) | 12,458,529 | |
| Total Investment in Securities (cost $355,322,097) | | $390,669,304 |
| Receivable for investments sold | | 193,793 |
| Receivable for fund shares sold | | 2,280,747 |
| Dividends receivable | | 1,382,794 |
| Distributions receivable from Fidelity Central Funds | | 10,006 |
| Prepaid expenses | | 830 |
| Other receivables | | 13,548 |
| Total assets | | 394,551,022 |
| Liabilities | | |
| Payable for investments purchased | $215,133 | |
| Payable for fund shares redeemed | 130,405 | |
| Accrued management fee | 212,299 | |
| Distribution and service plan fees payable | 7,567 | |
| Other affiliated payables | 67,044 | |
| Other payables and accrued expenses | 66,426 | |
| Collateral on securities loaned | 11,057,500 | |
| Total liabilities | | 11,756,374 |
| Net Assets | | $382,794,648 |
| Net Assets consist of: | | |
| Paid in capital | | $381,672,420 |
| Undistributed net investment income | | 7,489,052 |
| Accumulated undistributed net realized gain (loss) on investments and foreign currency transactions | | (41,701,871) |
| Net unrealized appreciation (depreciation) on investments and assets and liabilities in foreign currencies | | 35,335,047 |
| Net Assets | | $382,794,648 |
| Calculation of Maximum Offering Price | | |
| Class A: | | |
| Net Asset Value and redemption price per share ($8,150,574 ÷ 897,547 shares) | | $9.08 |
| Maximum offering price per share (100/94.25 of $9.08) | | $9.63 |
| Class M: | | |
| Net Asset Value and redemption price per share ($4,180,900 ÷ 461,364 shares) | | $9.06 |
| Maximum offering price per share (100/96.50 of $9.06) | | $9.39 |
| Class C: | | |
| Net Asset Value and offering price per share ($5,170,880 ÷ 572,193 shares)(a) | | $9.04 |
| International Value: | | |
| Net Asset Value, offering price and redemption price per share ($359,769,575 ÷ 39,573,666 shares) | | $9.09 |
| Class I: | | |
| Net Asset Value, offering price and redemption price per share ($5,522,719 ÷ 606,939 shares) | | $9.10 |
(a) Redemption price per share is equal to net asset value less any applicable contingent deferred sales charge.
See accompanying notes which are an integral part of the financial statements.
Statement of Operations
| | | Year ended October 31, 2017 |
| Investment Income | | |
| Dividends | | $12,349,696 |
| Income from Fidelity Central Funds | | 196,287 |
| Income before foreign taxes withheld | | 12,545,983 |
| Less foreign taxes withheld | | (951,887) |
| Total income | | 11,594,096 |
| Expenses | | |
| Management fee | | |
| Basic fee | $2,421,290 | |
| Performance adjustment | 1,657 | |
| Transfer agent fees | 582,522 | |
| Distribution and service plan fees | 82,932 | |
| Accounting and security lending fees | 181,588 | |
| Custodian fees and expenses | 82,572 | |
| Independent trustees' fees and expenses | 1,365 | |
| Registration fees | 75,068 | |
| Audit | 65,969 | |
| Legal | 3,656 | |
| Miscellaneous | 2,626 | |
| Total expenses before reductions | 3,501,245 | |
| Expense reductions | (37,945) | 3,463,300 |
| Net investment income (loss) | | 8,130,796 |
| Realized and Unrealized Gain (Loss) | | |
| Net realized gain (loss) on: | | |
| Investment securities: | | |
| Unaffiliated issuers | 565,454 | |
| Fidelity Central Funds | (1,737) | |
| Foreign currency transactions | (45,599) | |
| Total net realized gain (loss) | | 518,118 |
| Change in net unrealized appreciation (depreciation) on: | | |
| Investment securities: | | |
| Unaffiliated issuers | 54,024,866 | |
| Fidelity Central Funds | (13) | |
| Assets and liabilities in foreign currencies | 32,843 | |
| Total change in net unrealized appreciation (depreciation) | | 54,057,696 |
| Net gain (loss) | | 54,575,814 |
| Net increase (decrease) in net assets resulting from operations | | $62,706,610 |
See accompanying notes which are an integral part of the financial statements.
Statement of Changes in Net Assets
| | Year ended October 31, 2017 | Year ended October 31, 2016 |
| Increase (Decrease) in Net Assets | | |
| Operations | | |
| Net investment income (loss) | $8,130,796 | $7,988,662 |
| Net realized gain (loss) | 518,118 | (3,305,724) |
| Change in net unrealized appreciation (depreciation) | 54,057,696 | (18,037,363) |
| Net increase (decrease) in net assets resulting from operations | 62,706,610 | (13,354,425) |
| Distributions to shareholders from net investment income | (8,124,122) | (4,084,383) |
| Distributions to shareholders from net realized gain | (457,331) | – |
| Total distributions | (8,581,453) | (4,084,383) |
| Share transactions - net increase (decrease) | 1,925,222 | 56,799,318 |
| Redemption fees | 1,612 | 637 |
| Total increase (decrease) in net assets | 56,051,991 | 39,361,147 |
| Net Assets | | |
| Beginning of period | 326,742,657 | 287,381,510 |
| End of period | $382,794,648 | $326,742,657 |
| Other Information | | |
| Undistributed net investment income end of period | $7,489,052 | $7,482,378 |
See accompanying notes which are an integral part of the financial statements.
Financial Highlights
Fidelity International Value Fund Class A
| Years ended October 31, | 2017 | 2016 | 2015 | 2014 | 2013 |
| Selected Per–Share Data | | | | | |
| Net asset value, beginning of period | $7.78 | $8.27 | $8.62 | $8.96 | $7.39 |
| Income from Investment Operations | | | | | |
| Net investment income (loss)A | .17 | .17 | .13 | .31B | .17 |
| Net realized and unrealized gain (loss) | 1.31 | (.57) | (.20) | (.47) | 1.64 |
| Total from investment operations | 1.48 | (.40) | (.07) | (.16) | 1.81 |
| Distributions from net investment income | (.17) | (.09) | (.28) | (.17) | (.20) |
| Distributions from net realized gain | (.01) | – | – | (.01) | (.04) |
| Total distributions | (.18) | (.09) | (.28) | (.18) | (.24) |
| Redemption fees added to paid in capitalA,C | – | – | – | – | – |
| Net asset value, end of period | $9.08 | $7.78 | $8.27 | $8.62 | $8.96 |
| Total ReturnD,E | 19.36% | (4.91)% | (.81)% | (1.76)% | 25.24% |
| Ratios to Average Net AssetsF,G | | | | | |
| Expenses before reductions | 1.33% | 1.40% | 1.37% | 1.32% | 1.39% |
| Expenses net of fee waivers, if any | 1.33% | 1.40% | 1.37% | 1.32% | 1.39% |
| Expenses net of all reductions | 1.32% | 1.39% | 1.36% | 1.32% | 1.36% |
| Net investment income (loss) | 2.01% | 2.19% | 1.58% | 3.44%B | 2.08% |
| Supplemental Data | | | | | |
| Net assets, end of period (000 omitted) | $8,151 | $7,717 | $8,956 | $6,296 | $6,191 |
| Portfolio turnover rateH | 50% | 47% | 44% | 69% | 79% |
A Calculated based on average shares outstanding during the period.
B Net Investment income per share reflects a large, non-recurring dividend which amounted to $.14 per share. Excluding this non-recurring dividend, the ratio of net investment income (loss) to average net assets would have been 1.90%.
C Amount represents less than $.005 per share.
D Total returns would have been lower if certain expenses had not been reduced during the applicable periods shown.
E Total returns do not include the effect of the sales charges.
F Fees and expenses of any underlying Fidelity Central Funds are not included in the Fund's expense ratio. The Fund indirectly bears its proportionate share of the expenses of any underlying Fidelity Central Funds.
G Expense ratios reflect operating expenses of the class. Expenses before reductions do not reflect amounts reimbursed by the investment adviser or reductions from brokerage service arrangements or reductions from other expense offset arrangements and do not represent the amount paid by the class during periods when reimbursements or reductions occur. Expenses net of fee waivers reflect expenses after reimbursement by the investment adviser but prior to reductions from brokerage service arrangements or other expense offset arrangements. Expenses net of all reductions represent the net expenses paid by the class.
H Amount does not include the portfolio activity of any underlying Fidelity Central Funds.
See accompanying notes which are an integral part of the financial statements.
Fidelity International Value Fund Class M
| Years ended October 31, | 2017 | 2016 | 2015 | 2014 | 2013 |
| Selected Per–Share Data | | | | | |
| Net asset value, beginning of period | $7.76 | $8.25 | $8.60 | $8.94 | $7.38 |
| Income from Investment Operations | | | | | |
| Net investment income (loss)A | .14 | .15 | .11 | .28B | .15 |
| Net realized and unrealized gain (loss) | 1.31 | (.58) | (.20) | (.46) | 1.64 |
| Total from investment operations | 1.45 | (.43) | (.09) | (.18) | 1.79 |
| Distributions from net investment income | (.14) | (.06) | (.26) | (.15) | (.19) |
| Distributions from net realized gain | (.01) | – | – | (.01) | (.04) |
| Total distributions | (.15) | (.06) | (.26) | (.16) | (.23) |
| Redemption fees added to paid in capitalA,C | – | – | – | – | – |
| Net asset value, end of period | $9.06 | $7.76 | $8.25 | $8.60 | $8.94 |
| Total ReturnD,E | 19.04% | (5.24)% | (1.09)% | (1.99)% | 24.86% |
| Ratios to Average Net AssetsF,G | | | | | |
| Expenses before reductions | 1.64% | 1.70% | 1.66% | 1.59% | 1.66% |
| Expenses net of fee waivers, if any | 1.64% | 1.70% | 1.66% | 1.59% | 1.65% |
| Expenses net of all reductions | 1.63% | 1.69% | 1.65% | 1.59% | 1.63% |
| Net investment income (loss) | 1.70% | 1.89% | 1.29% | 3.17%B | 1.81% |
| Supplemental Data | | | | | |
| Net assets, end of period (000 omitted) | $4,181 | $3,703 | $4,086 | $3,604 | $3,758 |
| Portfolio turnover rateH | 50% | 47% | 44% | 69% | 79% |
A Calculated based on average shares outstanding during the period.
B Net Investment income per share reflects a large, non-recurring dividend which amounted to $.14 per share. Excluding this non-recurring dividend, the ratio of net investment income (loss) to average net assets would have been 1.64%.
C Amount represents less than $.005 per share.
D Total returns would have been lower if certain expenses had not been reduced during the applicable periods shown.
E Total returns do not include the effect of the sales charges.
F Fees and expenses of any underlying Fidelity Central Funds are not included in the Fund's expense ratio. The Fund indirectly bears its proportionate share of the expenses of any underlying Fidelity Central Funds.
G Expense ratios reflect operating expenses of the class. Expenses before reductions do not reflect amounts reimbursed by the investment adviser or reductions from brokerage service arrangements or reductions from other expense offset arrangements and do not represent the amount paid by the class during periods when reimbursements or reductions occur. Expenses net of fee waivers reflect expenses after reimbursement by the investment adviser but prior to reductions from brokerage service arrangements or other expense offset arrangements. Expenses net of all reductions represent the net expenses paid by the class.
H Amount does not include the portfolio activity of any underlying Fidelity Central Funds.
See accompanying notes which are an integral part of the financial statements.
Fidelity International Value Fund Class C
| Years ended October 31, | 2017 | 2016 | 2015 | 2014 | 2013 |
| Selected Per–Share Data | | | | | |
| Net asset value, beginning of period | $7.75 | $8.23 | $8.59 | $8.93 | $7.38 |
| Income from Investment Operations | | | | | |
| Net investment income (loss)A | .10 | .11 | .07 | .24B | .11 |
| Net realized and unrealized gain (loss) | 1.31 | (.57) | (.20) | (.45) | 1.63 |
| Total from investment operations | 1.41 | (.46) | (.13) | (.21) | 1.74 |
| Distributions from net investment income | (.11) | (.02) | (.23) | (.11) | (.15) |
| Distributions from net realized gain | (.01) | – | – | (.01) | (.04) |
| Total distributions | (.12) | (.02) | (.23) | (.13)C | (.19) |
| Redemption fees added to paid in capitalA,D | – | – | – | – | – |
| Net asset value, end of period | $9.04 | $7.75 | $8.23 | $8.59 | $8.93 |
| Total ReturnE,F | 18.41% | (5.61)% | (1.58)% | (2.43)% | 24.17% |
| Ratios to Average Net AssetsG,H | | | | | |
| Expenses before reductions | 2.12% | 2.17% | 2.15% | 2.07% | 2.14% |
| Expenses net of fee waivers, if any | 2.12% | 2.17% | 2.14% | 2.07% | 2.14% |
| Expenses net of all reductions | 2.11% | 2.17% | 2.14% | 2.07% | 2.11% |
| Net investment income (loss) | 1.22% | 1.42% | .81% | 2.69%B | 1.33% |
| Supplemental Data | | | | | |
| Net assets, end of period (000 omitted) | $5,171 | $4,168 | $4,502 | $3,647 | $3,231 |
| Portfolio turnover rateI | 50% | 47% | 44% | 69% | 79% |
A Calculated based on average shares outstanding during the period.
B Net Investment income per share reflects a large, non-recurring dividend which amounted to $.14 per share. Excluding this non-recurring dividend, the ratio of net investment income (loss) to average net assets would have been 1.15%.
C Total distributions of $.13 per share is comprised of distributions from net investment income of $.111 and distributions from net realized gain of $.014 per share.
D Amount represents less than $.005 per share.
E Total returns would have been lower if certain expenses had not been reduced during the applicable periods shown.
F Total returns do not include the effect of the contingent deferred sales charge.
G Fees and expenses of any underlying Fidelity Central Funds are not included in the Fund's expense ratio. The Fund indirectly bears its proportionate share of the expenses of any underlying Fidelity Central Funds.
H Expense ratios reflect operating expenses of the class. Expenses before reductions do not reflect amounts reimbursed by the investment adviser or reductions from brokerage service arrangements or reductions from other expense offset arrangements and do not represent the amount paid by the class during periods when reimbursements or reductions occur. Expenses net of fee waivers reflect expenses after reimbursement by the investment adviser but prior to reductions from brokerage service arrangements or other expense offset arrangements. Expenses net of all reductions represent the net expenses paid by the class.
I Amount does not include the portfolio activity of any underlying Fidelity Central Funds.
See accompanying notes which are an integral part of the financial statements.
Fidelity International Value Fund
| Years ended October 31, | 2017 | 2016 | 2015 | 2014 | 2013 |
| Selected Per–Share Data | | | | | |
| Net asset value, beginning of period | $7.79 | $8.29 | $8.64 | $8.97 | $7.40 |
| Income from Investment Operations | | | | | |
| Net investment income (loss)A | .20 | .20 | .16 | .34B | .19 |
| Net realized and unrealized gain (loss) | 1.31 | (.58) | (.19) | (.46) | 1.65 |
| Total from investment operations | 1.51 | (.38) | (.03) | (.12) | 1.84 |
| Distributions from net investment income | (.20) | (.12) | (.32) | (.20) | (.22) |
| Distributions from net realized gain | (.01) | – | – | (.01) | (.04) |
| Total distributions | (.21) | (.12) | (.32) | (.21) | (.27)C |
| Redemption fees added to paid in capitalA,D | – | – | – | – | – |
| Net asset value, end of period | $9.09 | $7.79 | $8.29 | $8.64 | $8.97 |
| Total ReturnE | 19.83% | (4.69)% | (.41)% | (1.34)% | 25.57% |
| Ratios to Average Net AssetsF,G | | | | | |
| Expenses before reductions | .97% | 1.03% | 1.02% | .96% | 1.05% |
| Expenses net of fee waivers, if any | .97% | 1.03% | 1.02% | .96% | 1.05% |
| Expenses net of all reductions | .96% | 1.03% | 1.01% | .95% | 1.02% |
| Net investment income (loss) | 2.36% | 2.56% | 1.93% | 3.80%B | 2.41% |
| Supplemental Data | | | | | |
| Net assets, end of period (000 omitted) | $359,770 | $309,199 | $267,567 | $192,789 | $181,568 |
| Portfolio turnover rateH | 50% | 47% | 44% | 69% | 79% |
A Calculated based on average shares outstanding during the period.
B Net Investment income per share reflects a large, non-recurring dividend which amounted to $.14 per share. Excluding this non-recurring dividend, the ratio of net investment income (loss) to average net assets would have been 2.27%.
C Total distributions of $.27 per share is comprised of distributions from net investment income of $.223 and distributions from net realized gain of $.042 per share.
D Amount represents less than $.005 per share.
E Total returns would have been lower if certain expenses had not been reduced during the applicable periods shown.
F Fees and expenses of any underlying Fidelity Central Funds are not included in the Fund's expense ratio. The Fund indirectly bears its proportionate share of the expenses of any underlying Fidelity Central Funds.
G Expense ratios reflect operating expenses of the class. Expenses before reductions do not reflect amounts reimbursed by the investment adviser or reductions from brokerage service arrangements or reductions from other expense offset arrangements and do not represent the amount paid by the class during periods when reimbursements or reductions occur. Expenses net of fee waivers reflect expenses after reimbursement by the investment adviser but prior to reductions from brokerage service arrangements or other expense offset arrangements. Expenses net of all reductions represent the net expenses paid by the class.
H Amount does not include the portfolio activity of any underlying Fidelity Central Funds.
See accompanying notes which are an integral part of the financial statements.
Fidelity International Value Fund Class I
| Years ended October 31, | 2017 | 2016 | 2015 | 2014 | 2013 |
| Selected Per–Share Data | | | | | |
| Net asset value, beginning of period | $7.80 | $8.29 | $8.65 | $8.98 | $7.41 |
| Income from Investment Operations | | | | | |
| Net investment income (loss)A | .19 | .19 | .15 | .33B | .19 |
| Net realized and unrealized gain (loss) | 1.31 | (.58) | (.19) | (.45) | 1.65 |
| Total from investment operations | 1.50 | (.39) | (.04) | (.12) | 1.84 |
| Distributions from net investment income | (.19) | (.10) | (.32) | (.19) | (.23) |
| Distributions from net realized gain | (.01) | – | – | (.01) | (.04) |
| Total distributions | (.20) | (.10) | (.32) | (.21)C | (.27) |
| Redemption fees added to paid in capitalA,D | – | – | – | – | – |
| Net asset value, end of period | $9.10 | $7.80 | $8.29 | $8.65 | $8.98 |
| Total ReturnE | 19.68% | (4.81)% | (.53)% | (1.41)% | 25.64% |
| Ratios to Average Net AssetsF,G | | | | | |
| Expenses before reductions | 1.10% | 1.17% | 1.14% | 1.05% | 1.07% |
| Expenses net of fee waivers, if any | 1.10% | 1.17% | 1.14% | 1.05% | 1.07% |
| Expenses net of all reductions | 1.09% | 1.16% | 1.13% | 1.04% | 1.04% |
| Net investment income (loss) | 2.23% | 2.42% | 1.81% | 3.71%B | 2.39% |
| Supplemental Data | | | | | |
| Net assets, end of period (000 omitted) | $5,523 | $1,955 | $1,969 | $1,310 | $239 |
| Portfolio turnover rateH | 50% | 47% | 44% | 69% | 79% |
A Calculated based on average shares outstanding during the period.
B Net Investment income per share reflects a large, non-recurring dividend which amounted to $.14 per share. Excluding this non-recurring dividend, the ratio of net investment income (loss) to average net assets would have been 2.18%.
C Total distributions of $.21 per share is comprised of distributions from net investment income of $.191 and distributions from net realized gain of $0.14 per share.
D Amount represents less than $.005 per share.
E Total returns would have been lower if certain expenses had not been reduced during the applicable periods shown.
F Fees and expenses of any underlying Fidelity Central Funds are not included in the Fund's expense ratio. The Fund indirectly bears its proportionate share of the expenses of any underlying Fidelity Central Funds.
G Expense ratios reflect operating expenses of the class. Expenses before reductions do not reflect amounts reimbursed by the investment adviser or reductions from brokerage service arrangements or reductions from other expense offset arrangements and do not represent the amount paid by the class during periods when reimbursements or reductions occur. Expenses net of fee waivers reflect expenses after reimbursement by the investment adviser but prior to reductions from brokerage service arrangements or other expense offset arrangements. Expenses net of all reductions represent the net expenses paid by the class.
H Amount does not include the portfolio activity of any underlying Fidelity Central Funds.
See accompanying notes which are an integral part of the financial statements.
Notes to Financial Statements
For the period ended October 31, 2017
1. Organization.
Fidelity International Value Fund (the Fund) is a fund of Fidelity Investment Trust (the Trust) and is authorized to issue an unlimited number of shares. The Trust is registered under the Investment Company Act of 1940, as amended (the 1940 Act), as an open-end management investment company organized as a Massachusetts business trust. The Fund offers Class A, Class M (formerly Class T), Class C, International Value, and Class I shares, each of which has equal rights as to assets and voting privileges. Each class has exclusive voting rights with respect to matters that affect that class.
After the close of business on June 24, 2016, all outstanding Class B shares were converted to Class A shares. All prior fiscal period dollar and share amounts for Class B presented in the Notes to Financial Statements are for the period November 1, 2015 through June 24, 2016.
2. Investments in Fidelity Central Funds.
The Fund invests in Fidelity Central Funds, which are open-end investment companies generally available only to other investment companies and accounts managed by the investment adviser and its affiliates. The Fund's Schedule of Investments lists each of the Fidelity Central Funds held as of period end, if any, as an investment of the Fund, but does not include the underlying holdings of each Fidelity Central Fund. As an Investing Fund, the Fund indirectly bears its proportionate share of the expenses of the underlying Fidelity Central Funds.
The Money Market Central Funds seek preservation of capital and current income and are managed by Fidelity Investments Money Management, Inc. (FIMM), an affiliate of the investment adviser. Annualized expenses of the Money Market Central Funds as of their most recent shareholder report date are less than .005%.
A complete unaudited list of holdings for each Fidelity Central Fund is available upon request or at the Securities and Exchange Commission (the SEC) website at www.sec.gov. In addition, the financial statements of the Fidelity Central Funds, which are not covered by the Fund's Report of Independent Registered Public Accounting Firm, are available on the SEC website or upon request.
3. Significant Accounting Policies.
The Fund is an investment company and applies the accounting and reporting guidance of the Financial Accounting Standards Board (FASB) Accounting Standards Codification Topic 946 Financial Services – Investments Companies. The financial statements have been prepared in conformity with accounting principles generally accepted in the United States of America (GAAP), which require management to make certain estimates and assumptions at the date of the financial statements. Actual results could differ from those estimates. Subsequent events, if any, through the date that the financial statements were issued have been evaluated in the preparation of the financial statements. The following summarizes the significant accounting policies of the Fund:
Investment Valuation. Investments are valued as of 4:00 p.m. Eastern time on the last calendar day of the period. The Board of Trustees (the Board) has delegated the day to day responsibility for the valuation of the Fund's investments to the Fair Value Committee (the Committee) established by the Fund's investment adviser. In accordance with valuation policies and procedures approved by the Board, the Fund attempts to obtain prices from one or more third party pricing vendors or brokers to value its investments. When current market prices, quotations or currency exchange rates are not readily available or reliable, investments will be fair valued in good faith by the Committee, in accordance with procedures adopted by the Board. Factors used in determining fair value vary by investment type and may include market or investment specific events. The frequency with which these procedures are used cannot be predicted and they may be utilized to a significant extent. The Committee oversees the Fund's valuation policies and procedures and reports to the Board on the Committee's activities and fair value determinations. The Board monitors the appropriateness of the procedures used in valuing the Fund's investments and ratifies the fair value determinations of the Committee.
The Fund categorizes the inputs to valuation techniques used to value its investments into a disclosure hierarchy consisting of three levels as shown below:
- Level 1 – quoted prices in active markets for identical investments
- Level 2 – other significant observable inputs (including quoted prices for similar investments, interest rates, prepayment speeds, etc.)
- Level 3 – unobservable inputs (including the Fund's own assumptions based on the best information available)
Valuation techniques used to value the Fund's investments by major category are as follows:
Equity securities, including restricted securities, for which market quotations are readily available, are valued at the last reported sale price or official closing price as reported by a third party pricing vendor on the primary market or exchange on which they are traded and are categorized as Level 1 in the hierarchy. In the event there were no sales during the day or closing prices are not available, securities are valued at the last quoted bid price or may be valued using the last available price and are generally categorized as Level 2 in the hierarchy. For foreign equity securities, when market or security specific events arise, comparisons to the valuation of American Depositary Receipts (ADRs), futures contracts, Exchange-Traded Funds (ETFs) and certain indexes as well as quoted prices for similar securities may be used and would be categorized as Level 2 in the hierarchy. Utilizing these techniques may result in transfers between Level 1 and Level 2. For equity securities, including restricted securities, where observable inputs are limited, assumptions about market activity and risk are used and these securities may be categorized as Level 3 in the hierarchy.
Investments in open-end mutual funds, including the Fidelity Central Funds, are valued at their closing net asset value (NAV) each business day and are categorized as Level 1 in the hierarchy
Changes in valuation techniques may result in transfers in or out of an assigned level within the disclosure hierarchy. The aggregate value of investments by input level as of October 31, 2017, including information on transfers between Levels 1 and 2, is included at the end of the Fund's Schedule of Investments.
Foreign Currency. The Fund may use foreign currency contracts to facilitate transactions in foreign-denominated securities. Gains and losses from these transactions may arise from changes in the value of the foreign currency or if the counterparties do not perform under the contracts' terms.
Foreign-denominated assets, including investment securities, and liabilities are translated into U.S. dollars at the exchange rates at period end. Purchases and sales of investment securities, income and dividends received and expenses denominated in foreign currencies are translated into U.S. dollars at the exchange rate in effect on the transaction date.
The effects of exchange rate fluctuations on investments are included with the net realized and unrealized gain (loss) on investment securities. Other foreign currency transactions resulting in realized and unrealized gain (loss) are disclosed separately.
Investment Transactions and Income. For financial reporting purposes, the Fund's investment holdings and NAV include trades executed through the end of the last business day of the period. The NAV per share for processing shareholder transactions is calculated as of the close of business of the New York Stock Exchange (NYSE), normally 4:00 p.m. Eastern time and includes trades executed through the end of the prior business day. Gains and losses on securities sold are determined on the basis of identified cost. Dividend income is recorded on the ex-dividend date, except for certain dividends from foreign securities where the ex-dividend date may have passed, which are recorded as soon as the Fund is informed of the ex-dividend date. Non-cash dividends included in dividend income, if any, are recorded at the fair market value of the securities received. Income and capital gain distributions from Fidelity Central Funds, if any, are recorded on the ex-dividend date. Certain distributions received by the Fund represent a return of capital or capital gain. The Fund determines the components of these distributions subsequent to the ex-dividend date, based upon receipt of tax filings or other correspondence relating to the underlying investment. These distributions are recorded as a reduction of cost of investments and/or as a realized gain. Investment income is recorded net of foreign taxes withheld where recovery of such taxes is uncertain.
Class Allocations and Expenses. Investment income, realized and unrealized capital gains and losses, common expenses of the Fund, and certain fund-level expense reductions, if any, are allocated daily on a pro-rata basis to each class based on the relative net assets of each class to the total net assets of the Fund. Each class differs with respect to transfer agent and distribution and service plan fees incurred. Certain expense reductions may also differ by class. For the reporting period, the allocated portion of income and expenses to each class as a percent of its average net assets may vary due to the timing of recording these transactions in relation to fluctuating net assets of the classes. Expenses directly attributable to a fund are charged to that fund. Expenses attributable to more than one fund are allocated among the respective funds on the basis of relative net assets or other appropriate methods. Expense estimates are accrued in the period to which they relate and adjustments are made when actual amounts are known.
Income Tax Information and Distributions to Shareholders. Each year, the Fund intends to qualify as a regulated investment company under Subchapter M of the Internal Revenue Code, including distributing substantially all of its taxable income and realized gains. As a result, no provision for U.S. Federal income taxes is required. As of October 31, 2017, the Fund did not have any unrecognized tax benefits in the financial statements; nor is the Fund aware of any tax positions for which it is reasonably possible that the total amounts of unrecognized tax benefits will significantly change in the next twelve months. The Fund files a U.S. federal tax return, in addition to state and local tax returns as required. The Fund's federal income tax returns are subject to examination by the Internal Revenue Service (IRS) for a period of three fiscal years after they are filed. State and local tax returns may be subject to examination for an additional fiscal year depending on the jurisdiction. Foreign taxes are provided for based on the Fund's understanding of the tax rules and rates that exist in the foreign markets in which it invests.
Distributions are declared and recorded on the ex-dividend date. Income dividends and capital gain distributions are declared separately for each class. Income and capital gain distributions are determined in accordance with income tax regulations, which may differ from GAAP.
Capital accounts within the financial statements are adjusted for permanent book-tax differences. These adjustments have no impact on net assets or the results of operations. Capital accounts are not adjusted for temporary book-tax differences which will reverse in a subsequent period.
Book-tax differences are primarily due to foreign currency transactions, passive foreign investment companies (PFIC), partnerships, capital loss carryforwards, expiring capital loss carryforwards, and losses deferred due to wash sales.
As of period end, the cost and unrealized appreciation (depreciation) in securities, and derivatives if applicable, for federal income tax purposes were as follows:
| Gross unrealized appreciation | $46,378,499 |
| Gross unrealized depreciation | (12,928,378) |
| Net unrealized appreciation (depreciation) | $33,450,121 |
| Tax Cost | $357,219,183 |
The tax-based components of distributable earnings as of period end were as follows:
| Undistributed ordinary income | $8,222,478 |
| Capital loss carryforward | $(40,538,521) |
| Net unrealized appreciation (depreciation) on securities and other investments | $33,438,270 |
Capital loss carryforwards are only available to offset future capital gains of the Fund to the extent provided by regulations and may be limited. Under the Regulated Investment Company Modernization Act of 2010 (the Act), the Fund is permitted to carry forward capital losses incurred in taxable years beginning after December 22, 2010 for an unlimited period and such capital losses are required to be used prior to any losses that expire. The capital loss carryforward information presented below, including any applicable limitation, is estimated as of fiscal period end and is subject to adjustment.
| Fiscal year of expiration | |
| 2018 | $ (3,571,319) |
| 2019 | (31,368,797) |
| Total with expiration | $(34,940,116) |
| No expiration | |
| Short-term | $(1,634,534) |
| Long-term | (3,963,871) |
| Total no expiration | $(5,598,405) |
| Total capital loss carryforward | $(40,538,521) |
The tax character of distributions paid was as follows:
| | October 31, 2017 | October 31, 2016 |
| Ordinary Income | $8,581,453 | $ 4,084,383 |
Short-Term Trading (Redemption) Fees. Shares held by investors in the Fund less than 30 days may have been subject to a redemption fee equal to 1.00% of the NAV of shares redeemed. All redemption fees, which reduce the proceeds of the shareholder redemption, are retained by the Fund and accounted for as an addition to paid in capital. In November 2017, the Board of Trustees approved the elimination of these redemption fees effective December 18, 2017.
4. Purchases and Sales of Investments.
Purchases and sales of securities, other than short-term securities aggregated $172,260,962 and $172,307,064, respectively.
5. Fees and Other Transactions with Affiliates.
Management Fee. Fidelity Management & Research Company (the investment adviser) and its affiliates provide the Fund with investment management related services for which the Fund pays a monthly management fee. The management fee is the sum of an individual fund fee rate that is based on an annual rate of .45% of the Fund's average net assets and an annualized group fee rate that averaged .25% during the period. The group fee rate is based upon the average net assets of all the mutual funds advised by the investment adviser, including any mutual funds previously advised by the investment adviser that are currently advised by Fidelity SelectCo, LLC, an affiliate of the investment adviser. The group fee rate decreases as assets under management increase and increases as assets under management decrease. In addition, the management fee is subject to a performance adjustment (up to a maximum of +/- .20% of the Fund's average net assets over a 36 month performance period). The upward or downward adjustment to the management fee is based on the relative investment performance of International Value as compared to its benchmark index, the MSCI EAFE Value Index, over the same 36 month performance period. For the reporting period, the total annual management fee rate, including the performance adjustment, was .69% of the Fund's average net assets. The performance adjustment included in the management fee rate may be higher or lower than the maximum performance adjustment rate due to the difference between the average net assets for the reporting and performance periods.
Distribution and Service Plan Fees. In accordance with Rule 12b-1 of the 1940 Act, the Fund has adopted separate Distribution and Service Plans for each class of shares. Certain classes pay Fidelity Distributors Corporation (FDC), an affiliate of the investment adviser, separate Distribution and Service Fees, each of which is based on an annual percentage of each class' average net assets. In addition, FDC may pay financial intermediaries for selling shares of the Fund and providing shareholder support services. For the period, the Distribution and Service Fee rates, total fees and amounts retained by FDC were as follows:
| | Distribution
Fee | Service
Fee | Total Fees | Retained
by FDC |
| Class A | -% | .25% | $18,763 | $– |
| Class M | .25% | .25% | 19,350 | – |
| Class C | .75% | .25% | 44,819 | 4,912 |
| | | | $82,932 | $4,912 |
Sales Load. FDC may receive a front-end sales charge of up to 5.75% for selling Class A shares and 3.50% for selling Class M shares, some of which is paid to financial intermediaries for selling shares of the Fund. Depending on the holding period, FDC may receive contingent deferred sales charges levied on Class A, Class M and Class C redemptions. The deferred sales charges are 1.00% for Class C shares, 1.00% for certain purchases of Class A shares and .25% for certain purchases of Class M shares.
For the period, sales charge amounts retained by FDC were as follows:
| | Retained
by FDC |
| Class A | $4,121 |
| Class M | 863 |
| Class C(a) | 612 |
| | $5,596 |
(a) When Class C shares are initially sold, FDC pays commissions from its own resources to financial intermediaries through which the sales are made.
Transfer Agent Fees. Fidelity Investments Institutional Operations Company, Inc., (FIIOC), an affiliate of the investment adviser, is the transfer, dividend disbursing and shareholder servicing agent for each class of the Fund. FIIOC receives account fees and asset-based fees that vary according to the account size and type of account of the shareholders of the respective classes of the Fund. FIIOC pays for typesetting, printing and mailing of shareholder reports, except proxy statements.
For the period, transfer agent fees for each class were as follows:
| | Amount | % of
Class-Level Average
Net Assets |
| Class A | $19,912 | .27 |
| Class M | 12,625 | .33 |
| Class C | 13,645 | .30 |
| International Value | 525,662 | .16 |
| Class I | 10,678 | .29 |
| | $582,522 | |
Accounting and Security Lending Fees. Fidelity Service Company, Inc. (FSC), an affiliate of the investment adviser, maintains the Fund's accounting records. The accounting fee is based on the level of average net assets for each month. Under a separate contract, FSC administers the security lending program. The security lending fee is based on the number and duration of lending transactions.
Brokerage Commissions. The Fund placed a portion of its portfolio transactions with brokerage firms which are affiliates of the investment adviser. Brokerage commissions are included in net realized gain (loss) and change in net unrealized appreciation (depreciation) in the Statement of Operations. The commissions paid to these affiliated firms were $179 for the period.
Interfund Trades. The Fund may purchase from or sell securities to other Fidelity Funds under procedures adopted by the Board. The procedures have been designed to ensure these interfund trades are executed in accordance with Rule 17a-7 of the 1940 Act. Interfund trades are included within the respective purchases and sales amounts shown in the Purchases and Sales of Investments note.
6. Committed Line of Credit.
The Fund participates with other funds managed by the investment adviser or an affiliate in a $4.25 billion credit facility (the "line of credit") to be utilized for temporary or emergency purposes to fund shareholder redemptions or for other short-term liquidity purposes. The Fund has agreed to pay commitment fees on its pro-rata portion of the line of credit, which amounted to $1,098 and is reflected in Miscellaneous expenses on the Statement of Operations. During the period, the Fund did not borrow on this line of credit.
7. Security Lending.
The Fund lends portfolio securities through a lending agent from time to time in order to earn additional income. For equity securities, a lending agent is used and may loan securities to certain qualified borrowers, including Fidelity Capital Markets (FCM), a broker-dealer affiliated with the Fund. On the settlement date of the loan, the Fund receives collateral (in the form of U.S. Treasury obligations, letters of credit and/or cash) against the loaned securities and maintains collateral in an amount not less than 100% of the market value of the loaned securities during the period of the loan. The market value of the loaned securities is determined at the close of business of the Fund and any additional required collateral is delivered to the Fund on the next business day. The Fund or borrower may terminate the loan at any time, and if the borrower defaults on its obligation to return the securities loaned because of insolvency or other reasons, the Fund may apply collateral received from the borrower against the obligation. The Fund may experience delays and costs in recovering the securities loaned. Any cash collateral received is invested in the Fidelity Securities Lending Cash Central Fund. The value of loaned securities and cash collateral at period end are disclosed on the Fund's Statement of Assets and Liabilities. Security lending income represents the income earned on investing cash collateral, less rebates paid to borrowers and any lending agent fees associated with the loan, plus any premium payments received for lending certain types of securities. Security lending income is presented in the Statement of Operations as a component of income from Fidelity Central Funds. Total security lending income during the period amounted to $181,569, including $36 from securities loaned to FCM.
8. Expense Reductions.
Commissions paid to certain brokers with whom the investment adviser, or its affiliates, places trades on behalf of the Fund include an amount in addition to trade execution, which may be rebated back to the Fund to offset certain expenses. This amount totaled $35,011 for the period.
In addition, during the period the investment adviser reimbursed and/or waived a portion of fund-level operating expenses in the amount of $2,934.
9. Distributions to Shareholders.
Distributions to shareholders of each class were as follows:
| | Year ended
October 31, 2017 | Year ended October 31, 2016 |
| From net investment income | | |
| Class A | $160,715 | $95,726 |
| Class M | 64,948 | 30,318 |
| Class B | – | 141 |
| Class C | 57,557 | 10,293 |
| International Value | 7,786,373 | 3,924,604 |
| Class I | 54,529 | 23,301 |
| Total | $8,124,122 | $4,084,383 |
| From net realized gain | | |
| Class A | $10,650 | $– |
| Class M | 5,031 | – |
| Class C | 5,917 | – |
| International Value | 432,576 | – |
| Class I | 3,157 | – |
| Total | $457,331 | $– |
10. Share Transactions.
Share transactions for each class were as follows and may contain automatic conversions between classes or exchanges between affiliated funds:
| | Shares | Shares | Dollars | Dollars |
| | Year ended October 31, 2017 | Year ended October 31, 2016 | Year ended October 31, 2017 | Year ended October 31, 2016 |
| Class A | | | | |
| Shares sold | 276,572 | 238,095 | $2,327,962 | $1,848,202 |
| Reinvestment of distributions | 21,396 | 11,425 | 166,672 | 93,224 |
| Shares redeemed | (392,253) | (340,144) | (3,202,452) | (2,620,114) |
| Net increase (decrease) | (94,285) | (90,624) | $(707,818) | $(678,688) |
| Class M | | | | |
| Shares sold | 101,768 | 88,717 | $836,059 | $694,653 |
| Reinvestment of distributions | 8,935 | 3,669 | 69,695 | 29,980 |
| Shares redeemed | (126,227) | (110,449) | (1,023,584) | (851,756) |
| Net increase (decrease) | (15,524) | (18,063) | $(117,830) | $(127,123) |
| Class B | | | | |
| Shares sold | – | 2 | $– | $14 |
| Reinvestment of distributions | – | 15 | – | 124 |
| Shares redeemed | – | (36,263) | – | (277,663) |
| Net increase (decrease) | – | (36,246) | $– | $(277,525) |
| Class C | | | | |
| Shares sold | 120,429 | 105,656 | $1,017,626 | $808,615 |
| Reinvestment of distributions | 7,631 | 1,181 | 59,598 | 9,659 |
| Shares redeemed | (94,013) | (115,602) | (768,940) | (896,778) |
| Net increase (decrease) | 34,047 | (8,765) | $308,284 | $(78,504) |
| International Value | | | | |
| Shares sold | 2,636,526 | 10,653,545 | $22,208,337 | $82,568,730 |
| Reinvestment of distributions | 1,033,790 | 470,177 | 8,032,545 | 3,831,944 |
| Shares redeemed | (3,774,158) | (3,741,188) | (30,751,436) | (28,527,423) |
| Net increase (decrease) | (103,842) | 7,382,534 | $(510,554) | $57,873,251 |
| Class I | | | | |
| Shares sold | 426,959 | 73,854 | $3,538,590 | $567,094 |
| Reinvestment of distributions | 6,933 | 2,528 | 54,005 | 20,650 |
| Shares redeemed | (77,592) | (63,368) | (639,455) | (499,837) |
| Net increase (decrease) | 356,300 | 13,014 | $2,953,140 | $87,907 |
11. Other.
The Fund's organizational documents provide former and current trustees and officers with a limited indemnification against liabilities arising in connection with the performance of their duties to the Fund. In the normal course of business, the Fund may also enter into contracts that provide general indemnifications. The Fund's maximum exposure under these arrangements is unknown as this would be dependent on future claims that may be made against the Fund. The risk of material loss from such claims is considered remote.
At the end of the period, Strategic Advisers International II Fund was the owner of record of approximately 68% of the total outstanding shares of the Fund.
Report of Independent Registered Public Accounting Firm
To the Trustees of Fidelity Investment Trust and Shareholders of Fidelity International Value Fund:
We have audited the accompanying statement of assets and liabilities of Fidelity International Value Fund (the Fund), a fund of Fidelity Investment Trust, including the schedule of investments, as of October 31, 2017, and the related statement of operations for the year then ended, the statement of changes in net assets for each of the two years in the period then ended, and the financial highlights for each of the five years in the period then ended. These financial statements and financial highlights are the responsibility of the Fund's management. Our responsibility is to express an opinion on these financial statements and financial highlights based on our audits.
We conducted our audits in accordance with the standards of the Public Company Accounting Oversight Board (United States). Those standards require that we plan and perform the audit to obtain reasonable assurance about whether the financial statements and financial highlights are free of material misstatement. The Fund is not required to have, nor were we engaged to perform, an audit of its internal control over financial reporting. Our audits included consideration of internal control over financial reporting as a basis for designing audit procedures that are appropriate in the circumstances, but not for the purpose of expressing an opinion on the effectiveness of the Fund's internal control over financial reporting. Accordingly, we express no such opinion. An audit also includes examining, on a test basis, evidence supporting the amounts and disclosures in the financial statements, assessing the accounting principles used and significant estimates made by management, as well as evaluating the overall financial statement presentation. Our procedures included confirmation of securities owned as of October 31, 2017, by correspondence with the custodians and brokers; when replies were not received from brokers, we performed other auditing procedures. We believe that our audits provide a reasonable basis for our opinion.
In our opinion, such financial statements and financial highlights referred to above present fairly, in all material respects, the financial position of Fidelity International Value Fund as of October 31, 2017, the results of its operations for the year then ended, the changes in its net assets for each of the two years in the period then ended, and the financial highlights for each of the five years in the period then ended, in conformity with accounting principles generally accepted in the United States of America.
DELOITTE & TOUCHE LLP
Boston, Massachusetts
December 13, 2017
Trustees and Officers
The Trustees, Members of the Advisory Board (if any), and officers of the trust and fund, as applicable, are listed below. The Board of Trustees governs the fund and is responsible for protecting the interests of shareholders. The Trustees are experienced executives who meet periodically throughout the year to oversee the fund's activities, review contractual arrangements with companies that provide services to the fund, oversee management of the risks associated with such activities and contractual arrangements, and review the fund's performance. Except for Jonathan Chiel, each of the Trustees oversees 190 funds. Mr. Chiel oversees 143 funds.
The Trustees hold office without limit in time except that (a) any Trustee may resign; (b) any Trustee may be removed by written instrument, signed by at least two-thirds of the number of Trustees prior to such removal; (c) any Trustee who requests to be retired or who has become incapacitated by illness or injury may be retired by written instrument signed by a majority of the other Trustees; and (d) any Trustee may be removed at any special meeting of shareholders by a two-thirds vote of the outstanding voting securities of the trust. Each Trustee who is not an interested person (as defined in the 1940 Act) of the trust and the fund is referred to herein as an Independent Trustee. Each Independent Trustee shall retire not later than the last day of the calendar year in which his or her 75th birthday occurs. The Independent Trustees may waive this mandatory retirement age policy with respect to individual Trustees. Officers and Advisory Board Members hold office without limit in time, except that any officer or Advisory Board Member may resign or may be removed by a vote of a majority of the Trustees at any regular meeting or any special meeting of the Trustees. Except as indicated, each individual has held the office shown or other offices in the same company for the past five years.
The fund’s Statement of Additional Information (SAI) includes more information about the Trustees. To request a free copy, call Fidelity at 1-800-544-8544.
Experience, Skills, Attributes, and Qualifications of the Trustees. The Governance and Nominating Committee has adopted a statement of policy that describes the experience, qualifications, attributes, and skills that are necessary and desirable for potential Independent Trustee candidates (Statement of Policy). The Board believes that each Trustee satisfied at the time he or she was initially elected or appointed a Trustee, and continues to satisfy, the standards contemplated by the Statement of Policy. The Governance and Nominating Committee also engages professional search firms to help identify potential Independent Trustee candidates who have the experience, qualifications, attributes, and skills consistent with the Statement of Policy. From time to time, additional criteria based on the composition and skills of the current Independent Trustees, as well as experience or skills that may be appropriate in light of future changes to board composition, business conditions, and regulatory or other developments, have also been considered by the professional search firms and the Governance and Nominating Committee. In addition, the Board takes into account the Trustees' commitment and participation in Board and committee meetings, as well as their leadership of standing and ad hoc committees throughout their tenure.
In determining that a particular Trustee was and continues to be qualified to serve as a Trustee, the Board has considered a variety of criteria, none of which, in isolation, was controlling. The Board believes that, collectively, the Trustees have balanced and diverse experience, qualifications, attributes, and skills, which allow the Board to operate effectively in governing the fund and protecting the interests of shareholders. Information about the specific experience, skills, attributes, and qualifications of each Trustee, which in each case led to the Board's conclusion that the Trustee should serve (or continue to serve) as a trustee of the fund, is provided below.
Board Structure and Oversight Function. James C. Curvey is an interested person and currently serves as Chairman. The Trustees have determined that an interested Chairman is appropriate and benefits shareholders because an interested Chairman has a personal and professional stake in the quality and continuity of services provided to the fund. Independent Trustees exercise their informed business judgment to appoint an individual of their choosing to serve as Chairman, regardless of whether the Trustee happens to be independent or a member of management. The Independent Trustees have determined that they can act independently and effectively without having an Independent Trustee serve as Chairman and that a key structural component for assuring that they are in a position to do so is for the Independent Trustees to constitute a substantial majority for the Board. The Independent Trustees also regularly meet in executive session. Ned C. Lautenbach serves as Chairman of the Independent Trustees and as such (i) acts as a liaison between the Independent Trustees and management with respect to matters important to the Independent Trustees and (ii) with management prepares agendas for Board meetings.
Fidelity® funds are overseen by different Boards of Trustees. The fund's Board oversees Fidelity's high income and certain equity funds, and other Boards oversee Fidelity's investment-grade bond, money market, asset allocation, and sector funds. The asset allocation funds may invest in Fidelity® funds overseen by the fund's Board. The use of separate Boards, each with its own committee structure, allows the Trustees of each group of Fidelity® funds to focus on the unique issues of the funds they oversee, including common research, investment, and operational issues. On occasion, the separate Boards establish joint committees to address issues of overlapping consequences for the Fidelity® funds overseen by each Board.
The Trustees operate using a system of committees to facilitate the timely and efficient consideration of all matters of importance to the Trustees, the fund, and fund shareholders and to facilitate compliance with legal and regulatory requirements and oversight of the fund's activities and associated risks. The Board, acting through its committees, has charged FMR and its affiliates with (i) identifying events or circumstances the occurrence of which could have demonstrably adverse effects on the fund's business and/or reputation; (ii) implementing processes and controls to lessen the possibility that such events or circumstances occur or to mitigate the effects of such events or circumstances if they do occur; and (iii) creating and maintaining a system designed to evaluate continuously business and market conditions in order to facilitate the identification and implementation processes described in (i) and (ii) above. Because the day-to-day operations and activities of the fund are carried out by or through FMR, its affiliates, and other service providers, the fund's exposure to risks is mitigated but not eliminated by the processes overseen by the Trustees. While each of the Board's committees has responsibility for overseeing different aspects of the fund's activities, oversight is exercised primarily through the Operations, Audit, and Compliance Committees. In addition, the Independent Trustees have worked with FMR to enhance the Board's oversight of investment and financial risks, legal and regulatory risks, technology risks, and operational risks, including the development of additional risk reporting to the Board. For example, a working group comprised of Independent Trustees and FMR has worked and continues to work to review the Fidelity® funds' valuation-related activities, reporting and risk management. Appropriate personnel, including but not limited to the fund's Chief Compliance Officer (CCO), FMR's internal auditor, the independent accountants, the fund's Treasurer and portfolio management personnel, make periodic reports to the Board's committees, as appropriate, including an annual review of Fidelity's risk management program for the Fidelity® funds. The responsibilities of each standing committee, including their oversight responsibilities, are described further under "Standing Committees of the Trustees."
Interested Trustees*:
Correspondence intended for a Trustee who is an interested person may be sent to Fidelity Investments, 245 Summer Street, Boston, Massachusetts 02210.
Name, Year of Birth; Principal Occupations and Other Relevant Experience+
Jonathan Chiel (1957)
Year of Election or Appointment: 2016
Trustee
Mr. Chiel also serves as Trustee of other Fidelity® funds. Mr. Chiel is Executive Vice President and General Counsel for FMR LLC (diversified financial services company, 2012-present). Previously, Mr. Chiel served as general counsel (2004-2012) and senior vice president and deputy general counsel (2000-2004) for John Hancock Financial Services; a partner with Choate, Hall & Stewart (1996-2000) (law firm); and an Assistant United States Attorney for the United States Attorney’s Office of the District of Massachusetts (1986-95), including Chief of the Criminal Division (1993-1995). Mr. Chiel is a director on the boards of the Boston Bar Foundation and the Maimonides School.
James C. Curvey (1935)
Year of Election or Appointment: 2007
Trustee
Chairman of the Board of Trustees
Mr. Curvey also serves as Trustee of other Fidelity® funds. Mr. Curvey is a Director of Fidelity Research & Analysis Co. (investment adviser firm, 2009-present), and Vice Chairman (2007-present) and Director of FMR LLC (diversified financial services company). In addition, Mr. Curvey serves as an Overseer for the Boston Symphony Orchestra and a member of the board of Artis-Naples, Naples, Florida, and as a Trustee for Brewster Academy, Wolfeboro, New Hampshire. Previously, Mr. Curvey served as a Director of Fidelity Investments Money Management, Inc. (investment adviser firm, 2009-2014) and a Director of FMR and FMR Co., Inc. (investment adviser firms, 2007-2014).
Charles S. Morrison (1960)
Year of Election or Appointment: 2014
Trustee
Mr. Morrison also serves as Trustee of other funds. He serves as President of Fidelity Management & Research Company (FMR) (investment adviser firm, 2016-present), a Director of Fidelity Investments Money Management, Inc. (FIMM) (investment adviser firm, 2014-present), Director of Fidelity SelectCo, LLC (investment adviser firm, 2014-present), President, Asset Management (2014-present), and is an employee of Fidelity Investments. Previously, Mr. Morrison served as Vice President of Fidelity's Fixed Income and Asset Allocation Funds (2012-2014), President, Fixed Income (2011-2014), Vice President of Fidelity's Money Market Funds (2005-2009), President, Money Market Group Leader of FMR (investment adviser firm, 2009), and Senior Vice President, Money Market Group of FMR (2004-2009). Mr. Morrison also served as Vice President of Fidelity's Bond Funds (2002-2005), certain Balanced Funds (2002-2005), and certain Asset Allocation Funds (2002-2007), and as Senior Vice President (2002-2005) of Fidelity's Bond Division.
* Determined to be an “Interested Trustee” by virtue of, among other things, his or her affiliation with the trust or various entities under common control with FMR.
+ The information includes the Trustee's principal occupation during the last five years and other information relating to the experience, attributes, and skills relevant to the Trustee's qualifications to serve as a Trustee, which led to the conclusion that the Trustee should serve as a Trustee for the fund.
Independent Trustees:
Correspondence intended for an Independent Trustee may be sent to Fidelity Investments, P.O. Box 55235, Boston, Massachusetts 02205-5235.
Name, Year of Birth; Principal Occupations and Other Relevant Experience+
Dennis J. Dirks (1948)
Year of Election or Appointment: 2005
Trustee
Mr. Dirks also serves as Trustee of other Fidelity® funds. Prior to his retirement in May 2003, Mr. Dirks was Chief Operating Officer and a member of the Board of The Depository Trust & Clearing Corporation (DTCC). He also served as President, Chief Operating Officer, and Board member of The Depository Trust Company (DTC) and President and Board member of the National Securities Clearing Corporation (NSCC). In addition, Mr. Dirks served as Chief Executive Officer and Board member of the Government Securities Clearing Corporation, Chief Executive Officer and Board member of the Mortgage-Backed Securities Clearing Corporation, as a Trustee and a member of the Finance Committee of Manhattan College (2005-2008), as a Trustee and a member of the Finance Committee of AHRC of Nassau County (2006-2008), as a member of the Independent Directors Council (IDC) Governing Council (2010-2015), and as a member of the Board of Directors for The Brookville Center for Children’s Services, Inc. (2009-2017). Mr. Dirks is a member of the Finance Committee (2016-present) and Board of Directors (2017-present) of the Asolo Repertory Theatre.
Alan J. Lacy (1953)
Year of Election or Appointment: 2008
Trustee
Mr. Lacy also serves as Trustee of other Fidelity® funds. Mr. Lacy serves as a Director of Bristol-Myers Squibb Company (global pharmaceuticals, 2008-present). He is a Trustee of the California Chapter of The Nature Conservancy (2015-present) and a Director of the Center for Advanced Study in the Behavioral Sciences at Stanford University (2015-present). In addition, Mr. Lacy served as Senior Adviser (2007-2014) of Oak Hill Capital Partners, L.P. (private equity) and also served as Chief Executive Officer (2005) and Vice Chairman (2005-2006) of Sears Holdings Corporation (retail) and Chief Executive Officer and Chairman of the Board of Sears, Roebuck and Co. (retail, 2000-2005). Previously, Mr. Lacy served as Chairman (2014-2017) and a member (2010-2017) of the Board of Directors of Dave & Buster’s Entertainment, Inc. (restaurant and entertainment complexes), as Chairman (2008-2011) and a member (2006-2015) of the Board of Trustees of the National Parks Conservation Association, and as a member of the Board of Directors for The Hillman Companies, Inc. (hardware wholesalers, 2010-2014), Earth Fare, Inc. (retail grocery, 2010-2014), and The Western Union Company (global money transfer, 2006-2011).
Ned C. Lautenbach (1944)
Year of Election or Appointment: 2000
Trustee
Chairman of the Independent Trustees
Mr. Lautenbach also serves as Trustee of other Fidelity® funds. Mr. Lautenbach currently serves as Vice Chair of the Board of Governors, State University System of Florida (2013-present) and is a member of the Council on Foreign Relations (1994-present). He is also a member and has most recently served as Chairman of the Board of Directors of Artis-Naples (2012-present). Previously, Mr. Lautenbach served as a member and then Lead Director of the Board of Directors of Eaton Corporation (diversified industrial, 1997-2016). He was also a Partner and Advisory Partner at Clayton, Dubilier & Rice, LLC (private equity investment, 1998-2010), as well as a Director of Sony Corporation (2006-2007). In addition, Mr. Lautenbach also had a 30-year career with IBM (technology company) during which time he served as Senior Vice President and a member of the Corporate Executive Committee (1968-1998).
Joseph Mauriello (1944)
Year of Election or Appointment: 2008
Trustee
Mr. Mauriello also serves as Trustee of other Fidelity® funds. Prior to his retirement in January 2006, Mr. Mauriello served in numerous senior management positions including Deputy Chairman and Chief Operating Officer (2004-2005), and Vice Chairman of Financial Services (2002-2004) of KPMG LLP US (professional services, 1965-2005). Mr. Mauriello currently serves as a member of the Board of Directors of XL Group plc. (global insurance and re-insurance, 2006-present) and the Independent Directors Council (IDC) Governing Council (2015-present). Previously, Mr. Mauriello served as a Director of the Hamilton Funds of the Bank of New York (2006-2007) and of Arcadia Resources Inc. (health care services and products, 2007-2012).
Cornelia M. Small (1944)
Year of Election or Appointment: 2005
Trustee
Ms. Small also serves as Trustee of other Fidelity® funds. Ms. Small is a member of the Board of Directors (2009-present) and Chair of the Investment Committee (2010-present) of the Teagle Foundation. Ms. Small also serves on the Investment Committee of the Berkshire Taconic Community Foundation (2008-present). Previously, Ms. Small served as Chairperson (2002-2008) and a member of the Investment Committee and Chairperson (2008-2012) and a member of the Board of Trustees of Smith College. In addition, Ms. Small served as Chief Investment Officer, Director of Global Equity Investments, and a member of the Board of Directors of Scudder, Stevens & Clark and Scudder Kemper Investments.
William S. Stavropoulos (1939)
Year of Election or Appointment: 2001
Trustee
Vice Chairman of the Independent Trustees
Mr. Stavropoulos also serves as Trustee of other Fidelity® funds. Mr. Stavropoulos serves as President and Founder of the Michigan Baseball Foundation, the Great Lakes Loons (2007-present). Mr. Stavropoulos is Chairman Emeritus of the Board of Directors of The Dow Chemical Company, where he previously served in numerous senior management positions, including President, CEO (1995-2000; 2002-2004), Chairman of the Executive Committee (2000-2006), and as a member of the Board of Directors (1990-2006). Currently, Mr. Stavropoulos is Chairman of the Board of Directors of Univar Inc. (global distributor of commodity and specialty chemicals), a Director of Teradata Corporation (data warehousing and technology solutions), and a member of the Advisory Board for Metalmark Capital LLC (private equity investment, 2005-present). Mr. Stavropoulos is an operating advisor to Clayton, Dubilier & Rice, LLC (private equity investment). In addition, Mr. Stavropoulos is a member of the University of Notre Dame Advisory Council for the College of Science, a Trustee of the Rollin L. Gerstacker Foundation, and a Director of Artis-Naples in Naples, Florida. Previously, Mr. Stavropoulos served as a Director of Chemical Financial Corporation (bank holding company, 1993-2012) and Tyco International, Ltd. (multinational manufacturing and services, 2007-2012).
David M. Thomas (1949)
Year of Election or Appointment: 2008
Trustee
Mr. Thomas also serves as Trustee of other Fidelity® funds. Mr. Thomas serves as Non-Executive Chairman of the Board of Directors of Fortune Brands Home and Security (home and security products, 2011-present), as a member of the Board of Directors (2004-present) and Presiding Director (2013-present) of Interpublic Group of Companies, Inc. (marketing communication), and as a member of the Board of Trustees of the University of Florida (2013-present). Previously, Mr. Thomas served as Executive Chairman (2005-2006) and Chairman and Chief Executive Officer (2000-2005) of IMS Health, Inc. (pharmaceutical and healthcare information solutions), and a Director of Fortune Brands, Inc. (consumer products, 2000-2011).
+ The information includes the Trustee's principal occupation during the last five years and other information relating to the experience, attributes, and skills relevant to the Trustee's qualifications to serve as a Trustee, which led to the conclusion that the Trustee should serve as a Trustee for the fund.
Advisory Board Members and Officers:
Correspondence intended for an officer or Peter S. Lynch may be sent to Fidelity Investments, 245 Summer Street, Boston, Massachusetts 02210. Officers appear below in alphabetical order.
Name, Year of Birth; Principal Occupation
Peter S. Lynch (1944)
Year of Election or Appointment: 2003
Member of the Advisory Board
Mr. Lynch also serves as Member of the Advisory Board of other Fidelity® funds. Mr. Lynch is Vice Chairman and a Director of FMR (investment adviser firm) and FMR Co., Inc. (investment adviser firm). In addition, Mr. Lynch serves as a Trustee of Boston College and as the Chairman of the Inner-City Scholarship Fund. Previously, Mr. Lynch served on the Special Olympics International Board of Directors (1997-2006).
Elizabeth Paige Baumann (1968)
Year of Election or Appointment: 2017
Anti-Money Laundering (AML) Officer
Ms. Baumann also serves as AML Officer of other funds. She is Chief AML Officer (2012-present) and Senior Vice President (2014-present) of FMR LLC (diversified financial services company) and is an employee of Fidelity Investments. Previously, Ms. Baumann served as AML Officer of the funds (2012-2016), and Vice President (2007-2014) and Deputy Anti-Money Laundering Officer (2007-2012) of FMR LLC.
Marc R. Bryant (1966)
Year of Election or Appointment: 2015
Secretary and Chief Legal Officer (CLO)
Mr. Bryant also serves as Secretary and CLO of other funds. Mr. Bryant serves as CLO, Secretary, and Senior Vice President of Fidelity Management & Research Company (investment adviser firm, 2015-present) and FMR Co., Inc. (investment adviser firm, 2015-present); Secretary of Fidelity SelectCo, LLC (investment adviser firm, 2015-present) and Fidelity Investments Money Management, Inc. (investment adviser firm, 2015-present); and CLO of Fidelity Management & Research (Hong Kong) Limited and FMR Investment Management (UK) Limited (investment adviser firms, 2015-present) and Fidelity Management & Research (Japan) Limited (investment adviser firm, 2016-present). He is Senior Vice President and Deputy General Counsel of FMR LLC (diversified financial services company). Previously, Mr. Bryant served as Secretary and CLO of Fidelity Rutland Square Trust II (2010-2014) and Assistant Secretary of Fidelity's Fixed Income and Asset Allocation Funds (2013-2015). Prior to joining Fidelity Investments, Mr. Bryant served as a Senior Vice President and the Head of Global Retail Legal for AllianceBernstein L.P. (2006-2010), and as the General Counsel for ProFund Advisors LLC (2001-2006).
William C. Coffey (1969)
Year of Election or Appointment: 2009
Assistant Secretary
Mr. Coffey also serves as Assistant Secretary of other funds. He is Senior Vice President and Deputy General Counsel of FMR LLC (diversified financial services company, 2010-present), and is an employee of Fidelity Investments. Previously, Mr. Coffey served as Vice President and Associate General Counsel of FMR LLC (2005-2009).
Jonathan Davis (1968)
Year of Election or Appointment: 2010
Assistant Treasurer
Mr. Davis also serves as Assistant Treasurer of other funds, and is an employee of Fidelity Investments. Previously, Mr. Davis served as Vice President and Associate General Counsel of FMR LLC (diversified financial services company, 2003-2010).
Adrien E. Deberghes (1967)
Year of Election or Appointment: 2016
Assistant Treasurer
Mr. Deberghes also serves as an officer of other funds. He serves as Executive Vice President of Fidelity Investments Money Management, Inc. (FIMM) (investment adviser firm, 2016-present) and is an employee of Fidelity Investments (2008-present). Prior to joining Fidelity Investments, Mr. Deberghes was Senior Vice President of Mutual Fund Administration at State Street Corporation (2007-2008), Senior Director of Mutual Fund Administration at Investors Bank & Trust (2005-2007), and Director of Finance for Dunkin' Brands (2000-2005). Previously, Mr. Deberghes served in other fund officer roles.
Joseph DeSantis (1959)
Year of Election or Appointment: 2017
Vice President
Mr. DeSantis also serves as Vice President of other funds. Mr. DeSantis serves as a Director of Fidelity Management & Research (Japan) Limited (investment adviser firm, 2016-present), Chief Investment Officer, Equities (2010-present) and is an employee of Fidelity Investments.
Stephanie J. Dorsey (1969)
Year of Election or Appointment: 2010
Assistant Treasurer
Ms. Dorsey also serves as an officer of other funds. She is an employee of Fidelity Investments (2008-present) and has served in other fund officer roles. Prior to joining Fidelity Investments, Ms. Dorsey served as Treasurer (2004-2008) of the JPMorgan Mutual Funds and Vice President (2004-2008) of JPMorgan Chase Bank.
Howard J. Galligan III (1966)
Year of Election or Appointment: 2014
Chief Financial Officer
Mr. Galligan also serves as Chief Financial Officer of other funds. Mr. Galligan serves as President of Fidelity Pricing and Cash Management Services (FPCMS) (2014-present) and as a Director of Strategic Advisers, Inc. (investment adviser firm, 2008-present). Previously, Mr. Galligan served as Chief Administrative Officer of Asset Management (2011-2014) and Chief Operating Officer and Senior Vice President of Investment Support for Strategic Advisers, Inc. (2003-2011).
Brian B. Hogan (1964)
Year of Election or Appointment: 2009
Vice President
Mr. Hogan also serves as Trustee or Vice President of other funds. Mr. Hogan serves as a Director of FMR Investment Management (UK) Limited (investment adviser firm, 2015-present) and Fidelity SelectCo, LLC (investment adviser firm, 2014-present) and President of the Equity Division of FMR (investment adviser firm, 2009-present). Previously, Mr. Hogan served as Senior Vice President, Equity Research of FMR (2006-2009) and as a portfolio manager. Mr. Brian B. Hogan is not related to Mr. Colm A. Hogan.
Colm A. Hogan (1973)
Year of Election or Appointment: 2016
Deputy Treasurer
Mr. Hogan also serves as an officer of other funds. Mr. Hogan is an employee of Fidelity Investments (2005-present). Mr. Colm A. Hogan is not related to Mr. Brian B. Hogan.
Chris Maher (1972)
Year of Election or Appointment: 2013
Assistant Treasurer
Mr. Maher serves as Assistant Treasurer of other funds. Mr. Maher is Vice President of Valuation Oversight and is an employee of Fidelity Investments. Previously, Mr. Maher served as Vice President of Asset Management Compliance (2013), Vice President of the Program Management Group of FMR (investment adviser firm, 2010-2013), and Vice President of Valuation Oversight (2008-2010).
Rieco E. Mello (1969)
Year of Election or Appointment: 2017
Assistant Treasurer
Mr. Mello also serves as Assistant Treasurer of other funds. Mr. Mello is an employee of Fidelity Investments (1995-present).
Kenneth B. Robins (1969)
Year of Election or Appointment: 2016
Chief Compliance Officer
Mr. Robins also serves as an officer of other funds. Mr. Robins serves as Compliance Officer of Fidelity Management & Research Company and FMR Co., Inc. (investment adviser firms, 2016-present) and is an employee of Fidelity Investments (2004-present). Previously, Mr. Robins served as Executive Vice President of Fidelity Investments Money Management, Inc. (investment adviser firm, 2013-2016) and served in other fund officer roles.
Stacie M. Smith (1974)
Year of Election or Appointment: 2016
President and Treasurer
Ms. Smith also serves as an officer of other funds. She is an employee of Fidelity Investments (2009-present) and has served in other fund officer roles. Prior to joining Fidelity Investments, Ms. Smith served as Senior Audit Manager of Ernst & Young LLP (accounting firm, 1996-2009). Previously, Ms. Smith served as Deputy Treasurer of certain Fidelity® funds (2013-2016).
Marc L. Spector (1972)
Year of Election or Appointment: 2016
Assistant Treasurer
Mr. Spector also serves as an officer of other funds. Mr. Spector is an employee of Fidelity Investments (2016-present). Prior to joining Fidelity Investments, Mr. Spector served as Director at the Siegfried Group (accounting firm, 2013-2016), and prior to Siegfried Group as audit senior manager at Deloitte & Touche (accounting firm, 2005-2013).
Renee Stagnone (1975)
Year of Election or Appointment: 2016
Assistant Treasurer
Ms. Stagnone also serves as an officer of other funds. Ms. Stagnone is an employee of Fidelity Investments (1997-present). Previously, Ms. Stagnone served as Deputy Treasurer of certain Fidelity® funds (2013-2016).
Shareholder Expense Example
As a shareholder of the Fund, you incur two types of costs: (1) transaction costs, including sales charges (loads) on purchase payments or redemption proceeds, redemption fees and (2) ongoing costs, including management fees, distribution and/or service (12b-1) fees and other Fund expenses. This Example is intended to help you understand your ongoing costs (in dollars) of investing in the Fund and to compare these costs with the ongoing costs of investing in other mutual funds.
The Example is based on an investment of $1,000 invested at the beginning of the period and held for the entire period (May 1, 2017 to October 31, 2017).
Actual Expenses
The first line of the accompanying table for each class of the Fund provides information about actual account values and actual expenses. You may use the information in this line, together with the amount you invested, to estimate the expenses that you paid over the period. Simply divide your account value by $1,000.00 (for example, an $8,600 account value divided by $1,000.00 = 8.6), then multiply the result by the number in the first line for a class of the Fund under the heading entitled "Expenses Paid During Period" to estimate the expenses you paid on your account during this period. A small balance maintenance fee of $12.00 that is charged once a year may apply for certain accounts with a value of less than $2,000. This fee is not included in the table below. If it was, the estimate of expenses you paid during the period would be higher, and your ending account value lower, by this amount. In addition, the Fund, as a shareholder in the underlying Fidelity Central Funds, will indirectly bear its pro-rata share of the fees and expenses incurred by the underlying Fidelity Central Funds. These fees and expenses are not included in the Fund's annualized expense ratio used to calculate the expense estimate in the table below.
Hypothetical Example for Comparison Purposes
The second line of the accompanying table for each class of the Fund provides information about hypothetical account values and hypothetical expenses based on a Class' actual expense ratio and an assumed rate of return of 5% per year before expenses, which is not the Class' actual return. The hypothetical account values and expenses may not be used to estimate the actual ending account balance or expenses you paid for the period. You may use this information to compare the ongoing costs of investing in the Fund and other funds. To do so, compare this 5% hypothetical example with the 5% hypothetical examples that appear in the shareholder reports of the other funds. A small balance maintenance fee of $12.00 that is charged once a year may apply for certain accounts with a value of less than $2,000. This fee is not included in the table below. If it was, the estimate of expenses you paid during the period would be higher, and your ending account value lower, by this amount. In addition, the Fund, as a shareholder in the underlying Fidelity Central Funds, will indirectly bear its pro-rata share of the fees and expenses incurred by the underlying Fidelity Central Funds. These fees and expenses are not included in the Fund's annualized expense ratio used to calculate the expense estimate in the table below.
Please note that the expenses shown in the table are meant to highlight your ongoing costs only and do not reflect any transaction costs. Therefore, the second line of the table is useful in comparing ongoing costs only, and will not help you determine the relative total costs of owning different funds. In addition, if these transactional costs were included, your costs would have been higher.
| | Annualized Expense Ratio-A | Beginning
Account Value
May 1, 2017 | Ending
Account Value
October 31, 2017 | Expenses Paid
During Period-B
May 1, 2017
to October 31, 2017 |
| Class A | 1.30% | | | |
| Actual | | $1,000.00 | $1,083.50 | $6.83 |
| Hypothetical-C | | $1,000.00 | $1,018.65 | $6.61 |
| Class M | 1.63% | | | |
| Actual | | $1,000.00 | $1,082.40 | $8.56 |
| Hypothetical-C | | $1,000.00 | $1,016.99 | $8.29 |
| Class C | 2.10% | | | |
| Actual | | $1,000.00 | $1,080.00 | $11.01 |
| Hypothetical-C | | $1,000.00 | $1,014.62 | $10.66 |
| International Value | .96% | | | |
| Actual | | $1,000.00 | $1,086.00 | $5.05 |
| Hypothetical-C | | $1,000.00 | $1,020.37 | $4.89 |
| Class I | 1.10% | | | |
| Actual | | $1,000.00 | $1,084.60 | $5.78 |
| Hypothetical-C | | $1,000.00 | $1,019.66 | $5.60 |
| | | | | |
| | | | | |
| | | | | |
A Annualized expense ratio reflects expenses net of applicable fee waivers.
B Expenses are equal to each Class' annualized expense ratio, multiplied by the average account value over the period, multiplied by 184/365 (to reflect the one-half year period).
C 5% return per year before expenses
Distributions (Unaudited)
The Board of Trustees of Fidelity International Value Fund voted to pay to shareholders of record at the opening of business on record date, the following distributions per share derived from capital gains realized from sales of portfolio securities, and dividends derived from net investment income:
| | Pay Date | Record Date | Dividends | Capital Gains |
| International Value | 12/11/2017 | 12/08/2017 | $0.136 | $0.014 |
| Class A | 12/11/2017 | 12/08/2017 | $0.102 | $0.014 |
| Class C | 12/11/2017 | 12/08/2017 | $0.042 | $0.014 |
| Class I | 12/11/2017 | 12/08/2017 | $0.126 | $0.014 |
| Class M | 12/11/2017 | 12/08/2017 | $0.075 | $0.014 |
|
International Value designates 3%, Class A designates 3%, Class C designates 5%, Class I designates 3%, and Class M designates 4% of the dividends distributed during the fiscal year as qualifying for the dividends–received deduction for corporate shareholders.
International Value designates 92%, Class A designates 100%, Class C designates 100%, Class I designates 96%, and Class M designates 100% of the dividends distributed during the fiscal year as amounts which may be taken into account as a dividend for purposes of the maximum rate under section 1(h)(11) of the Internal Revenue Code.
The amounts per share which represent income derived from sources within, and taxes paid to, foreign countries or possessions of the United States are as follows:
| | Pay Date | Income | Taxes |
| International Value | 12/12/2016 | $0.2208 | $0.0118 |
| Class A | 12/12/2016 | $0.1888 | $0.0118 |
| Class C | 12/12/2016 | $0.1298 | $0.0118 |
| Class I | 12/12/2016 | $0.2128 | $0.0118 |
| Class M | 12/12/2016 | $0.1648 | $0.0118 |
|
The fund will notify shareholders in January 2018 of amounts for use in preparing 2017 income tax returns.
Board Approval of Investment Advisory Contracts and Management Fees
Fidelity International Value Fund
Each year, the Board of Trustees, including the Independent Trustees (together, the Board), votes on the renewal of the management contract with Fidelity Management & Research Company (FMR) and the sub-advisory agreements (together, the Advisory Contracts) for the fund. FMR and the sub-advisers are referred to herein as the Investment Advisers. The Board, assisted by the advice of fund counsel and Independent Trustees' counsel, requests and considers a broad range of information relevant to the renewal of the Advisory Contracts throughout the year.
The Board meets regularly and, at each of its meetings, covers an extensive agenda of topics and materials and considers factors that are relevant to its annual consideration of the renewal of the fund's Advisory Contracts, including the services and support provided to the fund and its shareholders. The Board has established various standing committees (Committees), each composed of and chaired by Independent Trustees with varying backgrounds, to which the Board has assigned specific subject matter responsibilities in order to enhance effective decision-making by the Board. The Board, acting directly and through its Committees, requests and receives information concerning the annual consideration of the renewal of the fund's Advisory Contracts. The Board also meets as needed to review matters specifically related to the Board's annual consideration of the renewal of the Advisory Contracts. Members of the Board may also meet with trustees of other Fidelity funds through ad hoc joint committees to discuss certain matters relevant to all of the Fidelity funds.
At its July 2017 meeting, the Board unanimously determined to renew the fund's Advisory Contracts. In reaching its determination, the Board considered all factors it believed relevant, including (i) the nature, extent, and quality of the services to be provided to the fund and its shareholders (including the investment performance of the fund); (ii) the competitiveness of the fund's management fee and total expense ratio relative to peer funds; (iii) the total costs of the services to be provided by and the profits to be realized by Fidelity from its relationships with the fund; and (iv) the extent to which, if any, economies of scale exist and would be realized as the fund grows, and whether any economies of scale are appropriately shared with fund shareholders.
In considering whether to renew the Advisory Contracts for the fund, the Board reached a determination, with the assistance of fund counsel and Independent Trustees' counsel and through the exercise of its business judgment, that the renewal of the Advisory Contracts was in the best interests of the fund and its shareholders and that the compensation payable under the Advisory Contracts was fair and reasonable. The Board's decision to renew the Advisory Contracts was not based on any single factor, but rather was based on a comprehensive consideration of all the information provided to the Board at its meetings throughout the year. The Board, in reaching its determination to renew the Advisory Contracts, was aware that shareholders of the fund have a broad range of investment choices available to them, including a wide choice among funds offered by Fidelity's competitors, and that the fund's shareholders, who have the opportunity to review and weigh the disclosure provided by the fund in its prospectus and other public disclosures, have chosen to invest in this fund, which is part of the Fidelity family of funds.
Amendment to Group Fee Rate. The Board also approved an amendment to the management contract for the fund to add an additional breakpoint to the group fee schedule, effective October 1, 2017. The Board noted that the additional breakpoint would result in lower management fee rates as Fidelity's assets under management increase.
Nature, Extent, and Quality of Services Provided. The Board considered Fidelity's staffing as it relates to the fund, including the backgrounds of investment personnel of Fidelity, and also considered the fund's investment objective, strategies, and related investment philosophy. The Independent Trustees also had discussions with senior management of Fidelity's investment operations and investment groups. The Board considered the structure of the investment personnel compensation program and whether this structure provides appropriate incentives to act in the best interests of the fund. Additionally, the Board considered the portfolio managers' investments, if any, in the funds that they manage.
Resources Dedicated to Investment Management and Support Services. The Board and the Fund Oversight and Research Committees reviewed the general qualifications and capabilities of Fidelity's investment staff, including its size, education, experience, and resources, as well as Fidelity's approach to recruiting, training, managing, and compensating investment personnel. The Board noted that Fidelity has continued to increase the resources devoted to non-U.S. offices, including expansion of Fidelity's global investment organization. The Board also noted that Fidelity's analysts have extensive resources, tools and capabilities that allow them to conduct sophisticated quantitative and fundamental analysis, as well as credit analysis of issuers, counterparties and guarantors. Further, the Board considered that Fidelity's investment professionals have sufficient access to global information and data so as to provide competitive investment results over time, and that those professionals also have access to sophisticated tools that permit them to assess portfolio construction and risk and performance attribution characteristics continuously, as well as to transmit new information and research conclusions rapidly around the world. Additionally, in its deliberations, the Board considered Fidelity's trading, risk management, compliance, and technology and operations capabilities and resources, which are integral parts of the investment management process.
Shareholder and Administrative Services. The Board considered (i) the nature, extent, quality, and cost of advisory, administrative, and shareholder services performed by the Investment Advisers and their affiliates under the Advisory Contracts and under separate agreements covering transfer agency, pricing and bookkeeping, and securities lending services for the fund; (ii) the nature and extent of the supervision of third party service providers, principally custodians, subcustodians, and pricing vendors; and (iii) the resources devoted to, and the record of compliance with, the fund's compliance policies and procedures. The Board also reviewed the allocation of fund brokerage, including allocations to brokers affiliated with the Investment Advisers, the use of brokerage commissions to pay fund expenses, and the use of "soft" commission dollars to pay for research services.
The Board noted that the growth of fund assets over time across the complex allows Fidelity to reinvest in the development of services designed to enhance the value or convenience of the Fidelity funds as investment vehicles. These services include 24-hour access to account information and market information through telephone representatives and over the Internet, investor education materials and asset allocation tools, and the expanded availability of Fidelity Investor Centers.
In 2014, the Board formed an ad hoc Committee on Transfer Agency Fees to review the variety of transfer agency fee structures throughout the industry and Fidelity's competitive positioning with respect to industry participants.
Investment in a Large Fund Family. The Board considered the benefits to shareholders of investing in a Fidelity fund, including the benefits of investing in a fund that is part of a large family of funds offering a variety of investment disciplines and providing a large variety of mutual fund investor services. The Board noted that Fidelity had taken, or had made recommendations that resulted in the Fidelity funds taking, a number of actions over the previous year that benefited particular funds, including: (i) continuing to dedicate additional resources to Fidelity's investment research process, and to the support of the senior management team that oversees asset management; (ii) continuing efforts to enhance Fidelity's global research capabilities; (iii) launching new funds and making other enhancements to meet client needs; (iv) launching new share classes of existing funds; (v) eliminating purchase minimums and broadening eligibility requirements for certain lower-priced share classes; (vi) reducing management fees and total expenses for certain growth equity funds and index funds; (vii) lowering expense caps for certain existing funds and classes to reduce expenses borne by shareholders; (viii) eliminating short-term redemption fees for certain funds; (ix) introducing a new pricing structure for certain funds of funds that is expected to reduce overall expenses paid by shareholders; (x) rationalizing product lines and gaining increased efficiencies through proposals for fund mergers and share class consolidations; (xi) continuing to develop, acquire and implement systems and technology to improve services to the funds and shareholders, strengthen information security, and increase efficiency; and (xii) implementing enhancements to further strengthen Fidelity's product line to increase investors' probability of success in achieving their investment goals, including retirement income goals.
Investment Performance. The Board considered whether the fund has operated in accordance with its investment objective, as well as its record of compliance with its investment restrictions and its performance history.
The Board took into account discussions with representatives of the Investment Advisers about fund investment performance that occur at Board meetings throughout the year. In this regard the Board noted that as part of regularly scheduled fund reviews and other reports to the Board on fund performance, the Board considers annualized return information for the fund for different time periods, measured against a securities market index ("benchmark index") and a peer group of funds with similar objectives ("peer group"), if any. In its evaluation of fund investment performance, the Board gave particular attention to information indicating changes in performance of certain Fidelity funds for specific time periods and discussed with the Investment Advisers the reasons for any overperformance or underperformance.
In addition to reviewing absolute and relative fund performance, the Independent Trustees periodically consider the appropriateness of fund performance metrics in evaluating the results achieved. In general, the Independent Trustees believe that fund performance should be evaluated based on net performance (after fees and expenses) of both the highest performing and lowest performing fund share classes, where applicable, compared to appropriate benchmark indices, over appropriate time periods that may include full market cycles, and compared to peer groups, as applicable, over the same periods, taking into account relevant factors including the following: general market conditions; issuer-specific information; and fund cash flows and other factors.
The Independent Trustees recognize that shareholders evaluate performance on a net basis over their own holding periods, for which one-, three-, and five-year periods are often used as a proxy. For this reason, the performance information reviewed by the Board also included net cumulative calendar year total return information for the fund and an appropriate benchmark index and peer group for the most recent
one-, three-, and five-year periods, as shown below. Returns are shown compared to the 25th percentile (top of box, 75% beaten) and 75th percentile (bottom of box, 25% beaten) of the peer universe. Returns of the benchmark index are "net MA," i.e., adjusted for tax withholding rates applicable to U.S.-based funds organized as Massachusetts business trusts.Fidelity International Value Fund
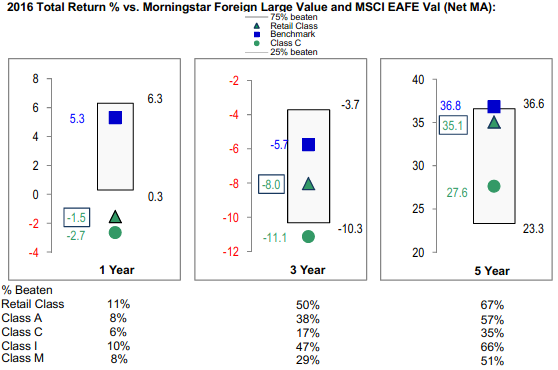
The Board also considered that the fund's management fee is subject to upward or downward adjustment depending upon whether, and to what extent, the fund's investment performance for the performance period (a rolling 36-month period) exceeds, or is exceeded by, a securities index, thus leading to a performance adjustment for the same period. The Board noted that the performance adjustment provides FMR with a strong economic incentive to seek to achieve superior long-term performance for the fund's shareholders and helps to more closely align the interests of FMR and the shareholders of the fund.
Based on its review, the Board concluded that the nature, extent, and quality of services provided to the fund under the Advisory Contracts should continue to benefit the shareholders of the fund.
Competitiveness of Management Fee and Total Expense Ratio. The Board considered the fund's management fee and total expense ratio compared to "mapped groups" of competitive funds and classes created for the purpose of facilitating the Trustees' competitive analysis of management fees and total expenses. Fidelity creates "mapped groups" by combining similar Lipper investment objective categories that have comparable investment mandates. Combining Lipper investment objective categories aids the Board's management fee and total expense ratio comparisons by broadening the competitive group used for comparison.
Management Fee. The Board considered two proprietary management fee comparisons for the 12-month periods shown in basis points (BP) in the chart below. The group of Lipper funds used by the Board for management fee comparisons is referred to below as the "Total Mapped Group." The Total Mapped Group comparison focuses on a fund's standing in terms of gross management fees before expense reimbursements or caps, and without giving effect to the fund's performance adjustment, relative to the total universe of funds with comparable investment mandates, regardless of whether their management fee structures also are comparable. Funds with comparable investment mandates offer exposure to similar types of securities. Funds with comparable management fee structures have similar management fee contractual arrangements (
e.g., flat rate charged for advisory services, all-inclusive fee rate,
etc.). "TMG %" represents the percentage of funds in the Total Mapped Group that had management fees that were lower than the fund's. For example, a hypothetical TMG % of 20% would mean that 80% of the funds in the Total Mapped Group had higher, and 20% had lower, management fees than the fund. The fund's actual TMG %s and the number of funds in the Total Mapped Group are in the chart below. The "Asset-Size Peer Group" (ASPG) comparison focuses on a fund's standing relative to a subset of non-Fidelity funds within the Total Mapped Group that are similar in size and management fee structure without taking into account performance adjustments, if any. For example, if a fund is in the first quartile of the ASPG, the fund's management fee ranks in the least expensive or lowest 25% of funds in the ASPG. The ASPG represents at least 15% of the funds in the Total Mapped Group with comparable asset size and management fee structures, subject to a minimum of 50 funds (or all funds in the Total Mapped Group if fewer than 50). Additional information, such as the ASPG quartile in which the fund's management fee rate ranked and the impact of the fund's performance adjustment, is also included in the chart and considered by the Board.
Fidelity International Value Fund
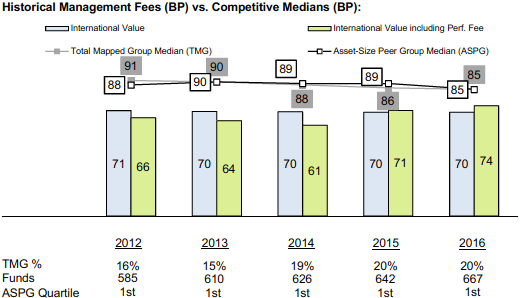
The Board noted that the fund's management fee rate ranked below the median of its Total Mapped Group and below the median of its ASPG for 2016. The Board also noted the effect of the fund's performance adjustment, if any, on the fund's management fee ranking.
The Board noted that, in 2014, the Board and the boards of other Fidelity funds formed the ad hoc Committee on Group Fee to conduct an in-depth review of the "group fee" component of the management fee of funds with such management fee structures. The Committee's focus included the mechanics of the group fee, the competitive landscape of group fee structures, Fidelity funds with no group fee component and investment products not included in group fee assets. The Board also considered that, for funds subject to the group fee, FMR agreed to voluntarily waive fees over a specified period of time in amounts designed to account for assets converted from certain funds to certain collective investment trusts.
The Board also noted that, in 2013, the ad hoc Committee on Management Fees was formed to conduct an in-depth review of the management fee rates of Fidelity's active equity mutual funds. The Committee focused on the following areas: (i) standard fee structures; (ii) research consumption and trading evolution; (iii) management fee competitiveness/profitability by category; and (iv) factors that drive institutional pricing.
Based on its review, the Board concluded that the fund's management fee is fair and reasonable in light of the services that the fund receives and the other factors considered.
Total Expense Ratio. In its review of each class's total expense ratio, the Board considered the fund's management fee rate as well as other fund or class expenses, as applicable, such as transfer agent fees, pricing and bookkeeping fees, fund-paid 12b-1 fees, and custodial, legal, and audit fees. The Board noted the impact of the fund's performance adjustment. The Board also noted that Fidelity may agree to waive fees and expenses from time to time, and the extent to which, if any, it has done so for the fund. As part of its review, the Board also considered the current and historical total expense ratios of each class of the fund compared to competitive fund median expenses. Each class of the fund is compared to those funds and classes in the Total Mapped Group (used by the Board for management fee comparisons) that have a similar sales load structure.
The Board noted that the total expense ratio of the retail class ranked below the competitive median for 2016 and the total expense ratio of each of Class A, Class M (formerly Class T), Class C, and Class I ranked above the competitive median for 2016. The Board considered that, in general, various factors can affect total expense ratios. The Board noted that the total expense ratio of each of Class A, Class M, Class C, and Class I was above the competitive median because of a positive performance fee adjustment in 2016 and relatively higher other expenses due to low asset levels. The Board noted that the total expense ratio of Class M was also above the competitive median because of higher 12b-1 fees on Class M as compared to most competitor funds. Class M has a higher 12b-1 fee, but a lower front-end sales charge, than traditionally priced front-end sales charge classes. The Board considered that Class M is primarily sold load-waived in the retirement plan market where its 0.50% 12b-1 fee is comparable to competing no-load, higher 12b-1 fee classes designed specifically for retirement plans. The Board noted that the total expense ratio of Class C was also above the competitive median because of its 12b-1 fees. The Board also noted that, although Class I is categorized by Lipper as an institutional class, Class I has a significantly lower investment minimum than most other funds and classes categorized as institutional. As a result, FMR believes Class I is generally more comparable to retail funds and classes. The Board noted that the fund offers multiple classes, each of which has a different sales load and 12b-1 fee structure, and that the multiple structures are intended to offer a range of pricing options for the intermediary market. The Board also noted that the total expense ratios of the classes vary primarily by the level of their 12b-1 fees, although differences in transfer agent fees may also cause expenses to vary from class to class.
Fees Charged to Other Fidelity Clients. The Board also considered Fidelity fee structures and other information with respect to clients of Fidelity, such as other funds advised or subadvised by Fidelity, pension plan clients, and other institutional clients with similar mandates. The Board noted that an ad hoc joint committee created by it and the boards of other Fidelity funds periodically (most recently in 2013) reviews and compares Fidelity's institutional investment advisory business with its business of providing services to the Fidelity funds, including the differences in services provided, fees charged, and costs incurred, as well as competition in their respective marketplaces.
Based on its review of total expense ratios and fees charged to other Fidelity clients, the Board concluded that, although some classes were above the median of the universe presented for comparison, the total expense ratio of each class of the fund was reasonable in light of the services that the fund and its shareholders receive and the other factors considered.
Costs of the Services and Profitability. The Board considered the revenues earned and the expenses incurred by Fidelity in conducting the business of developing, marketing, distributing, managing, administering and servicing the fund and servicing the fund's shareholders. The Board also considered the level of Fidelity's profits in respect of all the Fidelity funds.
On an annual basis, Fidelity presents to the Board information about the profitability of its relationships with the fund. Fidelity calculates profitability information for each fund, as well as aggregate profitability information for groups of Fidelity funds and all Fidelity funds, using a series of detailed revenue and cost allocation methodologies which originate with the books and records of Fidelity on which Fidelity's audited financial statements are based. The Audit Committee of the Board reviews any significant changes from the prior year's methodologies.
PricewaterhouseCoopers LLP (PwC), independent registered public accounting firm and auditor to Fidelity and certain Fidelity funds, has been engaged annually by the Board as part of the Board's assessment of Fidelity's profitability analysis. PwC's engagement includes the review and assessment of the methodologies used by Fidelity in determining the revenues and expenses attributable to Fidelity's mutual fund business, and completion of agreed-upon procedures in respect of the mathematical accuracy of the fund profitability information and its conformity to established allocation methodologies. After considering PwC's reports issued under the engagement and information provided by Fidelity, the Board concluded that while other allocation methods may also be reasonable, Fidelity's profitability methodologies are reasonable in all material respects.
The Board also reviewed Fidelity's non-fund businesses and potential fall-out benefits related to the mutual fund business as well as cases where Fidelity's affiliates may benefit from or be related to the fund's business.
The Board considered the costs of the services provided by and the profits realized by Fidelity in connection with the operation of the fund and was satisfied that the profitability was not excessive.
Economies of Scale. The Board considered whether there have been economies of scale in respect of the management of the Fidelity funds, whether the Fidelity funds (including the fund) have appropriately benefited from any such economies of scale, and whether there is potential for realization of any further economies of scale. The Board considered the extent to which the fund will benefit from economies of scale as assets grow through increased services to the fund, through waivers or reimbursements, or through fee or expense ratio reductions. The Board also noted that a committee (the Economies of Scale Committee) created by it and the boards of other Fidelity funds periodically (most recently in 2013) analyzes whether Fidelity attains economies of scale in respect of the management and servicing of the Fidelity funds, whether the Fidelity funds have appropriately benefited from such economies of scale, and whether there is potential for realization of any further economies of scale.
The Board recognized that the fund's management contract incorporates a "group fee" structure, which provides for lower group fee rates as total group assets increase, and for higher group fee rates as total group assets decrease (with "group assets" defined to include fund assets under FMR's management plus the assets of sector funds previously under FMR's management). FMR calculates the group fee rates based on a tiered asset "breakpoint" schedule that varies based on asset class. The Board considered that the group fee is designed to deliver the benefits of economies of scale to fund shareholders when total Fidelity fund assets increase, even if assets of any particular fund are unchanged or have declined, because some portion of Fidelity's costs are attributable to services provided to all Fidelity funds, and all funds benefit if those costs can be allocated among more assets. The Board concluded that, given the group fee structure, fund shareholders will benefit from lower management fees as group assets increase at the fund complex level, regardless of whether Fidelity achieves any such economies of scale.
The Board concluded, taking into account the analysis of the Economies of Scale Committee, that economies of scale, if any, are being appropriately shared between fund shareholders and Fidelity.
Additional Information Requested by the Board. In order to develop fully the factual basis for consideration of the Fidelity funds' advisory contracts, the Board requested and received additional information on certain topics, including: (i) fund performance trends, in particular the underperformance of certain funds, and Fidelity's long-term strategies for certain funds; (ii) Fidelity's fund profitability methodology, profitability trends for certain funds, and the impact of certain factors on fund profitability results, including the impact of market trends on actively managed funds; (iii) the use of performance fees and the calculation of performance adjustments, including the impact of underperformance and fund outflows on performance adjustments; (iv) metrics for evaluating index fund performance; (v) Fidelity's group fee structure, including the group fee breakpoint schedules; (vi) the terms of Fidelity's contractual and voluntary expense cap arrangements with the funds; (vii) the methodology with respect to evaluating competitive fund data and peer group classifications and fee comparisons; (viii) the expense structures for different funds and classes; (ix) Fidelity's arrangements with affiliated sub-advisers on behalf of the funds; (x) information regarding other accounts managed by Fidelity, including institutional accounts and collective investment trusts; (xi) recent changes to the fee structure for certain funds of funds; and (xii) the impact of the Department of Labor's new fiduciary rule on the funds' comparative expense information.
Based on its evaluation of all of the conclusions noted above, and after considering all factors it believed relevant, the Board concluded that the advisory fee structures are fair and reasonable, and that the fund's Advisory Contracts should be renewed.
Corporate Headquarters
245 Summer St.
Boston, MA 02210
www.fidelity.com
FIV-ANN-1217
1.827482.111
Fidelity® Total International Equity Fund
Annual Report October 31, 2017 |
|
Contents
To view a fund's proxy voting guidelines and proxy voting record for the 12-month period ended June 30, visit http://www.fidelity.com/proxyvotingresults or visit the Securities and Exchange Commission's (SEC) web site at http://www.sec.gov.
You may also call 1-800-544-8544 to request a free copy of the proxy voting guidelines.
Standard & Poor's, S&P and S&P 500 are registered service marks of The McGraw-Hill Companies, Inc. and have been licensed for use by Fidelity Distributors Corporation.
Other third-party marks appearing herein are the property of their respective owners.
All other marks appearing herein are registered or unregistered trademarks or service marks of FMR LLC or an affiliated company. © 2017 FMR LLC. All rights reserved.
This report and the financial statements contained herein are submitted for the general information of the shareholders of the Fund. This report is not authorized for distribution to prospective investors in the Fund unless preceded or accompanied by an effective prospectus.
A fund files its complete schedule of portfolio holdings with the SEC for the first and third quarters of each fiscal year on Form N-Q. Forms N-Q are available on the SEC’s web site at http://www.sec.gov. A fund's Forms N-Q may be reviewed and copied at the SEC’s Public Reference Room in Washington, DC. Information regarding the operation of the SEC's Public Reference Room may be obtained by calling 1-800-SEC-0330.
For a complete list of a fund's portfolio holdings, view the most recent holdings listing, semiannual report, or annual report on Fidelity's web site at http://www.fidelity.com, http://www.institutional.fidelity.com, or http://www.401k.com, as applicable.
NOT FDIC INSURED •MAY LOSE VALUE •NO BANK GUARANTEE
Neither the Fund nor Fidelity Distributors Corporation is a bank.
Performance: The Bottom Line
Average annual total return reflects the change in the value of an investment, assuming reinvestment of distributions from dividend income and capital gains (the profits earned upon the sale of securities that have grown in value, if any) and assuming a constant rate of performance each year. The hypothetical investment and the average annual total returns do not reflect the deduction of taxes that a shareholder would pay on fund distributions or the redemption of fund shares. During periods of reimbursement by Fidelity, a fund’s total return will be greater than it would be had the reimbursement not occurred. How a fund did yesterday is no guarantee of how it will do tomorrow.
Average Annual Total Returns
| For the periods ended October 31, 2017 | Past 1 year | Past 5 years | Life of fundA |
| Fidelity® Total International Equity Fund | 23.86% | 8.09% | 1.51% |
A From November 1, 2007
$10,000 Over Life of Fund
Let's say hypothetically that $10,000 was invested in Fidelity® Total International Equity Fund, a class of the fund, on November 1, 2007, when the fund started.
The chart shows how the value of your investment would have changed, and also shows how the MSCI ACWI (All Country World Index) ex USA Index performed over the same period.
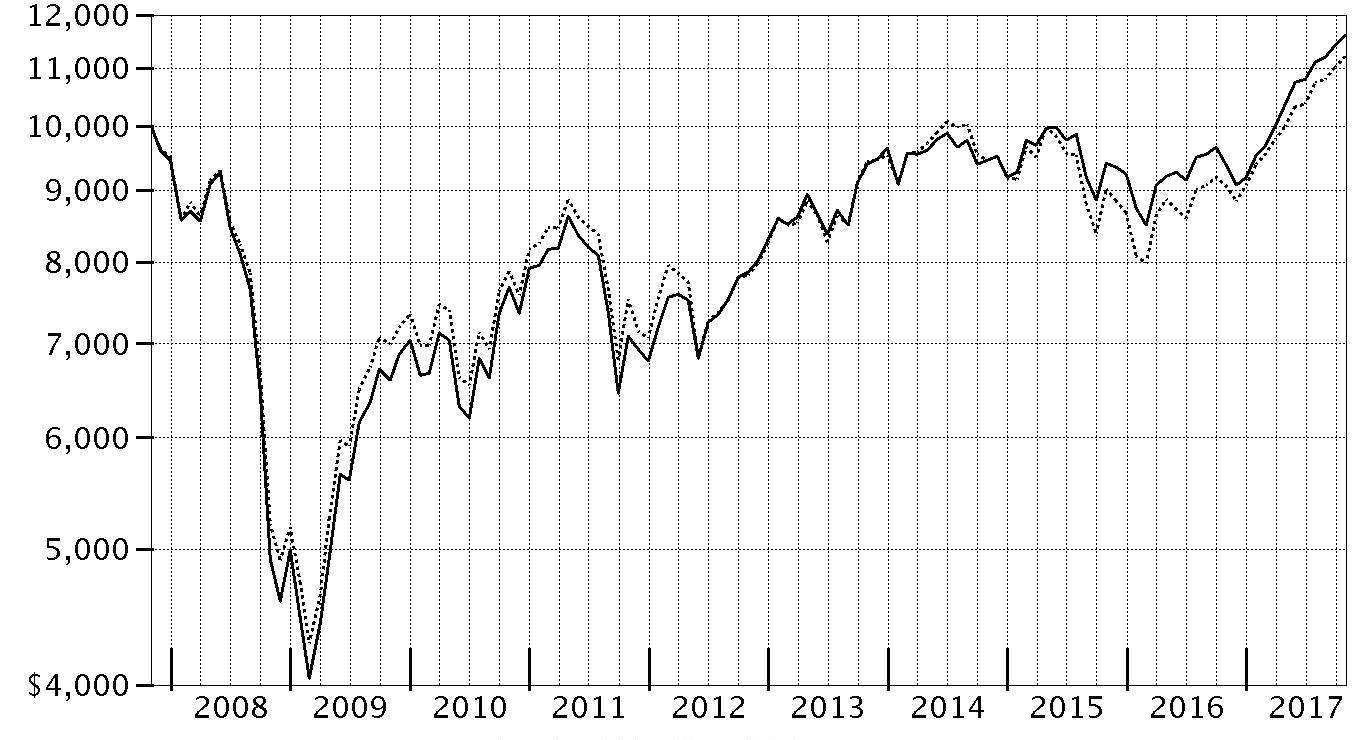
| Period Ending Values |
| $11,612 | Fidelity® Total International Equity Fund |
| $11,218 | MSCI ACWI (All Country World Index) ex USA Index |
Management's Discussion of Fund Performance
Market Recap: The MSCI ACWI (All Country World Index) ex USA Index returned 23.85% for the 12 months ending October 31, 2017, helped partly by a generally weak U.S. dollar. Some favorable election results in continental Europe (+30%) suggested ebbing political uncertainty and near-term risk there, but the U.K. (+20%) faced more-mixed conditions ahead of its expected exit from the European Union. Despite central-bank easing – and pressured recently by yen strength – Japan (+18%) lagged the rest of the Asia-Pacific group (+22%). Commodity-price volatility slowed Canada (+17%), but the emerging-markets group (+26%) sped ahead. Sector-wise, information technology (+47%) was driven by a surge among several Chinese internet-related names. Financials (+27%) rode rising interest rates that, at the same time, weighed on real estate (+17%), utilities (+16%), consumer staples (+14%) and telecom services (+9%) – so-called “bond proxy” sectors. Materials (+28%) and industrials (+27%) responded to demand from China and gains in certain commodity prices. In energy (+20%), oil prices lost ground in the spring before rebounding through October 31 to end well above where they started 12 months ago. Lastly, health care (+14%) was hurt by early-period turmoil around drug pricing and health care legislation.
Comments from Co-Portfolio Manager Alex Zavratsky: For the fiscal year, the fund’s share classes (excluding sales charges, if applicable) posted gains of about 23% to 24%, roughly in line with the 23.85% return of the MSCI ACWI (All Country World Index) ex USA Index. Versus the benchmark, the fund was helped by favorable stock picks in emerging markets, especially India, China and South Africa. Selection in Japan and the rest of Asia-Pacific also added value. In contrast, the fund was hampered by out-of-index U.S. picks. Individually , our top contributor was a non-index stake in a convertible security issued by Indian jewelry retailer PC Jeweller (+58%). Out-of-index Interpump Group, an Italian maker of specialty pumps, also helped; its value more than doubled this period. Other contributors were ASML Holding (+74%), a Dutch manufacturer of semiconductor equipment, and Intercontinental Hotels Group (+54%), a U.K.-based hotel operator. In contrast, our biggest individual detractor was an overweighting in Canadian quick-mart operator Alimentation-Couche Tard (-6%). Weaker-than-expected earnings guidance weighed on shares of out-of-index U.S.-based Molson Coors Brewing (-21%). U.K.-based consumer goods company Reckitt Benckiser Group (+2%) also detracted.
The views expressed above reflect those of the portfolio manager(s) only through the end of the period as stated on the cover of this report and do not necessarily represent the views of Fidelity or any other person in the Fidelity organization. Any such views are subject to change at any time based upon market or other conditions and Fidelity disclaims any responsibility to update such views. These views may not be relied on as investment advice and, because investment decisions for a Fidelity fund are based on numerous factors, may not be relied on as an indication of trading intent on behalf of any Fidelity fund.
Note to Shareholders: Following a roughly five-month leave of absence, Jed Weiss returned to Fidelity on November 29, 2017, and resumed his day-to-day responsibilities as Co-Portfolio Manager. In his stead, Vincent Montemaggiore served as interim manager of the fund's developed-growth subportfolio, while Patrick Drouot and Patrick Buchanan served (and remain) as co-managers of the developed small-cap sleeve.
Investment Summary (Unaudited)
Geographic Diversification (% of fund's net assets)
| As of October 31, 2017 |
| | Japan | 12.9% |
| | United States of America* | 10.1% |
| | United Kingdom | 9.8% |
| | France | 5.9% |
| | Switzerland | 5.8% |
| | Cayman Islands | 5.3% |
| | Canada | 4.9% |
| | Germany | 4.6% |
| | India | 4.1% |
| | Other | 36.6% |

* Includes Short-Term investments and Net Other Assets (Liabilities).
| As of April 30, 2017 |
| | Japan | 12.7% |
| | United States of America* | 11.3% |
| | United Kingdom | 11.0% |
| | Switzerland | 5.9% |
| | France | 5.5% |
| | Canada | 4.8% |
| | Germany | 4.4% |
| | Sweden | 3.5% |
| | India | 3.3% |
| | Other | 37.6% |

* Includes Short-Term investments and Net Other Assets (Liabilities).
Percentages are based on country or territory of incorporation and are adjusted for the effect of futures contracts, if applicable.
Asset Allocation as of October 31, 2017
| | % of fund's net assets | % of fund's net assets 6 months ago |
| Stocks | 98.0 | 97.5 |
| Investment Companies | 0.0 | 0.4 |
| Short-Term Investments and Net Other Assets (Liabilities) | 2.0 | 2.1 |
Top Ten Stocks as of October 31, 2017
| | % of fund's net assets | % of fund's net assets 6 months ago |
| Nestle SA (Reg. S) (Switzerland, Food Products) | 2.1 | 2.1 |
| Alibaba Group Holding Ltd. sponsored ADR (Cayman Islands, Internet Software & Services) | 1.7 | 1.1 |
| Samsung Electronics Co. Ltd. (Korea (South), Technology Hardware, Storage & Peripherals) | 1.6 | 1.3 |
| Taiwan Semiconductor Manufacturing Co. Ltd. (Taiwan, Semiconductors & Semiconductor Equipment) | 1.5 | 1.3 |
| Tencent Holdings Ltd. (Cayman Islands, Internet Software & Services) | 1.4 | 1.1 |
| Naspers Ltd. Class N (South Africa, Media) | 1.3 | 1.1 |
| SAP SE (Germany, Software) | 1.2 | 1.2 |
| Anheuser-Busch InBev SA NV (Belgium, Beverages) | 1.0 | 1.3 |
| Total SA (France, Oil, Gas & Consumable Fuels) | 1.0 | 1.0 |
| British American Tobacco PLC (United Kingdom) (United Kingdom, Tobacco) | 1.0 | 1.1 |
| | 13.8 | |
Top Market Sectors as of October 31, 2017
| | % of fund's net assets | % of fund's net assets 6 months ago |
| Financials | 20.0 | 19.3 |
| Information Technology | 18.4 | 15.5 |
| Industrials | 13.4 | 12.9 |
| Consumer Discretionary | 10.5 | 10.0 |
| Consumer Staples | 10.1 | 12.2 |
| Health Care | 8.8 | 9.9 |
| Materials | 7.7 | 8.9 |
| Energy | 4.6 | 4.2 |
| Real Estate | 1.8 | 1.8 |
| Telecommunication Services | 1.7 | 1.8 |
Percentages shown as 0.0% may reflect amounts less than 0.05%.
Investments October 31, 2017
Showing Percentage of Net Assets
| Common Stocks - 97.3% | | | |
| | | Shares | Value |
| Argentina - 0.4% | | | |
| Banco Macro SA sponsored ADR | | 1,200 | $151,104 |
| IRSA Propiedades Comerciales SA sponsored ADR | | 2,700 | 151,200 |
| Telecom Argentina SA Class B sponsored ADR (a) | | 4,800 | 156,528 |
|
| TOTAL ARGENTINA | | | 458,832 |
|
| Australia - 2.6% | | | |
| Adelaide Brighton Ltd. | | 4,581 | 21,773 |
| Amcor Ltd. | | 12,834 | 155,588 |
| Australia & New Zealand Banking Group Ltd. | | 30,502 | 698,474 |
| Beacon Lighting Group Ltd. | | 12,420 | 13,878 |
| CSL Ltd. | | 10,376 | 1,103,281 |
| DuluxGroup Ltd. | | 9,609 | 54,201 |
| Imdex Ltd. (a) | | 41,011 | 30,446 |
| Insurance Australia Group Ltd. | | 40,136 | 201,511 |
| Macquarie Group Ltd. | | 4,936 | 371,543 |
| Magellan Financial Group Ltd. | | 6,475 | 120,273 |
| RCG Corp. Ltd. | | 28,933 | 16,608 |
| Transurban Group unit | | 26,542 | 246,408 |
|
| TOTAL AUSTRALIA | | | 3,033,984 |
|
| Austria - 0.9% | | | |
| Andritz AG | | 8,572 | 484,676 |
| BUWOG-Gemeinnuetzige Wohnung | | 8,698 | 250,865 |
| Erste Group Bank AG | | 7,000 | 300,799 |
|
| TOTAL AUSTRIA | | | 1,036,340 |
|
| Bailiwick of Jersey - 0.3% | | | |
| Integrated Diagnostics Holdings PLC | | 7,500 | 29,250 |
| Shire PLC | | 2,700 | 132,990 |
| Wolseley PLC | | 3,068 | 214,536 |
|
| TOTAL BAILIWICK OF JERSEY | | | 376,776 |
|
| Belgium - 1.8% | | | |
| Anheuser-Busch InBev SA NV | | 10,171 | 1,247,181 |
| KBC Ancora | | 1,311 | 78,188 |
| KBC Groep NV | | 9,616 | 798,757 |
|
| TOTAL BELGIUM | | | 2,124,126 |
|
| Bermuda - 0.1% | | | |
| Credicorp Ltd. (United States) | | 212 | 44,401 |
| Vostok New Ventures Ltd. (depositary receipt) (a) | | 3,860 | 31,815 |
|
| TOTAL BERMUDA | | | 76,216 |
|
| Brazil - 1.2% | | | |
| BM&F BOVESPA SA | | 32,900 | 240,366 |
| BTG Pactual Participations Ltd. unit | | 24,400 | 164,168 |
| Equatorial Energia SA | | 8,900 | 165,958 |
| Estacio Participacoes SA | | 17,300 | 155,109 |
| IRB Brasil Resseguros SA | | 16,100 | 161,477 |
| Itau Unibanco Holding SA | | 3,000 | 35,234 |
| Kroton Educacional SA | | 33,100 | 182,028 |
| Qualicorp SA | | 15,200 | 162,626 |
| Smiles Fidelidade SA | | 6,088 | 159,118 |
|
| TOTAL BRAZIL | | | 1,426,084 |
|
| Canada - 4.9% | | | |
| Alimentation Couche-Tard, Inc. Class B (sub. vtg.) | | 19,222 | 901,278 |
| Canadian National Railway Co. | | 9,763 | 785,596 |
| Canadian Pacific Railway Ltd. | | 1,853 | 321,277 |
| CCL Industries, Inc. Class B | | 12,890 | 621,270 |
| Constellation Software, Inc. | | 1,157 | 658,255 |
| Franco-Nevada Corp. | | 6,859 | 545,062 |
| Imperial Oil Ltd. | | 15,284 | 495,566 |
| McCoy Global, Inc. (a) | | 7,100 | 9,961 |
| New Look Vision Group, Inc. | | 1,300 | 34,644 |
| Pason Systems, Inc. | | 17,691 | 256,842 |
| Potash Corp. of Saskatchewan, Inc. | | 38,414 | 747,675 |
| PrairieSky Royalty Ltd. | | 12,173 | 324,022 |
| ShawCor Ltd. Class A | | 800 | 17,338 |
|
| TOTAL CANADA | | | 5,718,786 |
|
| Cayman Islands - 5.3% | | | |
| 58.com, Inc. ADR (a) | | 6,100 | 409,737 |
| Alibaba Group Holding Ltd. sponsored ADR (a) | | 10,482 | 1,938,017 |
| Baidu.com, Inc. sponsored ADR (a) | | 2,300 | 561,062 |
| China Biologic Products Holdings, Inc. | | 300 | 23,313 |
| China Literature Ltd. | | 29 | 204 |
| Ctrip.com International Ltd. ADR (a) | | 5,180 | 248,070 |
| JD.com, Inc. sponsored ADR (a) | | 8,000 | 300,160 |
| Melco Crown Entertainment Ltd. sponsored ADR | | 6,600 | 166,848 |
| NetEase, Inc. ADR | | 1,053 | 296,862 |
| New Oriental Education & Technology Group, Inc. sponsored ADR | | 2,660 | 221,418 |
| Sands China Ltd. | | 31,600 | 148,858 |
| Shenzhou International Group Holdings Ltd. | | 22,000 | 187,812 |
| Tencent Holdings Ltd. | | 37,700 | 1,694,431 |
| Value Partners Group Ltd. | | 20,000 | 19,817 |
|
| TOTAL CAYMAN ISLANDS | | | 6,216,609 |
|
| China - 2.1% | | | |
| Gree Electric Appliances, Inc. of Zhuhai Class A | | 25,100 | 160,968 |
| Hangzhou Hikvision Digital Technology Co. Ltd. Class A | | 31,400 | 185,895 |
| Hangzhou Robam Appliances Co. Ltd. Class A | | 24,600 | 172,295 |
| Inner Mongoli Yili Industries Co. Ltd. (A Shares) | | 36,182 | 161,145 |
| Jiangsu Yanghe Brewery Joint-Stock Co. Ltd. Class A | | 9,400 | 156,183 |
| Kweichow Moutai Co. Ltd. (A Shares) | | 1,694 | 157,793 |
| Midea Group Co. Ltd. Class A | | 22,700 | 174,486 |
| Ping An Insurance (Group) Co. of China Ltd. (H Shares) | | 50,500 | 443,414 |
| Shanghai International Airport Co. Ltd. (A Shares) | | 26,800 | 176,717 |
| Shenzhen Inovance Technology Co. Ltd. Class A | | 35,900 | 166,977 |
| Tonghua Dongbao Pharmaceutical Co. Ltd. Class A | | 46,800 | 152,499 |
| Wuliangye Yibin Co. Ltd. Class A | | 18,000 | 180,735 |
| Yunnan Baiyao Group Co. Ltd. | | 10,400 | 164,333 |
|
| TOTAL CHINA | | | 2,453,440 |
|
| Denmark - 0.5% | | | |
| Jyske Bank A/S (Reg.) | | 4,554 | 257,347 |
| Novo Nordisk A/S Series B sponsored ADR | | 6,200 | 308,698 |
| Scandinavian Tobacco Group A/S | | 1,711 | 28,926 |
| Spar Nord Bank A/S | | 3,631 | 46,181 |
|
| TOTAL DENMARK | | | 641,152 |
|
| Finland - 0.5% | | | |
| Sampo Oyj (A Shares) | | 7,453 | 390,500 |
| Tikkurila Oyj | | 7,680 | 151,814 |
|
| TOTAL FINLAND | | | 542,314 |
|
| France - 5.9% | | | |
| Atos Origin SA | | 3,047 | 473,476 |
| AXA SA | | 19,306 | 582,818 |
| Bouygues SA | | 4,344 | 208,552 |
| Capgemini SA | | 2,802 | 340,589 |
| Compagnie de St. Gobain | | 3,900 | 228,781 |
| Dassault Systemes SA | | 1,484 | 157,600 |
| Edenred SA | | 5,300 | 152,799 |
| Elis SA | | 12,251 | 319,590 |
| Essilor International SA | | 2,370 | 300,087 |
| Kering SA | | 400 | 183,347 |
| Laurent-Perrier Group SA | | 259 | 24,290 |
| LVMH Moet Hennessy - Louis Vuitton SA | | 577 | 172,098 |
| Natixis SA | | 29,300 | 229,764 |
| Rubis | | 2,400 | 150,629 |
| Sanofi SA | | 4,403 | 416,905 |
| Societe Generale Series A | | 9,900 | 550,980 |
| SR Teleperformance SA | | 2,000 | 292,144 |
| Total SA | | 21,791 | 1,214,590 |
| Vetoquinol SA | | 600 | 38,727 |
| VINCI SA | | 5,200 | 509,109 |
| Virbac SA (a) | | 190 | 24,467 |
| Vivendi SA | | 13,052 | 324,217 |
|
| TOTAL FRANCE | | | 6,895,559 |
|
| Germany - 4.5% | | | |
| adidas AG | | 643 | 143,096 |
| BASF AG | | 6,450 | 703,394 |
| Bayer AG | | 6,000 | 780,474 |
| Brenntag AG | | 3,000 | 169,888 |
| CompuGroup Medical AG | | 2,146 | 123,314 |
| CTS Eventim AG | | 1,994 | 82,363 |
| Deutsche Post AG | | 6,383 | 292,354 |
| Deutsche Telekom AG | | 19,900 | 360,336 |
| Fielmann AG | | 358 | 31,380 |
| Fresenius SE & Co. KGaA | | 2,200 | 183,769 |
| HeidelbergCement Finance AG | | 2,500 | 254,724 |
| Linde AG (a) | | 1,300 | 280,071 |
| Nexus AG | | 1,120 | 33,992 |
| SAP SE | | 12,710 | 1,452,278 |
| Vonovia SE | | 8,265 | 363,534 |
|
| TOTAL GERMANY | | | 5,254,967 |
|
| Greece - 0.1% | | | |
| Titan Cement Co. SA (Reg.) | | 5,600 | 135,160 |
| Hong Kong - 1.4% | | | |
| AIA Group Ltd. | | 144,800 | 1,089,517 |
| CSPC Pharmaceutical Group Ltd. | | 120,000 | 208,578 |
| Guangdong Investment Ltd. | | 120,000 | 173,815 |
| Techtronic Industries Co. Ltd. | | 29,500 | 172,998 |
|
| TOTAL HONG KONG | | | 1,644,908 |
|
| Hungary - 0.2% | | | |
| OTP Bank PLC | | 5,600 | 225,836 |
| India - 4.1% | | | |
| Adani Ports & Special Economic Zone Ltd. | | 31,097 | 206,681 |
| Asian Paints Ltd. | | 10,640 | 194,042 |
| Bharat Petroleum Corp. Ltd. | | 24,563 | 205,457 |
| Eicher Motors Ltd. | | 361 | 179,711 |
| Godrej Consumer Products Ltd. | | 12,509 | 180,419 |
| HDFC Bank Ltd. | | 5,555 | 155,486 |
| Hero Motocorp Ltd. | | 2,965 | 176,293 |
| Housing Development Finance Corp. Ltd. | | 29,517 | 778,337 |
| Indraprastha Gas Ltd. | | 6,474 | 158,491 |
| IndusInd Bank Ltd. | | 5,761 | 144,772 |
| ITC Ltd. | | 58,599 | 240,460 |
| Jyothy Laboratories Ltd. | | 6,583 | 39,996 |
| Kotak Mahindra Bank Ltd. | | 10,458 | 165,559 |
| LIC Housing Finance Ltd. | | 18,425 | 170,364 |
| Maruti Suzuki India Ltd. | | 1,921 | 243,611 |
| PC Jeweller Ltd. | | 54,116 | 293,188 |
| Power Grid Corp. of India Ltd. | | 48,058 | 157,237 |
| Reliance Industries Ltd. | | 28,137 | 408,845 |
| Shree Cement Ltd. | | 590 | 172,493 |
| Ultratech Cemco Ltd. | | 2,998 | 203,774 |
| UPL Ltd. | | 14,531 | 179,377 |
| Vakrangee Ltd. | | 18,723 | 162,594 |
|
| TOTAL INDIA | | | 4,817,187 |
|
| Indonesia - 0.8% | | | |
| PT Bank Central Asia Tbk | | 170,000 | 261,972 |
| PT Bank Rakyat Indonesia Tbk | | 414,700 | 477,001 |
| PT Telkomunikasi Indonesia Tbk Series B | | 836,100 | 249,465 |
|
| TOTAL INDONESIA | | | 988,438 |
|
| Ireland - 1.5% | | | |
| Allergan PLC | | 800 | 141,784 |
| CRH PLC | | 6,548 | 246,414 |
| CRH PLC sponsored ADR | | 19,129 | 717,720 |
| FBD Holdings PLC (a) | | 2,272 | 23,687 |
| James Hardie Industries PLC CDI | | 37,351 | 568,587 |
| Medtronic PLC | | 1,400 | 112,728 |
|
| TOTAL IRELAND | | | 1,810,920 |
|
| Isle of Man - 0.2% | | | |
| Playtech Ltd. | | 21,343 | 278,932 |
| Israel - 0.7% | | | |
| Azrieli Group | | 2,196 | 123,918 |
| Check Point Software Technologies Ltd. (a) | | 1,334 | 157,025 |
| Elbit Systems Ltd. (Israel) | | 1,100 | 163,067 |
| Frutarom Industries Ltd. | | 1,900 | 156,425 |
| Ituran Location & Control Ltd. | | 1,861 | 66,066 |
| Strauss Group Ltd. | | 2,659 | 54,143 |
| Teva Pharmaceutical Industries Ltd. sponsored ADR | | 2,809 | 38,764 |
|
| TOTAL ISRAEL | | | 759,408 |
|
| Italy - 0.9% | | | |
| Azimut Holding SpA | | 6,614 | 130,665 |
| Beni Stabili SpA SIIQ | | 36,526 | 32,336 |
| Interpump Group SpA | | 13,191 | 444,218 |
| Intesa Sanpaolo SpA | | 139,300 | 468,314 |
|
| TOTAL ITALY | | | 1,075,533 |
|
| Japan - 12.9% | | | |
| AEON Financial Service Co. Ltd. | | 7,000 | 150,335 |
| Ai Holdings Corp. | | 1,100 | 27,007 |
| Aoki Super Co. Ltd. | | 2,000 | 22,910 |
| Artnature, Inc. | | 3,300 | 21,680 |
| Asahi Co. Ltd. | | 1,900 | 23,097 |
| Astellas Pharma, Inc. | | 17,100 | 227,581 |
| Aucnet, Inc. | | 400 | 5,290 |
| Azbil Corp. | | 3,400 | 148,467 |
| Broadleaf Co. Ltd. | | 3,900 | 32,020 |
| Central Automotive Products Ltd. | | 2,400 | 39,054 |
| Coca-Cola West Co. Ltd. | | 1,000 | 34,989 |
| Daiichikosho Co. Ltd. | | 1,200 | 56,547 |
| Daikokutenbussan Co. Ltd. | | 1,000 | 45,527 |
| DENSO Corp. | | 7,000 | 385,518 |
| East Japan Railway Co. | | 5,900 | 572,180 |
| Fujitsu Ltd. | | 16,000 | 124,680 |
| Funai Soken Holdings, Inc. | | 1,300 | 47,764 |
| GCA Savvian Group Corp. | | 3,100 | 28,375 |
| Goldcrest Co. Ltd. | | 2,960 | 64,130 |
| Hoya Corp. | | 13,600 | 738,898 |
| Itochu Corp. | | 25,400 | 444,923 |
| Japan Tobacco, Inc. | | 8,420 | 278,704 |
| Kao Corp. | | 3,500 | 211,523 |
| KDDI Corp. | | 13,500 | 359,676 |
| Keyence Corp. | | 1,842 | 1,022,724 |
| Kobayashi Pharmaceutical Co. Ltd. | | 1,200 | 69,385 |
| Komatsu Ltd. | | 11,900 | 388,842 |
| Koshidaka Holdings Co. Ltd. | | 1,200 | 48,542 |
| Kusuri No Aoki Holdings Co. Ltd. | | 500 | 27,749 |
| Lasertec Corp. | | 2,900 | 63,805 |
| Makita Corp. | | 6,100 | 255,643 |
| Medikit Co. Ltd. | | 500 | 24,174 |
| Miroku Jyoho Service Co., Ltd. | | 1,200 | 28,024 |
| Misumi Group, Inc. | | 17,500 | 479,457 |
| Mitsubishi UFJ Financial Group, Inc. | | 121,500 | 824,152 |
| Mitsui Fudosan Co. Ltd. | | 10,400 | 242,746 |
| Nabtesco Corp. | | 1,400 | 55,617 |
| Nagaileben Co. Ltd. | | 2,800 | 69,865 |
| Nakano Refrigerators Co. Ltd. | | 700 | 24,938 |
| ND Software Co. Ltd. | | 1,300 | 15,836 |
| Nihon Parkerizing Co. Ltd. | | 6,900 | 113,113 |
| Nintendo Co. Ltd. | | 1,100 | 426,758 |
| Nippon Telegraph & Telephone Corp. | | 6,700 | 323,928 |
| Nomura Holdings, Inc. | | 34,600 | 198,008 |
| NS Tool Co. Ltd. | | 1,000 | 19,560 |
| OBIC Co. Ltd. | | 5,600 | 370,671 |
| Olympus Corp. | | 12,100 | 450,298 |
| Oracle Corp. Japan | | 2,200 | 186,154 |
| ORIX Corp. | | 23,900 | 410,927 |
| OSG Corp. | | 12,800 | 277,054 |
| Panasonic Corp. | | 18,000 | 271,789 |
| Paramount Bed Holdings Co. Ltd. | | 1,300 | 57,329 |
| ProNexus, Inc. | | 2,900 | 35,194 |
| Recruit Holdings Co. Ltd. | | 10,800 | 264,791 |
| San-Ai Oil Co. Ltd. | | 3,500 | 41,802 |
| Seven & i Holdings Co. Ltd. | | 5,400 | 217,644 |
| Shin-Etsu Chemical Co. Ltd. | | 3,500 | 369,114 |
| Shinsei Bank Ltd. | | 11,000 | 185,633 |
| SHO-BOND Holdings Co. Ltd. | | 6,040 | 371,692 |
| Shoei Co. Ltd. | | 1,700 | 57,075 |
| SK Kaken Co. Ltd. | | 100 | 8,308 |
| Software Service, Inc. | | 500 | 23,035 |
| Sony Corp. | | 5,900 | 246,825 |
| Sony Financial Holdings, Inc. | | 12,300 | 204,346 |
| Subaru Corp. | | 4,500 | 155,471 |
| Taiheiyo Cement Corp. | | 4,900 | 195,848 |
| Techno Medica Co. Ltd. | | 500 | 8,692 |
| The Monogatari Corp. | | 480 | 35,367 |
| TKC Corp. | | 1,200 | 37,771 |
| Tocalo Co. Ltd. | | 300 | 12,106 |
| Tokio Marine Holdings, Inc. | | 7,400 | 318,993 |
| Toyota Motor Corp. | | 12,600 | 781,529 |
| USS Co. Ltd. | | 31,800 | 642,831 |
| Welcia Holdings Co. Ltd. | | 1,000 | 37,952 |
| Workman Co. Ltd. | | 1,300 | 40,522 |
| Yamada Consulting Group Co. Ltd. | | 2,400 | 46,367 |
| Yamato Kogyo Co. Ltd. | | 600 | 16,049 |
|
| TOTAL JAPAN | | | 15,192,920 |
|
| Kenya - 0.3% | | | |
| Safaricom Ltd. | | 1,502,200 | 369,215 |
| Korea (South) - 2.0% | | | |
| BGFretail Co. Ltd. (b) | | 4,677 | 330,877 |
| Leeno Industrial, Inc. | | 349 | 15,982 |
| NAVER Corp. | | 195 | 155,918 |
| Samsung Electronics Co. Ltd. | | 757 | 1,864,589 |
|
| TOTAL KOREA (SOUTH) | | | 2,367,366 |
|
| Mexico - 1.4% | | | |
| CEMEX S.A.B. de CV sponsored ADR | | 29,543 | 239,594 |
| Consorcio ARA S.A.B. de CV | | 61,255 | 21,663 |
| Embotelladoras Arca S.A.B. de CV | | 26,100 | 166,102 |
| Fomento Economico Mexicano S.A.B. de CV: | | | |
| unit | | 29,600 | 258,409 |
| sponsored ADR | | 1,733 | 152,071 |
| Gruma S.A.B. de CV Series B | | 12,315 | 161,314 |
| Grupo Aeroportuario del Pacifico S.A.B. de CV Series B | | 18,500 | 175,459 |
| Grupo Aeroportuario del Sureste S.A.B. de CV Series B | | 10,565 | 188,422 |
| Grupo Aeroportuario Norte S.A.B. de CV | | 29,900 | 150,874 |
| Grupo Cementos de Chihuahua S.A.B. de CV | | 29,900 | 142,811 |
|
| TOTAL MEXICO | | | 1,656,719 |
|
| Netherlands - 2.4% | | | |
| Aalberts Industries NV | | 1,700 | 83,853 |
| ASML Holding NV (Netherlands) | | 5,900 | 1,064,534 |
| ING Groep NV (Certificaten Van Aandelen) | | 30,676 | 566,877 |
| Koninklijke Philips Electronics NV | | 5,800 | 236,367 |
| RELX NV | | 15,085 | 340,716 |
| Takeaway.com Holding BV (a)(c) | | 500 | 23,632 |
| VastNed Retail NV | | 596 | 26,090 |
| Wolters Kluwer NV | | 4,100 | 200,969 |
| X5 Retail Group NV GDR (Reg. S) (a) | | 3,700 | 152,070 |
| Yandex NV Series A (a) | | 4,897 | 165,666 |
|
| TOTAL NETHERLANDS | | | 2,860,774 |
|
| New Zealand - 0.1% | | | |
| Auckland International Airport Ltd. | | 23,280 | 99,247 |
| Norway - 0.5% | | | |
| Kongsberg Gruppen ASA | | 1,800 | 32,835 |
| Skandiabanken ASA | | 1,800 | 18,236 |
| Statoil ASA (d) | | 27,056 | 549,711 |
|
| TOTAL NORWAY | | | 600,782 |
|
| Panama - 0.1% | | | |
| Copa Holdings SA Class A | | 1,200 | 147,828 |
| Philippines - 0.7% | | | |
| Ayala Corp. | | 9,625 | 192,368 |
| Ayala Land, Inc. | | 241,200 | 201,992 |
| Jollibee Food Corp. | | 7,250 | 34,995 |
| SM Investments Corp. | | 10,920 | 202,161 |
| SM Prime Holdings, Inc. | | 287,900 | 206,498 |
|
| TOTAL PHILIPPINES | | | 838,014 |
|
| Portugal - 0.2% | | | |
| Galp Energia SGPS SA Class B | | 12,041 | 223,854 |
| Russia - 0.3% | | | |
| Sberbank of Russia | | 111,140 | 368,277 |
| South Africa - 2.5% | | | |
| Bidcorp Ltd. | | 9,145 | 201,156 |
| Capitec Bank Holdings Ltd. | | 2,624 | 174,424 |
| Clicks Group Ltd. | | 22,157 | 248,278 |
| Discovery Ltd. | | 16,422 | 170,216 |
| FirstRand Ltd. | | 58,250 | 211,144 |
| Mondi Ltd. | | 7,214 | 173,044 |
| Naspers Ltd. Class N | | 6,218 | 1,515,057 |
| Sanlam Ltd. | | 37,926 | 189,647 |
|
| TOTAL SOUTH AFRICA | | | 2,882,966 |
|
| Spain - 2.9% | | | |
| Amadeus IT Holding SA Class A | | 11,600 | 787,089 |
| Banco Santander SA (Spain) | | 117,340 | 795,485 |
| Banco Santander SA (Spain) rights 11/1/17 (a) | | 111,640 | 5,332 |
| CaixaBank SA | | 59,006 | 276,170 |
| Hispania Activos Inmobiliarios SA | | 8,395 | 144,777 |
| Iberdrola SA | | 41,454 | 335,020 |
| Inditex SA | | 13,057 | 488,147 |
| Merlin Properties Socimi SA | | 10,300 | 135,937 |
| Prosegur Compania de Seguridad SA (Reg.) | | 35,876 | 273,726 |
| Unicaja Banco SA | | 81,600 | 118,815 |
|
| TOTAL SPAIN | | | 3,360,498 |
|
| Sweden - 3.5% | | | |
| Addlife AB | | 1,000 | 19,709 |
| AddTech AB (B Shares) | | 2,400 | 53,179 |
| Alfa Laval AB | | 11,100 | 281,224 |
| ASSA ABLOY AB (B Shares) | | 35,300 | 744,225 |
| Atlas Copco AB (A Shares) | | 13,100 | 574,596 |
| Essity AB Class B | | 6,700 | 200,320 |
| Fagerhult AB | | 26,325 | 334,108 |
| Investor AB (B Shares) | | 7,589 | 376,112 |
| Lagercrantz Group AB (B Shares) | | 3,800 | 40,398 |
| Loomis AB (B Shares) | | 1,200 | 48,148 |
| Nordea Bank AB | | 46,267 | 559,295 |
| Saab AB (B Shares) | | 1,200 | 61,321 |
| Svenska Cellulosa AB (SCA) (B Shares) | | 6,700 | 62,905 |
| Svenska Handelsbanken AB (A Shares) | | 19,845 | 284,460 |
| Swedbank AB (A Shares) | | 15,200 | 377,292 |
| Telefonaktiebolaget LM Ericsson (B Shares) | | 15,000 | 94,396 |
|
| TOTAL SWEDEN | | | 4,111,688 |
|
| Switzerland - 5.8% | | | |
| Compagnie Financiere Richemont SA Series A | | 1,617 | 149,065 |
| Credit Suisse Group AG | | 27,727 | 436,945 |
| Lafargeholcim Ltd. (Reg.) | | 3,810 | 215,199 |
| Nestle SA (Reg. S) | | 29,232 | 2,459,536 |
| Novartis AG | | 13,309 | 1,097,717 |
| Roche Holding AG (participation certificate) | | 3,262 | 753,950 |
| Schindler Holding AG: | | | |
| (participation certificate) | | 1,445 | 327,484 |
| (Reg.) | | 324 | 71,545 |
| Sika AG | | 20 | 148,048 |
| Tecan Group AG | | 190 | 40,184 |
| UBS Group AG | | 32,889 | 559,442 |
| Zurich Insurance Group AG | | 1,674 | 510,934 |
|
| TOTAL SWITZERLAND | | | 6,770,049 |
|
| Taiwan - 1.9% | | | |
| Addcn Technology Co. Ltd. | | 2,772 | 25,110 |
| Advantech Co. Ltd. | | 24,599 | 168,140 |
| Taiwan Semiconductor Manufacturing Co. Ltd. | | 222,035 | 1,796,279 |
| United Microelectronics Corp. | | 381,000 | 196,776 |
|
| TOTAL TAIWAN | | | 2,186,305 |
|
| Thailand - 0.2% | | | |
| Airports of Thailand PCL (For. Reg.) | | 114,000 | 204,184 |
| Turkey - 0.7% | | | |
| Koc Holding A/S | | 41,000 | 183,301 |
| Tofas Turk Otomobil Fabrikasi A/S | | 18,167 | 147,882 |
| Tupras Turkiye Petrol Rafinerileri A/S | | 9,000 | 323,839 |
| Turkcell Iletisim Hizmet A/S | | 48,000 | 179,294 |
|
| TOTAL TURKEY | | | 834,316 |
|
| United Arab Emirates - 0.1% | | | |
| DP World Ltd. | | 7,131 | 169,361 |
| United Kingdom - 9.8% | | | |
| Alliance Pharma PLC | | 18,714 | 14,851 |
| AstraZeneca PLC (United Kingdom) | | 8,942 | 605,024 |
| Aviva PLC | | 48,053 | 322,299 |
| Avon Rubber PLC | | 900 | 11,702 |
| BAE Systems PLC | | 77,102 | 607,359 |
| BHP Billiton PLC | | 28,081 | 508,425 |
| BP PLC | | 148,377 | 1,006,391 |
| British American Tobacco PLC (United Kingdom) | | 18,475 | 1,193,667 |
| Bunzl PLC | | 9,846 | 306,655 |
| Compass Group PLC | | 14,092 | 309,380 |
| Dechra Pharmaceuticals PLC | | 2,900 | 79,190 |
| Diageo PLC | | 4,325 | 147,694 |
| DP Poland PLC (a) | | 40,100 | 22,369 |
| Elementis PLC | | 39,008 | 147,291 |
| GlaxoSmithKline PLC | | 24,823 | 445,507 |
| Great Portland Estates PLC | | 5,388 | 44,475 |
| Hilton Food Group PLC (e) | | 2,654 | 31,442 |
| Howden Joinery Group PLC | | 23,600 | 128,543 |
| HSBC Holdings PLC sponsored ADR | | 7,489 | 365,239 |
| Imperial Tobacco Group PLC | | 4,636 | 189,060 |
| Informa PLC | | 76,509 | 708,260 |
| InterContinental Hotel Group PLC | | 3,000 | 166,231 |
| InterContinental Hotel Group PLC ADR | | 11,191 | 622,108 |
| ITE Group PLC | | 19,600 | 46,271 |
| Micro Focus International PLC | | 8,058 | 283,074 |
| NMC Health PLC | | 4,262 | 163,704 |
| Prudential PLC | | 33,087 | 812,133 |
| Reckitt Benckiser Group PLC | | 9,151 | 818,709 |
| Rightmove PLC | | 2,500 | 137,928 |
| Shaftesbury PLC | | 11,837 | 155,641 |
| Spectris PLC | | 7,470 | 253,985 |
| Spirax-Sarco Engineering PLC | | 1,899 | 142,502 |
| Standard Chartered PLC (United Kingdom) (a) | | 34,876 | 347,589 |
| Standard Life PLC | | 55,579 | 317,267 |
| Topps Tiles PLC | | 19,600 | 18,157 |
| Ultra Electronics Holdings PLC | | 2,101 | 50,898 |
| Unite Group PLC | | 3,751 | 35,023 |
|
| TOTAL UNITED KINGDOM | | | 11,566,043 |
|
| United States of America - 8.1% | | | |
| A.O. Smith Corp. | | 2,662 | 157,590 |
| Alphabet, Inc.: | | | |
| Class A (a) | | 612 | 632,220 |
| Class C (a) | | 162 | 164,696 |
| American Tower Corp. | | 1,100 | 158,037 |
| Amgen, Inc. | | 1,100 | 192,742 |
| Amphenol Corp. Class A | | 1,840 | 160,080 |
| Autoliv, Inc. | | 3,524 | 440,007 |
| Berkshire Hathaway, Inc. Class B (a) | | 2,516 | 470,341 |
| ConocoPhillips Co. | | 7,100 | 363,165 |
| Edgewell Personal Care Co. (a) | | 1,200 | 77,916 |
| Facebook, Inc. Class A (a) | | 878 | 158,093 |
| Martin Marietta Materials, Inc. | | 1,760 | 381,656 |
| MasterCard, Inc. Class A | | 6,953 | 1,034,398 |
| Mohawk Industries, Inc. (a) | | 1,595 | 417,507 |
| Molson Coors Brewing Co. Class B | | 3,200 | 258,784 |
| Moody's Corp. | | 2,739 | 390,061 |
| MSCI, Inc. | | 3,851 | 451,953 |
| Philip Morris International, Inc. | | 4,900 | 512,736 |
| PriceSmart, Inc. | | 1,985 | 166,343 |
| ResMed, Inc. | | 4,260 | 358,607 |
| S&P Global, Inc. | | 4,501 | 704,271 |
| Sherwin-Williams Co. | | 1,100 | 434,665 |
| Visa, Inc. Class A | | 10,531 | 1,158,199 |
| Yum China Holdings, Inc. | | 6,300 | 254,205 |
|
| TOTAL UNITED STATES OF AMERICA | | | 9,498,272 |
|
| TOTAL COMMON STOCKS | | | |
| (Cost $98,406,189) | | | 114,300,185 |
|
| Nonconvertible Preferred Stocks - 0.7% | | | |
| Brazil - 0.5% | | | |
| Itau Unibanco Holding SA | | 42,770 | 549,775 |
| Germany - 0.1% | | | |
| Sartorius AG (non-vtg.) | | 1,200 | 111,840 |
| Spain - 0.1% | | | |
| Grifols SA Class B | | 8,300 | 194,948 |
| TOTAL NONCONVERTIBLE PREFERRED STOCKS | | | |
| (Cost $741,463) | | | 856,563 |
|
| Money Market Funds - 1.5% | | | |
| Fidelity Cash Central Fund, 1.10% (f) | | 1,243,426 | 1,243,675 |
| Fidelity Securities Lending Cash Central Fund 1.11% (f)(g) | | 539,946 | 540,000 |
| TOTAL MONEY MARKET FUNDS | | | |
| (Cost $1,783,675) | | | 1,783,675 |
| TOTAL INVESTMENT IN SECURITIES - 99.5% | | | |
| (Cost $100,931,327) | | | 116,940,423 |
| NET OTHER ASSETS (LIABILITIES) - 0.5% | | | 556,077 |
| NET ASSETS - 100% | | | $117,496,500 |
Categorizations in the Schedule of Investments are based on country or territory of incorporation.
Legend
(a) Non-income producing
(b) Level 3 security
(c) Security exempt from registration under Rule 144A of the Securities Act of 1933. These securities may be resold in transactions exempt from registration, normally to qualified institutional buyers. At the end of the period, the value of these securities amounted to $23,632 or 0.0% of net assets.
(d) Security or a portion of the security is on loan at period end.
(e) Security or a portion of the security purchased on a delayed delivery or when-issued basis.
(f) Affiliated fund that is generally available only to investment companies and other accounts managed by Fidelity Investments. The rate quoted is the annualized seven-day yield of the fund at period end. A complete unaudited listing of the fund's holdings as of its most recent quarter end is available upon request. In addition, each Fidelity Central Fund's financial statements, which are not covered by the Fund's Report of Independent Registered Public Accounting Firm, are available on the SEC's website or upon request.
(g) Investment made with cash collateral received from securities on loan.
Affiliated Central Funds
Information regarding fiscal year to date income earned by the Fund from investments in Fidelity Central Funds is as follows:
| Fund | Income earned |
| Fidelity Cash Central Fund | $35,828 |
| Fidelity Securities Lending Cash Central Fund | 32,511 |
| Total | $68,339 |
Investment Valuation
The following is a summary of the inputs used, as of October 31, 2017, involving the Fund's assets and liabilities carried at fair value. The inputs or methodology used for valuing securities may not be an indication of the risk associated with investing in those securities. For more information on valuation inputs, and their aggregation into the levels used below, please refer to the Investment Valuation section in the accompanying Notes to Financial Statements.
| | Valuation Inputs at Reporting Date: |
| Description | Total | Level 1 | Level 2 | Level 3 |
| Investments in Securities: | | | | |
| Equities: | | | | |
| Consumer Discretionary | $12,334,198 | $9,228,664 | $3,105,534 | $-- |
| Consumer Staples | 12,038,170 | 4,872,443 | 6,834,850 | 330,877 |
| Energy | 5,441,383 | 2,628,889 | 2,812,494 | -- |
| Financials | 23,282,535 | 16,224,451 | 7,058,084 | -- |
| Health Care | 10,410,627 | 4,131,037 | 6,279,590 | -- |
| Industrials | 15,213,224 | 10,565,512 | 4,647,712 | -- |
| Information Technology | 21,663,740 | 12,891,675 | 8,772,065 | -- |
| Materials | 9,296,080 | 7,838,809 | 1,457,271 | -- |
| Real Estate | 2,337,199 | 2,030,323 | 306,876 | -- |
| Telecommunication Services | 1,998,442 | 705,037 | 1,293,405 | -- |
| Utilities | 1,141,150 | 1,141,150 | -- | -- |
| Money Market Funds | 1,783,675 | 1,783,675 | -- | -- |
| Total Investments in Securities: | $116,940,423 | $74,041,665 | $42,567,881 | $330,877 |
The following is a summary of transfers between Level 1 and Level 2 for the period ended October 31, 2017. Transfers are assumed to have occurred at the beginning of the period, and are primarily attributable to the valuation techniques used for foreign equity securities, as discussed in the accompanying Notes to Financial Statements:
| Transfers | Total |
| Level 1 to Level 2 | $30,739,338 |
| Level 2 to Level 1 | $7,101,750 |
See accompanying notes which are an integral part of the financial statements.
Financial Statements
Statement of Assets and Liabilities
| | | October 31, 2017 |
| Assets | | |
Investment in securities, at value (including securities loaned of $505,384) — See accompanying schedule:
Unaffiliated issuers (cost $99,147,652) | $115,156,748 | |
| Fidelity Central Funds (cost $1,783,675) | 1,783,675 | |
| Total Investment in Securities (cost $100,931,327) | | $116,940,423 |
| Cash | | 84,270 |
| Foreign currency held at value (cost $81,421) | | 81,756 |
| Receivable for investments sold | | 745,745 |
| Receivable for fund shares sold | | 180,701 |
| Dividends receivable | | 648,567 |
| Distributions receivable from Fidelity Central Funds | | 2,497 |
| Prepaid expenses | | 252 |
| Receivable from investment adviser for expense reductions | | 17,073 |
| Other receivables | | 31,130 |
| Total assets | | 118,732,414 |
| Liabilities | | |
| Payable for investments purchased | | |
| Regular delivery | $351,006 | |
| Delayed delivery | 3,009 | |
| Payable for fund shares redeemed | 19,907 | |
| Accrued management fee | 87,436 | |
| Distribution and service plan fees payable | 11,233 | |
| Audit fee payable | 55,327 | |
| Custody fee payable | 33,451 | |
| Other affiliated payables | 23,284 | |
| Other payables and accrued expenses | 111,261 | |
| Collateral on securities loaned | 540,000 | |
| Total liabilities | | 1,235,914 |
| Net Assets | | $117,496,500 |
| Net Assets consist of: | | |
| Paid in capital | | $103,427,287 |
| Undistributed net investment income | | 1,842,046 |
| Accumulated undistributed net realized gain (loss) on investments and foreign currency transactions | | (3,670,677) |
| Net unrealized appreciation (depreciation) on investments and assets and liabilities in foreign currencies | | 15,897,844 |
| Net Assets | | $117,496,500 |
| Calculation of Maximum Offering Price | | |
| Class A: | | |
| Net Asset Value and redemption price per share ($9,292,066 ÷ 989,520 shares) | | $9.39 |
| Maximum offering price per share (100/94.25 of $9.39) | | $9.96 |
| Class M: | | |
| Net Asset Value and redemption price per share ($15,894,100 ÷ 1,687,456 shares) | | $9.42 |
| Maximum offering price per share (100/96.50 of $9.42) | | $9.76 |
| Class C: | | |
| Net Asset Value and offering price per share ($3,211,229 ÷ 342,534 shares)(a) | | $9.37 |
| Total International Equity: | | |
| Net Asset Value, offering price and redemption price per share ($82,076,663 ÷ 8,731,279 shares) | | $9.40 |
| Class I: | | |
| Net Asset Value, offering price and redemption price per share ($6,776,051 ÷ 722,430 shares) | | $9.38 |
| Class Z: | | |
| Net Asset Value, offering price and redemption price per share ($246,391 ÷ 26,227 shares) | | $9.39 |
(a) Redemption price per share is equal to net asset value less any applicable contingent deferred sales charge.
See accompanying notes which are an integral part of the financial statements.
Statement of Operations
| | | Year ended October 31, 2017 |
| Investment Income | | |
| Dividends | | $5,867,168 |
| Income from Fidelity Central Funds | | 68,339 |
| Income before foreign taxes withheld | | 5,935,507 |
| Less foreign taxes withheld | | (515,820) |
| Total income | | 5,419,687 |
| Expenses | | |
| Management fee | | |
| Basic fee | $1,550,378 | |
| Performance adjustment | 258,769 | |
| Transfer agent fees | 318,550 | |
| Distribution and service plan fees | 125,353 | |
| Accounting and security lending fees | 115,549 | |
| Custodian fees and expenses | 171,686 | |
| Independent trustees' fees and expenses | 966 | |
| Registration fees | 90,840 | |
| Audit | 110,411 | |
| Legal | 2,730 | |
| Miscellaneous | 2,692 | |
| Total expenses before reductions | 2,747,924 | |
| Expense reductions | (115,152) | 2,632,772 |
| Net investment income (loss) | | 2,786,915 |
| Realized and Unrealized Gain (Loss) | | |
| Net realized gain (loss) on: | | |
| Investment securities: | | |
| Unaffiliated issuers | 19,411,497 | |
| Redemptions in-kind with affiliated entities | 51,686,661 | |
| Fidelity Central Funds | (1,147) | |
| Foreign currency transactions | (126,503) | |
| Futures contracts | (206,898) | |
| Total net realized gain (loss) | | 70,763,610 |
| Change in net unrealized appreciation (depreciation) on: | | |
| Unaffiliated issuers (net of increase in deferred foreign taxes of $111,264) | (21,965,474) | |
| Assets and liabilities in foreign currencies | 34,164 | |
| Total change in net unrealized appreciation (depreciation) | | (21,931,310) |
| Net gain (loss) | | 48,832,300 |
| Net increase (decrease) in net assets resulting from operations | | $51,619,215 |
See accompanying notes which are an integral part of the financial statements.
Statement of Changes in Net Assets
| | Year ended October 31, 2017 | Year ended October 31, 2016 |
| Increase (Decrease) in Net Assets | | |
| Operations | | |
| Net investment income (loss) | $2,786,915 | $4,368,676 |
| Net realized gain (loss) | 70,763,610 | 3,239,278 |
| Change in net unrealized appreciation (depreciation) | (21,931,310) | (10,501,802) |
| Net increase (decrease) in net assets resulting from operations | 51,619,215 | (2,893,848) |
| Distributions to shareholders from net investment income | (4,227,310) | (3,869,339) |
| Share transactions - net increase (decrease) | (237,908,011) | (21,421,371) |
| Redemption fees | 2,629 | 1,162 |
| Total increase (decrease) in net assets | (190,513,477) | (28,183,396) |
| Net Assets | | |
| Beginning of period | 308,009,977 | 336,193,373 |
| End of period | $117,496,500 | $308,009,977 |
| Other Information | | |
| Undistributed net investment income end of period | $1,842,046 | $3,810,969 |
See accompanying notes which are an integral part of the financial statements.
Financial Highlights
Fidelity Total International Equity Fund Class A
| Years ended October 31, | 2017 | 2016 | 2015 | 2014 | 2013 |
| Selected Per–Share Data | | | | | |
| Net asset value, beginning of period | $7.67 | $7.79 | $8.00 | $8.27 | $7.31 |
| Income from Investment Operations | | | | | |
| Net investment income (loss)A | .09 | .08 | .07 | .13 | .09 |
| Net realized and unrealized gain (loss) | 1.71 | (.14) | (.14) | (.12) | 1.24 |
| Total from investment operations | 1.80 | (.06) | (.07) | .01 | 1.33 |
| Distributions from net investment income | (.08) | (.06) | (.10) | (.10) | (.13) |
| Distributions from net realized gain | – | – | (.04) | (.18) | (.25) |
| Total distributions | (.08) | (.06) | (.14) | (.28) | (.37)B |
| Redemption fees added to paid in capitalA,C | – | – | – | – | – |
| Net asset value, end of period | $9.39 | $7.67 | $7.79 | $8.00 | $8.27 |
| Total ReturnD,E | 23.78% | (.76)% | (.89)% | .19% | 19.00% |
| Ratios to Average Net AssetsF,G | | | | | |
| Expenses before reductions | 1.67% | 1.52% | 1.48% | 1.44% | 1.50% |
| Expenses net of fee waivers, if any | 1.45% | 1.45% | 1.45% | 1.44% | 1.45% |
| Expenses net of all reductions | 1.43% | 1.45% | 1.44% | 1.44% | 1.43% |
| Net investment income (loss) | 1.02% | 1.10% | .86% | 1.63% | 1.21% |
| Supplemental Data | | | | | |
| Net assets, end of period (000 omitted) | $9,292 | $8,576 | $9,163 | $9,164 | $9,034 |
| Portfolio turnover rateH | 66%I | 51% | 53% | 85% | 89% |
A Calculated based on average shares outstanding during the period.
B Total distributions of $.37 per share is comprised of distributions from net investment income of $.126 and distributions from net realized gain of $.245 per share.
C Amount represents less than $.005 per share.
D Total returns would have been lower if certain expenses had not been reduced during the applicable periods shown.
E Total returns do not include the effect of the sales charges.
F Fees and expenses of any underlying Fidelity Central Funds are not included in the Fund's expense ratio. The Fund indirectly bears its proportionate share of the expenses of any underlying Fidelity Central Funds.
G Expense ratios reflect operating expenses of the class. Expenses before reductions do not reflect amounts reimbursed by the investment adviser or reductions from brokerage service arrangements or reductions from other expense offset arrangements and do not represent the amount paid by the class during periods when reimbursements or reductions occur. Expenses net of fee waivers reflect expenses after reimbursement by the investment adviser but prior to reductions from brokerage service arrangements or other expense offset arrangements. Expenses net of all reductions represent the net expenses paid by the class.
H Amount does not include the portfolio activity of any underlying Fidelity Central Funds.
I Portfolio turnover rate excludes securities received or delivered in-kind.
See accompanying notes which are an integral part of the financial statements.
Fidelity Total International Equity Fund Class M
| Years ended October 31, | 2017 | 2016 | 2015 | 2014 | 2013 |
| Selected Per–Share Data | | | | | |
| Net asset value, beginning of period | $7.70 | $7.81 | $8.04 | $8.32 | $7.37 |
| Income from Investment Operations | | | | | |
| Net investment income (loss)A | .06 | .06 | .05 | .11 | .07 |
| Net realized and unrealized gain (loss) | 1.73 | (.13) | (.15) | (.12) | 1.25 |
| Total from investment operations | 1.79 | (.07) | (.10) | (.01) | 1.32 |
| Distributions from net investment income | (.07) | (.04) | (.09) | (.09) | (.13) |
| Distributions from net realized gain | – | – | (.04) | (.18) | (.25) |
| Total distributions | (.07) | (.04) | (.13) | (.27) | (.37)B |
| Redemption fees added to paid in capitalA,C | – | – | – | – | – |
| Net asset value, end of period | $9.42 | $7.70 | $7.81 | $8.04 | $8.32 |
| Total ReturnD,E | 23.41% | (.86)% | (1.26)% | (.06)% | 18.73% |
| Ratios to Average Net AssetsF,G | | | | | |
| Expenses before reductions | 1.90% | 1.73% | 1.70% | 1.68% | 1.75% |
| Expenses net of fee waivers, if any | 1.70% | 1.70% | 1.70% | 1.68% | 1.70% |
| Expenses net of all reductions | 1.68% | 1.69% | 1.69% | 1.68% | 1.67% |
| Net investment income (loss) | .77% | .85% | .61% | 1.38% | .96% |
| Supplemental Data | | | | | |
| Net assets, end of period (000 omitted) | $15,894 | $13,893 | $13,962 | $10,282 | $7,909 |
| Portfolio turnover rateH | 66%I | 51% | 53% | 85% | 89% |
A Calculated based on average shares outstanding during the period.
B Total distributions of $.37 per share is comprised of distributions from net investment income of $.128 and distributions from net realized gain of $.245 per share.
C Amount represents less than $.005 per share.
D Total returns would have been lower if certain expenses had not been reduced during the applicable periods shown.
E Total returns do not include the effect of the sales charges.
F Fees and expenses of any underlying Fidelity Central Funds are not included in the Fund's expense ratio. The Fund indirectly bears its proportionate share of the expenses of any underlying Fidelity Central Funds.
G Expense ratios reflect operating expenses of the class. Expenses before reductions do not reflect amounts reimbursed by the investment adviser or reductions from brokerage service arrangements or reductions from other expense offset arrangements and do not represent the amount paid by the class during periods when reimbursements or reductions occur. Expenses net of fee waivers reflect expenses after reimbursement by the investment adviser but prior to reductions from brokerage service arrangements or other expense offset arrangements. Expenses net of all reductions represent the net expenses paid by the class.
H Amount does not include the portfolio activity of any underlying Fidelity Central Funds.
I Portfolio turnover rate excludes securities received or delivered in-kind.
See accompanying notes which are an integral part of the financial statements.
Fidelity Total International Equity Fund Class C
| Years ended October 31, | 2017 | 2016 | 2015 | 2014 | 2013 |
| Selected Per–Share Data | | | | | |
| Net asset value, beginning of period | $7.66 | $7.77 | $8.00 | $8.28 | $7.31 |
| Income from Investment Operations | | | | | |
| Net investment income (loss)A | .02 | .03 | .01 | .07 | .04 |
| Net realized and unrealized gain (loss) | 1.71 | (.14) | (.15) | (.12) | 1.25 |
| Total from investment operations | 1.73 | (.11) | (.14) | (.05) | 1.29 |
| Distributions from net investment income | (.02) | – | (.05) | (.05) | (.08) |
| Distributions from net realized gain | – | – | (.04) | (.18) | (.25) |
| Total distributions | (.02) | – | (.09) | (.23) | (.32)B |
| Redemption fees added to paid in capitalA,C | – | – | – | – | – |
| Net asset value, end of period | $9.37 | $7.66 | $7.77 | $8.00 | $8.28 |
| Total ReturnD,E | 22.70% | (1.42)% | (1.73)% | (.57)% | 18.30% |
| Ratios to Average Net AssetsF,G | | | | | |
| Expenses before reductions | 2.48% | 2.30% | 2.26% | 2.22% | 2.26% |
| Expenses net of fee waivers, if any | 2.20% | 2.20% | 2.20% | 2.20% | 2.20% |
| Expenses net of all reductions | 2.18% | 2.20% | 2.19% | 2.20% | 2.18% |
| Net investment income (loss) | .27% | .35% | .11% | .87% | .46% |
| Supplemental Data | | | | | |
| Net assets, end of period (000 omitted) | $3,211 | $2,713 | $3,311 | $4,028 | $3,584 |
| Portfolio turnover rateH | 66%I | 51% | 53% | 85% | 89% |
A Calculated based on average shares outstanding during the period.
B Total distributions of $.32 per share is comprised of distributions from net investment income of $.075 and distributions from net realized gain of $.245 per share.
C Amount represents less than $.005 per share.
D Total returns would have been lower if certain expenses had not been reduced during the applicable periods shown.
E Total returns do not include the effect of the contingent deferred sales charge.
F Fees and expenses of any underlying Fidelity Central Funds are not included in the Fund's expense ratio. The Fund indirectly bears its proportionate share of the expenses of any underlying Fidelity Central Funds.
G Expense ratios reflect operating expenses of the class. Expenses before reductions do not reflect amounts reimbursed by the investment adviser or reductions from brokerage service arrangements or reductions from other expense offset arrangements and do not represent the amount paid by the class during periods when reimbursements or reductions occur. Expenses net of fee waivers reflect expenses after reimbursement by the investment adviser but prior to reductions from brokerage service arrangements or other expense offset arrangements. Expenses net of all reductions represent the net expenses paid by the class.
H Amount does not include the portfolio activity of any underlying Fidelity Central Funds.
I Portfolio turnover rate excludes securities received or delivered in-kind.
See accompanying notes which are an integral part of the financial statements.
Fidelity Total International Equity Fund
| Years ended October 31, | 2017 | 2016 | 2015 | 2014 | 2013 |
| Selected Per–Share Data | | | | | |
| Net asset value, beginning of period | $7.70 | $7.82 | $8.03 | $8.29 | $7.32 |
| Income from Investment Operations | | | | | |
| Net investment income (loss)A | .11 | .11 | .10 | .16 | .12 |
| Net realized and unrealized gain (loss) | 1.70 | (.13) | (.14) | (.12) | 1.24 |
| Total from investment operations | 1.81 | (.02) | (.04) | .04 | 1.36 |
| Distributions from net investment income | (.11) | (.10) | (.13) | (.12) | (.15) |
| Distributions from net realized gain | – | – | (.04) | (.18) | (.25) |
| Total distributions | (.11) | (.10) | (.17) | (.30) | (.39)B |
| Redemption fees added to paid in capitalA,C | – | – | – | – | – |
| Net asset value, end of period | $9.40 | $7.70 | $7.82 | $8.03 | $8.29 |
| Total ReturnD | 23.86% | (.32)% | (.51)% | .55% | 19.48% |
| Ratios to Average Net AssetsE,F | | | | | |
| Expenses before reductions | 1.15% | 1.11% | 1.07% | 1.04% | 1.09% |
| Expenses net of fee waivers, if any | 1.14% | 1.11% | 1.07% | 1.04% | 1.09% |
| Expenses net of all reductions | 1.13% | 1.10% | 1.06% | 1.04% | 1.07% |
| Net investment income (loss) | 1.33% | 1.44% | 1.24% | 2.03% | 1.57% |
| Supplemental Data | | | | | |
| Net assets, end of period (000 omitted) | $82,077 | $280,672 | $307,035 | $324,438 | $324,395 |
| Portfolio turnover rateG | 66%H | 51% | 53% | 85% | 89% |
A Calculated based on average shares outstanding during the period.
B Total distributions of $.39 per share is comprised of distributions from net investment income of $.148 and distributions from net realized gain of $.245 per share.
C Amount represents less than $.005 per share.
D Total returns would have been lower if certain expenses had not been reduced during the applicable periods shown.
E Fees and expenses of any underlying Fidelity Central Funds are not included in the Fund's expense ratio. The Fund indirectly bears its proportionate share of the expenses of any underlying Fidelity Central Funds.
F Expense ratios reflect operating expenses of the class. Expenses before reductions do not reflect amounts reimbursed by the investment adviser or reductions from brokerage service arrangements or reductions from other expense offset arrangements and do not represent the amount paid by the class during periods when reimbursements or reductions occur. Expenses net of fee waivers reflect expenses after reimbursement by the investment adviser but prior to reductions from brokerage service arrangements or other expense offset arrangements. Expenses net of all reductions represent the net expenses paid by the class.
G Amount does not include the portfolio activity of any underlying Fidelity Central Funds.
H Portfolio turnover rate excludes securities received or delivered in-kind.
See accompanying notes which are an integral part of the financial statements.
Fidelity Total International Equity Fund Class I
| Years ended October 31, | 2017 | 2016 | 2015 | 2014 | 2013 |
| Selected Per–Share Data | | | | | |
| Net asset value, beginning of period | $7.66 | $7.78 | $7.99 | $8.26 | $7.30 |
| Income from Investment Operations | | | | | |
| Net investment income (loss)A | .11 | .10 | .09 | .15 | .11 |
| Net realized and unrealized gain (loss) | 1.71 | (.13) | (.14) | (.12) | 1.24 |
| Total from investment operations | 1.82 | (.03) | (.05) | .03 | 1.35 |
| Distributions from net investment income | (.10) | (.09) | (.12) | (.12) | (.15) |
| Distributions from net realized gain | – | – | (.04) | (.18) | (.25) |
| Total distributions | (.10) | (.09) | (.16) | (.30) | (.39)B |
| Redemption fees added to paid in capitalA,C | – | – | – | – | – |
| Net asset value, end of period | $9.38 | $7.66 | $7.78 | $7.99 | $8.26 |
| Total ReturnD | 24.08% | (.43)% | (.64)% | .37% | 19.40% |
| Ratios to Average Net AssetsE,F | | | | | |
| Expenses before reductions | 1.42% | 1.22% | 1.17% | 1.15% | 1.21% |
| Expenses net of fee waivers, if any | 1.20% | 1.20% | 1.17% | 1.15% | 1.20% |
| Expenses net of all reductions | 1.18% | 1.20% | 1.16% | 1.15% | 1.18% |
| Net investment income (loss) | 1.28% | 1.35% | 1.14% | 1.91% | 1.46% |
| Supplemental Data | | | | | |
| Net assets, end of period (000 omitted) | $6,776 | $2,156 | $2,602 | $2,240 | $2,372 |
| Portfolio turnover rateG | 66%H | 51% | 53% | 85% | 89% |
A Calculated based on average shares outstanding during the period.
B Total distributions of $.39 per share is comprised of distributions from net investment income of $.148 and distributions from net realized gain of $.245 per share.
C Amount represents less than $.005 per share.
D Total returns would have been lower if certain expenses had not been reduced during the applicable periods shown.
E Fees and expenses of any underlying Fidelity Central Funds are not included in the Fund's expense ratio. The Fund indirectly bears its proportionate share of the expenses of any underlying Fidelity Central Funds.
F Expense ratios reflect operating expenses of the class. Expenses before reductions do not reflect amounts reimbursed by the investment adviser or reductions from brokerage service arrangements or reductions from other expense offset arrangements and do not represent the amount paid by the class during periods when reimbursements or reductions occur. Expenses net of fee waivers reflect expenses after reimbursement by the investment adviser but prior to reductions from brokerage service arrangements or other expense offset arrangements. Expenses net of all reductions represent the net expenses paid by the class.
G Amount does not include the portfolio activity of any underlying Fidelity Central Funds.
H Portfolio turnover rate excludes securities received or delivered in-kind.
See accompanying notes which are an integral part of the financial statements.
Fidelity Total International Equity Fund Class Z
| Years ended October 31, | 2017 A |
| Selected Per–Share Data | |
| Net asset value, beginning of period | $7.73 |
| Income from Investment Operations | |
| Net investment income (loss)B | .08 |
| Net realized and unrealized gain (loss) | 1.58 |
| Total from investment operations | 1.66 |
| Distributions from net investment income | – |
| Distributions from net realized gain | – |
| Total distributions | – |
| Redemption fees added to paid in capitalB,C | – |
| Net asset value, end of period | $9.39 |
| Total ReturnD,E | 21.47% |
| Ratios to Average Net AssetsF,G | |
| Expenses before reductions | 1.32%H |
| Expenses net of fee waivers, if any | 1.05%H |
| Expenses net of all reductions | 1.04%H |
| Net investment income (loss) | 1.27%H |
| Supplemental Data | |
| Net assets, end of period (000 omitted) | $246 |
| Portfolio turnover rateI | 66%J |
A For the period February 1, 2017 (commencement of sale of shares) to October 31, 2017.
B Calculated based on average shares outstanding during the period.
C Amount represents less than $.005 per share.
D Total returns for periods of less than one year are not annualized.
E Total returns would have been lower if certain expenses had not been reduced during the applicable periods shown.
F Fees and expenses of any underlying Fidelity Central Funds are not included in the Fund's expense ratio. The Fund indirectly bears its proportionate share of the expenses of any underlying Fidelity Central Funds.
G Expense ratios reflect operating expenses of the class. Expenses before reductions do not reflect amounts reimbursed by the investment adviser or reductions from brokerage service arrangements or reductions from other expense offset arrangements and do not represent the amount paid by the class during periods when reimbursements or reductions occur. Expense ratios before reductions for start-up periods may not be representative of longer-term operating periods. Expenses net of fee waivers reflect expenses after reimbursement by the investment adviser but prior to reductions from brokerage service arrangements or other expense offset arrangements. Expenses net of all reductions represent the net expenses paid by the class.
H Annualized
I Amount does not include the portfolio activity of any underlying Fidelity Central Funds.
J Portfolio turnover rate excludes securities received or delivered in-kind.
See accompanying notes which are an integral part of the financial statements.
Notes to Financial Statements
For the period ended October 31, 2017
1. Organization.
Fidelity Total International Equity Fund (the Fund) is a fund of Fidelity Investment Trust (the Trust) and is authorized to issue an unlimited number of shares. The Trust is registered under the Investment Company Act of 1940, as amended (the 1940 Act), as an open-end management investment company organized as a Massachusetts business trust. The Fund commenced sale of Class Z shares on February 1, 2017. The Fund offers Class A, Class M (formerly Class T), Class C, Total International Equity, Class I and Class Z shares, each of which has equal rights as to assets and voting privileges. Each class has exclusive voting rights with respect to matters that affect that class. The Fund's investments in emerging markets can be subject to social, economic, regulatory and political uncertainties and can be extremely volatile.
After the close of business on June 24, 2016, all outstanding Class B shares were converted to Class A shares. All prior fiscal period dollar and share amounts for Class B presented in the Notes to Financial Statements are for the period November 1, 2015 through June 24, 2016.
2. Investments in Fidelity Central Funds.
The Fund invests in Fidelity Central Funds, which are open-end investment companies generally available only to other investment companies and accounts managed by the investment adviser and its affiliates. The Fund's Schedule of Investments lists each of the Fidelity Central Funds held as of period end, if any, as an investment of the Fund, but does not include the underlying holdings of each Fidelity Central Fund. As an Investing Fund, the Fund indirectly bears its proportionate share of the expenses of the underlying Fidelity Central Funds.
The Money Market Central Funds seek preservation of capital and current income and are managed by Fidelity Investments Money Management, Inc. (FIMM), an affiliate of the investment adviser. Annualized expenses of the Money Market Central Funds as of their most recent shareholder report date are less than .005%.
A complete unaudited list of holdings for each Fidelity Central Fund is available upon request or at the Securities and Exchange Commission (the SEC) website at www.sec.gov. In addition, the financial statements of the Fidelity Central Funds, which are not covered by the Fund's Report of Independent Registered Public Accounting Firm, are available on the SEC website or upon request.
3. Significant Accounting Policies.
The Fund is an investment company and applies the accounting and reporting guidance of the Financial Accounting Standards Board (FASB) Accounting Standards Codification Topic 946 Financial Services – Investments Companies. The financial statements have been prepared in conformity with accounting principles generally accepted in the United States of America (GAAP), which require management to make certain estimates and assumptions at the date of the financial statements. Actual results could differ from those estimates. Subsequent events, if any, through the date that the financial statements were issued have been evaluated in the preparation of the financial statements. The following summarizes the significant accounting policies of the Fund:
Investment Valuation. Investments are valued as of 4:00 p.m. Eastern time on the last calendar day of the period. The Board of Trustees (the Board) has delegated the day to day responsibility for the valuation of the Fund's investments to the Fair Value Committee (the Committee) established by the Fund's investment adviser. In accordance with valuation policies and procedures approved by the Board, the Fund attempts to obtain prices from one or more third party pricing vendors or brokers to value its investments. When current market prices, quotations or currency exchange rates are not readily available or reliable, investments will be fair valued in good faith by the Committee, in accordance with procedures adopted by the Board. Factors used in determining fair value vary by investment type and may include market or investment specific events. The frequency with which these procedures are used cannot be predicted and they may be utilized to a significant extent. The Committee oversees the Fund's valuation policies and procedures and reports to the Board on the Committee's activities and fair value determinations. The Board monitors the appropriateness of the procedures used in valuing the Fund's investments and ratifies the fair value determinations of the Committee.
The Fund categorizes the inputs to valuation techniques used to value its investments into a disclosure hierarchy consisting of three levels as shown below:
- Level 1 – quoted prices in active markets for identical investments
- Level 2 – other significant observable inputs (including quoted prices for similar investments, interest rates, prepayment speeds, etc.)
- Level 3 – unobservable inputs (including the Fund's own assumptions based on the best information available)
Valuation techniques used to value the Fund's investments by major category are as follows:
Equity securities, including restricted securities, for which market quotations are readily available, are valued at the last reported sale price or official closing price as reported by a third party pricing vendor on the primary market or exchange on which they are traded and are categorized as Level 1 in the hierarchy. In the event there were no sales during the day or closing prices are not available, securities are valued at the last quoted bid price or may be valued using the last available price and are generally categorized as Level 2 in the hierarchy. For foreign equity securities, when market or security specific events arise, comparisons to the valuation of American Depositary Receipts (ADRs), futures contracts, Exchange-Traded Funds (ETFs) and certain indexes as well as quoted prices for similar securities may be used and would be categorized as Level 2 in the hierarchy. Utilizing these techniques may result in transfers between Level 1 and Level 2. For equity securities, including restricted securities, where observable inputs are limited, assumptions about market activity and risk are used and these securities may be categorized as Level 3 in the hierarchy.
Investments in open-end mutual funds, including the Fidelity Central Funds, are valued at their closing net asset value (NAV) each business day and are categorized as Level 1 in the hierarchy.
Changes in valuation techniques may result in transfers in or out of an assigned level within the disclosure hierarchy. The aggregate value of investments by input level as of October 31, 2017, including information on transfers between Levels 1 and 2 is included at the end of the Fund's Schedule of Investments.
Foreign Currency. The Fund may use foreign currency contracts to facilitate transactions in foreign-denominated securities. Gains and losses from these transactions may arise from changes in the value of the foreign currency or if the counterparties do not perform under the contracts' terms.
Foreign-denominated assets, including investment securities, and liabilities are translated into U.S. dollars at the exchange rates at period end. Purchases and sales of investment securities, income and dividends received and expenses denominated in foreign currencies are translated into U.S. dollars at the exchange rate in effect on the transaction date.
The effects of exchange rate fluctuations on investments are included with the net realized and unrealized gain (loss) on investment securities. Other foreign currency transactions resulting in realized and unrealized gain (loss) are disclosed separately.
Investment Transactions and Income. For financial reporting purposes, the Fund's investment holdings and NAV include trades executed through the end of the last business day of the period. The NAV per share for processing shareholder transactions is calculated as of the close of business of the New York Stock Exchange (NYSE), normally 4:00 p.m. Eastern time and includes trades executed through the end of the prior business day. Gains and losses on securities sold are determined on the basis of identified cost and includes proceeds received from litigation. Dividend income is recorded on the ex-dividend date, except for certain dividends from foreign securities where the ex-dividend date may have passed, which are recorded as soon as the Fund is informed of the ex-dividend date. Non-cash dividends included in dividend income, if any, are recorded at the fair market value of the securities received. Income and capital gain distributions from Fidelity Central Funds, if any, are recorded on the ex-dividend date. Certain distributions received by the Fund represent a return of capital or capital gain. The Fund determines the components of these distributions subsequent to the ex-dividend date, based upon receipt of tax filings or other correspondence relating to the underlying investment. These distributions are recorded as a reduction of cost of investments and/or as a realized gain. Investment income is recorded net of foreign taxes withheld where recovery of such taxes is uncertain.
Class Allocations and Expenses. Investment income, realized and unrealized capital gains and losses, common expenses of the Fund, and certain fund-level expense reductions, if any, are allocated daily on a pro-rata basis to each class based on the relative net assets of each class to the total net assets of the Fund. Each class differs with respect to transfer agent and distribution and service plan fees incurred. Certain expense reductions may also differ by class. For the reporting period, the allocated portion of income and expenses to each class as a percent of its average net assets may vary due to the timing of recording these transactions in relation to fluctuating net assets of the classes. Expenses directly attributable to a fund are charged to that fund. Expenses attributable to more than one fund are allocated among the respective funds on the basis of relative net assets or other appropriate methods. Expense estimates are accrued in the period to which they relate and adjustments are made when actual amounts are known.
Income Tax Information and Distributions to Shareholders. Each year, the Fund intends to qualify as a regulated investment company under Subchapter M of the Internal Revenue Code, including distributing substantially all of its taxable income and realized gains. As a result, no provision for U.S. Federal income taxes is required. As of October 31, 2017, the Fund did not have any unrecognized tax benefits in the financial statements; nor is the Fund aware of any tax positions for which it is reasonably possible that the total amounts of unrecognized tax benefits will significantly change in the next twelve months. The Fund files a U.S. federal tax return, in addition to state and local tax returns as required. The Fund's federal income tax returns are subject to examination by the Internal Revenue Service (IRS) for a period of three fiscal years after they are filed. State and local tax returns may be subject to examination for an additional fiscal year depending on the jurisdiction. Foreign taxes are provided for based on the Fund's understanding of the tax rules and rates that exist in the foreign markets in which it invests. The Fund is subject to a tax imposed on capital gains by certain countries in which it invests. An estimated deferred tax liability for net unrealized appreciation on the applicable securities is included in Other payables and accrued expenses on the Statement of Assets & Liabilities.
Distributions are declared and recorded on the ex-dividend date. Income dividends and capital gain distributions are declared separately for each class. Income and capital gain distributions are determined in accordance with income tax regulations, which may differ from GAAP. In addition, the Fund claimed a portion of the payment made to redeeming shareholders as a distribution for income tax purposes.
Capital accounts within the financial statements are adjusted for permanent book-tax differences. These adjustments have no impact on net assets or the results of operations. Capital accounts are not adjusted for temporary book-tax differences which will reverse in a subsequent period.
Book-tax differences are primarily due to futures contracts, foreign currency transactions, certain foreign taxes, passive foreign investment companies (PFIC), redemptions in kind, partnerships, capital loss carryforwards and losses due to deferred wash sales.
As of period end, the cost and unrealized appreciation (depreciation) in securities for federal income tax purposes were as follows:
| Gross unrealized appreciation | $17,687,403 |
| Gross unrealized depreciation | (2,713,505) |
| Net unrealized appreciation (depreciation) | $14,973,898 |
| Tax Cost | $101,966,525 |
The tax-based components of distributable earnings as of period end were as follows:
| Undistributed ordinary income | $2,925,944 |
| Undistributed long-term capital gain | $1,715,912 |
| Capital loss carryforward | $(5,453,268) |
| Net unrealized appreciation (depreciation) on securities and other investments | $14,973,891 |
Capital loss carryforwards are only available to offset future capital gains of the Fund to the extent provided by regulations and may be limited. Under the Regulated Investment Company Modernization Act of 2010 (the Act), the Fund is permitted to carry forward capital losses incurred in taxable years beginning after December 22, 2010 for an unlimited period and such capital losses are required to be used prior to any losses that expire. The capital loss carryforward information presented below, including any applicable limitation, is estimated as of fiscal period end and is subject to adjustment.
| Fiscal year of expiration | |
| 2019 | $(5,453,268) |
As a result of a large redemption in May 2017, the Fund had an "ownership change" under the Internal Revenue Code, which limits capital losses that will be available to offset future capital gains to approximately $2,189,706 per year. As a result, at least $3,402,729 of the Fund's capital loss carryforward will expire unused and is not included in the capital loss carryforward amounts disclosed in the table above.
The tax character of distributions paid was as follows:
| | October 31, 2017 | October 31, 2016 |
| Ordinary Income | $4,227,310 | $ 3,869,339 |
Short-Term Trading (Redemption) Fees. Shares held by investors in the Fund less than 30 days may have been subject to a redemption fee equal to 1.00% of the NAV of shares redeemed. All redemption fees, which reduce the proceeds of the shareholder redemption, are retained by the Fund and accounted for as an addition to paid in capital. In November 2017, the Board of Trustees approved the elimination of these redemption fees effective December 18, 2017.
Delayed Delivery Transactions and When-Issued Securities. During the period, the Fund transacted in securities on a delayed delivery or when-issued basis. Payment and delivery may take place after the customary settlement period for that security. The price of the underlying securities and the date when the securities will be delivered and paid for are fixed at the time the transaction is negotiated. The securities purchased on a delayed delivery or when-issued basis are identified as such in the Fund's Schedule of Investments. With respect to purchase commitments, the Fund identifies securities as segregated in its records with a value at least equal to the amount of the commitment. Losses may arise due to changes in the value of the underlying securities or if the counterparty does not perform under the contract's terms, or if the issuer does not issue the securities due to political, economic, or other factors.
Restricted Securities. The Fund may invest in securities that are subject to legal or contractual restrictions on resale. These securities generally may be resold in transactions exempt from registration or to the public if the securities are registered. Disposal of these securities may involve time-consuming negotiations and expense, and prompt sale at an acceptable price may be difficult. Information regarding restricted securities is included at the end of the Fund's Schedule of Investments.
4. Derivative Instruments.
Risk Exposures and the Use of Derivative Instruments. The Fund's investment objective allows the Fund to enter into various types of derivative contracts, including futures contracts. Derivatives are investments whose value is primarily derived from underlying assets, indices or reference rates and may be transacted on an exchange or over-the-counter (OTC). Derivatives may involve a future commitment to buy or sell a specified asset based on specified terms, to exchange future cash flows at periodic intervals based on a notional principal amount, or for one party to make one or more payments upon the occurrence of specified events in exchange for periodic payments from the other party.
The Fund used derivatives to increase returns and to manage exposure to certain risks as defined below. The success of any strategy involving derivatives depends on analysis of numerous economic factors, and if the strategies for investment do not work as intended, the Fund may not achieve its objectives.
The Fund's use of derivatives increased or decreased its exposure to the following risk:
| Equity Risk | Equity risk relates to the fluctuations in the value of financial instruments as a result of changes in market prices (other than those arising from interest rate risk or foreign exchange risk), whether caused by factors specific to an individual investment, its issuer, or all factors affecting all instruments traded in a market or market segment.
|
The Fund is also exposed to additional risks from investing in derivatives, such as liquidity risk and counterparty credit risk. Liquidity risk is the risk that the Fund will be unable to close out the derivative in the open market in a timely manner. Counterparty credit risk is the risk that the counterparty will not be able to fulfill its obligation to the Fund. Counterparty credit risk related to exchange-traded futures contracts may be mitigated by the protection provided by the exchange on which they trade.
Investing in derivatives may involve greater risks than investing in the underlying assets directly and, to varying degrees, may involve risk of loss in excess of any initial investment and collateral received and amounts recognized in the Statement of Assets and Liabilities. In addition, there may be the risk that the change in value of the derivative contract does not correspond to the change in value of the underlying instrument.
Futures Contracts. A futures contract is an agreement between two parties to buy or sell a specified underlying instrument for a fixed price at a specified future date. The Fund used futures contracts to manage its exposure to the stock market.
Upon entering into a futures contract, a fund is required to deposit either cash or securities (initial margin) with a clearing broker in an amount equal to a certain percentage of the face value of the contract. Futures contracts are marked-to-market daily and subsequent daily payments (variation margin) are made or received by a fund depending on the daily fluctuations in the value of the futures contracts and are recorded as unrealized appreciation or (depreciation). This receivable and/or payable, if any, is included in daily variation margin on futures contracts in the Statement of Assets and Liabilities. Realized gain or (loss) is recorded upon the expiration or closing of a futures contract. The net realized gain (loss) and change in net unrealized appreciation (depreciation) on futures contracts during the period is presented in the Statement of Operations.
5. Purchases and Sales of Investments.
Purchases and sales of securities, other than short-term securities and in-kind transactions, aggregated $146,392,579 and $148,721,164, respectively.
6. Fees and Other Transactions with Affiliates.
Management Fee. Fidelity Management & Research Company (the investment adviser) and its affiliates provide the Fund with investment management related services for which the Fund pays a monthly management fee. The management fee is the sum of an individual fund fee rate that is based on an annual rate of .45% of the Fund's average net assets and an annualized group fee rate that averaged .25% during the period. The group fee rate is based upon the average net assets of all the mutual funds advised by the investment adviser, including any mutual funds previously advised by the investment adviser that are currently advised by Fidelity SelectCo, LLC, an affiliate of the investment adviser. The group fee rate decreases as assets under management increase and increases as assets under management decrease. In addition, the management fee is subject to a performance adjustment (up to a maximum of +/- .20% of the Fund's average net assets over a 36 month performance period). The upward or downward adjustment to the management fee is based on relative investment performance of Total International Equity as compared to its benchmark index, the MSCI All Country World ex USA Index, over the same 36 month performance period. For the reporting period, the total annual management fee rate, including the performance adjustment, was .82% of the Fund's average net assets. The performance adjustment included in the management fee rate may be higher or lower than the maximum performance adjustment rate due to the difference between the average net assets for the reporting and performance periods.
Distribution and Service Plan Fees. In accordance with Rule 12b-1 of the 1940 Act, the Fund has adopted separate Distribution and Service Plans for each class of shares. Certain classes pay Fidelity Distributors Corporation (FDC), an affiliate of the investment adviser, separate Distribution and Service Fees, each of which is based on an annual percentage of each class' average net assets. In addition, FDC may pay financial intermediaries for selling shares of the Fund and providing shareholder support services. For the period, the Distribution and Service Fee rates, total fees and amounts retained by FDC were as follows:
| | Distribution
Fee | Service
Fee | Total Fees | Retained
by FDC |
| Class A | -% | .25% | $21,944 | $2,040 |
| Class M | .25% | .25% | 73,878 | – |
| Class C | .75% | .25% | 29,531 | 5,011 |
| | | | $125,353 | $7,051 |
Sales Load. FDC may receive a front-end sales charge of up to 5.75% for selling Class A shares and 3.50% for selling Class M shares, some of which is paid to financial intermediaries for selling shares of the Fund. Depending on the holding period, FDC may receive contingent deferred sales charges levied on Class A, Class M and Class C redemptions. The deferred sales charges are 1.00% for Class C shares, 1.00% for certain purchases of Class A shares and .25% for certain purchases of Class M shares.
For the period, sales charge amounts retained by FDC were as follows:
| | Retained
by FDC |
| Class A | $2,125 |
| Class M | 819 |
| Class C(a) | 563 |
| | $3,507 |
(a) When Class C shares are initially sold, FDC pays commissions from its own resources to financial intermediaries through which the sales are made.
Transfer Agent Fees. Fidelity Investments Institutional Operations Company, Inc., (FIIOC), an affiliate of the investment adviser, is the transfer, dividend disbursing and shareholder servicing agent for each class of the Fund. FIIOC receives account fees and asset-based fees that vary according to the account size and type of account of the shareholders of the respective classes of the Fund, except for Class Z. FIIOC receives an asset-based fee of Class Z's average net assets. FIIOC pays for typesetting, printing and mailing of shareholder reports, except proxy statements.
For the period, transfer agent fees for each class were as follows:
| | Amount | % of
Class-Level Average
Net Assets |
| Class A | $22,313 | .25 |
| Class M | 34,354 | .23 |
| Class C | 9,141 | .31 |
| Total International Equity | 245,274 | .13 |
| Class I | 7,410 | .19 |
| Class Z | 58 | .05(a) |
| | $318,550 | |
(a) Annualized
Accounting and Security Lending Fees. Fidelity Service Company, Inc. (FSC), an affiliate of the investment adviser, maintains the Fund's accounting records. The accounting fee is based on the level of average net assets for each month. Under a separate contract, FSC administers the security lending program. The security lending fee is based on the number and duration of lending transactions.
Brokerage Commissions. The Fund placed a portion of its portfolio transactions with brokerage firms which are affiliates of the investment adviser. Brokerage commissions are included in net realized gain (loss) and change in net unrealized appreciation (depreciation) in the Statement of Operations. The commissions paid to these affiliated firms were $597 for the period.
Interfund Trades. The Fund may purchase from or sell securities to other Fidelity Funds under procedures adopted by the Board. The procedures have been designed to ensure these interfund trades are executed in accordance with Rule 17a-7 of the 1940 Act. Interfund trades are included within the respective purchases and sales amounts shown in the Purchases and Sales of Investments note.
Redemptions In-Kind. During the period, 30,358,599 shares of the Fund held by an affiliated entity were redeemed in-kind for investments and cash with a value of $259,566,026. The net realized gain of $51,686,661 on investments delivered through the in-kind redemptions is included in the accompanying Statement of Operations. The amount of the redemptions is included in share transactions activity shown in the accompanying Statement of Changes in Net Assets as well as the Notes to Financial Statements. The Fund recognized no gain or loss for federal income tax purposes.
Other. During the period, the investment adviser reimbursed the Fund for certain losses in the amount of $3,206.
7. Committed Line of Credit.
The Fund participates with other funds managed by the investment adviser or an affiliate in a $4.25 billion credit facility (the "line of credit") to be utilized for temporary or emergency purposes to fund shareholder redemptions or for other short-term liquidity purposes. The Fund has agreed to pay commitment fees on its pro-rata portion of the line of credit, which amounted to $779 and is reflected in Miscellaneous expenses on the Statement of Operations. During the period, the Fund did not borrow on this line of credit.
8. Security Lending.
The Fund lends portfolio securities through a lending agent from time to time in order to earn additional income. For equity securities, a lending agent is used and may loan securities to certain qualified borrowers, including Fidelity Capital Markets (FCM), a broker-dealer affiliated with the Fund. On the settlement date of the loan, the Fund receives collateral (in the form of U.S. Treasury obligations, letters of credit and/or cash) against the loaned securities and maintains collateral in an amount not less than 100% of the market value of the loaned securities during the period of the loan. The market value of the loaned securities is determined at the close of business of the Fund and any additional required collateral is delivered to the Fund on the next business day. The Fund or borrower may terminate the loan at any time, and if the borrower defaults on its obligation to return the securities loaned because of insolvency or other reasons, the Fund may apply collateral received from the borrower against the obligation. The Fund may experience delays and costs in recovering the securities loaned. Any cash collateral received is invested in the Fidelity Securities Lending Cash Central Fund. The value of loaned securities and cash collateral at period end are disclosed on the Fund's Statement of Assets and Liabilities. Security lending income represents the income earned on investing cash collateral, less rebates paid to borrowers and any lending agent fees associated with the loan, plus any premium payments received for lending certain types of securities. Security lending income is presented in the Statement of Operations as a component of income from Fidelity Central Funds. Total security lending income during the period amounted to $32,511. During the period, there were no securities loaned to FCM.
9. Expense Reductions.
The investment adviser contractually agreed to reimburse each class to the extent annual operating expenses exceeded certain levels of average net assets as noted in the table below. This reimbursement will remain in place through December 31, 2018. Some expenses, for example the compensation of the independent Trustees, and certain miscellaneous expenses such as proxy and shareholder meeting expenses, are excluded from this reimbursement.
The following classes were in reimbursement during the period:
| | Expense
Limitations | Reimbursement |
| Class A | 1.45% | $19,402 |
| Class M | 1.70% | 29,290 |
| Class C | 2.20% | 8,273 |
| Total International Equity | 1.20% | 15,515 |
| Class I | 1.20% | 8,992 |
| Class Z | 1.05% | 333 |
| | | $81,805 |
Commissions paid to certain brokers with whom the investment adviser, or its affiliates, places trades on behalf of the Fund include an amount in addition to trade execution, which may be rebated back to the Fund to offset certain expenses. This amount totaled $30,620 for the period.
In addition, during the period the investment adviser reimbursed and/or waived a portion of fund-level operating expenses in the amount of $2,727.
10. Distributions to Shareholders.
Distributions to shareholders of each class were as follows:
| | Year ended
October 31, 2017 | Year ended
October 31, 2016 |
| From net investment income | | |
| Class A | $92,173 | $72,361 |
| Class M | 119,902 | 77,358 |
| Class C | 8,223 | – |
| Total International Equity | 3,979,536 | 3,691,251 |
| Class I | 27,476 | 28,369 |
| Total | $4,227,310 | $3,869,339 |
11. Share Transactions.
Share transactions for each class were as follows and may contain automatic conversions between classes or exchanges between affiliated funds:
| | Shares | Shares | Dollars | Dollars |
| | Year ended October 31, 2017(a) | Year ended October 31, 2016 | Year ended October 31, 2017(a) | Year ended October 31, 2016 |
| Class A | | | | |
| Shares sold | 192,334 | 221,277 | $1,631,763 | $1,661,593 |
| Reinvestment of distributions | 12,257 | 9,322 | 91,682 | 71,782 |
| Shares redeemed | (332,738) | (289,523) | (2,778,571) | (2,176,317) |
| Net increase (decrease) | (128,147) | (58,924) | $(1,055,126) | $(442,942) |
| Class M | | | | |
| Shares sold | 238,813 | 459,219 | $1,896,741 | $3,481,274 |
| Reinvestment of distributions | 15,944 | 9,988 | 119,902 | 77,308 |
| Shares redeemed | (372,174) | (451,150) | (3,041,931) | (3,381,486) |
| Net increase (decrease) | (117,417) | 18,057 | $(1,025,288) | $177,096 |
| Class B | | | | |
| Shares sold | – | 1,078 | $– | $7,665 |
| Shares redeemed | – | (16,441) | – | (122,211) |
| Net increase (decrease) | – | (15,363) | $– | $(114,546) |
| Class C | | | | |
| Shares sold | 96,785 | 91,061 | $808,355 | $684,626 |
| Reinvestment of distributions | 1,070 | – | 8,046 | – |
| Shares redeemed | (109,698) | (162,991) | (920,097) | (1,228,823) |
| Net increase (decrease) | (11,843) | (71,930) | $(103,696) | $(544,197) |
| Total International Equity | | | | |
| Shares sold | 6,763,065 | 4,801,342 | $53,465,510 | $36,478,674 |
| Reinvestment of distributions | 523,250 | 471,692 | 3,913,907 | 3,632,026 |
| Shares redeemed | (35,028,420)(b) | (8,073,720) | (297,076,095)(b) | (60,183,392) |
| Net increase (decrease) | (27,742,105) | (2,800,686) | $(239,696,678) | $(20,072,692) |
| Class I | | | | |
| Shares sold | 604,657 | 155,879 | $5,121,757 | $1,165,295 |
| Reinvestment of distributions | 3,621 | 3,671 | 27,016 | 28,160 |
| Shares redeemed | (167,386) | (212,465) | (1,392,556) | (1,617,545) |
| Net increase (decrease) | 440,892 | (52,915) | $3,756,217 | $(424,090) |
| Class Z | | | | |
| Shares sold | 26,796 | – | $221,657 | $– |
| Shares redeemed | (569) | – | (5,097) | – |
| Net increase (decrease) | 26,227 | – | $216,560 | $– |
(a) Share transactions for Class Z are for the period February 1, 2017 (commencement of sale of shares) to October 31, 2017
(b) Amounts include in-kind redemption (see the Redemptions In-Kind note for additional details).
12. Other.
The Fund's organizational documents provide former and current trustees and officers with a limited indemnification against liabilities arising in connection with the performance of their duties to the Fund. In the normal course of business, the Fund may also enter into contracts that provide general indemnifications. The Fund's maximum exposure under these arrangements is unknown as this would be dependent on future claims that may be made against the Fund. The risk of material loss from such claims is considered remote.
Report of Independent Registered Public Accounting Firm
To the Trustees of Fidelity Investment Trust and Shareholders of Fidelity Total International Equity Fund:
We have audited the accompanying statement of assets and liabilities of Fidelity Total International Equity Fund (the Fund), a fund of Fidelity Investment Trust, including the schedule of investments, as of October 31, 2017, and the related statement of operations for the year then ended, the statement of changes in net assets for each of the two years in the period then ended, and the financial highlights for each of the periods presented. These financial statements and financial highlights are the responsibility of the Fund's management. Our responsibility is to express an opinion on these financial statements and financial highlights based on our audits.
We conducted our audits in accordance with the standards of the Public Company Accounting Oversight Board (United States). Those standards require that we plan and perform the audit to obtain reasonable assurance about whether the financial statements and financial highlights are free of material misstatement. The Fund is not required to have, nor were we engaged to perform, an audit of its internal control over financial reporting. Our audits included consideration of internal control over financial reporting as a basis for designing audit procedures that are appropriate in the circumstances, but not for the purpose of expressing an opinion on the effectiveness of the Fund's internal control over financial reporting. Accordingly, we express no such opinion. An audit also includes examining, on a test basis, evidence supporting the amounts and disclosures in the financial statements, assessing the accounting principles used and significant estimates made by management, as well as evaluating the overall financial statement presentation. Our procedures included confirmation of securities owned as of October 31, 2017, by correspondence with the custodians and brokers; when replies were not received from brokers, we performed other auditing procedures. We believe that our audits provide a reasonable basis for our opinion.
In our opinion, such financial statements and financial highlights referred to above present fairly, in all material respects, the financial position of Fidelity Total International Equity Fund as of October 31, 2017, the results of its operations for the year then ended, the changes in its net assets for each of the two years in the period then ended, and the financial highlights for each of the periods presented, in conformity with accounting principles generally accepted in the United States of America.
DELOITTE & TOUCHE LLP
Boston, Massachusetts
December 15, 2017
Trustees and Officers
The Trustees, Members of the Advisory Board (if any), and officers of the trust and fund, as applicable, are listed below. The Board of Trustees governs the fund and is responsible for protecting the interests of shareholders. The Trustees are experienced executives who meet periodically throughout the year to oversee the fund's activities, review contractual arrangements with companies that provide services to the fund, oversee management of the risks associated with such activities and contractual arrangements, and review the fund's performance. Except for Jonathan Chiel, each of the Trustees oversees 190 funds. Mr. Chiel oversees 143 funds.
The Trustees hold office without limit in time except that (a) any Trustee may resign; (b) any Trustee may be removed by written instrument, signed by at least two-thirds of the number of Trustees prior to such removal; (c) any Trustee who requests to be retired or who has become incapacitated by illness or injury may be retired by written instrument signed by a majority of the other Trustees; and (d) any Trustee may be removed at any special meeting of shareholders by a two-thirds vote of the outstanding voting securities of the trust. Each Trustee who is not an interested person (as defined in the 1940 Act) of the trust and the fund is referred to herein as an Independent Trustee. Each Independent Trustee shall retire not later than the last day of the calendar year in which his or her 75th birthday occurs. The Independent Trustees may waive this mandatory retirement age policy with respect to individual Trustees. Officers and Advisory Board Members hold office without limit in time, except that any officer or Advisory Board Member may resign or may be removed by a vote of a majority of the Trustees at any regular meeting or any special meeting of the Trustees. Except as indicated, each individual has held the office shown or other offices in the same company for the past five years.
The fund’s Statement of Additional Information (SAI) includes more information about the Trustees. To request a free copy, call Fidelity at 1-800-544-8544.
Experience, Skills, Attributes, and Qualifications of the Trustees. The Governance and Nominating Committee has adopted a statement of policy that describes the experience, qualifications, attributes, and skills that are necessary and desirable for potential Independent Trustee candidates (Statement of Policy). The Board believes that each Trustee satisfied at the time he or she was initially elected or appointed a Trustee, and continues to satisfy, the standards contemplated by the Statement of Policy. The Governance and Nominating Committee also engages professional search firms to help identify potential Independent Trustee candidates who have the experience, qualifications, attributes, and skills consistent with the Statement of Policy. From time to time, additional criteria based on the composition and skills of the current Independent Trustees, as well as experience or skills that may be appropriate in light of future changes to board composition, business conditions, and regulatory or other developments, have also been considered by the professional search firms and the Governance and Nominating Committee. In addition, the Board takes into account the Trustees' commitment and participation in Board and committee meetings, as well as their leadership of standing and ad hoc committees throughout their tenure.
In determining that a particular Trustee was and continues to be qualified to serve as a Trustee, the Board has considered a variety of criteria, none of which, in isolation, was controlling. The Board believes that, collectively, the Trustees have balanced and diverse experience, qualifications, attributes, and skills, which allow the Board to operate effectively in governing the fund and protecting the interests of shareholders. Information about the specific experience, skills, attributes, and qualifications of each Trustee, which in each case led to the Board's conclusion that the Trustee should serve (or continue to serve) as a trustee of the fund, is provided below.
Board Structure and Oversight Function. James C. Curvey is an interested person and currently serves as Chairman. The Trustees have determined that an interested Chairman is appropriate and benefits shareholders because an interested Chairman has a personal and professional stake in the quality and continuity of services provided to the fund. Independent Trustees exercise their informed business judgment to appoint an individual of their choosing to serve as Chairman, regardless of whether the Trustee happens to be independent or a member of management. The Independent Trustees have determined that they can act independently and effectively without having an Independent Trustee serve as Chairman and that a key structural component for assuring that they are in a position to do so is for the Independent Trustees to constitute a substantial majority for the Board. The Independent Trustees also regularly meet in executive session. Ned C. Lautenbach serves as Chairman of the Independent Trustees and as such (i) acts as a liaison between the Independent Trustees and management with respect to matters important to the Independent Trustees and (ii) with management prepares agendas for Board meetings.
Fidelity® funds are overseen by different Boards of Trustees. The fund's Board oversees Fidelity's high income and certain equity funds, and other Boards oversee Fidelity's investment-grade bond, money market, asset allocation, and sector funds. The asset allocation funds may invest in Fidelity® funds overseen by the fund's Board. The use of separate Boards, each with its own committee structure, allows the Trustees of each group of Fidelity® funds to focus on the unique issues of the funds they oversee, including common research, investment, and operational issues. On occasion, the separate Boards establish joint committees to address issues of overlapping consequences for the Fidelity® funds overseen by each Board.
The Trustees operate using a system of committees to facilitate the timely and efficient consideration of all matters of importance to the Trustees, the fund, and fund shareholders and to facilitate compliance with legal and regulatory requirements and oversight of the fund's activities and associated risks. The Board, acting through its committees, has charged FMR and its affiliates with (i) identifying events or circumstances the occurrence of which could have demonstrably adverse effects on the fund's business and/or reputation; (ii) implementing processes and controls to lessen the possibility that such events or circumstances occur or to mitigate the effects of such events or circumstances if they do occur; and (iii) creating and maintaining a system designed to evaluate continuously business and market conditions in order to facilitate the identification and implementation processes described in (i) and (ii) above. Because the day-to-day operations and activities of the fund are carried out by or through FMR, its affiliates, and other service providers, the fund's exposure to risks is mitigated but not eliminated by the processes overseen by the Trustees. While each of the Board's committees has responsibility for overseeing different aspects of the fund's activities, oversight is exercised primarily through the Operations, Audit, and Compliance Committees. In addition, the Independent Trustees have worked with FMR to enhance the Board's oversight of investment and financial risks, legal and regulatory risks, technology risks, and operational risks, including the development of additional risk reporting to the Board. For example, a working group comprised of Independent Trustees and FMR has worked and continues to work to review the Fidelity® funds' valuation-related activities, reporting and risk management. Appropriate personnel, including but not limited to the fund's Chief Compliance Officer (CCO), FMR's internal auditor, the independent accountants, the fund's Treasurer and portfolio management personnel, make periodic reports to the Board's committees, as appropriate, including an annual review of Fidelity's risk management program for the Fidelity® funds. The responsibilities of each standing committee, including their oversight responsibilities, are described further under "Standing Committees of the Trustees."
Interested Trustees*:
Correspondence intended for a Trustee who is an interested person may be sent to Fidelity Investments, 245 Summer Street, Boston, Massachusetts 02210.
Name, Year of Birth; Principal Occupations and Other Relevant Experience+
Jonathan Chiel (1957)
Year of Election or Appointment: 2016
Trustee
Mr. Chiel also serves as Trustee of other Fidelity® funds. Mr. Chiel is Executive Vice President and General Counsel for FMR LLC (diversified financial services company, 2012-present). Previously, Mr. Chiel served as general counsel (2004-2012) and senior vice president and deputy general counsel (2000-2004) for John Hancock Financial Services; a partner with Choate, Hall & Stewart (1996-2000) (law firm); and an Assistant United States Attorney for the United States Attorney’s Office of the District of Massachusetts (1986-95), including Chief of the Criminal Division (1993-1995). Mr. Chiel is a director on the boards of the Boston Bar Foundation and the Maimonides School.
James C. Curvey (1935)
Year of Election or Appointment: 2007
Trustee
Chairman of the Board of Trustees
Mr. Curvey also serves as Trustee of other Fidelity® funds. Mr. Curvey is a Director of Fidelity Research & Analysis Co. (investment adviser firm, 2009-present), and Vice Chairman (2007-present) and Director of FMR LLC (diversified financial services company). In addition, Mr. Curvey serves as an Overseer for the Boston Symphony Orchestra and a member of the board of Artis-Naples, Naples, Florida, and as a Trustee for Brewster Academy, Wolfeboro, New Hampshire. Previously, Mr. Curvey served as a Director of Fidelity Investments Money Management, Inc. (investment adviser firm, 2009-2014) and a Director of FMR and FMR Co., Inc. (investment adviser firms, 2007-2014).
Charles S. Morrison (1960)
Year of Election or Appointment: 2014
Trustee
Mr. Morrison also serves as Trustee of other funds. He serves as President of Fidelity Management & Research Company (FMR) (investment adviser firm, 2016-present), a Director of Fidelity Investments Money Management, Inc. (FIMM) (investment adviser firm, 2014-present), Director of Fidelity SelectCo, LLC (investment adviser firm, 2014-present), President, Asset Management (2014-present), and is an employee of Fidelity Investments. Previously, Mr. Morrison served as Vice President of Fidelity's Fixed Income and Asset Allocation Funds (2012-2014), President, Fixed Income (2011-2014), Vice President of Fidelity's Money Market Funds (2005-2009), President, Money Market Group Leader of FMR (investment adviser firm, 2009), and Senior Vice President, Money Market Group of FMR (2004-2009). Mr. Morrison also served as Vice President of Fidelity's Bond Funds (2002-2005), certain Balanced Funds (2002-2005), and certain Asset Allocation Funds (2002-2007), and as Senior Vice President (2002-2005) of Fidelity's Bond Division.
* Determined to be an “Interested Trustee” by virtue of, among other things, his or her affiliation with the trust or various entities under common control with FMR.
+ The information includes the Trustee's principal occupation during the last five years and other information relating to the experience, attributes, and skills relevant to the Trustee's qualifications to serve as a Trustee, which led to the conclusion that the Trustee should serve as a Trustee for the fund.
Independent Trustees:
Correspondence intended for an Independent Trustee may be sent to Fidelity Investments, P.O. Box 55235, Boston, Massachusetts 02205-5235.
Name, Year of Birth; Principal Occupations and Other Relevant Experience+
Dennis J. Dirks (1948)
Year of Election or Appointment: 2005
Trustee
Mr. Dirks also serves as Trustee of other Fidelity® funds. Prior to his retirement in May 2003, Mr. Dirks was Chief Operating Officer and a member of the Board of The Depository Trust & Clearing Corporation (DTCC). He also served as President, Chief Operating Officer, and Board member of The Depository Trust Company (DTC) and President and Board member of the National Securities Clearing Corporation (NSCC). In addition, Mr. Dirks served as Chief Executive Officer and Board member of the Government Securities Clearing Corporation, Chief Executive Officer and Board member of the Mortgage-Backed Securities Clearing Corporation, as a Trustee and a member of the Finance Committee of Manhattan College (2005-2008), as a Trustee and a member of the Finance Committee of AHRC of Nassau County (2006-2008), as a member of the Independent Directors Council (IDC) Governing Council (2010-2015), and as a member of the Board of Directors for The Brookville Center for Children’s Services, Inc. (2009-2017). Mr. Dirks is a member of the Finance Committee (2016-present) and Board of Directors (2017-present) of the Asolo Repertory Theatre.
Alan J. Lacy (1953)
Year of Election or Appointment: 2008
Trustee
Mr. Lacy also serves as Trustee of other Fidelity® funds. Mr. Lacy serves as a Director of Bristol-Myers Squibb Company (global pharmaceuticals, 2008-present). He is a Trustee of the California Chapter of The Nature Conservancy (2015-present) and a Director of the Center for Advanced Study in the Behavioral Sciences at Stanford University (2015-present). In addition, Mr. Lacy served as Senior Adviser (2007-2014) of Oak Hill Capital Partners, L.P. (private equity) and also served as Chief Executive Officer (2005) and Vice Chairman (2005-2006) of Sears Holdings Corporation (retail) and Chief Executive Officer and Chairman of the Board of Sears, Roebuck and Co. (retail, 2000-2005). Previously, Mr. Lacy served as Chairman (2014-2017) and a member (2010-2017) of the Board of Directors of Dave & Buster’s Entertainment, Inc. (restaurant and entertainment complexes), as Chairman (2008-2011) and a member (2006-2015) of the Board of Trustees of the National Parks Conservation Association, and as a member of the Board of Directors for The Hillman Companies, Inc. (hardware wholesalers, 2010-2014), Earth Fare, Inc. (retail grocery, 2010-2014), and The Western Union Company (global money transfer, 2006-2011).
Ned C. Lautenbach (1944)
Year of Election or Appointment: 2000
Trustee
Chairman of the Independent Trustees
Mr. Lautenbach also serves as Trustee of other Fidelity® funds. Mr. Lautenbach currently serves as Vice Chair of the Board of Governors, State University System of Florida (2013-present) and is a member of the Council on Foreign Relations (1994-present). He is also a member and has most recently served as Chairman of the Board of Directors of Artis-Naples (2012-present). Previously, Mr. Lautenbach served as a member and then Lead Director of the Board of Directors of Eaton Corporation (diversified industrial, 1997-2016). He was also a Partner and Advisory Partner at Clayton, Dubilier & Rice, LLC (private equity investment, 1998-2010), as well as a Director of Sony Corporation (2006-2007). In addition, Mr. Lautenbach also had a 30-year career with IBM (technology company) during which time he served as Senior Vice President and a member of the Corporate Executive Committee (1968-1998).
Joseph Mauriello (1944)
Year of Election or Appointment: 2008
Trustee
Mr. Mauriello also serves as Trustee of other Fidelity® funds. Prior to his retirement in January 2006, Mr. Mauriello served in numerous senior management positions including Deputy Chairman and Chief Operating Officer (2004-2005), and Vice Chairman of Financial Services (2002-2004) of KPMG LLP US (professional services, 1965-2005). Mr. Mauriello currently serves as a member of the Board of Directors of XL Group plc. (global insurance and re-insurance, 2006-present) and the Independent Directors Council (IDC) Governing Council (2015-present). Previously, Mr. Mauriello served as a Director of the Hamilton Funds of the Bank of New York (2006-2007) and of Arcadia Resources Inc. (health care services and products, 2007-2012).
Cornelia M. Small (1944)
Year of Election or Appointment: 2005
Trustee
Ms. Small also serves as Trustee of other Fidelity® funds. Ms. Small is a member of the Board of Directors (2009-present) and Chair of the Investment Committee (2010-present) of the Teagle Foundation. Ms. Small also serves on the Investment Committee of the Berkshire Taconic Community Foundation (2008-present). Previously, Ms. Small served as Chairperson (2002-2008) and a member of the Investment Committee and Chairperson (2008-2012) and a member of the Board of Trustees of Smith College. In addition, Ms. Small served as Chief Investment Officer, Director of Global Equity Investments, and a member of the Board of Directors of Scudder, Stevens & Clark and Scudder Kemper Investments.
William S. Stavropoulos (1939)
Year of Election or Appointment: 2001
Trustee
Vice Chairman of the Independent Trustees
Mr. Stavropoulos also serves as Trustee of other Fidelity® funds. Mr. Stavropoulos serves as President and Founder of the Michigan Baseball Foundation, the Great Lakes Loons (2007-present). Mr. Stavropoulos is Chairman Emeritus of the Board of Directors of The Dow Chemical Company, where he previously served in numerous senior management positions, including President, CEO (1995-2000; 2002-2004), Chairman of the Executive Committee (2000-2006), and as a member of the Board of Directors (1990-2006). Currently, Mr. Stavropoulos is Chairman of the Board of Directors of Univar Inc. (global distributor of commodity and specialty chemicals), a Director of Teradata Corporation (data warehousing and technology solutions), and a member of the Advisory Board for Metalmark Capital LLC (private equity investment, 2005-present). Mr. Stavropoulos is an operating advisor to Clayton, Dubilier & Rice, LLC (private equity investment). In addition, Mr. Stavropoulos is a member of the University of Notre Dame Advisory Council for the College of Science, a Trustee of the Rollin L. Gerstacker Foundation, and a Director of Artis-Naples in Naples, Florida. Previously, Mr. Stavropoulos served as a Director of Chemical Financial Corporation (bank holding company, 1993-2012) and Tyco International, Ltd. (multinational manufacturing and services, 2007-2012).
David M. Thomas (1949)
Year of Election or Appointment: 2008
Trustee
Mr. Thomas also serves as Trustee of other Fidelity® funds. Mr. Thomas serves as Non-Executive Chairman of the Board of Directors of Fortune Brands Home and Security (home and security products, 2011-present), as a member of the Board of Directors (2004-present) and Presiding Director (2013-present) of Interpublic Group of Companies, Inc. (marketing communication), and as a member of the Board of Trustees of the University of Florida (2013-present). Previously, Mr. Thomas served as Executive Chairman (2005-2006) and Chairman and Chief Executive Officer (2000-2005) of IMS Health, Inc. (pharmaceutical and healthcare information solutions), and a Director of Fortune Brands, Inc. (consumer products, 2000-2011).
+ The information includes the Trustee's principal occupation during the last five years and other information relating to the experience, attributes, and skills relevant to the Trustee's qualifications to serve as a Trustee, which led to the conclusion that the Trustee should serve as a Trustee for the fund.
Advisory Board Members and Officers:
Correspondence intended for an officer or Peter S. Lynch may be sent to Fidelity Investments, 245 Summer Street, Boston, Massachusetts 02210. Officers appear below in alphabetical order.
Name, Year of Birth; Principal Occupation
Peter S. Lynch (1944)
Year of Election or Appointment: 2003
Member of the Advisory Board
Mr. Lynch also serves as Member of the Advisory Board of other Fidelity® funds. Mr. Lynch is Vice Chairman and a Director of FMR (investment adviser firm) and FMR Co., Inc. (investment adviser firm). In addition, Mr. Lynch serves as a Trustee of Boston College and as the Chairman of the Inner-City Scholarship Fund. Previously, Mr. Lynch served on the Special Olympics International Board of Directors (1997-2006).
Elizabeth Paige Baumann (1968)
Year of Election or Appointment: 2017
Anti-Money Laundering (AML) Officer
Ms. Baumann also serves as AML Officer of other funds. She is Chief AML Officer (2012-present) and Senior Vice President (2014-present) of FMR LLC (diversified financial services company) and is an employee of Fidelity Investments. Previously, Ms. Baumann served as AML Officer of the funds (2012-2016), and Vice President (2007-2014) and Deputy Anti-Money Laundering Officer (2007-2012) of FMR LLC.
Marc R. Bryant (1966)
Year of Election or Appointment: 2015
Secretary and Chief Legal Officer (CLO)
Mr. Bryant also serves as Secretary and CLO of other funds. Mr. Bryant serves as CLO, Secretary, and Senior Vice President of Fidelity Management & Research Company (investment adviser firm, 2015-present) and FMR Co., Inc. (investment adviser firm, 2015-present); Secretary of Fidelity SelectCo, LLC (investment adviser firm, 2015-present) and Fidelity Investments Money Management, Inc. (investment adviser firm, 2015-present); and CLO of Fidelity Management & Research (Hong Kong) Limited and FMR Investment Management (UK) Limited (investment adviser firms, 2015-present) and Fidelity Management & Research (Japan) Limited (investment adviser firm, 2016-present). He is Senior Vice President and Deputy General Counsel of FMR LLC (diversified financial services company). Previously, Mr. Bryant served as Secretary and CLO of Fidelity Rutland Square Trust II (2010-2014) and Assistant Secretary of Fidelity's Fixed Income and Asset Allocation Funds (2013-2015). Prior to joining Fidelity Investments, Mr. Bryant served as a Senior Vice President and the Head of Global Retail Legal for AllianceBernstein L.P. (2006-2010), and as the General Counsel for ProFund Advisors LLC (2001-2006).
William C. Coffey (1969)
Year of Election or Appointment: 2009
Assistant Secretary
Mr. Coffey also serves as Assistant Secretary of other funds. He is Senior Vice President and Deputy General Counsel of FMR LLC (diversified financial services company, 2010-present), and is an employee of Fidelity Investments. Previously, Mr. Coffey served as Vice President and Associate General Counsel of FMR LLC (2005-2009).
Jonathan Davis (1968)
Year of Election or Appointment: 2010
Assistant Treasurer
Mr. Davis also serves as Assistant Treasurer of other funds, and is an employee of Fidelity Investments. Previously, Mr. Davis served as Vice President and Associate General Counsel of FMR LLC (diversified financial services company, 2003-2010).
Adrien E. Deberghes (1967)
Year of Election or Appointment: 2016
Assistant Treasurer
Mr. Deberghes also serves as an officer of other funds. He serves as Executive Vice President of Fidelity Investments Money Management, Inc. (FIMM) (investment adviser firm, 2016-present) and is an employee of Fidelity Investments (2008-present). Prior to joining Fidelity Investments, Mr. Deberghes was Senior Vice President of Mutual Fund Administration at State Street Corporation (2007-2008), Senior Director of Mutual Fund Administration at Investors Bank & Trust (2005-2007), and Director of Finance for Dunkin' Brands (2000-2005). Previously, Mr. Deberghes served in other fund officer roles.
Joseph DeSantis (1959)
Year of Election or Appointment: 2017
Vice President
Mr. DeSantis also serves as Vice President of other funds. Mr. DeSantis serves as a Director of Fidelity Management & Research (Japan) Limited (investment adviser firm, 2016-present), Chief Investment Officer, Equities (2010-present) and is an employee of Fidelity Investments.
Stephanie J. Dorsey (1969)
Year of Election or Appointment: 2010
Assistant Treasurer
Ms. Dorsey also serves as an officer of other funds. She is an employee of Fidelity Investments (2008-present) and has served in other fund officer roles. Prior to joining Fidelity Investments, Ms. Dorsey served as Treasurer (2004-2008) of the JPMorgan Mutual Funds and Vice President (2004-2008) of JPMorgan Chase Bank.
Howard J. Galligan III (1966)
Year of Election or Appointment: 2014
Chief Financial Officer
Mr. Galligan also serves as Chief Financial Officer of other funds. Mr. Galligan serves as President of Fidelity Pricing and Cash Management Services (FPCMS) (2014-present) and as a Director of Strategic Advisers, Inc. (investment adviser firm, 2008-present). Previously, Mr. Galligan served as Chief Administrative Officer of Asset Management (2011-2014) and Chief Operating Officer and Senior Vice President of Investment Support for Strategic Advisers, Inc. (2003-2011).
Brian B. Hogan (1964)
Year of Election or Appointment: 2009
Vice President
Mr. Hogan also serves as Trustee or Vice President of other funds. Mr. Hogan serves as a Director of FMR Investment Management (UK) Limited (investment adviser firm, 2015-present) and Fidelity SelectCo, LLC (investment adviser firm, 2014-present) and President of the Equity Division of FMR (investment adviser firm, 2009-present). Previously, Mr. Hogan served as Senior Vice President, Equity Research of FMR (2006-2009) and as a portfolio manager. Mr. Brian B. Hogan is not related to Mr. Colm A. Hogan.
Colm A. Hogan (1973)
Year of Election or Appointment: 2016
Deputy Treasurer
Mr. Hogan also serves as an officer of other funds. Mr. Hogan is an employee of Fidelity Investments (2005-present). Mr. Colm A. Hogan is not related to Mr. Brian B. Hogan.
Chris Maher (1972)
Year of Election or Appointment: 2013
Assistant Treasurer
Mr. Maher serves as Assistant Treasurer of other funds. Mr. Maher is Vice President of Valuation Oversight and is an employee of Fidelity Investments. Previously, Mr. Maher served as Vice President of Asset Management Compliance (2013), Vice President of the Program Management Group of FMR (investment adviser firm, 2010-2013), and Vice President of Valuation Oversight (2008-2010).
Rieco E. Mello (1969)
Year of Election or Appointment: 2017
Assistant Treasurer
Mr. Mello also serves as Assistant Treasurer of other funds. Mr. Mello is an employee of Fidelity Investments (1995-present).
Kenneth B. Robins (1969)
Year of Election or Appointment: 2016
Chief Compliance Officer
Mr. Robins also serves as an officer of other funds. Mr. Robins serves as Compliance Officer of Fidelity Management & Research Company and FMR Co., Inc. (investment adviser firms, 2016-present) and is an employee of Fidelity Investments (2004-present). Previously, Mr. Robins served as Executive Vice President of Fidelity Investments Money Management, Inc. (investment adviser firm, 2013-2016) and served in other fund officer roles.
Stacie M. Smith (1974)
Year of Election or Appointment: 2016
President and Treasurer
Ms. Smith also serves as an officer of other funds. She is an employee of Fidelity Investments (2009-present) and has served in other fund officer roles. Prior to joining Fidelity Investments, Ms. Smith served as Senior Audit Manager of Ernst & Young LLP (accounting firm, 1996-2009). Previously, Ms. Smith served as Deputy Treasurer of certain Fidelity® funds (2013-2016).
Marc L. Spector (1972)
Year of Election or Appointment: 2016
Assistant Treasurer
Mr. Spector also serves as an officer of other funds. Mr. Spector is an employee of Fidelity Investments (2016-present). Prior to joining Fidelity Investments, Mr. Spector served as Director at the Siegfried Group (accounting firm, 2013-2016), and prior to Siegfried Group as audit senior manager at Deloitte & Touche (accounting firm, 2005-2013).
Renee Stagnone (1975)
Year of Election or Appointment: 2016
Assistant Treasurer
Ms. Stagnone also serves as an officer of other funds. Ms. Stagnone is an employee of Fidelity Investments (1997-present). Previously, Ms. Stagnone served as Deputy Treasurer of certain Fidelity® funds (2013-2016).
Shareholder Expense Example
As a shareholder of the Fund, you incur two types of costs: (1) transaction costs, including sales charges (loads) on purchase payments or redemption proceeds, redemption fees and (2) ongoing costs, including management fees, distribution and/or service (12b-1) fees and other Fund expenses. This Example is intended to help you understand your ongoing costs (in dollars) of investing in the Fund and to compare these costs with the ongoing costs of investing in other mutual funds.
The Example is based on an investment of $1,000 invested at the beginning of the period and held for the entire period (May 1, 2017 to October 31, 2017).
Actual Expenses
The first line of the accompanying table for each class of the Fund provides information about actual account values and actual expenses. You may use the information in this line, together with the amount you invested, to estimate the expenses that you paid over the period. Simply divide your account value by $1,000.00 (for example, an $8,600 account value divided by $1,000.00 = 8.6), then multiply the result by the number in the first line for a class of the Fund under the heading entitled "Expenses Paid During Period" to estimate the expenses you paid on your account during this period. A small balance maintenance fee of $12.00 that is charged once a year may apply for certain accounts with a value of less than $2,000. This fee is not included in the table below. If it was, the estimate of expenses you paid during the period would be higher, and your ending account value lower, by this amount. In addition, the Fund, as a shareholder in the underlying Fidelity Central Funds, will indirectly bear its pro-rata share of the fees and expenses incurred by the underlying Fidelity Central Funds. These fees and expenses are not included in the Fund's annualized expense ratio used to calculate the expense estimate in the table below.
Hypothetical Example for Comparison Purposes
The second line of the accompanying table for each class of the Fund provides information about hypothetical account values and hypothetical expenses based on a Class' actual expense ratio and an assumed rate of return of 5% per year before expenses, which is not the Class' actual return. The hypothetical account values and expenses may not be used to estimate the actual ending account balance or expenses you paid for the period. You may use this information to compare the ongoing costs of investing in the Fund and other funds. To do so, compare this 5% hypothetical example with the 5% hypothetical examples that appear in the shareholder reports of the other funds. A small balance maintenance fee of $12.00 that is charged once a year may apply for certain accounts with a value of less than $2,000. This fee is not included in the table below. If it was, the estimate of expenses you paid during the period would be higher, and your ending account value lower, by this amount. In addition, the Fund, as a shareholder in the underlying Fidelity Central Funds, will indirectly bear its pro-rata share of the fees and expenses incurred by the underlying Fidelity Central Funds. These fees and expenses are not included in the Fund's annualized expense ratio used to calculate the expense estimate in the table below.
Please note that the expenses shown in the table are meant to highlight your ongoing costs only and do not reflect any transaction costs. Therefore, the second line of the table is useful in comparing ongoing costs only, and will not help you determine the relative total costs of owning different funds. In addition, if these transactional costs were included, your costs would have been higher.
| | Annualized Expense Ratio-A | Beginning
Account Value
May 1, 2017 | Ending
Account Value
October 31, 2017 | Expenses Paid
During Period-B
May 1, 2017
to October 31, 2017 |
| Class A | 1.45% | | | |
| Actual | | $1,000.00 | $1,120.50 | $7.75 |
| Hypothetical-C | | $1,000.00 | $1,017.90 | $7.38 |
| Class M | 1.70% | | | |
| Actual | | $1,000.00 | $1,120.10 | $9.08 |
| Hypothetical-C | | $1,000.00 | $1,016.64 | $8.64 |
| Class C | 2.20% | | | |
| Actual | | $1,000.00 | $1,116.80 | $11.74 |
| Hypothetical-C | | $1,000.00 | $1,014.12 | $11.17 |
| Total International Equity | 1.20% | | | |
| Actual | | $1,000.00 | $1,120.40 | $6.41 |
| Hypothetical-C | | $1,000.00 | $1,019.16 | $6.11 |
| Class I | 1.20% | | | |
| Actual | | $1,000.00 | $1,122.00 | $6.42 |
| Hypothetical-C | | $1,000.00 | $1,019.16 | $6.11 |
| Class Z | 1.05% | | | |
| Actual | | $1,000.00 | $1,121.90 | $5.62 |
| Hypothetical-C | | $1,000.00 | $1,019.91 | $5.35 |
A Annualized expense ratio reflects expenses net of applicable fee waivers.
B Expenses are equal to each Class' annualized expense ratio, multiplied by the average account value over the period, multiplied by 184/365 (to reflect the one-half year period).
C 5% return per year before expenses
Distributions (Unaudited)
The Board of Trustees of Fidelity Total International Equity Fund voted to pay to shareholders of record at the opening of business on record date, the following distributions per share derived from capital gains realized from sales of portfolio securities, and dividends derived from net investment income:
| | Pay Date | Record Date | Dividends | Capital Gains |
| Fidelity Total International Equity Fund | | | | |
| Class A | 12/11/17 | 12/08/17 | $0.152 | $0.226 |
| Class M | 12/11/17 | 12/08/17 | $0.133 | $0.226 |
| Class C | 12/11/17 | 12/08/17 | $0.097 | $0.226 |
| Total International Equity | 12/11/17 | 12/08/17 | $0.149 | $0.226 |
| Class I | 12/11/17 | 12/08/17 | $0.171 | $0.226 |
| Class Z | 12/11/17 | 12/08/17 | $0.171 | $0.226 |
|
The fund hereby designates as a capital gain dividend with respect to the taxable year ended October 31, 2017, $2,209,744 or, if subsequently determined to be different, the net capital gain of such year.
Class A designates 11%, Class M designates 13%, Class C designates 29%, Total International Equity designates 9%, and Class I designates 10% of the dividend distributed during the fiscal year as qualifying for the dividends–received deduction for corporate shareholders.
Class A, Class M, Class C, Total International Equity, and Class I designate 100% of the dividend distributed during the fiscal year as amounts which may be taken into account as a dividend for purposes of the maximum rate under section 1(h)(11) of the Internal Revenue Code.
The amounts per share which represent income derived from sources within, and taxes paid to, foreign countries or possessions of the United States are as follows:
| | Pay Date | Income | Taxes |
| Fidelity Total International Equity Fund | | | |
| Class A | 12/12/16 | $0.0973 | $0.0143 |
| Class M | 12/12/16 | $0.0803 | $0.0143 |
| Class C | 12/12/16 | $0.0373 | $0.0143 |
| Total International Equity | 12/12/16 | $0.1233 | $0.0143 |
| Class I | 12/12/16 | $0.1133 | $0.0143 |
|
The fund will notify shareholders in January 2018 of amounts for use in preparing 2017 income tax returns.
Board Approval of Investment Advisory Contracts and Management Fees
Fidelity Total International Equity Fund
Each year, the Board of Trustees, including the Independent Trustees (together, the Board), votes on the renewal of the management contract with Fidelity Management & Research Company (FMR) and the sub-advisory agreements (together, the Advisory Contracts) for the fund. FMR and the sub-advisers are referred to herein as the Investment Advisers. The Board, assisted by the advice of fund counsel and Independent Trustees' counsel, requests and considers a broad range of information relevant to the renewal of the Advisory Contracts throughout the year.
The Board meets regularly and, at each of its meetings, covers an extensive agenda of topics and materials and considers factors that are relevant to its annual consideration of the renewal of the fund's Advisory Contracts, including the services and support provided to the fund and its shareholders. The Board has established various standing committees (Committees), each composed of and chaired by Independent Trustees with varying backgrounds, to which the Board has assigned specific subject matter responsibilities in order to enhance effective decision-making by the Board. The Board, acting directly and through its Committees, requests and receives information concerning the annual consideration of the renewal of the fund's Advisory Contracts. The Board also meets as needed to review matters specifically related to the Board's annual consideration of the renewal of the Advisory Contracts. Members of the Board may also meet with trustees of other Fidelity funds through ad hoc joint committees to discuss certain matters relevant to all of the Fidelity funds.
At its July 2017 meeting, the Board unanimously determined to renew the fund's Advisory Contracts. In reaching its determination, the Board considered all factors it believed relevant, including (i) the nature, extent, and quality of the services to be provided to the fund and its shareholders (including the investment performance of the fund); (ii) the competitiveness of the fund's management fee and total expense ratio relative to peer funds; (iii) the total costs of the services to be provided by and the profits to be realized by Fidelity from its relationships with the fund; and (iv) the extent to which, if any, economies of scale exist and would be realized as the fund grows, and whether any economies of scale are appropriately shared with fund shareholders.
In considering whether to renew the Advisory Contracts for the fund, the Board reached a determination, with the assistance of fund counsel and Independent Trustees' counsel and through the exercise of its business judgment, that the renewal of the Advisory Contracts was in the best interests of the fund and its shareholders and that the compensation payable under the Advisory Contracts was fair and reasonable. The Board's decision to renew the Advisory Contracts was not based on any single factor, but rather was based on a comprehensive consideration of all the information provided to the Board at its meetings throughout the year. The Board, in reaching its determination to renew the Advisory Contracts, was aware that shareholders of the fund have a broad range of investment choices available to them, including a wide choice among funds offered by Fidelity's competitors, and that the fund's shareholders, who have the opportunity to review and weigh the disclosure provided by the fund in its prospectus and other public disclosures, have chosen to invest in this fund, which is part of the Fidelity family of funds.
Amendment to Group Fee Rate. The Board also approved an amendment to the management contract for the fund to add an additional breakpoint to the group fee schedule, effective October 1, 2017. The Board noted that the additional breakpoint would result in lower management fee rates as Fidelity's assets under management increase.
Nature, Extent, and Quality of Services Provided. The Board considered Fidelity's staffing as it relates to the fund, including the backgrounds of investment personnel of Fidelity, and also considered the fund's investment objective, strategies, and related investment philosophy. The Independent Trustees also had discussions with senior management of Fidelity's investment operations and investment groups. The Board considered the structure of the investment personnel compensation program and whether this structure provides appropriate incentives to act in the best interests of the fund. Additionally, the Board considered the portfolio managers' investments, if any, in the funds that they manage.
Resources Dedicated to Investment Management and Support Services. The Board and the Fund Oversight and Research Committees reviewed the general qualifications and capabilities of Fidelity's investment staff, including its size, education, experience, and resources, as well as Fidelity's approach to recruiting, training, managing, and compensating investment personnel. The Board noted that Fidelity has continued to increase the resources devoted to non-U.S. offices, including expansion of Fidelity's global investment organization. The Board also noted that Fidelity's analysts have extensive resources, tools and capabilities that allow them to conduct sophisticated quantitative and fundamental analysis, as well as credit analysis of issuers, counterparties and guarantors. Further, the Board considered that Fidelity's investment professionals have sufficient access to global information and data so as to provide competitive investment results over time, and that those professionals also have access to sophisticated tools that permit them to assess portfolio construction and risk and performance attribution characteristics continuously, as well as to transmit new information and research conclusions rapidly around the world. Additionally, in its deliberations, the Board considered Fidelity's trading, risk management, compliance, and technology and operations capabilities and resources, which are integral parts of the investment management process.
Shareholder and Administrative Services. The Board considered (i) the nature, extent, quality, and cost of advisory, administrative, and shareholder services performed by the Investment Advisers and their affiliates under the Advisory Contracts and under separate agreements covering transfer agency, pricing and bookkeeping, and securities lending services for the fund; (ii) the nature and extent of the supervision of third party service providers, principally custodians, subcustodians, and pricing vendors; and (iii) the resources devoted to, and the record of compliance with, the fund's compliance policies and procedures. The Board also reviewed the allocation of fund brokerage, including allocations to brokers affiliated with the Investment Advisers, the use of brokerage commissions to pay fund expenses, and the use of "soft" commission dollars to pay for research services.
The Board noted that the growth of fund assets over time across the complex allows Fidelity to reinvest in the development of services designed to enhance the value or convenience of the Fidelity funds as investment vehicles. These services include 24-hour access to account information and market information through telephone representatives and over the Internet, investor education materials and asset allocation tools, and the expanded availability of Fidelity Investor Centers.
In 2014, the Board formed an ad hoc Committee on Transfer Agency Fees to review the variety of transfer agency fee structures throughout the industry and Fidelity's competitive positioning with respect to industry participants.
Investment in a Large Fund Family. The Board considered the benefits to shareholders of investing in a Fidelity fund, including the benefits of investing in a fund that is part of a large family of funds offering a variety of investment disciplines and providing a large variety of mutual fund investor services. The Board noted that Fidelity had taken, or had made recommendations that resulted in the Fidelity funds taking, a number of actions over the previous year that benefited particular funds, including: (i) continuing to dedicate additional resources to Fidelity's investment research process, and to the support of the senior management team that oversees asset management; (ii) continuing efforts to enhance Fidelity's global research capabilities; (iii) launching new funds and making other enhancements to meet client needs; (iv) launching new share classes of existing funds; (v) eliminating purchase minimums and broadening eligibility requirements for certain lower-priced share classes; (vi) reducing management fees and total expenses for certain growth equity funds and index funds; (vii) lowering expense caps for certain existing funds and classes to reduce expenses borne by shareholders; (viii) eliminating short-term redemption fees for certain funds; (ix) introducing a new pricing structure for certain funds of funds that is expected to reduce overall expenses paid by shareholders; (x) rationalizing product lines and gaining increased efficiencies through proposals for fund mergers and share class consolidations; (xi) continuing to develop, acquire and implement systems and technology to improve services to the funds and shareholders, strengthen information security, and increase efficiency; and (xii) implementing enhancements to further strengthen Fidelity's product line to increase investors' probability of success in achieving their investment goals, including retirement income goals.
Investment Performance. The Board considered whether the fund has operated in accordance with its investment objective, as well as its record of compliance with its investment restrictions and its performance history. The Board noted that there was a portfolio management change for the fund in June 2014.
The Board took into account discussions with representatives of the Investment Advisers about fund investment performance that occur at Board meetings throughout the year. In this regard the Board noted that as part of regularly scheduled fund reviews and other reports to the Board on fund performance, the Board considers annualized return information for the fund for different time periods, measured against a securities market index ("benchmark index") and a peer group of funds with similar objectives ("peer group"), if any. In its evaluation of fund investment performance, the Board gave particular attention to information indicating changes in performance of certain Fidelity funds for specific time periods and discussed with the Investment Advisers the reasons for any overperformance or underperformance.
In addition to reviewing absolute and relative fund performance, the Independent Trustees periodically consider the appropriateness of fund performance metrics in evaluating the results achieved. In general, the Independent Trustees believe that fund performance should be evaluated based on net performance (after fees and expenses) of both the highest performing and lowest performing fund share classes, where applicable, compared to appropriate benchmark indices, over appropriate time periods that may include full market cycles, and compared to peer groups, as applicable, over the same periods, taking into account relevant factors including the following: general market conditions; issuer-specific information; and fund cash flows and other factors.
The Independent Trustees recognize that shareholders evaluate performance on a net basis over their own holding periods, for which one-, three-, and five-year periods are often used as a proxy. For this reason, the performance information reviewed by the Board also included net cumulative calendar year total return information for the fund and an appropriate benchmark index and peer group for the most recent one-, three-, and five-year periods, as shown below. Returns are shown compared to the 25th percentile (top of box, 75% beaten) and 75th percentile (bottom of box, 25% beaten) of the peer universe. Returns of the benchmark index are "net MA,"
i.e., adjusted for tax withholding rates applicable to U.S.-based funds organized as Massachusetts business trusts.
Fidelity Total International Equity Fund
The Board also considered that the fund's management fee is subject to upward or downward adjustment depending upon whether, and to what extent, the fund's investment performance for the performance period (a rolling 36-month period) exceeds, or is exceeded by, a securities index, thus leading to a performance adjustment for the same period. The Board noted that the performance adjustment provides FMR with a strong economic incentive to seek to achieve superior long-term performance for the fund's shareholders and helps to more closely align the interests of FMR and the shareholders of the fund.
Based on its review, the Board concluded that the nature, extent, and quality of services provided to the fund under the Advisory Contracts should continue to benefit the shareholders of the fund.
Competitiveness of Management Fee and Total Expense Ratio. The Board considered the fund's management fee and total expense ratio compared to "mapped groups" of competitive funds and classes created for the purpose of facilitating the Trustees' competitive analysis of management fees and total expenses. Fidelity creates "mapped groups" by combining similar Lipper investment objective categories that have comparable investment mandates. Combining Lipper investment objective categories aids the Board's management fee and total expense ratio comparisons by broadening the competitive group used for comparison.
Management Fee. The Board considered two proprietary management fee comparisons for the 12-month periods shown in basis points (BP) in the chart below. The group of Lipper funds used by the Board for management fee comparisons is referred to below as the "Total Mapped Group." The Total Mapped Group comparison focuses on a fund's standing in terms of gross management fees before expense reimbursements or caps, and without giving effect to the fund's performance adjustment, relative to the total universe of funds with comparable investment mandates, regardless of whether their management fee structures also are comparable. Funds with comparable investment mandates offer exposure to similar types of securities. Funds with comparable management fee structures have similar management fee contractual arrangements (
e.g., flat rate charged for advisory services, all-inclusive fee rate,
etc.). "TMG %" represents the percentage of funds in the Total Mapped Group that had management fees that were lower than the fund's. For example, a hypothetical TMG % of 20% would mean that 80% of the funds in the Total Mapped Group had higher, and 20% had lower, management fees than the fund. The fund's actual TMG %s and the number of funds in the Total Mapped Group are in the chart below. The "Asset-Size Peer Group" (ASPG) comparison focuses on a fund's standing relative to a subset of non-Fidelity funds within the Total Mapped Group that are similar in size and management fee structure without taking into account performance adjustments, if any. For example, if a fund is in the first quartile of the ASPG, the fund's management fee ranks in the least expensive or lowest 25% of funds in the ASPG. The ASPG represents at least 15% of the funds in the Total Mapped Group with comparable asset size and management fee structures, subject to a minimum of 50 funds (or all funds in the Total Mapped Group if fewer than 50). Additional information, such as the ASPG quartile in which the fund's management fee rate ranked and the impact of the fund's performance adjustment, is also included in the chart and considered by the Board.
Fidelity Total International Equity Fund
The Board noted that the fund's management fee rate ranked below the median of its Total Mapped Group and below the median of its ASPG for 2016. The Board also noted the effect of the fund's performance adjustment, if any, on the fund's management fee ranking.
The Board noted that, in 2014, the Board and the boards of other Fidelity funds formed the ad hoc Committee on Group Fee to conduct an in-depth review of the "group fee" component of the management fee of funds with such management fee structures. The Committee's focus included the mechanics of the group fee, the competitive landscape of group fee structures, Fidelity funds with no group fee component and investment products not included in group fee assets. The Board also considered that, for funds subject to the group fee, FMR agreed to voluntarily waive fees over a specified period of time in amounts designed to account for assets converted from certain funds to certain collective investment trusts.
The Board also noted that, in 2013, the ad hoc Committee on Management Fees was formed to conduct an in-depth review of the management fee rates of Fidelity's active equity mutual funds. The Committee focused on the following areas: (i) standard fee structures; (ii) research consumption and trading evolution; (iii) management fee competitiveness/profitability by category; and (iv) factors that drive institutional pricing.
Based on its review, the Board concluded that the fund's management fee is fair and reasonable in light of the services that the fund receives and the other factors considered.
Total Expense Ratio. In its review of each class's total expense ratio, the Board considered the fund's management fee rate as well as other fund or class expenses, as applicable, such as transfer agent fees, pricing and bookkeeping fees, fund-paid 12b-1 fees, and custodial, legal, and audit fees. The Board noted the impact of the fund's performance adjustment. The Board also noted that Fidelity may agree to waive fees and expenses from time to time, and the extent to which, if any, it has done so for the fund. As part of its review, the Board also considered the current and historical total expense ratios of each class of the fund compared to competitive fund median expenses. Each class of the fund is compared to those funds and classes in the Total Mapped Group (used by the Board for management fee comparisons) that have a similar sales load structure.
The Board noted that the total expense ratio of the retail class ranked below the competitive median for 2016 and the total expense ratio of each of Class A, Class M (formerly Class T), Class C, and Class I ranked above the competitive median for 2016. The Board considered that, in general, various factors can affect total expense ratios. The Board noted that the total expense ratio of each of Class A, Class M, Class C, and Class I was above the competitive median because of a positive performance fee adjustment in 2016 and relatively higher other expenses due to low asset levels. The Board noted that the total expense ratio of Class M was also above the competitive median because of higher 12b-1 fees on Class M as compared to most competitor funds. Class M has a higher 12b-1 fee, but a lower front-end sales charge, than traditionally priced front-end sales charge classes. The Board considered that Class M is primarily sold load-waived in the retirement plan market where its 0.50% 12b-1 fee is comparable to competing no-load, higher 12b-1 fee classes designed specifically for retirement plans. The Board noted that the total expense ratio of Class C was also above the competitive median because of its 12b-1 fees. The Board also noted that, although Class I is categorized by Lipper as an institutional class, Class I has a significantly lower investment minimum than most other funds and classes categorized as institutional. As a result, FMR believes Class I is generally more comparable to retail funds and classes. The Board noted that the fund offers multiple classes, each of which has a different sales load and 12b-1 fee structure, and that the multiple structures are intended to offer a range of pricing options for the intermediary market. The Board also noted that the total expense ratios of the classes vary primarily by the level of their 12b-1 fees, although differences in transfer agent fees may also cause expenses to vary from class to class.
The Board further considered that FMR has contractually agreed to reimburse Class A, Class M, Class C, Class I, and the retail class of the fund to the extent that total operating expenses (excluding interest, certain taxes, certain securities lending costs, brokerage commissions, fees and expenses of the Independent Trustees, proxy and shareholder meeting expenses, extraordinary expenses, and acquired fund fees and expenses, if any), as a percentage of their respective average net assets, exceed 1.45%, 1.70%, 2.20%, 1.20%, and 1.20% through December 31, 2018.
Fees Charged to Other Fidelity Clients. The Board also considered Fidelity fee structures and other information with respect to clients of Fidelity, such as other funds advised or subadvised by Fidelity, pension plan clients, and other institutional clients with similar mandates. The Board noted that an ad hoc joint committee created by it and the boards of other Fidelity funds periodically (most recently in 2013) reviews and compares Fidelity's institutional investment advisory business with its business of providing services to the Fidelity funds, including the differences in services provided, fees charged, and costs incurred, as well as competition in their respective marketplaces.
Based on its review of total expense ratios and fees charged to other Fidelity clients, the Board concluded that, although some classes were above the median of the universe presented for comparison, the total expense ratio of each class of the fund was reasonable in light of the services that the fund and its shareholders receive and the other factors considered.
Costs of the Services and Profitability. The Board considered the revenues earned and the expenses incurred by Fidelity in conducting the business of developing, marketing, distributing, managing, administering and servicing the fund and servicing the fund's shareholders. The Board also considered the level of Fidelity's profits in respect of all the Fidelity funds.
On an annual basis, Fidelity presents to the Board information about the profitability of its relationships with the fund. Fidelity calculates profitability information for each fund, as well as aggregate profitability information for groups of Fidelity funds and all Fidelity funds, using a series of detailed revenue and cost allocation methodologies which originate with the books and records of Fidelity on which Fidelity's audited financial statements are based. The Audit Committee of the Board reviews any significant changes from the prior year's methodologies.
PricewaterhouseCoopers LLP (PwC), independent registered public accounting firm and auditor to Fidelity and certain Fidelity funds, has been engaged annually by the Board as part of the Board's assessment of Fidelity's profitability analysis. PwC's engagement includes the review and assessment of the methodologies used by Fidelity in determining the revenues and expenses attributable to Fidelity's mutual fund business, and completion of agreed-upon procedures in respect of the mathematical accuracy of the fund profitability information and its conformity to established allocation methodologies. After considering PwC's reports issued under the engagement and information provided by Fidelity, the Board concluded that while other allocation methods may also be reasonable, Fidelity's profitability methodologies are reasonable in all material respects.
The Board also reviewed Fidelity's non-fund businesses and potential fall-out benefits related to the mutual fund business as well as cases where Fidelity's affiliates may benefit from or be related to the fund's business.
The Board considered the costs of the services provided by and the profits realized by Fidelity in connection with the operation of the fund and was satisfied that the profitability was not excessive.
Economies of Scale. The Board considered whether there have been economies of scale in respect of the management of the Fidelity funds, whether the Fidelity funds (including the fund) have appropriately benefited from any such economies of scale, and whether there is potential for realization of any further economies of scale. The Board considered the extent to which the fund will benefit from economies of scale as assets grow through increased services to the fund, through waivers or reimbursements, or through fee or expense ratio reductions. The Board also noted that a committee (the Economies of Scale Committee) created by it and the boards of other Fidelity funds periodically (most recently in 2013) analyzes whether Fidelity attains economies of scale in respect of the management and servicing of the Fidelity funds, whether the Fidelity funds have appropriately benefited from such economies of scale, and whether there is potential for realization of any further economies of scale.
The Board recognized that the fund's management contract incorporates a "group fee" structure, which provides for lower group fee rates as total group assets increase, and for higher group fee rates as total group assets decrease (with "group assets" defined to include fund assets under FMR's management plus the assets of sector funds previously under FMR's management). FMR calculates the group fee rates based on a tiered asset "breakpoint" schedule that varies based on asset class. The Board considered that the group fee is designed to deliver the benefits of economies of scale to fund shareholders when total Fidelity fund assets increase, even if assets of any particular fund are unchanged or have declined, because some portion of Fidelity's costs are attributable to services provided to all Fidelity funds, and all funds benefit if those costs can be allocated among more assets. The Board concluded that, given the group fee structure, fund shareholders will benefit from lower management fees as group assets increase at the fund complex level, regardless of whether Fidelity achieves any such economies of scale.
The Board concluded, taking into account the analysis of the Economies of Scale Committee, that economies of scale, if any, are being appropriately shared between fund shareholders and Fidelity.
Additional Information Requested by the Board. In order to develop fully the factual basis for consideration of the Fidelity funds' advisory contracts, the Board requested and received additional information on certain topics, including: (i) fund performance trends, in particular the underperformance of certain funds, and Fidelity's long-term strategies for certain funds; (ii) Fidelity's fund profitability methodology, profitability trends for certain funds, and the impact of certain factors on fund profitability results, including the impact of market trends on actively managed funds; (iii) the use of performance fees and the calculation of performance adjustments, including the impact of underperformance and fund outflows on performance adjustments; (iv) metrics for evaluating index fund performance; (v) Fidelity's group fee structure, including the group fee breakpoint schedules; (vi) the terms of Fidelity's contractual and voluntary expense cap arrangements with the funds; (vii) the methodology with respect to evaluating competitive fund data and peer group classifications and fee comparisons; (viii) the expense structures for different funds and classes; (ix) Fidelity's arrangements with affiliated sub-advisers on behalf of the funds; (x) information regarding other accounts managed by Fidelity, including institutional accounts and collective investment trusts; (xi) recent changes to the fee structure for certain funds of funds; and (xii) the impact of the Department of Labor's new fiduciary rule on the funds' comparative expense information.
Based on its evaluation of all of the conclusions noted above, and after considering all factors it believed relevant, the Board concluded that the advisory fee structures are fair and reasonable, and that the fund's Advisory Contracts should be renewed.
Corporate Headquarters
245 Summer St.
Boston, MA 02210
www.fidelity.com
TIE-ANN-1217
1.912358.107
Fidelity Advisor® International Value Fund - Class A, Class M (formerly Class T), Class C and Class I
Annual Report October 31, 2017 Class A, Class M, Class C and Class I are classes of Fidelity® International Value Fund |
|
Contents
To view a fund's proxy voting guidelines and proxy voting record for the 12-month period ended June 30, visit http://www.fidelity.com/proxyvotingresults or visit the Securities and Exchange Commission's (SEC) web site at http://www.sec.gov.
You may also call 1-877-208-0098 to request a free copy of the proxy voting guidelines.
Standard & Poor's, S&P and S&P 500 are registered service marks of The McGraw-Hill Companies, Inc. and have been licensed for use by Fidelity Distributors Corporation.
Other third-party marks appearing herein are the property of their respective owners.
All other marks appearing herein are registered or unregistered trademarks or service marks of FMR LLC or an affiliated company. © 2017 FMR LLC. All rights reserved.
This report and the financial statements contained herein are submitted for the general information of the shareholders of the Fund. This report is not authorized for distribution to prospective investors in the Fund unless preceded or accompanied by an effective prospectus.
A fund files its complete schedule of portfolio holdings with the SEC for the first and third quarters of each fiscal year on Form N-Q. Forms N-Q are available on the SEC’s web site at http://www.sec.gov. A fund's Forms N-Q may be reviewed and copied at the SEC’s Public Reference Room in Washington, DC. Information regarding the operation of the SEC's Public Reference Room may be obtained by calling 1-800-SEC-0330.
For a complete list of a fund's portfolio holdings, view the most recent holdings listing, semiannual report, or annual report on Fidelity's web site at http://www.fidelity.com, http://www.institutional.fidelity.com, or http://www.401k.com, as applicable.
NOT FDIC INSURED •MAY LOSE VALUE •NO BANK GUARANTEE
Neither the Fund nor Fidelity Distributors Corporation is a bank.
Performance: The Bottom Line
Average annual total return reflects the change in the value of an investment, assuming reinvestment of distributions from dividend income and capital gains (the profits earned upon the sale of securities that have grown in value, if any) and assuming a constant rate of performance each year. The hypothetical investment and the average annual total returns do not reflect the deduction of taxes that a shareholder would pay on fund distributions or the redemption of fund shares. During periods of reimbursement by Fidelity, a fund’s total return will be greater than it would be had the reimbursement not occurred. How a fund did yesterday is no guarantee of how it will do tomorrow.
Average Annual Total Returns
| For the periods ended October 31, 2017 | Past 1 year | Past 5 years | Past 10 years |
| Class A (incl. 5.75% sales charge) | 12.50% | 5.47% | (1.45)% |
| Class M (incl. 3.50% sales charge) | 14.88% | 5.67% | (1.49)% |
| Class C (incl. contingent deferred sales charge) | 17.41% | 5.91% | (1.61)% |
| Class I | 19.68% | 7.02% | (0.54)% |
Class C shares' contingent deferred sales charges included in the past one year, past five years and past ten years total return figures are 1%, 0% and 0%, respectively.
$10,000 Over 10 Years
Let's say hypothetically that $10,000 was invested in Fidelity Advisor® International Value Fund - Class A on October 31, 2007, and the current 5.75% sales charge was paid.
The chart shows how the value of your investment would have changed, and also shows how the MSCI EAFE Value Index performed over the same period.
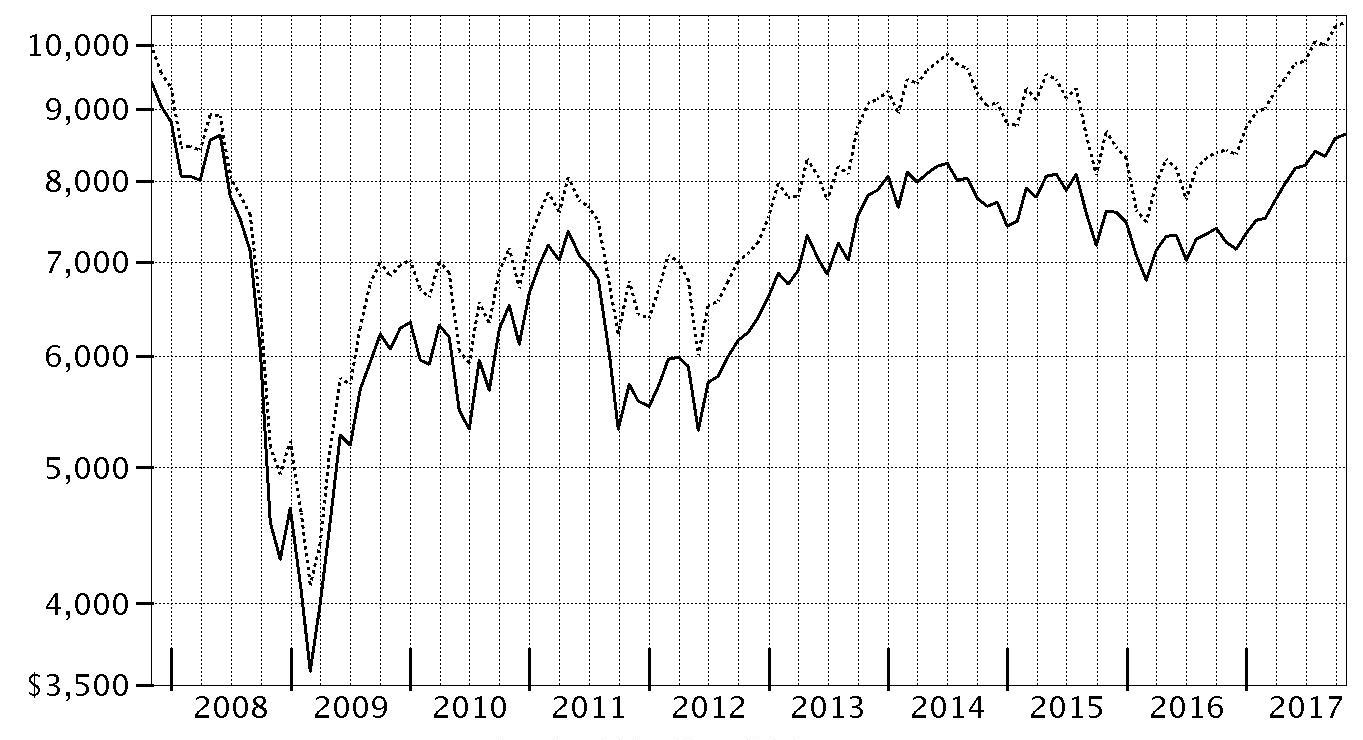
| Period Ending Values |
| $8,639 | Fidelity Advisor® International Value Fund - Class A |
| $10,380 | MSCI EAFE Value Index |
Management's Discussion of Fund Performance
Market Recap: The MSCI ACWI (All Country World Index) ex USA Index returned 23.85% for the 12 months ending October 31, 2017, helped partly by a generally weak U.S. dollar. Some favorable election results in continental Europe (+30%) suggested ebbing political uncertainty and near-term risk there, but the U.K. (+20%) faced more-mixed conditions ahead of its expected exit from the European Union. Despite central-bank easing – and pressured recently by yen strength – Japan (+18%) lagged the rest of the Asia-Pacific group (+22%). Commodity-price volatility slowed Canada (+17%), but the emerging-markets group (+26%) sped ahead. Sector-wise, information technology (+47%) was driven by a surge among several Chinese internet-related names. Financials (+27%) rode rising interest rates that, at the same time, weighed on real estate (+17%), utilities (+16%), consumer staples (+14%) and telecommunication services (+9%) – so-called “bond proxy” sectors. Materials (+28%) and industrials (+27%) responded to demand from China and price gains for certain commodities. In the energy sector (+20%), oil prices lost ground in the spring before rebounding through October 31 to end well above where they started 12 months ago. Lastly, health care (+14%) was hurt by early-period turmoil around drug pricing and health care legislation.
Comments from Portfolio Manager Alexander Zavratsky: For the fiscal year, the fund’s share class (excluding sales charges, if applicable) gained about 18% to 20%, trailing the 23.50% return of the benchmark MSCI EAFE Value Index. Versus the benchmark, the biggest detractors included choices in the U.K. and non-benchmark exposure to the United States. Among individual stocks, untimely positioning in Royal Dutch Shell hurt most. Shares of the Anglo-Dutch multinational oil and gas giant recovered in the second half of the period on positive financial results and an uptick in oil prices, but we missed out because I eliminated our stake in May. Avoiding German financial services company and benchmark stock Allianz also hurt relative results. Its shares benefited from the firm’s stock buyback program. Elsewhere, it hurt to own U.K. cigarette maker Imperial Brands – a stock that was removed from the benchmark in December 2016. Shares of Imperial Brands fell along with the broader tobacco industry. Conversely, the biggest relative contributor was a non-benchmark stake in French software & services firm Atos. Shares of Atos benefited from the firm’s increasing growth and merger-and-acquisition activity. Lastly, it helped to establish a non-benchmark position this period in Recruit Holdings, a Japan-based staffing agency. Recruit's stock was helped by a tightening labor market in Japan.
The views expressed above reflect those of the portfolio manager(s) only through the end of the period as stated on the cover of this report and do not necessarily represent the views of Fidelity or any other person in the Fidelity organization. Any such views are subject to change at any time based upon market or other conditions and Fidelity disclaims any responsibility to update such views. These views may not be relied on as investment advice and, because investment decisions for a Fidelity fund are based on numerous factors, may not be relied on as an indication of trading intent on behalf of any Fidelity fund.
Investment Summary (Unaudited)
Geographic Diversification (% of fund's net assets)
| As of October 31, 2017 |
| | Japan | 22.0% |
| | United Kingdom | 15.7% |
| | France | 14.4% |
| | Switzerland | 9.3% |
| | Germany | 7.8% |
| | Spain | 4.6% |
| | Sweden | 4.5% |
| | United States of America* | 3.8% |
| | Australia | 3.8% |
| | Other | 14.1% |
* Includes Short-Term investments and Net Other Assets (Liabilities).
| As of April 30, 2017 |
| | Japan | 22.6% |
| | United Kingdom | 17.2% |
| | France | 15.3% |
| | Germany | 7.4% |
| | Switzerland | 7.0% |
| | Australia | 5.7% |
| | Spain | 4.2% |
| | United States of America* | 4.1% |
| | Netherlands | 3.8% |
| | Other | 12.7% |

* Includes Short-Term investments and Net Other Assets (Liabilities).
Percentages are based on country or territory of incorporation and are adjusted for the effect of futures contracts, if applicable.
Asset Allocation as of October 31, 2017
| | % of fund's net assets | % of fund's net assets 6 months ago |
| Stocks | 98.8 | 98.9 |
| Short-Term Investments and Net Other Assets (Liabilities) | 1.2 | 1.1 |
Top Ten Stocks as of October 31, 2017
| | % of fund's net assets | % of fund's net assets 6 months ago |
| Total SA (France, Oil, Gas & Consumable Fuels) | 3.2 | 3.0 |
| Novartis AG (Switzerland, Pharmaceuticals) | 3.0 | 1.2 |
| BP PLC (United Kingdom, Oil, Gas & Consumable Fuels) | 2.7 | 1.9 |
| Mitsubishi UFJ Financial Group, Inc. (Japan, Banks) | 2.2 | 2.5 |
| Banco Santander SA (Spain) (Spain, Banks) | 2.1 | 1.4 |
| Toyota Motor Corp. (Japan, Automobiles) | 2.1 | 2.2 |
| BASF AG (Germany, Chemicals) | 1.9 | 1.7 |
| Australia & New Zealand Banking Group Ltd. (Australia, Banks) | 1.9 | 1.7 |
| Nestle SA (Reg. S) (Switzerland, Food Products) | 1.6 | 0.6 |
| AstraZeneca PLC (United Kingdom) (United Kingdom, Pharmaceuticals) | 1.6 | 1.4 |
| | 22.3 | |
Top Market Sectors as of October 31, 2017
| | % of fund's net assets | % of fund's net assets 6 months ago |
| Financials | 35.9 | 36.5 |
| Industrials | 12.2 | 13.4 |
| Health Care | 11.4 | 9.6 |
| Energy | 9.0 | 7.4 |
| Materials | 7.9 | 7.7 |
| Consumer Discretionary | 6.3 | 8.5 |
| Information Technology | 6.1 | 5.2 |
| Consumer Staples | 5.3 | 4.8 |
| Telecommunication Services | 2.8 | 3.4 |
| Real Estate | 1.0 | 0.6 |
Investments October 31, 2017
Showing Percentage of Net Assets
| Common Stocks - 98.3% | | | |
| | | Shares | Value |
| Australia - 3.8% | | | |
| Australia & New Zealand Banking Group Ltd. | | 314,052 | $7,191,562 |
| Insurance Australia Group Ltd. | | 413,965 | 2,078,392 |
| Macquarie Group Ltd. | | 50,807 | 3,824,353 |
| Magellan Financial Group Ltd. | | 68,954 | 1,280,824 |
|
| TOTAL AUSTRALIA | | | 14,375,131 |
|
| Austria - 0.8% | | | |
| Erste Group Bank AG | | 71,700 | 3,081,043 |
| Bailiwick of Jersey - 0.9% | | | |
| Shire PLC | | 27,700 | 1,364,380 |
| Wolseley PLC | | 31,628 | 2,211,654 |
|
| TOTAL BAILIWICK OF JERSEY | | | 3,576,034 |
|
| Belgium - 1.5% | | | |
| KBC Groep NV | | 68,291 | 5,672,623 |
| Canada - 0.4% | | | |
| Potash Corp. of Saskatchewan, Inc. | | 85,600 | 1,666,085 |
| Finland - 1.1% | | | |
| Sampo Oyj (A Shares) | | 79,334 | 4,156,701 |
| France - 14.4% | | | |
| Atos Origin SA | | 31,108 | 4,833,903 |
| AXA SA | | 198,521 | 5,993,037 |
| Bouygues SA | | 44,720 | 2,146,976 |
| Capgemini SA | | 28,993 | 3,524,160 |
| Compagnie de St. Gobain | | 39,700 | 2,328,875 |
| Natixis SA | | 301,500 | 2,364,294 |
| Sanofi SA | | 45,359 | 4,294,892 |
| Societe Generale Series A | | 101,600 | 5,654,500 |
| SR Teleperformance SA | | 20,600 | 3,009,087 |
| Total SA | | 223,894 | 12,479,434 |
| VINCI SA (a) | | 53,300 | 5,218,371 |
| Vivendi SA | | 136,492 | 3,390,519 |
|
| TOTAL FRANCE | | | 55,238,048 |
|
| Germany - 7.8% | | | |
| BASF AG | | 66,485 | 7,250,406 |
| Brenntag AG | | 30,700 | 1,738,516 |
| Deutsche Post AG | | 65,710 | 3,009,643 |
| Deutsche Telekom AG | | 201,100 | 3,641,384 |
| Fresenius SE & Co. KGaA | | 22,800 | 1,904,516 |
| HeidelbergCement Finance AG | | 26,100 | 2,659,314 |
| Linde AG (b) | | 13,300 | 2,865,339 |
| SAP SE | | 27,883 | 3,185,985 |
| Vonovia SE | | 85,465 | 3,759,155 |
|
| TOTAL GERMANY | | | 30,014,258 |
|
| Hong Kong - 0.3% | | | |
| AIA Group Ltd. | | 143,600 | 1,080,488 |
| Indonesia - 0.7% | | | |
| PT Bank Rakyat Indonesia Tbk | | 2,171,600 | 2,497,840 |
| Ireland - 1.3% | | | |
| Allergan PLC | | 7,680 | 1,361,126 |
| CRH PLC | | 67,571 | 2,542,829 |
| Medtronic PLC | | 14,600 | 1,175,592 |
|
| TOTAL IRELAND | | | 5,079,547 |
|
| Israel - 0.1% | | | |
| Teva Pharmaceutical Industries Ltd. sponsored ADR | | 29,199 | 402,946 |
| Italy - 1.3% | | | |
| Intesa Sanpaolo SpA | | 1,433,400 | 4,818,958 |
| Japan - 22.0% | | | |
| AEON Financial Service Co. Ltd. | | 72,600 | 1,559,193 |
| East Japan Railway Co. | | 22,000 | 2,133,552 |
| Fujitsu Ltd. | | 169,000 | 1,316,932 |
| Hoya Corp. | | 60,100 | 3,265,278 |
| Itochu Corp. | | 259,800 | 4,550,824 |
| Japan Tobacco, Inc. | | 87,100 | 2,883,028 |
| Kao Corp. | | 36,400 | 2,199,839 |
| KDDI Corp. | | 138,200 | 3,682,013 |
| Makita Corp. | | 62,700 | 2,627,672 |
| Mitsubishi UFJ Financial Group, Inc. | | 1,250,400 | 8,481,644 |
| Nintendo Co. Ltd. | | 6,100 | 2,366,567 |
| Nippon Telegraph & Telephone Corp. | | 68,400 | 3,306,971 |
| Nomura Holdings, Inc. | | 356,100 | 2,037,879 |
| OBIC Co. Ltd. | | 39,500 | 2,614,551 |
| Olympus Corp. | | 56,600 | 2,106,351 |
| Oracle Corp. Japan | | 22,500 | 1,903,849 |
| ORIX Corp. | | 246,500 | 4,238,226 |
| Panasonic Corp. | | 185,300 | 2,797,912 |
| Recruit Holdings Co. Ltd. | | 109,800 | 2,692,038 |
| Seven & i Holdings Co. Ltd. | | 55,500 | 2,236,898 |
| Shin-Etsu Chemical Co. Ltd. | | 35,500 | 3,743,874 |
| Shinsei Bank Ltd. | | 114,800 | 1,937,338 |
| Sony Corp. | | 61,100 | 2,556,100 |
| Sony Financial Holdings, Inc. | | 126,200 | 2,096,621 |
| Subaru Corp. | | 46,700 | 1,613,444 |
| Taiheiyo Cement Corp. | | 49,900 | 1,994,453 |
| Tokio Marine Holdings, Inc. | | 76,100 | 3,280,460 |
| Toyota Motor Corp. | | 127,600 | 7,914,528 |
|
| TOTAL JAPAN | | | 84,138,035 |
|
| Netherlands - 3.6% | | | |
| ING Groep NV (Certificaten Van Aandelen) | | 316,390 | 5,846,725 |
| Koninklijke Philips Electronics NV | | 60,400 | 2,461,478 |
| RELX NV | | 155,456 | 3,511,198 |
| Wolters Kluwer NV | | 41,955 | 2,056,504 |
|
| TOTAL NETHERLANDS | | | 13,875,905 |
|
| Norway - 1.5% | | | |
| Statoil ASA (a) | | 278,796 | 5,664,444 |
| Portugal - 0.6% | | | |
| Galp Energia SGPS SA Class B | | 124,067 | 2,306,530 |
| Spain - 4.1% | | | |
| Banco Santander SA (Spain) | | 1,208,830 | 8,195,040 |
| Banco Santander SA (Spain) rights 11/1/17 (b) | | 1,149,030 | 54,876 |
| CaixaBank SA | | 607,297 | 2,842,373 |
| Iberdrola SA | | 426,962 | 3,450,591 |
| Unicaja Banco SA | | 743,300 | 1,082,291 |
|
| TOTAL SPAIN | | | 15,625,171 |
|
| Sweden - 4.5% | | | |
| Alfa Laval AB | | 114,400 | 2,898,382 |
| Investor AB (B Shares) | | 78,042 | 3,867,771 |
| Nordea Bank AB | | 478,000 | 5,778,264 |
| Swedbank AB (A Shares) | | 156,442 | 3,883,183 |
| Telefonaktiebolaget LM Ericsson (B Shares) | | 155,300 | 977,315 |
|
| TOTAL SWEDEN | | | 17,404,915 |
|
| Switzerland - 9.3% | | | |
| Credit Suisse Group AG | | 285,372 | 4,497,131 |
| Lafargeholcim Ltd. (Reg.) | | 39,930 | 2,255,356 |
| Nestle SA (Reg. S) | | 74,857 | 6,298,358 |
| Novartis AG | | 136,938 | 11,294,550 |
| UBS Group AG | | 339,158 | 5,769,078 |
| Zurich Insurance Group AG | | 17,430 | 5,319,937 |
|
| TOTAL SWITZERLAND | | | 35,434,410 |
|
| United Kingdom - 15.7% | | | |
| AstraZeneca PLC (United Kingdom) | | 92,000 | 6,224,809 |
| Aviva PLC | | 494,942 | 3,319,654 |
| BAE Systems PLC | | 397,078 | 3,127,918 |
| BHP Billiton PLC | | 289,005 | 5,232,623 |
| BP PLC | | 1,525,547 | 10,347,267 |
| British American Tobacco PLC (United Kingdom) | | 41,417 | 2,675,945 |
| Bunzl PLC | | 104,556 | 3,256,409 |
| Compass Group PLC | | 145,591 | 3,196,351 |
| GlaxoSmithKline PLC | | 255,788 | 4,590,716 |
| HSBC Holdings PLC sponsored ADR | | 77,933 | 3,800,792 |
| Imperial Tobacco Group PLC | | 47,698 | 1,945,165 |
| Informa PLC | | 289,422 | 2,679,239 |
| Micro Focus International PLC | | 82,904 | 2,912,382 |
| Standard Chartered PLC (United Kingdom) (b) | | 371,353 | 3,701,067 |
| Standard Life PLC | | 571,609 | 3,262,966 |
|
| TOTAL UNITED KINGDOM | | | 60,273,303 |
|
| United States of America - 2.6% | | | |
| Amgen, Inc. | | 11,100 | 1,944,942 |
| ConocoPhillips Co. | | 73,900 | 3,779,985 |
| Edgewell Personal Care Co. (b) | | 12,500 | 811,625 |
| Molson Coors Brewing Co. Class B | | 12,800 | 1,035,136 |
| S&P Global, Inc. | | 14,400 | 2,253,168 |
|
| TOTAL UNITED STATES OF AMERICA | | | 9,824,856 |
|
| TOTAL COMMON STOCKS | | | |
| (Cost $341,482,659) | | | 376,207,271 |
|
| Nonconvertible Preferred Stocks - 0.5% | | | |
| Spain - 0.5% | | | |
| Grifols SA Class B | | | |
| (Cost $1,380,896) | | 85,300 | 2,003,504 |
|
| Money Market Funds - 3.3% | | | |
| Fidelity Cash Central Fund, 1.10% (c) | | 1,400,762 | 1,401,042 |
| Fidelity Securities Lending Cash Central Fund 1.11% (c)(d) | | 11,056,381 | 11,057,487 |
| TOTAL MONEY MARKET FUNDS | | | |
| (Cost $12,458,542) | | | 12,458,529 |
| TOTAL INVESTMENT IN SECURITIES - 102.1% | | | |
| (Cost $355,322,097) | | | 390,669,304 |
| NET OTHER ASSETS (LIABILITIES) - (2.1)% | | | (7,874,656) |
| NET ASSETS - 100% | | | $382,794,648 |
Categorizations in the Schedule of Investments are based on country or territory of incorporation.
Legend
(a) Security or a portion of the security is on loan at period end.
(b) Non-income producing
(c) Affiliated fund that is generally available only to investment companies and other accounts managed by Fidelity Investments. The rate quoted is the annualized seven-day yield of the fund at period end. A complete unaudited listing of the fund's holdings as of its most recent quarter end is available upon request. In addition, each Fidelity Central Fund's financial statements, which are not covered by the Fund's Report of Independent Registered Public Accounting Firm, are available on the SEC's website or upon request.
(d) Investment made with cash collateral received from securities on loan.
Affiliated Central Funds
Information regarding fiscal year to date income earned by the Fund from investments in Fidelity Central Funds is as follows:
| Fund | Income earned |
| Fidelity Cash Central Fund | $14,718 |
| Fidelity Securities Lending Cash Central Fund | 181,569 |
| Total | $196,287 |
Investment Valuation
The following is a summary of the inputs used, as of October 31, 2017, involving the Fund's assets and liabilities carried at fair value. The inputs or methodology used for valuing securities may not be an indication of the risk associated with investing in those securities. For more information on valuation inputs, and their aggregation into the levels used below, please refer to the Investment Valuation section in the accompanying Notes to Financial Statements.
| | Valuation Inputs at Reporting Date: |
| Description | Total | Level 1 | Level 2 | Level 3 |
| Investments in Securities: | | | | |
| Equities: | | | | |
| Consumer Discretionary | $24,148,093 | $9,266,109 | $14,881,984 | $-- |
| Consumer Staples | 20,085,994 | 3,791,926 | 16,294,068 | -- |
| Energy | 34,577,660 | 6,086,515 | 28,491,145 | -- |
| Financials | 136,800,292 | 78,163,540 | 58,636,752 | -- |
| Health Care | 44,395,080 | 6,789,122 | 37,605,958 | -- |
| Industrials | 46,517,619 | 31,385,615 | 15,132,004 | -- |
| Information Technology | 23,635,644 | 11,270,445 | 12,365,199 | -- |
| Materials | 30,210,279 | 16,696,500 | 13,513,779 | -- |
| Real Estate | 3,759,155 | 3,759,155 | -- | -- |
| Telecommunication Services | 10,630,368 | -- | 10,630,368 | -- |
| Utilities | 3,450,591 | 3,450,591 | -- | -- |
| Money Market Funds | 12,458,529 | 12,458,529 | -- | -- |
| Total Investments in Securities: | $390,669,304 | $183,118,047 | $207,551,257 | $-- |
The following is a summary of transfers between Level 1 and Level 2 for the period ended October 31, 2017. Transfers are assumed to have occurred at the beginning of the period, and are primarily attributable to the valuation techniques used for foreign equity securities, as discussed in the accompanying Notes to Financial Statements:
| Transfers | Total |
| Level 1 to Level 2 | $32,292,093 |
| Level 2 to Level 1 | $19,946,287 |
See accompanying notes which are an integral part of the financial statements.
Financial Statements
Statement of Assets and Liabilities
| | | October 31, 2017 |
| Assets | | |
Investment in securities, at value (including securities loaned of $10,454,924) — See accompanying schedule:
Unaffiliated issuers (cost $342,863,555) | $378,210,775 | |
| Fidelity Central Funds (cost $12,458,542) | 12,458,529 | |
| Total Investment in Securities (cost $355,322,097) | | $390,669,304 |
| Receivable for investments sold | | 193,793 |
| Receivable for fund shares sold | | 2,280,747 |
| Dividends receivable | | 1,382,794 |
| Distributions receivable from Fidelity Central Funds | | 10,006 |
| Prepaid expenses | | 830 |
| Other receivables | | 13,548 |
| Total assets | | 394,551,022 |
| Liabilities | | |
| Payable for investments purchased | $215,133 | |
| Payable for fund shares redeemed | 130,405 | |
| Accrued management fee | 212,299 | |
| Distribution and service plan fees payable | 7,567 | |
| Other affiliated payables | 67,044 | |
| Other payables and accrued expenses | 66,426 | |
| Collateral on securities loaned | 11,057,500 | |
| Total liabilities | | 11,756,374 |
| Net Assets | | $382,794,648 |
| Net Assets consist of: | | |
| Paid in capital | | $381,672,420 |
| Undistributed net investment income | | 7,489,052 |
| Accumulated undistributed net realized gain (loss) on investments and foreign currency transactions | | (41,701,871) |
| Net unrealized appreciation (depreciation) on investments and assets and liabilities in foreign currencies | | 35,335,047 |
| Net Assets | | $382,794,648 |
| Calculation of Maximum Offering Price | | |
| Class A: | | |
| Net Asset Value and redemption price per share ($8,150,574 ÷ 897,547 shares) | | $9.08 |
| Maximum offering price per share (100/94.25 of $9.08) | | $9.63 |
| Class M: | | |
| Net Asset Value and redemption price per share ($4,180,900 ÷ 461,364 shares) | | $9.06 |
| Maximum offering price per share (100/96.50 of $9.06) | | $9.39 |
| Class C: | | |
| Net Asset Value and offering price per share ($5,170,880 ÷ 572,193 shares)(a) | | $9.04 |
| International Value: | | |
| Net Asset Value, offering price and redemption price per share ($359,769,575 ÷ 39,573,666 shares) | | $9.09 |
| Class I: | | |
| Net Asset Value, offering price and redemption price per share ($5,522,719 ÷ 606,939 shares) | | $9.10 |
(a) Redemption price per share is equal to net asset value less any applicable contingent deferred sales charge.
See accompanying notes which are an integral part of the financial statements.
Statement of Operations
| | | Year ended October 31, 2017 |
| Investment Income | | |
| Dividends | | $12,349,696 |
| Income from Fidelity Central Funds | | 196,287 |
| Income before foreign taxes withheld | | 12,545,983 |
| Less foreign taxes withheld | | (951,887) |
| Total income | | 11,594,096 |
| Expenses | | |
| Management fee | | |
| Basic fee | $2,421,290 | |
| Performance adjustment | 1,657 | |
| Transfer agent fees | 582,522 | |
| Distribution and service plan fees | 82,932 | |
| Accounting and security lending fees | 181,588 | |
| Custodian fees and expenses | 82,572 | |
| Independent trustees' fees and expenses | 1,365 | |
| Registration fees | 75,068 | |
| Audit | 65,969 | |
| Legal | 3,656 | |
| Miscellaneous | 2,626 | |
| Total expenses before reductions | 3,501,245 | |
| Expense reductions | (37,945) | 3,463,300 |
| Net investment income (loss) | | 8,130,796 |
| Realized and Unrealized Gain (Loss) | | |
| Net realized gain (loss) on: | | |
| Investment securities: | | |
| Unaffiliated issuers | 565,454 | |
| Fidelity Central Funds | (1,737) | |
| Foreign currency transactions | (45,599) | |
| Total net realized gain (loss) | | 518,118 |
| Change in net unrealized appreciation (depreciation) on: | | |
| Investment securities: | | |
| Unaffiliated issuers | 54,024,866 | |
| Fidelity Central Funds | (13) | |
| Assets and liabilities in foreign currencies | 32,843 | |
| Total change in net unrealized appreciation (depreciation) | | 54,057,696 |
| Net gain (loss) | | 54,575,814 |
| Net increase (decrease) in net assets resulting from operations | | $62,706,610 |
See accompanying notes which are an integral part of the financial statements.
Statement of Changes in Net Assets
| | Year ended October 31, 2017 | Year ended October 31, 2016 |
| Increase (Decrease) in Net Assets | | |
| Operations | | |
| Net investment income (loss) | $8,130,796 | $7,988,662 |
| Net realized gain (loss) | 518,118 | (3,305,724) |
| Change in net unrealized appreciation (depreciation) | 54,057,696 | (18,037,363) |
| Net increase (decrease) in net assets resulting from operations | 62,706,610 | (13,354,425) |
| Distributions to shareholders from net investment income | (8,124,122) | (4,084,383) |
| Distributions to shareholders from net realized gain | (457,331) | – |
| Total distributions | (8,581,453) | (4,084,383) |
| Share transactions - net increase (decrease) | 1,925,222 | 56,799,318 |
| Redemption fees | 1,612 | 637 |
| Total increase (decrease) in net assets | 56,051,991 | 39,361,147 |
| Net Assets | | |
| Beginning of period | 326,742,657 | 287,381,510 |
| End of period | $382,794,648 | $326,742,657 |
| Other Information | | |
| Undistributed net investment income end of period | $7,489,052 | $7,482,378 |
See accompanying notes which are an integral part of the financial statements.
Financial Highlights
Fidelity International Value Fund Class A
| Years ended October 31, | 2017 | 2016 | 2015 | 2014 | 2013 |
| Selected Per–Share Data | | | | | |
| Net asset value, beginning of period | $7.78 | $8.27 | $8.62 | $8.96 | $7.39 |
| Income from Investment Operations | | | | | |
| Net investment income (loss)A | .17 | .17 | .13 | .31B | .17 |
| Net realized and unrealized gain (loss) | 1.31 | (.57) | (.20) | (.47) | 1.64 |
| Total from investment operations | 1.48 | (.40) | (.07) | (.16) | 1.81 |
| Distributions from net investment income | (.17) | (.09) | (.28) | (.17) | (.20) |
| Distributions from net realized gain | (.01) | – | – | (.01) | (.04) |
| Total distributions | (.18) | (.09) | (.28) | (.18) | (.24) |
| Redemption fees added to paid in capitalA,C | – | – | – | – | – |
| Net asset value, end of period | $9.08 | $7.78 | $8.27 | $8.62 | $8.96 |
| Total ReturnD,E | 19.36% | (4.91)% | (.81)% | (1.76)% | 25.24% |
| Ratios to Average Net AssetsF,G | | | | | |
| Expenses before reductions | 1.33% | 1.40% | 1.37% | 1.32% | 1.39% |
| Expenses net of fee waivers, if any | 1.33% | 1.40% | 1.37% | 1.32% | 1.39% |
| Expenses net of all reductions | 1.32% | 1.39% | 1.36% | 1.32% | 1.36% |
| Net investment income (loss) | 2.01% | 2.19% | 1.58% | 3.44%B | 2.08% |
| Supplemental Data | | | | | |
| Net assets, end of period (000 omitted) | $8,151 | $7,717 | $8,956 | $6,296 | $6,191 |
| Portfolio turnover rateH | 50% | 47% | 44% | 69% | 79% |
A Calculated based on average shares outstanding during the period.
B Net Investment income per share reflects a large, non-recurring dividend which amounted to $.14 per share. Excluding this non-recurring dividend, the ratio of net investment income (loss) to average net assets would have been 1.90%.
C Amount represents less than $.005 per share.
D Total returns would have been lower if certain expenses had not been reduced during the applicable periods shown.
E Total returns do not include the effect of the sales charges.
F Fees and expenses of any underlying Fidelity Central Funds are not included in the Fund's expense ratio. The Fund indirectly bears its proportionate share of the expenses of any underlying Fidelity Central Funds.
G Expense ratios reflect operating expenses of the class. Expenses before reductions do not reflect amounts reimbursed by the investment adviser or reductions from brokerage service arrangements or reductions from other expense offset arrangements and do not represent the amount paid by the class during periods when reimbursements or reductions occur. Expenses net of fee waivers reflect expenses after reimbursement by the investment adviser but prior to reductions from brokerage service arrangements or other expense offset arrangements. Expenses net of all reductions represent the net expenses paid by the class.
H Amount does not include the portfolio activity of any underlying Fidelity Central Funds.
See accompanying notes which are an integral part of the financial statements.
Fidelity International Value Fund Class M
| Years ended October 31, | 2017 | 2016 | 2015 | 2014 | 2013 |
| Selected Per–Share Data | | | | | |
| Net asset value, beginning of period | $7.76 | $8.25 | $8.60 | $8.94 | $7.38 |
| Income from Investment Operations | | | | | |
| Net investment income (loss)A | .14 | .15 | .11 | .28B | .15 |
| Net realized and unrealized gain (loss) | 1.31 | (.58) | (.20) | (.46) | 1.64 |
| Total from investment operations | 1.45 | (.43) | (.09) | (.18) | 1.79 |
| Distributions from net investment income | (.14) | (.06) | (.26) | (.15) | (.19) |
| Distributions from net realized gain | (.01) | – | – | (.01) | (.04) |
| Total distributions | (.15) | (.06) | (.26) | (.16) | (.23) |
| Redemption fees added to paid in capitalA,C | – | – | – | – | – |
| Net asset value, end of period | $9.06 | $7.76 | $8.25 | $8.60 | $8.94 |
| Total ReturnD,E | 19.04% | (5.24)% | (1.09)% | (1.99)% | 24.86% |
| Ratios to Average Net AssetsF,G | | | | | |
| Expenses before reductions | 1.64% | 1.70% | 1.66% | 1.59% | 1.66% |
| Expenses net of fee waivers, if any | 1.64% | 1.70% | 1.66% | 1.59% | 1.65% |
| Expenses net of all reductions | 1.63% | 1.69% | 1.65% | 1.59% | 1.63% |
| Net investment income (loss) | 1.70% | 1.89% | 1.29% | 3.17%B | 1.81% |
| Supplemental Data | | | | | |
| Net assets, end of period (000 omitted) | $4,181 | $3,703 | $4,086 | $3,604 | $3,758 |
| Portfolio turnover rateH | 50% | 47% | 44% | 69% | 79% |
A Calculated based on average shares outstanding during the period.
B Net Investment income per share reflects a large, non-recurring dividend which amounted to $.14 per share. Excluding this non-recurring dividend, the ratio of net investment income (loss) to average net assets would have been 1.64%.
C Amount represents less than $.005 per share.
D Total returns would have been lower if certain expenses had not been reduced during the applicable periods shown.
E Total returns do not include the effect of the sales charges.
F Fees and expenses of any underlying Fidelity Central Funds are not included in the Fund's expense ratio. The Fund indirectly bears its proportionate share of the expenses of any underlying Fidelity Central Funds.
G Expense ratios reflect operating expenses of the class. Expenses before reductions do not reflect amounts reimbursed by the investment adviser or reductions from brokerage service arrangements or reductions from other expense offset arrangements and do not represent the amount paid by the class during periods when reimbursements or reductions occur. Expenses net of fee waivers reflect expenses after reimbursement by the investment adviser but prior to reductions from brokerage service arrangements or other expense offset arrangements. Expenses net of all reductions represent the net expenses paid by the class.
H Amount does not include the portfolio activity of any underlying Fidelity Central Funds.
See accompanying notes which are an integral part of the financial statements.
Fidelity International Value Fund Class C
| Years ended October 31, | 2017 | 2016 | 2015 | 2014 | 2013 |
| Selected Per–Share Data | | | | | |
| Net asset value, beginning of period | $7.75 | $8.23 | $8.59 | $8.93 | $7.38 |
| Income from Investment Operations | | | | | |
| Net investment income (loss)A | .10 | .11 | .07 | .24B | .11 |
| Net realized and unrealized gain (loss) | 1.31 | (.57) | (.20) | (.45) | 1.63 |
| Total from investment operations | 1.41 | (.46) | (.13) | (.21) | 1.74 |
| Distributions from net investment income | (.11) | (.02) | (.23) | (.11) | (.15) |
| Distributions from net realized gain | (.01) | – | – | (.01) | (.04) |
| Total distributions | (.12) | (.02) | (.23) | (.13)C | (.19) |
| Redemption fees added to paid in capitalA,D | – | – | – | – | – |
| Net asset value, end of period | $9.04 | $7.75 | $8.23 | $8.59 | $8.93 |
| Total ReturnE,F | 18.41% | (5.61)% | (1.58)% | (2.43)% | 24.17% |
| Ratios to Average Net AssetsG,H | | | | | |
| Expenses before reductions | 2.12% | 2.17% | 2.15% | 2.07% | 2.14% |
| Expenses net of fee waivers, if any | 2.12% | 2.17% | 2.14% | 2.07% | 2.14% |
| Expenses net of all reductions | 2.11% | 2.17% | 2.14% | 2.07% | 2.11% |
| Net investment income (loss) | 1.22% | 1.42% | .81% | 2.69%B | 1.33% |
| Supplemental Data | | | | | |
| Net assets, end of period (000 omitted) | $5,171 | $4,168 | $4,502 | $3,647 | $3,231 |
| Portfolio turnover rateI | 50% | 47% | 44% | 69% | 79% |
A Calculated based on average shares outstanding during the period.
B Net Investment income per share reflects a large, non-recurring dividend which amounted to $.14 per share. Excluding this non-recurring dividend, the ratio of net investment income (loss) to average net assets would have been 1.15%.
C Total distributions of $.13 per share is comprised of distributions from net investment income of $.111 and distributions from net realized gain of $.014 per share.
D Amount represents less than $.005 per share.
E Total returns would have been lower if certain expenses had not been reduced during the applicable periods shown.
F Total returns do not include the effect of the contingent deferred sales charge.
G Fees and expenses of any underlying Fidelity Central Funds are not included in the Fund's expense ratio. The Fund indirectly bears its proportionate share of the expenses of any underlying Fidelity Central Funds.
H Expense ratios reflect operating expenses of the class. Expenses before reductions do not reflect amounts reimbursed by the investment adviser or reductions from brokerage service arrangements or reductions from other expense offset arrangements and do not represent the amount paid by the class during periods when reimbursements or reductions occur. Expenses net of fee waivers reflect expenses after reimbursement by the investment adviser but prior to reductions from brokerage service arrangements or other expense offset arrangements. Expenses net of all reductions represent the net expenses paid by the class.
I Amount does not include the portfolio activity of any underlying Fidelity Central Funds.
See accompanying notes which are an integral part of the financial statements.
Fidelity International Value Fund
| Years ended October 31, | 2017 | 2016 | 2015 | 2014 | 2013 |
| Selected Per–Share Data | | | | | |
| Net asset value, beginning of period | $7.79 | $8.29 | $8.64 | $8.97 | $7.40 |
| Income from Investment Operations | | | | | |
| Net investment income (loss)A | .20 | .20 | .16 | .34B | .19 |
| Net realized and unrealized gain (loss) | 1.31 | (.58) | (.19) | (.46) | 1.65 |
| Total from investment operations | 1.51 | (.38) | (.03) | (.12) | 1.84 |
| Distributions from net investment income | (.20) | (.12) | (.32) | (.20) | (.22) |
| Distributions from net realized gain | (.01) | – | – | (.01) | (.04) |
| Total distributions | (.21) | (.12) | (.32) | (.21) | (.27)C |
| Redemption fees added to paid in capitalA,D | – | – | – | – | – |
| Net asset value, end of period | $9.09 | $7.79 | $8.29 | $8.64 | $8.97 |
| Total ReturnE | 19.83% | (4.69)% | (.41)% | (1.34)% | 25.57% |
| Ratios to Average Net AssetsF,G | | | | | |
| Expenses before reductions | .97% | 1.03% | 1.02% | .96% | 1.05% |
| Expenses net of fee waivers, if any | .97% | 1.03% | 1.02% | .96% | 1.05% |
| Expenses net of all reductions | .96% | 1.03% | 1.01% | .95% | 1.02% |
| Net investment income (loss) | 2.36% | 2.56% | 1.93% | 3.80%B | 2.41% |
| Supplemental Data | | | | | |
| Net assets, end of period (000 omitted) | $359,770 | $309,199 | $267,567 | $192,789 | $181,568 |
| Portfolio turnover rateH | 50% | 47% | 44% | 69% | 79% |
A Calculated based on average shares outstanding during the period.
B Net Investment income per share reflects a large, non-recurring dividend which amounted to $.14 per share. Excluding this non-recurring dividend, the ratio of net investment income (loss) to average net assets would have been 2.27%.
C Total distributions of $.27 per share is comprised of distributions from net investment income of $.223 and distributions from net realized gain of $.042 per share.
D Amount represents less than $.005 per share.
E Total returns would have been lower if certain expenses had not been reduced during the applicable periods shown.
F Fees and expenses of any underlying Fidelity Central Funds are not included in the Fund's expense ratio. The Fund indirectly bears its proportionate share of the expenses of any underlying Fidelity Central Funds.
G Expense ratios reflect operating expenses of the class. Expenses before reductions do not reflect amounts reimbursed by the investment adviser or reductions from brokerage service arrangements or reductions from other expense offset arrangements and do not represent the amount paid by the class during periods when reimbursements or reductions occur. Expenses net of fee waivers reflect expenses after reimbursement by the investment adviser but prior to reductions from brokerage service arrangements or other expense offset arrangements. Expenses net of all reductions represent the net expenses paid by the class.
H Amount does not include the portfolio activity of any underlying Fidelity Central Funds.
See accompanying notes which are an integral part of the financial statements.
Fidelity International Value Fund Class I
| Years ended October 31, | 2017 | 2016 | 2015 | 2014 | 2013 |
| Selected Per–Share Data | | | | | |
| Net asset value, beginning of period | $7.80 | $8.29 | $8.65 | $8.98 | $7.41 |
| Income from Investment Operations | | | | | |
| Net investment income (loss)A | .19 | .19 | .15 | .33B | .19 |
| Net realized and unrealized gain (loss) | 1.31 | (.58) | (.19) | (.45) | 1.65 |
| Total from investment operations | 1.50 | (.39) | (.04) | (.12) | 1.84 |
| Distributions from net investment income | (.19) | (.10) | (.32) | (.19) | (.23) |
| Distributions from net realized gain | (.01) | – | – | (.01) | (.04) |
| Total distributions | (.20) | (.10) | (.32) | (.21)C | (.27) |
| Redemption fees added to paid in capitalA,D | – | – | – | – | – |
| Net asset value, end of period | $9.10 | $7.80 | $8.29 | $8.65 | $8.98 |
| Total ReturnE | 19.68% | (4.81)% | (.53)% | (1.41)% | 25.64% |
| Ratios to Average Net AssetsF,G | | | | | |
| Expenses before reductions | 1.10% | 1.17% | 1.14% | 1.05% | 1.07% |
| Expenses net of fee waivers, if any | 1.10% | 1.17% | 1.14% | 1.05% | 1.07% |
| Expenses net of all reductions | 1.09% | 1.16% | 1.13% | 1.04% | 1.04% |
| Net investment income (loss) | 2.23% | 2.42% | 1.81% | 3.71%B | 2.39% |
| Supplemental Data | | | | | |
| Net assets, end of period (000 omitted) | $5,523 | $1,955 | $1,969 | $1,310 | $239 |
| Portfolio turnover rateH | 50% | 47% | 44% | 69% | 79% |
A Calculated based on average shares outstanding during the period.
B Net Investment income per share reflects a large, non-recurring dividend which amounted to $.14 per share. Excluding this non-recurring dividend, the ratio of net investment income (loss) to average net assets would have been 2.18%.
C Total distributions of $.21 per share is comprised of distributions from net investment income of $.191 and distributions from net realized gain of $0.14 per share.
D Amount represents less than $.005 per share.
E Total returns would have been lower if certain expenses had not been reduced during the applicable periods shown.
F Fees and expenses of any underlying Fidelity Central Funds are not included in the Fund's expense ratio. The Fund indirectly bears its proportionate share of the expenses of any underlying Fidelity Central Funds.
G Expense ratios reflect operating expenses of the class. Expenses before reductions do not reflect amounts reimbursed by the investment adviser or reductions from brokerage service arrangements or reductions from other expense offset arrangements and do not represent the amount paid by the class during periods when reimbursements or reductions occur. Expenses net of fee waivers reflect expenses after reimbursement by the investment adviser but prior to reductions from brokerage service arrangements or other expense offset arrangements. Expenses net of all reductions represent the net expenses paid by the class.
H Amount does not include the portfolio activity of any underlying Fidelity Central Funds.
See accompanying notes which are an integral part of the financial statements.
Notes to Financial Statements
For the period ended October 31, 2017
1. Organization.
Fidelity International Value Fund (the Fund) is a fund of Fidelity Investment Trust (the Trust) and is authorized to issue an unlimited number of shares. The Trust is registered under the Investment Company Act of 1940, as amended (the 1940 Act), as an open-end management investment company organized as a Massachusetts business trust. The Fund offers Class A, Class M (formerly Class T), Class C, International Value, and Class I shares, each of which has equal rights as to assets and voting privileges. Each class has exclusive voting rights with respect to matters that affect that class.
After the close of business on June 24, 2016, all outstanding Class B shares were converted to Class A shares. All prior fiscal period dollar and share amounts for Class B presented in the Notes to Financial Statements are for the period November 1, 2015 through June 24, 2016.
2. Investments in Fidelity Central Funds.
The Fund invests in Fidelity Central Funds, which are open-end investment companies generally available only to other investment companies and accounts managed by the investment adviser and its affiliates. The Fund's Schedule of Investments lists each of the Fidelity Central Funds held as of period end, if any, as an investment of the Fund, but does not include the underlying holdings of each Fidelity Central Fund. As an Investing Fund, the Fund indirectly bears its proportionate share of the expenses of the underlying Fidelity Central Funds.
The Money Market Central Funds seek preservation of capital and current income and are managed by Fidelity Investments Money Management, Inc. (FIMM), an affiliate of the investment adviser. Annualized expenses of the Money Market Central Funds as of their most recent shareholder report date are less than .005%.
A complete unaudited list of holdings for each Fidelity Central Fund is available upon request or at the Securities and Exchange Commission (the SEC) website at www.sec.gov. In addition, the financial statements of the Fidelity Central Funds, which are not covered by the Fund's Report of Independent Registered Public Accounting Firm, are available on the SEC website or upon request.
3. Significant Accounting Policies.
The Fund is an investment company and applies the accounting and reporting guidance of the Financial Accounting Standards Board (FASB) Accounting Standards Codification Topic 946 Financial Services – Investments Companies. The financial statements have been prepared in conformity with accounting principles generally accepted in the United States of America (GAAP), which require management to make certain estimates and assumptions at the date of the financial statements. Actual results could differ from those estimates. Subsequent events, if any, through the date that the financial statements were issued have been evaluated in the preparation of the financial statements. The following summarizes the significant accounting policies of the Fund:
Investment Valuation. Investments are valued as of 4:00 p.m. Eastern time on the last calendar day of the period. The Board of Trustees (the Board) has delegated the day to day responsibility for the valuation of the Fund's investments to the Fair Value Committee (the Committee) established by the Fund's investment adviser. In accordance with valuation policies and procedures approved by the Board, the Fund attempts to obtain prices from one or more third party pricing vendors or brokers to value its investments. When current market prices, quotations or currency exchange rates are not readily available or reliable, investments will be fair valued in good faith by the Committee, in accordance with procedures adopted by the Board. Factors used in determining fair value vary by investment type and may include market or investment specific events. The frequency with which these procedures are used cannot be predicted and they may be utilized to a significant extent. The Committee oversees the Fund's valuation policies and procedures and reports to the Board on the Committee's activities and fair value determinations. The Board monitors the appropriateness of the procedures used in valuing the Fund's investments and ratifies the fair value determinations of the Committee.
The Fund categorizes the inputs to valuation techniques used to value its investments into a disclosure hierarchy consisting of three levels as shown below:
- Level 1 – quoted prices in active markets for identical investments
- Level 2 – other significant observable inputs (including quoted prices for similar investments, interest rates, prepayment speeds, etc.)
- Level 3 – unobservable inputs (including the Fund's own assumptions based on the best information available)
Valuation techniques used to value the Fund's investments by major category are as follows:
Equity securities, including restricted securities, for which market quotations are readily available, are valued at the last reported sale price or official closing price as reported by a third party pricing vendor on the primary market or exchange on which they are traded and are categorized as Level 1 in the hierarchy. In the event there were no sales during the day or closing prices are not available, securities are valued at the last quoted bid price or may be valued using the last available price and are generally categorized as Level 2 in the hierarchy. For foreign equity securities, when market or security specific events arise, comparisons to the valuation of American Depositary Receipts (ADRs), futures contracts, Exchange-Traded Funds (ETFs) and certain indexes as well as quoted prices for similar securities may be used and would be categorized as Level 2 in the hierarchy. Utilizing these techniques may result in transfers between Level 1 and Level 2. For equity securities, including restricted securities, where observable inputs are limited, assumptions about market activity and risk are used and these securities may be categorized as Level 3 in the hierarchy.
Investments in open-end mutual funds, including the Fidelity Central Funds, are valued at their closing net asset value (NAV) each business day and are categorized as Level 1 in the hierarchy
Changes in valuation techniques may result in transfers in or out of an assigned level within the disclosure hierarchy. The aggregate value of investments by input level as of October 31, 2017, including information on transfers between Levels 1 and 2, is included at the end of the Fund's Schedule of Investments.
Foreign Currency. The Fund may use foreign currency contracts to facilitate transactions in foreign-denominated securities. Gains and losses from these transactions may arise from changes in the value of the foreign currency or if the counterparties do not perform under the contracts' terms.
Foreign-denominated assets, including investment securities, and liabilities are translated into U.S. dollars at the exchange rates at period end. Purchases and sales of investment securities, income and dividends received and expenses denominated in foreign currencies are translated into U.S. dollars at the exchange rate in effect on the transaction date.
The effects of exchange rate fluctuations on investments are included with the net realized and unrealized gain (loss) on investment securities. Other foreign currency transactions resulting in realized and unrealized gain (loss) are disclosed separately.
Investment Transactions and Income. For financial reporting purposes, the Fund's investment holdings and NAV include trades executed through the end of the last business day of the period. The NAV per share for processing shareholder transactions is calculated as of the close of business of the New York Stock Exchange (NYSE), normally 4:00 p.m. Eastern time and includes trades executed through the end of the prior business day. Gains and losses on securities sold are determined on the basis of identified cost. Dividend income is recorded on the ex-dividend date, except for certain dividends from foreign securities where the ex-dividend date may have passed, which are recorded as soon as the Fund is informed of the ex-dividend date. Non-cash dividends included in dividend income, if any, are recorded at the fair market value of the securities received. Income and capital gain distributions from Fidelity Central Funds, if any, are recorded on the ex-dividend date. Certain distributions received by the Fund represent a return of capital or capital gain. The Fund determines the components of these distributions subsequent to the ex-dividend date, based upon receipt of tax filings or other correspondence relating to the underlying investment. These distributions are recorded as a reduction of cost of investments and/or as a realized gain. Investment income is recorded net of foreign taxes withheld where recovery of such taxes is uncertain.
Class Allocations and Expenses. Investment income, realized and unrealized capital gains and losses, common expenses of the Fund, and certain fund-level expense reductions, if any, are allocated daily on a pro-rata basis to each class based on the relative net assets of each class to the total net assets of the Fund. Each class differs with respect to transfer agent and distribution and service plan fees incurred. Certain expense reductions may also differ by class. For the reporting period, the allocated portion of income and expenses to each class as a percent of its average net assets may vary due to the timing of recording these transactions in relation to fluctuating net assets of the classes. Expenses directly attributable to a fund are charged to that fund. Expenses attributable to more than one fund are allocated among the respective funds on the basis of relative net assets or other appropriate methods. Expense estimates are accrued in the period to which they relate and adjustments are made when actual amounts are known.
Income Tax Information and Distributions to Shareholders. Each year, the Fund intends to qualify as a regulated investment company under Subchapter M of the Internal Revenue Code, including distributing substantially all of its taxable income and realized gains. As a result, no provision for U.S. Federal income taxes is required. As of October 31, 2017, the Fund did not have any unrecognized tax benefits in the financial statements; nor is the Fund aware of any tax positions for which it is reasonably possible that the total amounts of unrecognized tax benefits will significantly change in the next twelve months. The Fund files a U.S. federal tax return, in addition to state and local tax returns as required. The Fund's federal income tax returns are subject to examination by the Internal Revenue Service (IRS) for a period of three fiscal years after they are filed. State and local tax returns may be subject to examination for an additional fiscal year depending on the jurisdiction. Foreign taxes are provided for based on the Fund's understanding of the tax rules and rates that exist in the foreign markets in which it invests.
Distributions are declared and recorded on the ex-dividend date. Income dividends and capital gain distributions are declared separately for each class. Income and capital gain distributions are determined in accordance with income tax regulations, which may differ from GAAP.
Capital accounts within the financial statements are adjusted for permanent book-tax differences. These adjustments have no impact on net assets or the results of operations. Capital accounts are not adjusted for temporary book-tax differences which will reverse in a subsequent period.
Book-tax differences are primarily due to foreign currency transactions, passive foreign investment companies (PFIC), partnerships, capital loss carryforwards, expiring capital loss carryforwards, and losses deferred due to wash sales.
As of period end, the cost and unrealized appreciation (depreciation) in securities, and derivatives if applicable, for federal income tax purposes were as follows:
| Gross unrealized appreciation | $46,378,499 |
| Gross unrealized depreciation | (12,928,378) |
| Net unrealized appreciation (depreciation) | $33,450,121 |
| Tax Cost | $357,219,183 |
The tax-based components of distributable earnings as of period end were as follows:
| Undistributed ordinary income | $8,222,478 |
| Capital loss carryforward | $(40,538,521) |
| Net unrealized appreciation (depreciation) on securities and other investments | $33,438,270 |
Capital loss carryforwards are only available to offset future capital gains of the Fund to the extent provided by regulations and may be limited. Under the Regulated Investment Company Modernization Act of 2010 (the Act), the Fund is permitted to carry forward capital losses incurred in taxable years beginning after December 22, 2010 for an unlimited period and such capital losses are required to be used prior to any losses that expire. The capital loss carryforward information presented below, including any applicable limitation, is estimated as of fiscal period end and is subject to adjustment.
| Fiscal year of expiration | |
| 2018 | $ (3,571,319) |
| 2019 | (31,368,797) |
| Total with expiration | $(34,940,116) |
| No expiration | |
| Short-term | $(1,634,534) |
| Long-term | (3,963,871) |
| Total no expiration | $(5,598,405) |
| Total capital loss carryforward | $(40,538,521) |
The tax character of distributions paid was as follows:
| | October 31, 2017 | October 31, 2016 |
| Ordinary Income | $8,581,453 | $ 4,084,383 |
Short-Term Trading (Redemption) Fees. Shares held by investors in the Fund less than 30 days may have been subject to a redemption fee equal to 1.00% of the NAV of shares redeemed. All redemption fees, which reduce the proceeds of the shareholder redemption, are retained by the Fund and accounted for as an addition to paid in capital. In November 2017, the Board of Trustees approved the elimination of these redemption fees effective December 18, 2017.
4. Purchases and Sales of Investments.
Purchases and sales of securities, other than short-term securities aggregated $172,260,962 and $172,307,064, respectively.
5. Fees and Other Transactions with Affiliates.
Management Fee. Fidelity Management & Research Company (the investment adviser) and its affiliates provide the Fund with investment management related services for which the Fund pays a monthly management fee. The management fee is the sum of an individual fund fee rate that is based on an annual rate of .45% of the Fund's average net assets and an annualized group fee rate that averaged .25% during the period. The group fee rate is based upon the average net assets of all the mutual funds advised by the investment adviser, including any mutual funds previously advised by the investment adviser that are currently advised by Fidelity SelectCo, LLC, an affiliate of the investment adviser. The group fee rate decreases as assets under management increase and increases as assets under management decrease. In addition, the management fee is subject to a performance adjustment (up to a maximum of +/- .20% of the Fund's average net assets over a 36 month performance period). The upward or downward adjustment to the management fee is based on the relative investment performance of International Value as compared to its benchmark index, the MSCI EAFE Value Index, over the same 36 month performance period. For the reporting period, the total annual management fee rate, including the performance adjustment, was .69% of the Fund's average net assets. The performance adjustment included in the management fee rate may be higher or lower than the maximum performance adjustment rate due to the difference between the average net assets for the reporting and performance periods.
Distribution and Service Plan Fees. In accordance with Rule 12b-1 of the 1940 Act, the Fund has adopted separate Distribution and Service Plans for each class of shares. Certain classes pay Fidelity Distributors Corporation (FDC), an affiliate of the investment adviser, separate Distribution and Service Fees, each of which is based on an annual percentage of each class' average net assets. In addition, FDC may pay financial intermediaries for selling shares of the Fund and providing shareholder support services. For the period, the Distribution and Service Fee rates, total fees and amounts retained by FDC were as follows:
| | Distribution
Fee | Service
Fee | Total Fees | Retained
by FDC |
| Class A | -% | .25% | $18,763 | $– |
| Class M | .25% | .25% | 19,350 | – |
| Class C | .75% | .25% | 44,819 | 4,912 |
| | | | $82,932 | $4,912 |
Sales Load. FDC may receive a front-end sales charge of up to 5.75% for selling Class A shares and 3.50% for selling Class M shares, some of which is paid to financial intermediaries for selling shares of the Fund. Depending on the holding period, FDC may receive contingent deferred sales charges levied on Class A, Class M and Class C redemptions. The deferred sales charges are 1.00% for Class C shares, 1.00% for certain purchases of Class A shares and .25% for certain purchases of Class M shares.
For the period, sales charge amounts retained by FDC were as follows:
| | Retained
by FDC |
| Class A | $4,121 |
| Class M | 863 |
| Class C(a) | 612 |
| | $5,596 |
(a) When Class C shares are initially sold, FDC pays commissions from its own resources to financial intermediaries through which the sales are made.
Transfer Agent Fees. Fidelity Investments Institutional Operations Company, Inc., (FIIOC), an affiliate of the investment adviser, is the transfer, dividend disbursing and shareholder servicing agent for each class of the Fund. FIIOC receives account fees and asset-based fees that vary according to the account size and type of account of the shareholders of the respective classes of the Fund. FIIOC pays for typesetting, printing and mailing of shareholder reports, except proxy statements.
For the period, transfer agent fees for each class were as follows:
| | Amount | % of
Class-Level Average
Net Assets |
| Class A | $19,912 | .27 |
| Class M | 12,625 | .33 |
| Class C | 13,645 | .30 |
| International Value | 525,662 | .16 |
| Class I | 10,678 | .29 |
| | $582,522 | |
Accounting and Security Lending Fees. Fidelity Service Company, Inc. (FSC), an affiliate of the investment adviser, maintains the Fund's accounting records. The accounting fee is based on the level of average net assets for each month. Under a separate contract, FSC administers the security lending program. The security lending fee is based on the number and duration of lending transactions.
Brokerage Commissions. The Fund placed a portion of its portfolio transactions with brokerage firms which are affiliates of the investment adviser. Brokerage commissions are included in net realized gain (loss) and change in net unrealized appreciation (depreciation) in the Statement of Operations. The commissions paid to these affiliated firms were $179 for the period.
Interfund Trades. The Fund may purchase from or sell securities to other Fidelity Funds under procedures adopted by the Board. The procedures have been designed to ensure these interfund trades are executed in accordance with Rule 17a-7 of the 1940 Act. Interfund trades are included within the respective purchases and sales amounts shown in the Purchases and Sales of Investments note.
6. Committed Line of Credit.
The Fund participates with other funds managed by the investment adviser or an affiliate in a $4.25 billion credit facility (the "line of credit") to be utilized for temporary or emergency purposes to fund shareholder redemptions or for other short-term liquidity purposes. The Fund has agreed to pay commitment fees on its pro-rata portion of the line of credit, which amounted to $1,098 and is reflected in Miscellaneous expenses on the Statement of Operations. During the period, the Fund did not borrow on this line of credit.
7. Security Lending.
The Fund lends portfolio securities through a lending agent from time to time in order to earn additional income. For equity securities, a lending agent is used and may loan securities to certain qualified borrowers, including Fidelity Capital Markets (FCM), a broker-dealer affiliated with the Fund. On the settlement date of the loan, the Fund receives collateral (in the form of U.S. Treasury obligations, letters of credit and/or cash) against the loaned securities and maintains collateral in an amount not less than 100% of the market value of the loaned securities during the period of the loan. The market value of the loaned securities is determined at the close of business of the Fund and any additional required collateral is delivered to the Fund on the next business day. The Fund or borrower may terminate the loan at any time, and if the borrower defaults on its obligation to return the securities loaned because of insolvency or other reasons, the Fund may apply collateral received from the borrower against the obligation. The Fund may experience delays and costs in recovering the securities loaned. Any cash collateral received is invested in the Fidelity Securities Lending Cash Central Fund. The value of loaned securities and cash collateral at period end are disclosed on the Fund's Statement of Assets and Liabilities. Security lending income represents the income earned on investing cash collateral, less rebates paid to borrowers and any lending agent fees associated with the loan, plus any premium payments received for lending certain types of securities. Security lending income is presented in the Statement of Operations as a component of income from Fidelity Central Funds. Total security lending income during the period amounted to $181,569, including $36 from securities loaned to FCM.
8. Expense Reductions.
Commissions paid to certain brokers with whom the investment adviser, or its affiliates, places trades on behalf of the Fund include an amount in addition to trade execution, which may be rebated back to the Fund to offset certain expenses. This amount totaled $35,011 for the period.
In addition, during the period the investment adviser reimbursed and/or waived a portion of fund-level operating expenses in the amount of $2,934.
9. Distributions to Shareholders.
Distributions to shareholders of each class were as follows:
| | Year ended
October 31, 2017 | Year ended October 31, 2016 |
| From net investment income | | |
| Class A | $160,715 | $95,726 |
| Class M | 64,948 | 30,318 |
| Class B | – | 141 |
| Class C | 57,557 | 10,293 |
| International Value | 7,786,373 | 3,924,604 |
| Class I | 54,529 | 23,301 |
| Total | $8,124,122 | $4,084,383 |
| From net realized gain | | |
| Class A | $10,650 | $– |
| Class M | 5,031 | – |
| Class C | 5,917 | – |
| International Value | 432,576 | – |
| Class I | 3,157 | – |
| Total | $457,331 | $– |
10. Share Transactions.
Share transactions for each class were as follows and may contain automatic conversions between classes or exchanges between affiliated funds:
| | Shares | Shares | Dollars | Dollars |
| | Year ended October 31, 2017 | Year ended October 31, 2016 | Year ended October 31, 2017 | Year ended October 31, 2016 |
| Class A | | | | |
| Shares sold | 276,572 | 238,095 | $2,327,962 | $1,848,202 |
| Reinvestment of distributions | 21,396 | 11,425 | 166,672 | 93,224 |
| Shares redeemed | (392,253) | (340,144) | (3,202,452) | (2,620,114) |
| Net increase (decrease) | (94,285) | (90,624) | $(707,818) | $(678,688) |
| Class M | | | | |
| Shares sold | 101,768 | 88,717 | $836,059 | $694,653 |
| Reinvestment of distributions | 8,935 | 3,669 | 69,695 | 29,980 |
| Shares redeemed | (126,227) | (110,449) | (1,023,584) | (851,756) |
| Net increase (decrease) | (15,524) | (18,063) | $(117,830) | $(127,123) |
| Class B | | | | |
| Shares sold | – | 2 | $– | $14 |
| Reinvestment of distributions | – | 15 | – | 124 |
| Shares redeemed | – | (36,263) | – | (277,663) |
| Net increase (decrease) | – | (36,246) | $– | $(277,525) |
| Class C | | | | |
| Shares sold | 120,429 | 105,656 | $1,017,626 | $808,615 |
| Reinvestment of distributions | 7,631 | 1,181 | 59,598 | 9,659 |
| Shares redeemed | (94,013) | (115,602) | (768,940) | (896,778) |
| Net increase (decrease) | 34,047 | (8,765) | $308,284 | $(78,504) |
| International Value | | | | |
| Shares sold | 2,636,526 | 10,653,545 | $22,208,337 | $82,568,730 |
| Reinvestment of distributions | 1,033,790 | 470,177 | 8,032,545 | 3,831,944 |
| Shares redeemed | (3,774,158) | (3,741,188) | (30,751,436) | (28,527,423) |
| Net increase (decrease) | (103,842) | 7,382,534 | $(510,554) | $57,873,251 |
| Class I | | | | |
| Shares sold | 426,959 | 73,854 | $3,538,590 | $567,094 |
| Reinvestment of distributions | 6,933 | 2,528 | 54,005 | 20,650 |
| Shares redeemed | (77,592) | (63,368) | (639,455) | (499,837) |
| Net increase (decrease) | 356,300 | 13,014 | $2,953,140 | $87,907 |
11. Other.
The Fund's organizational documents provide former and current trustees and officers with a limited indemnification against liabilities arising in connection with the performance of their duties to the Fund. In the normal course of business, the Fund may also enter into contracts that provide general indemnifications. The Fund's maximum exposure under these arrangements is unknown as this would be dependent on future claims that may be made against the Fund. The risk of material loss from such claims is considered remote.
At the end of the period, Strategic Advisers International II Fund was the owner of record of approximately 68% of the total outstanding shares of the Fund.
Report of Independent Registered Public Accounting Firm
To the Trustees of Fidelity Investment Trust and Shareholders of Fidelity International Value Fund:
We have audited the accompanying statement of assets and liabilities of Fidelity International Value Fund (the Fund), a fund of Fidelity Investment Trust, including the schedule of investments, as of October 31, 2017, and the related statement of operations for the year then ended, the statement of changes in net assets for each of the two years in the period then ended, and the financial highlights for each of the five years in the period then ended. These financial statements and financial highlights are the responsibility of the Fund's management. Our responsibility is to express an opinion on these financial statements and financial highlights based on our audits.
We conducted our audits in accordance with the standards of the Public Company Accounting Oversight Board (United States). Those standards require that we plan and perform the audit to obtain reasonable assurance about whether the financial statements and financial highlights are free of material misstatement. The Fund is not required to have, nor were we engaged to perform, an audit of its internal control over financial reporting. Our audits included consideration of internal control over financial reporting as a basis for designing audit procedures that are appropriate in the circumstances, but not for the purpose of expressing an opinion on the effectiveness of the Fund's internal control over financial reporting. Accordingly, we express no such opinion. An audit also includes examining, on a test basis, evidence supporting the amounts and disclosures in the financial statements, assessing the accounting principles used and significant estimates made by management, as well as evaluating the overall financial statement presentation. Our procedures included confirmation of securities owned as of October 31, 2017, by correspondence with the custodians and brokers; when replies were not received from brokers, we performed other auditing procedures. We believe that our audits provide a reasonable basis for our opinion.
In our opinion, such financial statements and financial highlights referred to above present fairly, in all material respects, the financial position of Fidelity International Value Fund as of October 31, 2017, the results of its operations for the year then ended, the changes in its net assets for each of the two years in the period then ended, and the financial highlights for each of the five years in the period then ended, in conformity with accounting principles generally accepted in the United States of America.
DELOITTE & TOUCHE LLP
Boston, Massachusetts
December 13, 2017
Trustees and Officers
The Trustees, Members of the Advisory Board (if any), and officers of the trust and fund, as applicable, are listed below. The Board of Trustees governs the fund and is responsible for protecting the interests of shareholders. The Trustees are experienced executives who meet periodically throughout the year to oversee the fund's activities, review contractual arrangements with companies that provide services to the fund, oversee management of the risks associated with such activities and contractual arrangements, and review the fund's performance. Except for Jonathan Chiel, each of the Trustees oversees 190 funds. Mr. Chiel oversees 143 funds.
The Trustees hold office without limit in time except that (a) any Trustee may resign; (b) any Trustee may be removed by written instrument, signed by at least two-thirds of the number of Trustees prior to such removal; (c) any Trustee who requests to be retired or who has become incapacitated by illness or injury may be retired by written instrument signed by a majority of the other Trustees; and (d) any Trustee may be removed at any special meeting of shareholders by a two-thirds vote of the outstanding voting securities of the trust. Each Trustee who is not an interested person (as defined in the 1940 Act) of the trust and the fund is referred to herein as an Independent Trustee. Each Independent Trustee shall retire not later than the last day of the calendar year in which his or her 75th birthday occurs. The Independent Trustees may waive this mandatory retirement age policy with respect to individual Trustees. Officers and Advisory Board Members hold office without limit in time, except that any officer or Advisory Board Member may resign or may be removed by a vote of a majority of the Trustees at any regular meeting or any special meeting of the Trustees. Except as indicated, each individual has held the office shown or other offices in the same company for the past five years.
The fund’s Statement of Additional Information (SAI) includes more information about the Trustees. To request a free copy, call Fidelity at 1-877-208-0098.
Experience, Skills, Attributes, and Qualifications of the Trustees. The Governance and Nominating Committee has adopted a statement of policy that describes the experience, qualifications, attributes, and skills that are necessary and desirable for potential Independent Trustee candidates (Statement of Policy). The Board believes that each Trustee satisfied at the time he or she was initially elected or appointed a Trustee, and continues to satisfy, the standards contemplated by the Statement of Policy. The Governance and Nominating Committee also engages professional search firms to help identify potential Independent Trustee candidates who have the experience, qualifications, attributes, and skills consistent with the Statement of Policy. From time to time, additional criteria based on the composition and skills of the current Independent Trustees, as well as experience or skills that may be appropriate in light of future changes to board composition, business conditions, and regulatory or other developments, have also been considered by the professional search firms and the Governance and Nominating Committee. In addition, the Board takes into account the Trustees' commitment and participation in Board and committee meetings, as well as their leadership of standing and ad hoc committees throughout their tenure.
In determining that a particular Trustee was and continues to be qualified to serve as a Trustee, the Board has considered a variety of criteria, none of which, in isolation, was controlling. The Board believes that, collectively, the Trustees have balanced and diverse experience, qualifications, attributes, and skills, which allow the Board to operate effectively in governing the fund and protecting the interests of shareholders. Information about the specific experience, skills, attributes, and qualifications of each Trustee, which in each case led to the Board's conclusion that the Trustee should serve (or continue to serve) as a trustee of the fund, is provided below.
Board Structure and Oversight Function. James C. Curvey is an interested person and currently serves as Chairman. The Trustees have determined that an interested Chairman is appropriate and benefits shareholders because an interested Chairman has a personal and professional stake in the quality and continuity of services provided to the fund. Independent Trustees exercise their informed business judgment to appoint an individual of their choosing to serve as Chairman, regardless of whether the Trustee happens to be independent or a member of management. The Independent Trustees have determined that they can act independently and effectively without having an Independent Trustee serve as Chairman and that a key structural component for assuring that they are in a position to do so is for the Independent Trustees to constitute a substantial majority for the Board. The Independent Trustees also regularly meet in executive session. Ned C. Lautenbach serves as Chairman of the Independent Trustees and as such (i) acts as a liaison between the Independent Trustees and management with respect to matters important to the Independent Trustees and (ii) with management prepares agendas for Board meetings.
Fidelity® funds are overseen by different Boards of Trustees. The fund's Board oversees Fidelity's high income and certain equity funds, and other Boards oversee Fidelity's investment-grade bond, money market, asset allocation, and sector funds. The asset allocation funds may invest in Fidelity® funds overseen by the fund's Board. The use of separate Boards, each with its own committee structure, allows the Trustees of each group of Fidelity® funds to focus on the unique issues of the funds they oversee, including common research, investment, and operational issues. On occasion, the separate Boards establish joint committees to address issues of overlapping consequences for the Fidelity® funds overseen by each Board.
The Trustees operate using a system of committees to facilitate the timely and efficient consideration of all matters of importance to the Trustees, the fund, and fund shareholders and to facilitate compliance with legal and regulatory requirements and oversight of the fund's activities and associated risks. The Board, acting through its committees, has charged FMR and its affiliates with (i) identifying events or circumstances the occurrence of which could have demonstrably adverse effects on the fund's business and/or reputation; (ii) implementing processes and controls to lessen the possibility that such events or circumstances occur or to mitigate the effects of such events or circumstances if they do occur; and (iii) creating and maintaining a system designed to evaluate continuously business and market conditions in order to facilitate the identification and implementation processes described in (i) and (ii) above. Because the day-to-day operations and activities of the fund are carried out by or through FMR, its affiliates, and other service providers, the fund's exposure to risks is mitigated but not eliminated by the processes overseen by the Trustees. While each of the Board's committees has responsibility for overseeing different aspects of the fund's activities, oversight is exercised primarily through the Operations, Audit, and Compliance Committees. In addition, the Independent Trustees have worked with FMR to enhance the Board's oversight of investment and financial risks, legal and regulatory risks, technology risks, and operational risks, including the development of additional risk reporting to the Board. For example, a working group comprised of Independent Trustees and FMR has worked and continues to work to review the Fidelity® funds' valuation-related activities, reporting and risk management. Appropriate personnel, including but not limited to the fund's Chief Compliance Officer (CCO), FMR's internal auditor, the independent accountants, the fund's Treasurer and portfolio management personnel, make periodic reports to the Board's committees, as appropriate, including an annual review of Fidelity's risk management program for the Fidelity® funds. The responsibilities of each standing committee, including their oversight responsibilities, are described further under "Standing Committees of the Trustees."
Interested Trustees*:
Correspondence intended for a Trustee who is an interested person may be sent to Fidelity Investments, 245 Summer Street, Boston, Massachusetts 02210.
Name, Year of Birth; Principal Occupations and Other Relevant Experience+
Jonathan Chiel (1957)
Year of Election or Appointment: 2016
Trustee
Mr. Chiel also serves as Trustee of other Fidelity® funds. Mr. Chiel is Executive Vice President and General Counsel for FMR LLC (diversified financial services company, 2012-present). Previously, Mr. Chiel served as general counsel (2004-2012) and senior vice president and deputy general counsel (2000-2004) for John Hancock Financial Services; a partner with Choate, Hall & Stewart (1996-2000) (law firm); and an Assistant United States Attorney for the United States Attorney’s Office of the District of Massachusetts (1986-95), including Chief of the Criminal Division (1993-1995). Mr. Chiel is a director on the boards of the Boston Bar Foundation and the Maimonides School.
James C. Curvey (1935)
Year of Election or Appointment: 2007
Trustee
Chairman of the Board of Trustees
Mr. Curvey also serves as Trustee of other Fidelity® funds. Mr. Curvey is a Director of Fidelity Research & Analysis Co. (investment adviser firm, 2009-present), and Vice Chairman (2007-present) and Director of FMR LLC (diversified financial services company). In addition, Mr. Curvey serves as an Overseer for the Boston Symphony Orchestra and a member of the board of Artis-Naples, Naples, Florida, and as a Trustee for Brewster Academy, Wolfeboro, New Hampshire. Previously, Mr. Curvey served as a Director of Fidelity Investments Money Management, Inc. (investment adviser firm, 2009-2014) and a Director of FMR and FMR Co., Inc. (investment adviser firms, 2007-2014).
Charles S. Morrison (1960)
Year of Election or Appointment: 2014
Trustee
Mr. Morrison also serves as Trustee of other funds. He serves as President of Fidelity Management & Research Company (FMR) (investment adviser firm, 2016-present), a Director of Fidelity Investments Money Management, Inc. (FIMM) (investment adviser firm, 2014-present), Director of Fidelity SelectCo, LLC (investment adviser firm, 2014-present), President, Asset Management (2014-present), and is an employee of Fidelity Investments. Previously, Mr. Morrison served as Vice President of Fidelity's Fixed Income and Asset Allocation Funds (2012-2014), President, Fixed Income (2011-2014), Vice President of Fidelity's Money Market Funds (2005-2009), President, Money Market Group Leader of FMR (investment adviser firm, 2009), and Senior Vice President, Money Market Group of FMR (2004-2009). Mr. Morrison also served as Vice President of Fidelity's Bond Funds (2002-2005), certain Balanced Funds (2002-2005), and certain Asset Allocation Funds (2002-2007), and as Senior Vice President (2002-2005) of Fidelity's Bond Division.
* Determined to be an “Interested Trustee” by virtue of, among other things, his or her affiliation with the trust or various entities under common control with FMR.
+ The information includes the Trustee's principal occupation during the last five years and other information relating to the experience, attributes, and skills relevant to the Trustee's qualifications to serve as a Trustee, which led to the conclusion that the Trustee should serve as a Trustee for the fund.
Independent Trustees:
Correspondence intended for an Independent Trustee may be sent to Fidelity Investments, P.O. Box 55235, Boston, Massachusetts 02205-5235.
Name, Year of Birth; Principal Occupations and Other Relevant Experience+
Dennis J. Dirks (1948)
Year of Election or Appointment: 2005
Trustee
Mr. Dirks also serves as Trustee of other Fidelity® funds. Prior to his retirement in May 2003, Mr. Dirks was Chief Operating Officer and a member of the Board of The Depository Trust & Clearing Corporation (DTCC). He also served as President, Chief Operating Officer, and Board member of The Depository Trust Company (DTC) and President and Board member of the National Securities Clearing Corporation (NSCC). In addition, Mr. Dirks served as Chief Executive Officer and Board member of the Government Securities Clearing Corporation, Chief Executive Officer and Board member of the Mortgage-Backed Securities Clearing Corporation, as a Trustee and a member of the Finance Committee of Manhattan College (2005-2008), as a Trustee and a member of the Finance Committee of AHRC of Nassau County (2006-2008), as a member of the Independent Directors Council (IDC) Governing Council (2010-2015), and as a member of the Board of Directors for The Brookville Center for Children’s Services, Inc. (2009-2017). Mr. Dirks is a member of the Finance Committee (2016-present) and Board of Directors (2017-present) of the Asolo Repertory Theatre.
Alan J. Lacy (1953)
Year of Election or Appointment: 2008
Trustee
Mr. Lacy also serves as Trustee of other Fidelity® funds. Mr. Lacy serves as a Director of Bristol-Myers Squibb Company (global pharmaceuticals, 2008-present). He is a Trustee of the California Chapter of The Nature Conservancy (2015-present) and a Director of the Center for Advanced Study in the Behavioral Sciences at Stanford University (2015-present). In addition, Mr. Lacy served as Senior Adviser (2007-2014) of Oak Hill Capital Partners, L.P. (private equity) and also served as Chief Executive Officer (2005) and Vice Chairman (2005-2006) of Sears Holdings Corporation (retail) and Chief Executive Officer and Chairman of the Board of Sears, Roebuck and Co. (retail, 2000-2005). Previously, Mr. Lacy served as Chairman (2014-2017) and a member (2010-2017) of the Board of Directors of Dave & Buster’s Entertainment, Inc. (restaurant and entertainment complexes), as Chairman (2008-2011) and a member (2006-2015) of the Board of Trustees of the National Parks Conservation Association, and as a member of the Board of Directors for The Hillman Companies, Inc. (hardware wholesalers, 2010-2014), Earth Fare, Inc. (retail grocery, 2010-2014), and The Western Union Company (global money transfer, 2006-2011).
Ned C. Lautenbach (1944)
Year of Election or Appointment: 2000
Trustee
Chairman of the Independent Trustees
Mr. Lautenbach also serves as Trustee of other Fidelity® funds. Mr. Lautenbach currently serves as Vice Chair of the Board of Governors, State University System of Florida (2013-present) and is a member of the Council on Foreign Relations (1994-present). He is also a member and has most recently served as Chairman of the Board of Directors of Artis-Naples (2012-present). Previously, Mr. Lautenbach served as a member and then Lead Director of the Board of Directors of Eaton Corporation (diversified industrial, 1997-2016). He was also a Partner and Advisory Partner at Clayton, Dubilier & Rice, LLC (private equity investment, 1998-2010), as well as a Director of Sony Corporation (2006-2007). In addition, Mr. Lautenbach also had a 30-year career with IBM (technology company) during which time he served as Senior Vice President and a member of the Corporate Executive Committee (1968-1998).
Joseph Mauriello (1944)
Year of Election or Appointment: 2008
Trustee
Mr. Mauriello also serves as Trustee of other Fidelity® funds. Prior to his retirement in January 2006, Mr. Mauriello served in numerous senior management positions including Deputy Chairman and Chief Operating Officer (2004-2005), and Vice Chairman of Financial Services (2002-2004) of KPMG LLP US (professional services, 1965-2005). Mr. Mauriello currently serves as a member of the Board of Directors of XL Group plc. (global insurance and re-insurance, 2006-present) and the Independent Directors Council (IDC) Governing Council (2015-present). Previously, Mr. Mauriello served as a Director of the Hamilton Funds of the Bank of New York (2006-2007) and of Arcadia Resources Inc. (health care services and products, 2007-2012).
Cornelia M. Small (1944)
Year of Election or Appointment: 2005
Trustee
Ms. Small also serves as Trustee of other Fidelity® funds. Ms. Small is a member of the Board of Directors (2009-present) and Chair of the Investment Committee (2010-present) of the Teagle Foundation. Ms. Small also serves on the Investment Committee of the Berkshire Taconic Community Foundation (2008-present). Previously, Ms. Small served as Chairperson (2002-2008) and a member of the Investment Committee and Chairperson (2008-2012) and a member of the Board of Trustees of Smith College. In addition, Ms. Small served as Chief Investment Officer, Director of Global Equity Investments, and a member of the Board of Directors of Scudder, Stevens & Clark and Scudder Kemper Investments.
William S. Stavropoulos (1939)
Year of Election or Appointment: 2001
Trustee
Vice Chairman of the Independent Trustees
Mr. Stavropoulos also serves as Trustee of other Fidelity® funds. Mr. Stavropoulos serves as President and Founder of the Michigan Baseball Foundation, the Great Lakes Loons (2007-present). Mr. Stavropoulos is Chairman Emeritus of the Board of Directors of The Dow Chemical Company, where he previously served in numerous senior management positions, including President, CEO (1995-2000; 2002-2004), Chairman of the Executive Committee (2000-2006), and as a member of the Board of Directors (1990-2006). Currently, Mr. Stavropoulos is Chairman of the Board of Directors of Univar Inc. (global distributor of commodity and specialty chemicals), a Director of Teradata Corporation (data warehousing and technology solutions), and a member of the Advisory Board for Metalmark Capital LLC (private equity investment, 2005-present). Mr. Stavropoulos is an operating advisor to Clayton, Dubilier & Rice, LLC (private equity investment). In addition, Mr. Stavropoulos is a member of the University of Notre Dame Advisory Council for the College of Science, a Trustee of the Rollin L. Gerstacker Foundation, and a Director of Artis-Naples in Naples, Florida. Previously, Mr. Stavropoulos served as a Director of Chemical Financial Corporation (bank holding company, 1993-2012) and Tyco International, Ltd. (multinational manufacturing and services, 2007-2012).
David M. Thomas (1949)
Year of Election or Appointment: 2008
Trustee
Mr. Thomas also serves as Trustee of other Fidelity® funds. Mr. Thomas serves as Non-Executive Chairman of the Board of Directors of Fortune Brands Home and Security (home and security products, 2011-present), as a member of the Board of Directors (2004-present) and Presiding Director (2013-present) of Interpublic Group of Companies, Inc. (marketing communication), and as a member of the Board of Trustees of the University of Florida (2013-present). Previously, Mr. Thomas served as Executive Chairman (2005-2006) and Chairman and Chief Executive Officer (2000-2005) of IMS Health, Inc. (pharmaceutical and healthcare information solutions), and a Director of Fortune Brands, Inc. (consumer products, 2000-2011).
+ The information includes the Trustee's principal occupation during the last five years and other information relating to the experience, attributes, and skills relevant to the Trustee's qualifications to serve as a Trustee, which led to the conclusion that the Trustee should serve as a Trustee for the fund.
Advisory Board Members and Officers:
Correspondence intended for an officer or Peter S. Lynch may be sent to Fidelity Investments, 245 Summer Street, Boston, Massachusetts 02210. Officers appear below in alphabetical order.
Name, Year of Birth; Principal Occupation
Peter S. Lynch (1944)
Year of Election or Appointment: 2003
Member of the Advisory Board
Mr. Lynch also serves as Member of the Advisory Board of other Fidelity® funds. Mr. Lynch is Vice Chairman and a Director of FMR (investment adviser firm) and FMR Co., Inc. (investment adviser firm). In addition, Mr. Lynch serves as a Trustee of Boston College and as the Chairman of the Inner-City Scholarship Fund. Previously, Mr. Lynch served on the Special Olympics International Board of Directors (1997-2006).
Elizabeth Paige Baumann (1968)
Year of Election or Appointment: 2017
Anti-Money Laundering (AML) Officer
Ms. Baumann also serves as AML Officer of other funds. She is Chief AML Officer (2012-present) and Senior Vice President (2014-present) of FMR LLC (diversified financial services company) and is an employee of Fidelity Investments. Previously, Ms. Baumann served as AML Officer of the funds (2012-2016), and Vice President (2007-2014) and Deputy Anti-Money Laundering Officer (2007-2012) of FMR LLC.
Marc R. Bryant (1966)
Year of Election or Appointment: 2015
Secretary and Chief Legal Officer (CLO)
Mr. Bryant also serves as Secretary and CLO of other funds. Mr. Bryant serves as CLO, Secretary, and Senior Vice President of Fidelity Management & Research Company (investment adviser firm, 2015-present) and FMR Co., Inc. (investment adviser firm, 2015-present); Secretary of Fidelity SelectCo, LLC (investment adviser firm, 2015-present) and Fidelity Investments Money Management, Inc. (investment adviser firm, 2015-present); and CLO of Fidelity Management & Research (Hong Kong) Limited and FMR Investment Management (UK) Limited (investment adviser firms, 2015-present) and Fidelity Management & Research (Japan) Limited (investment adviser firm, 2016-present). He is Senior Vice President and Deputy General Counsel of FMR LLC (diversified financial services company). Previously, Mr. Bryant served as Secretary and CLO of Fidelity Rutland Square Trust II (2010-2014) and Assistant Secretary of Fidelity's Fixed Income and Asset Allocation Funds (2013-2015). Prior to joining Fidelity Investments, Mr. Bryant served as a Senior Vice President and the Head of Global Retail Legal for AllianceBernstein L.P. (2006-2010), and as the General Counsel for ProFund Advisors LLC (2001-2006).
William C. Coffey (1969)
Year of Election or Appointment: 2009
Assistant Secretary
Mr. Coffey also serves as Assistant Secretary of other funds. He is Senior Vice President and Deputy General Counsel of FMR LLC (diversified financial services company, 2010-present), and is an employee of Fidelity Investments. Previously, Mr. Coffey served as Vice President and Associate General Counsel of FMR LLC (2005-2009).
Jonathan Davis (1968)
Year of Election or Appointment: 2010
Assistant Treasurer
Mr. Davis also serves as Assistant Treasurer of other funds, and is an employee of Fidelity Investments. Previously, Mr. Davis served as Vice President and Associate General Counsel of FMR LLC (diversified financial services company, 2003-2010).
Adrien E. Deberghes (1967)
Year of Election or Appointment: 2016
Assistant Treasurer
Mr. Deberghes also serves as an officer of other funds. He serves as Executive Vice President of Fidelity Investments Money Management, Inc. (FIMM) (investment adviser firm, 2016-present) and is an employee of Fidelity Investments (2008-present). Prior to joining Fidelity Investments, Mr. Deberghes was Senior Vice President of Mutual Fund Administration at State Street Corporation (2007-2008), Senior Director of Mutual Fund Administration at Investors Bank & Trust (2005-2007), and Director of Finance for Dunkin' Brands (2000-2005). Previously, Mr. Deberghes served in other fund officer roles.
Joseph DeSantis (1959)
Year of Election or Appointment: 2017
Vice President
Mr. DeSantis also serves as Vice President of other funds. Mr. DeSantis serves as a Director of Fidelity Management & Research (Japan) Limited (investment adviser firm, 2016-present), Chief Investment Officer, Equities (2010-present) and is an employee of Fidelity Investments.
Stephanie J. Dorsey (1969)
Year of Election or Appointment: 2010
Assistant Treasurer
Ms. Dorsey also serves as an officer of other funds. She is an employee of Fidelity Investments (2008-present) and has served in other fund officer roles. Prior to joining Fidelity Investments, Ms. Dorsey served as Treasurer (2004-2008) of the JPMorgan Mutual Funds and Vice President (2004-2008) of JPMorgan Chase Bank.
Howard J. Galligan III (1966)
Year of Election or Appointment: 2014
Chief Financial Officer
Mr. Galligan also serves as Chief Financial Officer of other funds. Mr. Galligan serves as President of Fidelity Pricing and Cash Management Services (FPCMS) (2014-present) and as a Director of Strategic Advisers, Inc. (investment adviser firm, 2008-present). Previously, Mr. Galligan served as Chief Administrative Officer of Asset Management (2011-2014) and Chief Operating Officer and Senior Vice President of Investment Support for Strategic Advisers, Inc. (2003-2011).
Brian B. Hogan (1964)
Year of Election or Appointment: 2009
Vice President
Mr. Hogan also serves as Trustee or Vice President of other funds. Mr. Hogan serves as a Director of FMR Investment Management (UK) Limited (investment adviser firm, 2015-present) and Fidelity SelectCo, LLC (investment adviser firm, 2014-present) and President of the Equity Division of FMR (investment adviser firm, 2009-present). Previously, Mr. Hogan served as Senior Vice President, Equity Research of FMR (2006-2009) and as a portfolio manager. Mr. Brian B. Hogan is not related to Mr. Colm A. Hogan.
Colm A. Hogan (1973)
Year of Election or Appointment: 2016
Deputy Treasurer
Mr. Hogan also serves as an officer of other funds. Mr. Hogan is an employee of Fidelity Investments (2005-present). Mr. Colm A. Hogan is not related to Mr. Brian B. Hogan.
Chris Maher (1972)
Year of Election or Appointment: 2013
Assistant Treasurer
Mr. Maher serves as Assistant Treasurer of other funds. Mr. Maher is Vice President of Valuation Oversight and is an employee of Fidelity Investments. Previously, Mr. Maher served as Vice President of Asset Management Compliance (2013), Vice President of the Program Management Group of FMR (investment adviser firm, 2010-2013), and Vice President of Valuation Oversight (2008-2010).
Rieco E. Mello (1969)
Year of Election or Appointment: 2017
Assistant Treasurer
Mr. Mello also serves as Assistant Treasurer of other funds. Mr. Mello is an employee of Fidelity Investments (1995-present).
Kenneth B. Robins (1969)
Year of Election or Appointment: 2016
Chief Compliance Officer
Mr. Robins also serves as an officer of other funds. Mr. Robins serves as Compliance Officer of Fidelity Management & Research Company and FMR Co., Inc. (investment adviser firms, 2016-present) and is an employee of Fidelity Investments (2004-present). Previously, Mr. Robins served as Executive Vice President of Fidelity Investments Money Management, Inc. (investment adviser firm, 2013-2016) and served in other fund officer roles.
Stacie M. Smith (1974)
Year of Election or Appointment: 2016
President and Treasurer
Ms. Smith also serves as an officer of other funds. She is an employee of Fidelity Investments (2009-present) and has served in other fund officer roles. Prior to joining Fidelity Investments, Ms. Smith served as Senior Audit Manager of Ernst & Young LLP (accounting firm, 1996-2009). Previously, Ms. Smith served as Deputy Treasurer of certain Fidelity® funds (2013-2016).
Marc L. Spector (1972)
Year of Election or Appointment: 2016
Assistant Treasurer
Mr. Spector also serves as an officer of other funds. Mr. Spector is an employee of Fidelity Investments (2016-present). Prior to joining Fidelity Investments, Mr. Spector served as Director at the Siegfried Group (accounting firm, 2013-2016), and prior to Siegfried Group as audit senior manager at Deloitte & Touche (accounting firm, 2005-2013).
Renee Stagnone (1975)
Year of Election or Appointment: 2016
Assistant Treasurer
Ms. Stagnone also serves as an officer of other funds. Ms. Stagnone is an employee of Fidelity Investments (1997-present). Previously, Ms. Stagnone served as Deputy Treasurer of certain Fidelity® funds (2013-2016).
Shareholder Expense Example
As a shareholder of the Fund, you incur two types of costs: (1) transaction costs, including sales charges (loads) on purchase payments or redemption proceeds, redemption fees and (2) ongoing costs, including management fees, distribution and/or service (12b-1) fees and other Fund expenses. This Example is intended to help you understand your ongoing costs (in dollars) of investing in the Fund and to compare these costs with the ongoing costs of investing in other mutual funds.
The Example is based on an investment of $1,000 invested at the beginning of the period and held for the entire period (May 1, 2017 to October 31, 2017).
Actual Expenses
The first line of the accompanying table for each class of the Fund provides information about actual account values and actual expenses. You may use the information in this line, together with the amount you invested, to estimate the expenses that you paid over the period. Simply divide your account value by $1,000.00 (for example, an $8,600 account value divided by $1,000.00 = 8.6), then multiply the result by the number in the first line for a class of the Fund under the heading entitled "Expenses Paid During Period" to estimate the expenses you paid on your account during this period. A small balance maintenance fee of $12.00 that is charged once a year may apply for certain accounts with a value of less than $2,000. This fee is not included in the table below. If it was, the estimate of expenses you paid during the period would be higher, and your ending account value lower, by this amount. In addition, the Fund, as a shareholder in the underlying Fidelity Central Funds, will indirectly bear its pro-rata share of the fees and expenses incurred by the underlying Fidelity Central Funds. These fees and expenses are not included in the Fund's annualized expense ratio used to calculate the expense estimate in the table below.
Hypothetical Example for Comparison Purposes
The second line of the accompanying table for each class of the Fund provides information about hypothetical account values and hypothetical expenses based on a Class' actual expense ratio and an assumed rate of return of 5% per year before expenses, which is not the Class' actual return. The hypothetical account values and expenses may not be used to estimate the actual ending account balance or expenses you paid for the period. You may use this information to compare the ongoing costs of investing in the Fund and other funds. To do so, compare this 5% hypothetical example with the 5% hypothetical examples that appear in the shareholder reports of the other funds. A small balance maintenance fee of $12.00 that is charged once a year may apply for certain accounts with a value of less than $2,000. This fee is not included in the table below. If it was, the estimate of expenses you paid during the period would be higher, and your ending account value lower, by this amount. In addition, the Fund, as a shareholder in the underlying Fidelity Central Funds, will indirectly bear its pro-rata share of the fees and expenses incurred by the underlying Fidelity Central Funds. These fees and expenses are not included in the Fund's annualized expense ratio used to calculate the expense estimate in the table below.
Please note that the expenses shown in the table are meant to highlight your ongoing costs only and do not reflect any transaction costs. Therefore, the second line of the table is useful in comparing ongoing costs only, and will not help you determine the relative total costs of owning different funds. In addition, if these transactional costs were included, your costs would have been higher.
| | Annualized Expense Ratio-A | Beginning
Account Value
May 1, 2017 | Ending
Account Value
October 31, 2017 | Expenses Paid
During Period-B
May 1, 2017
to October 31, 2017 |
| Class A | 1.30% | | | |
| Actual | | $1,000.00 | $1,083.50 | $6.83 |
| Hypothetical-C | | $1,000.00 | $1,018.65 | $6.61 |
| Class M | 1.63% | | | |
| Actual | | $1,000.00 | $1,082.40 | $8.56 |
| Hypothetical-C | | $1,000.00 | $1,016.99 | $8.29 |
| Class C | 2.10% | | | |
| Actual | | $1,000.00 | $1,080.00 | $11.01 |
| Hypothetical-C | | $1,000.00 | $1,014.62 | $10.66 |
| International Value | .96% | | | |
| Actual | | $1,000.00 | $1,086.00 | $5.05 |
| Hypothetical-C | | $1,000.00 | $1,020.37 | $4.89 |
| Class I | 1.10% | | | |
| Actual | | $1,000.00 | $1,084.60 | $5.78 |
| Hypothetical-C | | $1,000.00 | $1,019.66 | $5.60 |
| | | | | |
| | | | | |
| | | | | |
A Annualized expense ratio reflects expenses net of applicable fee waivers.
B Expenses are equal to each Class' annualized expense ratio, multiplied by the average account value over the period, multiplied by 184/365 (to reflect the one-half year period).
C 5% return per year before expenses
Distributions (Unaudited)
The Board of Trustees of Fidelity International Value Fund voted to pay to shareholders of record at the opening of business on record date, the following distributions per share derived from capital gains realized from sales of portfolio securities, and dividends derived from net investment income:
| | Pay Date | Record Date | Dividends | Capital Gains |
| International Value | 12/11/2017 | 12/08/2017 | $0.136 | $0.014 |
| Class A | 12/11/2017 | 12/08/2017 | $0.102 | $0.014 |
| Class C | 12/11/2017 | 12/08/2017 | $0.042 | $0.014 |
| Class I | 12/11/2017 | 12/08/2017 | $0.126 | $0.014 |
| Class M | 12/11/2017 | 12/08/2017 | $0.075 | $0.014 |
|
International Value designates 3%, Class A designates 3%, Class C designates 5%, Class I designates 3%, and Class M designates 4% of the dividends distributed during the fiscal year as qualifying for the dividends–received deduction for corporate shareholders.
International Value designates 92%, Class A designates 100%, Class C designates 100%, Class I designates 96%, and Class M designates 100% of the dividends distributed during the fiscal year as amounts which may be taken into account as a dividend for purposes of the maximum rate under section 1(h)(11) of the Internal Revenue Code.
The amounts per share which represent income derived from sources within, and taxes paid to, foreign countries or possessions of the United States are as follows:
| | Pay Date | Income | Taxes |
| International Value | 12/12/2016 | $0.2208 | $0.0118 |
| Class A | 12/12/2016 | $0.1888 | $0.0118 |
| Class C | 12/12/2016 | $0.1298 | $0.0118 |
| Class I | 12/12/2016 | $0.2128 | $0.0118 |
| Class M | 12/12/2016 | $0.1648 | $0.0118 |
|
The fund will notify shareholders in January 2018 of amounts for use in preparing 2017 income tax returns.
Board Approval of Investment Advisory Contracts and Management Fees
Fidelity International Value Fund
Each year, the Board of Trustees, including the Independent Trustees (together, the Board), votes on the renewal of the management contract with Fidelity Management & Research Company (FMR) and the sub-advisory agreements (together, the Advisory Contracts) for the fund. FMR and the sub-advisers are referred to herein as the Investment Advisers. The Board, assisted by the advice of fund counsel and Independent Trustees' counsel, requests and considers a broad range of information relevant to the renewal of the Advisory Contracts throughout the year.
The Board meets regularly and, at each of its meetings, covers an extensive agenda of topics and materials and considers factors that are relevant to its annual consideration of the renewal of the fund's Advisory Contracts, including the services and support provided to the fund and its shareholders. The Board has established various standing committees (Committees), each composed of and chaired by Independent Trustees with varying backgrounds, to which the Board has assigned specific subject matter responsibilities in order to enhance effective decision-making by the Board. The Board, acting directly and through its Committees, requests and receives information concerning the annual consideration of the renewal of the fund's Advisory Contracts. The Board also meets as needed to review matters specifically related to the Board's annual consideration of the renewal of the Advisory Contracts. Members of the Board may also meet with trustees of other Fidelity funds through ad hoc joint committees to discuss certain matters relevant to all of the Fidelity funds.
At its July 2017 meeting, the Board unanimously determined to renew the fund's Advisory Contracts. In reaching its determination, the Board considered all factors it believed relevant, including (i) the nature, extent, and quality of the services to be provided to the fund and its shareholders (including the investment performance of the fund); (ii) the competitiveness of the fund's management fee and total expense ratio relative to peer funds; (iii) the total costs of the services to be provided by and the profits to be realized by Fidelity from its relationships with the fund; and (iv) the extent to which, if any, economies of scale exist and would be realized as the fund grows, and whether any economies of scale are appropriately shared with fund shareholders.
In considering whether to renew the Advisory Contracts for the fund, the Board reached a determination, with the assistance of fund counsel and Independent Trustees' counsel and through the exercise of its business judgment, that the renewal of the Advisory Contracts was in the best interests of the fund and its shareholders and that the compensation payable under the Advisory Contracts was fair and reasonable. The Board's decision to renew the Advisory Contracts was not based on any single factor, but rather was based on a comprehensive consideration of all the information provided to the Board at its meetings throughout the year. The Board, in reaching its determination to renew the Advisory Contracts, was aware that shareholders of the fund have a broad range of investment choices available to them, including a wide choice among funds offered by Fidelity's competitors, and that the fund's shareholders, who have the opportunity to review and weigh the disclosure provided by the fund in its prospectus and other public disclosures, have chosen to invest in this fund, which is part of the Fidelity family of funds.
Amendment to Group Fee Rate. The Board also approved an amendment to the management contract for the fund to add an additional breakpoint to the group fee schedule, effective October 1, 2017. The Board noted that the additional breakpoint would result in lower management fee rates as Fidelity's assets under management increase.
Nature, Extent, and Quality of Services Provided. The Board considered Fidelity's staffing as it relates to the fund, including the backgrounds of investment personnel of Fidelity, and also considered the fund's investment objective, strategies, and related investment philosophy. The Independent Trustees also had discussions with senior management of Fidelity's investment operations and investment groups. The Board considered the structure of the investment personnel compensation program and whether this structure provides appropriate incentives to act in the best interests of the fund. Additionally, the Board considered the portfolio managers' investments, if any, in the funds that they manage.
Resources Dedicated to Investment Management and Support Services. The Board and the Fund Oversight and Research Committees reviewed the general qualifications and capabilities of Fidelity's investment staff, including its size, education, experience, and resources, as well as Fidelity's approach to recruiting, training, managing, and compensating investment personnel. The Board noted that Fidelity has continued to increase the resources devoted to non-U.S. offices, including expansion of Fidelity's global investment organization. The Board also noted that Fidelity's analysts have extensive resources, tools and capabilities that allow them to conduct sophisticated quantitative and fundamental analysis, as well as credit analysis of issuers, counterparties and guarantors. Further, the Board considered that Fidelity's investment professionals have sufficient access to global information and data so as to provide competitive investment results over time, and that those professionals also have access to sophisticated tools that permit them to assess portfolio construction and risk and performance attribution characteristics continuously, as well as to transmit new information and research conclusions rapidly around the world. Additionally, in its deliberations, the Board considered Fidelity's trading, risk management, compliance, and technology and operations capabilities and resources, which are integral parts of the investment management process.
Shareholder and Administrative Services. The Board considered (i) the nature, extent, quality, and cost of advisory, administrative, and shareholder services performed by the Investment Advisers and their affiliates under the Advisory Contracts and under separate agreements covering transfer agency, pricing and bookkeeping, and securities lending services for the fund; (ii) the nature and extent of the supervision of third party service providers, principally custodians, subcustodians, and pricing vendors; and (iii) the resources devoted to, and the record of compliance with, the fund's compliance policies and procedures. The Board also reviewed the allocation of fund brokerage, including allocations to brokers affiliated with the Investment Advisers, the use of brokerage commissions to pay fund expenses, and the use of "soft" commission dollars to pay for research services.
The Board noted that the growth of fund assets over time across the complex allows Fidelity to reinvest in the development of services designed to enhance the value or convenience of the Fidelity funds as investment vehicles. These services include 24-hour access to account information and market information through telephone representatives and over the Internet, investor education materials and asset allocation tools, and the expanded availability of Fidelity Investor Centers.
In 2014, the Board formed an ad hoc Committee on Transfer Agency Fees to review the variety of transfer agency fee structures throughout the industry and Fidelity's competitive positioning with respect to industry participants.
Investment in a Large Fund Family. The Board considered the benefits to shareholders of investing in a Fidelity fund, including the benefits of investing in a fund that is part of a large family of funds offering a variety of investment disciplines and providing a large variety of mutual fund investor services. The Board noted that Fidelity had taken, or had made recommendations that resulted in the Fidelity funds taking, a number of actions over the previous year that benefited particular funds, including: (i) continuing to dedicate additional resources to Fidelity's investment research process, and to the support of the senior management team that oversees asset management; (ii) continuing efforts to enhance Fidelity's global research capabilities; (iii) launching new funds and making other enhancements to meet client needs; (iv) launching new share classes of existing funds; (v) eliminating purchase minimums and broadening eligibility requirements for certain lower-priced share classes; (vi) reducing management fees and total expenses for certain growth equity funds and index funds; (vii) lowering expense caps for certain existing funds and classes to reduce expenses borne by shareholders; (viii) eliminating short-term redemption fees for certain funds; (ix) introducing a new pricing structure for certain funds of funds that is expected to reduce overall expenses paid by shareholders; (x) rationalizing product lines and gaining increased efficiencies through proposals for fund mergers and share class consolidations; (xi) continuing to develop, acquire and implement systems and technology to improve services to the funds and shareholders, strengthen information security, and increase efficiency; and (xii) implementing enhancements to further strengthen Fidelity's product line to increase investors' probability of success in achieving their investment goals, including retirement income goals.
Investment Performance. The Board considered whether the fund has operated in accordance with its investment objective, as well as its record of compliance with its investment restrictions and its performance history.
The Board took into account discussions with representatives of the Investment Advisers about fund investment performance that occur at Board meetings throughout the year. In this regard the Board noted that as part of regularly scheduled fund reviews and other reports to the Board on fund performance, the Board considers annualized return information for the fund for different time periods, measured against a securities market index ("benchmark index") and a peer group of funds with similar objectives ("peer group"), if any. In its evaluation of fund investment performance, the Board gave particular attention to information indicating changes in performance of certain Fidelity funds for specific time periods and discussed with the Investment Advisers the reasons for any overperformance or underperformance.
In addition to reviewing absolute and relative fund performance, the Independent Trustees periodically consider the appropriateness of fund performance metrics in evaluating the results achieved. In general, the Independent Trustees believe that fund performance should be evaluated based on net performance (after fees and expenses) of both the highest performing and lowest performing fund share classes, where applicable, compared to appropriate benchmark indices, over appropriate time periods that may include full market cycles, and compared to peer groups, as applicable, over the same periods, taking into account relevant factors including the following: general market conditions; issuer-specific information; and fund cash flows and other factors.
The Independent Trustees recognize that shareholders evaluate performance on a net basis over their own holding periods, for which one-, three-, and five-year periods are often used as a proxy. For this reason, the performance information reviewed by the Board also included net cumulative calendar year total return information for the fund and an appropriate benchmark index and peer group for the most recent
one-, three-, and five-year periods, as shown below. Returns are shown compared to the 25th percentile (top of box, 75% beaten) and 75th percentile (bottom of box, 25% beaten) of the peer universe. Returns of the benchmark index are "net MA," i.e., adjusted for tax withholding rates applicable to U.S.-based funds organized as Massachusetts business trusts.Fidelity International Value Fund
The Board also considered that the fund's management fee is subject to upward or downward adjustment depending upon whether, and to what extent, the fund's investment performance for the performance period (a rolling 36-month period) exceeds, or is exceeded by, a securities index, thus leading to a performance adjustment for the same period. The Board noted that the performance adjustment provides FMR with a strong economic incentive to seek to achieve superior long-term performance for the fund's shareholders and helps to more closely align the interests of FMR and the shareholders of the fund.
Based on its review, the Board concluded that the nature, extent, and quality of services provided to the fund under the Advisory Contracts should continue to benefit the shareholders of the fund.
Competitiveness of Management Fee and Total Expense Ratio. The Board considered the fund's management fee and total expense ratio compared to "mapped groups" of competitive funds and classes created for the purpose of facilitating the Trustees' competitive analysis of management fees and total expenses. Fidelity creates "mapped groups" by combining similar Lipper investment objective categories that have comparable investment mandates. Combining Lipper investment objective categories aids the Board's management fee and total expense ratio comparisons by broadening the competitive group used for comparison.
Management Fee. The Board considered two proprietary management fee comparisons for the 12-month periods shown in basis points (BP) in the chart below. The group of Lipper funds used by the Board for management fee comparisons is referred to below as the "Total Mapped Group." The Total Mapped Group comparison focuses on a fund's standing in terms of gross management fees before expense reimbursements or caps, and without giving effect to the fund's performance adjustment, relative to the total universe of funds with comparable investment mandates, regardless of whether their management fee structures also are comparable. Funds with comparable investment mandates offer exposure to similar types of securities. Funds with comparable management fee structures have similar management fee contractual arrangements (
e.g., flat rate charged for advisory services, all-inclusive fee rate,
etc.). "TMG %" represents the percentage of funds in the Total Mapped Group that had management fees that were lower than the fund's. For example, a hypothetical TMG % of 20% would mean that 80% of the funds in the Total Mapped Group had higher, and 20% had lower, management fees than the fund. The fund's actual TMG %s and the number of funds in the Total Mapped Group are in the chart below. The "Asset-Size Peer Group" (ASPG) comparison focuses on a fund's standing relative to a subset of non-Fidelity funds within the Total Mapped Group that are similar in size and management fee structure without taking into account performance adjustments, if any. For example, if a fund is in the first quartile of the ASPG, the fund's management fee ranks in the least expensive or lowest 25% of funds in the ASPG. The ASPG represents at least 15% of the funds in the Total Mapped Group with comparable asset size and management fee structures, subject to a minimum of 50 funds (or all funds in the Total Mapped Group if fewer than 50). Additional information, such as the ASPG quartile in which the fund's management fee rate ranked and the impact of the fund's performance adjustment, is also included in the chart and considered by the Board.
Fidelity International Value Fund
The Board noted that the fund's management fee rate ranked below the median of its Total Mapped Group and below the median of its ASPG for 2016. The Board also noted the effect of the fund's performance adjustment, if any, on the fund's management fee ranking.
The Board noted that, in 2014, the Board and the boards of other Fidelity funds formed the ad hoc Committee on Group Fee to conduct an in-depth review of the "group fee" component of the management fee of funds with such management fee structures. The Committee's focus included the mechanics of the group fee, the competitive landscape of group fee structures, Fidelity funds with no group fee component and investment products not included in group fee assets. The Board also considered that, for funds subject to the group fee, FMR agreed to voluntarily waive fees over a specified period of time in amounts designed to account for assets converted from certain funds to certain collective investment trusts.
The Board also noted that, in 2013, the ad hoc Committee on Management Fees was formed to conduct an in-depth review of the management fee rates of Fidelity's active equity mutual funds. The Committee focused on the following areas: (i) standard fee structures; (ii) research consumption and trading evolution; (iii) management fee competitiveness/profitability by category; and (iv) factors that drive institutional pricing.
Based on its review, the Board concluded that the fund's management fee is fair and reasonable in light of the services that the fund receives and the other factors considered.
Total Expense Ratio. In its review of each class's total expense ratio, the Board considered the fund's management fee rate as well as other fund or class expenses, as applicable, such as transfer agent fees, pricing and bookkeeping fees, fund-paid 12b-1 fees, and custodial, legal, and audit fees. The Board noted the impact of the fund's performance adjustment. The Board also noted that Fidelity may agree to waive fees and expenses from time to time, and the extent to which, if any, it has done so for the fund. As part of its review, the Board also considered the current and historical total expense ratios of each class of the fund compared to competitive fund median expenses. Each class of the fund is compared to those funds and classes in the Total Mapped Group (used by the Board for management fee comparisons) that have a similar sales load structure.
The Board noted that the total expense ratio of the retail class ranked below the competitive median for 2016 and the total expense ratio of each of Class A, Class M (formerly Class T), Class C, and Class I ranked above the competitive median for 2016. The Board considered that, in general, various factors can affect total expense ratios. The Board noted that the total expense ratio of each of Class A, Class M, Class C, and Class I was above the competitive median because of a positive performance fee adjustment in 2016 and relatively higher other expenses due to low asset levels. The Board noted that the total expense ratio of Class M was also above the competitive median because of higher 12b-1 fees on Class M as compared to most competitor funds. Class M has a higher 12b-1 fee, but a lower front-end sales charge, than traditionally priced front-end sales charge classes. The Board considered that Class M is primarily sold load-waived in the retirement plan market where its 0.50% 12b-1 fee is comparable to competing no-load, higher 12b-1 fee classes designed specifically for retirement plans. The Board noted that the total expense ratio of Class C was also above the competitive median because of its 12b-1 fees. The Board also noted that, although Class I is categorized by Lipper as an institutional class, Class I has a significantly lower investment minimum than most other funds and classes categorized as institutional. As a result, FMR believes Class I is generally more comparable to retail funds and classes. The Board noted that the fund offers multiple classes, each of which has a different sales load and 12b-1 fee structure, and that the multiple structures are intended to offer a range of pricing options for the intermediary market. The Board also noted that the total expense ratios of the classes vary primarily by the level of their 12b-1 fees, although differences in transfer agent fees may also cause expenses to vary from class to class.
Fees Charged to Other Fidelity Clients. The Board also considered Fidelity fee structures and other information with respect to clients of Fidelity, such as other funds advised or subadvised by Fidelity, pension plan clients, and other institutional clients with similar mandates. The Board noted that an ad hoc joint committee created by it and the boards of other Fidelity funds periodically (most recently in 2013) reviews and compares Fidelity's institutional investment advisory business with its business of providing services to the Fidelity funds, including the differences in services provided, fees charged, and costs incurred, as well as competition in their respective marketplaces.
Based on its review of total expense ratios and fees charged to other Fidelity clients, the Board concluded that, although some classes were above the median of the universe presented for comparison, the total expense ratio of each class of the fund was reasonable in light of the services that the fund and its shareholders receive and the other factors considered.
Costs of the Services and Profitability. The Board considered the revenues earned and the expenses incurred by Fidelity in conducting the business of developing, marketing, distributing, managing, administering and servicing the fund and servicing the fund's shareholders. The Board also considered the level of Fidelity's profits in respect of all the Fidelity funds.
On an annual basis, Fidelity presents to the Board information about the profitability of its relationships with the fund. Fidelity calculates profitability information for each fund, as well as aggregate profitability information for groups of Fidelity funds and all Fidelity funds, using a series of detailed revenue and cost allocation methodologies which originate with the books and records of Fidelity on which Fidelity's audited financial statements are based. The Audit Committee of the Board reviews any significant changes from the prior year's methodologies.
PricewaterhouseCoopers LLP (PwC), independent registered public accounting firm and auditor to Fidelity and certain Fidelity funds, has been engaged annually by the Board as part of the Board's assessment of Fidelity's profitability analysis. PwC's engagement includes the review and assessment of the methodologies used by Fidelity in determining the revenues and expenses attributable to Fidelity's mutual fund business, and completion of agreed-upon procedures in respect of the mathematical accuracy of the fund profitability information and its conformity to established allocation methodologies. After considering PwC's reports issued under the engagement and information provided by Fidelity, the Board concluded that while other allocation methods may also be reasonable, Fidelity's profitability methodologies are reasonable in all material respects.
The Board also reviewed Fidelity's non-fund businesses and potential fall-out benefits related to the mutual fund business as well as cases where Fidelity's affiliates may benefit from or be related to the fund's business.
The Board considered the costs of the services provided by and the profits realized by Fidelity in connection with the operation of the fund and was satisfied that the profitability was not excessive.
Economies of Scale. The Board considered whether there have been economies of scale in respect of the management of the Fidelity funds, whether the Fidelity funds (including the fund) have appropriately benefited from any such economies of scale, and whether there is potential for realization of any further economies of scale. The Board considered the extent to which the fund will benefit from economies of scale as assets grow through increased services to the fund, through waivers or reimbursements, or through fee or expense ratio reductions. The Board also noted that a committee (the Economies of Scale Committee) created by it and the boards of other Fidelity funds periodically (most recently in 2013) analyzes whether Fidelity attains economies of scale in respect of the management and servicing of the Fidelity funds, whether the Fidelity funds have appropriately benefited from such economies of scale, and whether there is potential for realization of any further economies of scale.
The Board recognized that the fund's management contract incorporates a "group fee" structure, which provides for lower group fee rates as total group assets increase, and for higher group fee rates as total group assets decrease (with "group assets" defined to include fund assets under FMR's management plus the assets of sector funds previously under FMR's management). FMR calculates the group fee rates based on a tiered asset "breakpoint" schedule that varies based on asset class. The Board considered that the group fee is designed to deliver the benefits of economies of scale to fund shareholders when total Fidelity fund assets increase, even if assets of any particular fund are unchanged or have declined, because some portion of Fidelity's costs are attributable to services provided to all Fidelity funds, and all funds benefit if those costs can be allocated among more assets. The Board concluded that, given the group fee structure, fund shareholders will benefit from lower management fees as group assets increase at the fund complex level, regardless of whether Fidelity achieves any such economies of scale.
The Board concluded, taking into account the analysis of the Economies of Scale Committee, that economies of scale, if any, are being appropriately shared between fund shareholders and Fidelity.
Additional Information Requested by the Board. In order to develop fully the factual basis for consideration of the Fidelity funds' advisory contracts, the Board requested and received additional information on certain topics, including: (i) fund performance trends, in particular the underperformance of certain funds, and Fidelity's long-term strategies for certain funds; (ii) Fidelity's fund profitability methodology, profitability trends for certain funds, and the impact of certain factors on fund profitability results, including the impact of market trends on actively managed funds; (iii) the use of performance fees and the calculation of performance adjustments, including the impact of underperformance and fund outflows on performance adjustments; (iv) metrics for evaluating index fund performance; (v) Fidelity's group fee structure, including the group fee breakpoint schedules; (vi) the terms of Fidelity's contractual and voluntary expense cap arrangements with the funds; (vii) the methodology with respect to evaluating competitive fund data and peer group classifications and fee comparisons; (viii) the expense structures for different funds and classes; (ix) Fidelity's arrangements with affiliated sub-advisers on behalf of the funds; (x) information regarding other accounts managed by Fidelity, including institutional accounts and collective investment trusts; (xi) recent changes to the fee structure for certain funds of funds; and (xii) the impact of the Department of Labor's new fiduciary rule on the funds' comparative expense information.
Based on its evaluation of all of the conclusions noted above, and after considering all factors it believed relevant, the Board concluded that the advisory fee structures are fair and reasonable, and that the fund's Advisory Contracts should be renewed.
AFIV-ANN-1217
1.827497.111
Fidelity® Series Canada Fund
Annual Report October 31, 2017 |
|
Contents
To view a fund's proxy voting guidelines and proxy voting record for the 12-month period ended June 30, visit http://www.fidelity.com/proxyvotingresults or visit the Securities and Exchange Commission's (SEC) web site at http://www.sec.gov.
You may also call 1-800-544-8544 to request a free copy of the proxy voting guidelines.
Standard & Poor's, S&P and S&P 500 are registered service marks of The McGraw-Hill Companies, Inc. and have been licensed for use by Fidelity Distributors Corporation.
Other third-party marks appearing herein are the property of their respective owners.
All other marks appearing herein are registered or unregistered trademarks or service marks of FMR LLC or an affiliated company. © 2017 FMR LLC. All rights reserved.
This report and the financial statements contained herein are submitted for the general information of the shareholders of the Fund. This report is not authorized for distribution to prospective investors in the Fund unless preceded or accompanied by an effective prospectus.
A fund files its complete schedule of portfolio holdings with the SEC for the first and third quarters of each fiscal year on Form N-Q. Forms N-Q are available on the SEC’s web site at http://www.sec.gov. A fund's Forms N-Q may be reviewed and copied at the SEC’s Public Reference Room in Washington, DC. Information regarding the operation of the SEC's Public Reference Room may be obtained by calling 1-800-SEC-0330.
For a complete list of a fund's portfolio holdings, view the most recent holdings listing, semiannual report, or annual report on Fidelity's web site at http://www.fidelity.com, http://www.institutional.fidelity.com, or http://www.401k.com, as applicable.
NOT FDIC INSURED •MAY LOSE VALUE •NO BANK GUARANTEE
Neither the Fund nor Fidelity Distributors Corporation is a bank.
Investment Summary (Unaudited)
Geographic Diversification (% of fund's net assets)
| As of October 31, 2017 |
| | Canada | 97.1% |
| | United States of America* | 2.9% |

* Includes Short-Term investments and Net Other Assets (Liabilities).
Percentages are based on country or territory of incorporation and are adjusted for the effect of futures contracts, if applicable.
Asset Allocation as of October 31, 2017
| | % of fund's net assets |
| Stocks | 97.1 |
| Short-Term Investments and Net Other Assets (Liabilities) | 2.9 |
Top Ten Stocks as of October 31, 2017
| | % of fund's net assets |
| The Toronto-Dominion Bank (Banks) | 10.1 |
| Suncor Energy, Inc. (Oil, Gas & Consumable Fuels) | 6.8 |
| Royal Bank of Canada (Banks) | 5.1 |
| Bank of Nova Scotia (Banks) | 5.0 |
| Manulife Financial Corp. (Insurance) | 4.9 |
| National Bank of Canada (Banks) | 4.0 |
| Canadian Pacific Railway Ltd. (Road & Rail) | 3.9 |
| Enbridge, Inc. (Oil, Gas & Consumable Fuels) | 3.7 |
| Canadian National Railway Co. (Road & Rail) | 3.5 |
| Agrium, Inc. (Chemicals) | 3.4 |
| | 50.4 |
Top Market Sectors as of October 31, 2017
| | % of fund's net assets |
| Financials | 38.9 |
| Energy | 19.5 |
| Materials | 11.0 |
| Industrials | 8.9 |
| Consumer Staples | 6.3 |
| Information Technology | 4.8 |
| Telecommunication Services | 3.7 |
| Consumer Discretionary | 2.5 |
| Utilities | 0.8 |
| Real Estate | 0.7 |
Market Sectors may include more than one industry category.
The Fund may invest up to 35% of its total assets in any industry that represents more than 20% of the Canadian market. As of October 31, 2017, 26.1% of the Fund’s total assets were invested in the Diversified Banks industry, which accounts for more than 20% of the Canadian market.
Investments October 31, 2017
Showing Percentage of Net Assets
| Common Stocks - 97.1% | | | |
| | | Shares | Value |
| CONSUMER DISCRETIONARY - 2.5% | | | |
| Hotels, Restaurants & Leisure - 0.2% | | | |
| Cara Operations Ltd. | | 118,300 | $2,421,753 |
| Leisure Products - 0.4% | | | |
| BRP, Inc. | | 181,300 | 6,093,456 |
| Media - 1.4% | | | |
| Cogeco Communications, Inc. | | 121,000 | 8,699,132 |
| Corus Entertainment, Inc. Class B (non-vtg.) | | 274,100 | 2,543,196 |
| Quebecor, Inc. Class B (sub. vtg.) | | 229,700 | 8,667,387 |
| | | | 19,909,715 |
| Specialty Retail - 0.3% | | | |
| Sleep Country Canada Holdings, Inc. | | 165,600 | 4,912,419 |
| Textiles, Apparel & Luxury Goods - 0.2% | | | |
| ERO Copper Corp. | | 922,400 | 3,660,715 |
|
| TOTAL CONSUMER DISCRETIONARY | | | 36,998,058 |
|
| CONSUMER STAPLES - 6.3% | | | |
| Food & Staples Retailing - 6.3% | | | |
| Alimentation Couche-Tard, Inc. Class B (sub. vtg.) | | 968,400 | 45,406,182 |
| George Weston Ltd. | | 421,200 | 35,364,998 |
| North West Co., Inc. | | 470,800 | 11,488,089 |
| | | | 92,259,269 |
| ENERGY - 19.5% | | | |
| Energy Equipment & Services - 0.8% | | | |
| Canadian Energy Services & Technology Corp. | | 1,734,500 | 9,344,062 |
| ShawCor Ltd. Class A | | 148,647 | 3,221,588 |
| | | | 12,565,650 |
| Oil, Gas & Consumable Fuels - 18.7% | | | |
| ARC Resources Ltd. | | 797,200 | 9,720,143 |
| Canadian Natural Resources Ltd. | | 1,342,200 | 46,838,109 |
| Cenovus Energy, Inc. | | 2,015,800 | 19,562,682 |
| Enbridge, Inc. | | 1,433,500 | 55,091,024 |
| NuVista Energy Ltd. (a) | | 985,100 | 6,123,945 |
| Peyto Exploration & Development Corp. | | 652,000 | 8,894,814 |
| PrairieSky Royalty Ltd. | | 1,128,200 | 30,030,531 |
| Suncor Energy, Inc. | | 2,941,400 | 99,863,049 |
| | | | 276,124,297 |
|
| TOTAL ENERGY | | | 288,689,947 |
|
| FINANCIALS - 38.9% | | | |
| Banks - 26.1% | | | |
| Bank of Montreal | | 371,800 | 28,482,284 |
| Bank of Nova Scotia | | 1,147,600 | 74,081,178 |
| National Bank of Canada | | 1,208,600 | 58,654,714 |
| Royal Bank of Canada | | 951,200 | 74,372,176 |
| The Toronto-Dominion Bank | | 2,626,900 | 149,334,817 |
| | | | 384,925,169 |
| Capital Markets - 3.5% | | | |
| Brookfield Asset Management, Inc. Class A | | 593,100 | 24,880,685 |
| CI Financial Corp. | | 826,200 | 18,367,116 |
| Gluskin Sheff + Associates, Inc. | | 120,400 | 1,506,283 |
| TMX Group Ltd. | | 131,400 | 7,179,588 |
| | | | 51,933,672 |
| Insurance - 9.3% | | | |
| Intact Financial Corp. | | 316,700 | 25,886,377 |
| Manulife Financial Corp. | | 3,630,800 | 73,004,381 |
| Power Corp. of Canada (sub. vtg.) | | 1,532,900 | 39,305,738 |
| | | | 138,196,496 |
|
| TOTAL FINANCIALS | | | 575,055,337 |
|
| INDUSTRIALS - 8.9% | | | |
| Professional Services - 0.6% | | | |
| Stantec, Inc. | | 309,400 | 8,840,000 |
| Road & Rail - 7.9% | | | |
| Canadian National Railway Co. | | 632,000 | 50,854,910 |
| Canadian Pacific Railway Ltd. | | 332,500 | 57,649,485 |
| TransForce, Inc. | | 311,400 | 7,516,468 |
| | | | 116,020,863 |
| Trading Companies & Distributors - 0.4% | | | |
| Toromont Industries Ltd. | | 131,600 | 5,801,172 |
|
| TOTAL INDUSTRIALS | | | 130,662,035 |
|
| INFORMATION TECHNOLOGY - 4.8% | | | |
| IT Services - 1.9% | | | |
| CGI Group, Inc. Class A (sub. vtg.) (a) | | 532,900 | 28,315,863 |
| Software - 2.9% | | | |
| Constellation Software, Inc. | | 38,800 | 22,074,586 |
| Open Text Corp. | | 585,200 | 20,462,268 |
| | | | 42,536,854 |
|
| TOTAL INFORMATION TECHNOLOGY | | | 70,852,717 |
|
| MATERIALS - 11.0% | | | |
| Chemicals - 3.7% | | | |
| Agrium, Inc. | | 453,700 | 49,393,198 |
| Methanex Corp. | | 87,900 | 4,283,601 |
| | | | 53,676,799 |
| Containers & Packaging - 1.1% | | | |
| CCL Industries, Inc. Class B | | 341,100 | 16,440,274 |
| Metals & Mining - 5.5% | | | |
| Agnico Eagle Mines Ltd. (Canada) | | 374,900 | 16,738,423 |
| Barrick Gold Corp. | | 556,400 | 8,039,141 |
| Franco-Nevada Corp. | | 339,500 | 26,978,947 |
| Lundin Mining Corp. | | 1,443,700 | 11,011,556 |
| Premier Gold Mines Ltd. (a) | | 1,149,800 | 3,056,983 |
| Wheaton Precious Metals Corp. | | 756,300 | 15,693,474 |
| | | | 81,518,524 |
| Paper & Forest Products - 0.7% | | | |
| Western Forest Products, Inc. | | 5,189,000 | 10,538,082 |
|
| TOTAL MATERIALS | | | 162,173,679 |
|
| REAL ESTATE - 0.7% | | | |
| Equity Real Estate Investment Trusts (REITs) - 0.7% | | | |
| Allied Properties (REIT) | | 323,900 | 10,379,061 |
| TELECOMMUNICATION SERVICES - 3.7% | | | |
| Diversified Telecommunication Services - 1.4% | | | |
| TELUS Corp. | | 586,100 | 21,225,170 |
| Wireless Telecommunication Services - 2.3% | | | |
| Rogers Communications, Inc. Class B (non-vtg.) | | 651,200 | 33,789,108 |
|
| TOTAL TELECOMMUNICATION SERVICES | | | 55,014,278 |
|
| UTILITIES - 0.8% | | | |
| Electric Utilities - 0.8% | | | |
| Hydro One Ltd. | | 657,600 | 11,626,894 |
| TOTAL COMMON STOCKS | | | |
| (Cost $1,391,524,683) | | | 1,433,711,275 |
|
| Money Market Funds - 2.6% | | | |
| Fidelity Cash Central Fund, 1.10% (b) | | | |
| (Cost $39,085,637) | | 39,077,822 | 39,085,637 |
| TOTAL INVESTMENT IN SECURITIES - 99.7% | | | |
| (Cost $1,430,610,320) | | | 1,472,796,912 |
| NET OTHER ASSETS (LIABILITIES) - 0.3% | | | 4,170,298 |
| NET ASSETS - 100% | | | $1,476,967,210 |
Legend
(a) Non-income producing
(b) Affiliated fund that is generally available only to investment companies and other accounts managed by Fidelity Investments. The rate quoted is the annualized seven-day yield of the fund at period end. A complete unaudited listing of the fund's holdings as of its most recent quarter end is available upon request. In addition, each Fidelity Central Fund's financial statements, which are not covered by the Fund's Report of Independent Registered Public Accounting Firm, are available on the SEC's website or upon request.
Affiliated Central Funds
Information regarding fiscal year to date income earned by the Fund from investments in Fidelity Central Funds is as follows:
| Fund | Income earned |
| Fidelity Cash Central Fund | $96,582 |
| Total | $96,582 |
Investment Valuation
All investments are categorized as Level 1 under the Fair Value Hierarchy. The inputs or methodology used for valuing securities may not be an indication of the risk associated with investing in those securities. For more information on valuation inputs please refer to the Investment Valuation section in the accompanying Notes to Financial Statements.
See accompanying notes which are an integral part of the financial statements.
Financial Statements
Statement of Assets and Liabilities
| | | October 31, 2017 |
| Assets | | |
Investment in securities, at value — See accompanying schedule:
Unaffiliated issuers (cost $1,391,524,683) | $1,433,711,275 | |
| Fidelity Central Funds (cost $39,085,637) | 39,085,637 | |
| Total Investment in Securities (cost $1,430,610,320) | | $1,472,796,912 |
| Foreign currency held at value (cost $1,060,299) | | 1,060,299 |
| Receivable for fund shares sold | | 2,593,983 |
| Dividends receivable | | 1,388,867 |
| Distributions receivable from Fidelity Central Funds | | 36,061 |
| Total assets | | 1,477,876,122 |
| Liabilities | | |
| Payable for investments purchased | $726,294 | |
| Payable for fund shares redeemed | 178,242 | |
| Other payables and accrued expenses | 4,376 | |
| Total liabilities | | 908,912 |
| Net Assets | | $1,476,967,210 |
| Net Assets consist of: | | |
| Paid in capital | | $1,430,588,368 |
| Undistributed net investment income | | 6,106,214 |
| Accumulated undistributed net realized gain (loss) on investments and foreign currency transactions | | (1,889,438) |
| Net unrealized appreciation (depreciation) on investments and assets and liabilities in foreign currencies | | 42,162,066 |
| Net Assets, for 138,611,784 shares outstanding | | $1,476,967,210 |
| Net Asset Value, offering price and redemption price per share ($1,476,967,210 ÷ 138,611,784 shares) | | $10.66 |
See accompanying notes which are an integral part of the financial statements.
Statement of Operations
| | | For the period
August 15, 2017 (commencement of operations) to
October 31, 2017 |
| Investment Income | | |
| Dividends | | $7,069,576 |
| Income from Fidelity Central Funds | | 96,582 |
| Income before foreign taxes withheld | | 7,166,158 |
| Less foreign taxes withheld | | (1,055,194) |
| Total income | | 6,110,964 |
| Expenses | | |
| Custodian fees and expenses | $4,378 | |
| Independent trustees' fees and expenses | 372 | |
| Total expenses | | 4,750 |
| Net investment income (loss) | | 6,106,214 |
| Realized and Unrealized Gain (Loss) | | |
| Net realized gain (loss) on: | | |
| Investment securities: | | |
| Unaffiliated issuers | (1,004,457) | |
| Foreign currency transactions | (883,903) | |
| Futures contracts | (1,078) | |
| Total net realized gain (loss) | | (1,889,438) |
| Change in net unrealized appreciation (depreciation) on: | | |
| Investment securities: | | |
| Unaffiliated issuers | 42,186,592 | |
| Assets and liabilities in foreign currencies | (24,526) | |
| Total change in net unrealized appreciation (depreciation) | | 42,162,066 |
| Net gain (loss) | | 40,272,628 |
| Net increase (decrease) in net assets resulting from operations | | $46,378,842 |
See accompanying notes which are an integral part of the financial statements.
Statement of Changes in Net Assets
| | For the period
August 15, 2017 (commencement of operations) to
October 31, 2017 |
| Increase (Decrease) in Net Assets | |
| Operations | |
| Net investment income (loss) | $6,106,214 |
| Net realized gain (loss) | (1,889,438) |
| Change in net unrealized appreciation (depreciation) | 42,162,066 |
| Net increase (decrease) in net assets resulting from operations | 46,378,842 |
| Share transactions | |
| Proceeds from sales of shares | 1,473,942,687 |
| Cost of shares redeemed | (43,354,319) |
| Net increase (decrease) in net assets resulting from share transactions | 1,430,588,368 |
| Total increase (decrease) in net assets | 1,476,967,210 |
| Net Assets | |
| Beginning of period | – |
| End of period | $1,476,967,210 |
| Other Information | |
| Undistributed net investment income end of period | $6,106,214 |
| Shares | |
| Sold | 142,690,282 |
| Redeemed | (4,078,498) |
| Net increase (decrease) | 138,611,784 |
See accompanying notes which are an integral part of the financial statements.
Financial Highlights
Fidelity Series Canada Fund
| Years ended October 31, | 2017 A |
| Selected Per–Share Data | |
| Net asset value, beginning of period | $10.00 |
| Income from Investment Operations | |
| Net investment income (loss)B | .06 |
| Net realized and unrealized gain (loss) | .60 |
| Total from investment operations | .66 |
| Net asset value, end of period | $10.66 |
| Total ReturnC | 6.60% |
| Ratios to Average Net AssetsD,E | |
| Expenses before reductions | - %F,G |
| Expenses net of fee waivers, if any | - %F,G |
| Expenses net of all reductions | - %F,G |
| Net investment income (loss) | 2.62%F |
| Supplemental Data | |
| Net assets, end of period (000 omitted) | $1,476,967 |
| Portfolio turnover rateH | 3%I |
A For the period August 15, 2017 (commencement of operations) to October 31, 2017.
B Calculated based on average shares outstanding during the period.
C Total returns for periods of less than one year are not annualized.
D Fees and expenses of any underlying Fidelity Central Funds are not included in the Fund's expense ratio. The Fund indirectly bears its proportionate share of the expenses of any underlying Fidelity Central Funds.
E Expense ratios reflect operating expenses of the Fund. Expenses before reductions do not reflect amounts reimbursed by the investment adviser or reductions from expense offset arrangements and do not represent the amount paid by the Fund during periods when reimbursements or reductions occur. Expense ratios before reductions for start-up periods may not be representative of longer term operating periods. Expenses net of fee waivers reflect expenses after reimbursement by the investment adviser but prior to reductions from expense offset arrangements. Expenses net of all reductions represent the net expenses paid by the Fund.
F Annualized
G Amount represents less than .005%.
H Amount does not include the portfolio activity of any underlying Fidelity Central Funds.
I Amount not annualized.
See accompanying notes which are an integral part of the financial statements.
Notes to Financial Statements
For the period ended October 31, 2017
1. Organization.
Fidelity Series Canada Fund (the Fund) is a fund of Fidelity Investment Trust (the Trust) and is authorized to issue an unlimited number of shares. Shares of the Fund are only available for purchase by mutual funds for which Fidelity Management & Research Company (FMR) or an affiliate serves as an investment manager. The Trust is registered under the Investment Company Act of 1940, as amended (the 1940 Act), as an open-end management investment company organized as a Massachusetts business trust.
2. Investments in Fidelity Central Funds.
The Fund invests in Fidelity Central Funds, which are open-end investment companies generally available only to other investment companies and accounts managed by the investment adviser and its affiliates. The Fund's Schedule of Investments lists each of the Fidelity Central Funds held as of period end, if any, as an investment of the Fund, but does not include the underlying holdings of each Fidelity Central Fund. As an Investing Fund, the Fund indirectly bears its proportionate share of the expenses of the underlying Fidelity Central Funds.
The Money Market Central Funds seek preservation of capital and current income and are managed by Fidelity Investments Money Management, Inc. (FIMM), an affiliate of the investment adviser. Annualized expenses of the Money Market Central Funds as of their most recent shareholder report date are less than .005%.
A complete unaudited list of holdings for each Fidelity Central Fund is available upon request or at the Securities and Exchange Commission (the SEC) website at www.sec.gov. In addition, the financial statements of the Fidelity Central Funds, which are not covered by the Fund's Report of Independent Registered Public Accounting Firm, are available on the SEC website or upon request.
3. Significant Accounting Policies.
The Fund is an investment company and applies the accounting and reporting guidance of the Financial Accounting Standards Board (FASB) Accounting Standards Codification Topic 946 Financial Services – Investments Companies. The financial statements have been prepared in conformity with accounting principles generally accepted in the United States of America (GAAP), which require management to make certain estimates and assumptions at the date of the financial statements. Actual results could differ from those estimates. Subsequent events, if any, through the date that the financial statements were issued have been evaluated in the preparation of the financial statements. The following summarizes the significant accounting policies of the Fund:
Investment Valuation. Investments are valued as of 4:00 p.m. Eastern time on the last calendar day of the period. The Board of Trustees (the Board) has delegated the day to day responsibility for the valuation of the Fund's investments to the Fair Value Committee (the Committee) established by the Fund's investment adviser. In accordance with valuation policies and procedures approved by the Board, the Fund attempts to obtain prices from one or more third party pricing vendors or brokers to value its investments. When current market prices, quotations or currency exchange rates are not readily available or reliable, investments will be fair valued in good faith by the Committee, in accordance with procedures adopted by the Board. Factors used in determining fair value vary by investment type and may include market or investment specific events. The frequency with which these procedures are used cannot be predicted and they may be utilized to a significant extent. The Committee oversees the Fund's valuation policies and procedures and reports to the Board on the Committee's activities and fair value determinations. The Board monitors the appropriateness of the procedures used in valuing the Fund's investments and ratifies the fair value determinations of the Committee.
The Fund categorizes the inputs to valuation techniques used to value its investments into a disclosure hierarchy consisting of three levels as shown below:
- Level 1 – quoted prices in active markets for identical investments
- Level 2 – other significant observable inputs (including quoted prices for similar investments, interest rates, prepayment speeds, etc.)
- Level 3 – unobservable inputs (including the Fund's own assumptions based on the best information available)
Valuation techniques used to value the Fund's investments by major category are as follows:
Equity securities, including restricted securities, for which market quotations are readily available, are valued at the last reported sale price or official closing price as reported by a third party pricing vendor on the primary market or exchange on which they are traded and are categorized as Level 1 in the hierarchy. In the event there were no sales during the day or closing prices are not available, securities are valued at the last quoted bid price or may be valued using the last available price and are generally categorized as Level 2 in the hierarchy. For foreign equity securities, when market or security specific events arise, comparisons to the valuation of American Depositary Receipts (ADRs), futures contracts, Exchange-Traded Funds (ETFs) and certain indexes as well as quoted prices for similar securities may be used and would be categorized as Level 2 in the hierarchy. Utilizing these techniques may result in transfers between Level 1 and Level 2. For equity securities, including restricted securities, where observable inputs are limited, assumptions about market activity and risk are used and these securities may be categorized as Level 3 in the hierarchy.
Investments in open-end mutual funds, including the Fidelity Central Funds, are valued at their closing net asset value (NAV) each business day and are categorized as Level 1 in the hierarchy.
Changes in valuation techniques may result in transfers in or out of an assigned level within the disclosure hierarchy.
Foreign Currency. The Fund may use foreign currency contracts to facilitate transactions in foreign-denominated securities. Gains and losses from these transactions may arise from changes in the value of the foreign currency or if the counterparties do not perform under the contracts' terms.
Foreign-denominated assets, including investment securities, and liabilities are translated into U.S. dollars at the exchange rates at period end. Purchases and sales of investment securities, income and dividends received and expenses denominated in foreign currencies are translated into U.S. dollars at the exchange rate in effect on the transaction date.
The effects of exchange rate fluctuations on investments are included with the net realized and unrealized gain (loss) on investment securities. Other foreign currency transactions resulting in realized and unrealized gain (loss) are disclosed separately.
Investment Transactions and Income. For financial reporting purposes, the Fund's investment holdings and NAV include trades executed through the end of the last business day of the period. The NAV per share for processing shareholder transactions is calculated as of the close of business of the New York Stock Exchange (NYSE), normally 4:00 p.m. Eastern time and includes trades executed through the end of the prior business day. Gains and losses on securities sold are determined on the basis of identified cost. Dividend income is recorded on the ex-dividend date, except for certain dividends from foreign securities where the ex-dividend date may have passed, which are recorded as soon as the Fund is informed of the ex-dividend date. Non-cash dividends included in dividend income, if any, are recorded at the fair market value of the securities received. Income and capital gain distributions from Fidelity Central Funds, if any, are recorded on the ex-dividend date. Investment income is recorded net of foreign taxes withheld where recovery of such taxes is uncertain.
Expenses. Expenses directly attributable to a fund are charged to that fund. Expenses attributable to more than one fund are allocated among the respective funds on the basis of relative net assets or other appropriate methods. Expense estimates are accrued in the period to which they relate and adjustments are made when actual amounts are known.
Income Tax Information and Distributions to Shareholders. Each year, the Fund intends to qualify as a regulated investment company under Subchapter M of the Internal Revenue Code, including distributing substantially all of its taxable income and realized gains. As a result, no provision for U.S. Federal income taxes is required. As of October 31, 2017, the Fund did not have any unrecognized tax benefits in the financial statements; nor is the Fund aware of any tax positions for which it is reasonably possible that the total amounts of unrecognized tax benefits will significantly change in the next twelve months. The Fund files a U.S. federal tax return, in addition to state and local tax returns as required. The Fund's federal income tax returns are subject to examination by the Internal Revenue Service (IRS) for a period of three fiscal years after they are filed. State and local tax returns may be subject to examination for an additional fiscal year depending on the jurisdiction. Foreign taxes are provided for based on the Fund's understanding of the tax rules and rates that exist in the foreign markets in which it invests.
Distributions are declared and recorded on the ex-dividend date. Income and capital gain distributions are determined in accordance with income tax regulations, which may differ from GAAP.
Capital accounts within the financial statements are adjusted for permanent book-tax differences. These adjustments have no impact on net assets or the results of operations. Capital accounts are not adjusted for temporary book-tax differences which will reverse in a subsequent period.
Book-tax differences are primarily due to foreign currency transactions, passive foreign investment companies (PFIC), capital loss carryforwards and losses deferred due to wash sales.
As of period end, the cost and unrealized appreciation (depreciation) in securities, and derivatives if applicable, for federal income tax purposes were as follows:
| Gross unrealized appreciation | $56,796,351 |
| Gross unrealized depreciation | (18,748,999) |
| Net unrealized appreciation (depreciation) | $38,047,352 |
| Tax Cost | $1,434,749,560 |
The tax-based components of distributable earnings as of period end were as follows:
| Undistributed ordinary income | $8,744,026 |
| Capital loss carryforward | $(388,009) |
| Net unrealized appreciation (depreciation) on securities and other investments | $38,022,826 |
Capital loss carryforwards are only available to offset future capital gains of the Fund to the extent provided by regulations and may be limited. Under the Regulated Investment Company Modernization Act of 2010 (the Act), the Fund is permitted to carry forward capital losses incurred in taxable years beginning after December 22, 2010 for an unlimited period and such capital losses are required to be used prior to any losses that expire. The capital loss carryforward information presented below, including any applicable limitation, is estimated as of fiscal period end and is subject to adjustment.
| No expiration | |
| Short-term | $(387,362) |
| Long Term | (647) |
| Total capital loss carryforward | $(388,009) |
4. Derivative Instruments.
Risk Exposures and the Use of Derivative Instruments. The Fund's investment objective allows the Fund to enter into various types of derivative contracts, including futures contracts. Derivatives are investments whose value is primarily derived from underlying assets, indices or reference rates and may be transacted on an exchange or over-the-counter (OTC). Derivatives may involve a future commitment to buy or sell a specified asset based on specified terms, to exchange future cash flows at periodic intervals based on a notional principal amount, or for one party to make one or more payments upon the occurrence of specified events in exchange for periodic payments from the other party.
The Fund used derivatives to increase returns and to manage exposure to certain risks as defined below. The success of any strategy involving derivatives depends on analysis of numerous economic factors, and if the strategies for investment do not work as intended, the Fund may not achieve its objectives.
The Fund's use of derivatives increased or decreased its exposure to the following risk:
| Equity Risk | Equity risk relates to the fluctuations in the value of financial instruments as a result of changes in market prices (other than those arising from interest rate risk or foreign exchange risk), whether caused by factors specific to an individual investment, its issuer, or all factors affecting all instruments traded in a market or market segment. |
The Fund is also exposed to additional risks from investing in derivatives, such as liquidity risk and counterparty credit risk. Liquidity risk is the risk that the Fund will be unable to close out the derivative in the open market in a timely manner. Counterparty credit risk is the risk that the counterparty will not be able to fulfill its obligation to the Fund. Counterparty credit risk related to exchange-traded futures contracts may be mitigated by the protection provided by the exchange on which they trade.
Investing in derivatives may involve greater risks than investing in the underlying assets directly and, to varying degrees, may involve risk of loss in excess of any initial investment and collateral received and amounts recognized in the Statement of Assets and Liabilities. In addition, there may be the risk that the change in value of the derivative contract does not correspond to the change in value of the underlying instrument.
Futures Contracts. A futures contract is an agreement between two parties to buy or sell a specified underlying instrument for a fixed price at a specified future date. The Fund used futures contracts to manage its exposure to the stock market.
Upon entering into a futures contract, a fund is required to deposit either cash or securities (initial margin) with a clearing broker in an amount equal to a certain percentage of the face value of the contract. Futures contracts are marked-to-market daily and subsequent daily payments (variation margin) are made or received by a fund depending on the daily fluctuations in the value of the futures contracts and are recorded as unrealized appreciation or (depreciation). This receivable and/or payable, if any, is included in daily variation margin on futures contracts in the Statement of Assets and Liabilities. Realized gain or (loss) is recorded upon the expiration or closing of a futures contract. The net realized gain (loss) and change in net unrealized appreciation (depreciation) on futures contracts during the period is presented in the Statement of Operations.
Any open futures contracts at period end are presented in the Schedule of Investments under the caption "Futures Contracts". The notional amount at value reflects each contract's exposure to the underlying instrument or index at period end.
5. Purchases and Sales of Investments.
Purchases and sales of securities, other than short-term securities, aggregated $1,425,746,345 and $33,214,304, respectively.
6. Fees and Other Transactions with Affiliates.
Management Fee. Fidelity Management & Research Company (the investment adviser) and its affiliates provide the Fund with investment management related services for which the Fund does not pay a management fee. Under the management contract, the investment adviser or an affiliate pays all ordinary operating expenses of the Fund, except custody fees, fees and expenses of the independent Trustees, and certain miscellaneous expenses such as proxy and shareholder meeting expenses.
Interfund Trades. The Fund may purchase from or sell securities to other Fidelity Funds under procedures adopted by the Board. The procedures have been designed to ensure these interfund trades are executed in accordance with Rule 17a-7 of the 1940 Act. Interfund trades are included within the respective purchases and sales amounts shown in the Purchases and Sales of Investments note.
7. Other.
The Fund's organizational documents provide former and current trustees and officers with a limited indemnification against liabilities arising in connection with the performance of their duties to the Fund. In the normal course of business, the Fund may also enter into contracts that provide general indemnifications. The Fund's maximum exposure under these arrangements is unknown as this would be dependent on future claims that may be made against the Fund. The risk of material loss from such claims is considered remote.
At the end of the period, mutual funds managed by the investment adviser or its affiliates were the owners of record of all of the outstanding shares of the Fund.
Report of Independent Registered Public Accounting Firm
To the Trustees of Fidelity Investment Trust and Shareholders of Fidelity Series Canada Fund:
In our opinion, the accompanying statement of assets and liabilities, including the schedule of investments, and the related statements of operations and of changes in net assets and the financial highlights present fairly, in all material respects, the financial position of Fidelity Series Canada Fund (a fund of Fidelity Investment Trust) as of October 31, 2017, and the results of its operations, the changes in its net assets, and the financial highlights for the period August 15, 2017 (commencement of operations) to October 31, 2017, in conformity with accounting principles generally accepted in the United States of America. These financial statements and financial highlights (hereafter referred to as “financial statements”) are the responsibility of the Fidelity Series Canada Fund’s management. Our responsibility is to express an opinion on these financial statements based on our audit. We conducted our audit of these financial statements in accordance with the standards of the Public Company Accounting Oversight Board (United States). Those standards require that we plan and perform the audit to obtain reasonable assurance about whether the financial statements are free of material misstatement. An audit includes examining, on a test basis, evidence supporting the amounts and disclosures in the financial statements, assessing the accounting principles used and significant estimates made by management, and evaluating the overall financial statement presentation. Our procedures included confirmation of securities owned as of October 31, 2017 by correspondence with the custodians and brokers; when replies were not received from brokers, we performed other auditing procedures. We believe that our audit provides a reasonable basis for our opinion.
PricewaterhouseCoopers LLP
Boston, Massachusetts
December 19, 2017
Trustees and Officers
The Trustees, Members of the Advisory Board (if any), and officers of the Fidelity Investment Trust and fund, as applicable, are listed below. The Board of Trustees governs the fund and is responsible for protecting the interests of shareholders. The Trustees are experienced executives who meet periodically throughout the year to oversee the fund's activities, review contractual arrangements with companies that provide services to the fund, oversee management of the risks associated with such activities and contractual arrangements, and review the fund's performance. Except for Jonathan Chiel, each of the Trustees oversees 190 funds. Mr. Chiel oversees 143 funds.
The Trustees hold office without limit in time except that (a) any Trustee may resign; (b) any Trustee may be removed by written instrument, signed by at least two-thirds of the number of Trustees prior to such removal; (c) any Trustee who requests to be retired or who has become incapacitated by illness or injury may be retired by written instrument signed by a majority of the other Trustees; and (d) any Trustee may be removed at any special meeting of shareholders by a two-thirds vote of the outstanding voting securities of the trust. Each Trustee who is not an interested person (as defined in the 1940 Act) of the trust and the fund is referred to herein as an Independent Trustee. Each Independent Trustee shall retire not later than the last day of the calendar year in which his or her 75th birthday occurs. The Independent Trustees may waive this mandatory retirement age policy with respect to individual Trustees. Officers and Advisory Board Members hold office without limit in time, except that any officer or Advisory Board Member may resign or may be removed by a vote of a majority of the Trustees at any regular meeting or any special meeting of the Trustees. Except as indicated, each individual has held the office shown or other offices in the same company for the past five years.
The fund’s Statement of Additional Information (SAI) includes more information about the Trustees. To request a free copy, call Fidelity at 1-800-544-8544.
Experience, Skills, Attributes, and Qualifications of the Trustees. The Governance and Nominating Committee has adopted a statement of policy that describes the experience, qualifications, attributes, and skills that are necessary and desirable for potential Independent Trustee candidates (Statement of Policy). The Board believes that each Trustee satisfied at the time he or she was initially elected or appointed a Trustee, and continues to satisfy, the standards contemplated by the Statement of Policy. The Governance and Nominating Committee also engages professional search firms to help identify potential Independent Trustee candidates who have the experience, qualifications, attributes, and skills consistent with the Statement of Policy. From time to time, additional criteria based on the composition and skills of the current Independent Trustees, as well as experience or skills that may be appropriate in light of future changes to board composition, business conditions, and regulatory or other developments, have also been considered by the professional search firms and the Governance and Nominating Committee. In addition, the Board takes into account the Trustees' commitment and participation in Board and committee meetings, as well as their leadership of standing and ad hoc committees throughout their tenure.
In determining that a particular Trustee was and continues to be qualified to serve as a Trustee, the Board has considered a variety of criteria, none of which, in isolation, was controlling. The Board believes that, collectively, the Trustees have balanced and diverse experience, qualifications, attributes, and skills, which allow the Board to operate effectively in governing the fund and protecting the interests of shareholders. Information about the specific experience, skills, attributes, and qualifications of each Trustee, which in each case led to the Board's conclusion that the Trustee should serve (or continue to serve) as a trustee of the fund, is provided below.
Board Structure and Oversight Function. James C. Curvey is an interested person and currently serves as Chairman. The Trustees have determined that an interested Chairman is appropriate and benefits shareholders because an interested Chairman has a personal and professional stake in the quality and continuity of services provided to the fund. Independent Trustees exercise their informed business judgment to appoint an individual of their choosing to serve as Chairman, regardless of whether the Trustee happens to be independent or a member of management. The Independent Trustees have determined that they can act independently and effectively without having an Independent Trustee serve as Chairman and that a key structural component for assuring that they are in a position to do so is for the Independent Trustees to constitute a substantial majority for the Board. The Independent Trustees also regularly meet in executive session. Ned C. Lautenbach serves as Chairman of the Independent Trustees and as such (i) acts as a liaison between the Independent Trustees and management with respect to matters important to the Independent Trustees and (ii) with management prepares agendas for Board meetings.
Fidelity® funds are overseen by different Boards of Trustees. The fund's Board oversees Fidelity's high income and certain equity funds, and other Boards oversee Fidelity's investment-grade bond, money market, asset allocation, and sector funds. The asset allocation funds may invest in Fidelity® funds overseen by the fund's Board. The use of separate Boards, each with its own committee structure, allows the Trustees of each group of Fidelity® funds to focus on the unique issues of the funds they oversee, including common research, investment, and operational issues. On occasion, the separate Boards establish joint committees to address issues of overlapping consequences for the Fidelity® funds overseen by each Board.
The Trustees operate using a system of committees to facilitate the timely and efficient consideration of all matters of importance to the Trustees, the fund, and fund shareholders and to facilitate compliance with legal and regulatory requirements and oversight of the fund's activities and associated risks. The Board, acting through its committees, has charged FMR and its affiliates with (i) identifying events or circumstances the occurrence of which could have demonstrably adverse effects on the fund's business and/or reputation; (ii) implementing processes and controls to lessen the possibility that such events or circumstances occur or to mitigate the effects of such events or circumstances if they do occur; and (iii) creating and maintaining a system designed to evaluate continuously business and market conditions in order to facilitate the identification and implementation processes described in (i) and (ii) above. Because the day-to-day operations and activities of the fund are carried out by or through FMR, its affiliates, and other service providers, the fund's exposure to risks is mitigated but not eliminated by the processes overseen by the Trustees. While each of the Board's committees has responsibility for overseeing different aspects of the fund's activities, oversight is exercised primarily through the Operations, Audit, and Compliance Committees. In addition, the Independent Trustees have worked with FMR to enhance the Board's oversight of investment and financial risks, legal and regulatory risks, technology risks, and operational risks, including the development of additional risk reporting to the Board. For example, a working group comprised of Independent Trustees and FMR has worked and continues to work to review the Fidelity® funds' valuation-related activities, reporting and risk management. Appropriate personnel, including but not limited to the fund's Chief Compliance Officer (CCO), FMR's internal auditor, the independent accountants, the fund's Treasurer and portfolio management personnel, make periodic reports to the Board's committees, as appropriate, including an annual review of Fidelity's risk management program for the Fidelity® funds. The responsibilities of each standing committee, including their oversight responsibilities, are described further under "Standing Committees of the Trustees."
Interested Trustees*:
Correspondence intended for a Trustee who is an interested person may be sent to Fidelity Investments, 245 Summer Street, Boston, Massachusetts 02210.
Name, Year of Birth; Principal Occupations and Other Relevant Experience+
Jonathan Chiel (1957)
Year of Election or Appointment: 2016
Trustee
Mr. Chiel also serves as Trustee of other Fidelity® funds. Mr. Chiel is Executive Vice President and General Counsel for FMR LLC (diversified financial services company, 2012-present). Previously, Mr. Chiel served as general counsel (2004-2012) and senior vice president and deputy general counsel (2000-2004) for John Hancock Financial Services; a partner with Choate, Hall & Stewart (1996-2000) (law firm); and an Assistant United States Attorney for the United States Attorney’s Office of the District of Massachusetts (1986-95), including Chief of the Criminal Division (1993-1995). Mr. Chiel is a director on the boards of the Boston Bar Foundation and the Maimonides School.
James C. Curvey (1935)
Year of Election or Appointment: 2007
Trustee
Chairman of the Board of Trustees
Mr. Curvey also serves as Trustee of other Fidelity® funds. Mr. Curvey is a Director of Fidelity Research & Analysis Co. (investment adviser firm, 2009-present), and Vice Chairman (2007-present) and Director of FMR LLC (diversified financial services company). In addition, Mr. Curvey serves as an Overseer for the Boston Symphony Orchestra and a member of the board of Artis-Naples, Naples, Florida, and as a Trustee for Brewster Academy, Wolfeboro, New Hampshire. Previously, Mr. Curvey served as a Director of Fidelity Investments Money Management, Inc. (investment adviser firm, 2009-2014) and a Director of FMR and FMR Co., Inc. (investment adviser firms, 2007-2014).
Charles S. Morrison (1960)
Year of Election or Appointment: 2014
Trustee
Mr. Morrison also serves as Trustee of other funds. He serves as President of Fidelity Management & Research Company (FMR) (investment adviser firm, 2016-present), a Director of Fidelity Investments Money Management, Inc. (FIMM) (investment adviser firm, 2014-present), Director of Fidelity SelectCo, LLC (investment adviser firm, 2014-present), President, Asset Management (2014-present), and is an employee of Fidelity Investments. Previously, Mr. Morrison served as Vice President of Fidelity's Fixed Income and Asset Allocation Funds (2012-2014), President, Fixed Income (2011-2014), Vice President of Fidelity's Money Market Funds (2005-2009), President, Money Market Group Leader of FMR (investment adviser firm, 2009), and Senior Vice President, Money Market Group of FMR (2004-2009). Mr. Morrison also served as Vice President of Fidelity's Bond Funds (2002-2005), certain Balanced Funds (2002-2005), and certain Asset Allocation Funds (2002-2007), and as Senior Vice President (2002-2005) of Fidelity's Bond Division.
* Determined to be an “Interested Trustee” by virtue of, among other things, his or her affiliation with the trusts or various entities under common control with FMR.
+ The information includes the Trustee's principal occupation during the last five years and other information relating to the experience, attributes, and skills relevant to the Trustee's qualifications to serve as a Trustee, which led to the conclusion that the Trustee should serve as a Trustee for the fund.
Independent Trustees:
Correspondence intended for an Independent Trustee may be sent to Fidelity Investments, P.O. Box 55235, Boston, Massachusetts 02205-5235.
Name, Year of Birth; Principal Occupations and Other Relevant Experience+
Dennis J. Dirks (1948)
Year of Election or Appointment: 2005
Trustee
Mr. Dirks also serves as Trustee of other Fidelity® funds. Prior to his retirement in May 2003, Mr. Dirks was Chief Operating Officer and a member of the Board of The Depository Trust & Clearing Corporation (DTCC). He also served as President, Chief Operating Officer, and Board member of The Depository Trust Company (DTC) and President and Board member of the National Securities Clearing Corporation (NSCC). In addition, Mr. Dirks served as Chief Executive Officer and Board member of the Government Securities Clearing Corporation, Chief Executive Officer and Board member of the Mortgage-Backed Securities Clearing Corporation, as a Trustee and a member of the Finance Committee of Manhattan College (2005-2008), as a Trustee and a member of the Finance Committee of AHRC of Nassau County (2006-2008), as a member of the Independent Directors Council (IDC) Governing Council (2010-2015), and as a member of the Board of Directors for The Brookville Center for Children’s Services, Inc. (2009-2017). Mr. Dirks is a member of the Finance Committee (2016-present) and Board of Directors (2017-present) of the Asolo Repertory Theatre.
Alan J. Lacy (1953)
Year of Election or Appointment: 2008
Trustee
Mr. Lacy also serves as Trustee of other Fidelity® funds. Mr. Lacy serves as a Director of Bristol-Myers Squibb Company (global pharmaceuticals, 2008-present). He is a Trustee of the California Chapter of The Nature Conservancy (2015-present) and a Director of the Center for Advanced Study in the Behavioral Sciences at Stanford University (2015-present). In addition, Mr. Lacy served as Senior Adviser (2007-2014) of Oak Hill Capital Partners, L.P. (private equity) and also served as Chief Executive Officer (2005) and Vice Chairman (2005-2006) of Sears Holdings Corporation (retail) and Chief Executive Officer and Chairman of the Board of Sears, Roebuck and Co. (retail, 2000-2005). Previously, Mr. Lacy served as Chairman (2014-2017) and a member (2010-2017) of the Board of Directors of Dave & Buster’s Entertainment, Inc. (restaurant and entertainment complexes), as Chairman (2008-2011) and a member (2006-2015) of the Board of Trustees of the National Parks Conservation Association, and as a member of the Board of Directors for The Hillman Companies, Inc. (hardware wholesalers, 2010-2014), Earth Fare, Inc. (retail grocery, 2010-2014), and The Western Union Company (global money transfer, 2006-2011).
Ned C. Lautenbach (1944)
Year of Election or Appointment: 2000
Trustee
Chairman of the Independent Trustees
Mr. Lautenbach also serves as Trustee of other Fidelity® funds. Mr. Lautenbach currently serves as Vice Chair of the Board of Governors, State University System of Florida (2013-present) and is a member of the Council on Foreign Relations (1994-present). He is also a member and has most recently served as Chairman of the Board of Directors of Artis-Naples (2012-present). Previously, Mr. Lautenbach served as a member and then Lead Director of the Board of Directors of Eaton Corporation (diversified industrial, 1997-2016). He was also a Partner and Advisory Partner at Clayton, Dubilier & Rice, LLC (private equity investment, 1998-2010), as well as a Director of Sony Corporation (2006-2007). In addition, Mr. Lautenbach also had a 30-year career with IBM (technology company) during which time he served as Senior Vice President and a member of the Corporate Executive Committee (1968-1998).
Joseph Mauriello (1944)
Year of Election or Appointment: 2008
Trustee
Mr. Mauriello also serves as Trustee of other Fidelity® funds. Prior to his retirement in January 2006, Mr. Mauriello served in numerous senior management positions including Deputy Chairman and Chief Operating Officer (2004-2005), and Vice Chairman of Financial Services (2002-2004) of KPMG LLP US (professional services, 1965-2005). Mr. Mauriello currently serves as a member of the Board of Directors of XL Group plc. (global insurance and re-insurance, 2006-present) and the Independent Directors Council (IDC) Governing Council (2015-present). Previously, Mr. Mauriello served as a Director of the Hamilton Funds of the Bank of New York (2006-2007) and of Arcadia Resources Inc. (health care services and products, 2007-2012).
Cornelia M. Small (1944)
Year of Election or Appointment: 2005
Trustee
Ms. Small also serves as Trustee of other Fidelity® funds. Ms. Small is a member of the Board of Directors (2009-present) and Chair of the Investment Committee (2010-present) of the Teagle Foundation. Ms. Small also serves on the Investment Committee of the Berkshire Taconic Community Foundation (2008-present). Previously, Ms. Small served as Chairperson (2002-2008) and a member of the Investment Committee and Chairperson (2008-2012) and a member of the Board of Trustees of Smith College. In addition, Ms. Small served as Chief Investment Officer, Director of Global Equity Investments, and a member of the Board of Directors of Scudder, Stevens & Clark and Scudder Kemper Investments.
William S. Stavropoulos (1939)
Year of Election or Appointment: 2001
Trustee
Vice Chairman of the Independent Trustees
Mr. Stavropoulos also serves as Trustee of other Fidelity® funds. Mr. Stavropoulos serves as President and Founder of the Michigan Baseball Foundation, the Great Lakes Loons (2007-present). Mr. Stavropoulos is Chairman Emeritus of the Board of Directors of The Dow Chemical Company, where he previously served in numerous senior management positions, including President, CEO (1995-2000; 2002-2004), Chairman of the Executive Committee (2000-2006), and as a member of the Board of Directors (1990-2006). Currently, Mr. Stavropoulos is Chairman of the Board of Directors of Univar Inc. (global distributor of commodity and specialty chemicals), a Director of Teradata Corporation (data warehousing and technology solutions), and a member of the Advisory Board for Metalmark Capital LLC (private equity investment, 2005-present). Mr. Stavropoulos is an operating advisor to Clayton, Dubilier & Rice, LLC (private equity investment). In addition, Mr. Stavropoulos is a member of the University of Notre Dame Advisory Council for the College of Science, a Trustee of the Rollin L. Gerstacker Foundation, and a Director of Artis-Naples in Naples, Florida. Previously, Mr. Stavropoulos served as a Director of Chemical Financial Corporation (bank holding company, 1993-2012) and Tyco International, Ltd. (multinational manufacturing and services, 2007-2012).
David M. Thomas (1949)
Year of Election or Appointment: 2008
Trustee
Mr. Thomas also serves as Trustee of other Fidelity® funds. Mr. Thomas serves as Non-Executive Chairman of the Board of Directors of Fortune Brands Home and Security (home and security products, 2011-present), as a member of the Board of Directors (2004-present) and Presiding Director (2013-present) of Interpublic Group of Companies, Inc. (marketing communication), and as a member of the Board of Trustees of the University of Florida (2013-present). Previously, Mr. Thomas served as Executive Chairman (2005-2006) and Chairman and Chief Executive Officer (2000-2005) of IMS Health, Inc. (pharmaceutical and healthcare information solutions), and a Director of Fortune Brands, Inc. (consumer products, 2000-2011).
+ The information includes the Trustee's principal occupation during the last five years and other information relating to the experience, attributes, and skills relevant to the Trustee's qualifications to serve as a Trustee, which led to the conclusion that the Trustee should serve as a Trustee for the fund.
Advisory Board Members and Officers:
Correspondence intended for an officer or Peter S. Lynch may be sent to Fidelity Investments, 245 Summer Street, Boston, Massachusetts 02210. Officers appear below in alphabetical order.
Name, Year of Birth; Principal Occupation
Peter S. Lynch (1944)
Year of Election or Appointment: 2003
Member of the Advisory Board
Mr. Lynch also serves as Member of the Advisory Board of other Fidelity® funds. Mr. Lynch is Vice Chairman and a Director of FMR (investment adviser firm) and FMR Co., Inc. (investment adviser firm). In addition, Mr. Lynch serves as a Trustee of Boston College and as the Chairman of the Inner-City Scholarship Fund. Previously, Mr. Lynch served on the Special Olympics International Board of Directors (1997-2006).
Elizabeth Paige Baumann (1968)
Year of Election or Appointment: 2017
Anti-Money Laundering (AML) Officer
Ms. Baumann also serves as AML Officer of other funds. She is Chief AML Officer (2012-present) and Senior Vice President (2014-present) of FMR LLC (diversified financial services company) and is an employee of Fidelity Investments. Previously, Ms. Baumann served as AML Officer of the funds (2012-2016), and Vice President (2007-2014) and Deputy Anti-Money Laundering Officer (2007-2012) of FMR LLC.
Marc R. Bryant (1966)
Year of Election or Appointment: 2015
Secretary and Chief Legal Officer (CLO)
Mr. Bryant also serves as Secretary and CLO of other funds. Mr. Bryant serves as CLO, Secretary, and Senior Vice President of Fidelity Management & Research Company (investment adviser firm, 2015-present) and FMR Co., Inc. (investment adviser firm, 2015-present); Secretary of Fidelity SelectCo, LLC (investment adviser firm, 2015-present) and Fidelity Investments Money Management, Inc. (investment adviser firm, 2015-present); and CLO of Fidelity Management & Research (Hong Kong) Limited and FMR Investment Management (UK) Limited (investment adviser firms, 2015-present) and Fidelity Management & Research (Japan) Limited (investment adviser firm, 2016-present). He is Senior Vice President and Deputy General Counsel of FMR LLC (diversified financial services company). Previously, Mr. Bryant served as Secretary and CLO of Fidelity Rutland Square Trust II (2010-2014) and Assistant Secretary of Fidelity's Fixed Income and Asset Allocation Funds (2013-2015). Prior to joining Fidelity Investments, Mr. Bryant served as a Senior Vice President and the Head of Global Retail Legal for AllianceBernstein L.P. (2006-2010), and as the General Counsel for ProFund Advisors LLC (2001-2006).
William C. Coffey (1969)
Year of Election or Appointment: 2009
Assistant Secretary
Mr. Coffey also serves as Assistant Secretary of other funds. He is Senior Vice President and Deputy General Counsel of FMR LLC (diversified financial services company, 2010-present), and is an employee of Fidelity Investments. Previously, Mr. Coffey served as Vice President and Associate General Counsel of FMR LLC (2005-2009).
Jonathan Davis (1968)
Year of Election or Appointment: 2010
Assistant Treasurer
Mr. Davis also serves as Assistant Treasurer of other funds, and is an employee of Fidelity Investments. Previously, Mr. Davis served as Vice President and Associate General Counsel of FMR LLC (diversified financial services company, 2003-2010).
Adrien E. Deberghes (1967)
Year of Election or Appointment: 2016
Assistant Treasurer
Mr. Deberghes also serves as an officer of other funds. He serves as Executive Vice President of Fidelity Investments Money Management, Inc. (FIMM) (investment adviser firm, 2016-present) and is an employee of Fidelity Investments (2008-present). Prior to joining Fidelity Investments, Mr. Deberghes was Senior Vice President of Mutual Fund Administration at State Street Corporation (2007-2008), Senior Director of Mutual Fund Administration at Investors Bank & Trust (2005-2007), and Director of Finance for Dunkin' Brands (2000-2005). Previously, Mr. Deberghes served in other fund officer roles.
Joseph DeSantis (1959)
Year of Election or Appointment: 2017
Vice President
Mr. DeSantis also serves as Vice President of other funds. Mr. DeSantis serves as a Director of Fidelity Management & Research (Japan) Limited (investment adviser firm, 2016-present), Chief Investment Officer, Equities (2010-present) and is an employee of Fidelity Investments.
Stephanie J. Dorsey (1969)
Year of Election or Appointment: 2010
Assistant Treasurer
Ms. Dorsey also serves as an officer of other funds. She is an employee of Fidelity Investments (2008-present) and has served in other fund officer roles. Prior to joining Fidelity Investments, Ms. Dorsey served as Treasurer (2004-2008) of the JPMorgan Mutual Funds and Vice President (2004-2008) of JPMorgan Chase Bank.
Howard J. Galligan III (1966)
Year of Election or Appointment: 2014
Chief Financial Officer
Mr. Galligan also serves as Chief Financial Officer of other funds. Mr. Galligan serves as President of Fidelity Pricing and Cash Management Services (FPCMS) (2014-present) and as a Director of Strategic Advisers, Inc. (investment adviser firm, 2008-present). Previously, Mr. Galligan served as Chief Administrative Officer of Asset Management (2011-2014) and Chief Operating Officer and Senior Vice President of Investment Support for Strategic Advisers, Inc. (2003-2011).
Brian B. Hogan (1964)
Year of Election or Appointment: 2009
Vice President
Mr. Hogan also serves as Trustee or Vice President of other funds. Mr. Hogan serves as a Director of FMR Investment Management (UK) Limited (investment adviser firm, 2015-present) and Fidelity SelectCo, LLC (investment adviser firm, 2014-present) and President of the Equity Division of FMR (investment adviser firm, 2009-present). Previously, Mr. Hogan served as Senior Vice President, Equity Research of FMR (2006-2009) and as a portfolio manager. Mr. Brian B. Hogan is not related to Mr. Colm A. Hogan.
Colm A. Hogan (1973)
Year of Election or Appointment: 2016
Deputy Treasurer
Mr. Hogan also serves as an officer of other funds. Mr. Hogan is an employee of Fidelity Investments (2005-present). Mr. Colm A. Hogan is not related to Mr. Brian B. Hogan.
Chris Maher (1972)
Year of Election or Appointment: 2013
Assistant Treasurer
Mr. Maher serves as Assistant Treasurer of other funds. Mr. Maher is Vice President of Valuation Oversight and is an employee of Fidelity Investments. Previously, Mr. Maher served as Vice President of Asset Management Compliance (2013), Vice President of the Program Management Group of FMR (investment adviser firm, 2010-2013), and Vice President of Valuation Oversight (2008-2010).
Rieco E. Mello (1969)
Year of Election or Appointment: 2017
Assistant Treasurer
Mr. Mello also serves as Assistant Treasurer of other funds. Mr. Mello is an employee of Fidelity Investments (1995-present).
Kenneth B. Robins (1969)
Year of Election or Appointment: 2016
Chief Compliance Officer
Mr. Robins also serves as an officer of other funds. Mr. Robins serves as Compliance Officer of Fidelity Management & Research Company and FMR Co., Inc. (investment adviser firms, 2016-present) and is an employee of Fidelity Investments (2004-present). Previously, Mr. Robins served as Executive Vice President of Fidelity Investments Money Management, Inc. (investment adviser firm, 2013-2016) and served in other fund officer roles.
Stacie M. Smith (1974)
Year of Election or Appointment: 2016
President and Treasurer
Ms. Smith also serves as an officer of other funds. She is an employee of Fidelity Investments (2009-present) and has served in other fund officer roles. Prior to joining Fidelity Investments, Ms. Smith served as Senior Audit Manager of Ernst & Young LLP (accounting firm, 1996-2009). Previously, Ms. Smith served as Deputy Treasurer of certain Fidelity® funds (2013-2016).
Marc L. Spector (1972)
Year of Election or Appointment: 2016
Assistant Treasurer
Mr. Spector also serves as an officer of other funds. Mr. Spector is an employee of Fidelity Investments (2016-present). Prior to joining Fidelity Investments, Mr. Spector served as Director at the Siegfried Group (accounting firm, 2013-2016), and prior to Siegfried Group as audit senior manager at Deloitte & Touche (accounting firm, 2005-2013).
Renee Stagnone (1975)
Year of Election or Appointment: 2016
Assistant Treasurer
Ms. Stagnone also serves as an officer of other funds. Ms. Stagnone is an employee of Fidelity Investments (1997-present). Previously, Ms. Stagnone served as Deputy Treasurer of certain Fidelity® funds (2013-2016).
Shareholder Expense Example
As a shareholder of the Fund, you incur two types of costs: (1) transaction costs and (2) ongoing costs, including other Fund expenses. This Example is intended to help you understand your ongoing costs (in dollars) of investing in the Fund and to compare these costs with the ongoing costs of investing in other mutual funds.
The actual expense Example is based on an investment of $1,000 invested at the beginning of the period and held for the entire period (August 15, 2017 to October 31, 2017). The hypothetical expense Example is based on an investment of $1,000 invested for the one-half year period (May 1, 2017 to October 31, 2017).
Actual Expenses
The first line of the accompanying table provides information about actual account values and actual expenses. You may use the information in this line, together with the amount you invested, to estimate the expenses that you paid over the period. Simply divide your account value by $1,000.00 (for example, an $8,600 account value divided by $1,000.00 = 8.6), then multiply the result by the number in the first line under the heading entitled "Expenses Paid During Period" to estimate the expenses you paid on your account during this period. In addition, the Fund, as a shareholder in the underlying Fidelity Central Funds, will indirectly bear its pro-rata share of the fees and expenses incurred by the underlying Fidelity Central Funds. These fees and expenses are not included in the Fund's annualized expense ratio used to calculate the expense estimate in the table below.
Hypothetical Example for Comparison Purposes
The second line of the accompanying table provides information about hypothetical account values and hypothetical expenses based on the Fund's actual expense ratio and an assumed rate of return of 5% per year before expenses, which is not the Fund's actual return. The hypothetical account values and expenses may not be used to estimate the actual ending account balance or expenses you paid for the period. You may use this information to compare the ongoing costs of investing in the Fund and other funds. To do so, compare this 5% hypothetical example with the 5% hypothetical examples that appear in the shareholder reports of the other funds. In addition, the Fund, as a shareholder in the underlying Fidelity Central Funds, will indirectly bear its pro-rata share of the fees and expenses incurred by the underlying Fidelity Central Funds. These fees and expenses are not included in the Fund's annualized expense ratio used to calculate the expense estimate in the table below.
Please note that the expenses shown in the table are meant to highlight your ongoing costs only and do not reflect any transaction costs. Therefore, the second line of the table is useful in comparing ongoing costs only, and will not help you determine the relative total costs of owning different funds.
| | Annualized Expense Ratio-A | Beginning
Account Value | Ending
Account Value
October 31, 2017 | Expenses Paid
During Period |
| Actual | - %B | $1,000.00 | $1,066.00 | $--C |
| Hypothetical-D | | $1,000.00 | $1,025.21 | $--E |
A Annualized expense ratio reflects expenses net of applicable fee waivers.
B Amount represents less than .005%.
C Actual expenses are equal to the Fund's annualized expense ratio, multiplied by the average account value over the period, multiplied by 78/365 (to reflect the period August 15, 2017 to October 31, 2017).
D 5% return per year before expenses
E Hypothetical expenses are equal to the Fund's annualized expense ratio, multiplied by the average account value over the period, multiplied by 184/365 (to reflect the one-half year period).
Distributions (Unaudited)
The Board of Trustees of Fidelity Series Canada Fund voted to pay on December 11, 2017, to shareholders of record at the opening of business on December 8, 2017, a distribution of $.019 per share derived from capital gains realized from sales of portfolio securities and a dividend of $.097 per share from net investment income.
The fund will notify shareholders in January 2018 of amounts for use in preparing 2017 income tax returns.
Board Approval of Investment Advisory Contracts and Management Fees
Fidelity Series Canada Fund
On May 16, 2017, the Board of Trustees, including the Independent Trustees (together, the Board), voted to approve the management contract with Fidelity Management & Research Company (FMR) and the sub-advisory agreements with affiliates of FMR (together, the Advisory Contracts) for the fund. FMR and the sub-advisers are collectively referred to herein as the Investment Advisers. The Board, assisted by the advice of fund counsel and Independent Trustees' counsel, considered a broad range of information.
Nature, Extent, and Quality of Services Provided. The Board considered staffing as it relates to the fund, including the backgrounds of investment personnel of Fidelity, and also considered the fund's investment objective, strategies, and related investment philosophy, and the purpose of Series funds generally. The Board considered the structure of the investment personnel compensation program, and whether this structure provides appropriate incentives to act in the best interests of the fund.
Resources Dedicated to Investment Management and Support Services. The Board and the Fund Oversight and Research Committees reviewed the general qualifications and capabilities of Fidelity's investment staff, including its size, education, experience, and resources, as well as Fidelity's approach to recruiting, training, managing, and compensating investment personnel. The Board noted that Fidelity has continued to increase the resources devoted to non-U.S. offices, including expansion of Fidelity's global investment organization. The Board also noted that Fidelity's analysts have extensive resources, tools and capabilities that allow them to conduct sophisticated quantitative and fundamental analysis, as well as credit analysis of issuers, counterparties and guarantors. Further, the Board considered that Fidelity's investment professionals have sufficient access to global information and data so as to provide competitive investment results over time, and that those professionals also have access to sophisticated tools that permit them to assess portfolio construction and risk and performance attribution characteristics continuously, as well as to transmit new information and research conclusions rapidly around the world. Additionally, in its deliberations, the Board considered Fidelity's trading, risk management, compliance, and technology and operations capabilities and resources, which are integral parts of the investment management process.
Administrative Services. The Board considered the nature, extent, quality, and cost of advisory, administrative, and shareholder services to be performed by the Investment Advisers, and their affiliates under the Advisory Contracts and under separate agreements covering transfer agency, pricing and bookkeeping, and securities lending services for the fund. The Board also considered the nature and extent of the supervision of third party service providers, principally custodians, subcustodians, and pricing vendors.
Investment Performance. The fund is a new fund and therefore had no historical performance for the Board to review at the time it approved the fund's Advisory Contracts. The Board considered the Investment Advisers' strength in fundamental, research-driven security selection, which the Board is familiar with through its supervision of other Fidelity funds.
Based on its review, the Board concluded that the nature, extent, and quality of services to be provided to the fund under the Advisory Contracts should benefit the shareholders of the fund.
Competitiveness of Management Fee and Total Expense Ratio ..The Board considered the fund would not pay a management fee for investment advisory services. In reviewing the Advisory Contracts, the Board also considered the projected total expense ratio of the fund. The Board noted that FMR pays all other expenses of the fund, with limited exceptions.
The Board also noted that FMR had contractually agreed to reimburse the fund through December 31, 2020 to the extent total operating expenses (excluding interest, certain taxes, certain securities lending costs, brokerage commissions, fees and expenses of the Independent Trustees, proxy and shareholder meeting expenses, extraordinary expenses, and acquired fund fees and expenses, if any) as a percentage of its average net assets exceed 1.4 bp.
The Board considered the total expense ratio of the fund after the effect of the contractual expense cap arrangements.
Based on its review, the Board concluded that the fund's projected total expense ratio was reasonable in light of the services that the fund and its shareholders will receive and the other factors considered.
Costs of the Services and Profitability. The fund is a new fund and therefore no revenue, cost, or profitability data was available for the Board to review in respect of the fund at the time it approved the Advisory Contracts. In connection with its future renewal of the fund's Advisory Contracts, the Board will consider the level of Fidelity's profits in respect of all the Fidelity funds, including the Fidelity funds as well as the profitability of each fund that invests in this fund.
Economies of Scale. The Board concluded that because the fund does not pay a management fee and FMR pays all other expenses of the fund, with limited exceptions, economies of scale cannot be realized by the fund, but may be realized by the other Fidelity funds that invest in the fund.
Additional Information Considered by the Board. In order to develop fully the factual basis for consideration of the Advisory Contracts, the Board received information explaining that the fund is offered exclusively to other Fidelity funds, which use the fund to gain exposure to a specific type of investment. The Board also noted that those Fidelity funds investing in the fund will benefit from investing in one centralized fund as the fund may deliver more uniform asset class performance and offer additional opportunities to generate returns and diversify the investing funds' international equity allocations.
Based on its evaluation of all of the conclusions noted above, and after considering all factors it believed relevant, the Board concluded that the advisory fee structures are fair and reasonable, and that the fund's Advisory Contracts should be approved.
Board Approval of Investment Advisory Contracts At its July 2017 meeting, the Board of Trustees, including the Independent Trustees (together, the Board), voted to approve amended and restated sub-advisory agreements with FMR Co., Inc., FMR Investment Management (U.K.) Limited, Fidelity Management & Research (Hong Kong) Limited, and Fidelity Management & Research (Japan) Limited (together, the Sub-Advisers) for the fund (together, the Amended Contracts). The Board noted that the Amended Contracts are intended to ensure consistency in the sub-advisory fees paid under a new fee structure, pursuant to which the fund does not pay a management fee to Fidelity Management & Research Company (FMR), as compared to the sub-advisory fees paid under the prior fee structure. The Board, assisted by the advice of fund counsel and Independent Trustees' counsel, considered a broad range of information.
The Board noted that it previously received and considered materials relating to the nature, extent and quality of services provided by FMR and the Sub-Advisers to the fund, including the resources dedicated to investment management and support services, as well as administrative services. At its May 2017 meeting, the Board concluded that the nature, extent and quality of the services provided to the fund under the existing management and sub-advisory agreements should benefit the fund's shareholders. The Board noted that approval of the Amended Contracts would not change the management fee payable by the fund, the total expenses of the fund, the fund's portfolio manager, the investment processes, the level or nature of services provided, the resources and personnel allocated or trading and compliance operations.
The Board considered that the fund does not pay a management fee for investment advisory services and that the Sub-Advisers receive compensation from FMR or its affiliates. The Board noted at its May 2017 meeting that FMR pays all other expenses of the fund, with limited exceptions. Because the Board was approving arrangements with the Sub-Advisers under which the fund will not bear any additional management fees or expenses and under which the fund's portfolio manager would not change, it did not consider the fund's investment performance, competitiveness of management fee and total expenses, or costs of services and profitability to be significant factors in its decision.
In connection with its future renewal of the fund's management contract and sub-advisory agreements, the Board will consider: (i) the nature, extent, and quality of services provided to the fund, including administrative services and investment performance; (ii) the competitiveness of the fund's management fee and total expenses; and (iii) the level of Fidelity's profits in respect of all the Fidelity funds.
The Board noted that because the fund pays no advisory fees and FMR or an affiliate bears all expenses of the fund, with limited exceptions, economies of scale cannot be realized by the fund.
Based on its evaluation of all of the conclusions noted above, and after considering all material factors, the Board ultimately concluded that the fund's Amended Contracts are fair and reasonable, and that the fund's Amended Contracts should be approved.
Corporate Headquarters
245 Summer St.
Boston, MA 02210
www.fidelity.com
SAD-ANN-1217
1.9883882.100
Fidelity Advisor® Total Emerging Markets Fund - Class A, Class M (formerly Class T), Class C and Class I
Annual Report October 31, 2017 Class A, Class M, Class C and Class I are classes of Fidelity® Total Emerging Markets Fund |
|
Contents
To view a fund's proxy voting guidelines and proxy voting record for the 12-month period ended June 30, visit http://www.fidelity.com/proxyvotingresults or visit the Securities and Exchange Commission's (SEC) web site at http://www.sec.gov.
You may also call 1-877-208-0098 to request a free copy of the proxy voting guidelines.
Standard & Poor's, S&P and S&P 500 are registered service marks of The McGraw-Hill Companies, Inc. and have been licensed for use by Fidelity Distributors Corporation.
Other third-party marks appearing herein are the property of their respective owners.
All other marks appearing herein are registered or unregistered trademarks or service marks of FMR LLC or an affiliated company. © 2017 FMR LLC. All rights reserved.
This report and the financial statements contained herein are submitted for the general information of the shareholders of the Fund. This report is not authorized for distribution to prospective investors in the Fund unless preceded or accompanied by an effective prospectus.
A fund files its complete schedule of portfolio holdings with the SEC for the first and third quarters of each fiscal year on Form N-Q. Forms N-Q are available on the SEC’s web site at http://www.sec.gov. A fund's Forms N-Q may be reviewed and copied at the SEC’s Public Reference Room in Washington, DC. Information regarding the operation of the SEC's Public Reference Room may be obtained by calling 1-800-SEC-0330.
For a complete list of a fund's portfolio holdings, view the most recent holdings listing, semiannual report, or annual report on Fidelity's web site at http://www.fidelity.com, http://www.institutional.fidelity.com, or http://www.401k.com, as applicable.
NOT FDIC INSURED •MAY LOSE VALUE •NO BANK GUARANTEE
Neither the Fund nor Fidelity Distributors Corporation is a bank.
Performance: The Bottom Line
Average annual total return reflects the change in the value of an investment, assuming reinvestment of distributions from dividend income and capital gains (the profits earned upon the sale of securities that have grown in value, if any) and assuming a constant rate of performance each year. The hypothetical investment and the average annual total returns do not reflect the deduction of taxes that a shareholder would pay on fund distributions or the redemption of fund shares. During periods of reimbursement by Fidelity, a fund’s total return will be greater than it would be had the reimbursement not occurred. How a fund did yesterday is no guarantee of how it will do tomorrow.
Average Annual Total Returns
| For the periods ended October 31, 2017 | Past 1 year | Past 5 years | Life of fundA |
| Class A (incl. 5.75% sales charge) | 14.17% | 5.05% | 5.67% |
| Class M (incl. 3.50% sales charge) | 16.43% | 5.25% | 5.79% |
| Class C (incl. contingent deferred sales charge) | 19.29% | 5.50% | 5.92% |
| Class I | 21.51% | 6.56% | 6.99% |
A From November 1, 2011
Class C shares' contingent deferred sales charges included in the past one year and life of fund total return figures are 1% and 0%, respectively.
Class C shares' contingent deferred sales charges included in the past one year, past five years, and life of fund total return figures are 1%, 0%, and 0%, respectively.
$10,000 Over Life of Fund
Let's say hypothetically that $10,000 was invested in Fidelity Advisor® Total Emerging Markets Fund - Class A on November 1, 2011, when the fund started, and the current 5.75% sales charge was paid.
The chart shows how the value of your investment would have changed, and also shows how the MSCI Emerging Markets Index performed over the same period.
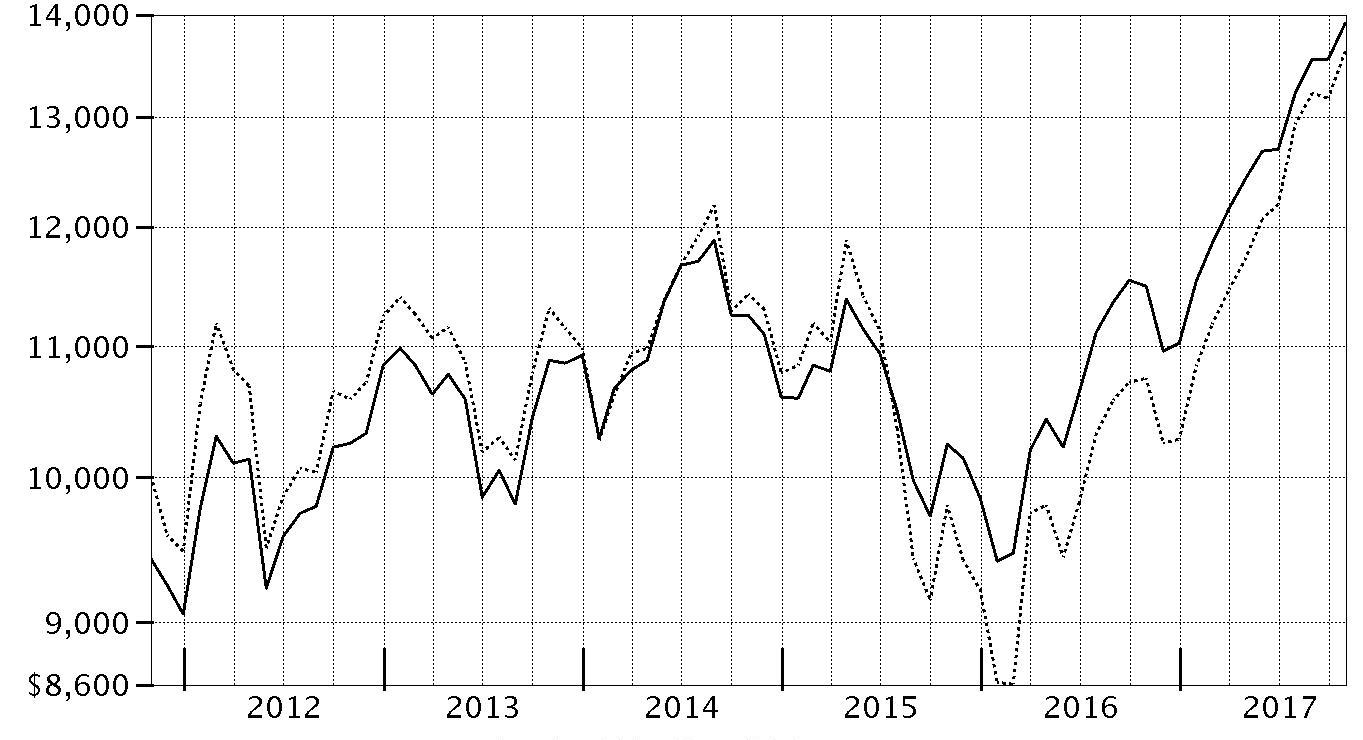
| Period Ending Values |
| $13,921 | Fidelity Advisor® Total Emerging Markets Fund - Class A |
| $13,639 | MSCI Emerging Markets Index |
Management's Discussion of Fund Performance
Market Recap: For the 12 months ending October 31, 2017, the Fidelity Total Emerging Markets Composite Index – consisting of 60% equities and 40% debt – gained 18.14%. Separately, emerging-markets (EM) equity gained 26.91%, as measured by the MSCI Emerging Markets Index. EM debt rose 5.89%, according to the J.P. Morgan Emerging Markets Bond Index Global. Both asset classes generally benefited from continued synchronized expansion in global economic activity, which sustained investors' appetite for risk assets. Moreover, a continued flattening of the yield curve – partly the result of a decline in 30-year interest rates – also supported EM debt. EM equities were bolstered by China (+41%) and South Korea (+41%). Improved economic growth supported Chinese stocks, while a widespread technology rally lifted both markets. Turning to EM debt, Ukrainian bonds advanced about 17%. The country issued its first sovereign bond since restructuring its debt in 2015, drawing widespread demand. In addition, reforms progressed due to the influence of the International Monetary Fund, which provided financing support. One of the few countries in the EM debt index to decline was Venezuela (-1%), which suffered amid geopolitical tension and U.S.-issued sanctions.
Comments from Lead Portfolio Manager John Carlson: For the year, the fund’s share classes (excluding sales charges, if applicable) advanced about 21%, outpacing the Composite index. Versus the Composite, successful security selection within both the EM equity and debt subportfolios lifted relative performance, as did asset allocation. The debt sleeve outperformed its benchmark, mainly due to helpful decisions in Ukraine, Venezuela, China and Argentina. Successful security selection overwhelmingly drove the equity sleeve's strong outperformance of its benchmark, with choices among consumer discretionary, industrials, consumer staples and information technology stocks helping the most. Conversely, choices in the health care and real estate sectors detracted. Among individual stocks, an overweighting in Taiwan-based GlobalWafers was our biggest individual contributor. The firm makes silicon wafers upon which semiconductors are made. The stock benefited from the integration of a key acquisition last year, as well as continued growth in global chip manufacturing, led by China. However, underexposure to a few strong-performing South Korea-based technology names, namely chipmakers Samsung Electronics and SK Hynix, hurt the relative result.
The views expressed above reflect those of the portfolio manager(s) only through the end of the period as stated on the cover of this report and do not necessarily represent the views of Fidelity or any other person in the Fidelity organization. Any such views are subject to change at any time based upon market or other conditions and Fidelity disclaims any responsibility to update such views. These views may not be relied on as investment advice and, because investment decisions for a Fidelity fund are based on numerous factors, may not be relied on as an indication of trading intent on behalf of any Fidelity fund.
Investment Summary (Unaudited)
Top Five Stocks as of October 31, 2017
| | % of fund's net assets | % of fund's net assets 6 months ago |
| Tencent Holdings Ltd. (Cayman Islands, Internet Software & Services) | 4.0 | 2.7 |
| Alibaba Group Holding Ltd. sponsored ADR (Cayman Islands, Internet Software & Services) | 3.5 | 1.5 |
| Naspers Ltd. Class N (South Africa, Media) | 1.9 | 2.6 |
| Sberbank of Russia (Russia, Banks) | 1.7 | 1.4 |
| Taiwan Semiconductor Manufacturing Co. Ltd. (Taiwan, Semiconductors & Semiconductor Equipment) | 1.5 | 2.1 |
| | 12.6 | |
Top Five Market Sectors as of October 31, 2017
| | % of fund's net assets | % of fund's net assets 6 months ago |
| Financials | 18.2 | 16.3 |
| Information Technology | 17.9 | 14.6 |
| Consumer Discretionary | 10.2 | 9.6 |
| Energy | 9.5 | 9.3 |
| Materials | 5.9 | 5.3 |
Top Five Countries as of October 31, 2017
| (excluding cash equivalents) | % of fund's net assets | % of fund's net assets 6 months ago |
| Cayman Islands | 10.9 | 10.3 |
| Korea (South) | 9.3 | 8.0 |
| Brazil | 7.1 | 6.4 |
| India | 6.6 | 5.1 |
| China | 6.3 | 4.7 |
Percentages are adjusted for the effect of futures contracts, if applicable.
Asset Allocation (% of fund's net assets)
| As of October 31, 2017 |
| | Stocks | 71.5% |
| | Bonds | 25.6% |
| | Short-Term Investments and Net Other Assets (Liabilities) | 2.9% |

| As of April 30, 2017 |
| | Stocks and Equity Futures | 68.6% |
| | Bonds | 27.4% |
| | Short-Term Investments and Net Other Assets (Liabilities) | 4.0% |

Investments October 31, 2017
Showing Percentage of Net Assets
| Common Stocks - 66.8% | | | |
| | | Shares | Value |
| Argentina - 0.3% | | | |
| Grupo Superveille SA sponsored ADR | | 29,700 | $796,257 |
| Telecom Argentina SA Class B sponsored ADR (a) | | 14,934 | 486,998 |
| YPF SA Class D sponsored ADR | | 44,700 | 1,097,832 |
|
| TOTAL ARGENTINA | | | 2,381,087 |
|
| Australia - 0.0% | | | |
| Frontier Digital Ventures Ltd. (a) | | 419,187 | 208,536 |
| Austria - 0.2% | | | |
| Erste Group Bank AG | | 23,655 | 1,016,486 |
| Bermuda - 1.1% | | | |
| AGTech Holdings Ltd. (a) | | 1,920,000 | 334,709 |
| Credicorp Ltd. (United States) | | 10,500 | 2,199,120 |
| GP Investments Ltd. Class A (depositary receipt) (a) | | 22,922 | 40,991 |
| Shangri-La Asia Ltd. | | 2,102,000 | 4,181,690 |
| VimpelCom Ltd. sponsored ADR | | 343,660 | 1,343,711 |
|
| TOTAL BERMUDA | | | 8,100,221 |
|
| Brazil - 3.2% | | | |
| Azul SA sponsored ADR | | 33,600 | 849,744 |
| B2W Companhia Global do Varejo (a) | | 928,517 | 6,025,866 |
| Banco do Brasil SA | | 200,400 | 2,109,796 |
| BR Malls Participacoes SA | | 262,923 | 1,019,125 |
| Centrais Eletricas Brasileiras SA (Electrobras) (a) | | 64,540 | 435,028 |
| Companhia de Saneamento de Minas Gerais | | 99,636 | 1,200,030 |
| Cosan SA Industria e Comercio | | 108,255 | 1,237,654 |
| Direcional Engenharia SA (a) | | 326,900 | 584,589 |
| Localiza Rent A Car SA | | 79,895 | 1,413,360 |
| Minerva SA | | 294,800 | 1,036,346 |
| Smiles Fidelidade SA | | 97,200 | 2,540,458 |
| Vale SA sponsored ADR | | 506,868 | 4,962,238 |
|
| TOTAL BRAZIL | | | 23,414,234 |
|
| British Virgin Islands - 0.9% | | | |
| Despegar.com Corp. | | 37,900 | 1,167,320 |
| Mail.Ru Group Ltd. GDR (Reg. S) (a) | | 174,266 | 5,663,645 |
|
| TOTAL BRITISH VIRGIN ISLANDS | | | 6,830,965 |
|
| Canada - 0.3% | | | |
| Pan American Silver Corp. | | 88,200 | 1,440,306 |
| Torex Gold Resources, Inc. (a) | | 50,530 | 696,790 |
|
| TOTAL CANADA | | | 2,137,096 |
|
| Cayman Islands - 10.9% | | | |
| 58.com, Inc. ADR (a) | | 45,150 | 3,032,726 |
| Alibaba Group Holding Ltd. sponsored ADR (a) | | 139,400 | 25,773,666 |
| BizLink Holding, Inc. | | 66,294 | 664,304 |
| China Biologic Products Holdings, Inc. | | 7,700 | 598,367 |
| China Literature Ltd. | | 4,366 | 30,780 |
| Ctrip.com International Ltd. ADR (a) | | 21,100 | 1,010,479 |
| Haitian International Holdings Ltd. | | 446,000 | 1,334,901 |
| JD.com, Inc. sponsored ADR (a) | | 251,500 | 9,436,280 |
| NetEase, Inc. ADR | | 9,900 | 2,791,008 |
| Qudian, Inc. ADR | | 400 | 9,960 |
| Sea Ltd. ADR (b) | | 24,400 | 367,952 |
| Secoo Holding Ltd. ADR | | 22,000 | 159,280 |
| Silergy Corp. | | 9,000 | 194,406 |
| Silicon Motion Technology Corp. sponsored ADR | | 14,900 | 721,458 |
| Tencent Holdings Ltd. | | 645,350 | 29,005,318 |
| Uni-President China Holdings Ltd. | | 2,725,600 | 2,277,913 |
| Vipshop Holdings Ltd. ADR (a) | | 180,600 | 1,426,740 |
| ZTO Express (Cayman), Inc. sponsored ADR | | 52,900 | 845,871 |
|
| TOTAL CAYMAN ISLANDS | | | 79,681,409 |
|
| Chile - 0.8% | | | |
| Compania Cervecerias Unidas SA sponsored ADR | | 72,800 | 2,073,344 |
| Enersis SA | | 5,152,627 | 1,105,089 |
| Inversiones La Construccion SA | | 59,428 | 1,013,017 |
| Sociedad Quimica y Minera de Chile SA (PN-B) sponsored ADR | | 16,500 | 985,710 |
| Vina Concha y Toro SA | | 519,858 | 917,113 |
|
| TOTAL CHILE | | | 6,094,273 |
|
| China - 6.3% | | | |
| BBMG Corp. (H Shares) | | 2,286,000 | 1,139,865 |
| China Life Insurance Co. Ltd. (H Shares) | | 2,124,834 | 7,044,468 |
| China Longyuan Power Grid Corp. Ltd. (H Shares) | | 2,281,960 | 1,690,687 |
| China Molybdenum Co. Ltd. (H Shares) | | 420,000 | 272,951 |
| China Pacific Insurance (Group) Co. Ltd. (H Shares) | | 869,706 | 4,286,435 |
| China Petroleum & Chemical Corp. (H Shares) | | 1,714,000 | 1,258,622 |
| China Telecom Corp. Ltd. (H Shares) | | 2,803,949 | 1,405,317 |
| Conch Cement Co. Ltd. (H Shares) | | 388,000 | 1,658,651 |
| Guangzhou Automobile Group Co. Ltd. (H Shares) | | 1,812,000 | 4,505,960 |
| Hangzhou Hikvision Digital Technology Co. Ltd. Class A | | 201,100 | 1,190,554 |
| Industrial & Commercial Bank of China Ltd. (H Shares) | | 13,029,160 | 10,337,952 |
| Kweichow Moutai Co. Ltd. (A Shares) | | 7,499 | 698,519 |
| Maanshan Iron & Steel Ltd. (H Shares) (a) | | 866,000 | 406,281 |
| PICC Property & Casualty Co. Ltd. (H Shares) | | 1,046,580 | 2,074,003 |
| Qingdao Haier Co. Ltd. | | 1,286,251 | 3,353,802 |
| Shanghai International Airport Co. Ltd. (A Shares) | | 235,114 | 1,550,323 |
| Tsingtao Brewery Co. Ltd. (H Shares) | | 390,000 | 1,632,207 |
| Zhengzhou Yutong Bus Co. Ltd. | | 335,590 | 1,286,743 |
|
| TOTAL CHINA | | | 45,793,340 |
|
| Colombia - 0.1% | | | |
| Bancolombia SA sponsored ADR | | 15,395 | 581,161 |
| Cyprus - 0.1% | | | |
| Etalon Group PLC GDR (Reg. S) | | 162,600 | 658,530 |
| Egypt - 0.0% | | | |
| Six of October Development & Investment Co. (a) | | 149,100 | 156,736 |
| Greece - 0.2% | | | |
| Titan Cement Co. SA (Reg.) | | 63,700 | 1,537,444 |
| Hong Kong - 3.3% | | | |
| AIA Group Ltd. | | 95,120 | 715,711 |
| China Mobile Ltd. | | 12,950 | 130,256 |
| China Mobile Ltd. sponsored ADR | | 49,252 | 2,484,763 |
| China Overseas Land and Investment Ltd. | | 648,500 | 2,103,090 |
| China Resources Beer Holdings Co. Ltd. | | 1,090,666 | 3,145,587 |
| China Resources Power Holdings Co. Ltd. | | 740,009 | 1,422,839 |
| China Unicom Ltd. (a) | | 132,500 | 187,999 |
| China Unicom Ltd. sponsored ADR (a) | | 104,520 | 1,476,868 |
| CNOOC Ltd. | | 3,119,000 | 4,258,662 |
| CSPC Pharmaceutical Group Ltd. | | 1,192,000 | 2,071,874 |
| Far East Horizon Ltd. | | 3,371,980 | 3,349,764 |
| Sinotruk Hong Kong Ltd. | | 1,095,000 | 1,454,124 |
| Techtronic Industries Co. Ltd. | | 216,500 | 1,269,628 |
|
| TOTAL HONG KONG | | | 24,071,165 |
|
| India - 6.6% | | | |
| Adani Ports & Special Economic Zone Ltd. | | 297,696 | 1,978,586 |
| Axis Bank Ltd. | | 345,946 | 2,795,083 |
| Bharat Petroleum Corp. Ltd. | | 327,667 | 2,740,764 |
| Bharti Infratel Ltd. | | 249,464 | 1,703,483 |
| Coal India Ltd. | | 344,413 | 1,523,662 |
| Eicher Motors Ltd. | | 1,595 | 794,012 |
| Federal Bank Ltd. | | 745,104 | 1,401,026 |
| ICICI Bank Ltd. | | 334,745 | 1,569,742 |
| ICICI Bank Ltd. sponsored ADR | | 342,840 | 3,136,986 |
| Indraprastha Gas Ltd. | | 49,828 | 1,219,843 |
| InterGlobe Aviation Ltd. | | 48,086 | 926,704 |
| ITC Ltd. | | 432,498 | 1,774,745 |
| JK Cement Ltd. | | 79,550 | 1,231,520 |
| Larsen & Toubro Ltd. | | 105,092 | 1,983,845 |
| LIC Housing Finance Ltd. | | 257,628 | 2,382,114 |
| Lupin Ltd. | | 167,037 | 2,652,083 |
| Petronet LNG Ltd. | | 325,459 | 1,306,108 |
| Phoenix Mills Ltd. | | 201,080 | 1,632,242 |
| Power Grid Corp. of India Ltd. | | 314,674 | 1,029,555 |
| Reliance Industries Ltd. | | 438,986 | 6,378,687 |
| SREI Infrastructure Finance Ltd. | | 116,223 | 205,881 |
| State Bank of India | | 431,823 | 2,039,405 |
| Sun Pharmaceutical Industries Ltd. | | 367,195 | 3,135,477 |
| Tata Motors Ltd. (a) | | 367,301 | 2,430,143 |
| Tejas Networks Ltd. | | 37,582 | 189,303 |
|
| TOTAL INDIA | | | 48,160,999 |
|
| Indonesia - 1.9% | | | |
| PT Astra International Tbk | | 6,130,200 | 3,615,971 |
| PT Bank Mandiri (Persero) Tbk | | 4,384,100 | 2,278,924 |
| PT Bank Rakyat Indonesia Tbk | | 2,610,000 | 3,002,101 |
| PT Indocement Tunggal Prakarsa Tbk | | 644,300 | 1,066,509 |
| PT Kalbe Farma Tbk | | 6,587,100 | 777,096 |
| PT Link Net Tbk | | 1,521,900 | 559,947 |
| PT Lippo Karawaci Tbk | | 5,578,500 | 283,809 |
| PT Media Nusantara Citra Tbk | | 4,697,700 | 540,344 |
| PT Semen Gresik (Persero) Tbk | | 1,856,400 | 1,491,964 |
|
| TOTAL INDONESIA | | | 13,616,665 |
|
| Israel - 0.2% | | | |
| Bezeq The Israel Telecommunication Corp. Ltd. | | 1,055,255 | 1,575,728 |
| Japan - 0.5% | | | |
| Minebea Mitsumi, Inc. | | 28,500 | 522,494 |
| Panasonic Corp. | | 58,800 | 887,843 |
| Sumco Corp. | | 78,200 | 1,722,477 |
| TDK Corp. | | 6,500 | 499,456 |
|
| TOTAL JAPAN | | | 3,632,270 |
|
| Korea (South) - 7.8% | | | |
| AMOREPACIFIC Group, Inc. | | 22,985 | 2,949,984 |
| BS Financial Group, Inc. | | 306,417 | 2,724,096 |
| Daou Technology, Inc. | | 97,211 | 1,595,419 |
| Duk San Neolux Co. Ltd. | | 12,583 | 247,026 |
| Fila Korea Ltd. | | 934 | 56,553 |
| Hanon Systems | | 99,944 | 1,162,046 |
| Hyundai Fire & Marine Insurance Co. Ltd. | | 50,621 | 2,053,200 |
| Hyundai Glovis Co. Ltd. | | 9,908 | 1,338,093 |
| Hyundai Industrial Development & Construction Co. | | 17,529 | 628,673 |
| Hyundai Mipo Dockyard Co. Ltd. (a) | | 9,923 | 962,933 |
| Hyundai Mobis | | 27,350 | 6,518,952 |
| InterPark INT Corp. | | 29,545 | 246,541 |
| KB Financial Group, Inc. | | 121,436 | 6,362,031 |
| KEPCO Plant Service & Engineering Co. Ltd. | | 15,493 | 572,280 |
| Korea Electric Power Corp. | | 28,583 | 1,004,133 |
| Korea Express Co. Ltd. (a) | | 10,300 | 1,446,306 |
| Korean Reinsurance Co. | | 140,421 | 1,406,609 |
| KT Corp. | | 11,630 | 305,858 |
| KT Corp. sponsored ADR | | 18,890 | 271,827 |
| LG Chemical Ltd. | | 13,541 | 4,886,721 |
| LG Telecom Ltd. | | 66,519 | 764,490 |
| NAVER Corp. | | 2,379 | 1,902,196 |
| Samsung Electronics Co. Ltd. | | 2,356 | 5,803,132 |
| Samsung Life Insurance Co. Ltd. | | 16,190 | 1,954,807 |
| Samsung SDI Co. Ltd. | | 18,150 | 3,344,006 |
| Shinhan Financial Group Co. Ltd. | | 141,551 | 6,371,067 |
|
| TOTAL KOREA (SOUTH) | | | 56,878,979 |
|
| Mauritius - 0.1% | | | |
| MakeMyTrip Ltd. (a) | | 30,500 | 832,650 |
| Mexico - 1.7% | | | |
| America Movil S.A.B. de CV Series L sponsored ADR | | 24,600 | 421,152 |
| CEMEX S.A.B. de CV sponsored ADR | | 272,583 | 2,210,648 |
| Grupo Aeroportuario del Pacifico S.A.B. de CV Series B | | 114,400 | 1,085,000 |
| Grupo Financiero Banorte S.A.B. de CV Series O | | 537,529 | 3,190,113 |
| Infraestructura Energetica Nova S.A.B. de CV | | 25,284 | 129,099 |
| Macquarie Mexican (REIT) | | 1,979,270 | 2,374,494 |
| Promotora y Operadora de Infraestructura S.A.B. de CV | | 90,110 | 855,708 |
| Tenedora Nemak SA de CV | | 31,814 | 23,912 |
| Wal-Mart de Mexico SA de CV Series V | | 1,028,900 | 2,299,116 |
|
| TOTAL MEXICO | | | 12,589,242 |
|
| Netherlands - 0.9% | | | |
| Hangzhou Hikvision Digital Technology Co. Ltd. ELS (BNP Paribas Warrant Program) warrants 9/5/18 (a)(c) | | 99,825 | 590,985 |
| X5 Retail Group NV GDR (Reg. S) (a) | | 20,300 | 834,330 |
| Yandex NV Series A (a) | | 157,987 | 5,344,700 |
|
| TOTAL NETHERLANDS | | | 6,770,015 |
|
| Nigeria - 0.3% | | | |
| Guaranty Trust Bank PLC | | 3,465,183 | 404,271 |
| Guaranty Trust Bank PLC GDR (Reg. S) | | 124,480 | 746,880 |
| Transnational Corp. of Nigeria PLC (a) | | 41,804,033 | 167,216 |
| Zenith Bank PLC | | 16,215,469 | 1,148,145 |
|
| TOTAL NIGERIA | | | 2,466,512 |
|
| Pakistan - 0.2% | | | |
| Habib Bank Ltd. | | 953,200 | 1,452,310 |
| Panama - 0.2% | | | |
| Copa Holdings SA Class A | | 11,149 | 1,373,445 |
| Peru - 0.2% | | | |
| Compania de Minas Buenaventura SA sponsored ADR | | 101,200 | 1,395,548 |
| Philippines - 0.6% | | | |
| International Container Terminal Services, Inc. | | 390,620 | 801,905 |
| Metropolitan Bank & Trust Co. | | 1,507,081 | 2,530,037 |
| Robinsons Land Corp. | | 2,417,880 | 1,181,157 |
|
| TOTAL PHILIPPINES | | | 4,513,099 |
|
| Russia - 3.7% | | | |
| Lukoil PJSC sponsored ADR | | 80,200 | 4,258,620 |
| MegaFon PJSC | | 46,200 | 458,208 |
| MegaFon PJSC GDR | | 32,060 | 335,027 |
| MMC Norilsk Nickel PJSC sponsored ADR | | 215,400 | 3,963,360 |
| Mobile TeleSystems OJSC | | 253,962 | 1,223,700 |
| NOVATEK OAO GDR (Reg. S) | | 21,600 | 2,464,560 |
| RusHydro PJSC | | 76,654,300 | 1,070,906 |
| Sberbank of Russia | | 1,638,160 | 5,428,258 |
| Sberbank of Russia sponsored ADR | | 490,284 | 7,035,575 |
| Unipro PJSC | | 20,261,700 | 888,701 |
|
| TOTAL RUSSIA | | | 27,126,915 |
|
| Singapore - 0.2% | | | |
| First Resources Ltd. | | 799,500 | 1,155,465 |
| South Africa - 4.5% | | | |
| Aspen Pharmacare Holdings Ltd. | | 94,261 | 2,129,727 |
| Barclays Africa Group Ltd. | | 152,614 | 1,512,674 |
| Bidvest Group Ltd. | | 107,056 | 1,298,566 |
| FirstRand Ltd. | | 553,500 | 2,006,321 |
| Imperial Holdings Ltd. | | 215,464 | 3,087,930 |
| Life Healthcare Group Holdings Ltd. | | 634,300 | 1,175,398 |
| MTN Group Ltd. | | 240,600 | 2,089,185 |
| Naspers Ltd. Class N | | 56,545 | 13,777,563 |
| Nedbank Group Ltd. | | 80,580 | 1,181,850 |
| Sasol Ltd. | | 52,800 | 1,542,699 |
| Tiger Brands Ltd. | | 98,900 | 2,700,055 |
|
| TOTAL SOUTH AFRICA | | | 32,501,968 |
|
| Taiwan - 5.7% | | | |
| Advantech Co. Ltd. | | 83,897 | 573,455 |
| Chroma ATE, Inc. | | 166,000 | 809,675 |
| eMemory Technology, Inc. | | 7,995 | 98,021 |
| Genius Electronic Optical Co. Ltd. (a) | | 28,000 | 315,416 |
| GlobalWafers Co. Ltd. | | 374,300 | 4,328,209 |
| Hon Hai Precision Industry Co. Ltd. (Foxconn) | | 270,000 | 1,003,384 |
| King's Town Bank | | 400,600 | 437,978 |
| LandMark Optoelectronics Corp. | | 72,000 | 918,575 |
| Largan Precision Co. Ltd. | | 55,403 | 10,505,944 |
| MediaTek, Inc. | | 57,000 | 647,770 |
| Nanya Technology Corp. | | 517,000 | 1,403,232 |
| PChome Online, Inc. | | 71,032 | 411,278 |
| Quanta Computer, Inc. | | 696,000 | 1,639,658 |
| Taiwan Fertilizer Co. Ltd. | | 387,000 | 505,933 |
| Taiwan Semiconductor Manufacturing Co. Ltd. | | 1,338,000 | 10,824,514 |
| Taiwan Semiconductor Manufacturing Co. Ltd. sponsored ADR | | 11,342 | 480,107 |
| Unified-President Enterprises Corp. | | 1,234,000 | 2,579,534 |
| United Microelectronics Corp. | | 3,770,000 | 1,947,105 |
| Universal Cement Corp. | | 374,219 | 289,933 |
| Wistron NeWeb Corp. | | 30,728 | 88,193 |
| Yuanta Financial Holding Co. Ltd. | | 4,066,231 | 1,807,933 |
|
| TOTAL TAIWAN | | | 41,615,847 |
|
| Thailand - 0.6% | | | |
| Delta Electronics PCL (For. Reg.) | | 236,800 | 613,028 |
| PTT Global Chemical PCL (For. Reg.) | | 1,143,600 | 2,754,004 |
| Star Petroleum Refining PCL | | 1,910,800 | 1,000,840 |
|
| TOTAL THAILAND | | | 4,367,872 |
|
| Turkey - 1.4% | | | |
| Bim Birlesik Magazalar A/S JSC | | 102,000 | 2,079,767 |
| Tupras Turkiye Petrol Rafinerileri A/S | | 74,200 | 2,669,874 |
| Turkcell Iletisim Hizmet A/S | | 554,300 | 2,070,470 |
| Turkcell Iletisim Hizmet A/S sponsored ADR (b) | | 19,500 | 183,105 |
| Turkiye Garanti Bankasi A/S | | 1,213,000 | 3,335,027 |
|
| TOTAL TURKEY | | | 10,338,243 |
|
| United Arab Emirates - 1.2% | | | |
| DP World Ltd. | | 65,964 | 1,566,645 |
| Emaar Properties PJSC | | 1,999,013 | 4,512,224 |
| National Bank of Abu Dhabi PJSC | | 863,602 | 2,433,741 |
|
| TOTAL UNITED ARAB EMIRATES | | | 8,512,610 |
|
| United Kingdom - 0.2% | | | |
| Fresnillo PLC | | 61,500 | 1,063,490 |
| Shanghai International Airport Co. Ltd. ELS (UBS Warrant Programme) warrants 5/11/18 (c) | | 9,200 | 60,664 |
|
| TOTAL UNITED KINGDOM | | | 1,124,154 |
|
| United States of America - 0.4% | | | |
| Cognizant Technology Solutions Corp. Class A | | 25,200 | 1,906,884 |
| MercadoLibre, Inc. | | 3,400 | 817,054 |
|
| TOTAL UNITED STATES OF AMERICA | | | 2,723,938 |
|
| TOTAL COMMON STOCKS | | | |
| (Cost $414,136,019) | | | 487,387,157 |
|
| Nonconvertible Preferred Stocks - 4.7% | | | |
| Brazil - 3.2% | | | |
| Ambev SA sponsored ADR | | 554,300 | 3,508,719 |
| Banco do Estado Rio Grande do Sul SA | | 213,320 | 993,794 |
| Companhia Paranaense de Energia-Copel: | | | |
| (PN-B) | | 4,015 | 30,671 |
| (PN-B) sponsored ADR | | 168,852 | 1,298,472 |
| Fibria Celulose SA sponsored ADR | | 161,700 | 2,577,498 |
| Itau Unibanco Holding SA sponsored ADR | | 515,141 | 6,598,956 |
| Metalurgica Gerdau SA (PN) (a) | | 925,170 | 1,445,180 |
| Petroleo Brasileiro SA - Petrobras (PN) sponsored ADR (non-vtg.) (a) | | 462,406 | 4,739,662 |
| Telefonica Brasil SA | | 150,743 | 2,327,063 |
|
| TOTAL BRAZIL | | | 23,520,015 |
|
| Korea (South) - 1.5% | | | |
| Hyundai Motor Co. Series 2 | | 51,644 | 5,219,412 |
| Samsung Electronics Co. Ltd. | | 1,991 | 3,988,802 |
| Samsung Fire & Marine Insurance Co. Ltd. | | 9,832 | 1,578,445 |
|
| TOTAL KOREA (SOUTH) | | | 10,786,659 |
|
| TOTAL NONCONVERTIBLE PREFERRED STOCKS | | | |
| (Cost $29,356,617) | | | 34,306,674 |
| | | Principal Amount(d) | Value |
|
| Nonconvertible Bonds - 7.4% | | | |
| Azerbaijan - 0.8% | | | |
| Southern Gas Corridor CJSC 6.875% 3/24/26 (c) | | 2,330,000 | 2,632,993 |
| State Oil Co. of Azerbaijan Republic 6.95% 3/18/30 (Reg. S) | | 3,225,000 | 3,544,739 |
|
| TOTAL AZERBAIJAN | | | 6,177,732 |
|
| Bahrain - 0.1% | | | |
| The Oil and Gas Holding Co. 7.5% 10/25/27 (c) | | 455,000 | 472,081 |
| British Virgin Islands - 0.1% | | | |
| 1MDB Global Investments Ltd. 4.4% 3/9/23 | | 1,000,000 | 960,765 |
| Canada - 0.3% | | | |
| First Quantum Minerals Ltd.: | | | |
| 7.25% 5/15/22 (c) | | 450,000 | 470,250 |
| 7.25% 4/1/23 (c) | | 1,700,000 | 1,797,750 |
| 7.5% 4/1/25 (c) | | 200,000 | 211,750 |
|
| TOTAL CANADA | | | 2,479,750 |
|
| Cayman Islands - 0.0% | | | |
| Sparc Em Spc 0% 12/5/22 (c) | | 200,000 | 182,500 |
| Georgia - 0.6% | | | |
| Georgian Oil & Gas Corp. 6.75% 4/26/21 (c) | | 2,000,000 | 2,140,000 |
| JSC BGEO Group 6% 7/26/23 (c) | | 850,000 | 873,511 |
| JSC Georgian Railway 7.75% 7/11/22 (c) | | 1,250,000 | 1,395,338 |
|
| TOTAL GEORGIA | | | 4,408,849 |
|
| Indonesia - 0.2% | | | |
| PT Pertamina Persero 6.5% 5/27/41 (c) | | 1,000,000 | 1,206,769 |
| Ireland - 0.5% | | | |
| Vnesheconombank Via VEB Finance PLC: | | | |
| 6.025% 7/5/22 (c) | | 900,000 | 976,597 |
| 6.8% 11/22/25 (c) | | 2,075,000 | 2,359,420 |
|
| TOTAL IRELAND | | | 3,336,017 |
|
| Israel - 0.0% | | | |
| Israel Electric Corp. Ltd. 7.75% 12/15/27 (Reg. S) | | 275,000 | 353,374 |
| Kazakhstan - 0.1% | | | |
| KazMunaiGaz Finance Sub BV 5.75% 4/19/47 (c) | | 490,000 | 492,450 |
| Mexico - 1.6% | | | |
| Pemex Project Funding Master Trust: | | | |
| 6.625% 6/15/35 | | 3,875,000 | 4,092,000 |
| 8.625% 2/1/22 | | 300,000 | 350,609 |
| Petroleos Mexicanos: | | | |
| 6.5% 3/13/27 (c) | | 500,000 | 546,000 |
| 6.5% 3/13/27 (c) | | 1,505,000 | 1,643,460 |
| 6.5% 6/2/41 | | 3,550,000 | 3,594,375 |
| 6.875% 8/4/26 | | 1,200,000 | 1,348,200 |
|
| TOTAL MEXICO | | | 11,574,644 |
|
| Mongolia - 0.1% | | | |
| Trade and Development Bank of Mongolia LLC 9.375% 5/19/20 (Reg. S) | | 850,000 | 933,738 |
| Morocco - 0.1% | | | |
| OCP SA 6.875% 4/25/44 (c) | | 775,000 | 873,735 |
| Netherlands - 0.4% | | | |
| Petrobras Global Finance BV: | | | |
| 7.25% 3/17/44 | | 705,000 | 739,369 |
| 8.75% 5/23/26 | | 1,675,000 | 2,028,844 |
|
| TOTAL NETHERLANDS | | | 2,768,213 |
|
| Oman - 0.1% | | | |
| Oman Sovereign Sukuk SAOC 4.397% 6/1/24 (c) | | 1,000,000 | 1,000,000 |
| Peru - 0.1% | | | |
| Petroleos Del Peru Petroperu SA: | | | |
| 4.75% 6/19/32 (c) | | 205,000 | 209,551 |
| 5.625% 6/19/47 (c) | | 275,000 | 289,438 |
|
| TOTAL PERU | | | 498,989 |
|
| South Africa - 0.4% | | | |
| Eskom Holdings SOC Ltd. 6.75% 8/6/23 (c) | | 2,825,000 | 2,888,563 |
| Trinidad & Tobago - 0.2% | | | |
| Petroleum Co. of Trinidad & Tobago Ltd.: | | | |
| 6% 5/8/22 (c) | | 285,417 | 288,271 |
| 9.75% 8/14/19 (c) | | 750,000 | 798,750 |
|
| TOTAL TRINIDAD & TOBAGO | | | 1,087,021 |
|
| Tunisia - 0.3% | | | |
| Banque Centrale de Tunisie 5.75% 1/30/25 (c) | | 2,500,000 | 2,478,730 |
| United Arab Emirates - 0.3% | | | |
| Abu Dhabi Crude Oil Pipeline 4.6% 11/2/47 (c) | | 570,000 | 582,434 |
| Dolphin Energy Ltd.: | | | |
| 5.5% 12/15/21 (c) | | 340,000 | 371,422 |
| 5.888% 6/15/19 (c) | | 750,250 | 772,622 |
| DP World Ltd. 6.85% 7/2/37 (Reg. S) | | 500,000 | 618,750 |
|
| TOTAL UNITED ARAB EMIRATES | | | 2,345,228 |
|
| United Kingdom - 0.4% | | | |
| Biz Finance PLC 9.625% 4/27/22 (c) | | 2,450,000 | 2,646,196 |
| Venezuela - 0.7% | | | |
| Petroleos de Venezuela SA: | | | |
| 5.375% 4/12/27 | | 1,750,000 | 505,750 |
| 5.5% 4/12/37 | | 1,000,000 | 287,500 |
| 6% 5/16/24 (c) | | 3,600,000 | 1,017,000 |
| 6% 11/15/26 (Reg. S) | | 2,450,000 | 679,875 |
| 8.5% 10/27/20 (Reg. S) | | 2,625,000 | 2,182,688 |
| 9% 11/17/21 (Reg. S) | | 550,000 | 243,375 |
| 12.75% 2/17/22 (c) | | 600,000 | 271,500 |
|
| TOTAL VENEZUELA | | | 5,187,688 |
|
| TOTAL NONCONVERTIBLE BONDS | | | |
| (Cost $54,219,152) | | | 54,353,032 |
|
| Government Obligations - 18.4% | | | |
| Argentina - 1.6% | | | |
| Argentine Republic: | | | |
| 6.875% 1/26/27 | | 1,800,000 | 1,962,000 |
| 7.125% 7/6/36 | | 400,000 | 430,200 |
| 7.5% 4/22/26 | | 5,960,000 | 6,734,800 |
| 7.82% 12/31/33 | EUR | 1,685,727 | 2,255,904 |
|
| TOTAL ARGENTINA | | | 11,382,904 |
|
| Armenia - 0.3% | | | |
| Republic of Armenia 7.15% 3/26/25 (c) | | 1,820,000 | 2,032,485 |
| Barbados - 0.2% | | | |
| Barbados Government 7% 8/4/22 (c) | | 1,313,000 | 1,185,481 |
| Belarus - 0.2% | | | |
| Belarus Republic: | | | |
| 6.875% 2/28/23 (c) | | 290,000 | 308,183 |
| 7.625% 6/29/27 (c) | | 1,265,000 | 1,394,663 |
|
| TOTAL BELARUS | | | 1,702,846 |
|
| Bolivia - 0.2% | | | |
| Plurinational State of Bolivia 4.5% 3/20/28 (c) | | 1,300,000 | 1,264,250 |
| Brazil - 0.7% | | | |
| Brazilian Federative Republic: | | | |
| 4.625% 1/13/28 | | 500,000 | 496,500 |
| 5% 1/27/45 | | 600,000 | 555,230 |
| 5.625% 2/21/47 | | 800,000 | 815,200 |
| 7.125% 1/20/37 | | 700,000 | 836,150 |
| 8.25% 1/20/34 | | 1,600,000 | 2,079,200 |
| 12.25% 3/6/30 | | 100,000 | 165,750 |
|
| TOTAL BRAZIL | | | 4,948,030 |
|
| Cameroon - 0.3% | | | |
| Cameroon Republic 9.5% 11/19/25 (c) | | 2,050,000 | 2,429,578 |
| Colombia - 0.2% | | | |
| Colombian Republic: | | | |
| 6.125% 1/18/41 | | 575,000 | 676,775 |
| 7.375% 9/18/37 | | 550,000 | 726,000 |
|
| TOTAL COLOMBIA | | | 1,402,775 |
|
| Dominican Republic - 0.3% | | | |
| Dominican Republic: | | | |
| 5.95% 1/25/27 (c) | | 750,000 | 807,375 |
| 6.85% 1/27/45 (c) | | 550,000 | 613,250 |
| 7.45% 4/30/44 (c) | | 425,000 | 504,688 |
|
| TOTAL DOMINICAN REPUBLIC | | | 1,925,313 |
|
| Ecuador - 0.3% | | | |
| Ecuador Republic: | | | |
| 7.95% 6/20/24 (c) | | 200,000 | 202,000 |
| 8.75% 6/2/23 (c) | | 800,000 | 839,200 |
| 8.875% 10/23/27 (c) | | 460,000 | 469,163 |
| 9.625% 6/2/27 (c) | | 200,000 | 215,000 |
| 9.65% 12/13/26 (c) | | 200,000 | 217,000 |
| 10.75% 3/28/22 (c) | | 450,000 | 508,500 |
|
| TOTAL ECUADOR | | | 2,450,863 |
|
| Egypt - 0.8% | | | |
| Arab Republic of Egypt: | | | |
| , yield at date of purchase 20.3492% 12/26/17 | EGP | 11,000,000 | 607,191 |
| 6.125% 1/31/22 (c) | | 800,000 | 834,179 |
| 7.5% 1/31/27 (c) | | 1,250,000 | 1,385,738 |
| 8.5% 1/31/47 (c) | | 2,600,000 | 2,940,787 |
|
| TOTAL EGYPT | | | 5,767,895 |
|
| El Salvador - 0.9% | | | |
| El Salvador Republic: | | | |
| 6.375% 1/18/27 (c) | | 900,000 | 895,500 |
| 7.375% 12/1/19 | | 775,000 | 804,063 |
| 7.625% 2/1/41 (c) | | 1,450,000 | 1,511,625 |
| 7.65% 6/15/35 (Reg. S) | | 900,000 | 938,250 |
| 8.625% 2/28/29 (c) | | 2,160,000 | 2,446,200 |
|
| TOTAL EL SALVADOR | | | 6,595,638 |
|
| Ethiopia - 0.3% | | | |
| Federal Democratic Republic of Ethiopia 6.625% 12/11/24 (c) | | 2,050,000 | 2,111,500 |
| Gabon - 0.2% | | | |
| Gabonese Republic: | | | |
| 6.375% 12/12/24 (c) | | 850,000 | 833,136 |
| 6.95% 6/16/25 (c) | | 800,000 | 800,978 |
|
| TOTAL GABON | | | 1,634,114 |
|
| Ghana - 0.8% | | | |
| Ghana Republic: | | | |
| 7.875% 8/7/23 (Reg.S) | | 1,950,000 | 2,108,535 |
| 8.125% 1/18/26 (c) | | 1,200,000 | 1,302,000 |
| 9.25% 9/15/22 (c) | | 1,350,000 | 1,523,880 |
| 10.75% 10/14/30 (c) | | 600,000 | 799,440 |
|
| TOTAL GHANA | | | 5,733,855 |
|
| Guatemala - 0.2% | | | |
| Guatemalan Republic: | | | |
| 4.375% 6/5/27 (c) | | 800,000 | 796,000 |
| 4.875% 2/13/28 (c) | | 300,000 | 307,842 |
|
| TOTAL GUATEMALA | | | 1,103,842 |
|
| Honduras - 0.2% | | | |
| Republic of Honduras 6.25% 1/19/27 | | 1,150,000 | 1,240,126 |
| Indonesia - 0.1% | | | |
| Indonesian Republic 8.5% 10/12/35 (c) | | 650,000 | 972,540 |
| Iraq - 0.4% | | | |
| Republic of Iraq: | | | |
| 5.8% 1/15/28 (Reg. S) | | 2,600,000 | 2,447,110 |
| 6.752% 3/9/23 (c) | | 385,000 | 385,742 |
|
| TOTAL IRAQ | | | 2,832,852 |
|
| Ivory Coast - 0.2% | | | |
| Ivory Coast: | | | |
| 5.75% 12/31/32 | | 723,750 | 713,560 |
| 6.125% 6/15/33 (c) | | 730,000 | 719,853 |
|
| TOTAL IVORY COAST | | | 1,433,413 |
|
| Jamaica - 0.0% | | | |
| Jamaican Government 8% 3/15/39 | | 200,000 | 249,500 |
| Jordan - 0.7% | | | |
| Jordanian Kingdom: | | | |
| 5.75% 1/31/27 (c) | | 1,050,000 | 1,050,000 |
| 6.125% 1/29/26 (c) | | 2,650,000 | 2,742,750 |
| 7.375% 10/10/47 (c) | | 1,585,000 | 1,658,703 |
|
| TOTAL JORDAN | | | 5,451,453 |
|
| Kuwait - 0.5% | | | |
| State of Kuwait 3.5% 3/20/27 (c) | | 3,740,000 | 3,814,800 |
| Lebanon - 1.7% | | | |
| Lebanese Republic: | | | |
| 4% 12/31/17 | | 98,500 | 98,273 |
| 5.15% 6/12/18 | | 2,050,000 | 2,057,392 |
| 5.15% 11/12/18 | | 100,000 | 100,600 |
| 5.45% 11/28/19 | | 1,750,000 | 1,752,030 |
| 6% 5/20/19 | | 2,675,000 | 2,707,929 |
| 6.1% 10/4/22 | | 2,135,000 | 2,109,619 |
| 6.375% 3/9/20 | | 1,125,000 | 1,142,555 |
| 6.6% 11/27/26 | | 570,000 | 549,695 |
| 6.65% 2/26/30 (Reg. S) | | 680,000 | 636,831 |
| 6.85% 3/23/27 | | 1,000,000 | 973,712 |
|
| TOTAL LEBANON | | | 12,128,636 |
|
| Mongolia - 0.1% | | | |
| Mongolia Government 5.625% 5/1/23 (c) | | 350,000 | 350,913 |
| Mongolian People's Republic 8.75% 3/9/24 (c) | | 450,000 | 517,025 |
|
| TOTAL MONGOLIA | | | 867,938 |
|
| Namibia - 0.1% | | | |
| Republic of Namibia 5.25% 10/29/25 (c) | | 400,000 | 406,320 |
| Nigeria - 0.1% | | | |
| Republic of Nigeria: | | | |
| 6.375% 7/12/23 (c) | | 200,000 | 209,874 |
| 7.875% 2/16/32 (c) | | 400,000 | 439,392 |
|
| TOTAL NIGERIA | | | 649,266 |
|
| Oman - 0.2% | | | |
| Sultanate of Oman: | | | |
| 4.75% 6/15/26 (c) | | 400,000 | 394,480 |
| 5.375% 3/8/27 (c) | | 335,000 | 343,839 |
| 6.5% 3/8/47 (c) | | 780,000 | 802,770 |
|
| TOTAL OMAN | | | 1,541,089 |
|
| Paraguay - 0.2% | | | |
| Republic of Paraguay: | | | |
| 4.7% 3/27/27 (c) | | 800,000 | 840,000 |
| 6.1% 8/11/44 (c) | | 785,000 | 896,863 |
|
| TOTAL PARAGUAY | | | 1,736,863 |
|
| Qatar - 0.5% | | | |
| State of Qatar: | | | |
| 2.375% 6/2/21 | | 850,000 | 831,300 |
| 3.25% 6/2/26 | | 450,000 | 439,650 |
| 9.75% 6/15/30 (Reg. S) | | 1,430,000 | 2,230,800 |
|
| TOTAL QATAR | | | 3,501,750 |
|
| Russia - 0.8% | | | |
| Ministry of Finance Russian Federation 4.75% 5/27/26 (c) | | 1,000,000 | 1,055,560 |
| Russian Federation: | | | |
| 4.25% 6/23/27 (c) | | 800,000 | 815,336 |
| 5.25% 6/23/47 (c) | | 3,000,000 | 3,071,250 |
| 5.625% 4/4/42 (c) | | 600,000 | 661,752 |
|
| TOTAL RUSSIA | | | 5,603,898 |
|
| Rwanda - 0.2% | | | |
| Rwanda Republic 6.625% 5/2/23 (c) | | 1,625,000 | 1,686,055 |
| Saudi Arabia - 0.7% | | | |
| Saudi Arabia Kingdom of: | | | |
| 3.625% 3/4/28 (c) | | 2,225,000 | 2,208,313 |
| 4.5% 10/26/46 (c) | | 2,010,000 | 2,013,513 |
| 4.625% 10/4/47 (c) | | 1,075,000 | 1,100,237 |
|
| TOTAL SAUDI ARABIA | | | 5,322,063 |
|
| Senegal - 0.2% | | | |
| Republic of Senegal 6.25% 5/23/33 (c) | | 1,300,000 | 1,343,745 |
| Sri Lanka - 0.3% | | | |
| Democratic Socialist Republic of Sri Lanka: | | | |
| 6.2% 5/11/27 (c) | | 1,750,000 | 1,859,809 |
| 6.85% 11/3/25 (c) | | 500,000 | 554,993 |
|
| TOTAL SRI LANKA | | | 2,414,802 |
|
| Suriname - 0.3% | | | |
| Republic of Suriname 9.25% 10/26/26 (c) | | 2,350,000 | 2,546,813 |
| Tajikistan - 0.0% | | | |
| Tajikistan Republic 7.125% 9/14/27 (c) | | 275,000 | 264,413 |
| Turkey - 1.3% | | | |
| Turkish Republic: | | | |
| 4.875% 10/9/26 | | 400,000 | 390,613 |
| 5.75% 3/22/24 | | 550,000 | 579,159 |
| 5.75% 5/11/47 | | 1,115,000 | 1,062,595 |
| 6% 3/25/27 | | 2,050,000 | 2,159,060 |
| 6.25% 9/26/22 | | 850,000 | 922,502 |
| 6.875% 3/17/36 | | 1,975,000 | 2,175,107 |
| 7.25% 3/5/38 | | 550,000 | 631,552 |
| 7.375% 2/5/25 | | 350,000 | 401,232 |
| 8% 2/14/34 | | 950,000 | 1,159,846 |
| 11.875% 1/15/30 | | 165,000 | 256,873 |
|
| TOTAL TURKEY | | | 9,738,539 |
|
| Ukraine - 1.4% | | | |
| Ukraine Government: | | | |
| 0% 5/31/40 (c)(e) | | 430,000 | 245,196 |
| 7.375% 9/25/32 (c) | | 1,000,000 | 985,872 |
| 7.75% 9/1/20 (c) | | 1,940,000 | 2,068,137 |
| 7.75% 9/1/21 (c) | | 1,900,000 | 2,028,326 |
| 7.75% 9/1/22 (c) | | 2,200,000 | 2,351,153 |
| 7.75% 9/1/24 (c) | | 500,000 | 524,098 |
| 7.75% 9/1/27 (c) | | 1,650,000 | 1,699,629 |
|
| TOTAL UKRAINE | | | 9,902,411 |
|
| United States of America - 0.2% | | | |
| U.S. Treasury Bills, yield at date of purchase 0.99% to 1.09% 11/24/17 to 1/25/18 (f) | | 1,260,000 | 1,258,271 |
| Uruguay - 0.3% | | | |
| Uruguay Republic: | | | |
| 7.625% 3/21/36 | | 375,000 | 529,688 |
| 7.875% 1/15/33 pay-in-kind | | 930,000 | 1,318,275 |
|
| TOTAL URUGUAY | | | 1,847,963 |
|
| Venezuela - 0.2% | | | |
| Venezuelan Republic: | | | |
| 7% 12/1/18 (Reg. S) | | 200,000 | 124,500 |
| 7% 3/31/38 | | 650,000 | 211,250 |
| 7.75% 10/13/19 (Reg. S) | | 300,000 | 140,250 |
| 9% 5/7/23 (Reg. S) | | 300,000 | 102,750 |
| 9.25% 9/15/27 | | 650,000 | 238,875 |
| 9.25% 5/7/28 (Reg. S) | | 1,000,000 | 330,000 |
| 12.75% 8/23/22 | | 325,000 | 143,000 |
|
| TOTAL VENEZUELA | | | 1,290,625 |
|
| Zambia - 0.0% | | | |
| Republic of Zambia 8.97% 7/30/27 (c) | | 200,000 | 218,040 |
| TOTAL GOVERNMENT OBLIGATIONS | | | |
| (Cost $130,853,342) | | | 133,935,553 |
| | | Shares | Value |
|
| Money Market Funds - 3.2% | | | |
| Fidelity Cash Central Fund, 1.10% (g) | | 22,519,273 | 22,523,777 |
| Fidelity Securities Lending Cash Central Fund 1.11% (g)(h) | | 530,259 | 530,312 |
| TOTAL MONEY MARKET FUNDS | | | |
| (Cost $23,052,369) | | | 23,054,089 |
| TOTAL INVESTMENT IN SECURITIES - 100.5% | | | |
| (Cost $651,617,499) | | | 733,036,505 |
| NET OTHER ASSETS (LIABILITIES) - (0.5)% | | | (3,583,275) |
| NET ASSETS - 100% | | | $729,453,230 |
Currency Abbreviations
EGP – Egyptian pound
EUR – European Monetary Unit
Security Type Abbreviations
ELS – Equity-Linked Security
Categorizations in the Schedule of Investments are based on country or territory of incorporation.
Legend
(a) Non-income producing
(b) Security or a portion of the security is on loan at period end.
(c) Security exempt from registration under Rule 144A of the Securities Act of 1933. These securities may be resold in transactions exempt from registration, normally to qualified institutional buyers. At the end of the period, the value of these securities amounted to $109,868,455 or 15.1% of net assets.
(d) Amount is stated in United States dollars unless otherwise noted.
(e) Coupon rates for floating and adjustable rate securities reflect the rates in effect at period end.
(f) Security or a portion of the security was pledged to cover margin requirements for futures contracts. At period end, the value of securities pledged amounted to $22,986.
(g) Affiliated fund that is generally available only to investment companies and other accounts managed by Fidelity Investments. The rate quoted is the annualized seven-day yield of the fund at period end. A complete unaudited listing of the fund's holdings as of its most recent quarter end is available upon request. In addition, each Fidelity Central Fund's financial statements, which are not covered by the Fund's Report of Independent Registered Public Accounting Firm, are available on the SEC's website or upon request.
(h) Investment made with cash collateral received from securities on loan.
Affiliated Central Funds
Information regarding fiscal year to date income earned by the Fund from investments in Fidelity Central Funds is as follows:
| Fund | Income earned |
| Fidelity Cash Central Fund | $244,061 |
| Fidelity Securities Lending Cash Central Fund | 844 |
| Total | $244,905 |
Investment Valuation
The following is a summary of the inputs used, as of October 31, 2017, involving the Fund's assets and liabilities carried at fair value. The inputs or methodology used for valuing securities may not be an indication of the risk associated with investing in those securities. For more information on valuation inputs, and their aggregation into the levels used below, please refer to the Investment Valuation section in the accompanying Notes to Financial Statements.
| | Valuation Inputs at Reporting Date: |
| Description | Total | Level 1 | Level 2 | Level 3 |
| Investments in Securities: | | | | |
| Equities: | | | | |
| Consumer Discretionary | $75,704,394 | $74,785,771 | $918,623 | $-- |
| Consumer Staples | 31,662,744 | 31,662,744 | -- | -- |
| Energy | 34,935,547 | 29,418,263 | 5,517,284 | -- |
| Financials | 121,317,609 | 93,890,394 | 27,427,215 | -- |
| Health Care | 12,540,022 | 12,540,022 | -- | -- |
| Industrials | 26,688,694 | 26,166,200 | 522,494 | -- |
| Information Technology | 130,653,721 | 86,654,851 | 43,998,870 | -- |
| Materials | 39,772,269 | 38,229,570 | 1,542,699 | -- |
| Real Estate | 13,921,407 | 13,921,407 | -- | -- |
| Telecommunication Services | 21,805,155 | 19,957,342 | 1,847,813 | -- |
| Utilities | 12,692,269 | 11,688,136 | 1,004,133 | -- |
| Corporate Bonds | 54,353,032 | -- | 54,353,032 | -- |
| Government Obligations | 133,935,553 | -- | 133,935,553 | -- |
| Money Market Funds | 23,054,089 | 23,054,089 | -- | -- |
| Total Investments in Securities: | $733,036,505 | $461,968,789 | $271,067,716 | $-- |
Other Information
The composition of credit quality ratings as a percentage of Total Net Assets is as follows (Unaudited):
| AAA,AA,A | 1.9% |
| BBB | 3.1% |
| BB | 5.5% |
| B | 9.2% |
| CCC,CC,C | 4.1% |
| Not Rated | 1.8% |
| Equities | 71.5% |
| Short-Term Investments and Net Other Assets | 2.9% |
| | 100% |
We have used ratings from Moody's Investors Service, Inc. Where Moody's® ratings are not available, we have used S&P® ratings. All ratings are as of the date indicated and do not reflect subsequent changes.
See accompanying notes which are an integral part of the financial statements.
Financial Statements
Statement of Assets and Liabilities
| | | October 31, 2017 |
| Assets | | |
Investment in securities, at value (including securities loaned of $537,513) — See accompanying schedule:
Unaffiliated issuers (cost $628,565,130) | $709,982,416 | |
| Fidelity Central Funds (cost $23,052,369) | 23,054,089 | |
| Total Investment in Securities (cost $651,617,499) | | $733,036,505 |
| Cash | | 113,914 |
| Foreign currency held at value (cost $3,570,444) | | 3,570,533 |
| Receivable for investments sold | | 2,599,057 |
| Receivable for fund shares sold | | 1,390,868 |
| Dividends receivable | | 240,266 |
| Interest receivable | | 3,247,865 |
| Distributions receivable from Fidelity Central Funds | | 27,038 |
| Receivable for daily variation margin on futures contracts | | 2,451 |
| Prepaid expenses | | 1,338 |
| Other receivables | | 58,074 |
| Total assets | | 744,287,909 |
| Liabilities | | |
| Payable for investments purchased | $12,215,399 | |
| Payable for fund shares redeemed | 592,970 | |
| Accrued management fee | 473,747 | |
| Distribution and service plan fees payable | 40,200 | |
| Other affiliated payables | 143,675 | |
| Other payables and accrued expenses | 838,363 | |
| Collateral on securities loaned | 530,325 | |
| Total liabilities | | 14,834,679 |
| Net Assets | | $729,453,230 |
| Net Assets consist of: | | |
| Paid in capital | | $633,979,823 |
| Undistributed net investment income | | 8,176,283 |
| Accumulated undistributed net realized gain (loss) on investments and foreign currency transactions | | 6,528,325 |
| Net unrealized appreciation (depreciation) on investments and assets and liabilities in foreign currencies | | 80,768,799 |
| Net Assets | | $729,453,230 |
| Calculation of Maximum Offering Price | | |
| Class A: | | |
| Net Asset Value and redemption price per share ($42,213,197 ÷ 3,113,526 shares) | | $13.56 |
| Maximum offering price per share (100/94.25 of $13.56) | | $14.39 |
| Class M: | | |
| Net Asset Value and redemption price per share ($8,751,133 ÷ 645,717 shares) | | $13.55 |
| Maximum offering price per share (100/96.50 of $13.55) | | $14.04 |
| Class C: | | |
| Net Asset Value and offering price per share ($34,869,073 ÷ 2,593,161 shares)(a) | | $13.45 |
| Total Emerging Markets: | | |
| Net Asset Value, offering price and redemption price per share ($272,002,329 ÷ 20,025,803 shares) | | $13.58 |
| Class I: | | |
| Net Asset Value, offering price and redemption price per share ($371,617,498 ÷ 27,372,128 shares) | | $13.58 |
(a) Redemption price per share is equal to net asset value less any applicable contingent deferred sales charge.
See accompanying notes which are an integral part of the financial statements.
Statement of Operations
| | | Year ended October 31, 2017 |
| Investment Income | | |
| Dividends | | $6,855,253 |
| Interest | | 8,087,674 |
| Income from Fidelity Central Funds | | 244,905 |
| Income before foreign taxes withheld | | 15,187,832 |
| Less foreign taxes withheld | | (730,979) |
| Total income | | 14,456,853 |
| Expenses | | |
| Management fee | $3,323,128 | |
| Transfer agent fees | 918,799 | |
| Distribution and service plan fees | 296,574 | |
| Accounting and security lending fees | 210,959 | |
| Custodian fees and expenses | 452,198 | |
| Independent trustees' fees and expenses | 1,431 | |
| Registration fees | 142,124 | |
| Audit | 114,128 | |
| Legal | 1,055 | |
| Miscellaneous | 2,176 | |
| Total expenses before reductions | 5,462,572 | |
| Expense reductions | (57,073) | 5,405,499 |
| Net investment income (loss) | | 9,051,354 |
| Realized and Unrealized Gain (Loss) | | |
| Net realized gain (loss) on: | | |
| Investment securities: | | |
| Unaffiliated issuers (net of foreign taxes of $73,623) | 7,876,815 | |
| Fidelity Central Funds | (456) | |
| Foreign currency transactions | (25,456) | |
| Futures contracts | 2,923,167 | |
| Total net realized gain (loss) | | 10,774,070 |
| Change in net unrealized appreciation (depreciation) on: | | |
| Unaffiliated issuers (net of increase in deferred foreign taxes of $590,231) | 71,407,533 | |
| Fidelity Central Funds | (994) | |
| Assets and liabilities in foreign currencies | 6,395 | |
| Futures contracts | (14,320) | |
| Total change in net unrealized appreciation (depreciation) | | 71,398,614 |
| Net gain (loss) | | 82,172,684 |
| Net increase (decrease) in net assets resulting from operations | | $91,224,038 |
See accompanying notes which are an integral part of the financial statements.
Statement of Changes in Net Assets
| | Year ended October 31, 2017 | Year ended October 31, 2016 |
| Increase (Decrease) in Net Assets | | |
| Operations | | |
| Net investment income (loss) | $9,051,354 | $2,170,894 |
| Net realized gain (loss) | 10,774,070 | (1,751,096) |
| Change in net unrealized appreciation (depreciation) | 71,398,614 | 9,508,420 |
| Net increase (decrease) in net assets resulting from operations | 91,224,038 | 9,928,218 |
| Distributions to shareholders from net investment income | (1,957,793) | (1,715,467) |
| Distributions to shareholders from net realized gain | (138,064) | – |
| Total distributions | (2,095,857) | (1,715,467) |
| Share transactions - net increase (decrease) | 485,742,909 | 80,624,262 |
| Redemption fees | 215,914 | 36,372 |
| Total increase (decrease) in net assets | 575,087,004 | 88,873,385 |
| Net Assets | | |
| Beginning of period | 154,366,226 | 65,492,841 |
| End of period | $729,453,230 | $154,366,226 |
| Other Information | | |
| Undistributed net investment income end of period | $8,176,283 | $1,743,575 |
See accompanying notes which are an integral part of the financial statements.
Financial Highlights
Fidelity Total Emerging Markets Fund Class A
| Years ended October 31, | 2017 | 2016 | 2015 | 2014 | 2013 |
| Selected Per–Share Data | | | | | |
| Net asset value, beginning of period | $11.33 | $10.35 | $11.56 | $11.37 | $10.86 |
| Income from Investment Operations | | | | | |
| Net investment income (loss)A | .24 | .26 | .28 | .18 | .18 |
| Net realized and unrealized gain (loss) | 2.11 | .96 | (1.30) | .19 | .48 |
| Total from investment operations | 2.35 | 1.22 | (1.02) | .37 | .66 |
| Distributions from net investment income | (.12) | (.24) | (.17) | (.18) | (.15) |
| Distributions from net realized gain | (.01) | – | (.02) | – | (.01) |
| Total distributions | (.13) | (.24) | (.19) | (.18) | (.16) |
| Redemption fees added to paid in capitalA | .01 | –B | –B | –B | .01 |
| Net asset value, end of period | $13.56 | $11.33 | $10.35 | $11.56 | $11.37 |
| Total ReturnC,D | 21.13% | 12.13% | (8.92)% | 3.30% | 6.23% |
| Ratios to Average Net AssetsE,F | | | | | |
| Expenses before reductions | 1.47% | 1.87% | 1.93% | 1.98% | 1.89% |
| Expenses net of fee waivers, if any | 1.47% | 1.65% | 1.65% | 1.65% | 1.65% |
| Expenses net of all reductions | 1.46% | 1.64% | 1.64% | 1.65% | 1.62% |
| Net investment income (loss) | 1.97% | 2.47% | 2.58% | 1.61% | 1.61% |
| Supplemental Data | | | | | |
| Net assets, end of period (000 omitted) | $42,213 | $15,206 | $10,164 | $13,627 | $18,837 |
| Portfolio turnover rateG | 59% | 57% | 80% | 102% | 120% |
A Calculated based on average shares outstanding during the period.
B Amount represents less than $.005 per share.
C Total returns would have been lower if certain expenses had not been reduced during the applicable periods shown.
D Total returns do not include the effect of the sales charges.
E Fees and expenses of any underlying Fidelity Central Funds are not included in the Fund's expense ratio. The Fund indirectly bears its proportionate share of the expenses of any underlying Fidelity Central Funds.
F Expense ratios reflect operating expenses of the class. Expenses before reductions do not reflect amounts reimbursed by the investment adviser or reductions from brokerage service arrangements or reductions from other expense offset arrangements and do not represent the amount paid by the class during periods when reimbursements or reductions occur. Expenses net of fee waivers reflect expenses after reimbursement by the investment adviser but prior to reductions from brokerage service arrangements or other expense offset arrangements. Expenses net of all reductions represent the net expenses paid by the class.
G Amount does not include the portfolio activity of any underlying Fidelity Central Funds.
See accompanying notes which are an integral part of the financial statements.
Fidelity Total Emerging Markets Fund Class M
| Years ended October 31, | 2017 | 2016 | 2015 | 2014 | 2013 |
| Selected Per–Share Data | | | | | |
| Net asset value, beginning of period | $11.33 | $10.33 | $11.54 | $11.34 | $10.84 |
| Income from Investment Operations | | | | | |
| Net investment income (loss)A | .20 | .23 | .25 | .15 | .15 |
| Net realized and unrealized gain (loss) | 2.11 | .97 | (1.30) | .19 | .48 |
| Total from investment operations | 2.31 | 1.20 | (1.05) | .34 | .63 |
| Distributions from net investment income | (.09) | (.20) | (.14) | (.14) | (.12) |
| Distributions from net realized gain | (.01) | – | (.02) | – | (.01) |
| Total distributions | (.10) | (.20) | (.16) | (.14) | (.14)B |
| Redemption fees added to paid in capitalA | .01 | –C | –C | –C | .01 |
| Net asset value, end of period | $13.55 | $11.33 | $10.33 | $11.54 | $11.34 |
| Total ReturnD,E | 20.66% | 11.92% | (9.18)% | 3.04% | 5.93% |
| Ratios to Average Net AssetsF,G | | | | | |
| Expenses before reductions | 1.82% | 2.22% | 2.27% | 2.32% | 2.13% |
| Expenses net of fee waivers, if any | 1.82% | 1.90% | 1.90% | 1.90% | 1.90% |
| Expenses net of all reductions | 1.81% | 1.90% | 1.89% | 1.90% | 1.88% |
| Net investment income (loss) | 1.62% | 2.22% | 2.33% | 1.36% | 1.36% |
| Supplemental Data | | | | | |
| Net assets, end of period (000 omitted) | $8,751 | $3,019 | $3,331 | $5,277 | $5,967 |
| Portfolio turnover rateH | 59% | 57% | 80% | 102% | 120% |
A Calculated based on average shares outstanding during the period.
B Total distributions of $.14 per share is comprised of distributions from net investment income of $.124 and distributions from net realized gain of $.014 per share.
C Amount represents less than $.005 per share.
D Total returns would have been lower if certain expenses had not been reduced during the applicable periods shown.
E Total returns do not include the effect of the sales charges.
F Fees and expenses of any underlying Fidelity Central Funds are not included in the Fund's expense ratio. The Fund indirectly bears its proportionate share of the expenses of any underlying Fidelity Central Funds.
G Expense ratios reflect operating expenses of the class. Expenses before reductions do not reflect amounts reimbursed by the investment adviser or reductions from brokerage service arrangements or reductions from other expense offset arrangements and do not represent the amount paid by the class during periods when reimbursements or reductions occur. Expenses net of fee waivers reflect expenses after reimbursement by the investment adviser but prior to reductions from brokerage service arrangements or other expense offset arrangements. Expenses net of all reductions represent the net expenses paid by the class.
H Amount does not include the portfolio activity of any underlying Fidelity Central Funds.
See accompanying notes which are an integral part of the financial statements.
Fidelity Total Emerging Markets Fund Class C
| Years ended October 31, | 2017 | 2016 | 2015 | 2014 | 2013 |
| Selected Per–Share Data | | | | | |
| Net asset value, beginning of period | $11.25 | $10.25 | $11.47 | $11.29 | $10.80 |
| Income from Investment Operations | | | | | |
| Net investment income (loss)A | .15 | .18 | .20 | .10 | .09 |
| Net realized and unrealized gain (loss) | 2.11 | .97 | (1.30) | .19 | .47 |
| Total from investment operations | 2.26 | 1.15 | (1.10) | .29 | .56 |
| Distributions from net investment income | (.06) | (.15) | (.10) | (.11) | (.07) |
| Distributions from net realized gain | (.01) | – | (.02) | – | (.01) |
| Total distributions | (.07) | (.15) | (.12) | (.11) | (.08) |
| Redemption fees added to paid in capitalA | .01 | –B | –B | –B | .01 |
| Net asset value, end of period | $13.45 | $11.25 | $10.25 | $11.47 | $11.29 |
| Total ReturnC,D | 20.29% | 11.36% | (9.68)% | 2.56% | 5.31% |
| Ratios to Average Net AssetsE,F | | | | | |
| Expenses before reductions | 2.21% | 2.62% | 2.68% | 2.72% | 2.65% |
| Expenses net of fee waivers, if any | 2.21% | 2.40% | 2.40% | 2.40% | 2.40% |
| Expenses net of all reductions | 2.20% | 2.39% | 2.39% | 2.40% | 2.37% |
| Net investment income (loss) | 1.23% | 1.72% | 1.83% | .86% | .86% |
| Supplemental Data | | | | | |
| Net assets, end of period (000 omitted) | $34,869 | $10,710 | $7,736 | $10,104 | $7,436 |
| Portfolio turnover rateG | 59% | 57% | 80% | 102% | 120% |
A Calculated based on average shares outstanding during the period.
B Amount represents less than $.005 per share.
C Total returns would have been lower if certain expenses had not been reduced during the applicable periods shown.
D Total returns do not include the effect of the contingent deferred sales charge.
E Fees and expenses of any underlying Fidelity Central Funds are not included in the Fund's expense ratio. The Fund indirectly bears its proportionate share of the expenses of any underlying Fidelity Central Funds.
F Expense ratios reflect operating expenses of the class. Expenses before reductions do not reflect amounts reimbursed by the investment adviser or reductions from brokerage service arrangements or reductions from other expense offset arrangements and do not represent the amount paid by the class during periods when reimbursements or reductions occur. Expenses net of fee waivers reflect expenses after reimbursement by the investment adviser but prior to reductions from brokerage service arrangements or other expense offset arrangements. Expenses net of all reductions represent the net expenses paid by the class.
G Amount does not include the portfolio activity of any underlying Fidelity Central Funds.
See accompanying notes which are an integral part of the financial statements.
Fidelity Total Emerging Markets Fund
| Years ended October 31, | 2017 | 2016 | 2015 | 2014 | 2013 |
| Selected Per–Share Data | | | | | |
| Net asset value, beginning of period | $11.34 | $10.38 | $11.60 | $11.40 | $10.89 |
| Income from Investment Operations | | | | | |
| Net investment income (loss)A | .27 | .28 | .31 | .21 | .21 |
| Net realized and unrealized gain (loss) | 2.10 | .97 | (1.31) | .19 | .47 |
| Total from investment operations | 2.37 | 1.25 | (1.00) | .40 | .68 |
| Distributions from net investment income | (.14) | (.29) | (.20) | (.20) | (.17) |
| Distributions from net realized gain | (.01) | – | (.02) | – | (.01) |
| Total distributions | (.14)B | (.29) | (.22) | (.20) | (.18) |
| Redemption fees added to paid in capitalA | .01 | –C | –C | –C | .01 |
| Net asset value, end of period | $13.58 | $11.34 | $10.38 | $11.60 | $11.40 |
| Total ReturnD | 21.37% | 12.44% | (8.74)% | 3.56% | 6.44% |
| Ratios to Average Net AssetsE,F | | | | | |
| Expenses before reductions | 1.26% | 1.62% | 1.72% | 1.73% | 1.56% |
| Expenses net of fee waivers, if any | 1.26% | 1.40% | 1.40% | 1.40% | 1.40% |
| Expenses net of all reductions | 1.24% | 1.39% | 1.39% | 1.40% | 1.38% |
| Net investment income (loss) | 2.18% | 2.72% | 2.83% | 1.86% | 1.85% |
| Supplemental Data | | | | | |
| Net assets, end of period (000 omitted) | $272,002 | $104,332 | $37,918 | $45,763 | $49,959 |
| Portfolio turnover rateG | 59% | 57% | 80% | 102% | 120% |
A Calculated based on average shares outstanding during the period.
B Total distributions of $.14 per share is comprised of distributions from net investment income of $.135 and distributions from net realized gain of $.009 per share.
C Amount represents less than $.005 per share.
D Total returns would have been lower if certain expenses had not been reduced during the applicable periods shown.
E Fees and expenses of any underlying Fidelity Central Funds are not included in the Fund's expense ratio. The Fund indirectly bears its proportionate share of the expenses of any underlying Fidelity Central Funds.
F Expense ratios reflect operating expenses of the class. Expenses before reductions do not reflect amounts reimbursed by the investment adviser or reductions from brokerage service arrangements or reductions from other expense offset arrangements and do not represent the amount paid by the class during periods when reimbursements or reductions occur. Expenses net of fee waivers reflect expenses after reimbursement by the investment adviser but prior to reductions from brokerage service arrangements or other expense offset arrangements. Expenses net of all reductions represent the net expenses paid by the class.
G Amount does not include the portfolio activity of any underlying Fidelity Central Funds.
See accompanying notes which are an integral part of the financial statements.
Fidelity Total Emerging Markets Fund Class I
| Years ended October 31, | 2017 | 2016 | 2015 | 2014 | 2013 |
| Selected Per–Share Data | | | | | |
| Net asset value, beginning of period | $11.33 | $10.37 | $11.59 | $11.40 | $10.89 |
| Income from Investment Operations | | | | | |
| Net investment income (loss)A | .28 | .29 | .31 | .21 | .20 |
| Net realized and unrealized gain (loss) | 2.11 | .96 | (1.31) | .18 | .48 |
| Total from investment operations | 2.39 | 1.25 | (1.00) | .39 | .68 |
| Distributions from net investment income | (.14) | (.29) | (.20) | (.20) | (.17) |
| Distributions from net realized gain | (.01) | – | (.02) | – | (.01) |
| Total distributions | (.15) | (.29) | (.22) | (.20) | (.18) |
| Redemption fees added to paid in capitalA | .01 | –B | –B | –B | .01 |
| Net asset value, end of period | $13.58 | $11.33 | $10.37 | $11.59 | $11.40 |
| Total ReturnC | 21.51% | 12.48% | (8.74)% | 3.51% | 6.44% |
| Ratios to Average Net AssetsD,E | | | | | |
| Expenses before reductions | 1.19% | 1.54% | 1.58% | 1.71% | 1.63% |
| Expenses net of fee waivers, if any | 1.19% | 1.40% | 1.40% | 1.40% | 1.40% |
| Expenses net of all reductions | 1.17% | 1.39% | 1.39% | 1.40% | 1.37% |
| Net investment income (loss) | 2.25% | 2.72% | 2.83% | 1.86% | 1.86% |
| Supplemental Data | | | | | |
| Net assets, end of period (000 omitted) | $371,617 | $21,099 | $6,343 | $4,773 | $5,354 |
| Portfolio turnover rateF | 59% | 57% | 80% | 102% | 120% |
A Calculated based on average shares outstanding during the period.
B Amount represents less than $.005 per share.
C Total returns would have been lower if certain expenses had not been reduced during the applicable periods shown.
D Fees and expenses of any underlying Fidelity Central Funds are not included in the Fund's expense ratio. The Fund indirectly bears its proportionate share of the expenses of any underlying Fidelity Central Funds.
E Expense ratios reflect operating expenses of the class. Expenses before reductions do not reflect amounts reimbursed by the investment adviser or reductions from brokerage service arrangements or reductions from other expense offset arrangements and do not represent the amount paid by the class during periods when reimbursements or reductions occur. Expenses net of fee waivers reflect expenses after reimbursement by the investment adviser but prior to reductions from brokerage service arrangements or other expense offset arrangements. Expenses net of all reductions represent the net expenses paid by the class.
F Amount does not include the portfolio activity of any underlying Fidelity Central Funds.
See accompanying notes which are an integral part of the financial statements.
Notes to Financial Statements
For the period ended October 31, 2017
1. Organization.
Fidelity Total Emerging Markets Fund (the Fund) is a fund of Fidelity Investment Trust (the Trust) and is authorized to issue an unlimited number of shares. The Trust is registered under the Investment Company Act of 1940, as amended (the 1940 Act), as an open-end management investment company organized as a Massachusetts business trust. The Fund offers Class A, Class M (formerly Class T), Class C, Total Emerging Markets and Class I shares, each of which has equal rights as to assets and voting privileges. Each class has exclusive voting rights with respect to matters that affect that class. The Fund's investments in emerging markets can be subject to social, economic, regulatory, and political uncertainties and can be extremely volatile.
2. Investments in Fidelity Central Funds.
The Fund invests in Fidelity Central Funds, which are open-end investment companies generally available only to other investment companies and accounts managed by the investment adviser and its affiliates. The Fund's Schedule of Investments lists each of the Fidelity Central Funds held as of period end, if any, as an investment of the Fund, but does not include the underlying holdings of each Fidelity Central Fund. As an Investing Fund, the Fund indirectly bears its proportionate share of the expenses of the underlying Fidelity Central Funds.
The Money Market Central Funds seek preservation of capital and current income and are managed by Fidelity Investments Money Management, Inc. (FIMM), an affiliate of the investment adviser. Annualized expenses of the Money Market Central Funds as of their most recent shareholder report date are less than .005%.
A complete unaudited list of holdings for each Fidelity Central Fund is available upon request or at the Securities and Exchange Commission (the SEC) website at www.sec.gov. In addition, the financial statements of the Fidelity Central Funds, which are not covered by the Fund's Report of Independent Registered Public Accounting Firm, are available on the SEC website or upon request.
3. Significant Accounting Policies.
The Fund is an investment company and applies the accounting and reporting guidance of the Financial Accounting Standards Board (FASB) Accounting Standards Codification Topic 946 Financial Services – Investments Companies. The financial statements have been prepared in conformity with accounting principles generally accepted in the United States of America (GAAP), which require management to make certain estimates and assumptions at the date of the financial statements. Actual results could differ from those estimates. Subsequent events, if any, through the date that the financial statements were issued have been evaluated in the preparation of the financial statements. The following summarizes the significant accounting policies of the Fund:
Investment Valuation. Investments are valued as of 4:00 p.m. Eastern time on the last calendar day of the period. The Board of Trustees (the Board) has delegated the day to day responsibility for the valuation of the Fund's investments to the Fair Value Committee (the Committee) established by the Fund's investment adviser. In accordance with valuation policies and procedures approved by the Board, the Fund attempts to obtain prices from one or more third party pricing vendors or brokers to value its investments. When current market prices, quotations or currency exchange rates are not readily available or reliable, investments will be fair valued in good faith by the Committee, in accordance with procedures adopted by the Board. Factors used in determining fair value vary by investment type and may include market or investment specific events, changes in interest rates and credit quality. The frequency with which these procedures are used cannot be predicted and they may be utilized to a significant extent. The Committee oversees the Fund's valuation policies and procedures and reports to the Board on the Committee's activities and fair value determinations. The Board monitors the appropriateness of the procedures used in valuing the Fund's investments and ratifies the fair value determinations of the Committee.
The Fund categorizes the inputs to valuation techniques used to value its investments into a disclosure hierarchy consisting of three levels as shown below:
- Level 1 – quoted prices in active markets for identical investments
- Level 2 – other significant observable inputs (including quoted prices for similar investments, interest rates, prepayment speeds, etc.)
- Level 3 – unobservable inputs (including the Fund's own assumptions based on the best information available)
Valuation techniques used to value the Fund's investments by major category are as follows:
Equity securities, including restricted securities, for which market quotations are readily available, are valued at the last reported sale price or official closing price as reported by a third party pricing vendor on the primary market or exchange on which they are traded and are categorized as Level 1 in the hierarchy. In the event there were no sales during the day or closing prices are not available, securities are valued at the last quoted bid price or may be valued using the last available price and are generally categorized as Level 2 in the hierarchy. For foreign equity securities, when market or security specific events arise, comparisons to the valuation of American Depositary Receipts (ADRs), futures contracts, Exchange-Traded Funds (ETFs) and certain indexes as well as quoted prices for similar securities may be used and would be categorized as Level 2 in the hierarchy. Utilizing these techniques may result in transfers between Level 1 and Level 2. For equity securities, including restricted securities, where observable inputs are limited, assumptions about market activity and risk are used and these securities may be categorized as Level 3 in the hierarchy.
Debt securities, including restricted securities, are valued based on evaluated prices received from third party pricing vendors or from brokers who make markets in such securities. Corporate bonds, foreign government and government agency obligations and U.S. government and government agency obligations are valued by pricing vendors who utilize matrix pricing which considers yield or price of bonds of comparable quality, coupon, maturity and type or by broker-supplied prices. When independent prices are unavailable or unreliable, debt securities may be valued utilizing pricing methodologies which consider similar factors that would be used by third party pricing vendors. Debt securities are generally categorized as Level 2 in the hierarchy but may be Level 3 depending on the circumstances.
Investments in open-end mutual funds, including the Fidelity Central Funds, are valued at their closing net asset value (NAV) each business day and are categorized as Level 1 in the hierarchy.
Changes in valuation techniques may result in transfers in or out of an assigned level within the disclosure hierarchy. The aggregate value of investments by input level as of October 31, 2017 is included at the end of the Fund's Schedule of Investments.
Foreign Currency. The Fund may use foreign currency contracts to facilitate transactions in foreign-denominated securities. Gains and losses from these transactions may arise from changes in the value of the foreign currency or if the counterparties do not perform under the contracts' terms.
Foreign-denominated assets, including investment securities, and liabilities are translated into U.S. dollars at the exchange rates at period end. Purchases and sales of investment securities, income and dividends received and expenses denominated in foreign currencies are translated into U.S. dollars at the exchange rate in effect on the transaction date.
The effects of exchange rate fluctuations on investments are included with the net realized and unrealized gain (loss) on investment securities. Other foreign currency transactions resulting in realized and unrealized gain (loss) are disclosed separately.
Investment Transactions and Income. For financial reporting purposes, the Fund's investment holdings and NAV include trades executed through the end of the last business day of the period. The NAV per share for processing shareholder transactions is calculated as of the close of business of the New York Stock Exchange (NYSE), normally 4:00 p.m. Eastern time and includes trades executed through the end of the prior business day. Gains and losses on securities sold are determined on the basis of identified cost and includes proceeds received from litigation. Dividend income is recorded on the ex-dividend date, except for certain dividends from foreign securities where the ex-dividend date may have passed, which are recorded as soon as the Fund is informed of the ex-dividend date. Non-cash dividends included in dividend income, if any, are recorded at the fair market value of the securities received. Income and capital gain distributions from Fidelity Central Funds, if any, are recorded on the ex-dividend date. Certain distributions received by the Fund represent a return of capital or capital gain. The Fund determines the components of these distributions subsequent to the ex-dividend date, based upon receipt of tax filings or other correspondence relating to the underlying investment. These distributions are recorded as a reduction of cost of investments and/or as a realized gain. Interest income is accrued as earned and includes coupon interest and amortization of premium and accretion of discount on debt securities as applicable. Paid in Kind (PIK) income is recorded at the fair market value of the securities received. Investment income is recorded net of foreign taxes withheld where recovery of such taxes is uncertain. Debt obligations may be placed on non-accrual status and related interest income may be reduced by ceasing current accruals and writing off interest receivables when the collection of all or a portion of interest has become doubtful based on consistently applied procedures. A debt obligation is removed from non-accrual status when the issuer resumes interest payments or when collectability of interest is reasonably assured.
Class Allocations and Expenses. Investment income, realized and unrealized capital gains and losses, common expenses of the Fund, and certain fund-level expense reductions, if any, are allocated daily on a pro-rata basis to each class based on the relative net assets of each class to the total net assets of the Fund. Each class differs with respect to transfer agent and distribution and service plan fees incurred. Certain expense reductions may also differ by class. For the reporting period, the allocated portion of income and expenses to each class as a percent of its average net assets may vary due to the timing of recording these transactions in relation to fluctuating net assets of the classes. Expenses directly attributable to a fund are charged to that fund. Expenses attributable to more than one fund are allocated among the respective funds on the basis of relative net assets or other appropriate methods. Expense estimates are accrued in the period to which they relate and adjustments are made when actual amounts are known.
Income Tax Information and Distributions to Shareholders. Each year, the Fund intends to qualify as a regulated investment company under Subchapter M of the Internal Revenue Code, including distributing substantially all of its taxable income and realized gains. As a result, no provision for U.S. Federal income taxes is required. As of October 31, 2017, the Fund did not have any unrecognized tax benefits in the financial statements; nor is the Fund aware of any tax positions for which it is reasonably possible that the total amounts of unrecognized tax benefits will significantly change in the next twelve months. The Fund files a U.S. federal tax return, in addition to state and local tax returns as required. The Fund's federal income tax returns are subject to examination by the Internal Revenue Service (IRS) for a period of three fiscal years after they are filed. State and local tax returns may be subject to examination for an additional fiscal year depending on the jurisdiction. Foreign taxes are provided for based on the Fund's understanding of the tax rules and rates that exist in the foreign markets in which it invests. The Fund is subject to a tax imposed on capital gains by certain countries in which it invests. An estimated deferred tax liability for net unrealized appreciation on the applicable securities is included in Other payables and accrued expenses on the Statement of Assets & Liabilities.
Distributions are declared and recorded on the ex-dividend date. Income dividends and capital gain distributions are declared separately for each class. Income and capital gain distributions are determined in accordance with income tax regulations, which may differ from GAAP. In addition, the Fund claimed a portion of the payment made to redeeming shareholders as a distribution for income tax purposes.
Capital accounts within the financial statements are adjusted for permanent book-tax differences. These adjustments have no impact on net assets or the results of operations. Capital accounts are not adjusted for temporary book-tax differences which will reverse in a subsequent period.
Book-tax differences are primarily due to foreign currency transactions, futures contracts, certain foreign taxes, market discount, passive foreign investment companies (PFIC), capital loss carryforwards and losses deferred due to wash sales.
As of period end, the cost and unrealized appreciation (depreciation) in securities, and derivatives if applicable, for federal income tax purposes were as follows:
| Gross unrealized appreciation | $91,467,171 |
| Gross unrealized depreciation | (13,204,240) |
| Net unrealized appreciation (depreciation) | $78,262,931 |
| Tax Cost | $654,773,574 |
The tax-based components of distributable earnings as of period end were as follows:
| Undistributed ordinary income | $13,651,307 |
| Undistributed long-term capital gain | $4,214,487 |
| Net unrealized appreciation (depreciation) on securities and other investments | $78,261,164 |
The tax character of distributions paid was as follows:
| | October 31, 2017 | October 31, 2016 |
| Ordinary Income | $2,095,857 | $ 1,715,467 |
Short-Term Trading (Redemption) Fees. Shares held by investors in the Fund less than 90 days may have been subject to a redemption fee equal to 1.50% of the NAV of shares redeemed. All redemption fees, which reduce the proceeds of the shareholder redemption, are retained by the Fund and accounted for as an addition to paid in capital. In November 2017, the Board of Trustees approved the elimination of these redemption fees effective December 18, 2017.
Restricted Securities. The Fund may invest in securities that are subject to legal or contractual restrictions on resale. These securities generally may be resold in transactions exempt from registration or to the public if the securities are registered. Disposal of these securities may involve time-consuming negotiations and expense, and prompt sale at an acceptable price may be difficult. Information regarding restricted securities is included at the end of the Fund's Schedule of Investments.
4. Derivative Instruments.
Risk Exposures and the Use of Derivative Instruments. The Fund's investment objective allows the Fund to enter into various types of derivative contracts, including futures contracts. Derivatives are investments whose value is primarily derived from underlying assets, indices or reference rates and may be transacted on an exchange or over-the-counter (OTC). Derivatives may involve a future commitment to buy or sell a specified asset based on specified terms, to exchange future cash flows at periodic intervals based on a notional principal amount, or for one party to make one or more payments upon the occurrence of specified events in exchange for periodic payments from the other party.
The Fund used derivatives to increase returns and to manage exposure to certain risks as defined below. The success of any strategy involving derivatives depends on analysis of numerous economic factors, and if the strategies for investment do not work as intended, the Fund may not achieve its objectives.
The Fund's use of derivatives increased or decreased its exposure to the following risk:
| Equity Risk | Equity risk relates to the fluctuations in the value of financial instruments as a result of changes in market prices (other than those arising from interest rate risk or foreign exchange risk), whether caused by factors specific to an individual investment, its issuer, or all factors affecting all instruments traded in a market or market segment.
|
The Fund is also exposed to additional risks from investing in derivatives, such as liquidity risk and counterparty credit risk. Liquidity risk is the risk that the Fund will be unable to close out the derivative in the open market in a timely manner. Counterparty credit risk is the risk that the counterparty will not be able to fulfill its obligation to the Fund. Counterparty credit risk related to exchange-traded futures contracts may be mitigated by the protection provided by the exchange on which they trade.
Investing in derivatives may involve greater risks than investing in the underlying assets directly and, to varying degrees, may involve risk of loss in excess of any initial investment and collateral received and amounts recognized in the Statement of Assets and Liabilities. In addition, there may be the risk that the change in value of the derivative contract does not correspond to the change in value of the underlying instrument.
Futures Contracts. A futures contract is an agreement between two parties to buy or sell a specified underlying instrument for a fixed price at a specified future date. The Fund used futures contracts to manage its exposure to the stock market.
Upon entering into a futures contract, a fund is required to deposit either cash or securities (initial margin) with a clearing broker in an amount equal to a certain percentage of the face value of the contract. Futures contracts are marked-to-market daily and subsequent daily payments (variation margin) are made or received by a fund depending on the daily fluctuations in the value of the futures contracts and are recorded as unrealized appreciation or (depreciation). This receivable and/or payable, if any, is included in daily variation margin on futures contracts in the Statement of Assets and Liabilities. Realized gain or (loss) is recorded upon the expiration or closing of a futures contract. The net realized gain (loss) and change in net unrealized appreciation (depreciation) on futures contracts during the period is presented in the Statement of Operations.
Any open futures contracts at period end are presented in the Schedule of Investments under the caption "Futures Contracts". The notional amount at value reflects each contract's exposure to the underlying instrument or index at period end.
5. Purchases and Sales of Investments.
Purchases and sales of securities, other than short-term securities and U.S. government securities, aggregated $708,020,325 and $220,828,305, respectively.
6. Fees and Other Transactions with Affiliates.
Management Fee. Fidelity Management & Research Company (the investment adviser) and its affiliates provide the Fund with investment management related services for which the Fund pays a monthly management fee. The management fee is the sum of an individual fund fee rate that is based on an annual rate of .55% of the Fund's average net assets and an annualized group fee rate that averaged .25% during the period. The group fee rate is based upon the average net assets of all the mutual funds advised by the investment adviser, including any mutual funds previously advised by the investment adviser that are currently advised by Fidelity SelectCo, LLC, an affiliate of the investment adviser. The group fee rate decreases as assets under management increase and increases as assets under management decrease. For the reporting period, the total annual management fee rate was .79% of the Fund's average net assets.
Distribution and Service Plan Fees. In accordance with Rule 12b-1 of the 1940 Act, the Fund has adopted separate Distribution and Service Plans for each class of shares. Certain classes pay Fidelity Distributors Corporation (FDC), an affiliate of the investment adviser, separate Distribution and Service Fees, each of which is based on an annual percentage of each class' average net assets. In addition, FDC may pay financial intermediaries for selling shares of the Fund and providing shareholder support services. For the period, the Distribution and Service Fee rates, total fees and amounts retained by FDC were as follows:
| | Distribution
Fee | Service
Fee | Total Fees | Retained
by FDC |
| Class A | -% | .25% | $67,523 | $4,812 |
| Class M | .25% | .25% | 23,450 | – |
| Class C | .75% | .25% | 205,601 | 104,911 |
| | | | $296,574 | $109,723 |
Sales Load. FDC may receive a front-end sales charge of up to 5.75% for selling Class A shares and 3.50% for selling Class M shares, some of which is paid to financial intermediaries for selling shares of the Fund. Depending on the holding period, FDC may receive contingent deferred sales charges levied on Class A, Class M and Class C redemptions. The deferred sales charges are 1.00% for Class C shares, 1.00% for certain purchases of Class A shares and .25% for certain purchases of Class M shares.
For the period, sales charge amounts retained by FDC were as follows:
| | Retained
by FDC |
| Class A | $38,049 |
| Class M | 4,735 |
| Class C(a) | 6,809 |
| | $49,593 |
(a) When Class C shares are initially sold, FDC pays commissions from its own resources to financial intermediaries through which the sales are made.
Transfer Agent Fees. Fidelity Investments Institutional Operations Company, Inc., (FIIOC), an affiliate of the investment adviser, is the transfer, dividend disbursing and shareholder servicing agent for each class of the Fund. FIIOC receives account fees and asset-based fees that vary according to the account size and type of account of the shareholders of the respective classes of the Fund. FIIOC pays for typesetting, printing and mailing of shareholder reports, except proxy statements.
For the period, transfer agent fees for each class were as follows:
| | Amount | % of
Class-Level Average
Net Assets |
| Class A | $58,594 | .22 |
| Class M | 14,868 | .32 |
| Class C | 43,747 | .21 |
| Total Emerging Markets | 476,257 | .25 |
| Class I | 325,333 | .18 |
| | $918,799 | |
Accounting and Security Lending Fees. Fidelity Service Company, Inc. (FSC), an affiliate of the investment adviser, maintains the Fund's accounting records. The accounting fee is based on the level of average net assets for each month. Under a separate contract, FSC administers the security lending program. The security lending fee is based on the number and duration of lending transactions.
Brokerage Commissions. The Fund placed a portion of its portfolio transactions with brokerage firms which are affiliates of the investment adviser. Brokerage commissions are included in net realized gain (loss) and change in net unrealized appreciation (depreciation) in the Statement of Operations. The commissions paid to these affiliated firms were $4,114 for the period.
Interfund Trades. The Fund may purchase from or sell securities to other Fidelity Funds under procedures adopted by the Board. The procedures have been designed to ensure these interfund trades are executed in accordance with Rule 17a-7 of the 1940 Act. Interfund trades are included within the respective purchases and sales amounts shown in the Purchases and Sales of Investments note.
7. Committed Line of Credit.
The Fund participates with other funds managed by the investment adviser or an affiliate in a $4.25 billion credit facility (the "line of credit") to be utilized for temporary or emergency purposes to fund shareholder redemptions or for other short-term liquidity purposes. The Fund has agreed to pay commitment fees on its pro-rata portion of the line of credit, which amounted to $1,127 and is reflected in Miscellaneous expenses on the Statement of Operations. During the period, the Fund did not borrow on this line of credit.
8. Security Lending.
The Fund lends portfolio securities through a lending agent from time to time in order to earn additional income. For equity securities, a lending agent is used and may loan securities to certain qualified borrowers, including Fidelity Capital Markets (FCM), a broker-dealer affiliated with the Fund. On the settlement date of the loan, the Fund receives collateral (in the form of U.S. Treasury obligations, letters of credit and/or cash) against the loaned securities and maintains collateral in an amount not less than 100% of the market value of the loaned securities during the period of the loan. The market value of the loaned securities is determined at the close of business of the Fund and any additional required collateral is delivered to the Fund on the next business day. The Fund or borrower may terminate the loan at any time, and if the borrower defaults on its obligation to return the securities loaned because of insolvency or other reasons, the Fund may apply collateral received from the borrower against the obligation. The Fund may experience delays and costs in recovering the securities loaned. Any cash collateral received is invested in the Fidelity Securities Lending Cash Central Fund. The value of loaned securities and cash collateral at period end are disclosed on the Fund's Statement of Assets and Liabilities. Security lending income represents the income earned on investing cash collateral, less rebates paid to borrowers and any lending agent fees associated with the loan, plus any premium payments received for lending certain types of securities. Security lending income is presented in the Statement of Operations as a component of income from Fidelity Central Funds. Total security lending income during the period amounted to $844. During the period, there were no securities loaned to FCM.
9. Expense Reductions.
Commissions paid to certain brokers with whom the investment adviser, or its affiliates, places trades on behalf of the Fund include an amount in addition to trade execution, which may be rebated back to the Fund to offset certain expenses. This amount totaled $51,538 for the period. Through arrangements with the Fund's custodian, credits realized as a result of certain uninvested cash balances were used to reduce the Fund's expenses. During the period, these credits reduced the Fund's custody expenses by $4,047.
In addition, during the period the investment adviser reimbursed and/or waived a portion of fund-level operating expenses in the amount of $1,488.
10. Distributions to Shareholders.
Distributions to shareholders of each class were as follows:
| | Year ended
October 31, 2017 | Year ended October 31, 2016 |
| From net investment income | | |
| Class A | $195,255 | $214,855 |
| Class M | 23,027 | 63,597 |
| Class C | 57,828 | 107,081 |
| Total Emerging Markets | 1,274,142 | 1,155,874 |
| Class I | 407,541 | 174,060 |
| Total | $1,957,793 | $1,715,467 |
| From net realized gain | | |
| Class A | $14,644 | $– |
| Class M | 2,410 | – |
| Class C | 9,294 | – |
| Total Emerging Markets | 84,943 | – |
| Class I | 26,773 | – |
| Total | $138,064 | $– |
11. Share Transactions.
Share transactions for each class were as follows and may contain automatic conversions between classes or exchanges between affiliated funds:
| | Shares | Shares | Dollars | Dollars |
| | Year ended
October 31, 2017 | Year ended October 31, 2016 | Year ended
October 31, 2017 | Year ended October 31, 2016 |
| Class A | | | | |
| Shares sold | 3,615,728 | 982,236 | $43,198,307 | $10,454,988 |
| Reinvestment of distributions | 19,523 | 21,375 | 207,918 | 212,465 |
| Shares redeemed | (1,863,978) | (643,855) | (21,909,724) | (6,609,703) |
| Net increase (decrease) | 1,771,273 | 359,756 | $21,496,501 | $4,057,750 |
| Class M | | | | |
| Shares sold | 451,431 | 99,943 | $5,673,545 | $1,053,182 |
| Reinvestment of distributions | 2,361 | 6,356 | 25,216 | 63,302 |
| Shares redeemed | (74,567) | (162,291) | (886,466) | (1,643,320) |
| Net increase (decrease) | 379,225 | (55,992) | $4,812,295 | $(526,836) |
| Class C | | | | |
| Shares sold | 1,907,365 | 381,071 | $23,252,010 | $4,073,862 |
| Reinvestment of distributions | 6,299 | 10,753 | 66,954 | 106,882 |
| Shares redeemed | (272,258) | (194,422) | (3,283,907) | (1,922,472) |
| Net increase (decrease) | 1,641,406 | 197,402 | $20,035,057 | $2,258,272 |
| Total Emerging Markets | | | | |
| Shares sold | 17,602,916 | 7,221,843 | $212,356,677 | $77,958,709 |
| Reinvestment of distributions | 124,771 | 112,410 | 1,328,813 | 1,116,229 |
| Shares redeemed | (6,900,916) | (1,787,997) | (84,713,141) | (18,222,997) |
| Net increase (decrease) | 10,826,771 | 5,546,256 | $128,972,349 | $60,851,941 |
| Class I | | | | |
| Shares sold | 29,232,950 | 1,936,878 | $357,207,778 | $21,178,679 |
| Reinvestment of distributions | 38,174 | 14,612 | 405,784 | 144,954 |
| Shares redeemed | (3,761,001) | (700,942) | (47,186,855) | (7,340,498) |
| Net increase (decrease) | 25,510,123 | 1,250,548 | $310,426,707 | $13,983,135 |
12. Other.
The Fund's organizational documents provide former and current trustees and officers with a limited indemnification against liabilities arising in connection with the performance of their duties to the Fund. In the normal course of business, the Fund may also enter into contracts that provide general indemnifications. The Fund's maximum exposure under these arrangements is unknown as this would be dependent on future claims that may be made against the Fund. The risk of material loss from such claims is considered remote.
Report of Independent Registered Public Accounting Firm
To the Trustees of Fidelity Investment Trust and Shareholders of Fidelity Total Emerging Markets Fund:
In our opinion, the accompanying statement of assets and liabilities, including the schedule of investments, and the related statements of operations and of changes in net assets and the financial highlights present fairly, in all material respects, the financial position of Fidelity Total Emerging Markets Fund (a fund of Fidelity Investment Trust) as of October 31, 2017, the results of its operations for the year then ended, the changes in its net assets for each of the two years in the period then ended and the financial highlights for each of the five years in the period then ended, in conformity with accounting principles generally accepted in the United States of America. These financial statements and financial highlights (hereafter referred to as “financial statements”) are the responsibility of the Fidelity Total Emerging Markets Fund’s management. Our responsibility is to express an opinion on these financial statements based on our audits. We conducted our audits of these financial statements in accordance with the standards of the Public Company Accounting Oversight Board (United States). Those standards require that we plan and perform the audit to obtain reasonable assurance about whether the financial statements are free of material misstatement. An audit includes examining, on a test basis, evidence supporting the amounts and disclosures in the financial statements, assessing the accounting principles used and significant estimates made by management, and evaluating the overall financial statement presentation. Our procedures included confirmation of securities owned as of October 31, 2017 by correspondence with the custodian and brokers; when replies were not received from brokers, we performed other auditing procedures. We believe that our audits provide a reasonable basis for our opinion.
PricewaterhouseCoopers LLP
Boston, Massachusetts
December 18, 2017
Trustees and Officers
The Trustees, Members of the Advisory Board (if any), and officers of the trust and fund, as applicable, are listed below. The Board of Trustees governs the fund and is responsible for protecting the interests of shareholders. The Trustees are experienced executives who meet periodically throughout the year to oversee the fund's activities, review contractual arrangements with companies that provide services to the fund, oversee management of the risks associated with such activities and contractual arrangements, and review the fund's performance. Except for Jonathan Chiel, each of the Trustees oversees 190 funds. Mr. Chiel oversees 143 funds
The Trustees hold office without limit in time except that (a) any Trustee may resign; (b) any Trustee may be removed by written instrument, signed by at least two-thirds of the number of Trustees prior to such removal; (c) any Trustee who requests to be retired or who has become incapacitated by illness or injury may be retired by written instrument signed by a majority of the other Trustees; and (d) any Trustee may be removed at any special meeting of shareholders by a two-thirds vote of the outstanding voting securities of the trust. Each Trustee who is not an interested person (as defined in the 1940 Act) of the trust and the fund is referred to herein as an Independent Trustee. Each Independent Trustee shall retire not later than the last day of the calendar year in which his or her 75th birthday occurs. The Independent Trustees may waive this mandatory retirement age policy with respect to individual Trustees. Officers and Advisory Board Members hold office without limit in time, except that any officer or Advisory Board Member may resign or may be removed by a vote of a majority of the Trustees at any regular meeting or any special meeting of the Trustees. Except as indicated, each individual has held the office shown or other offices in the same company for the past five years.
The fund’s Statement of Additional Information (SAI) includes more information about the Trustees. To request a free copy, call Fidelity at 1-877-208-0098.
Experience, Skills, Attributes, and Qualifications of the Trustees. The Governance and Nominating Committee has adopted a statement of policy that describes the experience, qualifications, attributes, and skills that are necessary and desirable for potential Independent Trustee candidates (Statement of Policy). The Board believes that each Trustee satisfied at the time he or she was initially elected or appointed a Trustee, and continues to satisfy, the standards contemplated by the Statement of Policy. The Governance and Nominating Committee also engages professional search firms to help identify potential Independent Trustee candidates who have the experience, qualifications, attributes, and skills consistent with the Statement of Policy. From time to time, additional criteria based on the composition and skills of the current Independent Trustees, as well as experience or skills that may be appropriate in light of future changes to board composition, business conditions, and regulatory or other developments, have also been considered by the professional search firms and the Governance and Nominating Committee. In addition, the Board takes into account the Trustees' commitment and participation in Board and committee meetings, as well as their leadership of standing and ad hoc committees throughout their tenure.
In determining that a particular Trustee was and continues to be qualified to serve as a Trustee, the Board has considered a variety of criteria, none of which, in isolation, was controlling. The Board believes that, collectively, the Trustees have balanced and diverse experience, qualifications, attributes, and skills, which allow the Board to operate effectively in governing the fund and protecting the interests of shareholders. Information about the specific experience, skills, attributes, and qualifications of each Trustee, which in each case led to the Board's conclusion that the Trustee should serve (or continue to serve) as a trustee of the fund, is provided below.
Board Structure and Oversight Function. James C. Curvey is an interested person and currently serves as Chairman. The Trustees have determined that an interested Chairman is appropriate and benefits shareholders because an interested Chairman has a personal and professional stake in the quality and continuity of services provided to the fund. Independent Trustees exercise their informed business judgment to appoint an individual of their choosing to serve as Chairman, regardless of whether the Trustee happens to be independent or a member of management. The Independent Trustees have determined that they can act independently and effectively without having an Independent Trustee serve as Chairman and that a key structural component for assuring that they are in a position to do so is for the Independent Trustees to constitute a substantial majority for the Board. The Independent Trustees also regularly meet in executive session. Ned C. Lautenbach serves as Chairman of the Independent Trustees and as such (i) acts as a liaison between the Independent Trustees and management with respect to matters important to the Independent Trustees and (ii) with management prepares agendas for Board meetings.
Fidelity® funds are overseen by different Boards of Trustees. The fund's Board oversees Fidelity's high income and certain equity funds, and other Boards oversee Fidelity's investment-grade bond, money market, asset allocation, and sector funds. The asset allocation funds may invest in Fidelity® funds overseen by the fund's Board. The use of separate Boards, each with its own committee structure, allows the Trustees of each group of Fidelity® funds to focus on the unique issues of the funds they oversee, including common research, investment, and operational issues. On occasion, the separate Boards establish joint committees to address issues of overlapping consequences for the Fidelity® funds overseen by each Board.
The Trustees operate using a system of committees to facilitate the timely and efficient consideration of all matters of importance to the Trustees, the fund, and fund shareholders and to facilitate compliance with legal and regulatory requirements and oversight of the fund's activities and associated risks. The Board, acting through its committees, has charged FMR and its affiliates with (i) identifying events or circumstances the occurrence of which could have demonstrably adverse effects on the fund's business and/or reputation; (ii) implementing processes and controls to lessen the possibility that such events or circumstances occur or to mitigate the effects of such events or circumstances if they do occur; and (iii) creating and maintaining a system designed to evaluate continuously business and market conditions in order to facilitate the identification and implementation processes described in (i) and (ii) above. Because the day-to-day operations and activities of the fund are carried out by or through FMR, its affiliates, and other service providers, the fund's exposure to risks is mitigated but not eliminated by the processes overseen by the Trustees. While each of the Board's committees has responsibility for overseeing different aspects of the fund's activities, oversight is exercised primarily through the Operations, Audit, and Compliance Committees. In addition, the Independent Trustees have worked with FMR to enhance the Board's oversight of investment and financial risks, legal and regulatory risks, technology risks, and operational risks, including the development of additional risk reporting to the Board. For example, a working group comprised of Independent Trustees and FMR has worked and continues to work to review the Fidelity® funds' valuation-related activities, reporting and risk management. Appropriate personnel, including but not limited to the fund's Chief Compliance Officer (CCO), FMR's internal auditor, the independent accountants, the fund's Treasurer and portfolio management personnel, make periodic reports to the Board's committees, as appropriate, including an annual review of Fidelity's risk management program for the Fidelity® funds. The responsibilities of each standing committee, including their oversight responsibilities, are described further under "Standing Committees of the Trustees."
Interested Trustees*:
Correspondence intended for a Trustee who is an interested person may be sent to Fidelity Investments, 245 Summer Street, Boston, Massachusetts 02210.
Name, Year of Birth; Principal Occupations and Other Relevant Experience+
Jonathan Chiel (1957)
Year of Election or Appointment: 2016
Trustee
Mr. Chiel also serves as Trustee of other Fidelity® funds. Mr. Chiel is Executive Vice President and General Counsel for FMR LLC (diversified financial services company, 2012-present). Previously, Mr. Chiel served as general counsel (2004-2012) and senior vice president and deputy general counsel (2000-2004) for John Hancock Financial Services; a partner with Choate, Hall & Stewart (1996-2000) (law firm); and an Assistant United States Attorney for the United States Attorney’s Office of the District of Massachusetts (1986-95), including Chief of the Criminal Division (1993-1995). Mr. Chiel is a director on the boards of the Boston Bar Foundation and the Maimonides School.
James C. Curvey (1935)
Year of Election or Appointment: 2007
Trustee
Chairman of the Board of Trustees
Mr. Curvey also serves as Trustee of other Fidelity® funds. Mr. Curvey is a Director of Fidelity Research & Analysis Co. (investment adviser firm, 2009-present), and Vice Chairman (2007-present) and Director of FMR LLC (diversified financial services company). In addition, Mr. Curvey serves as an Overseer for the Boston Symphony Orchestra and a member of the board of Artis-Naples, Naples, Florida, and as a Trustee for Brewster Academy, Wolfeboro, New Hampshire. Previously, Mr. Curvey served as a Director of Fidelity Investments Money Management, Inc. (investment adviser firm, 2009-2014) and a Director of FMR and FMR Co., Inc. (investment adviser firms, 2007-2014).
Charles S. Morrison (1960)
Year of Election or Appointment: 2014
Trustee
Mr. Morrison also serves as Trustee of other funds. He serves as President of Fidelity Management & Research Company (FMR) (investment adviser firm, 2016-present), a Director of Fidelity Investments Money Management, Inc. (FIMM) (investment adviser firm, 2014-present), Director of Fidelity SelectCo, LLC (investment adviser firm, 2014-present), President, Asset Management (2014-present), and is an employee of Fidelity Investments. Previously, Mr. Morrison served as Vice President of Fidelity's Fixed Income and Asset Allocation Funds (2012-2014), President, Fixed Income (2011-2014), Vice President of Fidelity's Money Market Funds (2005-2009), President, Money Market Group Leader of FMR (investment adviser firm, 2009), and Senior Vice President, Money Market Group of FMR (2004-2009). Mr. Morrison also served as Vice President of Fidelity's Bond Funds (2002-2005), certain Balanced Funds (2002-2005), and certain Asset Allocation Funds (2002-2007), and as Senior Vice President (2002-2005) of Fidelity's Bond Division.
* Determined to be an “Interested Trustee” by virtue of, among other things, his or her affiliation with the trust[s] or various entities under common control with FMR.
+ The information includes the Trustee's principal occupation during the last five years and other information relating to the experience, attributes, and skills relevant to the Trustee's qualifications to serve as a Trustee, which led to the conclusion that the Trustee should serve as a Trustee for the fund.
Independent Trustees:
Correspondence intended for an Independent Trustee may be sent to Fidelity Investments, P.O. Box 55235, Boston, Massachusetts 02205-5235.
Name, Year of Birth; Principal Occupations and Other Relevant Experience+
Dennis J. Dirks (1948)
Year of Election or Appointment: 2005
Trustee
Mr. Dirks also serves as Trustee of other Fidelity® funds. Prior to his retirement in May 2003, Mr. Dirks was Chief Operating Officer and a member of the Board of The Depository Trust & Clearing Corporation (DTCC). He also served as President, Chief Operating Officer, and Board member of The Depository Trust Company (DTC) and President and Board member of the National Securities Clearing Corporation (NSCC). In addition, Mr. Dirks served as Chief Executive Officer and Board member of the Government Securities Clearing Corporation, Chief Executive Officer and Board member of the Mortgage-Backed Securities Clearing Corporation, as a Trustee and a member of the Finance Committee of Manhattan College (2005-2008), as a Trustee and a member of the Finance Committee of AHRC of Nassau County (2006-2008), as a member of the Independent Directors Council (IDC) Governing Council (2010-2015), and as a member of the Board of Directors for The Brookville Center for Children’s Services, Inc. (2009-2017). Mr. Dirks is a member of the Finance Committee (2016-present) and Board of Directors (2017-present) of the Asolo Repertory Theatre.
Alan J. Lacy (1953)
Year of Election or Appointment: 2008
Trustee
Mr. Lacy also serves as Trustee of other Fidelity® funds. Mr. Lacy serves as a Director of Bristol-Myers Squibb Company (global pharmaceuticals, 2008-present). He is a Trustee of the California Chapter of The Nature Conservancy (2015-present) and a Director of the Center for Advanced Study in the Behavioral Sciences at Stanford University (2015-present). In addition, Mr. Lacy served as Senior Adviser (2007-2014) of Oak Hill Capital Partners, L.P. (private equity) and also served as Chief Executive Officer (2005) and Vice Chairman (2005-2006) of Sears Holdings Corporation (retail) and Chief Executive Officer and Chairman of the Board of Sears, Roebuck and Co. (retail, 2000-2005). Previously, Mr. Lacy served as Chairman (2014-2017) and a member (2010-2017) of the Board of Directors of Dave & Buster’s Entertainment, Inc. (restaurant and entertainment complexes), as Chairman (2008-2011) and a member (2006-2015) of the Board of Trustees of the National Parks Conservation Association, and as a member of the Board of Directors for The Hillman Companies, Inc. (hardware wholesalers, 2010-2014), Earth Fare, Inc. (retail grocery, 2010-2014), and The Western Union Company (global money transfer, 2006-2011).
Ned C. Lautenbach (1944)
Year of Election or Appointment: 2000
Trustee
Chairman of the Independent Trustees
Mr. Lautenbach also serves as Trustee of other Fidelity® funds. Mr. Lautenbach currently serves as Vice Chair of the Board of Governors, State University System of Florida (2013-present) and is a member of the Council on Foreign Relations (1994-present). He is also a member and has most recently served as Chairman of the Board of Directors of Artis-Naples (2012-present). Previously, Mr. Lautenbach served as a member and then Lead Director of the Board of Directors of Eaton Corporation (diversified industrial, 1997-2016). He was also a Partner and Advisory Partner at Clayton, Dubilier & Rice, LLC (private equity investment, 1998-2010), as well as a Director of Sony Corporation (2006-2007). In addition, Mr. Lautenbach also had a 30-year career with IBM (technology company) during which time he served as Senior Vice President and a member of the Corporate Executive Committee (1968-1998).
Joseph Mauriello (1944)
Year of Election or Appointment: 2008
Trustee
Mr. Mauriello also serves as Trustee of other Fidelity® funds. Prior to his retirement in January 2006, Mr. Mauriello served in numerous senior management positions including Deputy Chairman and Chief Operating Officer (2004-2005), and Vice Chairman of Financial Services (2002-2004) of KPMG LLP US (professional services, 1965-2005). Mr. Mauriello currently serves as a member of the Board of Directors of XL Group plc. (global insurance and re-insurance, 2006-present) and the Independent Directors Council (IDC) Governing Council (2015-present). Previously, Mr. Mauriello served as a Director of the Hamilton Funds of the Bank of New York (2006-2007) and of Arcadia Resources Inc. (health care services and products, 2007-2012).
Cornelia M. Small (1944)
Year of Election or Appointment: 2005
Trustee
Ms. Small also serves as Trustee of other Fidelity® funds. Ms. Small is a member of the Board of Directors (2009-present) and Chair of the Investment Committee (2010-present) of the Teagle Foundation. Ms. Small also serves on the Investment Committee of the Berkshire Taconic Community Foundation (2008-present). Previously, Ms. Small served as Chairperson (2002-2008) and a member of the Investment Committee and Chairperson (2008-2012) and a member of the Board of Trustees of Smith College. In addition, Ms. Small served as Chief Investment Officer, Director of Global Equity Investments, and a member of the Board of Directors of Scudder, Stevens & Clark and Scudder Kemper Investments.
William S. Stavropoulos (1939)
Year of Election or Appointment: 2001
Trustee
Vice Chairman of the Independent Trustees
Mr. Stavropoulos also serves as Trustee of other Fidelity® funds. Mr. Stavropoulos serves as President and Founder of the Michigan Baseball Foundation, the Great Lakes Loons (2007-present). Mr. Stavropoulos is Chairman Emeritus of the Board of Directors of The Dow Chemical Company, where he previously served in numerous senior management positions, including President, CEO (1995-2000; 2002-2004), Chairman of the Executive Committee (2000-2006), and as a member of the Board of Directors (1990-2006). Currently, Mr. Stavropoulos is Chairman of the Board of Directors of Univar Inc. (global distributor of commodity and specialty chemicals), a Director of Teradata Corporation (data warehousing and technology solutions), and a member of the Advisory Board for Metalmark Capital LLC (private equity investment, 2005-present). Mr. Stavropoulos is an operating advisor to Clayton, Dubilier & Rice, LLC (private equity investment). In addition, Mr. Stavropoulos is a member of the University of Notre Dame Advisory Council for the College of Science, a Trustee of the Rollin L. Gerstacker Foundation, and a Director of Artis-Naples in Naples, Florida. Previously, Mr. Stavropoulos served as a Director of Chemical Financial Corporation (bank holding company, 1993-2012) and Tyco International, Ltd. (multinational manufacturing and services, 2007-2012).
David M. Thomas (1949)
Year of Election or Appointment: 2008
Trustee
Mr. Thomas also serves as Trustee of other Fidelity® funds. Mr. Thomas serves as Non-Executive Chairman of the Board of Directors of Fortune Brands Home and Security (home and security products, 2011-present), as a member of the Board of Directors (2004-present) and Presiding Director (2013-present) of Interpublic Group of Companies, Inc. (marketing communication), and as a member of the Board of Trustees of the University of Florida (2013-present). Previously, Mr. Thomas served as Executive Chairman (2005-2006) and Chairman and Chief Executive Officer (2000-2005) of IMS Health, Inc. (pharmaceutical and healthcare information solutions), and a Director of Fortune Brands, Inc. (consumer products, 2000-2011).
+ The information includes the Trustee's principal occupation during the last five years and other information relating to the experience, attributes, and skills relevant to the Trustee's qualifications to serve as a Trustee, which led to the conclusion that the Trustee should serve as a Trustee for the fund.
Advisory Board Members and Officers:
Correspondence intended for an officer or Peter S. Lynch may be sent to Fidelity Investments, 245 Summer Street, Boston, Massachusetts 02210. Officers appear below in alphabetical order.
Name, Year of Birth; Principal Occupation
Peter S. Lynch (1944)
Year of Election or Appointment: 2003
Member of the Advisory Board
Mr. Lynch also serves as Member of the Advisory Board of other Fidelity® funds. Mr. Lynch is Vice Chairman and a Director of FMR (investment adviser firm) and FMR Co., Inc. (investment adviser firm). In addition, Mr. Lynch serves as a Trustee of Boston College and as the Chairman of the Inner-City Scholarship Fund. Previously, Mr. Lynch served on the Special Olympics International Board of Directors (1997-2006).
Elizabeth Paige Baumann (1968)
Year of Election or Appointment: 2017
Anti-Money Laundering (AML) Officer
Ms. Baumann also serves as AML Officer of other funds. She is Chief AML Officer (2012-present) and Senior Vice President (2014-present) of FMR LLC (diversified financial services company) and is an employee of Fidelity Investments. Previously, Ms. Baumann served as AML Officer of the funds (2012-2016), and Vice President (2007-2014) and Deputy Anti-Money Laundering Officer (2007-2012) of FMR LLC.
Marc R. Bryant (1966)
Year of Election or Appointment: 2015
Secretary and Chief Legal Officer (CLO)
Mr. Bryant also serves as Secretary and CLO of other funds. Mr. Bryant serves as CLO, Secretary, and Senior Vice President of Fidelity Management & Research Company (investment adviser firm, 2015-present) and FMR Co., Inc. (investment adviser firm, 2015-present); Secretary of Fidelity SelectCo, LLC (investment adviser firm, 2015-present) and Fidelity Investments Money Management, Inc. (investment adviser firm, 2015-present); and CLO of Fidelity Management & Research (Hong Kong) Limited and FMR Investment Management (UK) Limited (investment adviser firms, 2015-present) and Fidelity Management & Research (Japan) Limited (investment adviser firm, 2016-present). He is Senior Vice President and Deputy General Counsel of FMR LLC (diversified financial services company). Previously, Mr. Bryant served as Secretary and CLO of Fidelity Rutland Square Trust II (2010-2014) and Assistant Secretary of Fidelity's Fixed Income and Asset Allocation Funds (2013-2015). Prior to joining Fidelity Investments, Mr. Bryant served as a Senior Vice President and the Head of Global Retail Legal for AllianceBernstein L.P. (2006-2010), and as the General Counsel for ProFund Advisors LLC (2001-2006).
William C. Coffey (1969)
Year of Election or Appointment: 2009
Assistant Secretary
Mr. Coffey also serves as Assistant Secretary of other funds. He is Senior Vice President and Deputy General Counsel of FMR LLC (diversified financial services company, 2010-present), and is an employee of Fidelity Investments. Previously, Mr. Coffey served as Vice President and Associate General Counsel of FMR LLC (2005-2009).
Jonathan Davis (1968)
Year of Election or Appointment: 2010
Assistant Treasurer
Mr. Davis also serves as Assistant Treasurer of other funds, and is an employee of Fidelity Investments. Previously, Mr. Davis served as Vice President and Associate General Counsel of FMR LLC (diversified financial services company, 2003-2010).
Adrien E. Deberghes (1967)
Year of Election or Appointment: 2016
Assistant Treasurer
Mr. Deberghes also serves as an officer of other funds. He serves as Executive Vice President of Fidelity Investments Money Management, Inc. (FIMM) (investment adviser firm, 2016-present) and is an employee of Fidelity Investments (2008-present). Prior to joining Fidelity Investments, Mr. Deberghes was Senior Vice President of Mutual Fund Administration at State Street Corporation (2007-2008), Senior Director of Mutual Fund Administration at Investors Bank & Trust (2005-2007), and Director of Finance for Dunkin' Brands (2000-2005). Previously, Mr. Deberghes served in other fund officer roles.
Joseph DeSantis (1959)
Year of Election or Appointment: 2017
Vice President
Mr. DeSantis also serves as Vice President of other funds. Mr. DeSantis serves as a Director of Fidelity Management & Research (Japan) Limited (investment adviser firm, 2016-present), Chief Investment Officer, Equities (2010-present) and is an employee of Fidelity Investments.
Stephanie J. Dorsey (1969)
Year of Election or Appointment: 2010
Assistant Treasurer
Ms. Dorsey also serves as an officer of other funds. She is an employee of Fidelity Investments (2008-present) and has served in other fund officer roles. Prior to joining Fidelity Investments, Ms. Dorsey served as Treasurer (2004-2008) of the JPMorgan Mutual Funds and Vice President (2004-2008) of JPMorgan Chase Bank.
Howard J. Galligan III (1966)
Year of Election or Appointment: 2014
Chief Financial Officer
Mr. Galligan also serves as Chief Financial Officer of other funds. Mr. Galligan serves as President of Fidelity Pricing and Cash Management Services (FPCMS) (2014-present) and as a Director of Strategic Advisers, Inc. (investment adviser firm, 2008-present). Previously, Mr. Galligan served as Chief Administrative Officer of Asset Management (2011-2014) and Chief Operating Officer and Senior Vice President of Investment Support for Strategic Advisers, Inc. (2003-2011).
Brian B. Hogan (1964)
Year of Election or Appointment: 2009
Vice President
Mr. Hogan also serves as Trustee or Vice President of other funds. Mr. Hogan serves as a Director of FMR Investment Management (UK) Limited (investment adviser firm, 2015-present) and Fidelity SelectCo, LLC (investment adviser firm, 2014-present) and President of the Equity Division of FMR (investment adviser firm, 2009-present). Previously, Mr. Hogan served as Senior Vice President, Equity Research of FMR (2006-2009) and as a portfolio manager. Mr. Brian B. Hogan is not related to Mr. Colm A. Hogan.
Colm A. Hogan (1973)
Year of Election or Appointment: 2016
Deputy Treasurer
Mr. Hogan also serves as an officer of other funds. Mr. Hogan is an employee of Fidelity Investments (2005-present). Mr. Colm A. Hogan is not related to Mr. Brian B. Hogan.
Chris Maher (1972)
Year of Election or Appointment: 2013
Assistant Treasurer
Mr. Maher serves as Assistant Treasurer of other funds. Mr. Maher is Vice President of Valuation Oversight and is an employee of Fidelity Investments. Previously, Mr. Maher served as Vice President of Asset Management Compliance (2013), Vice President of the Program Management Group of FMR (investment adviser firm, 2010-2013), and Vice President of Valuation Oversight (2008-2010).
Rieco E. Mello (1969)
Year of Election or Appointment: 2017
Assistant Treasurer
Mr. Mello also serves as Assistant Treasurer of other funds. Mr. Mello is an employee of Fidelity Investments (1995-present).
Kenneth B. Robins (1969)
Year of Election or Appointment: 2016
Chief Compliance Officer
Mr. Robins also serves as an officer of other funds. Mr. Robins serves as Compliance Officer of Fidelity Management & Research Company and FMR Co., Inc. (investment adviser firms, 2016-present) and is an employee of Fidelity Investments (2004-present). Previously, Mr. Robins served as Executive Vice President of Fidelity Investments Money Management, Inc. (investment adviser firm, 2013-2016) and served in other fund officer roles.
Stacie M. Smith (1974)
Year of Election or Appointment: 2016
President and Treasurer
Ms. Smith also serves as an officer of other funds. She is an employee of Fidelity Investments (2009-present) and has served in other fund officer roles. Prior to joining Fidelity Investments, Ms. Smith served as Senior Audit Manager of Ernst & Young LLP (accounting firm, 1996-2009). Previously, Ms. Smith served as Deputy Treasurer of certain Fidelity® funds (2013-2016).
Marc L. Spector (1972)
Year of Election or Appointment: 2016
Assistant Treasurer
Mr. Spector also serves as an officer of other funds. Mr. Spector is an employee of Fidelity Investments (2016-present). Prior to joining Fidelity Investments, Mr. Spector served as Director at the Siegfried Group (accounting firm, 2013-2016), and prior to Siegfried Group as audit senior manager at Deloitte & Touche (accounting firm, 2005-2013).
Renee Stagnone (1975)
Year of Election or Appointment: 2016
Assistant Treasurer
Ms. Stagnone also serves as an officer of other funds. Ms. Stagnone is an employee of Fidelity Investments (1997-present). Previously, Ms. Stagnone served as Deputy Treasurer of certain Fidelity® funds (2013-2016).
Shareholder Expense Example
As a shareholder of the Fund, you incur two types of costs: (1) transaction costs, including sales charges (loads) on purchase payments or redemption proceeds, redemption fees and (2) ongoing costs, including management fees, distribution and/or service (12b-1) fees and other Fund expenses. This Example is intended to help you understand your ongoing costs (in dollars) of investing in the Fund and to compare these costs with the ongoing costs of investing in other mutual funds.
The Example is based on an investment of $1,000 invested at the beginning of the period and held for the entire period (May 1, 2017 to October 31, 2017).
Actual Expenses
The first line of the accompanying table for each class of the Fund provides information about actual account values and actual expenses. You may use the information in this line, together with the amount you invested, to estimate the expenses that you paid over the period. Simply divide your account value by $1,000.00 (for example, an $8,600 account value divided by $1,000.00 = 8.6), then multiply the result by the number in the first line for a class of the Fund under the heading entitled "Expenses Paid During Period" to estimate the expenses you paid on your account during this period. A small balance maintenance fee of $12.00 that is charged once a year may apply for certain accounts with a value of less than $2,000. This fee is not included in the table below. If it was, the estimate of expenses you paid during the period would be higher, and your ending account value lower, by this amount. In addition, the Fund, as a shareholder in the underlying Fidelity Central Funds, will indirectly bear its pro-rata share of the fees and expenses incurred by the underlying Fidelity Central Funds. These fees and expenses are not included in the Fund's annualized expense ratio used to calculate the expense estimate in the table below.
Hypothetical Example for Comparison Purposes
The second line of the accompanying table for each class of the Fund provides information about hypothetical account values and hypothetical expenses based on a Class' actual expense ratio and an assumed rate of return of 5% per year before expenses, which is not the Class' actual return. The hypothetical account values and expenses may not be used to estimate the actual ending account balance or expenses you paid for the period. You may use this information to compare the ongoing costs of investing in the Fund and other funds. To do so, compare this 5% hypothetical example with the 5% hypothetical examples that appear in the shareholder reports of the other funds. A small balance maintenance fee of $12.00 that is charged once a year may apply for certain accounts with a value of less than $2,000. This fee is not included in the table below. If it was, the estimate of expenses you paid during the period would be higher, and your ending account value lower, by this amount. In addition, the Fund, as a shareholder in the underlying Fidelity Central Funds, will indirectly bear its pro-rata share of the fees and expenses incurred by the underlying Fidelity Central Funds. These fees and expenses are not included in the Fund's annualized expense ratio used to calculate the expense estimate in the table below.
Please note that the expenses shown in the table are meant to highlight your ongoing costs only and do not reflect any transaction costs. Therefore, the second line of the table is useful in comparing ongoing costs only, and will not help you determine the relative total costs of owning different funds. In addition, if these transactional costs were included, your costs would have been higher.
| | Annualized Expense Ratio-A | Beginning
Account Value
May 1, 2017 | Ending
Account Value
October 31, 2017 | Expenses Paid
During Period-B
May 1, 2017
to October 31, 2017 |
| Class A | 1.41% | | | |
| Actual | | $1,000.00 | $1,120.70 | $7.54 |
| Hypothetical-C | | $1,000.00 | $1,018.10 | $7.17 |
| Class M | 1.80% | | | |
| Actual | | $1,000.00 | $1,118.00 | $9.61 |
| Hypothetical-C | | $1,000.00 | $1,016.13 | $9.15 |
| Class C | 2.18% | | | |
| Actual | | $1,000.00 | $1,117.10 | $11.63 |
| Hypothetical-C | | $1,000.00 | $1,014.22 | $11.07 |
| Total Emerging Markets | 1.20% | | | |
| Actual | | $1,000.00 | $1,121.40 | $6.42 |
| Hypothetical-C | | $1,000.00 | $1,019.16 | $6.11 |
| Class I | 1.19% | | | |
| Actual | | $1,000.00 | $1,122.30 | $6.37 |
| Hypothetical-C | | $1,000.00 | $1,019.21 | $6.06 |
A Annualized expense ratio reflects expenses net of applicable fee waivers.
B Expenses are equal to each Class' annualized expense ratio, multiplied by the average account value over the period, multiplied by 184/365 (to reflect the one-half year period).
C 5% return per year before expenses
Distributions (Unaudited)
The Board of Trustees of Fidelity Total Emerging Markets Fund voted to pay to shareholders of record at the opening of business on record date, the following distributions per share derived from capital gains realized from sales of portfolio securities and dividends derived from net investment income:
| | Pay Date | Record Date | Dividends | Capital Gains |
| Fidelity Total Emerging Markets Fund | | | | |
| Class A | 12/18/17 | 12/15/17 | $0.157 | $0.185 |
| Class M | 12/18/17 | 12/15/17 | $0.130 | $0.185 |
| Class C | 12/18/17 | 12/15/17 | $0.093 | $0.185 |
| Total Emerging Markets | 12/18/17 | 12/15/17 | $0.174 | $0.185 |
| Class I | 12/18/17 | 12/15/17 | $0.185 | $0.185 |
|
The fund hereby designates as a capital gain dividend with respect to the taxable year ended October 31, 2017, $4,214,487, or, if subsequently determined to be different, the net capital gain of such year.
Class A designates 54%; Class M designates 72%; Class C designates 100%; Total Emerging Markets designates 49%; and Class I designates 48%; of the dividends distributed in December 2016, during the fiscal year as amounts which may be taken into account as a dividend for purposes of the maximum rate under section 1(h)(11) of the Internal Revenue Code.
The amounts per share which represent income derived from sources within, and taxes paid to, foreign countries or possessions of the United States are as follows:
| | Pay Date | Income | Taxes |
| Fidelity Total Emerging Markets Fund | | | |
| Class A | 12/19/16 | $0.1369 | $0.0079 |
| Class M | 12/19/16 | $0.1029 | $0.0079 |
| Class C | 12/19/16 | $0.0729 | $0.0079 |
| Total Emerging Markets | 12/19/16 | $0.1519 | $0.0079 |
| Class I | 12/19/16 | $0.1539 | $0.0079 |
|
The fund will notify shareholders in January 2018 of amounts for use in preparing 2017 income tax returns.
Board Approval of Investment Advisory Contracts and Management Fees
Fidelity Total Emerging Markets Fund
Each year, the Board of Trustees, including the Independent Trustees (together, the Board), votes on the renewal of the management contract with Fidelity Management & Research Company (FMR) and the sub-advisory agreements (together, the Advisory Contracts) for the fund. FMR and the sub-advisers are referred to herein as the Investment Advisers. The Board, assisted by the advice of fund counsel and Independent Trustees' counsel, requests and considers a broad range of information relevant to the renewal of the Advisory Contracts throughout the year.
The Board meets regularly and, at each of its meetings, covers an extensive agenda of topics and materials and considers factors that are relevant to its annual consideration of the renewal of the fund's Advisory Contracts, including the services and support provided to the fund and its shareholders. The Board has established various standing committees (Committees), each composed of and chaired by Independent Trustees with varying backgrounds, to which the Board has assigned specific subject matter responsibilities in order to enhance effective decision-making by the Board. The Board, acting directly and through its Committees, requests and receives information concerning the annual consideration of the renewal of the fund's Advisory Contracts. The Board also meets as needed to review matters specifically related to the Board's annual consideration of the renewal of the Advisory Contracts. Members of the Board may also meet with trustees of other Fidelity funds through ad hoc joint committees to discuss certain matters relevant to all of the Fidelity funds.
At its July 2017 meeting, the Board unanimously determined to renew the fund's Advisory Contracts. In reaching its determination, the Board considered all factors it believed relevant, including (i) the nature, extent, and quality of the services to be provided to the fund and its shareholders (including the investment performance of the fund); (ii) the competitiveness of the fund's management fee and total expense ratio relative to peer funds; (iii) the total costs of the services to be provided by and the profits to be realized by Fidelity from its relationships with the fund; and (iv) the extent to which, if any, economies of scale exist and would be realized as the fund grows, and whether any economies of scale are appropriately shared with fund shareholders.
In considering whether to renew the Advisory Contracts for the fund, the Board reached a determination, with the assistance of fund counsel and Independent Trustees' counsel and through the exercise of its business judgment, that the renewal of the Advisory Contracts was in the best interests of the fund and its shareholders and that the compensation payable under the Advisory Contracts was fair and reasonable. The Board's decision to renew the Advisory Contracts was not based on any single factor, but rather was based on a comprehensive consideration of all the information provided to the Board at its meetings throughout the year. The Board, in reaching its determination to renew the Advisory Contracts, was aware that shareholders of the fund have a broad range of investment choices available to them, including a wide choice among funds offered by Fidelity's competitors, and that the fund's shareholders, who have the opportunity to review and weigh the disclosure provided by the fund in its prospectus and other public disclosures, have chosen to invest in this fund, which is part of the Fidelity family of funds.
Amendment to Group Fee Rate. The Board also approved an amendment to the management contract for the fund to add an additional breakpoint to the group fee schedule, effective October 1, 2017. The Board noted that the additional breakpoint would result in lower management fee rates as Fidelity's assets under management increase.
Nature, Extent, and Quality of Services Provided. The Board considered Fidelity's staffing as it relates to the fund, including the backgrounds of investment personnel of Fidelity, and also considered the fund's investment objective, strategies, and related investment philosophy. The Independent Trustees also had discussions with senior management of Fidelity's investment operations and investment groups. The Board considered the structure of the investment personnel compensation program and whether this structure provides appropriate incentives to act in the best interests of the fund. Additionally, the Board considered the portfolio managers' investments, if any, in the funds that they manage.
Resources Dedicated to Investment Management and Support Services. The Board and the Fund Oversight and Research Committees reviewed the general qualifications and capabilities of Fidelity's investment staff, including its size, education, experience, and resources, as well as Fidelity's approach to recruiting, training, managing, and compensating investment personnel. The Board noted that Fidelity has continued to increase the resources devoted to non-U.S. offices, including expansion of Fidelity's global investment organization. The Board also noted that Fidelity's analysts have extensive resources, tools and capabilities that allow them to conduct sophisticated quantitative and fundamental analysis, as well as credit analysis of issuers, counterparties and guarantors. Further, the Board considered that Fidelity's investment professionals have sufficient access to global information and data so as to provide competitive investment results over time, and that those professionals also have access to sophisticated tools that permit them to assess portfolio construction and risk and performance attribution characteristics continuously, as well as to transmit new information and research conclusions rapidly around the world. Additionally, in its deliberations, the Board considered Fidelity's trading, risk management, compliance, and technology and operations capabilities and resources, which are integral parts of the investment management process.
Shareholder and Administrative Services. The Board considered (i) the nature, extent, quality, and cost of advisory, administrative, and shareholder services performed by the Investment Advisers and their affiliates under the Advisory Contracts and under separate agreements covering transfer agency, pricing and bookkeeping, and securities lending services for the fund; (ii) the nature and extent of the supervision of third party service providers, principally custodians, subcustodians, and pricing vendors; and (iii) the resources devoted to, and the record of compliance with, the fund's compliance policies and procedures. The Board also reviewed the allocation of fund brokerage, including allocations to brokers affiliated with the Investment Advisers, the use of brokerage commissions to pay fund expenses, and the use of "soft" commission dollars to pay for research services.
The Board noted that the growth of fund assets over time across the complex allows Fidelity to reinvest in the development of services designed to enhance the value or convenience of the Fidelity funds as investment vehicles. These services include 24-hour access to account information and market information through telephone representatives and over the Internet, investor education materials and asset allocation tools, and the expanded availability of Fidelity Investor Centers.
In 2014, the Board formed an ad hoc Committee on Transfer Agency Fees to review the variety of transfer agency fee structures throughout the industry and Fidelity's competitive positioning with respect to industry participants.
Investment in a Large Fund Family. The Board considered the benefits to shareholders of investing in a Fidelity fund, including the benefits of investing in a fund that is part of a large family of funds offering a variety of investment disciplines and providing a large variety of mutual fund investor services. The Board noted that Fidelity had taken, or had made recommendations that resulted in the Fidelity funds taking, a number of actions over the previous year that benefited particular funds, including: (i) continuing to dedicate additional resources to Fidelity's investment research process, and to the support of the senior management team that oversees asset management; (ii) continuing efforts to enhance Fidelity's global research capabilities; (iii) launching new funds and making other enhancements to meet client needs; (iv) launching new share classes of existing funds; (v) eliminating purchase minimums and broadening eligibility requirements for certain lower-priced share classes; (vi) reducing management fees and total expenses for certain growth equity funds and index funds; (vii) lowering expense caps for certain existing funds and classes to reduce expenses borne by shareholders; (viii) eliminating short-term redemption fees for certain funds; (ix) introducing a new pricing structure for certain funds of funds that is expected to reduce overall expenses paid by shareholders; (x) rationalizing product lines and gaining increased efficiencies through proposals for fund mergers and share class consolidations; (xi) continuing to develop, acquire and implement systems and technology to improve services to the funds and shareholders, strengthen information security, and increase efficiency; and (xii) implementing enhancements to further strengthen Fidelity's product line to increase investors' probability of success in achieving their investment goals, including retirement income goals.
Investment Performance. The Board considered whether the fund has operated in accordance with its investment objective, as well as its record of compliance with its investment restrictions and its performance history. The Board noted that there were portfolio management changes for the fund in September 2014, October 2015, and January 2017.
The Board took into account discussions with representatives of the Investment Advisers about fund investment performance that occur at Board meetings throughout the year. In this regard the Board noted that as part of regularly scheduled fund reviews and other reports to the Board on fund performance, the Board considers annualized return information for the fund for different time periods, measured against a securities market index ("benchmark index") and a peer group of funds with similar objectives ("peer group"), if any. In its evaluation of fund investment performance, the Board gave particular attention to information indicating changes in performance of certain Fidelity funds for specific time periods and discussed with the Investment Advisers the reasons for any overperformance or underperformance.
In addition to reviewing absolute and relative fund performance, the Independent Trustees periodically consider the appropriateness of fund performance metrics in evaluating the results achieved. In general, the Independent Trustees believe that fund performance should be evaluated based on net performance (after fees and expenses) of both the highest performing and lowest performing fund share classes, where applicable, compared to appropriate benchmark indices, over appropriate time periods that may include full market cycles, and compared to peer groups, as applicable, over the same periods, taking into account relevant factors including the following: general market conditions; issuer-specific information; and fund cash flows and other factors.
The Independent Trustees recognize that shareholders evaluate performance on a net basis over their own holding periods, for which one-, three-, and five-year periods are often used as a proxy. For this reason, the performance information reviewed by the Board also included net cumulative calendar year total return information for the fund and an appropriate benchmark index for the most recent one-, three-, and five-year periods, as shown below. A peer group is not shown below because the fund does not generally utilize a peer group for performance comparison purposes.
Fidelity Total Emerging Markets Fund
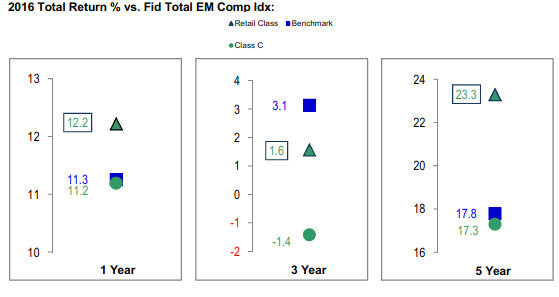
Based on its review, the Board concluded that the nature, extent, and quality of services provided to the fund under the Advisory Contracts should continue to benefit the shareholders of the fund.
Competitiveness of Management Fee and Total Expense Ratio. The Board considered the fund's management fee and total expense ratio compared to "mapped groups" of competitive funds and classes created for the purpose of facilitating the Trustees' competitive analysis of management fees and total expenses. Fidelity creates "mapped groups" by combining similar Lipper investment objective categories that have comparable investment mandates. Combining Lipper investment objective categories aids the Board's management fee and total expense ratio comparisons by broadening the competitive group used for comparison.
Management Fee. The Board considered two proprietary management fee comparisons for the 12-month periods shown in basis points (BP) in the chart below. The group of Lipper funds used by the Board for management fee comparisons is referred to below as the "Total Mapped Group." The Total Mapped Group comparison focuses on a fund's standing in terms of gross management fees before expense reimbursements or caps relative to the total universe of funds with comparable investment mandates, regardless of whether their management fee structures also are comparable. Funds with comparable investment mandates offer exposure to similar types of securities. Funds with comparable management fee structures have similar management fee contractual arrangements (
e.g., flat rate charged for advisory services, all-inclusive fee rate,
etc.). "TMG %" represents the percentage of funds in the Total Mapped Group that had management fees that were lower than the fund's. For example, a hypothetical TMG % of 20% would mean that 80% of the funds in the Total Mapped Group had higher, and 20% had lower, management fees than the fund. The fund's actual TMG %s and the number of funds in the Total Mapped Group are in the chart below. The "Asset-Size Peer Group" (ASPG) comparison focuses on a fund's standing relative to a subset of non-Fidelity funds within the Total Mapped Group that are similar in size and management fee structure. For example, if a fund is in the first quartile of the ASPG, the fund's management fee ranks in the least expensive or lowest 25% of funds in the ASPG. The ASPG represents at least 15% of the funds in the Total Mapped Group with comparable asset size and management fee structures, subject to a minimum of 50 funds (or all funds in the Total Mapped Group if fewer than 50). Additional information, such as the ASPG quartile in which the fund's management fee rate ranked, is also included in the chart and considered by the Board.
Fidelity Total Emerging Markets Fund
The Board noted that the fund's management fee rate ranked below the median of its Total Mapped Group and below the median of its ASPG for 2016.
The Board noted that, in 2014, the Board and the boards of other Fidelity funds formed the ad hoc Committee on Group Fee to conduct an in-depth review of the "group fee" component of the management fee of funds with such management fee structures. The Committee's focus included the mechanics of the group fee, the competitive landscape of group fee structures, Fidelity funds with no group fee component and investment products not included in group fee assets. The Board also considered that, for funds subject to the group fee, FMR agreed to voluntarily waive fees over a specified period of time in amounts designed to account for assets converted from certain funds to certain collective investment trusts.
The Board also noted that, in 2013, the ad hoc Committee on Management Fees was formed to conduct an in-depth review of the management fee rates of Fidelity's active equity mutual funds. The Committee focused on the following areas: (i) standard fee structures; (ii) research consumption and trading evolution; (iii) management fee competitiveness/profitability by category; and (iv) factors that drive institutional pricing.
Based on its review, the Board concluded that the fund's management fee is fair and reasonable in light of the services that the fund receives and the other factors considered.
Total Expense Ratio. In its review of each class's total expense ratio, the Board considered the fund's management fee rate as well as other fund or class expenses, as applicable, such as transfer agent fees, pricing and bookkeeping fees, fund-paid 12b-1 fees, and custodial, legal, and audit fees. The Board also noted that Fidelity may agree to waive fees and expenses from time to time, and the extent to which, if any, it has done so for the fund. As part of its review, the Board also considered the current and historical total expense ratios of each class of the fund compared to competitive fund median expenses. Each class of the fund is compared to those funds and classes in the Total Mapped Group (used by the Board for management fee comparisons) that have a similar sales load structure.
The Board noted that the total expense ratio of the retail class ranked below the competitive median for 2016 and the total expense ratio of each of Class A, Class M (formerly Class T), Class C, and Class I ranked above the competitive median for 2016. The Board considered that, in general, various factors can affect total expense ratios. The Board noted that the total expense ratio of Class A, Class M, Class C, and Class I was above the competitive median because of relatively higher other expenses due to low asset levels. The Board noted that the total expense ratio of Class M was also above the competitive median because of higher 12b-1 fees on Class M as compared to most competitor funds. Class M has a higher 12b-1 fee, but a lower front-end sales charge, than traditionally priced front-end sales charge classes. The Board considered that Class M is primarily sold load-waived in the retirement plan market where its 0.50% 12b-1 fee is comparable to competing no-load, higher 12b-1 fee classes designed specifically for retirement plans. The Board noted that the total expense ratio of Class C was also above the competitive median because of its 12b-1 fees. The Board also noted that, although Class I is categorized by Lipper as an institutional class, Class I has a significantly lower investment minimum than most other funds and classes categorized as institutional. As a result, FMR believes Class I is generally more comparable to retail funds and classes. The Board noted that the fund offers multiple classes, each of which has a different sales load and 12b-1 fee structure, and that the multiple structures are intended to offer a range of pricing options for the intermediary market. The Board also noted that the total expense ratios of the classes vary primarily by the level of their 12b-1 fees, although differences in transfer agent fees may also cause expenses to vary from class to class.
The Board further considered that FMR has contractually agreed to reimburse Class A, Class M, Class C, Class I, and the retail class of the fund to the extent that total operating expenses (excluding interest, certain taxes, certain securities lending costs, brokerage commissions, fees and expenses of the Independent Trustees, proxy and shareholder meeting expenses, extraordinary expenses, and acquired fund fees and expenses, if any), as a percentage of their respective average net assets, exceed 1.65%, 1.90%, 2.40%, 1.40%, and 1.40% through December 31, 2017.
Fees Charged to Other Fidelity Clients. The Board also considered Fidelity fee structures and other information with respect to clients of Fidelity, such as other funds advised or subadvised by Fidelity, pension plan clients, and other institutional clients with similar mandates. The Board noted that an ad hoc joint committee created by it and the boards of other Fidelity funds periodically (most recently in 2013) reviews and compares Fidelity's institutional investment advisory business with its business of providing services to the Fidelity funds, including the differences in services provided, fees charged, and costs incurred, as well as competition in their respective marketplaces.
Based on its review of total expense ratios and fees charged to other Fidelity clients, the Board concluded that, although some classes were above the median of the universe presented for comparison, the total expense ratio of each class of the fund was reasonable in light of the services that the fund and its shareholders receive and the other factors considered.
Costs of the Services and Profitability. The Board considered the revenues earned and the expenses incurred by Fidelity in conducting the business of developing, marketing, distributing, managing, administering and servicing the fund and servicing the fund's shareholders. The Board also considered the level of Fidelity's profits in respect of all the Fidelity funds.
On an annual basis, Fidelity presents to the Board information about the profitability of its relationships with the fund. Fidelity calculates profitability information for each fund, as well as aggregate profitability information for groups of Fidelity funds and all Fidelity funds, using a series of detailed revenue and cost allocation methodologies which originate with the books and records of Fidelity on which Fidelity's audited financial statements are based. The Audit Committee of the Board reviews any significant changes from the prior year's methodologies.
PricewaterhouseCoopers LLP (PwC), independent registered public accounting firm and auditor to Fidelity and certain Fidelity funds, has been engaged annually by the Board as part of the Board's assessment of Fidelity's profitability analysis. PwC's engagement includes the review and assessment of the methodologies used by Fidelity in determining the revenues and expenses attributable to Fidelity's mutual fund business, and completion of agreed-upon procedures in respect of the mathematical accuracy of the fund profitability information and its conformity to established allocation methodologies. After considering PwC's reports issued under the engagement and information provided by Fidelity, the Board concluded that while other allocation methods may also be reasonable, Fidelity's profitability methodologies are reasonable in all material respects.
The Board also reviewed Fidelity's non-fund businesses and potential fall-out benefits related to the mutual fund business as well as cases where Fidelity's affiliates may benefit from or be related to the fund's business.
The Board considered the costs of the services provided by and the profits realized by Fidelity in connection with the operation of the fund and was satisfied that the profitability was not excessive.
Economies of Scale. The Board considered whether there have been economies of scale in respect of the management of the Fidelity funds, whether the Fidelity funds (including the fund) have appropriately benefited from any such economies of scale, and whether there is potential for realization of any further economies of scale. The Board considered the extent to which the fund will benefit from economies of scale as assets grow through increased services to the fund, through waivers or reimbursements, or through fee or expense ratio reductions. The Board also noted that a committee (the Economies of Scale Committee) created by it and the boards of other Fidelity funds periodically (most recently in 2013) analyzes whether Fidelity attains economies of scale in respect of the management and servicing of the Fidelity funds, whether the Fidelity funds have appropriately benefited from such economies of scale, and whether there is potential for realization of any further economies of scale.
The Board recognized that the fund's management contract incorporates a "group fee" structure, which provides for lower group fee rates as total group assets increase, and for higher group fee rates as total group assets decrease (with "group assets" defined to include fund assets under FMR's management plus the assets of sector funds previously under FMR's management). FMR calculates the group fee rates based on a tiered asset "breakpoint" schedule that varies based on asset class. The Board considered that the group fee is designed to deliver the benefits of economies of scale to fund shareholders when total Fidelity fund assets increase, even if assets of any particular fund are unchanged or have declined, because some portion of Fidelity's costs are attributable to services provided to all Fidelity funds, and all funds benefit if those costs can be allocated among more assets. The Board concluded that, given the group fee structure, fund shareholders will benefit from lower management fees as group assets increase at the fund complex level, regardless of whether Fidelity achieves any such economies of scale.
The Board concluded, taking into account the analysis of the Economies of Scale Committee, that economies of scale, if any, are being appropriately shared between fund shareholders and Fidelity.
Additional Information Requested by the Board. In order to develop fully the factual basis for consideration of the Fidelity funds' advisory contracts, the Board requested and received additional information on certain topics, including: (i) fund performance trends, in particular the underperformance of certain funds, and Fidelity's long-term strategies for certain funds; (ii) Fidelity's fund profitability methodology, profitability trends for certain funds, and the impact of certain factors on fund profitability results, including the impact of market trends on actively managed funds; (iii) the use of performance fees and the calculation of performance adjustments, including the impact of underperformance and fund outflows on performance adjustments; (iv) metrics for evaluating index fund performance; (v) Fidelity's group fee structure, including the group fee breakpoint schedules; (vi) the terms of Fidelity's contractual and voluntary expense cap arrangements with the funds; (vii) the methodology with respect to evaluating competitive fund data and peer group classifications and fee comparisons; (viii) the expense structures for different funds and classes; (ix) Fidelity's arrangements with affiliated sub-advisers on behalf of the funds; (x) information regarding other accounts managed by Fidelity, including institutional accounts and collective investment trusts; (xi) recent changes to the fee structure for certain funds of funds; and (xii) the impact of the Department of Labor's new fiduciary rule on the funds' comparative expense information.
Based on its evaluation of all of the conclusions noted above, and after considering all factors it believed relevant, the Board concluded that the advisory fee structures are fair and reasonable, and that the fund's Advisory Contracts should be renewed.
ATEK-ANN-1217
1.931268.105
Fidelity® International Small Cap Opportunities Fund
Annual Report October 31, 2017 |
|
Contents
To view a fund's proxy voting guidelines and proxy voting record for the 12-month period ended June 30, visit http://www.fidelity.com/proxyvotingresults or visit the Securities and Exchange Commission's (SEC) web site at http://www.sec.gov.
You may also call 1-800-544-8544 to request a free copy of the proxy voting guidelines.
Standard & Poor's, S&P and S&P 500 are registered service marks of The McGraw-Hill Companies, Inc. and have been licensed for use by Fidelity Distributors Corporation.
Other third-party marks appearing herein are the property of their respective owners.
All other marks appearing herein are registered or unregistered trademarks or service marks of FMR LLC or an affiliated company. © 2017 FMR LLC. All rights reserved.
This report and the financial statements contained herein are submitted for the general information of the shareholders of the Fund. This report is not authorized for distribution to prospective investors in the Fund unless preceded or accompanied by an effective prospectus.
A fund files its complete schedule of portfolio holdings with the SEC for the first and third quarters of each fiscal year on Form N-Q. Forms N-Q are available on the SEC’s web site at http://www.sec.gov. A fund's Forms N-Q may be reviewed and copied at the SEC’s Public Reference Room in Washington, DC. Information regarding the operation of the SEC's Public Reference Room may be obtained by calling 1-800-SEC-0330.
For a complete list of a fund's portfolio holdings, view the most recent holdings listing, semiannual report, or annual report on Fidelity's web site at http://www.fidelity.com, http://www.institutional.fidelity.com, or http://www.401k.com, as applicable.
NOT FDIC INSURED •MAY LOSE VALUE •NO BANK GUARANTEE
Neither the Fund nor Fidelity Distributors Corporation is a bank.
Performance: The Bottom Line
Average annual total return reflects the change in the value of an investment, assuming reinvestment of distributions from dividend income and capital gains (the profits earned upon the sale of securities that have grown in value, if any) and assuming a constant rate of performance each year. The hypothetical investment and the average annual total returns do not reflect the deduction of taxes that a shareholder would pay on fund distributions or the redemption of fund shares. During periods of reimbursement by Fidelity, a fund’s total return will be greater than it would be had the reimbursement not occurred. How a fund did yesterday is no guarantee of how it will do tomorrow.
Average Annual Total Returns
| For the periods ended October 31, 2017 | Past 1 year | Past 5 years | Past 10 years |
| Fidelity® International Small Cap Opportunities Fund | 26.39% | 12.64% | 2.10% |
$10,000 Over 10 Years
Let's say hypothetically that $10,000 was invested in Fidelity® International Small Cap Opportunities Fund, a class of the fund, on October 31, 2007.
The chart shows how the value of your investment would have changed, and also shows how the MSCI EAFE Small Cap Index performed over the same period.
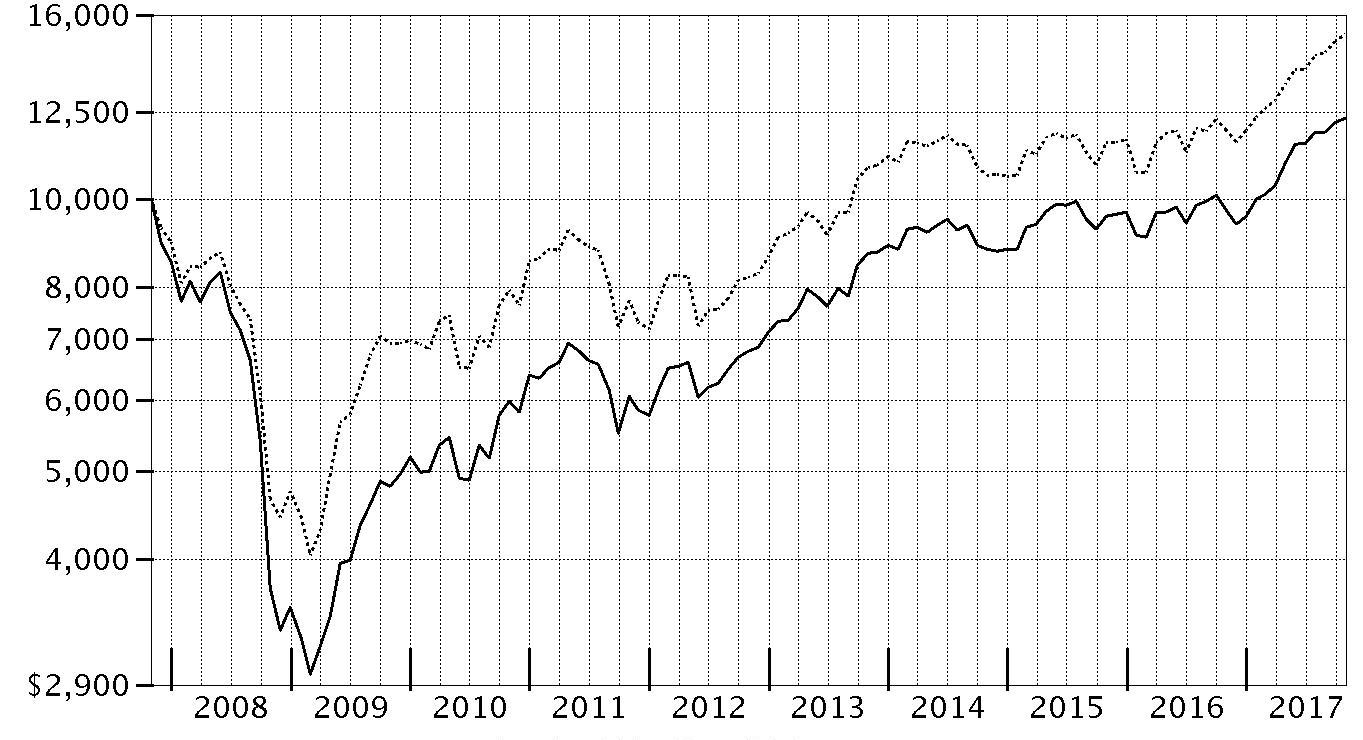
| Period Ending Values |
| $12,309 | Fidelity® International Small Cap Opportunities Fund |
| $15,217 | MSCI EAFE Small Cap Index |
Management's Discussion of Fund Performance
Market Recap: The MSCI ACWI (All Country World Index) ex USA Index returned 23.85% for the 12 months ending October 31, 2017, helped partly by a generally weak U.S. dollar. Some favorable election results in continental Europe (+30%) suggested ebbing political uncertainty and near-term risk there, but the U.K. (+20%) faced more-mixed conditions ahead of its expected exit from the European Union. Despite central-bank easing – and pressured recently by yen strength – Japan (+18%) lagged the rest of the Asia-Pacific group (+22%). Commodity-price volatility slowed Canada (+17%), but the emerging-markets group (+26%) sped ahead. Sector-wise, information technology (+47%) was driven by a surge among several Chinese internet-related names. Financials (+27%) rode rising interest rates that, at the same time, weighed on real estate (+17%), utilities (+16%), consumer staples (+14%) and telecom services (+9%) – so-called “bond proxy” sectors. Materials (+28%) and industrials (+27%) responded to demand from China and gains in certain commodity prices. In energy (+20%), oil prices lost ground in the spring before rebounding through October 31 to end well above where they started 12 months ago. Lastly, health care (+14%) was hurt by early-period turmoil around drug pricing and health care legislation.
Comments from Portfolio Manager Jed Weiss: For the fiscal year, the fund’s share classes (excluding sales charges, if applicable) rose about 25% to 26%, trailing the 27.70% return of the MSCI EAFE Small Cap Index. Versus the benchmark, picks in emerging markets, especially Korea, hurt fund performance the most. Stock picking in Germany also detracted. On the plus side, we benefited from stock selection in Japan and, to a lesser extent, Sweden and Italy. Among stocks, the fund’s biggest detractor was non-index Korean convenience-store operator BGF Retail, hurt by local minimum-wage hikes. Also detracting was an overweighting in RCG, an Australia-based shoe retailer. Other detractors included out-of-index SK Kaken, a Japan-based paint manufacturer, and Quintis, an Australian producer of sandalwood hit with financial difficulties. Conversely, our top contributor was an overweighting in Interpump Group, an Italian maker of specialty pumps whose share price more than doubled this period. Japan's semiconductor-equipment maker Lasertec and out-of-index light-fixture maker Fagerhult, based in Sweden, also added value.
The views expressed above reflect those of the portfolio manager(s) only through the end of the period as stated on the cover of this report and do not necessarily represent the views of Fidelity or any other person in the Fidelity organization. Any such views are subject to change at any time based upon market or other conditions and Fidelity disclaims any responsibility to update such views. These views may not be relied on as investment advice and, because investment decisions for a Fidelity fund are based on numerous factors, may not be relied on as an indication of trading intent on behalf of any Fidelity fund.
Note to shareholders: Portfolio Manager Jed Weiss returned from a five-month leave of absence on November 29, 2017. In his stead, Patrick Drouot and Patrick Buchanan served (and remain) as co-managers of the fund.
Investment Summary (Unaudited)
Geographic Diversification (% of fund's net assets)
| As of October 31, 2017 |
| | Japan | 32.9% |
| | United Kingdom | 15.6% |
| | United States of America* | 6.9% |
| | Germany | 6.2% |
| | Sweden | 4.9% |
| | Italy | 3.3% |
| | France | 3.2% |
| | Spain | 2.6% |
| | Netherlands | 2.2% |
| | Other | 22.2% |
* Includes Short-Term investments and Net Other Assets (Liabilities).
Percentages are based on country or territory of incorporation and are adjusted for the effect of futures contracts, if applicable.
| As of April 30, 2017 |
| | Japan | 30.4% |
| | United Kingdom | 18.8% |
| | Germany | 6.8% |
| | Sweden | 5.5% |
| | United States of America* | 5.4% |
| | Italy | 3.4% |
| | Australia | 2.5% |
| | Spain | 2.4% |
| | France | 2.4% |
| | Other | 22.4% |
* Includes Short-Term investments and Net Other Assets (Liabilities).
Percentages are based on country or territory of incorporation and are adjusted for the effect of futures contracts, if applicable.
Asset Allocation as of October 31, 2017
| | % of fund's net assets | % of fund's net assets 6 months ago |
| Stocks | 95.7 | 98.4 |
| Short-Term Investments and Net Other Assets (Liabilities) | 4.3 | 1.6 |
Top Ten Stocks as of October 31, 2017
| | % of fund's net assets | % of fund's net assets 6 months ago |
| Azbil Corp. (Japan, Electronic Equipment & Components) | 2.4 | 1.9 |
| Spirax-Sarco Engineering PLC (United Kingdom, Machinery) | 2.2 | 2.3 |
| Interpump Group SpA (Italy, Machinery) | 2.1 | 2.2 |
| Spectris PLC (United Kingdom, Electronic Equipment & Components) | 2.1 | 2.0 |
| CompuGroup Medical AG (Germany, Health Care Technology) | 2.0 | 2.1 |
| OBIC Co. Ltd. (Japan, IT Services) | 1.9 | 1.8 |
| Elis SA (France, Commercial Services & Supplies) | 1.9 | 0.9 |
| Nihon Parkerizing Co. Ltd. (Japan, Chemicals) | 1.8 | 1.6 |
| Sartorius AG (non-vtg.) (Germany, Health Care Equipment & Supplies) | 1.7 | 2.1 |
| USS Co. Ltd. (Japan, Specialty Retail) | 1.7 | 1.7 |
| | 19.8 | |
Top Market Sectors as of October 31, 2017
| | % of fund's net assets | % of fund's net assets 6 months ago |
| Industrials | 24.3 | 23.6 |
| Consumer Discretionary | 14.0 | 15.0 |
| Information Technology | 13.4 | 13.1 |
| Health Care | 12.4 | 13.4 |
| Consumer Staples | 9.3 | 10.0 |
| Materials | 7.6 | 8.5 |
| Real Estate | 6.9 | 7.3 |
| Financials | 5.9 | 5.7 |
| Energy | 1.9 | 1.8 |
Investments October 31, 2017
Showing Percentage of Net Assets
| Common Stocks - 94.0% | | | |
| | | Shares | Value |
| Australia - 2.2% | | | |
| Adelaide Brighton Ltd. | | 1,077,412 | $5,120,749 |
| Beacon Lighting Group Ltd. | | 2,681,235 | 2,996,041 |
| DuluxGroup Ltd. | | 1,736,117 | 9,792,793 |
| Imdex Ltd. (a) | | 3,940,102 | 2,925,090 |
| Quintis Ltd. (b)(c) | | 2,011,191 | 454,083 |
| RCG Corp. Ltd. (b) | | 6,206,097 | 3,562,377 |
|
| TOTAL AUSTRALIA | | | 24,851,133 |
|
| Austria - 1.6% | | | |
| Andritz AG | | 172,500 | 9,753,464 |
| BUWOG-Gemeinnuetzige Wohnung | | 318,874 | 9,196,864 |
|
| TOTAL AUSTRIA | | | 18,950,328 |
|
| Bailiwick of Jersey - 0.5% | | | |
| Integrated Diagnostics Holdings PLC | | 1,483,779 | 5,786,738 |
| Belgium - 1.3% | | | |
| KBC Ancora | | 257,848 | 15,378,137 |
| Bermuda - 0.5% | | | |
| Vostok New Ventures Ltd. (depositary receipt) (a) | | 701,789 | 5,784,217 |
| Canada - 1.6% | | | |
| McCoy Global, Inc. (a) | | 636,715 | 893,306 |
| New Look Vision Group, Inc. | | 207,200 | 5,521,693 |
| Pason Systems, Inc. | | 365,800 | 5,310,777 |
| PrairieSky Royalty Ltd. | | 107,800 | 2,869,430 |
| ShawCor Ltd. Class A | | 162,500 | 3,521,820 |
|
| TOTAL CANADA | | | 18,117,026 |
|
| Cayman Islands - 1.1% | | | |
| 58.com, Inc. ADR (a) | | 70,500 | 4,735,485 |
| China Biologic Products Holdings, Inc. | | 54,880 | 4,264,725 |
| Value Partners Group Ltd. | | 3,614,000 | 3,580,924 |
|
| TOTAL CAYMAN ISLANDS | | | 12,581,134 |
|
| Denmark - 2.1% | | | |
| Jyske Bank A/S (Reg.) | | 183,127 | 10,348,507 |
| Scandinavian Tobacco Group A/S | | 359,393 | 6,075,912 |
| Spar Nord Bank A/S | | 651,369 | 8,284,543 |
|
| TOTAL DENMARK | | | 24,708,962 |
|
| Finland - 0.7% | | | |
| Tikkurila Oyj | | 401,746 | 7,941,516 |
| France - 3.2% | | | |
| Elis SA | | 831,742 | 21,697,500 |
| Laurent-Perrier Group SA | | 51,163 | 4,798,172 |
| Vetoquinol SA | | 101,184 | 6,530,854 |
| Virbac SA (a) | | 32,652 | 4,204,734 |
|
| TOTAL FRANCE | | | 37,231,260 |
|
| Germany - 4.5% | | | |
| CompuGroup Medical AG | | 392,521 | 22,555,062 |
| CTS Eventim AG | | 360,354 | 14,884,631 |
| Fielmann AG | | 68,873 | 6,037,060 |
| Nexus AG | | 281,358 | 8,539,262 |
|
| TOTAL GERMANY | | | 52,016,015 |
|
| India - 0.6% | | | |
| Jyothy Laboratories Ltd. | | 1,189,354 | 7,226,129 |
| Ireland - 1.4% | | | |
| FBD Holdings PLC (a) | | 240,328 | 2,505,517 |
| James Hardie Industries PLC CDI | | 894,067 | 13,610,213 |
|
| TOTAL IRELAND | | | 16,115,730 |
|
| Isle of Man - 1.0% | | | |
| Playtech Ltd. | | 844,387 | 11,035,290 |
| Israel - 2.2% | | | |
| Azrieli Group | | 96,505 | 5,445,664 |
| Ituran Location & Control Ltd. | | 270,908 | 9,617,234 |
| Strauss Group Ltd. | | 483,344 | 9,841,893 |
|
| TOTAL ISRAEL | | | 24,904,791 |
|
| Italy - 3.3% | | | |
| Azimut Holding SpA | | 427,797 | 8,451,496 |
| Beni Stabili SpA SIIQ | | 6,607,875 | 5,849,859 |
| Interpump Group SpA | | 710,743 | 23,934,849 |
|
| TOTAL ITALY | | | 38,236,204 |
|
| Japan - 32.9% | | | |
| Ai Holdings Corp. | | 202,400 | 4,969,265 |
| Aoki Super Co. Ltd. | | 318,000 | 3,642,644 |
| Artnature, Inc. | | 535,800 | 3,520,028 |
| Asahi Co. Ltd. | | 345,700 | 4,202,351 |
| Aucnet, Inc. | | 37,500 | 495,917 |
| Azbil Corp. | | 621,200 | 27,125,806 |
| Broadleaf Co. Ltd. | | 287,300 | 2,358,782 |
| Central Automotive Products Ltd. | | 135,400 | 2,203,297 |
| Century21 Real Estate Japan Ltd. | | 66,500 | 800,670 |
| Coca-Cola West Co. Ltd. | | 175,275 | 6,132,758 |
| Daiichikosho Co. Ltd. | | 222,300 | 10,475,366 |
| Daikokutenbussan Co. Ltd. | | 174,500 | 7,944,428 |
| Funai Soken Holdings, Inc. | | 235,700 | 8,659,940 |
| GCA Savvian Group Corp. | | 555,461 | 5,084,340 |
| Goldcrest Co. Ltd. | | 534,130 | 11,572,133 |
| Iwatsuka Confectionary Co. Ltd. | | 21,400 | 953,303 |
| Kobayashi Pharmaceutical Co. Ltd. | | 217,900 | 12,599,200 |
| Koshidaka Holdings Co. Ltd. | | 195,200 | 7,896,186 |
| Kusuri No Aoki Holdings Co. Ltd. | | 132,800 | 7,370,264 |
| Lasertec Corp. | | 532,272 | 11,710,911 |
| Medikit Co. Ltd. | | 96,100 | 4,646,194 |
| Miroku Jyoho Service Co., Ltd. | | 164,800 | 3,848,690 |
| Misumi Group, Inc. | | 481,400 | 13,189,182 |
| Nabtesco Corp. | | 251,100 | 9,975,375 |
| Nagaileben Co. Ltd. | | 500,800 | 12,495,917 |
| Nakano Refrigerators Co. Ltd. | | 141,500 | 5,041,025 |
| ND Software Co. Ltd. | | 95,882 | 1,167,958 |
| Nihon Parkerizing Co. Ltd. | | 1,243,000 | 20,376,811 |
| NS Tool Co. Ltd. (b) | | 109,300 | 2,137,939 |
| OBIC Co. Ltd. | | 329,300 | 21,796,755 |
| OSG Corp. (b) | | 745,200 | 16,129,710 |
| Paramount Bed Holdings Co. Ltd. | | 257,200 | 11,342,304 |
| ProNexus, Inc. | | 472,400 | 5,732,939 |
| San-Ai Oil Co. Ltd. | | 766,200 | 9,151,124 |
| SHO-BOND Holdings Co. Ltd. | | 247,800 | 15,249,203 |
| Shoei Co. Ltd. | | 314,026 | 10,542,918 |
| SK Kaken Co. Ltd. | | 83,000 | 6,895,924 |
| Software Service, Inc. | | 67,000 | 3,086,679 |
| Techno Medica Co. Ltd. | | 80,791 | 1,404,451 |
| The Monogatari Corp. | | 84,300 | 6,211,303 |
| TKC Corp. | | 223,200 | 7,025,385 |
| Tocalo Co. Ltd. | | 117,000 | 4,721,178 |
| USS Co. Ltd. | | 966,500 | 19,537,614 |
| Welcia Holdings Co. Ltd. | | 172,500 | 6,546,758 |
| Workman Co. Ltd. | | 229,500 | 7,153,722 |
| Yamada Consulting Group Co. Ltd. | | 542,800 | 10,486,568 |
| Yamato Kogyo Co. Ltd. | | 113,000 | 3,022,643 |
|
| TOTAL JAPAN | | | 378,633,858 |
|
| Korea (South) - 1.7% | | | |
| BGFretail Co. Ltd. (c) | | 233,683 | 16,532,055 |
| Leeno Industrial, Inc. | | 63,110 | 2,889,957 |
|
| TOTAL KOREA (SOUTH) | | | 19,422,012 |
|
| Mexico - 0.3% | | | |
| Consorcio ARA S.A.B. de CV | | 9,564,478 | 3,382,433 |
| Netherlands - 2.2% | | | |
| Aalberts Industries NV | | 319,501 | 15,759,570 |
| Takeaway.com Holding BV (a)(d) | | 74,887 | 3,539,443 |
| VastNed Retail NV | | 129,002 | 5,647,071 |
|
| TOTAL NETHERLANDS | | | 24,946,084 |
|
| Norway - 0.9% | | | |
| Kongsberg Gruppen ASA (b) | | 331,100 | 6,039,900 |
| Skandiabanken ASA | | 436,200 | 4,419,142 |
|
| TOTAL NORWAY | | | 10,459,042 |
|
| Philippines - 0.5% | | | |
| Jollibee Food Corp. | | 1,309,740 | 6,322,034 |
| South Africa - 0.9% | | | |
| Clicks Group Ltd. | | 884,913 | 9,915,782 |
| Spain - 2.6% | | | |
| Hispania Activos Inmobiliarios SA | | 366,631 | 6,322,773 |
| Merlin Properties Socimi SA | | 545,300 | 7,196,733 |
| Prosegur Compania de Seguridad SA (Reg.) | | 2,217,090 | 16,915,881 |
|
| TOTAL SPAIN | | | 30,435,387 |
|
| Sweden - 4.9% | | | |
| Addlife AB | | 173,500 | 3,419,577 |
| AddTech AB (B Shares) | | 430,143 | 9,531,159 |
| Fagerhult AB | | 1,325,439 | 16,822,000 |
| Lagercrantz Group AB (B Shares) | | 684,707 | 7,279,201 |
| Loomis AB (B Shares) | | 216,200 | 8,674,703 |
| Saab AB (B Shares) | | 204,600 | 10,455,272 |
|
| TOTAL SWEDEN | | | 56,181,912 |
|
| Switzerland - 0.6% | | | |
| Tecan Group AG | | 34,420 | 7,279,727 |
| Taiwan - 0.5% | | | |
| Addcn Technology Co. Ltd. | | 588,435 | 5,330,239 |
| United Kingdom - 15.6% | | | |
| Alliance Pharma PLC | | 4,048,400 | 3,212,687 |
| Avon Rubber PLC | | 186,800 | 2,428,884 |
| Dechra Pharmaceuticals PLC | | 615,409 | 16,804,828 |
| DP Poland PLC (a) | | 7,057,200 | 3,936,669 |
| Elementis PLC | | 2,839,910 | 10,723,303 |
| Great Portland Estates PLC | | 1,103,789 | 9,111,174 |
| Hilton Food Group PLC (e) | | 312,888 | 3,706,815 |
| Howden Joinery Group PLC | | 1,999,300 | 10,889,674 |
| Informa PLC | | 1,684,956 | 15,597,984 |
| InterContinental Hotel Group PLC ADR | | 100,195 | 5,569,840 |
| ITE Group PLC | | 3,080,234 | 7,271,775 |
| Rightmove PLC | | 195,147 | 10,766,524 |
| Shaftesbury PLC | | 974,573 | 12,814,353 |
| Spectris PLC | | 697,778 | 23,724,899 |
| Spirax-Sarco Engineering PLC | | 331,991 | 24,912,762 |
| Topps Tiles PLC | | 3,398,615 | 3,148,425 |
| Ultra Electronics Holdings PLC | | 383,858 | 9,299,135 |
| Unite Group PLC | | 674,423 | 6,297,016 |
|
| TOTAL UNITED KINGDOM | | | 180,216,747 |
|
| United States of America - 2.6% | | | |
| Autoliv, Inc. (b) | | 52,200 | 6,517,692 |
| Martin Marietta Materials, Inc. | | 24,820 | 5,382,217 |
| Mohawk Industries, Inc. (a) | | 18,300 | 4,790,208 |
| PriceSmart, Inc. | | 84,074 | 7,045,401 |
| ResMed, Inc. | | 75,095 | 6,321,497 |
|
| TOTAL UNITED STATES OF AMERICA | | | 30,057,015 |
|
| TOTAL COMMON STOCKS | | | |
| (Cost $821,967,892) | | | 1,083,446,882 |
|
| Nonconvertible Preferred Stocks - 1.7% | | | |
| Germany - 1.7% | | | |
| Sartorius AG (non-vtg.) | | | |
| (Cost $8,387,461) | | 215,280 | 20,064,020 |
|
| Money Market Funds - 4.7% | | | |
| Fidelity Cash Central Fund, 1.10% (f) | | 47,164,769 | 47,174,202 |
| Fidelity Securities Lending Cash Central Fund 1.11% (f)(g) | | 6,505,865 | 6,506,516 |
| TOTAL MONEY MARKET FUNDS | | | |
| (Cost $53,681,365) | | | 53,680,718 |
| TOTAL INVESTMENT IN SECURITIES - 100.4% | | | |
| (Cost $884,036,718) | | | 1,157,191,620 |
| NET OTHER ASSETS (LIABILITIES) - (0.4)% | | | (5,137,743) |
| NET ASSETS - 100% | | | $1,152,053,877 |
Categorizations in the Schedule of Investments are based on country or territory of incorporation.
Legend
(a) Non-income producing
(b) Security or a portion of the security is on loan at period end.
(c) Level 3 security
(d) Security exempt from registration under Rule 144A of the Securities Act of 1933. These securities may be resold in transactions exempt from registration, normally to qualified institutional buyers. At the end of the period, the value of these securities amounted to $3,539,443 or 0.3% of net assets.
(e) Security or a portion of the security purchased on a delayed delivery or when-issued basis.
(f) Affiliated fund that is generally available only to investment companies and other accounts managed by Fidelity Investments. The rate quoted is the annualized seven-day yield of the fund at period end. A complete unaudited listing of the fund's holdings as of its most recent quarter end is available upon request. In addition, each Fidelity Central Fund's financial statements, which are not covered by the Fund's Report of Independent Registered Public Accounting Firm, are available on the SEC's website or upon request.
(g) Investment made with cash collateral received from securities on loan.
Affiliated Central Funds
Information regarding fiscal year to date income earned by the Fund from investments in Fidelity Central Funds is as follows:
| Fund | Income earned |
| Fidelity Cash Central Fund | $287,822 |
| Fidelity Securities Lending Cash Central Fund | 237,504 |
| Total | $525,326 |
Other Affiliated Issuers
An affiliated company is a company in which the Fund has ownership of at least 5% of the voting securities. Fiscal year to date transactions with companies which are or were affiliates are as follows:
| Affiliate | Value, beginning of period | Purchases | Sales Proceeds | Dividend Income | Realized Gain (loss) | Change in Unrealized appreciation (depreciation) | Value, end of period |
| DP Poland PLC | $5,450,276 | $64,233 | $907,568 | $-- | $599,349 | $(1,269,621) | $-- |
| Total | $5,450,276 | $64,233 | $907,568 | $-- | $599,349 | $(1,269,621) | $-- |
Investment Valuation
The following is a summary of the inputs used, as of October 31, 2017, involving the Fund's assets and liabilities carried at fair value. The inputs or methodology used for valuing securities may not be an indication of the risk associated with investing in those securities. For more information on valuation inputs, and their aggregation into the levels used below, please refer to the Investment Valuation section in the accompanying Notes to Financial Statements.
| | Valuation Inputs at Reporting Date: |
| Description | Total | Level 1 | Level 2 | Level 3 |
| Investments in Securities: | | | | |
| Equities: | | | | |
| Consumer Discretionary | $161,301,062 | $93,078,305 | $68,222,757 | $-- |
| Consumer Staples | 107,775,630 | 42,534,192 | 48,709,383 | 16,532,055 |
| Energy | 21,746,457 | 12,595,333 | 9,151,124 | -- |
| Financials | 69,912,735 | 64,828,395 | 5,084,340 | -- |
| Health Care | 143,127,214 | 108,983,711 | 34,143,503 | -- |
| Industrials | 278,437,812 | 187,114,753 | 91,323,059 | -- |
| Information Technology | 154,710,340 | 75,378,829 | 79,331,511 | -- |
| Materials | 86,245,342 | 55,495,881 | 30,295,378 | 454,083 |
| Real Estate | 80,254,310 | 67,881,507 | 12,372,803 | -- |
| Money Market Funds | 53,680,718 | 53,680,718 | -- | -- |
| Total Investments in Securities: | $1,157,191,620 | $761,571,624 | $378,633,858 | $16,986,138 |
The following is a summary of transfers between Level 1 and Level 2 for the period ended October 31, 2017. Transfers are assumed to have occurred at the beginning of the period, and are primarily attributable to the valuation techniques used for foreign equity securities, as discussed in the accompanying Notes to Financial Statements:
| Transfers | Total |
| Level 1 to Level 2 | $284,616,077 |
| Level 2 to Level 1 | $0 |
The following is a reconciliation of Investments in Securities for which Level 3 inputs were used in determining value:
| Investments in Securities: | |
| Equities - Consumer Staples | |
| Beginning Balance | $-- |
| Net Realized Gain (Loss) on Investment Securities | 283,385 |
| Net Unrealized Gain (Loss) on Investment Securities | (1,863,075) |
| Cost of Purchases | 3,666,809 |
| Proceeds of Sales | (467,198) |
| Amortization/Accretion | -- |
| Transfers into Level 3 | 14,912,134 |
| Transfers out of Level 3 | -- |
| Ending Balance | $16,532,055 |
| The change in unrealized gain (loss) for the period attributable to Level 3 securities held at October 31, 2017 | $(1,863,075) |
| Other Investments in Securities | |
| Beginning Balance | $-- |
| Net Realized Gain (Loss) on Investment Securities | (1,348,315) |
| Net Unrealized Gain (Loss) on Investment Securities | (1,479,124) |
| Cost of Purchases | 359,803 |
| Proceeds of Sales | (2,035,022) |
| Amortization/Accretion | -- |
| Transfers into Level 3 | 4,956,741 |
| Transfers out of Level 3 | -- |
| Ending Balance | $454,083 |
| The change in unrealized gain (loss) for the period attributable to Level 3 securities held at October 31, 2017 | $(1,479,124) |
The information used in the above reconciliation represents fiscal year to date activity for any Investments in Securities identified as using Level 3 inputs at either the beginning or the end of the current fiscal period. Transfers into Level 3 were attributable to a lack of observable market data resulting from decreases in market activity, decreases in liquidity, security restructurings or corporate actions. Transfers out of Level 3 were attributable to observable market data becoming available for those securities. Transfers in or out of Level 3 represent the beginning value of any Security or Instrument where a change in the pricing level occurred from the beginning to the end of the period. The cost of purchases and the proceeds of sales may include securities received or delivered through corporate actions or exchanges.
See accompanying notes which are an integral part of the financial statements.
Financial Statements
Statement of Assets and Liabilities
| | | October 31, 2017 |
| Assets | | |
Investment in securities, at value (including securities loaned of $6,241,794) — See accompanying schedule:
Unaffiliated issuers (cost $830,355,353) | $1,103,510,902 | |
| Fidelity Central Funds (cost $53,681,365) | 53,680,718 | |
| Total Investment in Securities (cost $884,036,718) | | $1,157,191,620 |
| Receivable for fund shares sold | | 1,581,653 |
| Dividends receivable | | 3,359,582 |
| Distributions receivable from Fidelity Central Funds | | 47,021 |
| Prepaid expenses | | 2,527 |
| Other receivables | | 10,690 |
| Total assets | | 1,162,193,093 |
| Liabilities | | |
| Payable for investments purchased | | |
| Regular delivery | $115 | |
| Delayed delivery | 333,025 | |
| Payable for fund shares redeemed | 2,215,893 | |
| Accrued management fee | 749,378 | |
| Distribution and service plan fees payable | 26,250 | |
| Other affiliated payables | 225,143 | |
| Other payables and accrued expenses | 83,023 | |
| Collateral on securities loaned | 6,506,389 | |
| Total liabilities | | 10,139,216 |
| Net Assets | | $1,152,053,877 |
| Net Assets consist of: | | |
| Paid in capital | | $873,874,359 |
| Undistributed net investment income | | 8,057,934 |
| Accumulated undistributed net realized gain (loss) on investments and foreign currency transactions | | (3,033,738) |
| Net unrealized appreciation (depreciation) on investments and assets and liabilities in foreign currencies | | 273,155,322 |
| Net Assets | | $1,152,053,877 |
| Calculation of Maximum Offering Price | | |
| Class A: | | |
| Net Asset Value and redemption price per share ($41,324,324 ÷ 2,237,463 shares) | | $18.47 |
| Maximum offering price per share (100/94.25 of $18.47) | | $19.60 |
| Class M: | | |
| Net Asset Value and redemption price per share ($14,422,181 ÷ 787,171 shares) | | $18.32 |
| Maximum offering price per share (100/96.50 of $18.32) | | $18.98 |
| Class C: | | |
| Net Asset Value and offering price per share ($14,547,484 ÷ 815,281 shares)(a) | | $17.84 |
| International Small Cap Opportunities: | | |
| Net Asset Value, offering price and redemption price per share ($916,881,772 ÷ 49,065,046 shares) | | $18.69 |
| Class I: | | |
| Net Asset Value, offering price and redemption price per share ($164,878,116 ÷ 8,834,439 shares) | | $18.66 |
(a) Redemption price per share is equal to net asset value less any applicable contingent deferred sales charge.
See accompanying notes which are an integral part of the financial statements.
Statement of Operations
| | | Year ended October 31, 2017 |
| Investment Income | | |
| Dividends | | $22,770,353 |
| Income from Fidelity Central Funds | | 525,326 |
| Income before foreign taxes withheld | | 23,295,679 |
| Less foreign taxes withheld | | (2,076,669) |
| Total income | | 21,219,010 |
| Expenses | | |
| Management fee | | |
| Basic fee | $8,769,277 | |
| Performance adjustment | 142,160 | |
| Transfer agent fees | 2,067,521 | |
| Distribution and service plan fees | 292,195 | |
| Accounting and security lending fees | 485,425 | |
| Custodian fees and expenses | 158,279 | |
| Independent trustees' fees and expenses | 4,093 | |
| Registration fees | 104,587 | |
| Audit | 79,821 | |
| Legal | 2,898 | |
| Interest | 2,066 | |
| Miscellaneous | 10,741 | |
| Total expenses before reductions | 12,119,063 | |
| Expense reductions | (31,942) | 12,087,121 |
| Net investment income (loss) | | 9,131,889 |
| Realized and Unrealized Gain (Loss) | | |
| Net realized gain (loss) on: | | |
| Investment securities: | | |
| Unaffiliated issuers | 40,931,692 | |
| Fidelity Central Funds | (1,551) | |
| Other affiliated issuers | 599,349 | |
| Foreign currency transactions | 31,689 | |
| Total net realized gain (loss) | | 41,561,179 |
| Change in net unrealized appreciation (depreciation) on: | | |
| Investment securities: | | |
| Unaffiliated issuers | 188,565,869 | |
| Fidelity Central Funds | (1,672) | |
| Other affiliated issuers | (1,269,621) | |
| Assets and liabilities in foreign currencies | 126,415 | |
| Total change in net unrealized appreciation (depreciation) | | 187,420,991 |
| Net gain (loss) | | 228,982,170 |
| Net increase (decrease) in net assets resulting from operations | | $238,114,059 |
See accompanying notes which are an integral part of the financial statements.
Statement of Changes in Net Assets
| | Year ended October 31, 2017 | Year ended October 31, 2016 |
| Increase (Decrease) in Net Assets | | |
| Operations | | |
| Net investment income (loss) | $9,131,889 | $9,502,103 |
| Net realized gain (loss) | 41,561,179 | 53,842,316 |
| Change in net unrealized appreciation (depreciation) | 187,420,991 | (43,765,071) |
| Net increase (decrease) in net assets resulting from operations | 238,114,059 | 19,579,348 |
| Distributions to shareholders from net investment income | (10,624,038) | (4,852,691) |
| Distributions to shareholders from net realized gain | (2,566,511) | (4,655,673) |
| Total distributions | (13,190,549) | (9,508,364) |
| Share transactions - net increase (decrease) | (108,646,188) | 68,430,907 |
| Redemption fees | 188,947 | 241,368 |
| Total increase (decrease) in net assets | 116,466,269 | 78,743,259 |
| Net Assets | | |
| Beginning of period | 1,035,587,608 | 956,844,349 |
| End of period | $1,152,053,877 | $1,035,587,608 |
| Other Information | | |
| Undistributed net investment income end of period | $8,057,934 | $9,497,402 |
See accompanying notes which are an integral part of the financial statements.
Financial Highlights
Fidelity International Small Cap Opportunities Fund Class A
| Years ended October 31, | 2017 | 2016 | 2015 | 2014 | 2013 |
| Selected Per–Share Data | | | | | |
| Net asset value, beginning of period | $14.82 | $14.75 | $13.65 | $13.68 | $10.78 |
| Income from Investment Operations | | | | | |
| Net investment income (loss)A | .10 | .09 | .06 | .05 | .07 |
| Net realized and unrealized gain (loss) | 3.71 | .10 | 1.11 | .05 | 2.91 |
| Total from investment operations | 3.81 | .19 | 1.17 | .10 | 2.98 |
| Distributions from net investment income | (.12) | (.05) | (.05) | (.06) | (.08) |
| Distributions from net realized gain | (.04) | (.07) | (.02) | (.08) | (.01) |
| Total distributions | (.16) | (.12) | (.07) | (.13)B | (.08)C |
| Redemption fees added to paid in capitalA,D | – | – | – | – | – |
| Net asset value, end of period | $18.47 | $14.82 | $14.75 | $13.65 | $13.68 |
| Total ReturnE,F | 26.00% | 1.30% | 8.62% | .78% | 27.85% |
| Ratios to Average Net AssetsG,H | | | | | |
| Expenses before reductions | 1.43% | 1.45% | 1.52% | 1.63% | 1.70% |
| Expenses net of fee waivers, if any | 1.43% | 1.45% | 1.52% | 1.63% | 1.65% |
| Expenses net of all reductions | 1.43% | 1.45% | 1.51% | 1.63% | 1.64% |
| Net investment income (loss) | .61% | .62% | .38% | .33% | .59% |
| Supplemental Data | | | | | |
| Net assets, end of period (000 omitted) | $41,324 | $45,151 | $42,289 | $25,041 | $22,052 |
| Portfolio turnover rateI | 11% | 24% | 21% | 18% | 31% |
A Calculated based on average shares outstanding during the period.
B Total distributions of $.13 per share is comprised of distributions from net investment income of $.055 and distributions from net realized gain of $.079 per share.
C Total distributions of $.08 per share is comprised of distributions from net investment income of $.077 and distributions from net realized gain of $.005 per share.
D Amount represents less than $.005 per share.
E Total returns would have been lower if certain expenses had not been reduced during the applicable periods shown.
F Total returns do not include the effect of the sales charges.
G Fees and expenses of any underlying Fidelity Central Funds are not included in the Fund's expense ratio. The Fund indirectly bears its proportionate share of the expenses of any underlying Fidelity Central Funds.
H Expense ratios reflect operating expenses of the class. Expenses before reductions do not reflect amounts reimbursed by the investment adviser or reductions from brokerage service arrangements or reductions from other expense offset arrangements and do not represent the amount paid by the class during periods when reimbursements or reductions occur. Expenses net of fee waivers reflect expenses after reimbursement by the investment adviser but prior to reductions from brokerage service arrangements or other expense offset arrangements. Expenses net of all reductions represent the net expenses paid by the class.
I Amount does not include the portfolio activity of any underlying Fidelity Central Funds.
See accompanying notes which are an integral part of the financial statements.
Fidelity International Small Cap Opportunities Fund Class M
| Years ended October 31, | 2017 | 2016 | 2015 | 2014 | 2013 |
| Selected Per–Share Data | | | | | |
| Net asset value, beginning of period | $14.68 | $14.62 | $13.53 | $13.56 | $10.69 |
| Income from Investment Operations | | | | | |
| Net investment income (loss)A | .05 | .04 | .01 | .01 | .04 |
| Net realized and unrealized gain (loss) | 3.69 | .10 | 1.11 | .06 | 2.89 |
| Total from investment operations | 3.74 | .14 | 1.12 | .07 | 2.93 |
| Distributions from net investment income | (.06) | (.01) | (.01) | (.02) | (.05) |
| Distributions from net realized gain | (.04) | (.07) | (.02) | (.08) | (.01) |
| Total distributions | (.10) | (.08) | (.03) | (.10) | (.06) |
| Redemption fees added to paid in capitalA,B | – | – | – | – | – |
| Net asset value, end of period | $18.32 | $14.68 | $14.62 | $13.53 | $13.56 |
| Total ReturnC,D | 25.63% | .95% | 8.27% | .55% | 27.53% |
| Ratios to Average Net AssetsE,F | | | | | |
| Expenses before reductions | 1.73% | 1.77% | 1.80% | 1.89% | 1.96% |
| Expenses net of fee waivers, if any | 1.73% | 1.77% | 1.80% | 1.89% | 1.90% |
| Expenses net of all reductions | 1.73% | 1.77% | 1.80% | 1.89% | 1.89% |
| Net investment income (loss) | .31% | .30% | .10% | .07% | .34% |
| Supplemental Data | | | | | |
| Net assets, end of period (000 omitted) | $14,422 | $12,308 | $13,296 | $9,913 | $9,634 |
| Portfolio turnover rateG | 11% | 24% | 21% | 18% | 31% |
A Calculated based on average shares outstanding during the period.
B Amount represents less than $.005 per share.
C Total returns would have been lower if certain expenses had not been reduced during the applicable periods shown.
D Total returns do not include the effect of the sales charges.
E Fees and expenses of any underlying Fidelity Central Funds are not included in the Fund's expense ratio. The Fund indirectly bears its proportionate share of the expenses of any underlying Fidelity Central Funds.
F Expense ratios reflect operating expenses of the class. Expenses before reductions do not reflect amounts reimbursed by the investment adviser or reductions from brokerage service arrangements or reductions from other expense offset arrangements and do not represent the amount paid by the class during periods when reimbursements or reductions occur. Expenses net of fee waivers reflect expenses after reimbursement by the investment adviser but prior to reductions from brokerage service arrangements or other expense offset arrangements. Expenses net of all reductions represent the net expenses paid by the class.
G Amount does not include the portfolio activity of any underlying Fidelity Central Funds.
See accompanying notes which are an integral part of the financial statements.
Fidelity International Small Cap Opportunities Fund Class C
| Years ended October 31, | 2017 | 2016 | 2015 | 2014 | 2013 |
| Selected Per–Share Data | | | | | |
| Net asset value, beginning of period | $14.27 | $14.26 | $13.23 | $13.28 | $10.48 |
| Income from Investment Operations | | | | | |
| Net investment income (loss)A | (.03) | (.03) | (.05) | (.06) | (.02) |
| Net realized and unrealized gain (loss) | 3.60 | .09 | 1.08 | .06 | 2.84 |
| Total from investment operations | 3.57 | .06 | 1.03 | – | 2.82 |
| Distributions from net investment income | – | – | – | – | (.01) |
| Distributions from net realized gain | – | (.05) | – | (.05) | (.01) |
| Total distributions | – | (.05) | – | (.05) | (.02) |
| Redemption fees added to paid in capitalA,B | – | – | – | – | – |
| Net asset value, end of period | $17.84 | $14.27 | $14.26 | $13.23 | $13.28 |
| Total ReturnC,D | 25.02% | .44% | 7.79% | .03% | 26.91% |
| Ratios to Average Net AssetsE,F | | | | | |
| Expenses before reductions | 2.22% | 2.26% | 2.27% | 2.38% | 2.45% |
| Expenses net of fee waivers, if any | 2.22% | 2.26% | 2.27% | 2.38% | 2.40% |
| Expenses net of all reductions | 2.21% | 2.25% | 2.26% | 2.38% | 2.39% |
| Net investment income (loss) | (.17)% | (.19)% | (.36)% | (.42)% | (.16)% |
| Supplemental Data | | | | | |
| Net assets, end of period (000 omitted) | $14,547 | $12,625 | $17,370 | $8,438 | $8,070 |
| Portfolio turnover rateG | 11% | 24% | 21% | 18% | 31% |
A Calculated based on average shares outstanding during the period.
B Amount represents less than $.005 per share.
C Total returns would have been lower if certain expenses had not been reduced during the applicable periods shown.
D Total returns do not include the effect of the contingent deferred sales charge.
E Fees and expenses of any underlying Fidelity Central Funds are not included in the Fund's expense ratio. The Fund indirectly bears its proportionate share of the expenses of any underlying Fidelity Central Funds.
F Expense ratios reflect operating expenses of the class. Expenses before reductions do not reflect amounts reimbursed by the investment adviser or reductions from brokerage service arrangements or reductions from other expense offset arrangements and do not represent the amount paid by the class during periods when reimbursements or reductions occur. Expenses net of fee waivers reflect expenses after reimbursement by the investment adviser but prior to reductions from brokerage service arrangements or other expense offset arrangements. Expenses net of all reductions represent the net expenses paid by the class.
G Amount does not include the portfolio activity of any underlying Fidelity Central Funds.
See accompanying notes which are an integral part of the financial statements.
Fidelity International Small Cap Opportunities Fund
| Years ended October 31, | 2017 | 2016 | 2015 | 2014 | 2013 |
| Selected Per–Share Data | | | | | |
| Net asset value, beginning of period | $15.00 | $14.91 | $13.80 | $13.82 | $10.88 |
| Income from Investment Operations | | | | | |
| Net investment income (loss)A | .15 | .13 | .10 | .09 | .10 |
| Net realized and unrealized gain (loss) | 3.75 | .11 | 1.12 | .06 | 2.95 |
| Total from investment operations | 3.90 | .24 | 1.22 | .15 | 3.05 |
| Distributions from net investment income | (.17) | (.08) | (.09) | (.09) | (.10) |
| Distributions from net realized gain | (.04) | (.07) | (.02) | (.08) | (.01) |
| Total distributions | (.21) | (.15) | (.11) | (.17) | (.11) |
| Redemption fees added to paid in capitalA,B | – | – | – | – | – |
| Net asset value, end of period | $18.69 | $15.00 | $14.91 | $13.80 | $13.82 |
| Total ReturnC | 26.39% | 1.58% | 8.92% | 1.11% | 28.24% |
| Ratios to Average Net AssetsD,E | | | | | |
| Expenses before reductions | 1.13% | 1.17% | 1.23% | 1.30% | 1.39% |
| Expenses net of fee waivers, if any | 1.13% | 1.17% | 1.22% | 1.30% | 1.39% |
| Expenses net of all reductions | 1.13% | 1.16% | 1.22% | 1.30% | 1.38% |
| Net investment income (loss) | .91% | .90% | .68% | .65% | .85% |
| Supplemental Data | | | | | |
| Net assets, end of period (000 omitted) | $916,882 | $809,952 | $762,563 | $584,253 | $518,121 |
| Portfolio turnover rateF | 11% | 24% | 21% | 18% | 31% |
A Calculated based on average shares outstanding during the period.
B Amount represents less than $.005 per share.
C Total returns would have been lower if certain expenses had not been reduced during the applicable periods shown.
D Fees and expenses of any underlying Fidelity Central Funds are not included in the Fund's expense ratio. The Fund indirectly bears its proportionate share of the expenses of any underlying Fidelity Central Funds.
E Expense ratios reflect operating expenses of the class. Expenses before reductions do not reflect amounts reimbursed by the investment adviser or reductions from brokerage service arrangements or reductions from other expense offset arrangements and do not represent the amount paid by the class during periods when reimbursements or reductions occur. Expenses net of fee waivers reflect expenses after reimbursement by the investment adviser but prior to reductions from brokerage service arrangements or other expense offset arrangements. Expenses net of all reductions represent the net expenses paid by the class.
F Amount does not include the portfolio activity of any underlying Fidelity Central Funds.
See accompanying notes which are an integral part of the financial statements.
Fidelity International Small Cap Opportunities Fund Class I
| Years ended October 31, | 2017 | 2016 | 2015 | 2014 | 2013 |
| Selected Per–Share Data | | | | | |
| Net asset value, beginning of period | $14.99 | $14.91 | $13.81 | $13.83 | $10.90 |
| Income from Investment Operations | | | | | |
| Net investment income (loss)A | .15 | .13 | .10 | .08 | .11 |
| Net realized and unrealized gain (loss) | 3.74 | .10 | 1.13 | .07 | 2.93 |
| Total from investment operations | 3.89 | .23 | 1.23 | .15 | 3.04 |
| Distributions from net investment income | (.18) | (.08) | (.11) | (.09) | (.10) |
| Distributions from net realized gain | (.04) | (.07) | (.02) | (.08) | (.01) |
| Total distributions | (.22) | (.15) | (.13) | (.17) | (.11) |
| Redemption fees added to paid in capitalA,B | – | – | – | – | – |
| Net asset value, end of period | $18.66 | $14.99 | $14.91 | $13.81 | $13.83 |
| Total ReturnC | 26.34% | 1.56% | 8.98% | 1.11% | 28.11% |
| Ratios to Average Net AssetsD,E | | | | | |
| Expenses before reductions | 1.14% | 1.16% | 1.19% | 1.36% | 1.38% |
| Expenses net of fee waivers, if any | 1.14% | 1.16% | 1.19% | 1.36% | 1.37% |
| Expenses net of all reductions | 1.14% | 1.16% | 1.18% | 1.36% | 1.37% |
| Net investment income (loss) | .90% | .91% | .71% | .60% | .87% |
| Supplemental Data | | | | | |
| Net assets, end of period (000 omitted) | $164,878 | $155,551 | $120,723 | $29,822 | $5,670 |
| Portfolio turnover rateF | 11% | 24% | 21% | 18% | 31% |
A Calculated based on average shares outstanding during the period.
B Amount represents less than $.005 per share.
C Total returns would have been lower if certain expenses had not been reduced during the applicable periods shown.
D Fees and expenses of any underlying Fidelity Central Funds are not included in the Fund's expense ratio. The Fund indirectly bears its proportionate share of the expenses of any underlying Fidelity Central Funds.
E Expense ratios reflect operating expenses of the class. Expenses before reductions do not reflect amounts reimbursed by the investment adviser or reductions from brokerage service arrangements or reductions from other expense offset arrangements and do not represent the amount paid by the class during periods when reimbursements or reductions occur. Expenses net of fee waivers reflect expenses after reimbursement by the investment adviser but prior to reductions from brokerage service arrangements or other expense offset arrangements. Expenses net of all reductions represent the net expenses paid by the class.
F Amount does not include the portfolio activity of any underlying Fidelity Central Funds.
See accompanying notes which are an integral part of the financial statements.
Notes to Financial Statements
For the period ended October 31, 2017
1. Organization.
Fidelity International Small Cap Opportunities Fund (the Fund) is a fund of Fidelity Investment Trust (the Trust) and is authorized to issue an unlimited number of shares. The Trust is registered under the Investment Company Act of 1940, as amended (the 1940 Act), as an open-end management investment company organized as a Massachusetts business trust. The Fund offers Class A, Class M (formerly Class T), Class C, International Small Cap Opportunities and Class I, each of which has equal rights as to assets and voting privileges. Each class has exclusive voting rights with respect to matters that affect that class.
After the close of business on June 24, 2016, all outstanding Class B shares were converted to Class A shares. All prior fiscal period dollar and share amounts for Class B presented in the Notes to Financial Statements are for the period November 1, 2015 through June 24, 2016.
2. Investments in Fidelity Central Funds.
The Fund invests in Fidelity Central Funds, which are open-end investment companies generally available only to other investment companies and accounts managed by the investment adviser and its affiliates. The Fund's Schedule of Investments lists each of the Fidelity Central Funds held as of period end, if any, as an investment of the Fund, but does not include the underlying holdings of each Fidelity Central Fund. As an Investing Fund, the Fund indirectly bears its proportionate share of the expenses of the underlying Fidelity Central Funds.
The Money Market Central Funds seek preservation of capital and current income and are managed by Fidelity Investments Money Management, Inc. (FIMM), an affiliate of the investment adviser. Annualized expenses of the Money Market Central Funds as of their most recent shareholder report date are less than .005%.
A complete unaudited list of holdings for each Fidelity Central Fund is available upon request or at the Securities and Exchange Commission (the SEC) website at www.sec.gov. In addition, the financial statements of the Fidelity Central Funds, which are not covered by the Fund's Report of Independent Registered Public Accounting Firm, are available on the SEC website or upon request.
3. Significant Accounting Policies.
The Fund is an investment company and applies the accounting and reporting guidance of the Financial Accounting Standards Board (FASB) Accounting Standards Codification Topic 946 Financial Services – Investments Companies. The financial statements have been prepared in conformity with accounting principles generally accepted in the United States of America (GAAP), which require management to make certain estimates and assumptions at the date of the financial statements. Actual results could differ from those estimates. Subsequent events, if any, through the date that the financial statements were issued have been evaluated in the preparation of the financial statements. The following summarizes the significant accounting policies of the Fund:
Investment Valuation. Investments are valued as of 4:00 p.m. Eastern time on the last calendar day of the period. The Board of Trustees (the Board) has delegated the day to day responsibility for the valuation of the Fund's investments to the Fair Value Committee (the Committee) established by the Fund's investment adviser. In accordance with valuation policies and procedures approved by the Board, the Fund attempts to obtain prices from one or more third party pricing vendors or brokers to value its investments. When current market prices, quotations or currency exchange rates are not readily available or reliable, investments will be fair valued in good faith by the Committee, in accordance with procedures adopted by the Board. Factors used in determining fair value vary by investment type and may include market or investment specific events. The frequency with which these procedures are used cannot be predicted and they may be utilized to a significant extent. The Committee oversees the Fund's valuation policies and procedures and reports to the Board on the Committee's activities and fair value determinations. The Board monitors the appropriateness of the procedures used in valuing the Fund's investments and ratifies the fair value determinations of the Committee.
The Fund categorizes the inputs to valuation techniques used to value its investments into a disclosure hierarchy consisting of three levels as shown below:
- Level 1 – quoted prices in active markets for identical investments
- Level 2 – other significant observable inputs (including quoted prices for similar investments, interest rates, prepayment speeds, etc.)
- Level 3 – unobservable inputs (including the Fund's own assumptions based on the best information available)
Valuation techniques used to value the Fund's investments by major category are as follows:
Equity securities, including restricted securities, for which market quotations are readily available, are valued at the last reported sale price or official closing price as reported by a third party pricing vendor on the primary market or exchange on which they are traded and are categorized as Level 1 in the hierarchy. In the event there were no sales during the day or closing prices are not available, securities are valued at the last quoted bid price or may be valued using the last available price and are generally categorized as Level 2 in the hierarchy. For foreign equity securities, when market or security specific events arise, comparisons to the valuation of American Depositary Receipts (ADRs), futures contracts, Exchange-Traded Funds (ETFs) and certain indexes as well as quoted prices for similar securities may be used and would be categorized as Level 2 in the hierarchy. Utilizing these techniques may result in transfers between Level 1 and Level 2. For equity securities, including restricted securities, where observable inputs are limited, assumptions about market activity and risk are used and these securities may be categorized as Level 3 in the hierarchy.
Investments in open-end mutual funds, including the Fidelity Central Funds, are valued at their closing net asset value (NAV) each business day and are categorized as Level 1 in the hierarchy.
The following provides information on Level 3 securities held by the Fund that were valued at period end based on unobservable inputs. These amounts exclude valuations provided by a broker.
| Asset Type | Fair Value | Valuation Technique(s) | Unobservable Input | Amount or Range/Weighted Average | Impact to Valuation from an Increase in Input(a) |
| Equities | 16,986,138 | Market approach | Transaction price | $0.23-$70.75 / $68.86 | Increase |
(a) Represents the expected directional change in the fair value of the Level 3 investments that would result from an increase in the corresponding input. A decrease to the unobservable input would have the opposite effect. Significant changes in these inputs could result in significantly higher or lower fair value measurements.
Changes in valuation techniques may result in transfers in or out of an assigned level within the disclosure hierarchy. The aggregate value of investments by input level as of October 31, 2017, including information on transfers between Levels 1 and 2, as well as a roll forward of Level 3 investments, is included at the end of the Fund's Schedule of Investments.
Foreign Currency. The Fund may use foreign currency contracts to facilitate transactions in foreign-denominated securities. Gains and losses from these transactions may arise from changes in the value of the foreign currency or if the counterparties do not perform under the contracts' terms.
Foreign-denominated assets, including investment securities, and liabilities are translated into U.S. dollars at the exchange rates at period end. Purchases and sales of investment securities, income and dividends received and expenses denominated in foreign currencies are translated into U.S. dollars at the exchange rate in effect on the transaction date.
The effects of exchange rate fluctuations on investments are included with the net realized and unrealized gain (loss) on investment securities. Other foreign currency transactions resulting in realized and unrealized gain (loss) are disclosed separately.
Investment Transactions and Income. For financial reporting purposes, the Fund's investment holdings and NAV include trades executed through the end of the last business day of the period. The NAV per share for processing shareholder transactions is calculated as of the close of business of the New York Stock Exchange (NYSE), normally 4:00 p.m. Eastern time and includes trades executed through the end of the prior business day. Gains and losses on securities sold are determined on the basis of identified cost. Dividend income is recorded on the ex-dividend date, except for certain dividends from foreign securities where the ex-dividend date may have passed, which are recorded as soon as the Fund is informed of the ex-dividend date. Non-cash dividends included in dividend income, if any, are recorded at the fair market value of the securities received. Income and capital gain distributions from Fidelity Central Funds, if any, are recorded on the ex-dividend date. Certain distributions received by the Fund represent a return of capital or capital gain. The Fund determines the components of these distributions subsequent to the ex-dividend date, based upon receipt of tax filings or other correspondence relating to the underlying investment. These distributions are recorded as a reduction of cost of investments and/or as a realized gain. Investment income is recorded net of foreign taxes withheld where recovery of such taxes is uncertain.
Class Allocations and Expenses. Investment income, realized and unrealized capital gains and losses, common expenses of the Fund, and certain fund-level expense reductions, if any, are allocated daily on a pro-rata basis to each class based on the relative net assets of each class to the total net assets of the Fund. Each class differs with respect to transfer agent and distribution and service plan fees incurred. Certain expense reductions may also differ by class. For the reporting period, the allocated portion of income and expenses to each class as a percent of its average net assets may vary due to the timing of recording these transactions in relation to fluctuating net assets of the classes. Expenses directly attributable to a fund are charged to that fund. Expenses attributable to more than one fund are allocated among the respective funds on the basis of relative net assets or other appropriate methods. Expense estimates are accrued in the period to which they relate and adjustments are made when actual amounts are known.
Income Tax Information and Distributions to Shareholders. Each year, the Fund intends to qualify as a regulated investment company under Subchapter M of the Internal Revenue Code, including distributing substantially all of its taxable income and realized gains. As a result, no provision for U.S. Federal income taxes is required. As of October 31, 2017, the Fund did not have any unrecognized tax benefits in the financial statements; nor is the Fund aware of any tax positions for which it is reasonably possible that the total amounts of unrecognized tax benefits will significantly change in the next twelve months. The Fund files a U.S. federal tax return, in addition to state and local tax returns as required. The Fund's federal income tax returns are subject to examination by the Internal Revenue Service (IRS) for a period of three fiscal years after they are filed. State and local tax returns may be subject to examination for an additional fiscal year depending on the jurisdiction. Foreign taxes are provided for based on the Fund's understanding of the tax rules and rates that exist in the foreign markets in which it invests.
Distributions are declared and recorded on the ex-dividend date. Income dividends and capital gain distributions are declared separately for each class. Income and capital gain distributions are determined in accordance with income tax regulations, which may differ from GAAP.
Capital accounts within the financial statements are adjusted for permanent book-tax differences. These adjustments have no impact on net assets or the results of operations. Capital accounts are not adjusted for temporary book-tax differences which will reverse in a subsequent period.
Book-tax differences are primarily due to foreign currency transactions, passive foreign investments companies (PFIC), capital loss carryforwards and losses deferred due to wash sales.
As of period end, the cost and unrealized appreciation (depreciation) in securities, and derivatives if applicable, for federal income tax purposes were as follows:
| Gross unrealized appreciation | $301,414,773 |
| Gross unrealized depreciation | (45,831,951) |
| Net unrealized appreciation (depreciation) | $255,582,822 |
| Tax Cost | $901,608,798 |
The tax-based components of distributable earnings as of period end were as follows:
| Undistributed ordinary income | $22,598,255 |
| Net unrealized appreciation (depreciation) on securities and other investments | $255,581,263 |
The tax character of distributions paid was as follows:
| | October 31, 2017 | October 31, 2016 |
| Ordinary Income | $13,190,549 | $ 9,508,364 |
Short-Term Trading (Redemption) Fees. Shares purchased by investors and held in the Fund less than 90 days may be subject to a redemption fee equal to 2.00% of the NAV of shares redeemed. All redemption fees, which reduce the proceeds of the shareholder redemption, are retained by the Fund and accounted for as an addition to paid in capital. In November 2017, the Board of Trustees approved the elimination of these redemption fees effective December 18, 2017.
Delayed Delivery Transactions and When-Issued Securities. During the period, the Fund transacted in securities on a delayed delivery or when-issued basis. Payment and delivery may take place after the customary settlement period for that security. The price of the underlying securities and the date when the securities will be delivered and paid for are fixed at the time the transaction is negotiated. The securities purchased on a delayed delivery or when-issued basis are identified as such in the Fund's Schedule of Investments. With respect to purchase commitments, the Fund identifies securities as segregated in its records with a value at least equal to the amount of the commitment. Losses may arise due to changes in the value of the underlying securities or if the counterparty does not perform under the contract's terms, or if the issuer does not issue the securities due to political, economic, or other factors.
Restricted Securities. The Fund may invest in securities that are subject to legal or contractual restrictions on resale. These securities generally may be resold in transactions exempt from registration or to the public if the securities are registered. Disposal of these securities may involve time-consuming negotiations and expense, and prompt sale at an acceptable price may be difficult. Information regarding restricted securities is included at the end of the Fund's Schedule of Investments.
4. Purchases and Sales of Investments.
Purchases and sales of securities, other than short-term securities, aggregated $114,512,335 and $258,712,685, respectively.
5. Fees and Other Transactions with Affiliates.
Management Fee. Fidelity Management & Research Company (the investment adviser) and its affiliates provide the Fund with investment management related services for which the Fund pays a monthly management fee. The management fee is the sum of an individual fund fee rate that is based on an annual rate of .60% of the Fund's average net assets and an annualized group fee rate that averaged .25% during the period. The group fee rate is based upon the average net assets of all the mutual funds advised by the investment adviser, including any mutual funds previously advised by the investment adviser that are currently advised by Fidelity SelectCo, LLC, an affiliate of the investment adviser. The group fee rate decreases as assets under management increase and increases as assets under management decrease. In addition, the management fee is subject to a performance adjustment (up to a maximum of +/- .20% of the Fund's average net assets over a 36 month performance period). The upward or downward adjustment to the management fee is based on the relative investment performance of International Small Cap Opportunities as compared to its benchmark index, the MSCI EAFE Small Cap Index, over the same 36 month performance period. For the reporting period, the total annual management fee rate, including the performance adjustment, was .86% of the Fund's average net assets. The performance adjustment included in the management fee rate may be higher or lower than the maximum performance adjustment rate due to the difference between the average net assets for the reporting and performance periods.
Distribution and Service Plan Fees. In accordance with Rule 12b-1 of the 1940 Act, the Fund has adopted separate Distribution and Service Plans for each class of shares. Certain classes pay Fidelity Distributors Corporation (FDC), an affiliate of the investment adviser, separate Distribution and Service Fees, each of which is based on an annual percentage of each class' average net assets. In addition, FDC may pay financial intermediaries for selling shares of the Fund and providing shareholder support services. For the period, the Distribution and Service Fee rates, total fees and amounts retained by FDC were as follows:
| | Distribution
Fee | Service
Fee | Total Fees | Retained
by FDC |
| Class A | -% | .25% | $102,634 | $1,872 |
| Class M | .25% | .25% | 62,074 | – |
| Class C | .75% | .25% | 127,487 | 11,355 |
| | | | $292,195 | $13,227 |
Sales Load. FDC may receive a front-end sales charge of up to 5.75% for selling Class A shares and 3.50% for selling Class M shares, some of which is paid to financial intermediaries for selling shares of the Fund. Depending on the holding period, FDC may receive contingent deferred sales charges levied on Class A, Class M and Class C redemptions. The deferred sales charges are 1.00% for Class C shares, 1.00% for certain purchases of Class A shares and .25% for certain purchases of Class M shares.
For the period, sales charge amounts retained by FDC were as follows:
| | Retained
by FDC |
| Class A | $3,805 |
| Class M | 1,586 |
| Class C(a) | 1,220 |
| | $6,611 |
(a) When Class C shares are initially sold, FDC pays commissions from its own resources to financial intermediaries through which the sales are made.
Transfer Agent Fees. Fidelity Investments Institutional Operations Company, Inc., (FIIOC), an affiliate of the investment adviser, is the transfer, dividend disbursing and shareholder servicing agent for each class of the Fund. FIIOC receives account fees and asset-based fees that vary according to the account size and type of account of the shareholders of the respective classes of the Fund. FIIOC pays for typesetting, printing and mailing of shareholder reports, except proxy statements.
For the period, transfer agent fees for each applicable class were as follows:
| | Amount | % of
Class-Level Average
Net Assets |
| Class A | $99,338 | .24 |
| Class M | 36,835 | .30 |
| Class C | 35,724 | .28 |
| International Small Cap Opportunities | 1,578,011 | .19 |
| Class I | 317,613 | .20 |
| | $2,067,521 | |
Accounting and Security Lending Fees. Fidelity Service Company, Inc. (FSC), an affiliate of the investment adviser, maintains the Fund's accounting records. The accounting fee is based on the level of average net assets for each month. Under a separate contract, FSC administers the security lending program. The security lending fee is based on the number and duration of lending transactions.
Brokerage Commissions. The Fund placed a portion of its portfolio transactions with brokerage firms which are affiliates of the investment adviser. Brokerage commissions are included in net realized gain (loss) and change in net unrealized appreciation (depreciation) in the Statement of Operations. The commissions paid to these affiliated firms were $921 for the period.
Interfund Lending Program. Pursuant to an Exemptive Order issued by the SEC, the Fund, along with other registered investment companies having management contracts with Fidelity Management & Research Company (FMR) or other affiliated entities of FMR, may participate in an interfund lending program. This program provides an alternative credit facility allowing the funds to borrow from, or lend money to, other participating affiliated funds. At period end, there were no interfund loans outstanding. The Fund's activity in this program during the period for which loans were outstanding was as follows:
| Borrower or Lender | Average Loan Balance | Weighted Average Interest Rate | Interest Expense |
| Borrower | $7,779,000 | .58% | $1,257 |
Interfund Trades. The Funds may purchase from or sell securities to other Fidelity Funds under procedures adopted by the Board. The procedures have been designed to ensure these interfund trades are executed in accordance with Rule 17a-7 of the 1940 Act. Interfund trades are included within the respective purchases and sales amounts shown in the Purchases and Sales of Investments note.
6. Committed Line of Credit.
The Fund participates with other funds managed by the investment adviser or an affiliate in a $4.25 billion credit facility (the "line of credit") to be utilized for temporary or emergency purposes to fund shareholder redemptions or for other short-term liquidity purposes. The Fund has agreed to pay commitment fees on its pro-rata portion of the line of credit, which amounted to $3,289 and is reflected in Miscellaneous expenses on the Statement of Operations. During the period, the Fund did not borrow on this line of credit.
7. Security Lending.
The Fund lends portfolio securities through a lending agent from time to time in order to earn additional income. For equity securities, a lending agent is used and may loan securities to certain qualified borrowers, including Fidelity Capital Markets (FCM), a broker-dealer affiliated with the Fund. On the settlement date of the loan, the Fund receives collateral (in the form of U.S. Treasury obligations, letters of credit and/or cash) against the loaned securities and maintains collateral in an amount not less than 100% of the market value of the loaned securities during the period of the loan. The market value of the loaned securities is determined at the close of business of the Fund and any additional required collateral is delivered to the Fund on the next business day. The Fund or borrower may terminate the loan at any time, and if the borrower defaults on its obligation to return the securities loaned because of insolvency or other reasons, the Fund may apply collateral received from the borrower against the obligation. The Fund may experience delays and costs in recovering the securities loaned. Any cash collateral received is invested in the Fidelity Securities Lending Cash Central Fund. The value of loaned securities and cash collateral at period end are disclosed on the Fund's Statement of Assets and Liabilities. The value of securities loaned to FCM at period end was $2,047,704. Security lending income represents the income earned on investing cash collateral, less rebates paid to borrowers and any lending agent fees associated with the loan, plus any premium payments received for lending certain types of securities. Security lending income is presented in the Statement of Operations as a component of income from Fidelity Central Funds. Total security lending income during the period amounted to $237,504, including $1,880 from securities loaned to FCM.
8. Bank Borrowings.
The Fund is permitted to have bank borrowings for temporary or emergency purposes to fund shareholder redemptions or for other short-term liquidity requirements. The Fund has established borrowing arrangements with certain banks. The interest rate on the borrowings is the bank's base rate, as revised from time to time. The average loan balance during the period for which loans were outstanding amounted to $5,334,167. The weighted average interest rate was .91%. The interest expense amounted to $809 under the bank borrowing program. At period end, there were no bank borrowings outstanding.
9. Expense Reductions.
Commissions paid to certain brokers with whom the investment adviser, or its affiliates, places trades on behalf of the Fund include an amount in addition to trade execution, which may be rebated back to the Fund to offset certain expenses. This amount totaled $23,393 for the period. Through arrangements with the Fund's custodian, credits realized as a result of certain uninvested cash balances were used to reduce the Fund's expenses. During the period, these credits reduced the Fund's custody expenses by $64.
In addition, during the period the investment adviser reimbursed and/or waived a portion of fund-level operating expenses in the amount of $8,485.
10. Distributions to Shareholders.
Distributions to shareholders of each class were as follows:
| | Year ended
October 31, 2017 | Year ended
October 31, 2016 |
| From net investment income | | |
| Class A | $345,589 | $159,395 |
| Class M | 44,101 | 9,385 |
| International Small Cap Opportunities | 8,436,166 | 3,989,748 |
| Class I | 1,798,182 | 694,163 |
| Total | $10,624,038 | $4,852,691 |
| From net realized gain | | |
| Class A | $117,149 | $214,570 |
| Class M | 32,073 | 65,696 |
| Class C | – | 66,143 |
| International Small Cap Opportunities | 2,008,611 | 3,723,825 |
| Class I | 408,678 | 585,439 |
| Total | $2,566,511 | $4,655,673 |
11. Share Transactions.
Share transactions for each class were as follows and may contain automatic conversions between classes or exchanges between affiliated funds:
| | Shares | Shares | Dollars | Dollars |
| | Year ended
October 31, 2017 | Year ended October 31, 2016 | Year ended
October 31, 2017 | Year ended October 31, 2016 |
| Class A | | | | |
| Shares sold | 617,618 | 1,351,287 | $9,892,785 | $19,658,244 |
| Reinvestment of distributions | 30,743 | 24,184 | 441,465 | 359,376 |
| Shares redeemed | (1,457,378) | (1,195,179) | (22,890,236) | (17,426,031) |
| Net increase (decrease) | (809,017) | 180,292 | $(12,555,986) | $2,591,589 |
| Class M | | | | |
| Shares sold | 184,978 | 193,483 | $3,117,188 | $2,768,529 |
| Reinvestment of distributions | 5,229 | 5,021 | 74,674 | 74,158 |
| Shares redeemed | (241,247) | (269,450) | (3,797,029) | (3,846,732) |
| Net increase (decrease) | (51,040) | (70,946) | $(605,167) | $(1,004,045) |
| Class B | | | | |
| Shares sold | – | 3,601 | $– | $51,563 |
| Shares redeemed | – | (45,696) | – | (635,715) |
| Net increase (decrease) | – | (42,095) | $– | $(584,152) |
| Class C | | | | |
| Shares sold | 166,898 | 246,339 | $2,711,727 | $3,449,372 |
| Reinvestment of distributions | – | 4,483 | – | 64,648 |
| Shares redeemed | (236,034) | (584,363) | (3,599,444) | (8,102,721) |
| Net increase (decrease) | (69,136) | (333,541) | $(887,717) | $(4,588,701) |
| International Small Cap Opportunities | | | | |
| Shares sold | 8,291,089 | 26,676,267 | $139,007,305 | $389,947,202 |
| Reinvestment of distributions | 594,332 | 402,267 | 8,611,863 | 6,034,011 |
| Shares redeemed | (13,816,436) | (24,218,791) | (218,659,907) | (357,874,849) |
| Net increase (decrease) | (4,931,015) | 2,859,743 | $(71,040,739) | $38,106,364 |
| Class I | | | | |
| Shares sold | 4,860,065 | 5,357,445 | $80,212,539 | $78,823,330 |
| Reinvestment of distributions | 138,286 | 75,351 | 2,000,992 | 1,129,506 |
| Shares redeemed | (6,539,728) | (3,153,630) | (105,770,110) | (46,042,984) |
| Net increase (decrease) | (1,541,377) | 2,279,166 | $(23,556,579) | $33,909,852 |
12. Other.
The Fund's organizational documents provide former and current trustees and officers with a limited indemnification against liabilities arising in connection with the performance of their duties to the Fund. In the normal course of business, the Fund may also enter into contracts that provide general indemnifications. The Fund's maximum exposure under these arrangements is unknown as this would be dependent on future claims that may be made against the Fund. The risk of material loss from such claims is considered remote.
Report of Independent Registered Public Accounting Firm
To the Trustees of Fidelity Investment Trust and Shareholders of Fidelity International Small Cap Opportunities Fund:
We have audited the accompanying statement of assets and liabilities of Fidelity International Small Cap Opportunities Fund (the Fund), a fund of Fidelity Investment Trust, including the schedule of investments, as of October 31, 2017, and the related statement of operations for the year then ended, the statement of changes in net assets for each of the two years in the period then ended, and the financial highlights for each of the five years in the period then ended. These financial statements and financial highlights are the responsibility of the Fund's management. Our responsibility is to express an opinion on these financial statements and financial highlights based on our audits.
We conducted our audits in accordance with the standards of the Public Company Accounting Oversight Board (United States). Those standards require that we plan and perform the audit to obtain reasonable assurance about whether the financial statements and financial highlights are free of material misstatement. The Fund is not required to have, nor were we engaged to perform, an audit of its internal control over financial reporting. Our audits included consideration of internal control over financial reporting as a basis for designing audit procedures that are appropriate in the circumstances, but not for the purpose of expressing an opinion on the effectiveness of the Fund's internal control over financial reporting. Accordingly, we express no such opinion. An audit also includes examining, on a test basis, evidence supporting the amounts and disclosures in the financial statements, assessing the accounting principles used and significant estimates made by management, as well as evaluating the overall financial statement presentation. Our procedures included confirmation of securities owned as of October 31, 2017, by correspondence with the custodians and brokers; when replies were not received from brokers, we performed other auditing procedures. We believe that our audits provide a reasonable basis for our opinion.
In our opinion, such financial statements and financial highlights referred to above present fairly, in all material respects, the financial position of Fidelity International Small Cap Opportunities Fund as of October 31, 2017, the results of its operations for the year then ended, the changes in its net assets for each of the two years in the period then ended, and the financial highlights for each of the five years in the period then ended, in conformity with accounting principles generally accepted in the United States of America.
DELOITTE & TOUCHE LLP
Boston, Massachusetts
December 13, 2017
Trustees and Officers
The Trustees, Members of the Advisory Board (if any), and officers of the trust and fund, as applicable, are listed below. The Board of Trustees governs the fund and is responsible for protecting the interests of shareholders. The Trustees are experienced executives who meet periodically throughout the year to oversee the fund's activities, review contractual arrangements with companies that provide services to the fund, oversee management of the risks associated with such activities and contractual arrangements, and review the fund's performance. Except for Jonathan Chiel, each of the Trustees oversees 190 funds. Mr. Chiel oversees 143 funds.
The Trustees hold office without limit in time except that (a) any Trustee may resign; (b) any Trustee may be removed by written instrument, signed by at least two-thirds of the number of Trustees prior to such removal; (c) any Trustee who requests to be retired or who has become incapacitated by illness or injury may be retired by written instrument signed by a majority of the other Trustees; and (d) any Trustee may be removed at any special meeting of shareholders by a two-thirds vote of the outstanding voting securities of the trust. Each Trustee who is not an interested person (as defined in the 1940 Act) of the trust and the fund is referred to herein as an Independent Trustee. Each Independent Trustee shall retire not later than the last day of the calendar year in which his or her 75th birthday occurs. The Independent Trustees may waive this mandatory retirement age policy with respect to individual Trustees. Officers and Advisory Board Members hold office without limit in time, except that any officer or Advisory Board Member may resign or may be removed by a vote of a majority of the Trustees at any regular meeting or any special meeting of the Trustees. Except as indicated, each individual has held the office shown or other offices in the same company for the past five years.
The fund’s Statement of Additional Information (SAI) includes more information about the Trustees. To request a free copy, call Fidelity at 1-800-544-8544.
Experience, Skills, Attributes, and Qualifications of the Trustees. The Governance and Nominating Committee has adopted a statement of policy that describes the experience, qualifications, attributes, and skills that are necessary and desirable for potential Independent Trustee candidates (Statement of Policy). The Board believes that each Trustee satisfied at the time he or she was initially elected or appointed a Trustee, and continues to satisfy, the standards contemplated by the Statement of Policy. The Governance and Nominating Committee also engages professional search firms to help identify potential Independent Trustee candidates who have the experience, qualifications, attributes, and skills consistent with the Statement of Policy. From time to time, additional criteria based on the composition and skills of the current Independent Trustees, as well as experience or skills that may be appropriate in light of future changes to board composition, business conditions, and regulatory or other developments, have also been considered by the professional search firms and the Governance and Nominating Committee. In addition, the Board takes into account the Trustees' commitment and participation in Board and committee meetings, as well as their leadership of standing and ad hoc committees throughout their tenure.
In determining that a particular Trustee was and continues to be qualified to serve as a Trustee, the Board has considered a variety of criteria, none of which, in isolation, was controlling. The Board believes that, collectively, the Trustees have balanced and diverse experience, qualifications, attributes, and skills, which allow the Board to operate effectively in governing the fund and protecting the interests of shareholders. Information about the specific experience, skills, attributes, and qualifications of each Trustee, which in each case led to the Board's conclusion that the Trustee should serve (or continue to serve) as a trustee of the fund, is provided below.
Board Structure and Oversight Function. James C. Curvey is an interested person and currently serves as Chairman. The Trustees have determined that an interested Chairman is appropriate and benefits shareholders because an interested Chairman has a personal and professional stake in the quality and continuity of services provided to the fund. Independent Trustees exercise their informed business judgment to appoint an individual of their choosing to serve as Chairman, regardless of whether the Trustee happens to be independent or a member of management. The Independent Trustees have determined that they can act independently and effectively without having an Independent Trustee serve as Chairman and that a key structural component for assuring that they are in a position to do so is for the Independent Trustees to constitute a substantial majority for the Board. The Independent Trustees also regularly meet in executive session. Ned C. Lautenbach serves as Chairman of the Independent Trustees and as such (i) acts as a liaison between the Independent Trustees and management with respect to matters important to the Independent Trustees and (ii) with management prepares agendas for Board meetings.
Fidelity® funds are overseen by different Boards of Trustees. The fund's Board oversees Fidelity's high income and certain equity funds, and other Boards oversee Fidelity's investment-grade bond, money market, asset allocation, and sector funds. The asset allocation funds may invest in Fidelity® funds overseen by the fund's Board. The use of separate Boards, each with its own committee structure, allows the Trustees of each group of Fidelity® funds to focus on the unique issues of the funds they oversee, including common research, investment, and operational issues. On occasion, the separate Boards establish joint committees to address issues of overlapping consequences for the Fidelity® funds overseen by each Board.
The Trustees operate using a system of committees to facilitate the timely and efficient consideration of all matters of importance to the Trustees, the fund, and fund shareholders and to facilitate compliance with legal and regulatory requirements and oversight of the fund's activities and associated risks. The Board, acting through its committees, has charged FMR and its affiliates with (i) identifying events or circumstances the occurrence of which could have demonstrably adverse effects on the fund's business and/or reputation; (ii) implementing processes and controls to lessen the possibility that such events or circumstances occur or to mitigate the effects of such events or circumstances if they do occur; and (iii) creating and maintaining a system designed to evaluate continuously business and market conditions in order to facilitate the identification and implementation processes described in (i) and (ii) above. Because the day-to-day operations and activities of the fund are carried out by or through FMR, its affiliates, and other service providers, the fund's exposure to risks is mitigated but not eliminated by the processes overseen by the Trustees. While each of the Board's committees has responsibility for overseeing different aspects of the fund's activities, oversight is exercised primarily through the Operations, Audit, and Compliance Committees. In addition, the Independent Trustees have worked with FMR to enhance the Board's oversight of investment and financial risks, legal and regulatory risks, technology risks, and operational risks, including the development of additional risk reporting to the Board. For example, a working group comprised of Independent Trustees and FMR has worked and continues to work to review the Fidelity® funds' valuation-related activities, reporting and risk management. Appropriate personnel, including but not limited to the fund's Chief Compliance Officer (CCO), FMR's internal auditor, the independent accountants, the fund's Treasurer and portfolio management personnel, make periodic reports to the Board's committees, as appropriate, including an annual review of Fidelity's risk management program for the Fidelity® funds. The responsibilities of each standing committee, including their oversight responsibilities, are described further under "Standing Committees of the Trustees."
Interested Trustees*:
Correspondence intended for a Trustee who is an interested person may be sent to Fidelity Investments, 245 Summer Street, Boston, Massachusetts 02210.
Name, Year of Birth; Principal Occupations and Other Relevant Experience+
Jonathan Chiel (1957)
Year of Election or Appointment: 2016
Trustee
Mr. Chiel also serves as Trustee of other Fidelity® funds. Mr. Chiel is Executive Vice President and General Counsel for FMR LLC (diversified financial services company, 2012-present). Previously, Mr. Chiel served as general counsel (2004-2012) and senior vice president and deputy general counsel (2000-2004) for John Hancock Financial Services; a partner with Choate, Hall & Stewart (1996-2000) (law firm); and an Assistant United States Attorney for the United States Attorney’s Office of the District of Massachusetts (1986-95), including Chief of the Criminal Division (1993-1995). Mr. Chiel is a director on the boards of the Boston Bar Foundation and the Maimonides School.
James C. Curvey (1935)
Year of Election or Appointment: 2007
Trustee
Chairman of the Board of Trustees
Mr. Curvey also serves as Trustee of other Fidelity® funds. Mr. Curvey is a Director of Fidelity Research & Analysis Co. (investment adviser firm, 2009-present), and Vice Chairman (2007-present) and Director of FMR LLC (diversified financial services company). In addition, Mr. Curvey serves as an Overseer for the Boston Symphony Orchestra and a member of the board of Artis-Naples, Naples, Florida, and as a Trustee for Brewster Academy, Wolfeboro, New Hampshire. Previously, Mr. Curvey served as a Director of Fidelity Investments Money Management, Inc. (investment adviser firm, 2009-2014) and a Director of FMR and FMR Co., Inc. (investment adviser firms, 2007-2014).
Charles S. Morrison (1960)
Year of Election or Appointment: 2014
Trustee
Mr. Morrison also serves as Trustee of other funds. He serves as President of Fidelity Management & Research Company (FMR) (investment adviser firm, 2016-present), a Director of Fidelity Investments Money Management, Inc. (FIMM) (investment adviser firm, 2014-present), Director of Fidelity SelectCo, LLC (investment adviser firm, 2014-present), President, Asset Management (2014-present), and is an employee of Fidelity Investments. Previously, Mr. Morrison served as Vice President of Fidelity's Fixed Income and Asset Allocation Funds (2012-2014), President, Fixed Income (2011-2014), Vice President of Fidelity's Money Market Funds (2005-2009), President, Money Market Group Leader of FMR (investment adviser firm, 2009), and Senior Vice President, Money Market Group of FMR (2004-2009). Mr. Morrison also served as Vice President of Fidelity's Bond Funds (2002-2005), certain Balanced Funds (2002-2005), and certain Asset Allocation Funds (2002-2007), and as Senior Vice President (2002-2005) of Fidelity's Bond Division.
* Determined to be an “Interested Trustee” by virtue of, among other things, his or her affiliation with the trust or various entities under common control with FMR.
+ The information includes the Trustee's principal occupation during the last five years and other information relating to the experience, attributes, and skills relevant to the Trustee's qualifications to serve as a Trustee, which led to the conclusion that the Trustee should serve as a Trustee for the fund.
Independent Trustees:
Correspondence intended for an Independent Trustee may be sent to Fidelity Investments, P.O. Box 55235, Boston, Massachusetts 02205-5235.
Name, Year of Birth; Principal Occupations and Other Relevant Experience+
Dennis J. Dirks (1948)
Year of Election or Appointment: 2005
Trustee
Mr. Dirks also serves as Trustee of other Fidelity® funds. Prior to his retirement in May 2003, Mr. Dirks was Chief Operating Officer and a member of the Board of The Depository Trust & Clearing Corporation (DTCC). He also served as President, Chief Operating Officer, and Board member of The Depository Trust Company (DTC) and President and Board member of the National Securities Clearing Corporation (NSCC). In addition, Mr. Dirks served as Chief Executive Officer and Board member of the Government Securities Clearing Corporation, Chief Executive Officer and Board member of the Mortgage-Backed Securities Clearing Corporation, as a Trustee and a member of the Finance Committee of Manhattan College (2005-2008), as a Trustee and a member of the Finance Committee of AHRC of Nassau County (2006-2008), as a member of the Independent Directors Council (IDC) Governing Council (2010-2015), and as a member of the Board of Directors for The Brookville Center for Children’s Services, Inc. (2009-2017). Mr. Dirks is a member of the Finance Committee (2016-present) and Board of Directors (2017-present) of the Asolo Repertory Theatre.
Alan J. Lacy (1953)
Year of Election or Appointment: 2008
Trustee
Mr. Lacy also serves as Trustee of other Fidelity® funds. Mr. Lacy serves as a Director of Bristol-Myers Squibb Company (global pharmaceuticals, 2008-present). He is a Trustee of the California Chapter of The Nature Conservancy (2015-present) and a Director of the Center for Advanced Study in the Behavioral Sciences at Stanford University (2015-present). In addition, Mr. Lacy served as Senior Adviser (2007-2014) of Oak Hill Capital Partners, L.P. (private equity) and also served as Chief Executive Officer (2005) and Vice Chairman (2005-2006) of Sears Holdings Corporation (retail) and Chief Executive Officer and Chairman of the Board of Sears, Roebuck and Co. (retail, 2000-2005). Previously, Mr. Lacy served as Chairman (2014-2017) and a member (2010-2017) of the Board of Directors of Dave & Buster’s Entertainment, Inc. (restaurant and entertainment complexes), as Chairman (2008-2011) and a member (2006-2015) of the Board of Trustees of the National Parks Conservation Association, and as a member of the Board of Directors for The Hillman Companies, Inc. (hardware wholesalers, 2010-2014), Earth Fare, Inc. (retail grocery, 2010-2014), and The Western Union Company (global money transfer, 2006-2011).
Ned C. Lautenbach (1944)
Year of Election or Appointment: 2000
Trustee
Chairman of the Independent Trustees
Mr. Lautenbach also serves as Trustee of other Fidelity® funds. Mr. Lautenbach currently serves as Vice Chair of the Board of Governors, State University System of Florida (2013-present) and is a member of the Council on Foreign Relations (1994-present). He is also a member and has most recently served as Chairman of the Board of Directors of Artis-Naples (2012-present). Previously, Mr. Lautenbach served as a member and then Lead Director of the Board of Directors of Eaton Corporation (diversified industrial, 1997-2016). He was also a Partner and Advisory Partner at Clayton, Dubilier & Rice, LLC (private equity investment, 1998-2010), as well as a Director of Sony Corporation (2006-2007). In addition, Mr. Lautenbach also had a 30-year career with IBM (technology company) during which time he served as Senior Vice President and a member of the Corporate Executive Committee (1968-1998).
Joseph Mauriello (1944)
Year of Election or Appointment: 2008
Trustee
Mr. Mauriello also serves as Trustee of other Fidelity® funds. Prior to his retirement in January 2006, Mr. Mauriello served in numerous senior management positions including Deputy Chairman and Chief Operating Officer (2004-2005), and Vice Chairman of Financial Services (2002-2004) of KPMG LLP US (professional services, 1965-2005). Mr. Mauriello currently serves as a member of the Board of Directors of XL Group plc. (global insurance and re-insurance, 2006-present) and the Independent Directors Council (IDC) Governing Council (2015-present). Previously, Mr. Mauriello served as a Director of the Hamilton Funds of the Bank of New York (2006-2007) and of Arcadia Resources Inc. (health care services and products, 2007-2012).
Cornelia M. Small (1944)
Year of Election or Appointment: 2005
Trustee
Ms. Small also serves as Trustee of other Fidelity® funds. Ms. Small is a member of the Board of Directors (2009-present) and Chair of the Investment Committee (2010-present) of the Teagle Foundation. Ms. Small also serves on the Investment Committee of the Berkshire Taconic Community Foundation (2008-present). Previously, Ms. Small served as Chairperson (2002-2008) and a member of the Investment Committee and Chairperson (2008-2012) and a member of the Board of Trustees of Smith College. In addition, Ms. Small served as Chief Investment Officer, Director of Global Equity Investments, and a member of the Board of Directors of Scudder, Stevens & Clark and Scudder Kemper Investments.
William S. Stavropoulos (1939)
Year of Election or Appointment: 2001
Trustee
Vice Chairman of the Independent Trustees
Mr. Stavropoulos also serves as Trustee of other Fidelity® funds. Mr. Stavropoulos serves as President and Founder of the Michigan Baseball Foundation, the Great Lakes Loons (2007-present). Mr. Stavropoulos is Chairman Emeritus of the Board of Directors of The Dow Chemical Company, where he previously served in numerous senior management positions, including President, CEO (1995-2000; 2002-2004), Chairman of the Executive Committee (2000-2006), and as a member of the Board of Directors (1990-2006). Currently, Mr. Stavropoulos is Chairman of the Board of Directors of Univar Inc. (global distributor of commodity and specialty chemicals), a Director of Teradata Corporation (data warehousing and technology solutions), and a member of the Advisory Board for Metalmark Capital LLC (private equity investment, 2005-present). Mr. Stavropoulos is an operating advisor to Clayton, Dubilier & Rice, LLC (private equity investment). In addition, Mr. Stavropoulos is a member of the University of Notre Dame Advisory Council for the College of Science, a Trustee of the Rollin L. Gerstacker Foundation, and a Director of Artis-Naples in Naples, Florida. Previously, Mr. Stavropoulos served as a Director of Chemical Financial Corporation (bank holding company, 1993-2012) and Tyco International, Ltd. (multinational manufacturing and services, 2007-2012).
David M. Thomas (1949)
Year of Election or Appointment: 2008
Trustee
Mr. Thomas also serves as Trustee of other Fidelity® funds. Mr. Thomas serves as Non-Executive Chairman of the Board of Directors of Fortune Brands Home and Security (home and security products, 2011-present), as a member of the Board of Directors (2004-present) and Presiding Director (2013-present) of Interpublic Group of Companies, Inc. (marketing communication), and as a member of the Board of Trustees of the University of Florida (2013-present). Previously, Mr. Thomas served as Executive Chairman (2005-2006) and Chairman and Chief Executive Officer (2000-2005) of IMS Health, Inc. (pharmaceutical and healthcare information solutions), and a Director of Fortune Brands, Inc. (consumer products, 2000-2011).
+ The information includes the Trustee's principal occupation during the last five years and other information relating to the experience, attributes, and skills relevant to the Trustee's qualifications to serve as a Trustee, which led to the conclusion that the Trustee should serve as a Trustee for the fund.
Advisory Board Members and Officers:
Correspondence intended for an officer or Peter S. Lynch may be sent to Fidelity Investments, 245 Summer Street, Boston, Massachusetts 02210. Officers appear below in alphabetical order.
Name, Year of Birth; Principal Occupation
Peter S. Lynch (1944)
Year of Election or Appointment: 2003
Member of the Advisory Board
Mr. Lynch also serves as Member of the Advisory Board of other Fidelity® funds. Mr. Lynch is Vice Chairman and a Director of FMR (investment adviser firm) and FMR Co., Inc. (investment adviser firm). In addition, Mr. Lynch serves as a Trustee of Boston College and as the Chairman of the Inner-City Scholarship Fund. Previously, Mr. Lynch served on the Special Olympics International Board of Directors (1997-2006).
Elizabeth Paige Baumann (1968)
Year of Election or Appointment: 2017
Anti-Money Laundering (AML) Officer
Ms. Baumann also serves as AML Officer of other funds. She is Chief AML Officer (2012-present) and Senior Vice President (2014-present) of FMR LLC (diversified financial services company) and is an employee of Fidelity Investments. Previously, Ms. Baumann served as AML Officer of the funds (2012-2016), and Vice President (2007-2014) and Deputy Anti-Money Laundering Officer (2007-2012) of FMR LLC.
Marc R. Bryant (1966)
Year of Election or Appointment: 2015
Secretary and Chief Legal Officer (CLO)
Mr. Bryant also serves as Secretary and CLO of other funds. Mr. Bryant serves as CLO, Secretary, and Senior Vice President of Fidelity Management & Research Company (investment adviser firm, 2015-present) and FMR Co., Inc. (investment adviser firm, 2015-present); Secretary of Fidelity SelectCo, LLC (investment adviser firm, 2015-present) and Fidelity Investments Money Management, Inc. (investment adviser firm, 2015-present); and CLO of Fidelity Management & Research (Hong Kong) Limited and FMR Investment Management (UK) Limited (investment adviser firms, 2015-present) and Fidelity Management & Research (Japan) Limited (investment adviser firm, 2016-present). He is Senior Vice President and Deputy General Counsel of FMR LLC (diversified financial services company). Previously, Mr. Bryant served as Secretary and CLO of Fidelity Rutland Square Trust II (2010-2014) and Assistant Secretary of Fidelity's Fixed Income and Asset Allocation Funds (2013-2015). Prior to joining Fidelity Investments, Mr. Bryant served as a Senior Vice President and the Head of Global Retail Legal for AllianceBernstein L.P. (2006-2010), and as the General Counsel for ProFund Advisors LLC (2001-2006).
William C. Coffey (1969)
Year of Election or Appointment: 2009
Assistant Secretary
Mr. Coffey also serves as Assistant Secretary of other funds. He is Senior Vice President and Deputy General Counsel of FMR LLC (diversified financial services company, 2010-present), and is an employee of Fidelity Investments. Previously, Mr. Coffey served as Vice President and Associate General Counsel of FMR LLC (2005-2009).
Jonathan Davis (1968)
Year of Election or Appointment: 2010
Assistant Treasurer
Mr. Davis also serves as Assistant Treasurer of other funds, and is an employee of Fidelity Investments. Previously, Mr. Davis served as Vice President and Associate General Counsel of FMR LLC (diversified financial services company, 2003-2010).
Adrien E. Deberghes (1967)
Year of Election or Appointment: 2016
Assistant Treasurer
Mr. Deberghes also serves as an officer of other funds. He serves as Executive Vice President of Fidelity Investments Money Management, Inc. (FIMM) (investment adviser firm, 2016-present) and is an employee of Fidelity Investments (2008-present). Prior to joining Fidelity Investments, Mr. Deberghes was Senior Vice President of Mutual Fund Administration at State Street Corporation (2007-2008), Senior Director of Mutual Fund Administration at Investors Bank & Trust (2005-2007), and Director of Finance for Dunkin' Brands (2000-2005). Previously, Mr. Deberghes served in other fund officer roles.
Joseph DeSantis (1959)
Year of Election or Appointment: 2017
Vice President
Mr. DeSantis also serves as Vice President of other funds. Mr. DeSantis serves as a Director of Fidelity Management & Research (Japan) Limited (investment adviser firm, 2016-present), Chief Investment Officer, Equities (2010-present) and is an employee of Fidelity Investments.
Stephanie J. Dorsey (1969)
Year of Election or Appointment: 2010
Assistant Treasurer
Ms. Dorsey also serves as an officer of other funds. She is an employee of Fidelity Investments (2008-present) and has served in other fund officer roles. Prior to joining Fidelity Investments, Ms. Dorsey served as Treasurer (2004-2008) of the JPMorgan Mutual Funds and Vice President (2004-2008) of JPMorgan Chase Bank.
Howard J. Galligan III (1966)
Year of Election or Appointment: 2014
Chief Financial Officer
Mr. Galligan also serves as Chief Financial Officer of other funds. Mr. Galligan serves as President of Fidelity Pricing and Cash Management Services (FPCMS) (2014-present) and as a Director of Strategic Advisers, Inc. (investment adviser firm, 2008-present). Previously, Mr. Galligan served as Chief Administrative Officer of Asset Management (2011-2014) and Chief Operating Officer and Senior Vice President of Investment Support for Strategic Advisers, Inc. (2003-2011).
Brian B. Hogan (1964)
Year of Election or Appointment: 2009
Vice President
Mr. Hogan also serves as Trustee or Vice President of other funds. Mr. Hogan serves as a Director of FMR Investment Management (UK) Limited (investment adviser firm, 2015-present) and Fidelity SelectCo, LLC (investment adviser firm, 2014-present) and President of the Equity Division of FMR (investment adviser firm, 2009-present). Previously, Mr. Hogan served as Senior Vice President, Equity Research of FMR (2006-2009) and as a portfolio manager. Mr. Brian B. Hogan is not related to Mr. Colm A. Hogan.
Colm A. Hogan (1973)
Year of Election or Appointment: 2016
Deputy Treasurer
Mr. Hogan also serves as an officer of other funds. Mr. Hogan is an employee of Fidelity Investments (2005-present). Mr. Colm A. Hogan is not related to Mr. Brian B. Hogan.
Chris Maher (1972)
Year of Election or Appointment: 2013
Assistant Treasurer
Mr. Maher serves as Assistant Treasurer of other funds. Mr. Maher is Vice President of Valuation Oversight and is an employee of Fidelity Investments. Previously, Mr. Maher served as Vice President of Asset Management Compliance (2013), Vice President of the Program Management Group of FMR (investment adviser firm, 2010-2013), and Vice President of Valuation Oversight (2008-2010).
Rieco E. Mello (1969)
Year of Election or Appointment: 2017
Assistant Treasurer
Mr. Mello also serves as Assistant Treasurer of other funds. Mr. Mello is an employee of Fidelity Investments (1995-present).
Kenneth B. Robins (1969)
Year of Election or Appointment: 2016
Chief Compliance Officer
Mr. Robins also serves as an officer of other funds. Mr. Robins serves as Compliance Officer of Fidelity Management & Research Company and FMR Co., Inc. (investment adviser firms, 2016-present) and is an employee of Fidelity Investments (2004-present). Previously, Mr. Robins served as Executive Vice President of Fidelity Investments Money Management, Inc. (investment adviser firm, 2013-2016) and served in other fund officer roles.
Stacie M. Smith (1974)
Year of Election or Appointment: 2016
President and Treasurer
Ms. Smith also serves as an officer of other funds. She is an employee of Fidelity Investments (2009-present) and has served in other fund officer roles. Prior to joining Fidelity Investments, Ms. Smith served as Senior Audit Manager of Ernst & Young LLP (accounting firm, 1996-2009). Previously, Ms. Smith served as Deputy Treasurer of certain Fidelity® funds (2013-2016).
Marc L. Spector (1972)
Year of Election or Appointment: 2016
Assistant Treasurer
Mr. Spector also serves as an officer of other funds. Mr. Spector is an employee of Fidelity Investments (2016-present). Prior to joining Fidelity Investments, Mr. Spector served as Director at the Siegfried Group (accounting firm, 2013-2016), and prior to Siegfried Group as audit senior manager at Deloitte & Touche (accounting firm, 2005-2013).
Renee Stagnone (1975)
Year of Election or Appointment: 2016
Assistant Treasurer
Ms. Stagnone also serves as an officer of other funds. Ms. Stagnone is an employee of Fidelity Investments (1997-present). Previously, Ms. Stagnone served as Deputy Treasurer of certain Fidelity® funds (2013-2016).
Shareholder Expense Example
As a shareholder of the Fund, you incur two types of costs: (1) transaction costs, including sales charges (loads) on purchase payments or redemption proceeds, redemption fees and (2) ongoing costs, including management fees, distribution and/or service (12b-1) fees and other Fund expenses. This Example is intended to help you understand your ongoing costs (in dollars) of investing in the Fund and to compare these costs with the ongoing costs of investing in other mutual funds.
The Example is based on an investment of $1,000 invested at the beginning of the period and held for the entire period (May 1, 2017 to October 31, 2017).
Actual Expenses
The first line of the accompanying table for each class of the Fund provides information about actual account values and actual expenses. You may use the information in this line, together with the amount you invested, to estimate the expenses that you paid over the period. Simply divide your account value by $1,000.00 (for example, an $8,600 account value divided by $1,000.00 = 8.6), then multiply the result by the number in the first line for a class of the Fund under the heading entitled "Expenses Paid During Period" to estimate the expenses you paid on your account during this period. A small balance maintenance fee of $12.00 that is charged once a year may apply for certain accounts with a value of less than $2,000. This fee is not included in the table below. If it was, the estimate of expenses you paid during the period would be higher, and your ending account value lower, by this amount. In addition, the Fund, as a shareholder in the underlying Fidelity Central Funds, will indirectly bear its pro-rata share of the fees and expenses incurred by the underlying Fidelity Central Funds. These fees and expenses are not included in the Fund's annualized expense ratio used to calculate the expense estimate in the table below.
Hypothetical Example for Comparison Purposes
The second line of the accompanying table for each class of the Fund provides information about hypothetical account values and hypothetical expenses based on a Class' actual expense ratio and an assumed rate of return of 5% per year before expenses, which is not the Class' actual return. The hypothetical account values and expenses may not be used to estimate the actual ending account balance or expenses you paid for the period. You may use this information to compare the ongoing costs of investing in the Fund and other funds. To do so, compare this 5% hypothetical example with the 5% hypothetical examples that appear in the shareholder reports of the other funds. A small balance maintenance fee of $12.00 that is charged once a year may apply for certain accounts with a value of less than $2,000. This fee is not included in the table below. If it was, the estimate of expenses you paid during the period would be higher, and your ending account value lower, by this amount. In addition, the Fund, as a shareholder in the underlying Fidelity Central Funds, will indirectly bear its pro-rata share of the fees and expenses incurred by the underlying Fidelity Central Funds. These fees and expenses are not included in the Fund's annualized expense ratio used to calculate the expense estimate in the table below.
Please note that the expenses shown in the table are meant to highlight your ongoing costs only and do not reflect any transaction costs. Therefore, the second line of the table is useful in comparing ongoing costs only, and will not help you determine the relative total costs of owning different funds. In addition, if these transactional costs were included, your costs would have been higher.
| | Annualized Expense Ratio-A | Beginning
Account Value
May 1, 2017 | Ending
Account Value
October 31, 2017 | Expenses Paid
During Period-B
May 1, 2017
to October 31, 2017 |
| Class A | 1.42% | | | |
| Actual | | $1,000.00 | $1,122.10 | $7.60 |
| Hypothetical-C | | $1,000.00 | $1,018.05 | $7.22 |
| Class M | 1.72% | | | |
| Actual | | $1,000.00 | $1,119.80 | $9.19 |
| Hypothetical-C | | $1,000.00 | $1,016.53 | $8.74 |
| Class C | 2.21% | | | |
| Actual | | $1,000.00 | $1,117.10 | $11.79 |
| Hypothetical-C | | $1,000.00 | $1,014.06 | $11.22 |
| International Small Cap Opportunities | 1.13% | | | |
| Actual | | $1,000.00 | $1,123.90 | $6.05 |
| Hypothetical-C | | $1,000.00 | $1,019.51 | $5.75 |
| Class I | 1.13% | | | |
| Actual | | $1,000.00 | $1,123.40 | $6.05 |
| Hypothetical-C | | $1,000.00 | $1,019.51 | $5.75 |
A Annualized expense ratio reflects expenses net of applicable fee waivers.
B Expenses are equal to each Class' annualized expense ratio, multiplied by the average account value over the period, multiplied by 184/365 (to reflect the one-half year period).
C 5% return per year before expenses
Distributions (Unaudited)
The Board of Trustees of Fidelity International Small Cap Opportunities Fund voted to pay to shareholders of record at the opening of business on record date, the following distributions per share derived from capital gains realized from sales of portfolio securities, and dividends derived from net investment income:
| | Pay Date | Record Date | Dividends | Capital Gains |
| Fidelity International Small Cap Opportunities Fund | | | | |
| Class A | 12/11/17 | 12/08/17 | $0.093 | $0.243 |
| Class M | 12/11/17 | 12/08/17 | $0.060 | $0.243 |
| Class C | 12/11/17 | 12/08/17 | $0.000 | $0.243 |
| International Small Cap Opportunities | 12/11/17 | 12/08/17 | $0.139 | $0.243 |
| Class I | 12/11/17 | 12/08/17 | $0.138 | $0.243 |
|
Class A designates 6%; Class M designates 9%; International Small Cap Opportunities designates 5% and Class I designates 4% of the dividends distributed in December 2016, respectively during the fiscal year as qualifying for the dividends–received deduction for corporate shareholders.
Class A, Class M, International Small Cap Opportunities and Class I designate 100% of the dividends distributed during the fiscal year as amounts which may be taken into account as a dividend for purposes of the maximum rate under section 1(h)(11) of the Internal Revenue Code.
The amounts per share which represent income derived from sources within, and taxes paid to, foreign countries or possessions of the United States are as follows:
| | Pay Date | Income | Taxes |
| Fidelity International Small Cap Opportunities Fund | | | |
| Class A | 12/12/16 | $0.1854 | $0.0274 |
| Class M | 12/12/16 | $0.1224 | $0.0274 |
| International Small Cap Opportunities | 12/12/16 | $0.2354 | $0.0274 |
| Class I | 12/12/16 | $0.2434 | $0.0274 |
|
The fund will notify shareholders in January 2018 of amounts for use in preparing 2017 income tax returns.
Board Approval of Investment Advisory Contracts and Management Fees
Fidelity International Small Cap Opportunities Fund
Each year, the Board of Trustees, including the Independent Trustees (together, the Board), votes on the renewal of the management contract with Fidelity Management & Research Company (FMR) and the sub-advisory agreements (together, the Advisory Contracts) for the fund. FMR and the sub-advisers are referred to herein as the Investment Advisers. The Board, assisted by the advice of fund counsel and Independent Trustees' counsel, requests and considers a broad range of information relevant to the renewal of the Advisory Contracts throughout the year.
The Board meets regularly and, at each of its meetings, covers an extensive agenda of topics and materials and considers factors that are relevant to its annual consideration of the renewal of the fund's Advisory Contracts, including the services and support provided to the fund and its shareholders. The Board has established various standing committees (Committees), each composed of and chaired by Independent Trustees with varying backgrounds, to which the Board has assigned specific subject matter responsibilities in order to enhance effective decision-making by the Board. The Board, acting directly and through its Committees, requests and receives information concerning the annual consideration of the renewal of the fund's Advisory Contracts. The Board also meets as needed to review matters specifically related to the Board's annual consideration of the renewal of the Advisory Contracts. Members of the Board may also meet with trustees of other Fidelity funds through ad hoc joint committees to discuss certain matters relevant to all of the Fidelity funds.
At its July 2017 meeting, the Board unanimously determined to renew the fund's Advisory Contracts. In reaching its determination, the Board considered all factors it believed relevant, including (i) the nature, extent, and quality of the services to be provided to the fund and its shareholders (including the investment performance of the fund); (ii) the competitiveness of the fund's management fee and total expense ratio relative to peer funds; (iii) the total costs of the services to be provided by and the profits to be realized by Fidelity from its relationships with the fund; and (iv) the extent to which, if any, economies of scale exist and would be realized as the fund grows, and whether any economies of scale are appropriately shared with fund shareholders.
In considering whether to renew the Advisory Contracts for the fund, the Board reached a determination, with the assistance of fund counsel and Independent Trustees' counsel and through the exercise of its business judgment, that the renewal of the Advisory Contracts was in the best interests of the fund and its shareholders and that the compensation payable under the Advisory Contracts was fair and reasonable. The Board's decision to renew the Advisory Contracts was not based on any single factor, but rather was based on a comprehensive consideration of all the information provided to the Board at its meetings throughout the year. The Board, in reaching its determination to renew the Advisory Contracts, was aware that shareholders of the fund have a broad range of investment choices available to them, including a wide choice among funds offered by Fidelity's competitors, and that the fund's shareholders, who have the opportunity to review and weigh the disclosure provided by the fund in its prospectus and other public disclosures, have chosen to invest in this fund, which is part of the Fidelity family of funds.
Amendment to Group Fee Rate. The Board also approved an amendment to the management contract for the fund to add an additional breakpoint to the group fee schedule, effective October 1, 2017. The Board noted that the additional breakpoint would result in lower management fee rates as Fidelity's assets under management increase.
Nature, Extent, and Quality of Services Provided. The Board considered Fidelity's staffing as it relates to the fund, including the backgrounds of investment personnel of Fidelity, and also considered the fund's investment objective, strategies, and related investment philosophy. The Independent Trustees also had discussions with senior management of Fidelity's investment operations and investment groups. The Board considered the structure of the investment personnel compensation program and whether this structure provides appropriate incentives to act in the best interests of the fund. Additionally, the Board considered the portfolio managers' investments, if any, in the funds that they manage.
Resources Dedicated to Investment Management and Support Services. The Board and the Fund Oversight and Research Committees reviewed the general qualifications and capabilities of Fidelity's investment staff, including its size, education, experience, and resources, as well as Fidelity's approach to recruiting, training, managing, and compensating investment personnel. The Board noted that Fidelity has continued to increase the resources devoted to non-U.S. offices, including expansion of Fidelity's global investment organization. The Board also noted that Fidelity's analysts have extensive resources, tools and capabilities that allow them to conduct sophisticated quantitative and fundamental analysis, as well as credit analysis of issuers, counterparties and guarantors. Further, the Board considered that Fidelity's investment professionals have sufficient access to global information and data so as to provide competitive investment results over time, and that those professionals also have access to sophisticated tools that permit them to assess portfolio construction and risk and performance attribution characteristics continuously, as well as to transmit new information and research conclusions rapidly around the world. Additionally, in its deliberations, the Board considered Fidelity's trading, risk management, compliance, and technology and operations capabilities and resources, which are integral parts of the investment management process.
Shareholder and Administrative Services. The Board considered (i) the nature, extent, quality, and cost of advisory, administrative, and shareholder services performed by the Investment Advisers and their affiliates under the Advisory Contracts and under separate agreements covering transfer agency, pricing and bookkeeping, and securities lending services for the fund; (ii) the nature and extent of the supervision of third party service providers, principally custodians, subcustodians, and pricing vendors; and (iii) the resources devoted to, and the record of compliance with, the fund's compliance policies and procedures. The Board also reviewed the allocation of fund brokerage, including allocations to brokers affiliated with the Investment Advisers, the use of brokerage commissions to pay fund expenses, and the use of "soft" commission dollars to pay for research services.
The Board noted that the growth of fund assets over time across the complex allows Fidelity to reinvest in the development of services designed to enhance the value or convenience of the Fidelity funds as investment vehicles. These services include 24-hour access to account information and market information through telephone representatives and over the Internet, investor education materials and asset allocation tools, and the expanded availability of Fidelity Investor Centers.
In 2014, the Board formed an ad hoc Committee on Transfer Agency Fees to review the variety of transfer agency fee structures throughout the industry and Fidelity's competitive positioning with respect to industry participants.
Investment in a Large Fund Family. The Board considered the benefits to shareholders of investing in a Fidelity fund, including the benefits of investing in a fund that is part of a large family of funds offering a variety of investment disciplines and providing a large variety of mutual fund investor services. The Board noted that Fidelity had taken, or had made recommendations that resulted in the Fidelity funds taking, a number of actions over the previous year that benefited particular funds, including: (i) continuing to dedicate additional resources to Fidelity's investment research process, and to the support of the senior management team that oversees asset management; (ii) continuing efforts to enhance Fidelity's global research capabilities; (iii) launching new funds and making other enhancements to meet client needs; (iv) launching new share classes of existing funds; (v) eliminating purchase minimums and broadening eligibility requirements for certain lower-priced share classes; (vi) reducing management fees and total expenses for certain growth equity funds and index funds; (vii) lowering expense caps for certain existing funds and classes to reduce expenses borne by shareholders; (viii) eliminating short-term redemption fees for certain funds; (ix) introducing a new pricing structure for certain funds of funds that is expected to reduce overall expenses paid by shareholders; (x) rationalizing product lines and gaining increased efficiencies through proposals for fund mergers and share class consolidations; (xi) continuing to develop, acquire and implement systems and technology to improve services to the funds and shareholders, strengthen information security, and increase efficiency; and (xii) implementing enhancements to further strengthen Fidelity's product line to increase investors' probability of success in achieving their investment goals, including retirement income goals.
Investment Performance. The Board considered whether the fund has operated in accordance with its investment objective, as well as its record of compliance with its investment restrictions and its performance history. The Board noted that there was a portfolio management change for the fund in March 2017.
The Board took into account discussions with representatives of the Investment Advisers about fund investment performance that occur at Board meetings throughout the year. In this regard the Board noted that as part of regularly scheduled fund reviews and other reports to the Board on fund performance, the Board considers annualized return information for the fund for different time periods, measured against a securities market index ("benchmark index") and a peer group of funds with similar objectives ("peer group"), if any. In its evaluation of fund investment performance, the Board gave particular attention to information indicating changes in performance of certain Fidelity funds for specific time periods and discussed with the Investment Advisers the reasons for any overperformance or underperformance.
In addition to reviewing absolute and relative fund performance, the Independent Trustees periodically consider the appropriateness of fund performance metrics in evaluating the results achieved. In general, the Independent Trustees believe that fund performance should be evaluated based on net performance (after fees and expenses) of both the highest performing and lowest performing fund share classes, where applicable, compared to appropriate benchmark indices, over appropriate time periods that may include full market cycles, and compared to peer groups, as applicable, over the same periods, taking into account relevant factors including the following: general market conditions; issuer-specific information; and fund cash flows and other factors.
The Independent Trustees recognize that shareholders evaluate performance on a net basis over their own holding periods, for which one-, three-, and five-year periods are often used as a proxy. For this reason, the performance information reviewed by the Board also included net cumulative calendar year total return information for the fund and an appropriate benchmark index and peer group for the most recentone-, three-, and five-year periods, as shown below. Returns are shown compared to the 25th percentile (top of box, 75% beaten) and 75th percentile (bottom of box, 25% beaten) of the peer universe. Returns of the benchmark index are "net MA,"
i.e., adjusted for tax withholding rates applicable to U.S.-based funds organized as Massachusetts business trusts.
Fidelity International Small Cap Opportunities Fund
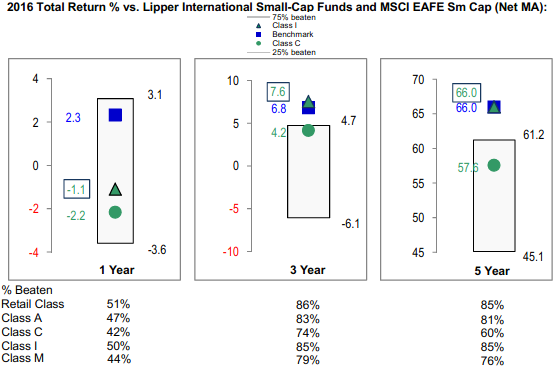
The Board also considered that the fund's management fee is subject to upward or downward adjustment depending upon whether, and to what extent, the fund's investment performance for the performance period (a rolling 36-month period) exceeds, or is exceeded by, a securities index, thus leading to a performance adjustment for the same period. The Board noted that the performance adjustment provides FMR with a strong economic incentive to seek to achieve superior long-term performance for the fund's shareholders and helps to more closely align the interests of FMR and the shareholders of the fund.
Based on its review, the Board concluded that the nature, extent, and quality of services provided to the fund under the Advisory Contracts should continue to benefit the shareholders of the fund.
Competitiveness of Management Fee and Total Expense Ratio. The Board considered the fund's management fee and total expense ratio compared to "mapped groups" of competitive funds and classes created for the purpose of facilitating the Trustees' competitive analysis of management fees and total expenses. Fidelity creates "mapped groups" by combining similar Lipper investment objective categories that have comparable investment mandates. Combining Lipper investment objective categories aids the Board's management fee and total expense ratio comparisons by broadening the competitive group used for comparison.
Management Fee. The Board considered two proprietary management fee comparisons for the 12-month periods shown in basis points (BP) in the chart below. The group of Lipper funds used by the Board for management fee comparisons is referred to below as the "Total Mapped Group." The Total Mapped Group is broader than the Lipper peer group used by the Board for performance comparisons because the Total Mapped Group combines several Lipper investment objective categories while the Lipper peer group does not. The Total Mapped Group comparison focuses on a fund's standing in terms of gross management fees before expense reimbursements or caps, and without giving effect to the fund's performance adjustment, relative to the total universe of funds with comparable investment mandates, regardless of whether their management fee structures also are comparable. Funds with comparable investment mandates offer exposure to similar types of securities. Funds with comparable management fee structures have similar management fee contractual arrangements (
e.g., flat rate charged for advisory services, all-inclusive fee rate,
etc.). "TMG %" represents the percentage of funds in the Total Mapped Group that had management fees that were lower than the fund's. For example, a hypothetical TMG % of 20% would mean that 80% of the funds in the Total Mapped Group had higher, and 20% had lower, management fees than the fund. The fund's actual TMG %s and the number of funds in the Total Mapped Group are in the chart below. The "Asset-Size Peer Group" (ASPG) comparison focuses on a fund's standing relative to a subset of non-Fidelity funds within the Total Mapped Group that are similar in size and management fee structure, without taking into account performance adjustments, if any. For example, if a fund is in the first quartile of the ASPG, the fund's management fee ranks in the least expensive or lowest 25% of funds in the ASPG. The ASPG represents at least 15% of the funds in the Total Mapped Group with comparable asset size and management fee structures, subject to a minimum of 50 funds (or all funds in the Total Mapped Group if fewer than 50). Additional information, such as the ASPG quartile in which the fund's management fee rate ranked and the impact of the fund's performance adjustment, is also included in the chart and considered by the Board.
Fidelity International Small Cap Opportunities Fund
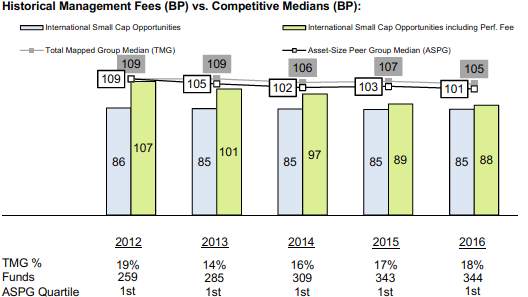
The Board noted that the fund's management fee rate ranked below the median of its Total Mapped Group and below the median of its ASPG for 2016. The Board also noted the effect of the fund's performance adjustment, if any, on the fund's management fee ranking.
The Board noted that, in 2014, the Board and the boards of other Fidelity funds formed the ad hoc Committee on Group Fee to conduct an in-depth review of the "group fee" component of the management fee of funds with such management fee structures. The Committee's focus included the mechanics of the group fee, the competitive landscape of group fee structures, Fidelity funds with no group fee component and investment products not included in group fee assets. The Board also considered that, for funds subject to the group fee, FMR agreed to voluntarily waive fees over a specified period of time in amounts designed to account for assets converted from certain funds to certain collective investment trusts.
The Board also noted that, in 2013, the ad hoc Committee on Management Fees was formed to conduct an in-depth review of the management fee rates of Fidelity's active equity mutual funds. The Committee focused on the following areas: (i) standard fee structures; (ii) research consumption and trading evolution; (iii) management fee competitiveness/profitability by category; and (iv) factors that drive institutional pricing.
Based on its review, the Board concluded that the fund's management fee is fair and reasonable in light of the services that the fund receives and the other factors considered.
Total Expense Ratio. In its review of each class's total expense ratio, the Board considered the fund's management fee rate as well as other fund or class expenses, as applicable, such as transfer agent fees, pricing and bookkeeping fees, fund-paid 12b-1 fees, and custodial, legal, and audit fees. The Board noted the impact of the fund's performance adjustment. The Board also noted that Fidelity may agree to waive fees and expenses from time to time, and the extent to which, if any, it has done so for the fund. As part of its review, the Board also considered the current and historical total expense ratios of each class of the fund compared to competitive fund median expenses. Each class of the fund is compared to those funds and classes in the Total Mapped Group (used by the Board for management fee comparisons) that have a similar sales load structure.
The Board noted that the total expense ratio of each of Class A, Class C, Class I, and the retail class ranked below the competitive median for 2016 and the total expense ratio of Class M (formerly Class T) ranked above the competitive median for 2016. The Board considered that, in general, various factors can affect total expense ratios. The Board noted that the total expense ratio of Class M was above the competitive median primarily because of higher 12b-1 fees on Class M as compared to most competitor funds. Class M has a higher 12b-1 fee, but a lower front-end sales charge, than traditionally priced front-end sales charge classes. The Board considered that Class M is primarily sold load-waived in the retirement plan market where its 0.50% 12b-1 fee is comparable to competing no-load, higher 12b-1 fee classes designed specifically for retirement plans. The Board noted that the fund offers multiple classes, each of which has a different sales load and 12b-1 fee structure, and that the multiple structures are intended to offer a range of pricing options for the intermediary market. The Board also noted that the total expense ratios of the classes vary primarily by the level of their 12b-1 fees, although differences in transfer agent fees may also cause expenses to vary from class to class.
Fees Charged to Other Fidelity Clients. The Board also considered Fidelity fee structures and other information with respect to clients of Fidelity, such as other funds advised or subadvised by Fidelity, pension plan clients, and other institutional clients with similar mandates. The Board noted that an ad hoc joint committee created by it and the boards of other Fidelity funds periodically (most recently in 2013) reviews and compares Fidelity's institutional investment advisory business with its business of providing services to the Fidelity funds, including the differences in services provided, fees charged, and costs incurred, as well as competition in their respective marketplaces.
Based on its review of total expense ratios and fees charged to other Fidelity clients, the Board concluded that, although Class M was above the median of the universe presented for comparison, the total expense ratio of each class of the fund was reasonable in light of the services that the fund and its shareholders receive and the other factors considered.
Costs of the Services and Profitability. The Board considered the revenues earned and the expenses incurred by Fidelity in conducting the business of developing, marketing, distributing, managing, administering and servicing the fund and servicing the fund's shareholders. The Board also considered the level of Fidelity's profits in respect of all the Fidelity funds.
On an annual basis, Fidelity presents to the Board information about the profitability of its relationships with the fund. Fidelity calculates profitability information for each fund, as well as aggregate profitability information for groups of Fidelity funds and all Fidelity funds, using a series of detailed revenue and cost allocation methodologies which originate with the books and records of Fidelity on which Fidelity's audited financial statements are based. The Audit Committee of the Board reviews any significant changes from the prior year's methodologies.
PricewaterhouseCoopers LLP (PwC), independent registered public accounting firm and auditor to Fidelity and certain Fidelity funds, has been engaged annually by the Board as part of the Board's assessment of Fidelity's profitability analysis. PwC's engagement includes the review and assessment of the methodologies used by Fidelity in determining the revenues and expenses attributable to Fidelity's mutual fund business, and completion of agreed-upon procedures in respect of the mathematical accuracy of the fund profitability information and its conformity to established allocation methodologies. After considering PwC's reports issued under the engagement and information provided by Fidelity, the Board concluded that while other allocation methods may also be reasonable, Fidelity's profitability methodologies are reasonable in all material respects.
The Board also reviewed Fidelity's non-fund businesses and potential fall-out benefits related to the mutual fund business as well as cases where Fidelity's affiliates may benefit from or be related to the fund's business.
The Board considered the costs of the services provided by and the profits realized by Fidelity in connection with the operation of the fund and was satisfied that the profitability was not excessive.
Economies of Scale. The Board considered whether there have been economies of scale in respect of the management of the Fidelity funds, whether the Fidelity funds (including the fund) have appropriately benefited from any such economies of scale, and whether there is potential for realization of any further economies of scale. The Board considered the extent to which the fund will benefit from economies of scale as assets grow through increased services to the fund, through waivers or reimbursements, or through fee or expense ratio reductions. The Board also noted that a committee (the Economies of Scale Committee) created by it and the boards of other Fidelity funds periodically (most recently in 2013) analyzes whether Fidelity attains economies of scale in respect of the management and servicing of the Fidelity funds, whether the Fidelity funds have appropriately benefited from such economies of scale, and whether there is potential for realization of any further economies of scale.
The Board recognized that the fund's management contract incorporates a "group fee" structure, which provides for lower group fee rates as total group assets increase, and for higher group fee rates as total group assets decrease (with "group assets" defined to include fund assets under FMR's management plus the assets of sector funds previously under FMR's management). FMR calculates the group fee rates based on a tiered asset "breakpoint" schedule that varies based on asset class. The Board considered that the group fee is designed to deliver the benefits of economies of scale to fund shareholders when total Fidelity fund assets increase, even if assets of any particular fund are unchanged or have declined, because some portion of Fidelity's costs are attributable to services provided to all Fidelity funds, and all funds benefit if those costs can be allocated among more assets. The Board concluded that, given the group fee structure, fund shareholders will benefit from lower management fees as group assets increase at the fund complex level, regardless of whether Fidelity achieves any such economies of scale.
The Board concluded, taking into account the analysis of the Economies of Scale Committee, that economies of scale, if any, are being appropriately shared between fund shareholders and Fidelity.
Additional Information Requested by the Board. In order to develop fully the factual basis for consideration of the Fidelity funds' advisory contracts, the Board requested and received additional information on certain topics, including: (i) fund performance trends, in particular the underperformance of certain funds, and Fidelity's long-term strategies for certain funds; (ii) Fidelity's fund profitability methodology, profitability trends for certain funds, and the impact of certain factors on fund profitability results, including the impact of market trends on actively managed funds; (iii) the use of performance fees and the calculation of performance adjustments, including the impact of underperformance and fund outflows on performance adjustments; (iv) metrics for evaluating index fund performance; (v) Fidelity's group fee structure, including the group fee breakpoint schedules; (vi) the terms of Fidelity's contractual and voluntary expense cap arrangements with the funds; (vii) the methodology with respect to evaluating competitive fund data and peer group classifications and fee comparisons; (viii) the expense structures for different funds and classes; (ix) Fidelity's arrangements with affiliated sub-advisers on behalf of the funds; (x) information regarding other accounts managed by Fidelity, including institutional accounts and collective investment trusts; (xi) recent changes to the fee structure for certain funds of funds; and (xii) the impact of the Department of Labor's new fiduciary rule on the funds' comparative expense information.
Based on its evaluation of all of the conclusions noted above, and after considering all factors it believed relevant, the Board concluded that the advisory fee structures are fair and reasonable, and that the fund's Advisory Contracts should be renewed.
Corporate Headquarters
245 Summer St.
Boston, MA 02210
www.fidelity.com
ILS-ANN-1217
1.815075.113
Fidelity® Diversified International K6 Fund
Annual Report October 31, 2017 |
|
Contents
To view a fund's proxy voting guidelines and proxy voting record for the 12-month period ended June 30, visit http://www.fidelity.com/proxyvotingresults or visit the Securities and Exchange Commission's (SEC) web site at http://www.sec.gov.
You may also call 1-800-835-5092 to request a free copy of the proxy voting guidelines.
Standard & Poor's, S&P and S&P 500 are registered service marks of The McGraw-Hill Companies, Inc. and have been licensed for use by Fidelity Distributors Corporation.
Other third-party marks appearing herein are the property of their respective owners.
All other marks appearing herein are registered or unregistered trademarks or service marks of FMR LLC or an affiliated company. © 2017 FMR LLC. All rights reserved.
This report and the financial statements contained herein are submitted for the general information of the shareholders of the Fund. This report is not authorized for distribution to prospective investors in the Fund unless preceded or accompanied by an effective prospectus.
A fund files its complete schedule of portfolio holdings with the SEC for the first and third quarters of each fiscal year on Form N-Q. Forms N-Q are available on the SEC’s web site at http://www.sec.gov. A fund's Forms N-Q may be reviewed and copied at the SEC’s Public Reference Room in Washington, DC. Information regarding the operation of the SEC's Public Reference Room may be obtained by calling 1-800-SEC-0330.
For a complete list of a fund's portfolio holdings, view the most recent holdings listing, semiannual report, or annual report on Fidelity's web site at http://www.fidelity.com, http://www.institutional.fidelity.com, or http://www.401k.com, as applicable.
NOT FDIC INSURED •MAY LOSE VALUE •NO BANK GUARANTEE
Neither the Fund nor Fidelity Distributors Corporation is a bank.
Investment Summary (Unaudited)
Geographic Diversification (% of fund's net assets)
| As of October 31, 2017 |
| | Japan | 17.4% |
| | United States of America* | 14.1% |
| | United Kingdom | 13.2% |
| | Germany | 7.6% |
| | France | 6.6% |
| | Netherlands | 5.9% |
| | Canada | 3.7% |
| | Ireland | 3.6% |
| | Sweden | 2.7% |
| | Other | 25.2% |

* Includes Short-Term investments and Net Other Assets (Liabilities).
Percentages are based on country or territory of incorporation and include the effect of futures contracts, options and swaps, as applicable.
Asset Allocation as of October 31, 2017
| | % of fund's net assets |
| Stocks | 95.9 |
| Short-Term Investments and Net Other Assets (Liabilities) | 4.1 |
Top Ten Stocks as of October 31, 2017
| | % of fund's net assets |
| ORIX Corp. (Japan, Diversified Financial Services) | 1.6 |
| Hoya Corp. (Japan, Health Care Equipment & Supplies) | 1.6 |
| Bayer AG (Germany, Pharmaceuticals) | 1.6 |
| Prudential PLC (United Kingdom, Insurance) | 1.5 |
| British American Tobacco PLC sponsored ADR (United States of America, Tobacco) | 1.4 |
| Unilever NV (Certificaten Van Aandelen) (Bearer) (Netherlands, Personal Products) | 1.4 |
| Keyence Corp. (Japan, Electronic Equipment & Components) | 1.4 |
| SAP SE (Germany, Software) | 1.4 |
| Taiwan Semiconductor Manufacturing Co. Ltd. sponsored ADR (Taiwan, Semiconductors & Semiconductor Equipment) | 1.1 |
| KBC Groep NV (Belgium, Banks) | 1.1 |
| | 14.1 |
Top Market Sectors as of October 31, 2017
| | % of fund's net assets |
| Financials | 21.3 |
| Industrials | 14.2 |
| Information Technology | 12.9 |
| Consumer Staples | 12.6 |
| Health Care | 10.8 |
| Consumer Discretionary | 10.3 |
| Materials | 3.9 |
| Energy | 3.5 |
| Telecommunication Services | 1.9 |
| Real Estate | 0.4 |
Investments October 31, 2017
Showing Percentage of Net Assets
| Common Stocks - 90.9% | | | |
| | | Shares | Value |
| Australia - 1.5% | | | |
| Amcor Ltd. | | 57,746 | $700,063 |
| Australia & New Zealand Banking Group Ltd. | | 73,030 | 1,672,334 |
| Bapcor Ltd. | | 11,506 | 47,905 |
| CSL Ltd. | | 6,988 | 743,035 |
| Magellan Financial Group Ltd. | | 43,876 | 814,999 |
| Ramsay Health Care Ltd. | | 8,611 | 440,966 |
|
| TOTAL AUSTRALIA | | | 4,419,302 |
|
| Austria - 0.1% | | | |
| Andritz AG | | 6,133 | 346,771 |
| Bailiwick of Jersey - 2.3% | | | |
| Shire PLC | | 46,800 | 2,305,162 |
| Wolseley PLC | | 43,877 | 3,068,191 |
| WPP PLC | | 73,530 | 1,299,954 |
|
| TOTAL BAILIWICK OF JERSEY | | | 6,673,307 |
|
| Belgium - 2.1% | | | |
| Anheuser-Busch InBev SA NV | | 24,305 | 2,980,309 |
| KBC Groep NV | | 39,422 | 3,274,606 |
|
| TOTAL BELGIUM | | | 6,254,915 |
|
| Bermuda - 0.9% | | | |
| Credicorp Ltd. (United States) | | 5,039 | 1,055,368 |
| Hiscox Ltd. | | 36,279 | 688,067 |
| IHS Markit Ltd. (a) | | 23,693 | 1,009,559 |
|
| TOTAL BERMUDA | | | 2,752,994 |
|
| British Virgin Islands - 0.2% | | | |
| Mail.Ru Group Ltd. GDR (Reg. S) (a) | | 16,102 | 523,315 |
| Canada - 3.7% | | | |
| Alimentation Couche-Tard, Inc. Class B (sub. vtg.) | | 60,589 | 2,840,887 |
| CCL Industries, Inc. Class B | | 3,131 | 150,907 |
| Cenovus Energy, Inc. | | 161,684 | 1,569,091 |
| Constellation Software, Inc. | | 906 | 515,453 |
| Fairfax India Holdings Corp. (a) | | 74,395 | 1,263,227 |
| Imperial Oil Ltd. | | 36,923 | 1,197,186 |
| PrairieSky Royalty Ltd. | | 12,021 | 319,976 |
| Suncor Energy, Inc. | | 87,543 | 2,972,160 |
|
| TOTAL CANADA | | | 10,828,887 |
|
| Cayman Islands - 1.1% | | | |
| Alibaba Group Holding Ltd. sponsored ADR (a) | | 12,778 | 2,362,524 |
| JD.com, Inc. sponsored ADR (a) | | 18,823 | 706,239 |
| NetEase, Inc. ADR | | 600 | 169,152 |
| Zai Lab Ltd. ADR | | 4,307 | 116,332 |
|
| TOTAL CAYMAN ISLANDS | | | 3,354,247 |
|
| China - 0.8% | | | |
| Jiangsu Hengrui Medicine Co. Ltd. (A Shares) | | 39,932 | 404,622 |
| Kweichow Moutai Co. Ltd. (A Shares) | | 16,779 | 1,562,936 |
| Shanghai International Airport Co. Ltd. (A Shares) | | 27,685 | 182,553 |
| Tonghua Dongbao Pharmaceutical Co. Ltd. Class A | | 53,356 | 173,862 |
|
| TOTAL CHINA | | | 2,323,973 |
|
| Curacao - 0.1% | | | |
| Schlumberger Ltd. | | 6,128 | 392,192 |
| Denmark - 0.2% | | | |
| A.P. Moller - Maersk A/S Series B | | 217 | 416,795 |
| NNIT A/S | | 7,889 | 224,756 |
|
| TOTAL DENMARK | | | 641,551 |
|
| Finland - 0.3% | | | |
| Sampo Oyj (A Shares) | | 19,555 | 1,024,583 |
| France - 6.6% | | | |
| Amundi SA | | 33,249 | 2,818,777 |
| AXA SA | | 48,375 | 1,460,365 |
| BNP Paribas SA | | 31,080 | 2,427,085 |
| Capgemini SA | | 5,098 | 619,673 |
| Compagnie de St. Gobain | | 25,242 | 1,480,742 |
| Elis SA | | 28,279 | 737,709 |
| Kering SA | | 1,788 | 819,563 |
| LVMH Moet Hennessy - Louis Vuitton SA | | 6,263 | 1,868,024 |
| Maisons du Monde SA | | 11,800 | 510,635 |
| Sanofi SA | | 34,483 | 3,265,080 |
| Societe Generale Series A | | 28,374 | 1,579,142 |
| VINCI SA | | 19,322 | 1,891,733 |
|
| TOTAL FRANCE | | | 19,478,528 |
|
| Germany - 6.8% | | | |
| adidas AG | | 9,993 | 2,223,888 |
| Aumann AG | | 4,435 | 411,222 |
| Axel Springer Verlag AG | | 11,738 | 791,667 |
| Bayer AG | | 35,516 | 4,619,885 |
| Deutsche Post AG | | 38,384 | 1,758,060 |
| Fresenius SE & Co. KGaA | | 30,886 | 2,579,951 |
| Linde AG | | 1,300 | 280,769 |
| Linde AG (a) | | 4,308 | 928,111 |
| ProSiebenSat.1 Media AG | | 17,697 | 623,354 |
| Rational AG | | 709 | 464,970 |
| Rheinmetall AG | | 1,712 | 201,915 |
| SAP SE | | 35,444 | 4,049,924 |
| Symrise AG | | 13,709 | 1,066,884 |
|
| TOTAL GERMANY | | | 20,000,600 |
|
| Hong Kong - 1.3% | | | |
| AIA Group Ltd. | | 396,026 | 2,979,815 |
| Techtronic Industries Co. Ltd. | | 165,000 | 967,615 |
|
| TOTAL HONG KONG | | | 3,947,430 |
|
| Indonesia - 0.9% | | | |
| PT Bank Central Asia Tbk | | 767,894 | 1,183,335 |
| PT Bank Rakyat Indonesia Tbk | | 1,313,220 | 1,510,506 |
|
| TOTAL INDONESIA | | | 2,693,841 |
|
| Ireland - 3.6% | | | |
| Allergan PLC | | 6,178 | 1,094,927 |
| CRH PLC | | 35,434 | 1,332,261 |
| DCC PLC (United Kingdom) | | 11,172 | 1,059,440 |
| Kerry Group PLC Class A | | 15,958 | 1,606,991 |
| Kingspan Group PLC (Ireland) | | 29,022 | 1,213,645 |
| Paddy Power Betfair PLC (Ireland) | | 6,137 | 627,655 |
| Ryanair Holdings PLC sponsored ADR (a) | | 28,008 | 3,139,977 |
| Weatherford International PLC | | 127,789 | 443,428 |
|
| TOTAL IRELAND | | | 10,518,324 |
|
| Isle of Man - 0.2% | | | |
| Paysafe Group PLC (a) | | 75,646 | 588,750 |
| Israel - 1.1% | | | |
| Check Point Software Technologies Ltd. (a) | | 17,548 | 2,065,575 |
| Elbit Systems Ltd. (Israel) | | 4,393 | 651,231 |
| Frutarom Industries Ltd. | | 1,679 | 138,230 |
| SodaStream International Ltd. (a) | | 5,400 | 343,818 |
|
| TOTAL ISRAEL | | | 3,198,854 |
|
| Italy - 0.8% | | | |
| Buzzi Unicem SpA | | 4,259 | 118,719 |
| Intesa Sanpaolo SpA | | 508,460 | 1,709,395 |
| Prada SpA | | 130,100 | 450,265 |
|
| TOTAL ITALY | | | 2,278,379 |
|
| Japan - 17.4% | | | |
| Bridgestone Corp. | | 39,058 | 1,865,816 |
| Daikin Industries Ltd. | | 15,092 | 1,667,830 |
| Daito Trust Construction Co. Ltd. | | 5,800 | 1,014,040 |
| Dentsu, Inc. | | 9,920 | 424,318 |
| Hoya Corp. | | 85,738 | 4,658,209 |
| Itochu Corp. | | 25,436 | 445,553 |
| Kao Corp. | | 8,445 | 510,375 |
| KDDI Corp. | | 92,815 | 2,472,837 |
| Keyence Corp. | | 7,358 | 4,085,345 |
| Minebea Mitsumi, Inc. | | 97,921 | 1,795,197 |
| Misumi Group, Inc. | | 32,326 | 885,653 |
| Mitsubishi UFJ Financial Group, Inc. | | 215,241 | 1,460,011 |
| Morinaga & Co. Ltd. | | 16,595 | 942,758 |
| Nabtesco Corp. | | 19,743 | 784,324 |
| Nidec Corp. | | 9,577 | 1,273,577 |
| Nippon Telegraph & Telephone Corp. | | 23,494 | 1,135,877 |
| Nitori Holdings Co. Ltd. | | 15,900 | 2,310,768 |
| Olympus Corp. | | 34,803 | 1,295,182 |
| ORIX Corp. | | 281,166 | 4,834,260 |
| Outsourcing, Inc. | | 36,700 | 505,949 |
| PALTAC Corp. | | 11,277 | 447,878 |
| Panasonic Corp. | | 60,545 | 914,191 |
| Recruit Holdings Co. Ltd. | | 102,120 | 2,503,743 |
| Renesas Electronics Corp. (a) | | 132,623 | 1,714,695 |
| Seria Co. Ltd. | | 5,738 | 326,514 |
| Seven & i Holdings Co. Ltd. | | 26,265 | 1,058,597 |
| SMC Corp. | | 2,000 | 765,121 |
| SoftBank Corp. | | 23,730 | 2,103,005 |
| Sohgo Security Services Co., Ltd. | | 6,681 | 321,877 |
| Sony Corp. | | 33,635 | 1,407,110 |
| Start Today Co. Ltd. | | 13,580 | 371,951 |
| Sundrug Co. Ltd. | | 8,450 | 367,732 |
| The Suruga Bank Ltd. | | 20,369 | 463,774 |
| Toto Ltd. | | 3,532 | 172,976 |
| Tsuruha Holdings, Inc. | | 23,687 | 2,936,777 |
| Welcia Holdings Co. Ltd. | | 33,449 | 1,269,464 |
|
| TOTAL JAPAN | | | 51,513,284 |
|
| Korea (South) - 0.2% | | | |
| LG Chemical Ltd. | | 1,825 | 658,612 |
| Luxembourg - 1.5% | | | |
| B&M European Value Retail S.A. | | 494,968 | 2,611,817 |
| Eurofins Scientific SA | | 3,008 | 1,881,578 |
|
| TOTAL LUXEMBOURG | | | 4,493,395 |
|
| Netherlands - 5.9% | | | |
| Altice NV Class A (a) | | 17,741 | 334,679 |
| ASML Holding NV | | 12,900 | 2,331,675 |
| IMCD Group BV | | 16,490 | 1,037,252 |
| ING Groep NV (Certificaten Van Aandelen) | | 119,164 | 2,202,090 |
| Koninklijke Philips Electronics NV | | 48,992 | 1,996,568 |
| LyondellBasell Industries NV Class A | | 14,361 | 1,486,794 |
| RELX NV | | 101,078 | 2,282,992 |
| Unilever NV (Certificaten Van Aandelen) (Bearer) | | 72,246 | 4,196,768 |
| Wolters Kluwer NV | | 21,470 | 1,052,393 |
| Yandex NV Series A (a) | | 18,556 | 627,749 |
|
| TOTAL NETHERLANDS | | | 17,548,960 |
|
| New Zealand - 0.2% | | | |
| Ryman Healthcare Group Ltd. | | 82,418 | 524,507 |
| Norway - 1.0% | | | |
| Schibsted ASA (A Shares) | | 16,661 | 429,580 |
| Statoil ASA (b) | | 131,014 | 2,661,880 |
|
| TOTAL NORWAY | | | 3,091,460 |
|
| Philippines - 0.1% | | | |
| Alliance Global Group, Inc. (a) | | 673,099 | 208,772 |
| Russia - 0.1% | | | |
| Sberbank of Russia sponsored ADR | | 20,222 | 290,186 |
| Singapore - 0.3% | | | |
| Broadcom Ltd. | | 3,593 | 948,229 |
| South Africa - 1.0% | | | |
| Capitec Bank Holdings Ltd. | | 3,313 | 220,224 |
| FirstRand Ltd. | | 31,260 | 113,311 |
| Naspers Ltd. Class N | | 10,866 | 2,647,573 |
|
| TOTAL SOUTH AFRICA | | | 2,981,108 |
|
| Spain - 2.4% | | | |
| Aedas Homes SAU | | 7,700 | 269,080 |
| Amadeus IT Holding SA Class A | | 38,469 | 2,610,218 |
| CaixaBank SA | | 414,240 | 1,938,795 |
| Inditex SA | | 15,281 | 571,293 |
| Neinor Homes SLU | | 33,000 | 678,275 |
| Prosegur Cash SA | | 317,507 | 1,035,574 |
|
| TOTAL SPAIN | | | 7,103,235 |
|
| Sweden - 2.7% | | | |
| Alfa Laval AB | | 12,361 | 313,172 |
| ASSA ABLOY AB (B Shares) | | 78,400 | 1,652,896 |
| Coor Service Management Holding AB | | 65,000 | 512,444 |
| Essity AB Class B | | 79,700 | 2,382,913 |
| HEXPOL AB (B Shares) | | 41,490 | 419,774 |
| Nordea Bank AB | | 230,817 | 2,790,212 |
|
| TOTAL SWEDEN | | | 8,071,411 |
|
| Switzerland - 2.7% | | | |
| Credit Suisse Group AG | | 135,450 | 2,134,534 |
| Forbo Holding AG (Reg.) | | 90 | 136,040 |
| Julius Baer Group Ltd. | | 13,006 | 769,274 |
| Lonza Group AG | | 661 | 175,578 |
| Sika AG | | 374 | 2,768,496 |
| UBS Group AG | | 114,915 | 1,955,853 |
|
| TOTAL SWITZERLAND | | | 7,939,775 |
|
| Taiwan - 1.4% | | | |
| Taiwan Semiconductor Manufacturing Co. Ltd. sponsored ADR | | 78,015 | 3,302,375 |
| Tripod Technology Corp. | | 46,000 | 169,421 |
| United Microelectronics Corp. | | 355,045 | 183,371 |
| United Microelectronics Corp. sponsored ADR | | 177,761 | 462,179 |
|
| TOTAL TAIWAN | | | 4,117,346 |
|
| Thailand - 0.3% | | | |
| Kasikornbank PCL (For. Reg.) | | 134,933 | 926,090 |
| United Kingdom - 13.2% | | | |
| Admiral Group PLC | | 16,187 | 413,636 |
| Aon PLC | | 2,023 | 290,159 |
| Ascential PLC | | 84,482 | 378,018 |
| Ashtead Group PLC | | 11,311 | 291,440 |
| AstraZeneca PLC (United Kingdom) | | 13,249 | 896,440 |
| Booker Group PLC | | 464,553 | 1,241,396 |
| Bunzl PLC | | 48,579 | 1,512,999 |
| Close Brothers Group PLC | | 5,353 | 98,752 |
| Coca-Cola European Partners PLC | | 23,290 | 951,629 |
| Compass Group PLC | | 70,996 | 1,558,669 |
| Cranswick PLC | | 5,983 | 244,747 |
| Dignity PLC | | 16,088 | 517,729 |
| Essentra PLC | | 128,944 | 911,087 |
| Halma PLC | | 31,634 | 496,614 |
| Hastings Group Holdings PLC | | 136,078 | 569,487 |
| Ibstock PLC | | 38,761 | 127,723 |
| IMI PLC | | 2,137 | 34,684 |
| Imperial Tobacco Group PLC | | 31,652 | 1,290,795 |
| Indivior PLC (a) | | 134,189 | 662,277 |
| Informa PLC | | 58,832 | 544,620 |
| John Wood Group PLC | | 100,805 | 952,586 |
| Liberty Global PLC Class A (a) | | 41,122 | 1,268,614 |
| LivaNova PLC (a) | | 2,654 | 196,131 |
| Lloyds Banking Group PLC | | 1,605,547 | 1,455,319 |
| London Stock Exchange Group PLC | | 33,503 | 1,673,533 |
| Melrose Industries PLC | | 732,054 | 2,138,038 |
| Micro Focus International PLC | | 65,654 | 2,306,397 |
| Polypipe Group PLC | | 43,509 | 238,369 |
| Prudential PLC | | 185,679 | 4,557,561 |
| Reckitt Benckiser Group PLC | | 33,699 | 3,014,937 |
| Rentokil Initial PLC | | 38,555 | 171,953 |
| Softcat PLC | | 55,375 | 394,576 |
| Spectris PLC | | 28,560 | 971,058 |
| St. James's Place Capital PLC | | 169,728 | 2,653,243 |
| Standard Chartered PLC (United Kingdom) (a) | | 121,941 | 1,215,317 |
| Standard Life PLC | | 252,575 | 1,441,796 |
| Tesco PLC | | 321,041 | 773,577 |
| The Weir Group PLC | | 20,452 | 530,500 |
|
| TOTAL UNITED KINGDOM | | | 38,986,406 |
|
| United States of America - 5.9% | | | |
| Alphabet, Inc. Class C (a) | | 1,935 | 1,967,198 |
| Amgen, Inc. | | 10,367 | 1,816,506 |
| British American Tobacco PLC sponsored ADR | | 65,722 | 4,232,497 |
| Coty, Inc. Class A | | 104,735 | 1,612,919 |
| DowDuPont, Inc. | | 4,000 | 289,240 |
| MasterCard, Inc. Class A | | 12,092 | 1,798,927 |
| Middleby Corp. (a) | | 2,242 | 259,848 |
| Molson Coors Brewing Co. Class B | | 1,970 | 159,314 |
| Oceaneering International, Inc. | | 18,168 | 367,357 |
| Qualcomm, Inc. | | 14,113 | 719,904 |
| Quintiles Transnational Holdings, Inc. (a) | | 7,984 | 863,070 |
| S&P Global, Inc. | | 11,009 | 1,722,578 |
| Visa, Inc. Class A | | 16,396 | 1,803,232 |
|
| TOTAL UNITED STATES OF AMERICA | | | 17,612,590 |
|
| TOTAL COMMON STOCKS | | | |
| (Cost $263,700,009) | | | 269,256,109 |
|
| Nonconvertible Preferred Stocks - 0.9% | | | |
| Brazil - 0.1% | | | |
| Itau Unibanco Holding SA | | 19,700 | 253,228 |
| Germany - 0.8% | | | |
| Henkel AG & Co. KGaA | | 10,529 | 1,477,897 |
| Jungheinrich AG | | 5,988 | 271,960 |
| Sartorius AG (non-vtg.) | | 6,193 | 577,185 |
|
| TOTAL GERMANY | | | 2,327,042 |
|
| TOTAL NONCONVERTIBLE PREFERRED STOCKS | | | |
| (Cost $2,607,229) | | | 2,580,270 |
|
| Investment Companies - 4.1% | | | |
| United States of America - 4.1% | | | |
| iShares MSCI India ETF | | | |
| (Cost $11,821,602) | | 343,428 | 12,104,117 |
|
| Money Market Funds - 5.2% | | | |
| Fidelity Cash Central Fund, 1.10% (c) | | 12,522,350 | 12,524,855 |
| Fidelity Securities Lending Cash Central Fund 1.11% (c)(d) | | 2,807,719 | 2,808,000 |
| TOTAL MONEY MARKET FUNDS | | | |
| (Cost $15,332,855) | | | 15,332,855 |
| TOTAL INVESTMENT IN SECURITIES - 101.1% | | | |
| (Cost $293,461,695) | | | 299,273,351 |
| NET OTHER ASSETS (LIABILITIES) - (1.1)% | | | (3,127,705) |
| NET ASSETS - 100% | | | $296,145,646 |
Security Type Abbreviations
ETF – Exchange-Traded Fund
Categorizations in the Schedule of Investments are based on country or territory of incorporation.
Legend
(a) Non-income producing
(b) Security or a portion of the security is on loan at period end.
(c) Affiliated fund that is generally available only to investment companies and other accounts managed by Fidelity Investments. The rate quoted is the annualized seven-day yield of the fund at period end. A complete unaudited listing of the fund's holdings as of its most recent quarter end is available upon request. In addition, each Fidelity Central Fund's financial statements, which are not covered by the Fund's Report of Independent Registered Public Accounting Firm, are available on the SEC's website or upon request.
(d) Investment made with cash collateral received from securities on loan.
Affiliated Central Funds
Information regarding fiscal year to date income earned by the Fund from investments in Fidelity Central Funds is as follows:
| Fund | Income earned |
| Fidelity Cash Central Fund | $19,979 |
| Fidelity Securities Lending Cash Central Fund | 5 |
| Total | $19,984 |
Investment Valuation
The following is a summary of the inputs used, as of October 31, 2017, involving the Fund's assets and liabilities carried at fair value. The inputs or methodology used for valuing securities may not be an indication of the risk associated with investing in those securities. For more information on valuation inputs, and their aggregation into the levels used below, please refer to the Investment Valuation section in the accompanying Notes to Financial Statements.
| | Valuation Inputs at Reporting Date: |
| Description | Total | Level 1 | Level 2 | Level 3 |
| Investments in Securities: | | | | |
| Equities: | | | | |
| Consumer Discretionary | $31,026,035 | $19,166,157 | $11,859,878 | $-- |
| Consumer Staples | 37,656,215 | 19,604,921 | 18,051,294 | -- |
| Energy | 10,875,856 | 8,213,976 | 2,661,880 | -- |
| Financials | 62,940,401 | 40,314,676 | 22,625,725 | -- |
| Health Care | 31,511,809 | 12,475,283 | 19,036,526 | -- |
| Industrials | 41,666,025 | 28,891,329 | 12,774,696 | -- |
| Information Technology | 37,787,529 | 27,754,194 | 10,033,335 | -- |
| Materials | 11,377,670 | 9,764,640 | 1,613,030 | -- |
| Real Estate | 1,283,120 | 269,080 | 1,014,040 | -- |
| Telecommunication Services | 5,711,719 | -- | 5,711,719 | -- |
| Investment Companies | 12,104,117 | 12,104,117 | -- | -- |
| Money Market Funds | 15,332,855 | 15,332,855 | -- | -- |
| Total Investments in Securities: | $299,273,351 | $193,891,228 | $105,382,123 | $-- |
See accompanying notes which are an integral part of the financial statements.
Financial Statements
Statement of Assets and Liabilities
| | | October 31, 2017 |
| Assets | | |
Investment in securities, at value (including securities loaned of $2,627,996) — See accompanying schedule:
Unaffiliated issuers (cost $278,128,840) | $283,940,496 | |
| Fidelity Central Funds (cost $15,332,855) | 15,332,855 | |
| Total Investment in Securities (cost $293,461,695) | | $299,273,351 |
| Cash | | 1 |
| Foreign currency held at value (cost $12) | | 12 |
| Receivable for investments sold | | 456,680 |
| Receivable for fund shares sold | | 45,758 |
| Dividends receivable | | 208,089 |
| Distributions receivable from Fidelity Central Funds | | 9,971 |
| Other receivables | | 89 |
| Total assets | | 299,993,951 |
| Liabilities | | |
| Payable for investments purchased | $778,289 | |
| Payable for fund shares redeemed | 148,981 | |
| Accrued management fee | 113,035 | |
| Collateral on securities loaned | 2,808,000 | |
| Total liabilities | | 3,848,305 |
| Net Assets | | $296,145,646 |
| Net Assets consist of: | | |
| Paid in capital | | $290,744,893 |
| Undistributed net investment income | | 303,449 |
| Accumulated undistributed net realized gain (loss) on investments and foreign currency transactions | | (715,801) |
| Net unrealized appreciation (depreciation) on investments and assets and liabilities in foreign currencies | | 5,813,105 |
| Net Assets, for 27,808,846 shares outstanding | | $296,145,646 |
| Net Asset Value, offering price and redemption price per share ($296,145,646 ÷ 27,808,846 shares) | | $10.65 |
See accompanying notes which are an integral part of the financial statements.
Statement of Operations
| | | For the period
May 25, 2017 (commencement of operations) to
October 31, 2017 |
| Investment Income | | |
| Dividends | | $478,389 |
| Special dividends | | 57,082 |
| Income from Fidelity Central Funds | | 19,984 |
| Total income | | 555,455 |
| Expenses | | |
| Management fee | $250,370 | |
| Independent trustees' fees and expenses | 77 | |
| Total expenses before reductions | 250,447 | |
| Expense reductions | (195) | 250,252 |
| Net investment income (loss) | | 305,203 |
| Realized and Unrealized Gain (Loss) | | |
| Net realized gain (loss) on: | | |
| Investment securities: | | |
| Unaffiliated issuers | (751,075) | |
| Foreign currency transactions | 33,520 | |
| Total net realized gain (loss) | | (717,555) |
| Change in net unrealized appreciation (depreciation) on: | | |
| Investment securities: | | |
| Unaffiliated issuers | 5,811,656 | |
| Assets and liabilities in foreign currencies | 1,449 | |
| Total change in net unrealized appreciation (depreciation) | | 5,813,105 |
| Net gain (loss) | | 5,095,550 |
| Net increase (decrease) in net assets resulting from operations | | $5,400,753 |
See accompanying notes which are an integral part of the financial statements.
Statement of Changes in Net Assets
| | For the period
May 25, 2017 (commencement of operations) to
October 31, 2017 |
| Increase (Decrease) in Net Assets | |
| Operations | |
| Net investment income (loss) | $305,203 |
| Net realized gain (loss) | (717,555) |
| Change in net unrealized appreciation (depreciation) | 5,813,105 |
| Net increase (decrease) in net assets resulting from operations | 5,400,753 |
| Share transactions | |
| Proceeds from sales of shares | 299,172,907 |
| Cost of shares redeemed | (8,428,014) |
| Net increase (decrease) in net assets resulting from share transactions | 290,744,893 |
| Total increase (decrease) in net assets | 296,145,646 |
| Net Assets | |
| Beginning of period | – |
| End of period | $296,145,646 |
| Other Information | |
| Undistributed net investment income end of period | $303,449 |
| Shares | |
| Sold | 28,621,106 |
| Redeemed | (812,260) |
| Net increase (decrease) | 27,808,846 |
See accompanying notes which are an integral part of the financial statements.
Financial Highlights
Fidelity Diversified International K6 Fund
| Years ended October 31, | 2017 A |
| Selected Per–Share Data | |
| Net asset value, beginning of period | $10.00 |
| Income from Investment Operations | |
| Net investment income (loss)B | .03C |
| Net realized and unrealized gain (loss) | .62 |
| Total from investment operations | .65 |
| Net asset value, end of period | $10.65 |
| Total ReturnD,E | 6.50% |
| Ratios to Average Net AssetsF,G | |
| Expenses before reductions | .60%H |
| Expenses net of fee waivers, if any | .60%H |
| Expenses net of all reductions | .60%H |
| Net investment income (loss) | .64%C,H |
| Supplemental Data | |
| Net assets, end of period (000 omitted) | $296,146 |
| Portfolio turnover rateI | 27%J,K |
A For the period May 25, 2017 (commencement of operations) to October 31, 2017.
B Calculated based on average shares outstanding during the period.
C Net investment income per share reflects a large, non-recurring dividend which amounted to $.01 per share. This dividend is not annualized in the ratio of net investment income (loss) to average net assets. Excluding this dividend the ratio would have been .58%.
D Total returns for periods of less than one year are not annualized.
E Total returns would have been lower if certain expenses had not been reduced during the applicable periods shown.
F Fees and expenses of any underlying Fidelity Central Funds are not included in the Fund's expense ratio. The Fund indirectly bears its proportionate share of the expenses of any underlying Fidelity Central Funds.
G Expense ratios reflect operating expenses of the Fund. Expenses before reductions do not reflect amounts reimbursed by the investment adviser or reductions from brokerage service arrangements or reductions from other expense offset arrangements and do not represent the amount paid by the Fund during periods when reimbursements or reductions occur. Expense ratios before reductions for start-up periods may not be representative of longer-term operating periods. Expenses net of fee waivers reflect expenses after reimbursement by the investment adviser but prior to reductions from brokerage service arrangements or other expense offset arrangements. Expenses net of all reductions represent the net expenses paid by the Fund.
H Annualized
I Amount does not include the portfolio activity of any underlying Fidelity Central Funds.
J Portfolio turnover rate excludes securities received or delivered in-kind.
K Amount not annualized.
See accompanying notes which are an integral part of the financial statements.
Notes to Financial Statements
For the period ended October 31, 2017
1. Organization.
Fidelity Diversified International K6 Fund (the Fund) is a fund of Fidelity Investment Trust (the Trust) and is authorized to issue an unlimited number of shares. Share transactions on the Statement of Changes in Net Assets may contain exchanges between affiliated funds. The Trust is registered under the Investment Company Act of 1940, as amended (the 1940 Act), as an open-end management investment company organized as a Massachusetts business trust. Shares generally are available only to employer-sponsored retirement plans that are recordkept by Fidelity.
2. Investments in Fidelity Central Funds.
The Fund invests in Fidelity Central Funds, which are open-end investment companies generally available only to other investment companies and accounts managed by the investment adviser and its affiliates. The Fund's Schedule of Investments lists each of the Fidelity Central Funds held as of period end, if any, as an investment of the Fund, but does not include the underlying holdings of each Fidelity Central Fund. As an Investing Fund, the Fund indirectly bears its proportionate share of the expenses of the underlying Fidelity Central Funds.
The Money Market Central Funds seek preservation of capital and current income and are managed by Fidelity Investments Money Management, Inc. (FIMM), an affiliate of the investment adviser. Annualized expenses of the Money Market Central Funds as of their most recent shareholder report date are less than .005%.
A complete unaudited list of holdings for each Fidelity Central Fund is available upon request or at the Securities and Exchange Commission (the SEC) website at www.sec.gov. In addition, the financial statements of the Fidelity Central Funds, which are not covered by the Fund's Report of Independent Registered Public Accounting Firm, are available on the SEC website or upon request.
3. Significant Accounting Policies.
The Fund is an investment company and applies the accounting and reporting guidance of the Financial Accounting Standards Board (FASB) Accounting Standards Codification Topic 946 Financial Services – Investments Companies. The financial statements have been prepared in conformity with accounting principles generally accepted in the United States of America (GAAP), which require management to make certain estimates and assumptions at the date of the financial statements. Actual results could differ from those estimates. Subsequent events, if any, through the date that the financial statements were issued have been evaluated in the preparation of the financial statements. The following summarizes the significant accounting policies of the Fund:
Investment Valuation. Investments are valued as of 4:00 p.m. Eastern time on the last calendar day of the period. The Board of Trustees (the Board) has delegated the day to day responsibility for the valuation of the Fund's investments to the Fair Value Committee (the Committee) established by the Fund's investment adviser. In accordance with valuation policies and procedures approved by the Board, the Fund attempts to obtain prices from one or more third party pricing vendors or brokers to value its investments. When current market prices, quotations or currency exchange rates are not readily available or reliable, investments will be fair valued in good faith by the Committee, in accordance with procedures adopted by the Board. Factors used in determining fair value vary by investment type and may include market or investment specific events. The frequency with which these procedures are used cannot be predicted and they may be utilized to a significant extent. The Committee oversees the Fund's valuation policies and procedures and reports to the Board on the Committee's activities and fair value determinations. The Board monitors the appropriateness of the procedures used in valuing the Fund's investments and ratifies the fair value determinations of the Committee.
The Fund categorizes the inputs to valuation techniques used to value its investments into a disclosure hierarchy consisting of three levels as shown below:
- Level 1 – quoted prices in active markets for identical investments
- Level 2 – other significant observable inputs (including quoted prices for similar investments, interest rates, prepayment speeds, etc.)
- Level 3 – unobservable inputs (including the Fund's own assumptions based on the best information available)
Valuation techniques used to value the Fund's investments by major category are as follows:
Equity securities, including restricted securities, for which market quotations are readily available, are valued at the last reported sale price or official closing price as reported by a third party pricing vendor on the primary market or exchange on which they are traded and are categorized as Level 1 in the hierarchy. In the event there were no sales during the day or closing prices are not available, securities are valued at the last quoted bid price or may be valued using the last available price and are generally categorized as Level 2 in the hierarchy. For foreign equity securities, when market or security specific events arise, comparisons to the valuation of American Depositary Receipts (ADRs), futures contracts, Exchange-Traded Funds (ETFs) and certain indexes as well as quoted prices for similar securities may be used and would be categorized as Level 2 in the hierarchy. Utilizing these techniques may result in transfers between Level 1 and Level 2. For equity securities, including restricted securities, where observable inputs are limited, assumptions about market activity and risk are used and these securities may be categorized as Level 3 in the hierarchy.
ETFs are valued at their last sale price or official closing price as reported by a third party pricing vendor on the primary market or exchange on which they are traded and are categorized as Level 1 in the hierarchy. In the event there were no sales during the day but the exchange reports a closing bid level, ETFs are valued at the closing bid and would be categorized as Level 1 in the hierarchy. In the event there was no closing bid, ETFs may be valued by another method that the Board believes reflects fair value in accordance with the Board's fair value pricing policies and may be categorized as Level 2 in the hierarchy.
Investments in open-end mutual funds, including the Fidelity Central Funds, are valued at their closing net asset value (NAV) each business day and are categorized as Level 1 in the hierarchy.
Changes in valuation techniques may result in transfers in or out of an assigned level within the disclosure hierarchy. The aggregate value of investments by input level as of October 31, 2017 is included at the end of the Fund's Schedule of Investments.
Foreign Currency. The Fund may use foreign currency contracts to facilitate transactions in foreign-denominated securities. Gains and losses from these transactions may arise from changes in the value of the foreign currency or if the counterparties do not perform under the contracts' terms.
Foreign-denominated assets, including investment securities, and liabilities are translated into U.S. dollars at the exchange rates at period end. Purchases and sales of investment securities, income and dividends received and expenses denominated in foreign currencies are translated into U.S. dollars at the exchange rate in effect on the transaction date.
The effects of exchange rate fluctuations on investments are included with the net realized and unrealized gain (loss) on investment securities. Other foreign currency transactions resulting in realized and unrealized gain (loss) are disclosed separately.
Investment Transactions and Income. For financial reporting purposes, the Fund's investment holdings and NAV include trades executed through the end of the last business day of the period. The NAV per share for processing shareholder transactions is calculated as of the close of business of the New York Stock Exchange (NYSE), normally 4:00 p.m. Eastern time and includes trades executed through the end of the prior business day. Gains and losses on securities sold are determined on the basis of identified cost. Dividend income is recorded on the ex-dividend date, except for certain dividends from foreign securities where the ex-dividend date may have passed, which are recorded as soon as the Fund is informed of the ex-dividend date. Non-cash dividends included in dividend income, if any, are recorded at the fair market value of the securities received. Income and capital gain distributions from Fidelity Central Funds, if any, are recorded on the ex-dividend date. Large, non-recurring dividends recognized by the Fund are presented separately on the Statement of Operations as "Special Dividends" and the impact of these dividends is presented in the Financial Highlights. Investment income is recorded net of foreign taxes withheld where recovery of such taxes is uncertain.
Expenses. Expenses directly attributable to a fund are charged to that fund. Expenses attributable to more than one fund are allocated among the respective funds on the basis of relative net assets or other appropriate methods. Expense estimates are accrued in the period to which they relate and adjustments are made when actual amounts are known.
Income Tax Information and Distributions to Shareholders. Each year, the Fund intends to qualify as a regulated investment company under Subchapter M of the Internal Revenue Code, including distributing substantially all of its taxable income and realized gains. As a result, no provision for U.S. Federal income taxes is required. As of October 31, 2017, the Fund did not have any unrecognized tax benefits in the financial statements; nor is the Fund aware of any tax positions for which it is reasonably possible that the total amounts of unrecognized tax benefits will significantly change in the next twelve months. The Fund files a U.S. federal tax return, in addition to state and local tax returns as required. The Fund's federal income tax returns are subject to examination by the Internal Revenue Service (IRS) for a period of three fiscal years after they are filed. State and local tax returns may be subject to examination for an additional fiscal year depending on the jurisdiction. Foreign taxes are provided for based on the Fund's understanding of the tax rules and rates that exist in the foreign markets in which it invests.
Distributions are declared and recorded on the ex-dividend date. Income and capital gain distributions are determined in accordance with income tax regulations, which may differ from GAAP.
Capital accounts within the financial statements are adjusted for permanent book-tax differences. These adjustments have no impact on net assets or the results of operations. Capital accounts are not adjusted for temporary book-tax differences which will reverse in a subsequent period.
Book-tax differences are primarily due to foreign currency transactions, passive foreign investment companies (PFIC), capital loss carryforwards and losses deferred due to wash sales.
As of period end, the cost and unrealized appreciation (depreciation) in securities, and derivatives if applicable, for federal income tax purposes were as follows:
| Gross unrealized appreciation | $9,924,461 |
| Gross unrealized depreciation | (4,592,224) |
| Net unrealized appreciation (depreciation) | $5,332,237 |
| Tax Cost | $293,941,114 |
The tax-based components of distributable earnings as of period end were as follows:
| Undistributed ordinary income | $613,964 |
| Capital loss carryforward | $(545,142) |
| Net unrealized appreciation (depreciation) on securities and other investments | $5,331,932 |
Capital loss carryforwards are only available to offset future capital gains of the Fund to the extent provided by regulations and may be limited. Under the Regulated Investment Company Modernization Act of 2010 (the Act), the Fund is permitted to carry forward capital losses incurred in taxable years beginning after December 22, 2010 for an unlimited period and such capital losses are required to be used prior to any losses that expire. The capital loss carryforward information presented below, including any applicable limitation, is estimated as of fiscal period end and is subject to adjustment.
| No expiration | |
| Short-term | $(545,142) |
| Total capital loss carryforward | $(545,142) |
4. Purchases and Sales of Investments.
Purchases and sales of securities, other than short-term securities and in-kind transactions, aggregated $65,964,894 and $30,041,523, respectively.
5. Fees and Other Transactions with Affiliates.
Management Fee. Fidelity Management & Research Company (the investment adviser) and its affiliates provide the Fund with investment management related services for which the Fund pays a monthly management fee that is based on an annual rate of .60% of average net assets. Under the management contract, the investment adviser or an affiliate pays all other expenses of the Fund, excluding fees and expenses of the independent Trustees, and certain miscellaneous expenses such as proxy and shareholder meeting expenses.
Brokerage Commissions. The Fund placed a portion of its portfolio transactions with brokerage firms which are affiliates of the investment adviser. Brokerage commissions are included in net realized gain (loss) and change in net unrealized appreciation (depreciation) in the Statement of Operations. The commissions paid to these affiliated firms were $230 for the period.
Interfund Trades. The Fund may purchase from or sell securities to other Fidelity Funds under procedures adopted by the Board. The procedures have been designed to ensure these interfund trades are executed in accordance with Rule 17a-7 of the 1940 Act. Interfund trades are included within the respective purchases and sales amounts shown in the Purchases and Sales of Investments note.
Exchanges In-Kind. During the period, an affiliated entity completed an exchange in-kind with the Fund. The affiliated entity delivered investments and cash, including accrued interest, valued at $252,875,067 in exchange for 24,179,719 shares of the Fund. The amount of in-kind exchanges is included in share transactions in the accompanying Statement of Changes in Net Assets. The Fund recognized no gain or loss for federal income tax purposes.
6. Security Lending.
The Fund lends portfolio securities through a lending agent from time to time in order to earn additional income. For equity securities, a lending agent is used and may loan securities to certain qualified borrowers, including Fidelity Capital Markets (FCM), a broker-dealer affiliated with the Fund. On the settlement date of the loan, the Fund receives collateral (in the form of U.S. Treasury obligations, letters of credit and/or cash) against the loaned securities and maintains collateral in an amount not less than 100% of the market value of the loaned securities during the period of the loan. The market value of the loaned securities is determined at the close of business of the Fund and any additional required collateral is delivered to the Fund on the next business day. The Fund or borrower may terminate the loan at any time, and if the borrower defaults on its obligation to return the securities loaned because of insolvency or other reasons, the Fund may apply collateral received from the borrower against the obligation. The Fund may experience delays and costs in recovering the securities loaned. Any cash collateral received is invested in the Fidelity Securities Lending Cash Central Fund. The value of loaned securities and cash collateral at period end are disclosed on the Fund's Statement of Assets and Liabilities. Security lending income represents the income earned on investing cash collateral, less rebates paid to borrowers and any lending agent fees associated with the loan, plus any premium payments received for lending certain types of securities. Security lending income is presented in the Statement of Operations as a component of income from Fidelity Central Funds. Total security lending income during the period amounted to $5. During the period, there were no securities loaned to FCM.
7. Expense Reductions.
Commissions paid to certain brokers with whom the investment adviser, or its affiliates, places trades on behalf of the Fund include an amount in addition to trade execution, which may be rebated back to the Fund to offset certain expenses. This amount totaled $157 for the period. In addition, through arrangements with the Fund's custodian, credits realized as a result of certain uninvested cash balances were used to reduce the Fund's expenses. During the period, these credits reduced the Fund's management expenses by $38.
8. Other.
The Fund's organizational documents provide former and current trustees and officers with a limited indemnification against liabilities arising in connection with the performance of their duties to the Fund. In the normal course of business, the Fund may also enter into contracts that provide general indemnifications. The Fund's maximum exposure under these arrangements is unknown as this would be dependent on future claims that may be made against the Fund. The risk of material loss from such claims is considered remote.
Effective after the close of business on October 31, 2017, affiliated entities completed exchanges in-kind with the Fund. The affiliated entities delivered investments and cash valued at $362,620,955 in exchange for 33,993,326 shares of the Fund. The Fund recognized no gain or loss for federal income tax purposes.
Report of Independent Registered Public Accounting Firm
To the Trustees of Fidelity Investment Trust and Shareholders of Fidelity Diversified International K6 Fund:
We have audited the accompanying statement of assets and liabilities of Fidelity Diversified International K6 Fund (the Fund), a fund of Fidelity Investment Trust, including the schedule of investments, as of October 31, 2017, and the related statements of operations, changes in net assets, and the financial highlights for the period from May 25, 2017 (commencement of operations) to October 31, 2017. These financial statements and financial highlights are the responsibility of the Fund’s management. Our responsibility is to express an opinion on these financial statements and financial highlights based on our audit.
We conducted our audit in accordance with the standards of the Public Company Accounting Oversight Board (United States). Those standards require that we plan and perform the audit to obtain reasonable assurance about whether the financial statements and financial highlights are free of material misstatement. The Fund is not required to have, nor were we engaged to perform, an audit of its internal control over financial reporting. Our audit included consideration of internal control over financial reporting as a basis for designing audit procedures that are appropriate in the circumstances, but not for the purpose of expressing an opinion on the effectiveness of the Fund’s internal control over financial reporting. Accordingly, we express no such opinion. An audit also includes examining, on a test basis, evidence supporting the amounts and disclosures in the financial statements, assessing the accounting principles used and significant estimates made by management, as well as evaluating the overall financial statement presentation. Our procedures included confirmation of securities owned as of October 31, 2017, by correspondence with the custodians and brokers; when replies were not received from brokers, we performed other auditing procedures. We believe that our audit provides a reasonable basis for our opinion.
In our opinion, such financial statements and financial highlights referred to above present fairly, in all material respects, the financial position of Fidelity Diversified International K6 Fund as of October 31, 2017, and the results of its operations, changes in its net assets, and the financial highlights for the period from May 25, 2017 (commencement of operations) to October 31, 2017 in conformity with accounting principles generally accepted in the United States of America.
DELOITTE & TOUCHE LLP
Boston, Massachusetts
December 18, 2017
Trustees and Officers
The Trustees, Members of the Advisory Board (if any), and officers of the trust and fund, as applicable, are listed below. The Board of Trustees governs the fund and is responsible for protecting the interests of shareholders. The Trustees are experienced executives who meet periodically throughout the year to oversee the fund's activities, review contractual arrangements with companies that provide services to the fund, oversee management of the risks associated with such activities and contractual arrangements, and review the fund's performance. Except for Jonathan Chiel, each of the Trustees oversees 190 funds. Mr. Chiel oversees 143 funds.
The Trustees hold office without limit in time except that (a) any Trustee may resign; (b) any Trustee may be removed by written instrument, signed by at least two-thirds of the number of Trustees prior to such removal; (c) any Trustee who requests to be retired or who has become incapacitated by illness or injury may be retired by written instrument signed by a majority of the other Trustees; and (d) any Trustee may be removed at any special meeting of shareholders by a two-thirds vote of the outstanding voting securities of the trust. Each Trustee who is not an interested person (as defined in the 1940 Act) of the trust and the fund is referred to herein as an Independent Trustee. Each Independent Trustee shall retire not later than the last day of the calendar year in which his or her 75th birthday occurs. The Independent Trustees may waive this mandatory retirement age policy with respect to individual Trustees. Officers and Advisory Board Members hold office without limit in time, except that any officer or Advisory Board Member may resign or may be removed by a vote of a majority of the Trustees at any regular meeting or any special meeting of the Trustees. Except as indicated, each individual has held the office shown or other offices in the same company for the past five years.
The fund’s Statement of Additional Information (SAI) includes more information about the Trustees. To request a free copy, call Fidelity at 1-800-835-5092.
Experience, Skills, Attributes, and Qualifications of the Trustees. The Governance and Nominating Committee has adopted a statement of policy that describes the experience, qualifications, attributes, and skills that are necessary and desirable for potential Independent Trustee candidates (Statement of Policy). The Board believes that each Trustee satisfied at the time he or she was initially elected or appointed a Trustee, and continues to satisfy, the standards contemplated by the Statement of Policy. The Governance and Nominating Committee also engages professional search firms to help identify potential Independent Trustee candidates who have the experience, qualifications, attributes, and skills consistent with the Statement of Policy. From time to time, additional criteria based on the composition and skills of the current Independent Trustees, as well as experience or skills that may be appropriate in light of future changes to board composition, business conditions, and regulatory or other developments, have also been considered by the professional search firms and the Governance and Nominating Committee. In addition, the Board takes into account the Trustees' commitment and participation in Board and committee meetings, as well as their leadership of standing and ad hoc committees throughout their tenure.
In determining that a particular Trustee was and continues to be qualified to serve as a Trustee, the Board has considered a variety of criteria, none of which, in isolation, was controlling. The Board believes that, collectively, the Trustees have balanced and diverse experience, qualifications, attributes, and skills, which allow the Board to operate effectively in governing the fund and protecting the interests of shareholders. Information about the specific experience, skills, attributes, and qualifications of each Trustee, which in each case led to the Board's conclusion that the Trustee should serve (or continue to serve) as a trustee of the fund, is provided below.
Board Structure and Oversight Function. James C. Curvey is an interested person and currently serves as Chairman. The Trustees have determined that an interested Chairman is appropriate and benefits shareholders because an interested Chairman has a personal and professional stake in the quality and continuity of services provided to the fund. Independent Trustees exercise their informed business judgment to appoint an individual of their choosing to serve as Chairman, regardless of whether the Trustee happens to be independent or a member of management. The Independent Trustees have determined that they can act independently and effectively without having an Independent Trustee serve as Chairman and that a key structural component for assuring that they are in a position to do so is for the Independent Trustees to constitute a substantial majority for the Board. The Independent Trustees also regularly meet in executive session. Ned C. Lautenbach serves as Chairman of the Independent Trustees and as such (i) acts as a liaison between the Independent Trustees and management with respect to matters important to the Independent Trustees and (ii) with management prepares agendas for Board meetings.
Fidelity® funds are overseen by different Boards of Trustees. The fund's Board oversees Fidelity's high income and certain equity funds, and other Boards oversee Fidelity's investment-grade bond, money market, asset allocation, and sector funds. The asset allocation funds may invest in Fidelity® funds overseen by the fund's Board. The use of separate Boards, each with its own committee structure, allows the Trustees of each group of Fidelity® funds to focus on the unique issues of the funds they oversee, including common research, investment, and operational issues. On occasion, the separate Boards establish joint committees to address issues of overlapping consequences for the Fidelity® funds overseen by each Board.
The Trustees operate using a system of committees to facilitate the timely and efficient consideration of all matters of importance to the Trustees, the fund, and fund shareholders and to facilitate compliance with legal and regulatory requirements and oversight of the fund's activities and associated risks. The Board, acting through its committees, has charged FMR and its affiliates with (i) identifying events or circumstances the occurrence of which could have demonstrably adverse effects on the fund's business and/or reputation; (ii) implementing processes and controls to lessen the possibility that such events or circumstances occur or to mitigate the effects of such events or circumstances if they do occur; and (iii) creating and maintaining a system designed to evaluate continuously business and market conditions in order to facilitate the identification and implementation processes described in (i) and (ii) above. Because the day-to-day operations and activities of the fund are carried out by or through FMR, its affiliates, and other service providers, the fund's exposure to risks is mitigated but not eliminated by the processes overseen by the Trustees. While each of the Board's committees has responsibility for overseeing different aspects of the fund's activities, oversight is exercised primarily through the Operations, Audit, and Compliance Committees. In addition, the Independent Trustees have worked with FMR to enhance the Board's oversight of investment and financial risks, legal and regulatory risks, technology risks, and operational risks, including the development of additional risk reporting to the Board. For example, a working group comprised of Independent Trustees and FMR has worked and continues to work to review the Fidelity® funds' valuation-related activities, reporting and risk management. Appropriate personnel, including but not limited to the fund's Chief Compliance Officer (CCO), FMR's internal auditor, the independent accountants, the fund's Treasurer and portfolio management personnel, make periodic reports to the Board's committees, as appropriate, including an annual review of Fidelity's risk management program for the Fidelity® funds. The responsibilities of each standing committee, including their oversight responsibilities, are described further under "Standing Committees of the Trustees."
Interested Trustees*:
Correspondence intended for a Trustee who is an interested person may be sent to Fidelity Investments, 245 Summer Street, Boston, Massachusetts 02210.
Name, Year of Birth; Principal Occupations and Other Relevant Experience+
Jonathan Chiel (1957)
Year of Election or Appointment: 2016
Trustee
Mr. Chiel also serves as Trustee of other Fidelity® funds. Mr. Chiel is Executive Vice President and General Counsel for FMR LLC (diversified financial services company, 2012-present). Previously, Mr. Chiel served as general counsel (2004-2012) and senior vice president and deputy general counsel (2000-2004) for John Hancock Financial Services; a partner with Choate, Hall & Stewart (1996-2000) (law firm); and an Assistant United States Attorney for the United States Attorney’s Office of the District of Massachusetts (1986-95), including Chief of the Criminal Division (1993-1995). Mr. Chiel is a director on the boards of the Boston Bar Foundation and the Maimonides School.
James C. Curvey (1935)
Year of Election or Appointment: 2007
Trustee
Chairman of the Board of Trustees
Mr. Curvey also serves as Trustee of other Fidelity® funds. Mr. Curvey is a Director of Fidelity Research & Analysis Co. (investment adviser firm, 2009-present), and Vice Chairman (2007-present) and Director of FMR LLC (diversified financial services company). In addition, Mr. Curvey serves as an Overseer for the Boston Symphony Orchestra and a member of the board of Artis-Naples, Naples, Florida, and as a Trustee for Brewster Academy, Wolfeboro, New Hampshire. Previously, Mr. Curvey served as a Director of Fidelity Investments Money Management, Inc. (investment adviser firm, 2009-2014) and a Director of FMR and FMR Co., Inc. (investment adviser firms, 2007-2014).
Charles S. Morrison (1960)
Year of Election or Appointment: 2014
Trustee
Mr. Morrison also serves as Trustee of other funds. He serves as President of Fidelity Management & Research Company (FMR) (investment adviser firm, 2016-present), a Director of Fidelity Investments Money Management, Inc. (FIMM) (investment adviser firm, 2014-present), Director of Fidelity SelectCo, LLC (investment adviser firm, 2014-present), President, Asset Management (2014-present), and is an employee of Fidelity Investments. Previously, Mr. Morrison served as Vice President of Fidelity's Fixed Income and Asset Allocation Funds (2012-2014), President, Fixed Income (2011-2014), Vice President of Fidelity's Money Market Funds (2005-2009), President, Money Market Group Leader of FMR (investment adviser firm, 2009), and Senior Vice President, Money Market Group of FMR (2004-2009). Mr. Morrison also served as Vice President of Fidelity's Bond Funds (2002-2005), certain Balanced Funds (2002-2005), and certain Asset Allocation Funds (2002-2007), and as Senior Vice President (2002-2005) of Fidelity's Bond Division.
* Determined to be an “Interested Trustee” by virtue of, among other things, his or her affiliation with the trust or various entities under common control with FMR.
+ The information includes the Trustee's principal occupation during the last five years and other information relating to the experience, attributes, and skills relevant to the Trustee's qualifications to serve as a Trustee, which led to the conclusion that the Trustee should serve as a Trustee for the fund.
Independent Trustees:
Correspondence intended for an Independent Trustee may be sent to Fidelity Investments, P.O. Box 55235, Boston, Massachusetts 02205-5235.
Name, Year of Birth; Principal Occupations and Other Relevant Experience+
Dennis J. Dirks (1948)
Year of Election or Appointment: 2005
Trustee
Mr. Dirks also serves as Trustee of other Fidelity® funds. Prior to his retirement in May 2003, Mr. Dirks was Chief Operating Officer and a member of the Board of The Depository Trust & Clearing Corporation (DTCC). He also served as President, Chief Operating Officer, and Board member of The Depository Trust Company (DTC) and President and Board member of the National Securities Clearing Corporation (NSCC). In addition, Mr. Dirks served as Chief Executive Officer and Board member of the Government Securities Clearing Corporation, Chief Executive Officer and Board member of the Mortgage-Backed Securities Clearing Corporation, as a Trustee and a member of the Finance Committee of Manhattan College (2005-2008), as a Trustee and a member of the Finance Committee of AHRC of Nassau County (2006-2008), as a member of the Independent Directors Council (IDC) Governing Council (2010-2015), and as a member of the Board of Directors for The Brookville Center for Children’s Services, Inc. (2009-2017). Mr. Dirks is a member of the Finance Committee (2016-present) and Board of Directors (2017-present) of the Asolo Repertory Theatre.
Alan J. Lacy (1953)
Year of Election or Appointment: 2008
Trustee
Mr. Lacy also serves as Trustee of other Fidelity® funds. Mr. Lacy serves as a Director of Bristol-Myers Squibb Company (global pharmaceuticals, 2008-present). He is a Trustee of the California Chapter of The Nature Conservancy (2015-present) and a Director of the Center for Advanced Study in the Behavioral Sciences at Stanford University (2015-present). In addition, Mr. Lacy served as Senior Adviser (2007-2014) of Oak Hill Capital Partners, L.P. (private equity) and also served as Chief Executive Officer (2005) and Vice Chairman (2005-2006) of Sears Holdings Corporation (retail) and Chief Executive Officer and Chairman of the Board of Sears, Roebuck and Co. (retail, 2000-2005). Previously, Mr. Lacy served as Chairman (2014-2017) and a member (2010-2017) of the Board of Directors of Dave & Buster’s Entertainment, Inc. (restaurant and entertainment complexes), as Chairman (2008-2011) and a member (2006-2015) of the Board of Trustees of the National Parks Conservation Association, and as a member of the Board of Directors for The Hillman Companies, Inc. (hardware wholesalers, 2010-2014), Earth Fare, Inc. (retail grocery, 2010-2014), and The Western Union Company (global money transfer, 2006-2011).
Ned C. Lautenbach (1944)
Year of Election or Appointment: 2000
Trustee
Chairman of the Independent Trustees
Mr. Lautenbach also serves as Trustee of other Fidelity® funds. Mr. Lautenbach currently serves as Vice Chair of the Board of Governors, State University System of Florida (2013-present) and is a member of the Council on Foreign Relations (1994-present). He is also a member and has most recently served as Chairman of the Board of Directors of Artis-Naples (2012-present). Previously, Mr. Lautenbach served as a member and then Lead Director of the Board of Directors of Eaton Corporation (diversified industrial, 1997-2016). He was also a Partner and Advisory Partner at Clayton, Dubilier & Rice, LLC (private equity investment, 1998-2010), as well as a Director of Sony Corporation (2006-2007). In addition, Mr. Lautenbach also had a 30-year career with IBM (technology company) during which time he served as Senior Vice President and a member of the Corporate Executive Committee (1968-1998).
Joseph Mauriello (1944)
Year of Election or Appointment: 2008
Trustee
Mr. Mauriello also serves as Trustee of other Fidelity® funds. Prior to his retirement in January 2006, Mr. Mauriello served in numerous senior management positions including Deputy Chairman and Chief Operating Officer (2004-2005), and Vice Chairman of Financial Services (2002-2004) of KPMG LLP US (professional services, 1965-2005). Mr. Mauriello currently serves as a member of the Board of Directors of XL Group plc. (global insurance and re-insurance, 2006-present) and the Independent Directors Council (IDC) Governing Council (2015-present). Previously, Mr. Mauriello served as a Director of the Hamilton Funds of the Bank of New York (2006-2007) and of Arcadia Resources Inc. (health care services and products, 2007-2012).
Cornelia M. Small (1944)
Year of Election or Appointment: 2005
Trustee
Ms. Small also serves as Trustee of other Fidelity® funds. Ms. Small is a member of the Board of Directors (2009-present) and Chair of the Investment Committee (2010-present) of the Teagle Foundation. Ms. Small also serves on the Investment Committee of the Berkshire Taconic Community Foundation (2008-present). Previously, Ms. Small served as Chairperson (2002-2008) and a member of the Investment Committee and Chairperson (2008-2012) and a member of the Board of Trustees of Smith College. In addition, Ms. Small served as Chief Investment Officer, Director of Global Equity Investments, and a member of the Board of Directors of Scudder, Stevens & Clark and Scudder Kemper Investments.
William S. Stavropoulos (1939)
Year of Election or Appointment: 2001
Trustee
Vice Chairman of the Independent Trustees
Mr. Stavropoulos also serves as Trustee of other Fidelity® funds. Mr. Stavropoulos serves as President and Founder of the Michigan Baseball Foundation, the Great Lakes Loons (2007-present). Mr. Stavropoulos is Chairman Emeritus of the Board of Directors of The Dow Chemical Company, where he previously served in numerous senior management positions, including President, CEO (1995-2000; 2002-2004), Chairman of the Executive Committee (2000-2006), and as a member of the Board of Directors (1990-2006). Currently, Mr. Stavropoulos is Chairman of the Board of Directors of Univar Inc. (global distributor of commodity and specialty chemicals), a Director of Teradata Corporation (data warehousing and technology solutions), and a member of the Advisory Board for Metalmark Capital LLC (private equity investment, 2005-present). Mr. Stavropoulos is an operating advisor to Clayton, Dubilier & Rice, LLC (private equity investment). In addition, Mr. Stavropoulos is a member of the University of Notre Dame Advisory Council for the College of Science, a Trustee of the Rollin L. Gerstacker Foundation, and a Director of Artis-Naples in Naples, Florida. Previously, Mr. Stavropoulos served as a Director of Chemical Financial Corporation (bank holding company, 1993-2012) and Tyco International, Ltd. (multinational manufacturing and services, 2007-2012).
David M. Thomas (1949)
Year of Election or Appointment: 2008
Trustee
Mr. Thomas also serves as Trustee of other Fidelity® funds. Mr. Thomas serves as Non-Executive Chairman of the Board of Directors of Fortune Brands Home and Security (home and security products, 2011-present), as a member of the Board of Directors (2004-present) and Presiding Director (2013-present) of Interpublic Group of Companies, Inc. (marketing communication), and as a member of the Board of Trustees of the University of Florida (2013-present). Previously, Mr. Thomas served as Executive Chairman (2005-2006) and Chairman and Chief Executive Officer (2000-2005) of IMS Health, Inc. (pharmaceutical and healthcare information solutions), and a Director of Fortune Brands, Inc. (consumer products, 2000-2011).
+ The information includes the Trustee's principal occupation during the last five years and other information relating to the experience, attributes, and skills relevant to the Trustee's qualifications to serve as a Trustee, which led to the conclusion that the Trustee should serve as a Trustee for the fund.
Advisory Board Members and Officers:
Correspondence intended for an officer or Peter S. Lynch may be sent to Fidelity Investments, 245 Summer Street, Boston, Massachusetts 02210. Officers appear below in alphabetical order.
Name, Year of Birth; Principal Occupation
Peter S. Lynch (1944)
Year of Election or Appointment: 2003
Member of the Advisory Board
Mr. Lynch also serves as Member of the Advisory Board of other Fidelity® funds. Mr. Lynch is Vice Chairman and a Director of FMR (investment adviser firm) and FMR Co., Inc. (investment adviser firm). In addition, Mr. Lynch serves as a Trustee of Boston College and as the Chairman of the Inner-City Scholarship Fund. Previously, Mr. Lynch served on the Special Olympics International Board of Directors (1997-2006).
Elizabeth Paige Baumann (1968)
Year of Election or Appointment: 2017
Anti-Money Laundering (AML) Officer
Ms. Baumann also serves as AML Officer of other funds. She is Chief AML Officer (2012-present) and Senior Vice President (2014-present) of FMR LLC (diversified financial services company) and is an employee of Fidelity Investments. Previously, Ms. Baumann served as AML Officer of the funds (2012-2016), and Vice President (2007-2014) and Deputy Anti-Money Laundering Officer (2007-2012) of FMR LLC.
Marc R. Bryant (1966)
Year of Election or Appointment: 2015
Secretary and Chief Legal Officer (CLO)
Mr. Bryant also serves as Secretary and CLO of other funds. Mr. Bryant serves as CLO, Secretary, and Senior Vice President of Fidelity Management & Research Company (investment adviser firm, 2015-present) and FMR Co., Inc. (investment adviser firm, 2015-present); Secretary of Fidelity SelectCo, LLC (investment adviser firm, 2015-present) and Fidelity Investments Money Management, Inc. (investment adviser firm, 2015-present); and CLO of Fidelity Management & Research (Hong Kong) Limited and FMR Investment Management (UK) Limited (investment adviser firms, 2015-present) and Fidelity Management & Research (Japan) Limited (investment adviser firm, 2016-present). He is Senior Vice President and Deputy General Counsel of FMR LLC (diversified financial services company). Previously, Mr. Bryant served as Secretary and CLO of Fidelity Rutland Square Trust II (2010-2014) and Assistant Secretary of Fidelity's Fixed Income and Asset Allocation Funds (2013-2015). Prior to joining Fidelity Investments, Mr. Bryant served as a Senior Vice President and the Head of Global Retail Legal for AllianceBernstein L.P. (2006-2010), and as the General Counsel for ProFund Advisors LLC (2001-2006).
William C. Coffey (1969)
Year of Election or Appointment: 2009
Assistant Secretary
Mr. Coffey also serves as Assistant Secretary of other funds. He is Senior Vice President and Deputy General Counsel of FMR LLC (diversified financial services company, 2010-present), and is an employee of Fidelity Investments. Previously, Mr. Coffey served as Vice President and Associate General Counsel of FMR LLC (2005-2009).
Jonathan Davis (1968)
Year of Election or Appointment: 2010
Assistant Treasurer
Mr. Davis also serves as Assistant Treasurer of other funds, and is an employee of Fidelity Investments. Previously, Mr. Davis served as Vice President and Associate General Counsel of FMR LLC (diversified financial services company, 2003-2010).
Adrien E. Deberghes (1967)
Year of Election or Appointment: 2016
Assistant Treasurer
Mr. Deberghes also serves as an officer of other funds. He serves as Executive Vice President of Fidelity Investments Money Management, Inc. (FIMM) (investment adviser firm, 2016-present) and is an employee of Fidelity Investments (2008-present). Prior to joining Fidelity Investments, Mr. Deberghes was Senior Vice President of Mutual Fund Administration at State Street Corporation (2007-2008), Senior Director of Mutual Fund Administration at Investors Bank & Trust (2005-2007), and Director of Finance for Dunkin' Brands (2000-2005). Previously, Mr. Deberghes served in other fund officer roles.
Joseph DeSantis (1959)
Year of Election or Appointment: 2017
Vice President
Mr. DeSantis also serves as Vice President of other funds. Mr. DeSantis serves as a Director of Fidelity Management & Research (Japan) Limited (investment adviser firm, 2016-present), Chief Investment Officer, Equities (2010-present) and is an employee of Fidelity Investments.
Stephanie J. Dorsey (1969)
Year of Election or Appointment: 2010
Assistant Treasurer
Ms. Dorsey also serves as an officer of other funds. She is an employee of Fidelity Investments (2008-present) and has served in other fund officer roles. Prior to joining Fidelity Investments, Ms. Dorsey served as Treasurer (2004-2008) of the JPMorgan Mutual Funds and Vice President (2004-2008) of JPMorgan Chase Bank.
Howard J. Galligan III (1966)
Year of Election or Appointment: 2014
Chief Financial Officer
Mr. Galligan also serves as Chief Financial Officer of other funds. Mr. Galligan serves as President of Fidelity Pricing and Cash Management Services (FPCMS) (2014-present) and as a Director of Strategic Advisers, Inc. (investment adviser firm, 2008-present). Previously, Mr. Galligan served as Chief Administrative Officer of Asset Management (2011-2014) and Chief Operating Officer and Senior Vice President of Investment Support for Strategic Advisers, Inc. (2003-2011).
Brian B. Hogan (1964)
Year of Election or Appointment: 2009
Vice President
Mr. Hogan also serves as Trustee or Vice President of other funds. Mr. Hogan serves as a Director of FMR Investment Management (UK) Limited (investment adviser firm, 2015-present) and Fidelity SelectCo, LLC (investment adviser firm, 2014-present) and President of the Equity Division of FMR (investment adviser firm, 2009-present). Previously, Mr. Hogan served as Senior Vice President, Equity Research of FMR (2006-2009) and as a portfolio manager. Mr. Brian B. Hogan is not related to Mr. Colm A. Hogan.
Colm A. Hogan (1973)
Year of Election or Appointment: 2016
Deputy Treasurer
Mr. Hogan also serves as an officer of other funds. Mr. Hogan is an employee of Fidelity Investments (2005-present). Mr. Colm A. Hogan is not related to Mr. Brian B. Hogan.
Chris Maher (1972)
Year of Election or Appointment: 2013
Assistant Treasurer
Mr. Maher serves as Assistant Treasurer of other funds. Mr. Maher is Vice President of Valuation Oversight and is an employee of Fidelity Investments. Previously, Mr. Maher served as Vice President of Asset Management Compliance (2013), Vice President of the Program Management Group of FMR (investment adviser firm, 2010-2013), and Vice President of Valuation Oversight (2008-2010).
Rieco E. Mello (1969)
Year of Election or Appointment: 2017
Assistant Treasurer
Mr. Mello also serves as Assistant Treasurer of other funds. Mr. Mello is an employee of Fidelity Investments (1995-present).
Kenneth B. Robins (1969)
Year of Election or Appointment: 2016
Chief Compliance Officer
Mr. Robins also serves as an officer of other funds. Mr. Robins serves as Compliance Officer of Fidelity Management & Research Company and FMR Co., Inc. (investment adviser firms, 2016-present) and is an employee of Fidelity Investments (2004-present). Previously, Mr. Robins served as Executive Vice President of Fidelity Investments Money Management, Inc. (investment adviser firm, 2013-2016) and served in other fund officer roles.
Stacie M. Smith (1974)
Year of Election or Appointment: 2016
President and Treasurer
Ms. Smith also serves as an officer of other funds. She is an employee of Fidelity Investments (2009-present) and has served in other fund officer roles. Prior to joining Fidelity Investments, Ms. Smith served as Senior Audit Manager of Ernst & Young LLP (accounting firm, 1996-2009). Previously, Ms. Smith served as Deputy Treasurer of certain Fidelity® funds (2013-2016).
Marc L. Spector (1972)
Year of Election or Appointment: 2016
Assistant Treasurer
Mr. Spector also serves as an officer of other funds. Mr. Spector is an employee of Fidelity Investments (2016-present). Prior to joining Fidelity Investments, Mr. Spector served as Director at the Siegfried Group (accounting firm, 2013-2016), and prior to Siegfried Group as audit senior manager at Deloitte & Touche (accounting firm, 2005-2013).
Renee Stagnone (1975)
Year of Election or Appointment: 2016
Assistant Treasurer
Ms. Stagnone also serves as an officer of other funds. Ms. Stagnone is an employee of Fidelity Investments (1997-present). Previously, Ms. Stagnone served as Deputy Treasurer of certain Fidelity® funds (2013-2016).
Shareholder Expense Example
As a shareholder of the Fund, you incur two types of costs: (1) transaction costs and (2) ongoing costs, including management fees and other Fund expenses. This Example is intended to help you understand your ongoing costs (in dollars) of investing in the Fund and to compare these costs with the ongoing costs of investing in other mutual funds.
The actual expense Example is based on an investment of $1,000 invested at the beginning of the period and held for the entire period (May 25, 2017 to October 31, 2017). The hypothetical expense Example is based on an investment of $1,000 invested for the one-half year period (May 1, 2017 to October 31, 2017).
Actual Expenses
The first line of the accompanying table provides information about actual account values and actual expenses. You may use the information in this line, together with the amount you invested, to estimate the expenses that you paid over the period. Simply divide your account value by $1,000.00 (for example, an $8,600 account value divided by $1,000.00 = 8.6), then multiply the result by the number in the first line under the heading entitled "Expenses Paid During Period" to estimate the expenses you paid on your account during this period. In addition, the Fund, as a shareholder in the underlying Fidelity Central Funds, will indirectly bear its pro-rata share of the fees and expenses incurred by the underlying Fidelity Central Funds. These fees and expenses are not included in the Fund's annualized expense ratio used to calculate the expense estimate in the table below.
Hypothetical Example for Comparison Purposes
The second line of the accompanying table provides information about hypothetical account values and hypothetical expenses based on the Fund's actual expense ratio and an assumed rate of return of 5% per year before expenses, which is not the Fund's actual return. The hypothetical account values and expenses may not be used to estimate the actual ending account balance or expenses you paid for the period. You may use this information to compare the ongoing costs of investing in the Fund and other funds. To do so, compare this 5% hypothetical example with the 5% hypothetical examples that appear in the shareholder reports of the other funds. In addition, the Fund, as a shareholder in the underlying Fidelity Central Funds, will indirectly bear its pro-rata share of the fees and expenses incurred by the underlying Fidelity Central Funds. These fees and expenses are not included in the Fund's annualized expense ratio used to calculate the expense estimate in the table below.
Please note that the expenses shown in the table are meant to highlight your ongoing costs only and do not reflect any transaction costs. Therefore, the second line of the table is useful in comparing ongoing costs only, and will not help you determine the relative total costs of owning different funds.
| | Annualized Expense RatioA | Beginning
Account Value | Ending
Account Value
October 31, 2017 | Expenses Paid
During Period |
| Actual | .60% | $1,000.00 | $1,065.00 | 2.72B |
| Hypothetical-C | | $1,000.00 | $1,022.18 | 3.06D |
A Annualized expense ratio reflects expenses net of applicable fee waivers.
B Actual expenses are equal to the Fund's annualized expense ratio, multiplied by the average account value over the period, multiplied by 160/365 (to reflect the period May 25, 2017 to October 31, 2017).
C 5% return per year before expenses
D Hypothetical expenses are equal to the Fund's annualized expense ratio, multiplied by the average account value over the period, multiplied by 184/365 (to reflect the one-half year period).
Distributions (Unaudited)
The Board of Trustees of Fidelity Diversified International K6 Fund voted to pay on December 11, 2017, to shareholders of record at the opening of business on December 8, 2017, a distribution of $0.005 per share derived from capital gains realized from sales of portfolio securities and a dividend of $0.016 per share from net investment income.
The fund will notify shareholders in January 2018 of amounts for use in preparing 2017 income tax returns.
Board Approval of Investment Advisory Contracts and Management Fees
Fidelity Diversified International K6 Fund
On January 18, 2017 the Board of Trustees, including the Independent Trustees (together, the Board), voted to approve the management contract with Fidelity Management & Research Company (FMR) and the sub-advisory agreements with affiliates of FMR (together, the Advisory Contracts) for the fund. The Board, assisted by the advice of fund counsel and Independent Trustees' counsel, considered a broad range of information.
Nature, Extent, and Quality of Services Provided. The Board considered Fidelity's staffing as it relates to the fund, including the backgrounds of investment personnel of Fidelity, and also considered the fund's investment objective, strategies, and related investment philosophy. The Board considered the structure of the investment personnel compensation program and whether this structure provides appropriate incentives to act in the best interests of the fund.
Resources Dedicated to Investment Management and Support Services. The Board and the Fund Oversight and Research Committees reviewed the general qualifications and capabilities of Fidelity's investment staff, including its size, education, experience, and resources, as well as Fidelity's approach to recruiting, training, managing, and compensating investment personnel. The Board noted that Fidelity has continued to increase the resources devoted to non-U.S. offices, including expansion of Fidelity's global investment organization. The Board also noted that Fidelity's analysts have extensive resources, tools and capabilities that allow them to conduct sophisticated quantitative and fundamental analysis, as well as credit analysis of issuers, counterparties and guarantors. Further, the Board considered that Fidelity's investment professionals have sufficient access to global information and data so as to provide competitive investment results over time, and that those professionals also have access to sophisticated tools that permit them to assess portfolio construction and risk and performance attribution characteristics continuously, as well as to transmit new information and research conclusions rapidly around the world. Additionally, in its deliberations, the Board considered Fidelity's trading, risk management, compliance, and technology and operationscapabilities and resources, which are integral parts of the investment management process.
Shareholder and Administrative Services. The Board considered the nature, extent, quality, and cost of advisory, administrative, and shareholder services to be performed by FMR, the sub-advisers (together with FMR, the Investment Advisers), and their affiliates under the Advisory Contracts and under separate agreements covering transfer agency, pricing and bookkeeping and securities lending services for the fund. The Board also considered the nature and extent of the supervision of third party service providers, principally custodians, subcustodians, and pricing vendors.
The Board noted that the growth of fund assets over time across the complex allows Fidelity to reinvest in the development of services designed to enhance the value or convenience of the Fidelity funds as investment vehicles. These services include 24-hour access to account information and market information through telephone representatives and over the Internet, investor education materials and asset allocation tools, and the expanded availability of Fidelity Investor Centers.
Investment Performance. The fund is a new fund and therefore had no historical performance for the Board to review at the time it approved the fund's Advisory Contracts. The Board considered the Investment Advisers' strength in fundamental, research-driven security selection, which the Board is familiar with through its supervision of other Fidelity funds, including funds with identical investment objectives as the the fund.
Based on its review, the Board concluded that the nature, extent, and quality of services to be provided to the fund under the Advisory Contracts should benefit the shareholders of the fund.
Competitiveness of Management Fee and Total Expense Ratio ..The Board considered the fund's proposed management fee out of which FMR will pay all operating expenses, with certain limited exceptions, and the projected total expense ratio of the fund in reviewing the Advisory Contracts. The Board noted that the fund's proposed management fee rate is lower than the median fee rate of funds with similar Lipper investment objective categories and comparable investment mandates, regardless of whether their management fee structures are comparable. The Board also considered that the projected total expense ratio of the fund is below the median of those funds and classes used by the Board for management fee comparisons that have a similar sales load structure.
Based on its review, the Board concluded that the fund's management fee and projected total expense ratio were reasonable in light of the services that the fund and its shareholders will receive and the other factors considered.
Costs of the Services and Profitability. The fund is a new fund and therefore no revenue, cost, or profitability data was available for the Board to review in respect of the fund at the time it approved the Advisory Contracts. In connection with its future renewal of the fund's Advisory Contracts, the Board will consider the revenues earned and the expenses incurred by Fidelity in conducting the business of developing, marketing, distributing, managing, administering and servicing the fund and servicing the fund's shareholders.
Economies of Scale. The Board will consider economies of scale when there is operating experience to permit assessment thereof. It noted that, notwithstanding the entrepreneurial risk associated with a new fund, the management fee was at a level normally associated, by comparison with competitors, with very high fund net assets, and Fidelity asserted to the Board that the level of the fee anticipated economies of scale at lower asset levels even before, if ever, economies of scale are achieved. The Board also noted that the fund and its shareholders would have access to the very considerable number and variety of services available through Fidelity and its affiliates.
Based on its evaluation of all of the conclusions noted above, and after considering all factors it believed relevant, the Board concluded that the advisory fee structures are fair and reasonable, and that the fund's Advisory Contracts should be approved.
Corporate Headquarters
245 Summer St.
Boston, MA 02210
www.fidelity.com
DIFK6-ANN-1217
1.9883987.100
Fidelity Advisor® International Small Cap Opportunities Fund - Class A, Class M (formerly Class T), Class C and Class I
Annual Report October 31, 2017 Class A, Class M, Class C and Class I are classes of Fidelity® International Small Cap Opportunities Fund |
|
Contents
To view a fund's proxy voting guidelines and proxy voting record for the 12-month period ended June 30, visit http://www.fidelity.com/proxyvotingresults or visit the Securities and Exchange Commission's (SEC) web site at http://www.sec.gov.
You may also call 1-877-208-0098 to request a free copy of the proxy voting guidelines.
Standard & Poor's, S&P and S&P 500 are registered service marks of The McGraw-Hill Companies, Inc. and have been licensed for use by Fidelity Distributors Corporation.
Other third-party marks appearing herein are the property of their respective owners.
All other marks appearing herein are registered or unregistered trademarks or service marks of FMR LLC or an affiliated company. © 2017 FMR LLC. All rights reserved.
This report and the financial statements contained herein are submitted for the general information of the shareholders of the Fund. This report is not authorized for distribution to prospective investors in the Fund unless preceded or accompanied by an effective prospectus.
A fund files its complete schedule of portfolio holdings with the SEC for the first and third quarters of each fiscal year on Form N-Q. Forms N-Q are available on the SEC’s web site at http://www.sec.gov. A fund's Forms N-Q may be reviewed and copied at the SEC’s Public Reference Room in Washington, DC. Information regarding the operation of the SEC's Public Reference Room may be obtained by calling 1-800-SEC-0330.
For a complete list of a fund's portfolio holdings, view the most recent holdings listing, semiannual report, or annual report on Fidelity's web site at http://www.fidelity.com, http://www.institutional.fidelity.com, or http://www.401k.com, as applicable.
NOT FDIC INSURED •MAY LOSE VALUE •NO BANK GUARANTEE
Neither the Fund nor Fidelity Distributors Corporation is a bank.
Performance: The Bottom Line
Average annual total return reflects the change in the value of an investment, assuming reinvestment of distributions from dividend income and capital gains (the profits earned upon the sale of securities that have grown in value, if any) and assuming a constant rate of performance each year. The hypothetical investment and the average annual total returns do not reflect the deduction of taxes that a shareholder would pay on fund distributions or the redemption of fund shares. During periods of reimbursement by Fidelity, a fund’s total return will be greater than it would be had the reimbursement not occurred. How a fund did yesterday is no guarantee of how it will do tomorrow.
Average Annual Total Returns
| For the periods ended October 31, 2017 | Past 1 year | Past 5 years | Past 10 years |
| Class A (incl. 5.75% sales charge) | 18.76% | 10.98% | 1.22% |
| Class M (incl. 3.50% sales charge) | 21.23% | 11.19% | 1.18% |
| Class C (incl. contingent deferred sales charge) | 24.02% | 11.43% | 1.05% |
| Class I | 26.34% | 12.62% | 2.10% |
Class C shares' contingent deferred sales charges included in the past one year, past five years and past ten years total return figures are 1%, 0% and 0%, respectively.
$10,000 Over 10 Years
Let's say hypothetically that $10,000 was invested in Fidelity Advisor® International Small Cap Opportunities Fund - Class A on October 31, 2007, and the current 5.75% sales charge was paid.
The chart shows how the value of your investment would have changed, and also shows how the MSCI EAFE Small Cap Index performed over the same period.
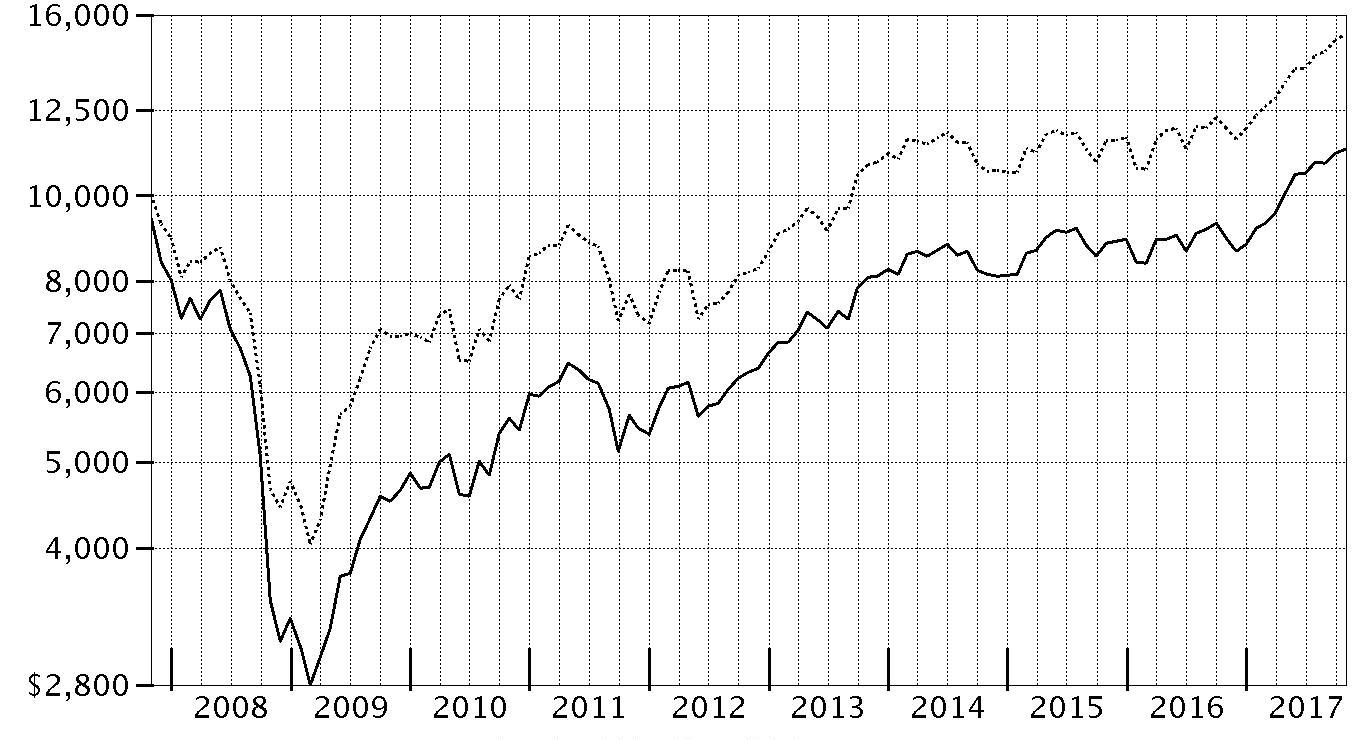
| Period Ending Values |
| $11,290 | Fidelity Advisor® International Small Cap Opportunities Fund - Class A |
| $15,217 | MSCI EAFE Small Cap Index |
Management's Discussion of Fund Performance
Market Recap: The MSCI ACWI (All Country World Index) ex USA Index returned 23.85% for the 12 months ending October 31, 2017, helped partly by a generally weak U.S. dollar. Some favorable election results in continental Europe (+30%) suggested ebbing political uncertainty and near-term risk there, but the U.K. (+20%) faced more-mixed conditions ahead of its expected exit from the European Union. Despite central-bank easing – and pressured recently by yen strength – Japan (+18%) lagged the rest of the Asia-Pacific group (+22%). Commodity-price volatility slowed Canada (+17%), but the emerging-markets group (+26%) sped ahead. Sector-wise, information technology (+47%) was driven by a surge among several Chinese internet-related names. Financials (+27%) rode rising interest rates that, at the same time, weighed on real estate (+17%), utilities (+16%), consumer staples (+14%) and telecom services (+9%) – so-called “bond proxy” sectors. Materials (+28%) and industrials (+27%) responded to demand from China and gains in certain commodity prices. In energy (+20%), oil prices lost ground in the spring before rebounding through October 31 to end well above where they started 12 months ago. Lastly, health care (+14%) was hurt by early-period turmoil around drug pricing and health care legislation.
Comments from Portfolio Manager Jed Weiss: For the fiscal year, the fund’s share classes (excluding sales charges, if applicable) rose about 25% to 26%, trailing the 27.70% return of the MSCI EAFE Small Cap Index. Versus the benchmark, picks in emerging markets, especially Korea, hurt fund performance the most. Stock picking in Germany also detracted. On the plus side, we benefited from stock selection in Japan and, to a lesser extent, Sweden and Italy. Among stocks, the fund’s biggest detractor was non-index Korean convenience-store operator BGF Retail, hurt by local minimum-wage hikes. Also detracting was an overweighting in RCG, an Australia-based shoe retailer. Other detractors included out-of-index SK Kaken, a Japan-based paint manufacturer, and Quintis, an Australian producer of sandalwood hit with financial difficulties. Conversely, our top contributor was an overweighting in Interpump Group, an Italian maker of specialty pumps whose share price more than doubled this period. Japan's semiconductor-equipment maker Lasertec and out-of-index light-fixture maker Fagerhult, based in Sweden, also added value.
The views expressed above reflect those of the portfolio manager(s) only through the end of the period as stated on the cover of this report and do not necessarily represent the views of Fidelity or any other person in the Fidelity organization. Any such views are subject to change at any time based upon market or other conditions and Fidelity disclaims any responsibility to update such views. These views may not be relied on as investment advice and, because investment decisions for a Fidelity fund are based on numerous factors, may not be relied on as an indication of trading intent on behalf of any Fidelity fund.
Note to shareholders: Portfolio Manager Jed Weiss returned from a five-month leave of absence on November 29, 2017. In his stead, Patrick Drouot and Patrick Buchanan served (and remain) as co-managers of the fund.
Investment Summary (Unaudited)
Geographic Diversification (% of fund's net assets)
| As of October 31, 2017 |
| | Japan | 32.9% |
| | United Kingdom | 15.6% |
| | United States of America* | 6.9% |
| | Germany | 6.2% |
| | Sweden | 4.9% |
| | Italy | 3.3% |
| | France | 3.2% |
| | Spain | 2.6% |
| | Netherlands | 2.2% |
| | Other | 22.2% |

* Includes Short-Term investments and Net Other Assets (Liabilities).
Percentages are based on country or territory of incorporation and are adjusted for the effect of futures contracts, if applicable.
| As of April 30, 2017 |
| | Japan | 30.4% |
| | United Kingdom | 18.8% |
| | Germany | 6.8% |
| | Sweden | 5.5% |
| | United States of America* | 5.4% |
| | Italy | 3.4% |
| | Australia | 2.5% |
| | Spain | 2.4% |
| | France | 2.4% |
| | Other | 22.4% |

* Includes Short-Term investments and Net Other Assets (Liabilities).
Percentages are based on country or territory of incorporation and are adjusted for the effect of futures contracts, if applicable.
Asset Allocation as of October 31, 2017
| | % of fund's net assets | % of fund's net assets 6 months ago |
| Stocks | 95.7 | 98.4 |
| Short-Term Investments and Net Other Assets (Liabilities) | 4.3 | 1.6 |
Top Ten Stocks as of October 31, 2017
| | % of fund's net assets | % of fund's net assets 6 months ago |
| Azbil Corp. (Japan, Electronic Equipment & Components) | 2.4 | 1.9 |
| Spirax-Sarco Engineering PLC (United Kingdom, Machinery) | 2.2 | 2.3 |
| Interpump Group SpA (Italy, Machinery) | 2.1 | 2.2 |
| Spectris PLC (United Kingdom, Electronic Equipment & Components) | 2.1 | 2.0 |
| CompuGroup Medical AG (Germany, Health Care Technology) | 2.0 | 2.1 |
| OBIC Co. Ltd. (Japan, IT Services) | 1.9 | 1.8 |
| Elis SA (France, Commercial Services & Supplies) | 1.9 | 0.9 |
| Nihon Parkerizing Co. Ltd. (Japan, Chemicals) | 1.8 | 1.6 |
| Sartorius AG (non-vtg.) (Germany, Health Care Equipment & Supplies) | 1.7 | 2.1 |
| USS Co. Ltd. (Japan, Specialty Retail) | 1.7 | 1.7 |
| | 19.8 | |
Top Market Sectors as of October 31, 2017
| | % of fund's net assets | % of fund's net assets 6 months ago |
| Industrials | 24.3 | 23.6 |
| Consumer Discretionary | 14.0 | 15.0 |
| Information Technology | 13.4 | 13.1 |
| Health Care | 12.4 | 13.4 |
| Consumer Staples | 9.3 | 10.0 |
| Materials | 7.6 | 8.5 |
| Real Estate | 6.9 | 7.3 |
| Financials | 5.9 | 5.7 |
| Energy | 1.9 | 1.8 |
Investments October 31, 2017
Showing Percentage of Net Assets
| Common Stocks - 94.0% | | | |
| | | Shares | Value |
| Australia - 2.2% | | | |
| Adelaide Brighton Ltd. | | 1,077,412 | $5,120,749 |
| Beacon Lighting Group Ltd. | | 2,681,235 | 2,996,041 |
| DuluxGroup Ltd. | | 1,736,117 | 9,792,793 |
| Imdex Ltd. (a) | | 3,940,102 | 2,925,090 |
| Quintis Ltd. (b)(c) | | 2,011,191 | 454,083 |
| RCG Corp. Ltd. (b) | | 6,206,097 | 3,562,377 |
|
| TOTAL AUSTRALIA | | | 24,851,133 |
|
| Austria - 1.6% | | | |
| Andritz AG | | 172,500 | 9,753,464 |
| BUWOG-Gemeinnuetzige Wohnung | | 318,874 | 9,196,864 |
|
| TOTAL AUSTRIA | | | 18,950,328 |
|
| Bailiwick of Jersey - 0.5% | | | |
| Integrated Diagnostics Holdings PLC | | 1,483,779 | 5,786,738 |
| Belgium - 1.3% | | | |
| KBC Ancora | | 257,848 | 15,378,137 |
| Bermuda - 0.5% | | | |
| Vostok New Ventures Ltd. (depositary receipt) (a) | | 701,789 | 5,784,217 |
| Canada - 1.6% | | | |
| McCoy Global, Inc. (a) | | 636,715 | 893,306 |
| New Look Vision Group, Inc. | | 207,200 | 5,521,693 |
| Pason Systems, Inc. | | 365,800 | 5,310,777 |
| PrairieSky Royalty Ltd. | | 107,800 | 2,869,430 |
| ShawCor Ltd. Class A | | 162,500 | 3,521,820 |
|
| TOTAL CANADA | | | 18,117,026 |
|
| Cayman Islands - 1.1% | | | |
| 58.com, Inc. ADR (a) | | 70,500 | 4,735,485 |
| China Biologic Products Holdings, Inc. | | 54,880 | 4,264,725 |
| Value Partners Group Ltd. | | 3,614,000 | 3,580,924 |
|
| TOTAL CAYMAN ISLANDS | | | 12,581,134 |
|
| Denmark - 2.1% | | | |
| Jyske Bank A/S (Reg.) | | 183,127 | 10,348,507 |
| Scandinavian Tobacco Group A/S | | 359,393 | 6,075,912 |
| Spar Nord Bank A/S | | 651,369 | 8,284,543 |
|
| TOTAL DENMARK | | | 24,708,962 |
|
| Finland - 0.7% | | | |
| Tikkurila Oyj | | 401,746 | 7,941,516 |
| France - 3.2% | | | |
| Elis SA | | 831,742 | 21,697,500 |
| Laurent-Perrier Group SA | | 51,163 | 4,798,172 |
| Vetoquinol SA | | 101,184 | 6,530,854 |
| Virbac SA (a) | | 32,652 | 4,204,734 |
|
| TOTAL FRANCE | | | 37,231,260 |
|
| Germany - 4.5% | | | |
| CompuGroup Medical AG | | 392,521 | 22,555,062 |
| CTS Eventim AG | | 360,354 | 14,884,631 |
| Fielmann AG | | 68,873 | 6,037,060 |
| Nexus AG | | 281,358 | 8,539,262 |
|
| TOTAL GERMANY | | | 52,016,015 |
|
| India - 0.6% | | | |
| Jyothy Laboratories Ltd. | | 1,189,354 | 7,226,129 |
| Ireland - 1.4% | | | |
| FBD Holdings PLC (a) | | 240,328 | 2,505,517 |
| James Hardie Industries PLC CDI | | 894,067 | 13,610,213 |
|
| TOTAL IRELAND | | | 16,115,730 |
|
| Isle of Man - 1.0% | | | |
| Playtech Ltd. | | 844,387 | 11,035,290 |
| Israel - 2.2% | | | |
| Azrieli Group | | 96,505 | 5,445,664 |
| Ituran Location & Control Ltd. | | 270,908 | 9,617,234 |
| Strauss Group Ltd. | | 483,344 | 9,841,893 |
|
| TOTAL ISRAEL | | | 24,904,791 |
|
| Italy - 3.3% | | | |
| Azimut Holding SpA | | 427,797 | 8,451,496 |
| Beni Stabili SpA SIIQ | | 6,607,875 | 5,849,859 |
| Interpump Group SpA | | 710,743 | 23,934,849 |
|
| TOTAL ITALY | | | 38,236,204 |
|
| Japan - 32.9% | | | |
| Ai Holdings Corp. | | 202,400 | 4,969,265 |
| Aoki Super Co. Ltd. | | 318,000 | 3,642,644 |
| Artnature, Inc. | | 535,800 | 3,520,028 |
| Asahi Co. Ltd. | | 345,700 | 4,202,351 |
| Aucnet, Inc. | | 37,500 | 495,917 |
| Azbil Corp. | | 621,200 | 27,125,806 |
| Broadleaf Co. Ltd. | | 287,300 | 2,358,782 |
| Central Automotive Products Ltd. | | 135,400 | 2,203,297 |
| Century21 Real Estate Japan Ltd. | | 66,500 | 800,670 |
| Coca-Cola West Co. Ltd. | | 175,275 | 6,132,758 |
| Daiichikosho Co. Ltd. | | 222,300 | 10,475,366 |
| Daikokutenbussan Co. Ltd. | | 174,500 | 7,944,428 |
| Funai Soken Holdings, Inc. | | 235,700 | 8,659,940 |
| GCA Savvian Group Corp. | | 555,461 | 5,084,340 |
| Goldcrest Co. Ltd. | | 534,130 | 11,572,133 |
| Iwatsuka Confectionary Co. Ltd. | | 21,400 | 953,303 |
| Kobayashi Pharmaceutical Co. Ltd. | | 217,900 | 12,599,200 |
| Koshidaka Holdings Co. Ltd. | | 195,200 | 7,896,186 |
| Kusuri No Aoki Holdings Co. Ltd. | | 132,800 | 7,370,264 |
| Lasertec Corp. | | 532,272 | 11,710,911 |
| Medikit Co. Ltd. | | 96,100 | 4,646,194 |
| Miroku Jyoho Service Co., Ltd. | | 164,800 | 3,848,690 |
| Misumi Group, Inc. | | 481,400 | 13,189,182 |
| Nabtesco Corp. | | 251,100 | 9,975,375 |
| Nagaileben Co. Ltd. | | 500,800 | 12,495,917 |
| Nakano Refrigerators Co. Ltd. | | 141,500 | 5,041,025 |
| ND Software Co. Ltd. | | 95,882 | 1,167,958 |
| Nihon Parkerizing Co. Ltd. | | 1,243,000 | 20,376,811 |
| NS Tool Co. Ltd. (b) | | 109,300 | 2,137,939 |
| OBIC Co. Ltd. | | 329,300 | 21,796,755 |
| OSG Corp. (b) | | 745,200 | 16,129,710 |
| Paramount Bed Holdings Co. Ltd. | | 257,200 | 11,342,304 |
| ProNexus, Inc. | | 472,400 | 5,732,939 |
| San-Ai Oil Co. Ltd. | | 766,200 | 9,151,124 |
| SHO-BOND Holdings Co. Ltd. | | 247,800 | 15,249,203 |
| Shoei Co. Ltd. | | 314,026 | 10,542,918 |
| SK Kaken Co. Ltd. | | 83,000 | 6,895,924 |
| Software Service, Inc. | | 67,000 | 3,086,679 |
| Techno Medica Co. Ltd. | | 80,791 | 1,404,451 |
| The Monogatari Corp. | | 84,300 | 6,211,303 |
| TKC Corp. | | 223,200 | 7,025,385 |
| Tocalo Co. Ltd. | | 117,000 | 4,721,178 |
| USS Co. Ltd. | | 966,500 | 19,537,614 |
| Welcia Holdings Co. Ltd. | | 172,500 | 6,546,758 |
| Workman Co. Ltd. | | 229,500 | 7,153,722 |
| Yamada Consulting Group Co. Ltd. | | 542,800 | 10,486,568 |
| Yamato Kogyo Co. Ltd. | | 113,000 | 3,022,643 |
|
| TOTAL JAPAN | | | 378,633,858 |
|
| Korea (South) - 1.7% | | | |
| BGFretail Co. Ltd. (c) | | 233,683 | 16,532,055 |
| Leeno Industrial, Inc. | | 63,110 | 2,889,957 |
|
| TOTAL KOREA (SOUTH) | | | 19,422,012 |
|
| Mexico - 0.3% | | | |
| Consorcio ARA S.A.B. de CV | | 9,564,478 | 3,382,433 |
| Netherlands - 2.2% | | | |
| Aalberts Industries NV | | 319,501 | 15,759,570 |
| Takeaway.com Holding BV (a)(d) | | 74,887 | 3,539,443 |
| VastNed Retail NV | | 129,002 | 5,647,071 |
|
| TOTAL NETHERLANDS | | | 24,946,084 |
|
| Norway - 0.9% | | | |
| Kongsberg Gruppen ASA (b) | | 331,100 | 6,039,900 |
| Skandiabanken ASA | | 436,200 | 4,419,142 |
|
| TOTAL NORWAY | | | 10,459,042 |
|
| Philippines - 0.5% | | | |
| Jollibee Food Corp. | | 1,309,740 | 6,322,034 |
| South Africa - 0.9% | | | |
| Clicks Group Ltd. | | 884,913 | 9,915,782 |
| Spain - 2.6% | | | |
| Hispania Activos Inmobiliarios SA | | 366,631 | 6,322,773 |
| Merlin Properties Socimi SA | | 545,300 | 7,196,733 |
| Prosegur Compania de Seguridad SA (Reg.) | | 2,217,090 | 16,915,881 |
|
| TOTAL SPAIN | | | 30,435,387 |
|
| Sweden - 4.9% | | | |
| Addlife AB | | 173,500 | 3,419,577 |
| AddTech AB (B Shares) | | 430,143 | 9,531,159 |
| Fagerhult AB | | 1,325,439 | 16,822,000 |
| Lagercrantz Group AB (B Shares) | | 684,707 | 7,279,201 |
| Loomis AB (B Shares) | | 216,200 | 8,674,703 |
| Saab AB (B Shares) | | 204,600 | 10,455,272 |
|
| TOTAL SWEDEN | | | 56,181,912 |
|
| Switzerland - 0.6% | | | |
| Tecan Group AG | | 34,420 | 7,279,727 |
| Taiwan - 0.5% | | | |
| Addcn Technology Co. Ltd. | | 588,435 | 5,330,239 |
| United Kingdom - 15.6% | | | |
| Alliance Pharma PLC | | 4,048,400 | 3,212,687 |
| Avon Rubber PLC | | 186,800 | 2,428,884 |
| Dechra Pharmaceuticals PLC | | 615,409 | 16,804,828 |
| DP Poland PLC (a) | | 7,057,200 | 3,936,669 |
| Elementis PLC | | 2,839,910 | 10,723,303 |
| Great Portland Estates PLC | | 1,103,789 | 9,111,174 |
| Hilton Food Group PLC (e) | | 312,888 | 3,706,815 |
| Howden Joinery Group PLC | | 1,999,300 | 10,889,674 |
| Informa PLC | | 1,684,956 | 15,597,984 |
| InterContinental Hotel Group PLC ADR | | 100,195 | 5,569,840 |
| ITE Group PLC | | 3,080,234 | 7,271,775 |
| Rightmove PLC | | 195,147 | 10,766,524 |
| Shaftesbury PLC | | 974,573 | 12,814,353 |
| Spectris PLC | | 697,778 | 23,724,899 |
| Spirax-Sarco Engineering PLC | | 331,991 | 24,912,762 |
| Topps Tiles PLC | | 3,398,615 | 3,148,425 |
| Ultra Electronics Holdings PLC | | 383,858 | 9,299,135 |
| Unite Group PLC | | 674,423 | 6,297,016 |
|
| TOTAL UNITED KINGDOM | | | 180,216,747 |
|
| United States of America - 2.6% | | | |
| Autoliv, Inc. (b) | | 52,200 | 6,517,692 |
| Martin Marietta Materials, Inc. | | 24,820 | 5,382,217 |
| Mohawk Industries, Inc. (a) | | 18,300 | 4,790,208 |
| PriceSmart, Inc. | | 84,074 | 7,045,401 |
| ResMed, Inc. | | 75,095 | 6,321,497 |
|
| TOTAL UNITED STATES OF AMERICA | | | 30,057,015 |
|
| TOTAL COMMON STOCKS | | | |
| (Cost $821,967,892) | | | 1,083,446,882 |
|
| Nonconvertible Preferred Stocks - 1.7% | | | |
| Germany - 1.7% | | | |
| Sartorius AG (non-vtg.) | | | |
| (Cost $8,387,461) | | 215,280 | 20,064,020 |
|
| Money Market Funds - 4.7% | | | |
| Fidelity Cash Central Fund, 1.10% (f) | | 47,164,769 | 47,174,202 |
| Fidelity Securities Lending Cash Central Fund 1.11% (f)(g) | | 6,505,865 | 6,506,516 |
| TOTAL MONEY MARKET FUNDS | | | |
| (Cost $53,681,365) | | | 53,680,718 |
| TOTAL INVESTMENT IN SECURITIES - 100.4% | | | |
| (Cost $884,036,718) | | | 1,157,191,620 |
| NET OTHER ASSETS (LIABILITIES) - (0.4)% | | | (5,137,743) |
| NET ASSETS - 100% | | | $1,152,053,877 |
Categorizations in the Schedule of Investments are based on country or territory of incorporation.
Legend
(a) Non-income producing
(b) Security or a portion of the security is on loan at period end.
(c) Level 3 security
(d) Security exempt from registration under Rule 144A of the Securities Act of 1933. These securities may be resold in transactions exempt from registration, normally to qualified institutional buyers. At the end of the period, the value of these securities amounted to $3,539,443 or 0.3% of net assets.
(e) Security or a portion of the security purchased on a delayed delivery or when-issued basis.
(f) Affiliated fund that is generally available only to investment companies and other accounts managed by Fidelity Investments. The rate quoted is the annualized seven-day yield of the fund at period end. A complete unaudited listing of the fund's holdings as of its most recent quarter end is available upon request. In addition, each Fidelity Central Fund's financial statements, which are not covered by the Fund's Report of Independent Registered Public Accounting Firm, are available on the SEC's website or upon request.
(g) Investment made with cash collateral received from securities on loan.
Affiliated Central Funds
Information regarding fiscal year to date income earned by the Fund from investments in Fidelity Central Funds is as follows:
| Fund | Income earned |
| Fidelity Cash Central Fund | $287,822 |
| Fidelity Securities Lending Cash Central Fund | 237,504 |
| Total | $525,326 |
Other Affiliated Issuers
An affiliated company is a company in which the Fund has ownership of at least 5% of the voting securities. Fiscal year to date transactions with companies which are or were affiliates are as follows:
| Affiliate | Value, beginning of period | Purchases | Sales Proceeds | Dividend Income | Realized Gain (loss) | Change in Unrealized appreciation (depreciation) | Value, end of period |
| DP Poland PLC | $5,450,276 | $64,233 | $907,568 | $-- | $599,349 | $(1,269,621) | $-- |
| Total | $5,450,276 | $64,233 | $907,568 | $-- | $599,349 | $(1,269,621) | $-- |
Investment Valuation
The following is a summary of the inputs used, as of October 31, 2017, involving the Fund's assets and liabilities carried at fair value. The inputs or methodology used for valuing securities may not be an indication of the risk associated with investing in those securities. For more information on valuation inputs, and their aggregation into the levels used below, please refer to the Investment Valuation section in the accompanying Notes to Financial Statements.
| | Valuation Inputs at Reporting Date: |
| Description | Total | Level 1 | Level 2 | Level 3 |
| Investments in Securities: | | | | |
| Equities: | | | | |
| Consumer Discretionary | $161,301,062 | $93,078,305 | $68,222,757 | $-- |
| Consumer Staples | 107,775,630 | 42,534,192 | 48,709,383 | 16,532,055 |
| Energy | 21,746,457 | 12,595,333 | 9,151,124 | -- |
| Financials | 69,912,735 | 64,828,395 | 5,084,340 | -- |
| Health Care | 143,127,214 | 108,983,711 | 34,143,503 | -- |
| Industrials | 278,437,812 | 187,114,753 | 91,323,059 | -- |
| Information Technology | 154,710,340 | 75,378,829 | 79,331,511 | -- |
| Materials | 86,245,342 | 55,495,881 | 30,295,378 | 454,083 |
| Real Estate | 80,254,310 | 67,881,507 | 12,372,803 | -- |
| Money Market Funds | 53,680,718 | 53,680,718 | -- | -- |
| Total Investments in Securities: | $1,157,191,620 | $761,571,624 | $378,633,858 | $16,986,138 |
The following is a summary of transfers between Level 1 and Level 2 for the period ended October 31, 2017. Transfers are assumed to have occurred at the beginning of the period, and are primarily attributable to the valuation techniques used for foreign equity securities, as discussed in the accompanying Notes to Financial Statements:
| Transfers | Total |
| Level 1 to Level 2 | $284,616,077 |
| Level 2 to Level 1 | $0 |
The following is a reconciliation of Investments in Securities for which Level 3 inputs were used in determining value:
| Investments in Securities: | |
| Equities - Consumer Staples | |
| Beginning Balance | $-- |
| Net Realized Gain (Loss) on Investment Securities | 283,385 |
| Net Unrealized Gain (Loss) on Investment Securities | (1,863,075) |
| Cost of Purchases | 3,666,809 |
| Proceeds of Sales | (467,198) |
| Amortization/Accretion | -- |
| Transfers into Level 3 | 14,912,134 |
| Transfers out of Level 3 | -- |
| Ending Balance | $16,532,055 |
| The change in unrealized gain (loss) for the period attributable to Level 3 securities held at October 31, 2017 | $(1,863,075) |
| Other Investments in Securities | |
| Beginning Balance | $-- |
| Net Realized Gain (Loss) on Investment Securities | (1,348,315) |
| Net Unrealized Gain (Loss) on Investment Securities | (1,479,124) |
| Cost of Purchases | 359,803 |
| Proceeds of Sales | (2,035,022) |
| Amortization/Accretion | -- |
| Transfers into Level 3 | 4,956,741 |
| Transfers out of Level 3 | -- |
| Ending Balance | $454,083 |
| The change in unrealized gain (loss) for the period attributable to Level 3 securities held at October 31, 2017 | $(1,479,124) |
The information used in the above reconciliation represents fiscal year to date activity for any Investments in Securities identified as using Level 3 inputs at either the beginning or the end of the current fiscal period. Transfers into Level 3 were attributable to a lack of observable market data resulting from decreases in market activity, decreases in liquidity, security restructurings or corporate actions. Transfers out of Level 3 were attributable to observable market data becoming available for those securities. Transfers in or out of Level 3 represent the beginning value of any Security or Instrument where a change in the pricing level occurred from the beginning to the end of the period. The cost of purchases and the proceeds of sales may include securities received or delivered through corporate actions or exchanges.
See accompanying notes which are an integral part of the financial statements.
Financial Statements
Statement of Assets and Liabilities
| | | October 31, 2017 |
| Assets | | |
Investment in securities, at value (including securities loaned of $6,241,794) — See accompanying schedule:
Unaffiliated issuers (cost $830,355,353) | $1,103,510,902 | |
| Fidelity Central Funds (cost $53,681,365) | 53,680,718 | |
| Total Investment in Securities (cost $884,036,718) | | $1,157,191,620 |
| Receivable for fund shares sold | | 1,581,653 |
| Dividends receivable | | 3,359,582 |
| Distributions receivable from Fidelity Central Funds | | 47,021 |
| Prepaid expenses | | 2,527 |
| Other receivables | | 10,690 |
| Total assets | | 1,162,193,093 |
| Liabilities | | |
| Payable for investments purchased | | |
| Regular delivery | $115 | |
| Delayed delivery | 333,025 | |
| Payable for fund shares redeemed | 2,215,893 | |
| Accrued management fee | 749,378 | |
| Distribution and service plan fees payable | 26,250 | |
| Other affiliated payables | 225,143 | |
| Other payables and accrued expenses | 83,023 | |
| Collateral on securities loaned | 6,506,389 | |
| Total liabilities | | 10,139,216 |
| Net Assets | | $1,152,053,877 |
| Net Assets consist of: | | |
| Paid in capital | | $873,874,359 |
| Undistributed net investment income | | 8,057,934 |
| Accumulated undistributed net realized gain (loss) on investments and foreign currency transactions | | (3,033,738) |
| Net unrealized appreciation (depreciation) on investments and assets and liabilities in foreign currencies | | 273,155,322 |
| Net Assets | | $1,152,053,877 |
| Calculation of Maximum Offering Price | | |
| Class A: | | |
| Net Asset Value and redemption price per share ($41,324,324 ÷ 2,237,463 shares) | | $18.47 |
| Maximum offering price per share (100/94.25 of $18.47) | | $19.60 |
| Class M: | | |
| Net Asset Value and redemption price per share ($14,422,181 ÷ 787,171 shares) | | $18.32 |
| Maximum offering price per share (100/96.50 of $18.32) | | $18.98 |
| Class C: | | |
| Net Asset Value and offering price per share ($14,547,484 ÷ 815,281 shares)(a) | | $17.84 |
| International Small Cap Opportunities: | | |
| Net Asset Value, offering price and redemption price per share ($916,881,772 ÷ 49,065,046 shares) | | $18.69 |
| Class I: | | |
| Net Asset Value, offering price and redemption price per share ($164,878,116 ÷ 8,834,439 shares) | | $18.66 |
(a) Redemption price per share is equal to net asset value less any applicable contingent deferred sales charge.
See accompanying notes which are an integral part of the financial statements.
Statement of Operations
| | | Year ended October 31, 2017 |
| Investment Income | | |
| Dividends | | $22,770,353 |
| Income from Fidelity Central Funds | | 525,326 |
| Income before foreign taxes withheld | | 23,295,679 |
| Less foreign taxes withheld | | (2,076,669) |
| Total income | | 21,219,010 |
| Expenses | | |
| Management fee | | |
| Basic fee | $8,769,277 | |
| Performance adjustment | 142,160 | |
| Transfer agent fees | 2,067,521 | |
| Distribution and service plan fees | 292,195 | |
| Accounting and security lending fees | 485,425 | |
| Custodian fees and expenses | 158,279 | |
| Independent trustees' fees and expenses | 4,093 | |
| Registration fees | 104,587 | |
| Audit | 79,821 | |
| Legal | 2,898 | |
| Interest | 2,066 | |
| Miscellaneous | 10,741 | |
| Total expenses before reductions | 12,119,063 | |
| Expense reductions | (31,942) | 12,087,121 |
| Net investment income (loss) | | 9,131,889 |
| Realized and Unrealized Gain (Loss) | | |
| Net realized gain (loss) on: | | |
| Investment securities: | | |
| Unaffiliated issuers | 40,931,692 | |
| Fidelity Central Funds | (1,551) | |
| Other affiliated issuers | 599,349 | |
| Foreign currency transactions | 31,689 | |
| Total net realized gain (loss) | | 41,561,179 |
| Change in net unrealized appreciation (depreciation) on: | | |
| Investment securities: | | |
| Unaffiliated issuers | 188,565,869 | |
| Fidelity Central Funds | (1,672) | |
| Other affiliated issuers | (1,269,621) | |
| Assets and liabilities in foreign currencies | 126,415 | |
| Total change in net unrealized appreciation (depreciation) | | 187,420,991 |
| Net gain (loss) | | 228,982,170 |
| Net increase (decrease) in net assets resulting from operations | | $238,114,059 |
See accompanying notes which are an integral part of the financial statements.
Statement of Changes in Net Assets
| | Year ended October 31, 2017 | Year ended October 31, 2016 |
| Increase (Decrease) in Net Assets | | |
| Operations | | |
| Net investment income (loss) | $9,131,889 | $9,502,103 |
| Net realized gain (loss) | 41,561,179 | 53,842,316 |
| Change in net unrealized appreciation (depreciation) | 187,420,991 | (43,765,071) |
| Net increase (decrease) in net assets resulting from operations | 238,114,059 | 19,579,348 |
| Distributions to shareholders from net investment income | (10,624,038) | (4,852,691) |
| Distributions to shareholders from net realized gain | (2,566,511) | (4,655,673) |
| Total distributions | (13,190,549) | (9,508,364) |
| Share transactions - net increase (decrease) | (108,646,188) | 68,430,907 |
| Redemption fees | 188,947 | 241,368 |
| Total increase (decrease) in net assets | 116,466,269 | 78,743,259 |
| Net Assets | | |
| Beginning of period | 1,035,587,608 | 956,844,349 |
| End of period | $1,152,053,877 | $1,035,587,608 |
| Other Information | | |
| Undistributed net investment income end of period | $8,057,934 | $9,497,402 |
See accompanying notes which are an integral part of the financial statements.
Financial Highlights
Fidelity International Small Cap Opportunities Fund Class A
| Years ended October 31, | 2017 | 2016 | 2015 | 2014 | 2013 |
| Selected Per–Share Data | | | | | |
| Net asset value, beginning of period | $14.82 | $14.75 | $13.65 | $13.68 | $10.78 |
| Income from Investment Operations | | | | | |
| Net investment income (loss)A | .10 | .09 | .06 | .05 | .07 |
| Net realized and unrealized gain (loss) | 3.71 | .10 | 1.11 | .05 | 2.91 |
| Total from investment operations | 3.81 | .19 | 1.17 | .10 | 2.98 |
| Distributions from net investment income | (.12) | (.05) | (.05) | (.06) | (.08) |
| Distributions from net realized gain | (.04) | (.07) | (.02) | (.08) | (.01) |
| Total distributions | (.16) | (.12) | (.07) | (.13)B | (.08)C |
| Redemption fees added to paid in capitalA,D | – | – | – | – | – |
| Net asset value, end of period | $18.47 | $14.82 | $14.75 | $13.65�� | $13.68 |
| Total ReturnE,F | 26.00% | 1.30% | 8.62% | .78% | 27.85% |
| Ratios to Average Net AssetsG,H | | | | | |
| Expenses before reductions | 1.43% | 1.45% | 1.52% | 1.63% | 1.70% |
| Expenses net of fee waivers, if any | 1.43% | 1.45% | 1.52% | 1.63% | 1.65% |
| Expenses net of all reductions | 1.43% | 1.45% | 1.51% | 1.63% | 1.64% |
| Net investment income (loss) | .61% | .62% | .38% | .33% | .59% |
| Supplemental Data | | | | | |
| Net assets, end of period (000 omitted) | $41,324 | $45,151 | $42,289 | $25,041 | $22,052 |
| Portfolio turnover rateI | 11% | 24% | 21% | 18% | 31% |
A Calculated based on average shares outstanding during the period.
B Total distributions of $.13 per share is comprised of distributions from net investment income of $.055 and distributions from net realized gain of $.079 per share.
C Total distributions of $.08 per share is comprised of distributions from net investment income of $.077 and distributions from net realized gain of $.005 per share.
D Amount represents less than $.005 per share.
E Total returns would have been lower if certain expenses had not been reduced during the applicable periods shown.
F Total returns do not include the effect of the sales charges.
G Fees and expenses of any underlying Fidelity Central Funds are not included in the Fund's expense ratio. The Fund indirectly bears its proportionate share of the expenses of any underlying Fidelity Central Funds.
H Expense ratios reflect operating expenses of the class. Expenses before reductions do not reflect amounts reimbursed by the investment adviser or reductions from brokerage service arrangements or reductions from other expense offset arrangements and do not represent the amount paid by the class during periods when reimbursements or reductions occur. Expenses net of fee waivers reflect expenses after reimbursement by the investment adviser but prior to reductions from brokerage service arrangements or other expense offset arrangements. Expenses net of all reductions represent the net expenses paid by the class.
I Amount does not include the portfolio activity of any underlying Fidelity Central Funds.
See accompanying notes which are an integral part of the financial statements.
Fidelity International Small Cap Opportunities Fund Class M
| Years ended October 31, | 2017 | 2016 | 2015 | 2014 | 2013 |
| Selected Per–Share Data | | | | | |
| Net asset value, beginning of period | $14.68 | $14.62 | $13.53 | $13.56 | $10.69 |
| Income from Investment Operations | | | | | |
| Net investment income (loss)A | .05 | .04 | .01 | .01 | .04 |
| Net realized and unrealized gain (loss) | 3.69 | .10 | 1.11 | .06 | 2.89 |
| Total from investment operations | 3.74 | .14 | 1.12 | .07 | 2.93 |
| Distributions from net investment income | (.06) | (.01) | (.01) | (.02) | (.05) |
| Distributions from net realized gain | (.04) | (.07) | (.02) | (.08) | (.01) |
| Total distributions | (.10) | (.08) | (.03) | (.10) | (.06) |
| Redemption fees added to paid in capitalA,B | – | – | – | – | – |
| Net asset value, end of period | $18.32 | $14.68 | $14.62 | $13.53 | $13.56 |
| Total ReturnC,D | 25.63% | .95% | 8.27% | .55% | 27.53% |
| Ratios to Average Net AssetsE,F | | | | | |
| Expenses before reductions | 1.73% | 1.77% | 1.80% | 1.89% | 1.96% |
| Expenses net of fee waivers, if any | 1.73% | 1.77% | 1.80% | 1.89% | 1.90% |
| Expenses net of all reductions | 1.73% | 1.77% | 1.80% | 1.89% | 1.89% |
| Net investment income (loss) | .31% | .30% | .10% | .07% | .34% |
| Supplemental Data | | | | | |
| Net assets, end of period (000 omitted) | $14,422 | $12,308 | $13,296 | $9,913 | $9,634 |
| Portfolio turnover rateG | 11% | 24% | 21% | 18% | 31% |
A Calculated based on average shares outstanding during the period.
B Amount represents less than $.005 per share.
C Total returns would have been lower if certain expenses had not been reduced during the applicable periods shown.
D Total returns do not include the effect of the sales charges.
E Fees and expenses of any underlying Fidelity Central Funds are not included in the Fund's expense ratio. The Fund indirectly bears its proportionate share of the expenses of any underlying Fidelity Central Funds.
F Expense ratios reflect operating expenses of the class. Expenses before reductions do not reflect amounts reimbursed by the investment adviser or reductions from brokerage service arrangements or reductions from other expense offset arrangements and do not represent the amount paid by the class during periods when reimbursements or reductions occur. Expenses net of fee waivers reflect expenses after reimbursement by the investment adviser but prior to reductions from brokerage service arrangements or other expense offset arrangements. Expenses net of all reductions represent the net expenses paid by the class.
G Amount does not include the portfolio activity of any underlying Fidelity Central Funds.
See accompanying notes which are an integral part of the financial statements.
Fidelity International Small Cap Opportunities Fund Class C
| Years ended October 31, | 2017 | 2016 | 2015 | 2014 | 2013 |
| Selected Per–Share Data | | | | | |
| Net asset value, beginning of period | $14.27 | $14.26 | $13.23 | $13.28 | $10.48 |
| Income from Investment Operations | | | | | |
| Net investment income (loss)A | (.03) | (.03) | (.05) | (.06) | (.02) |
| Net realized and unrealized gain (loss) | 3.60 | .09 | 1.08 | .06 | 2.84 |
| Total from investment operations | 3.57 | .06 | 1.03 | – | 2.82 |
| Distributions from net investment income | – | – | – | – | (.01) |
| Distributions from net realized gain | – | (.05) | – | (.05) | (.01) |
| Total distributions | – | (.05) | – | (.05) | (.02) |
| Redemption fees added to paid in capitalA,B | – | – | – | – | – |
| Net asset value, end of period | $17.84 | $14.27 | $14.26 | $13.23 | $13.28 |
| Total ReturnC,D | 25.02% | .44% | 7.79% | .03% | 26.91% |
| Ratios to Average Net AssetsE,F | | | | | |
| Expenses before reductions | 2.22% | 2.26% | 2.27% | 2.38% | 2.45% |
| Expenses net of fee waivers, if any | 2.22% | 2.26% | 2.27% | 2.38% | 2.40% |
| Expenses net of all reductions | 2.21% | 2.25% | 2.26% | 2.38% | 2.39% |
| Net investment income (loss) | (.17)% | (.19)% | (.36)% | (.42)% | (.16)% |
| Supplemental Data | | | | | |
| Net assets, end of period (000 omitted) | $14,547 | $12,625 | $17,370 | $8,438 | $8,070 |
| Portfolio turnover rateG | 11% | 24% | 21% | 18% | 31% |
A Calculated based on average shares outstanding during the period.
B Amount represents less than $.005 per share.
C Total returns would have been lower if certain expenses had not been reduced during the applicable periods shown.
D Total returns do not include the effect of the contingent deferred sales charge.
E Fees and expenses of any underlying Fidelity Central Funds are not included in the Fund's expense ratio. The Fund indirectly bears its proportionate share of the expenses of any underlying Fidelity Central Funds.
F Expense ratios reflect operating expenses of the class. Expenses before reductions do not reflect amounts reimbursed by the investment adviser or reductions from brokerage service arrangements or reductions from other expense offset arrangements and do not represent the amount paid by the class during periods when reimbursements or reductions occur. Expenses net of fee waivers reflect expenses after reimbursement by the investment adviser but prior to reductions from brokerage service arrangements or other expense offset arrangements. Expenses net of all reductions represent the net expenses paid by the class.
G Amount does not include the portfolio activity of any underlying Fidelity Central Funds.
See accompanying notes which are an integral part of the financial statements.
Fidelity International Small Cap Opportunities Fund
| Years ended October 31, | 2017 | 2016 | 2015 | 2014 | 2013 |
| Selected Per–Share Data | | | | | |
| Net asset value, beginning of period | $15.00 | $14.91 | $13.80 | $13.82 | $10.88 |
| Income from Investment Operations | | | | | |
| Net investment income (loss)A | .15 | .13 | .10 | .09 | .10 |
| Net realized and unrealized gain (loss) | 3.75 | .11 | 1.12 | .06 | 2.95 |
| Total from investment operations | 3.90 | .24 | 1.22 | .15 | 3.05 |
| Distributions from net investment income | (.17) | (.08) | (.09) | (.09) | (.10) |
| Distributions from net realized gain | (.04) | (.07) | (.02) | (.08) | (.01) |
| Total distributions | (.21) | (.15) | (.11) | (.17) | (.11) |
| Redemption fees added to paid in capitalA,B | – | – | – | – | – |
| Net asset value, end of period | $18.69 | $15.00 | $14.91 | $13.80 | $13.82 |
| Total ReturnC | 26.39% | 1.58% | 8.92% | 1.11% | 28.24% |
| Ratios to Average Net AssetsD,E | | | | | |
| Expenses before reductions | 1.13% | 1.17% | 1.23% | 1.30% | 1.39% |
| Expenses net of fee waivers, if any | 1.13% | 1.17% | 1.22% | 1.30% | 1.39% |
| Expenses net of all reductions | 1.13% | 1.16% | 1.22% | 1.30% | 1.38% |
| Net investment income (loss) | .91% | .90% | .68% | .65% | .85% |
| Supplemental Data | | | | | |
| Net assets, end of period (000 omitted) | $916,882 | $809,952 | $762,563 | $584,253 | $518,121 |
| Portfolio turnover rateF | 11% | 24% | 21% | 18% | 31% |
A Calculated based on average shares outstanding during the period.
B Amount represents less than $.005 per share.
C Total returns would have been lower if certain expenses had not been reduced during the applicable periods shown.
D Fees and expenses of any underlying Fidelity Central Funds are not included in the Fund's expense ratio. The Fund indirectly bears its proportionate share of the expenses of any underlying Fidelity Central Funds.
E Expense ratios reflect operating expenses of the class. Expenses before reductions do not reflect amounts reimbursed by the investment adviser or reductions from brokerage service arrangements or reductions from other expense offset arrangements and do not represent the amount paid by the class during periods when reimbursements or reductions occur. Expenses net of fee waivers reflect expenses after reimbursement by the investment adviser but prior to reductions from brokerage service arrangements or other expense offset arrangements. Expenses net of all reductions represent the net expenses paid by the class.
F Amount does not include the portfolio activity of any underlying Fidelity Central Funds.
See accompanying notes which are an integral part of the financial statements.
Fidelity International Small Cap Opportunities Fund Class I
| Years ended October 31, | 2017 | 2016 | 2015 | 2014 | 2013 |
| Selected Per–Share Data | | | | | |
| Net asset value, beginning of period | $14.99 | $14.91 | $13.81 | $13.83 | $10.90 |
| Income from Investment Operations | | | | | |
| Net investment income (loss)A | .15 | .13 | .10 | .08 | .11 |
| Net realized and unrealized gain (loss) | 3.74 | .10 | 1.13 | .07 | 2.93 |
| Total from investment operations | 3.89 | .23 | 1.23 | .15 | 3.04 |
| Distributions from net investment income | (.18) | (.08) | (.11) | (.09) | (.10) |
| Distributions from net realized gain | (.04) | (.07) | (.02) | (.08) | (.01) |
| Total distributions | (.22) | (.15) | (.13) | (.17) | (.11) |
| Redemption fees added to paid in capitalA,B | – | – | – | – | – |
| Net asset value, end of period | $18.66 | $14.99 | $14.91 | $13.81 | $13.83 |
| Total ReturnC | 26.34% | 1.56% | 8.98% | 1.11% | 28.11% |
| Ratios to Average Net AssetsD,E | | | | | |
| Expenses before reductions | 1.14% | 1.16% | 1.19% | 1.36% | 1.38% |
| Expenses net of fee waivers, if any | 1.14% | 1.16% | 1.19% | 1.36% | 1.37% |
| Expenses net of all reductions | 1.14% | 1.16% | 1.18% | 1.36% | 1.37% |
| Net investment income (loss) | .90% | .91% | .71% | .60% | .87% |
| Supplemental Data | | | | | |
| Net assets, end of period (000 omitted) | $164,878 | $155,551 | $120,723 | $29,822 | $5,670 |
| Portfolio turnover rateF | 11% | 24% | 21% | 18% | 31% |
A Calculated based on average shares outstanding during the period.
B Amount represents less than $.005 per share.
C Total returns would have been lower if certain expenses had not been reduced during the applicable periods shown.
D Fees and expenses of any underlying Fidelity Central Funds are not included in the Fund's expense ratio. The Fund indirectly bears its proportionate share of the expenses of any underlying Fidelity Central Funds.
E Expense ratios reflect operating expenses of the class. Expenses before reductions do not reflect amounts reimbursed by the investment adviser or reductions from brokerage service arrangements or reductions from other expense offset arrangements and do not represent the amount paid by the class during periods when reimbursements or reductions occur. Expenses net of fee waivers reflect expenses after reimbursement by the investment adviser but prior to reductions from brokerage service arrangements or other expense offset arrangements. Expenses net of all reductions represent the net expenses paid by the class.
F Amount does not include the portfolio activity of any underlying Fidelity Central Funds.
See accompanying notes which are an integral part of the financial statements.
Notes to Financial Statements
For the period ended October 31, 2017
1. Organization.
Fidelity International Small Cap Opportunities Fund (the Fund) is a fund of Fidelity Investment Trust (the Trust) and is authorized to issue an unlimited number of shares. The Trust is registered under the Investment Company Act of 1940, as amended (the 1940 Act), as an open-end management investment company organized as a Massachusetts business trust. The Fund offers Class A, Class M (formerly Class T), Class C, International Small Cap Opportunities and Class I, each of which has equal rights as to assets and voting privileges. Each class has exclusive voting rights with respect to matters that affect that class.
After the close of business on June 24, 2016, all outstanding Class B shares were converted to Class A shares. All prior fiscal period dollar and share amounts for Class B presented in the Notes to Financial Statements are for the period November 1, 2015 through June 24, 2016.
2. Investments in Fidelity Central Funds.
The Fund invests in Fidelity Central Funds, which are open-end investment companies generally available only to other investment companies and accounts managed by the investment adviser and its affiliates. The Fund's Schedule of Investments lists each of the Fidelity Central Funds held as of period end, if any, as an investment of the Fund, but does not include the underlying holdings of each Fidelity Central Fund. As an Investing Fund, the Fund indirectly bears its proportionate share of the expenses of the underlying Fidelity Central Funds.
The Money Market Central Funds seek preservation of capital and current income and are managed by Fidelity Investments Money Management, Inc. (FIMM), an affiliate of the investment adviser. Annualized expenses of the Money Market Central Funds as of their most recent shareholder report date are less than .005%.
A complete unaudited list of holdings for each Fidelity Central Fund is available upon request or at the Securities and Exchange Commission (the SEC) website at www.sec.gov. In addition, the financial statements of the Fidelity Central Funds, which are not covered by the Fund's Report of Independent Registered Public Accounting Firm, are available on the SEC website or upon request.
3. Significant Accounting Policies.
The Fund is an investment company and applies the accounting and reporting guidance of the Financial Accounting Standards Board (FASB) Accounting Standards Codification Topic 946 Financial Services – Investments Companies. The financial statements have been prepared in conformity with accounting principles generally accepted in the United States of America (GAAP), which require management to make certain estimates and assumptions at the date of the financial statements. Actual results could differ from those estimates. Subsequent events, if any, through the date that the financial statements were issued have been evaluated in the preparation of the financial statements. The following summarizes the significant accounting policies of the Fund:
Investment Valuation. Investments are valued as of 4:00 p.m. Eastern time on the last calendar day of the period. The Board of Trustees (the Board) has delegated the day to day responsibility for the valuation of the Fund's investments to the Fair Value Committee (the Committee) established by the Fund's investment adviser. In accordance with valuation policies and procedures approved by the Board, the Fund attempts to obtain prices from one or more third party pricing vendors or brokers to value its investments. When current market prices, quotations or currency exchange rates are not readily available or reliable, investments will be fair valued in good faith by the Committee, in accordance with procedures adopted by the Board. Factors used in determining fair value vary by investment type and may include market or investment specific events. The frequency with which these procedures are used cannot be predicted and they may be utilized to a significant extent. The Committee oversees the Fund's valuation policies and procedures and reports to the Board on the Committee's activities and fair value determinations. The Board monitors the appropriateness of the procedures used in valuing the Fund's investments and ratifies the fair value determinations of the Committee.
The Fund categorizes the inputs to valuation techniques used to value its investments into a disclosure hierarchy consisting of three levels as shown below:
- Level 1 – quoted prices in active markets for identical investments
- Level 2 – other significant observable inputs (including quoted prices for similar investments, interest rates, prepayment speeds, etc.)
- Level 3 – unobservable inputs (including the Fund's own assumptions based on the best information available)
Valuation techniques used to value the Fund's investments by major category are as follows:
Equity securities, including restricted securities, for which market quotations are readily available, are valued at the last reported sale price or official closing price as reported by a third party pricing vendor on the primary market or exchange on which they are traded and are categorized as Level 1 in the hierarchy. In the event there were no sales during the day or closing prices are not available, securities are valued at the last quoted bid price or may be valued using the last available price and are generally categorized as Level 2 in the hierarchy. For foreign equity securities, when market or security specific events arise, comparisons to the valuation of American Depositary Receipts (ADRs), futures contracts, Exchange-Traded Funds (ETFs) and certain indexes as well as quoted prices for similar securities may be used and would be categorized as Level 2 in the hierarchy. Utilizing these techniques may result in transfers between Level 1 and Level 2. For equity securities, including restricted securities, where observable inputs are limited, assumptions about market activity and risk are used and these securities may be categorized as Level 3 in the hierarchy.
Investments in open-end mutual funds, including the Fidelity Central Funds, are valued at their closing net asset value (NAV) each business day and are categorized as Level 1 in the hierarchy.
The following provides information on Level 3 securities held by the Fund that were valued at period end based on unobservable inputs. These amounts exclude valuations provided by a broker.
| Asset Type | Fair Value | Valuation Technique(s) | Unobservable Input | Amount or Range/Weighted Average | Impact to Valuation from an Increase in Input(a) |
| Equities | 16,986,138 | Market approach | Transaction price | $0.23-$70.75 / $68.86 | Increase |
(a) Represents the expected directional change in the fair value of the Level 3 investments that would result from an increase in the corresponding input. A decrease to the unobservable input would have the opposite effect. Significant changes in these inputs could result in significantly higher or lower fair value measurements.
Changes in valuation techniques may result in transfers in or out of an assigned level within the disclosure hierarchy. The aggregate value of investments by input level as of October 31, 2017, including information on transfers between Levels 1 and 2, as well as a roll forward of Level 3 investments, is included at the end of the Fund's Schedule of Investments.
Foreign Currency. The Fund may use foreign currency contracts to facilitate transactions in foreign-denominated securities. Gains and losses from these transactions may arise from changes in the value of the foreign currency or if the counterparties do not perform under the contracts' terms.
Foreign-denominated assets, including investment securities, and liabilities are translated into U.S. dollars at the exchange rates at period end. Purchases and sales of investment securities, income and dividends received and expenses denominated in foreign currencies are translated into U.S. dollars at the exchange rate in effect on the transaction date.
The effects of exchange rate fluctuations on investments are included with the net realized and unrealized gain (loss) on investment securities. Other foreign currency transactions resulting in realized and unrealized gain (loss) are disclosed separately.
Investment Transactions and Income. For financial reporting purposes, the Fund's investment holdings and NAV include trades executed through the end of the last business day of the period. The NAV per share for processing shareholder transactions is calculated as of the close of business of the New York Stock Exchange (NYSE), normally 4:00 p.m. Eastern time and includes trades executed through the end of the prior business day. Gains and losses on securities sold are determined on the basis of identified cost. Dividend income is recorded on the ex-dividend date, except for certain dividends from foreign securities where the ex-dividend date may have passed, which are recorded as soon as the Fund is informed of the ex-dividend date. Non-cash dividends included in dividend income, if any, are recorded at the fair market value of the securities received. Income and capital gain distributions from Fidelity Central Funds, if any, are recorded on the ex-dividend date. Certain distributions received by the Fund represent a return of capital or capital gain. The Fund determines the components of these distributions subsequent to the ex-dividend date, based upon receipt of tax filings or other correspondence relating to the underlying investment. These distributions are recorded as a reduction of cost of investments and/or as a realized gain. Investment income is recorded net of foreign taxes withheld where recovery of such taxes is uncertain.
Class Allocations and Expenses. Investment income, realized and unrealized capital gains and losses, common expenses of the Fund, and certain fund-level expense reductions, if any, are allocated daily on a pro-rata basis to each class based on the relative net assets of each class to the total net assets of the Fund. Each class differs with respect to transfer agent and distribution and service plan fees incurred. Certain expense reductions may also differ by class. For the reporting period, the allocated portion of income and expenses to each class as a percent of its average net assets may vary due to the timing of recording these transactions in relation to fluctuating net assets of the classes. Expenses directly attributable to a fund are charged to that fund. Expenses attributable to more than one fund are allocated among the respective funds on the basis of relative net assets or other appropriate methods. Expense estimates are accrued in the period to which they relate and adjustments are made when actual amounts are known.
Income Tax Information and Distributions to Shareholders. Each year, the Fund intends to qualify as a regulated investment company under Subchapter M of the Internal Revenue Code, including distributing substantially all of its taxable income and realized gains. As a result, no provision for U.S. Federal income taxes is required. As of October 31, 2017, the Fund did not have any unrecognized tax benefits in the financial statements; nor is the Fund aware of any tax positions for which it is reasonably possible that the total amounts of unrecognized tax benefits will significantly change in the next twelve months. The Fund files a U.S. federal tax return, in addition to state and local tax returns as required. The Fund's federal income tax returns are subject to examination by the Internal Revenue Service (IRS) for a period of three fiscal years after they are filed. State and local tax returns may be subject to examination for an additional fiscal year depending on the jurisdiction. Foreign taxes are provided for based on the Fund's understanding of the tax rules and rates that exist in the foreign markets in which it invests.
Distributions are declared and recorded on the ex-dividend date. Income dividends and capital gain distributions are declared separately for each class. Income and capital gain distributions are determined in accordance with income tax regulations, which may differ from GAAP.
Capital accounts within the financial statements are adjusted for permanent book-tax differences. These adjustments have no impact on net assets or the results of operations. Capital accounts are not adjusted for temporary book-tax differences which will reverse in a subsequent period.
Book-tax differences are primarily due to foreign currency transactions, passive foreign investments companies (PFIC), capital loss carryforwards and losses deferred due to wash sales.
As of period end, the cost and unrealized appreciation (depreciation) in securities, and derivatives if applicable, for federal income tax purposes were as follows:
| Gross unrealized appreciation | $301,414,773 |
| Gross unrealized depreciation | (45,831,951) |
| Net unrealized appreciation (depreciation) | $255,582,822 |
| Tax Cost | $901,608,798 |
The tax-based components of distributable earnings as of period end were as follows:
| Undistributed ordinary income | $22,598,255 |
| Net unrealized appreciation (depreciation) on securities and other investments | $255,581,263 |
The tax character of distributions paid was as follows:
| | October 31, 2017 | October 31, 2016 |
| Ordinary Income | $13,190,549 | $ 9,508,364 |
Short-Term Trading (Redemption) Fees. Shares purchased by investors and held in the Fund less than 90 days may be subject to a redemption fee equal to 2.00% of the NAV of shares redeemed. All redemption fees, which reduce the proceeds of the shareholder redemption, are retained by the Fund and accounted for as an addition to paid in capital. In November 2017, the Board of Trustees approved the elimination of these redemption fees effective December 18, 2017.
Delayed Delivery Transactions and When-Issued Securities. During the period, the Fund transacted in securities on a delayed delivery or when-issued basis. Payment and delivery may take place after the customary settlement period for that security. The price of the underlying securities and the date when the securities will be delivered and paid for are fixed at the time the transaction is negotiated. The securities purchased on a delayed delivery or when-issued basis are identified as such in the Fund's Schedule of Investments. With respect to purchase commitments, the Fund identifies securities as segregated in its records with a value at least equal to the amount of the commitment. Losses may arise due to changes in the value of the underlying securities or if the counterparty does not perform under the contract's terms, or if the issuer does not issue the securities due to political, economic, or other factors.
Restricted Securities. The Fund may invest in securities that are subject to legal or contractual restrictions on resale. These securities generally may be resold in transactions exempt from registration or to the public if the securities are registered. Disposal of these securities may involve time-consuming negotiations and expense, and prompt sale at an acceptable price may be difficult. Information regarding restricted securities is included at the end of the Fund's Schedule of Investments.
4. Purchases and Sales of Investments.
Purchases and sales of securities, other than short-term securities, aggregated $114,512,335 and $258,712,685, respectively.
5. Fees and Other Transactions with Affiliates.
Management Fee. Fidelity Management & Research Company (the investment adviser) and its affiliates provide the Fund with investment management related services for which the Fund pays a monthly management fee. The management fee is the sum of an individual fund fee rate that is based on an annual rate of .60% of the Fund's average net assets and an annualized group fee rate that averaged .25% during the period. The group fee rate is based upon the average net assets of all the mutual funds advised by the investment adviser, including any mutual funds previously advised by the investment adviser that are currently advised by Fidelity SelectCo, LLC, an affiliate of the investment adviser. The group fee rate decreases as assets under management increase and increases as assets under management decrease. In addition, the management fee is subject to a performance adjustment (up to a maximum of +/- .20% of the Fund's average net assets over a 36 month performance period). The upward or downward adjustment to the management fee is based on the relative investment performance of International Small Cap Opportunities as compared to its benchmark index, the MSCI EAFE Small Cap Index, over the same 36 month performance period. For the reporting period, the total annual management fee rate, including the performance adjustment, was .86% of the Fund's average net assets. The performance adjustment included in the management fee rate may be higher or lower than the maximum performance adjustment rate due to the difference between the average net assets for the reporting and performance periods.
Distribution and Service Plan Fees. In accordance with Rule 12b-1 of the 1940 Act, the Fund has adopted separate Distribution and Service Plans for each class of shares. Certain classes pay Fidelity Distributors Corporation (FDC), an affiliate of the investment adviser, separate Distribution and Service Fees, each of which is based on an annual percentage of each class' average net assets. In addition, FDC may pay financial intermediaries for selling shares of the Fund and providing shareholder support services. For the period, the Distribution and Service Fee rates, total fees and amounts retained by FDC were as follows:
| | Distribution
Fee | Service
Fee | Total Fees | Retained
by FDC |
| Class A | -% | .25% | $102,634 | $1,872 |
| Class M | .25% | .25% | 62,074 | – |
| Class C | .75% | .25% | 127,487 | 11,355 |
| | | | $292,195 | $13,227 |
Sales Load. FDC may receive a front-end sales charge of up to 5.75% for selling Class A shares and 3.50% for selling Class M shares, some of which is paid to financial intermediaries for selling shares of the Fund. Depending on the holding period, FDC may receive contingent deferred sales charges levied on Class A, Class M and Class C redemptions. The deferred sales charges are 1.00% for Class C shares, 1.00% for certain purchases of Class A shares and .25% for certain purchases of Class M shares.
For the period, sales charge amounts retained by FDC were as follows:
| | Retained
by FDC |
| Class A | $3,805 |
| Class M | 1,586 |
| Class C(a) | 1,220 |
| | $6,611 |
(a) When Class C shares are initially sold, FDC pays commissions from its own resources to financial intermediaries through which the sales are made.
Transfer Agent Fees. Fidelity Investments Institutional Operations Company, Inc., (FIIOC), an affiliate of the investment adviser, is the transfer, dividend disbursing and shareholder servicing agent for each class of the Fund. FIIOC receives account fees and asset-based fees that vary according to the account size and type of account of the shareholders of the respective classes of the Fund. FIIOC pays for typesetting, printing and mailing of shareholder reports, except proxy statements.
For the period, transfer agent fees for each applicable class were as follows:
| | Amount | % of
Class-Level Average
Net Assets |
| Class A | $99,338 | .24 |
| Class M | 36,835 | .30 |
| Class C | 35,724 | .28 |
| International Small Cap Opportunities | 1,578,011 | .19 |
| Class I | 317,613 | .20 |
| | $2,067,521 | |
Accounting and Security Lending Fees. Fidelity Service Company, Inc. (FSC), an affiliate of the investment adviser, maintains the Fund's accounting records. The accounting fee is based on the level of average net assets for each month. Under a separate contract, FSC administers the security lending program. The security lending fee is based on the number and duration of lending transactions.
Brokerage Commissions. The Fund placed a portion of its portfolio transactions with brokerage firms which are affiliates of the investment adviser. Brokerage commissions are included in net realized gain (loss) and change in net unrealized appreciation (depreciation) in the Statement of Operations. The commissions paid to these affiliated firms were $921 for the period.
Interfund Lending Program. Pursuant to an Exemptive Order issued by the SEC, the Fund, along with other registered investment companies having management contracts with Fidelity Management & Research Company (FMR) or other affiliated entities of FMR, may participate in an interfund lending program. This program provides an alternative credit facility allowing the funds to borrow from, or lend money to, other participating affiliated funds. At period end, there were no interfund loans outstanding. The Fund's activity in this program during the period for which loans were outstanding was as follows:
| Borrower or Lender | Average Loan Balance | Weighted Average Interest Rate | Interest Expense |
| Borrower | $7,779,000 | .58% | $1,257 |
Interfund Trades. The Funds may purchase from or sell securities to other Fidelity Funds under procedures adopted by the Board. The procedures have been designed to ensure these interfund trades are executed in accordance with Rule 17a-7 of the 1940 Act. Interfund trades are included within the respective purchases and sales amounts shown in the Purchases and Sales of Investments note.
6. Committed Line of Credit.
The Fund participates with other funds managed by the investment adviser or an affiliate in a $4.25 billion credit facility (the "line of credit") to be utilized for temporary or emergency purposes to fund shareholder redemptions or for other short-term liquidity purposes. The Fund has agreed to pay commitment fees on its pro-rata portion of the line of credit, which amounted to $3,289 and is reflected in Miscellaneous expenses on the Statement of Operations. During the period, the Fund did not borrow on this line of credit.
7. Security Lending.
The Fund lends portfolio securities through a lending agent from time to time in order to earn additional income. For equity securities, a lending agent is used and may loan securities to certain qualified borrowers, including Fidelity Capital Markets (FCM), a broker-dealer affiliated with the Fund. On the settlement date of the loan, the Fund receives collateral (in the form of U.S. Treasury obligations, letters of credit and/or cash) against the loaned securities and maintains collateral in an amount not less than 100% of the market value of the loaned securities during the period of the loan. The market value of the loaned securities is determined at the close of business of the Fund and any additional required collateral is delivered to the Fund on the next business day. The Fund or borrower may terminate the loan at any time, and if the borrower defaults on its obligation to return the securities loaned because of insolvency or other reasons, the Fund may apply collateral received from the borrower against the obligation. The Fund may experience delays and costs in recovering the securities loaned. Any cash collateral received is invested in the Fidelity Securities Lending Cash Central Fund. The value of loaned securities and cash collateral at period end are disclosed on the Fund's Statement of Assets and Liabilities. The value of securities loaned to FCM at period end was $2,047,704. Security lending income represents the income earned on investing cash collateral, less rebates paid to borrowers and any lending agent fees associated with the loan, plus any premium payments received for lending certain types of securities. Security lending income is presented in the Statement of Operations as a component of income from Fidelity Central Funds. Total security lending income during the period amounted to $237,504, including $1,880 from securities loaned to FCM.
8. Bank Borrowings.
The Fund is permitted to have bank borrowings for temporary or emergency purposes to fund shareholder redemptions or for other short-term liquidity requirements. The Fund has established borrowing arrangements with certain banks. The interest rate on the borrowings is the bank's base rate, as revised from time to time. The average loan balance during the period for which loans were outstanding amounted to $5,334,167. The weighted average interest rate was .91%. The interest expense amounted to $809 under the bank borrowing program. At period end, there were no bank borrowings outstanding.
9. Expense Reductions.
Commissions paid to certain brokers with whom the investment adviser, or its affiliates, places trades on behalf of the Fund include an amount in addition to trade execution, which may be rebated back to the Fund to offset certain expenses. This amount totaled $23,393 for the period. Through arrangements with the Fund's custodian, credits realized as a result of certain uninvested cash balances were used to reduce the Fund's expenses. During the period, these credits reduced the Fund's custody expenses by $64.
In addition, during the period the investment adviser reimbursed and/or waived a portion of fund-level operating expenses in the amount of $8,485.
10. Distributions to Shareholders.
Distributions to shareholders of each class were as follows:
| | Year ended
October 31, 2017 | Year ended
October 31, 2016 |
| From net investment income | | |
| Class A | $345,589 | $159,395 |
| Class M | 44,101 | 9,385 |
| International Small Cap Opportunities | 8,436,166 | 3,989,748 |
| Class I | 1,798,182 | 694,163 |
| Total | $10,624,038 | $4,852,691 |
| From net realized gain | | |
| Class A | $117,149 | $214,570 |
| Class M | 32,073 | 65,696 |
| Class C | – | 66,143 |
| International Small Cap Opportunities | 2,008,611 | 3,723,825 |
| Class I | 408,678 | 585,439 |
| Total | $2,566,511 | $4,655,673 |
11. Share Transactions.
Share transactions for each class were as follows and may contain automatic conversions between classes or exchanges between affiliated funds:
| | Shares | Shares | Dollars | Dollars |
| | Year ended
October 31, 2017 | Year ended October 31, 2016 | Year ended
October 31, 2017 | Year ended October 31, 2016 |
| Class A | | | | |
| Shares sold | 617,618 | 1,351,287 | $9,892,785 | $19,658,244 |
| Reinvestment of distributions | 30,743 | 24,184 | 441,465 | 359,376 |
| Shares redeemed | (1,457,378) | (1,195,179) | (22,890,236) | (17,426,031) |
| Net increase (decrease) | (809,017) | 180,292 | $(12,555,986) | $2,591,589 |
| Class M | | | | |
| Shares sold | 184,978 | 193,483 | $3,117,188 | $2,768,529 |
| Reinvestment of distributions | 5,229 | 5,021 | 74,674 | 74,158 |
| Shares redeemed | (241,247) | (269,450) | (3,797,029) | (3,846,732) |
| Net increase (decrease) | (51,040) | (70,946) | $(605,167) | $(1,004,045) |
| Class B | | | | |
| Shares sold | – | 3,601 | $– | $51,563 |
| Shares redeemed | – | (45,696) | – | (635,715) |
| Net increase (decrease) | – | (42,095) | $– | $(584,152) |
| Class C | | | | |
| Shares sold | 166,898 | 246,339 | $2,711,727 | $3,449,372 |
| Reinvestment of distributions | – | 4,483 | – | 64,648 |
| Shares redeemed | (236,034) | (584,363) | (3,599,444) | (8,102,721) |
| Net increase (decrease) | (69,136) | (333,541) | $(887,717) | $(4,588,701) |
| International Small Cap Opportunities | | | | |
| Shares sold | 8,291,089 | 26,676,267 | $139,007,305 | $389,947,202 |
| Reinvestment of distributions | 594,332 | 402,267 | 8,611,863 | 6,034,011 |
| Shares redeemed | (13,816,436) | (24,218,791) | (218,659,907) | (357,874,849) |
| Net increase (decrease) | (4,931,015) | 2,859,743 | $(71,040,739) | $38,106,364 |
| Class I | | | | |
| Shares sold | 4,860,065 | 5,357,445 | $80,212,539 | $78,823,330 |
| Reinvestment of distributions | 138,286 | 75,351 | 2,000,992 | 1,129,506 |
| Shares redeemed | (6,539,728) | (3,153,630) | (105,770,110) | (46,042,984) |
| Net increase (decrease) | (1,541,377) | 2,279,166 | $(23,556,579) | $33,909,852 |
12. Other.
The Fund's organizational documents provide former and current trustees and officers with a limited indemnification against liabilities arising in connection with the performance of their duties to the Fund. In the normal course of business, the Fund may also enter into contracts that provide general indemnifications. The Fund's maximum exposure under these arrangements is unknown as this would be dependent on future claims that may be made against the Fund. The risk of material loss from such claims is considered remote.
Report of Independent Registered Public Accounting Firm
To the Trustees of Fidelity Investment Trust and Shareholders of Fidelity International Small Cap Opportunities Fund:
We have audited the accompanying statement of assets and liabilities of Fidelity International Small Cap Opportunities Fund (the Fund), a fund of Fidelity Investment Trust, including the schedule of investments, as of October 31, 2017, and the related statement of operations for the year then ended, the statement of changes in net assets for each of the two years in the period then ended, and the financial highlights for each of the five years in the period then ended. These financial statements and financial highlights are the responsibility of the Fund's management. Our responsibility is to express an opinion on these financial statements and financial highlights based on our audits.
We conducted our audits in accordance with the standards of the Public Company Accounting Oversight Board (United States). Those standards require that we plan and perform the audit to obtain reasonable assurance about whether the financial statements and financial highlights are free of material misstatement. The Fund is not required to have, nor were we engaged to perform, an audit of its internal control over financial reporting. Our audits included consideration of internal control over financial reporting as a basis for designing audit procedures that are appropriate in the circumstances, but not for the purpose of expressing an opinion on the effectiveness of the Fund's internal control over financial reporting. Accordingly, we express no such opinion. An audit also includes examining, on a test basis, evidence supporting the amounts and disclosures in the financial statements, assessing the accounting principles used and significant estimates made by management, as well as evaluating the overall financial statement presentation. Our procedures included confirmation of securities owned as of October 31, 2017, by correspondence with the custodians and brokers; when replies were not received from brokers, we performed other auditing procedures. We believe that our audits provide a reasonable basis for our opinion.
In our opinion, such financial statements and financial highlights referred to above present fairly, in all material respects, the financial position of Fidelity International Small Cap Opportunities Fund as of October 31, 2017, the results of its operations for the year then ended, the changes in its net assets for each of the two years in the period then ended, and the financial highlights for each of the five years in the period then ended, in conformity with accounting principles generally accepted in the United States of America.
DELOITTE & TOUCHE LLP
Boston, Massachusetts
December 13, 2017
Trustees and Officers
The Trustees, Members of the Advisory Board (if any), and officers of the trust and fund, as applicable, are listed below. The Board of Trustees governs the fund and is responsible for protecting the interests of shareholders. The Trustees are experienced executives who meet periodically throughout the year to oversee the fund's activities, review contractual arrangements with companies that provide services to the fund, oversee management of the risks associated with such activities and contractual arrangements, and review the fund's performance. Except for Jonathan Chiel, each of the Trustees oversees 190 funds. Mr. Chiel oversees 143 funds.
The Trustees hold office without limit in time except that (a) any Trustee may resign; (b) any Trustee may be removed by written instrument, signed by at least two-thirds of the number of Trustees prior to such removal; (c) any Trustee who requests to be retired or who has become incapacitated by illness or injury may be retired by written instrument signed by a majority of the other Trustees; and (d) any Trustee may be removed at any special meeting of shareholders by a two-thirds vote of the outstanding voting securities of the trust. Each Trustee who is not an interested person (as defined in the 1940 Act) of the trust and the fund is referred to herein as an Independent Trustee. Each Independent Trustee shall retire not later than the last day of the calendar year in which his or her 75th birthday occurs. The Independent Trustees may waive this mandatory retirement age policy with respect to individual Trustees. Officers and Advisory Board Members hold office without limit in time, except that any officer or Advisory Board Member may resign or may be removed by a vote of a majority of the Trustees at any regular meeting or any special meeting of the Trustees. Except as indicated, each individual has held the office shown or other offices in the same company for the past five years.
The fund’s Statement of Additional Information (SAI) includes more information about the Trustees. To request a free copy, call Fidelity at 1-800-544-8544.
Experience, Skills, Attributes, and Qualifications of the Trustees. The Governance and Nominating Committee has adopted a statement of policy that describes the experience, qualifications, attributes, and skills that are necessary and desirable for potential Independent Trustee candidates (Statement of Policy). The Board believes that each Trustee satisfied at the time he or she was initially elected or appointed a Trustee, and continues to satisfy, the standards contemplated by the Statement of Policy. The Governance and Nominating Committee also engages professional search firms to help identify potential Independent Trustee candidates who have the experience, qualifications, attributes, and skills consistent with the Statement of Policy. From time to time, additional criteria based on the composition and skills of the current Independent Trustees, as well as experience or skills that may be appropriate in light of future changes to board composition, business conditions, and regulatory or other developments, have also been considered by the professional search firms and the Governance and Nominating Committee. In addition, the Board takes into account the Trustees' commitment and participation in Board and committee meetings, as well as their leadership of standing and ad hoc committees throughout their tenure.
In determining that a particular Trustee was and continues to be qualified to serve as a Trustee, the Board has considered a variety of criteria, none of which, in isolation, was controlling. The Board believes that, collectively, the Trustees have balanced and diverse experience, qualifications, attributes, and skills, which allow the Board to operate effectively in governing the fund and protecting the interests of shareholders. Information about the specific experience, skills, attributes, and qualifications of each Trustee, which in each case led to the Board's conclusion that the Trustee should serve (or continue to serve) as a trustee of the fund, is provided below.
Board Structure and Oversight Function. James C. Curvey is an interested person and currently serves as Chairman. The Trustees have determined that an interested Chairman is appropriate and benefits shareholders because an interested Chairman has a personal and professional stake in the quality and continuity of services provided to the fund. Independent Trustees exercise their informed business judgment to appoint an individual of their choosing to serve as Chairman, regardless of whether the Trustee happens to be independent or a member of management. The Independent Trustees have determined that they can act independently and effectively without having an Independent Trustee serve as Chairman and that a key structural component for assuring that they are in a position to do so is for the Independent Trustees to constitute a substantial majority for the Board. The Independent Trustees also regularly meet in executive session. Ned C. Lautenbach serves as Chairman of the Independent Trustees and as such (i) acts as a liaison between the Independent Trustees and management with respect to matters important to the Independent Trustees and (ii) with management prepares agendas for Board meetings.
Fidelity® funds are overseen by different Boards of Trustees. The fund's Board oversees Fidelity's high income and certain equity funds, and other Boards oversee Fidelity's investment-grade bond, money market, asset allocation, and sector funds. The asset allocation funds may invest in Fidelity® funds overseen by the fund's Board. The use of separate Boards, each with its own committee structure, allows the Trustees of each group of Fidelity® funds to focus on the unique issues of the funds they oversee, including common research, investment, and operational issues. On occasion, the separate Boards establish joint committees to address issues of overlapping consequences for the Fidelity® funds overseen by each Board.
The Trustees operate using a system of committees to facilitate the timely and efficient consideration of all matters of importance to the Trustees, the fund, and fund shareholders and to facilitate compliance with legal and regulatory requirements and oversight of the fund's activities and associated risks. The Board, acting through its committees, has charged FMR and its affiliates with (i) identifying events or circumstances the occurrence of which could have demonstrably adverse effects on the fund's business and/or reputation; (ii) implementing processes and controls to lessen the possibility that such events or circumstances occur or to mitigate the effects of such events or circumstances if they do occur; and (iii) creating and maintaining a system designed to evaluate continuously business and market conditions in order to facilitate the identification and implementation processes described in (i) and (ii) above. Because the day-to-day operations and activities of the fund are carried out by or through FMR, its affiliates, and other service providers, the fund's exposure to risks is mitigated but not eliminated by the processes overseen by the Trustees. While each of the Board's committees has responsibility for overseeing different aspects of the fund's activities, oversight is exercised primarily through the Operations, Audit, and Compliance Committees. In addition, the Independent Trustees have worked with FMR to enhance the Board's oversight of investment and financial risks, legal and regulatory risks, technology risks, and operational risks, including the development of additional risk reporting to the Board. For example, a working group comprised of Independent Trustees and FMR has worked and continues to work to review the Fidelity® funds' valuation-related activities, reporting and risk management. Appropriate personnel, including but not limited to the fund's Chief Compliance Officer (CCO), FMR's internal auditor, the independent accountants, the fund's Treasurer and portfolio management personnel, make periodic reports to the Board's committees, as appropriate, including an annual review of Fidelity's risk management program for the Fidelity® funds. The responsibilities of each standing committee, including their oversight responsibilities, are described further under "Standing Committees of the Trustees."
Interested Trustees*:
Correspondence intended for a Trustee who is an interested person may be sent to Fidelity Investments, 245 Summer Street, Boston, Massachusetts 02210.
Name, Year of Birth; Principal Occupations and Other Relevant Experience+
Jonathan Chiel (1957)
Year of Election or Appointment: 2016
Trustee
Mr. Chiel also serves as Trustee of other Fidelity® funds. Mr. Chiel is Executive Vice President and General Counsel for FMR LLC (diversified financial services company, 2012-present). Previously, Mr. Chiel served as general counsel (2004-2012) and senior vice president and deputy general counsel (2000-2004) for John Hancock Financial Services; a partner with Choate, Hall & Stewart (1996-2000) (law firm); and an Assistant United States Attorney for the United States Attorney’s Office of the District of Massachusetts (1986-95), including Chief of the Criminal Division (1993-1995). Mr. Chiel is a director on the boards of the Boston Bar Foundation and the Maimonides School.
James C. Curvey (1935)
Year of Election or Appointment: 2007
Trustee
Chairman of the Board of Trustees
Mr. Curvey also serves as Trustee of other Fidelity® funds. Mr. Curvey is a Director of Fidelity Research & Analysis Co. (investment adviser firm, 2009-present), and Vice Chairman (2007-present) and Director of FMR LLC (diversified financial services company). In addition, Mr. Curvey serves as an Overseer for the Boston Symphony Orchestra and a member of the board of Artis-Naples, Naples, Florida, and as a Trustee for Brewster Academy, Wolfeboro, New Hampshire. Previously, Mr. Curvey served as a Director of Fidelity Investments Money Management, Inc. (investment adviser firm, 2009-2014) and a Director of FMR and FMR Co., Inc. (investment adviser firms, 2007-2014).
Charles S. Morrison (1960)
Year of Election or Appointment: 2014
Trustee
Mr. Morrison also serves as Trustee of other funds. He serves as President of Fidelity Management & Research Company (FMR) (investment adviser firm, 2016-present), a Director of Fidelity Investments Money Management, Inc. (FIMM) (investment adviser firm, 2014-present), Director of Fidelity SelectCo, LLC (investment adviser firm, 2014-present), President, Asset Management (2014-present), and is an employee of Fidelity Investments. Previously, Mr. Morrison served as Vice President of Fidelity's Fixed Income and Asset Allocation Funds (2012-2014), President, Fixed Income (2011-2014), Vice President of Fidelity's Money Market Funds (2005-2009), President, Money Market Group Leader of FMR (investment adviser firm, 2009), and Senior Vice President, Money Market Group of FMR (2004-2009). Mr. Morrison also served as Vice President of Fidelity's Bond Funds (2002-2005), certain Balanced Funds (2002-2005), and certain Asset Allocation Funds (2002-2007), and as Senior Vice President (2002-2005) of Fidelity's Bond Division.
* Determined to be an “Interested Trustee” by virtue of, among other things, his or her affiliation with the trust or various entities under common control with FMR.
+ The information includes the Trustee's principal occupation during the last five years and other information relating to the experience, attributes, and skills relevant to the Trustee's qualifications to serve as a Trustee, which led to the conclusion that the Trustee should serve as a Trustee for the fund.
Independent Trustees:
Correspondence intended for an Independent Trustee may be sent to Fidelity Investments, P.O. Box 55235, Boston, Massachusetts 02205-5235.
Name, Year of Birth; Principal Occupations and Other Relevant Experience+
Dennis J. Dirks (1948)
Year of Election or Appointment: 2005
Trustee
Mr. Dirks also serves as Trustee of other Fidelity® funds. Prior to his retirement in May 2003, Mr. Dirks was Chief Operating Officer and a member of the Board of The Depository Trust & Clearing Corporation (DTCC). He also served as President, Chief Operating Officer, and Board member of The Depository Trust Company (DTC) and President and Board member of the National Securities Clearing Corporation (NSCC). In addition, Mr. Dirks served as Chief Executive Officer and Board member of the Government Securities Clearing Corporation, Chief Executive Officer and Board member of the Mortgage-Backed Securities Clearing Corporation, as a Trustee and a member of the Finance Committee of Manhattan College (2005-2008), as a Trustee and a member of the Finance Committee of AHRC of Nassau County (2006-2008), as a member of the Independent Directors Council (IDC) Governing Council (2010-2015), and as a member of the Board of Directors for The Brookville Center for Children’s Services, Inc. (2009-2017). Mr. Dirks is a member of the Finance Committee (2016-present) and Board of Directors (2017-present) of the Asolo Repertory Theatre.
Alan J. Lacy (1953)
Year of Election or Appointment: 2008
Trustee
Mr. Lacy also serves as Trustee of other Fidelity® funds. Mr. Lacy serves as a Director of Bristol-Myers Squibb Company (global pharmaceuticals, 2008-present). He is a Trustee of the California Chapter of The Nature Conservancy (2015-present) and a Director of the Center for Advanced Study in the Behavioral Sciences at Stanford University (2015-present). In addition, Mr. Lacy served as Senior Adviser (2007-2014) of Oak Hill Capital Partners, L.P. (private equity) and also served as Chief Executive Officer (2005) and Vice Chairman (2005-2006) of Sears Holdings Corporation (retail) and Chief Executive Officer and Chairman of the Board of Sears, Roebuck and Co. (retail, 2000-2005). Previously, Mr. Lacy served as Chairman (2014-2017) and a member (2010-2017) of the Board of Directors of Dave & Buster’s Entertainment, Inc. (restaurant and entertainment complexes), as Chairman (2008-2011) and a member (2006-2015) of the Board of Trustees of the National Parks Conservation Association, and as a member of the Board of Directors for The Hillman Companies, Inc. (hardware wholesalers, 2010-2014), Earth Fare, Inc. (retail grocery, 2010-2014), and The Western Union Company (global money transfer, 2006-2011).
Ned C. Lautenbach (1944)
Year of Election or Appointment: 2000
Trustee
Chairman of the Independent Trustees
Mr. Lautenbach also serves as Trustee of other Fidelity® funds. Mr. Lautenbach currently serves as Vice Chair of the Board of Governors, State University System of Florida (2013-present) and is a member of the Council on Foreign Relations (1994-present). He is also a member and has most recently served as Chairman of the Board of Directors of Artis-Naples (2012-present). Previously, Mr. Lautenbach served as a member and then Lead Director of the Board of Directors of Eaton Corporation (diversified industrial, 1997-2016). He was also a Partner and Advisory Partner at Clayton, Dubilier & Rice, LLC (private equity investment, 1998-2010), as well as a Director of Sony Corporation (2006-2007). In addition, Mr. Lautenbach also had a 30-year career with IBM (technology company) during which time he served as Senior Vice President and a member of the Corporate Executive Committee (1968-1998).
Joseph Mauriello (1944)
Year of Election or Appointment: 2008
Trustee
Mr. Mauriello also serves as Trustee of other Fidelity® funds. Prior to his retirement in January 2006, Mr. Mauriello served in numerous senior management positions including Deputy Chairman and Chief Operating Officer (2004-2005), and Vice Chairman of Financial Services (2002-2004) of KPMG LLP US (professional services, 1965-2005). Mr. Mauriello currently serves as a member of the Board of Directors of XL Group plc. (global insurance and re-insurance, 2006-present) and the Independent Directors Council (IDC) Governing Council (2015-present). Previously, Mr. Mauriello served as a Director of the Hamilton Funds of the Bank of New York (2006-2007) and of Arcadia Resources Inc. (health care services and products, 2007-2012).
Cornelia M. Small (1944)
Year of Election or Appointment: 2005
Trustee
Ms. Small also serves as Trustee of other Fidelity® funds. Ms. Small is a member of the Board of Directors (2009-present) and Chair of the Investment Committee (2010-present) of the Teagle Foundation. Ms. Small also serves on the Investment Committee of the Berkshire Taconic Community Foundation (2008-present). Previously, Ms. Small served as Chairperson (2002-2008) and a member of the Investment Committee and Chairperson (2008-2012) and a member of the Board of Trustees of Smith College. In addition, Ms. Small served as Chief Investment Officer, Director of Global Equity Investments, and a member of the Board of Directors of Scudder, Stevens & Clark and Scudder Kemper Investments.
William S. Stavropoulos (1939)
Year of Election or Appointment: 2001
Trustee
Vice Chairman of the Independent Trustees
Mr. Stavropoulos also serves as Trustee of other Fidelity® funds. Mr. Stavropoulos serves as President and Founder of the Michigan Baseball Foundation, the Great Lakes Loons (2007-present). Mr. Stavropoulos is Chairman Emeritus of the Board of Directors of The Dow Chemical Company, where he previously served in numerous senior management positions, including President, CEO (1995-2000; 2002-2004), Chairman of the Executive Committee (2000-2006), and as a member of the Board of Directors (1990-2006). Currently, Mr. Stavropoulos is Chairman of the Board of Directors of Univar Inc. (global distributor of commodity and specialty chemicals), a Director of Teradata Corporation (data warehousing and technology solutions), and a member of the Advisory Board for Metalmark Capital LLC (private equity investment, 2005-present). Mr. Stavropoulos is an operating advisor to Clayton, Dubilier & Rice, LLC (private equity investment). In addition, Mr. Stavropoulos is a member of the University of Notre Dame Advisory Council for the College of Science, a Trustee of the Rollin L. Gerstacker Foundation, and a Director of Artis-Naples in Naples, Florida. Previously, Mr. Stavropoulos served as a Director of Chemical Financial Corporation (bank holding company, 1993-2012) and Tyco International, Ltd. (multinational manufacturing and services, 2007-2012).
David M. Thomas (1949)
Year of Election or Appointment: 2008
Trustee
Mr. Thomas also serves as Trustee of other Fidelity® funds. Mr. Thomas serves as Non-Executive Chairman of the Board of Directors of Fortune Brands Home and Security (home and security products, 2011-present), as a member of the Board of Directors (2004-present) and Presiding Director (2013-present) of Interpublic Group of Companies, Inc. (marketing communication), and as a member of the Board of Trustees of the University of Florida (2013-present). Previously, Mr. Thomas served as Executive Chairman (2005-2006) and Chairman and Chief Executive Officer (2000-2005) of IMS Health, Inc. (pharmaceutical and healthcare information solutions), and a Director of Fortune Brands, Inc. (consumer products, 2000-2011).
+ The information includes the Trustee's principal occupation during the last five years and other information relating to the experience, attributes, and skills relevant to the Trustee's qualifications to serve as a Trustee, which led to the conclusion that the Trustee should serve as a Trustee for the fund.
Advisory Board Members and Officers:
Correspondence intended for an officer or Peter S. Lynch may be sent to Fidelity Investments, 245 Summer Street, Boston, Massachusetts 02210. Officers appear below in alphabetical order.
Name, Year of Birth; Principal Occupation
Peter S. Lynch (1944)
Year of Election or Appointment: 2003
Member of the Advisory Board
Mr. Lynch also serves as Member of the Advisory Board of other Fidelity® funds. Mr. Lynch is Vice Chairman and a Director of FMR (investment adviser firm) and FMR Co., Inc. (investment adviser firm). In addition, Mr. Lynch serves as a Trustee of Boston College and as the Chairman of the Inner-City Scholarship Fund. Previously, Mr. Lynch served on the Special Olympics International Board of Directors (1997-2006).
Elizabeth Paige Baumann (1968)
Year of Election or Appointment: 2017
Anti-Money Laundering (AML) Officer
Ms. Baumann also serves as AML Officer of other funds. She is Chief AML Officer (2012-present) and Senior Vice President (2014-present) of FMR LLC (diversified financial services company) and is an employee of Fidelity Investments. Previously, Ms. Baumann served as AML Officer of the funds (2012-2016), and Vice President (2007-2014) and Deputy Anti-Money Laundering Officer (2007-2012) of FMR LLC.
Marc R. Bryant (1966)
Year of Election or Appointment: 2015
Secretary and Chief Legal Officer (CLO)
Mr. Bryant also serves as Secretary and CLO of other funds. Mr. Bryant serves as CLO, Secretary, and Senior Vice President of Fidelity Management & Research Company (investment adviser firm, 2015-present) and FMR Co., Inc. (investment adviser firm, 2015-present); Secretary of Fidelity SelectCo, LLC (investment adviser firm, 2015-present) and Fidelity Investments Money Management, Inc. (investment adviser firm, 2015-present); and CLO of Fidelity Management & Research (Hong Kong) Limited and FMR Investment Management (UK) Limited (investment adviser firms, 2015-present) and Fidelity Management & Research (Japan) Limited (investment adviser firm, 2016-present). He is Senior Vice President and Deputy General Counsel of FMR LLC (diversified financial services company). Previously, Mr. Bryant served as Secretary and CLO of Fidelity Rutland Square Trust II (2010-2014) and Assistant Secretary of Fidelity's Fixed Income and Asset Allocation Funds (2013-2015). Prior to joining Fidelity Investments, Mr. Bryant served as a Senior Vice President and the Head of Global Retail Legal for AllianceBernstein L.P. (2006-2010), and as the General Counsel for ProFund Advisors LLC (2001-2006).
William C. Coffey (1969)
Year of Election or Appointment: 2009
Assistant Secretary
Mr. Coffey also serves as Assistant Secretary of other funds. He is Senior Vice President and Deputy General Counsel of FMR LLC (diversified financial services company, 2010-present), and is an employee of Fidelity Investments. Previously, Mr. Coffey served as Vice President and Associate General Counsel of FMR LLC (2005-2009).
Jonathan Davis (1968)
Year of Election or Appointment: 2010
Assistant Treasurer
Mr. Davis also serves as Assistant Treasurer of other funds, and is an employee of Fidelity Investments. Previously, Mr. Davis served as Vice President and Associate General Counsel of FMR LLC (diversified financial services company, 2003-2010).
Adrien E. Deberghes (1967)
Year of Election or Appointment: 2016
Assistant Treasurer
Mr. Deberghes also serves as an officer of other funds. He serves as Executive Vice President of Fidelity Investments Money Management, Inc. (FIMM) (investment adviser firm, 2016-present) and is an employee of Fidelity Investments (2008-present). Prior to joining Fidelity Investments, Mr. Deberghes was Senior Vice President of Mutual Fund Administration at State Street Corporation (2007-2008), Senior Director of Mutual Fund Administration at Investors Bank & Trust (2005-2007), and Director of Finance for Dunkin' Brands (2000-2005). Previously, Mr. Deberghes served in other fund officer roles.
Joseph DeSantis (1959)
Year of Election or Appointment: 2017
Vice President
Mr. DeSantis also serves as Vice President of other funds. Mr. DeSantis serves as a Director of Fidelity Management & Research (Japan) Limited (investment adviser firm, 2016-present), Chief Investment Officer, Equities (2010-present) and is an employee of Fidelity Investments.
Stephanie J. Dorsey (1969)
Year of Election or Appointment: 2010
Assistant Treasurer
Ms. Dorsey also serves as an officer of other funds. She is an employee of Fidelity Investments (2008-present) and has served in other fund officer roles. Prior to joining Fidelity Investments, Ms. Dorsey served as Treasurer (2004-2008) of the JPMorgan Mutual Funds and Vice President (2004-2008) of JPMorgan Chase Bank.
Howard J. Galligan III (1966)
Year of Election or Appointment: 2014
Chief Financial Officer
Mr. Galligan also serves as Chief Financial Officer of other funds. Mr. Galligan serves as President of Fidelity Pricing and Cash Management Services (FPCMS) (2014-present) and as a Director of Strategic Advisers, Inc. (investment adviser firm, 2008-present). Previously, Mr. Galligan served as Chief Administrative Officer of Asset Management (2011-2014) and Chief Operating Officer and Senior Vice President of Investment Support for Strategic Advisers, Inc. (2003-2011).
Brian B. Hogan (1964)
Year of Election or Appointment: 2009
Vice President
Mr. Hogan also serves as Trustee or Vice President of other funds. Mr. Hogan serves as a Director of FMR Investment Management (UK) Limited (investment adviser firm, 2015-present) and Fidelity SelectCo, LLC (investment adviser firm, 2014-present) and President of the Equity Division of FMR (investment adviser firm, 2009-present). Previously, Mr. Hogan served as Senior Vice President, Equity Research of FMR (2006-2009) and as a portfolio manager. Mr. Brian B. Hogan is not related to Mr. Colm A. Hogan.
Colm A. Hogan (1973)
Year of Election or Appointment: 2016
Deputy Treasurer
Mr. Hogan also serves as an officer of other funds. Mr. Hogan is an employee of Fidelity Investments (2005-present). Mr. Colm A. Hogan is not related to Mr. Brian B. Hogan.
Chris Maher (1972)
Year of Election or Appointment: 2013
Assistant Treasurer
Mr. Maher serves as Assistant Treasurer of other funds. Mr. Maher is Vice President of Valuation Oversight and is an employee of Fidelity Investments. Previously, Mr. Maher served as Vice President of Asset Management Compliance (2013), Vice President of the Program Management Group of FMR (investment adviser firm, 2010-2013), and Vice President of Valuation Oversight (2008-2010).
Rieco E. Mello (1969)
Year of Election or Appointment: 2017
Assistant Treasurer
Mr. Mello also serves as Assistant Treasurer of other funds. Mr. Mello is an employee of Fidelity Investments (1995-present).
Kenneth B. Robins (1969)
Year of Election or Appointment: 2016
Chief Compliance Officer
Mr. Robins also serves as an officer of other funds. Mr. Robins serves as Compliance Officer of Fidelity Management & Research Company and FMR Co., Inc. (investment adviser firms, 2016-present) and is an employee of Fidelity Investments (2004-present). Previously, Mr. Robins served as Executive Vice President of Fidelity Investments Money Management, Inc. (investment adviser firm, 2013-2016) and served in other fund officer roles.
Stacie M. Smith (1974)
Year of Election or Appointment: 2016
President and Treasurer
Ms. Smith also serves as an officer of other funds. She is an employee of Fidelity Investments (2009-present) and has served in other fund officer roles. Prior to joining Fidelity Investments, Ms. Smith served as Senior Audit Manager of Ernst & Young LLP (accounting firm, 1996-2009). Previously, Ms. Smith served as Deputy Treasurer of certain Fidelity® funds (2013-2016).
Marc L. Spector (1972)
Year of Election or Appointment: 2016
Assistant Treasurer
Mr. Spector also serves as an officer of other funds. Mr. Spector is an employee of Fidelity Investments (2016-present). Prior to joining Fidelity Investments, Mr. Spector served as Director at the Siegfried Group (accounting firm, 2013-2016), and prior to Siegfried Group as audit senior manager at Deloitte & Touche (accounting firm, 2005-2013).
Renee Stagnone (1975)
Year of Election or Appointment: 2016
Assistant Treasurer
Ms. Stagnone also serves as an officer of other funds. Ms. Stagnone is an employee of Fidelity Investments (1997-present). Previously, Ms. Stagnone served as Deputy Treasurer of certain Fidelity® funds (2013-2016).
Shareholder Expense Example
As a shareholder of the Fund, you incur two types of costs: (1) transaction costs, including sales charges (loads) on purchase payments or redemption proceeds, redemption fees and (2) ongoing costs, including management fees, distribution and/or service (12b-1) fees and other Fund expenses. This Example is intended to help you understand your ongoing costs (in dollars) of investing in the Fund and to compare these costs with the ongoing costs of investing in other mutual funds.
The Example is based on an investment of $1,000 invested at the beginning of the period and held for the entire period (May 1, 2017 to October 31, 2017).
Actual Expenses
The first line of the accompanying table for each class of the Fund provides information about actual account values and actual expenses. You may use the information in this line, together with the amount you invested, to estimate the expenses that you paid over the period. Simply divide your account value by $1,000.00 (for example, an $8,600 account value divided by $1,000.00 = 8.6), then multiply the result by the number in the first line for a class of the Fund under the heading entitled "Expenses Paid During Period" to estimate the expenses you paid on your account during this period. A small balance maintenance fee of $12.00 that is charged once a year may apply for certain accounts with a value of less than $2,000. This fee is not included in the table below. If it was, the estimate of expenses you paid during the period would be higher, and your ending account value lower, by this amount. In addition, the Fund, as a shareholder in the underlying Fidelity Central Funds, will indirectly bear its pro-rata share of the fees and expenses incurred by the underlying Fidelity Central Funds. These fees and expenses are not included in the Fund's annualized expense ratio used to calculate the expense estimate in the table below.
Hypothetical Example for Comparison Purposes
The second line of the accompanying table for each class of the Fund provides information about hypothetical account values and hypothetical expenses based on a Class' actual expense ratio and an assumed rate of return of 5% per year before expenses, which is not the Class' actual return. The hypothetical account values and expenses may not be used to estimate the actual ending account balance or expenses you paid for the period. You may use this information to compare the ongoing costs of investing in the Fund and other funds. To do so, compare this 5% hypothetical example with the 5% hypothetical examples that appear in the shareholder reports of the other funds. A small balance maintenance fee of $12.00 that is charged once a year may apply for certain accounts with a value of less than $2,000. This fee is not included in the table below. If it was, the estimate of expenses you paid during the period would be higher, and your ending account value lower, by this amount. In addition, the Fund, as a shareholder in the underlying Fidelity Central Funds, will indirectly bear its pro-rata share of the fees and expenses incurred by the underlying Fidelity Central Funds. These fees and expenses are not included in the Fund's annualized expense ratio used to calculate the expense estimate in the table below.
Please note that the expenses shown in the table are meant to highlight your ongoing costs only and do not reflect any transaction costs. Therefore, the second line of the table is useful in comparing ongoing costs only, and will not help you determine the relative total costs of owning different funds. In addition, if these transactional costs were included, your costs would have been higher.
| | Annualized Expense Ratio-A | Beginning
Account Value
May 1, 2017 | Ending
Account Value
October 31, 2017 | Expenses Paid
During Period-B
May 1, 2017
to October 31, 2017 |
| Class A | 1.42% | | | |
| Actual | | $1,000.00 | $1,122.10 | $7.60 |
| Hypothetical-C | | $1,000.00 | $1,018.05 | $7.22 |
| Class M | 1.72% | | | |
| Actual | | $1,000.00 | $1,119.80 | $9.19 |
| Hypothetical-C | | $1,000.00 | $1,016.53 | $8.74 |
| Class C | 2.21% | | | |
| Actual | | $1,000.00 | $1,117.10 | $11.79 |
| Hypothetical-C | | $1,000.00 | $1,014.06 | $11.22 |
| International Small Cap Opportunities | 1.13% | | | |
| Actual | | $1,000.00 | $1,123.90 | $6.05 |
| Hypothetical-C | | $1,000.00 | $1,019.51 | $5.75 |
| Class I | 1.13% | | | |
| Actual | | $1,000.00 | $1,123.40 | $6.05 |
| Hypothetical-C | | $1,000.00 | $1,019.51 | $5.75 |
A Annualized expense ratio reflects expenses net of applicable fee waivers.
B Expenses are equal to each Class' annualized expense ratio, multiplied by the average account value over the period, multiplied by 184/365 (to reflect the one-half year period).
C 5% return per year before expenses
Distributions (Unaudited)
The Board of Trustees of Fidelity International Small Cap Opportunities Fund voted to pay to shareholders of record at the opening of business on record date, the following distributions per share derived from capital gains realized from sales of portfolio securities, and dividends derived from net investment income:
| | Pay Date | Record Date | Dividends | Capital Gains |
| Fidelity International Small Cap Opportunities Fund | | | | |
| Class A | 12/11/17 | 12/08/17 | $0.093 | $0.243 |
| Class M | 12/11/17 | 12/08/17 | $0.060 | $0.243 |
| Class C | 12/11/17 | 12/08/17 | $0.000 | $0.243 |
| International Small Cap Opportunities | 12/11/17 | 12/08/17 | $0.139 | $0.243 |
| Class I | 12/11/17 | 12/08/17 | $0.138 | $0.243 |
|
Class A designates 6%; Class M designates 9%; International Small Cap Opportunities designates 5% and Class I designates 4% of the dividends distributed in December 2016, respectively during the fiscal year as qualifying for the dividends–received deduction for corporate shareholders.
Class A, Class M, International Small Cap Opportunities and Class I designate 100% of the dividends distributed during the fiscal year as amounts which may be taken into account as a dividend for purposes of the maximum rate under section 1(h)(11) of the Internal Revenue Code.
The amounts per share which represent income derived from sources within, and taxes paid to, foreign countries or possessions of the United States are as follows:
| | Pay Date | Income | Taxes |
| Fidelity International Small Cap Opportunities Fund | | | |
| Class A | 12/12/16 | $0.1854 | $0.0274 |
| Class M | 12/12/16 | $0.1224 | $0.0274 |
| International Small Cap Opportunities | 12/12/16 | $0.2354 | $0.0274 |
| Class I | 12/12/16 | $0.2434 | $0.0274 |
|
The fund will notify shareholders in January 2018 of amounts for use in preparing 2017 income tax returns.
Board Approval of Investment Advisory Contracts and Management Fees
Fidelity International Small Cap Opportunities Fund
Each year, the Board of Trustees, including the Independent Trustees (together, the Board), votes on the renewal of the management contract with Fidelity Management & Research Company (FMR) and the sub-advisory agreements (together, the Advisory Contracts) for the fund. FMR and the sub-advisers are referred to herein as the Investment Advisers. The Board, assisted by the advice of fund counsel and Independent Trustees' counsel, requests and considers a broad range of information relevant to the renewal of the Advisory Contracts throughout the year.
The Board meets regularly and, at each of its meetings, covers an extensive agenda of topics and materials and considers factors that are relevant to its annual consideration of the renewal of the fund's Advisory Contracts, including the services and support provided to the fund and its shareholders. The Board has established various standing committees (Committees), each composed of and chaired by Independent Trustees with varying backgrounds, to which the Board has assigned specific subject matter responsibilities in order to enhance effective decision-making by the Board. The Board, acting directly and through its Committees, requests and receives information concerning the annual consideration of the renewal of the fund's Advisory Contracts. The Board also meets as needed to review matters specifically related to the Board's annual consideration of the renewal of the Advisory Contracts. Members of the Board may also meet with trustees of other Fidelity funds through ad hoc joint committees to discuss certain matters relevant to all of the Fidelity funds.
At its July 2017 meeting, the Board unanimously determined to renew the fund's Advisory Contracts. In reaching its determination, the Board considered all factors it believed relevant, including (i) the nature, extent, and quality of the services to be provided to the fund and its shareholders (including the investment performance of the fund); (ii) the competitiveness of the fund's management fee and total expense ratio relative to peer funds; (iii) the total costs of the services to be provided by and the profits to be realized by Fidelity from its relationships with the fund; and (iv) the extent to which, if any, economies of scale exist and would be realized as the fund grows, and whether any economies of scale are appropriately shared with fund shareholders.
In considering whether to renew the Advisory Contracts for the fund, the Board reached a determination, with the assistance of fund counsel and Independent Trustees' counsel and through the exercise of its business judgment, that the renewal of the Advisory Contracts was in the best interests of the fund and its shareholders and that the compensation payable under the Advisory Contracts was fair and reasonable. The Board's decision to renew the Advisory Contracts was not based on any single factor, but rather was based on a comprehensive consideration of all the information provided to the Board at its meetings throughout the year. The Board, in reaching its determination to renew the Advisory Contracts, was aware that shareholders of the fund have a broad range of investment choices available to them, including a wide choice among funds offered by Fidelity's competitors, and that the fund's shareholders, who have the opportunity to review and weigh the disclosure provided by the fund in its prospectus and other public disclosures, have chosen to invest in this fund, which is part of the Fidelity family of funds.
Amendment to Group Fee Rate. The Board also approved an amendment to the management contract for the fund to add an additional breakpoint to the group fee schedule, effective October 1, 2017. The Board noted that the additional breakpoint would result in lower management fee rates as Fidelity's assets under management increase.
Nature, Extent, and Quality of Services Provided. The Board considered Fidelity's staffing as it relates to the fund, including the backgrounds of investment personnel of Fidelity, and also considered the fund's investment objective, strategies, and related investment philosophy. The Independent Trustees also had discussions with senior management of Fidelity's investment operations and investment groups. The Board considered the structure of the investment personnel compensation program and whether this structure provides appropriate incentives to act in the best interests of the fund. Additionally, the Board considered the portfolio managers' investments, if any, in the funds that they manage.
Resources Dedicated to Investment Management and Support Services. The Board and the Fund Oversight and Research Committees reviewed the general qualifications and capabilities of Fidelity's investment staff, including its size, education, experience, and resources, as well as Fidelity's approach to recruiting, training, managing, and compensating investment personnel. The Board noted that Fidelity has continued to increase the resources devoted to non-U.S. offices, including expansion of Fidelity's global investment organization. The Board also noted that Fidelity's analysts have extensive resources, tools and capabilities that allow them to conduct sophisticated quantitative and fundamental analysis, as well as credit analysis of issuers, counterparties and guarantors. Further, the Board considered that Fidelity's investment professionals have sufficient access to global information and data so as to provide competitive investment results over time, and that those professionals also have access to sophisticated tools that permit them to assess portfolio construction and risk and performance attribution characteristics continuously, as well as to transmit new information and research conclusions rapidly around the world. Additionally, in its deliberations, the Board considered Fidelity's trading, risk management, compliance, and technology and operations capabilities and resources, which are integral parts of the investment management process.
Shareholder and Administrative Services. The Board considered (i) the nature, extent, quality, and cost of advisory, administrative, and shareholder services performed by the Investment Advisers and their affiliates under the Advisory Contracts and under separate agreements covering transfer agency, pricing and bookkeeping, and securities lending services for the fund; (ii) the nature and extent of the supervision of third party service providers, principally custodians, subcustodians, and pricing vendors; and (iii) the resources devoted to, and the record of compliance with, the fund's compliance policies and procedures. The Board also reviewed the allocation of fund brokerage, including allocations to brokers affiliated with the Investment Advisers, the use of brokerage commissions to pay fund expenses, and the use of "soft" commission dollars to pay for research services.
The Board noted that the growth of fund assets over time across the complex allows Fidelity to reinvest in the development of services designed to enhance the value or convenience of the Fidelity funds as investment vehicles. These services include 24-hour access to account information and market information through telephone representatives and over the Internet, investor education materials and asset allocation tools, and the expanded availability of Fidelity Investor Centers.
In 2014, the Board formed an ad hoc Committee on Transfer Agency Fees to review the variety of transfer agency fee structures throughout the industry and Fidelity's competitive positioning with respect to industry participants.
Investment in a Large Fund Family. The Board considered the benefits to shareholders of investing in a Fidelity fund, including the benefits of investing in a fund that is part of a large family of funds offering a variety of investment disciplines and providing a large variety of mutual fund investor services. The Board noted that Fidelity had taken, or had made recommendations that resulted in the Fidelity funds taking, a number of actions over the previous year that benefited particular funds, including: (i) continuing to dedicate additional resources to Fidelity's investment research process, and to the support of the senior management team that oversees asset management; (ii) continuing efforts to enhance Fidelity's global research capabilities; (iii) launching new funds and making other enhancements to meet client needs; (iv) launching new share classes of existing funds; (v) eliminating purchase minimums and broadening eligibility requirements for certain lower-priced share classes; (vi) reducing management fees and total expenses for certain growth equity funds and index funds; (vii) lowering expense caps for certain existing funds and classes to reduce expenses borne by shareholders; (viii) eliminating short-term redemption fees for certain funds; (ix) introducing a new pricing structure for certain funds of funds that is expected to reduce overall expenses paid by shareholders; (x) rationalizing product lines and gaining increased efficiencies through proposals for fund mergers and share class consolidations; (xi) continuing to develop, acquire and implement systems and technology to improve services to the funds and shareholders, strengthen information security, and increase efficiency; and (xii) implementing enhancements to further strengthen Fidelity's product line to increase investors' probability of success in achieving their investment goals, including retirement income goals.
Investment Performance. The Board considered whether the fund has operated in accordance with its investment objective, as well as its record of compliance with its investment restrictions and its performance history. The Board noted that there was a portfolio management change for the fund in March 2017.
The Board took into account discussions with representatives of the Investment Advisers about fund investment performance that occur at Board meetings throughout the year. In this regard the Board noted that as part of regularly scheduled fund reviews and other reports to the Board on fund performance, the Board considers annualized return information for the fund for different time periods, measured against a securities market index ("benchmark index") and a peer group of funds with similar objectives ("peer group"), if any. In its evaluation of fund investment performance, the Board gave particular attention to information indicating changes in performance of certain Fidelity funds for specific time periods and discussed with the Investment Advisers the reasons for any overperformance or underperformance.
In addition to reviewing absolute and relative fund performance, the Independent Trustees periodically consider the appropriateness of fund performance metrics in evaluating the results achieved. In general, the Independent Trustees believe that fund performance should be evaluated based on net performance (after fees and expenses) of both the highest performing and lowest performing fund share classes, where applicable, compared to appropriate benchmark indices, over appropriate time periods that may include full market cycles, and compared to peer groups, as applicable, over the same periods, taking into account relevant factors including the following: general market conditions; issuer-specific information; and fund cash flows and other factors.
The Independent Trustees recognize that shareholders evaluate performance on a net basis over their own holding periods, for which one-, three-, and five-year periods are often used as a proxy. For this reason, the performance information reviewed by the Board also included net cumulative calendar year total return information for the fund and an appropriate benchmark index and peer group for the most recentone-, three-, and five-year periods, as shown below. Returns are shown compared to the 25th percentile (top of box, 75% beaten) and 75th percentile (bottom of box, 25% beaten) of the peer universe. Returns of the benchmark index are "net MA,"
i.e., adjusted for tax withholding rates applicable to U.S.-based funds organized as Massachusetts business trusts.
Fidelity International Small Cap Opportunities Fund
The Board also considered that the fund's management fee is subject to upward or downward adjustment depending upon whether, and to what extent, the fund's investment performance for the performance period (a rolling 36-month period) exceeds, or is exceeded by, a securities index, thus leading to a performance adjustment for the same period. The Board noted that the performance adjustment provides FMR with a strong economic incentive to seek to achieve superior long-term performance for the fund's shareholders and helps to more closely align the interests of FMR and the shareholders of the fund.
Based on its review, the Board concluded that the nature, extent, and quality of services provided to the fund under the Advisory Contracts should continue to benefit the shareholders of the fund.
Competitiveness of Management Fee and Total Expense Ratio. The Board considered the fund's management fee and total expense ratio compared to "mapped groups" of competitive funds and classes created for the purpose of facilitating the Trustees' competitive analysis of management fees and total expenses. Fidelity creates "mapped groups" by combining similar Lipper investment objective categories that have comparable investment mandates. Combining Lipper investment objective categories aids the Board's management fee and total expense ratio comparisons by broadening the competitive group used for comparison.
Management Fee. The Board considered two proprietary management fee comparisons for the 12-month periods shown in basis points (BP) in the chart below. The group of Lipper funds used by the Board for management fee comparisons is referred to below as the "Total Mapped Group." The Total Mapped Group is broader than the Lipper peer group used by the Board for performance comparisons because the Total Mapped Group combines several Lipper investment objective categories while the Lipper peer group does not. The Total Mapped Group comparison focuses on a fund's standing in terms of gross management fees before expense reimbursements or caps, and without giving effect to the fund's performance adjustment, relative to the total universe of funds with comparable investment mandates, regardless of whether their management fee structures also are comparable. Funds with comparable investment mandates offer exposure to similar types of securities. Funds with comparable management fee structures have similar management fee contractual arrangements (
e.g., flat rate charged for advisory services, all-inclusive fee rate,
etc.). "TMG %" represents the percentage of funds in the Total Mapped Group that had management fees that were lower than the fund's. For example, a hypothetical TMG % of 20% would mean that 80% of the funds in the Total Mapped Group had higher, and 20% had lower, management fees than the fund. The fund's actual TMG %s and the number of funds in the Total Mapped Group are in the chart below. The "Asset-Size Peer Group" (ASPG) comparison focuses on a fund's standing relative to a subset of non-Fidelity funds within the Total Mapped Group that are similar in size and management fee structure, without taking into account performance adjustments, if any. For example, if a fund is in the first quartile of the ASPG, the fund's management fee ranks in the least expensive or lowest 25% of funds in the ASPG. The ASPG represents at least 15% of the funds in the Total Mapped Group with comparable asset size and management fee structures, subject to a minimum of 50 funds (or all funds in the Total Mapped Group if fewer than 50). Additional information, such as the ASPG quartile in which the fund's management fee rate ranked and the impact of the fund's performance adjustment, is also included in the chart and considered by the Board.
Fidelity International Small Cap Opportunities Fund
The Board noted that the fund's management fee rate ranked below the median of its Total Mapped Group and below the median of its ASPG for 2016. The Board also noted the effect of the fund's performance adjustment, if any, on the fund's management fee ranking.
The Board noted that, in 2014, the Board and the boards of other Fidelity funds formed the ad hoc Committee on Group Fee to conduct an in-depth review of the "group fee" component of the management fee of funds with such management fee structures. The Committee's focus included the mechanics of the group fee, the competitive landscape of group fee structures, Fidelity funds with no group fee component and investment products not included in group fee assets. The Board also considered that, for funds subject to the group fee, FMR agreed to voluntarily waive fees over a specified period of time in amounts designed to account for assets converted from certain funds to certain collective investment trusts.
The Board also noted that, in 2013, the ad hoc Committee on Management Fees was formed to conduct an in-depth review of the management fee rates of Fidelity's active equity mutual funds. The Committee focused on the following areas: (i) standard fee structures; (ii) research consumption and trading evolution; (iii) management fee competitiveness/profitability by category; and (iv) factors that drive institutional pricing.
Based on its review, the Board concluded that the fund's management fee is fair and reasonable in light of the services that the fund receives and the other factors considered.
Total Expense Ratio. In its review of each class's total expense ratio, the Board considered the fund's management fee rate as well as other fund or class expenses, as applicable, such as transfer agent fees, pricing and bookkeeping fees, fund-paid 12b-1 fees, and custodial, legal, and audit fees. The Board noted the impact of the fund's performance adjustment. The Board also noted that Fidelity may agree to waive fees and expenses from time to time, and the extent to which, if any, it has done so for the fund. As part of its review, the Board also considered the current and historical total expense ratios of each class of the fund compared to competitive fund median expenses. Each class of the fund is compared to those funds and classes in the Total Mapped Group (used by the Board for management fee comparisons) that have a similar sales load structure.
The Board noted that the total expense ratio of each of Class A, Class C, Class I, and the retail class ranked below the competitive median for 2016 and the total expense ratio of Class M (formerly Class T) ranked above the competitive median for 2016. The Board considered that, in general, various factors can affect total expense ratios. The Board noted that the total expense ratio of Class M was above the competitive median primarily because of higher 12b-1 fees on Class M as compared to most competitor funds. Class M has a higher 12b-1 fee, but a lower front-end sales charge, than traditionally priced front-end sales charge classes. The Board considered that Class M is primarily sold load-waived in the retirement plan market where its 0.50% 12b-1 fee is comparable to competing no-load, higher 12b-1 fee classes designed specifically for retirement plans. The Board noted that the fund offers multiple classes, each of which has a different sales load and 12b-1 fee structure, and that the multiple structures are intended to offer a range of pricing options for the intermediary market. The Board also noted that the total expense ratios of the classes vary primarily by the level of their 12b-1 fees, although differences in transfer agent fees may also cause expenses to vary from class to class.
Fees Charged to Other Fidelity Clients. The Board also considered Fidelity fee structures and other information with respect to clients of Fidelity, such as other funds advised or subadvised by Fidelity, pension plan clients, and other institutional clients with similar mandates. The Board noted that an ad hoc joint committee created by it and the boards of other Fidelity funds periodically (most recently in 2013) reviews and compares Fidelity's institutional investment advisory business with its business of providing services to the Fidelity funds, including the differences in services provided, fees charged, and costs incurred, as well as competition in their respective marketplaces.
Based on its review of total expense ratios and fees charged to other Fidelity clients, the Board concluded that, although Class M was above the median of the universe presented for comparison, the total expense ratio of each class of the fund was reasonable in light of the services that the fund and its shareholders receive and the other factors considered.
Costs of the Services and Profitability. The Board considered the revenues earned and the expenses incurred by Fidelity in conducting the business of developing, marketing, distributing, managing, administering and servicing the fund and servicing the fund's shareholders. The Board also considered the level of Fidelity's profits in respect of all the Fidelity funds.
On an annual basis, Fidelity presents to the Board information about the profitability of its relationships with the fund. Fidelity calculates profitability information for each fund, as well as aggregate profitability information for groups of Fidelity funds and all Fidelity funds, using a series of detailed revenue and cost allocation methodologies which originate with the books and records of Fidelity on which Fidelity's audited financial statements are based. The Audit Committee of the Board reviews any significant changes from the prior year's methodologies.
PricewaterhouseCoopers LLP (PwC), independent registered public accounting firm and auditor to Fidelity and certain Fidelity funds, has been engaged annually by the Board as part of the Board's assessment of Fidelity's profitability analysis. PwC's engagement includes the review and assessment of the methodologies used by Fidelity in determining the revenues and expenses attributable to Fidelity's mutual fund business, and completion of agreed-upon procedures in respect of the mathematical accuracy of the fund profitability information and its conformity to established allocation methodologies. After considering PwC's reports issued under the engagement and information provided by Fidelity, the Board concluded that while other allocation methods may also be reasonable, Fidelity's profitability methodologies are reasonable in all material respects.
The Board also reviewed Fidelity's non-fund businesses and potential fall-out benefits related to the mutual fund business as well as cases where Fidelity's affiliates may benefit from or be related to the fund's business.
The Board considered the costs of the services provided by and the profits realized by Fidelity in connection with the operation of the fund and was satisfied that the profitability was not excessive.
Economies of Scale. The Board considered whether there have been economies of scale in respect of the management of the Fidelity funds, whether the Fidelity funds (including the fund) have appropriately benefited from any such economies of scale, and whether there is potential for realization of any further economies of scale. The Board considered the extent to which the fund will benefit from economies of scale as assets grow through increased services to the fund, through waivers or reimbursements, or through fee or expense ratio reductions. The Board also noted that a committee (the Economies of Scale Committee) created by it and the boards of other Fidelity funds periodically (most recently in 2013) analyzes whether Fidelity attains economies of scale in respect of the management and servicing of the Fidelity funds, whether the Fidelity funds have appropriately benefited from such economies of scale, and whether there is potential for realization of any further economies of scale.
The Board recognized that the fund's management contract incorporates a "group fee" structure, which provides for lower group fee rates as total group assets increase, and for higher group fee rates as total group assets decrease (with "group assets" defined to include fund assets under FMR's management plus the assets of sector funds previously under FMR's management). FMR calculates the group fee rates based on a tiered asset "breakpoint" schedule that varies based on asset class. The Board considered that the group fee is designed to deliver the benefits of economies of scale to fund shareholders when total Fidelity fund assets increase, even if assets of any particular fund are unchanged or have declined, because some portion of Fidelity's costs are attributable to services provided to all Fidelity funds, and all funds benefit if those costs can be allocated among more assets. The Board concluded that, given the group fee structure, fund shareholders will benefit from lower management fees as group assets increase at the fund complex level, regardless of whether Fidelity achieves any such economies of scale.
The Board concluded, taking into account the analysis of the Economies of Scale Committee, that economies of scale, if any, are being appropriately shared between fund shareholders and Fidelity.
Additional Information Requested by the Board. In order to develop fully the factual basis for consideration of the Fidelity funds' advisory contracts, the Board requested and received additional information on certain topics, including: (i) fund performance trends, in particular the underperformance of certain funds, and Fidelity's long-term strategies for certain funds; (ii) Fidelity's fund profitability methodology, profitability trends for certain funds, and the impact of certain factors on fund profitability results, including the impact of market trends on actively managed funds; (iii) the use of performance fees and the calculation of performance adjustments, including the impact of underperformance and fund outflows on performance adjustments; (iv) metrics for evaluating index fund performance; (v) Fidelity's group fee structure, including the group fee breakpoint schedules; (vi) the terms of Fidelity's contractual and voluntary expense cap arrangements with the funds; (vii) the methodology with respect to evaluating competitive fund data and peer group classifications and fee comparisons; (viii) the expense structures for different funds and classes; (ix) Fidelity's arrangements with affiliated sub-advisers on behalf of the funds; (x) information regarding other accounts managed by Fidelity, including institutional accounts and collective investment trusts; (xi) recent changes to the fee structure for certain funds of funds; and (xii) the impact of the Department of Labor's new fiduciary rule on the funds' comparative expense information.
Based on its evaluation of all of the conclusions noted above, and after considering all factors it believed relevant, the Board concluded that the advisory fee structures are fair and reasonable, and that the fund's Advisory Contracts should be renewed.
AILS-ANN-1217
1.815091.112
Fidelity® Global Commodity Stock Fund
Annual Report October 31, 2017 |
|
Contents
To view a fund's proxy voting guidelines and proxy voting record for the 12-month period ended June 30, visit http://www.fidelity.com/proxyvotingresults or visit the Securities and Exchange Commission's (SEC) web site at http://www.sec.gov.
You may also call 1-800-544-8544 to request a free copy of the proxy voting guidelines.
Standard & Poor's, S&P and S&P 500 are registered service marks of The McGraw-Hill Companies, Inc. and have been licensed for use by Fidelity Distributors Corporation.
Other third-party marks appearing herein are the property of their respective owners.
All other marks appearing herein are registered or unregistered trademarks or service marks of FMR LLC or an affiliated company. © 2017 FMR LLC. All rights reserved.
This report and the financial statements contained herein are submitted for the general information of the shareholders of the Fund. This report is not authorized for distribution to prospective investors in the Fund unless preceded or accompanied by an effective prospectus.
A fund files its complete schedule of portfolio holdings with the SEC for the first and third quarters of each fiscal year on Form N-Q. Forms N-Q are available on the SEC’s web site at http://www.sec.gov. A fund's Forms N-Q may be reviewed and copied at the SEC’s Public Reference Room in Washington, DC. Information regarding the operation of the SEC's Public Reference Room may be obtained by calling 1-800-SEC-0330.
For a complete list of a fund's portfolio holdings, view the most recent holdings listing, semiannual report, or annual report on Fidelity's web site at http://www.fidelity.com, http://www.institutional.fidelity.com, or http://www.401k.com, as applicable.
NOT FDIC INSURED •MAY LOSE VALUE •NO BANK GUARANTEE
Neither the Fund nor Fidelity Distributors Corporation is a bank.
Performance: The Bottom Line
Average annual total return reflects the change in the value of an investment, assuming reinvestment of distributions from dividend income and capital gains (the profits earned upon the sale of securities that have grown in value, if any) and assuming a constant rate of performance each year. The hypothetical investment and the average annual total returns do not reflect the deduction of taxes that a shareholder would pay on fund distributions or the redemption of fund shares. During periods of reimbursement by Fidelity, a fund’s total return will be greater than it would be had the reimbursement not occurred. How a fund did yesterday is no guarantee of how it will do tomorrow.
Average Annual Total Returns
| For the periods ended October 31, 2017 | Past 1 year | Past 5 years | Life of fundA |
| Fidelity® Global Commodity Stock Fund | 18.65% | (1.37)% | 4.03% |
A From March 25, 2009
$10,000 Over Life of Fund
Let's say hypothetically that $10,000 was invested in Fidelity® Global Commodity Stock Fund, a class of the fund, on March 25, 2009, when the fund started.
The chart shows how the value of your investment would have changed, and also shows how the MSCI ACWI (All Country World Index) Index performed over the same period.
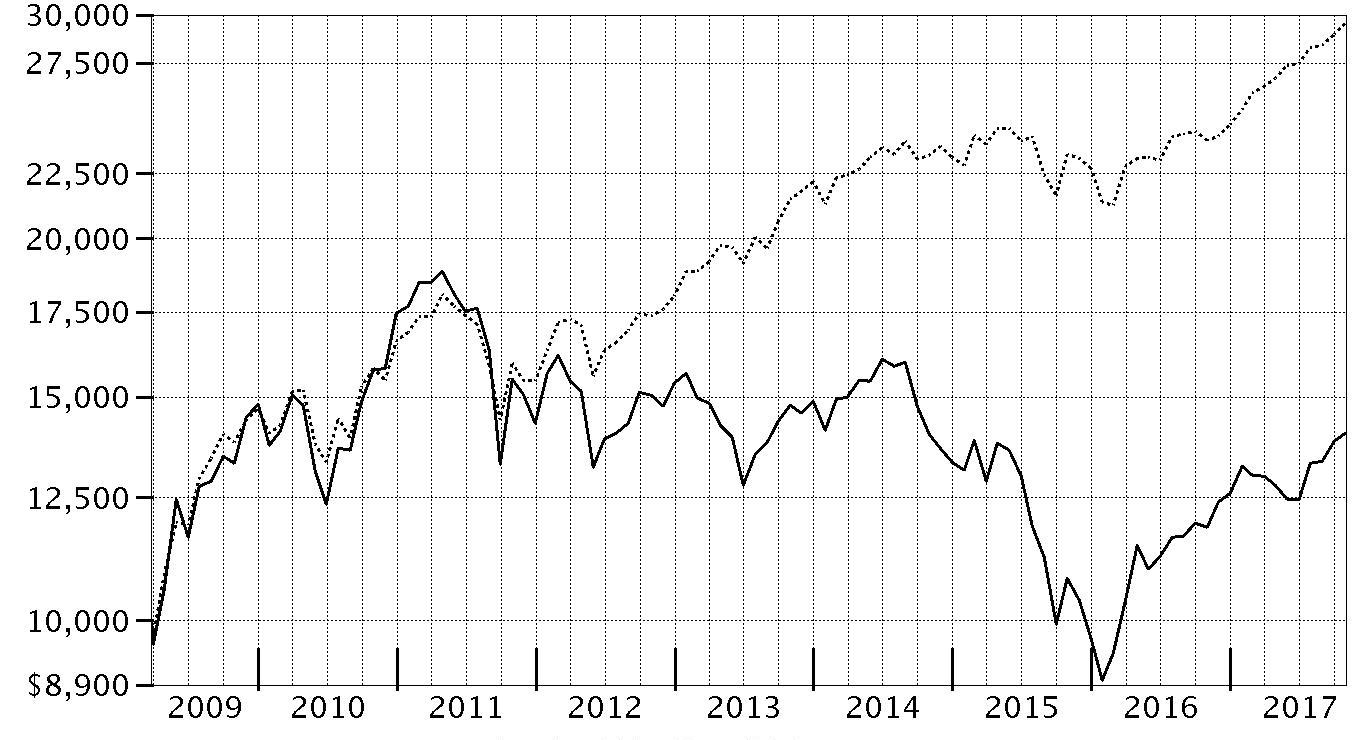
| Period Ending Values |
| $14,046 | Fidelity® Global Commodity Stock Fund |
| $29,566 | MSCI ACWI (All Country World Index) Index |
Management's Discussion of Fund Performance
Market Recap: The MSCI ACWI (All Country World Index) Index returned 23.70% for the 12 months ending October 31, 2017, helped partly by a generally weak U.S. dollar. Favorable election results in continental Europe (+30%) suggested ebbing political uncertainty and near-term risk there, but the U.K. (+20%) faced more-mixed conditions ahead of its expected exit from the European Union. Despite central-bank easing – and pressured recently by yen strength – Japan (+18%) lagged the rest of the Asia-Pacific group (+23%). Commodity-price volatility slowed Canada (+17%), but the emerging-markets group (+26%) sped ahead. The U.S. (+23%) finished close to the index result. Sector-wise, information technology (+41%) was driven by a surge among several U.S. and Chinese internet-related names. Financials (+31%) rode rising interest rates that, at the same time, weighed on real estate (+13%) as well as utilities (+15%), consumer staples (+9%) and telecommunication services (+5%) – so-called “bond proxy” sectors. Materials (+28%) and industrials (+26%) responded to demand from China and price gains for certain commodities. In the energy sector (+10%), oil prices lost ground in the spring before rebounding through October 31 to end well above where they started 12 months ago. Lastly, health care (+20%) was hurt by early-period turmoil around drug pricing and health care legislation.
Comments from Portfolio Manager S. Joseph Wickwire II, CFA: For the fiscal year, the fund's share classes (excluding sales charges, if applicable) gained roughly 18% to 19%, trailing the 20.52% gain of the industry index, the MSCI All Country World Commodity Producers Sector Capped Index. The fund also lagged the broader global equity market, as measured by the MSCI ACWI (All Country World Index) Index. Overall, global economic improvement, particularly in foreign markets, provided a tailwind for many commodity producers. Versus the commodities-focused industry index, the fund was hindered most by an overweighting in the exploration & production group, which gained about 1%. Here, notable individual detractors included Range Resources and a sizable position in Anadarko Petroleum. Elsewhere, underweighting the paper products subindustry held back our relative result, including largely avoiding Brazil's Fibria Celulose, as shares of the pulp and paper manufacturer roughly doubled this period. Turning to contributors, good stock selection among agriculture-related firms boosted the fund's relative return, led by North American fertilizer manufacturer CF Industries Holdings and Chicago-based food processor Archer Daniels Midland. Lastly, a sizable underweighting in relatively poor-performing integrated oil giant Exxon Mobil was the fund's top relative contributor the past 12 months.
The views expressed above reflect those of the portfolio manager(s) only through the end of the period as stated on the cover of this report and do not necessarily represent the views of Fidelity or any other person in the Fidelity organization. Any such views are subject to change at any time based upon market or other conditions and Fidelity disclaims any responsibility to update such views. These views may not be relied on as investment advice and, because investment decisions for a Fidelity fund are based on numerous factors, may not be relied on as an indication of trading intent on behalf of any Fidelity fund.
Investment Summary (Unaudited)
Top Ten Stocks as of October 31, 2017
| | % of fund's net assets | % of fund's net assets 6 months ago |
| BHP Billiton PLC | 4.5 | 4.4 |
| Chevron Corp. | 4.2 | 4.2 |
| Rio Tinto PLC | 3.4 | 4.1 |
| Exxon Mobil Corp. | 3.3 | 1.5 |
| Potash Corp. of Saskatchewan, Inc. | 3.1 | 2.6 |
| Glencore Xstrata PLC | 2.8 | 3.4 |
| Agrium, Inc. | 2.6 | 2.2 |
| Total SA | 2.4 | 2.2 |
| FMC Corp. | 2.2 | 1.3 |
| Anadarko Petroleum Corp. | 2.2 | 2.2 |
| | 30.7 | |
Top Sectors (% of fund's net assets)
| As of October 31, 2017 |
| | Energy | 32.7% |
| | Metals | 32.7% |
| | Agriculture | 26.2% |
| | Other | 7.2% |
| | Short-Term Investments and Net Other Assets | 1.2% |

| As of April 30, 2017 |
| | Energy | 34.5% |
| | Metals | 31.3% |
| | Agriculture | 28.7% |
| | Other | 3.9% |
| | Short-Term Investments and Net Other Assets | 1.6% |

Investments October 31, 2017
Showing Percentage of Net Assets
| Common Stocks - 97.2% | | | |
| | | Shares | Value |
| Chemicals - 17.7% | | | |
| Commodity Chemicals - 0.9% | | | |
| LyondellBasell Industries NV Class A | | 35,100 | $3,633,903 |
| Methanex Corp. | | 4,200 | 204,677 |
| | | | 3,838,580 |
| Diversified Chemicals - 1.0% | | | |
| DowDuPont, Inc. | | 42,358 | 3,062,907 |
| Eastman Chemical Co. | | 5,000 | 454,050 |
| The Chemours Co. LLC | | 16,200 | 917,082 |
| | | | 4,434,039 |
| Fertilizers & Agricultural Chemicals - 15.3% | | | |
| Agrium, Inc. | | 103,200 | 11,235,129 |
| CF Industries Holdings, Inc. | | 221,760 | 8,422,445 |
| FMC Corp. | | 100,300 | 9,313,858 |
| K&S AG (a) | | 140,100 | 3,397,730 |
| Monsanto Co. | | 61,200 | 7,411,320 |
| Potash Corp. of Saskatchewan, Inc. | | 687,000 | 13,371,498 |
| The Mosaic Co. | | 285,161 | 6,370,497 |
| UPL Ltd. | | 109,900 | 1,356,650 |
| Yara International ASA | | 100,400 | 4,766,787 |
| | | | 65,645,914 |
| Specialty Chemicals - 0.5% | | | |
| Platform Specialty Products Corp. (b) | | 119,500 | 1,278,650 |
| W.R. Grace & Co. | | 10,300 | 787,847 |
| | | | 2,066,497 |
|
| TOTAL CHEMICALS | | | 75,985,030 |
|
| Construction Materials - 0.2% | | | |
| Construction Materials - 0.2% | | | |
| Buzzi Unicem SpA | | 15,600 | 434,848 |
| CEMEX S.A.B. de CV sponsored ADR | | 51,800 | 420,098 |
| | | | 854,946 |
| Containers & Packaging - 0.1% | | | |
| Paper Packaging - 0.1% | | | |
| Graphic Packaging Holding Co. | | 14,100 | 218,409 |
| WestRock Co. | | 3,459 | 212,140 |
| | | | 430,549 |
| Energy Equipment & Services - 0.7% | | | |
| Oil & Gas Equipment & Services - 0.7% | | | |
| Baker Hughes, a GE Co. Class A | | 40,700 | 1,279,201 |
| John Wood Group PLC | | 139,100 | 1,314,465 |
| Schlumberger Ltd. | | 10,000 | 640,000 |
| | | | 3,233,666 |
| Food Products - 5.7% | | | |
| Agricultural Products - 5.5% | | | |
| Archer Daniels Midland Co. | | 78,000 | 3,187,860 |
| Bunge Ltd. | | 108,100 | 7,435,118 |
| Darling International, Inc. (b) | | 194,800 | 3,555,100 |
| First Resources Ltd. | | 1,532,700 | 2,215,112 |
| Ingredion, Inc. | | 42,500 | 5,327,375 |
| Wilmar International Ltd. | | 709,100 | 1,763,516 |
| | | | 23,484,081 |
| Packaged Foods & Meats - 0.2% | | | |
| Adecoagro SA (b) | | 106,700 | 1,084,072 |
|
| TOTAL FOOD PRODUCTS | | | 24,568,153 |
|
| Independent Power and Renewable Electricity Producers - 0.6% | | | |
| Independent Power Producers & Energy Traders - 0.6% | | | |
| China Resources Power Holdings Co. Ltd. | | 476,000 | 915,220 |
| NRG Energy, Inc. | | 25,100 | 627,500 |
| The AES Corp. | | 91,400 | 971,582 |
| | | | 2,514,302 |
| Machinery - 1.4% | | | |
| Agricultural & Farm Machinery - 0.4% | | | |
| AGCO Corp. | | 600 | 41,142 |
| Deere & Co. | | 6,400 | 850,432 |
| Jain Irrigation Systems Ltd. | | 617,859 | 977,601 |
| | | | 1,869,175 |
| Construction Machinery & Heavy Trucks - 0.4% | | | |
| Allison Transmission Holdings, Inc. | | 36,400 | 1,546,636 |
| Caterpillar, Inc. | | 400 | 54,320 |
| | | | 1,600,956 |
| Industrial Machinery - 0.6% | | | |
| Andritz AG | | 15,300 | 865,090 |
| Mitsubishi Heavy Industries Ltd. | | 21,400 | 837,316 |
| The Weir Group PLC | | 40,700 | 1,055,708 |
| | | | 2,758,114 |
|
| TOTAL MACHINERY | | | 6,228,245 |
|
| Metals & Mining - 32.3% | | | |
| Copper - 2.6% | | | |
| First Quantum Minerals Ltd. | | 619,124 | 6,925,013 |
| Freeport-McMoRan, Inc. (b) | | 290,000 | 4,054,200 |
| | | | 10,979,213 |
| Diversified Metals & Mining - 14.8% | | | |
| Anglo American PLC (United Kingdom) | | 236,651 | 4,463,174 |
| Arizona Mining, Inc. (b) | | 635,900 | 1,597,020 |
| BHP Billiton PLC | | 1,067,704 | 19,331,472 |
| Boliden AB | | 55,200 | 1,931,949 |
| Glencore Xstrata PLC | | 2,465,935 | 11,888,728 |
| Grupo Mexico SA de CV Series B | | 408,820 | 1,329,343 |
| Ivanhoe Mines Ltd. (b) | | 586,900 | 2,124,504 |
| Korea Zinc Co. Ltd. | | 1,992 | 912,184 |
| MMC Norilsk Nickel PJSC sponsored ADR | | 45,700 | 840,880 |
| Rio Tinto PLC | | 304,887 | 14,409,155 |
| South32 Ltd. | | 509,778 | 1,314,834 |
| Teck Resources Ltd. Class B (sub. vtg.) | | 118,900 | 2,429,427 |
| Turquoise Hill Resources Ltd. (b) | | 311,400 | 951,024 |
| | | | 63,523,694 |
| Gold - 7.3% | | | |
| Agnico Eagle Mines Ltd. (Canada) | | 47,000 | 2,098,442 |
| AngloGold Ashanti Ltd. sponsored ADR | | 117,500 | 1,092,750 |
| B2Gold Corp. (b) | | 862,180 | 2,192,040 |
| Barrick Gold Corp. | | 327,500 | 4,731,881 |
| Compania de Minas Buenaventura SA sponsored ADR | | 30,200 | 416,458 |
| Continental Gold, Inc. (b) | | 571,800 | 1,373,987 |
| Detour Gold Corp. (b) | | 79,800 | 850,515 |
| Eldorado Gold Corp. | | 259,600 | 325,984 |
| Goldcorp, Inc. | | 140,110 | 1,829,977 |
| Guyana Goldfields, Inc. (b) | | 306,000 | 1,091,078 |
| Kinross Gold Corp. (b) | | 110,000 | 434,850 |
| Newcrest Mining Ltd. | | 63,442 | 1,088,125 |
| Newmont Mining Corp. | | 123,600 | 4,469,376 |
| Premier Gold Mines Ltd. (b) | | 1,044,900 | 2,778,085 |
| Randgold Resources Ltd. sponsored ADR | | 19,200 | 1,886,784 |
| Resolute Mng Ltd. | | 516,514 | 407,173 |
| Seabridge Gold, Inc. (b) | | 33,200 | 451,520 |
| SEMAFO, Inc. (b) | | 441,100 | 1,107,793 |
| Sibanye-Stillwater ADR (a) | | 213,428 | 1,094,886 |
| Solgold PLC (a)(b) | | 575,000 | 253,926 |
| Teranga Gold Corp. (b) | | 174,600 | 354,586 |
| Torex Gold Resources, Inc. (b) | | 76,470 | 1,054,493 |
| | | | 31,384,709 |
| Precious Metals & Minerals - 0.7% | | | |
| Alrosa Co. Ltd. | | 625,000 | 803,694 |
| Dalradian Resources, Inc. (b) | | 10,000 | 9,457 |
| Fresnillo PLC | | 48,300 | 835,228 |
| Gold Standard Ventures Corp. (b) | | 721,400 | 952,247 |
| Impala Platinum Holdings Ltd. (b) | | 122,400 | 339,530 |
| Osisko Mining, Inc. (b) | | 5,000 | 15,270 |
| | | | 2,955,426 |
| Silver - 0.7% | | | |
| Wheaton Precious Metals Corp. | | 143,900 | 2,985,972 |
| Steel - 6.2% | | | |
| ArcelorMittal SA Class A unit (a)(b) | | 172,102 | 4,922,117 |
| China Steel Corp. | | 530,000 | 431,731 |
| Fortescue Metals Group Ltd. | | 258,456 | 917,835 |
| Hyundai Steel Co. | | 28,152 | 1,447,773 |
| JFE Holdings, Inc. | | 105,300 | 2,263,032 |
| Nippon Steel & Sumitomo Metal Corp. | | 101,200 | 2,426,318 |
| Nucor Corp. | | 65,692 | 3,798,968 |
| POSCO | | 15,312 | 4,472,250 |
| Steel Dynamics, Inc. | | 53,600 | 1,994,456 |
| Thyssenkrupp AG | | 93,700 | 2,499,999 |
| Vale SA sponsored ADR | | 152,741 | 1,495,334 |
| | | | 26,669,813 |
|
| TOTAL METALS & MINING | | | 138,498,827 |
|
| Multi-Utilities - 0.2% | | | |
| Multi-Utilities - 0.2% | | | |
| E.ON AG | | 77,600 | 919,129 |
| Oil, Gas & Consumable Fuels - 32.4% | | | |
| Coal & Consumable Fuels - 0.1% | | | |
| Cameco Corp. | | 53,100 | 431,353 |
| Integrated Oil & Gas - 17.7% | | | |
| BP PLC | | 1,023,500 | 6,942,053 |
| Cenovus Energy, Inc. | | 294,700 | 2,859,967 |
| Chevron Corp. | | 156,300 | 18,113,607 |
| China Petroleum & Chemical Corp. (H Shares) | | 2,756,000 | 2,023,782 |
| Exxon Mobil Corp. | | 170,500 | 14,211,175 |
| Gazprom OAO | | 195,000 | 419,810 |
| Imperial Oil Ltd. | | 28,400 | 920,837 |
| Lukoil PJSC sponsored ADR | | 42,200 | 2,240,820 |
| Occidental Petroleum Corp. | | 13,100 | 845,867 |
| Royal Dutch Shell PLC: | | | |
| Class A (United Kingdom) | | 122,000 | 3,840,535 |
| Class B (United Kingdom) | | 44,393 | 1,429,334 |
| Statoil ASA (a) | | 116,900 | 2,375,118 |
| Suncor Energy, Inc. | | 240,632 | 8,169,663 |
| Total SA | | 185,600 | 10,344,999 |
| YPF SA Class D sponsored ADR (b) | | 50,300 | 1,235,368 |
| | | | 75,972,935 |
| Oil & Gas Exploration & Production - 13.0% | | | |
| Anadarko Petroleum Corp. | | 187,800 | 9,271,686 |
| Apache Corp. | | 40,500 | 1,675,485 |
| Cabot Oil & Gas Corp. | | 40,900 | 1,132,930 |
| Canadian Natural Resources Ltd. | | 83,300 | 2,906,880 |
| Centennial Resource Development, Inc. Class A | | 2,500 | 48,575 |
| Cimarex Energy Co. | | 9,000 | 1,052,370 |
| CNOOC Ltd. sponsored ADR | | 23,600 | 3,226,120 |
| ConocoPhillips Co. | | 98,500 | 5,038,275 |
| Continental Resources, Inc. (b) | | 50,292 | 2,047,387 |
| Devon Energy Corp. | | 42,100 | 1,553,490 |
| Diamondback Energy, Inc. (b) | | 14,400 | 1,543,104 |
| Encana Corp. | | 40,600 | 474,889 |
| EOG Resources, Inc. | | 44,100 | 4,404,267 |
| EQT Corp. | | 33,601 | 2,101,407 |
| Hess Corp. | | 25,300 | 1,117,248 |
| INPEX Corp. | | 84,600 | 905,828 |
| Marathon Oil Corp. | | 92,800 | 1,319,616 |
| Murphy Oil Corp. | | 34,400 | 920,200 |
| Newfield Exploration Co. (b) | | 37,000 | 1,139,230 |
| Noble Energy, Inc. | | 139,200 | 3,879,504 |
| NOVATEK OAO GDR (Reg. S) | | 13,400 | 1,528,940 |
| Pioneer Natural Resources Co. | | 14,010 | 2,096,877 |
| PrairieSky Royalty Ltd. | | 61,398 | 1,634,298 |
| Range Resources Corp. (a) | | 97,900 | 1,772,969 |
| RSP Permian, Inc. (b) | | 25,850 | 889,499 |
| Southwestern Energy Co. (b) | | 191,700 | 1,063,935 |
| Woodside Petroleum Ltd. | | 37,311 | 877,525 |
| | | | 55,622,534 |
| Oil & Gas Refining & Marketing - 0.3% | | | |
| Bharat Petroleum Corp. Ltd. | | 58,500 | 489,322 |
| Reliance Industries Ltd. | | 59,400 | 863,112 |
| | | | 1,352,434 |
| Oil & Gas Storage & Transport - 1.3% | | | |
| Boardwalk Pipeline Partners, LP | | 75,900 | 1,064,118 |
| Cheniere Energy, Inc. (b) | | 19,100 | 892,734 |
| Golar LNG Ltd. (a) | | 42,500 | 898,025 |
| Kinder Morgan, Inc. | | 56,300 | 1,019,593 |
| Petronet LNG Ltd. | | 207,500 | 832,724 |
| Scorpio Tankers, Inc. | | 245,700 | 874,692 |
| | | | 5,581,886 |
|
| TOTAL OIL, GAS & CONSUMABLE FUELS | | | 138,961,142 |
|
| Paper & Forest Products - 5.2% | | | |
| Forest Products - 0.3% | | | |
| Quintis Ltd. (c) | | 413,280 | 93,310 |
| Svenska Cellulosa AB (SCA) (B Shares) | | 137,700 | 1,292,842 |
| | | | 1,386,152 |
| Paper Products - 4.9% | | | |
| Mondi PLC | | 297,600 | 7,197,638 |
| Nine Dragons Paper (Holdings) Ltd. | | 414,000 | 759,925 |
| Sappi Ltd. | | 285,361 | 1,911,321 |
| Stora Enso Oyj (R Shares) | | 130,600 | 2,043,098 |
| UPM-Kymmene Corp. | | 295,100 | 8,868,679 |
| | | | 20,780,661 |
|
| TOTAL PAPER & FOREST PRODUCTS | | | 22,166,813 |
|
| Pharmaceuticals - 0.3% | | | |
| Pharmaceuticals - 0.3% | | | |
| Bayer AG | | 11,100 | 1,443,877 |
| Trading Companies & Distributors - 0.4% | | | |
| Trading Companies & Distributors - 0.4% | | | |
| Univar, Inc. (b) | | 53,000 | 1,576,750 |
| TOTAL COMMON STOCKS | | | |
| (Cost $460,294,912) | | | 417,381,429 |
|
| Nonconvertible Preferred Stocks - 1.6% | | | |
| Metals & Mining - 0.4% | | | |
| Steel - 0.4% | | | |
| Gerdau SA (PN) | | 52,000 | 174,059 |
| Gerdau SA sponsored ADR | | 532,900 | 1,763,899 |
| | | | 1,937,958 |
| Oil, Gas & Consumable Fuels - 0.9% | | | |
| Integrated Oil & Gas - 0.9% | | | |
| Petroleo Brasileiro SA - Petrobras (PN) sponsored ADR (non-vtg.) (b) | | 356,900 | 3,658,225 |
| Paper & Forest Products - 0.3% | | | |
| Paper Products - 0.3% | | | |
| Suzano Papel e Celulose SA | | 177,900 | 1,105,587 |
| TOTAL NONCONVERTIBLE PREFERRED STOCKS | | | |
| (Cost $6,045,313) | | | 6,701,770 |
|
| Money Market Funds - 3.7% | | | |
| Fidelity Cash Central Fund, 1.10% (d) | | 3,156,335 | 3,156,966 |
| Fidelity Securities Lending Cash Central Fund 1.11% (d)(e) | | 12,638,057 | 12,639,320 |
| TOTAL MONEY MARKET FUNDS | | | |
| (Cost $15,796,730) | | | 15,796,286 |
| TOTAL INVESTMENT IN SECURITIES - 102.5% | | | |
| (Cost $482,136,955) | | | 439,879,485 |
| NET OTHER ASSETS (LIABILITIES) - (2.5)% | | | (10,583,395) |
| NET ASSETS - 100% | | | $429,296,090 |
Legend
(a) Security or a portion of the security is on loan at period end.
(b) Non-income producing
(c) Level 3 security
(d) Affiliated fund that is generally available only to investment companies and other accounts managed by Fidelity Investments. The rate quoted is the annualized seven-day yield of the fund at period end. A complete unaudited listing of the fund's holdings as of its most recent quarter end is available upon request. In addition, each Fidelity Central Fund's financial statements, which are not covered by the Fund's Report of Independent Registered Public Accounting Firm, are available on the SEC's website or upon request.
(e) Investment made with cash collateral received from securities on loan.
Affiliated Central Funds
Information regarding fiscal year to date income earned by the Fund from investments in Fidelity Central Funds is as follows:
| Fund | Income earned |
| Fidelity Cash Central Fund | $42,932 |
| Fidelity Securities Lending Cash Central Fund | 132,727 |
| Total | $175,659 |
Investment Valuation
The following is a summary of the inputs used, as of October 31, 2017, involving the Fund's assets and liabilities carried at fair value. The inputs or methodology used for valuing securities may not be an indication of the risk associated with investing in those securities. For more information on valuation inputs, and their aggregation into the levels used below, please refer to the Investment Valuation section in the accompanying Notes to Financial Statements.
| | Valuation Inputs at Reporting Date: |
| Description | Total | Level 1 | Level 2 | Level 3 |
| Investments in Securities: | | | | |
| Common Stocks | $417,381,429 | $343,323,921 | $73,964,198 | $93,310 |
| Nonconvertible Preferred Stocks | 6,701,770 | 6,701,770 | -- | -- |
| Money Market Funds | 15,796,286 | 15,796,286 | -- | -- |
| Total Investments in Securities: | $439,879,485 | $365,821,977 | $73,964,198 | $93,310 |
Other Information
Distribution of investments by country or territory of incorporation, as a percentage of Total Net Assets, is as follows (Unaudited):
| United States of America | 37.0% |
| Canada | 18.9% |
| United Kingdom | 14.2% |
| Bailiwick of Jersey | 3.2% |
| Finland | 2.6% |
| France | 2.4% |
| Bermuda | 2.1% |
| Germany | 2.0% |
| Brazil | 1.9% |
| Norway | 1.7% |
| Korea (South) | 1.5% |
| Japan | 1.5% |
| Luxembourg | 1.3% |
| Russia | 1.3% |
| Australia | 1.1% |
| South Africa | 1.0% |
| India | 1.0% |
| Others (Individually Less Than 1%) | 5.3% |
| | 100.0% |
See accompanying notes which are an integral part of the financial statements.
Financial Statements
Statement of Assets and Liabilities
| | | October 31, 2017 |
| Assets | | |
Investment in securities, at value (including securities loaned of $12,167,784) — See accompanying schedule:
Unaffiliated issuers (cost $466,340,225) | $424,083,199 | |
| Fidelity Central Funds (cost $15,796,730) | 15,796,286 | |
| Total Investment in Securities (cost $482,136,955) | | $439,879,485 |
| Foreign currency held at value (cost $276,467) | | 277,381 |
| Receivable for investments sold | | 3,102,219 |
| Receivable for fund shares sold | | 3,413,322 |
| Dividends receivable | | 458,224 |
| Distributions receivable from Fidelity Central Funds | | 7,953 |
| Prepaid expenses | | 909 |
| Other receivables | | 19,507 |
| Total assets | | 447,159,000 |
| Liabilities | | |
| Payable for investments purchased | $4,312,349 | |
| Payable for fund shares redeemed | 477,301 | |
| Accrued management fee | 247,456 | |
| Distribution and service plan fees payable | 21,130 | |
| Other affiliated payables | 109,187 | |
| Other payables and accrued expenses | 54,915 | |
| Collateral on securities loaned | 12,640,572 | |
| Total liabilities | | 17,862,910 |
| Net Assets | | $429,296,090 |
| Net Assets consist of: | | |
| Paid in capital | | $531,459,376 |
| Undistributed net investment income | | 4,378,040 |
| Accumulated undistributed net realized gain (loss) on investments and foreign currency transactions | | (64,262,092) |
| Net unrealized appreciation (depreciation) on investments and assets and liabilities in foreign currencies | | (42,279,234) |
| Net Assets | | $429,296,090 |
| Calculation of Maximum Offering Price | | |
| Class A: | | |
| Net Asset Value and redemption price per share ($29,919,799 ÷ 2,382,606 shares) | | $12.56 |
| Maximum offering price per share (100/94.25 of $12.56) | | $13.33 |
| Class M: | | |
| Net Asset Value and redemption price per share ($6,876,025 ÷ 548,659 shares) | | $12.53 |
| Maximum offering price per share (100/96.50 of $12.53) | | $12.98 |
| Class C: | | |
| Net Asset Value and offering price per share ($14,288,713 ÷ 1,152,801 shares)(a) | | $12.39 |
| Global Commodity Stock: | | |
| Net Asset Value, offering price and redemption price per share ($264,556,747 ÷ 21,006,163 shares) | | $12.59 |
| Class I: | | |
| Net Asset Value, offering price and redemption price per share ($113,654,806 ÷ 9,022,691 shares) | | $12.60 |
(a) Redemption price per share is equal to net asset value less any applicable contingent deferred sales charge.
See accompanying notes which are an integral part of the financial statements.
Statement of Operations
| | | Year ended October 31, 2017 |
| Investment Income | | |
| Dividends | | $10,152,766 |
| Income from Fidelity Central Funds | | 175,659 |
| Income before foreign taxes withheld | | 10,328,425 |
| Less foreign taxes withheld | | (502,978) |
| Total income | | 9,825,447 |
| Expenses | | |
| Management fee | $2,861,185 | |
| Transfer agent fees | 1,084,396 | |
| Distribution and service plan fees | 255,937 | |
| Accounting and security lending fees | 215,262 | |
| Custodian fees and expenses | 58,348 | |
| Independent trustees' fees and expenses | 1,608 | |
| Registration fees | 88,279 | |
| Audit | 58,197 | |
| Legal | 1,209 | |
| Miscellaneous | 2,887 | |
| Total expenses before reductions | 4,627,308 | |
| Expense reductions | (43,280) | 4,584,028 |
| Net investment income (loss) | | 5,241,419 |
| Realized and Unrealized Gain (Loss) | | |
| Net realized gain (loss) on: | | |
| Investment securities: | | |
| Unaffiliated issuers | 30,393,066 | |
| Fidelity Central Funds | (2,036) | |
| Foreign currency transactions | (36,581) | |
| Total net realized gain (loss) | | 30,354,449 |
| Change in net unrealized appreciation (depreciation) on: | | |
| Investment securities: | | |
| Unaffiliated issuers | 31,183,525 | |
| Fidelity Central Funds | (444) | |
| Assets and liabilities in foreign currencies | 8,727 | |
| Total change in net unrealized appreciation (depreciation) | | 31,191,808 |
| Net gain (loss) | | 61,546,257 |
| Net increase (decrease) in net assets resulting from operations | | $66,787,676 |
See accompanying notes which are an integral part of the financial statements.
Statement of Changes in Net Assets
| | Year ended October 31, 2017 | Year ended October 31, 2016 |
| Increase (Decrease) in Net Assets | | |
| Operations | | |
| Net investment income (loss) | $5,241,419 | $3,732,641 |
| Net realized gain (loss) | 30,354,449 | (22,456,882) |
| Change in net unrealized appreciation (depreciation) | 31,191,808 | 48,478,395 |
| Net increase (decrease) in net assets resulting from operations | 66,787,676 | 29,754,154 |
| Distributions to shareholders from net investment income | (3,511,036) | (5,140,876) |
| Distributions to shareholders from net realized gain | (2,362,260) | (224,075) |
| Total distributions | (5,873,296) | (5,364,951) |
| Share transactions - net increase (decrease) | 15,840,057 | 97,100,151 |
| Redemption fees | 12,604 | 14,543 |
| Total increase (decrease) in net assets | 76,767,041 | 121,503,897 |
| Net Assets | | |
| Beginning of period | 352,529,049 | 231,025,152 |
| End of period | $429,296,090 | $352,529,049 |
| Other Information | | |
| Undistributed net investment income end of period | $4,378,040 | $3,009,856 |
See accompanying notes which are an integral part of the financial statements.
Financial Highlights
Fidelity Global Commodity Stock Fund Class A
| Years ended October 31, | 2017 | 2016 | 2015 | 2014 | 2013 |
| Selected Per–Share Data | | | | | |
| Net asset value, beginning of period | $10.73 | $10.05 | $13.25 | $14.17 | $14.59 |
| Income from Investment Operations | | | | | |
| Net investment income (loss)A | .12 | .11 | .22 | .15 | .16 |
| Net realized and unrealized gain (loss) | 1.86 | .79 | (3.25) | (.91) | (.45) |
| Total from investment operations | 1.98 | .90 | (3.03) | (.76) | (.29) |
| Distributions from net investment income | (.08) | (.21) | (.14) | (.15) | (.13) |
| Distributions from net realized gain | (.07) | (.01) | (.03) | (.01) | – |
| Total distributions | (.15) | (.22) | (.17) | (.16) | (.13) |
| Redemption fees added to paid in capitalA,B | – | – | – | – | – |
| Net asset value, end of period | $12.56 | $10.73 | $10.05 | $13.25 | $14.17 |
| Total ReturnC,D | 18.53% | 9.29% | (23.16)% | (5.41)% | (2.00)% |
| Ratios to Average Net AssetsE,F | | | | | |
| Expenses before reductions | 1.33% | 1.38% | 1.34% | 1.35% | 1.36% |
| Expenses net of fee waivers, if any | 1.33% | 1.38% | 1.34% | 1.35% | 1.35% |
| Expenses net of all reductions | 1.32% | 1.37% | 1.34% | 1.35% | 1.34% |
| Net investment income (loss) | 1.07% | 1.18% | 1.85% | 1.05% | 1.12% |
| Supplemental Data | | | | | |
| Net assets, end of period (000 omitted) | $29,920 | $34,791 | $31,391 | $51,586 | $71,293 |
| Portfolio turnover rateG | 81% | 85% | 77% | 75% | 65% |
A Calculated based on average shares outstanding during the period.
B Amount represents less than $.005 per share.
C Total returns would have been lower if certain expenses had not been reduced during the applicable periods shown.
D Total returns do not include the effect of the sales charges.
E Fees and expenses of any underlying Fidelity Central Funds are not included in the Fund's expense ratio. The Fund indirectly bears its proportionate share of the expenses of any underlying Fidelity Central Funds.
F Expense ratios reflect operating expenses of the class. Expenses before reductions do not reflect amounts reimbursed by the investment adviser or reductions from brokerage service arrangements or reductions from other expense offset arrangements and do not represent the amount paid by the class during periods when reimbursements or reductions occur. Expenses net of fee waivers reflect expenses after reimbursement by the investment adviser but prior to reductions from brokerage service arrangements or other expense offset arrangements. Expenses net of all reductions represent the net expenses paid by the class.
G Amount does not include the portfolio activity of any underlying Fidelity Central Funds.
See accompanying notes which are an integral part of the financial statements.
Fidelity Global Commodity Stock Fund Class M
| Years ended October 31, | 2017 | 2016 | 2015 | 2014 | 2013 |
| Selected Per–Share Data | | | | | |
| Net asset value, beginning of period | $10.72 | $10.02 | $13.21 | $14.13 | $14.54 |
| Income from Investment Operations | | | | | |
| Net investment income (loss)A | .09 | .09 | .19 | .11 | .12 |
| Net realized and unrealized gain (loss) | 1.84 | .79 | (3.25) | (.90) | (.45) |
| Total from investment operations | 1.93 | .88 | (3.06) | (.79) | (.33) |
| Distributions from net investment income | (.05) | (.17) | (.10) | (.11) | (.08) |
| Distributions from net realized gain | (.07) | (.01) | (.03) | (.01) | – |
| Total distributions | (.12) | (.18) | (.13) | (.13)B | (.08) |
| Redemption fees added to paid in capitalA,C | – | – | – | – | – |
| Net asset value, end of period | $12.53 | $10.72 | $10.02 | $13.21 | $14.13 |
| Total ReturnD,E | 18.09% | 9.08% | (23.40)% | (5.65)% | (2.26)% |
| Ratios to Average Net AssetsF,G | | | | | |
| Expenses before reductions | 1.62% | 1.65% | 1.63% | 1.62% | 1.62% |
| Expenses net of fee waivers, if any | 1.62% | 1.65% | 1.63% | 1.62% | 1.61% |
| Expenses net of all reductions | 1.61% | 1.64% | 1.62% | 1.62% | 1.60% |
| Net investment income (loss) | .78% | .90% | 1.57% | .78% | .86% |
| Supplemental Data | | | | | |
| Net assets, end of period (000 omitted) | $6,876 | $6,068 | $6,335 | $9,867 | $12,551 |
| Portfolio turnover rateH | 81% | 85% | 77% | 75% | 65% |
A Calculated based on average shares outstanding during the period.
B Total distributions of $.13 per share is comprised of distributions from net investment income of $.113 and distributions from net realized gain of $.013 per share.
C Amount represents less than $.005 per share.
D Total returns would have been lower if certain expenses had not been reduced during the applicable periods shown.
E Total returns do not include the effect of the sales charges.
F Fees and expenses of any underlying Fidelity Central Funds are not included in the Fund's expense ratio. The Fund indirectly bears its proportionate share of the expenses of any underlying Fidelity Central Funds.
G Expense ratios reflect operating expenses of the class. Expenses before reductions do not reflect amounts reimbursed by the investment adviser or reductions from brokerage service arrangements or reductions from other expense offset arrangements and do not represent the amount paid by the class during periods when reimbursements or reductions occur. Expenses net of fee waivers reflect expenses after reimbursement by the investment adviser but prior to reductions from brokerage service arrangements or other expense offset arrangements. Expenses net of all reductions represent the net expenses paid by the class.
H Amount does not include the portfolio activity of any underlying Fidelity Central Funds.
See accompanying notes which are an integral part of the financial statements.
Fidelity Global Commodity Stock Fund Class C
| Years ended October 31, | 2017 | 2016 | 2015 | 2014 | 2013 |
| Selected Per–Share Data | | | | | |
| Net asset value, beginning of period | $10.61 | $9.92 | $13.06 | $13.96 | $14.37 |
| Income from Investment Operations | | | | | |
| Net investment income (loss)A | .04 | .04 | .13 | .04 | .05 |
| Net realized and unrealized gain (loss) | 1.82 | .78 | (3.22) | (.89) | (.44) |
| Total from investment operations | 1.86 | .82 | (3.09) | (.85) | (.39) |
| Distributions from net investment income | (.01) | (.12) | (.03) | (.03) | (.02) |
| Distributions from net realized gain | (.07) | (.01) | (.03) | (.01) | – |
| Total distributions | (.08) | (.13) | (.05)B | (.05)C | (.02) |
| Redemption fees added to paid in capitalA,D | – | – | – | – | – |
| Net asset value, end of period | $12.39 | $10.61 | $9.92 | $13.06 | $13.96 |
| Total ReturnE,F | 17.59% | 8.46% | (23.74)% | (6.13)% | (2.75)% |
| Ratios to Average Net AssetsG,H | | | | | |
| Expenses before reductions | 2.07% | 2.13% | 2.12% | 2.11% | 2.11% |
| Expenses net of fee waivers, if any | 2.07% | 2.13% | 2.12% | 2.11% | 2.11% |
| Expenses net of all reductions | 2.06% | 2.12% | 2.11% | 2.11% | 2.10% |
| Net investment income (loss) | .33% | .43% | 1.08% | .29% | .36% |
| Supplemental Data | | | | | |
| Net assets, end of period (000 omitted) | $14,289 | $12,620 | $11,274 | $17,659 | $23,830 |
| Portfolio turnover rateI | 81% | 85% | 77% | 75% | 65% |
A Calculated based on average shares outstanding during the period.
B Total distributions of $.05 per share is comprised of distributions from net investment income of $.025 and distributions from net realized gain of $.026 per share.
C Total distributions of $.05 per share is comprised of distributions from net investment income of $.033 and distributions from net realized gain of $.013 per share.
D Amount represents less than $.005 per share.
E Total returns would have been lower if certain expenses had not been reduced during the applicable periods shown.
F Total returns do not include the effect of the contingent deferred sales charge.
G Fees and expenses of any underlying Fidelity Central Funds are not included in the Fund's expense ratio. The Fund indirectly bears its proportionate share of the expenses of any underlying Fidelity Central Funds.
H Expense ratios reflect operating expenses of the class. Expenses before reductions do not reflect amounts reimbursed by the investment adviser or reductions from brokerage service arrangements or reductions from other expense offset arrangements and do not represent the amount paid by the class during periods when reimbursements or reductions occur. Expenses net of fee waivers reflect expenses after reimbursement by the investment adviser but prior to reductions from brokerage service arrangements or other expense offset arrangements. Expenses net of all reductions represent the net expenses paid by the class.
I Amount does not include the portfolio activity of any underlying Fidelity Central Funds.
See accompanying notes which are an integral part of the financial statements.
Fidelity Global Commodity Stock Fund
| Years ended October 31, | 2017 | 2016 | 2015 | 2014 | 2013 |
| Selected Per–Share Data | | | | | |
| Net asset value, beginning of period | $10.77 | $10.09 | $13.31 | $14.24 | $14.66 |
| Income from Investment Operations | | | | | |
| Net investment income (loss)A | .15 | .14 | .25 | .19 | .19 |
| Net realized and unrealized gain (loss) | 1.84 | .79 | (3.27) | (.92) | (.45) |
| Total from investment operations | 1.99 | .93 | (3.02) | (.73) | (.26) |
| Distributions from net investment income | (.11) | (.24) | (.18) | (.19) | (.16) |
| Distributions from net realized gain | (.07) | (.01) | (.03) | (.01) | – |
| Total distributions | (.17)B | (.25) | (.20)C | (.20) | (.16) |
| Redemption fees added to paid in capitalA,D | – | – | – | – | – |
| Net asset value, end of period | $12.59 | $10.77 | $10.09 | $13.31 | $14.24 |
| Total ReturnE | 18.65% | 9.62% | (22.97)% | (5.16)% | (1.75)% |
| Ratios to Average Net AssetsF,G | | | | | |
| Expenses before reductions | 1.10% | 1.13% | 1.12% | 1.11% | 1.11% |
| Expenses net of fee waivers, if any | 1.10% | 1.13% | 1.12% | 1.11% | 1.11% |
| Expenses net of all reductions | 1.09% | 1.12% | 1.11% | 1.11% | 1.09% |
| Net investment income (loss) | 1.30% | 1.43% | 2.08% | 1.29% | 1.37% |
| Supplemental Data | | | | | |
| Net assets, end of period (000 omitted) | $264,557 | $228,982 | $156,320 | $223,084 | $273,476 |
| Portfolio turnover rateH | 81% | 85% | 77% | 75% | 65% |
A Calculated based on average shares outstanding during the period.
B Total distributions of $.17 per share is comprised of distributions from net investment income of $.105 and distributions from net realized gain of $.068 per share.
C Total distributions of $.20 per share is comprised of distributions from net investment income of $.178 and distributions from net realized gain of $.026 per share.
D Amount represents less than $.005 per share.
E Total returns would have been lower if certain expenses had not been reduced during the applicable periods shown.
F Fees and expenses of any underlying Fidelity Central Funds are not included in the Fund's expense ratio. The Fund indirectly bears its proportionate share of the expenses of any underlying Fidelity Central Funds.
G Expense ratios reflect operating expenses of the class. Expenses before reductions do not reflect amounts reimbursed by the investment adviser or reductions from brokerage service arrangements or reductions from other expense offset arrangements and do not represent the amount paid by the class during periods when reimbursements or reductions occur. Expenses net of fee waivers reflect expenses after reimbursement by the investment adviser but prior to reductions from brokerage service arrangements or other expense offset arrangements. Expenses net of all reductions represent the net expenses paid by the class.
H Amount does not include the portfolio activity of any underlying Fidelity Central Funds.
See accompanying notes which are an integral part of the financial statements.
Fidelity Global Commodity Stock Fund Class I
| Years ended October 31, | 2017 | 2016 | 2015 | 2014 | 2013 |
| Selected Per–Share Data | | | | | |
| Net asset value, beginning of period | $10.76 | $10.09 | $13.31 | $14.24 | $14.67 |
| Income from Investment Operations | | | | | |
| Net investment income (loss)A | .17 | .16 | .25 | .19 | .20 |
| Net realized and unrealized gain (loss) | 1.86 | .77 | (3.26) | (.92) | (.45) |
| Total from investment operations | 2.03 | .93 | (3.01) | (.73) | (.25) |
| Distributions from net investment income | (.12) | (.25) | (.19) | (.19) | (.18) |
| Distributions from net realized gain | (.07) | (.01) | (.03) | (.01) | – |
| Total distributions | (.19) | (.26) | (.21)B | (.20) | (.18) |
| Redemption fees added to paid in capitalA,C | – | – | – | – | – |
| Net asset value, end of period | $12.60 | $10.76 | $10.09 | $13.31 | $14.24 |
| Total ReturnD | 18.99% | 9.63% | (22.93)% | (5.16)% | (1.71)% |
| Ratios to Average Net AssetsE,F | | | | | |
| Expenses before reductions | .96% | 1.01% | 1.09% | 1.06% | 1.04% |
| Expenses net of fee waivers, if any | .95% | 1.01% | 1.08% | 1.06% | 1.04% |
| Expenses net of all reductions | .94% | 1.00% | 1.08% | 1.06% | 1.03% |
| Net investment income (loss) | 1.45% | 1.55% | 2.11% | 1.34% | 1.43% |
| Supplemental Data | | | | | |
| Net assets, end of period (000 omitted) | $113,655 | $70,068 | $24,841 | $23,840 | $31,613 |
| Portfolio turnover rateG | 81% | 85% | 77% | 75% | 65% |
A Calculated based on average shares outstanding during the period.
B Total distributions of $.21 per share is comprised of distributions from net investment income of $.186 and distributions from net realized gain of $.026 per share.
C Amount represents less than $.005 per share.
D Total returns would have been lower if certain expenses had not been reduced during the applicable periods shown.
E Fees and expenses of any underlying Fidelity Central Funds are not included in the Fund's expense ratio. The Fund indirectly bears its proportionate share of the expenses of any underlying Fidelity Central Funds.
F Expense ratios reflect operating expenses of the class. Expenses before reductions do not reflect amounts reimbursed by the investment adviser or reductions from brokerage service arrangements or reductions from other expense offset arrangements and do not represent the amount paid by the class during periods when reimbursements or reductions occur. Expenses net of fee waivers reflect expenses after reimbursement by the investment adviser but prior to reductions from brokerage service arrangements or other expense offset arrangements. Expenses net of all reductions represent the net expenses paid by the class.
G Amount does not include the portfolio activity of any underlying Fidelity Central Funds.
See accompanying notes which are an integral part of the financial statements.
Notes to Financial Statements
For the period ended October 31, 2017
1. Organization.
Fidelity Global Commodity Stock Fund (the Fund) is a fund of Fidelity Investment Trust (the Trust) and is authorized to issue an unlimited number of shares. The Trust is registered under the Investment Company Act of 1940, as amended (the 1940 Act), as an open-end management investment company organized as a Massachusetts business trust. The Fund offers Class A, Class M (formerly Class T), Class C, Global Commodity Stock and Class I shares, each of which has equal rights as to assets and voting privileges. Each class has exclusive voting rights with respect to matters that affect that class.
After the close of business on June 24, 2016, all outstanding Class B shares were converted to Class A shares. All prior fiscal period dollar and share amounts for Class B presented in the Notes to Financial Statements are for the period May 1, 2016 through June 24, 2016.
2. Investments in Fidelity Central Funds.
The Fund invests in Fidelity Central Funds, which are open-end investment companies generally available only to other investment companies and accounts managed by the investment adviser and its affiliates. The Fund's Schedule of Investments lists each of the Fidelity Central Funds held as of period end, if any, as an investment of the Fund, but does not include the underlying holdings of each Fidelity Central Fund. As an Investing Fund, the Fund indirectly bears its proportionate share of the expenses of the underlying Fidelity Central Funds.
The Money Market Central Funds seek preservation of capital and current income and are managed by Fidelity Investments Money Management, Inc. (FIMM), an affiliate of the investment adviser. Annualized expenses of the Money Market Central Funds as of their most recent shareholder report date are less than .005%.
A complete unaudited list of holdings for each Fidelity Central Fund is available upon request or at the Securities and Exchange Commission (the SEC) website at www.sec.gov. In addition, the financial statements of the Fidelity Central Funds, which are not covered by the Fund's Report of Independent Registered Public Accounting Firm, are available on the SEC website or upon request.
3. Significant Accounting Policies.
The Fund is an investment company and applies the accounting and reporting guidance of the Financial Accounting Standards Board (FASB) Accounting Standards Codification Topic 946 Financial Services – Investments Companies. The financial statements have been prepared in conformity with accounting principles generally accepted in the United States of America (GAAP), which require management to make certain estimates and assumptions at the date of the financial statements. Actual results could differ from those estimates. Subsequent events, if any, through the date that the financial statements were issued have been evaluated in the preparation of the financial statements. The following summarizes the significant accounting policies of the Fund:
Investment Valuation. Investments are valued as of 4:00 p.m. Eastern time on the last calendar day of the period. The Board of Trustees (the Board) has delegated the day to day responsibility for the valuation of the Fund's investments to the Fair Value Committee (the Committee) established by the Fund's investment adviser. In accordance with valuation policies and procedures approved by the Board, the Fund attempts to obtain prices from one or more third party pricing vendors or brokers to value its investments. When current market prices, quotations or currency exchange rates are not readily available or reliable, investments will be fair valued in good faith by the Committee, in accordance with procedures adopted by the Board. Factors used in determining fair value vary by investment type and may include market or investment specific events. The frequency with which these procedures are used cannot be predicted and they may be utilized to a significant extent. The Committee oversees the Fund's valuation policies and procedures and reports to the Board on the Committee's activities and fair value determinations. The Board monitors the appropriateness of the procedures used in valuing the Fund's investments and ratifies the fair value determinations of the Committee.
The Fund categorizes the inputs to valuation techniques used to value its investments into a disclosure hierarchy consisting of three levels as shown below:
- Level 1 – quoted prices in active markets for identical investments
- Level 2 – other significant observable inputs (including quoted prices for similar investments, interest rates, prepayment speeds, etc.)
- Level 3 – unobservable inputs (including the Fund's own assumptions based on the best information available)
Valuation techniques used to value the Fund's investments by major category are as follows:
Equity securities, including restricted securities, for which market quotations are readily available, are valued at the last reported sale price or official closing price as reported by a third party pricing vendor on the primary market or exchange on which they are traded and are categorized as Level 1 in the hierarchy. In the event there were no sales during the day or closing prices are not available, securities are valued at the last quoted bid price or may be valued using the last available price and are generally categorized as Level 2 in the hierarchy. For foreign equity securities, when market or security specific events arise, comparisons to the valuation of American Depositary Receipts (ADRs), futures contracts, Exchange-Traded Funds (ETFs) and certain indexes as well as quoted prices for similar securities may be used and would be categorized as Level 2 in the hierarchy. Utilizing these techniques may result in transfers between Level 1 and Level 2. For equity securities, including restricted securities, where observable inputs are limited, assumptions about market activity and risk are used and these securities may be categorized as Level 3 in the hierarchy.
Investments in open-end mutual funds, including the Fidelity Central Funds, are valued at their closing net asset value (NAV) each business day and are categorized as Level 1 in the hierarchy.
Changes in valuation techniques may result in transfers in or out of an assigned level within the disclosure hierarchy. The aggregate value of investments by input level as of October 31, 2017, is included at the end of the Fund's Schedule of Investments.
Foreign Currency. The Fund may use foreign currency contracts to facilitate transactions in foreign-denominated securities. Gains and losses from these transactions may arise from changes in the value of the foreign currency or if the counterparties do not perform under the contracts' terms.
Foreign-denominated assets, including investment securities, and liabilities are translated into U.S. dollars at the exchange rates at period end. Purchases and sales of investment securities, income and dividends received and expenses denominated in foreign currencies are translated into U.S. dollars at the exchange rate in effect on the transaction date.
The effects of exchange rate fluctuations on investments are included with the net realized and unrealized gain (loss) on investment securities. Other foreign currency transactions resulting in realized and unrealized gain (loss) are disclosed separately.
Investment Transactions and Income. For financial reporting purposes, the Fund's investment holdings and NAV include trades executed through the end of the last business day of the period. The NAV per share for processing shareholder transactions is calculated as of the close of business of the New York Stock Exchange (NYSE), normally 4:00 p.m. Eastern time and includes trades executed through the end of the prior business day. Gains and losses on securities sold are determined on the basis of identified cost and includes proceeds received from litigation. Dividend income is recorded on the ex-dividend date, except for certain dividends from foreign securities where the ex-dividend date may have passed, which are recorded as soon as the Fund is informed of the ex-dividend date. Non-cash dividends included in dividend income, if any, are recorded at the fair market value of the securities received. Income and capital gain distributions from Fidelity Central Funds, if any, are recorded on the ex-dividend date. Certain distributions received by the Fund represent a return of capital or capital gain. The Fund determines the components of these distributions subsequent to the ex-dividend date, based upon receipt of tax filings or other correspondence relating to the underlying investment. These distributions are recorded as a reduction of cost of investments and/or as a realized gain. Investment income is recorded net of foreign taxes withheld where recovery of such taxes is uncertain.
Class Allocations and Expenses. Investment income, realized and unrealized capital gains and losses, common expenses of the Fund, and certain fund-level expense reductions, if any, are allocated daily on a pro-rata basis to each class based on the relative net assets of each class to the total net assets of the Fund. Each class differs with respect to transfer agent and distribution and service plan fees incurred. Certain expense reductions may also differ by class. For the reporting period, the allocated portion of income and expenses to each class as a percent of its average net assets may vary due to the timing of recording these transactions in relation to fluctuating net assets of the classes. Expenses directly attributable to a fund are charged to that fund. Expenses attributable to more than one fund are allocated among the respective funds on the basis of relative net assets or other appropriate methods. Expense estimates are accrued in the period to which they relate and adjustments are made when actual amounts are known.
Income Tax Information and Distributions to Shareholders. Each year, the Fund intends to qualify as a regulated investment company under Subchapter M of the Internal Revenue Code, including distributing substantially all of its taxable income and realized gains. As a result, no provision for U.S. Federal income taxes is required. As of October 31, 2017, the Fund did not have any unrecognized tax benefits in the financial statements; nor is the Fund aware of any tax positions for which it is reasonably possible that the total amounts of unrecognized tax benefits will significantly change in the next twelve months. The Fund files a U.S. federal tax return, in addition to state and local tax returns as required. The Fund's federal income tax returns are subject to examination by the Internal Revenue Service (IRS) for a period of three fiscal years after they are filed. State and local tax returns may be subject to examination for an additional fiscal year depending on the jurisdiction. Foreign taxes are provided for based on the Fund's understanding of the tax rules and rates that exist in the foreign markets in which it invests.
Distributions are declared and recorded on the ex-dividend date. Income dividends and capital gain distributions are declared separately for each class. Income and capital gain distributions are determined in accordance with income tax regulations, which may differ from GAAP. In addition, the Fund claimed a portion of the payment made to redeeming shareholders as a distribution for income tax purposes.
Capital accounts within the financial statements are adjusted for permanent book-tax differences. These adjustments have no impact on net assets or the results of operations. Capital accounts are not adjusted for temporary book-tax differences which will reverse in a subsequent period.
Book-tax differences are primarily due to foreign currency transactions, passive foreign investment companies (PFIC), partnerships, capital loss carryforwards and losses deferred due to wash sales.
As of period end, the cost and unrealized appreciation (depreciation) in securities, and derivatives if applicable, for federal income tax purposes were as follows:
| Gross unrealized appreciation | $28,655,448 |
| Gross unrealized depreciation | (79,047,358) |
| Net unrealized appreciation (depreciation) | $(50,391,910) |
| Tax Cost | $490,271,395 |
The tax-based components of distributable earnings as of period end were as follows:
| Undistributed ordinary income | $6,297,770 |
| Capital loss carryforward | $(58,047,381) |
| Net unrealized appreciation (depreciation) on securities and other investments | $(50,413,674) |
Capital loss carryforwards are only available to offset future capital gains of the Fund to the extent provided by regulations and may be limited. Under the Regulated Investment Company Modernization Act of 2010 (the Act), the Fund is permitted to carry forward capital losses incurred in taxable years beginning after December 22, 2010 for an unlimited period and such capital losses are required to be used prior to any losses that expire. The capital loss carryforward information presented below, including any applicable limitation, is estimated as of fiscal period end and is subject to adjustment.
| Fiscal year of expiration | |
| 2019 | $(6,952,413) |
| No expiration | |
| Long-term | (51,094,968) |
| Total capital loss carryforward | $(58,047,381) |
The tax character of distributions paid was as follows:
| | October 31, 2017 | October 31, 2016 |
| Ordinary Income | $5,873,296 | $ 5,364,951 |
Short-Term Trading (Redemption) Fees. Shares held by investors in the Fund less than 30 days may have been subject to a redemption fee equal to 1.00% of the NAV of shares redeemed. All redemption fees, which reduce the proceeds of the shareholder redemption, are retained by the Fund and accounted for as an addition to paid in capital. In November 2017, the Board of Trustees approved the elimination of these redemption fees effective December 18, 2017.
4. Purchases and Sales of Investments.
Purchases and sales of securities, other than short-term securities, aggregated $339,551,755 and $325,873,886, respectively.
5. Fees and Other Transactions with Affiliates.
Management Fee. Fidelity Management & Research Company (the investment adviser) and its affiliates provide the Fund with investment management related services for which the Fund pays a monthly management fee. The management fee is the sum of an individual fund fee rate that is based on an annual rate of .45% of the Fund's average net assets and an annualized group fee rate that averaged .25% during the period. The group fee rate is based upon the average net assets of all the mutual funds advised by the investment adviser, including any mutual funds previously advised by the investment adviser that are currently advised by Fidelity SelectCo, LLC, an affiliate of the investment adviser. The group fee rate decreases as assets under management increase and increases as assets under management decrease. For the reporting period, the total annual management fee rate was .70% of the Fund's average net assets.
Distribution and Service Plan Fees. In accordance with Rule 12b-1 of the 1940 Act, the Fund has adopted separate Distribution and Service Plans for each class of shares. Certain classes pay Fidelity Distributors Corporation (FDC), an affiliate of the investment adviser, separate Distribution and Service Fees, each of which is based on an annual percentage of each class' average net assets. In addition, FDC may pay financial intermediaries for selling shares of the Fund and providing shareholder support services. For the period, the Distribution and Service Fee rates, total fees and amounts retained by FDC were as follows:
| | Distribution
Fee | Service
Fee | Total Fees | Retained
by FDC |
| Class A | -% | .25% | $81,909 | $1,523 |
| Class M | .25% | .25% | 33,472 | – |
| Class C | .75% | .25% | 140,556 | 26,029 |
| | | | $255,937 | $27,552 |
Sales Load. FDC may receive a front-end sales charge of up to 5.75% for selling Class A shares and 3.50% for selling Class M shares, some of which is paid to financial intermediaries for selling shares of the Fund. Depending on the holding period, FDC may receive contingent deferred sales charges levied on Class A, Class M and Class C redemptions. The deferred sales charges are 1.00% for Class C shares, 1.00% for certain purchases of Class A shares and .25% for certain purchases of Class M shares.
For the period, sales charge amounts retained by FDC were as follows:
| | Retained
by FDC |
| Class A | $21,092 |
| Class M | 2,344 |
| Class C(a) | 2,826 |
| | $26,262 |
(a) When Class C shares are initially sold, FDC pays commissions from its own resources to financial intermediaries through which the sales are made.
Transfer Agent Fees. Fidelity Investments Institutional Operations Company, Inc., (FIIOC), an affiliate of the investment adviser, is the transfer, dividend disbursing and shareholder servicing agent for each class of the Fund. FIIOC receives account fees and asset-based fees that vary according to the account size and type of account of the shareholders of the respective classes of the Fund. FIIOC pays for typesetting, printing and mailing of shareholder reports, except proxy statements.
For the period, transfer agent fees for each class were as follows:
| | Amount | % of
Class-Level Average
Net Assets |
| Class A | $91,463 | .28 |
| Class M | 21,297 | .32 |
| Class C | 37,616 | .27 |
| Global Commodity Stock | 781,528 | .30 |
| Class I | 152,492 | .16 |
| | $1,084,396 | |
Accounting and Security Lending Fees. Fidelity Service Company, Inc. (FSC), an affiliate of the investment adviser, maintains the Fund's accounting records. The accounting fee is based on the level of average net assets for each month. Under a separate contract, FSC administers the security lending program. The security lending fee is based on the number and duration of lending transactions.
Brokerage Commissions. The Fund placed a portion of its portfolio transactions with brokerage firms which are affiliates of the investment adviser. Brokerage commissions are included in net realized gain (loss) and change in net unrealized appreciation (depreciation) in the Statement of Operations. The commissions paid to these affiliated firms were $6,746 for the period.
Interfund Trades. The Fund may purchase from or sell securities to other Fidelity Funds under procedures adopted by the Board. The procedures have been designed to ensure these interfund trades are executed in accordance with Rule 17a-7 of the 1940 Act. Interfund trades are included within the respective purchases and sales amounts shown in the Purchases and Sales of Investments note.
6. Committed Line of Credit.
The Fund participates with other funds managed by the investment adviser or an affiliate in a $4.25 billion credit facility (the "line of credit") to be utilized for temporary or emergency purposes to fund shareholder redemptions or for other short-term liquidity purposes. The Fund has agreed to pay commitment fees on its pro-rata portion of the line of credit, which amounted to $1,299 and is reflected in Miscellaneous expenses on the Statement of Operations. During the period, the Fund did not borrow on this line of credit.
7. Security Lending.
The Fund lends portfolio securities through a lending agent from time to time in order to earn additional income. For equity securities, a lending agent is used and may loan securities to certain qualified borrowers, including Fidelity Capital Markets (FCM), a broker-dealer affiliated with the Fund. On the settlement date of the loan, the Fund receives collateral (in the form of U.S. Treasury obligations, letters of credit and/or cash) against the loaned securities and maintains collateral in an amount not less than 100% of the market value of the loaned securities during the period of the loan. The market value of the loaned securities is determined at the close of business of the Fund and any additional required collateral is delivered to the Fund on the next business day. The Fund or borrower may terminate the loan at any time, and if the borrower defaults on its obligation to return the securities loaned because of insolvency or other reasons, the Fund may apply collateral received from the borrower against the obligation. The Fund may experience delays and costs in recovering the securities loaned. Any cash collateral received is invested in the Fidelity Securities Lending Cash Central Fund. The value of loaned securities and cash collateral at period end are disclosed on the Fund's Statement of Assets and Liabilities. At period end, there were no security loans outstanding with FCM. Security lending income represents the income earned on investing cash collateral, less rebates paid to borrowers, plus any premium payments received for lending certain types of securities. Security lending income is presented in the Statement of Operations as a component of income from Fidelity Central Funds. Total security lending income during the period amounted to $132,727, including $341 from securities loaned to FCM.
8. Expense Reductions.
Commissions paid to certain brokers with whom the investment adviser, or its affiliates, places trades on behalf of the Fund include an amount in addition to trade execution, which may be rebated back to the Fund to offset certain expenses. This amount totaled $39,683 for the period.
In addition, during the period the investment adviser reimbursed and/or waived a portion of fund-level operating expenses in the amount of $3,597.
9. Distributions to Shareholders.
Distributions to shareholders of each class were as follows:
| | Year ended October 31, 2017 | Year ended October 31, 2016 |
| From net investment income | | |
| Class A | $252,767 | $638,599 |
| Class M | 29,683 | 103,956 |
| Class B | – | 8,861 |
| Class C | 14,849 | 133,173 |
| Global Commodity Stock | 2,329,358 | 3,642,366 |
| Class I | 884,379 | 613,921 |
| Total | $3,511,036 | $5,140,876 |
| From net realized gain | | |
| Class A | $220,361 | $30,410 |
| Class M | 39,578 | 6,044 |
| Class B | – | 836 |
| Class C | 84,142 | 11,098 |
| Global Commodity Stock | 1,508,537 | 151,130 |
| Class I | 509,642 | 24,557 |
| Total | $2,362,260 | $224,075 |
10. Share Transactions.
Share transactions for each class were as follows and may contain automatic conversions between classes or exchanges between affiliated funds:
| | Shares | Shares | Dollars | Dollars |
| | Year ended October 31, 2017 | Year ended October 31, 2016 | Year ended October 31, 2017 | Year ended October 31, 2016 |
| Class A | | | | |
| Shares sold | 651,469 | 995,820 | $7,552,817 | $9,707,856 |
| Reinvestment of distributions | 39,394 | 70,559 | 455,002 | 655,495 |
| Shares redeemed | (1,549,520) | (948,589) | (18,059,878) | (9,072,163) |
| Net increase (decrease) | (858,657) | 117,790 | $(10,052,059) | $1,291,188 |
| Class M | | | | |
| Shares sold | 139,490 | 109,904 | $1,612,955 | $1,057,407 |
| Reinvestment of distributions | 5,865 | 11,521 | 67,801 | 107,030 |
| Shares redeemed | (162,841) | (187,357) | (1,893,807) | (1,802,838) |
| Net increase (decrease) | (17,486) | (65,932) | $(213,051) | $(638,401) |
| Class B | | | | |
| Shares sold | – | 2,904 | $– | $29,587 |
| Reinvestment of distributions | – | 982 | – | 9,133 |
| Shares redeemed | – | (90,607) | – | (897,527) |
| Net increase (decrease) | – | (86,721) | $– | $(858,807) |
| Class C | | | | |
| Shares sold | 316,655 | 318,100 | $3,641,065 | $3,098,053 |
| Reinvestment of distributions | 8,150 | 14,787 | 93,566 | 136,635 |
| Shares redeemed | (361,056) | (280,508) | (4,124,666) | (2,667,860) |
| Net increase (decrease) | (36,251) | 52,379 | $(390,035) | $566,828 |
| Global Commodity Stock | | | | |
| Shares sold | 7,707,102 | 11,244,608 | $89,805,053 | $110,744,052 |
| Reinvestment of distributions | 315,142 | 376,092 | 3,643,039 | 3,493,876 |
| Shares redeemed | (8,286,656) | (5,847,902) | (96,347,286) | (57,190,452) |
| Net increase (decrease) | (264,412) | 5,772,798 | $(2,899,194) | $57,047,476 |
| Class I | | | | |
| Shares sold | 4,738,302 | 6,770,473 | $54,914,110 | $66,305,135 |
| Reinvestment of distributions | 58,242 | 60,388 | 672,698 | 560,405 |
| Shares redeemed | (2,283,691) | (2,783,838) | (26,192,412) | (27,173,673) |
| Net increase (decrease) | 2,512,853 | 4,047,023 | $29,394,396 | $39,691,867 |
11. Other.
The Fund's organizational documents provide former and current trustees and officers with a limited indemnification against liabilities arising in connection with the performance of their duties to the Fund. In the normal course of business, the Fund may also enter into contracts that provide general indemnifications. The Fund's maximum exposure under these arrangements is unknown as this would be dependent on future claims that may be made against the Fund. The risk of material loss from such claims is considered remote.
Report of Independent Registered Public Accounting Firm
To the Trustees of Fidelity Investment Trust and Shareholders of Fidelity Global Commodity Stock Fund:
In our opinion, the accompanying statement of assets and liabilities, including the schedule of investments, and the related statements of operations and of changes in net assets and the financial highlights present fairly, in all material respects, the financial position of Fidelity Global Commodity Stock Fund (a fund of Fidelity Investment Trust) (the "Fund") as of October 31, 2017, the results of its operations for the year then ended, the changes in its net assets for each of the two years in the period then ended and the financial highlights for each of the five years in the period then ended, in conformity with accounting principles generally accepted in the United States of America. These financial statements and financial highlights (hereafter referred to as “financial statements”) are the responsibility of the Fund's management. Our responsibility is to express an opinion on these financial statements based on our audits. We conducted our audits of these financial statements in accordance with the standards of the Public Company Accounting Oversight Board (United States). Those standards require that we plan and perform the audit to obtain reasonable assurance about whether the financial statements are free of material misstatement. An audit includes examining, on a test basis, evidence supporting the amounts and disclosures in the financial statements, assessing the accounting principles used and significant estimates made by management, and evaluating the overall financial statement presentation. Our procedures included confirmation of securities owned as of October 31, 2017 by correspondence with the custodian and brokers; when replies were not received from brokers, we performed other auditing procedures. We believe that our audits provide a reasonable basis for our opinion.
PricewaterhouseCoopers LLP
Boston, Massachusetts
December 13, 2017
Trustees and Officers
The Trustees, Members of the Advisory Board (if any), and officers of the trust and fund, as applicable, are listed below. The Board of Trustees governs the fund and is responsible for protecting the interests of shareholders. The Trustees are experienced executives who meet periodically throughout the year to oversee the fund's activities, review contractual arrangements with companies that provide services to the fund, oversee management of the risks associated with such activities and contractual arrangements, and review the fund's performance. Except for Jonathan Chiel, each of the Trustees oversees 190 funds. Mr. Chiel oversees 143 funds.
The Trustees hold office without limit in time except that (a) any Trustee may resign; (b) any Trustee may be removed by written instrument, signed by at least two-thirds of the number of Trustees prior to such removal; (c) any Trustee who requests to be retired or who has become incapacitated by illness or injury may be retired by written instrument signed by a majority of the other Trustees; and (d) any Trustee may be removed at any special meeting of shareholders by a two-thirds vote of the outstanding voting securities of the trust. Each Trustee who is not an interested person (as defined in the 1940 Act) of the trust and the fund is referred to herein as an Independent Trustee. Each Independent Trustee shall retire not later than the last day of the calendar year in which his or her 75th birthday occurs. The Independent Trustees may waive this mandatory retirement age policy with respect to individual Trustees. Officers and Advisory Board Members hold office without limit in time, except that any officer or Advisory Board Member may resign or may be removed by a vote of a majority of the Trustees at any regular meeting or any special meeting of the Trustees. Except as indicated, each individual has held the office shown or other offices in the same company for the past five years.
The fund’s Statement of Additional Information (SAI) includes more information about the Trustees. To request a free copy, call Fidelity at 1-800-544-8544.
Experience, Skills, Attributes, and Qualifications of the Trustees. The Governance and Nominating Committee has adopted a statement of policy that describes the experience, qualifications, attributes, and skills that are necessary and desirable for potential Independent Trustee candidates (Statement of Policy). The Board believes that each Trustee satisfied at the time he or she was initially elected or appointed a Trustee, and continues to satisfy, the standards contemplated by the Statement of Policy. The Governance and Nominating Committee also engages professional search firms to help identify potential Independent Trustee candidates who have the experience, qualifications, attributes, and skills consistent with the Statement of Policy. From time to time, additional criteria based on the composition and skills of the current Independent Trustees, as well as experience or skills that may be appropriate in light of future changes to board composition, business conditions, and regulatory or other developments, have also been considered by the professional search firms and the Governance and Nominating Committee. In addition, the Board takes into account the Trustees' commitment and participation in Board and committee meetings, as well as their leadership of standing and ad hoc committees throughout their tenure.
In determining that a particular Trustee was and continues to be qualified to serve as a Trustee, the Board has considered a variety of criteria, none of which, in isolation, was controlling. The Board believes that, collectively, the Trustees have balanced and diverse experience, qualifications, attributes, and skills, which allow the Board to operate effectively in governing the fund and protecting the interests of shareholders. Information about the specific experience, skills, attributes, and qualifications of each Trustee, which in each case led to the Board's conclusion that the Trustee should serve (or continue to serve) as a trustee of the fund, is provided below.
Board Structure and Oversight Function. James C. Curvey is an interested person and currently serves as Chairman. The Trustees have determined that an interested Chairman is appropriate and benefits shareholders because an interested Chairman has a personal and professional stake in the quality and continuity of services provided to the fund. Independent Trustees exercise their informed business judgment to appoint an individual of their choosing to serve as Chairman, regardless of whether the Trustee happens to be independent or a member of management. The Independent Trustees have determined that they can act independently and effectively without having an Independent Trustee serve as Chairman and that a key structural component for assuring that they are in a position to do so is for the Independent Trustees to constitute a substantial majority for the Board. The Independent Trustees also regularly meet in executive session. Ned C. Lautenbach serves as Chairman of the Independent Trustees and as such (i) acts as a liaison between the Independent Trustees and management with respect to matters important to the Independent Trustees and (ii) with management prepares agendas for Board meetings.
Fidelity® funds are overseen by different Boards of Trustees. The fund's Board oversees Fidelity's high income and certain equity funds, and other Boards oversee Fidelity's investment-grade bond, money market, asset allocation, and sector funds. The asset allocation funds may invest in Fidelity® funds overseen by the fund's Board. The use of separate Boards, each with its own committee structure, allows the Trustees of each group of Fidelity® funds to focus on the unique issues of the funds they oversee, including common research, investment, and operational issues. On occasion, the separate Boards establish joint committees to address issues of overlapping consequences for the Fidelity® funds overseen by each Board.
The Trustees operate using a system of committees to facilitate the timely and efficient consideration of all matters of importance to the Trustees, the fund, and fund shareholders and to facilitate compliance with legal and regulatory requirements and oversight of the fund's activities and associated risks. The Board, acting through its committees, has charged FMR and its affiliates with (i) identifying events or circumstances the occurrence of which could have demonstrably adverse effects on the fund's business and/or reputation; (ii) implementing processes and controls to lessen the possibility that such events or circumstances occur or to mitigate the effects of such events or circumstances if they do occur; and (iii) creating and maintaining a system designed to evaluate continuously business and market conditions in order to facilitate the identification and implementation processes described in (i) and (ii) above. Because the day-to-day operations and activities of the fund are carried out by or through FMR, its affiliates, and other service providers, the fund's exposure to risks is mitigated but not eliminated by the processes overseen by the Trustees. While each of the Board's committees has responsibility for overseeing different aspects of the fund's activities, oversight is exercised primarily through the Operations, Audit, and Compliance Committees. In addition, the Independent Trustees have worked with FMR to enhance the Board's oversight of investment and financial risks, legal and regulatory risks, technology risks, and operational risks, including the development of additional risk reporting to the Board. For example, a working group comprised of Independent Trustees and FMR has worked and continues to work to review the Fidelity® funds' valuation-related activities, reporting and risk management. Appropriate personnel, including but not limited to the fund's Chief Compliance Officer (CCO), FMR's internal auditor, the independent accountants, the fund's Treasurer and portfolio management personnel, make periodic reports to the Board's committees, as appropriate, including an annual review of Fidelity's risk management program for the Fidelity® funds. The responsibilities of each standing committee, including their oversight responsibilities, are described further under "Standing Committees of the Trustees."
Interested Trustees*:
Correspondence intended for a Trustee who is an interested person may be sent to Fidelity Investments, 245 Summer Street, Boston, Massachusetts 02210.
Name, Year of Birth; Principal Occupations and Other Relevant Experience+
Jonathan Chiel (1957)
Year of Election or Appointment: 2016
Trustee
Mr. Chiel also serves as Trustee of other Fidelity® funds. Mr. Chiel is Executive Vice President and General Counsel for FMR LLC (diversified financial services company, 2012-present). Previously, Mr. Chiel served as general counsel (2004-2012) and senior vice president and deputy general counsel (2000-2004) for John Hancock Financial Services; a partner with Choate, Hall & Stewart (1996-2000) (law firm); and an Assistant United States Attorney for the United States Attorney’s Office of the District of Massachusetts (1986-95), including Chief of the Criminal Division (1993-1995). Mr. Chiel is a director on the boards of the Boston Bar Foundation and the Maimonides School.
James C. Curvey (1935)
Year of Election or Appointment: 2007
Trustee
Chairman of the Board of Trustees
Mr. Curvey also serves as Trustee of other Fidelity® funds. Mr. Curvey is a Director of Fidelity Research & Analysis Co. (investment adviser firm, 2009-present), and Vice Chairman (2007-present) and Director of FMR LLC (diversified financial services company). In addition, Mr. Curvey serves as an Overseer for the Boston Symphony Orchestra and a member of the board of Artis-Naples, Naples, Florida, and as a Trustee for Brewster Academy, Wolfeboro, New Hampshire. Previously, Mr. Curvey served as a Director of Fidelity Investments Money Management, Inc. (investment adviser firm, 2009-2014) and a Director of FMR and FMR Co., Inc. (investment adviser firms, 2007-2014).
Charles S. Morrison (1960)
Year of Election or Appointment: 2014
Trustee
Mr. Morrison also serves as Trustee of other funds. He serves as President of Fidelity Management & Research Company (FMR) (investment adviser firm, 2016-present), a Director of Fidelity Investments Money Management, Inc. (FIMM) (investment adviser firm, 2014-present), Director of Fidelity SelectCo, LLC (investment adviser firm, 2014-present), President, Asset Management (2014-present), and is an employee of Fidelity Investments. Previously, Mr. Morrison served as Vice President of Fidelity's Fixed Income and Asset Allocation Funds (2012-2014), President, Fixed Income (2011-2014), Vice President of Fidelity's Money Market Funds (2005-2009), President, Money Market Group Leader of FMR (investment adviser firm, 2009), and Senior Vice President, Money Market Group of FMR (2004-2009). Mr. Morrison also served as Vice President of Fidelity's Bond Funds (2002-2005), certain Balanced Funds (2002-2005), and certain Asset Allocation Funds (2002-2007), and as Senior Vice President (2002-2005) of Fidelity's Bond Division.
* Determined to be an “Interested Trustee” by virtue of, among other things, his or her affiliation with the trust or various entities under common control with FMR.
+ The information includes the Trustee's principal occupation during the last five years and other information relating to the experience, attributes, and skills relevant to the Trustee's qualifications to serve as a Trustee, which led to the conclusion that the Trustee should serve as a Trustee for the fund.
Independent Trustees:
Correspondence intended for an Independent Trustee may be sent to Fidelity Investments, P.O. Box 55235, Boston, Massachusetts 02205-5235.
Name, Year of Birth; Principal Occupations and Other Relevant Experience+
Dennis J. Dirks (1948)
Year of Election or Appointment: 2005
Trustee
Mr. Dirks also serves as Trustee of other Fidelity® funds. Prior to his retirement in May 2003, Mr. Dirks was Chief Operating Officer and a member of the Board of The Depository Trust & Clearing Corporation (DTCC). He also served as President, Chief Operating Officer, and Board member of The Depository Trust Company (DTC) and President and Board member of the National Securities Clearing Corporation (NSCC). In addition, Mr. Dirks served as Chief Executive Officer and Board member of the Government Securities Clearing Corporation, Chief Executive Officer and Board member of the Mortgage-Backed Securities Clearing Corporation, as a Trustee and a member of the Finance Committee of Manhattan College (2005-2008), as a Trustee and a member of the Finance Committee of AHRC of Nassau County (2006-2008), as a member of the Independent Directors Council (IDC) Governing Council (2010-2015), and as a member of the Board of Directors for The Brookville Center for Children’s Services, Inc. (2009-2017). Mr. Dirks is a member of the Finance Committee (2016-present) and Board of Directors (2017-present) of the Asolo Repertory Theatre.
Alan J. Lacy (1953)
Year of Election or Appointment: 2008
Trustee
Mr. Lacy also serves as Trustee of other Fidelity® funds. Mr. Lacy serves as a Director of Bristol-Myers Squibb Company (global pharmaceuticals, 2008-present). He is a Trustee of the California Chapter of The Nature Conservancy (2015-present) and a Director of the Center for Advanced Study in the Behavioral Sciences at Stanford University (2015-present). In addition, Mr. Lacy served as Senior Adviser (2007-2014) of Oak Hill Capital Partners, L.P. (private equity) and also served as Chief Executive Officer (2005) and Vice Chairman (2005-2006) of Sears Holdings Corporation (retail) and Chief Executive Officer and Chairman of the Board of Sears, Roebuck and Co. (retail, 2000-2005). Previously, Mr. Lacy served as Chairman (2014-2017) and a member (2010-2017) of the Board of Directors of Dave & Buster’s Entertainment, Inc. (restaurant and entertainment complexes), as Chairman (2008-2011) and a member (2006-2015) of the Board of Trustees of the National Parks Conservation Association, and as a member of the Board of Directors for The Hillman Companies, Inc. (hardware wholesalers, 2010-2014), Earth Fare, Inc. (retail grocery, 2010-2014), and The Western Union Company (global money transfer, 2006-2011).
Ned C. Lautenbach (1944)
Year of Election or Appointment: 2000
Trustee
Chairman of the Independent Trustees
Mr. Lautenbach also serves as Trustee of other Fidelity® funds. Mr. Lautenbach currently serves as Vice Chair of the Board of Governors, State University System of Florida (2013-present) and is a member of the Council on Foreign Relations (1994-present). He is also a member and has most recently served as Chairman of the Board of Directors of Artis-Naples (2012-present). Previously, Mr. Lautenbach served as a member and then Lead Director of the Board of Directors of Eaton Corporation (diversified industrial, 1997-2016). He was also a Partner and Advisory Partner at Clayton, Dubilier & Rice, LLC (private equity investment, 1998-2010), as well as a Director of Sony Corporation (2006-2007). In addition, Mr. Lautenbach also had a 30-year career with IBM (technology company) during which time he served as Senior Vice President and a member of the Corporate Executive Committee (1968-1998).
Joseph Mauriello (1944)
Year of Election or Appointment: 2008
Trustee
Mr. Mauriello also serves as Trustee of other Fidelity® funds. Prior to his retirement in January 2006, Mr. Mauriello served in numerous senior management positions including Deputy Chairman and Chief Operating Officer (2004-2005), and Vice Chairman of Financial Services (2002-2004) of KPMG LLP US (professional services, 1965-2005). Mr. Mauriello currently serves as a member of the Board of Directors of XL Group plc. (global insurance and re-insurance, 2006-present) and the Independent Directors Council (IDC) Governing Council (2015-present). Previously, Mr. Mauriello served as a Director of the Hamilton Funds of the Bank of New York (2006-2007) and of Arcadia Resources Inc. (health care services and products, 2007-2012).
Cornelia M. Small (1944)
Year of Election or Appointment: 2005
Trustee
Ms. Small also serves as Trustee of other Fidelity® funds. Ms. Small is a member of the Board of Directors (2009-present) and Chair of the Investment Committee (2010-present) of the Teagle Foundation. Ms. Small also serves on the Investment Committee of the Berkshire Taconic Community Foundation (2008-present). Previously, Ms. Small served as Chairperson (2002-2008) and a member of the Investment Committee and Chairperson (2008-2012) and a member of the Board of Trustees of Smith College. In addition, Ms. Small served as Chief Investment Officer, Director of Global Equity Investments, and a member of the Board of Directors of Scudder, Stevens & Clark and Scudder Kemper Investments.
William S. Stavropoulos (1939)
Year of Election or Appointment: 2001
Trustee
Vice Chairman of the Independent Trustees
Mr. Stavropoulos also serves as Trustee of other Fidelity® funds. Mr. Stavropoulos serves as President and Founder of the Michigan Baseball Foundation, the Great Lakes Loons (2007-present). Mr. Stavropoulos is Chairman Emeritus of the Board of Directors of The Dow Chemical Company, where he previously served in numerous senior management positions, including President, CEO (1995-2000; 2002-2004), Chairman of the Executive Committee (2000-2006), and as a member of the Board of Directors (1990-2006). Currently, Mr. Stavropoulos is Chairman of the Board of Directors of Univar Inc. (global distributor of commodity and specialty chemicals), a Director of Teradata Corporation (data warehousing and technology solutions), and a member of the Advisory Board for Metalmark Capital LLC (private equity investment, 2005-present). Mr. Stavropoulos is an operating advisor to Clayton, Dubilier & Rice, LLC (private equity investment). In addition, Mr. Stavropoulos is a member of the University of Notre Dame Advisory Council for the College of Science, a Trustee of the Rollin L. Gerstacker Foundation, and a Director of Artis-Naples in Naples, Florida. Previously, Mr. Stavropoulos served as a Director of Chemical Financial Corporation (bank holding company, 1993-2012) and Tyco International, Ltd. (multinational manufacturing and services, 2007-2012).
David M. Thomas (1949)
Year of Election or Appointment: 2008
Trustee
Mr. Thomas also serves as Trustee of other Fidelity® funds. Mr. Thomas serves as Non-Executive Chairman of the Board of Directors of Fortune Brands Home and Security (home and security products, 2011-present), as a member of the Board of Directors (2004-present) and Presiding Director (2013-present) of Interpublic Group of Companies, Inc. (marketing communication), and as a member of the Board of Trustees of the University of Florida (2013-present). Previously, Mr. Thomas served as Executive Chairman (2005-2006) and Chairman and Chief Executive Officer (2000-2005) of IMS Health, Inc. (pharmaceutical and healthcare information solutions), and a Director of Fortune Brands, Inc. (consumer products, 2000-2011).
+ The information includes the Trustee's principal occupation during the last five years and other information relating to the experience, attributes, and skills relevant to the Trustee's qualifications to serve as a Trustee, which led to the conclusion that the Trustee should serve as a Trustee for the fund.
Advisory Board Members and Officers:
Correspondence intended for an officer or Peter S. Lynch may be sent to Fidelity Investments, 245 Summer Street, Boston, Massachusetts 02210. Officers appear below in alphabetical order.
Name, Year of Birth; Principal Occupation
Peter S. Lynch (1944)
Year of Election or Appointment: 2003
Member of the Advisory Board
Mr. Lynch also serves as Member of the Advisory Board of other Fidelity® funds. Mr. Lynch is Vice Chairman and a Director of FMR (investment adviser firm) and FMR Co., Inc. (investment adviser firm). In addition, Mr. Lynch serves as a Trustee of Boston College and as the Chairman of the Inner-City Scholarship Fund. Previously, Mr. Lynch served on the Special Olympics International Board of Directors (1997-2006).
Elizabeth Paige Baumann (1968)
Year of Election or Appointment: 2017
Anti-Money Laundering (AML) Officer
Ms. Baumann also serves as AML Officer of other funds. She is Chief AML Officer (2012-present) and Senior Vice President (2014-present) of FMR LLC (diversified financial services company) and is an employee of Fidelity Investments. Previously, Ms. Baumann served as AML Officer of the funds (2012-2016), and Vice President (2007-2014) and Deputy Anti-Money Laundering Officer (2007-2012) of FMR LLC.
Marc R. Bryant (1966)
Year of Election or Appointment: 2015
Secretary and Chief Legal Officer (CLO)
Mr. Bryant also serves as Secretary and CLO of other funds. Mr. Bryant serves as CLO, Secretary, and Senior Vice President of Fidelity Management & Research Company (investment adviser firm, 2015-present) and FMR Co., Inc. (investment adviser firm, 2015-present); Secretary of Fidelity SelectCo, LLC (investment adviser firm, 2015-present) and Fidelity Investments Money Management, Inc. (investment adviser firm, 2015-present); and CLO of Fidelity Management & Research (Hong Kong) Limited and FMR Investment Management (UK) Limited (investment adviser firms, 2015-present) and Fidelity Management & Research (Japan) Limited (investment adviser firm, 2016-present). He is Senior Vice President and Deputy General Counsel of FMR LLC (diversified financial services company). Previously, Mr. Bryant served as Secretary and CLO of Fidelity Rutland Square Trust II (2010-2014) and Assistant Secretary of Fidelity's Fixed Income and Asset Allocation Funds (2013-2015). Prior to joining Fidelity Investments, Mr. Bryant served as a Senior Vice President and the Head of Global Retail Legal for AllianceBernstein L.P. (2006-2010), and as the General Counsel for ProFund Advisors LLC (2001-2006).
William C. Coffey (1969)
Year of Election or Appointment: 2009
Assistant Secretary
Mr. Coffey also serves as Assistant Secretary of other funds. He is Senior Vice President and Deputy General Counsel of FMR LLC (diversified financial services company, 2010-present), and is an employee of Fidelity Investments. Previously, Mr. Coffey served as Vice President and Associate General Counsel of FMR LLC (2005-2009).
Jonathan Davis (1968)
Year of Election or Appointment: 2010
Assistant Treasurer
Mr. Davis also serves as Assistant Treasurer of other funds, and is an employee of Fidelity Investments. Previously, Mr. Davis served as Vice President and Associate General Counsel of FMR LLC (diversified financial services company, 2003-2010).
Adrien E. Deberghes (1967)
Year of Election or Appointment: 2016
Assistant Treasurer
Mr. Deberghes also serves as an officer of other funds. He serves as Executive Vice President of Fidelity Investments Money Management, Inc. (FIMM) (investment adviser firm, 2016-present) and is an employee of Fidelity Investments (2008-present). Prior to joining Fidelity Investments, Mr. Deberghes was Senior Vice President of Mutual Fund Administration at State Street Corporation (2007-2008), Senior Director of Mutual Fund Administration at Investors Bank & Trust (2005-2007), and Director of Finance for Dunkin' Brands (2000-2005). Previously, Mr. Deberghes served in other fund officer roles.
Joseph DeSantis (1959)
Year of Election or Appointment: 2017
Vice President
Mr. DeSantis also serves as Vice President of other funds. Mr. DeSantis serves as a Director of Fidelity Management & Research (Japan) Limited (investment adviser firm, 2016-present), Chief Investment Officer, Equities (2010-present) and is an employee of Fidelity Investments.
Stephanie J. Dorsey (1969)
Year of Election or Appointment: 2010
Assistant Treasurer
Ms. Dorsey also serves as an officer of other funds. She is an employee of Fidelity Investments (2008-present) and has served in other fund officer roles. Prior to joining Fidelity Investments, Ms. Dorsey served as Treasurer (2004-2008) of the JPMorgan Mutual Funds and Vice President (2004-2008) of JPMorgan Chase Bank.
Howard J. Galligan III (1966)
Year of Election or Appointment: 2014
Chief Financial Officer
Mr. Galligan also serves as Chief Financial Officer of other funds. Mr. Galligan serves as President of Fidelity Pricing and Cash Management Services (FPCMS) (2014-present) and as a Director of Strategic Advisers, Inc. (investment adviser firm, 2008-present). Previously, Mr. Galligan served as Chief Administrative Officer of Asset Management (2011-2014) and Chief Operating Officer and Senior Vice President of Investment Support for Strategic Advisers, Inc. (2003-2011).
Brian B. Hogan (1964)
Year of Election or Appointment: 2009
Vice President
Mr. Hogan also serves as Trustee or Vice President of other funds. Mr. Hogan serves as a Director of FMR Investment Management (UK) Limited (investment adviser firm, 2015-present) and Fidelity SelectCo, LLC (investment adviser firm, 2014-present) and President of the Equity Division of FMR (investment adviser firm, 2009-present). Previously, Mr. Hogan served as Senior Vice President, Equity Research of FMR (2006-2009) and as a portfolio manager. Mr. Brian B. Hogan is not related to Mr. Colm A. Hogan.
Colm A. Hogan (1973)
Year of Election or Appointment: 2016
Deputy Treasurer
Mr. Hogan also serves as an officer of other funds. Mr. Hogan is an employee of Fidelity Investments (2005-present). Mr. Colm A. Hogan is not related to Mr. Brian B. Hogan.
Chris Maher (1972)
Year of Election or Appointment: 2013
Assistant Treasurer
Mr. Maher serves as Assistant Treasurer of other funds. Mr. Maher is Vice President of Valuation Oversight and is an employee of Fidelity Investments. Previously, Mr. Maher served as Vice President of Asset Management Compliance (2013), Vice President of the Program Management Group of FMR (investment adviser firm, 2010-2013), and Vice President of Valuation Oversight (2008-2010).
Rieco E. Mello (1969)
Year of Election or Appointment: 2017
Assistant Treasurer
Mr. Mello also serves as Assistant Treasurer of other funds. Mr. Mello is an employee of Fidelity Investments (1995-present).
Kenneth B. Robins (1969)
Year of Election or Appointment: 2016
Chief Compliance Officer
Mr. Robins also serves as an officer of other funds. Mr. Robins serves as Compliance Officer of Fidelity Management & Research Company and FMR Co., Inc. (investment adviser firms, 2016-present) and is an employee of Fidelity Investments (2004-present). Previously, Mr. Robins served as Executive Vice President of Fidelity Investments Money Management, Inc. (investment adviser firm, 2013-2016) and served in other fund officer roles.
Stacie M. Smith (1974)
Year of Election or Appointment: 2016
President and Treasurer
Ms. Smith also serves as an officer of other funds. She is an employee of Fidelity Investments (2009-present) and has served in other fund officer roles. Prior to joining Fidelity Investments, Ms. Smith served as Senior Audit Manager of Ernst & Young LLP (accounting firm, 1996-2009). Previously, Ms. Smith served as Deputy Treasurer of certain Fidelity® funds (2013-2016).
Marc L. Spector (1972)
Year of Election or Appointment: 2016
Assistant Treasurer
Mr. Spector also serves as an officer of other funds. Mr. Spector is an employee of Fidelity Investments (2016-present). Prior to joining Fidelity Investments, Mr. Spector served as Director at the Siegfried Group (accounting firm, 2013-2016), and prior to Siegfried Group as audit senior manager at Deloitte & Touche (accounting firm, 2005-2013).
Renee Stagnone (1975)
Year of Election or Appointment: 2016
Assistant Treasurer
Ms. Stagnone also serves as an officer of other funds. Ms. Stagnone is an employee of Fidelity Investments (1997-present). Previously, Ms. Stagnone served as Deputy Treasurer of certain Fidelity® funds (2013-2016).
Shareholder Expense Example
As a shareholder of the Fund, you incur two types of costs: (1) transaction costs, including sales charges (loads) on purchase payments or redemption proceeds, redemption fees and (2) ongoing costs, including management fees, distribution and/or service (12b-1) fees and other Fund expenses. This Example is intended to help you understand your ongoing costs (in dollars) of investing in the Fund and to compare these costs with the ongoing costs of investing in other mutual funds.
The Example is based on an investment of $1,000 invested at the beginning of the period and held for the entire period (May 1, 2017 to October 31, 2017).
Actual Expenses
The first line of the accompanying table for each class of the Fund provides information about actual account values and actual expenses. You may use the information in this line, together with the amount you invested, to estimate the expenses that you paid over the period. Simply divide your account value by $1,000.00 (for example, an $8,600 account value divided by $1,000.00 = 8.6), then multiply the result by the number in the first line for a class of the Fund under the heading entitled "Expenses Paid During Period" to estimate the expenses you paid on your account during this period. A small balance maintenance fee of $12.00 that is charged once a year may apply for certain accounts with a value of less than $2,000. This fee is not included in the table below. If it was, the estimate of expenses you paid during the period would be higher, and your ending account value lower, by this amount. In addition, the Fund, as a shareholder in the underlying Fidelity Central Funds, will indirectly bear its pro-rata share of the fees and expenses incurred by the underlying Fidelity Central Funds. These fees and expenses are not included in the Fund's annualized expense ratio used to calculate the expense estimate in the table below.
Hypothetical Example for Comparison Purposes
The second line of the accompanying table for each class of the Fund provides information about hypothetical account values and hypothetical expenses based on a Class' actual expense ratio and an assumed rate of return of 5% per year before expenses, which is not the Class' actual return. The hypothetical account values and expenses may not be used to estimate the actual ending account balance or expenses you paid for the period. You may use this information to compare the ongoing costs of investing in the Fund and other funds. To do so, compare this 5% hypothetical example with the 5% hypothetical examples that appear in the shareholder reports of the other funds. A small balance maintenance fee of $12.00 that is charged once a year may apply for certain accounts with a value of less than $2,000. This fee is not included in the table below. If it was, the estimate of expenses you paid during the period would be higher, and your ending account value lower, by this amount. In addition, the Fund, as a shareholder in the underlying Fidelity Central Funds, will indirectly bear its pro-rata share of the fees and expenses incurred by the underlying Fidelity Central Funds. These fees and expenses are not included in the Fund's annualized expense ratio used to calculate the expense estimate in the table below.
Please note that the expenses shown in the table are meant to highlight your ongoing costs only and do not reflect any transaction costs. Therefore, the second line of the table is useful in comparing ongoing costs only, and will not help you determine the relative total costs of owning different funds. In addition, if these transactional costs were included, your costs would have been higher.
| | Annualized Expense Ratio-A | Beginning
Account Value
May 1, 2017 | Ending
Account Value
October 31, 2017 | Expenses Paid
During Period-B
May 1, 2017
to October 31, 2017 |
| Class A | 1.30% | | | |
| Actual | | $1,000.00 | $1,098.90 | $6.88 |
| Hypothetical-C | | $1,000.00 | $1,018.65 | $6.61 |
| Class M | 1.60% | | | |
| Actual | | $1,000.00 | $1,097.20 | $8.46 |
| Hypothetical-C | | $1,000.00 | $1,017.14 | $8.13 |
| Class C | 2.03% | | | |
| Actual | | $1,000.00 | $1,094.50 | $10.72 |
| Hypothetical-C | | $1,000.00 | $1,014.97 | $10.31 |
| Global Commodity Stock | 1.08% | | | |
| Actual | | $1,000.00 | $1,099.60 | $5.72 |
| Hypothetical-C | | $1,000.00 | $1,019.76 | $5.50 |
| Class I | .93% | | | |
| Actual | | $1,000.00 | $1,101.40 | $4.93 |
| Hypothetical-C | | $1,000.00 | $1,020.52 | $4.74 |
A Annualized expense ratio reflects expenses net of applicable fee waivers.
B Expenses are equal to each Class' annualized expense ratio, multiplied by the average account value over the period, multiplied by 184/365 (to reflect the one-half year period).
C 5% return per year before expenses
Distributions (Unaudited)
The Board of Trustees of Fidelity Global Commodity Stock Fund voted to pay to shareholders of record at the opening of business on record date, the following distributions per share derived from capital gains realized from sales of portfolio securities, and dividends derived from net investment income:
| | Pay Date | Record Date | Dividends | Capital Gains |
| Fidelity Global Commodity Stock Fund | | | | |
| Class A | 12/11/17 | 12/08/17 | $0.086 | $0.047 |
| Class M | 12/11/17 | 12/08/17 | $0.055 | $0.047 |
| Class C | 12/11/17 | 12/08/17 | $0.000 | $0.047 |
| Global Commodity Stock | 12/11/17 | 12/08/17 | $0.131 | $0.047 |
| Class I | 12/11/17 | 12/08/17 | $0.139 | $0.047 |
|
Class A designates 47%, Class M designates 57%, Class C designates 83%, Global Commodity Stock designates 40%, and Class I designates 37% of the dividend distributed during the fiscal year as qualifying for the dividends–received deduction for corporate shareholders.
Class A designates 100%, Class M designates 100%, Class C designates 100%, Global Commodity Stock designates 86%, and Class I designates 80% of the dividend distributed during the fiscal year as amounts which may be taken into account as a dividend for purposes of the maximum rate under section 1(h)(11) of the Internal Revenue Code.
The amounts per share which represent income derived from sources within, and taxes paid to, foreign countries or possessions of the United States are as follows:
| | Pay Date | Income | Taxes |
| Fidelity Global Commodity Stock Fund | | | |
| Class A | 12/12/16 | $0.1077 | $0.0074 |
| Class M | 12/12/16 | $0.0887 | $0.0074 |
| Class C | 12/12/16 | $0.0614 | $0.0074 |
| Global Commodity Stock | 12/12/16 | $0.1267 | $0.0074 |
| Class I | 12/12/16 | $0.1358 | $0.0074 |
|
The fund will notify shareholders in January 2018 of amounts for use in preparing 2017 income tax returns.
Board Approval of Investment Advisory Contracts and Management Fees
Fidelity Global Commodity Stock Fund
Each year, the Board of Trustees, including the Independent Trustees (together, the Board), votes on the renewal of the management contract with Fidelity Management & Research Company (FMR) and the sub-advisory agreements (together, the Advisory Contracts) for the fund. FMR and the sub-advisers are referred to herein as the Investment Advisers. The Board, assisted by the advice of fund counsel and Independent Trustees' counsel, requests and considers a broad range of information relevant to the renewal of the Advisory Contracts throughout the year.
The Board meets regularly and, at each of its meetings, covers an extensive agenda of topics and materials and considers factors that are relevant to its annual consideration of the renewal of the fund's Advisory Contracts, including the services and support provided to the fund and its shareholders. The Board has established various standing committees (Committees), each composed of and chaired by Independent Trustees with varying backgrounds, to which the Board has assigned specific subject matter responsibilities in order to enhance effective decision-making by the Board. The Board, acting directly and through its Committees, requests and receives information concerning the annual consideration of the renewal of the fund's Advisory Contracts. The Board also meets as needed to review matters specifically related to the Board's annual consideration of the renewal of the Advisory Contracts. Members of the Board may also meet with trustees of other Fidelity funds through ad hoc joint committees to discuss certain matters relevant to all of the Fidelity funds.
At its July 2017 meeting, the Board unanimously determined to renew the fund's Advisory Contracts. In reaching its determination, the Board considered all factors it believed relevant, including (i) the nature, extent, and quality of the services to be provided to the fund and its shareholders (including the investment performance of the fund); (ii) the competitiveness of the fund's management fee and total expense ratio relative to peer funds; (iii) the total costs of the services to be provided by and the profits to be realized by Fidelity from its relationships with the fund; and (iv) the extent to which, if any, economies of scale exist and would be realized as the fund grows, and whether any economies of scale are appropriately shared with fund shareholders.
In considering whether to renew the Advisory Contracts for the fund, the Board reached a determination, with the assistance of fund counsel and Independent Trustees' counsel and through the exercise of its business judgment, that the renewal of the Advisory Contracts was in the best interests of the fund and its shareholders and that the compensation payable under the Advisory Contracts was fair and reasonable. The Board's decision to renew the Advisory Contracts was not based on any single factor, but rather was based on a comprehensive consideration of all the information provided to the Board at its meetings throughout the year. The Board, in reaching its determination to renew the Advisory Contracts, was aware that shareholders of the fund have a broad range of investment choices available to them, including a wide choice among funds offered by Fidelity's competitors, and that the fund's shareholders, who have the opportunity to review and weigh the disclosure provided by the fund in its prospectus and other public disclosures, have chosen to invest in this fund, which is part of the Fidelity family of funds.
Amendment to Group Fee Rate. The Board also approved an amendment to the management contract for the fund to add an additional breakpoint to the group fee schedule, effective October 1, 2017. The Board noted that the additional breakpoint would result in lower management fee rates as Fidelity's assets under management increase.
Nature, Extent, and Quality of Services Provided. The Board considered Fidelity's staffing as it relates to the fund, including the backgrounds of investment personnel of Fidelity, and also considered the fund's investment objective, strategies, and related investment philosophy. The Independent Trustees also had discussions with senior management of Fidelity's investment operations and investment groups. The Board considered the structure of the investment personnel compensation program and whether this structure provides appropriate incentives to act in the best interests of the fund. Additionally, the Board considered the portfolio managers' investments, if any, in the funds that they manage.
Resources Dedicated to Investment Management and Support Services. The Board and the Fund Oversight and Research Committees reviewed the general qualifications and capabilities of Fidelity's investment staff, including its size, education, experience, and resources, as well as Fidelity's approach to recruiting, training, managing, and compensating investment personnel. The Board noted that Fidelity has continued to increase the resources devoted to non-U.S. offices, including expansion of Fidelity's global investment organization. The Board also noted that Fidelity's analysts have extensive resources, tools and capabilities that allow them to conduct sophisticated quantitative and fundamental analysis, as well as credit analysis of issuers, counterparties and guarantors. Further, the Board considered that Fidelity's investment professionals have sufficient access to global information and data so as to provide competitive investment results over time, and that those professionals also have access to sophisticated tools that permit them to assess portfolio construction and risk and performance attribution characteristics continuously, as well as to transmit new information and research conclusions rapidly around the world. Additionally, in its deliberations, the Board considered Fidelity's trading, risk management, compliance, and technology and operations capabilities and resources, which are integral parts of the investment management process.
Shareholder and Administrative Services. The Board considered (i) the nature, extent, quality, and cost of advisory, administrative, and shareholder services performed by the Investment Advisers and their affiliates under the Advisory Contracts and under separate agreements covering transfer agency, pricing and bookkeeping, and securities lending services for the fund; (ii) the nature and extent of the supervision of third party service providers, principally custodians, subcustodians, and pricing vendors; and (iii) the resources devoted to, and the record of compliance with, the fund's compliance policies and procedures. The Board also reviewed the allocation of fund brokerage, including allocations to brokers affiliated with the Investment Advisers, the use of brokerage commissions to pay fund expenses, and the use of "soft" commission dollars to pay for research services.
The Board noted that the growth of fund assets over time across the complex allows Fidelity to reinvest in the development of services designed to enhance the value or convenience of the Fidelity funds as investment vehicles. These services include 24-hour access to account information and market information through telephone representatives and over the Internet, investor education materials and asset allocation tools, and the expanded availability of Fidelity Investor Centers.
In 2014, the Board formed an ad hoc Committee on Transfer Agency Fees to review the variety of transfer agency fee structures throughout the industry and Fidelity's competitive positioning with respect to industry participants.
Investment in a Large Fund Family. The Board considered the benefits to shareholders of investing in a Fidelity fund, including the benefits of investing in a fund that is part of a large family of funds offering a variety of investment disciplines and providing a large variety of mutual fund investor services. The Board noted that Fidelity had taken, or had made recommendations that resulted in the Fidelity funds taking, a number of actions over the previous year that benefited particular funds, including: (i) continuing to dedicate additional resources to Fidelity's investment research process, and to the support of the senior management team that oversees asset management; (ii) continuing efforts to enhance Fidelity's global research capabilities; (iii) launching new funds and making other enhancements to meet client needs; (iv) launching new share classes of existing funds; (v) eliminating purchase minimums and broadening eligibility requirements for certain lower-priced share classes; (vi) reducing management fees and total expenses for certain growth equity funds and index funds; (vii) lowering expense caps for certain existing funds and classes to reduce expenses borne by shareholders; (viii) eliminating short-term redemption fees for certain funds; (ix) introducing a new pricing structure for certain funds of funds that is expected to reduce overall expenses paid by shareholders; (x) rationalizing product lines and gaining increased efficiencies through proposals for fund mergers and share class consolidations; (xi) continuing to develop, acquire and implement systems and technology to improve services to the funds and shareholders, strengthen information security, and increase efficiency; and (xii) implementing enhancements to further strengthen Fidelity's product line to increase investors' probability of success in achieving their investment goals, including retirement income goals.
Investment Performance. The Board considered whether the fund has operated in accordance with its investment objective, as well as its record of compliance with its investment restrictions and its performance history.
The Board took into account discussions with representatives of the Investment Advisers about fund investment performance that occur at Board meetings throughout the year. In this regard the Board noted that as part of regularly scheduled fund reviews and other reports to the Board on fund performance, the Board considers annualized return information for the fund for different time periods, measured against a securities market index ("benchmark index") and a peer group of funds with similar objectives ("peer group"), if any. In its evaluation of fund investment performance, the Board gave particular attention to information indicating changes in performance of certain Fidelity funds for specific time periods and discussed with the Investment Advisers the reasons for any overperformance or underperformance.
In addition to reviewing absolute and relative fund performance, the Independent Trustees periodically consider the appropriateness of fund performance metrics in evaluating the results achieved. In general, the Independent Trustees believe that fund performance should be evaluated based on net performance (after fees and expenses) of both the highest performing and lowest performing fund share classes, where applicable, compared to appropriate benchmark indices, over appropriate time periods that may include full market cycles, and compared to peer groups, as applicable, over the same periods, taking into account relevant factors including the following: general market conditions; issuer-specific information; and fund cash flows and other factors.
The Independent Trustees recognize that shareholders evaluate performance on a net basis over their own holding periods, for which one-, three-, and five-year periods are often used as a proxy. For this reason, the performance information reviewed by the Board also included net cumulative calendar year total return information for the fund and an appropriate benchmark index for the most recent one-, three-, and five-year periods, as shown below. A peer group is not shown below because the fund does not generally utilize a peer group for performance comparison purposes.
Fidelity Global Commodity Stock Fund
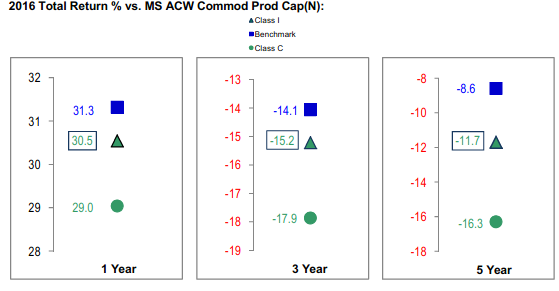
The Board has discussed the fund's underperformance with FMR, including the fund's investment strategy, the portfolio management team, and broader trends in the market that may have impacted the fund's performance, and has engaged with FMR to consider what steps might be taken to remediate the fund's underperformance.
Based on its review, the Board concluded that the nature, extent, and quality of services provided to the fund under the Advisory Contracts should continue to benefit the shareholders of the fund.
Competitiveness of Management Fee and Total Expense Ratio. The Board considered the fund's management fee and total expense ratio compared to "mapped groups" of competitive funds and classes created for the purpose of facilitating the Trustees' competitive analysis of management fees and total expenses. Fidelity creates "mapped groups" by combining similar Lipper investment objective categories that have comparable investment mandates. Combining Lipper investment objective categories aids the Board's management fee and total expense ratio comparisons by broadening the competitive group used for comparison.
Management Fee. The Board considered two proprietary management fee comparisons for the 12-month periods shown in basis points (BP) in the chart below. The group of Lipper funds used by the Board for management fee comparisons is referred to below as the "Total Mapped Group." The Total Mapped Group comparison focuses on a fund's standing in terms of gross management fees before expense reimbursements or caps relative to the total universe of funds with comparable investment mandates, regardless of whether their management fee structures also are comparable. Funds with comparable investment mandates offer exposure to similar types of securities. Funds with comparable management fee structures have similar management fee contractual arrangements (
e.g., flat rate charged for advisory services, all-inclusive fee rate,
etc.). "TMG %" represents the percentage of funds in the Total Mapped Group that had management fees that were lower than the fund's. For example, a hypothetical TMG % of 20% would mean that 80% of the funds in the Total Mapped Group had higher, and 20% had lower, management fees than the fund. The fund's actual TMG %s and the number of funds in the Total Mapped Group are in the chart below. The "Asset-Size Peer Group" (ASPG) comparison focuses on a fund's standing relative to a subset of non-Fidelity funds within the Total Mapped Group that are similar in size and management fee structure. For example, if a fund is in the first quartile of the ASPG, the fund's management fee ranks in the least expensive or lowest 25% of funds in the ASPG. The ASPG represents at least 15% of the funds in the Total Mapped Group with comparable asset size and management fee structures, subject to a minimum of 50 funds (or all funds in the Total Mapped Group if fewer than 50). Additional information, such as the ASPG quartile in which the fund's management fee rate ranked, is also included in the chart and considered by the Board.
Fidelity Global Commodity Stock Fund
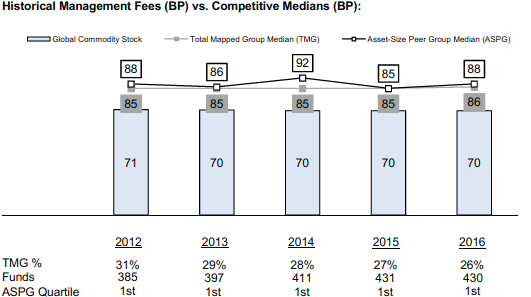
The Board noted that the fund's management fee rate ranked below the median of its Total Mapped Group and below the median of its ASPG for 2016.
The Board noted that, in 2014, the Board and the boards of other Fidelity funds formed the ad hoc Committee on Group Fee to conduct an in-depth review of the "group fee" component of the management fee of funds with such management fee structures. The Committee's focus included the mechanics of the group fee, the competitive landscape of group fee structures, Fidelity funds with no group fee component and investment products not included in group fee assets. The Board also considered that, for funds subject to the group fee, FMR agreed to voluntarily waive fees over a specified period of time in amounts designed to account for assets converted from certain funds to certain collective investment trusts.
The Board also noted that, in 2013, the ad hoc Committee on Management Fees was formed to conduct an in-depth review of the management fee rates of Fidelity's active equity mutual funds. The Committee focused on the following areas: (i) standard fee structures; (ii) research consumption and trading evolution; (iii) management fee competitiveness/profitability by category; and (iv) factors that drive institutional pricing.
Based on its review, the Board concluded that the fund's management fee is fair and reasonable in light of the services that the fund receives and the other factors considered.
Total Expense Ratio. In its review of each class's total expense ratio, the Board considered the fund's management fee rate as well as other fund or class expenses, as applicable, such as transfer agent fees, pricing and bookkeeping fees, fund-paid 12b-1 fees, and custodial, legal, and audit fees. The Board also noted that Fidelity may agree to waive fees and expenses from time to time, and the extent to which, if any, it has done so for the fund. As part of its review, the Board also considered the current and historical total expense ratios of each class of the fund compared to competitive fund median expenses. Each class of the fund is compared to those funds and classes in the Total Mapped Group (used by the Board for management fee comparisons) that have a similar sales load structure.
The Board noted that the total expense ratio of each of Class A and Class I ranked below the competitive median for 2016, the total expense ratio of the retail class ranked equal to the competitive median for 2016, and the total expense ratio of each of Class M (formerly Class T) and Class C ranked above the competitive median for 2016. The Board considered that, in general, various factors can affect total expense ratios. The Board noted that the total expense ratio of Class M was above the competitive median primarily because of higher 12b-1 fees on Class M as compared to most competitor funds. Class M has a higher 12b-1 fee, but a lower front-end sales charge, than traditionally priced front-end sales charge classes. The Board considered that Class M is primarily sold load-waived in the retirement plan market where its 0.50% 12b-1 fee is comparable to competing no-load, higher 12b-1 fee classes designed specifically for retirement plans. The Board noted that the total expense ratio of Class C was above the competitive median primarily because of its 12b-1 fees. The Board noted that the fund offers multiple classes, each of which has a different sales load and 12b-1 fee structure, and that the multiple structures are intended to offer a range of pricing options for the intermediary market. The Board also noted that the total expense ratios of the classes vary primarily by the level of their 12b-1 fees, although differences in transfer agent fees may also cause expenses to vary from class to class.
Fees Charged to Other Fidelity Clients. The Board also considered Fidelity fee structures and other information with respect to clients of Fidelity, such as other funds advised or subadvised by Fidelity, pension plan clients, and other institutional clients with similar mandates. The Board noted that an ad hoc joint committee created by it and the boards of other Fidelity funds periodically (most recently in 2013) reviews and compares Fidelity's institutional investment advisory business with its business of providing services to the Fidelity funds, including the differences in services provided, fees charged, and costs incurred, as well as competition in their respective marketplaces.
Based on its review of total expense ratios and fees charged to other Fidelity clients, the Board concluded that, although some classes were above the median of the universe presented for comparison, the total expense ratio of each class of the fund was reasonable in light of the services that the fund and its shareholders receive and the other factors considered.
Costs of the Services and Profitability. The Board considered the revenues earned and the expenses incurred by Fidelity in conducting the business of developing, marketing, distributing, managing, administering and servicing the fund and servicing the fund's shareholders. The Board also considered the level of Fidelity's profits in respect of all the Fidelity funds.
On an annual basis, Fidelity presents to the Board information about the profitability of its relationships with the fund. Fidelity calculates profitability information for each fund, as well as aggregate profitability information for groups of Fidelity funds and all Fidelity funds, using a series of detailed revenue and cost allocation methodologies which originate with the books and records of Fidelity on which Fidelity's audited financial statements are based. The Audit Committee of the Board reviews any significant changes from the prior year's methodologies.
PricewaterhouseCoopers LLP (PwC), independent registered public accounting firm and auditor to Fidelity and certain Fidelity funds, has been engaged annually by the Board as part of the Board's assessment of Fidelity's profitability analysis. PwC's engagement includes the review and assessment of the methodologies used by Fidelity in determining the revenues and expenses attributable to Fidelity's mutual fund business, and completion of agreed-upon procedures in respect of the mathematical accuracy of the fund profitability information and its conformity to established allocation methodologies. After considering PwC's reports issued under the engagement and information provided by Fidelity, the Board concluded that while other allocation methods may also be reasonable, Fidelity's profitability methodologies are reasonable in all material respects.
The Board also reviewed Fidelity's non-fund businesses and potential fall-out benefits related to the mutual fund business as well as cases where Fidelity's affiliates may benefit from or be related to the fund's business.
The Board considered the costs of the services provided by and the profits realized by Fidelity in connection with the operation of the fund and was satisfied that the profitability was not excessive.
Economies of Scale. The Board considered whether there have been economies of scale in respect of the management of the Fidelity funds, whether the Fidelity funds (including the fund) have appropriately benefited from any such economies of scale, and whether there is potential for realization of any further economies of scale. The Board considered the extent to which the fund will benefit from economies of scale as assets grow through increased services to the fund, through waivers or reimbursements, or through fee or expense ratio reductions. The Board also noted that a committee (the Economies of Scale Committee) created by it and the boards of other Fidelity funds periodically (most recently in 2013) analyzes whether Fidelity attains economies of scale in respect of the management and servicing of the Fidelity funds, whether the Fidelity funds have appropriately benefited from such economies of scale, and whether there is potential for realization of any further economies of scale.
The Board recognized that the fund's management contract incorporates a "group fee" structure, which provides for lower group fee rates as total group assets increase, and for higher group fee rates as total group assets decrease (with "group assets" defined to include fund assets under FMR's management plus the assets of sector funds previously under FMR's management). FMR calculates the group fee rates based on a tiered asset "breakpoint" schedule that varies based on asset class. The Board considered that the group fee is designed to deliver the benefits of economies of scale to fund shareholders when total Fidelity fund assets increase, even if assets of any particular fund are unchanged or have declined, because some portion of Fidelity's costs are attributable to services provided to all Fidelity funds, and all funds benefit if those costs can be allocated among more assets. The Board concluded that, given the group fee structure, fund shareholders will benefit from lower management fees as group assets increase at the fund complex level, regardless of whether Fidelity achieves any such economies of scale.
The Board concluded, taking into account the analysis of the Economies of Scale Committee, that economies of scale, if any, are being appropriately shared between fund shareholders and Fidelity.
Additional Information Requested by the Board. In order to develop fully the factual basis for consideration of the Fidelity funds' advisory contracts, the Board requested and received additional information on certain topics, including: (i) fund performance trends, in particular the underperformance of certain funds, and Fidelity's long-term strategies for certain funds; (ii) Fidelity's fund profitability methodology, profitability trends for certain funds, and the impact of certain factors on fund profitability results, including the impact of market trends on actively managed funds; (iii) the use of performance fees and the calculation of performance adjustments, including the impact of underperformance and fund outflows on performance adjustments; (iv) metrics for evaluating index fund performance; (v) Fidelity's group fee structure, including the group fee breakpoint schedules; (vi) the terms of Fidelity's contractual and voluntary expense cap arrangements with the funds; (vii) the methodology with respect to evaluating competitive fund data and peer group classifications and fee comparisons; (viii) the expense structures for different funds and classes; (ix) Fidelity's arrangements with affiliated sub-advisers on behalf of the funds; (x) information regarding other accounts managed by Fidelity, including institutional accounts and collective investment trusts; (xi) recent changes to the fee structure for certain funds of funds; and (xii) the impact of the Department of Labor's new fiduciary rule on the funds' comparative expense information.
Based on its evaluation of all of the conclusions noted above, and after considering all factors it believed relevant, the Board concluded that the advisory fee structures are fair and reasonable, and that the fund's Advisory Contracts should be renewed.
Corporate Headquarters
245 Summer St.
Boston, MA 02210
www.fidelity.com
GCS-ANN-1217
1.879380.108
Fidelity Advisor® Global Commodity Stock Fund - Class A, Class M (formerly Class T), Class C and Class I
Annual Report October 31, 2017 Class A, Class M, Class C and Class I are classes of Fidelity® Global Commodity Stock Fund |
|
Contents
To view a fund's proxy voting guidelines and proxy voting record for the 12-month period ended June 30, visit http://www.fidelity.com/proxyvotingresults or visit the Securities and Exchange Commission's (SEC) web site at http://www.sec.gov.
You may also call 1-877-208-0098 to request a free copy of the proxy voting guidelines.
Standard & Poor's, S&P and S&P 500 are registered service marks of The McGraw-Hill Companies, Inc. and have been licensed for use by Fidelity Distributors Corporation.
Other third-party marks appearing herein are the property of their respective owners.
All other marks appearing herein are registered or unregistered trademarks or service marks of FMR LLC or an affiliated company. © 2017 FMR LLC. All rights reserved.
This report and the financial statements contained herein are submitted for the general information of the shareholders of the Fund. This report is not authorized for distribution to prospective investors in the Fund unless preceded or accompanied by an effective prospectus.
A fund files its complete schedule of portfolio holdings with the SEC for the first and third quarters of each fiscal year on Form N-Q. Forms N-Q are available on the SEC’s web site at http://www.sec.gov. A fund's Forms N-Q may be reviewed and copied at the SEC’s Public Reference Room in Washington, DC. Information regarding the operation of the SEC's Public Reference Room may be obtained by calling 1-800-SEC-0330.
For a complete list of a fund's portfolio holdings, view the most recent holdings listing, semiannual report, or annual report on Fidelity's web site at http://www.fidelity.com, http://www.institutional.fidelity.com, or http://www.401k.com, as applicable.
NOT FDIC INSURED •MAY LOSE VALUE •NO BANK GUARANTEE
Neither the Fund nor Fidelity Distributors Corporation is a bank.
Performance: The Bottom Line
Average annual total return reflects the change in the value of an investment, assuming reinvestment of distributions from dividend income and capital gains (the profits earned upon the sale of securities that have grown in value, if any) and assuming a constant rate of performance each year. The hypothetical investment and the average annual total returns do not reflect the deduction of taxes that a shareholder would pay on fund distributions or the redemption of fund shares. During periods of reimbursement by Fidelity, a fund’s total return will be greater than it would be had the reimbursement not occurred. How a fund did yesterday is no guarantee of how it will do tomorrow.
Average Annual Total Returns
| For the periods ended October 31, 2017 | Past 1 year | Past 5 years | Life of fundA |
| Class A (incl. 5.75% sales charge) | 11.72% | (2.75)% | 3.07% |
| Class M (incl. 3.50% sales charge) | 13.95% | (2.57)% | 3.07% |
| Class C (incl. contingent deferred sales charge) | 16.59% | (2.35)% | 2.99% |
| Class I | 18.99% | (1.29)% | 4.09% |
A From March 25, 2009
Class C shares' contingent deferred sales charges included in the past one year, past five years, and life of fund total return figures are 1%, 0%, and 0%, respectively.
$10,000 Over Life of Fund
Let's say hypothetically that $10,000 was invested in Fidelity Advisor® Global Commodity Stock Fund - Class A on March 25, 2009, when the fund started, and the current 5.75% sales charge was paid.
The chart shows how the value of your investment would have changed, and also shows how the MSCI ACWI (All Country World Index) Index performed over the same period.
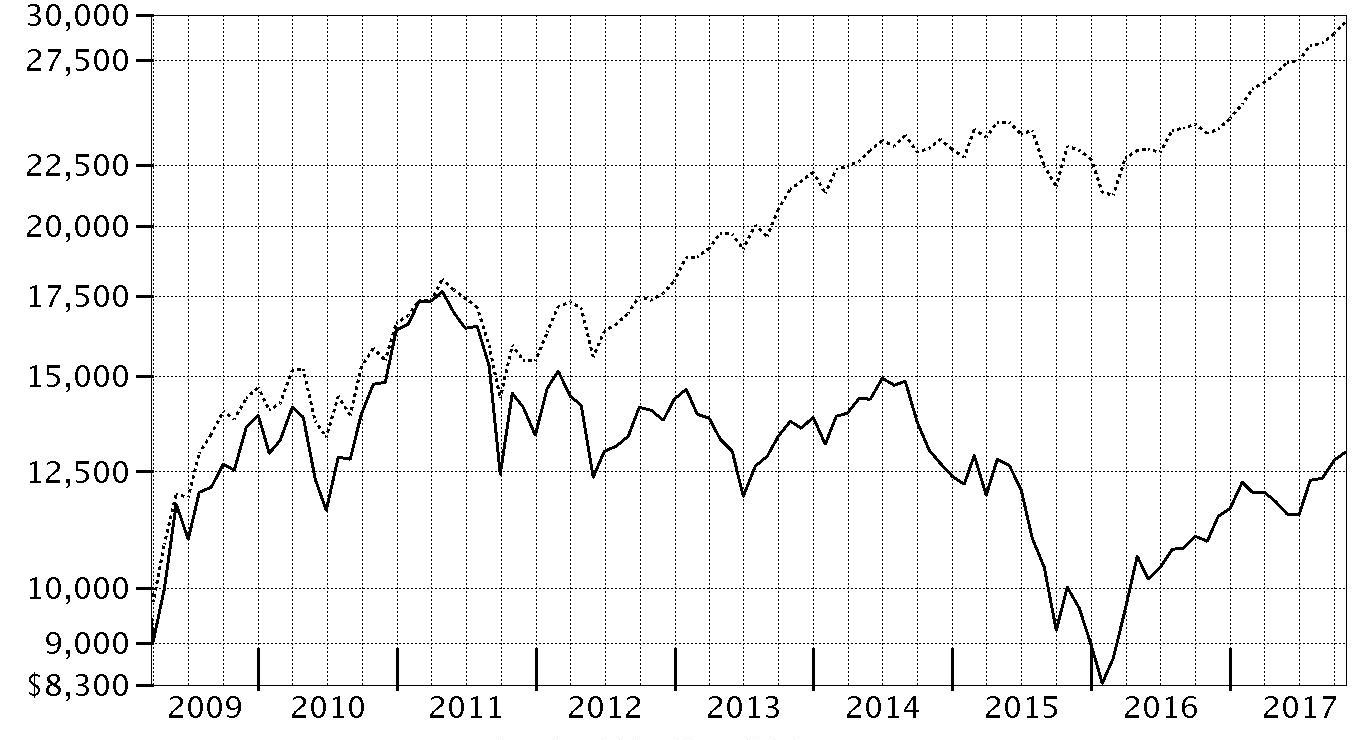
| Period Ending Values |
| $12,971 | Fidelity Advisor® Global Commodity Stock Fund - Class A |
| $29,566 | MSCI ACWI (All Country World Index) Index |
Management's Discussion of Fund Performance
Market Recap: The MSCI ACWI (All Country World Index) Index returned 23.70% for the 12 months ending October 31, 2017, helped partly by a generally weak U.S. dollar. Favorable election results in continental Europe (+30%) suggested ebbing political uncertainty and near-term risk there, but the U.K. (+20%) faced more-mixed conditions ahead of its expected exit from the European Union. Despite central-bank easing – and pressured recently by yen strength – Japan (+18%) lagged the rest of the Asia-Pacific group (+23%). Commodity-price volatility slowed Canada (+17%), but the emerging-markets group (+26%) sped ahead. The U.S. (+23%) finished close to the index result. Sector-wise, information technology (+41%) was driven by a surge among several U.S. and Chinese internet-related names. Financials (+31%) rode rising interest rates that, at the same time, weighed on real estate (+13%) as well as utilities (+15%), consumer staples (+9%) and telecommunication services (+5%) – so-called “bond proxy” sectors. Materials (+28%) and industrials (+26%) responded to demand from China and price gains for certain commodities. In the energy sector (+10%), oil prices lost ground in the spring before rebounding through October 31 to end well above where they started 12 months ago. Lastly, health care (+20%) was hurt by early-period turmoil around drug pricing and health care legislation.
Comments from Portfolio Manager S. Joseph Wickwire II, CFA: For the fiscal year, the fund's share classes (excluding sales charges, if applicable) gained roughly 18% to 19%, trailing the 20.52% gain of the industry index, the MSCI All Country World Commodity Producers Sector Capped Index. The fund also lagged the broader global equity market, as measured by the MSCI ACWI (All Country World Index) Index. Overall, global economic improvement, particularly in foreign markets, provided a tailwind for many commodity producers. Versus the commodities-focused industry index, the fund was hindered most by an overweighting in the exploration & production group, which gained about 1%. Here, notable individual detractors included Range Resources and a sizable position in Anadarko Petroleum. Elsewhere, underweighting the paper products subindustry held back our relative result, including largely avoiding Brazil's Fibria Celulose, as shares of the pulp and paper manufacturer roughly doubled this period. Turning to contributors, good stock selection among agriculture-related firms boosted the fund's relative return, led by North American fertilizer manufacturer CF Industries Holdings and Chicago-based food processor Archer Daniels Midland. Lastly, a sizable underweighting in relatively poor-performing integrated oil giant Exxon Mobil was the fund's top relative contributor the past 12 months.
The views expressed above reflect those of the portfolio manager(s) only through the end of the period as stated on the cover of this report and do not necessarily represent the views of Fidelity or any other person in the Fidelity organization. Any such views are subject to change at any time based upon market or other conditions and Fidelity disclaims any responsibility to update such views. These views may not be relied on as investment advice and, because investment decisions for a Fidelity fund are based on numerous factors, may not be relied on as an indication of trading intent on behalf of any Fidelity fund.
Investment Summary (Unaudited)
Top Ten Stocks as of October 31, 2017
| | % of fund's net assets | % of fund's net assets 6 months ago |
| BHP Billiton PLC | 4.5 | 4.4 |
| Chevron Corp. | 4.2 | 4.2 |
| Rio Tinto PLC | 3.4 | 4.1 |
| Exxon Mobil Corp. | 3.3 | 1.5 |
| Potash Corp. of Saskatchewan, Inc. | 3.1 | 2.6 |
| Glencore Xstrata PLC | 2.8 | 3.4 |
| Agrium, Inc. | 2.6 | 2.2 |
| Total SA | 2.4 | 2.2 |
| FMC Corp. | 2.2 | 1.3 |
| Anadarko Petroleum Corp. | 2.2 | 2.2 |
| | 30.7 | |
Top Sectors (% of fund's net assets)
| As of October 31, 2017 |
| | Energy | 32.7% |
| | Metals | 32.7% |
| | Agriculture | 26.2% |
| | Other | 7.2% |
| | Short-Term Investments and Net Other Assets | 1.2% |

| As of April 30, 2017 |
| | Energy | 34.5% |
| | Metals | 31.3% |
| | Agriculture | 28.7% |
| | Other | 3.9% |
| | Short-Term Investments and Net Other Assets | 1.6% |
Investments October 31, 2017
Showing Percentage of Net Assets
| Common Stocks - 97.2% | | | |
| | | Shares | Value |
| Chemicals - 17.7% | | | |
| Commodity Chemicals - 0.9% | | | |
| LyondellBasell Industries NV Class A | | 35,100 | $3,633,903 |
| Methanex Corp. | | 4,200 | 204,677 |
| | | | 3,838,580 |
| Diversified Chemicals - 1.0% | | | |
| DowDuPont, Inc. | | 42,358 | 3,062,907 |
| Eastman Chemical Co. | | 5,000 | 454,050 |
| The Chemours Co. LLC | | 16,200 | 917,082 |
| | | | 4,434,039 |
| Fertilizers & Agricultural Chemicals - 15.3% | | | |
| Agrium, Inc. | | 103,200 | 11,235,129 |
| CF Industries Holdings, Inc. | | 221,760 | 8,422,445 |
| FMC Corp. | | 100,300 | 9,313,858 |
| K&S AG (a) | | 140,100 | 3,397,730 |
| Monsanto Co. | | 61,200 | 7,411,320 |
| Potash Corp. of Saskatchewan, Inc. | | 687,000 | 13,371,498 |
| The Mosaic Co. | | 285,161 | 6,370,497 |
| UPL Ltd. | | 109,900 | 1,356,650 |
| Yara International ASA | | 100,400 | 4,766,787 |
| | | | 65,645,914 |
| Specialty Chemicals - 0.5% | | | |
| Platform Specialty Products Corp. (b) | | 119,500 | 1,278,650 |
| W.R. Grace & Co. | | 10,300 | 787,847 |
| | | | 2,066,497 |
|
| TOTAL CHEMICALS | | | 75,985,030 |
|
| Construction Materials - 0.2% | | | |
| Construction Materials - 0.2% | | | |
| Buzzi Unicem SpA | | 15,600 | 434,848 |
| CEMEX S.A.B. de CV sponsored ADR | | 51,800 | 420,098 |
| | | | 854,946 |
| Containers & Packaging - 0.1% | | | |
| Paper Packaging - 0.1% | | | |
| Graphic Packaging Holding Co. | | 14,100 | 218,409 |
| WestRock Co. | | 3,459 | 212,140 |
| | | | 430,549 |
| Energy Equipment & Services - 0.7% | | | |
| Oil & Gas Equipment & Services - 0.7% | | | |
| Baker Hughes, a GE Co. Class A | | 40,700 | 1,279,201 |
| John Wood Group PLC | | 139,100 | 1,314,465 |
| Schlumberger Ltd. | | 10,000 | 640,000 |
| | | | 3,233,666 |
| Food Products - 5.7% | | | |
| Agricultural Products - 5.5% | | | |
| Archer Daniels Midland Co. | | 78,000 | 3,187,860 |
| Bunge Ltd. | | 108,100 | 7,435,118 |
| Darling International, Inc. (b) | | 194,800 | 3,555,100 |
| First Resources Ltd. | | 1,532,700 | 2,215,112 |
| Ingredion, Inc. | | 42,500 | 5,327,375 |
| Wilmar International Ltd. | | 709,100 | 1,763,516 |
| | | | 23,484,081 |
| Packaged Foods & Meats - 0.2% | | | |
| Adecoagro SA (b) | | 106,700 | 1,084,072 |
|
| TOTAL FOOD PRODUCTS | | | 24,568,153 |
|
| Independent Power and Renewable Electricity Producers - 0.6% | | | |
| Independent Power Producers & Energy Traders - 0.6% | | | |
| China Resources Power Holdings Co. Ltd. | | 476,000 | 915,220 |
| NRG Energy, Inc. | | 25,100 | 627,500 |
| The AES Corp. | | 91,400 | 971,582 |
| | | | 2,514,302 |
| Machinery - 1.4% | | | |
| Agricultural & Farm Machinery - 0.4% | | | |
| AGCO Corp. | | 600 | 41,142 |
| Deere & Co. | | 6,400 | 850,432 |
| Jain Irrigation Systems Ltd. | | 617,859 | 977,601 |
| | | | 1,869,175 |
| Construction Machinery & Heavy Trucks - 0.4% | | | |
| Allison Transmission Holdings, Inc. | | 36,400 | 1,546,636 |
| Caterpillar, Inc. | | 400 | 54,320 |
| | | | 1,600,956 |
| Industrial Machinery - 0.6% | | | |
| Andritz AG | | 15,300 | 865,090 |
| Mitsubishi Heavy Industries Ltd. | | 21,400 | 837,316 |
| The Weir Group PLC | | 40,700 | 1,055,708 |
| | | | 2,758,114 |
|
| TOTAL MACHINERY | | | 6,228,245 |
|
| Metals & Mining - 32.3% | | | |
| Copper - 2.6% | | | |
| First Quantum Minerals Ltd. | | 619,124 | 6,925,013 |
| Freeport-McMoRan, Inc. (b) | | 290,000 | 4,054,200 |
| | | | 10,979,213 |
| Diversified Metals & Mining - 14.8% | | | |
| Anglo American PLC (United Kingdom) | | 236,651 | 4,463,174 |
| Arizona Mining, Inc. (b) | | 635,900 | 1,597,020 |
| BHP Billiton PLC | | 1,067,704 | 19,331,472 |
| Boliden AB | | 55,200 | 1,931,949 |
| Glencore Xstrata PLC | | 2,465,935 | 11,888,728 |
| Grupo Mexico SA de CV Series B | | 408,820 | 1,329,343 |
| Ivanhoe Mines Ltd. (b) | | 586,900 | 2,124,504 |
| Korea Zinc Co. Ltd. | | 1,992 | 912,184 |
| MMC Norilsk Nickel PJSC sponsored ADR | | 45,700 | 840,880 |
| Rio Tinto PLC | | 304,887 | 14,409,155 |
| South32 Ltd. | | 509,778 | 1,314,834 |
| Teck Resources Ltd. Class B (sub. vtg.) | | 118,900 | 2,429,427 |
| Turquoise Hill Resources Ltd. (b) | | 311,400 | 951,024 |
| | | | 63,523,694 |
| Gold - 7.3% | | | |
| Agnico Eagle Mines Ltd. (Canada) | | 47,000 | 2,098,442 |
| AngloGold Ashanti Ltd. sponsored ADR | | 117,500 | 1,092,750 |
| B2Gold Corp. (b) | | 862,180 | 2,192,040 |
| Barrick Gold Corp. | | 327,500 | 4,731,881 |
| Compania de Minas Buenaventura SA sponsored ADR | | 30,200 | 416,458 |
| Continental Gold, Inc. (b) | | 571,800 | 1,373,987 |
| Detour Gold Corp. (b) | | 79,800 | 850,515 |
| Eldorado Gold Corp. | | 259,600 | 325,984 |
| Goldcorp, Inc. | | 140,110 | 1,829,977 |
| Guyana Goldfields, Inc. (b) | | 306,000 | 1,091,078 |
| Kinross Gold Corp. (b) | | 110,000 | 434,850 |
| Newcrest Mining Ltd. | | 63,442 | 1,088,125 |
| Newmont Mining Corp. | | 123,600 | 4,469,376 |
| Premier Gold Mines Ltd. (b) | | 1,044,900 | 2,778,085 |
| Randgold Resources Ltd. sponsored ADR | | 19,200 | 1,886,784 |
| Resolute Mng Ltd. | | 516,514 | 407,173 |
| Seabridge Gold, Inc. (b) | | 33,200 | 451,520 |
| SEMAFO, Inc. (b) | | 441,100 | 1,107,793 |
| Sibanye-Stillwater ADR (a) | | 213,428 | 1,094,886 |
| Solgold PLC (a)(b) | | 575,000 | 253,926 |
| Teranga Gold Corp. (b) | | 174,600 | 354,586 |
| Torex Gold Resources, Inc. (b) | | 76,470 | 1,054,493 |
| | | | 31,384,709 |
| Precious Metals & Minerals - 0.7% | | | |
| Alrosa Co. Ltd. | | 625,000 | 803,694 |
| Dalradian Resources, Inc. (b) | | 10,000 | 9,457 |
| Fresnillo PLC | | 48,300 | 835,228 |
| Gold Standard Ventures Corp. (b) | | 721,400 | 952,247 |
| Impala Platinum Holdings Ltd. (b) | | 122,400 | 339,530 |
| Osisko Mining, Inc. (b) | | 5,000 | 15,270 |
| | | | 2,955,426 |
| Silver - 0.7% | | | |
| Wheaton Precious Metals Corp. | | 143,900 | 2,985,972 |
| Steel - 6.2% | | | |
| ArcelorMittal SA Class A unit (a)(b) | | 172,102 | 4,922,117 |
| China Steel Corp. | | 530,000 | 431,731 |
| Fortescue Metals Group Ltd. | | 258,456 | 917,835 |
| Hyundai Steel Co. | | 28,152 | 1,447,773 |
| JFE Holdings, Inc. | | 105,300 | 2,263,032 |
| Nippon Steel & Sumitomo Metal Corp. | | 101,200 | 2,426,318 |
| Nucor Corp. | | 65,692 | 3,798,968 |
| POSCO | | 15,312 | 4,472,250 |
| Steel Dynamics, Inc. | | 53,600 | 1,994,456 |
| Thyssenkrupp AG | | 93,700 | 2,499,999 |
| Vale SA sponsored ADR | | 152,741 | 1,495,334 |
| | | | 26,669,813 |
|
| TOTAL METALS & MINING | | | 138,498,827 |
|
| Multi-Utilities - 0.2% | | | |
| Multi-Utilities - 0.2% | | | |
| E.ON AG | | 77,600 | 919,129 |
| Oil, Gas & Consumable Fuels - 32.4% | | | |
| Coal & Consumable Fuels - 0.1% | | | |
| Cameco Corp. | | 53,100 | 431,353 |
| Integrated Oil & Gas - 17.7% | | | |
| BP PLC | | 1,023,500 | 6,942,053 |
| Cenovus Energy, Inc. | | 294,700 | 2,859,967 |
| Chevron Corp. | | 156,300 | 18,113,607 |
| China Petroleum & Chemical Corp. (H Shares) | | 2,756,000 | 2,023,782 |
| Exxon Mobil Corp. | | 170,500 | 14,211,175 |
| Gazprom OAO | | 195,000 | 419,810 |
| Imperial Oil Ltd. | | 28,400 | 920,837 |
| Lukoil PJSC sponsored ADR | | 42,200 | 2,240,820 |
| Occidental Petroleum Corp. | | 13,100 | 845,867 |
| Royal Dutch Shell PLC: | | | |
| Class A (United Kingdom) | | 122,000 | 3,840,535 |
| Class B (United Kingdom) | | 44,393 | 1,429,334 |
| Statoil ASA (a) | | 116,900 | 2,375,118 |
| Suncor Energy, Inc. | | 240,632 | 8,169,663 |
| Total SA | | 185,600 | 10,344,999 |
| YPF SA Class D sponsored ADR (b) | | 50,300 | 1,235,368 |
| | | | 75,972,935 |
| Oil & Gas Exploration & Production - 13.0% | | | |
| Anadarko Petroleum Corp. | | 187,800 | 9,271,686 |
| Apache Corp. | | 40,500 | 1,675,485 |
| Cabot Oil & Gas Corp. | | 40,900 | 1,132,930 |
| Canadian Natural Resources Ltd. | | 83,300 | 2,906,880 |
| Centennial Resource Development, Inc. Class A | | 2,500 | 48,575 |
| Cimarex Energy Co. | | 9,000 | 1,052,370 |
| CNOOC Ltd. sponsored ADR | | 23,600 | 3,226,120 |
| ConocoPhillips Co. | | 98,500 | 5,038,275 |
| Continental Resources, Inc. (b) | | 50,292 | 2,047,387 |
| Devon Energy Corp. | | 42,100 | 1,553,490 |
| Diamondback Energy, Inc. (b) | | 14,400 | 1,543,104 |
| Encana Corp. | | 40,600 | 474,889 |
| EOG Resources, Inc. | | 44,100 | 4,404,267 |
| EQT Corp. | | 33,601 | 2,101,407 |
| Hess Corp. | | 25,300 | 1,117,248 |
| INPEX Corp. | | 84,600 | 905,828 |
| Marathon Oil Corp. | | 92,800 | 1,319,616 |
| Murphy Oil Corp. | | 34,400 | 920,200 |
| Newfield Exploration Co. (b) | | 37,000 | 1,139,230 |
| Noble Energy, Inc. | | 139,200 | 3,879,504 |
| NOVATEK OAO GDR (Reg. S) | | 13,400 | 1,528,940 |
| Pioneer Natural Resources Co. | | 14,010 | 2,096,877 |
| PrairieSky Royalty Ltd. | | 61,398 | 1,634,298 |
| Range Resources Corp. (a) | | 97,900 | 1,772,969 |
| RSP Permian, Inc. (b) | | 25,850 | 889,499 |
| Southwestern Energy Co. (b) | | 191,700 | 1,063,935 |
| Woodside Petroleum Ltd. | | 37,311 | 877,525 |
| | | | 55,622,534 |
| Oil & Gas Refining & Marketing - 0.3% | | | |
| Bharat Petroleum Corp. Ltd. | | 58,500 | 489,322 |
| Reliance Industries Ltd. | | 59,400 | 863,112 |
| | | | 1,352,434 |
| Oil & Gas Storage & Transport - 1.3% | | | |
| Boardwalk Pipeline Partners, LP | | 75,900 | 1,064,118 |
| Cheniere Energy, Inc. (b) | | 19,100 | 892,734 |
| Golar LNG Ltd. (a) | | 42,500 | 898,025 |
| Kinder Morgan, Inc. | | 56,300 | 1,019,593 |
| Petronet LNG Ltd. | | 207,500 | 832,724 |
| Scorpio Tankers, Inc. | | 245,700 | 874,692 |
| | | | 5,581,886 |
|
| TOTAL OIL, GAS & CONSUMABLE FUELS | | | 138,961,142 |
|
| Paper & Forest Products - 5.2% | | | |
| Forest Products - 0.3% | | | |
| Quintis Ltd. (c) | | 413,280 | 93,310 |
| Svenska Cellulosa AB (SCA) (B Shares) | | 137,700 | 1,292,842 |
| | | | 1,386,152 |
| Paper Products - 4.9% | | | |
| Mondi PLC | | 297,600 | 7,197,638 |
| Nine Dragons Paper (Holdings) Ltd. | | 414,000 | 759,925 |
| Sappi Ltd. | | 285,361 | 1,911,321 |
| Stora Enso Oyj (R Shares) | | 130,600 | 2,043,098 |
| UPM-Kymmene Corp. | | 295,100 | 8,868,679 |
| | | | 20,780,661 |
|
| TOTAL PAPER & FOREST PRODUCTS | | | 22,166,813 |
|
| Pharmaceuticals - 0.3% | | | |
| Pharmaceuticals - 0.3% | | | |
| Bayer AG | | 11,100 | 1,443,877 |
| Trading Companies & Distributors - 0.4% | | | |
| Trading Companies & Distributors - 0.4% | | | |
| Univar, Inc. (b) | | 53,000 | 1,576,750 |
| TOTAL COMMON STOCKS | | | |
| (Cost $460,294,912) | | | 417,381,429 |
|
| Nonconvertible Preferred Stocks - 1.6% | | | |
| Metals & Mining - 0.4% | | | |
| Steel - 0.4% | | | |
| Gerdau SA (PN) | | 52,000 | 174,059 |
| Gerdau SA sponsored ADR | | 532,900 | 1,763,899 |
| | | | 1,937,958 |
| Oil, Gas & Consumable Fuels - 0.9% | | | |
| Integrated Oil & Gas - 0.9% | | | |
| Petroleo Brasileiro SA - Petrobras (PN) sponsored ADR (non-vtg.) (b) | | 356,900 | 3,658,225 |
| Paper & Forest Products - 0.3% | | | |
| Paper Products - 0.3% | | | |
| Suzano Papel e Celulose SA | | 177,900 | 1,105,587 |
| TOTAL NONCONVERTIBLE PREFERRED STOCKS | | | |
| (Cost $6,045,313) | | | 6,701,770 |
|
| Money Market Funds - 3.7% | | | |
| Fidelity Cash Central Fund, 1.10% (d) | | 3,156,335 | 3,156,966 |
| Fidelity Securities Lending Cash Central Fund 1.11% (d)(e) | | 12,638,057 | 12,639,320 |
| TOTAL MONEY MARKET FUNDS | | | |
| (Cost $15,796,730) | | | 15,796,286 |
| TOTAL INVESTMENT IN SECURITIES - 102.5% | | | |
| (Cost $482,136,955) | | | 439,879,485 |
| NET OTHER ASSETS (LIABILITIES) - (2.5)% | | | (10,583,395) |
| NET ASSETS - 100% | | | $429,296,090 |
Legend
(a) Security or a portion of the security is on loan at period end.
(b) Non-income producing
(c) Level 3 security
(d) Affiliated fund that is generally available only to investment companies and other accounts managed by Fidelity Investments. The rate quoted is the annualized seven-day yield of the fund at period end. A complete unaudited listing of the fund's holdings as of its most recent quarter end is available upon request. In addition, each Fidelity Central Fund's financial statements, which are not covered by the Fund's Report of Independent Registered Public Accounting Firm, are available on the SEC's website or upon request.
(e) Investment made with cash collateral received from securities on loan.
Affiliated Central Funds
Information regarding fiscal year to date income earned by the Fund from investments in Fidelity Central Funds is as follows:
| Fund | Income earned |
| Fidelity Cash Central Fund | $42,932 |
| Fidelity Securities Lending Cash Central Fund | 132,727 |
| Total | $175,659 |
Investment Valuation
The following is a summary of the inputs used, as of October 31, 2017, involving the Fund's assets and liabilities carried at fair value. The inputs or methodology used for valuing securities may not be an indication of the risk associated with investing in those securities. For more information on valuation inputs, and their aggregation into the levels used below, please refer to the Investment Valuation section in the accompanying Notes to Financial Statements.
| | Valuation Inputs at Reporting Date: |
| Description | Total | Level 1 | Level 2 | Level 3 |
| Investments in Securities: | | | | |
| Common Stocks | $417,381,429 | $343,323,921 | $73,964,198 | $93,310 |
| Nonconvertible Preferred Stocks | 6,701,770 | 6,701,770 | -- | -- |
| Money Market Funds | 15,796,286 | 15,796,286 | -- | -- |
| Total Investments in Securities: | $439,879,485 | $365,821,977 | $73,964,198 | $93,310 |
Other Information
Distribution of investments by country or territory of incorporation, as a percentage of Total Net Assets, is as follows (Unaudited):
| United States of America | 37.0% |
| Canada | 18.9% |
| United Kingdom | 14.2% |
| Bailiwick of Jersey | 3.2% |
| Finland | 2.6% |
| France | 2.4% |
| Bermuda | 2.1% |
| Germany | 2.0% |
| Brazil | 1.9% |
| Norway | 1.7% |
| Korea (South) | 1.5% |
| Japan | 1.5% |
| Luxembourg | 1.3% |
| Russia | 1.3% |
| Australia | 1.1% |
| South Africa | 1.0% |
| India | 1.0% |
| Others (Individually Less Than 1%) | 5.3% |
| | 100.0% |
See accompanying notes which are an integral part of the financial statements.
Financial Statements
Statement of Assets and Liabilities
| | | October 31, 2017 |
| Assets | | |
Investment in securities, at value (including securities loaned of $12,167,784) — See accompanying schedule:
Unaffiliated issuers (cost $466,340,225) | $424,083,199 | |
| Fidelity Central Funds (cost $15,796,730) | 15,796,286 | |
| Total Investment in Securities (cost $482,136,955) | | $439,879,485 |
| Foreign currency held at value (cost $276,467) | | 277,381 |
| Receivable for investments sold | | 3,102,219 |
| Receivable for fund shares sold | | 3,413,322 |
| Dividends receivable | | 458,224 |
| Distributions receivable from Fidelity Central Funds | | 7,953 |
| Prepaid expenses | | 909 |
| Other receivables | | 19,507 |
| Total assets | | 447,159,000 |
| Liabilities | | |
| Payable for investments purchased | $4,312,349 | |
| Payable for fund shares redeemed | 477,301 | |
| Accrued management fee | 247,456 | |
| Distribution and service plan fees payable | 21,130 | |
| Other affiliated payables | 109,187 | |
| Other payables and accrued expenses | 54,915 | |
| Collateral on securities loaned | 12,640,572 | |
| Total liabilities | | 17,862,910 |
| Net Assets | | $429,296,090 |
| Net Assets consist of: | | |
| Paid in capital | | $531,459,376 |
| Undistributed net investment income | | 4,378,040 |
| Accumulated undistributed net realized gain (loss) on investments and foreign currency transactions | | (64,262,092) |
| Net unrealized appreciation (depreciation) on investments and assets and liabilities in foreign currencies | | (42,279,234) |
| Net Assets | | $429,296,090 |
| Calculation of Maximum Offering Price | | |
| Class A: | | |
| Net Asset Value and redemption price per share ($29,919,799 ÷ 2,382,606 shares) | | $12.56 |
| Maximum offering price per share (100/94.25 of $12.56) | | $13.33 |
| Class M: | | |
| Net Asset Value and redemption price per share ($6,876,025 ÷ 548,659 shares) | | $12.53 |
| Maximum offering price per share (100/96.50 of $12.53) | | $12.98 |
| Class C: | | |
| Net Asset Value and offering price per share ($14,288,713 ÷ 1,152,801 shares)(a) | | $12.39 |
| Global Commodity Stock: | | |
| Net Asset Value, offering price and redemption price per share ($264,556,747 ÷ 21,006,163 shares) | | $12.59 |
| Class I: | | |
| Net Asset Value, offering price and redemption price per share ($113,654,806 ÷ 9,022,691 shares) | | $12.60 |
(a) Redemption price per share is equal to net asset value less any applicable contingent deferred sales charge.
See accompanying notes which are an integral part of the financial statements.
Statement of Operations
| | | Year ended October 31, 2017 |
| Investment Income | | |
| Dividends | | $10,152,766 |
| Income from Fidelity Central Funds | | 175,659 |
| Income before foreign taxes withheld | | 10,328,425 |
| Less foreign taxes withheld | | (502,978) |
| Total income | | 9,825,447 |
| Expenses | | |
| Management fee | $2,861,185 | |
| Transfer agent fees | 1,084,396 | |
| Distribution and service plan fees | 255,937 | |
| Accounting and security lending fees | 215,262 | |
| Custodian fees and expenses | 58,348 | |
| Independent trustees' fees and expenses | 1,608 | |
| Registration fees | 88,279 | |
| Audit | 58,197 | |
| Legal | 1,209 | |
| Miscellaneous | 2,887 | |
| Total expenses before reductions | 4,627,308 | |
| Expense reductions | (43,280) | 4,584,028 |
| Net investment income (loss) | | 5,241,419 |
| Realized and Unrealized Gain (Loss) | | |
| Net realized gain (loss) on: | | |
| Investment securities: | | |
| Unaffiliated issuers | 30,393,066 | |
| Fidelity Central Funds | (2,036) | |
| Foreign currency transactions | (36,581) | |
| Total net realized gain (loss) | | 30,354,449 |
| Change in net unrealized appreciation (depreciation) on: | | |
| Investment securities: | | |
| Unaffiliated issuers | 31,183,525 | |
| Fidelity Central Funds | (444) | |
| Assets and liabilities in foreign currencies | 8,727 | |
| Total change in net unrealized appreciation (depreciation) | | 31,191,808 |
| Net gain (loss) | | 61,546,257 |
| Net increase (decrease) in net assets resulting from operations | | $66,787,676 |
See accompanying notes which are an integral part of the financial statements.
Statement of Changes in Net Assets
| | Year ended October 31, 2017 | Year ended October 31, 2016 |
| Increase (Decrease) in Net Assets | | |
| Operations | | |
| Net investment income (loss) | $5,241,419 | $3,732,641 |
| Net realized gain (loss) | 30,354,449 | (22,456,882) |
| Change in net unrealized appreciation (depreciation) | 31,191,808 | 48,478,395 |
| Net increase (decrease) in net assets resulting from operations | 66,787,676 | 29,754,154 |
| Distributions to shareholders from net investment income | (3,511,036) | (5,140,876) |
| Distributions to shareholders from net realized gain | (2,362,260) | (224,075) |
| Total distributions | (5,873,296) | (5,364,951) |
| Share transactions - net increase (decrease) | 15,840,057 | 97,100,151 |
| Redemption fees | 12,604 | 14,543 |
| Total increase (decrease) in net assets | 76,767,041 | 121,503,897 |
| Net Assets | | |
| Beginning of period | 352,529,049 | 231,025,152 |
| End of period | $429,296,090 | $352,529,049 |
| Other Information | | |
| Undistributed net investment income end of period | $4,378,040 | $3,009,856 |
See accompanying notes which are an integral part of the financial statements.
Financial Highlights
Fidelity Global Commodity Stock Fund Class A
| Years ended October 31, | 2017 | 2016 | 2015 | 2014 | 2013 |
| Selected Per–Share Data | | | | | |
| Net asset value, beginning of period | $10.73 | $10.05 | $13.25 | $14.17 | $14.59 |
| Income from Investment Operations | | | | | |
| Net investment income (loss)A | .12 | .11 | .22 | .15 | .16 |
| Net realized and unrealized gain (loss) | 1.86 | .79 | (3.25) | (.91) | (.45) |
| Total from investment operations | 1.98 | .90 | (3.03) | (.76) | (.29) |
| Distributions from net investment income | (.08) | (.21) | (.14) | (.15) | (.13) |
| Distributions from net realized gain | (.07) | (.01) | (.03) | (.01) | – |
| Total distributions | (.15) | (.22) | (.17) | (.16) | (.13) |
| Redemption fees added to paid in capitalA,B | – | – | – | – | – |
| Net asset value, end of period | $12.56 | $10.73 | $10.05 | $13.25 | $14.17 |
| Total ReturnC,D | 18.53% | 9.29% | (23.16)% | (5.41)% | (2.00)% |
| Ratios to Average Net AssetsE,F | | | | | |
| Expenses before reductions | 1.33% | 1.38% | 1.34% | 1.35% | 1.36% |
| Expenses net of fee waivers, if any | 1.33% | 1.38% | 1.34% | 1.35% | 1.35% |
| Expenses net of all reductions | 1.32% | 1.37% | 1.34% | 1.35% | 1.34% |
| Net investment income (loss) | 1.07% | 1.18% | 1.85% | 1.05% | 1.12% |
| Supplemental Data | | | | | |
| Net assets, end of period (000 omitted) | $29,920 | $34,791 | $31,391 | $51,586 | $71,293 |
| Portfolio turnover rateG | 81% | 85% | 77% | 75% | 65% |
A Calculated based on average shares outstanding during the period.
B Amount represents less than $.005 per share.
C Total returns would have been lower if certain expenses had not been reduced during the applicable periods shown.
D Total returns do not include the effect of the sales charges.
E Fees and expenses of any underlying Fidelity Central Funds are not included in the Fund's expense ratio. The Fund indirectly bears its proportionate share of the expenses of any underlying Fidelity Central Funds.
F Expense ratios reflect operating expenses of the class. Expenses before reductions do not reflect amounts reimbursed by the investment adviser or reductions from brokerage service arrangements or reductions from other expense offset arrangements and do not represent the amount paid by the class during periods when reimbursements or reductions occur. Expenses net of fee waivers reflect expenses after reimbursement by the investment adviser but prior to reductions from brokerage service arrangements or other expense offset arrangements. Expenses net of all reductions represent the net expenses paid by the class.
G Amount does not include the portfolio activity of any underlying Fidelity Central Funds.
See accompanying notes which are an integral part of the financial statements.
Fidelity Global Commodity Stock Fund Class M
| Years ended October 31, | 2017 | 2016 | 2015 | 2014 | 2013 |
| Selected Per–Share Data | | | | | |
| Net asset value, beginning of period | $10.72 | $10.02 | $13.21 | $14.13 | $14.54 |
| Income from Investment Operations | | | | | |
| Net investment income (loss)A | .09 | .09 | .19 | .11 | .12 |
| Net realized and unrealized gain (loss) | 1.84 | .79 | (3.25) | (.90) | (.45) |
| Total from investment operations | 1.93 | .88 | (3.06) | (.79) | (.33) |
| Distributions from net investment income | (.05) | (.17) | (.10) | (.11) | (.08) |
| Distributions from net realized gain | (.07) | (.01) | (.03) | (.01) | – |
| Total distributions | (.12) | (.18) | (.13) | (.13)B | (.08) |
| Redemption fees added to paid in capitalA,C | – | – | – | – | – |
| Net asset value, end of period | $12.53 | $10.72 | $10.02 | $13.21 | $14.13 |
| Total ReturnD,E | 18.09% | 9.08% | (23.40)% | (5.65)% | (2.26)% |
| Ratios to Average Net AssetsF,G | | | | | |
| Expenses before reductions | 1.62% | 1.65% | 1.63% | 1.62% | 1.62% |
| Expenses net of fee waivers, if any | 1.62% | 1.65% | 1.63% | 1.62% | 1.61% |
| Expenses net of all reductions | 1.61% | 1.64% | 1.62% | 1.62% | 1.60% |
| Net investment income (loss) | .78% | .90% | 1.57% | .78% | .86% |
| Supplemental Data | | | | | |
| Net assets, end of period (000 omitted) | $6,876 | $6,068 | $6,335 | $9,867 | $12,551 |
| Portfolio turnover rateH | 81% | 85% | 77% | 75% | 65% |
A Calculated based on average shares outstanding during the period.
B Total distributions of $.13 per share is comprised of distributions from net investment income of $.113 and distributions from net realized gain of $.013 per share.
C Amount represents less than $.005 per share.
D Total returns would have been lower if certain expenses had not been reduced during the applicable periods shown.
E Total returns do not include the effect of the sales charges.
F Fees and expenses of any underlying Fidelity Central Funds are not included in the Fund's expense ratio. The Fund indirectly bears its proportionate share of the expenses of any underlying Fidelity Central Funds.
G Expense ratios reflect operating expenses of the class. Expenses before reductions do not reflect amounts reimbursed by the investment adviser or reductions from brokerage service arrangements or reductions from other expense offset arrangements and do not represent the amount paid by the class during periods when reimbursements or reductions occur. Expenses net of fee waivers reflect expenses after reimbursement by the investment adviser but prior to reductions from brokerage service arrangements or other expense offset arrangements. Expenses net of all reductions represent the net expenses paid by the class.
H Amount does not include the portfolio activity of any underlying Fidelity Central Funds.
See accompanying notes which are an integral part of the financial statements.
Fidelity Global Commodity Stock Fund Class C
| Years ended October 31, | 2017 | 2016 | 2015 | 2014 | 2013 |
| Selected Per–Share Data | | | | | |
| Net asset value, beginning of period | $10.61 | $9.92 | $13.06 | $13.96 | $14.37 |
| Income from Investment Operations | | | | | |
| Net investment income (loss)A | .04 | .04 | .13 | .04 | .05 |
| Net realized and unrealized gain (loss) | 1.82 | .78 | (3.22) | (.89) | (.44) |
| Total from investment operations | 1.86 | .82 | (3.09) | (.85) | (.39) |
| Distributions from net investment income | (.01) | (.12) | (.03) | (.03) | (.02) |
| Distributions from net realized gain | (.07) | (.01) | (.03) | (.01) | – |
| Total distributions | (.08) | (.13) | (.05)B | (.05)C | (.02) |
| Redemption fees added to paid in capitalA,D | – | – | – | – | – |
| Net asset value, end of period | $12.39 | $10.61 | $9.92 | $13.06 | $13.96 |
| Total ReturnE,F | 17.59% | 8.46% | (23.74)% | (6.13)% | (2.75)% |
| Ratios to Average Net AssetsG,H | | | | | |
| Expenses before reductions | 2.07% | 2.13% | 2.12% | 2.11% | 2.11% |
| Expenses net of fee waivers, if any | 2.07% | 2.13% | 2.12% | 2.11% | 2.11% |
| Expenses net of all reductions | 2.06% | 2.12% | 2.11% | 2.11% | 2.10% |
| Net investment income (loss) | .33% | .43% | 1.08% | .29% | .36% |
| Supplemental Data | | | | | |
| Net assets, end of period (000 omitted) | $14,289 | $12,620 | $11,274 | $17,659 | $23,830 |
| Portfolio turnover rateI | 81% | 85% | 77% | 75% | 65% |
A Calculated based on average shares outstanding during the period.
B Total distributions of $.05 per share is comprised of distributions from net investment income of $.025 and distributions from net realized gain of $.026 per share.
C Total distributions of $.05 per share is comprised of distributions from net investment income of $.033 and distributions from net realized gain of $.013 per share.
D Amount represents less than $.005 per share.
E Total returns would have been lower if certain expenses had not been reduced during the applicable periods shown.
F Total returns do not include the effect of the contingent deferred sales charge.
G Fees and expenses of any underlying Fidelity Central Funds are not included in the Fund's expense ratio. The Fund indirectly bears its proportionate share of the expenses of any underlying Fidelity Central Funds.
H Expense ratios reflect operating expenses of the class. Expenses before reductions do not reflect amounts reimbursed by the investment adviser or reductions from brokerage service arrangements or reductions from other expense offset arrangements and do not represent the amount paid by the class during periods when reimbursements or reductions occur. Expenses net of fee waivers reflect expenses after reimbursement by the investment adviser but prior to reductions from brokerage service arrangements or other expense offset arrangements. Expenses net of all reductions represent the net expenses paid by the class.
I Amount does not include the portfolio activity of any underlying Fidelity Central Funds.
See accompanying notes which are an integral part of the financial statements.
Fidelity Global Commodity Stock Fund
| Years ended October 31, | 2017 | 2016 | 2015 | 2014 | 2013 |
| Selected Per–Share Data | | | | | |
| Net asset value, beginning of period | $10.77 | $10.09 | $13.31 | $14.24 | $14.66 |
| Income from Investment Operations | | | | | |
| Net investment income (loss)A | .15 | .14 | .25 | .19 | .19 |
| Net realized and unrealized gain (loss) | 1.84 | .79 | (3.27) | (.92) | (.45) |
| Total from investment operations | 1.99 | .93 | (3.02) | (.73) | (.26) |
| Distributions from net investment income | (.11) | (.24) | (.18) | (.19) | (.16) |
| Distributions from net realized gain | (.07) | (.01) | (.03) | (.01) | – |
| Total distributions | (.17)B | (.25) | (.20)C | (.20) | (.16) |
| Redemption fees added to paid in capitalA,D | – | – | – | – | – |
| Net asset value, end of period | $12.59 | $10.77 | $10.09 | $13.31 | $14.24 |
| Total ReturnE | 18.65% | 9.62% | (22.97)% | (5.16)% | (1.75)% |
| Ratios to Average Net AssetsF,G | | | | | |
| Expenses before reductions | 1.10% | 1.13% | 1.12% | 1.11% | 1.11% |
| Expenses net of fee waivers, if any | 1.10% | 1.13% | 1.12% | 1.11% | 1.11% |
| Expenses net of all reductions | 1.09% | 1.12% | 1.11% | 1.11% | 1.09% |
| Net investment income (loss) | 1.30% | 1.43% | 2.08% | 1.29% | 1.37% |
| Supplemental Data | | | | | |
| Net assets, end of period (000 omitted) | $264,557 | $228,982 | $156,320 | $223,084 | $273,476 |
| Portfolio turnover rateH | 81% | 85% | 77% | 75% | 65% |
A Calculated based on average shares outstanding during the period.
B Total distributions of $.17 per share is comprised of distributions from net investment income of $.105 and distributions from net realized gain of $.068 per share.
C Total distributions of $.20 per share is comprised of distributions from net investment income of $.178 and distributions from net realized gain of $.026 per share.
D Amount represents less than $.005 per share.
E Total returns would have been lower if certain expenses had not been reduced during the applicable periods shown.
F Fees and expenses of any underlying Fidelity Central Funds are not included in the Fund's expense ratio. The Fund indirectly bears its proportionate share of the expenses of any underlying Fidelity Central Funds.
G Expense ratios reflect operating expenses of the class. Expenses before reductions do not reflect amounts reimbursed by the investment adviser or reductions from brokerage service arrangements or reductions from other expense offset arrangements and do not represent the amount paid by the class during periods when reimbursements or reductions occur. Expenses net of fee waivers reflect expenses after reimbursement by the investment adviser but prior to reductions from brokerage service arrangements or other expense offset arrangements. Expenses net of all reductions represent the net expenses paid by the class.
H Amount does not include the portfolio activity of any underlying Fidelity Central Funds.
See accompanying notes which are an integral part of the financial statements.
Fidelity Global Commodity Stock Fund Class I
| Years ended October 31, | 2017 | 2016 | 2015 | 2014 | 2013 |
| Selected Per–Share Data | | | | | |
| Net asset value, beginning of period | $10.76 | $10.09 | $13.31 | $14.24 | $14.67 |
| Income from Investment Operations | | | | | |
| Net investment income (loss)A | .17 | .16 | .25 | .19 | .20 |
| Net realized and unrealized gain (loss) | 1.86 | .77 | (3.26) | (.92) | (.45) |
| Total from investment operations | 2.03 | .93 | (3.01) | (.73) | (.25) |
| Distributions from net investment income | (.12) | (.25) | (.19) | (.19) | (.18) |
| Distributions from net realized gain | (.07) | (.01) | (.03) | (.01) | – |
| Total distributions | (.19) | (.26) | (.21)B | (.20) | (.18) |
| Redemption fees added to paid in capitalA,C | – | – | – | – | – |
| Net asset value, end of period | $12.60 | $10.76 | $10.09 | $13.31 | $14.24 |
| Total ReturnD | 18.99% | 9.63% | (22.93)% | (5.16)% | (1.71)% |
| Ratios to Average Net AssetsE,F | | | | | |
| Expenses before reductions | .96% | 1.01% | 1.09% | 1.06% | 1.04% |
| Expenses net of fee waivers, if any | .95% | 1.01% | 1.08% | 1.06% | 1.04% |
| Expenses net of all reductions | .94% | 1.00% | 1.08% | 1.06% | 1.03% |
| Net investment income (loss) | 1.45% | 1.55% | 2.11% | 1.34% | 1.43% |
| Supplemental Data | | | | | |
| Net assets, end of period (000 omitted) | $113,655 | $70,068 | $24,841 | $23,840 | $31,613 |
| Portfolio turnover rateG | 81% | 85% | 77% | 75% | 65% |
A Calculated based on average shares outstanding during the period.
B Total distributions of $.21 per share is comprised of distributions from net investment income of $.186 and distributions from net realized gain of $.026 per share.
C Amount represents less than $.005 per share.
D Total returns would have been lower if certain expenses had not been reduced during the applicable periods shown.
E Fees and expenses of any underlying Fidelity Central Funds are not included in the Fund's expense ratio. The Fund indirectly bears its proportionate share of the expenses of any underlying Fidelity Central Funds.
F Expense ratios reflect operating expenses of the class. Expenses before reductions do not reflect amounts reimbursed by the investment adviser or reductions from brokerage service arrangements or reductions from other expense offset arrangements and do not represent the amount paid by the class during periods when reimbursements or reductions occur. Expenses net of fee waivers reflect expenses after reimbursement by the investment adviser but prior to reductions from brokerage service arrangements or other expense offset arrangements. Expenses net of all reductions represent the net expenses paid by the class.
G Amount does not include the portfolio activity of any underlying Fidelity Central Funds.
See accompanying notes which are an integral part of the financial statements.
Notes to Financial Statements
For the period ended October 31, 2017
1. Organization.
Fidelity Global Commodity Stock Fund (the Fund) is a fund of Fidelity Investment Trust (the Trust) and is authorized to issue an unlimited number of shares. The Trust is registered under the Investment Company Act of 1940, as amended (the 1940 Act), as an open-end management investment company organized as a Massachusetts business trust. The Fund offers Class A, Class M (formerly Class T), Class C, Global Commodity Stock and Class I shares, each of which has equal rights as to assets and voting privileges. Each class has exclusive voting rights with respect to matters that affect that class.
After the close of business on June 24, 2016, all outstanding Class B shares were converted to Class A shares. All prior fiscal period dollar and share amounts for Class B presented in the Notes to Financial Statements are for the period May 1, 2016 through June 24, 2016.
2. Investments in Fidelity Central Funds.
The Fund invests in Fidelity Central Funds, which are open-end investment companies generally available only to other investment companies and accounts managed by the investment adviser and its affiliates. The Fund's Schedule of Investments lists each of the Fidelity Central Funds held as of period end, if any, as an investment of the Fund, but does not include the underlying holdings of each Fidelity Central Fund. As an Investing Fund, the Fund indirectly bears its proportionate share of the expenses of the underlying Fidelity Central Funds.
The Money Market Central Funds seek preservation of capital and current income and are managed by Fidelity Investments Money Management, Inc. (FIMM), an affiliate of the investment adviser. Annualized expenses of the Money Market Central Funds as of their most recent shareholder report date are less than .005%.
A complete unaudited list of holdings for each Fidelity Central Fund is available upon request or at the Securities and Exchange Commission (the SEC) website at www.sec.gov. In addition, the financial statements of the Fidelity Central Funds, which are not covered by the Fund's Report of Independent Registered Public Accounting Firm, are available on the SEC website or upon request.
3. Significant Accounting Policies.
The Fund is an investment company and applies the accounting and reporting guidance of the Financial Accounting Standards Board (FASB) Accounting Standards Codification Topic 946 Financial Services – Investments Companies. The financial statements have been prepared in conformity with accounting principles generally accepted in the United States of America (GAAP), which require management to make certain estimates and assumptions at the date of the financial statements. Actual results could differ from those estimates. Subsequent events, if any, through the date that the financial statements were issued have been evaluated in the preparation of the financial statements. The following summarizes the significant accounting policies of the Fund:
Investment Valuation. Investments are valued as of 4:00 p.m. Eastern time on the last calendar day of the period. The Board of Trustees (the Board) has delegated the day to day responsibility for the valuation of the Fund's investments to the Fair Value Committee (the Committee) established by the Fund's investment adviser. In accordance with valuation policies and procedures approved by the Board, the Fund attempts to obtain prices from one or more third party pricing vendors or brokers to value its investments. When current market prices, quotations or currency exchange rates are not readily available or reliable, investments will be fair valued in good faith by the Committee, in accordance with procedures adopted by the Board. Factors used in determining fair value vary by investment type and may include market or investment specific events. The frequency with which these procedures are used cannot be predicted and they may be utilized to a significant extent. The Committee oversees the Fund's valuation policies and procedures and reports to the Board on the Committee's activities and fair value determinations. The Board monitors the appropriateness of the procedures used in valuing the Fund's investments and ratifies the fair value determinations of the Committee.
The Fund categorizes the inputs to valuation techniques used to value its investments into a disclosure hierarchy consisting of three levels as shown below:
- Level 1 – quoted prices in active markets for identical investments
- Level 2 – other significant observable inputs (including quoted prices for similar investments, interest rates, prepayment speeds, etc.)
- Level 3 – unobservable inputs (including the Fund's own assumptions based on the best information available)
Valuation techniques used to value the Fund's investments by major category are as follows:
Equity securities, including restricted securities, for which market quotations are readily available, are valued at the last reported sale price or official closing price as reported by a third party pricing vendor on the primary market or exchange on which they are traded and are categorized as Level 1 in the hierarchy. In the event there were no sales during the day or closing prices are not available, securities are valued at the last quoted bid price or may be valued using the last available price and are generally categorized as Level 2 in the hierarchy. For foreign equity securities, when market or security specific events arise, comparisons to the valuation of American Depositary Receipts (ADRs), futures contracts, Exchange-Traded Funds (ETFs) and certain indexes as well as quoted prices for similar securities may be used and would be categorized as Level 2 in the hierarchy. Utilizing these techniques may result in transfers between Level 1 and Level 2. For equity securities, including restricted securities, where observable inputs are limited, assumptions about market activity and risk are used and these securities may be categorized as Level 3 in the hierarchy.
Investments in open-end mutual funds, including the Fidelity Central Funds, are valued at their closing net asset value (NAV) each business day and are categorized as Level 1 in the hierarchy.
Changes in valuation techniques may result in transfers in or out of an assigned level within the disclosure hierarchy. The aggregate value of investments by input level as of October 31, 2017, is included at the end of the Fund's Schedule of Investments.
Foreign Currency. The Fund may use foreign currency contracts to facilitate transactions in foreign-denominated securities. Gains and losses from these transactions may arise from changes in the value of the foreign currency or if the counterparties do not perform under the contracts' terms.
Foreign-denominated assets, including investment securities, and liabilities are translated into U.S. dollars at the exchange rates at period end. Purchases and sales of investment securities, income and dividends received and expenses denominated in foreign currencies are translated into U.S. dollars at the exchange rate in effect on the transaction date.
The effects of exchange rate fluctuations on investments are included with the net realized and unrealized gain (loss) on investment securities. Other foreign currency transactions resulting in realized and unrealized gain (loss) are disclosed separately.
Investment Transactions and Income. For financial reporting purposes, the Fund's investment holdings and NAV include trades executed through the end of the last business day of the period. The NAV per share for processing shareholder transactions is calculated as of the close of business of the New York Stock Exchange (NYSE), normally 4:00 p.m. Eastern time and includes trades executed through the end of the prior business day. Gains and losses on securities sold are determined on the basis of identified cost and includes proceeds received from litigation. Dividend income is recorded on the ex-dividend date, except for certain dividends from foreign securities where the ex-dividend date may have passed, which are recorded as soon as the Fund is informed of the ex-dividend date. Non-cash dividends included in dividend income, if any, are recorded at the fair market value of the securities received. Income and capital gain distributions from Fidelity Central Funds, if any, are recorded on the ex-dividend date. Certain distributions received by the Fund represent a return of capital or capital gain. The Fund determines the components of these distributions subsequent to the ex-dividend date, based upon receipt of tax filings or other correspondence relating to the underlying investment. These distributions are recorded as a reduction of cost of investments and/or as a realized gain. Investment income is recorded net of foreign taxes withheld where recovery of such taxes is uncertain.
Class Allocations and Expenses. Investment income, realized and unrealized capital gains and losses, common expenses of the Fund, and certain fund-level expense reductions, if any, are allocated daily on a pro-rata basis to each class based on the relative net assets of each class to the total net assets of the Fund. Each class differs with respect to transfer agent and distribution and service plan fees incurred. Certain expense reductions may also differ by class. For the reporting period, the allocated portion of income and expenses to each class as a percent of its average net assets may vary due to the timing of recording these transactions in relation to fluctuating net assets of the classes. Expenses directly attributable to a fund are charged to that fund. Expenses attributable to more than one fund are allocated among the respective funds on the basis of relative net assets or other appropriate methods. Expense estimates are accrued in the period to which they relate and adjustments are made when actual amounts are known.
Income Tax Information and Distributions to Shareholders. Each year, the Fund intends to qualify as a regulated investment company under Subchapter M of the Internal Revenue Code, including distributing substantially all of its taxable income and realized gains. As a result, no provision for U.S. Federal income taxes is required. As of October 31, 2017, the Fund did not have any unrecognized tax benefits in the financial statements; nor is the Fund aware of any tax positions for which it is reasonably possible that the total amounts of unrecognized tax benefits will significantly change in the next twelve months. The Fund files a U.S. federal tax return, in addition to state and local tax returns as required. The Fund's federal income tax returns are subject to examination by the Internal Revenue Service (IRS) for a period of three fiscal years after they are filed. State and local tax returns may be subject to examination for an additional fiscal year depending on the jurisdiction. Foreign taxes are provided for based on the Fund's understanding of the tax rules and rates that exist in the foreign markets in which it invests.
Distributions are declared and recorded on the ex-dividend date. Income dividends and capital gain distributions are declared separately for each class. Income and capital gain distributions are determined in accordance with income tax regulations, which may differ from GAAP. In addition, the Fund claimed a portion of the payment made to redeeming shareholders as a distribution for income tax purposes.
Capital accounts within the financial statements are adjusted for permanent book-tax differences. These adjustments have no impact on net assets or the results of operations. Capital accounts are not adjusted for temporary book-tax differences which will reverse in a subsequent period.
Book-tax differences are primarily due to foreign currency transactions, passive foreign investment companies (PFIC), partnerships, capital loss carryforwards and losses deferred due to wash sales.
As of period end, the cost and unrealized appreciation (depreciation) in securities, and derivatives if applicable, for federal income tax purposes were as follows:
| Gross unrealized appreciation | $28,655,448 |
| Gross unrealized depreciation | (79,047,358) |
| Net unrealized appreciation (depreciation) | $(50,391,910) |
| Tax Cost | $490,271,395 |
The tax-based components of distributable earnings as of period end were as follows:
| Undistributed ordinary income | $6,297,770 |
| Capital loss carryforward | $(58,047,381) |
| Net unrealized appreciation (depreciation) on securities and other investments | $(50,413,674) |
Capital loss carryforwards are only available to offset future capital gains of the Fund to the extent provided by regulations and may be limited. Under the Regulated Investment Company Modernization Act of 2010 (the Act), the Fund is permitted to carry forward capital losses incurred in taxable years beginning after December 22, 2010 for an unlimited period and such capital losses are required to be used prior to any losses that expire. The capital loss carryforward information presented below, including any applicable limitation, is estimated as of fiscal period end and is subject to adjustment.
| Fiscal year of expiration | |
| 2019 | $(6,952,413) |
| No expiration | |
| Long-term | (51,094,968) |
| Total capital loss carryforward | $(58,047,381) |
The tax character of distributions paid was as follows:
| | October 31, 2017 | October 31, 2016 |
| Ordinary Income | $5,873,296 | $ 5,364,951 |
Short-Term Trading (Redemption) Fees. Shares held by investors in the Fund less than 30 days may have been subject to a redemption fee equal to 1.00% of the NAV of shares redeemed. All redemption fees, which reduce the proceeds of the shareholder redemption, are retained by the Fund and accounted for as an addition to paid in capital. In November 2017, the Board of Trustees approved the elimination of these redemption fees effective December 18, 2017.
4. Purchases and Sales of Investments.
Purchases and sales of securities, other than short-term securities, aggregated $339,551,755 and $325,873,886, respectively.
5. Fees and Other Transactions with Affiliates.
Management Fee. Fidelity Management & Research Company (the investment adviser) and its affiliates provide the Fund with investment management related services for which the Fund pays a monthly management fee. The management fee is the sum of an individual fund fee rate that is based on an annual rate of .45% of the Fund's average net assets and an annualized group fee rate that averaged .25% during the period. The group fee rate is based upon the average net assets of all the mutual funds advised by the investment adviser, including any mutual funds previously advised by the investment adviser that are currently advised by Fidelity SelectCo, LLC, an affiliate of the investment adviser. The group fee rate decreases as assets under management increase and increases as assets under management decrease. For the reporting period, the total annual management fee rate was .70% of the Fund's average net assets.
Distribution and Service Plan Fees. In accordance with Rule 12b-1 of the 1940 Act, the Fund has adopted separate Distribution and Service Plans for each class of shares. Certain classes pay Fidelity Distributors Corporation (FDC), an affiliate of the investment adviser, separate Distribution and Service Fees, each of which is based on an annual percentage of each class' average net assets. In addition, FDC may pay financial intermediaries for selling shares of the Fund and providing shareholder support services. For the period, the Distribution and Service Fee rates, total fees and amounts retained by FDC were as follows:
| | Distribution
Fee | Service
Fee | Total Fees | Retained
by FDC |
| Class A | -% | .25% | $81,909 | $1,523 |
| Class M | .25% | .25% | 33,472 | – |
| Class C | .75% | .25% | 140,556 | 26,029 |
| | | | $255,937 | $27,552 |
Sales Load. FDC may receive a front-end sales charge of up to 5.75% for selling Class A shares and 3.50% for selling Class M shares, some of which is paid to financial intermediaries for selling shares of the Fund. Depending on the holding period, FDC may receive contingent deferred sales charges levied on Class A, Class M and Class C redemptions. The deferred sales charges are 1.00% for Class C shares, 1.00% for certain purchases of Class A shares and .25% for certain purchases of Class M shares.
For the period, sales charge amounts retained by FDC were as follows:
| | Retained
by FDC |
| Class A | $21,092 |
| Class M | 2,344 |
| Class C(a) | 2,826 |
| | $26,262 |
(a) When Class C shares are initially sold, FDC pays commissions from its own resources to financial intermediaries through which the sales are made.
Transfer Agent Fees. Fidelity Investments Institutional Operations Company, Inc., (FIIOC), an affiliate of the investment adviser, is the transfer, dividend disbursing and shareholder servicing agent for each class of the Fund. FIIOC receives account fees and asset-based fees that vary according to the account size and type of account of the shareholders of the respective classes of the Fund. FIIOC pays for typesetting, printing and mailing of shareholder reports, except proxy statements.
For the period, transfer agent fees for each class were as follows:
| | Amount | % of
Class-Level Average
Net Assets |
| Class A | $91,463 | .28 |
| Class M | 21,297 | .32 |
| Class C | 37,616 | .27 |
| Global Commodity Stock | 781,528 | .30 |
| Class I | 152,492 | .16 |
| | $1,084,396 | |
Accounting and Security Lending Fees. Fidelity Service Company, Inc. (FSC), an affiliate of the investment adviser, maintains the Fund's accounting records. The accounting fee is based on the level of average net assets for each month. Under a separate contract, FSC administers the security lending program. The security lending fee is based on the number and duration of lending transactions.
Brokerage Commissions. The Fund placed a portion of its portfolio transactions with brokerage firms which are affiliates of the investment adviser. Brokerage commissions are included in net realized gain (loss) and change in net unrealized appreciation (depreciation) in the Statement of Operations. The commissions paid to these affiliated firms were $6,746 for the period.
Interfund Trades. The Fund may purchase from or sell securities to other Fidelity Funds under procedures adopted by the Board. The procedures have been designed to ensure these interfund trades are executed in accordance with Rule 17a-7 of the 1940 Act. Interfund trades are included within the respective purchases and sales amounts shown in the Purchases and Sales of Investments note.
6. Committed Line of Credit.
The Fund participates with other funds managed by the investment adviser or an affiliate in a $4.25 billion credit facility (the "line of credit") to be utilized for temporary or emergency purposes to fund shareholder redemptions or for other short-term liquidity purposes. The Fund has agreed to pay commitment fees on its pro-rata portion of the line of credit, which amounted to $1,299 and is reflected in Miscellaneous expenses on the Statement of Operations. During the period, the Fund did not borrow on this line of credit.
7. Security Lending.
The Fund lends portfolio securities through a lending agent from time to time in order to earn additional income. For equity securities, a lending agent is used and may loan securities to certain qualified borrowers, including Fidelity Capital Markets (FCM), a broker-dealer affiliated with the Fund. On the settlement date of the loan, the Fund receives collateral (in the form of U.S. Treasury obligations, letters of credit and/or cash) against the loaned securities and maintains collateral in an amount not less than 100% of the market value of the loaned securities during the period of the loan. The market value of the loaned securities is determined at the close of business of the Fund and any additional required collateral is delivered to the Fund on the next business day. The Fund or borrower may terminate the loan at any time, and if the borrower defaults on its obligation to return the securities loaned because of insolvency or other reasons, the Fund may apply collateral received from the borrower against the obligation. The Fund may experience delays and costs in recovering the securities loaned. Any cash collateral received is invested in the Fidelity Securities Lending Cash Central Fund. The value of loaned securities and cash collateral at period end are disclosed on the Fund's Statement of Assets and Liabilities. At period end, there were no security loans outstanding with FCM. Security lending income represents the income earned on investing cash collateral, less rebates paid to borrowers, plus any premium payments received for lending certain types of securities. Security lending income is presented in the Statement of Operations as a component of income from Fidelity Central Funds. Total security lending income during the period amounted to $132,727, including $341 from securities loaned to FCM.
8. Expense Reductions.
Commissions paid to certain brokers with whom the investment adviser, or its affiliates, places trades on behalf of the Fund include an amount in addition to trade execution, which may be rebated back to the Fund to offset certain expenses. This amount totaled $39,683 for the period.
In addition, during the period the investment adviser reimbursed and/or waived a portion of fund-level operating expenses in the amount of $3,597.
9. Distributions to Shareholders.
Distributions to shareholders of each class were as follows:
| | Year ended October 31, 2017 | Year ended October 31, 2016 |
| From net investment income | | |
| Class A | $252,767 | $638,599 |
| Class M | 29,683 | 103,956 |
| Class B | – | 8,861 |
| Class C | 14,849 | 133,173 |
| Global Commodity Stock | 2,329,358 | 3,642,366 |
| Class I | 884,379 | 613,921 |
| Total | $3,511,036 | $5,140,876 |
| From net realized gain | | |
| Class A | $220,361 | $30,410 |
| Class M | 39,578 | 6,044 |
| Class B | – | 836 |
| Class C | 84,142 | 11,098 |
| Global Commodity Stock | 1,508,537 | 151,130 |
| Class I | 509,642 | 24,557 |
| Total | $2,362,260 | $224,075 |
10. Share Transactions.
Share transactions for each class were as follows and may contain automatic conversions between classes or exchanges between affiliated funds:
| | Shares | Shares | Dollars | Dollars |
| | Year ended October 31, 2017 | Year ended October 31, 2016 | Year ended October 31, 2017 | Year ended October 31, 2016 |
| Class A | | | | |
| Shares sold | 651,469 | 995,820 | $7,552,817 | $9,707,856 |
| Reinvestment of distributions | 39,394 | 70,559 | 455,002 | 655,495 |
| Shares redeemed | (1,549,520) | (948,589) | (18,059,878) | (9,072,163) |
| Net increase (decrease) | (858,657) | 117,790 | $(10,052,059) | $1,291,188 |
| Class M | | | | |
| Shares sold | 139,490 | 109,904 | $1,612,955 | $1,057,407 |
| Reinvestment of distributions | 5,865 | 11,521 | 67,801 | 107,030 |
| Shares redeemed | (162,841) | (187,357) | (1,893,807) | (1,802,838) |
| Net increase (decrease) | (17,486) | (65,932) | $(213,051) | $(638,401) |
| Class B | | | | |
| Shares sold | – | 2,904 | $– | $29,587 |
| Reinvestment of distributions | – | 982 | – | 9,133 |
| Shares redeemed | – | (90,607) | – | (897,527) |
| Net increase (decrease) | – | (86,721) | $– | $(858,807) |
| Class C | | | | |
| Shares sold | 316,655 | 318,100 | $3,641,065 | $3,098,053 |
| Reinvestment of distributions | 8,150 | 14,787 | 93,566 | 136,635 |
| Shares redeemed | (361,056) | (280,508) | (4,124,666) | (2,667,860) |
| Net increase (decrease) | (36,251) | 52,379 | $(390,035) | $566,828 |
| Global Commodity Stock | | | | |
| Shares sold | 7,707,102 | 11,244,608 | $89,805,053 | $110,744,052 |
| Reinvestment of distributions | 315,142 | 376,092 | 3,643,039 | 3,493,876 |
| Shares redeemed | (8,286,656) | (5,847,902) | (96,347,286) | (57,190,452) |
| Net increase (decrease) | (264,412) | 5,772,798 | $(2,899,194) | $57,047,476 |
| Class I | | | | |
| Shares sold | 4,738,302 | 6,770,473 | $54,914,110 | $66,305,135 |
| Reinvestment of distributions | 58,242 | 60,388 | 672,698 | 560,405 |
| Shares redeemed | (2,283,691) | (2,783,838) | (26,192,412) | (27,173,673) |
| Net increase (decrease) | 2,512,853 | 4,047,023 | $29,394,396 | $39,691,867 |
11. Other.
The Fund's organizational documents provide former and current trustees and officers with a limited indemnification against liabilities arising in connection with the performance of their duties to the Fund. In the normal course of business, the Fund may also enter into contracts that provide general indemnifications. The Fund's maximum exposure under these arrangements is unknown as this would be dependent on future claims that may be made against the Fund. The risk of material loss from such claims is considered remote.
Report of Independent Registered Public Accounting Firm
To the Trustees of Fidelity Investment Trust and Shareholders of Fidelity Global Commodity Stock Fund:
In our opinion, the accompanying statement of assets and liabilities, including the schedule of investments, and the related statements of operations and of changes in net assets and the financial highlights present fairly, in all material respects, the financial position of Fidelity Global Commodity Stock Fund (a fund of Fidelity Investment Trust) (the "Fund") as of October 31, 2017, the results of its operations for the year then ended, the changes in its net assets for each of the two years in the period then ended and the financial highlights for each of the five years in the period then ended, in conformity with accounting principles generally accepted in the United States of America. These financial statements and financial highlights (hereafter referred to as “financial statements”) are the responsibility of the Fund's management. Our responsibility is to express an opinion on these financial statements based on our audits. We conducted our audits of these financial statements in accordance with the standards of the Public Company Accounting Oversight Board (United States). Those standards require that we plan and perform the audit to obtain reasonable assurance about whether the financial statements are free of material misstatement. An audit includes examining, on a test basis, evidence supporting the amounts and disclosures in the financial statements, assessing the accounting principles used and significant estimates made by management, and evaluating the overall financial statement presentation. Our procedures included confirmation of securities owned as of October 31, 2017 by correspondence with the custodian and brokers; when replies were not received from brokers, we performed other auditing procedures. We believe that our audits provide a reasonable basis for our opinion.
PricewaterhouseCoopers LLP
Boston, Massachusetts
December 13, 2017
Trustees and Officers
The Trustees, Members of the Advisory Board (if any), and officers of the trust and fund, as applicable, are listed below. The Board of Trustees governs the fund and is responsible for protecting the interests of shareholders. The Trustees are experienced executives who meet periodically throughout the year to oversee the fund's activities, review contractual arrangements with companies that provide services to the fund, oversee management of the risks associated with such activities and contractual arrangements, and review the fund's performance. Except for Jonathan Chiel, each of the Trustees oversees 190 funds. Mr. Chiel oversees 143 funds.
The Trustees hold office without limit in time except that (a) any Trustee may resign; (b) any Trustee may be removed by written instrument, signed by at least two-thirds of the number of Trustees prior to such removal; (c) any Trustee who requests to be retired or who has become incapacitated by illness or injury may be retired by written instrument signed by a majority of the other Trustees; and (d) any Trustee may be removed at any special meeting of shareholders by a two-thirds vote of the outstanding voting securities of the trust. Each Trustee who is not an interested person (as defined in the 1940 Act) of the trust and the fund is referred to herein as an Independent Trustee. Each Independent Trustee shall retire not later than the last day of the calendar year in which his or her 75th birthday occurs. The Independent Trustees may waive this mandatory retirement age policy with respect to individual Trustees. Officers and Advisory Board Members hold office without limit in time, except that any officer or Advisory Board Member may resign or may be removed by a vote of a majority of the Trustees at any regular meeting or any special meeting of the Trustees. Except as indicated, each individual has held the office shown or other offices in the same company for the past five years.
The fund’s Statement of Additional Information (SAI) includes more information about the Trustees. To request a free copy, call Fidelity at 1-877-208-0098.
Experience, Skills, Attributes, and Qualifications of the Trustees. The Governance and Nominating Committee has adopted a statement of policy that describes the experience, qualifications, attributes, and skills that are necessary and desirable for potential Independent Trustee candidates (Statement of Policy). The Board believes that each Trustee satisfied at the time he or she was initially elected or appointed a Trustee, and continues to satisfy, the standards contemplated by the Statement of Policy. The Governance and Nominating Committee also engages professional search firms to help identify potential Independent Trustee candidates who have the experience, qualifications, attributes, and skills consistent with the Statement of Policy. From time to time, additional criteria based on the composition and skills of the current Independent Trustees, as well as experience or skills that may be appropriate in light of future changes to board composition, business conditions, and regulatory or other developments, have also been considered by the professional search firms and the Governance and Nominating Committee. In addition, the Board takes into account the Trustees' commitment and participation in Board and committee meetings, as well as their leadership of standing and ad hoc committees throughout their tenure.
In determining that a particular Trustee was and continues to be qualified to serve as a Trustee, the Board has considered a variety of criteria, none of which, in isolation, was controlling. The Board believes that, collectively, the Trustees have balanced and diverse experience, qualifications, attributes, and skills, which allow the Board to operate effectively in governing the fund and protecting the interests of shareholders. Information about the specific experience, skills, attributes, and qualifications of each Trustee, which in each case led to the Board's conclusion that the Trustee should serve (or continue to serve) as a trustee of the fund, is provided below.
Board Structure and Oversight Function. James C. Curvey is an interested person and currently serves as Chairman. The Trustees have determined that an interested Chairman is appropriate and benefits shareholders because an interested Chairman has a personal and professional stake in the quality and continuity of services provided to the fund. Independent Trustees exercise their informed business judgment to appoint an individual of their choosing to serve as Chairman, regardless of whether the Trustee happens to be independent or a member of management. The Independent Trustees have determined that they can act independently and effectively without having an Independent Trustee serve as Chairman and that a key structural component for assuring that they are in a position to do so is for the Independent Trustees to constitute a substantial majority for the Board. The Independent Trustees also regularly meet in executive session. Ned C. Lautenbach serves as Chairman of the Independent Trustees and as such (i) acts as a liaison between the Independent Trustees and management with respect to matters important to the Independent Trustees and (ii) with management prepares agendas for Board meetings.
Fidelity® funds are overseen by different Boards of Trustees. The fund's Board oversees Fidelity's high income and certain equity funds, and other Boards oversee Fidelity's investment-grade bond, money market, asset allocation, and sector funds. The asset allocation funds may invest in Fidelity® funds overseen by the fund's Board. The use of separate Boards, each with its own committee structure, allows the Trustees of each group of Fidelity® funds to focus on the unique issues of the funds they oversee, including common research, investment, and operational issues. On occasion, the separate Boards establish joint committees to address issues of overlapping consequences for the Fidelity® funds overseen by each Board.
The Trustees operate using a system of committees to facilitate the timely and efficient consideration of all matters of importance to the Trustees, the fund, and fund shareholders and to facilitate compliance with legal and regulatory requirements and oversight of the fund's activities and associated risks. The Board, acting through its committees, has charged FMR and its affiliates with (i) identifying events or circumstances the occurrence of which could have demonstrably adverse effects on the fund's business and/or reputation; (ii) implementing processes and controls to lessen the possibility that such events or circumstances occur or to mitigate the effects of such events or circumstances if they do occur; and (iii) creating and maintaining a system designed to evaluate continuously business and market conditions in order to facilitate the identification and implementation processes described in (i) and (ii) above. Because the day-to-day operations and activities of the fund are carried out by or through FMR, its affiliates, and other service providers, the fund's exposure to risks is mitigated but not eliminated by the processes overseen by the Trustees. While each of the Board's committees has responsibility for overseeing different aspects of the fund's activities, oversight is exercised primarily through the Operations, Audit, and Compliance Committees. In addition, the Independent Trustees have worked with FMR to enhance the Board's oversight of investment and financial risks, legal and regulatory risks, technology risks, and operational risks, including the development of additional risk reporting to the Board. For example, a working group comprised of Independent Trustees and FMR has worked and continues to work to review the Fidelity® funds' valuation-related activities, reporting and risk management. Appropriate personnel, including but not limited to the fund's Chief Compliance Officer (CCO), FMR's internal auditor, the independent accountants, the fund's Treasurer and portfolio management personnel, make periodic reports to the Board's committees, as appropriate, including an annual review of Fidelity's risk management program for the Fidelity® funds. The responsibilities of each standing committee, including their oversight responsibilities, are described further under "Standing Committees of the Trustees."
Interested Trustees*:
Correspondence intended for a Trustee who is an interested person may be sent to Fidelity Investments, 245 Summer Street, Boston, Massachusetts 02210.
Name, Year of Birth; Principal Occupations and Other Relevant Experience+
Jonathan Chiel (1957)
Year of Election or Appointment: 2016
Trustee
Mr. Chiel also serves as Trustee of other Fidelity® funds. Mr. Chiel is Executive Vice President and General Counsel for FMR LLC (diversified financial services company, 2012-present). Previously, Mr. Chiel served as general counsel (2004-2012) and senior vice president and deputy general counsel (2000-2004) for John Hancock Financial Services; a partner with Choate, Hall & Stewart (1996-2000) (law firm); and an Assistant United States Attorney for the United States Attorney’s Office of the District of Massachusetts (1986-95), including Chief of the Criminal Division (1993-1995). Mr. Chiel is a director on the boards of the Boston Bar Foundation and the Maimonides School.
James C. Curvey (1935)
Year of Election or Appointment: 2007
Trustee
Chairman of the Board of Trustees
Mr. Curvey also serves as Trustee of other Fidelity® funds. Mr. Curvey is a Director of Fidelity Research & Analysis Co. (investment adviser firm, 2009-present), and Vice Chairman (2007-present) and Director of FMR LLC (diversified financial services company). In addition, Mr. Curvey serves as an Overseer for the Boston Symphony Orchestra and a member of the board of Artis-Naples, Naples, Florida, and as a Trustee for Brewster Academy, Wolfeboro, New Hampshire. Previously, Mr. Curvey served as a Director of Fidelity Investments Money Management, Inc. (investment adviser firm, 2009-2014) and a Director of FMR and FMR Co., Inc. (investment adviser firms, 2007-2014).
Charles S. Morrison (1960)
Year of Election or Appointment: 2014
Trustee
Mr. Morrison also serves as Trustee of other funds. He serves as President of Fidelity Management & Research Company (FMR) (investment adviser firm, 2016-present), a Director of Fidelity Investments Money Management, Inc. (FIMM) (investment adviser firm, 2014-present), Director of Fidelity SelectCo, LLC (investment adviser firm, 2014-present), President, Asset Management (2014-present), and is an employee of Fidelity Investments. Previously, Mr. Morrison served as Vice President of Fidelity's Fixed Income and Asset Allocation Funds (2012-2014), President, Fixed Income (2011-2014), Vice President of Fidelity's Money Market Funds (2005-2009), President, Money Market Group Leader of FMR (investment adviser firm, 2009), and Senior Vice President, Money Market Group of FMR (2004-2009). Mr. Morrison also served as Vice President of Fidelity's Bond Funds (2002-2005), certain Balanced Funds (2002-2005), and certain Asset Allocation Funds (2002-2007), and as Senior Vice President (2002-2005) of Fidelity's Bond Division.
* Determined to be an “Interested Trustee” by virtue of, among other things, his or her affiliation with the trust or various entities under common control with FMR.
+ The information includes the Trustee's principal occupation during the last five years and other information relating to the experience, attributes, and skills relevant to the Trustee's qualifications to serve as a Trustee, which led to the conclusion that the Trustee should serve as a Trustee for the fund.
Independent Trustees:
Correspondence intended for an Independent Trustee may be sent to Fidelity Investments, P.O. Box 55235, Boston, Massachusetts 02205-5235.
Name, Year of Birth; Principal Occupations and Other Relevant Experience+
Dennis J. Dirks (1948)
Year of Election or Appointment: 2005
Trustee
Mr. Dirks also serves as Trustee of other Fidelity® funds. Prior to his retirement in May 2003, Mr. Dirks was Chief Operating Officer and a member of the Board of The Depository Trust & Clearing Corporation (DTCC). He also served as President, Chief Operating Officer, and Board member of The Depository Trust Company (DTC) and President and Board member of the National Securities Clearing Corporation (NSCC). In addition, Mr. Dirks served as Chief Executive Officer and Board member of the Government Securities Clearing Corporation, Chief Executive Officer and Board member of the Mortgage-Backed Securities Clearing Corporation, as a Trustee and a member of the Finance Committee of Manhattan College (2005-2008), as a Trustee and a member of the Finance Committee of AHRC of Nassau County (2006-2008), as a member of the Independent Directors Council (IDC) Governing Council (2010-2015), and as a member of the Board of Directors for The Brookville Center for Children’s Services, Inc. (2009-2017). Mr. Dirks is a member of the Finance Committee (2016-present) and Board of Directors (2017-present) of the Asolo Repertory Theatre.
Alan J. Lacy (1953)
Year of Election or Appointment: 2008
Trustee
Mr. Lacy also serves as Trustee of other Fidelity® funds. Mr. Lacy serves as a Director of Bristol-Myers Squibb Company (global pharmaceuticals, 2008-present). He is a Trustee of the California Chapter of The Nature Conservancy (2015-present) and a Director of the Center for Advanced Study in the Behavioral Sciences at Stanford University (2015-present). In addition, Mr. Lacy served as Senior Adviser (2007-2014) of Oak Hill Capital Partners, L.P. (private equity) and also served as Chief Executive Officer (2005) and Vice Chairman (2005-2006) of Sears Holdings Corporation (retail) and Chief Executive Officer and Chairman of the Board of Sears, Roebuck and Co. (retail, 2000-2005). Previously, Mr. Lacy served as Chairman (2014-2017) and a member (2010-2017) of the Board of Directors of Dave & Buster’s Entertainment, Inc. (restaurant and entertainment complexes), as Chairman (2008-2011) and a member (2006-2015) of the Board of Trustees of the National Parks Conservation Association, and as a member of the Board of Directors for The Hillman Companies, Inc. (hardware wholesalers, 2010-2014), Earth Fare, Inc. (retail grocery, 2010-2014), and The Western Union Company (global money transfer, 2006-2011).
Ned C. Lautenbach (1944)
Year of Election or Appointment: 2000
Trustee
Chairman of the Independent Trustees
Mr. Lautenbach also serves as Trustee of other Fidelity® funds. Mr. Lautenbach currently serves as Vice Chair of the Board of Governors, State University System of Florida (2013-present) and is a member of the Council on Foreign Relations (1994-present). He is also a member and has most recently served as Chairman of the Board of Directors of Artis-Naples (2012-present). Previously, Mr. Lautenbach served as a member and then Lead Director of the Board of Directors of Eaton Corporation (diversified industrial, 1997-2016). He was also a Partner and Advisory Partner at Clayton, Dubilier & Rice, LLC (private equity investment, 1998-2010), as well as a Director of Sony Corporation (2006-2007). In addition, Mr. Lautenbach also had a 30-year career with IBM (technology company) during which time he served as Senior Vice President and a member of the Corporate Executive Committee (1968-1998).
Joseph Mauriello (1944)
Year of Election or Appointment: 2008
Trustee
Mr. Mauriello also serves as Trustee of other Fidelity® funds. Prior to his retirement in January 2006, Mr. Mauriello served in numerous senior management positions including Deputy Chairman and Chief Operating Officer (2004-2005), and Vice Chairman of Financial Services (2002-2004) of KPMG LLP US (professional services, 1965-2005). Mr. Mauriello currently serves as a member of the Board of Directors of XL Group plc. (global insurance and re-insurance, 2006-present) and the Independent Directors Council (IDC) Governing Council (2015-present). Previously, Mr. Mauriello served as a Director of the Hamilton Funds of the Bank of New York (2006-2007) and of Arcadia Resources Inc. (health care services and products, 2007-2012).
Cornelia M. Small (1944)
Year of Election or Appointment: 2005
Trustee
Ms. Small also serves as Trustee of other Fidelity® funds. Ms. Small is a member of the Board of Directors (2009-present) and Chair of the Investment Committee (2010-present) of the Teagle Foundation. Ms. Small also serves on the Investment Committee of the Berkshire Taconic Community Foundation (2008-present). Previously, Ms. Small served as Chairperson (2002-2008) and a member of the Investment Committee and Chairperson (2008-2012) and a member of the Board of Trustees of Smith College. In addition, Ms. Small served as Chief Investment Officer, Director of Global Equity Investments, and a member of the Board of Directors of Scudder, Stevens & Clark and Scudder Kemper Investments.
William S. Stavropoulos (1939)
Year of Election or Appointment: 2001
Trustee
Vice Chairman of the Independent Trustees
Mr. Stavropoulos also serves as Trustee of other Fidelity® funds. Mr. Stavropoulos serves as President and Founder of the Michigan Baseball Foundation, the Great Lakes Loons (2007-present). Mr. Stavropoulos is Chairman Emeritus of the Board of Directors of The Dow Chemical Company, where he previously served in numerous senior management positions, including President, CEO (1995-2000; 2002-2004), Chairman of the Executive Committee (2000-2006), and as a member of the Board of Directors (1990-2006). Currently, Mr. Stavropoulos is Chairman of the Board of Directors of Univar Inc. (global distributor of commodity and specialty chemicals), a Director of Teradata Corporation (data warehousing and technology solutions), and a member of the Advisory Board for Metalmark Capital LLC (private equity investment, 2005-present). Mr. Stavropoulos is an operating advisor to Clayton, Dubilier & Rice, LLC (private equity investment). In addition, Mr. Stavropoulos is a member of the University of Notre Dame Advisory Council for the College of Science, a Trustee of the Rollin L. Gerstacker Foundation, and a Director of Artis-Naples in Naples, Florida. Previously, Mr. Stavropoulos served as a Director of Chemical Financial Corporation (bank holding company, 1993-2012) and Tyco International, Ltd. (multinational manufacturing and services, 2007-2012).
David M. Thomas (1949)
Year of Election or Appointment: 2008
Trustee
Mr. Thomas also serves as Trustee of other Fidelity® funds. Mr. Thomas serves as Non-Executive Chairman of the Board of Directors of Fortune Brands Home and Security (home and security products, 2011-present), as a member of the Board of Directors (2004-present) and Presiding Director (2013-present) of Interpublic Group of Companies, Inc. (marketing communication), and as a member of the Board of Trustees of the University of Florida (2013-present). Previously, Mr. Thomas served as Executive Chairman (2005-2006) and Chairman and Chief Executive Officer (2000-2005) of IMS Health, Inc. (pharmaceutical and healthcare information solutions), and a Director of Fortune Brands, Inc. (consumer products, 2000-2011).
+ The information includes the Trustee's principal occupation during the last five years and other information relating to the experience, attributes, and skills relevant to the Trustee's qualifications to serve as a Trustee, which led to the conclusion that the Trustee should serve as a Trustee for the fund.
Advisory Board Members and Officers:
Correspondence intended for an officer or Peter S. Lynch may be sent to Fidelity Investments, 245 Summer Street, Boston, Massachusetts 02210. Officers appear below in alphabetical order.
Name, Year of Birth; Principal Occupation
Peter S. Lynch (1944)
Year of Election or Appointment: 2003
Member of the Advisory Board
Mr. Lynch also serves as Member of the Advisory Board of other Fidelity® funds. Mr. Lynch is Vice Chairman and a Director of FMR (investment adviser firm) and FMR Co., Inc. (investment adviser firm). In addition, Mr. Lynch serves as a Trustee of Boston College and as the Chairman of the Inner-City Scholarship Fund. Previously, Mr. Lynch served on the Special Olympics International Board of Directors (1997-2006).
Elizabeth Paige Baumann (1968)
Year of Election or Appointment: 2017
Anti-Money Laundering (AML) Officer
Ms. Baumann also serves as AML Officer of other funds. She is Chief AML Officer (2012-present) and Senior Vice President (2014-present) of FMR LLC (diversified financial services company) and is an employee of Fidelity Investments. Previously, Ms. Baumann served as AML Officer of the funds (2012-2016), and Vice President (2007-2014) and Deputy Anti-Money Laundering Officer (2007-2012) of FMR LLC.
Marc R. Bryant (1966)
Year of Election or Appointment: 2015
Secretary and Chief Legal Officer (CLO)
Mr. Bryant also serves as Secretary and CLO of other funds. Mr. Bryant serves as CLO, Secretary, and Senior Vice President of Fidelity Management & Research Company (investment adviser firm, 2015-present) and FMR Co., Inc. (investment adviser firm, 2015-present); Secretary of Fidelity SelectCo, LLC (investment adviser firm, 2015-present) and Fidelity Investments Money Management, Inc. (investment adviser firm, 2015-present); and CLO of Fidelity Management & Research (Hong Kong) Limited and FMR Investment Management (UK) Limited (investment adviser firms, 2015-present) and Fidelity Management & Research (Japan) Limited (investment adviser firm, 2016-present). He is Senior Vice President and Deputy General Counsel of FMR LLC (diversified financial services company). Previously, Mr. Bryant served as Secretary and CLO of Fidelity Rutland Square Trust II (2010-2014) and Assistant Secretary of Fidelity's Fixed Income and Asset Allocation Funds (2013-2015). Prior to joining Fidelity Investments, Mr. Bryant served as a Senior Vice President and the Head of Global Retail Legal for AllianceBernstein L.P. (2006-2010), and as the General Counsel for ProFund Advisors LLC (2001-2006).
William C. Coffey (1969)
Year of Election or Appointment: 2009
Assistant Secretary
Mr. Coffey also serves as Assistant Secretary of other funds. He is Senior Vice President and Deputy General Counsel of FMR LLC (diversified financial services company, 2010-present), and is an employee of Fidelity Investments. Previously, Mr. Coffey served as Vice President and Associate General Counsel of FMR LLC (2005-2009).
Jonathan Davis (1968)
Year of Election or Appointment: 2010
Assistant Treasurer
Mr. Davis also serves as Assistant Treasurer of other funds, and is an employee of Fidelity Investments. Previously, Mr. Davis served as Vice President and Associate General Counsel of FMR LLC (diversified financial services company, 2003-2010).
Adrien E. Deberghes (1967)
Year of Election or Appointment: 2016
Assistant Treasurer
Mr. Deberghes also serves as an officer of other funds. He serves as Executive Vice President of Fidelity Investments Money Management, Inc. (FIMM) (investment adviser firm, 2016-present) and is an employee of Fidelity Investments (2008-present). Prior to joining Fidelity Investments, Mr. Deberghes was Senior Vice President of Mutual Fund Administration at State Street Corporation (2007-2008), Senior Director of Mutual Fund Administration at Investors Bank & Trust (2005-2007), and Director of Finance for Dunkin' Brands (2000-2005). Previously, Mr. Deberghes served in other fund officer roles.
Joseph DeSantis (1959)
Year of Election or Appointment: 2017
Vice President
Mr. DeSantis also serves as Vice President of other funds. Mr. DeSantis serves as a Director of Fidelity Management & Research (Japan) Limited (investment adviser firm, 2016-present), Chief Investment Officer, Equities (2010-present) and is an employee of Fidelity Investments.
Stephanie J. Dorsey (1969)
Year of Election or Appointment: 2010
Assistant Treasurer
Ms. Dorsey also serves as an officer of other funds. She is an employee of Fidelity Investments (2008-present) and has served in other fund officer roles. Prior to joining Fidelity Investments, Ms. Dorsey served as Treasurer (2004-2008) of the JPMorgan Mutual Funds and Vice President (2004-2008) of JPMorgan Chase Bank.
Howard J. Galligan III (1966)
Year of Election or Appointment: 2014
Chief Financial Officer
Mr. Galligan also serves as Chief Financial Officer of other funds. Mr. Galligan serves as President of Fidelity Pricing and Cash Management Services (FPCMS) (2014-present) and as a Director of Strategic Advisers, Inc. (investment adviser firm, 2008-present). Previously, Mr. Galligan served as Chief Administrative Officer of Asset Management (2011-2014) and Chief Operating Officer and Senior Vice President of Investment Support for Strategic Advisers, Inc. (2003-2011).
Brian B. Hogan (1964)
Year of Election or Appointment: 2009
Vice President
Mr. Hogan also serves as Trustee or Vice President of other funds. Mr. Hogan serves as a Director of FMR Investment Management (UK) Limited (investment adviser firm, 2015-present) and Fidelity SelectCo, LLC (investment adviser firm, 2014-present) and President of the Equity Division of FMR (investment adviser firm, 2009-present). Previously, Mr. Hogan served as Senior Vice President, Equity Research of FMR (2006-2009) and as a portfolio manager. Mr. Brian B. Hogan is not related to Mr. Colm A. Hogan.
Colm A. Hogan (1973)
Year of Election or Appointment: 2016
Deputy Treasurer
Mr. Hogan also serves as an officer of other funds. Mr. Hogan is an employee of Fidelity Investments (2005-present). Mr. Colm A. Hogan is not related to Mr. Brian B. Hogan.
Chris Maher (1972)
Year of Election or Appointment: 2013
Assistant Treasurer
Mr. Maher serves as Assistant Treasurer of other funds. Mr. Maher is Vice President of Valuation Oversight and is an employee of Fidelity Investments. Previously, Mr. Maher served as Vice President of Asset Management Compliance (2013), Vice President of the Program Management Group of FMR (investment adviser firm, 2010-2013), and Vice President of Valuation Oversight (2008-2010).
Rieco E. Mello (1969)
Year of Election or Appointment: 2017
Assistant Treasurer
Mr. Mello also serves as Assistant Treasurer of other funds. Mr. Mello is an employee of Fidelity Investments (1995-present).
Kenneth B. Robins (1969)
Year of Election or Appointment: 2016
Chief Compliance Officer
Mr. Robins also serves as an officer of other funds. Mr. Robins serves as Compliance Officer of Fidelity Management & Research Company and FMR Co., Inc. (investment adviser firms, 2016-present) and is an employee of Fidelity Investments (2004-present). Previously, Mr. Robins served as Executive Vice President of Fidelity Investments Money Management, Inc. (investment adviser firm, 2013-2016) and served in other fund officer roles.
Stacie M. Smith (1974)
Year of Election or Appointment: 2016
President and Treasurer
Ms. Smith also serves as an officer of other funds. She is an employee of Fidelity Investments (2009-present) and has served in other fund officer roles. Prior to joining Fidelity Investments, Ms. Smith served as Senior Audit Manager of Ernst & Young LLP (accounting firm, 1996-2009). Previously, Ms. Smith served as Deputy Treasurer of certain Fidelity® funds (2013-2016).
Marc L. Spector (1972)
Year of Election or Appointment: 2016
Assistant Treasurer
Mr. Spector also serves as an officer of other funds. Mr. Spector is an employee of Fidelity Investments (2016-present). Prior to joining Fidelity Investments, Mr. Spector served as Director at the Siegfried Group (accounting firm, 2013-2016), and prior to Siegfried Group as audit senior manager at Deloitte & Touche (accounting firm, 2005-2013).
Renee Stagnone (1975)
Year of Election or Appointment: 2016
Assistant Treasurer
Ms. Stagnone also serves as an officer of other funds. Ms. Stagnone is an employee of Fidelity Investments (1997-present). Previously, Ms. Stagnone served as Deputy Treasurer of certain Fidelity® funds (2013-2016).
Shareholder Expense Example
As a shareholder of the Fund, you incur two types of costs: (1) transaction costs, including sales charges (loads) on purchase payments or redemption proceeds, redemption fees and (2) ongoing costs, including management fees, distribution and/or service (12b-1) fees and other Fund expenses. This Example is intended to help you understand your ongoing costs (in dollars) of investing in the Fund and to compare these costs with the ongoing costs of investing in other mutual funds.
The Example is based on an investment of $1,000 invested at the beginning of the period and held for the entire period (May 1, 2017 to October 31, 2017).
Actual Expenses
The first line of the accompanying table for each class of the Fund provides information about actual account values and actual expenses. You may use the information in this line, together with the amount you invested, to estimate the expenses that you paid over the period. Simply divide your account value by $1,000.00 (for example, an $8,600 account value divided by $1,000.00 = 8.6), then multiply the result by the number in the first line for a class of the Fund under the heading entitled "Expenses Paid During Period" to estimate the expenses you paid on your account during this period. A small balance maintenance fee of $12.00 that is charged once a year may apply for certain accounts with a value of less than $2,000. This fee is not included in the table below. If it was, the estimate of expenses you paid during the period would be higher, and your ending account value lower, by this amount. In addition, the Fund, as a shareholder in the underlying Fidelity Central Funds, will indirectly bear its pro-rata share of the fees and expenses incurred by the underlying Fidelity Central Funds. These fees and expenses are not included in the Fund's annualized expense ratio used to calculate the expense estimate in the table below.
Hypothetical Example for Comparison Purposes
The second line of the accompanying table for each class of the Fund provides information about hypothetical account values and hypothetical expenses based on a Class' actual expense ratio and an assumed rate of return of 5% per year before expenses, which is not the Class' actual return. The hypothetical account values and expenses may not be used to estimate the actual ending account balance or expenses you paid for the period. You may use this information to compare the ongoing costs of investing in the Fund and other funds. To do so, compare this 5% hypothetical example with the 5% hypothetical examples that appear in the shareholder reports of the other funds. A small balance maintenance fee of $12.00 that is charged once a year may apply for certain accounts with a value of less than $2,000. This fee is not included in the table below. If it was, the estimate of expenses you paid during the period would be higher, and your ending account value lower, by this amount. In addition, the Fund, as a shareholder in the underlying Fidelity Central Funds, will indirectly bear its pro-rata share of the fees and expenses incurred by the underlying Fidelity Central Funds. These fees and expenses are not included in the Fund's annualized expense ratio used to calculate the expense estimate in the table below.
Please note that the expenses shown in the table are meant to highlight your ongoing costs only and do not reflect any transaction costs. Therefore, the second line of the table is useful in comparing ongoing costs only, and will not help you determine the relative total costs of owning different funds. In addition, if these transactional costs were included, your costs would have been higher.
| | Annualized Expense Ratio-A | Beginning
Account Value
May 1, 2017 | Ending
Account Value
October 31, 2017 | Expenses Paid
During Period-B
May 1, 2017
to October 31, 2017 |
| Class A | 1.30% | | | |
| Actual | | $1,000.00 | $1,098.90 | $6.88 |
| Hypothetical-C | | $1,000.00 | $1,018.65 | $6.61 |
| Class M | 1.60% | | | |
| Actual | | $1,000.00 | $1,097.20 | $8.46 |
| Hypothetical-C | | $1,000.00 | $1,017.14 | $8.13 |
| Class C | 2.03% | | | |
| Actual | | $1,000.00 | $1,094.50 | $10.72 |
| Hypothetical-C | | $1,000.00 | $1,014.97 | $10.31 |
| Global Commodity Stock | 1.08% | | | |
| Actual | | $1,000.00 | $1,099.60 | $5.72 |
| Hypothetical-C | | $1,000.00 | $1,019.76 | $5.50 |
| Class I | .93% | | | |
| Actual | | $1,000.00 | $1,101.40 | $4.93 |
| Hypothetical-C | | $1,000.00 | $1,020.52 | $4.74 |
A Annualized expense ratio reflects expenses net of applicable fee waivers.
B Expenses are equal to each Class' annualized expense ratio, multiplied by the average account value over the period, multiplied by 184/365 (to reflect the one-half year period).
C 5% return per year before expenses
Distributions (Unaudited)
The Board of Trustees of Fidelity Global Commodity Stock Fund voted to pay to shareholders of record at the opening of business on record date, the following distributions per share derived from capital gains realized from sales of portfolio securities, and dividends derived from net investment income:
| | Pay Date | Record Date | Dividends | Capital Gains |
| Fidelity Global Commodity Stock Fund | | | | |
| Class A | 12/11/17 | 12/08/17 | $0.086 | $0.047 |
| Class M | 12/11/17 | 12/08/17 | $0.055 | $0.047 |
| Class C | 12/11/17 | 12/08/17 | $0.000 | $0.047 |
| Global Commodity Stock | 12/11/17 | 12/08/17 | $0.131 | $0.047 |
| Class I | 12/11/17 | 12/08/17 | $0.139 | $0.047 |
|
Class A designates 47%, Class M designates 57%, Class C designates 83%, Global Commodity Stock designates 40%, and Class I designates 37% of the dividend distributed during the fiscal year as qualifying for the dividends–received deduction for corporate shareholders.
Class A designates 100%, Class M designates 100%, Class C designates 100%, Global Commodity Stock designates 86%, and Class I designates 80% of the dividend distributed during the fiscal year as amounts which may be taken into account as a dividend for purposes of the maximum rate under section 1(h)(11) of the Internal Revenue Code.
The amounts per share which represent income derived from sources within, and taxes paid to, foreign countries or possessions of the United States are as follows:
| | Pay Date | Income | Taxes |
| Fidelity Global Commodity Stock Fund | | | |
| Class A | 12/12/16 | $0.1077 | $0.0074 |
| Class M | 12/12/16 | $0.0887 | $0.0074 |
| Class C | 12/12/16 | $0.0614 | $0.0074 |
| Global Commodity Stock | 12/12/16 | $0.1267 | $0.0074 |
| Class I | 12/12/16 | $0.1358 | $0.0074 |
|
The fund will notify shareholders in January 2018 of amounts for use in preparing 2017 income tax returns.
Board Approval of Investment Advisory Contracts and Management Fees
Fidelity Global Commodity Stock Fund
Each year, the Board of Trustees, including the Independent Trustees (together, the Board), votes on the renewal of the management contract with Fidelity Management & Research Company (FMR) and the sub-advisory agreements (together, the Advisory Contracts) for the fund. FMR and the sub-advisers are referred to herein as the Investment Advisers. The Board, assisted by the advice of fund counsel and Independent Trustees' counsel, requests and considers a broad range of information relevant to the renewal of the Advisory Contracts throughout the year.
The Board meets regularly and, at each of its meetings, covers an extensive agenda of topics and materials and considers factors that are relevant to its annual consideration of the renewal of the fund's Advisory Contracts, including the services and support provided to the fund and its shareholders. The Board has established various standing committees (Committees), each composed of and chaired by Independent Trustees with varying backgrounds, to which the Board has assigned specific subject matter responsibilities in order to enhance effective decision-making by the Board. The Board, acting directly and through its Committees, requests and receives information concerning the annual consideration of the renewal of the fund's Advisory Contracts. The Board also meets as needed to review matters specifically related to the Board's annual consideration of the renewal of the Advisory Contracts. Members of the Board may also meet with trustees of other Fidelity funds through ad hoc joint committees to discuss certain matters relevant to all of the Fidelity funds.
At its July 2017 meeting, the Board unanimously determined to renew the fund's Advisory Contracts. In reaching its determination, the Board considered all factors it believed relevant, including (i) the nature, extent, and quality of the services to be provided to the fund and its shareholders (including the investment performance of the fund); (ii) the competitiveness of the fund's management fee and total expense ratio relative to peer funds; (iii) the total costs of the services to be provided by and the profits to be realized by Fidelity from its relationships with the fund; and (iv) the extent to which, if any, economies of scale exist and would be realized as the fund grows, and whether any economies of scale are appropriately shared with fund shareholders.
In considering whether to renew the Advisory Contracts for the fund, the Board reached a determination, with the assistance of fund counsel and Independent Trustees' counsel and through the exercise of its business judgment, that the renewal of the Advisory Contracts was in the best interests of the fund and its shareholders and that the compensation payable under the Advisory Contracts was fair and reasonable. The Board's decision to renew the Advisory Contracts was not based on any single factor, but rather was based on a comprehensive consideration of all the information provided to the Board at its meetings throughout the year. The Board, in reaching its determination to renew the Advisory Contracts, was aware that shareholders of the fund have a broad range of investment choices available to them, including a wide choice among funds offered by Fidelity's competitors, and that the fund's shareholders, who have the opportunity to review and weigh the disclosure provided by the fund in its prospectus and other public disclosures, have chosen to invest in this fund, which is part of the Fidelity family of funds.
Amendment to Group Fee Rate. The Board also approved an amendment to the management contract for the fund to add an additional breakpoint to the group fee schedule, effective October 1, 2017. The Board noted that the additional breakpoint would result in lower management fee rates as Fidelity's assets under management increase.
Nature, Extent, and Quality of Services Provided. The Board considered Fidelity's staffing as it relates to the fund, including the backgrounds of investment personnel of Fidelity, and also considered the fund's investment objective, strategies, and related investment philosophy. The Independent Trustees also had discussions with senior management of Fidelity's investment operations and investment groups. The Board considered the structure of the investment personnel compensation program and whether this structure provides appropriate incentives to act in the best interests of the fund. Additionally, the Board considered the portfolio managers' investments, if any, in the funds that they manage.
Resources Dedicated to Investment Management and Support Services. The Board and the Fund Oversight and Research Committees reviewed the general qualifications and capabilities of Fidelity's investment staff, including its size, education, experience, and resources, as well as Fidelity's approach to recruiting, training, managing, and compensating investment personnel. The Board noted that Fidelity has continued to increase the resources devoted to non-U.S. offices, including expansion of Fidelity's global investment organization. The Board also noted that Fidelity's analysts have extensive resources, tools and capabilities that allow them to conduct sophisticated quantitative and fundamental analysis, as well as credit analysis of issuers, counterparties and guarantors. Further, the Board considered that Fidelity's investment professionals have sufficient access to global information and data so as to provide competitive investment results over time, and that those professionals also have access to sophisticated tools that permit them to assess portfolio construction and risk and performance attribution characteristics continuously, as well as to transmit new information and research conclusions rapidly around the world. Additionally, in its deliberations, the Board considered Fidelity's trading, risk management, compliance, and technology and operations capabilities and resources, which are integral parts of the investment management process.
Shareholder and Administrative Services. The Board considered (i) the nature, extent, quality, and cost of advisory, administrative, and shareholder services performed by the Investment Advisers and their affiliates under the Advisory Contracts and under separate agreements covering transfer agency, pricing and bookkeeping, and securities lending services for the fund; (ii) the nature and extent of the supervision of third party service providers, principally custodians, subcustodians, and pricing vendors; and (iii) the resources devoted to, and the record of compliance with, the fund's compliance policies and procedures. The Board also reviewed the allocation of fund brokerage, including allocations to brokers affiliated with the Investment Advisers, the use of brokerage commissions to pay fund expenses, and the use of "soft" commission dollars to pay for research services.
The Board noted that the growth of fund assets over time across the complex allows Fidelity to reinvest in the development of services designed to enhance the value or convenience of the Fidelity funds as investment vehicles. These services include 24-hour access to account information and market information through telephone representatives and over the Internet, investor education materials and asset allocation tools, and the expanded availability of Fidelity Investor Centers.
In 2014, the Board formed an ad hoc Committee on Transfer Agency Fees to review the variety of transfer agency fee structures throughout the industry and Fidelity's competitive positioning with respect to industry participants.
Investment in a Large Fund Family. The Board considered the benefits to shareholders of investing in a Fidelity fund, including the benefits of investing in a fund that is part of a large family of funds offering a variety of investment disciplines and providing a large variety of mutual fund investor services. The Board noted that Fidelity had taken, or had made recommendations that resulted in the Fidelity funds taking, a number of actions over the previous year that benefited particular funds, including: (i) continuing to dedicate additional resources to Fidelity's investment research process, and to the support of the senior management team that oversees asset management; (ii) continuing efforts to enhance Fidelity's global research capabilities; (iii) launching new funds and making other enhancements to meet client needs; (iv) launching new share classes of existing funds; (v) eliminating purchase minimums and broadening eligibility requirements for certain lower-priced share classes; (vi) reducing management fees and total expenses for certain growth equity funds and index funds; (vii) lowering expense caps for certain existing funds and classes to reduce expenses borne by shareholders; (viii) eliminating short-term redemption fees for certain funds; (ix) introducing a new pricing structure for certain funds of funds that is expected to reduce overall expenses paid by shareholders; (x) rationalizing product lines and gaining increased efficiencies through proposals for fund mergers and share class consolidations; (xi) continuing to develop, acquire and implement systems and technology to improve services to the funds and shareholders, strengthen information security, and increase efficiency; and (xii) implementing enhancements to further strengthen Fidelity's product line to increase investors' probability of success in achieving their investment goals, including retirement income goals.
Investment Performance. The Board considered whether the fund has operated in accordance with its investment objective, as well as its record of compliance with its investment restrictions and its performance history.
The Board took into account discussions with representatives of the Investment Advisers about fund investment performance that occur at Board meetings throughout the year. In this regard the Board noted that as part of regularly scheduled fund reviews and other reports to the Board on fund performance, the Board considers annualized return information for the fund for different time periods, measured against a securities market index ("benchmark index") and a peer group of funds with similar objectives ("peer group"), if any. In its evaluation of fund investment performance, the Board gave particular attention to information indicating changes in performance of certain Fidelity funds for specific time periods and discussed with the Investment Advisers the reasons for any overperformance or underperformance.
In addition to reviewing absolute and relative fund performance, the Independent Trustees periodically consider the appropriateness of fund performance metrics in evaluating the results achieved. In general, the Independent Trustees believe that fund performance should be evaluated based on net performance (after fees and expenses) of both the highest performing and lowest performing fund share classes, where applicable, compared to appropriate benchmark indices, over appropriate time periods that may include full market cycles, and compared to peer groups, as applicable, over the same periods, taking into account relevant factors including the following: general market conditions; issuer-specific information; and fund cash flows and other factors.
The Independent Trustees recognize that shareholders evaluate performance on a net basis over their own holding periods, for which one-, three-, and five-year periods are often used as a proxy. For this reason, the performance information reviewed by the Board also included net cumulative calendar year total return information for the fund and an appropriate benchmark index for the most recent one-, three-, and five-year periods, as shown below. A peer group is not shown below because the fund does not generally utilize a peer group for performance comparison purposes.
Fidelity Global Commodity Stock Fund
The Board has discussed the fund's underperformance with FMR, including the fund's investment strategy, the portfolio management team, and broader trends in the market that may have impacted the fund's performance, and has engaged with FMR to consider what steps might be taken to remediate the fund's underperformance.
Based on its review, the Board concluded that the nature, extent, and quality of services provided to the fund under the Advisory Contracts should continue to benefit the shareholders of the fund.
Competitiveness of Management Fee and Total Expense Ratio. The Board considered the fund's management fee and total expense ratio compared to "mapped groups" of competitive funds and classes created for the purpose of facilitating the Trustees' competitive analysis of management fees and total expenses. Fidelity creates "mapped groups" by combining similar Lipper investment objective categories that have comparable investment mandates. Combining Lipper investment objective categories aids the Board's management fee and total expense ratio comparisons by broadening the competitive group used for comparison.
Management Fee. The Board considered two proprietary management fee comparisons for the 12-month periods shown in basis points (BP) in the chart below. The group of Lipper funds used by the Board for management fee comparisons is referred to below as the "Total Mapped Group." The Total Mapped Group comparison focuses on a fund's standing in terms of gross management fees before expense reimbursements or caps relative to the total universe of funds with comparable investment mandates, regardless of whether their management fee structures also are comparable. Funds with comparable investment mandates offer exposure to similar types of securities. Funds with comparable management fee structures have similar management fee contractual arrangements (
e.g., flat rate charged for advisory services, all-inclusive fee rate,
etc.). "TMG %" represents the percentage of funds in the Total Mapped Group that had management fees that were lower than the fund's. For example, a hypothetical TMG % of 20% would mean that 80% of the funds in the Total Mapped Group had higher, and 20% had lower, management fees than the fund. The fund's actual TMG %s and the number of funds in the Total Mapped Group are in the chart below. The "Asset-Size Peer Group" (ASPG) comparison focuses on a fund's standing relative to a subset of non-Fidelity funds within the Total Mapped Group that are similar in size and management fee structure. For example, if a fund is in the first quartile of the ASPG, the fund's management fee ranks in the least expensive or lowest 25% of funds in the ASPG. The ASPG represents at least 15% of the funds in the Total Mapped Group with comparable asset size and management fee structures, subject to a minimum of 50 funds (or all funds in the Total Mapped Group if fewer than 50). Additional information, such as the ASPG quartile in which the fund's management fee rate ranked, is also included in the chart and considered by the Board.
Fidelity Global Commodity Stock Fund
The Board noted that the fund's management fee rate ranked below the median of its Total Mapped Group and below the median of its ASPG for 2016.
The Board noted that, in 2014, the Board and the boards of other Fidelity funds formed the ad hoc Committee on Group Fee to conduct an in-depth review of the "group fee" component of the management fee of funds with such management fee structures. The Committee's focus included the mechanics of the group fee, the competitive landscape of group fee structures, Fidelity funds with no group fee component and investment products not included in group fee assets. The Board also considered that, for funds subject to the group fee, FMR agreed to voluntarily waive fees over a specified period of time in amounts designed to account for assets converted from certain funds to certain collective investment trusts.
The Board also noted that, in 2013, the ad hoc Committee on Management Fees was formed to conduct an in-depth review of the management fee rates of Fidelity's active equity mutual funds. The Committee focused on the following areas: (i) standard fee structures; (ii) research consumption and trading evolution; (iii) management fee competitiveness/profitability by category; and (iv) factors that drive institutional pricing.
Based on its review, the Board concluded that the fund's management fee is fair and reasonable in light of the services that the fund receives and the other factors considered.
Total Expense Ratio. In its review of each class's total expense ratio, the Board considered the fund's management fee rate as well as other fund or class expenses, as applicable, such as transfer agent fees, pricing and bookkeeping fees, fund-paid 12b-1 fees, and custodial, legal, and audit fees. The Board also noted that Fidelity may agree to waive fees and expenses from time to time, and the extent to which, if any, it has done so for the fund. As part of its review, the Board also considered the current and historical total expense ratios of each class of the fund compared to competitive fund median expenses. Each class of the fund is compared to those funds and classes in the Total Mapped Group (used by the Board for management fee comparisons) that have a similar sales load structure.
The Board noted that the total expense ratio of each of Class A and Class I ranked below the competitive median for 2016, the total expense ratio of the retail class ranked equal to the competitive median for 2016, and the total expense ratio of each of Class M (formerly Class T) and Class C ranked above the competitive median for 2016. The Board considered that, in general, various factors can affect total expense ratios. The Board noted that the total expense ratio of Class M was above the competitive median primarily because of higher 12b-1 fees on Class M as compared to most competitor funds. Class M has a higher 12b-1 fee, but a lower front-end sales charge, than traditionally priced front-end sales charge classes. The Board considered that Class M is primarily sold load-waived in the retirement plan market where its 0.50% 12b-1 fee is comparable to competing no-load, higher 12b-1 fee classes designed specifically for retirement plans. The Board noted that the total expense ratio of Class C was above the competitive median primarily because of its 12b-1 fees. The Board noted that the fund offers multiple classes, each of which has a different sales load and 12b-1 fee structure, and that the multiple structures are intended to offer a range of pricing options for the intermediary market. The Board also noted that the total expense ratios of the classes vary primarily by the level of their 12b-1 fees, although differences in transfer agent fees may also cause expenses to vary from class to class.
Fees Charged to Other Fidelity Clients. The Board also considered Fidelity fee structures and other information with respect to clients of Fidelity, such as other funds advised or subadvised by Fidelity, pension plan clients, and other institutional clients with similar mandates. The Board noted that an ad hoc joint committee created by it and the boards of other Fidelity funds periodically (most recently in 2013) reviews and compares Fidelity's institutional investment advisory business with its business of providing services to the Fidelity funds, including the differences in services provided, fees charged, and costs incurred, as well as competition in their respective marketplaces.
Based on its review of total expense ratios and fees charged to other Fidelity clients, the Board concluded that, although some classes were above the median of the universe presented for comparison, the total expense ratio of each class of the fund was reasonable in light of the services that the fund and its shareholders receive and the other factors considered.
Costs of the Services and Profitability. The Board considered the revenues earned and the expenses incurred by Fidelity in conducting the business of developing, marketing, distributing, managing, administering and servicing the fund and servicing the fund's shareholders. The Board also considered the level of Fidelity's profits in respect of all the Fidelity funds.
On an annual basis, Fidelity presents to the Board information about the profitability of its relationships with the fund. Fidelity calculates profitability information for each fund, as well as aggregate profitability information for groups of Fidelity funds and all Fidelity funds, using a series of detailed revenue and cost allocation methodologies which originate with the books and records of Fidelity on which Fidelity's audited financial statements are based. The Audit Committee of the Board reviews any significant changes from the prior year's methodologies.
PricewaterhouseCoopers LLP (PwC), independent registered public accounting firm and auditor to Fidelity and certain Fidelity funds, has been engaged annually by the Board as part of the Board's assessment of Fidelity's profitability analysis. PwC's engagement includes the review and assessment of the methodologies used by Fidelity in determining the revenues and expenses attributable to Fidelity's mutual fund business, and completion of agreed-upon procedures in respect of the mathematical accuracy of the fund profitability information and its conformity to established allocation methodologies. After considering PwC's reports issued under the engagement and information provided by Fidelity, the Board concluded that while other allocation methods may also be reasonable, Fidelity's profitability methodologies are reasonable in all material respects.
The Board also reviewed Fidelity's non-fund businesses and potential fall-out benefits related to the mutual fund business as well as cases where Fidelity's affiliates may benefit from or be related to the fund's business.
The Board considered the costs of the services provided by and the profits realized by Fidelity in connection with the operation of the fund and was satisfied that the profitability was not excessive.
Economies of Scale. The Board considered whether there have been economies of scale in respect of the management of the Fidelity funds, whether the Fidelity funds (including the fund) have appropriately benefited from any such economies of scale, and whether there is potential for realization of any further economies of scale. The Board considered the extent to which the fund will benefit from economies of scale as assets grow through increased services to the fund, through waivers or reimbursements, or through fee or expense ratio reductions. The Board also noted that a committee (the Economies of Scale Committee) created by it and the boards of other Fidelity funds periodically (most recently in 2013) analyzes whether Fidelity attains economies of scale in respect of the management and servicing of the Fidelity funds, whether the Fidelity funds have appropriately benefited from such economies of scale, and whether there is potential for realization of any further economies of scale.
The Board recognized that the fund's management contract incorporates a "group fee" structure, which provides for lower group fee rates as total group assets increase, and for higher group fee rates as total group assets decrease (with "group assets" defined to include fund assets under FMR's management plus the assets of sector funds previously under FMR's management). FMR calculates the group fee rates based on a tiered asset "breakpoint" schedule that varies based on asset class. The Board considered that the group fee is designed to deliver the benefits of economies of scale to fund shareholders when total Fidelity fund assets increase, even if assets of any particular fund are unchanged or have declined, because some portion of Fidelity's costs are attributable to services provided to all Fidelity funds, and all funds benefit if those costs can be allocated among more assets. The Board concluded that, given the group fee structure, fund shareholders will benefit from lower management fees as group assets increase at the fund complex level, regardless of whether Fidelity achieves any such economies of scale.
The Board concluded, taking into account the analysis of the Economies of Scale Committee, that economies of scale, if any, are being appropriately shared between fund shareholders and Fidelity.
Additional Information Requested by the Board. In order to develop fully the factual basis for consideration of the Fidelity funds' advisory contracts, the Board requested and received additional information on certain topics, including: (i) fund performance trends, in particular the underperformance of certain funds, and Fidelity's long-term strategies for certain funds; (ii) Fidelity's fund profitability methodology, profitability trends for certain funds, and the impact of certain factors on fund profitability results, including the impact of market trends on actively managed funds; (iii) the use of performance fees and the calculation of performance adjustments, including the impact of underperformance and fund outflows on performance adjustments; (iv) metrics for evaluating index fund performance; (v) Fidelity's group fee structure, including the group fee breakpoint schedules; (vi) the terms of Fidelity's contractual and voluntary expense cap arrangements with the funds; (vii) the methodology with respect to evaluating competitive fund data and peer group classifications and fee comparisons; (viii) the expense structures for different funds and classes; (ix) Fidelity's arrangements with affiliated sub-advisers on behalf of the funds; (x) information regarding other accounts managed by Fidelity, including institutional accounts and collective investment trusts; (xi) recent changes to the fee structure for certain funds of funds; and (xii) the impact of the Department of Labor's new fiduciary rule on the funds' comparative expense information.
Based on its evaluation of all of the conclusions noted above, and after considering all factors it believed relevant, the Board concluded that the advisory fee structures are fair and reasonable, and that the fund's Advisory Contracts should be renewed.
AGCS-ANN-1217
1.879396.108
Fidelity® International Small Cap Fund
Annual Report October 31, 2017 |
|
Contents
To view a fund's proxy voting guidelines and proxy voting record for the 12-month period ended June 30, visit http://www.fidelity.com/proxyvotingresults or visit the Securities and Exchange Commission's (SEC) web site at http://www.sec.gov.
You may also call 1-800-544-8544 to request a free copy of the proxy voting guidelines.
Standard & Poor's, S&P and S&P 500 are registered service marks of The McGraw-Hill Companies, Inc. and have been licensed for use by Fidelity Distributors Corporation.
Other third-party marks appearing herein are the property of their respective owners.
All other marks appearing herein are registered or unregistered trademarks or service marks of FMR LLC or an affiliated company. © 2017 FMR LLC. All rights reserved.
This report and the financial statements contained herein are submitted for the general information of the shareholders of the Fund. This report is not authorized for distribution to prospective investors in the Fund unless preceded or accompanied by an effective prospectus.
A fund files its complete schedule of portfolio holdings with the SEC for the first and third quarters of each fiscal year on Form N-Q. Forms N-Q are available on the SEC’s web site at http://www.sec.gov. A fund's Forms N-Q may be reviewed and copied at the SEC’s Public Reference Room in Washington, DC. Information regarding the operation of the SEC's Public Reference Room may be obtained by calling 1-800-SEC-0330.
For a complete list of a fund's portfolio holdings, view the most recent holdings listing, semiannual report, or annual report on Fidelity's web site at http://www.fidelity.com, http://www.institutional.fidelity.com, or http://www.401k.com, as applicable.
NOT FDIC INSURED •MAY LOSE VALUE •NO BANK GUARANTEE
Neither the Fund nor Fidelity Distributors Corporation is a bank.
Performance: The Bottom Line
Average annual total return reflects the change in the value of an investment, assuming reinvestment of distributions from dividend income and capital gains (the profits earned upon the sale of securities that have grown in value, if any) and assuming a constant rate of performance each year. The hypothetical investment and the average annual total returns do not reflect the deduction of taxes that a shareholder would pay on fund distributions or the redemption of fund shares. During periods of reimbursement by Fidelity, a fund’s total return will be greater than it would be had the reimbursement not occurred. How a fund did yesterday is no guarantee of how it will do tomorrow.
Average Annual Total Returns
| For the periods ended October 31, 2017 | Past 1 year | Past 5 years | Past 10 years |
| Fidelity® International Small Cap Fund | 26.18% | 14.38% | 5.15% |
$10,000 Over 10 Years
Let's say hypothetically that $10,000 was invested in Fidelity® International Small Cap Fund, a class of the fund, on October 31, 2007.
The chart shows how the value of your investment would have changed, and also shows how the MSCI ACWI (All Country World Index) ex USA Small Cap Index performed over the same period.
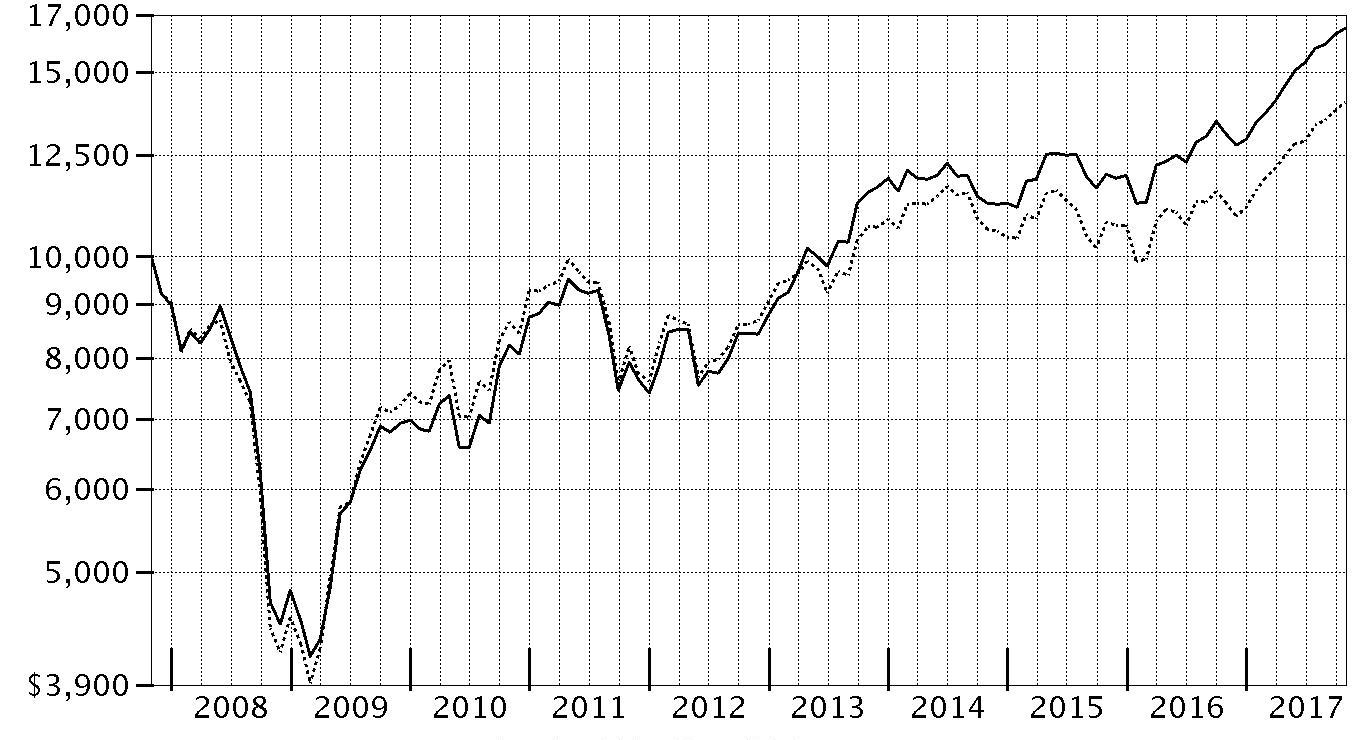
| Period Ending Values |
| $16,524 | Fidelity® International Small Cap Fund |
| $14,044 | MSCI ACWI (All Country World Index) ex USA Small Cap Index |
Management's Discussion of Fund Performance
Market Recap: The MSCI ACWI (All Country World Index) ex USA Index returned 23.85% for the 12 months ending October 31, 2017, helped partly by a generally weak U.S. dollar. Some favorable election results in continental Europe (+30%) suggested ebbing political uncertainty and near-term risk there, but the U.K. (+20%) faced more-mixed conditions ahead of its expected exit from the European Union. Despite central-bank easing – and pressured recently by yen strength – Japan (+18%) lagged the rest of the Asia-Pacific group (+22%). Commodity-price volatility slowed Canada (+17%), but the emerging-markets group (+26%) sped ahead. Sector-wise, information technology (+47%) was driven by a surge among several Chinese internet-related names. Financials (+27%) rode rising interest rates that, at the same time, weighed on real estate (+17%), utilities (+16%), consumer staples (+14%) and telecommunication services (+9%) – so-called “bond proxy” sectors. Materials (+28%) and industrials (+27%) responded to demand from China and price gains for certain commodities. In the energy sector (+20%), oil prices lost ground in the spring before rebounding through October 31 to end well above where they started 12 months ago. Lastly, health care (+14%) was hurt by early-period turmoil around drug pricing and health care legislation.
Comments from Portfolio Manager Samuel Chamovitz: For the year, the fund’s share classes (excluding sales charges, if applicable) posted gains in the range of roughly 25% to 26%, generally topping the 24.85% advance of the benchmark MSCI ACWI (All Country World Index) ex USA Small Cap Index. Stock picks in the industrials and consumer discretionary sectors aided relative performance the most. Overall, active management added value in eight of 11 market sectors this period. Geographically, stock picking in Japan contributed meaningfully. As a group, emerging markets also positively influenced the return. A sizable overweighting in Taiwan-based Yageo, maker of resistors and other so-called passive electrical components, helped the relative return more than any other individual holding. Other contributors included Brazil-based for-profit education provider Estacio Participacoes and Programmed Maintenance Services, an Australia-based company providing facilities maintenance that I sold by period end. Conversely, positioning in information technology and health care detracted, as did a roughly 5% cash position, on average. Among countries, positioning in Germany, the U.K. and Finland worked against us. Petra Diamonds, where we had a large overweighting, was the fund’s biggest relative detractor. The fund's overweighted exposure to U.K.-based real estate brokerage Countrywide and to Oriola, a Finland-based drug distributor, also hurt relative results.
The views expressed above reflect those of the portfolio manager(s) only through the end of the period as stated on the cover of this report and do not necessarily represent the views of Fidelity or any other person in the Fidelity organization. Any such views are subject to change at any time based upon market or other conditions and Fidelity disclaims any responsibility to update such views. These views may not be relied on as investment advice and, because investment decisions for a Fidelity fund are based on numerous factors, may not be relied on as an indication of trading intent on behalf of any Fidelity fund.
Investment Summary (Unaudited)
Geographic Diversification (% of fund's net assets)
| As of October 31, 2017 |
| | Japan | 20.2% |
| | United Kingdom | 15.5% |
| | Canada | 5.3% |
| | United States of America* | 5.1% |
| | Australia | 5.1% |
| | Taiwan | 4.2% |
| | France | 4.0% |
| | Cayman Islands | 3.8% |
| | Netherlands | 3.5% |
| | Other | 33.3% |

* Includes Short-Term investments and Net Other Assets (Liabilities).
Percentages are based on country or territory of incorporation and are adjusted for the effect of futures contracts, if applicable.
| As of April 30, 2017 |
| | Japan | 20.1% |
| | United Kingdom | 15.0% |
| | United States of America* | 5.6% |
| | Canada | 5.0% |
| | Australia | 4.9% |
| | Cayman Islands | 3.7% |
| | France | 3.5% |
| | Austria | 3.3% |
| | Finland | 3.0% |
| | Other | 35.9% |
* Includes Short-Term investments and Net Other Assets (Liabilities).
Percentages are based on country or territory of incorporation and are adjusted for the effect of futures contracts, if applicable.
Asset Allocation as of October 31, 2017
| | % of fund's net assets | % of fund's net assets 6 months ago |
| Stocks | 94.9 | 94.8 |
| Short-Term Investments and Net Other Assets (Liabilities) | 5.1 | 5.2 |
Top Ten Stocks as of October 31, 2017
| | % of fund's net assets | % of fund's net assets 6 months ago |
| Micro Focus International PLC (United Kingdom, Software) | 1.1 | 1.2 |
| John Wood Group PLC (United Kingdom, Energy Equipment & Services) | 1.0 | 0.6 |
| JSR Corp. (Japan, Chemicals) | 1.0 | 0.9 |
| LivaNova PLC (United Kingdom, Health Care Equipment & Supplies) | 0.9 | 0.8 |
| S Foods, Inc. (Japan, Food Products) | 0.9 | 0.9 |
| Iida Group Holdings Co. Ltd. (Japan, Household Durables) | 0.8 | 0.6 |
| McColl's Retail Group PLC (United Kingdom, Food & Staples Retailing) | 0.8 | 0.6 |
| PALTAC Corp. (Japan, Distributors) | 0.8 | 0.5 |
| SITC International Holdings Co. Ltd. (Cayman Islands, Marine) | 0.8 | 0.8 |
| Mears Group PLC (United Kingdom, Commercial Services & Supplies) | 0.8 | 0.7 |
| | 8.9 | |
Top Market Sectors as of October 31, 2017
| | % of fund's net assets | % of fund's net assets 6 months ago |
| Industrials | 19.0 | 18.3 |
| Consumer Discretionary | 17.0 | 17.2 |
| Financials | 12.2 | 12.7 |
| Information Technology | 10.3 | 9.3 |
| Materials | 9.7 | 9.8 |
| Consumer Staples | 8.6 | 8.8 |
| Health Care | 7.9 | 8.6 |
| Real Estate | 6.1 | 6.1 |
| Energy | 3.8 | 3.7 |
| Utilities | 0.3 | 0.3 |
Investments October 31, 2017
Showing Percentage of Net Assets
| Common Stocks - 93.8% | | | |
| | | Shares | Value |
| Australia - 5.1% | | | |
| Aub Group Ltd. | | 681,041 | $6,895,935 |
| Austal Ltd. | | 5,521,804 | 7,459,089 |
| Challenger Ltd. | | 576,380 | 5,867,061 |
| GUD Holdings Ltd. | | 1,220,600 | 11,154,183 |
| Imdex Ltd. (a) | | 15,668,852 | 11,632,391 |
| Life Healthcare Group Ltd. | | 2,219,795 | 4,502,138 |
| Nanosonics Ltd. (a) | | 3,352,347 | 7,697,156 |
| Pact Group Holdings Ltd. | | 2,384,465 | 10,584,712 |
| Reckon Ltd. | | 4,332,829 | 4,128,583 |
| Servcorp Ltd. | | 1,818,739 | 7,753,283 |
| Sigma Healthcare Ltd. | | 13,905,982 | 8,035,422 |
| SomnoMed Ltd. (a)(b) | | 1,267,444 | 3,521,239 |
|
| TOTAL AUSTRALIA | | | 89,231,192 |
|
| Austria - 2.5% | | | |
| Andritz AG | | 179,532 | 10,151,066 |
| BUWOG-Gemeinnuetzige Wohnung | | 422,446 | 12,184,055 |
| IMMOFINANZ Immobilien Anlagen AG | | 4,431,943 | 11,207,893 |
| Wienerberger AG | | 435,600 | 11,193,435 |
|
| TOTAL AUSTRIA | | | 44,736,449 |
|
| Bailiwick of Jersey - 0.4% | | | |
| IWG PLC | | 2,744,800 | 7,852,420 |
| Belgium - 0.5% | | | |
| Barco NV | | 94,183 | 9,644,524 |
| Bermuda - 1.4% | | | |
| BW Offshore Ltd. (a) | | 1,659,938 | 5,446,418 |
| Hiscox Ltd. | | 599,099 | 11,362,501 |
| Petra Diamonds Ltd. (a) | | 8,480,474 | 8,672,773 |
|
| TOTAL BERMUDA | | | 25,481,692 |
|
| Brazil - 0.9% | | | |
| Estacio Participacoes SA | | 1,487,100 | 13,333,122 |
| Sul America SA unit | | 331,900 | 1,819,144 |
|
| TOTAL BRAZIL | | | 15,152,266 |
|
| British Virgin Islands - 0.3% | | | |
| Gem Diamonds Ltd. (a) | | 4,248,962 | 4,514,607 |
| Canada - 5.3% | | | |
| AutoCanada, Inc. (b) | | 552,484 | 9,982,484 |
| Dorel Industries, Inc. Class B (sub. vtg.) | | 353,403 | 9,215,159 |
| Genesis Land Development Corp. | | 2,038,722 | 6,005,072 |
| Lassonde Industries, Inc. Class A (sub. vtg.) | | 55,569 | 10,552,984 |
| McCoy Global, Inc. (a) | | 1,341,170 | 1,881,651 |
| North West Co., Inc. | | 384,500 | 9,382,265 |
| Open Text Corp. | | 284,996 | 9,965,250 |
| Total Energy Services, Inc. | | 524,980 | 6,181,262 |
| TransForce, Inc. | | 364,300 | 8,793,351 |
| Western Forest Products, Inc. | | 5,000,600 | 10,155,470 |
| Whitecap Resources, Inc. | | 1,496,253 | 10,739,712 |
|
| TOTAL CANADA | | | 92,854,660 |
|
| Cayman Islands - 3.8% | | | |
| AMVIG Holdings Ltd. | | 23,634,000 | 6,695,098 |
| Best Pacific International Holdings Ltd. (b) | | 13,900,000 | 8,053,426 |
| China High Precision Automation Group Ltd. (a)(c) | | 712,000 | 1 |
| China Metal Recycling (Holdings) Ltd. (a)(c) | | 436,800 | 1 |
| Haitian International Holdings Ltd. | | 2,192,000 | 6,560,771 |
| Pico Far East Holdings Ltd. | | 20,466,000 | 8,657,138 |
| Precision Tsugami China Corp. Ltd. | | 4,200,000 | 4,360,756 |
| SITC International Holdings Co. Ltd. | | 14,024,000 | 13,518,148 |
| Value Partners Group Ltd. (b) | | 9,903,000 | 9,812,366 |
| Xingda International Holdings Ltd. | | 22,589,629 | 8,628,848 |
|
| TOTAL CAYMAN ISLANDS | | | 66,286,553 |
|
| Chile - 0.7% | | | |
| Quinenco SA | | 2,326,244 | 7,200,775 |
| Vina San Pedro SA | | 394,698,308 | 4,403,108 |
|
| TOTAL CHILE | | | 11,603,883 |
|
| China - 1.1% | | | |
| Qingdao Port International Co. Ltd. | | 15,265,000 | 10,781,417 |
| Weifu High-Technology Co. Ltd. (B Shares) | | 3,747,554 | 8,814,779 |
|
| TOTAL CHINA | | | 19,596,196 |
|
| Denmark - 1.1% | | | |
| Jyske Bank A/S (Reg.) | | 162,703 | 9,194,346 |
| Scandinavian Tobacco Group A/S | | 609,715 | 10,307,865 |
|
| TOTAL DENMARK | | | 19,502,211 |
|
| Finland - 2.7% | | | |
| Amer Group PLC (A Shares) | | 417,245 | 10,386,415 |
| Asiakastieto Group Oyj | | 404,523 | 10,743,556 |
| Cramo Oyj (B Shares) | | 280,810 | 6,234,555 |
| Olvi PLC (A Shares) | | 231,238 | 7,555,480 |
| Oriola-KD Oyj | | 1,925,400 | 7,221,823 |
| Tikkurila Oyj | | 298,465 | 5,899,908 |
|
| TOTAL FINLAND | | | 48,041,737 |
|
| France - 4.0% | | | |
| Altarea SCA | | 48,130 | 10,834,413 |
| Elis SA (b) | | 405,700 | 10,583,421 |
| Maisons du Monde SA | | 176,717 | 7,647,283 |
| Rexel SA | | 547,200 | 9,768,246 |
| The Vicat Group | | 154,056 | 11,917,416 |
| Thermador Groupe SA | | 64,683 | 7,906,055 |
| Wendel SA | | 71,635 | 12,082,696 |
|
| TOTAL FRANCE | | | 70,739,530 |
|
| Germany - 0.4% | | | |
| SHW Group | | 182,639 | 7,245,100 |
| Greece - 0.6% | | | |
| Mytilineos Holdings SA (a) | | 1,028,516 | 10,770,621 |
| Hong Kong - 2.5% | | | |
| Dah Sing Banking Group Ltd. | | 5,004,400 | 11,071,852 |
| Far East Horizon Ltd. | | 7,833,000 | 7,781,392 |
| Magnificent Hotel Investment Ltd. | | 187,662,000 | 5,652,905 |
| Sino Land Ltd. | | 6,190,440 | 10,664,690 |
| Techtronic Industries Co. Ltd. | | 1,423,000 | 8,344,945 |
|
| TOTAL HONG KONG | | | 43,515,784 |
|
| India - 0.7% | | | |
| PC Jeweller Ltd. | | 1,088,000 | 5,894,524 |
| Torrent Pharmaceuticals Ltd. | | 366,773 | 7,192,999 |
|
| TOTAL INDIA | | | 13,087,523 |
|
| Indonesia - 0.6% | | | |
| PT ACE Hardware Indonesia Tbk | | 71,443,900 | 6,611,030 |
| PT Media Nusantara Citra Tbk | | 38,452,100 | 4,422,877 |
|
| TOTAL INDONESIA | | | 11,033,907 |
|
| Ireland - 1.5% | | | |
| Mincon Group PLC | | 6,351,743 | 7,842,758 |
| Origin Enterprises PLC | | 920,300 | 7,289,678 |
| United Drug PLC (United Kingdom) | | 872,449 | 10,712,580 |
|
| TOTAL IRELAND | | | 25,845,016 |
|
| Isle of Man - 0.7% | | | |
| Playtech Ltd. | | 942,487 | 12,317,359 |
| Israel - 0.7% | | | |
| Frutarom Industries Ltd. | | 159,889 | 13,163,456 |
| Italy - 0.9% | | | |
| Banca Generali SpA | | 290,200 | 9,559,756 |
| Banco di Desio e della Brianza SpA | | 2,124,136 | 6,062,035 |
|
| TOTAL ITALY | | | 15,621,791 |
|
| Japan - 20.2% | | | |
| A/S One Corp. | | 154,400 | 8,488,553 |
| Aeon Delight Co. Ltd. | | 289,900 | 10,851,548 |
| Arc Land Sakamoto Co. Ltd. | | 653,200 | 10,676,382 |
| Aucnet, Inc. | | 336,200 | 4,446,060 |
| Broadleaf Co. Ltd. | | 819,600 | 6,729,056 |
| Central Automotive Products Ltd. | | 339,100 | 5,518,006 |
| Daiwa Industries Ltd. | | 488,300 | 5,485,160 |
| Dexerials Corp. | | 882,500 | 9,944,046 |
| Fuji Corp. | | 149,100 | 2,789,944 |
| Funai Soken Holdings, Inc. | | 198,120 | 7,279,200 |
| GMO Internet, Inc. | | 620,600 | 9,587,841 |
| Iida Group Holdings Co. Ltd. | | 758,851 | 14,557,275 |
| Isuzu Motors Ltd. | | 726,400 | 10,609,367 |
| Japan Meat Co. Ltd. | | 452,000 | 7,230,043 |
| JSR Corp. | | 888,700 | 17,227,334 |
| Kirindo Holdings Co. Ltd. (d) | | 627,000 | 8,403,137 |
| Kotobuki Spirits Co. Ltd. (b) | | 137,000 | 5,638,889 |
| Meitec Corp. | | 198,300 | 9,686,447 |
| Minebea Mitsumi, Inc. | | 323,400 | 5,928,930 |
| Mitani Shoji Co. Ltd. | | 257,100 | 10,196,120 |
| Morinaga & Co. Ltd. | | 175,200 | 9,953,075 |
| Nihon Parkerizing Co. Ltd. | | 715,000 | 11,721,175 |
| Nitori Holdings Co. Ltd. | | 37,100 | 5,391,793 |
| Otsuka Corp. | | 119,200 | 8,125,686 |
| PALTAC Corp. | | 347,100 | 13,785,438 |
| Paramount Bed Holdings Co. Ltd. | | 294,700 | 12,996,022 |
| Renesas Electronics Corp. (a) | | 670,300 | 8,666,370 |
| Ricoh Leasing Co. Ltd. | | 186,900 | 6,716,351 |
| S Foods, Inc. | | 396,300 | 15,071,430 |
| San-Ai Oil Co. Ltd. | | 737,100 | 8,803,568 |
| Shinsei Bank Ltd. | | 643,400 | 10,857,870 |
| Ship Healthcare Holdings, Inc. | | 371,900 | 11,630,018 |
| TKC Corp. | | 242,200 | 7,623,425 |
| Toshiba Plant Systems & Services Corp. | | 750,900 | 12,952,567 |
| Tsuruha Holdings, Inc. | | 100,600 | 12,472,654 |
| VT Holdings Co. Ltd. | | 1,252,000 | 6,815,416 |
| Welcia Holdings Co. Ltd. | | 216,300 | 8,209,065 |
| Yamada Consulting Group Co. Ltd. (b) | | 681,580 | 13,167,714 |
|
| TOTAL JAPAN | | | 356,232,975 |
|
| Korea (South) - 1.8% | | | |
| BGFretail Co. Ltd. (c) | | 88,758 | 6,279,242 |
| Hy-Lok Corp. | | 132,477 | 2,926,582 |
| Hyundai Fire & Marine Insurance Co. Ltd. | | 234,807 | 9,523,829 |
| Hyundai Mipo Dockyard Co. Ltd. (a) | | 77,708 | 7,540,822 |
| NS Shopping Co. Ltd. | | 455,325 | 6,128,882 |
|
| TOTAL KOREA (SOUTH) | | | 32,399,357 |
|
| Luxembourg - 0.3% | | | |
| SAF-Holland SA | | 302,900 | 5,999,926 |
| Mexico - 1.0% | | | |
| Credito Real S.A.B. de CV | | 5,034,200 | 8,071,840 |
| Genomma Lab Internacional SA de CV (a) | | 8,144,900 | 9,503,640 |
|
| TOTAL MEXICO | | | 17,575,480 |
|
| Netherlands - 3.5% | | | |
| Amsterdam Commodities NV | | 287,255 | 8,059,057 |
| Arcadis NV | | 324,689 | 7,507,548 |
| Basic-Fit NV (a) | | 379,800 | 8,722,114 |
| BinckBank NV | | 1,088,658 | 5,548,039 |
| IMCD Group BV | | 156,000 | 9,812,696 |
| Philips Lighting NV | | 270,500 | 10,248,365 |
| RHI Magnesita NV | | 268,710 | 11,236,946 |
|
| TOTAL NETHERLANDS | | | 61,134,765 |
|
| New Zealand - 0.9% | | | |
| Air New Zealand Ltd. | | 3,371,740 | 7,614,030 |
| EBOS Group Ltd. | | 740,450 | 8,917,743 |
|
| TOTAL NEW ZEALAND | | | 16,531,773 |
|
| Norway - 0.8% | | | |
| ABG Sundal Collier ASA | | 9,028,610 | 6,256,358 |
| Ekornes A/S | | 533,899 | 7,484,260 |
|
| TOTAL NORWAY | | | 13,740,618 |
|
| Philippines - 0.3% | | | |
| Century Pacific Food, Inc. | | 15,141,700 | 4,461,599 |
| Romania - 0.4% | | | |
| Banca Transilvania SA | | 13,456,284 | 7,490,846 |
| Singapore - 1.6% | | | |
| Boustead Singapore Ltd. | | 7,623,069 | 5,033,205 |
| Hour Glass Ltd. | | 8,112,100 | 4,046,826 |
| Mapletree Industrial (REIT) | | 6,087,794 | 8,664,310 |
| Wing Tai Holdings Ltd. | | 6,441,400 | 11,341,325 |
|
| TOTAL SINGAPORE | | | 29,085,666 |
|
| South Africa - 0.5% | | | |
| Clicks Group Ltd. | | 726,051 | 8,135,674 |
| Spain - 0.6% | | | |
| Hispania Activos Inmobiliarios SA | | 594,185 | 10,247,079 |
| Sweden - 1.4% | | | |
| Addlife AB | | 99,154 | 1,954,264 |
| AddTech AB (B Shares) | | 306,019 | 6,780,805 |
| Coor Service Management Holding AB | | 631,700 | 4,980,165 |
| Granges AB | | 1,037,021 | 10,745,979 |
|
| TOTAL SWEDEN | | | 24,461,213 |
|
| Switzerland - 0.5% | | | |
| Vontobel Holdings AG | | 152,905 | 9,510,104 |
| Taiwan - 4.2% | | | |
| King's Town Bank | | 5,554,000 | 6,072,211 |
| Lumax International Corp. Ltd. | | 4,027,600 | 7,697,583 |
| Makalot Industrial Co. Ltd. | | 2,170,540 | 10,046,796 |
| Micro-Star International Co. Ltd. | | 3,074,000 | 7,496,815 |
| Test Research, Inc. | | 4,131,000 | 5,756,918 |
| Tripod Technology Corp. | | 2,865,000 | 10,551,961 |
| United Microelectronics Corp. | | 17,285,000 | 8,927,242 |
| Yageo Corp. | | 1,517,457 | 12,058,894 |
| Yung Chi Paint & Varnish Manufacturing Co. Ltd. | | 1,872,000 | 4,938,085 |
|
| TOTAL TAIWAN | | | 73,546,505 |
|
| Thailand - 1.6% | | | |
| Delta Electronics PCL (For. Reg.) | | 2,983,800 | 7,724,467 |
| Star Petroleum Refining PCL | | 20,830,300 | 10,910,512 |
| TISCO Financial Group PCL | | 3,363,400 | 8,884,357 |
|
| TOTAL THAILAND | | | 27,519,336 |
|
| Turkey - 0.3% | | | |
| Aygaz A/S | | 1,273,000 | 5,406,026 |
| United Kingdom - 15.5% | | | |
| AEW UK REIT PLC (b) | | 4,299,768 | 5,796,398 |
| Alliance Pharma PLC | | 8,828,765 | 7,006,240 |
| Bond International Software PLC (a)(c) | | 899,666 | 12�� |
| Cineworld Group PLC | | 564,776 | 4,984,463 |
| Close Brothers Group PLC | | 397,980 | 7,341,936 |
| Countrywide PLC (b) | | 5,028,907 | 8,332,231 |
| Diploma PLC | | 362,851 | 5,199,923 |
| Elementis PLC | | 2,605,500 | 9,838,187 |
| Empiric Student Property PLC | | 4,048,310 | 5,228,902 |
| Essentra PLC | | 1,150,455 | 8,128,837 |
| Indivior PLC (a) | | 1,571,500 | 7,755,990 |
| Informa PLC | | 1,270,341 | 11,759,808 |
| ITE Group PLC | | 3,302,019 | 7,795,362 |
| James Fisher and Sons PLC | | 228,000 | 4,711,851 |
| Jardine Lloyd Thompson Group PLC | | 445,940 | 7,717,346 |
| John Wood Group PLC | | 1,887,400 | 17,835,529 |
| LivaNova PLC (a) | | 220,900 | 16,324,510 |
| Luxfer Holdings PLC sponsored ADR | | 970,009 | 12,008,711 |
| McColl's Retail Group PLC | | 3,753,081 | 14,243,650 |
| Mears Group PLC | | 2,236,510 | 13,463,432 |
| Melrose Industries PLC | | 2,680,650 | 7,829,111 |
| Micro Focus International PLC | | 567,640 | 19,940,949 |
| PayPoint PLC | | 455,211 | 5,553,145 |
| Sinclair Pharma PLC (a) | | 16,601,028 | 6,449,232 |
| Spectris PLC | | 251,690 | 8,557,621 |
| Ten Entertainment Group PLC (d) | | 3,545,819 | 10,172,260 |
| The Restaurant Group PLC | | 761,100 | 3,069,967 |
| Topps Tiles PLC | | 5,534,175 | 5,126,775 |
| Tullett Prebon PLC | | 1,677,600 | 12,132,029 |
| Ultra Electronics Holdings PLC | | 399,497 | 9,677,997 |
| Volution Group PLC | | 3,328,300 | 9,327,216 |
|
| TOTAL UNITED KINGDOM | | | 273,309,620 |
|
| TOTAL COMMON STOCKS | | | |
| (Cost $1,353,262,021) | | | 1,654,627,039 |
|
| Nonconvertible Preferred Stocks - 1.1% | | | |
| Brazil - 1.1% | | | |
| Alpargatas SA (PN) | | 1,788,400 | 9,457,806 |
| Banco ABC Brasil SA | | 1,704,022 | 9,350,165 |
| TOTAL NONCONVERTIBLE PREFERRED STOCKS | | | |
| (Cost $12,349,925) | | | 18,807,971 |
|
| Money Market Funds - 4.8% | | | |
| Fidelity Cash Central Fund, 1.10% (e) | | 80,047,770 | 80,063,780 |
| Fidelity Securities Lending Cash Central Fund 1.11% (e)(f) | | 4,733,258 | 4,733,731 |
| TOTAL MONEY MARKET FUNDS | | | |
| (Cost $84,788,724) | | | 84,797,511 |
| TOTAL INVESTMENT IN SECURITIES - 99.7% | | | |
| (Cost $1,450,400,670) | | | 1,758,232,521 |
| NET OTHER ASSETS (LIABILITIES) - 0.3% | | | 5,300,728 |
| NET ASSETS - 100% | | | $1,763,533,249 |
Categorizations in the Schedule of Investments are based on country or territory of incorporation.
Legend
(a) Non-income producing
(b) Security or a portion of the security is on loan at period end.
(c) Level 3 security
(d) Affiliated company
(e) Affiliated fund that is generally available only to investment companies and other accounts managed by Fidelity Investments. The rate quoted is the annualized seven-day yield of the fund at period end. A complete unaudited listing of the fund's holdings as of its most recent quarter end is available upon request. In addition, each Fidelity Central Fund's financial statements, which are not covered by the Fund's Report of Independent Registered Public Accounting Firm, are available on the SEC's website or upon request.
(f) Investment made with cash collateral received from securities on loan.
Affiliated Central Funds
Information regarding fiscal year to date income earned by the Fund from investments in Fidelity Central Funds is as follows:
| Fund | Income earned |
| Fidelity Cash Central Fund | $563,190 |
| Fidelity Securities Lending Cash Central Fund | 246,284 |
| Total | $809,474 |
Other Affiliated Issuers
An affiliated company is a company in which the Fund has ownership of at least 5% of the voting securities. Fiscal year to date transactions with companies which are or were affiliates are as follows:
| Affiliate | Value, beginning of period | Purchases | Sales Proceeds | Dividend Income | Realized Gain (loss) | Change in Unrealized appreciation (depreciation) | Value, end of period |
| Kirindo Holdings Co. Ltd. | $-- | $6,269,413 | $-- | $40,210 | $-- | $2,133,724 | $8,403,137 |
| Ten Entertainment Group PLC | -- | 7,649,521 | -- | -- | -- | 2,522,739 | 10,172,260 |
| Total | $-- | $13,918,934 | $-- | $40,210 | $-- | $4,656,463 | $18,575,397 |
Investment Valuation
The following is a summary of the inputs used, as of October 31, 2017, involving the Fund's assets and liabilities carried at fair value. The inputs or methodology used for valuing securities may not be an indication of the risk associated with investing in those securities. For more information on valuation inputs, and their aggregation into the levels used below, please refer to the Investment Valuation section in the accompanying Notes to Financial Statements.
| | Valuation Inputs at Reporting Date: |
| Description | Total | Level 1 | Level 2 | Level 3 |
| Investments in Securities: | | | | |
| Equities: | | | | |
| Consumer Discretionary | $298,983,084 | $228,839,463 | $70,143,621 | $-- |
| Consumer Staples | 147,341,030 | 74,083,495 | 66,978,293 | 6,279,242 |
| Energy | 66,510,503 | 57,706,935 | 8,803,568 | -- |
| Financials | 217,290,230 | 199,716,009 | 17,574,221 | -- |
| Health Care | 139,909,569 | 106,794,976 | 33,114,593 | -- |
| Industrials | 339,027,662 | 263,479,976 | 75,547,686 | -- |
| Information Technology | 182,441,445 | 118,391,706 | 64,049,726 | 13 |
| Materials | 168,265,810 | 139,317,300 | 28,948,509 | 1 |
| Real Estate | 108,259,651 | 108,259,651 | -- | -- |
| Utilities | 5,406,026 | 5,406,026 | -- | -- |
| Money Market Funds | 84,797,511 | 84,797,511 | -- | -- |
| Total Investments in Securities: | $1,758,232,521 | $1,386,793,048 | $365,160,217 | $6,279,256 |
The following is a summary of transfers between Level 1 and Level 2 for the period ended October 31, 2017. Transfers are assumed to have occurred at the beginning of the period, and are primarily attributable to the valuation techniques used for foreign equity securities, as discussed in the accompanying Notes to Financial Statements:
| Transfers | Total |
| Level 1 to Level 2 | $193,833,983 |
| Level 2 to Level 1 | $0 |
See accompanying notes which are an integral part of the financial statements.
Financial Statements
Statement of Assets and Liabilities
| | | October 31, 2017 |
| Assets | | |
Investment in securities, at value (including securities loaned of $4,377,708) — See accompanying schedule:
Unaffiliated issuers (cost $1,351,693,012) | $1,654,859,613 | |
| Fidelity Central Funds (cost $84,788,724) | 84,797,511 | |
| Other affiliated issuers (cost $13,918,934) | 18,575,397 | |
| Total Investment in Securities (cost $1,450,400,670) | | $1,758,232,521 |
| Foreign currency held at value (cost $1,384,184) | | 1,391,808 |
| Receivable for investments sold | | 9,267,471 |
| Receivable for fund shares sold | | 3,110,146 |
| Dividends receivable | | 4,322,314 |
| Distributions receivable from Fidelity Central Funds | | 87,901 |
| Prepaid expenses | | 3,372 |
| Other receivables | | 38,000 |
| Total assets | | 1,776,453,533 |
| Liabilities | | |
| Payable for investments purchased | $4,767,186 | |
| Payable for fund shares redeemed | 1,450,903 | |
| Accrued management fee | 1,390,011 | |
| Distribution and service plan fees payable | 40,728 | |
| Other affiliated payables | 316,738 | |
| Other payables and accrued expenses | 219,534 | |
| Collateral on securities loaned | 4,735,184 | |
| Total liabilities | | 12,920,284 |
| Net Assets | | $1,763,533,249 |
| Net Assets consist of: | | |
| Paid in capital | | $1,410,903,777 |
| Undistributed net investment income | | 16,549,081 |
| Accumulated undistributed net realized gain (loss) on investments and foreign currency transactions | | 28,338,669 |
| Net unrealized appreciation (depreciation) on investments and assets and liabilities in foreign currencies | | 307,741,722 |
| Net Assets | | $1,763,533,249 |
| Calculation of Maximum Offering Price | | |
| Class A: | | |
| Net Asset Value and redemption price per share ($63,459,255 ÷ 2,170,243 shares) | | $29.24 |
| Maximum offering price per share (100/94.25 of $29.24) | | $31.02 |
| Class M: | | |
| Net Asset Value and redemption price per share ($18,147,582 ÷ 624,377 shares) | | $29.07 |
| Maximum offering price per share (100/96.50 of $29.07) | | $30.12 |
| Class C: | | |
| Net Asset Value and offering price per share ($26,004,972 ÷ 921,858 shares)(a) | | $28.21 |
| International Small Cap: | | |
| Net Asset Value, offering price and redemption price per share ($1,418,451,950 ÷ 47,642,070 shares) | | $29.77 |
| Class I: | | |
| Net Asset Value, offering price and redemption price per share ($237,469,490 ÷ 7,923,881 shares) | | $29.97 |
(a) Redemption price per share is equal to net asset value less any applicable contingent deferred sales charge.
See accompanying notes which are an integral part of the financial statements.
Statement of Operations
| | | Year ended October 31, 2017 |
| Investment Income | | |
| Dividends (including $40,210 earned from other affiliated issuers) | | $38,217,276 |
| Income from Fidelity Central Funds | | 809,474 |
| Income before foreign taxes withheld | | 39,026,750 |
| Less foreign taxes withheld | | (3,654,408) |
| Total income | | 35,372,342 |
| Expenses | | |
| Management fee | | |
| Basic fee | $11,222,416 | |
| Performance adjustment | 1,741,296 | |
| Transfer agent fees | 2,494,393 | |
| Distribution and service plan fees | 355,772 | |
| Accounting and security lending fees | 604,845 | |
| Custodian fees and expenses | 426,022 | |
| Independent trustees' fees and expenses | 4,976 | |
| Registration fees | 148,235 | |
| Audit | 91,755 | |
| Legal | 2,686 | |
| Miscellaneous | 9,362 | |
| Total expenses before reductions | 17,101,758 | |
| Expense reductions | (85,624) | 17,016,134 |
| Net investment income (loss) | | 18,356,208 |
| Realized and Unrealized Gain (Loss) | | |
| Net realized gain (loss) on: | | |
| Investment securities: | | |
| Unaffiliated issuers (net of foreign taxes of $86,242) | 41,116,774 | |
| Fidelity Central Funds | (665) | |
| Foreign currency transactions | 79,704 | |
| Total net realized gain (loss) | | 41,195,813 |
| Change in net unrealized appreciation (depreciation) on: | | |
| Unaffiliated issuers (net of decrease in deferred foreign taxes of $79,683) | 253,968,304 | |
| Fidelity Central Funds | (6,149) | |
| Other affiliated issuers | 4,656,463 | |
| Assets and liabilities in foreign currencies | 39,119 | |
| Total change in net unrealized appreciation (depreciation) | | 258,657,737 |
| Net gain (loss) | | 299,853,550 |
| Net increase (decrease) in net assets resulting from operations | | $318,209,758 |
See accompanying notes which are an integral part of the financial statements.
Statement of Changes in Net Assets
| | Year ended October 31, 2017 | Year ended October 31, 2016 |
| Increase (Decrease) in Net Assets | | |
| Operations | | |
| Net investment income (loss) | $18,356,208 | $15,277,971 |
| Net realized gain (loss) | 41,195,813 | 12,084,769 |
| Change in net unrealized appreciation (depreciation) | 258,657,737 | 49,975,496 |
| Net increase (decrease) in net assets resulting from operations | 318,209,758 | 77,338,236 |
| Distributions to shareholders from net investment income | (14,393,212) | (10,933,091) |
| Distributions to shareholders from net realized gain | (12,478,859) | (23,540,154) |
| Total distributions | (26,872,071) | (34,473,245) |
| Share transactions - net increase (decrease) | 480,792,049 | 74,066,306 |
| Redemption fees | 258,237 | 222,176 |
| Total increase (decrease) in net assets | 772,387,973 | 117,153,473 |
| Net Assets | | |
| Beginning of period | 991,145,276 | 873,991,803 |
| End of period | $1,763,533,249 | $991,145,276 |
| Other Information | | |
| Undistributed net investment income end of period | $16,549,081 | $13,974,440 |
See accompanying notes which are an integral part of the financial statements.
Financial Highlights
Fidelity International Small Cap Fund Class A
| Years ended October 31, | 2017 | 2016 | 2015 | 2014 | 2013 |
| Selected Per–Share Data | | | | | |
| Net asset value, beginning of period | $23.81 | $22.69 | $24.98 | $26.34 | $19.74 |
| Income from Investment Operations | | | | | |
| Net investment income (loss)A | .29 | .34 | .27 | .17 | .06 |
| Net realized and unrealized gain (loss) | 5.70 | 1.64 | 1.05 | (.89) | 6.94 |
| Total from investment operations | 5.99 | 1.98 | 1.32 | (.72) | 7.00 |
| Distributions from net investment income | (.28) | (.25) | (.16) | (.05) | (.07) |
| Distributions from net realized gain | (.29) | (.62) | (3.45) | (.60) | (.33) |
| Total distributions | (.57) | (.87) | (3.61) | (.65) | (.40) |
| Redemption fees added to paid in capitalA | .01 | .01 | –B | .01 | –B |
| Net asset value, end of period | $29.24 | $23.81 | $22.69 | $24.98 | $26.34 |
| Total ReturnC,D | 25.83% | 9.11% | 6.21% | (2.79)% | 36.18% |
| Ratios to Average Net AssetsE,F | | | | | |
| Expenses before reductions | 1.55% | 1.61% | 1.59% | 1.50% | 1.61% |
| Expenses net of fee waivers, if any | 1.55% | 1.61% | 1.58% | 1.50% | 1.61% |
| Expenses net of all reductions | 1.55% | 1.61% | 1.58% | 1.50% | 1.60% |
| Net investment income (loss) | 1.11% | 1.50% | 1.18% | .65% | .25% |
| Supplemental Data | | | | | |
| Net assets, end of period (000 omitted) | $63,459 | $36,480 | $28,238 | $24,572 | $24,020 |
| Portfolio turnover rateG | 22% | 29% | 36% | 102% | 54% |
A Calculated based on average shares outstanding during the period.
B Amount represents less than $.005 per share.
C Total returns would have been lower if certain expenses had not been reduced during the applicable periods shown.
D Total returns do not include the effect of the sales charges.
E Fees and expenses of any underlying Fidelity Central Funds are not included in the Fund's expense ratio. The Fund indirectly bears its proportionate share of the expenses of any underlying Fidelity Central Funds.
F Expense ratios reflect operating expenses of the class. Expenses before reductions do not reflect amounts reimbursed by the investment adviser or reductions from brokerage service arrangements or reductions from other expense offset arrangements and do not represent the amount paid by the class during periods when reimbursements or reductions occur. Expenses net of fee waivers reflect expenses after reimbursement by the investment adviser but prior to reductions from brokerage service arrangements or other expense offset arrangements. Expenses net of all reductions represent the net expenses paid by the class.
G Amount does not include the portfolio activity of any underlying Fidelity Central Funds.
See accompanying notes which are an integral part of the financial statements.
Fidelity International Small Cap Fund Class M
| Years ended October 31, | 2017 | 2016 | 2015 | 2014 | 2013 |
| Selected Per–Share Data | | | | | |
| Net asset value, beginning of period | $23.65 | $22.55 | $24.81 | $26.17 | $19.59 |
| Income from Investment Operations | | | | | |
| Net investment income (loss)A | .21 | .27 | .21 | .10 | –B |
| Net realized and unrealized gain (loss) | 5.69 | 1.63 | 1.04 | (.87) | 6.90 |
| Total from investment operations | 5.90 | 1.90 | 1.25 | (.77) | 6.90 |
| Distributions from net investment income | (.19) | (.19) | (.06) | – | – |
| Distributions from net realized gain | (.29) | (.62) | (3.45) | (.60) | (.32) |
| Total distributions | (.48) | (.81) | (3.51) | (.60) | (.32) |
| Redemption fees added to paid in capitalA | –B | .01 | –B | .01 | –B |
| Net asset value, end of period | $29.07 | $23.65 | $22.55 | $24.81 | $26.17 |
| Total ReturnC,D | 25.47% | 8.79% | 5.90% | (3.00)% | 35.80% |
| Ratios to Average Net AssetsE,F | | | | | |
| Expenses before reductions | 1.84% | 1.90% | 1.87% | 1.77% | 1.87% |
| Expenses net of fee waivers, if any | 1.84% | 1.90% | 1.86% | 1.77% | 1.87% |
| Expenses net of all reductions | 1.84% | 1.90% | 1.86% | 1.76% | 1.85% |
| Net investment income (loss) | .82% | 1.21% | .90% | .38% | (.01)% |
| Supplemental Data | | | | | |
| Net assets, end of period (000 omitted) | $18,148 | $13,331 | $12,400 | $12,296 | $13,530 |
| Portfolio turnover rateG | 22% | 29% | 36% | 102% | 54% |
A Calculated based on average shares outstanding during the period.
B Amount represents less than $.005 per share.
C Total returns would have been lower if certain expenses had not been reduced during the applicable periods shown.
D Total returns do not include the effect of the sales charges.
E Fees and expenses of any underlying Fidelity Central Funds are not included in the Fund's expense ratio. The Fund indirectly bears its proportionate share of the expenses of any underlying Fidelity Central Funds.
F Expense ratios reflect operating expenses of the class. Expenses before reductions do not reflect amounts reimbursed by the investment adviser or reductions from brokerage service arrangements or reductions from other expense offset arrangements and do not represent the amount paid by the class during periods when reimbursements or reductions occur. Expenses net of fee waivers reflect expenses after reimbursement by the investment adviser but prior to reductions from brokerage service arrangements or other expense offset arrangements. Expenses net of all reductions represent the net expenses paid by the class.
G Amount does not include the portfolio activity of any underlying Fidelity Central Funds.
See accompanying notes which are an integral part of the financial statements.
Fidelity International Small Cap Fund Class C
| Years ended October 31, | 2017 | 2016 | 2015 | 2014 | 2013 |
| Selected Per–Share Data | | | | | |
| Net asset value, beginning of period | $22.97 | $21.96 | $24.27 | $25.68 | $19.18 |
| Income from Investment Operations | | | | | |
| Net investment income (loss)A | .08 | .16 | .09 | (.02) | (.11) |
| Net realized and unrealized gain (loss) | 5.53 | 1.59 | 1.02 | (.85) | 6.79 |
| Total from investment operations | 5.61 | 1.75 | 1.11 | (.87) | 6.68 |
| Distributions from net investment income | (.08) | (.13) | – | – | – |
| Distributions from net realized gain | (.29) | (.62) | (3.42) | (.55) | (.18) |
| Total distributions | (.37) | (.75) | (3.42) | (.55) | (.18) |
| Redemption fees added to paid in capitalA | –B | .01 | –B | .01 | –B |
| Net asset value, end of period | $28.21 | $22.97 | $21.96 | $24.27 | $25.68 |
| Total ReturnC,D | 24.85% | 8.26% | 5.37% | (3.43)% | 35.15% |
| Ratios to Average Net AssetsE,F | | | | | |
| Expenses before reductions | 2.33% | 2.40% | 2.36% | 2.23% | 2.33% |
| Expenses net of fee waivers, if any | 2.33% | 2.40% | 2.35% | 2.22% | 2.33% |
| Expenses net of all reductions | 2.32% | 2.39% | 2.35% | 2.22% | 2.32% |
| Net investment income (loss) | .33% | .71% | .41% | (.07)% | (.47)% |
| Supplemental Data | | | | | |
| Net assets, end of period (000 omitted) | $26,005 | $12,187 | $11,359 | $12,576 | $13,426 |
| Portfolio turnover rateG | 22% | 29% | 36% | 102% | 54% |
A Calculated based on average shares outstanding during the period.
B Amount represents less than $.005 per share.
C Total returns would have been lower if certain expenses had not been reduced during the applicable periods shown.
D Total returns do not include the effect of the contingent deferred sales charge.
E Fees and expenses of any underlying Fidelity Central Funds are not included in the Fund's expense ratio. The Fund indirectly bears its proportionate share of the expenses of any underlying Fidelity Central Funds.
F Expense ratios reflect operating expenses of the class. Expenses before reductions do not reflect amounts reimbursed by the investment adviser or reductions from brokerage service arrangements or reductions from other expense offset arrangements and do not represent the amount paid by the class during periods when reimbursements or reductions occur. Expenses net of fee waivers reflect expenses after reimbursement by the investment adviser but prior to reductions from brokerage service arrangements or other expense offset arrangements. Expenses net of all reductions represent the net expenses paid by the class.
G Amount does not include the portfolio activity of any underlying Fidelity Central Funds.
See accompanying notes which are an integral part of the financial statements.
Fidelity International Small Cap Fund
| Years ended October 31, | 2017 | 2016 | 2015 | 2014 | 2013 |
| Selected Per–Share Data | | | | | |
| Net asset value, beginning of period | $24.23 | $23.06 | $25.34 | $26.67 | $19.99 |
| Income from Investment Operations | | | | | |
| Net investment income (loss)A | .37 | .40 | .34 | .25 | .12 |
| Net realized and unrealized gain (loss) | 5.79 | 1.67 | 1.07 | (.90) | 7.02 |
| Total from investment operations | 6.16 | 2.07 | 1.41 | (.65) | 7.14 |
| Distributions from net investment income | (.34) | (.29) | (.24) | (.09) | (.14) |
| Distributions from net realized gain | (.29) | (.62) | (3.45) | (.60) | (.33) |
| Total distributions | (.63) | (.91) | (3.69) | (.69) | (.46)B |
| Redemption fees added to paid in capitalA | .01 | .01 | –C | .01 | –C |
| Net asset value, end of period | $29.77 | $24.23 | $23.06 | $25.34 | $26.67 |
| Total ReturnD | 26.18% | 9.39% | 6.53% | (2.48)% | 36.56% |
| Ratios to Average Net AssetsE,F | | | | | |
| Expenses before reductions | 1.25% | 1.34% | 1.31% | 1.21% | 1.33% |
| Expenses net of fee waivers, if any | 1.25% | 1.34% | 1.31% | 1.20% | 1.32% |
| Expenses net of all reductions | 1.24% | 1.33% | 1.31% | 1.20% | 1.31% |
| Net investment income (loss) | 1.41% | 1.77% | 1.45% | .95% | .53% |
| Supplemental Data | | | | | |
| Net assets, end of period (000 omitted) | $1,418,452 | $906,420 | $811,534 | $842,031 | $1,029,629 |
| Portfolio turnover rateG | 22% | 29% | 36% | 102% | 54% |
A Calculated based on average shares outstanding during the period.
B Total distributions of $.46 per share is comprised of distributions from net investment income of $.136 and distributions from net realized gain of $.327 per share.
C Amount represents less than $.005 per share.
D Total returns would have been lower if certain expenses had not been reduced during the applicable periods shown.
E Fees and expenses of any underlying Fidelity Central Funds are not included in the Fund's expense ratio. The Fund indirectly bears its proportionate share of the expenses of any underlying Fidelity Central Funds.
F Expense ratios reflect operating expenses of the class. Expenses before reductions do not reflect amounts reimbursed by the investment adviser or reductions from brokerage service arrangements or reductions from other expense offset arrangements and do not represent the amount paid by the class during periods when reimbursements or reductions occur. Expenses net of fee waivers reflect expenses after reimbursement by the investment adviser but prior to reductions from brokerage service arrangements or other expense offset arrangements. Expenses net of all reductions represent the net expenses paid by the class.
G Amount does not include the portfolio activity of any underlying Fidelity Central Funds.
See accompanying notes which are an integral part of the financial statements.
Fidelity International Small Cap Fund Class I
| Years ended October 31, | 2017 | 2016 | 2015 | 2014 | 2013 |
| Selected Per–Share Data | | | | | |
| Net asset value, beginning of period | $24.42 | $23.24 | $25.34 | $26.67 | $20.00 |
| Income from Investment Operations | | | | | |
| Net investment income (loss)A | .38 | .41 | .36 | .29 | .16 |
| Net realized and unrealized gain (loss) | 5.82 | 1.69 | 1.07 | (.90) | 7.00 |
| Total from investment operations | 6.20 | 2.10 | 1.43 | (.61) | 7.16 |
| Distributions from net investment income | (.37) | (.31) | (.08) | (.13) | (.16) |
| Distributions from net realized gain | (.29) | (.62) | (3.45) | (.60) | (.33) |
| Total distributions | (.66) | (.93) | (3.53) | (.73) | (.49) |
| Redemption fees added to paid in capitalA | .01 | .01 | –B | .01 | –B |
| Net asset value, end of period | $29.97 | $24.42 | $23.24 | $25.34 | $26.67 |
| Total ReturnC | 26.17% | 9.43% | 6.60% | (2.35)% | 36.68% |
| Ratios to Average Net AssetsD,E | | | | | |
| Expenses before reductions | 1.28% | 1.31% | 1.24% | 1.08% | 1.20% |
| Expenses net of fee waivers, if any | 1.28% | 1.31% | 1.23% | 1.08% | 1.20% |
| Expenses net of all reductions | 1.27% | 1.31% | 1.23% | 1.08% | 1.18% |
| Net investment income (loss) | 1.39% | 1.80% | 1.53% | 1.07% | .66% |
| Supplemental Data | | | | | |
| Net assets, end of period (000 omitted) | $237,469 | $22,727 | $10,070 | $8,092 | $67,038 |
| Portfolio turnover rateF | 22% | 29% | 36% | 102% | 54% |
A Calculated based on average shares outstanding during the period.
B Amount represents less than $.005 per share.
C Total returns would have been lower if certain expenses had not been reduced during the applicable periods shown.
D Fees and expenses of any underlying Fidelity Central Funds are not included in the Fund's expense ratio. The Fund indirectly bears its proportionate share of the expenses of any underlying Fidelity Central Funds.
E Expense ratios reflect operating expenses of the class. Expenses before reductions do not reflect amounts reimbursed by the investment adviser or reductions from brokerage service arrangements or reductions from other expense offset arrangements and do not represent the amount paid by the class during periods when reimbursements or reductions occur. Expenses net of fee waivers reflect expenses after reimbursement by the investment adviser but prior to reductions from brokerage service arrangements or other expense offset arrangements. Expenses net of all reductions represent the net expenses paid by the class.
F Amount does not include the portfolio activity of any underlying Fidelity Central Funds.
See accompanying notes which are an integral part of the financial statements.
Notes to Financial Statements
For the period ended October 31, 2017
1. Organization.
Fidelity International Small Cap Fund (the Fund) is a fund of Fidelity Investment Trust (the Trust) and is authorized to issue an unlimited number of shares. The Trust is registered under the Investment Company Act of 1940, as amended (the 1940 Act), as an open-end management investment company organized as a Massachusetts business trust. The Fund offers Class A, Class M (formerly Class T), Class C, International Small Cap and Class I shares, each of which has equal rights as to assets and voting privileges. Each class has exclusive voting rights with respect to matters that affect that class. The Fund's investments in emerging markets can be subject to social, economic, regulatory, and political uncertainties and can be extremely volatile.
After the close of business on June 24, 2016, all outstanding Class B shares were converted to Class A shares. All prior fiscal period dollar and share amounts for Class B presented in the Notes to Financial Statements are for the period November 1, 2015 through June 24, 2016.
2. Investments in Fidelity Central Funds.
The Fund invests in Fidelity Central Funds, which are open-end investment companies generally available only to other investment companies and accounts managed by the investment adviser and its affiliates. The Fund's Schedule of Investments lists each of the Fidelity Central Funds held as of period end, if any, as an investment of the Fund, but does not include the underlying holdings of each Fidelity Central Fund. As an Investing Fund, the Fund indirectly bears its proportionate share of the expenses of the underlying Fidelity Central Funds.
The Money Market Central Funds seek preservation of capital and current income and are managed by Fidelity Investments Money Management, Inc. (FIMM), an affiliate of the investment adviser. Annualized expenses of the Money Market Central Funds as of their most recent shareholder report date are less than .005%.
A complete unaudited list of holdings for each Fidelity Central Fund is available upon request or at the Securities and Exchange Commission (the SEC) website at www.sec.gov. In addition, the financial statements of the Fidelity Central Funds, which are not covered by the Fund's Report of Independent Registered Public Accounting Firm, are available on the SEC website or upon request.
3. Significant Accounting Policies.
The Fund is an investment company and applies the accounting and reporting guidance of the Financial Accounting Standards Board (FASB) Accounting Standards Codification Topic 946 Financial Services – Investments Companies. The financial statements have been prepared in conformity with accounting principles generally accepted in the United States of America (GAAP), which require management to make certain estimates and assumptions at the date of the financial statements. Actual results could differ from those estimates. Subsequent events, if any, through the date that the financial statements were issued have been evaluated in the preparation of the financial statements. The following summarizes the significant accounting policies of the Fund:
Investment Valuation. Investments are valued as of 4:00 p.m. Eastern time on the last calendar day of the period. The Board of Trustees (the Board) has delegated the day to day responsibility for the valuation of the Fund's investments to the Fair Value Committee (the Committee) established by the Fund's investment adviser. In accordance with valuation policies and procedures approved by the Board, the Fund attempts to obtain prices from one or more third party pricing vendors or brokers to value its investments. When current market prices, quotations or currency exchange rates are not readily available or reliable, investments will be fair valued in good faith by the Committee, in accordance with procedures adopted by the Board. Factors used in determining fair value vary by investment type and may include market or investment specific events. The frequency with which these procedures are used cannot be predicted and they may be utilized to a significant extent. The Committee oversees the Fund's valuation policies and procedures and reports to the Board on the Committee's activities and fair value determinations. The Board monitors the appropriateness of the procedures used in valuing the Fund's investments and ratifies the fair value determinations of the Committee.
The Fund categorizes the inputs to valuation techniques used to value its investments into a disclosure hierarchy consisting of three levels as shown below:
- Level 1 – quoted prices in active markets for identical investments
- Level 2 – other significant observable inputs (including quoted prices for similar investments, interest rates, prepayment speeds, etc.)
- Level 3 – unobservable inputs (including the Fund's own assumptions based on the best information available)
Valuation techniques used to value the Fund's investments by major category are as follows:
Equity securities, including restricted securities, for which market quotations are readily available, are valued at the last reported sale price or official closing price as reported by a third party pricing vendor on the primary market or exchange on which they are traded and are categorized as Level 1 in the hierarchy. In the event there were no sales during the day or closing prices are not available, securities are valued at the last quoted bid price or may be valued using the last available price and are generally categorized as Level 2 in the hierarchy. For foreign equity securities, when market or security specific events arise, comparisons to the valuation of American Depositary Receipts (ADRs), futures contracts, Exchange-Traded Funds (ETFs)and certain indexes as well as quoted prices for similar securities may be used and would be categorized as Level 2 in the hierarchy. Utilizing these techniques may result in transfers between Level 1 and Level 2. For equity securities, including restricted securities, where observable inputs are limited, assumptions about market activity and risk are used and these securities may be categorized as Level 3 in the hierarchy.
Investments in open-end mutual funds, including the Fidelity Central Funds, are valued at their closing net asset value (NAV) each business day and are categorized as Level 1 in the hierarchy.
Changes in valuation techniques may result in transfers in or out of an assigned level within the disclosure hierarchy. The aggregate value of investments by input level as of October 31, 2017, including information on transfers between Levels 1 and 2, is included at the end of the Fund's Schedule of Investments.
Foreign Currency. The Fund may use foreign currency contracts to facilitate transactions in foreign-denominated securities. Gains and losses from these transactions may arise from changes in the value of the foreign currency or if the counterparties do not perform under the contracts' terms.
Foreign-denominated assets, including investment securities, and liabilities are translated into U.S. dollars at the exchange rates at period end. Purchases and sales of investment securities, income and dividends received and expenses denominated in foreign currencies are translated into U.S. dollars at the exchange rate in effect on the transaction date.
The effects of exchange rate fluctuations on investments are included with the net realized and unrealized gain (loss) on investment securities. Other foreign currency transactions resulting in realized and unrealized gain (loss) are disclosed separately.
Investment Transactions and Income. For financial reporting purposes, the Fund's investment holdings and NAV include trades executed through the end of the last business day of the period. The NAV per share for processing shareholder transactions is calculated as of the close of business of the New York Stock Exchange (NYSE), normally 4:00 p.m. Eastern time and includes trades executed through the end of the prior business day. Gains and losses on securities sold are determined on the basis of identified cost and includes proceeds received from litigation. Dividend income is recorded on the ex-dividend date, except for certain dividends from foreign securities where the ex-dividend date may have passed, which are recorded as soon as the Fund is informed of the ex-dividend date. Non-cash dividends included in dividend income, if any, are recorded at the fair market value of the securities received. Income and capital gain distributions from Fidelity Central Funds, if any, are recorded on the ex-dividend date. Certain distributions received by the Fund represent a return of capital or capital gain. The Fund determines the components of these distributions subsequent to the ex-dividend date, based upon receipt of tax filings or other correspondence relating to the underlying investment. These distributions are recorded as a reduction of cost of investments and/or as a realized gain. Investment income is recorded net of foreign taxes withheld where recovery of such taxes is uncertain.
Class Allocations and Expenses. Investment income, realized and unrealized capital gains and losses, common expenses of the Fund, and certain fund-level expense reductions, if any, are allocated daily on a pro-rata basis to each class based on the relative net assets of each class to the total net assets of the Fund. Each class differs with respect to transfer agent and distribution and service plan fees incurred. Certain expense reductions may also differ by class. For the reporting period, the allocated portion of income and expenses to each class as a percent of its average net assets may vary due to the timing of recording these transactions in relation to fluctuating net assets of the classes. Expenses directly attributable to a fund are charged to that fund. Expenses attributable to more than one fund are allocated among the respective funds on the basis of relative net assets or other appropriate methods. Expense estimates are accrued in the period to which they relate and adjustments are made when actual amounts are known.
Income Tax Information and Distributions to Shareholders. Each year, the Fund intends to qualify as a regulated investment company under Subchapter M of the Internal Revenue Code, including distributing substantially all of its taxable income and realized gains. As a result, no provision for U.S. Federal income taxes is required. As of October 31, 2017, the Fund did not have any unrecognized tax benefits in the financial statements; nor is the Fund aware of any tax positions for which it is reasonably possible that the total amounts of unrecognized tax benefits will significantly change in the next twelve months. The Fund files a U.S. federal tax return, in addition to state and local tax returns as required. The Fund's federal income tax returns are subject to examination by the Internal Revenue Service (IRS) for a period of three fiscal years after they are filed. State and local tax returns may be subject to examination for an additional fiscal year depending on the jurisdiction. Foreign taxes are provided for based on the Fund's understanding of the tax rules and rates that exist in the foreign markets in which it invests. The Fund is subject to a tax imposed on capital gains by certain countries in which it invests.
Distributions are declared and recorded on the ex-dividend date. Income dividends and capital gain distributions are declared separately for each class. Income and capital gain distributions are determined in accordance with income tax regulations, which may differ from GAAP. In addition, the Fund claimed a portion of the payment made to redeeming shareholders as a distribution for income tax purposes.
Capital accounts within the financial statements are adjusted for permanent book-tax differences. These adjustments have no impact on net assets or the results of operations. Capital accounts are not adjusted for temporary book-tax differences which will reverse in a subsequent period.
Book-tax differences are primarily due to foreign currency transactions, certain foreign taxes, passive foreign investment companies (PFIC) and losses deferred due to wash sales.
As of period end, the cost and unrealized appreciation (depreciation) in securities, and derivatives if applicable, for federal income tax purposes were as follows:
| Gross unrealized appreciation | $368,862,454 |
| Gross unrealized depreciation | (76,868,724) |
| Net unrealized appreciation (depreciation) | $291,993,730 |
| Tax Cost | $1,466,238,791 |
The tax-based components of distributable earnings as of period end were as follows:
| Undistributed ordinary income | $35,357,334 |
| Undistributed long-term capital gain | $25,367,408 |
| Net unrealized appreciation (depreciation) on securities and other investments | $291,904,730 |
The tax character of distributions paid was as follows:
| | October 31, 2017 | October 31, 2016 |
| Ordinary Income | $16,336,287 | $ 15,375,346 |
| Long-term Capital Gains | 10,535,784 | 19,097,899 |
| Total | $26,872,071 | $ 34,473,245 |
Short-Term Trading (Redemption) Fees. Shares held by investors in the Fund less than 90 days may have been subject to a redemption fee equal to 2.00% of the NAV of shares redeemed. All redemption fees, which reduce the proceeds of the shareholder redemption, are retained by the Fund and accounted for as an addition to paid in capital. In November 2017, the Board of Trustees approved the elimination of these redemption fees effective December 18, 2017.
4. Purchases and Sales of Investments.
Purchases and sales of securities, other than short-term securities, aggregated $716,974,743 and $282,441,072, respectively.
5. Fees and Other Transactions with Affiliates.
Management Fee. Fidelity Management & Research Company (the investment adviser) and its affiliates provide the Fund with investment management related services for which the Fund pays a monthly management fee. The management fee is the sum of an individual fund fee rate that is based on an annual rate of .60% of the Fund's average net assets and an annualized group fee rate that averaged .25% during the period. The group fee rate is based upon the average net assets of all the mutual funds advised by the investment adviser, including any mutual funds previously advised by the investment adviser that are currently advised by Fidelity SelectCo, LLC, an affiliate of the investment adviser. The group fee rate decreases as assets under management increase and increases as assets under management decrease. In addition, the management fee is subject to a performance adjustment (up to a maximum of +/- .20% of the Fund's average net assets over a 36 month performance period). The upward or downward adjustment to the management fee is based on the relative investment performance of International Small Cap as compared to its benchmark index, the MSCI ACWI (All Country World Index) ex USA Small Cap Index effective April 1, 2014 (the MSCI EAFE Small Cap Index prior to April 1, 2014), over the same 36 month performance period. For the reporting period, the total annual management fee rate, including the performance adjustment, was .97% of the Fund's average net assets. The performance adjustment included in the management fee rate may be higher or lower than the maximum performance adjustment rate due to the difference between the average net assets for the reporting and performance periods.
Distribution and Service Plan Fees. In accordance with Rule 12b-1 of the 1940 Act, the Fund has adopted separate Distribution and Service Plans for each class of shares. Certain classes pay Fidelity Distributors Corporation (FDC), an affiliate of the investment adviser, separate Distribution and Service Fees, each of which is based on an annual percentage of each class' average net assets. In addition, FDC may pay financial intermediaries for selling shares of the Fund and providing shareholder support services. For the period, the Distribution and Service Fee rates, total fees and amounts retained by FDC were as follows:
| | Distribution
Fee | Service
Fee | Total Fees | Retained
by FDC |
| Class A | -% | .25% | $113,953 | $– |
| Class M | .25% | .25% | 76,138 | – |
| Class C | .75% | .25% | 165,681 | 50,183 |
| | | | $355,772 | $50,183 |
Sales Load. FDC may receive a front-end sales charge of up to 5.75% for selling Class A shares and 3.50% for selling Class M shares, some of which is paid to financial intermediaries for selling shares of the Fund. Depending on the holding period, FDC may receive contingent deferred sales charges levied on Class A, Class M and Class C redemptions. The deferred sales charges are 1.00% for Class C shares, 1.00% for certain purchases of Class A shares and .25% for certain purchases of Class M shares.
For the period, sales charge amounts retained by FDC were as follows:
| | Retained
by FDC |
| Class A | $48,163 |
| Class M | 3,241 |
| Class C(a) | 3,064 |
| | $54,468 |
(a) When Class C shares are initially sold, FDC pays commissions from its own resources to financial intermediaries through which the sales are made.
Transfer Agent Fees. Fidelity Investments Institutional Operations Company, Inc., (FIIOC), an affiliate of the investment adviser, is the transfer, dividend disbursing and shareholder servicing agent for each class of the Fund. FIIOC receives account fees and asset-based fees that vary according to the account size and type of account of the shareholders of the respective classes of the Fund. FIIOC pays for typesetting, printing and mailing of shareholder reports, except proxy statements.
For the period, transfer agent fees for each class were as follows:
| | Amount | % of
Class-Level Average
Net Assets |
| Class A | $107,596 | .24 |
| Class M | 41,674 | .27 |
| Class C | 44,185 | .27 |
| International Small Cap | 2,096,814 | .18 |
| Class I | 204,124 | .21 |
| | $2,494,393 | |
Accounting and Security Lending Fees. Fidelity Service Company, Inc. (FSC), an affiliate of the investment adviser, maintains the Fund's accounting records. The accounting fee is based on the level of average net assets for each month. Under a separate contract, FSC administers the security lending program. The security lending fee is based on the number and duration of lending transactions.
Brokerage Commissions. The Fund placed a portion of its portfolio transactions with brokerage firms which are affiliates of the investment adviser. Brokerage commissions are included in net realized gain (loss) and change in net unrealized appreciation (depreciation) in the Statement of Operations. The commissions paid to these affiliated firms were $2,875 for the period.
Interfund Trades. The Fund may purchase from or sell securities to other Fidelity Funds under procedures adopted by the Board. The procedures have been designed to ensure these interfund trades are executed in accordance with Rule 17a-7 of the 1940 Act. Interfund trades are included within the respective purchases and sales amounts shown in the Purchases and Sales of Investments note.
6. Committed Line of Credit.
The Fund participates with other funds managed by the investment adviser or an affiliate in a $4.25 billion credit facility (the "line of credit") to be utilized for temporary or emergency purposes to fund shareholder redemptions or for other short-term liquidity purposes. The Fund has agreed to pay commitment fees on its pro-rata portion of the line of credit, which amounted to $3,978 and is reflected in Miscellaneous expenses on the Statement of Operations.
7. Security Lending.
The Fund lends portfolio securities through a lending agent from time to time in order to earn additional income. For equity securities, a lending agent is used and may loan securities to certain qualified borrowers, including Fidelity Capital Markets (FCM), a broker-dealer affiliated with the Fund. On the settlement date of the loan, the Fund receives collateral (in the form of U.S. Treasury obligations, letters of credit and/or cash) against the loaned securities and maintains collateral in an amount not less than 100% of the market value of the loaned securities during the period of the loan. The market value of the loaned securities is determined at the close of business of the Fund and any additional required collateral is delivered to the Fund on the next business day. The Fund or borrower may terminate the loan at any time, and if the borrower defaults on its obligation to return the securities loaned because of insolvency or other reasons, the Fund may apply collateral received from the borrower against the obligation. The Fund may experience delays and costs in recovering the securities loaned. Any cash collateral received is invested in the Fidelity Securities Lending Cash Central Fund. The value of loaned securities and cash collateral at period end are disclosed on the Fund's Statement of Assets and Liabilities. The value of securities loaned to FCM at period end was $2,532. Security lending income represents the income earned on investing cash collateral, less rebates paid to borrowers and any lending agent fees associated with the loan, plus any premium payments received for lending certain types of securities. Security lending income is presented in the Statement of Operations as a component of income from Fidelity Central Funds. Total security lending income during the period amounted to $246,284, including $30,742 from securities loaned to FCM.
8. Expense Reductions.
Commissions paid to certain brokers with whom the investment adviser, or its affiliates, places trades on behalf of the Fund include an amount in addition to trade execution, which may be rebated back to the Fund to offset certain expenses. This amount totaled $75,969 for the period. In addition, through arrangements with the Fund's custodian, credits realized as a result of certain uninvested cash balances were used to reduce the Fund's expenses. During the period, these credits reduced the Fund's custody expenses by $409.
In addition, during the period the investment adviser reimbursed and/or waived a portion of fund-level operating expenses in the amount of $9,246.
9. Distributions to Shareholders.
Distributions to shareholders of each class were as follows:
| | Year ended
October 31, 2017 | Year ended
October 31, 2016 |
| From net investment income | | |
| Class A | $440,395 | $319,347 |
| Class M | 105,144 | 106,306 |
| Class B | – | 996 |
| Class C | 42,573 | 64,383 |
| International Small Cap | 13,342,577 | 10,307,620 |
| Class I | 462,523 | 134,439 |
| Total | $14,393,212 | $10,933,091 |
| From net realized gain | | |
| Class A | $461,138 | $788,825 |
| Class M | 163,369 | 339,739 |
| Class B | – | 10,287 |
| Class C | 151,895 | 319,340 |
| International Small Cap | 11,341,189 | 21,811,338 |
| Class I | 361,268 | 270,625 |
| Total | $12,478,859 | $23,540,154 |
10. Share Transactions.
Share transactions for each class were as follows and may contain automatic conversions between classes or exchanges between affiliated funds:
| | Shares | Shares | Dollars | Dollars |
| | Year ended October 31, 2017 | Year ended October 31, 2016 | Year ended October 31, 2017 | Year ended October 31, 2016 |
| Class A | | | | |
| Shares sold | 1,346,483 | 622,254 | $35,353,222 | $13,846,907 |
| Reinvestment of distributions | 38,390 | 49,226 | 881,445 | 1,077,561 |
| Shares redeemed | (746,471) | (383,922) | (18,879,894) | (8,560,022) |
| Net increase (decrease) | 638,402 | 287,558 | $17,354,773 | $6,364,446 |
| Class M | | | | |
| Shares sold | 165,476 | 133,036 | $4,273,457 | $2,846,482 |
| Reinvestment of distributions | 11,602 | 20,220 | 265,460 | 440,798 |
| Shares redeemed | (116,364) | (139,487) | (2,968,272) | (3,059,683) |
| Net increase (decrease) | 60,714 | 13,769 | $1,570,645 | $227,597 |
| Class B | | | | |
| Shares sold | – | 2,210 | $– | $44,410 |
| Reinvestment of distributions | – | 493 | – | 10,648 |
| Shares redeemed | – | (20,270) | – | (435,806) |
| Net increase (decrease) | – | (17,567) | $– | $(380,748) |
| Class C | | | | |
| Shares sold | 554,853 | 222,957 | $14,330,189 | $4,942,382 |
| Reinvestment of distributions | 8,175 | 16,869 | 182,379 | 358,801 |
| Shares redeemed | (171,623) | (226,514) | (4,225,035) | (4,770,771) |
| Net increase (decrease) | 391,405 | 13,312 | $10,287,533 | $530,412 |
| International Small Cap | | | | |
| Shares sold | 20,105,455 | 11,991,539 | $528,374,537 | $277,123,750 |
| Reinvestment of distributions | 1,029,746 | 1,408,054 | 24,013,687 | 31,286,953 |
| Shares redeemed | (10,901,622) | (11,188,601) | (292,534,899) | (253,612,350) |
| Net increase (decrease) | 10,233,579 | 2,210,992 | $259,853,325 | $54,798,353 |
| Class I | | | | |
| Shares sold | 7,788,345 | 924,076 | $213,872,926 | $21,994,159 |
| Reinvestment of distributions | 29,052 | 16,670 | 682,131 | 373,252 |
| Shares redeemed | (824,089) | (443,477) | (22,829,284) | (9,841,165) |
| Net increase (decrease) | 6,993,308 | 497,269 | $191,725,773 | $12,526,246 |
11. Other.
The Fund's organizational documents provide former and current trustees and officers with a limited indemnification against liabilities arising in connection with the performance of their duties to the Fund. In the normal course of business, the Fund may also enter into contracts that provide general indemnifications. The Fund's maximum exposure under these arrangements is unknown as this would be dependent on future claims that may be made against the Fund. The risk of material loss from such claims is considered remote.
Report of Independent Registered Public Accounting Firm
To the Trustees of Fidelity Investment Trust and Shareholders of Fidelity International Small Cap Fund:
We have audited the accompanying statement of assets and liabilities of Fidelity International Small Cap Fund (the Fund), a fund of Fidelity Investment Trust, including the schedule of investments, as of October 31, 2017, and the related statement of operations for the year then ended, the statement of changes in net assets for each of the two years in the period then ended, and the financial highlights for each of the five years in the period then ended. These financial statements and financial highlights are the responsibility of the Fund's management. Our responsibility is to express an opinion on these financial statements and financial highlights based on our audits.
We conducted our audits in accordance with the standards of the Public Company Accounting Oversight Board (United States). Those standards require that we plan and perform the audit to obtain reasonable assurance about whether the financial statements and financial highlights are free of material misstatement. The Fund is not required to have, nor were we engaged to perform, an audit of its internal control over financial reporting. Our audits included consideration of internal control over financial reporting as a basis for designing audit procedures that are appropriate in the circumstances, but not for the purpose of expressing an opinion on the effectiveness of the Fund's internal control over financial reporting. Accordingly, we express no such opinion. An audit also includes examining, on a test basis, evidence supporting the amounts and disclosures in the financial statements, assessing the accounting principles used and significant estimates made by management, as well as evaluating the overall financial statement presentation. Our procedures included confirmation of securities owned as of October 31, 2017, by correspondence with the custodians and brokers; when replies were not received from brokers, we performed other auditing procedures. We believe that our audits provide a reasonable basis for our opinion.
In our opinion, such financial statements and financial highlights referred to above present fairly, in all material respects, the financial position of Fidelity International Small Cap Fund as of October 31, 2017, the results of its operations for the year then ended, the changes in its net assets for each of the two years in the period then ended, and the financial highlights for each of the five years in the period then ended in conformity with accounting principles generally accepted in the United States of America.
DELOITTE & TOUCHE LLP
Boston, Massachusetts
December 15, 2017
Trustees and Officers
The Trustees, Members of the Advisory Board (if any), and officers of the trust and fund, as applicable, are listed below. The Board of Trustees governs the fund and is responsible for protecting the interests of shareholders. The Trustees are experienced executives who meet periodically throughout the year to oversee the fund's activities, review contractual arrangements with companies that provide services to the fund, oversee management of the risks associated with such activities and contractual arrangements, and review the fund's performance. Except for Jonathan Chiel, each of the Trustees oversees 190 funds. Mr. Chiel oversees 143 funds.
The Trustees hold office without limit in time except that (a) any Trustee may resign; (b) any Trustee may be removed by written instrument, signed by at least two-thirds of the number of Trustees prior to such removal; (c) any Trustee who requests to be retired or who has become incapacitated by illness or injury may be retired by written instrument signed by a majority of the other Trustees; and (d) any Trustee may be removed at any special meeting of shareholders by a two-thirds vote of the outstanding voting securities of the trust. Each Trustee who is not an interested person (as defined in the 1940 Act) of the trust and the fund is referred to herein as an Independent Trustee. Each Independent Trustee shall retire not later than the last day of the calendar year in which his or her 75th birthday occurs. The Independent Trustees may waive this mandatory retirement age policy with respect to individual Trustees. Officers and Advisory Board Members hold office without limit in time, except that any officer or Advisory Board Member may resign or may be removed by a vote of a majority of the Trustees at any regular meeting or any special meeting of the Trustees. Except as indicated, each individual has held the office shown or other offices in the same company for the past five years.
The fund’s Statement of Additional Information (SAI) includes more information about the Trustees. To request a free copy, call Fidelity at 1-800-544-8544.
Experience, Skills, Attributes, and Qualifications of the Trustees. The Governance and Nominating Committee has adopted a statement of policy that describes the experience, qualifications, attributes, and skills that are necessary and desirable for potential Independent Trustee candidates (Statement of Policy). The Board believes that each Trustee satisfied at the time he or she was initially elected or appointed a Trustee, and continues to satisfy, the standards contemplated by the Statement of Policy. The Governance and Nominating Committee also engages professional search firms to help identify potential Independent Trustee candidates who have the experience, qualifications, attributes, and skills consistent with the Statement of Policy. From time to time, additional criteria based on the composition and skills of the current Independent Trustees, as well as experience or skills that may be appropriate in light of future changes to board composition, business conditions, and regulatory or other developments, have also been considered by the professional search firms and the Governance and Nominating Committee. In addition, the Board takes into account the Trustees' commitment and participation in Board and committee meetings, as well as their leadership of standing and ad hoc committees throughout their tenure.
In determining that a particular Trustee was and continues to be qualified to serve as a Trustee, the Board has considered a variety of criteria, none of which, in isolation, was controlling. The Board believes that, collectively, the Trustees have balanced and diverse experience, qualifications, attributes, and skills, which allow the Board to operate effectively in governing the fund and protecting the interests of shareholders. Information about the specific experience, skills, attributes, and qualifications of each Trustee, which in each case led to the Board's conclusion that the Trustee should serve (or continue to serve) as a trustee of the fund, is provided below.
Board Structure and Oversight Function. James C. Curvey is an interested person and currently serves as Chairman. The Trustees have determined that an interested Chairman is appropriate and benefits shareholders because an interested Chairman has a personal and professional stake in the quality and continuity of services provided to the fund. Independent Trustees exercise their informed business judgment to appoint an individual of their choosing to serve as Chairman, regardless of whether the Trustee happens to be independent or a member of management. The Independent Trustees have determined that they can act independently and effectively without having an Independent Trustee serve as Chairman and that a key structural component for assuring that they are in a position to do so is for the Independent Trustees to constitute a substantial majority for the Board. The Independent Trustees also regularly meet in executive session. Ned C. Lautenbach serves as Chairman of the Independent Trustees and as such (i) acts as a liaison between the Independent Trustees and management with respect to matters important to the Independent Trustees and (ii) with management prepares agendas for Board meetings.
Fidelity® funds are overseen by different Boards of Trustees. The fund's Board oversees Fidelity's high income and certain equity funds, and other Boards oversee Fidelity's investment-grade bond, money market, asset allocation, and sector funds. The asset allocation funds may invest in Fidelity® funds overseen by the fund's Board. The use of separate Boards, each with its own committee structure, allows the Trustees of each group of Fidelity® funds to focus on the unique issues of the funds they oversee, including common research, investment, and operational issues. On occasion, the separate Boards establish joint committees to address issues of overlapping consequences for the Fidelity® funds overseen by each Board.
The Trustees operate using a system of committees to facilitate the timely and efficient consideration of all matters of importance to the Trustees, the fund, and fund shareholders and to facilitate compliance with legal and regulatory requirements and oversight of the fund's activities and associated risks. The Board, acting through its committees, has charged FMR and its affiliates with (i) identifying events or circumstances the occurrence of which could have demonstrably adverse effects on the fund's business and/or reputation; (ii) implementing processes and controls to lessen the possibility that such events or circumstances occur or to mitigate the effects of such events or circumstances if they do occur; and (iii) creating and maintaining a system designed to evaluate continuously business and market conditions in order to facilitate the identification and implementation processes described in (i) and (ii) above. Because the day-to-day operations and activities of the fund are carried out by or through FMR, its affiliates, and other service providers, the fund's exposure to risks is mitigated but not eliminated by the processes overseen by the Trustees. While each of the Board's committees has responsibility for overseeing different aspects of the fund's activities, oversight is exercised primarily through the Operations, Audit, and Compliance Committees. In addition, the Independent Trustees have worked with FMR to enhance the Board's oversight of investment and financial risks, legal and regulatory risks, technology risks, and operational risks, including the development of additional risk reporting to the Board. For example, a working group comprised of Independent Trustees and FMR has worked and continues to work to review the Fidelity® funds' valuation-related activities, reporting and risk management. Appropriate personnel, including but not limited to the fund's Chief Compliance Officer (CCO), FMR's internal auditor, the independent accountants, the fund's Treasurer and portfolio management personnel, make periodic reports to the Board's committees, as appropriate, including an annual review of Fidelity's risk management program for the Fidelity® funds. The responsibilities of each standing committee, including their oversight responsibilities, are described further under "Standing Committees of the Trustees."
Interested Trustees*:
Correspondence intended for a Trustee who is an interested person may be sent to Fidelity Investments, 245 Summer Street, Boston, Massachusetts 02210.
Name, Year of Birth; Principal Occupations and Other Relevant Experience+
Jonathan Chiel (1957)
Year of Election or Appointment: 2016
Trustee
Mr. Chiel also serves as Trustee of other Fidelity® funds. Mr. Chiel is Executive Vice President and General Counsel for FMR LLC (diversified financial services company, 2012-present). Previously, Mr. Chiel served as general counsel (2004-2012) and senior vice president and deputy general counsel (2000-2004) for John Hancock Financial Services; a partner with Choate, Hall & Stewart (1996-2000) (law firm); and an Assistant United States Attorney for the United States Attorney’s Office of the District of Massachusetts (1986-95), including Chief of the Criminal Division (1993-1995). Mr. Chiel is a director on the boards of the Boston Bar Foundation and the Maimonides School.
James C. Curvey (1935)
Year of Election or Appointment: 2007
Trustee
Chairman of the Board of Trustees
Mr. Curvey also serves as Trustee of other Fidelity® funds. Mr. Curvey is a Director of Fidelity Research & Analysis Co. (investment adviser firm, 2009-present), and Vice Chairman (2007-present) and Director of FMR LLC (diversified financial services company). In addition, Mr. Curvey serves as an Overseer for the Boston Symphony Orchestra and a member of the board of Artis-Naples, Naples, Florida, and as a Trustee for Brewster Academy, Wolfeboro, New Hampshire. Previously, Mr. Curvey served as a Director of Fidelity Investments Money Management, Inc. (investment adviser firm, 2009-2014) and a Director of FMR and FMR Co., Inc. (investment adviser firms, 2007-2014).
Charles S. Morrison (1960)
Year of Election or Appointment: 2014
Trustee
Mr. Morrison also serves as Trustee of other funds. He serves as President of Fidelity Management & Research Company (FMR) (investment adviser firm, 2016-present), a Director of Fidelity Investments Money Management, Inc. (FIMM) (investment adviser firm, 2014-present), Director of Fidelity SelectCo, LLC (investment adviser firm, 2014-present), President, Asset Management (2014-present), and is an employee of Fidelity Investments. Previously, Mr. Morrison served as Vice President of Fidelity's Fixed Income and Asset Allocation Funds (2012-2014), President, Fixed Income (2011-2014), Vice President of Fidelity's Money Market Funds (2005-2009), President, Money Market Group Leader of FMR (investment adviser firm, 2009), and Senior Vice President, Money Market Group of FMR (2004-2009). Mr. Morrison also served as Vice President of Fidelity's Bond Funds (2002-2005), certain Balanced Funds (2002-2005), and certain Asset Allocation Funds (2002-2007), and as Senior Vice President (2002-2005) of Fidelity's Bond Division.
* Determined to be an “Interested Trustee” by virtue of, among other things, his or her affiliation with the trust or various entities under common control with FMR.
+ The information includes the Trustee's principal occupation during the last five years and other information relating to the experience, attributes, and skills relevant to the Trustee's qualifications to serve as a Trustee, which led to the conclusion that the Trustee should serve as a Trustee for the fund.
Independent Trustees:
Correspondence intended for an Independent Trustee may be sent to Fidelity Investments, P.O. Box 55235, Boston, Massachusetts 02205-5235.
Name, Year of Birth; Principal Occupations and Other Relevant Experience+
Dennis J. Dirks (1948)
Year of Election or Appointment: 2005
Trustee
Mr. Dirks also serves as Trustee of other Fidelity® funds. Prior to his retirement in May 2003, Mr. Dirks was Chief Operating Officer and a member of the Board of The Depository Trust & Clearing Corporation (DTCC). He also served as President, Chief Operating Officer, and Board member of The Depository Trust Company (DTC) and President and Board member of the National Securities Clearing Corporation (NSCC). In addition, Mr. Dirks served as Chief Executive Officer and Board member of the Government Securities Clearing Corporation, Chief Executive Officer and Board member of the Mortgage-Backed Securities Clearing Corporation, as a Trustee and a member of the Finance Committee of Manhattan College (2005-2008), as a Trustee and a member of the Finance Committee of AHRC of Nassau County (2006-2008), as a member of the Independent Directors Council (IDC) Governing Council (2010-2015), and as a member of the Board of Directors for The Brookville Center for Children’s Services, Inc. (2009-2017). Mr. Dirks is a member of the Finance Committee (2016-present) and Board of Directors (2017-present) of the Asolo Repertory Theatre.
Alan J. Lacy (1953)
Year of Election or Appointment: 2008
Trustee
Mr. Lacy also serves as Trustee of other Fidelity® funds. Mr. Lacy serves as a Director of Bristol-Myers Squibb Company (global pharmaceuticals, 2008-present). He is a Trustee of the California Chapter of The Nature Conservancy (2015-present) and a Director of the Center for Advanced Study in the Behavioral Sciences at Stanford University (2015-present). In addition, Mr. Lacy served as Senior Adviser (2007-2014) of Oak Hill Capital Partners, L.P. (private equity) and also served as Chief Executive Officer (2005) and Vice Chairman (2005-2006) of Sears Holdings Corporation (retail) and Chief Executive Officer and Chairman of the Board of Sears, Roebuck and Co. (retail, 2000-2005). Previously, Mr. Lacy served as Chairman (2014-2017) and a member (2010-2017) of the Board of Directors of Dave & Buster’s Entertainment, Inc. (restaurant and entertainment complexes), as Chairman (2008-2011) and a member (2006-2015) of the Board of Trustees of the National Parks Conservation Association, and as a member of the Board of Directors for The Hillman Companies, Inc. (hardware wholesalers, 2010-2014), Earth Fare, Inc. (retail grocery, 2010-2014), and The Western Union Company (global money transfer, 2006-2011).
Ned C. Lautenbach (1944)
Year of Election or Appointment: 2000
Trustee
Chairman of the Independent Trustees
Mr. Lautenbach also serves as Trustee of other Fidelity® funds. Mr. Lautenbach currently serves as Vice Chair of the Board of Governors, State University System of Florida (2013-present) and is a member of the Council on Foreign Relations (1994-present). He is also a member and has most recently served as Chairman of the Board of Directors of Artis-Naples (2012-present). Previously, Mr. Lautenbach served as a member and then Lead Director of the Board of Directors of Eaton Corporation (diversified industrial, 1997-2016). He was also a Partner and Advisory Partner at Clayton, Dubilier & Rice, LLC (private equity investment, 1998-2010), as well as a Director of Sony Corporation (2006-2007). In addition, Mr. Lautenbach also had a 30-year career with IBM (technology company) during which time he served as Senior Vice President and a member of the Corporate Executive Committee (1968-1998).
Joseph Mauriello (1944)
Year of Election or Appointment: 2008
Trustee
Mr. Mauriello also serves as Trustee of other Fidelity® funds. Prior to his retirement in January 2006, Mr. Mauriello served in numerous senior management positions including Deputy Chairman and Chief Operating Officer (2004-2005), and Vice Chairman of Financial Services (2002-2004) of KPMG LLP US (professional services, 1965-2005). Mr. Mauriello currently serves as a member of the Board of Directors of XL Group plc. (global insurance and re-insurance, 2006-present) and the Independent Directors Council (IDC) Governing Council (2015-present). Previously, Mr. Mauriello served as a Director of the Hamilton Funds of the Bank of New York (2006-2007) and of Arcadia Resources Inc. (health care services and products, 2007-2012).
Cornelia M. Small (1944)
Year of Election or Appointment: 2005
Trustee
Ms. Small also serves as Trustee of other Fidelity® funds. Ms. Small is a member of the Board of Directors (2009-present) and Chair of the Investment Committee (2010-present) of the Teagle Foundation. Ms. Small also serves on the Investment Committee of the Berkshire Taconic Community Foundation (2008-present). Previously, Ms. Small served as Chairperson (2002-2008) and a member of the Investment Committee and Chairperson (2008-2012) and a member of the Board of Trustees of Smith College. In addition, Ms. Small served as Chief Investment Officer, Director of Global Equity Investments, and a member of the Board of Directors of Scudder, Stevens & Clark and Scudder Kemper Investments.
William S. Stavropoulos (1939)
Year of Election or Appointment: 2001
Trustee
Vice Chairman of the Independent Trustees
Mr. Stavropoulos also serves as Trustee of other Fidelity® funds. Mr. Stavropoulos serves as President and Founder of the Michigan Baseball Foundation, the Great Lakes Loons (2007-present). Mr. Stavropoulos is Chairman Emeritus of the Board of Directors of The Dow Chemical Company, where he previously served in numerous senior management positions, including President, CEO (1995-2000; 2002-2004), Chairman of the Executive Committee (2000-2006), and as a member of the Board of Directors (1990-2006). Currently, Mr. Stavropoulos is Chairman of the Board of Directors of Univar Inc. (global distributor of commodity and specialty chemicals), a Director of Teradata Corporation (data warehousing and technology solutions), and a member of the Advisory Board for Metalmark Capital LLC (private equity investment, 2005-present). Mr. Stavropoulos is an operating advisor to Clayton, Dubilier & Rice, LLC (private equity investment). In addition, Mr. Stavropoulos is a member of the University of Notre Dame Advisory Council for the College of Science, a Trustee of the Rollin L. Gerstacker Foundation, and a Director of Artis-Naples in Naples, Florida. Previously, Mr. Stavropoulos served as a Director of Chemical Financial Corporation (bank holding company, 1993-2012) and Tyco International, Ltd. (multinational manufacturing and services, 2007-2012).
David M. Thomas (1949)
Year of Election or Appointment: 2008
Trustee
Mr. Thomas also serves as Trustee of other Fidelity® funds. Mr. Thomas serves as Non-Executive Chairman of the Board of Directors of Fortune Brands Home and Security (home and security products, 2011-present), as a member of the Board of Directors (2004-present) and Presiding Director (2013-present) of Interpublic Group of Companies, Inc. (marketing communication), and as a member of the Board of Trustees of the University of Florida (2013-present). Previously, Mr. Thomas served as Executive Chairman (2005-2006) and Chairman and Chief Executive Officer (2000-2005) of IMS Health, Inc. (pharmaceutical and healthcare information solutions), and a Director of Fortune Brands, Inc. (consumer products, 2000-2011).
+ The information includes the Trustee's principal occupation during the last five years and other information relating to the experience, attributes, and skills relevant to the Trustee's qualifications to serve as a Trustee, which led to the conclusion that the Trustee should serve as a Trustee for the fund.
Advisory Board Members and Officers:
Correspondence intended for an officer or Peter S. Lynch may be sent to Fidelity Investments, 245 Summer Street, Boston, Massachusetts 02210. Officers appear below in alphabetical order.
Name, Year of Birth; Principal Occupation
Peter S. Lynch (1944)
Year of Election or Appointment: 2003
Member of the Advisory Board
Mr. Lynch also serves as Member of the Advisory Board of other Fidelity® funds. Mr. Lynch is Vice Chairman and a Director of FMR (investment adviser firm) and FMR Co., Inc. (investment adviser firm). In addition, Mr. Lynch serves as a Trustee of Boston College and as the Chairman of the Inner-City Scholarship Fund. Previously, Mr. Lynch served on the Special Olympics International Board of Directors (1997-2006).
Elizabeth Paige Baumann (1968)
Year of Election or Appointment: 2017
Anti-Money Laundering (AML) Officer
Ms. Baumann also serves as AML Officer of other funds. She is Chief AML Officer (2012-present) and Senior Vice President (2014-present) of FMR LLC (diversified financial services company) and is an employee of Fidelity Investments. Previously, Ms. Baumann served as AML Officer of the funds (2012-2016), and Vice President (2007-2014) and Deputy Anti-Money Laundering Officer (2007-2012) of FMR LLC.
Marc R. Bryant (1966)
Year of Election or Appointment: 2015
Secretary and Chief Legal Officer (CLO)
Mr. Bryant also serves as Secretary and CLO of other funds. Mr. Bryant serves as CLO, Secretary, and Senior Vice President of Fidelity Management & Research Company (investment adviser firm, 2015-present) and FMR Co., Inc. (investment adviser firm, 2015-present); Secretary of Fidelity SelectCo, LLC (investment adviser firm, 2015-present) and Fidelity Investments Money Management, Inc. (investment adviser firm, 2015-present); and CLO of Fidelity Management & Research (Hong Kong) Limited and FMR Investment Management (UK) Limited (investment adviser firms, 2015-present) and Fidelity Management & Research (Japan) Limited (investment adviser firm, 2016-present). He is Senior Vice President and Deputy General Counsel of FMR LLC (diversified financial services company). Previously, Mr. Bryant served as Secretary and CLO of Fidelity Rutland Square Trust II (2010-2014) and Assistant Secretary of Fidelity's Fixed Income and Asset Allocation Funds (2013-2015). Prior to joining Fidelity Investments, Mr. Bryant served as a Senior Vice President and the Head of Global Retail Legal for AllianceBernstein L.P. (2006-2010), and as the General Counsel for ProFund Advisors LLC (2001-2006).
William C. Coffey (1969)
Year of Election or Appointment: 2009
Assistant Secretary
Mr. Coffey also serves as Assistant Secretary of other funds. He is Senior Vice President and Deputy General Counsel of FMR LLC (diversified financial services company, 2010-present), and is an employee of Fidelity Investments. Previously, Mr. Coffey served as Vice President and Associate General Counsel of FMR LLC (2005-2009).
Jonathan Davis (1968)
Year of Election or Appointment: 2010
Assistant Treasurer
Mr. Davis also serves as Assistant Treasurer of other funds, and is an employee of Fidelity Investments. Previously, Mr. Davis served as Vice President and Associate General Counsel of FMR LLC (diversified financial services company, 2003-2010).
Adrien E. Deberghes (1967)
Year of Election or Appointment: 2016
Assistant Treasurer
Mr. Deberghes also serves as an officer of other funds. He serves as Executive Vice President of Fidelity Investments Money Management, Inc. (FIMM) (investment adviser firm, 2016-present) and is an employee of Fidelity Investments (2008-present). Prior to joining Fidelity Investments, Mr. Deberghes was Senior Vice President of Mutual Fund Administration at State Street Corporation (2007-2008), Senior Director of Mutual Fund Administration at Investors Bank & Trust (2005-2007), and Director of Finance for Dunkin' Brands (2000-2005). Previously, Mr. Deberghes served in other fund officer roles.
Stephanie J. Dorsey (1969)
Year of Election or Appointment: 2010
Assistant Treasurer
Ms. Dorsey also serves as an officer of other funds. She is an employee of Fidelity Investments (2008-present) and has served in other fund officer roles. Prior to joining Fidelity Investments, Ms. Dorsey served as Treasurer (2004-2008) of the JPMorgan Mutual Funds and Vice President (2004-2008) of JPMorgan Chase Bank.
Howard J. Galligan III (1966)
Year of Election or Appointment: 2014
Chief Financial Officer
Mr. Galligan also serves as Chief Financial Officer of other funds. Mr. Galligan serves as President of Fidelity Pricing and Cash Management Services (FPCMS) (2014-present) and as a Director of Strategic Advisers, Inc. (investment adviser firm, 2008-present). Previously, Mr. Galligan served as Chief Administrative Officer of Asset Management (2011-2014) and Chief Operating Officer and Senior Vice President of Investment Support for Strategic Advisers, Inc. (2003-2011).
Thomas C. Hense (1964)
Year of Election or Appointment: 2008, 2010, or 2015
Vice President
Mr. Hense serves as Vice President of Fidelity Advisor® Multi-Asset Income Fund (2015) and other funds (High Income (2008), Small Cap (2008), and Value (2010) funds), and is an employee of Fidelity Investments (1993-present). Previously, Mr. Hense served as a portfolio manager for Fidelity's Institutional Money Management Group (Pyramis) (2003-2008).
Brian B. Hogan (1964)
Year of Election or Appointment: 2009
Vice President
Mr. Hogan also serves as Trustee or Vice President of other funds. Mr. Hogan serves as a Director of FMR Investment Management (UK) Limited (investment adviser firm, 2015-present) and Fidelity SelectCo, LLC (investment adviser firm, 2014-present) and President of the Equity Division of FMR (investment adviser firm, 2009-present). Previously, Mr. Hogan served as Senior Vice President, Equity Research of FMR (2006-2009) and as a portfolio manager. Mr. Brian B. Hogan is not related to Mr. Colm A. Hogan.
Colm A. Hogan (1973)
Year of Election or Appointment: 2016
Deputy Treasurer
Mr. Hogan also serves as an officer of other funds. Mr. Hogan is an employee of Fidelity Investments (2005-present). Mr. Colm A. Hogan is not related to Mr. Brian B. Hogan.
Chris Maher (1972)
Year of Election or Appointment: 2013
Assistant Treasurer
Mr. Maher serves as Assistant Treasurer of other funds. Mr. Maher is Vice President of Valuation Oversight and is an employee of Fidelity Investments. Previously, Mr. Maher served as Vice President of Asset Management Compliance (2013), Vice President of the Program Management Group of FMR (investment adviser firm, 2010-2013), and Vice President of Valuation Oversight (2008-2010).
Rieco E. Mello (1969)
Year of Election or Appointment: 2017
Assistant Treasurer
Mr. Mello also serves as Assistant Treasurer of other funds. Mr. Mello is an employee of Fidelity Investments (1995-present).
Kenneth B. Robins (1969)
Year of Election or Appointment: 2016
Chief Compliance Officer
Mr. Robins also serves as an officer of other funds. Mr. Robins serves as Compliance Officer of Fidelity Management & Research Company and FMR Co., Inc. (investment adviser firms, 2016-present) and is an employee of Fidelity Investments (2004-present). Previously, Mr. Robins served as Executive Vice President of Fidelity Investments Money Management, Inc. (investment adviser firm, 2013-2016) and served in other fund officer roles.
Stacie M. Smith (1974)
Year of Election or Appointment: 2016
President and Treasurer
Ms. Smith also serves as an officer of other funds. She is an employee of Fidelity Investments (2009-present) and has served in other fund officer roles. Prior to joining Fidelity Investments, Ms. Smith served as Senior Audit Manager of Ernst & Young LLP (accounting firm, 1996-2009). Previously, Ms. Smith served as Deputy Treasurer of certain Fidelity® funds (2013-2016).
Marc L. Spector (1972)
Year of Election or Appointment: 2016
Assistant Treasurer
Mr. Spector also serves as an officer of other funds. Mr. Spector is an employee of Fidelity Investments (2016-present). Prior to joining Fidelity Investments, Mr. Spector served as Director at the Siegfried Group (accounting firm, 2013-2016), and prior to Siegfried Group as audit senior manager at Deloitte & Touche (accounting firm, 2005-2013).
Renee Stagnone (1975)
Year of Election or Appointment: 2016
Assistant Treasurer
Ms. Stagnone also serves as an officer of other funds. Ms. Stagnone is an employee of Fidelity Investments (1997-present). Previously, Ms. Stagnone served as Deputy Treasurer of certain Fidelity® funds (2013-2016).
Shareholder Expense Example
As a shareholder of the Fund, you incur two types of costs: (1) transaction costs, including sales charges (loads) on purchase payments or redemption proceeds, redemption fees and (2) ongoing costs, including management fees, distribution and/or service (12b-1) fees and other Fund expenses. This Example is intended to help you understand your ongoing costs (in dollars) of investing in the Fund and to compare these costs with the ongoing costs of investing in other mutual funds.
The Example is based on an investment of $1,000 invested at the beginning of the period and held for the entire period (May 1, 2017 to October 31, 2017).
Actual Expenses
The first line of the accompanying table for each class of the Fund provides information about actual account values and actual expenses. You may use the information in this line, together with the amount you invested, to estimate the expenses that you paid over the period. Simply divide your account value by $1,000.00 (for example, an $8,600 account value divided by $1,000.00 = 8.6), then multiply the result by the number in the first line for a class of the Fund under the heading entitled "Expenses Paid During Period" to estimate the expenses you paid on your account during this period. A small balance maintenance fee of $12.00 that is charged once a year may apply for certain accounts with a value of less than $2,000. This fee is not included in the table below. If it was, the estimate of expenses you paid during the period would be higher, and your ending account value lower, by this amount. In addition, the Fund, as a shareholder in the underlying Fidelity Central Funds, will indirectly bear its pro-rata share of the fees and expenses incurred by the underlying Fidelity Central Funds. These fees and expenses are not included in the Fund's annualized expense ratio used to calculate the expense estimate in the table below.
Hypothetical Example for Comparison Purposes
The second line of the accompanying table for each class of the Fund provides information about hypothetical account values and hypothetical expenses based on a Class' actual expense ratio and an assumed rate of return of 5% per year before expenses, which is not the Class' actual return. The hypothetical account values and expenses may not be used to estimate the actual ending account balance or expenses you paid for the period. You may use this information to compare the ongoing costs of investing in the Fund and other funds. To do so, compare this 5% hypothetical example with the 5% hypothetical examples that appear in the shareholder reports of the other funds. A small balance maintenance fee of $12.00 that is charged once a year may apply for certain accounts with a value of less than $2,000. This fee is not included in the table below. If it was, the estimate of expenses you paid during the period would be higher, and your ending account value lower, by this amount. In addition, the Fund, as a shareholder in the underlying Fidelity Central Funds, will indirectly bear its pro-rata share of the fees and expenses incurred by the underlying Fidelity Central Funds. These fees and expenses are not included in the Fund's annualized expense ratio used to calculate the expense estimate in the table below.
Please note that the expenses shown in the table are meant to highlight your ongoing costs only and do not reflect any transaction costs. Therefore, the second line of the table is useful in comparing ongoing costs only, and will not help you determine the relative total costs of owning different funds. In addition, if these transactional costs were included, your costs would have been higher.
| | Annualized Expense Ratio-A | Beginning
Account Value
May 1, 2017 | Ending
Account Value
October 31, 2017 | Expenses Paid
During Period-B
May 1, 2017
to October 31, 2017 |
| Class A | 1.54% | | | |
| Actual | | $1,000.00 | $1,131.60 | $8.27 |
| Hypothetical-C | | $1,000.00 | $1,017.44 | $7.83 |
| Class M | 1.82% | | | |
| Actual | | $1,000.00 | $1,130.20 | $9.77 |
| Hypothetical-C | | $1,000.00 | $1,016.03 | $9.25 |
| Class C | 2.32% | | | |
| Actual | | $1,000.00 | $1,127.50 | $12.44 |
| Hypothetical-C | | $1,000.00 | $1,013.51 | $11.77 |
| International Small Cap | 1.24% | | | |
| Actual | | $1,000.00 | $1,133.20 | $6.67 |
| Hypothetical-C | | $1,000.00 | $1,018.95 | $6.31 |
| Class I | 1.29% | | | |
| Actual | | $1,000.00 | $1,133.50 | $6.94 |
| Hypothetical-C | | $1,000.00 | $1,018.70 | $6.56 |
A Annualized expense ratio reflects expenses net of applicable fee waivers.
B Expenses are equal to each Class' annualized expense ratio, multiplied by the average account value over the period, multiplied by 184/365 (to reflect the one-half year period).
C 5% return per year before expenses
Distributions (Unaudited)
The Board of Trustees of Fidelity International Small Cap Fund voted to pay to shareholders of record at the opening of business on record date, the following distributions per share derived from capital gains realized from sales of portfolio securities, and dividends derived from net investment income:
| | Pay Date | Record Date | Dividends | Capital Gains |
| Fidelity International Small Cap Fund | | | | |
| Class A | 12/11/17 | 12/08/17 | $0.230 | $0.737 |
| Class M | 12/11/17 | 12/08/17 | $0.151 | $0.737 |
| Class C | 12/11/17 | 12/08/17 | $0.103 | $0.737 |
| Fidelity International Small Cap | 12/11/17 | 12/08/17 | $0.292 | $0.737 |
| Class I | 12/11/17 | 12/08/17 | $0.304 | $0.737 |
|
The fund hereby designates as a capital gain dividend with respect to the taxable year ended October 31, 2017, $25,367,408, or, if subsequently determined to be different, the net capital gain of such year.
Class A, Class M, Class C, Fidelity International Small Cap, and Class I designate 100% of the dividend distributed during the fiscal year as amounts which may be taken into account as a dividend for purposes of the maximum rate under section 1(h)(11) of the Internal Revenue Code.
The amounts per share which represent income derived from sources within, and taxes paid to, foreign countries or possessions of the United States are as follows:
| | Pay Date | Income | Taxes |
| Fidelity International Small Cap Fund | | | |
| Class A | 12/12/16 | $0.3637 | $0.0427 |
| Class M | 12/12/16 | $0.2737 | $0.0427 |
| Class C | 12/12/16 | $0.1687 | $0.0427 |
| Fidelity International Small Cap | 12/12/16 | $0.4277 | $0.0427 |
| Class I | 12/12/16 | $0.4577 | $0.0427 |
|
The fund will notify shareholders in January 2018 of amounts for use in preparing 2017 income tax returns.
Board Approval of Investment Advisory Contracts and Management Fees
Fidelity International Small Cap Fund
Each year, the Board of Trustees, including the Independent Trustees (together, the Board), votes on the renewal of the management contract with Fidelity Management & Research Company (FMR) and the sub-advisory agreements (together, the Advisory Contracts) for the fund. FMR and the sub-advisers are referred to herein as the Investment Advisers. The Board, assisted by the advice of fund counsel and Independent Trustees' counsel, requests and considers a broad range of information relevant to the renewal of the Advisory Contracts throughout the year.
The Board meets regularly and, at each of its meetings, covers an extensive agenda of topics and materials and considers factors that are relevant to its annual consideration of the renewal of the fund's Advisory Contracts, including the services and support provided to the fund and its shareholders. The Board has established various standing committees (Committees), each composed of and chaired by Independent Trustees with varying backgrounds, to which the Board has assigned specific subject matter responsibilities in order to enhance effective decision-making by the Board. The Board, acting directly and through its Committees, requests and receives information concerning the annual consideration of the renewal of the fund's Advisory Contracts. The Board also meets as needed to review matters specifically related to the Board's annual consideration of the renewal of the Advisory Contracts. Members of the Board may also meet with trustees of other Fidelity funds through ad hoc joint committees to discuss certain matters relevant to all of the Fidelity funds.
At its July 2017 meeting, the Board unanimously determined to renew the fund's Advisory Contracts. In reaching its determination, the Board considered all factors it believed relevant, including (i) the nature, extent, and quality of the services to be provided to the fund and its shareholders (including the investment performance of the fund); (ii) the competitiveness of the fund's management fee and total expense ratio relative to peer funds; (iii) the total costs of the services to be provided by and the profits to be realized by Fidelity from its relationships with the fund; and (iv) the extent to which, if any, economies of scale exist and would be realized as the fund grows, and whether any economies of scale are appropriately shared with fund shareholders.
In considering whether to renew the Advisory Contracts for the fund, the Board reached a determination, with the assistance of fund counsel and Independent Trustees' counsel and through the exercise of its business judgment, that the renewal of the Advisory Contracts was in the best interests of the fund and its shareholders and that the compensation payable under the Advisory Contracts was fair and reasonable. The Board's decision to renew the Advisory Contracts was not based on any single factor, but rather was based on a comprehensive consideration of all the information provided to the Board at its meetings throughout the year. The Board, in reaching its determination to renew the Advisory Contracts, was aware that shareholders of the fund have a broad range of investment choices available to them, including a wide choice among funds offered by Fidelity's competitors, and that the fund's shareholders, who have the opportunity to review and weigh the disclosure provided by the fund in its prospectus and other public disclosures, have chosen to invest in this fund, which is part of the Fidelity family of funds.
Amendment to Group Fee Rate. The Board also approved an amendment to the management contract for the fund to add an additional breakpoint to the group fee schedule, effective October 1, 2017. The Board noted that the additional breakpoint would result in lower management fee rates as Fidelity's assets under management increase.
Nature, Extent, and Quality of Services Provided. The Board considered Fidelity's staffing as it relates to the fund, including the backgrounds of investment personnel of Fidelity, and also considered the fund's investment objective, strategies, and related investment philosophy. The Independent Trustees also had discussions with senior management of Fidelity's investment operations and investment groups. The Board considered the structure of the investment personnel compensation program and whether this structure provides appropriate incentives to act in the best interests of the fund. Additionally, the Board considered the portfolio managers' investments, if any, in the funds that they manage.
Resources Dedicated to Investment Management and Support Services. The Board and the Fund Oversight and Research Committees reviewed the general qualifications and capabilities of Fidelity's investment staff, including its size, education, experience, and resources, as well as Fidelity's approach to recruiting, training, managing, and compensating investment personnel. The Board noted that Fidelity has continued to increase the resources devoted to non-U.S. offices, including expansion of Fidelity's global investment organization. The Board also noted that Fidelity's analysts have extensive resources, tools and capabilities that allow them to conduct sophisticated quantitative and fundamental analysis, as well as credit analysis of issuers, counterparties and guarantors. Further, the Board considered that Fidelity's investment professionals have sufficient access to global information and data so as to provide competitive investment results over time, and that those professionals also have access to sophisticated tools that permit them to assess portfolio construction and risk and performance attribution characteristics continuously, as well as to transmit new information and research conclusions rapidly around the world. Additionally, in its deliberations, the Board considered Fidelity's trading, risk management, compliance, and technology and operations capabilities and resources, which are integral parts of the investment management process.
Shareholder and Administrative Services. The Board considered (i) the nature, extent, quality, and cost of advisory, administrative, and shareholder services performed by the Investment Advisers and their affiliates under the Advisory Contracts and under separate agreements covering transfer agency, pricing and bookkeeping, and securities lending services for the fund; (ii) the nature and extent of the supervision of third party service providers, principally custodians, subcustodians, and pricing vendors; and (iii) the resources devoted to, and the record of compliance with, the fund's compliance policies and procedures. The Board also reviewed the allocation of fund brokerage, including allocations to brokers affiliated with the Investment Advisers, the use of brokerage commissions to pay fund expenses, and the use of "soft" commission dollars to pay for research services.
The Board noted that the growth of fund assets over time across the complex allows Fidelity to reinvest in the development of services designed to enhance the value or convenience of the Fidelity funds as investment vehicles. These services include 24-hour access to account information and market information through telephone representatives and over the Internet, investor education materials and asset allocation tools, and the expanded availability of Fidelity Investor Centers.
In 2014, the Board formed an ad hoc Committee on Transfer Agency Fees to review the variety of transfer agency fee structures throughout the industry and Fidelity's competitive positioning with respect to industry participants.
Investment in a Large Fund Family. The Board considered the benefits to shareholders of investing in a Fidelity fund, including the benefits of investing in a fund that is part of a large family of funds offering a variety of investment disciplines and providing a large variety of mutual fund investor services. The Board noted that Fidelity had taken, or had made recommendations that resulted in the Fidelity funds taking, a number of actions over the previous year that benefited particular funds, including: (i) continuing to dedicate additional resources to Fidelity's investment research process, and to the support of the senior management team that oversees asset management; (ii) continuing efforts to enhance Fidelity's global research capabilities; (iii) launching new funds and making other enhancements to meet client needs; (iv) launching new share classes of existing funds; (v) eliminating purchase minimums and broadening eligibility requirements for certain lower-priced share classes; (vi) reducing management fees and total expenses for certain growth equity funds and index funds; (vii) lowering expense caps for certain existing funds and classes to reduce expenses borne by shareholders; (viii) eliminating short-term redemption fees for certain funds; (ix) introducing a new pricing structure for certain funds of funds that is expected to reduce overall expenses paid by shareholders; (x) rationalizing product lines and gaining increased efficiencies through proposals for fund mergers and share class consolidations; (xi) continuing to develop, acquire and implement systems and technology to improve services to the funds and shareholders, strengthen information security, and increase efficiency; and (xii) implementing enhancements to further strengthen Fidelity's product line to increase investors' probability of success in achieving their investment goals, including retirement income goals.
Investment Performance. The Board considered whether the fund has operated in accordance with its investment objective, as well as its record of compliance with its investment restrictions and its performance history. The Board noted that there was a portfolio management change for the fund in March 2014.
The Board took into account discussions with representatives of the Investment Advisers about fund investment performance that occur at Board meetings throughout the year. In this regard the Board noted that as part of regularly scheduled fund reviews and other reports to the Board on fund performance, the Board considers annualized return information for the fund for different time periods, measured against a securities market index ("benchmark index") and a peer group of funds with similar objectives ("peer group"), if any. In its evaluation of fund investment performance, the Board gave particular attention to information indicating changes in performance of certain Fidelity funds for specific time periods and discussed with the Investment Advisers the reasons for any overperformance or underperformance.
In addition to reviewing absolute and relative fund performance, the Independent Trustees periodically consider the appropriateness of fund performance metrics in evaluating the results achieved. In general, the Independent Trustees believe that fund performance should be evaluated based on net performance (after fees and expenses) of both the highest performing and lowest performing fund share classes, where applicable, compared to appropriate benchmark indices, over appropriate time periods that may include full market cycles, and compared to peer groups, as applicable, over the same periods, taking into account relevant factors including the following: general market conditions; issuer-specific information; and fund cash flows and other factors.
The Independent Trustees recognize that shareholders evaluate performance on a net basis over their own holding periods, for which one-, three-, and five-year periods are often used as a proxy. For this reason, the performance information reviewed by the Board also included net cumulative calendar year total return information for the fund and an appropriate benchmark index and peer group for the most recent
one-, three-, and five-year periods, as shown below. Returns are shown compared to the 25th percentile (top of box, 75% beaten) and 75th percentile (bottom of box, 25% beaten) of the peer universe. Returns of the benchmark index are "net MA," i.e., adjusted for tax withholding rates applicable to U.S.-based funds organized as Massachusetts business trusts.Fidelity International Small Cap Fund
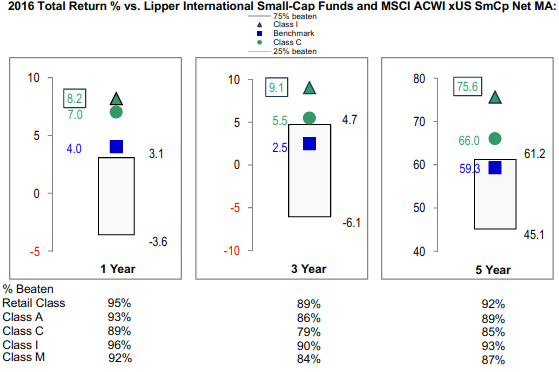
The Board also considered that the fund's management fee is subject to upward or downward adjustment depending upon whether, and to what extent, the fund's investment performance for the performance period (a rolling 36-month period) exceeds, or is exceeded by, a securities index, thus leading to a performance adjustment for the same period. The Board noted that the performance adjustment provides FMR with a strong economic incentive to seek to achieve superior long-term performance for the fund's shareholders and helps to more closely align the interests of FMR and the shareholders of the fund.
Based on its review, the Board concluded that the nature, extent, and quality of services provided to the fund under the Advisory Contracts should continue to benefit the shareholders of the fund.
Competitiveness of Management Fee and Total Expense Ratio. The Board considered the fund's management fee and total expense ratio compared to "mapped groups" of competitive funds and classes created for the purpose of facilitating the Trustees' competitive analysis of management fees and total expenses. Fidelity creates "mapped groups" by combining similar Lipper investment objective categories that have comparable investment mandates. Combining Lipper investment objective categories aids the Board's management fee and total expense ratio comparisons by broadening the competitive group used for comparison.
Management Fee. The Board considered two proprietary management fee comparisons for the 12-month periods shown in basis points (BP) in the chart below. The group of Lipper funds used by the Board for management fee comparisons is referred to below as the "Total Mapped Group." The Total Mapped Group is broader than the Lipper peer group used by the Board for performance comparisons because the Total Mapped Group combines several Lipper investment objective categories while the Lipper peer group does not. The Total Mapped Group comparison focuses on a fund's standing in terms of gross management fees before expense reimbursements or caps, and without giving effect to the fund's performance adjustment, relative to the total universe of funds with comparable investment mandates, regardless of whether their management fee structures also are comparable. Funds with comparable investment mandates offer exposure to similar types of securities. Funds with comparable management fee structures have similar management fee contractual arrangements (
e.g., flat rate charged for advisory services, all-inclusive fee rate,
etc.). "TMG %" represents the percentage of funds in the Total Mapped Group that had management fees that were lower than the fund's. For example, a hypothetical TMG % of 20% would mean that 80% of the funds in the Total Mapped Group had higher, and 20% had lower, management fees than the fund. The fund's actual TMG %s and the number of funds in the Total Mapped Group are in the chart below. The "Asset-Size Peer Group" (ASPG) comparison focuses on a fund's standing relative to a subset of non-Fidelity funds within the Total Mapped Group that are similar in size and management fee structure without taking into account performance adjustments, if any. For example, if a fund is in the first quartile of the ASPG, the fund's management fee ranks in the least expensive or lowest 25% of funds in the ASPG. The ASPG represents at least 15% of the funds in the Total Mapped Group with comparable asset size and management fee structures, subject to a minimum of 50 funds (or all funds in the Total Mapped Group if fewer than 50). Additional information, such as the ASPG quartile in which the fund's management fee rate ranked and the impact of the fund's performance adjustment, is also included in the chart and considered by the Board.
Fidelity International Small Cap Fund
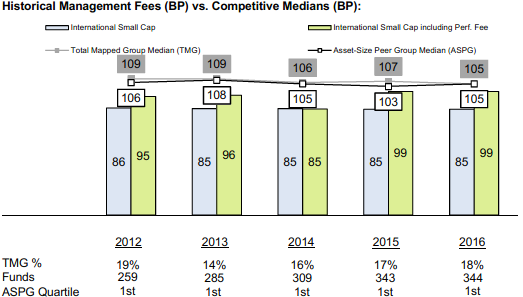
The Board noted that the fund's management fee rate ranked below the median of its Total Mapped Group and below the median of its ASPG for 2016. The Board also noted the effect of the fund's performance adjustment, if any, on the fund's management fee ranking.
Furthermore, the Board considered that shareholders approved a prospective change in the index used to calculate the fund's performance adjustment, beginning April 1, 2014. The Board also considered that, because the performance adjustment is based on a rolling 36-month measurement period, during a transition period the fund's performance is compared to a blended index return that reflects the performance of the former index for the portion of the measurement period prior to April 1, 2014 and the performance of the current index for the remainder of the measurement period. The Board noted that the fund's performance adjustments for 2014 through 2016 shown in the chart above reflect the effect of using the blended index return to calculate the fund's performance adjustment.
The Board noted that, in 2014, the Board and the boards of other Fidelity funds formed the ad hoc Committee on Group Fee to conduct an in-depth review of the "group fee" component of the management fee of funds with such management fee structures. The Committee's focus included the mechanics of the group fee, the competitive landscape of group fee structures, Fidelity funds with no group fee component and investment products not included in group fee assets. The Board also considered that, for funds subject to the group fee, FMR agreed to voluntarily waive fees over a specified period of time in amounts designed to account for assets converted from certain funds to certain collective investment trusts.
The Board also noted that, in 2013, the ad hoc Committee on Management Fees was formed to conduct an in-depth review of the management fee rates of Fidelity's active equity mutual funds. The Committee focused on the following areas: (i) standard fee structures; (ii) research consumption and trading evolution; (iii) management fee competitiveness/profitability by category; and (iv) factors that drive institutional pricing.
Based on its review, the Board concluded that the fund's management fee is fair and reasonable in light of the services that the fund receives and the other factors considered.
Total Expense Ratio. In its review of each class's total expense ratio, the Board considered the fund's management fee rate as well as other fund or class expenses, as applicable, such as transfer agent fees, pricing and bookkeeping fees, fund-paid 12b-1 fees, and custodial, legal, and audit fees. The Board noted the impact of the fund's performance adjustment. The Board also noted that Fidelity may agree to waive fees and expenses from time to time, and the extent to which, if any, it has done so for the fund. As part of its review, the Board also considered the current and historical total expense ratios of each class of the fund compared to competitive fund median expenses. Each class of the fund is compared to those funds and classes in the Total Mapped Group (used by the Board for management fee comparisons) that have a similar sales load structure.
The Board noted that the total expense ratio of each of Class A and the retail class ranked below the competitive median for 2016 and the total expense ratio of each of Class M (formerly Class T), Class C, and Class I ranked above the competitive median for 2016. The Board considered that, in general, various factors can affect total expense ratios. The Board noted that the total expense ratio of Class M was above the competitive median primarily because of higher 12b-1 fees on Class M as compared to most competitor funds. Class M has a higher 12b-1 fee, but a lower front-end sales charge, than traditionally priced front-end sales charge classes. The Board considered that Class M is primarily sold load-waived in the retirement plan market where its 0.50% 12b-1 fee is comparable to competing no-load, higher 12b-1 fee classes designed specifically for retirement plans. The Board noted that the total expense ratio of Class C was above the competitive median primarily because of its 12b-1 fees. The Board noted that, although Class I is categorized by Lipper as an institutional class, Class I has a significantly lower investment minimum than most other funds and classes categorized as institutional. As a result, FMR believes that Class I is generally more comparable to retail funds and classes. The Board considered that, when compared to retail funds and classes, Class I would not be above the competitive median for 2016. The Board noted that the fund offers multiple classes, each of which has a different sales load and 12b-1 fee structure, and that the multiple structures are intended to offer a range of pricing options for the intermediary market. The Board also noted that the total expense ratios of the classes vary primarily by the level of their 12b-1 fees, although differences in transfer agent fees may also cause expenses to vary from class to class.
Fees Charged to Other Fidelity Clients. The Board also considered Fidelity fee structures and other information with respect to clients of Fidelity, such as other funds advised or subadvised by Fidelity, pension plan clients, and other institutional clients with similar mandates. The Board noted that an ad hoc joint committee created by it and the boards of other Fidelity funds periodically (most recently in 2013) reviews and compares Fidelity's institutional investment advisory business with its business of providing services to the Fidelity funds, including the differences in services provided, fees charged, and costs incurred, as well as competition in their respective marketplaces.
Based on its review of total expense ratios and fees charged to other Fidelity clients, the Board concluded that, although some classes were above the median of the universe presented for comparison, the total expense ratio of each class of the fund was reasonable in light of the services that the fund and its shareholders receive and the other factors considered.
Costs of the Services and Profitability. The Board considered the revenues earned and the expenses incurred by Fidelity in conducting the business of developing, marketing, distributing, managing, administering and servicing the fund and servicing the fund's shareholders. The Board also considered the level of Fidelity's profits in respect of all the Fidelity funds.
On an annual basis, Fidelity presents to the Board information about the profitability of its relationships with the fund. Fidelity calculates profitability information for each fund, as well as aggregate profitability information for groups of Fidelity funds and all Fidelity funds, using a series of detailed revenue and cost allocation methodologies which originate with the books and records of Fidelity on which Fidelity's audited financial statements are based. The Audit Committee of the Board reviews any significant changes from the prior year's methodologies.
PricewaterhouseCoopers LLP (PwC), independent registered public accounting firm and auditor to Fidelity and certain Fidelity funds, has been engaged annually by the Board as part of the Board's assessment of Fidelity's profitability analysis. PwC's engagement includes the review and assessment of the methodologies used by Fidelity in determining the revenues and expenses attributable to Fidelity's mutual fund business, and completion of agreed-upon procedures in respect of the mathematical accuracy of the fund profitability information and its conformity to established allocation methodologies. After considering PwC's reports issued under the engagement and information provided by Fidelity, the Board concluded that while other allocation methods may also be reasonable, Fidelity's profitability methodologies are reasonable in all material respects.
The Board also reviewed Fidelity's non-fund businesses and potential fall-out benefits related to the mutual fund business as well as cases where Fidelity's affiliates may benefit from or be related to the fund's business.
The Board considered the costs of the services provided by and the profits realized by Fidelity in connection with the operation of the fund and was satisfied that the profitability was not excessive.
Economies of Scale. The Board considered whether there have been economies of scale in respect of the management of the Fidelity funds, whether the Fidelity funds (including the fund) have appropriately benefited from any such economies of scale, and whether there is potential for realization of any further economies of scale. The Board considered the extent to which the fund will benefit from economies of scale as assets grow through increased services to the fund, through waivers or reimbursements, or through fee or expense ratio reductions. The Board also noted that a committee (the Economies of Scale Committee) created by it and the boards of other Fidelity funds periodically (most recently in 2013) analyzes whether Fidelity attains economies of scale in respect of the management and servicing of the Fidelity funds, whether the Fidelity funds have appropriately benefited from such economies of scale, and whether there is potential for realization of any further economies of scale.
The Board recognized that the fund's management contract incorporates a "group fee" structure, which provides for lower group fee rates as total group assets increase, and for higher group fee rates as total group assets decrease (with "group assets" defined to include fund assets under FMR's management plus the assets of sector funds previously under FMR's management). FMR calculates the group fee rates based on a tiered asset "breakpoint" schedule that varies based on asset class. The Board considered that the group fee is designed to deliver the benefits of economies of scale to fund shareholders when total Fidelity fund assets increase, even if assets of any particular fund are unchanged or have declined, because some portion of Fidelity's costs are attributable to services provided to all Fidelity funds, and all funds benefit if those costs can be allocated among more assets. The Board concluded that, given the group fee structure, fund shareholders will benefit from lower management fees as group assets increase at the fund complex level, regardless of whether Fidelity achieves any such economies of scale.
The Board concluded, taking into account the analysis of the Economies of Scale Committee, that economies of scale, if any, are being appropriately shared between fund shareholders and Fidelity.
Additional Information Requested by the Board. In order to develop fully the factual basis for consideration of the Fidelity funds' advisory contracts, the Board requested and received additional information on certain topics, including: (i) fund performance trends, in particular the underperformance of certain funds, and Fidelity's long-term strategies for certain funds; (ii) Fidelity's fund profitability methodology, profitability trends for certain funds, and the impact of certain factors on fund profitability results, including the impact of market trends on actively managed funds; (iii) the use of performance fees and the calculation of performance adjustments, including the impact of underperformance and fund outflows on performance adjustments; (iv) metrics for evaluating index fund performance; (v) Fidelity's group fee structure, including the group fee breakpoint schedules; (vi) the terms of Fidelity's contractual and voluntary expense cap arrangements with the funds; (vii) the methodology with respect to evaluating competitive fund data and peer group classifications and fee comparisons; (viii) the expense structures for different funds and classes; (ix) Fidelity's arrangements with affiliated sub-advisers on behalf of the funds; (x) information regarding other accounts managed by Fidelity, including institutional accounts and collective investment trusts; (xi) recent changes to the fee structure for certain funds of funds; and (xii) the impact of the Department of Labor's new fiduciary rule on the funds' comparative expense information.
Based on its evaluation of all of the conclusions noted above, and after considering all factors it believed relevant, the Board concluded that the advisory fee structures are fair and reasonable, and that the fund's Advisory Contracts should be renewed.
Corporate Headquarters
245 Summer St.
Boston, MA 02210
www.fidelity.com
ISC-ANN-1217
1.793585.114
Fidelity® Global Equity Income Fund
Annual Report October 31, 2017 |
|
Contents
To view a fund's proxy voting guidelines and proxy voting record for the 12-month period ended June 30, visit http://www.fidelity.com/proxyvotingresults or visit the Securities and Exchange Commission's (SEC) web site at http://www.sec.gov.
You may also call 1-800-544-8544 to request a free copy of the proxy voting guidelines.
Standard & Poor's, S&P and S&P 500 are registered service marks of The McGraw-Hill Companies, Inc. and have been licensed for use by Fidelity Distributors Corporation.
Other third-party marks appearing herein are the property of their respective owners.
All other marks appearing herein are registered or unregistered trademarks or service marks of FMR LLC or an affiliated company. © 2017 FMR LLC. All rights reserved.
This report and the financial statements contained herein are submitted for the general information of the shareholders of the Fund. This report is not authorized for distribution to prospective investors in the Fund unless preceded or accompanied by an effective prospectus.
A fund files its complete schedule of portfolio holdings with the SEC for the first and third quarters of each fiscal year on Form N-Q. Forms N-Q are available on the SEC’s web site at http://www.sec.gov. A fund's Forms N-Q may be reviewed and copied at the SEC’s Public Reference Room in Washington, DC. Information regarding the operation of the SEC's Public Reference Room may be obtained by calling 1-800-SEC-0330.
For a complete list of a fund's portfolio holdings, view the most recent holdings listing, semiannual report, or annual report on Fidelity's web site at http://www.fidelity.com, http://www.institutional.fidelity.com, or http://www.401k.com, as applicable.
NOT FDIC INSURED •MAY LOSE VALUE •NO BANK GUARANTEE
Neither the Fund nor Fidelity Distributors Corporation is a bank.
Performance: The Bottom Line
Average annual total return reflects the change in the value of an investment, assuming reinvestment of distributions from dividend income and capital gains (the profits earned upon the sale of securities that have grown in value, if any) and assuming a constant rate of performance each year. The hypothetical investment and the average annual total returns do not reflect the deduction of taxes that a shareholder would pay on fund distributions or the redemption of fund shares. During periods of reimbursement by Fidelity, a fund’s total return will be greater than it would be had the reimbursement not occurred. How a fund did yesterday is no guarantee of how it will do tomorrow.
Average Annual Total Returns
| For the periods ended October 31, 2017 | Past 1 year | Past 5 years | Life of fundA |
| Fidelity® Global Equity Income Fund | 19.31% | 11.13% | 10.51% |
A From May 2, 2012
$10,000 Over Life of Fund
Let's say hypothetically that $10,000 was invested in Fidelity® Global Equity Income Fund on May 2, 2012, when the fund started.
The chart shows how the value of your investment would have changed, and also shows how the MSCI ACWI (All Country World Index) Index performed over the same period.
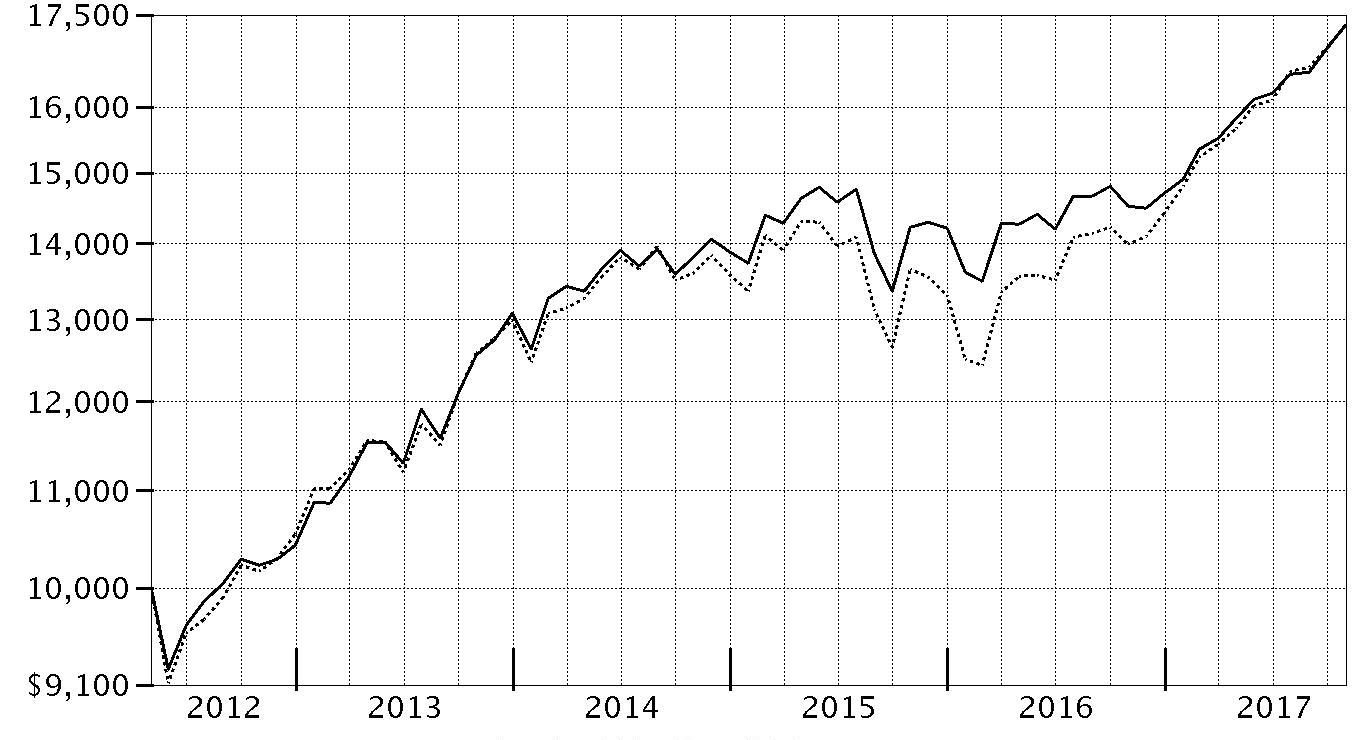
| Period Ending Values |
| $17,330 | Fidelity® Global Equity Income Fund |
| $17,310 | MSCI ACWI (All Country World Index) Index |
Management's Discussion of Fund Performance
Market Recap: The MSCI ACWI (All Country World Index) Index returned 23.70% for the 12 months ending October 31, 2017, helped partly by a generally weak U.S. dollar. Favorable election results in continental Europe (+30%) suggested ebbing political uncertainty and near-term risk there, but the U.K. (+20%) faced more-mixed conditions ahead of its expected exit from the European Union. Despite central-bank easing – and pressured recently by yen strength – Japan (+18%) lagged the rest of the Asia-Pacific group (+23%). Commodity-price volatility slowed Canada (+17%), but the emerging-markets group (+26%) sped ahead. The U.S. (+23%) finished close to the index result. Sector-wise, information technology (+41%) was driven by a surge among several U.S. and Chinese internet-related names. Financials (+31%) rode rising interest rates that, at the same time, weighed on real estate (+13%) as well as utilities (+15%), consumer staples (+9%) and telecommunication services (+5%) – so-called “bond proxy” sectors. Materials (+28%) and industrials (+26%) responded to demand from China and price gains for certain commodities. In the energy sector (+10%), oil prices lost ground in the spring before rebounding through October 31 to end well above where they started 12 months ago. Lastly, health care (+20%) was hurt by early-period turmoil around drug pricing and health care legislation.
Comments from Portfolio Manager Ramona Persaud: For the year, the fund’s Retail Class shares returned 19.31%, underperforming the 23.70% return of the benchmark MSCI ACWI (All Country World Index) Index. An unhelpful investment in Teva Pharmaceutical Industries, which suffered as the company continued to integrate its 2016 acquisition of Actavis’ generics business, and due to concerns about the environment for drug prices, weighed on relative results. The fund's cash position of about 4% of assets also hurt relative results in a strong market. Molson Coors Brewing – maker of its namesake branded beers, as well as several others – also detracted notably. The stock returned about -21%, hurt by lower-than-expected quarterly profits, competitive pressures, weak sales-volume trends and some currency headwinds. Conversely, Bank of America (+69%) and JPMorgan Chase (+49%) each were among the fund’s largest contributors. These stocks outperformed on expectations that business-friendly policies forwarded by the new U.S. administration would lead to higher interest rates and, therefore, stronger bank profits.
The views expressed above reflect those of the portfolio manager(s) only through the end of the period as stated on the cover of this report and do not necessarily represent the views of Fidelity or any other person in the Fidelity organization. Any such views are subject to change at any time based upon market or other conditions and Fidelity disclaims any responsibility to update such views. These views may not be relied on as investment advice and, because investment decisions for a Fidelity fund are based on numerous factors, may not be relied on as an indication of trading intent on behalf of any Fidelity fund.
Investment Summary (Unaudited)
Geographic Diversification (% of fund's net assets)
| As of October 31, 2017 |
| | United States of America* | 45.6% |
| | United Kingdom | 12.2% |
| | Japan | 8.8% |
| | Canada | 5.1% |
| | Netherlands | 3.8% |
| | Switzerland | 2.8% |
| | Ireland | 2.7% |
| | Germany | 2.0% |
| | France | 1.8% |
| | Other | 15.2% |
* Includes Short-Term investments and Net Other Assets (Liabilities).
Percentages are based on country or territory of incorporation and are adjusted for the effect of futures contracts, if applicable.
| As of April 30, 2017 |
| | United States of America* | 47.7% |
| | United Kingdom | 10.0% |
| | Japan | 9.5% |
| | Canada | 4.3% |
| | Ireland | 3.4% |
| | Netherlands | 2.8% |
| | Switzerland | 2.4% |
| | Germany | 2.4% |
| | Israel | 1.9% |
| | Other | 15.6% |

* Includes Short-Term investments and Net Other Assets (Liabilities).
Percentages are based on country or territory of incorporation and are adjusted for the effect of futures contracts, if applicable.
Asset Allocation as of October 31, 2017
| | % of fund's net assets | % of fund's net assets 6 months ago |
| Stocks | 96.8 | 94.4 |
| Short-Term Investments and Net Other Assets (Liabilities) | 3.2 | 5.6 |
Top Ten Stocks as of October 31, 2017
| | % of fund's net assets | % of fund's net assets 6 months ago |
| Apple, Inc. (United States of America, Technology Hardware, Storage & Peripherals) | 3.1 | 2.9 |
| Micro Focus International PLC (United Kingdom, Software) | 2.3 | 2.2 |
| Microsoft Corp. (United States of America, Software) | 2.2 | 1.9 |
| Chevron Corp. (United States of America, Oil, Gas & Consumable Fuels) | 2.1 | 2.0 |
| JPMorgan Chase & Co. (United States of America, Banks) | 1.9 | 1.8 |
| British American Tobacco PLC (United Kingdom) (United Kingdom, Tobacco) | 1.8 | 1.5 |
| Bank of America Corp. (United States of America, Banks) | 1.8 | 1.8 |
| Suncor Energy, Inc. (Canada, Oil, Gas & Consumable Fuels) | 1.8 | 1.7 |
| Amgen, Inc. (United States of America, Biotechnology) | 1.7 | 1.5 |
| Unilever NV (Certificaten Van Aandelen) (Bearer) (Netherlands, Personal Products) | 1.7 | 1.1 |
| | 20.4 | |
Top Market Sectors as of October 31, 2017
| | % of fund's net assets | % of fund's net assets 6 months ago |
| Financials | 15.9 | 17.7 |
| Consumer Staples | 15.8 | 13.9 |
| Information Technology | 15.6 | 16.3 |
| Health Care | 12.9 | 12.4 |
| Consumer Discretionary | 9.2 | 10.6 |
| Energy | 8.9 | 7.4 |
| Industrials | 8.6 | 7.6 |
| Materials | 4.1 | 3.6 |
| Telecommunication Services | 3.7 | 3.1 |
| Real Estate | 1.6 | 1.8 |
Investments October 31, 2017
Showing Percentage of Net Assets
| Common Stocks - 96.1% | | | |
| | | Shares | Value |
| Austria - 0.3% | | | |
| Andritz AG | | 3,700 | $209,205 |
| Bailiwick of Jersey - 1.1% | | | |
| Wolseley PLC | | 12,146 | 849,335 |
| Belgium - 1.7% | | | |
| Anheuser-Busch InBev SA NV | | 6,500 | 797,038 |
| KBC Groep NV | | 6,461 | 536,686 |
|
| TOTAL BELGIUM | | | 1,333,724 |
|
| Bermuda - 0.4% | | | |
| Hiscox Ltd. | | 4,600 | 87,244 |
| IHS Markit Ltd. (a) | | 5,000 | 213,050 |
|
| TOTAL BERMUDA | | | 300,294 |
|
| Canada - 5.1% | | | |
| Alimentation Couche-Tard, Inc. Class B (sub. vtg.) | | 7,200 | 337,592 |
| Constellation Software, Inc. | | 1,300 | 739,612 |
| Fairfax Financial Holdings Ltd. (sub. vtg.) | | 541 | 284,909 |
| Hydro One Ltd. | | 22,900 | 404,890 |
| Imperial Oil Ltd. | | 22,800 | 739,264 |
| PrairieSky Royalty Ltd. | | 5,100 | 135,752 |
| Suncor Energy, Inc. | | 42,500 | 1,442,911 |
|
| TOTAL CANADA | | | 4,084,930 |
|
| Cayman Islands - 0.8% | | | |
| Best Pacific International Holdings Ltd. | | 138,000 | 79,955 |
| SITC International Holdings Co. Ltd. | | 551,000 | 531,125 |
|
| TOTAL CAYMAN ISLANDS | | | 611,080 |
|
| Chile - 0.5% | | | |
| Vina San Pedro SA | | 37,219,054 | 415,202 |
| China - 0.3% | | | |
| Shanghai International Airport Co. Ltd. (A Shares) | | 37,168 | 245,083 |
| France - 1.8% | | | |
| Cegedim SA (a) | | 6,000 | 233,436 |
| Compagnie de St. Gobain | | 7,000 | 410,633 |
| Maisons du Monde SA | | 6,400 | 276,955 |
| VINCI SA | | 5,700 | 558,062 |
|
| TOTAL FRANCE | | | 1,479,086 |
|
| Germany - 2.0% | | | |
| adidas AG | | 1,131 | 251,698 |
| AURELIUS AG (b) | | 3,399 | 207,983 |
| Deutsche Post AG | | 6,809 | 311,865 |
| SAP SE | | 7,519 | 859,141 |
|
| TOTAL GERMANY | | | 1,630,687 |
|
| Hong Kong - 1.0% | | | |
| Techtronic Industries Co. Ltd. | | 140,500 | 823,939 |
| India - 0.1% | | | |
| Bharat Petroleum Corp. Ltd. | | 10,137 | 84,791 |
| Ireland - 2.7% | | | |
| Accenture PLC Class A | | 7,640 | 1,087,630 |
| Allergan PLC | | 2,100 | 372,183 |
| Medtronic PLC | | 6,800 | 547,536 |
| Paddy Power Betfair PLC (Ireland) | | 1,400 | 143,183 |
|
| TOTAL IRELAND | | | 2,150,532 |
|
| Isle of Man - 0.5% | | | |
| Playtech Ltd. | | 32,778 | 428,376 |
| Israel - 0.4% | | | |
| Teva Pharmaceutical Industries Ltd. sponsored ADR | | 22,450 | 309,810 |
| Italy - 0.4% | | | |
| Prada SpA | | 103,200 | 357,167 |
| Japan - 8.8% | | | |
| A/S One Corp. | | 11,200 | 615,750 |
| Aucnet, Inc. | | 9,500 | 125,632 |
| Bridgestone Corp. | | 5,500 | 262,737 |
| Broadleaf Co. Ltd. | | 21,600 | 177,340 |
| Daiichikosho Co. Ltd. | | 21,800 | 1,027,274 |
| Hoya Corp. | | 16,400 | 891,024 |
| Inaba Denki Sangyo Co. Ltd. | | 8,000 | 351,168 |
| Japan Meat Co. Ltd. | | 18,600 | 297,519 |
| KDDI Corp. | | 20,900 | 556,831 |
| Morinaga & Co. Ltd. | | 7,300 | 414,711 |
| Nippon Telegraph & Telephone Corp. | | 13,100 | 633,353 |
| Olympus Corp. | | 11,000 | 409,361 |
| Recruit Holdings Co. Ltd. | | 13,100 | 321,181 |
| Sacs Bar Holdings, Inc. | | 3,500 | 42,655 |
| Sony Corp. | | 11,700 | 489,466 |
| Tsuruha Holdings, Inc. | | 3,800 | 471,134 |
|
| TOTAL JAPAN | | | 7,087,136 |
|
| Kenya - 0.5% | | | |
| Safaricom Ltd. | | 1,783,700 | 438,403 |
| Korea (South) - 0.6% | | | |
| Coway Co. Ltd. | | 2,626 | 228,523 |
| KB Financial Group, Inc. | | 5,095 | 266,927 |
|
| TOTAL KOREA (SOUTH) | | | 495,450 |
|
| Luxembourg - 0.8% | | | |
| B&M European Value Retail S.A. | | 124,446 | 656,669 |
| Multi-National - 0.5% | | | |
| HKT Trust/HKT Ltd. unit | | 351,600 | 429,506 |
| Netherlands - 3.8% | | | |
| Koninklijke Philips Electronics NV | | 17,454 | 711,302 |
| LyondellBasell Industries NV Class A | | 9,900 | 1,024,947 |
| Unilever NV (Certificaten Van Aandelen) (Bearer) | | 23,235 | 1,349,720 |
|
| TOTAL NETHERLANDS | | | 3,085,969 |
|
| Norway - 0.6% | | | |
| Statoil ASA (b) | | 25,256 | 513,139 |
| South Africa - 0.2% | | | |
| EOH Holdings Ltd. | | 26,000 | 193,840 |
| Spain - 1.0% | | | |
| Amadeus IT Holding SA Class A | | 6,800 | 461,397 |
| Prosegur Cash SA | | 112,800 | 367,906 |
|
| TOTAL SPAIN | | | 829,303 |
|
| Sweden - 1.2% | | | |
| Essity AB Class B | | 15,000 | 448,478 |
| Loomis AB (B Shares) | | 13,000 | 521,606 |
|
| TOTAL SWEDEN | | | 970,084 |
|
| Switzerland - 2.8% | | | |
| Banque Cantonale Vaudoise | | 570 | 409,938 |
| Chubb Ltd. | | 4,300 | 648,526 |
| Nestle SA (Reg. S) | | 14,447 | 1,215,549 |
|
| TOTAL SWITZERLAND | | | 2,274,013 |
|
| Taiwan - 1.6% | | | |
| Taiwan Semiconductor Manufacturing Co. Ltd. | | 149,000 | 1,205,421 |
| United Microelectronics Corp. | | 194,000 | 100,196 |
|
| TOTAL TAIWAN | | | 1,305,617 |
|
| United Kingdom - 12.2% | | | |
| Ashtead Group PLC | | 8,800 | 226,742 |
| AstraZeneca PLC sponsored ADR | | 8,500 | 293,250 |
| BAE Systems PLC | | 44,209 | 348,249 |
| Booker Group PLC | | 268,100 | 716,427 |
| British American Tobacco PLC (United Kingdom) | | 22,878 | 1,478,144 |
| Cineworld Group PLC | | 15,000 | 132,383 |
| Conviviality PLC | | 60,100 | 339,442 |
| GlaxoSmithKline PLC | | 62,275 | 1,117,671 |
| Hastings Group Holdings PLC | | 29,064 | 121,633 |
| Hilton Food Group PLC | | 58,600 | 694,240 |
| Imperial Tobacco Group PLC | | 9,577 | 390,558 |
| ITV PLC | | 123,026 | 268,788 |
| Jiangsu Yanghe Brewery JSC Ltd. ELS (UBS Warrant Programme) warrants 10/22/18 (a)(c) | | 7,672 | 127,472 |
| John Wood Group PLC | | 25,000 | 236,245 |
| Mears Group PLC | | 25,900 | 155,914 |
| Micro Focus International PLC | | 52,058 | 1,828,775 |
| Moneysupermarket.com Group PLC | | 102,744 | 443,357 |
| St. James's Place Capital PLC | | 31,221 | 488,057 |
| Victrex PLC | | 15,400 | 490,475 |
|
| TOTAL UNITED KINGDOM | | | 9,897,822 |
|
| United States of America - 42.4% | | | |
| American Tower Corp. | | 8,760 | 1,258,549 |
| AMETEK, Inc. | | 12,900 | 870,621 |
| Amgen, Inc. | | 7,920 | 1,387,742 |
| Apple, Inc. | | 14,650 | 2,476,439 |
| AutoZone, Inc. (a) | | 800 | 471,600 |
| Ball Corp. | | 7,800 | 334,854 |
| Bank of America Corp. | | 53,380 | 1,462,078 |
| Becton, Dickinson & Co. | | 2,500 | 521,675 |
| Bristol-Myers Squibb Co. | | 6,100 | 376,126 |
| Capital One Financial Corp. | | 5,600 | 516,208 |
| Caterpillar, Inc. | | 2,400 | 325,920 |
| Cedar Fair LP (depositary unit) | | 4,100 | 256,660 |
| Charter Communications, Inc. Class A (a) | | 1,000 | 334,170 |
| Chevron Corp. | | 14,465 | 1,676,349 |
| Citigroup, Inc. | | 14,300 | 1,051,050 |
| Comcast Corp. Class A | | 18,700 | 673,761 |
| ConocoPhillips Co. | | 21,600 | 1,104,840 |
| Danaher Corp. | | 6,000 | 553,620 |
| Deluxe Corp. | | 1,700 | 118,405 |
| Diamond Hill Investment Group, Inc. | | 2,100 | 445,053 |
| DowDuPont, Inc. | | 10,640 | 769,378 |
| Dr. Pepper Snapple Group, Inc. | | 4,841 | 414,680 |
| Exxon Mobil Corp. | | 11,030 | 919,351 |
| Fortive Corp. | | 4,200 | 303,492 |
| Johnson & Johnson | | 9,600 | 1,338,336 |
| JPMorgan Chase & Co. | | 15,630 | 1,572,534 |
| L Brands, Inc. | | 8,800 | 378,752 |
| Microsoft Corp. | | 21,664 | 1,802,012 |
| Molson Coors Brewing Co. Class B | | 8,200 | 663,134 |
| Monsanto Co. | | 3,200 | 387,520 |
| MSCI, Inc. | | 5,500 | 645,480 |
| PepsiCo, Inc. | | 6,300 | 694,449 |
| Phillips 66 Co. | | 3,500 | 318,780 |
| PPG Industries, Inc. | | 2,700 | 313,848 |
| Procter & Gamble Co. | | 8,159 | 704,448 |
| Qualcomm, Inc. | | 6,100 | 311,161 |
| S&P Global, Inc. | | 4,340 | 679,080 |
| SunTrust Banks, Inc. | | 13,600 | 818,856 |
| The Coca-Cola Co. | | 16,400 | 754,072 |
| The J.M. Smucker Co. | | 2,500 | 265,125 |
| Total System Services, Inc. | | 5,700 | 410,685 |
| U.S. Bancorp | | 17,580 | 956,000 |
| Verizon Communications, Inc. | | 21,000 | 1,005,270 |
| VF Corp. | | 5,800 | 403,970 |
| Wells Fargo & Co. | | 23,757 | 1,333,718 |
|
| TOTAL UNITED STATES OF AMERICA | | | 34,379,851 |
|
| TOTAL COMMON STOCKS | | | |
| (Cost $61,663,616) | | | 77,870,043 |
|
| Nonconvertible Preferred Stocks - 0.7% | | | |
| Spain - 0.7% | | | |
| Grifols SA Class B | | | |
| (Cost $420,916) | | 25,200 | 591,891 |
| | | Principal Amount(d) | Value |
|
| Nonconvertible Bonds - 0.0% | | | |
| Canada - 0.0% | | | |
| Constellation Software, Inc. Canada Consumer Price Index + 6.500% 7.9% 3/31/40(e)(f) | | | |
| (Cost $2,060) | | CAD 2,400 | 2,158 |
| | | Shares | Value |
|
| Money Market Funds - 3.9% | | | |
| Fidelity Cash Central Fund, 1.10%(g) | | 2,415,202 | 2,415,685 |
| Fidelity Securities Lending Cash Central Fund 1.11%(g)(h) | | 700,227 | 700,297 |
| TOTAL MONEY MARKET FUNDS | | | |
| (Cost $3,115,924) | | | 3,115,982 |
| TOTAL INVESTMENT IN SECURITIES - 100.7% | | | |
| (Cost $65,202,516) | | | 81,580,074 |
| NET OTHER ASSETS (LIABILITIES) - (0.7)% | | | (573,544) |
| NET ASSETS - 100% | | | $81,006,530 |
Currency Abbreviations
CAD – Canadian dollar
Security Type Abbreviations
ELS – Equity-Linked Security
Categorizations in the Schedule of Investments are based on country or territory of incorporation.
Legend
(a) Non-income producing
(b) Security or a portion of the security is on loan at period end.
(c) Security exempt from registration under Rule 144A of the Securities Act of 1933. These securities may be resold in transactions exempt from registration, normally to qualified institutional buyers. At the end of the period, the value of these securities amounted to $127,472 or 0.2% of net assets.
(d) Amount is stated in United States dollars unless otherwise noted.
(e) Coupon rates for floating and adjustable rate securities reflect the rates in effect at period end.
(f) Coupon is indexed to a floating interest rate which may be multiplied by a specified factor and/or subject to caps or floors.
(g) Affiliated fund that is generally available only to investment companies and other accounts managed by Fidelity Investments. The rate quoted is the annualized seven-day yield of the fund at period end. A complete unaudited listing of the fund's holdings as of its most recent quarter end is available upon request. In addition, each Fidelity Central Fund's financial statements, which are not covered by the Fund's Report of Independent Registered Public Accounting Firm, are available on the SEC's website or upon request.
(h) Investment made with cash collateral received from securities on loan.
Affiliated Central Funds
Information regarding fiscal year to date income earned by the Fund from investments in Fidelity Central Funds is as follows:
| Fund | Income earned |
| Fidelity Cash Central Fund | $22,849 |
| Fidelity Securities Lending Cash Central Fund | 6,356 |
| Total | $29,205 |
Investment Valuation
The following is a summary of the inputs used, as of October 31, 2017, involving the Fund's assets and liabilities carried at fair value. The inputs or methodology used for valuing securities may not be an indication of the risk associated with investing in those securities. For more information on valuation inputs, and their aggregation into the levels used below, please refer to the Investment Valuation section in the accompanying Notes to Financial Statements.
| | Valuation Inputs at Reporting Date: |
| Description | Total | Level 1 | Level 2 | Level 3 |
| Investments in Securities: | | | | |
| Equities: | | | | |
| Consumer Discretionary | $7,560,305 | $5,738,173 | $1,822,132 | $-- |
| Consumer Staples | 12,861,662 | 6,837,847 | 6,023,815 | -- |
| Energy | 7,171,422 | 6,658,283 | 513,139 | -- |
| Financials | 13,027,338 | 12,632,939 | 394,399 | -- |
| Health Care | 10,270,713 | 5,933,714 | 4,336,999 | -- |
| Industrials | 6,871,656 | 5,851,058 | 1,020,598 | -- |
| Information Technology | 12,651,014 | 10,183,284 | 2,467,730 | -- |
| Materials | 3,321,022 | 3,321,022 | -- | -- |
| Real Estate | 1,258,549 | 1,258,549 | -- | -- |
| Telecommunication Services | 3,063,363 | 1,873,179 | 1,190,184 | -- |
| Utilities | 404,890 | 404,890 | -- | -- |
| Corporate Bonds | 2,158 | -- | 2,158 | -- |
| Money Market Funds | 3,115,982 | 3,115,982 | -- | -- |
| Total Investments in Securities: | $81,580,074 | $63,808,920 | $17,771,154 | $-- |
The following is a summary of transfers between Level 1 and Level 2 for the period ended October 31, 2017. Transfers are assumed to have occurred at the beginning of the period, and are primarily attributable to the valuation techniques used for foreign equity securities, as discussed in the accompanying Notes to Financial Statements:
| Transfers | Total |
| Level 1 to Level 2 | $4,944,624 |
| Level 2 to Level 1 | $837,899 |
See accompanying notes which are an integral part of the financial statements.
Financial Statements
Statement of Assets and Liabilities
| | | October 31, 2017 |
| Assets | | |
Investment in securities, at value (including securities loaned of $658,371) — See accompanying schedule:
Unaffiliated issuers (cost $62,086,592) | $78,464,092 | |
| Fidelity Central Funds (cost $3,115,924) | 3,115,982 | |
| Total Investment in Securities (cost $65,202,516) | | $81,580,074 |
| Cash | | 36,780 |
| Receivable for fund shares sold | | 68,998 |
| Dividends receivable | | 154,076 |
| Interest receivable | | 13 |
| Distributions receivable from Fidelity Central Funds | | 2,817 |
| Prepaid expenses | | 175 |
| Other receivables | | 545 |
| Total assets | | 81,843,478 |
| Liabilities | | |
| Payable for fund shares redeemed | $18,152 | |
| Accrued management fee | 46,327 | |
| Audit fee payable | 43,680 | |
| Other affiliated payables | 15,861 | |
| Other payables and accrued expenses | 12,553 | |
| Collateral on securities loaned | 700,375 | |
| Total liabilities | | 836,948 |
| Net Assets | | $81,006,530 |
| Net Assets consist of: | | |
| Paid in capital | | $63,695,364 |
| Undistributed net investment income | | 66,533 |
| Accumulated undistributed net realized gain (loss) on investments and foreign currency transactions | | 867,492 |
| Net unrealized appreciation (depreciation) on investments and assets and liabilities in foreign currencies | | 16,377,141 |
| Net Assets, for 5,699,072 shares outstanding | | $81,006,530 |
| Net Asset Value, offering price and redemption price per share ($81,006,530 ÷ 5,699,072 shares) | | $14.21 |
See accompanying notes which are an integral part of the financial statements.
Statement of Operations
| | | Year ended October 31, 2017 |
| Investment Income | | |
| Dividends | | $1,903,692 |
| Interest | | 252 |
| Income from Fidelity Central Funds | | 29,205 |
| Income before foreign taxes withheld | | 1,933,149 |
| Less foreign taxes withheld | | (100,047) |
| Total income | | 1,833,102 |
| Expenses | | |
| Management fee | $525,706 | |
| Transfer agent fees | 179,827 | |
| Accounting and security lending fees | 39,203 | |
| Custodian fees and expenses | 18,978 | |
| Independent trustees' fees and expenses | 299 | |
| Registration fees | 23,350 | |
| Audit | 70,352 | |
| Legal | 190 | |
| Miscellaneous | 666 | |
| Total expenses before reductions | 858,571 | |
| Expense reductions | (2,612) | 855,959 |
| Net investment income (loss) | | 977,143 |
| Realized and Unrealized Gain (Loss) | | |
| Net realized gain (loss) on: | | |
| Investment securities: | | |
| Unaffiliated issuers | 2,291,235 | |
| Fidelity Central Funds | (73) | |
| Foreign currency transactions | (11,426) | |
| Total net realized gain (loss) | | 2,279,736 |
| Change in net unrealized appreciation (depreciation) on: | | |
| Unaffiliated issuers (net of increase in deferred foreign taxes of $1,361) | 10,154,755 | |
| Fidelity Central Funds | (303) | |
| Assets and liabilities in foreign currencies | 5,673 | |
| Total change in net unrealized appreciation (depreciation) | | 10,160,125 |
| Net gain (loss) | | 12,439,861 |
| Net increase (decrease) in net assets resulting from operations | | $13,417,004 |
See accompanying notes which are an integral part of the financial statements.
Statement of Changes in Net Assets
| | Year ended October 31, 2017 | Year ended October 31, 2016 |
| Increase (Decrease) in Net Assets | | |
| Operations | | |
| Net investment income (loss) | $977,143 | $898,420 |
| Net realized gain (loss) | 2,279,736 | (1,275,087) |
| Change in net unrealized appreciation (depreciation) | 10,160,125 | 1,963,524 |
| Net increase (decrease) in net assets resulting from operations | 13,417,004 | 1,586,857 |
| Distributions to shareholders from net investment income | (949,348) | (921,832) |
| Distributions to shareholders from net realized gain | – | (910,524) |
| Total distributions | (949,348) | (1,832,356) |
| Share transactions | | |
| Proceeds from sales of shares | 22,414,620 | 29,645,365 |
| Reinvestment of distributions | 891,642 | 1,694,504 |
| Cost of shares redeemed | (26,444,504) | (27,349,989) |
| Net increase (decrease) in net assets resulting from share transactions | (3,138,242) | 3,989,880 |
| Redemption fees | 2,427 | 4,736 |
| Total increase (decrease) in net assets | 9,331,841 | 3,749,117 |
| Net Assets | | |
| Beginning of period | 71,674,689 | 67,925,572 |
| End of period | $81,006,530 | $71,674,689 |
| Other Information | | |
| Undistributed net investment income end of period | $66,533 | $66,681 |
| Shares | | |
| Sold | 1,724,355 | 2,505,409 |
| Issued in reinvestment of distributions | 67,744 | 141,047 |
| Redeemed | (2,036,720) | (2,305,213) |
| Net increase (decrease) | (244,621) | 341,243 |
See accompanying notes which are an integral part of the financial statements.
Financial Highlights
Fidelity Global Equity Income Fund
| Years ended October 31, | 2017 | 2016 | 2015 | 2014 | 2013 |
| Selected Per–Share Data | | | | | |
| Net asset value, beginning of period | $12.06 | $12.12 | $12.87 | $12.20 | $10.16 |
| Income from Investment Operations | | | | | |
| Net investment income (loss)A | .17 | .15 | .16 | .28B | .22 |
| Net realized and unrealized gain (loss) | 2.15 | .11 | .21 | .92 | 2.06 |
| Total from investment operations | 2.32 | .26 | .37 | 1.20 | 2.28 |
| Distributions from net investment income | (.17) | (.15) | (.16) | (.25) | (.21) |
| Distributions from net realized gain | – | (.16) | (.95) | (.28) | (.03) |
| Total distributions | (.17) | (.32)C | (1.12)D | (.53) | (.24) |
| Redemption fees added to paid in capitalA,E | – | – | – | – | – |
| Net asset value, end of period | $14.21 | $12.06 | $12.12 | $12.87 | $12.20 |
| Total ReturnF | 19.31% | 2.13% | 2.93% | 10.10% | 22.73% |
| Ratios to Average Net AssetsG,H | | | | | |
| Expenses before reductions | 1.13% | 1.18% | 1.15% | 1.16% | 1.28% |
| Expenses net of fee waivers, if any | 1.13% | 1.18% | 1.15% | 1.16% | 1.20% |
| Expenses net of all reductions | 1.13% | 1.18% | 1.14% | 1.16% | 1.19% |
| Net investment income (loss) | 1.29% | 1.24% | 1.27% | 2.21%E | 1.94% |
| Supplemental Data | | | | | |
| Net assets, end of period (000 omitted) | $81,007 | $71,675 | $67,926 | $52,038 | $42,271 |
| Portfolio turnover rateI | 37% | 40% | 64% | 92% | 66% |
A Calculated based on average shares outstanding during the period.
B Net Investment income per share reflects a large, non-recurring dividend which amounted to $.08 per share. Excluding this non-recurring dividend, the ratio of net investment income (loss) to average net assets would have been 1.56%.
C Total distributions of $.32 per share is comprised of distributions from net investment income of $.153 and distributions from net realized gain of $.162 per share.
D Total distributions of $1.12 per share is comprised of distributions from net investment income of $.164 and distributions from net realized gain of $.954 per share.
E Amount represents less than $.005 per share.
F Total returns would have been lower if certain expenses had not been reduced during the applicable periods shown.
G Fees and expenses of any underlying Fidelity Central Funds are not included in the Fund's expense ratio. The Fund indirectly bears its proportionate share of the expenses of any underlying Fidelity Central Funds.
H Expense ratios reflect operating expenses of the Fund. Expenses before reductions do not reflect amounts reimbursed by the investment adviser or reductions from brokerage service arrangements or reductions from other expense offset arrangements and do not represent the amount paid by the Fund during periods when reimbursements or reductions occur. Expenses net of fee waivers reflect expenses after reimbursement by the investment adviser but prior to reductions from brokerage service arrangements or other expense offset arrangements. Expenses net of all reductions represent the net expenses paid by the Fund.
I Amount does not include the portfolio activity of any underlying Fidelity Central Funds.
See accompanying notes which are an integral part of the financial statements.
Notes to Financial Statements
For the period ended October 31, 2017
1. Organization.
Fidelity Global Equity Income Fund (the Fund) is a fund of Fidelity Investment Trust (the Trust) and is authorized to issue an unlimited number of shares. Share transactions on the Statement of Changes in Net Assets may contain exchanges between affiliated funds. The Trust is registered under the Investment Company Act of 1940, as amended (the 1940 Act), as an open-end management investment company organized as a Massachusetts business trust.
2. Investments in Fidelity Central Funds.
The Fund invests in Fidelity Central Funds, which are open-end investment companies generally available only to other investment companies and accounts managed by the investment adviser and its affiliates. The Fund's Schedule of Investments lists each of the Fidelity Central Funds held as of period end, if any, as an investment of the Fund, but does not include the underlying holdings of each Fidelity Central Fund. As an Investing Fund, the Fund indirectly bears its proportionate share of the expenses of the underlying Fidelity Central Funds.
The Money Market Central Funds seek preservation of capital and current income and are managed by Fidelity Investments Money Management, Inc. (FIMM), an affiliate of the investment adviser. Annualized expenses of the Money Market Central Funds as of their most recent shareholder report date are less than .005%.
A complete unaudited list of holdings for each Fidelity Central Fund is available upon request or at the Securities and Exchange Commission (the SEC) website at www.sec.gov. In addition, the financial statements of the Fidelity Central Funds, which are not covered by the Fund's Report of Independent Registered Public Accounting Firm, are available on the SEC website or upon request.
3. Significant Accounting Policies.
The Fund is an investment company and applies the accounting and reporting guidance of the Financial Accounting Standards Board (FASB) Accounting Standards Codification Topic 946 Financial Services – Investments Companies. The financial statements have been prepared in conformity with accounting principles generally accepted in the United States of America (GAAP), which require management to make certain estimates and assumptions at the date of the financial statements. Actual results could differ from those estimates. Subsequent events, if any, through the date that the financial statements were issued have been evaluated in the preparation of the financial statements. The following summarizes the significant accounting policies of the Fund:
Investment Valuation. Investments are valued as of 4:00 p.m. Eastern time on the last calendar day of the period. The Board of Trustees (the Board) has delegated the day to day responsibility for the valuation of the Fund's investments to the Fair Value Committee (the Committee) established by the Fund's investment adviser. In accordance with valuation policies and procedures approved by the Board, the Fund attempts to obtain prices from one or more third party pricing vendors or brokers to value its investments. When current market prices, quotations or currency exchange rates are not readily available or reliable, investments will be fair valued in good faith by the Committee, in accordance with procedures adopted by the Board. Factors used in determining fair value vary by investment type and may include market or investment specific events, changes in interest rates and credit quality. The frequency with which these procedures are used cannot be predicted and they may be utilized to a significant extent. The Committee oversees the Fund's valuation policies and procedures and reports to the Board on the Committee's activities and fair value determinations. The Board monitors the appropriateness of the procedures used in valuing the Fund's investments and ratifies the fair value determinations of the Committee.
The Fund categorizes the inputs to valuation techniques used to value its investments into a disclosure hierarchy consisting of three levels as shown below:
- Level 1 – quoted prices in active markets for identical investments
- Level 2 – other significant observable inputs (including quoted prices for similar investments, interest rates, prepayment speeds, etc.)
- Level 3 – unobservable inputs (including the Fund's own assumptions based on the best information available)
Valuation techniques used to value the Fund's investments by major category are as follows:
Equity securities, including restricted securities, for which market quotations are readily available, are valued at the last reported sale price or official closing price as reported by a third party pricing vendor on the primary market or exchange on which they are traded and are categorized as Level 1 in the hierarchy. In the event there were no sales during the day or closing prices are not available, securities are valued at the last quoted bid price or may be valued using the last available price and are generally categorized as Level 2 in the hierarchy. For foreign equity securities, when market or security specific events arise, comparisons to the valuation of American Depositary Receipts (ADRs), futures contracts, Exchange-Traded Funds (ETFs) and certain indexes as well as quoted prices for similar securities may be used and would be categorized as Level 2 in the hierarchy. Utilizing these techniques may result in transfers between Level 1 and Level 2. For equity securities, including restricted securities, where observable inputs are limited, assumptions about market activity and risk are used and these securities may be categorized as Level 3 in the hierarchy
Debt securities, including restricted securities, are valued based on evaluated prices received from third party pricing vendors or from brokers who make markets in such securities. Corporate bonds are valued by pricing vendors who utilize matrix pricing which considers yield or price of bonds of comparable quality, coupon, maturity and type or by broker-supplied prices. When independent prices are unavailable or unreliable, debt securities may be valued utilizing pricing methodologies which consider similar factors that would be used by third party pricing vendors. Debt securities are generally categorized as Level 2 in the hierarchy but may be Level 3 depending on the circumstances.
Investments in open-end mutual funds, including the Fidelity Central Funds, are valued at their closing net asset value (NAV) each business day and are categorized as Level 1 in the hierarchy.
Changes in valuation techniques may result in transfers in or out of an assigned level within the disclosure hierarchy. The aggregate value of investments by input level as of October 31, 2017, including information on transfers between Levels 1 and 2 is included at the end of the Fund's Schedule of Investments.
Foreign Currency. The Fund may use foreign currency contracts to facilitate transactions in foreign-denominated securities. Gains and losses from these transactions may arise from changes in the value of the foreign currency or if the counterparties do not perform under the contracts' terms.
Foreign-denominated assets, including investment securities, and liabilities are translated into U.S. dollars at the exchange rates at period end. Purchases and sales of investment securities, income and dividends received and expenses denominated in foreign currencies are translated into U.S. dollars at the exchange rate in effect on the transaction date.
The effects of exchange rate fluctuations on investments are included with the net realized and unrealized gain (loss) on investment securities. Other foreign currency transactions resulting in realized and unrealized gain (loss) are disclosed separately.
Investment Transactions and Income. For financial reporting purposes, the Fund's investment holdings and NAV include trades executed through the end of the last business day of the period. The NAV per share for processing shareholder transactions is calculated as of the close of business of the New York Stock Exchange (NYSE), normally 4:00 p.m. Eastern time and includes trades executed through the end of the prior business day. Gains and losses on securities sold are determined on the basis of identified cost and includes proceeds received from litigation. Dividend income is recorded on the ex-dividend date, except for certain dividends from foreign securities where the ex-dividend date may have passed, which are recorded as soon as the Fund is informed of the ex-dividend date. Non-cash dividends included in dividend income, if any, are recorded at the fair market value of the securities received. Income and capital gain distributions from Fidelity Central Funds, if any, are recorded on the ex-dividend date. Certain distributions received by the Fund represent a return of capital or capital gain. The Fund determines the components of these distributions subsequent to the ex-dividend date, based upon receipt of tax filings or other correspondence relating to the underlying investment. These distributions are recorded as a reduction of cost of investments and/or as a realized gain. Interest income is accrued as earned and includes coupon interest and amortization of premium and accretion of discount on debt securities as applicable. Investment income is recorded net of foreign taxes withheld where recovery of such taxes is uncertain.
Expenses. Expenses directly attributable to a fund are charged to that fund. Expenses attributable to more than one fund are allocated among the respective funds on the basis of relative net assets or other appropriate methods. Expense estimates are accrued in the period to which they relate and adjustments are made when actual amounts are known.
Income Tax Information and Distributions to Shareholders. Each year, the Fund intends to qualify as a regulated investment company under Subchapter M of the Internal Revenue Code, including distributing substantially all of its taxable income and realized gains. As a result, no provision for U.S. Federal income taxes is required. As of October 31, 2017, the Fund did not have any unrecognized tax benefits in the financial statements; nor is the Fund aware of any tax positions for which it is reasonably possible that the total amounts of unrecognized tax benefits will significantly change in the next twelve months. The Fund files a U.S. federal tax return, in addition to state and local tax returns as required. The Fund's federal income tax returns are subject to examination by the Internal Revenue Service (IRS) for a period of three fiscal years after they are filed. State and local tax returns may be subject to examination for an additional fiscal year depending on the jurisdiction. Foreign taxes are provided for based on the Fund's understanding of the tax rules and rates that exist in the foreign markets in which it invests. The Fund is subject to a tax imposed on capital gains by certain countries in which it invests. An estimated deferred tax liability for net unrealized appreciation on the applicable securities is included in Other payables and accrued expenses on the Statement of Assets & Liabilities.
Distributions are declared and recorded on the ex-dividend date. Income and capital gain distributions are determined in accordance with income tax regulations, which may differ from GAAP. In addition, the Fund claimed a portion of the payment made to redeeming shareholders as a distribution for income tax purposes.
Capital accounts within the financial statements are adjusted for permanent book-tax differences. These adjustments have no impact on net assets or the results of operations. Capital accounts are not adjusted for temporary book-tax differences which will reverse in a subsequent period.
Book-tax differences are primarily due to foreign currency transactions, passive foreign investment companies (PFIC), partnerships, capital loss carryforwards and losses deferred due to wash sales.
As of period end, the cost and unrealized appreciation (depreciation) in securities, and derivatives if applicable, for federal income tax purposes were as follows:
| Gross unrealized appreciation | $18,562,423 |
| Gross unrealized depreciation | (2,325,193) |
| Net unrealized appreciation (depreciation) | $16,237,230 |
| Tax Cost | $65,342,844 |
The tax-based components of distributable earnings as of period end were as follows:
| Undistributed ordinary income | $66,534 |
| Undistributed long-term capital gain | $1,007,820 |
| Net unrealized appreciation (depreciation) on securities and other investments | $16,238,174 |
The tax character of distributions paid was as follows:
| | October 31, 2017 | October 31, 2016 |
| Ordinary Income | $949,348 | $ 921,832 |
| Long-term Capital Gains | – | 910,524 |
| Total | $949,348 | $ 1,832,356 |
Short-Term Trading (Redemption) Fees. Shares held by investors in the Fund less than 30 days may have been subject to a redemption fee equal to 1.00% of the NAV of shares redeemed. All redemption fees, which reduce the proceeds of the shareholder redemption, are retained by the Fund and accounted for as an addition to paid in capital. In November 2017, the Board of Trustees approved the elimination of these redemption fees effective December 18, 2017.
Restricted Securities. The Fund may invest in securities that are subject to legal or contractual restrictions on resale. These securities generally may be resold in transactions exempt from registration or to the public if the securities are registered. Disposal of these securities may involve time-consuming negotiations and expense, and prompt sale at an acceptable price may be difficult. Information regarding restricted securities is included at the end of the Fund's Schedule of Investments.
4. Purchases and Sales of Investments.
Purchases and sales of securities, other than short-term securities, aggregated $27,275,712 and $31,161,654, respectively.
5. Fees and Other Transactions with Affiliates.
Management Fee. Fidelity Management & Research Company (the investment adviser) and its affiliates provide the Fund with investment management related services for which the Fund pays a monthly management fee. The management fee is the sum of an individual fund fee rate that is based on an annual rate of .45% of the Fund's average net assets and an annualized group fee rate that averaged .25% during the period. The group fee rate is based upon the average net assets of all the mutual funds advised by the investment adviser, including any mutual funds previously advised by the investment adviser that are currently advised by Fidelity SelectCo, LLC, an affiliate of the investment adviser. The group fee rate decreases as assets under management increase and increases as assets under management decrease. For the reporting period, the total annual management fee rate was .69% of the Fund's average net assets.
Transfer Agent Fees. Fidelity Investments Institutional Operations Company, Inc. (FIIOC), an affiliate of the investment adviser, is the Fund's transfer, dividend disbursing and shareholder servicing agent. FIIOC receives account fees and asset-based fees that vary according to account size and type of account. FIIOC pays for typesetting, printing and mailing of shareholder reports, except proxy statements. For the period, the transfer agent fees were equivalent to an annual rate of .24% of average net assets.
Accounting and Security Lending Fees. Fidelity Service Company, Inc. (FSC), an affiliate of the investment adviser, maintains the Fund's accounting records. The accounting fee is based on the level of average net assets for each month. Under a separate contract, FSC administers the security lending program. The security lending fee is based on the number and duration of lending transactions.
Brokerage Commissions. The Fund placed a portion of its portfolio transactions with brokerage firms which are affiliates of the investment adviser. Brokerage commissions are included in net realized gain (loss) and change in net unrealized appreciation (depreciation) in the Statement of Operations. The commissions paid to these affiliated firms were $271 for the period.
Interfund Trades. The Fund may purchase from or sell securities to other Fidelity Funds under procedures adopted by the Board. The procedures have been designed to ensure these interfund trades are executed in accordance with Rule 17a-7 of the 1940 Act. Interfund trades are included within the respective purchases and sales amounts shown in the Purchases and Sales of Investments note.
6. Committed Line of Credit.
The Fund participates with other funds managed by the investment adviser or an affiliate in a $4.25 billion credit facility (the "line of credit") to be utilized for temporary or emergency purposes to fund shareholder redemptions or for other short-term liquidity purposes. The Fund has agreed to pay commitment fees on its pro-rata portion of the line of credit, which amounted to $239 and is reflected in Miscellaneous expenses on the Statement of Operations. During the period, the Fund did not borrow on this line of credit.
7. Security Lending.
The Fund lends portfolio securities through a lending agent from time to time in order to earn additional income. For equity securities, a lending agent is used and may loan securities to certain qualified borrowers, including Fidelity Capital Markets (FCM), a broker-dealer affiliated with the Fund. On the settlement date of the loan, the Fund receives collateral (in the form of U.S. Treasury obligations, letters of credit and/or cash) against the loaned securities and maintains collateral in an amount not less than 100% of the market value of the loaned securities during the period of the loan. The market value of the loaned securities is determined at the close of business of the Fund and any additional required collateral is delivered to the Fund on the next business day. The Fund or borrower may terminate the loan at any time, and if the borrower defaults on its obligation to return the securities loaned because of insolvency or other reasons, the Fund may apply collateral received from the borrower against the obligation. The Fund may experience delays and costs in recovering the securities loaned. Any cash collateral received is invested in the Fidelity Securities Lending Cash Central Fund. The value of loaned securities and cash collateral at period end are disclosed on the Fund's Statement of Assets and Liabilities. Security lending income represents the income earned on investing cash collateral, less rebates paid to borrowers and any lending agent fees associated with the loan, plus any premium payments received for lending certain types of securities. Security lending income is presented in the Statement of Operations as a component of income from Fidelity Central Funds. Total security lending income during the period amounted to $6,356, including $3,181 from securities loaned to FCM.
8. Expense Reductions.
Commissions paid to certain brokers with whom the investment adviser, or its affiliates, places trades on behalf of the Fund include an amount in addition to trade execution, which may be rebated back to the Fund to offset certain expenses. This amount totaled $1,961 for the period.
In addition, during the period the investment adviser reimbursed and/or waived a portion of operating expenses in the amount of $651.
9. Other.
The Fund's organizational documents provide former and current trustees and officers with a limited indemnification against liabilities arising in connection with the performance of their duties to the Fund. In the normal course of business, the Fund may also enter into contracts that provide general indemnifications. The Fund's maximum exposure under these arrangements is unknown as this would be dependent on future claims that may be made against the Fund. The risk of material loss from such claims is considered remote.
Report of Independent Registered Public Accounting Firm
To the Trustees of Fidelity Investment Trust and Shareholders of Fidelity Global Equity Income Fund:
We have audited the accompanying statement of assets and liabilities of Fidelity Global Equity Income Fund (the Fund), a fund of Fidelity Investment Trust, including the schedule of investments, as of October 31, 2017, and the related statement of operations for the year then ended, the statement of changes in net assets for each of the two years in the period then ended, and the financial highlights for each of the five years in the period then ended. These financial statements and financial highlights are the responsibility of the Fund's management. Our responsibility is to express an opinion on these financial statements and financial highlights based on our audits.
We conducted our audits in accordance with the standards of the Public Company Accounting Oversight Board (United States). Those standards require that we plan and perform the audit to obtain reasonable assurance about whether the financial statements and financial highlights are free of material misstatement. The Fund is not required to have, nor were we engaged to perform, an audit of its internal control over financial reporting. Our audits included consideration of internal control over financial reporting as a basis for designing audit procedures that are appropriate in the circumstances, but not for the purpose of expressing an opinion on the effectiveness of the Fund's internal control over financial reporting. Accordingly, we express no such opinion. An audit also includes examining, on a test basis, evidence supporting the amounts and disclosures in the financial statements, assessing the accounting principles used and significant estimates made by management, as well as evaluating the overall financial statement presentation. Our procedures included confirmation of securities owned as of October 31, 2017, by correspondence with the custodians and brokers; when replies were not received from brokers, we performed other auditing procedures. We believe that our audits provide a reasonable basis for our opinion.
In our opinion, such financial statements and financial highlights referred to above present fairly, in all material respects, the financial position of Fidelity Global Equity Income Fund as of October 31, 2017, the results of its operations for the year then ended, the changes in its net assets for each of the two years in the period then ended, and the financial highlights for each of the five years in the period then ended, in conformity with accounting principles generally accepted in the United States of America.
DELOITTE & TOUCHE LLP
Boston, Massachusetts
December 18, 2017
Trustees and Officers
The Trustees, Members of the Advisory Board (if any), and officers of the trust and fund, as applicable, are listed below. The Board of Trustees governs the fund and is responsible for protecting the interests of shareholders. The Trustees are experienced executives who meet periodically throughout the year to oversee the fund's activities, review contractual arrangements with companies that provide services to the fund, oversee management of the risks associated with such activities and contractual arrangements, and review the fund's performance. Except for Jonathan Chiel, each of the Trustees oversees 190 funds. Mr. Chiel oversees 143 funds.
The Trustees hold office without limit in time except that (a) any Trustee may resign; (b) any Trustee may be removed by written instrument, signed by at least two-thirds of the number of Trustees prior to such removal; (c) any Trustee who requests to be retired or who has become incapacitated by illness or injury may be retired by written instrument signed by a majority of the other Trustees; and (d) any Trustee may be removed at any special meeting of shareholders by a two-thirds vote of the outstanding voting securities of the trust. Each Trustee who is not an interested person (as defined in the 1940 Act) of the trust and the fund is referred to herein as an Independent Trustee. Each Independent Trustee shall retire not later than the last day of the calendar year in which his or her 75th birthday occurs. The Independent Trustees may waive this mandatory retirement age policy with respect to individual Trustees. Officers and Advisory Board Members hold office without limit in time, except that any officer or Advisory Board Member may resign or may be removed by a vote of a majority of the Trustees at any regular meeting or any special meeting of the Trustees. Except as indicated, each individual has held the office shown or other offices in the same company for the past five years.
The fund’s Statement of Additional Information (SAI) includes more information about the Trustees. To request a free copy, call Fidelity at 1-800-544-8544.
Experience, Skills, Attributes, and Qualifications of the Trustees. The Governance and Nominating Committee has adopted a statement of policy that describes the experience, qualifications, attributes, and skills that are necessary and desirable for potential Independent Trustee candidates (Statement of Policy). The Board believes that each Trustee satisfied at the time he or she was initially elected or appointed a Trustee, and continues to satisfy, the standards contemplated by the Statement of Policy. The Governance and Nominating Committee also engages professional search firms to help identify potential Independent Trustee candidates who have the experience, qualifications, attributes, and skills consistent with the Statement of Policy. From time to time, additional criteria based on the composition and skills of the current Independent Trustees, as well as experience or skills that may be appropriate in light of future changes to board composition, business conditions, and regulatory or other developments, have also been considered by the professional search firms and the Governance and Nominating Committee. In addition, the Board takes into account the Trustees' commitment and participation in Board and committee meetings, as well as their leadership of standing and ad hoc committees throughout their tenure.
In determining that a particular Trustee was and continues to be qualified to serve as a Trustee, the Board has considered a variety of criteria, none of which, in isolation, was controlling. The Board believes that, collectively, the Trustees have balanced and diverse experience, qualifications, attributes, and skills, which allow the Board to operate effectively in governing the fund and protecting the interests of shareholders. Information about the specific experience, skills, attributes, and qualifications of each Trustee, which in each case led to the Board's conclusion that the Trustee should serve (or continue to serve) as a trustee of the fund, is provided below.
Board Structure and Oversight Function. James C. Curvey is an interested person and currently serves as Chairman. The Trustees have determined that an interested Chairman is appropriate and benefits shareholders because an interested Chairman has a personal and professional stake in the quality and continuity of services provided to the fund. Independent Trustees exercise their informed business judgment to appoint an individual of their choosing to serve as Chairman, regardless of whether the Trustee happens to be independent or a member of management. The Independent Trustees have determined that they can act independently and effectively without having an Independent Trustee serve as Chairman and that a key structural component for assuring that they are in a position to do so is for the Independent Trustees to constitute a substantial majority for the Board. The Independent Trustees also regularly meet in executive session. Ned C. Lautenbach serves as Chairman of the Independent Trustees and as such (i) acts as a liaison between the Independent Trustees and management with respect to matters important to the Independent Trustees and (ii) with management prepares agendas for Board meetings.
Fidelity® funds are overseen by different Boards of Trustees. The fund's Board oversees Fidelity's high income and certain equity funds, and other Boards oversee Fidelity's investment-grade bond, money market, asset allocation, and sector funds. The asset allocation funds may invest in Fidelity® funds overseen by the fund's Board. The use of separate Boards, each with its own committee structure, allows the Trustees of each group of Fidelity® funds to focus on the unique issues of the funds they oversee, including common research, investment, and operational issues. On occasion, the separate Boards establish joint committees to address issues of overlapping consequences for the Fidelity® funds overseen by each Board.
The Trustees operate using a system of committees to facilitate the timely and efficient consideration of all matters of importance to the Trustees, the fund, and fund shareholders and to facilitate compliance with legal and regulatory requirements and oversight of the fund's activities and associated risks. The Board, acting through its committees, has charged FMR and its affiliates with (i) identifying events or circumstances the occurrence of which could have demonstrably adverse effects on the fund's business and/or reputation; (ii) implementing processes and controls to lessen the possibility that such events or circumstances occur or to mitigate the effects of such events or circumstances if they do occur; and (iii) creating and maintaining a system designed to evaluate continuously business and market conditions in order to facilitate the identification and implementation processes described in (i) and (ii) above. Because the day-to-day operations and activities of the fund are carried out by or through FMR, its affiliates, and other service providers, the fund's exposure to risks is mitigated but not eliminated by the processes overseen by the Trustees. While each of the Board's committees has responsibility for overseeing different aspects of the fund's activities, oversight is exercised primarily through the Operations, Audit, and Compliance Committees. In addition, the Independent Trustees have worked with FMR to enhance the Board's oversight of investment and financial risks, legal and regulatory risks, technology risks, and operational risks, including the development of additional risk reporting to the Board. For example, a working group comprised of Independent Trustees and FMR has worked and continues to work to review the Fidelity® funds' valuation-related activities, reporting and risk management. Appropriate personnel, including but not limited to the fund's Chief Compliance Officer (CCO), FMR's internal auditor, the independent accountants, the fund's Treasurer and portfolio management personnel, make periodic reports to the Board's committees, as appropriate, including an annual review of Fidelity's risk management program for the Fidelity® funds. The responsibilities of each standing committee, including their oversight responsibilities, are described further under "Standing Committees of the Trustees."
Interested Trustees*:
Correspondence intended for a Trustee who is an interested person may be sent to Fidelity Investments, 245 Summer Street, Boston, Massachusetts 02210.
Name, Year of Birth; Principal Occupations and Other Relevant Experience+
Jonathan Chiel (1957)
Year of Election or Appointment: 2016
Trustee
Mr. Chiel also serves as Trustee of other Fidelity® funds. Mr. Chiel is Executive Vice President and General Counsel for FMR LLC (diversified financial services company, 2012-present). Previously, Mr. Chiel served as general counsel (2004-2012) and senior vice president and deputy general counsel (2000-2004) for John Hancock Financial Services; a partner with Choate, Hall & Stewart (1996-2000) (law firm); and an Assistant United States Attorney for the United States Attorney’s Office of the District of Massachusetts (1986-95), including Chief of the Criminal Division (1993-1995). Mr. Chiel is a director on the boards of the Boston Bar Foundation and the Maimonides School.
James C. Curvey (1935)
Year of Election or Appointment: 2007
Trustee
Chairman of the Board of Trustees
Mr. Curvey also serves as Trustee of other Fidelity® funds. Mr. Curvey is a Director of Fidelity Research & Analysis Co. (investment adviser firm, 2009-present), and Vice Chairman (2007-present) and Director of FMR LLC (diversified financial services company). In addition, Mr. Curvey serves as an Overseer for the Boston Symphony Orchestra and a member of the board of Artis-Naples, Naples, Florida, and as a Trustee for Brewster Academy, Wolfeboro, New Hampshire. Previously, Mr. Curvey served as a Director of Fidelity Investments Money Management, Inc. (investment adviser firm, 2009-2014) and a Director of FMR and FMR Co., Inc. (investment adviser firms, 2007-2014).
Charles S. Morrison (1960)
Year of Election or Appointment: 2014
Trustee
Mr. Morrison also serves as Trustee of other funds. He serves as President of Fidelity Management & Research Company (FMR) (investment adviser firm, 2016-present), a Director of Fidelity Investments Money Management, Inc. (FIMM) (investment adviser firm, 2014-present), Director of Fidelity SelectCo, LLC (investment adviser firm, 2014-present), President, Asset Management (2014-present), and is an employee of Fidelity Investments. Previously, Mr. Morrison served as Vice President of Fidelity's Fixed Income and Asset Allocation Funds (2012-2014), President, Fixed Income (2011-2014), Vice President of Fidelity's Money Market Funds (2005-2009), President, Money Market Group Leader of FMR (investment adviser firm, 2009), and Senior Vice President, Money Market Group of FMR (2004-2009). Mr. Morrison also served as Vice President of Fidelity's Bond Funds (2002-2005), certain Balanced Funds (2002-2005), and certain Asset Allocation Funds (2002-2007), and as Senior Vice President (2002-2005) of Fidelity's Bond Division.
* Determined to be an “Interested Trustee” by virtue of, among other things, his or her affiliation with the trust or various entities under common control with FMR.
+ The information includes the Trustee's principal occupation during the last five years and other information relating to the experience, attributes, and skills relevant to the Trustee's qualifications to serve as a Trustee, which led to the conclusion that the Trustee should serve as a Trustee for the fund.
Independent Trustees:
Correspondence intended for an Independent Trustee may be sent to Fidelity Investments, P.O. Box 55235, Boston, Massachusetts 02205-5235.
Name, Year of Birth; Principal Occupations and Other Relevant Experience+
Dennis J. Dirks (1948)
Year of Election or Appointment: 2005
Trustee
Mr. Dirks also serves as Trustee of other Fidelity® funds. Prior to his retirement in May 2003, Mr. Dirks was Chief Operating Officer and a member of the Board of The Depository Trust & Clearing Corporation (DTCC). He also served as President, Chief Operating Officer, and Board member of The Depository Trust Company (DTC) and President and Board member of the National Securities Clearing Corporation (NSCC). In addition, Mr. Dirks served as Chief Executive Officer and Board member of the Government Securities Clearing Corporation, Chief Executive Officer and Board member of the Mortgage-Backed Securities Clearing Corporation, as a Trustee and a member of the Finance Committee of Manhattan College (2005-2008), as a Trustee and a member of the Finance Committee of AHRC of Nassau County (2006-2008), as a member of the Independent Directors Council (IDC) Governing Council (2010-2015), and as a member of the Board of Directors for The Brookville Center for Children’s Services, Inc. (2009-2017). Mr. Dirks is a member of the Finance Committee (2016-present) and Board of Directors (2017-present) of the Asolo Repertory Theatre.
Alan J. Lacy (1953)
Year of Election or Appointment: 2008
Trustee
Mr. Lacy also serves as Trustee of other Fidelity® funds. Mr. Lacy serves as a Director of Bristol-Myers Squibb Company (global pharmaceuticals, 2008-present). He is a Trustee of the California Chapter of The Nature Conservancy (2015-present) and a Director of the Center for Advanced Study in the Behavioral Sciences at Stanford University (2015-present). In addition, Mr. Lacy served as Senior Adviser (2007-2014) of Oak Hill Capital Partners, L.P. (private equity) and also served as Chief Executive Officer (2005) and Vice Chairman (2005-2006) of Sears Holdings Corporation (retail) and Chief Executive Officer and Chairman of the Board of Sears, Roebuck and Co. (retail, 2000-2005). Previously, Mr. Lacy served as Chairman (2014-2017) and a member (2010-2017) of the Board of Directors of Dave & Buster’s Entertainment, Inc. (restaurant and entertainment complexes), as Chairman (2008-2011) and a member (2006-2015) of the Board of Trustees of the National Parks Conservation Association, and as a member of the Board of Directors for The Hillman Companies, Inc. (hardware wholesalers, 2010-2014), Earth Fare, Inc. (retail grocery, 2010-2014), and The Western Union Company (global money transfer, 2006-2011).
Ned C. Lautenbach (1944)
Year of Election or Appointment: 2000
Trustee
Chairman of the Independent Trustees
Mr. Lautenbach also serves as Trustee of other Fidelity® funds. Mr. Lautenbach currently serves as Vice Chair of the Board of Governors, State University System of Florida (2013-present) and is a member of the Council on Foreign Relations (1994-present). He is also a member and has most recently served as Chairman of the Board of Directors of Artis-Naples (2012-present). Previously, Mr. Lautenbach served as a member and then Lead Director of the Board of Directors of Eaton Corporation (diversified industrial, 1997-2016). He was also a Partner and Advisory Partner at Clayton, Dubilier & Rice, LLC (private equity investment, 1998-2010), as well as a Director of Sony Corporation (2006-2007). In addition, Mr. Lautenbach also had a 30-year career with IBM (technology company) during which time he served as Senior Vice President and a member of the Corporate Executive Committee (1968-1998).
Joseph Mauriello (1944)
Year of Election or Appointment: 2008
Trustee
Mr. Mauriello also serves as Trustee of other Fidelity® funds. Prior to his retirement in January 2006, Mr. Mauriello served in numerous senior management positions including Deputy Chairman and Chief Operating Officer (2004-2005), and Vice Chairman of Financial Services (2002-2004) of KPMG LLP US (professional services, 1965-2005). Mr. Mauriello currently serves as a member of the Board of Directors of XL Group plc. (global insurance and re-insurance, 2006-present) and the Independent Directors Council (IDC) Governing Council (2015-present). Previously, Mr. Mauriello served as a Director of the Hamilton Funds of the Bank of New York (2006-2007) and of Arcadia Resources Inc. (health care services and products, 2007-2012).
Cornelia M. Small (1944)
Year of Election or Appointment: 2005
Trustee
Ms. Small also serves as Trustee of other Fidelity® funds. Ms. Small is a member of the Board of Directors (2009-present) and Chair of the Investment Committee (2010-present) of the Teagle Foundation. Ms. Small also serves on the Investment Committee of the Berkshire Taconic Community Foundation (2008-present). Previously, Ms. Small served as Chairperson (2002-2008) and a member of the Investment Committee and Chairperson (2008-2012) and a member of the Board of Trustees of Smith College. In addition, Ms. Small served as Chief Investment Officer, Director of Global Equity Investments, and a member of the Board of Directors of Scudder, Stevens & Clark and Scudder Kemper Investments.
William S. Stavropoulos (1939)
Year of Election or Appointment: 2001
Trustee
Vice Chairman of the Independent Trustees
Mr. Stavropoulos also serves as Trustee of other Fidelity® funds. Mr. Stavropoulos serves as President and Founder of the Michigan Baseball Foundation, the Great Lakes Loons (2007-present). Mr. Stavropoulos is Chairman Emeritus of the Board of Directors of The Dow Chemical Company, where he previously served in numerous senior management positions, including President, CEO (1995-2000; 2002-2004), Chairman of the Executive Committee (2000-2006), and as a member of the Board of Directors (1990-2006). Currently, Mr. Stavropoulos is Chairman of the Board of Directors of Univar Inc. (global distributor of commodity and specialty chemicals), a Director of Teradata Corporation (data warehousing and technology solutions), and a member of the Advisory Board for Metalmark Capital LLC (private equity investment, 2005-present). Mr. Stavropoulos is an operating advisor to Clayton, Dubilier & Rice, LLC (private equity investment). In addition, Mr. Stavropoulos is a member of the University of Notre Dame Advisory Council for the College of Science, a Trustee of the Rollin L. Gerstacker Foundation, and a Director of Artis-Naples in Naples, Florida. Previously, Mr. Stavropoulos served as a Director of Chemical Financial Corporation (bank holding company, 1993-2012) and Tyco International, Ltd. (multinational manufacturing and services, 2007-2012).
David M. Thomas (1949)
Year of Election or Appointment: 2008
Trustee
Mr. Thomas also serves as Trustee of other Fidelity® funds. Mr. Thomas serves as Non-Executive Chairman of the Board of Directors of Fortune Brands Home and Security (home and security products, 2011-present), as a member of the Board of Directors (2004-present) and Presiding Director (2013-present) of Interpublic Group of Companies, Inc. (marketing communication), and as a member of the Board of Trustees of the University of Florida (2013-present). Previously, Mr. Thomas served as Executive Chairman (2005-2006) and Chairman and Chief Executive Officer (2000-2005) of IMS Health, Inc. (pharmaceutical and healthcare information solutions), and a Director of Fortune Brands, Inc. (consumer products, 2000-2011).
+ The information includes the Trustee's principal occupation during the last five years and other information relating to the experience, attributes, and skills relevant to the Trustee's qualifications to serve as a Trustee, which led to the conclusion that the Trustee should serve as a Trustee for the fund.
Advisory Board Members and Officers:
Correspondence intended for an officer or Peter S. Lynch may be sent to Fidelity Investments, 245 Summer Street, Boston, Massachusetts 02210. Officers appear below in alphabetical order.
Name, Year of Birth; Principal Occupation
Peter S. Lynch (1944)
Year of Election or Appointment: 2003
Member of the Advisory Board
Mr. Lynch also serves as Member of the Advisory Board of other Fidelity® funds. Mr. Lynch is Vice Chairman and a Director of FMR (investment adviser firm) and FMR Co., Inc. (investment adviser firm). In addition, Mr. Lynch serves as a Trustee of Boston College and as the Chairman of the Inner-City Scholarship Fund. Previously, Mr. Lynch served on the Special Olympics International Board of Directors (1997-2006).
Elizabeth Paige Baumann (1968)
Year of Election or Appointment: 2017
Anti-Money Laundering (AML) Officer
Ms. Baumann also serves as AML Officer of other funds. She is Chief AML Officer (2012-present) and Senior Vice President (2014-present) of FMR LLC (diversified financial services company) and is an employee of Fidelity Investments. Previously, Ms. Baumann served as AML Officer of the funds (2012-2016), and Vice President (2007-2014) and Deputy Anti-Money Laundering Officer (2007-2012) of FMR LLC.
Marc R. Bryant (1966)
Year of Election or Appointment: 2015
Secretary and Chief Legal Officer (CLO)
Mr. Bryant also serves as Secretary and CLO of other funds. Mr. Bryant serves as CLO, Secretary, and Senior Vice President of Fidelity Management & Research Company (investment adviser firm, 2015-present) and FMR Co., Inc. (investment adviser firm, 2015-present); Secretary of Fidelity SelectCo, LLC (investment adviser firm, 2015-present) and Fidelity Investments Money Management, Inc. (investment adviser firm, 2015-present); and CLO of Fidelity Management & Research (Hong Kong) Limited and FMR Investment Management (UK) Limited (investment adviser firms, 2015-present) and Fidelity Management & Research (Japan) Limited (investment adviser firm, 2016-present). He is Senior Vice President and Deputy General Counsel of FMR LLC (diversified financial services company). Previously, Mr. Bryant served as Secretary and CLO of Fidelity Rutland Square Trust II (2010-2014) and Assistant Secretary of Fidelity's Fixed Income and Asset Allocation Funds (2013-2015). Prior to joining Fidelity Investments, Mr. Bryant served as a Senior Vice President and the Head of Global Retail Legal for AllianceBernstein L.P. (2006-2010), and as the General Counsel for ProFund Advisors LLC (2001-2006).
William C. Coffey (1969)
Year of Election or Appointment: 2009
Assistant Secretary
Mr. Coffey also serves as Assistant Secretary of other funds. He is Senior Vice President and Deputy General Counsel of FMR LLC (diversified financial services company, 2010-present), and is an employee of Fidelity Investments. Previously, Mr. Coffey served as Vice President and Associate General Counsel of FMR LLC (2005-2009).
Jonathan Davis (1968)
Year of Election or Appointment: 2010
Assistant Treasurer
Mr. Davis also serves as Assistant Treasurer of other funds, and is an employee of Fidelity Investments. Previously, Mr. Davis served as Vice President and Associate General Counsel of FMR LLC (diversified financial services company, 2003-2010).
Adrien E. Deberghes (1967)
Year of Election or Appointment: 2016
Assistant Treasurer
Mr. Deberghes also serves as an officer of other funds. He serves as Executive Vice President of Fidelity Investments Money Management, Inc. (FIMM) (investment adviser firm, 2016-present) and is an employee of Fidelity Investments (2008-present). Prior to joining Fidelity Investments, Mr. Deberghes was Senior Vice President of Mutual Fund Administration at State Street Corporation (2007-2008), Senior Director of Mutual Fund Administration at Investors Bank & Trust (2005-2007), and Director of Finance for Dunkin' Brands (2000-2005). Previously, Mr. Deberghes served in other fund officer roles.
Stephanie J. Dorsey (1969)
Year of Election or Appointment: 2010
Assistant Treasurer
Ms. Dorsey also serves as an officer of other funds. She is an employee of Fidelity Investments (2008-present) and has served in other fund officer roles. Prior to joining Fidelity Investments, Ms. Dorsey served as Treasurer (2004-2008) of the JPMorgan Mutual Funds and Vice President (2004-2008) of JPMorgan Chase Bank.
Howard J. Galligan III (1966)
Year of Election or Appointment: 2014
Chief Financial Officer
Mr. Galligan also serves as Chief Financial Officer of other funds. Mr. Galligan serves as President of Fidelity Pricing and Cash Management Services (FPCMS) (2014-present) and as a Director of Strategic Advisers, Inc. (investment adviser firm, 2008-present). Previously, Mr. Galligan served as Chief Administrative Officer of Asset Management (2011-2014) and Chief Operating Officer and Senior Vice President of Investment Support for Strategic Advisers, Inc. (2003-2011).
Thomas C. Hense (1964)
Year of Election or Appointment: 2008, 2010, or 2015
Vice President
Mr. Hense serves as Vice President of Fidelity Advisor® Multi-Asset Income Fund (2015) and other funds (High Income (2008), Small Cap (2008), and Value (2010) funds), and is an employee of Fidelity Investments (1993-present). Previously, Mr. Hense served as a portfolio manager for Fidelity's Institutional Money Management Group (Pyramis) (2003-2008).
Brian B. Hogan (1964)
Year of Election or Appointment: 2009
Vice President
Mr. Hogan also serves as Trustee or Vice President of other funds. Mr. Hogan serves as a Director of FMR Investment Management (UK) Limited (investment adviser firm, 2015-present) and Fidelity SelectCo, LLC (investment adviser firm, 2014-present) and President of the Equity Division of FMR (investment adviser firm, 2009-present). Previously, Mr. Hogan served as Senior Vice President, Equity Research of FMR (2006-2009) and as a portfolio manager. Mr. Brian B. Hogan is not related to Mr. Colm A. Hogan.
Colm A. Hogan (1973)
Year of Election or Appointment: 2016
Deputy Treasurer
Mr. Hogan also serves as an officer of other funds. Mr. Hogan is an employee of Fidelity Investments (2005-present). Mr. Colm A. Hogan is not related to Mr. Brian B. Hogan.
Chris Maher (1972)
Year of Election or Appointment: 2013
Assistant Treasurer
Mr. Maher serves as Assistant Treasurer of other funds. Mr. Maher is Vice President of Valuation Oversight and is an employee of Fidelity Investments. Previously, Mr. Maher served as Vice President of Asset Management Compliance (2013), Vice President of the Program Management Group of FMR (investment adviser firm, 2010-2013), and Vice President of Valuation Oversight (2008-2010).
Rieco E. Mello (1969)
Year of Election or Appointment: 2017
Assistant Treasurer
Mr. Mello also serves as Assistant Treasurer of other funds. Mr. Mello is an employee of Fidelity Investments (1995-present).
Kenneth B. Robins (1969)
Year of Election or Appointment: 2016
Chief Compliance Officer
Mr. Robins also serves as an officer of other funds. Mr. Robins serves as Compliance Officer of Fidelity Management & Research Company and FMR Co., Inc. (investment adviser firms, 2016-present) and is an employee of Fidelity Investments (2004-present). Previously, Mr. Robins served as Executive Vice President of Fidelity Investments Money Management, Inc. (investment adviser firm, 2013-2016) and served in other fund officer roles.
Stacie M. Smith (1974)
Year of Election or Appointment: 2016
President and Treasurer
Ms. Smith also serves as an officer of other funds. She is an employee of Fidelity Investments (2009-present) and has served in other fund officer roles. Prior to joining Fidelity Investments, Ms. Smith served as Senior Audit Manager of Ernst & Young LLP (accounting firm, 1996-2009). Previously, Ms. Smith served as Deputy Treasurer of certain Fidelity® funds (2013-2016).
Marc L. Spector (1972)
Year of Election or Appointment: 2016
Assistant Treasurer
Mr. Spector also serves as an officer of other funds. Mr. Spector is an employee of Fidelity Investments (2016-present). Prior to joining Fidelity Investments, Mr. Spector served as Director at the Siegfried Group (accounting firm, 2013-2016), and prior to Siegfried Group as audit senior manager at Deloitte & Touche (accounting firm, 2005-2013).
Renee Stagnone (1975)
Year of Election or Appointment: 2016
Assistant Treasurer
Ms. Stagnone also serves as an officer of other funds. Ms. Stagnone is an employee of Fidelity Investments (1997-present). Previously, Ms. Stagnone served as Deputy Treasurer of certain Fidelity® funds (2013-2016).
Shareholder Expense Example
As a shareholder of the Fund, you incur two types of costs: (1) transaction costs, including redemption fees and (2) ongoing costs, including management fees and other Fund expenses. This Example is intended to help you understand your ongoing costs (in dollars) of investing in the Fund and to compare these costs with the ongoing costs of investing in other mutual funds.
The Example is based on an investment of $1,000 invested at the beginning of the period and held for the entire period (May 1, 2017 to October 31, 2017).
Actual Expenses
The first line of the accompanying table provides information about actual account values and actual expenses. You may use the information in this line, together with the amount you invested, to estimate the expenses that you paid over the period. Simply divide your account value by $1,000.00 (for example, an $8,600 account value divided by $1,000.00 = 8.6), then multiply the result by the number in the first line under the heading entitled "Expenses Paid During Period" to estimate the expenses you paid on your account during this period. A small balance maintenance fee of $12.00 that is charged once a year may apply for certain accounts with a value of less than $2,000. This fee is not included in the table below. If it was, the estimate of expenses you paid during the period would be higher, and your ending account value lower, by this amount. In addition, the Fund, as a shareholder in the underlying Fidelity Central Funds, will indirectly bear its pro-rata share of the fees and expenses incurred by the underlying Fidelity Central Funds. These fees and expenses are not included in the Fund's annualized expense ratio used to calculate the expense estimate in the table below.
Hypothetical Example for Comparison Purposes
The second line of the accompanying table provides information about hypothetical account values and hypothetical expenses based on the Fund's actual expense ratio and an assumed rate of return of 5% per year before expenses, which is not the Fund's actual return. The hypothetical account values and expenses may not be used to estimate the actual ending account balance or expenses you paid for the period. You may use this information to compare the ongoing costs of investing in the Fund and other funds. To do so, compare this 5% hypothetical example with the 5% hypothetical examples that appear in the shareholder reports of the other funds. A small balance maintenance fee of $12.00 that is charged once a year may apply for certain accounts with a value of less than $2,000. This fee is not included in the table below. If it was, the estimate of expenses you paid during the period would be higher, and your ending account value lower, by this amount. In addition, the Fund, as a shareholder in the underlying Fidelity Central Funds, will indirectly bear its pro-rata share of the fees and expenses incurred by the underlying Fidelity Central Funds. These fees and expenses are not included in the Fund's annualized expense ratio used to calculate the expense estimate in the table below.
Please note that the expenses shown in the table are meant to highlight your ongoing costs only and do not reflect any transaction costs. Therefore, the second line of the table is useful in comparing ongoing costs only, and will not help you determine the relative total costs of owning different funds. In addition, if these transactional costs were included, your costs would have been higher.
| | Annualized Expense Ratio-A | Beginning
Account Value
May 1, 2017 | Ending
Account Value
October 31, 2017 | Expenses Paid
During Period-B
May 1, 2017
to October 31, 2017 |
| Actual | 1.09% | $1,000.00 | $1,095.80 | $5.76 |
| Hypothetical-C | | $1,000.00 | $1,019.71 | $5.55 |
A Annualized expense ratio reflects expenses net of applicable fee waivers.
B Expenses are equal to the Fund's annualized expense ratio, multiplied by the average account value over the period, multiplied by 184/365 (to reflect the one-half year period).
C 5% return per year before expenses
Distributions (Unaudited)
The Board of Trustees of Fidelity Global Equity Income Fund voted to pay on December 18, 2017, to shareholders of record at the opening of business on December 15, 2017, a distribution of $0.178 per share derived from capital gains realized from sales of portfolio securities and a dividend of $0.044 per share from net investment income.
The fund hereby designates as a capital gain dividend with respect to the taxable year ended October 31, 2017, $1,067,280, or, if subsequently determined to be different, the net capital gain of such year.
A total of 0.15% of the dividends distributed during the fiscal year was derived from interest on U.S. Government securities which is generally exempt from state income tax.
The fund designates 66%, 67%, 67%, and 67% of the dividends distributed in December, April, July, and October, respectively during the fiscal year as qualifying for the dividends–received deduction for corporate shareholders.
The fund designates 100% of the dividends distributed during the fiscal year as amounts which may be taken into account as a dividend for the purposes of the maximum rate under section 1(h)(11) of the Internal Revenue Code.
The amounts per share which represent income derived from sources within, and taxes paid to, foreign countries or possessions of the United States are as follows:
| Pay Date | Income | Taxes |
| | | |
| 12/19/16 | $0.0350 | $0.0037 |
| 04/10/17 | $0.0104 | $0.0009 |
| 07/10/17 | $0.0676 | $0.0057 |
| 10/09/17 | $0.0540 | $0.0045 |
|
The fund will notify shareholders in January 2018 of amounts for use in preparing 2017 income tax returns.
Board Approval of Investment Advisory Contracts and Management Fees
Fidelity Global Equity Income Fund
Each year, the Board of Trustees, including the Independent Trustees (together, the Board), votes on the renewal of the management contract with Fidelity Management & Research Company (FMR) and the sub-advisory agreements (together, the Advisory Contracts) for the fund. FMR and the sub-advisers are referred to herein as the Investment Advisers. The Board, assisted by the advice of fund counsel and Independent Trustees' counsel, requests and considers a broad range of information relevant to the renewal of the Advisory Contracts throughout the year.
The Board meets regularly and, at each of its meetings, covers an extensive agenda of topics and materials and considers factors that are relevant to its annual consideration of the renewal of the fund's Advisory Contracts, including the services and support provided to the fund and its shareholders. The Board has established various standing committees (Committees), each composed of and chaired by Independent Trustees with varying backgrounds, to which the Board has assigned specific subject matter responsibilities in order to enhance effective decision-making by the Board. The Board, acting directly and through its Committees, requests and receives information concerning the annual consideration of the renewal of the fund's Advisory Contracts. The Board also meets as needed to review matters specifically related to the Board's annual consideration of the renewal of the Advisory Contracts. Members of the Board may also meet with trustees of other Fidelity funds through ad hoc joint committees to discuss certain matters relevant to all of the Fidelity funds.
At its July 2017 meeting, the Board unanimously determined to renew the fund's Advisory Contracts. In reaching its determination, the Board considered all factors it believed relevant, including (i) the nature, extent, and quality of the services to be provided to the fund and its shareholders (including the investment performance of the fund); (ii) the competitiveness of the fund's management fee and total expense ratio relative to peer funds; (iii) the total costs of the services to be provided by and the profits to be realized by Fidelity from its relationships with the fund; and (iv) the extent to which, if any, economies of scale exist and would be realized as the fund grows, and whether any economies of scale are appropriately shared with fund shareholders.
In considering whether to renew the Advisory Contracts for the fund, the Board reached a determination, with the assistance of fund counsel and Independent Trustees' counsel and through the exercise of its business judgment, that the renewal of the Advisory Contracts was in the best interests of the fund and its shareholders and that the compensation payable under the Advisory Contracts was fair and reasonable. The Board's decision to renew the Advisory Contracts was not based on any single factor, but rather was based on a comprehensive consideration of all the information provided to the Board at its meetings throughout the year. The Board, in reaching its determination to renew the Advisory Contracts, was aware that shareholders of the fund have a broad range of investment choices available to them, including a wide choice among funds offered by Fidelity's competitors, and that the fund's shareholders, who have the opportunity to review and weigh the disclosure provided by the fund in its prospectus and other public disclosures, have chosen to invest in this fund, which is part of the Fidelity family of funds.
Amendment to Group Fee Rate. The Board also approved an amendment to the management contract for the fund to add an additional breakpoint to the group fee schedule, effective October 1, 2017. The Board noted that the additional breakpoint would result in lower management fee rates as Fidelity's assets under management increase.
Nature, Extent, and Quality of Services Provided. The Board considered Fidelity's staffing as it relates to the fund, including the backgrounds of investment personnel of Fidelity, and also considered the fund's investment objective, strategies, and related investment philosophy. The Independent Trustees also had discussions with senior management of Fidelity's investment operations and investment groups. The Board considered the structure of the investment personnel compensation program and whether this structure provides appropriate incentives to act in the best interests of the fund. Additionally, the Board considered the portfolio managers' investments, if any, in the funds that they manage.
Resources Dedicated to Investment Management and Support Services. The Board and the Fund Oversight and Research Committees reviewed the general qualifications and capabilities of Fidelity's investment staff, including its size, education, experience, and resources, as well as Fidelity's approach to recruiting, training, managing, and compensating investment personnel. The Board noted that Fidelity has continued to increase the resources devoted to non-U.S. offices, including expansion of Fidelity's global investment organization. The Board also noted that Fidelity's analysts have extensive resources, tools and capabilities that allow them to conduct sophisticated quantitative and fundamental analysis, as well as credit analysis of issuers, counterparties and guarantors. Further, the Board considered that Fidelity's investment professionals have sufficient access to global information and data so as to provide competitive investment results over time, and that those professionals also have access to sophisticated tools that permit them to assess portfolio construction and risk and performance attribution characteristics continuously, as well as to transmit new information and research conclusions rapidly around the world. Additionally, in its deliberations, the Board considered Fidelity's trading, risk management, compliance, and technology and operations capabilities and resources, which are integral parts of the investment management process.
Shareholder and Administrative Services. The Board considered (i) the nature, extent, quality, and cost of advisory, administrative, and shareholder services performed by the Investment Advisers and their affiliates under the Advisory Contracts and under separate agreements covering transfer agency, pricing and bookkeeping, and securities lending services for the fund; (ii) the nature and extent of the supervision of third party service providers, principally custodians, subcustodians, and pricing vendors; and (iii) the resources devoted to, and the record of compliance with, the fund's compliance policies and procedures. The Board also reviewed the allocation of fund brokerage, including allocations to brokers affiliated with the Investment Advisers, the use of brokerage commissions to pay fund expenses, and the use of "soft" commission dollars to pay for research services.
The Board noted that the growth of fund assets over time across the complex allows Fidelity to reinvest in the development of services designed to enhance the value or convenience of the Fidelity funds as investment vehicles. These services include 24-hour access to account information and market information through telephone representatives and over the Internet, investor education materials and asset allocation tools, and the expanded availability of Fidelity Investor Centers.
In 2014, the Board formed an ad hoc Committee on Transfer Agency Fees to review the variety of transfer agency fee structures throughout the industry and Fidelity's competitive positioning with respect to industry participants.
Investment in a Large Fund Family. The Board considered the benefits to shareholders of investing in a Fidelity fund, including the benefits of investing in a fund that is part of a large family of funds offering a variety of investment disciplines and providing a large variety of mutual fund investor services. The Board noted that Fidelity had taken, or had made recommendations that resulted in the Fidelity funds taking, a number of actions over the previous year that benefited particular funds, including: (i) continuing to dedicate additional resources to Fidelity's investment research process, and to the support of the senior management team that oversees asset management; (ii) continuing efforts to enhance Fidelity's global research capabilities; (iii) launching new funds and making other enhancements to meet client needs; (iv) launching new share classes of existing funds; (v) eliminating purchase minimums and broadening eligibility requirements for certain lower-priced share classes; (vi) reducing management fees and total expenses for certain growth equity funds and index funds; (vii) lowering expense caps for certain existing funds and classes to reduce expenses borne by shareholders; (viii) eliminating short-term redemption fees for certain funds; (ix) introducing a new pricing structure for certain funds of funds that is expected to reduce overall expenses paid by shareholders; (x) rationalizing product lines and gaining increased efficiencies through proposals for fund mergers and share class consolidations; (xi) continuing to develop, acquire and implement systems and technology to improve services to the funds and shareholders, strengthen information security, and increase efficiency; and (xii) implementing enhancements to further strengthen Fidelity's product line to increase investors' probability of success in achieving their investment goals, including retirement income goals.
Investment Performance. The Board considered whether the fund has operated in accordance with its investment objective, as well as its record of compliance with its investment restrictions and its performance history.
The Board took into account discussions with representatives of the Investment Advisers about fund investment performance that occur at Board meetings throughout the year. In this regard the Board noted that as part of regularly scheduled fund reviews and other reports to the Board on fund performance, the Board considers annualized return information for the fund for different time periods, measured against a securities market index ("benchmark index") and a peer group of funds with similar objectives ("peer group"), if any. In its evaluation of fund investment performance, the Board gave particular attention to information indicating changes in performance of certain Fidelity funds for specific time periods and discussed with the Investment Advisers the reasons for any overperformance or underperformance.
In addition to reviewing absolute and relative fund performance, the Independent Trustees periodically consider the appropriateness of fund performance metrics in evaluating the results achieved. In general, the Independent Trustees believe that fund performance should be evaluated based on net performance (after fees and expenses) of both the highest performing and lowest performing fund share classes, where applicable, compared to appropriate benchmark indices, over appropriate time periods that may include full market cycles, and compared to peer groups, as applicable, over the same periods, taking into account relevant factors including the following: general market conditions; issuer-specific information; and fund cash flows and other factors.
The Independent Trustees recognize that shareholders evaluate performance on a net basis over their own holding periods, for which one-, three-, and five-year periods are often used as a proxy. For this reason, the performance information reviewed by the Board also included net cumulative calendar year total return information for the fund and an appropriate benchmark index and peer group for the most recent one- and three-year periods, as shown below. Returns are shown compared to the 25th percentile (top of box, 75% beaten) and 75th percentile (bottom of box, 25% beaten) of the peer universe. Returns of the benchmark index are "net MA,"
i.e., adjusted for tax withholding rates applicable to U.S.-based funds organized as Massachusetts business trusts.
Fidelity Global Equity Income Fund
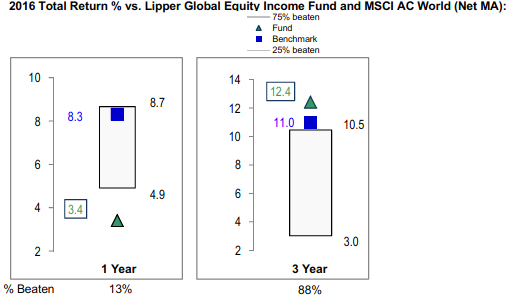
Based on its review, the Board concluded that the nature, extent, and quality of services provided to the fund under the Advisory Contracts should continue to benefit the shareholders of the fund.
Competitiveness of Management Fee and Total Expense Ratio. The Board considered the fund's management fee and total expense ratio compared to "mapped groups" of competitive funds and classes created for the purpose of facilitating the Trustees' competitive analysis of management fees and total expenses. Fidelity creates "mapped groups" by combining similar Lipper investment objective categories that have comparable investment mandates. Combining Lipper investment objective categories aids the Board's management fee and total expense ratio comparisons by broadening the competitive group used for comparison.
Management Fee. The Board considered two proprietary management fee comparisons for the 12-month (or shorter) periods shown in basis points (BP) in the chart below. The group of Lipper funds used by the Board for management fee comparisons is referred to below as the "Total Mapped Group." The Total Mapped Group is broader than the Lipper peer group used by the Board for performance comparisons because the Total Mapped Group combines several Lipper investment objective categories while the Lipper peer group does not. The Total Mapped Group comparison focuses on a fund's standing in terms of gross management fees before expense reimbursements or caps relative to the total universe of funds with comparable investment mandates, regardless of whether their management fee structures also are comparable. Funds with comparable investment mandates offer exposure to similar types of securities. Funds with comparable management fee structures have similar management fee contractual arrangements (
e.g., flat rate charged for advisory services, all-inclusive fee rate,
etc.). "TMG %" represents the percentage of funds in the Total Mapped Group that had management fees that were lower than the fund's. For example, a hypothetical TMG % of 20% would mean that 80% of the funds in the Total Mapped Group had higher, and 20% had lower, management fees than the fund. The fund's actual TMG %s and the number of funds in the Total Mapped Group are in the chart below. The "Asset-Size Peer Group" (ASPG) comparison focuses on a fund's standing relative to a subset of non-Fidelity funds within the Total Mapped Group that are similar in size and management fee structure. For example, if a fund is in the first quartile of the ASPG, the fund's management fee ranks in the least expensive or lowest 25% of funds in the ASPG. The ASPG represents at least 15% of the funds in the Total Mapped Group with comparable asset size and management fee structures, subject to a minimum of 50 funds (or all funds in the Total Mapped Group if fewer than 50). Additional information, such as the ASPG quartile in which the fund's management fee rate ranked, is also included in the chart and considered by the Board.
Fidelity Global Equity Income Fund
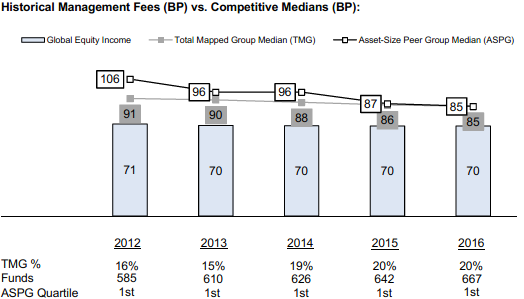
The Board noted that the fund's management fee rate ranked below the median of its Total Mapped Group and below the median of its ASPG for 2016.
The Board noted that, in 2014, the Board and the boards of other Fidelity funds formed the ad hoc Committee on Group Fee to conduct an in-depth review of the "group fee" component of the management fee of funds with such management fee structures. The Committee's focus included the mechanics of the group fee, the competitive landscape of group fee structures, Fidelity funds with no group fee component and investment products not included in group fee assets. The Board also considered that, for funds subject to the group fee, FMR agreed to voluntarily waive fees over a specified period of time in amounts designed to account for assets converted from certain funds to certain collective investment trusts.
The Board also noted that, in 2013, the ad hoc Committee on Management Fees was formed to conduct an in-depth review of the management fee rates of Fidelity's active equity mutual funds. The Committee focused on the following areas: (i) standard fee structures; (ii) research consumption and trading evolution; (iii) management fee competitiveness/profitability by category; and (iv) factors that drive institutional pricing.
Based on its review, the Board concluded that the fund's management fee is fair and reasonable in light of the services that the fund receives and the other factors considered.
Total Expense Ratio. In its review of the fund's total expense ratio, the Board considered the fund's management fee rate as well as other fund expenses, such as transfer agent fees, pricing and bookkeeping fees, and custodial, legal, and audit fees. The Board also noted that Fidelity may agree to waive fees and expenses from time to time, and the extent to which, if any, it has done so for the fund. As part of its review, the Board also considered the current and historical total expense ratios of the fund compared to competitive fund median expenses. The fund is compared to those funds and classes in the Total Mapped Group (used by the Board for management fee comparisons) that have a similar sales load structure.
The Board noted that the fund's total expense ratio ranked equal to the competitive median for 2016.
The Board further considered that FMR has contractually agreed to reimburse the fund to the extent that total operating expenses (excluding interest, certain taxes, certain securities lending costs, brokerage commissions, fees and expenses of the Independent Trustees, proxy and shareholder meeting expenses, extraordinary expenses, and acquired fund fees and expenses, if any), as a percentage of its average net assets, exceed 1.20% through December 31, 2017.
Fees Charged to Other Fidelity Clients. The Board also considered Fidelity fee structures and other information with respect to clients of Fidelity, such as other funds advised or subadvised by Fidelity, pension plan clients, and other institutional clients with similar mandates. The Board noted that an ad hoc joint committee created by it and the boards of other Fidelity funds periodically (most recently in 2013) reviews and compares Fidelity's institutional investment advisory business with its business of providing services to the Fidelity funds, including the differences in services provided, fees charged, and costs incurred, as well as competition in their respective marketplaces.
Based on its review of total expense ratios and fees charged to other Fidelity clients, the Board concluded that the fund's total expense ratio was reasonable in light of the services that the fund and its shareholders receive and the other factors considered.
Costs of the Services and Profitability. The Board considered the revenues earned and the expenses incurred by Fidelity in conducting the business of developing, marketing, distributing, managing, administering and servicing the fund and servicing the fund's shareholders. The Board also considered the level of Fidelity's profits in respect of all the Fidelity funds.
On an annual basis, Fidelity presents to the Board information about the profitability of its relationships with the fund. Fidelity calculates profitability information for each fund, as well as aggregate profitability information for groups of Fidelity funds and all Fidelity funds, using a series of detailed revenue and cost allocation methodologies which originate with the books and records of Fidelity on which Fidelity's audited financial statements are based. The Audit Committee of the Board reviews any significant changes from the prior year's methodologies.
PricewaterhouseCoopers LLP (PwC), independent registered public accounting firm and auditor to Fidelity and certain Fidelity funds, has been engaged annually by the Board as part of the Board's assessment of Fidelity's profitability analysis. PwC's engagement includes the review and assessment of the methodologies used by Fidelity in determining the revenues and expenses attributable to Fidelity's mutual fund business, and completion of agreed-upon procedures in respect of the mathematical accuracy of the fund profitability information and its conformity to established allocation methodologies. After considering PwC's reports issued under the engagement and information provided by Fidelity, the Board concluded that while other allocation methods may also be reasonable, Fidelity's profitability methodologies are reasonable in all material respects.
The Board also reviewed Fidelity's non-fund businesses and potential fall-out benefits related to the mutual fund business as well as cases where Fidelity's affiliates may benefit from or be related to the fund's business.
The Board considered the costs of the services provided by and the profits realized by Fidelity in connection with the operation of the fund and was satisfied that the profitability was not excessive.
Economies of Scale. The Board considered whether there have been economies of scale in respect of the management of the Fidelity funds, whether the Fidelity funds (including the fund) have appropriately benefited from any such economies of scale, and whether there is potential for realization of any further economies of scale. The Board considered the extent to which the fund will benefit from economies of scale as assets grow through increased services to the fund, through waivers or reimbursements, or through fee or expense ratio reductions. The Board also noted that a committee (the Economies of Scale Committee) created by it and the boards of other Fidelity funds periodically (most recently in 2013) analyzes whether Fidelity attains economies of scale in respect of the management and servicing of the Fidelity funds, whether the Fidelity funds have appropriately benefited from such economies of scale, and whether there is potential for realization of any further economies of scale.
The Board recognized that the fund's management contract incorporates a "group fee" structure, which provides for lower group fee rates as total group assets increase, and for higher group fee rates as total group assets decrease (with "group assets" defined to include fund assets under FMR's management plus the assets of sector funds previously under FMR's management). FMR calculates the group fee rates based on a tiered asset "breakpoint" schedule that varies based on asset class. The Board considered that the group fee is designed to deliver the benefits of economies of scale to fund shareholders when total Fidelity fund assets increase, even if assets of any particular fund are unchanged or have declined, because some portion of Fidelity's costs are attributable to services provided to all Fidelity funds, and all funds benefit if those costs can be allocated among more assets. The Board concluded that, given the group fee structure, fund shareholders will benefit from lower management fees as group assets increase at the fund complex level, regardless of whether Fidelity achieves any such economies of scale.
The Board concluded, taking into account the analysis of the Economies of Scale Committee, that economies of scale, if any, are being appropriately shared between fund shareholders and Fidelity.
Additional Information Requested by the Board. In order to develop fully the factual basis for consideration of the Fidelity funds' advisory contracts, the Board requested and received additional information on certain topics, including: (i) fund performance trends, in particular the underperformance of certain funds, and Fidelity's long-term strategies for certain funds; (ii) Fidelity's fund profitability methodology, profitability trends for certain funds, and the impact of certain factors on fund profitability results, including the impact of market trends on actively managed funds; (iii) the use of performance fees and the calculation of performance adjustments, including the impact of underperformance and fund outflows on performance adjustments; (iv) metrics for evaluating index fund performance; (v) Fidelity's group fee structure, including the group fee breakpoint schedules; (vi) the terms of Fidelity's contractual and voluntary expense cap arrangements with the funds; (vii) the methodology with respect to evaluating competitive fund data and peer group classifications and fee comparisons; (viii) the expense structures for different funds and classes; (ix) Fidelity's arrangements with affiliated sub-advisers on behalf of the funds; (x) information regarding other accounts managed by Fidelity, including institutional accounts and collective investment trusts; (xi) recent changes to the fee structure for certain funds of funds; and (xii) the impact of the Department of Labor's new fiduciary rule on the funds' comparative expense information.
Based on its evaluation of all of the conclusions noted above, and after considering all factors it believed relevant, the Board concluded that the advisory fee structures are fair and reasonable, and that the fund's Advisory Contracts should be renewed.
Corporate Headquarters
245 Summer St.
Boston, MA 02210
www.fidelity.com
GED-ANN-1217
1.938162.105
Fidelity® International Capital Appreciation K6 Fund
Annual Report October 31, 2017 |
|
Contents
To view a fund's proxy voting guidelines and proxy voting record for the 12-month period ended June 30, visit http://www.fidelity.com/proxyvotingresults or visit the Securities and Exchange Commission's (SEC) web site at http://www.sec.gov.
You may also call 1-800-835-5092 to request a free copy of the proxy voting guidelines.
Standard & Poor's, S&P and S&P 500 are registered service marks of The McGraw-Hill Companies, Inc. and have been licensed for use by Fidelity Distributors Corporation.
Other third-party marks appearing herein are the property of their respective owners.
All other marks appearing herein are registered or unregistered trademarks or service marks of FMR LLC or an affiliated company. © 2017 FMR LLC. All rights reserved.
This report and the financial statements contained herein are submitted for the general information of the shareholders of the Fund. This report is not authorized for distribution to prospective investors in the Fund unless preceded or accompanied by an effective prospectus.
A fund files its complete schedule of portfolio holdings with the SEC for the first and third quarters of each fiscal year on Form N-Q. Forms N-Q are available on the SEC’s web site at http://www.sec.gov. A fund's Forms N-Q may be reviewed and copied at the SEC’s Public Reference Room in Washington, DC. Information regarding the operation of the SEC's Public Reference Room may be obtained by calling 1-800-SEC-0330.
For a complete list of a fund's portfolio holdings, view the most recent holdings listing, semiannual report, or annual report on Fidelity's web site at http://www.fidelity.com, http://www.institutional.fidelity.com, or http://www.401k.com, as applicable.
NOT FDIC INSURED •MAY LOSE VALUE •NO BANK GUARANTEE
Neither the Fund nor Fidelity Distributors Corporation is a bank.
Investment Summary (Unaudited)
Geographic Diversification (% of fund's net assets)
| As of October 31, 2017 |
| | United States of America* | 14.3% |
| | United Kingdom | 14.3% |
| | Japan | 10.9% |
| | France | 9.2% |
| | Germany | 6.6% |
| | Canada | 6.0% |
| | Cayman Islands | 4.5% |
| | Netherlands | 4.0% |
| | Switzerland | 3.6% |
| | Other | 26.6% |
* Includes Short-Term investments and Net Other Assets (Liabilities).
Percentages are based on country or territory of incorporation and are adjusted for the effect of futures contracts, if applicable.
Asset Allocation as of October 31, 2017
| | % of fund's net assets |
| Stocks | 99.0 |
| Short-Term Investments and Net Other Assets (Liabilities) | 1.0 |
Top Ten Stocks as of October 31, 2017
| | % of fund's net assets |
| Tencent Holdings Ltd. (Cayman Islands, Internet Software & Services) | 1.7 |
| Taiwan Semiconductor Manufacturing Co. Ltd. sponsored ADR (Taiwan, Semiconductors & Semiconductor Equipment) | 1.6 |
| Alibaba Group Holding Ltd. sponsored ADR (Cayman Islands, Internet Software & Services) | 1.6 |
| Unilever PLC (United Kingdom, Personal Products) | 1.3 |
| British American Tobacco PLC (United Kingdom) (United Kingdom, Tobacco) | 1.3 |
| Naspers Ltd. Class N (South Africa, Media) | 1.1 |
| SAP SE (Germany, Software) | 1.1 |
| LVMH Moet Hennessy - Louis Vuitton SA (France, Textiles, Apparel & Luxury Goods) | 1.0 |
| AIA Group Ltd. (Hong Kong, Insurance) | 1.0 |
| Diageo PLC (United Kingdom, Beverages) | 0.9 |
| | 12.6 |
Top Market Sectors as of October 31, 2017
| | % of fund's net assets |
| Industrials | 25.6 |
| Information Technology | 21.8 |
| Financials | 11.9 |
| Consumer Staples | 11.1 |
| Consumer Discretionary | 10.5 |
| Materials | 6.3 |
| Health Care | 5.5 |
| Real Estate | 4.4 |
| Telecommunication Services | 1.0 |
| Utilities | 0.9 |
Investments October 31, 2017
Showing Percentage of Net Assets
| Common Stocks - 98.3% | | | |
| | | Shares | Value |
| Australia - 1.8% | | | |
| Amcor Ltd. | | 81,909 | $992,995 |
| CSL Ltd. | | 12,325 | 1,310,518 |
| realestate.com.au Ltd. | | 16,228 | 897,725 |
|
| TOTAL AUSTRALIA | | | 3,201,238 |
|
| Bailiwick of Jersey - 0.6% | | | |
| Wolseley PLC | | 15,070 | 1,053,801 |
| Bermuda - 1.2% | | | |
| Credicorp Ltd. (United States) | | 5,264 | 1,102,492 |
| Hiscox Ltd. | | 47,962 | 909,646 |
|
| TOTAL BERMUDA | | | 2,012,138 |
|
| Brazil - 1.8% | | | |
| BM&F BOVESPA SA | | 138,800 | 1,014,068 |
| BTG Pactual Participations Ltd. unit | | 128,200 | 862,557 |
| Equatorial Energia SA | | 38,800 | 723,504 |
| Qualicorp SA | | 49,600 | 530,676 |
|
| TOTAL BRAZIL | | | 3,130,805 |
|
| Canada - 6.0% | | | |
| Alimentation Couche-Tard, Inc. Class B (sub. vtg.) | | 22,364 | 1,048,600 |
| Brookfield Asset Management, Inc. Class A | | 27,600 | 1,157,827 |
| Canadian National Railway Co. | | 17,613 | 1,417,259 |
| Canadian Pacific Railway Ltd. | | 5,967 | 1,034,570 |
| CCL Industries, Inc. Class B | | 20,497 | 987,911 |
| Constellation Software, Inc. | | 1,753 | 997,339 |
| Descartes Systems Group, Inc. (a) | | 31,934 | 925,767 |
| Open Text Corp. | | 27,670 | 967,517 |
| Restaurant Brands International, Inc. | | 16,000 | 1,033,718 |
| Waste Connection, Inc. (Canada) | | 12,602 | 890,375 |
|
| TOTAL CANADA | | | 10,460,883 |
|
| Cayman Islands - 4.5% | | | |
| Alibaba Group Holding Ltd. sponsored ADR (a) | | 14,901 | 2,755,046 |
| China Literature Ltd. | | 55 | 388 |
| NetEase, Inc. ADR | | 4,032 | 1,136,701 |
| New Oriental Education & Technology Group, Inc. sponsored ADR | | 11,650 | 969,746 |
| Tencent Holdings Ltd. | | 67,900 | 3,051,767 |
|
| TOTAL CAYMAN ISLANDS | | | 7,913,648 |
|
| Denmark - 0.6% | | | |
| DSV de Sammensluttede Vognmaend A/S | | 13,600 | 1,051,681 |
| France - 9.2% | | | |
| ALTEN | | 10,126 | 886,415 |
| Danone SA | | 15,154 | 1,238,554 |
| Dassault Systemes SA | | 9,392 | 997,425 |
| Eiffage SA | | 9,488 | 991,263 |
| Elis SA | | 32,756 | 854,500 |
| Kering SA | | 2,676 | 1,226,594 |
| Legrand SA | | 14,683 | 1,090,690 |
| LVMH Moet Hennessy - Louis Vuitton SA | | 5,859 | 1,747,525 |
| Orpea | | 7,243 | 867,746 |
| Pernod Ricard SA | | 7,748 | 1,162,002 |
| Rubis | | 14,375 | 902,205 |
| Sartorius Stedim Biotech | | 13,719 | 935,024 |
| SR Teleperformance SA | | 6,395 | 934,132 |
| Thales SA | | 9,246 | 963,718 |
| VINCI SA | | 13,886 | 1,359,518 |
|
| TOTAL FRANCE | | | 16,157,311 |
|
| Germany - 6.6% | | | |
| adidas AG | | 5,404 | 1,202,631 |
| Deutsche Post AG | | 26,590 | 1,217,873 |
| Deutsche Wohnen AG (Bearer) | | 24,043 | 1,024,057 |
| Henkel AG & Co. KGaA | | 9,755 | 1,229,489 |
| Rheinmetall AG | | 7,911 | 933,032 |
| SAP SE | | 16,848 | 1,925,097 |
| Symrise AG | | 13,008 | 1,012,330 |
| United Internet AG | | 15,080 | 954,006 |
| Vonovia SE | | 24,200 | 1,064,431 |
| Wirecard AG | | 9,761 | 961,342 |
|
| TOTAL GERMANY | | | 11,524,288 |
|
| Hong Kong - 1.6% | | | |
| AIA Group Ltd. | | 221,400 | 1,665,878 |
| Techtronic Industries Co. Ltd. | | 187,500 | 1,099,562 |
|
| TOTAL HONG KONG | | | 2,765,440 |
|
| India - 0.5% | | | |
| HDFC Bank Ltd. sponsored ADR | | 9,910 | 914,693 |
| Indonesia - 1.2% | | | |
| PT Bank Central Asia Tbk | | 675,400 | 1,040,801 |
| PT Bank Rakyat Indonesia Tbk | | 889,200 | 1,022,785 |
|
| TOTAL INDONESIA | | | 2,063,586 |
|
| Ireland - 2.3% | | | |
| CRH PLC | | 29,862 | 1,122,763 |
| DCC PLC (United Kingdom) | | 10,488 | 994,576 |
| Kerry Group PLC Class A | | 10,400 | 1,047,293 |
| Kingspan Group PLC (Ireland) | | 21,200 | 886,544 |
|
| TOTAL IRELAND | | | 4,051,176 |
|
| Isle of Man - 0.5% | | | |
| Playtech Ltd. | | 69,878 | 913,235 |
| Israel - 1.7% | | | |
| Check Point Software Technologies Ltd. (a) | | 9,129 | 1,074,575 |
| Elbit Systems Ltd. | | 6,104 | 907,176 |
| Frutarom Industries Ltd. | | 12,300 | 1,012,643 |
|
| TOTAL ISRAEL | | | 2,994,394 |
|
| Italy - 0.6% | | | |
| Industria Macchine Automatiche SpA (IMA) | | 755 | 67,719 |
| Interpump Group SpA | | 30,261 | 1,019,064 |
|
| TOTAL ITALY | | | 1,086,783 |
|
| Japan - 10.9% | | | |
| Benefit One, Inc. | | 48,100 | 924,068 |
| Daikin Industries Ltd. | | 10,926 | 1,207,442 |
| Daito Trust Construction Co. Ltd. | | 5,500 | 961,589 |
| Hoya Corp. | | 19,239 | 1,045,269 |
| Kansai Paint Co. Ltd. | | 38,400 | 986,993 |
| Kao Corp. | | 19,818 | 1,197,704 |
| Keyence Corp. | | 2,532 | 1,405,830 |
| Makita Corp. | | 24,600 | 1,030,953 |
| Misumi Group, Inc. | | 36,500 | 1,000,011 |
| Nidec Corp. | | 9,500 | 1,263,338 |
| Nippon Paint Holdings Co. Ltd. | | 28,600 | 1,008,971 |
| Nitori Holdings Co. Ltd. | | 7,100 | 1,031,853 |
| Recruit Holdings Co. Ltd. | | 45,512 | 1,115,847 |
| Relo Holdings Corp. | | 41,230 | 1,020,754 |
| SMC Corp. | | 2,900 | 1,109,425 |
| Start Today Co. Ltd. | | 32,600 | 892,902 |
| Sundrug Co. Ltd. | | 22,400 | 974,815 |
| Tsuruha Holdings, Inc. | | 8,005 | 992,481 |
|
| TOTAL JAPAN | | | 19,170,245 |
|
| Kenya - 0.5% | | | |
| Safaricom Ltd. | | 3,625,500 | 891,087 |
| Luxembourg - 0.6% | | | |
| Eurofins Scientific SA | | 1,532 | 958,303 |
| Mexico - 1.1% | | | |
| Grupo Aeroportuario del Pacifico S.A.B. de CV Series B | | 97,100 | 920,922 |
| Grupo Aeroportuario del Sureste S.A.B. de CV Series B | | 54,215 | 966,901 |
| Grupo Aeroportuario Norte S.A.B. de CV | | 16,881 | 85,181 |
|
| TOTAL MEXICO | | | 1,973,004 |
|
| Netherlands - 4.0% | | | |
| ASML Holding NV (Netherlands) | | 8,400 | 1,515,608 |
| Heineken NV (Bearer) | | 12,300 | 1,198,652 |
| IMCD Group BV | | 14,500 | 912,078 |
| RELX NV | | 60,109 | 1,357,648 |
| Wolters Kluwer NV | | 20,900 | 1,024,453 |
| Yandex NV Series A (a) | | 28,955 | 979,548 |
|
| TOTAL NETHERLANDS | | | 6,987,987 |
|
| Philippines - 1.7% | | | |
| Ayala Land, Inc. | | 1,117,600 | 935,928 |
| SM Investments Corp. | | 55,210 | 1,022,100 |
| SM Prime Holdings, Inc. | | 1,347,200 | 966,287 |
|
| TOTAL PHILIPPINES | | | 2,924,315 |
|
| Russia - 0.7% | | | |
| Sberbank of Russia | | 369,930 | 1,225,812 |
| South Africa - 1.8% | | | |
| Capitec Bank Holdings Ltd. | | 13,803 | 917,522 |
| FirstRand Ltd. | | 86,431 | 313,294 |
| Naspers Ltd. Class N | | 7,941 | 1,934,877 |
|
| TOTAL SOUTH AFRICA | | | 3,165,693 |
|
| Spain - 1.8% | | | |
| Amadeus IT Holding SA Class A | | 17,324 | 1,175,477 |
| Cellnex Telecom Sau | | 36,000 | 893,836 |
| Grifols SA | | 35,000 | 1,095,687 |
|
| TOTAL SPAIN | | | 3,165,000 |
|
| Sweden - 1.7% | | | |
| ASSA ABLOY AB (B Shares) | | 49,600 | 1,045,710 |
| Hexagon AB (B Shares) | | 19,859 | 1,018,374 |
| Indutrade AB | | 35,400 | 981,871 |
|
| TOTAL SWEDEN | | | 3,045,955 |
|
| Switzerland - 3.6% | | | |
| Compagnie Financiere Richemont SA Series A | | 14,102 | 1,300,011 |
| Kaba Holding AG (B Shares) (Reg.) | | 863 | 853,787 |
| Lonza Group AG | | 4,136 | 1,098,622 |
| Partners Group Holding AG | | 1,467 | 986,676 |
| Schindler Holding AG (participation certificate) | | 4,528 | 1,026,192 |
| Sika AG | | 152 | 1,125,164 |
|
| TOTAL SWITZERLAND | | | 6,390,452 |
|
| Taiwan - 1.6% | | | |
| Taiwan Semiconductor Manufacturing Co. Ltd. sponsored ADR | | 65,587 | 2,776,298 |
| United Kingdom - 14.3% | | | |
| Ashtead Group PLC | | 39,100 | 1,007,455 |
| British American Tobacco PLC (United Kingdom) | | 34,048 | 2,199,836 |
| Bunzl PLC | | 34,189 | 1,064,820 |
| Compass Group PLC | | 55,579 | 1,220,199 |
| Cranswick PLC | | 22,434 | 917,708 |
| Diageo PLC | | 47,804 | 1,632,451 |
| Diploma PLC | | 62,892 | 901,289 |
| DS Smith PLC | | 112,776 | 780,372 |
| Halma PLC | | 63,405 | 995,378 |
| InterContinental Hotel Group PLC | | 18,896 | 1,047,035 |
| Intertek Group PLC | | 15,121 | 1,089,500 |
| London Stock Exchange Group PLC | | 20,547 | 1,026,358 |
| Micro Focus International PLC | | 29,900 | 1,050,374 |
| Mondi PLC | | 39,331 | 951,244 |
| Prudential PLC | | 59,639 | 1,463,862 |
| Reckitt Benckiser Group PLC | | 15,657 | 1,400,780 |
| Rentokil Initial PLC | | 232,290 | 1,035,997 |
| Rightmove PLC | | 17,299 | 954,409 |
| Sage Group PLC | | 105,583 | 1,045,415 |
| St. James's Place Capital PLC | | 63,054 | 985,681 |
| Unilever PLC | | 41,368 | 2,344,490 |
|
| TOTAL UNITED KINGDOM | | | 25,114,653 |
|
| United States of America - 13.3% | | | |
| A.O. Smith Corp. | | 15,989 | 946,549 |
| Adobe Systems, Inc. (a) | | 5,171 | 905,752 |
| Alphabet, Inc. Class C (a) | | 959 | 974,958 |
| Amazon.com, Inc. (a) | | 813 | 898,593 |
| American Tower Corp. | | 6,346 | 911,730 |
| Amphenol Corp. Class A | | 11,238 | 977,706 |
| Cintas Corp. | | 6,455 | 962,053 |
| Constellation Brands, Inc. Class A (sub. vtg.) | | 4,358 | 954,794 |
| Equinix, Inc. | | 2,008 | 930,708 |
| Facebook, Inc. Class A (a) | | 5,389 | 970,343 |
| Fiserv, Inc. (a) | | 7,085 | 917,012 |
| HEICO Corp. Class A | | 11,643 | 886,032 |
| Home Depot, Inc. | | 5,762 | 955,224 |
| MasterCard, Inc. Class A | | 6,683 | 994,230 |
| Moody's Corp. | | 6,481 | 922,959 |
| MSCI, Inc. | | 7,793 | 914,586 |
| Northrop Grumman Corp. | | 3,000 | 886,590 |
| PayPal Holdings, Inc. (a) | | 12,106 | 878,411 |
| Priceline Group, Inc. (a) | | 480 | 917,741 |
| S&P Global, Inc. | | 5,890 | 921,608 |
| Sherwin-Williams Co. | | 2,354 | 930,183 |
| SS&C Technologies Holdings, Inc. | | 2,200 | 88,440 |
| Thermo Fisher Scientific, Inc. | | 4,700 | 911,001 |
| TransDigm Group, Inc. | | 3,211 | 891,053 |
| UnitedHealth Group, Inc. | | 4,563 | 959,234 |
| Visa, Inc. Class A | | 8,585 | 944,178 |
|
| TOTAL UNITED STATES OF AMERICA | | | 23,351,668 |
|
| TOTAL COMMON STOCKS | | | |
| (Cost $162,108,982) | | | 172,435,572 |
|
| Nonconvertible Preferred Stocks - 0.7% | | | |
| Brazil - 0.7% | | | |
| Itau Unibanco Holding SA sponsored ADR | | | |
| (Cost $1,097,330) | | 93,185 | 1,193,700 |
|
| Money Market Funds - 2.8% | | | |
| Fidelity Cash Central Fund, 1.10%(b) | | | |
| (Cost $5,002,132) | | 5,001,132 | 5,002,132 |
| TOTAL INVESTMENT IN SECURITIES - 101.8% | | | |
| (Cost $168,208,444) | | | 178,631,404 |
| NET OTHER ASSETS (LIABILITIES) - (1.8)% | | | (3,227,758) |
| NET ASSETS - 100% | | | $175,403,646 |
Categorizations in the Schedule of Investments are based on country or territory of incorporation.
Legend
(a) Non-income producing
(b) Affiliated fund that is generally available only to investment companies and other accounts managed by Fidelity Investments. The rate quoted is the annualized seven-day yield of the fund at period end. A complete unaudited listing of the fund's holdings as of its most recent quarter end is available upon request. In addition, each Fidelity Central Fund's financial statements, which are not covered by the Fund's Report of Independent Registered Public Accounting Firm, are available on the SEC's website or upon request.
Affiliated Central Funds
Information regarding fiscal year to date income earned by the Fund from investments in Fidelity Central Funds is as follows:
| Fund | Income earned |
| Fidelity Cash Central Fund | $5,128 |
| Total | $5,128 |
Investment Valuation
The following is a summary of the inputs used, as of October 31, 2017, involving the Fund's assets and liabilities carried at fair value. The inputs or methodology used for valuing securities may not be an indication of the risk associated with investing in those securities. For more information on valuation inputs, and their aggregation into the levels used below, please refer to the Investment Valuation section in the accompanying Notes to Financial Statements.
| | Valuation Inputs at Reporting Date: |
| Description | Total | Level 1 | Level 2 | Level 3 |
| Investments in Securities: | | | | |
| Equities: | | | | |
| Consumer Discretionary | $18,376,324 | $13,403,645 | $4,972,679 | $-- |
| Consumer Staples | 19,539,649 | 7,558,538 | 11,981,111 | -- |
| Financials | 20,562,805 | 17,873,131 | 2,689,674 | -- |
| Health Care | 9,712,080 | 8,666,811 | 1,045,269 | -- |
| Industrials | 45,186,756 | 36,489,962 | 8,696,794 | -- |
| Information Technology | 38,113,973 | 30,215,671 | 7,898,302 | -- |
| Materials | 10,911,569 | 7,792,842 | 3,118,727 | -- |
| Real Estate | 7,815,484 | 5,833,141 | 1,982,343 | -- |
| Telecommunication Services | 1,784,923 | 1,784,923 | -- | -- |
| Utilities | 1,625,709 | 1,625,709 | -- | -- |
| Money Market Funds | 5,002,132 | 5,002,132 | -- | -- |
| Total Investments in Securities: | $178,631,404 | $136,246,505 | $42,384,899 | $-- |
See accompanying notes which are an integral part of the financial statements.
Financial Statements
Statement of Assets and Liabilities
| | | October 31, 2017 |
| Assets | | |
Investment in securities, at value — See accompanying schedule:
Unaffiliated issuers (cost $163,206,312) | $173,629,272 | |
| Fidelity Central Funds (cost $5,002,132) | 5,002,132 | |
| Total Investment in Securities (cost $168,208,444) | | $178,631,404 |
| Receivable for investments sold | | 2,526,841 |
| Receivable for fund shares sold | | 12,564 |
| Dividends receivable | | 101,294 |
| Distributions receivable from Fidelity Central Funds | | 987 |
| Other receivables | | 59 |
| Total assets | | 181,273,149 |
| Liabilities | | |
| Payable to custodian bank | $559,501 | |
| Payable for investments purchased | 5,171,274 | |
| Payable for fund shares redeemed | 44,765 | |
| Accrued management fee | 93,963 | |
| Total liabilities | | 5,869,503 |
| Net Assets | | $175,403,646 |
| Net Assets consist of: | | |
| Paid in capital | | $164,612,556 |
| Undistributed net investment income | | 215,830 |
| Accumulated undistributed net realized gain (loss) on investments and foreign currency transactions | | 155,186 |
| Net unrealized appreciation (depreciation) on investments and assets and liabilities in foreign currencies | | 10,420,074 |
| Net Assets, for 15,933,669 shares outstanding | | $175,403,646 |
| Net Asset Value, offering price and redemption price per share ($175,403,646 ÷ 15,933,669 shares) | | $11.01 |
See accompanying notes which are an integral part of the financial statements.
Statement of Operations
| | | For the period
May 25, 2017 (commencement of operations) to
October 31, 2017 |
| Investment Income | | |
| Dividends | | $532,047 |
| Income from Fidelity Central Funds | | 5,128 |
| Income before foreign taxes withheld | | 537,175 |
| Less foreign taxes withheld | | (29,175) |
| Total income | | 508,000 |
| Expenses | | |
| Management fee | $284,614 | |
| Independent trustees' fees and expenses | 98 | |
| Total expenses before reductions | 284,712 | |
| Expense reductions | (104) | 284,608 |
| Net investment income (loss) | | 223,392 |
| Realized and Unrealized Gain (Loss) | | |
| Net realized gain (loss) on: | | |
| Investment securities: | | |
| Unaffiliated issuers | 156,179 | |
| Foreign currency transactions | (8,635) | |
| Total net realized gain (loss) | | 147,544 |
| Change in net unrealized appreciation (depreciation) on: | | |
| Investment securities: | | |
| Unaffiliated issuers | 10,422,960 | |
| Assets and liabilities in foreign currencies | (2,886) | |
| Total change in net unrealized appreciation (depreciation) | | 10,420,074 |
| Net gain (loss) | | 10,567,618 |
| Net increase (decrease) in net assets resulting from operations | | $10,791,010 |
See accompanying notes which are an integral part of the financial statements.
Statement of Changes in Net Assets
| | For the period
May 25, 2017 (commencement of operations) to
October 31, 2017 |
| Increase (Decrease) in Net Assets | |
| Operations | |
| Net investment income (loss) | $223,392 |
| Net realized gain (loss) | 147,544 |
| Change in net unrealized appreciation (depreciation) | 10,420,074 |
| Net increase (decrease) in net assets resulting from operations | 10,791,010 |
| Share transactions | |
| Proceeds from sales of shares | 174,806,251 |
| Cost of shares redeemed | (10,193,615) |
| Net increase (decrease) in net assets resulting from share transactions | 164,612,636 |
| Total increase (decrease) in net assets | 175,403,646 |
| Net Assets | |
| Beginning of period | – |
| End of period | $175,403,646 |
| Other Information | |
| Undistributed net investment income end of period | $215,830 |
| Shares | |
| Sold | 16,893,772 |
| Redeemed | (960,103) |
| Net increase (decrease) | 15,933,669 |
See accompanying notes which are an integral part of the financial statements.
Financial Highlights
Fidelity International Capital Appreciation K6 Fund
| Years ended October 31, | 2017 A |
| Selected Per–Share Data | |
| Net asset value, beginning of period | $10.00 |
| Income from Investment Operations | |
| Net investment income (loss)B | .02 |
| Net realized and unrealized gain (loss) | .99 |
| Total from investment operations | 1.01 |
| Net asset value, end of period | $11.01 |
| Total ReturnC,D | 10.10% |
| Ratios to Average Net AssetsE,F | |
| Expenses before reductions | .65%G |
| Expenses net of fee waivers, if any | .65%G |
| Expenses net of all reductions | .65%G |
| Net investment income (loss) | .51%G |
| Supplemental Data | |
| Net assets, end of period (000 omitted) | $175,404 |
| Portfolio turnover rateH | 81%I,J |
A For the period May 25, 2017 (commencement of operations) to October 31, 2017.
B Calculated based on average shares outstanding during the period.
C Total returns for periods of less than one year are not annualized.
D Total returns would have been lower if certain expenses had not been reduced during the applicable periods shown.
E Fees and expenses of any underlying Fidelity Central Funds are not included in the Fund's expense ratio. The Fund indirectly bears its proportionate share of the expenses of any underlying Fidelity Central Funds.
F Expense ratios reflect operating expenses of the Fund. Expenses before reductions do not reflect amounts reimbursed by the investment adviser or reductions from brokerage service arrangements or reductions from other expense offset arrangements and do not represent the amount paid by the Fund during periods when reimbursements or reductions occur. Expense ratios before reductions for start-up periods may not be representative of longer term operating periods. Expenses net of fee waivers reflect expenses after reimbursement by the investment adviser but prior to reductions from brokerage service arrangements or other expense offset arrangements. Expenses net of all reductions represent the net expenses paid by the Fund.
G Annualized
H Amount does not include the portfolio activity of any underlying Fidelity Central Funds.
I Portfolio turnover rate excludes securities received or delivered in-kind.
J Amount not annualized.
See accompanying notes which are an integral part of the financial statements.
Notes to Financial Statements
For the period ended October 31, 2017
1. Organization.
Fidelity International Capital Appreciation K6 Fund (the Fund) is a fund of Fidelity Investment Trust (the Trust) and is authorized to issue an unlimited number of shares. Share transactions on the Statement of Changes in Net Assets may contain exchanges between affiliated funds. The Trust is registered under the Investment Company Act of 1940, as amended (the 1940 Act), as an open-end management investment company organized as a Massachusetts business trust. Shares generally are available only to employer-sponsored retirement plans that are recordkept by Fidelity. The Fund's investments in emerging markets can be subject to social, economic, regulatory, and political uncertainties and can be extremely volatile.
2. Investments in Fidelity Central Funds.
The Fund invests in Fidelity Central Funds, which are open-end investment companies generally available only to other investment companies and accounts managed by the investment adviser and its affiliates. The Fund's Schedule of Investments lists each of the Fidelity Central Funds held as of period end, if any, as an investment of the Fund, but does not include the underlying holdings of each Fidelity Central Fund. As an Investing Fund, the Fund indirectly bears its proportionate share of the expenses of the underlying Fidelity Central Funds.
The Money Market Central Funds seek preservation of capital and current income and are managed by Fidelity Investments Money Management, Inc. (FIMM), an affiliate of the investment adviser. Annualized expenses of the Money Market Central Funds as of their most recent shareholder report date are less than .005%.
A complete unaudited list of holdings for each Fidelity Central Fund is available upon request or at the Securities and Exchange Commission (the SEC) website at www.sec.gov. In addition, the financial statements of the Fidelity Central Funds, which are not covered by the Fund's Report of Independent Registered Public Accounting Firm, are available on the SEC website or upon request.
3. Significant Accounting Policies.
The Fund is an investment company and applies the accounting and reporting guidance of the Financial Accounting Standards Board (FASB) Accounting Standards Codification Topic 946 Financial Services – Investments Companies. The financial statements have been prepared in conformity with accounting principles generally accepted in the United States of America (GAAP), which require management to make certain estimates and assumptions at the date of the financial statements. Actual results could differ from those estimates. Subsequent events, if any, through the date that the financial statements were issued have been evaluated in the preparation of the financial statements. The following summarizes the significant accounting policies of the Fund:
Investment Valuation. Investments are valued as of 4:00 p.m. Eastern time on the last calendar day of the period. The Board of Trustees (the Board) has delegated the day to day responsibility for the valuation of the Fund's investments to the Fair Value Committee (the Committee) established by the Fund's investment adviser. In accordance with valuation policies and procedures approved by the Board, the Fund attempts to obtain prices from one or more third party pricing vendors or brokers to value its investments. When current market prices, quotations or currency exchange rates are not readily available or reliable, investments will be fair valued in good faith by the Committee, in accordance with procedures adopted by the Board. Factors used in determining fair value vary by investment type and may include market or investment specific events. The frequency with which these procedures are used cannot be predicted and they may be utilized to a significant extent. The Committee oversees the Fund's valuation policies and procedures and reports to the Board on the Committee's activities and fair value determinations. The Board monitors the appropriateness of the procedures used in valuing the Fund's investments and ratifies the fair value determinations of the Committee.
The Fund categorizes the inputs to valuation techniques used to value its investments into a disclosure hierarchy consisting of three levels as shown below:
- Level 1 – quoted prices in active markets for identical investments
- Level 2 – other significant observable inputs (including quoted prices for similar investments, interest rates, prepayment speeds, etc.)
- Level 3 – unobservable inputs (including the Fund's own assumptions based on the best information available)
Valuation techniques used to value the Fund's investments by major category are as follows:
Equity securities, including restricted securities, for which market quotations are readily available, are valued at the last reported sale price or official closing price as reported by a third party pricing vendor on the primary market or exchange on which they are traded and are categorized as Level 1 in the hierarchy. In the event there were no sales during the day or closing prices are not available, securities are valued at the last quoted bid price or may be valued using the last available price and are generally categorized as Level 2 in the hierarchy. For foreign equity securities, when market or security specific events arise, comparisons to the valuation of American Depositary Receipts (ADRs), futures contracts, Exchange-Traded Funds (ETFs) and certain indexes as well as quoted prices for similar securities may be used and would be categorized as Level 2 in the hierarchy. Utilizing these techniques may result in transfers between Level 1 and Level 2. For equity securities, including restricted securities, where observable inputs are limited, assumptions about market activity and risk are used and these securities may be categorized as Level 3 in the hierarchy.
Investments in open-end mutual funds, including the Fidelity Central Funds, are valued at their closing net asset value (NAV) each business day and are categorized as Level 1 in the hierarchy.
Changes in valuation techniques may result in transfers in or out of an assigned level within the disclosure hierarchy. The aggregate value of investments by input level as of October 31, 2017 is included at the end of the Fund's Schedule of Investments.
Foreign Currency. The Fund may use foreign currency contracts to facilitate transactions in foreign-denominated securities. Gains and losses from these transactions may arise from changes in the value of the foreign currency or if the counterparties do not perform under the contracts' terms.
Foreign-denominated assets, including investment securities, and liabilities are translated into U.S. dollars at the exchange rates at period end. Purchases and sales of investment securities, income and dividends received and expenses denominated in foreign currencies are translated into U.S. dollars at the exchange rate in effect on the transaction date.
The effects of exchange rate fluctuations on investments are included with the net realized and unrealized gain (loss) on investment securities. Other foreign currency transactions resulting in realized and unrealized gain (loss) are disclosed separately.
Investment Transactions and Income. For financial reporting purposes, the Fund's investment holdings and NAV include trades executed through the end of the last business day of the period. The NAV per share for processing shareholder transactions is calculated as of the close of business of the New York Stock Exchange (NYSE), normally 4:00 p.m. Eastern time and includes trades executed through the end of the prior business day. Gains and losses on securities sold are determined on the basis of identified cost. Dividend income is recorded on the ex-dividend date, except for certain dividends from foreign securities where the ex-dividend date may have passed, which are recorded as soon as the Fund is informed of the ex-dividend date. Non-cash dividends included in dividend income, if any, are recorded at the fair market value of the securities received. Income and capital gain distributions from Fidelity Central Funds, if any, are recorded on the ex-dividend date. Certain distributions received by the Fund represent a return of capital or capital gain. The Fund determines the components of these distributions subsequent to the ex-dividend date, based upon receipt of tax filings or other correspondence relating to the underlying investment. These distributions are recorded as a reduction of cost of investments and/or as a realized gain. Investment income is recorded net of foreign taxes withheld where recovery of such taxes is uncertain.
Expenses. Expenses directly attributable to a fund are charged to that fund. Expenses attributable to more than one fund are allocated among the respective funds on the basis of relative net assets or other appropriate methods. Expense estimates are accrued in the period to which they relate and adjustments are made when actual amounts are known.
Income Tax Information and Distributions to Shareholders. Each year, the Fund intends to qualify as a regulated investment company under Subchapter M of the Internal Revenue Code, including distributing substantially all of its taxable income and realized gains. As a result, no provision for U.S. Federal income taxes is required. As of October 31, 2017, the Fund did not have any unrecognized tax benefits in the financial statements; nor is the Fund aware of any tax positions for which it is reasonably possible that the total amounts of unrecognized tax benefits will significantly change in the next twelve months. The Fund files a U.S. federal tax return, in addition to state and local tax returns as required. The Fund's federal income tax returns are subject to examination by the Internal Revenue Service (IRS) for a period of three fiscal years after they are filed. State and local tax returns may be subject to examination for an additional fiscal year depending on the jurisdiction. Foreign taxes are provided for based on the Fund's understanding of the tax rules and rates that exist in the foreign markets in which it invests.
Distributions are declared and recorded on the ex-dividend date. Income and capital gain distributions are determined in accordance with income tax regulations, which may differ from GAAP.
Capital accounts within the financial statements are adjusted for permanent book-tax differences. These adjustments have no impact on net assets or the results of operations. Capital accounts are not adjusted for temporary book-tax differences which will reverse in a subsequent period.
Book-tax differences are primarily due to foreign currency transactions, passive foreign investment companies (PFIC) and losses deferred due to wash sales.
As of period end, the cost and unrealized appreciation (depreciation) in securities, and derivatives if applicable, for federal income tax purposes were as follows:
| Gross unrealized appreciation | $11,935,120 |
| Gross unrealized depreciation | (1,542,135) |
| Net unrealized appreciation (depreciation) | $10,392,985 |
| Tax Cost | $168,238,419 |
The tax-based components of distributable earnings as of period end were as follows:
| Undistributed ordinary income | $394,111 |
| Undistributed long-term capital gain | $3,108 |
| Net unrealized appreciation (depreciation) on securities and other investments | $10,393,872 |
4. Purchases and Sales of Investments.
Purchases and sales of securities, other than short-term securities and in-kind transactions, aggregated $73,024,048 and $73,200,549, respectively.
5. Fees and Other Transactions with Affiliates.
Management Fee. Fidelity Management & Research Company (the investment adviser) and its affiliates provide the Fund with investment management related services for which the Fund pays a monthly management fee that is based on an annual rate of .65% of average net assets. Under the management contract, the investment adviser or an affiliate pays all other expenses of the Fund, excluding fees and expenses of the independent Trustees, and certain miscellaneous expenses such as proxy and shareholder meeting expenses.
Brokerage Commissions. The Fund placed a portion of its portfolio transactions with brokerage firms which are affiliates of the investment adviser. Brokerage commissions are included in net realized gain (loss) and change in net unrealized appreciation (depreciation) in the Statement of Operations. The commissions paid to these affiliated firms were $460 for the period.
Interfund Trades. The Fund may purchase from or sell securities to other Fidelity Funds under procedures adopted by the Board. The procedures have been designed to ensure these interfund trades are executed in accordance with Rule 17a-7 of the 1940 Act. Interfund trades are included within the respective purchases and sales amounts shown in the Purchases and Sales of Investments note.
Exchanges In-Kind. During the period, an affiliated entity completed an exchange in-kind with the Fund. The affiliated entity delivered investments and cash valued at $165,479,456 in exchange for 16,003,816 shares of the Fund. The amount of in-kind exchanges is included in share transactions in the accompanying Statement of Changes in Net Assets. The Fund recognized no gain or loss for federal income tax purposes.
6. Expense Reductions.
Commissions paid to certain brokers with whom the investment adviser, or its affiliates, places trades on behalf of the Fund include an amount in addition to trade execution, which may be rebated back to the Fund to offset certain expenses. This amount totaled $103 for the period. In addition, through arrangements with the Fund's custodian, credits realized as a result of certain uninvested cash balances were used to reduce the Fund's management fee. During the period, these credits reduced the Fund's management fee by $1.
7. Other.
The Fund's organizational documents provide former and current trustees and officers with a limited indemnification against liabilities arising in connection with the performance of their duties to the Fund. In the normal course of business, the Fund may also enter into contracts that provide general indemnifications. The Fund's maximum exposure under these arrangements is unknown as this would be dependent on future claims that may be made against the Fund. The risk of material loss from such claims is considered remote.
Report of Independent Registered Public Accounting Firm
To the Trustees of Fidelity Investment Trust and Shareholders of Fidelity International Capital Appreciation K6 Fund:
We have audited the accompanying statement of assets and liabilities of Fidelity International Capital Appreciation K6 Fund (the Fund), a fund of Fidelity Investment Trust, including the schedule of investments, as of October 31, 2017, and the related statement of operations, the statement of changes in net assets, and the financial highlights for the period from May 25, 2017 (commencement of operations) to October 31, 2017. These financial statements and financial highlights are the responsibility of the Fund's management. Our responsibility is to express an opinion on these financial statements and financial highlights based on our audit.
We conducted our audit in accordance with the standards of the Public Company Accounting Oversight Board (United States). Those standards require that we plan and perform the audit to obtain reasonable assurance about whether the financial statements and financial highlights are free of material misstatement. The Fund is not required to have, nor were we engaged to perform, an audit of its internal control over financial reporting. Our audits included consideration of internal control over financial reporting as a basis for designing audit procedures that are appropriate in the circumstances, but not for the purpose of expressing an opinion on the effectiveness of the Fund's internal control over financial reporting. Accordingly, we express no such opinion. An audit also includes examining, on a test basis, evidence supporting the amounts and disclosures in the financial statements, assessing the accounting principles used and significant estimates made by management, as well as evaluating the overall financial statement presentation. Our procedures included confirmation of securities owned as of October 31, 2017, by correspondence with the custodians and brokers; when replies were not received from brokers, we performed other auditing procedures. We believe that our audit provides a reasonable basis for our opinion.
In our opinion, such financial statements and financial highlights referred to above present fairly, in all material respects, the financial position of Fidelity International Capital Appreciation K6 Fund as of October 31, 2017, the results of its operations, the changes in its net assets, and the financial highlights for the period from May 25, 2017 (commencement of operations) to October 31, 2017 in conformity with accounting principles generally accepted in the United States of America.
DELOITTE & TOUCHE LLP
Boston, Massachusetts
December 15, 2017
Trustees and Officers
The Trustees, Members of the Advisory Board (if any), and officers of the trust and fund, as applicable, are listed below. The Board of Trustees governs the fund and is responsible for protecting the interests of shareholders. The Trustees are experienced executives who meet periodically throughout the year to oversee the fund's activities, review contractual arrangements with companies that provide services to the fund, oversee management of the risks associated with such activities and contractual arrangements, and review the fund's performance. Except for Jonathan Chiel, each of the Trustees oversees 190 funds. Mr. Chiel oversees 143 funds.
The Trustees hold office without limit in time except that (a) any Trustee may resign; (b) any Trustee may be removed by written instrument, signed by at least two-thirds of the number of Trustees prior to such removal; (c) any Trustee who requests to be retired or who has become incapacitated by illness or injury may be retired by written instrument signed by a majority of the other Trustees; and (d) any Trustee may be removed at any special meeting of shareholders by a two-thirds vote of the outstanding voting securities of the trust. Each Trustee who is not an interested person (as defined in the 1940 Act) of the trust and the fund is referred to herein as an Independent Trustee. Each Independent Trustee shall retire not later than the last day of the calendar year in which his or her 75th birthday occurs. The Independent Trustees may waive this mandatory retirement age policy with respect to individual Trustees. Officers and Advisory Board Members hold office without limit in time, except that any officer or Advisory Board Member may resign or may be removed by a vote of a majority of the Trustees at any regular meeting or any special meeting of the Trustees. Except as indicated, each individual has held the office shown or other offices in the same company for the past five years.
The fund’s Statement of Additional Information (SAI) includes more information about the Trustees. To request a free copy, call Fidelity at 1-800-835-5092.
Experience, Skills, Attributes, and Qualifications of the Trustees. The Governance and Nominating Committee has adopted a statement of policy that describes the experience, qualifications, attributes, and skills that are necessary and desirable for potential Independent Trustee candidates (Statement of Policy). The Board believes that each Trustee satisfied at the time he or she was initially elected or appointed a Trustee, and continues to satisfy, the standards contemplated by the Statement of Policy. The Governance and Nominating Committee also engages professional search firms to help identify potential Independent Trustee candidates who have the experience, qualifications, attributes, and skills consistent with the Statement of Policy. From time to time, additional criteria based on the composition and skills of the current Independent Trustees, as well as experience or skills that may be appropriate in light of future changes to board composition, business conditions, and regulatory or other developments, have also been considered by the professional search firms and the Governance and Nominating Committee. In addition, the Board takes into account the Trustees' commitment and participation in Board and committee meetings, as well as their leadership of standing and ad hoc committees throughout their tenure.
In determining that a particular Trustee was and continues to be qualified to serve as a Trustee, the Board has considered a variety of criteria, none of which, in isolation, was controlling. The Board believes that, collectively, the Trustees have balanced and diverse experience, qualifications, attributes, and skills, which allow the Board to operate effectively in governing the fund and protecting the interests of shareholders. Information about the specific experience, skills, attributes, and qualifications of each Trustee, which in each case led to the Board's conclusion that the Trustee should serve (or continue to serve) as a trustee of the fund, is provided below.
Board Structure and Oversight Function. James C. Curvey is an interested person and currently serves as Chairman. The Trustees have determined that an interested Chairman is appropriate and benefits shareholders because an interested Chairman has a personal and professional stake in the quality and continuity of services provided to the fund. Independent Trustees exercise their informed business judgment to appoint an individual of their choosing to serve as Chairman, regardless of whether the Trustee happens to be independent or a member of management. The Independent Trustees have determined that they can act independently and effectively without having an Independent Trustee serve as Chairman and that a key structural component for assuring that they are in a position to do so is for the Independent Trustees to constitute a substantial majority for the Board. The Independent Trustees also regularly meet in executive session. Ned C. Lautenbach serves as Chairman of the Independent Trustees and as such (i) acts as a liaison between the Independent Trustees and management with respect to matters important to the Independent Trustees and (ii) with management prepares agendas for Board meetings.
Fidelity® funds are overseen by different Boards of Trustees. The fund's Board oversees Fidelity's high income and certain equity funds, and other Boards oversee Fidelity's investment-grade bond, money market, asset allocation, and sector funds. The asset allocation funds may invest in Fidelity® funds overseen by the fund's Board. The use of separate Boards, each with its own committee structure, allows the Trustees of each group of Fidelity® funds to focus on the unique issues of the funds they oversee, including common research, investment, and operational issues. On occasion, the separate Boards establish joint committees to address issues of overlapping consequences for the Fidelity® funds overseen by each Board.
The Trustees operate using a system of committees to facilitate the timely and efficient consideration of all matters of importance to the Trustees, the fund, and fund shareholders and to facilitate compliance with legal and regulatory requirements and oversight of the fund's activities and associated risks. The Board, acting through its committees, has charged FMR and its affiliates with (i) identifying events or circumstances the occurrence of which could have demonstrably adverse effects on the fund's business and/or reputation; (ii) implementing processes and controls to lessen the possibility that such events or circumstances occur or to mitigate the effects of such events or circumstances if they do occur; and (iii) creating and maintaining a system designed to evaluate continuously business and market conditions in order to facilitate the identification and implementation processes described in (i) and (ii) above. Because the day-to-day operations and activities of the fund are carried out by or through FMR, its affiliates, and other service providers, the fund's exposure to risks is mitigated but not eliminated by the processes overseen by the Trustees. While each of the Board's committees has responsibility for overseeing different aspects of the fund's activities, oversight is exercised primarily through the Operations, Audit, and Compliance Committees. In addition, the Independent Trustees have worked with FMR to enhance the Board's oversight of investment and financial risks, legal and regulatory risks, technology risks, and operational risks, including the development of additional risk reporting to the Board. For example, a working group comprised of Independent Trustees and FMR has worked and continues to work to review the Fidelity® funds' valuation-related activities, reporting and risk management. Appropriate personnel, including but not limited to the fund's Chief Compliance Officer (CCO), FMR's internal auditor, the independent accountants, the fund's Treasurer and portfolio management personnel, make periodic reports to the Board's committees, as appropriate, including an annual review of Fidelity's risk management program for the Fidelity® funds. The responsibilities of each standing committee, including their oversight responsibilities, are described further under "Standing Committees of the Trustees."
Interested Trustees*:
Correspondence intended for a Trustee who is an interested person may be sent to Fidelity Investments, 245 Summer Street, Boston, Massachusetts 02210.
Name, Year of Birth; Principal Occupations and Other Relevant Experience+
Jonathan Chiel (1957)
Year of Election or Appointment: 2016
Trustee
Mr. Chiel also serves as Trustee of other Fidelity® funds. Mr. Chiel is Executive Vice President and General Counsel for FMR LLC (diversified financial services company, 2012-present). Previously, Mr. Chiel served as general counsel (2004-2012) and senior vice president and deputy general counsel (2000-2004) for John Hancock Financial Services; a partner with Choate, Hall & Stewart (1996-2000) (law firm); and an Assistant United States Attorney for the United States Attorney’s Office of the District of Massachusetts (1986-95), including Chief of the Criminal Division (1993-1995). Mr. Chiel is a director on the boards of the Boston Bar Foundation and the Maimonides School.
James C. Curvey (1935)
Year of Election or Appointment: 2007
Trustee
Chairman of the Board of Trustees
Mr. Curvey also serves as Trustee of other Fidelity® funds. Mr. Curvey is a Director of Fidelity Research & Analysis Co. (investment adviser firm, 2009-present), and Vice Chairman (2007-present) and Director of FMR LLC (diversified financial services company). In addition, Mr. Curvey serves as an Overseer for the Boston Symphony Orchestra and a member of the board of Artis-Naples, Naples, Florida, and as a Trustee for Brewster Academy, Wolfeboro, New Hampshire. Previously, Mr. Curvey served as a Director of Fidelity Investments Money Management, Inc. (investment adviser firm, 2009-2014) and a Director of FMR and FMR Co., Inc. (investment adviser firms, 2007-2014).
Charles S. Morrison (1960)
Year of Election or Appointment: 2014
Trustee
Mr. Morrison also serves as Trustee of other funds. He serves as President of Fidelity Management & Research Company (FMR) (investment adviser firm, 2016-present), a Director of Fidelity Investments Money Management, Inc. (FIMM) (investment adviser firm, 2014-present), Director of Fidelity SelectCo, LLC (investment adviser firm, 2014-present), President, Asset Management (2014-present), and is an employee of Fidelity Investments. Previously, Mr. Morrison served as Vice President of Fidelity's Fixed Income and Asset Allocation Funds (2012-2014), President, Fixed Income (2011-2014), Vice President of Fidelity's Money Market Funds (2005-2009), President, Money Market Group Leader of FMR (investment adviser firm, 2009), and Senior Vice President, Money Market Group of FMR (2004-2009). Mr. Morrison also served as Vice President of Fidelity's Bond Funds (2002-2005), certain Balanced Funds (2002-2005), and certain Asset Allocation Funds (2002-2007), and as Senior Vice President (2002-2005) of Fidelity's Bond Division.
* Determined to be an “Interested Trustee” by virtue of, among other things, his or her affiliation with the trust or various entities under common control with FMR.
+ The information includes the Trustee's principal occupation during the last five years and other information relating to the experience, attributes, and skills relevant to the Trustee's qualifications to serve as a Trustee, which led to the conclusion that the Trustee should serve as a Trustee for the fund.
Independent Trustees:
Correspondence intended for an Independent Trustee may be sent to Fidelity Investments, P.O. Box 55235, Boston, Massachusetts 02205-5235.
Name, Year of Birth; Principal Occupations and Other Relevant Experience+
Dennis J. Dirks (1948)
Year of Election or Appointment: 2005
Trustee
Mr. Dirks also serves as Trustee of other Fidelity® funds. Prior to his retirement in May 2003, Mr. Dirks was Chief Operating Officer and a member of the Board of The Depository Trust & Clearing Corporation (DTCC). He also served as President, Chief Operating Officer, and Board member of The Depository Trust Company (DTC) and President and Board member of the National Securities Clearing Corporation (NSCC). In addition, Mr. Dirks served as Chief Executive Officer and Board member of the Government Securities Clearing Corporation, Chief Executive Officer and Board member of the Mortgage-Backed Securities Clearing Corporation, as a Trustee and a member of the Finance Committee of Manhattan College (2005-2008), as a Trustee and a member of the Finance Committee of AHRC of Nassau County (2006-2008), as a member of the Independent Directors Council (IDC) Governing Council (2010-2015), and as a member of the Board of Directors for The Brookville Center for Children’s Services, Inc. (2009-2017). Mr. Dirks is a member of the Finance Committee (2016-present) and Board of Directors (2017-present) of the Asolo Repertory Theatre.
Alan J. Lacy (1953)
Year of Election or Appointment: 2008
Trustee
Mr. Lacy also serves as Trustee of other Fidelity® funds. Mr. Lacy serves as a Director of Bristol-Myers Squibb Company (global pharmaceuticals, 2008-present). He is a Trustee of the California Chapter of The Nature Conservancy (2015-present) and a Director of the Center for Advanced Study in the Behavioral Sciences at Stanford University (2015-present). In addition, Mr. Lacy served as Senior Adviser (2007-2014) of Oak Hill Capital Partners, L.P. (private equity) and also served as Chief Executive Officer (2005) and Vice Chairman (2005-2006) of Sears Holdings Corporation (retail) and Chief Executive Officer and Chairman of the Board of Sears, Roebuck and Co. (retail, 2000-2005). Previously, Mr. Lacy served as Chairman (2014-2017) and a member (2010-2017) of the Board of Directors of Dave & Buster’s Entertainment, Inc. (restaurant and entertainment complexes), as Chairman (2008-2011) and a member (2006-2015) of the Board of Trustees of the National Parks Conservation Association, and as a member of the Board of Directors for The Hillman Companies, Inc. (hardware wholesalers, 2010-2014), Earth Fare, Inc. (retail grocery, 2010-2014), and The Western Union Company (global money transfer, 2006-2011).
Ned C. Lautenbach (1944)
Year of Election or Appointment: 2000
Trustee
Chairman of the Independent Trustees
Mr. Lautenbach also serves as Trustee of other Fidelity® funds. Mr. Lautenbach currently serves as Vice Chair of the Board of Governors, State University System of Florida (2013-present) and is a member of the Council on Foreign Relations (1994-present). He is also a member and has most recently served as Chairman of the Board of Directors of Artis-Naples (2012-present). Previously, Mr. Lautenbach served as a member and then Lead Director of the Board of Directors of Eaton Corporation (diversified industrial, 1997-2016). He was also a Partner and Advisory Partner at Clayton, Dubilier & Rice, LLC (private equity investment, 1998-2010), as well as a Director of Sony Corporation (2006-2007). In addition, Mr. Lautenbach also had a 30-year career with IBM (technology company) during which time he served as Senior Vice President and a member of the Corporate Executive Committee (1968-1998).
Joseph Mauriello (1944)
Year of Election or Appointment: 2008
Trustee
Mr. Mauriello also serves as Trustee of other Fidelity® funds. Prior to his retirement in January 2006, Mr. Mauriello served in numerous senior management positions including Deputy Chairman and Chief Operating Officer (2004-2005), and Vice Chairman of Financial Services (2002-2004) of KPMG LLP US (professional services, 1965-2005). Mr. Mauriello currently serves as a member of the Board of Directors of XL Group plc. (global insurance and re-insurance, 2006-present) and the Independent Directors Council (IDC) Governing Council (2015-present). Previously, Mr. Mauriello served as a Director of the Hamilton Funds of the Bank of New York (2006-2007) and of Arcadia Resources Inc. (health care services and products, 2007-2012).
Cornelia M. Small (1944)
Year of Election or Appointment: 2005
Trustee
Ms. Small also serves as Trustee of other Fidelity® funds. Ms. Small is a member of the Board of Directors (2009-present) and Chair of the Investment Committee (2010-present) of the Teagle Foundation. Ms. Small also serves on the Investment Committee of the Berkshire Taconic Community Foundation (2008-present). Previously, Ms. Small served as Chairperson (2002-2008) and a member of the Investment Committee and Chairperson (2008-2012) and a member of the Board of Trustees of Smith College. In addition, Ms. Small served as Chief Investment Officer, Director of Global Equity Investments, and a member of the Board of Directors of Scudder, Stevens & Clark and Scudder Kemper Investments.
William S. Stavropoulos (1939)
Year of Election or Appointment: 2001
Trustee
Vice Chairman of the Independent Trustees
Mr. Stavropoulos also serves as Trustee of other Fidelity® funds. Mr. Stavropoulos serves as President and Founder of the Michigan Baseball Foundation, the Great Lakes Loons (2007-present). Mr. Stavropoulos is Chairman Emeritus of the Board of Directors of The Dow Chemical Company, where he previously served in numerous senior management positions, including President, CEO (1995-2000; 2002-2004), Chairman of the Executive Committee (2000-2006), and as a member of the Board of Directors (1990-2006). Currently, Mr. Stavropoulos is Chairman of the Board of Directors of Univar Inc. (global distributor of commodity and specialty chemicals), a Director of Teradata Corporation (data warehousing and technology solutions), and a member of the Advisory Board for Metalmark Capital LLC (private equity investment, 2005-present). Mr. Stavropoulos is an operating advisor to Clayton, Dubilier & Rice, LLC (private equity investment). In addition, Mr. Stavropoulos is a member of the University of Notre Dame Advisory Council for the College of Science, a Trustee of the Rollin L. Gerstacker Foundation, and a Director of Artis-Naples in Naples, Florida. Previously, Mr. Stavropoulos served as a Director of Chemical Financial Corporation (bank holding company, 1993-2012) and Tyco International, Ltd. (multinational manufacturing and services, 2007-2012).
David M. Thomas (1949)
Year of Election or Appointment: 2008
Trustee
Mr. Thomas also serves as Trustee of other Fidelity® funds. Mr. Thomas serves as Non-Executive Chairman of the Board of Directors of Fortune Brands Home and Security (home and security products, 2011-present), as a member of the Board of Directors (2004-present) and Presiding Director (2013-present) of Interpublic Group of Companies, Inc. (marketing communication), and as a member of the Board of Trustees of the University of Florida (2013-present). Previously, Mr. Thomas served as Executive Chairman (2005-2006) and Chairman and Chief Executive Officer (2000-2005) of IMS Health, Inc. (pharmaceutical and healthcare information solutions), and a Director of Fortune Brands, Inc. (consumer products, 2000-2011).
+ The information includes the Trustee's principal occupation during the last five years and other information relating to the experience, attributes, and skills relevant to the Trustee's qualifications to serve as a Trustee, which led to the conclusion that the Trustee should serve as a Trustee for the fund.
Advisory Board Members and Officers:
Correspondence intended for an officer or Peter S. Lynch may be sent to Fidelity Investments, 245 Summer Street, Boston, Massachusetts 02210. Officers appear below in alphabetical order.
Name, Year of Birth; Principal Occupation
Peter S. Lynch (1944)
Year of Election or Appointment: 2003
Member of the Advisory Board
Mr. Lynch also serves as Member of the Advisory Board of other Fidelity® funds. Mr. Lynch is Vice Chairman and a Director of FMR (investment adviser firm) and FMR Co., Inc. (investment adviser firm). In addition, Mr. Lynch serves as a Trustee of Boston College and as the Chairman of the Inner-City Scholarship Fund. Previously, Mr. Lynch served on the Special Olympics International Board of Directors (1997-2006).
Elizabeth Paige Baumann (1968)
Year of Election or Appointment: 2017
Anti-Money Laundering (AML) Officer
Ms. Baumann also serves as AML Officer of other funds. She is Chief AML Officer (2012-present) and Senior Vice President (2014-present) of FMR LLC (diversified financial services company) and is an employee of Fidelity Investments. Previously, Ms. Baumann served as AML Officer of the funds (2012-2016), and Vice President (2007-2014) and Deputy Anti-Money Laundering Officer (2007-2012) of FMR LLC.
Marc R. Bryant (1966)
Year of Election or Appointment: 2015
Secretary and Chief Legal Officer (CLO)
Mr. Bryant also serves as Secretary and CLO of other funds. Mr. Bryant serves as CLO, Secretary, and Senior Vice President of Fidelity Management & Research Company (investment adviser firm, 2015-present) and FMR Co., Inc. (investment adviser firm, 2015-present); Secretary of Fidelity SelectCo, LLC (investment adviser firm, 2015-present) and Fidelity Investments Money Management, Inc. (investment adviser firm, 2015-present); and CLO of Fidelity Management & Research (Hong Kong) Limited and FMR Investment Management (UK) Limited (investment adviser firms, 2015-present) and Fidelity Management & Research (Japan) Limited (investment adviser firm, 2016-present). He is Senior Vice President and Deputy General Counsel of FMR LLC (diversified financial services company). Previously, Mr. Bryant served as Secretary and CLO of Fidelity Rutland Square Trust II (2010-2014) and Assistant Secretary of Fidelity's Fixed Income and Asset Allocation Funds (2013-2015). Prior to joining Fidelity Investments, Mr. Bryant served as a Senior Vice President and the Head of Global Retail Legal for AllianceBernstein L.P. (2006-2010), and as the General Counsel for ProFund Advisors LLC (2001-2006).
William C. Coffey (1969)
Year of Election or Appointment: 2009
Assistant Secretary
Mr. Coffey also serves as Assistant Secretary of other funds. He is Senior Vice President and Deputy General Counsel of FMR LLC (diversified financial services company, 2010-present), and is an employee of Fidelity Investments. Previously, Mr. Coffey served as Vice President and Associate General Counsel of FMR LLC (2005-2009).
Jonathan Davis (1968)
Year of Election or Appointment: 2010
Assistant Treasurer
Mr. Davis also serves as Assistant Treasurer of other funds, and is an employee of Fidelity Investments. Previously, Mr. Davis served as Vice President and Associate General Counsel of FMR LLC (diversified financial services company, 2003-2010).
Adrien E. Deberghes (1967)
Year of Election or Appointment: 2016
Assistant Treasurer
Mr. Deberghes also serves as an officer of other funds. He serves as Executive Vice President of Fidelity Investments Money Management, Inc. (FIMM) (investment adviser firm, 2016-present) and is an employee of Fidelity Investments (2008-present). Prior to joining Fidelity Investments, Mr. Deberghes was Senior Vice President of Mutual Fund Administration at State Street Corporation (2007-2008), Senior Director of Mutual Fund Administration at Investors Bank & Trust (2005-2007), and Director of Finance for Dunkin' Brands (2000-2005). Previously, Mr. Deberghes served in other fund officer roles.
Joseph DeSantis (1959)
Year of Election or Appointment: 2017
Vice President
Mr. DeSantis also serves as Vice President of other funds. Mr. DeSantis serves as a Director of Fidelity Management & Research (Japan) Limited (investment adviser firm, 2016-present), Chief Investment Officer, Equities (2010-present) and is an employee of Fidelity Investments.
Stephanie J. Dorsey (1969)
Year of Election or Appointment: 2010
Assistant Treasurer
Ms. Dorsey also serves as an officer of other funds. She is an employee of Fidelity Investments (2008-present) and has served in other fund officer roles. Prior to joining Fidelity Investments, Ms. Dorsey served as Treasurer (2004-2008) of the JPMorgan Mutual Funds and Vice President (2004-2008) of JPMorgan Chase Bank.
Howard J. Galligan III (1966)
Year of Election or Appointment: 2014
Chief Financial Officer
Mr. Galligan also serves as Chief Financial Officer of other funds. Mr. Galligan serves as President of Fidelity Pricing and Cash Management Services (FPCMS) (2014-present) and as a Director of Strategic Advisers, Inc. (investment adviser firm, 2008-present). Previously, Mr. Galligan served as Chief Administrative Officer of Asset Management (2011-2014) and Chief Operating Officer and Senior Vice President of Investment Support for Strategic Advisers, Inc. (2003-2011).
Brian B. Hogan (1964)
Year of Election or Appointment: 2009
Vice President
Mr. Hogan also serves as Trustee or Vice President of other funds. Mr. Hogan serves as a Director of FMR Investment Management (UK) Limited (investment adviser firm, 2015-present) and Fidelity SelectCo, LLC (investment adviser firm, 2014-present) and President of the Equity Division of FMR (investment adviser firm, 2009-present). Previously, Mr. Hogan served as Senior Vice President, Equity Research of FMR (2006-2009) and as a portfolio manager. Mr. Brian B. Hogan is not related to Mr. Colm A. Hogan.
Colm A. Hogan (1973)
Year of Election or Appointment: 2016
Deputy Treasurer
Mr. Hogan also serves as an officer of other funds. Mr. Hogan is an employee of Fidelity Investments (2005-present). Mr. Colm A. Hogan is not related to Mr. Brian B. Hogan.
Chris Maher (1972)
Year of Election or Appointment: 2013
Assistant Treasurer
Mr. Maher serves as Assistant Treasurer of other funds. Mr. Maher is Vice President of Valuation Oversight and is an employee of Fidelity Investments. Previously, Mr. Maher served as Vice President of Asset Management Compliance (2013), Vice President of the Program Management Group of FMR (investment adviser firm, 2010-2013), and Vice President of Valuation Oversight (2008-2010).
Rieco E. Mello (1969)
Year of Election or Appointment: 2017
Assistant Treasurer
Mr. Mello also serves as Assistant Treasurer of other funds. Mr. Mello is an employee of Fidelity Investments (1995-present).
Kenneth B. Robins (1969)
Year of Election or Appointment: 2016
Chief Compliance Officer
Mr. Robins also serves as an officer of other funds. Mr. Robins serves as Compliance Officer of Fidelity Management & Research Company and FMR Co., Inc. (investment adviser firms, 2016-present) and is an employee of Fidelity Investments (2004-present). Previously, Mr. Robins served as Executive Vice President of Fidelity Investments Money Management, Inc. (investment adviser firm, 2013-2016) and served in other fund officer roles.
Stacie M. Smith (1974)
Year of Election or Appointment: 2016
President and Treasurer
Ms. Smith also serves as an officer of other funds. She is an employee of Fidelity Investments (2009-present) and has served in other fund officer roles. Prior to joining Fidelity Investments, Ms. Smith served as Senior Audit Manager of Ernst & Young LLP (accounting firm, 1996-2009). Previously, Ms. Smith served as Deputy Treasurer of certain Fidelity® funds (2013-2016).
Marc L. Spector (1972)
Year of Election or Appointment: 2016
Assistant Treasurer
Mr. Spector also serves as an officer of other funds. Mr. Spector is an employee of Fidelity Investments (2016-present). Prior to joining Fidelity Investments, Mr. Spector served as Director at the Siegfried Group (accounting firm, 2013-2016), and prior to Siegfried Group as audit senior manager at Deloitte & Touche (accounting firm, 2005-2013).
Renee Stagnone (1975)
Year of Election or Appointment: 2016
Assistant Treasurer
Ms. Stagnone also serves as an officer of other funds. Ms. Stagnone is an employee of Fidelity Investments (1997-present). Previously, Ms. Stagnone served as Deputy Treasurer of certain Fidelity® funds (2013-2016).
Shareholder Expense Example
As a shareholder of a Fund, you incur two types of costs: (1) transaction costs and (2) ongoing costs, including management fees and other Fund expenses. This Example is intended to help you understand your ongoing costs (in dollars) of investing in the Funds and to compare these costs with the ongoing costs of investing in other mutual funds.
The actual expense Example is based on an investment of $1,000 invested at the beginning of the period and held for the entire period (May 25, 2017 to October 31, 2017). The hypothetical expense Example is based on an investment of $1,000 invested for the one-half year period (May 1, 2017 to October 31, 2017).
Actual Expenses
The first line of the accompanying table provides information about actual account values and actual expenses. You may use the information in this line, together with the amount you invested, to estimate the expenses that you paid over the period. Simply divide your account value by $1,000.00 (for example, an $8,600 account value divided by $1,000.00 = 8.6), then multiply the result by the number in the first line under the heading entitled "Expenses Paid During Period" to estimate the expenses you paid on your account during this period. In addition, the Fund, as a shareholder in the underlying Fidelity Central Funds, will indirectly bear its pro-rata share of the fees and expenses incurred by the underlying Fidelity Central Funds. These fees and expenses are not included in the Fund's annualized expense ratio used to calculate the expense estimate in the table below.
Hypothetical Example for Comparison Purposes
The second line of the accompanying table provides information about hypothetical account values and hypothetical expenses based on the Fund's actual expense ratio and an assumed rate of return of 5% per year before expenses, which is not the Fund's actual return. The hypothetical account values and expenses may not be used to estimate the actual ending account balance or expenses you paid for the period. You may use this information to compare the ongoing costs of investing in the Fund and other funds. To do so, compare this 5% hypothetical example with the 5% hypothetical examples that appear in the shareholder reports of the other funds. In addition, the Fund, as a shareholder in the underlying Fidelity Central Funds, will indirectly bear its pro-rata share of the fees and expenses incurred by the underlying Fidelity Central Funds. These fees and expenses are not included in the Fund's annualized expense ratio used to calculate the expense estimate in the table below.
Please note that the expenses shown in the table are meant to highlight your ongoing costs only and do not reflect any transaction costs. Therefore, the second line of the table is useful in comparing ongoing costs only, and will not help you determine the relative total costs of owning different funds.
| | Annualized Expense Ratio-A | Beginning
Account Value | Ending
Account Value
October 31, 2017 | Expenses Paid
During Period |
| Actual | .65% | $1,000.00 | $1,101.00 | $2.99-B |
| Hypothetical-C | | $1,000.00 | 1,021.93 | $3.31-D |
A Annualized expense ratio reflects expenses net of applicable fee waivers.
B Actual expenses are equal to the Fund's annualized expense ratio, multiplied by the average account value over the period, multiplied by 160/365 (to reflect the period May 25, 2017 to October 31, 2017).
C 5% return per year before expenses
D Hypothetical expenses are equal to the Fund's annualized expense ratio, multiplied by the average account value over the period, multiplied by 184/365 (to reflect the one-half year period).
Distributions (Unaudited)
The Board of Trustees of Fidelity International Capital Appreciation K6 Fund voted to pay on December 11, 2017, to shareholders of record at the opening of business on December 8, 2017, a distribution of $0.011 per share derived from capital gains realized from sales of portfolio securities and a dividend of $0.021 per share from net investment income.
The fund hereby designates as a capital gain dividend with respect to the taxable year ended October 31, 2017, $ 3,108, or, if subsequently determined to be different, the net capital gain of such year.
The fund will notify shareholders in January 2018 of amounts for use in preparing 2017 income tax returns.
Board Approval of Investment Advisory Contracts and Management Fees
Fidelity International Capital Appreciation K6 Fund
On January 18, 2017 the Board of Trustees, including the Independent Trustees (together, the Board), voted to approve the management contract with Fidelity Management & Research Company (FMR) and the sub-advisory agreements with affiliates of FMR (together, the Advisory Contracts) for the fund. The Board, assisted by the advice of fund counsel and Independent Trustees' counsel, considered a broad range of information.
Nature, Extent, and Quality of Services Provided. The Board considered Fidelity's staffing as it relates to the fund, including the backgrounds of investment personnel of Fidelity, and also considered the fund's investment objective, strategies, and related investment philosophy. The Board considered the structure of the investment personnel compensation program and whether this structure provides appropriate incentives to act in the best interests of the fund.
Resources Dedicated to Investment Management and Support Services. The Board and the Fund Oversight and Research Committees reviewed the general qualifications and capabilities of Fidelity's investment staff, including its size, education, experience, and resources, as well as Fidelity's approach to recruiting, training, managing, and compensating investment personnel. The Board noted that Fidelity has continued to increase the resources devoted to non-U.S. offices, including expansion of Fidelity's global investment organization. The Board also noted that Fidelity's analysts have extensive resources, tools and capabilities that allow them to conduct sophisticated quantitative and fundamental analysis, as well as credit analysis of issuers, counterparties and guarantors. Further, the Board considered that Fidelity's investment professionals have sufficient access to global information and data so as to provide competitive investment results over time, and that those professionals also have access to sophisticated tools that permit them to assess portfolio construction and risk and performance attribution characteristics continuously, as well as to transmit new information and research conclusions rapidly around the world. Additionally, in its deliberations, the Board considered Fidelity's trading, risk management, compliance, and technology and operations capabilities and resources, which are integral parts of the investment management process.
Shareholder and Administrative Services. The Board considered the nature, extent, quality, and cost of advisory, administrative, and shareholder services to be performed by FMR, the sub-advisers (together with FMR, the Investment Advisers), and their affiliates under the Advisory Contracts and under separate agreements covering transfer agency, pricing and bookkeeping and securities lending services for the fund. The Board also considered the nature and extent of the supervision of third party service providers, principally custodians, subcustodians, and pricing vendors.
The Board noted that the growth of fund assets over time across the complex allows Fidelity to reinvest in the development of services designed to enhance the value or convenience of the Fidelity funds as investment vehicles. These services include 24-hour access to account information and market information through telephone representatives and over the Internet, investor education materials and asset allocation tools, and the expanded availability of Fidelity Investor Centers.
Investment Performance. The fund is a new fund and therefore had no historical performance for the Board to review at the time it approved the fund's Advisory Contracts. The Board considered the Investment Advisers' strength in fundamental, research-driven security selection, which the Board is familiar with through its supervision of other Fidelity funds, including funds with identical investment objectives as the the fund.
Based on its review, the Board concluded that the nature, extent, and quality of services to be provided to the fund under the Advisory Contracts should benefit the shareholders of the fund.
Competitiveness of Management Fee and Total Expense Ratio ..The Board considered the fund's proposed management fee out of which FMR will pay all operating expenses, with certain limited exceptions, and the projected total expense ratio of the fund in reviewing the Advisory Contracts. The Board noted that the fund's proposed management fee rate is lower than the median fee rate of funds with similar Lipper investment objective categories and comparable investment mandates, regardless of whether their management fee structures are comparable. The Board also considered that the projected total expense ratio of the fund is below the median of those funds and classes used by the Board for management fee comparisons that have a similar sales load structure.
Based on its review, the Board concluded that the fund's management fee and projected total expense ratio were reasonable in light of the services that the fund and its shareholders will receive and the other factors considered.
Costs of the Services and Profitability. The fund is a new fund and therefore no revenue, cost, or profitability data was available for the Board to review in respect of the fund at the time it approved the Advisory Contracts. In connection with its future renewal of the fund's Advisory Contracts, the Board will consider the revenues earned and the expenses incurred by Fidelity in conducting the business of developing, marketing, distributing, managing, administering and servicing the fund and servicing the fund's shareholders.
Economies of Scale. The Board will consider economies of scale when there is operating experience to permit assessment thereof. It noted that, notwithstanding the entrepreneurial risk associated with a new fund, the management fee was at a level normally associated, by comparison with competitors, with very high fund net assets, and Fidelity asserted to the Board that the level of the fee anticipated economies of scale at lower asset levels even before, if ever, economies of scale are achieved. The Board also noted that the fund and its shareholders would have access to the very considerable number and variety of services available through Fidelity and its affiliates.
Based on its evaluation of all of the conclusions noted above, and after considering all factors it believed relevant, the Board concluded that the advisory fee structures are fair and reasonable, and that the fund's Advisory Contracts should be approved.
Corporate Headquarters
245 Summer St.
Boston, MA 02210
www.fidelity.com
IVFK6-ANN-1217
1.9883991.100
Fidelity® Series Emerging Markets Fund
Fidelity® Series International Growth Fund
Fidelity® Series International Small Cap Fund
Fidelity® Series International Value Fund
Annual Report October 31, 2017 |
|
Contents
To view a fund's proxy voting guidelines and proxy voting record for the 12-month period ended June 30, visit http://www.fidelity.com/proxyvotingresults or visit the Securities and Exchange Commission's (SEC) web site at http://www.sec.gov.
You may also call 1-800-544-8544 to request a free copy of the proxy voting guidelines.
Standard & Poor's, S&P and S&P 500 are registered service marks of The McGraw-Hill Companies, Inc. and have been licensed for use by Fidelity Distributors Corporation.
Other third-party marks appearing herein are the property of their respective owners.
All other marks appearing herein are registered or unregistered trademarks or service marks of FMR LLC or an affiliated company. © 2017 FMR LLC. All rights reserved.
This report and the financial statements contained herein are submitted for the general information of the shareholders of the Funds. This report is not authorized for distribution to prospective investors in the Funds unless preceded or accompanied by an effective prospectus.
A fund files its complete schedule of portfolio holdings with the SEC for the first and third quarters of each fiscal year on Form N-Q. Forms N-Q are available on the SEC’s web site at http://www.sec.gov. A fund's Forms N-Q may be reviewed and copied at the SEC’s Public Reference Room in Washington, DC. Information regarding the operation of the SEC's Public Reference Room may be obtained by calling 1-800-SEC-0330.
For a complete list of a fund's portfolio holdings, view the most recent holdings listing, semiannual report, or annual report on Fidelity's web site at http://www.fidelity.com, http://www.institutional.fidelity.com, or http://www.401k.com, as applicable.
NOT FDIC INSURED •MAY LOSE VALUE •NO BANK GUARANTEE
Neither the Funds nor Fidelity Distributors Corporation is a bank.
Fidelity® Series Emerging Markets Fund
Performance: The Bottom Line
Average annual total return reflects the change in the value of an investment, assuming reinvestment of distributions from dividend income and capital gains (the profits earned upon the sale of securities that have grown in value, if any) and assuming a constant rate of performance each year. The hypothetical investment and the average annual total returns do not reflect the deduction of taxes that a shareholder would pay on fund distributions or the redemption of fund shares. During periods of reimbursement by Fidelity, a fund’s total return will be greater than it would be had the reimbursement not occurred. How a fund did yesterday is no guarantee of how it will do tomorrow.
Average Annual Total Returns
| For the periods ended October 31, 2017 | Past 1 year | Past 5 years | Life of fundA |
| Fidelity® Series Emerging Markets Fund | 29.04% | 6.86% | 11.94% |
A From December 9, 2008
$10,000 Over Life of Fund
Let's say hypothetically that $10,000 was invested in Fidelity® Series Emerging Markets Fund on December 9, 2008, when the fund started.
The chart shows how the value of your investment would have changed, and also shows how the MSCI Emerging Markets Index performed over the same period.
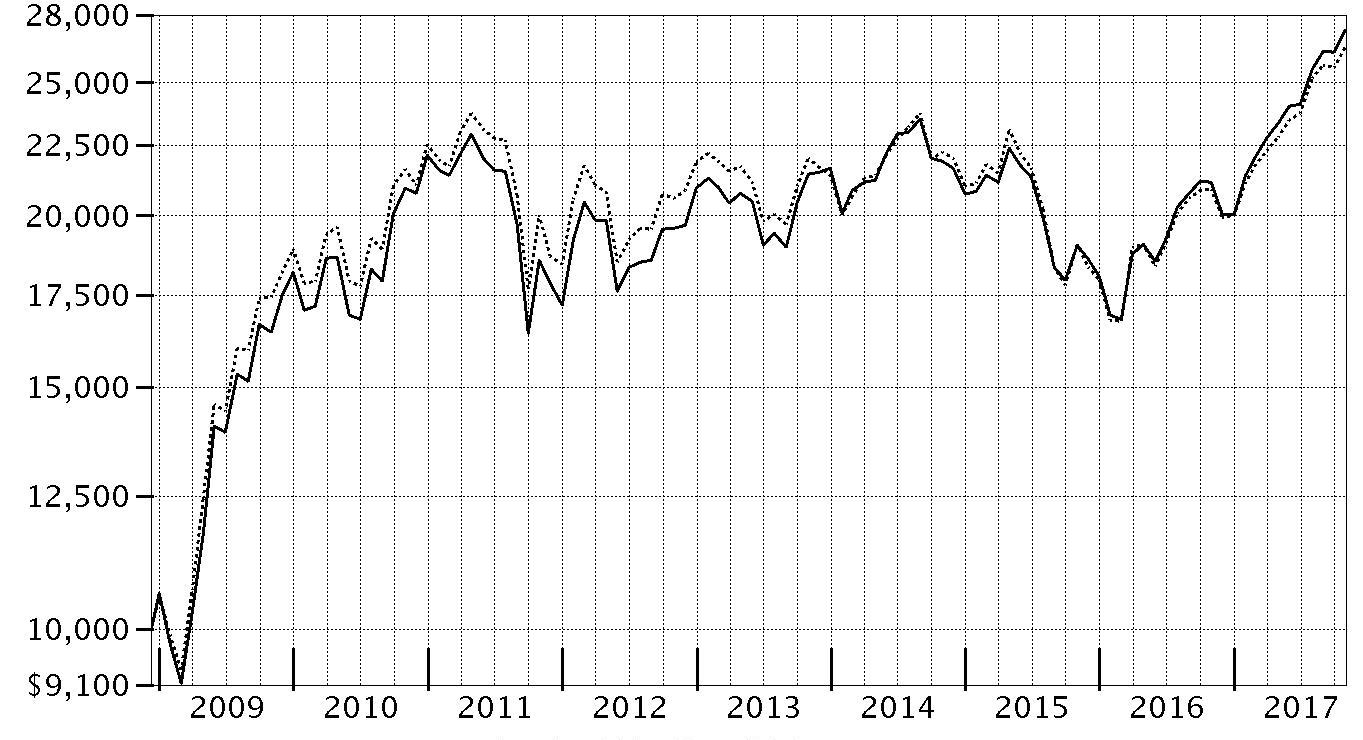
| Period Ending Values |
| $27,274 | Fidelity® Series Emerging Markets Fund |
| $26,547 | MSCI Emerging Markets Index |
Fidelity® Series Emerging Markets Fund
Management's Discussion of Fund Performance
Market Recap: The MSCI ACWI (All Country World Index) ex USA Index returned 23.85% for the 12 months ending October 31, 2017, helped partly by a generally weak U.S. dollar. Some favorable election results in continental Europe (+30%) suggested ebbing political uncertainty and near-term risk there, but the U.K. (+20%) faced more-mixed conditions ahead of its expected exit from the European Union. Despite central-bank easing – and pressured recently by yen strength – Japan (+18%) lagged the rest of the Asia-Pacific group (+22%). Commodity-price volatility slowed Canada (+17%), but the emerging-markets group (+26%) sped ahead. Sector-wise, information technology (+47%) was driven by a surge among several Chinese internet-related names. Financials (+27%) rode rising interest rates that, at the same time, weighed on real estate (+17%), utilities (+16%), consumer staples (+14%) and telecommunication services (+9%) – so-called “bond proxy” sectors. Materials (+28%) and industrials (+27%) responded to demand from China and price gains for certain commodities. In the energy sector (+20%), oil prices lost ground in the spring before rebounding through October 31 to end well above where they started 12 months ago. Lastly, health care (+14%) was hurt by early-period turmoil around drug pricing and health care legislation.
Comments from Co-Portfolio Manager Gregory Lee: For the fiscal year, the fund gained 29.04%, outperforming the 26.91% return of the benchmark MSCI Emerging Markets Index. The fund's outperformance of the benchmark was primarily driven by security selection, led by choices in the information technology, consumer discretionary and industrials sectors. Our top relative contributors were China’s 58.com and Taiwan-based GlobalWafers, both of which rose along with the broader tech sector. Specifically, shares of e-commerce giant 58.com were helped by the firm's strong financial results. GlobalWafers makes silicon wafers upon which chips are made. The stock, which we bought the past year, benefited from the integration of a key acquisition, as well as growth in global chip manufacturing. Another contributor was state-owned Russian banking and financial services firm Sberbank. Conversely, our relative result was hurt most by positioning in two South Korea-based chipmakers: Samsung Electronics, the world's largest maker of memory chips, smartphones and other electronics products, and SK Hynix. Underweighting Samsung hurt because the firm reported two consecutive quarters of record profits, benefiting from its booming chip business. It also hurt to largely avoid SK Hynix, as shares rallied on news that Toshiba would sell its memory-chip unit to a global consortium that includes SK Hynix, Apple and others.
The views expressed above reflect those of the portfolio manager(s) only through the end of the period as stated on the cover of this report and do not necessarily represent the views of Fidelity or any other person in the Fidelity organization. Any such views are subject to change at any time based upon market or other conditions and Fidelity disclaims any responsibility to update such views. These views may not be relied on as investment advice and, because investment decisions for a Fidelity fund are based on numerous factors, may not be relied on as an indication of trading intent on behalf of any Fidelity fund.
Fidelity® Series Emerging Markets Fund
Investment Summary (Unaudited)
Geographic Diversification (% of fund's net assets)
| As of October 31, 2017 |
| | Cayman Islands | 15.5% |
| | Korea (South) | 12.7% |
| | India | 9.2% |
| | Brazil | 9.0% |
| | China | 8.3% |
| | Taiwan | 7.9% |
| | South Africa | 6.1% |
| | Russia | 5.1% |
| | Hong Kong | 4.6% |
| | Other* | 21.6% |
* Includes Short-Term investments and Net Other Assets (Liabilities).
Percentages are based on country or territory of incorporation and are adjusted for the effect of futures contracts, if applicable.
| As of April 30, 2017 |
| | Cayman Islands | 15.4% |
| | Korea (South) | 11.7% |
| | Brazil | 9.4% |
| | Taiwan | 8.4% |
| | India | 7.9% |
| | China | 6.7% |
| | South Africa | 6.1% |
| | Russia | 5.5% |
| | Hong Kong | 4.4% |
| | Other* | 24.5% |
* Includes Short-Term investments and Net Other Assets (Liabilities).
Percentages are based on country or territory of incorporation and are adjusted for the effect of futures contracts, if applicable.
Asset Allocation as of October 31, 2017
| | % of fund's net assets | % of fund's net assets 6 months ago |
| Stocks and Equity Futures | 99.1 | 99.0 |
| Short-Term Investments and Net Other Assets (Liabilities) | 0.9 | 1.0 |
Top Ten Stocks as of October 31, 2017
| | % of fund's net assets | % of fund's net assets 6 months ago |
| Tencent Holdings Ltd. (Cayman Islands, Internet Software & Services) | 5.4 | 4.0 |
| Alibaba Group Holding Ltd. sponsored ADR (Cayman Islands, Internet Software & Services) | 4.8 | 2.2 |
| Naspers Ltd. Class N (South Africa, Media) | 2.6 | 3.6 |
| Sberbank of Russia (Russia, Banks) | 2.3 | 2.1 |
| Taiwan Semiconductor Manufacturing Co. Ltd. (Taiwan, Semiconductors & Semiconductor Equipment) | 2.1 | 3.2 |
| Largan Precision Co. Ltd. (Taiwan, Electronic Equipment & Components) | 2.0 | 1.8 |
| JD.com, Inc. sponsored ADR (Cayman Islands, Internet & Direct Marketing Retail) | 1.8 | 2.9 |
| Industrial & Commercial Bank of China Ltd. (H Shares) (China, Banks) | 1.8 | 1.4 |
| Itau Unibanco Holding SA sponsored ADR (Brazil, Banks) | 1.3 | 1.8 |
| Reliance Industries Ltd. (India, Oil, Gas & Consumable Fuels) | 1.2 | 1.1 |
| | 25.3 | |
Top Market Sectors as of October 31, 2017
| | % of fund's net assets | % of fund's net assets 6 months ago |
| Information Technology | 24.5 | 22.4 |
| Financials | 23.5 | 23.1 |
| Consumer Discretionary | 14.7 | 14.6 |
| Materials | 7.5 | 6.9 |
| Energy | 6.6 | 6.8 |
| Consumer Staples | 6.1 | 6.9 |
| Industrials | 5.1 | 5.6 |
| Telecommunication Services | 4.1 | 4.5 |
| Real Estate | 2.6 | 2.4 |
| Utilities | 2.3 | 2.8 |
Fidelity® Series Emerging Markets Fund
Investments October 31, 2017
Showing Percentage of Net Assets
| Common Stocks - 92.3% | | | |
| | | Shares | Value |
| Argentina - 0.5% | | | |
| Grupo Superveille SA sponsored ADR (a) | | 937,272 | $25,128,262 |
| Telecom Argentina SA Class B sponsored ADR (b) | | 444,134 | 14,483,210 |
| YPF SA Class D sponsored ADR (b) | | 1,340,600 | 32,925,136 |
|
| TOTAL ARGENTINA | | | 72,536,608 |
|
| Australia - 0.0% | | | |
| Frontier Digital Ventures Ltd. (b)(c) | | 15,054,170 | 7,489,111 |
| Austria - 0.2% | | | |
| Erste Group Bank AG | | 726,640 | 31,224,678 |
| Bermuda - 1.5% | | | |
| AGTech Holdings Ltd. (b) | | 58,440,000 | 10,187,710 |
| Credicorp Ltd. (United States) | | 334,440 | 70,045,114 |
| GP Investments Ltd. Class A (depositary receipt) (b)(c) | | 7,634,637 | 13,652,868 |
| Shangri-La Asia Ltd. | | 55,792,000 | 110,991,853 |
| VimpelCom Ltd. sponsored ADR | | 9,904,720 | 38,727,455 |
|
| TOTAL BERMUDA | | | 243,605,000 |
|
| Brazil - 4.5% | | | |
| Azul SA sponsored ADR | | 959,000 | 24,253,110 |
| B2W Companhia Global do Varejo (b)(c) | | 27,252,402 | 176,861,949 |
| Banco do Brasil SA | | 6,280,100 | 66,116,420 |
| BR Malls Participacoes SA | | 8,197,340 | 31,773,995 |
| Centrais Eletricas Brasileiras SA (Electrobras) (b) | | 1,908,500 | 12,864,129 |
| Companhia de Saneamento de Minas Gerais | | 2,945,270 | 35,473,249 |
| Cosan SA Industria e Comercio | | 3,199,500 | 36,579,128 |
| Direcional Engenharia SA (b)(c) | | 13,494,400 | 24,131,764 |
| Localiza Rent A Car SA | | 2,118,890 | 37,483,619 |
| Minerva SA | | 9,047,900 | 31,807,187 |
| Smiles Fidelidade SA | | 2,813,700 | 73,539,984 |
| Vale SA sponsored ADR | | 15,377,570 | 150,546,410 |
|
| TOTAL BRAZIL | | | 701,430,944 |
|
| British Virgin Islands - 1.3% | | | |
| Despegar.com Corp. (a) | | 1,108,700 | 34,147,960 |
| Mail.Ru Group Ltd. GDR (Reg. S) (b) | | 5,077,501 | 165,018,783 |
|
| TOTAL BRITISH VIRGIN ISLANDS | | | 199,166,743 |
|
| Canada - 0.4% | | | |
| Pan American Silver Corp. | | 2,674,600 | 43,676,218 |
| Torex Gold Resources, Inc. (b) | | 1,533,290 | 21,143,500 |
|
| TOTAL CANADA | | | 64,819,718 |
|
| Cayman Islands - 15.2% | | | |
| 58.com, Inc. ADR (b) | | 2,232,018 | 149,924,649 |
| Alibaba Group Holding Ltd. sponsored ADR (b) | | 4,081,106 | 754,555,688 |
| BizLink Holding, Inc. | | 1,862,277 | 18,661,081 |
| China Biologic Products Holdings, Inc. | | 206,800 | 16,070,428 |
| China Literature Ltd. | | 136,101 | 959,514 |
| Ctrip.com International Ltd. ADR (b) | | 661,900 | 31,698,391 |
| Haitian International Holdings Ltd. | | 12,724,000 | 38,083,600 |
| JD.com, Inc. sponsored ADR (b) | | 7,424,204 | 278,556,134 |
| NetEase, Inc. ADR | | 281,800 | 79,445,056 |
| Qudian, Inc. ADR | | 1,255 | 31,250 |
| Sea Ltd. ADR (a) | | 529,800 | 7,989,384 |
| Secoo Holding Ltd. ADR (a) | | 530,800 | 3,842,992 |
| Silergy Corp. | | 193,000 | 4,168,923 |
| Silicon Motion Technology Corp. sponsored ADR | | 436,900 | 21,154,698 |
| Tencent Holdings Ltd. | | 18,888,399 | 848,941,117 |
| Uni-President China Holdings Ltd. | | 82,650,000 | 69,074,525 |
| Vipshop Holdings Ltd. ADR (b) | | 5,285,400 | 41,754,660 |
| ZTO Express (Cayman), Inc. sponsored ADR (a) | | 1,548,400 | 24,758,916 |
|
| TOTAL CAYMAN ISLANDS | | | 2,389,671,006 |
|
| Chile - 1.4% | | | |
| Compania Cervecerias Unidas SA sponsored ADR (a) | | 2,217,200 | 63,145,856 |
| Enersis SA | | 152,257,237 | 32,654,746 |
| Inversiones La Construccion SA | | 1,890,851 | 32,231,664 |
| Sociedad Quimica y Minera de Chile SA (PN-B) sponsored ADR | | 492,600 | 29,427,924 |
| Vina Concha y Toro SA | | 34,096,719 | 60,152,088 |
|
| TOTAL CHILE | | | 217,612,278 |
|
| China - 8.3% | | | |
| BBMG Corp. (H Shares) | | 69,690,500 | 34,749,666 |
| China Life Insurance Co. Ltd. (H Shares) | | 56,813,900 | 188,355,273 |
| China Longyuan Power Grid Corp. Ltd. (H Shares) | | 67,437,810 | 49,964,178 |
| China Molybdenum Co. Ltd. (H Shares) | | 8,559,000 | 5,562,352 |
| China Pacific Insurance (Group) Co. Ltd. (H Shares) | | 26,171,694 | 128,989,878 |
| China Petroleum & Chemical Corp. (H Shares) | | 51,380,000 | 37,729,297 |
| China Telecom Corp. Ltd. (H Shares) | | 84,030,882 | 42,115,614 |
| Conch Cement Co. Ltd. (H Shares) | | 11,459,500 | 48,987,916 |
| Guangzhou Automobile Group Co. Ltd. (H Shares) | | 53,018,000 | 131,841,618 |
| Hangzhou Hikvision Digital Technology Co. Ltd. Class A | | 5,350,682 | 31,677,160 |
| Industrial & Commercial Bank of China Ltd. (H Shares) | | 348,344,400 | 276,392,934 |
| Kweichow Moutai Co. Ltd. (A Shares) | | 234,229 | 21,818,045 |
| Maanshan Iron & Steel Ltd. (H Shares) (b) | | 29,040,000 | 13,624,016 |
| PICC Property & Casualty Co. Ltd. (H Shares) | | 32,824,500 | 65,048,167 |
| Qingdao Haier Co. Ltd. | | 39,405,137 | 102,745,915 |
| Shanghai International Airport Co. Ltd. (A Shares) | | 6,485,198 | 42,762,877 |
| Tsingtao Brewery Co. Ltd. (H Shares) | | 11,670,000 | 48,840,657 |
| Zhengzhou Yutong Bus Co. Ltd. | | 9,283,051 | 35,593,727 |
|
| TOTAL CHINA | | | 1,306,799,290 |
|
| Colombia - 0.1% | | | |
| Bancolombia SA sponsored ADR | | 491,886 | 18,568,697 |
| Cyprus - 0.1% | | | |
| Etalon Group PLC GDR (Reg. S) | | 4,705,900 | 19,058,895 |
| Egypt - 0.0% | | | |
| Six of October Development & Investment Co. (b) | | 4,068,500 | 4,276,865 |
| Greece - 0.3% | | | |
| Titan Cement Co. SA (Reg.) | | 1,870,652 | 45,149,481 |
| Hong Kong - 4.6% | | | |
| AIA Group Ltd. | | 3,023,320 | 22,748,338 |
| China Mobile Ltd. | | 384,295 | 3,865,382 |
| China Mobile Ltd. sponsored ADR | | 1,467,670 | 74,043,952 |
| China Overseas Land and Investment Ltd. | | 18,788,000 | 60,929,628 |
| China Resources Beer Holdings Co. Ltd. | | 32,610,666 | 94,052,348 |
| China Resources Power Holdings Co. Ltd. | | 21,852,397 | 42,016,299 |
| China Unicom Ltd. (b) | | 3,953,000 | 5,608,749 |
| China Unicom Ltd. sponsored ADR (a)(b) | | 3,130,500 | 44,233,965 |
| CNOOC Ltd. | | 93,498,000 | 127,661,564 |
| CSPC Pharmaceutical Group Ltd. | | 31,918,000 | 55,478,258 |
| Far East Horizon Ltd. | | 122,785,750 | 121,976,769 |
| Sinotruk Hong Kong Ltd. | | 31,983,500 | 42,473,025 |
| Techtronic Industries Co. Ltd. | | 6,166,000 | 36,159,471 |
|
| TOTAL HONG KONG | | | 731,247,748 |
|
| India - 9.2% | | | |
| Adani Ports & Special Economic Zone Ltd. | | 8,487,833 | 56,412,956 |
| Axis Bank Ltd. | | 11,072,514 | 89,460,783 |
| Bharat Petroleum Corp. Ltd. | | 9,801,086 | 81,980,976 |
| Bharti Infratel Ltd. | | 7,474,437 | 51,039,727 |
| Coal India Ltd. | | 10,323,945 | 45,672,495 |
| Eicher Motors Ltd. | | 49,153 | 24,469,009 |
| Federal Bank Ltd. | | 19,920,619 | 37,456,917 |
| ICICI Bank Ltd. | | 10,642,918 | 49,908,536 |
| ICICI Bank Ltd. sponsored ADR | | 9,311,170 | 85,197,206 |
| Indraprastha Gas Ltd. | | 1,493,616 | 36,565,334 |
| InterGlobe Aviation Ltd. | | 1,371,018 | 26,422,005 |
| ITC Ltd. | | 13,179,690 | 54,082,527 |
| JK Cement Ltd. | | 2,438,552 | 37,751,421 |
| Larsen & Toubro Ltd. | | 2,996,347 | 56,562,702 |
| LIC Housing Finance Ltd. | | 7,075,902 | 65,426,139 |
| Lupin Ltd. | | 4,472,654 | 71,013,312 |
| Petronet LNG Ltd. | | 9,755,804 | 39,151,284 |
| Phoenix Mills Ltd. | | 5,818,404 | 47,230,164 |
| Power Grid Corp. of India Ltd. | | 9,298,431 | 30,422,743 |
| Reliance Industries Ltd. | | 13,158,820 | 191,204,259 |
| SREI Infrastructure Finance Ltd. (c) | | 34,355,610 | 60,858,509 |
| State Bank of India | | 12,057,633 | 56,945,547 |
| Sun Pharmaceutical Industries Ltd. | | 9,832,184 | 83,956,981 |
| Tata Motors Ltd. (b) | | 10,752,005 | 71,137,590 |
| Tejas Networks Ltd. | | 1,175,363 | 5,920,381 |
|
| TOTAL INDIA | | | 1,456,249,503 |
|
| Indonesia - 2.6% | | | |
| PT Astra International Tbk | | 176,543,800 | 104,136,435 |
| PT Bank Mandiri (Persero) Tbk | | 138,398,800 | 71,941,865 |
| PT Bank Rakyat Indonesia Tbk | | 75,674,900 | 87,043,572 |
| PT Indocement Tunggal Prakarsa Tbk | | 19,161,600 | 31,718,188 |
| PT Kalbe Farma Tbk | | 176,378,200 | 20,807,751 |
| PT Link Net Tbk | | 55,914,971 | 20,572,587 |
| PT Lippo Karawaci Tbk | | 173,911,800 | 8,847,863 |
| PT Media Nusantara Citra Tbk | | 140,752,200 | 16,189,746 |
| PT Semen Gresik (Persero) Tbk | | 55,116,900 | 44,296,716 |
|
| TOTAL INDONESIA | | | 405,554,723 |
|
| Israel - 0.3% | | | |
| Bezeq The Israel Telecommunication Corp. Ltd. | | 31,426,037 | 46,925,979 |
| Japan - 0.6% | | | |
| Minebea Mitsumi, Inc. | | 776,000 | 14,226,498 |
| Panasonic Corp. | | 1,722,500 | 26,008,656 |
| Sumco Corp. | | 2,129,600 | 46,907,776 |
| TDK Corp. | | 170,100 | 13,070,369 |
|
| TOTAL JAPAN | | | 100,213,299 |
|
| Korea (South) - 10.7% | | | |
| AMOREPACIFIC Group, Inc. | | 700,416 | 89,894,102 |
| BS Financial Group, Inc. | | 8,192,156 | 72,829,585 |
| Daou Technology, Inc. (c) | | 3,046,123 | 49,992,717 |
| Duk San Neolux Co. Ltd. | | 375,125 | 7,364,339 |
| Fila Korea Ltd. | | 116,611 | 7,060,760 |
| Hanon Systems | | 2,849,584 | 33,132,031 |
| Hyundai Fire & Marine Insurance Co. Ltd. | | 1,586,206 | 64,336,898 |
| Hyundai Glovis Co. Ltd. | | 282,493 | 38,151,171 |
| Hyundai Industrial Development & Construction Co. | | 507,225 | 18,191,490 |
| Hyundai Mipo Dockyard Co. Ltd. (b) | | 282,910 | 27,453,725 |
| Hyundai Mobis | | 796,418 | 189,828,544 |
| InterPark INT Corp. (c) | | 3,076,471 | 25,671,882 |
| KB Financial Group, Inc. | | 3,616,942 | 189,491,575 |
| KEPCO Plant Service & Engineering Co. Ltd. | | 441,718 | 16,316,176 |
| Korea Electric Power Corp. | | 844,614 | 29,671,660 |
| Korea Express Co. Ltd. (b) | | 295,223 | 41,454,633 |
| Korean Reinsurance Co. | | 4,478,971 | 44,866,223 |
| KT Corp. | | 564,481 | 14,845,300 |
| KT Corp. sponsored ADR (a) | | 567,200 | 8,162,008 |
| LG Chemical Ltd. | | 400,569 | 144,558,659 |
| LG Telecom Ltd. | | 1,993,049 | 22,905,741 |
| NAVER Corp. | | 63,307 | 50,618,875 |
| Samsung Electronics Co. Ltd. | | 67,040 | 165,128,174 |
| Samsung Life Insurance Co. Ltd. | | 510,162 | 61,597,787 |
| Samsung SDI Co. Ltd. | | 531,267 | 97,882,104 |
| Shinhan Financial Group Co. Ltd. | | 3,784,421 | 170,332,959 |
|
| TOTAL KOREA (SOUTH) | | | 1,681,739,118 |
|
| Mauritius - 0.2% | | | |
| MakeMyTrip Ltd. (a)(b) | | 893,096 | 24,381,521 |
| Mexico - 2.4% | | | |
| America Movil S.A.B. de CV Series L sponsored ADR | | 738,400 | 12,641,408 |
| CEMEX S.A.B. de CV sponsored ADR | | 8,075,936 | 65,495,841 |
| Grupo Aeroportuario del Pacifico S.A.B. de CV Series B | | 3,541,100 | 33,584,739 |
| Grupo Financiero Banorte S.A.B. de CV Series O | | 16,119,518 | 95,665,693 |
| Infraestructura Energetica Nova S.A.B. de CV | | 825,248 | 4,213,675 |
| Macquarie Mexican (REIT) (c) | | 61,332,832 | 73,579,884 |
| Promotora y Operadora de Infraestructura S.A.B. de CV | | 2,569,135 | 24,397,184 |
| Tenedora Nemak SA de CV | | 1,888,937 | 1,419,776 |
| Wal-Mart de Mexico SA de CV Series V | | 29,712,800 | 66,394,375 |
|
| TOTAL MEXICO | | | 377,392,575 |
|
| Netherlands - 1.4% | | | |
| Hangzhou Hikvision Digital Technology Co. Ltd. ELS (BNP Paribas Warrant Program) warrants 9/5/18 (b)(d) | | 7,288,400 | 43,148,857 |
| X5 Retail Group NV GDR (Reg. S) (b) | | 635,200 | 26,106,720 |
| Yandex NV Series A (b) | | 4,646,880 | 157,203,950 |
|
| TOTAL NETHERLANDS | | | 226,459,527 |
|
| Nigeria - 0.5% | | | |
| Guaranty Trust Bank PLC | | 101,802,322 | 11,876,938 |
| Guaranty Trust Bank PLC GDR (Reg. S) | | 3,878,704 | 23,272,224 |
| Transnational Corp. of Nigeria PLC (b) | | 1,235,285,783 | 4,941,143 |
| Zenith Bank PLC | | 508,113,887 | 35,977,286 |
|
| TOTAL NIGERIA | | | 76,067,591 |
|
| Pakistan - 0.3% | | | |
| Habib Bank Ltd. | | 29,868,700 | 45,508,403 |
| Panama - 0.3% | | | |
| Copa Holdings SA Class A | | 318,100 | 39,186,739 |
| Peru - 0.3% | | | |
| Compania de Minas Buenaventura SA sponsored ADR | | 3,070,000 | 42,335,300 |
| Philippines - 0.8% | | | |
| International Container Terminal Services, Inc. | | 12,089,790 | 24,819,160 |
| Metropolitan Bank & Trust Co. | | 40,292,407 | 67,641,536 |
| Robinsons Land Corp. | | 76,092,870 | 37,172,080 |
|
| TOTAL PHILIPPINES | | | 129,632,776 |
|
| Russia - 5.1% | | | |
| Lukoil PJSC sponsored ADR | | 2,405,200 | 127,716,120 |
| MegaFon PJSC | | 1,383,767 | 13,724,091 |
| MegaFon PJSC GDR | | 959,155 | 10,023,170 |
| MMC Norilsk Nickel PJSC sponsored ADR | | 6,534,800 | 120,240,320 |
| Mobile TeleSystems OJSC | | 7,609,330 | 36,665,078 |
| NOVATEK OAO GDR (Reg. S) | | 648,200 | 73,959,620 |
| RusHydro PJSC | | 2,265,090,200 | 31,644,643 |
| Sberbank of Russia | | 48,102,830 | 159,395,031 |
| Sberbank of Russia sponsored ADR | | 14,666,294 | 210,461,319 |
| Unipro PJSC | | 598,711,196 | 26,260,161 |
|
| TOTAL RUSSIA | | | 810,089,553 |
|
| Singapore - 0.2% | | | |
| First Resources Ltd. | | 23,175,900 | 33,494,625 |
| South Africa - 6.1% | | | |
| Aspen Pharmacare Holdings Ltd. | | 2,523,982 | 57,026,686 |
| Barclays Africa Group Ltd. | | 4,593,608 | 45,530,774 |
| Bidvest Group Ltd. | | 3,052,145 | 37,021,863 |
| FirstRand Ltd. | | 16,309,900 | 59,119,963 |
| Imperial Holdings Ltd. | | 6,238,400 | 89,405,852 |
| Life Healthcare Group Holdings Ltd. | | 16,984,500 | 31,473,355 |
| MTN Group Ltd. | | 7,209,100 | 62,598,264 |
| Naspers Ltd. Class N | | 1,671,100 | 407,174,573 |
| Nedbank Group Ltd. | | 2,437,300 | 35,747,354 |
| Sasol Ltd. | | 1,601,700 | 46,798,138 |
| Tiger Brands Ltd. | | 3,013,400 | 82,268,404 |
|
| TOTAL SOUTH AFRICA | | | 954,165,226 |
|
| Taiwan - 7.9% | | | |
| Advantech Co. Ltd. | | 2,317,795 | 15,842,649 |
| Chroma ATE, Inc. | | 6,302,000 | 30,738,403 |
| eMemory Technology, Inc. | | 355,000 | 4,352,396 |
| Genius Electronic Optical Co. Ltd. (b) | | 806,000 | 9,079,468 |
| GlobalWafers Co. Ltd. | | 10,967,300 | 126,820,096 |
| Hon Hai Precision Industry Co. Ltd. (Foxconn) | | 5,866,000 | 21,799,456 |
| King's Town Bank | | 28,288,000 | 30,927,387 |
| LandMark Optoelectronics Corp. | | 1,917,446 | 24,462,738 |
| Largan Precision Co. Ltd. | | 1,627,900 | 308,694,953 |
| MediaTek, Inc. | | 1,607,000 | 18,262,575 |
| Nanya Technology Corp. | | 15,147,000 | 41,111,706 |
| PChome Online, Inc. | | 2,076,613 | 12,023,657 |
| Quanta Computer, Inc. | | 18,510,000 | 43,606,411 |
| Taiwan Fertilizer Co. Ltd. | | 11,368,000 | 14,861,610 |
| Taiwan Semiconductor Manufacturing Co. Ltd. | | 38,253,284 | 309,471,765 |
| Taiwan Semiconductor Manufacturing Co. Ltd. sponsored ADR | | 331,101 | 14,015,505 |
| Unified-President Enterprises Corp. | | 37,598,000 | 78,594,266 |
| United Microelectronics Corp. | | 110,342,000 | 56,988,701 |
| Universal Cement Corp. | | 23,746,681 | 18,398,202 |
| Wistron NeWeb Corp. | | 922,148 | 2,646,685 |
| Yuanta Financial Holding Co. Ltd. | | 128,164,206 | 56,984,550 |
|
| TOTAL TAIWAN | | | 1,239,683,179 |
|
| Thailand - 0.8% | | | |
| Delta Electronics PCL (For. Reg.) | | 6,447,700 | 16,691,818 |
| PTT Global Chemical PCL (For. Reg.) | | 34,690,400 | 83,540,999 |
| Star Petroleum Refining PCL | | 57,276,100 | 30,000,125 |
|
| TOTAL THAILAND | | | 130,232,942 |
|
| Turkey - 1.9% | | | |
| Bim Birlesik Magazalar A/S JSC | | 2,947,000 | 60,088,954 |
| Tupras Turkiye Petrol Rafinerileri A/S | | 2,232,796 | 80,340,750 |
| Turkcell Iletisim Hizmet A/S | | 16,600,000 | 62,005,773 |
| Turkcell Iletisim Hizmet A/S sponsored ADR (a) | | 585,200 | 5,495,028 |
| Turkiye Garanti Bankasi A/S | | 32,953,000 | 90,601,097 |
|
| TOTAL TURKEY | | | 298,531,602 |
|
| United Arab Emirates - 1.6% | | | |
| DP World Ltd. | | 1,893,760 | 44,976,800 |
| Emaar Properties PJSC | | 57,842,883 | 130,564,443 |
| National Bank of Abu Dhabi PJSC | | 27,277,550 | 76,871,644 |
|
| TOTAL UNITED ARAB EMIRATES | | | 252,412,887 |
|
| United Kingdom - 0.2% | | | |
| Fresnillo PLC | | 1,864,500 | 32,241,891 |
| Shanghai International Airport Co. Ltd. ELS (UBS Warrant Programme) warrants 5/11/18 (d) | | 498,900 | 3,289,707 |
|
| TOTAL UNITED KINGDOM | | | 35,531,598 |
|
| United States of America - 0.5% | | | |
| Cognizant Technology Solutions Corp. Class A | | 671,300 | 50,797,271 |
| MercadoLibre, Inc. | | 100,400 | 24,127,124 |
|
| TOTAL UNITED STATES OF AMERICA | | | 74,924,395 |
|
| TOTAL COMMON STOCKS | | | |
| (Cost $10,447,407,070) | | | 14,533,370,123 |
|
| Preferred Stocks - 6.8% | | | |
| Convertible Preferred Stocks - 0.3% | | | |
| Cayman Islands - 0.3% | | | |
| China Internet Plus Holdings Ltd. Series A-11 (b)(e)(f) | | 7,577,282 | 42,349,884 |
| Nonconvertible Preferred Stocks - 6.5% | | | |
| Brazil - 4.5% | | | |
| Ambev SA sponsored ADR | | 17,097,400 | 108,226,542 |
| Banco do Estado Rio Grande do Sul SA | | 6,662,486 | 31,038,513 |
| Companhia Paranaense de Energia-Copel: | | | |
| (PN-B) | | 118,800 | 907,533 |
| (PN-B) sponsored ADR (a) | | 4,923,939 | 37,865,091 |
| Fibria Celulose SA sponsored ADR | | 4,788,600 | 76,330,284 |
| Itau Unibanco Holding SA sponsored ADR | | 16,064,094 | 205,781,044 |
| Metalurgica Gerdau SA (PN) (b) | | 27,924,822 | 43,620,530 |
| Petroleo Brasileiro SA - Petrobras (PN) sponsored ADR (non-vtg.) (b) | | 13,861,100 | 142,076,275 |
| Telefonica Brasil SA | | 4,518,000 | 69,745,667 |
| | | | 715,591,479 |
| Korea (South) - 2.0% | | | |
| Hyundai Motor Co. Series 2 | | 1,446,053 | 146,145,649 |
| Samsung Electronics Co. Ltd. | | 57,060 | 114,314,948 |
| Samsung Fire & Marine Insurance Co. Ltd. | | 308,094 | 49,461,915 |
| | | | 309,922,512 |
|
| TOTAL NONCONVERTIBLE PREFERRED STOCKS | | | 1,025,513,991 |
|
| TOTAL PREFERRED STOCKS | | | |
| (Cost $748,220,071) | | | 1,067,863,875 |
| | | Principal Amount | Value |
|
| Government Obligations - 0.1% | | | |
| United States of America - 0.1% | | | |
U.S. Treasury Bills, yield at date of purchase 0.99% to 1.06% 11/24/17 to 1/11/18
(Cost $12,584,381) | | 12,600,000 | 12,584,910 |
| | | Shares | Value |
|
| Money Market Funds - 0.6% | | | |
| Fidelity Cash Central Fund, 1.10% (g) | | 53,082,371 | 53,092,988 |
| Fidelity Securities Lending Cash Central Fund 1.11% (g)(h) | | 52,498,230 | 52,503,480 |
| TOTAL MONEY MARKET FUNDS | | | |
| (Cost $105,595,994) | | | 105,596,468 |
| TOTAL INVESTMENT IN SECURITIES - 99.8% | | | |
| (Cost $11,313,807,516) | | | 15,719,415,376 |
| NET OTHER ASSETS (LIABILITIES) - 0.2% | | | 28,031,352 |
| NET ASSETS - 100% | | | $15,747,446,728 |
Security Type Abbreviations
ELS – Equity-Linked Security
Categorizations in the Schedule of Investments are based on country or territory of incorporation.
Legend
(a) Security or a portion of the security is on loan at period end.
(b) Non-income producing
(c) Affiliated company
(d) Security exempt from registration under Rule 144A of the Securities Act of 1933. These securities may be resold in transactions exempt from registration, normally to qualified institutional buyers. At the end of the period, the value of these securities amounted to $46,438,564 or 0.3% of net assets.
(e) Restricted securities - Investment in securities not registered under the Securities Act of 1933 (excluding 144A issues). At the end of the period, the value of restricted securities (excluding 144A issues) amounted to $42,349,884 or 0.3% of net assets.
(f) Level 3 security
(g) Affiliated fund that is generally available only to investment companies and other accounts managed by Fidelity Investments. The rate quoted is the annualized seven-day yield of the fund at period end. A complete unaudited listing of the fund's holdings as of its most recent quarter end is available upon request. In addition, each Fidelity Central Fund's financial statements, which are not covered by the Fund's Report of Independent Registered Public Accounting Firm, are available on the SEC's website or upon request.
(h) Investment made with cash collateral received from securities on loan.
Additional information on each restricted holding is as follows:
| Security | Acquisition Date | Acquisition Cost |
| China Internet Plus Holdings Ltd. Series A-11 | 1/26/15 | $23,950,652 |
Affiliated Central Funds
Information regarding fiscal year to date income earned by the Fund from investments in Fidelity Central Funds is as follows:
| Fund | Income earned |
| Fidelity Cash Central Fund | $1,942,689 |
| Fidelity Securities Lending Cash Central Fund | 893,173 |
| Total | $2,835,862 |
Other Affiliated Issuers
An affiliated company is a company in which the Fund has ownership of at least 5% of the voting securities. Fiscal year to date transactions with companies which are or were affiliates are as follows:
| Affiliate | Value, beginning of period | Purchases | Sales Proceeds | Dividend Income | Realized Gain (loss) | Change in Unrealized appreciation (depreciation) | Value, end of period |
| B2W Companhia Global do Varejo | $46,206,356 | $92,252,255 | $29,933,561 | $-- | $1,360,435 | $66,976,464 | $176,861,949 |
| Daou Technology, Inc. | 44,852,464 | 8,601,682 | -- | 481,811 | -- | (3,461,429) | 49,992,717 |
| Direcional Engenharia SA | 23,505,135 | 754,992 | 1,055,251 | -- | (254,352) | 1,181,240 | 24,131,764 |
| Fila Korea Ltd. | 51,126,461 | -- | 35,251,515 | 115,434 | (18,056,158) | 9,241,972 | -- |
| FPC Par Corretora de Seguros | 51,039,845 | 6,095,227 | 75,005,396 | 1,430,767 | 27,656,204 | (9,785,880) | -- |
| Frontier Digital Ventures Ltd. | 6,042,789 | -- | 261,597 | -- | 60,982 | 1,646,937 | 7,489,111 |
| GP Investments Ltd. Class A (depositary receipt) | 17,347,037 | -- | 697,647 | -- | (508,996) | (2,487,526) | 13,652,868 |
| InterPark INT Corp. | 30,049,593 | 76,665 | -- | 190,078 | -- | (4,454,376) | 25,671,882 |
| Korean Reinsurance Co. | 75,492,743 | 2,585,365 | 31,408,227 | 1,390,984 | (2,354,460) | 550,802 | -- |
| Macquarie Mexican (REIT) | 90,614,570 | 1,842,491 | 14,437,624 | 6,177,820 | (7,309,198) | 2,869,645 | 73,579,884 |
| Metalurgica Gerdau SA (PN) | 56,285,896 | -- | 16,679,812 | -- | 11,947,079 | (7,932,633) | -- |
| Minerva SA | 40,691,800 | -- | 13,698,467 | 1,007,272 | (5,024,280) | 9,838,134 | -- |
| Smiles SA | 137,502,361 | -- | 101,647,333 | 10,190,945 | 49,197,526 | (57,468,711) | -- |
| SREI Infrastructure Finance Ltd. | 45,678,231 | -- | 14,032,863 | 300,692 | 6,749,120 | 22,464,021 | 60,858,509 |
| Total | $716,435,281 | $112,208,677 | $334,109,293 | $21,285,803 | $63,463,902 | $29,178,660 | $432,238,684 |
Investment Valuation
The following is a summary of the inputs used, as of October 31, 2017, involving the Fund's assets and liabilities carried at fair value. The inputs or methodology used for valuing securities may not be an indication of the risk associated with investing in those securities. For more information on valuation inputs, and their aggregation into the levels used below, please refer to the Investment Valuation section in the accompanying Notes to Financial Statements.
| | Valuation Inputs at Reporting Date: |
| Description | Total | Level 1 | Level 2 | Level 3 |
| Investments in Securities: | | | | |
| Equities: | | | | |
| Consumer Discretionary | $2,277,432,896 | $2,208,114,842 | $26,968,170 | $42,349,884 |
| Consumer Staples | 988,041,221 | 988,041,221 | -- | -- |
| Energy | 1,046,997,029 | 881,606,168 | 165,390,861 | -- |
| Financials | 3,696,467,115 | 2,892,545,177 | 803,921,938 | -- |
| Health Care | 335,826,771 | 335,826,771 | -- | -- |
| Industrials | 762,957,889 | 748,731,391 | 14,226,498 | -- |
| Information Technology | 3,841,764,607 | 2,566,384,879 | 1,275,379,728 | -- |
| Materials | 1,202,419,921 | 1,155,621,783 | 46,798,138 | -- |
| Real Estate | 413,433,817 | 413,433,817 | -- | -- |
| Telecommunication Services | 660,428,148 | 599,443,639 | 60,984,509 | -- |
| Utilities | 375,464,584 | 345,792,924 | 29,671,660 | -- |
| Government Obligations | 12,584,910 | -- | 12,584,910 | -- |
| Money Market Funds | 105,596,468 | 105,596,468 | -- | -- |
| Total Investments in Securities: | $15,719,415,376 | $13,241,139,080 | $2,435,926,412 | $42,349,884 |
The following is a summary of transfers between Level 1 and Level 2 for the period ended October 31, 2017. Transfers are assumed to have occurred at the beginning of the period, and are primarily attributable to the valuation techniques used for foreign equity securities, as discussed in the accompanying Notes to Financial Statements:
| Transfers | Total |
| Level 1 to Level 2 | $183,370,539 |
| Level 2 to Level 1 | $252,117,868 |
See accompanying notes which are an integral part of the financial statements.
Fidelity® Series Emerging Markets Fund
Financial Statements
Statement of Assets and Liabilities
| | | October 31, 2017 |
| Assets | | |
Investment in securities, at value (including securities loaned of $53,123,953) — See accompanying schedule:
Unaffiliated issuers (cost $10,839,374,623) | $15,181,580,224 | |
| Fidelity Central Funds (cost $105,595,994) | 105,596,468 | |
| Other affiliated issuers (cost $368,836,899) | 432,238,684 | |
| Total Investment in Securities (cost $11,313,807,516) | | $15,719,415,376 |
| Foreign currency held at value (cost $203,875,863) | | 204,146,680 |
| Receivable for investments sold | | 41,873,734 |
| Receivable for fund shares sold | | 438,554 |
| Dividends receivable | | 9,957,315 |
| Interest receivable | | 36,465 |
| Distributions receivable from Fidelity Central Funds | | 141,250 |
| Receivable from investment adviser for expense reductions | | 240,264 |
| Other receivables | | 2,599,627 |
| Total assets | | 15,978,849,265 |
| Liabilities | | |
| Payable to custodian bank | $1,026,794 | |
| Payable for investments purchased | 111,719,844 | |
| Payable for fund shares redeemed | 33,021,200 | |
| Other payables and accrued expenses | 33,141,199 | |
| Collateral on securities loaned | 52,493,500 | |
| Total liabilities | | 231,402,537 |
| Net Assets | | $15,747,446,728 |
| Net Assets consist of: | | |
| Paid in capital | | $11,098,006,629 |
| Undistributed net investment income | | 225,392,623 |
| Accumulated undistributed net realized gain (loss) on investments and foreign currency transactions | | 49,203,033 |
| Net unrealized appreciation (depreciation) on investments and assets and liabilities in foreign currencies | | 4,374,844,443 |
| Net Assets | | $15,747,446,728 |
| Series Emerging Markets: | | |
| Net Asset Value, offering price and redemption price per share ($15,747,446,728 ÷ 737,572,431 shares) | | $21.35 |
See accompanying notes which are an integral part of the financial statements.
Statement of Operations
| | | Year ended October 31, 2017 |
| Investment Income | | |
| Dividends (including $21,285,803 earned from other affiliated issuers) | | $390,908,738 |
| Interest | | 77,005 |
| Income from Fidelity Central Funds | | 2,835,862 |
| Income before foreign taxes withheld | | 393,821,605 |
| Less foreign taxes withheld | | (41,316,576) |
| Total income | | 352,505,029 |
| Expenses | | |
| Management fee | $72,895,755 | |
| Transfer agent fees | 6,504,328 | |
| Accounting and security lending fees | 1,187,555 | |
| Custodian fees and expenses | 9,477,879 | |
| Independent trustees' fees and expenses | 63,697 | |
| Registration fees | 6,307 | |
| Audit | 48,466 | |
| Legal | 30,423 | |
| Interest | 12,247 | |
| Miscellaneous | 106,500 | |
| Total expenses before reductions | 90,333,157 | |
| Expense reductions | (4,958,917) | 85,374,240 |
| Net investment income (loss) | | 267,130,789 |
| Realized and Unrealized Gain (Loss) | | |
| Net realized gain (loss) on: | | |
| Investment securities: | | |
| Unaffiliated issuers (net of foreign taxes of $2,526,782) | 1,417,823,012 | |
| Fidelity Central Funds | 37,235 | |
| Other affiliated issuers | 63,463,902 | |
| Foreign currency transactions | (3,689,454) | |
| Futures contracts | 5,372,495 | |
| Total net realized gain (loss) | | 1,483,007,190 |
| Change in net unrealized appreciation (depreciation) on: | | |
| Unaffiliated issuers (net of increase in deferred foreign taxes of $19,023,663) | 2,418,919,768 | |
| Fidelity Central Funds | (69,219) | |
| Other affiliated issuers | 29,178,660 | |
| Assets and liabilities in foreign currencies | 309,127 | |
| Futures contracts | (41,090) | |
| Total change in net unrealized appreciation (depreciation) | | 2,448,297,246 |
| Net gain (loss) | | 3,931,304,436 |
| Net increase (decrease) in net assets resulting from operations | | $4,198,435,225 |
See accompanying notes which are an integral part of the financial statements.
Statement of Changes in Net Assets
| | Year ended October 31, 2017 | Year ended October 31, 2016 |
| Increase (Decrease) in Net Assets | | |
| Operations | | |
| Net investment income (loss) | $267,130,789 | $180,634,834 |
| Net realized gain (loss) | 1,483,007,190 | (402,075,307) |
| Change in net unrealized appreciation (depreciation) | 2,448,297,246 | 1,930,762,003 |
| Net increase (decrease) in net assets resulting from operations | 4,198,435,225 | 1,709,321,530 |
| Distributions to shareholders from net investment income | (193,538,453) | (158,339,864) |
| Distributions to shareholders from net realized gain | (33,641,199) | – |
| Total distributions | (227,179,652) | (158,339,864) |
| Share transactions - net increase (decrease) | (3,684,478,975) | 1,997,447,805 |
| Total increase (decrease) in net assets | 286,776,598 | 3,548,429,471 |
| Net Assets | | |
| Beginning of period | 15,460,670,130 | 11,912,240,659 |
| End of period | $15,747,446,728 | $15,460,670,130 |
| Other Information | | |
| Undistributed net investment income end of period | $225,392,623 | $151,855,674 |
See accompanying notes which are an integral part of the financial statements.
Financial Highlights
Fidelity Series Emerging Markets Fund
| Years ended October 31, | 2017 | 2016 | 2015 | 2014 | 2013 |
| Selected Per–Share Data | | | | | |
| Net asset value, beginning of period | $16.79 | $15.31 | $17.77 | $17.56 | $16.25 |
| Income from Investment Operations | | | | | |
| Net investment income (loss)A | .30 | .19 | .21B | .21 | .20 |
| Net realized and unrealized gain (loss) | 4.49 | 1.47 | (2.53) | .17 | 1.34 |
| Total from investment operations | 4.79 | 1.66 | (2.32) | .38 | 1.54 |
| Distributions from net investment income | (.19) | (.18) | (.14) | (.17) | (.22) |
| Distributions from net realized gain | (.04) | – | – | (.01) | (.01) |
| Total distributions | (.23) | (.18) | (.14) | (.17)C | (.23) |
| Net asset value, end of period | $21.35 | $16.79 | $15.31 | $17.77 | $17.56 |
| Total ReturnD | 29.04% | 11.02% | (13.14)% | 2.20% | 9.59% |
| Ratios to Average Net AssetsE,F | | | | | |
| Expenses before reductions | .59% | 1.03% | 1.04% | 1.06% | 1.09% |
| Expenses net of fee waivers, if any | .57% | 1.03% | 1.04% | 1.06% | 1.09% |
| Expenses net of all reductions | .56% | 1.03% | 1.03% | 1.06% | 1.06% |
| Net investment income (loss) | 1.63% | 1.24% | 1.29%B | 1.18% | 1.22% |
| Supplemental Data | | | | | |
| Net assets, end of period (000 omitted) | $15,747,447 | $6,998,219 | $5,571,493 | $4,837,497 | $3,623,928 |
| Portfolio turnover rateG | 56% | 45% | 64% | 93% | 79% |
A Calculated based on average shares outstanding during the period.
B Net Investment income per share reflects a large, non-recurring dividend which amounted to $.05 per share. Excluding this non-recurring dividend, the ratio of net investment income (loss) to average net assets would have been 1.00%.
C Total distributions of $.17 per share is comprised of distributions from net investment income of $.166 and distributions from net realized gain of $.006 per share.
D Total returns would have been lower if certain expenses had not been reduced during the applicable periods shown.
E Fees and expenses of any underlying Fidelity Central Funds are not included in the Fund's expense ratio. The Fund indirectly bears its proportionate share of the expenses of any underlying Fidelity Central Funds.
F Expense ratios reflect operating expenses of the class. Expenses before reductions do not reflect amounts reimbursed by the investment adviser or reductions from brokerage service arrangements or reductions from other expense offset arrangements and do not represent the amount paid by the class during periods when reimbursements or reductions occur. Expenses net of fee waivers reflect expenses after reimbursement by the investment adviser but prior to reductions from brokerage service arrangements or other expense offset arrangements. Expenses net of all reductions represent the net expenses paid by the class.
G Amount does not include the portfolio activity of any underlying Fidelity Central Funds.
See accompanying notes which are an integral part of the financial statements.
Fidelity® Series International Growth Fund
Performance: The Bottom Line
Average annual total return reflects the change in the value of an investment, assuming reinvestment of distributions from dividend income and capital gains (the profits earned upon the sale of securities that have grown in value, if any) and assuming a constant rate of performance each year. The hypothetical investment and the average annual total returns do not reflect the deduction of taxes that a shareholder would pay on fund distributions or the redemption of fund shares. During periods of reimbursement by Fidelity, a fund’s total return will be greater than it would be had the reimbursement not occurred. How a fund did yesterday is no guarantee of how it will do tomorrow.
Average Annual Total Returns
| For the periods ended October 31, 2017 | Past 1 year | Past 5 years | Life of fundA |
| Fidelity® Series International Growth Fund | 24.42% | 9.50% | 8.08% |
A From December 3, 2009
$10,000 Over Life of Fund
Let's say hypothetically that $10,000 was invested in Fidelity® Series International Growth Fund on December 3, 2009, when the fund started.
The chart shows how the value of your investment would have changed, and also shows how the MSCI EAFE Growth Index performed over the same period.
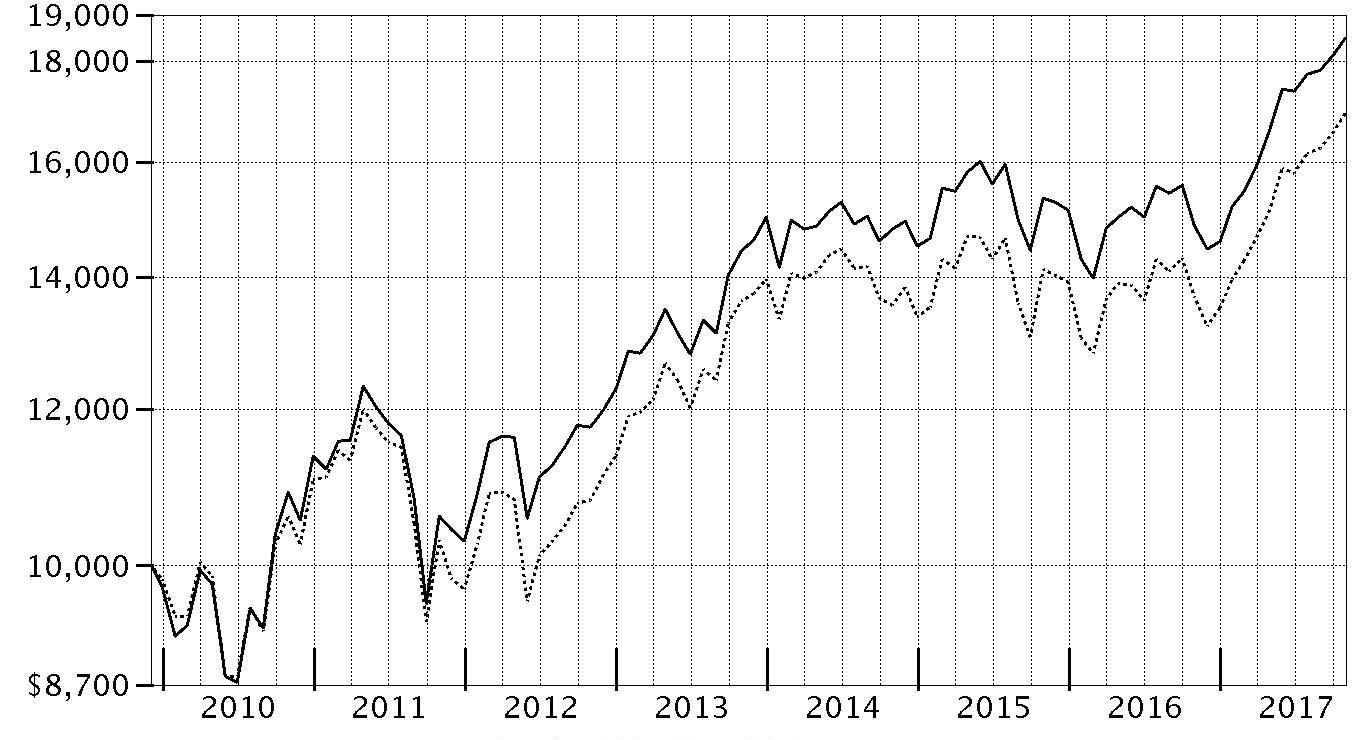
| Period Ending Values |
| $18,502 | Fidelity® Series International Growth Fund |
| $16,950 | MSCI EAFE Growth Index |
Fidelity® Series International Growth Fund
Management's Discussion of Fund Performance
Market Recap: The MSCI ACWI (All Country World Index) ex USA Index returned 23.85% for the 12 months ending October 31, 2017, helped partly by a generally weak U.S. dollar. Some favorable election results in continental Europe (+30%) suggested ebbing political uncertainty and near-term risk there, but the U.K. (+20%) faced more-mixed conditions ahead of its expected exit from the European Union. Despite central-bank easing – and pressured recently by yen strength – Japan (+18%) lagged the rest of the Asia-Pacific group (+22%). Commodity-price volatility slowed Canada (+17%), but the emerging-markets group (+26%) sped ahead. Sector-wise, information technology (+47%) was driven by a surge among several Chinese internet-related names. Financials (+27%) rode rising interest rates that, at the same time, weighed on real estate (+17%), utilities (+16%), consumer staples (+14%) and telecommunication services (+9%) – so-called “bond proxy” sectors. Materials (+28%) and industrials (+27%) responded to demand from China and price gains for certain commodities. In the energy sector (+20%), oil prices lost ground in the spring before rebounding through October 31 to end well above where they started 12 months ago. Lastly, health care (+14%) was hurt by early-period turmoil around drug pricing and health care legislation.
Comments from Portfolio Manager Jed Weiss: For the year, the fund gained 24.42%, versus 23.83% for the MSCI EAFE Growth Index. Relative to the benchmark, the fund was helped by security selection in the U.S., where we typically invest in companies that do most or all of their business abroad. Positioning in Japan, the U.K. and Australia also contributed. Conversely, stock picks and a significant underweighting in strong-performing continental Europe, a result of our bottom-up investment approach, weighed on relative results. At the stock level, the top contributor was Chinese e-commerce company Alibaba Group, whose shares rose on much better-than-expected financial results. Dutch semiconductor-equipment maker ASML Holding and Italy's Interpump Group also added value. In contrast, our biggest individual detraction came from not owning French luxury goods company LVMH Moet Hennessy Louis Vuitton, a strong-performing benchmark component that did not fit our investment criteria. U.K.-based consumer goods company Reckitt Benckiser Group also notably detracted, as did overweighting Belgian brewery Anheuser-Busch InBev.
The views expressed above reflect those of the portfolio manager(s) only through the end of the period as stated on the cover of this report and do not necessarily represent the views of Fidelity or any other person in the Fidelity organization. Any such views are subject to change at any time based upon market or other conditions and Fidelity disclaims any responsibility to update such views. These views may not be relied on as investment advice and, because investment decisions for a Fidelity fund are based on numerous factors, may not be relied on as an indication of trading intent on behalf of any Fidelity fund.
Note to shareholders: Following a roughly five-month leave of absence, Jed Weiss returned to Fidelity on November 29, 2017, and resumed his day-to-day responsibilities as Portfolio Manager. In his stead, Vincent Montemaggiore served as interim manager of the fund.
Fidelity® Series International Growth Fund
Investment Summary (Unaudited)
Geographic Diversification (% of fund's net assets)
| As of October 31, 2017 |
| | United States of America* | 19.2% |
| | Japan | 13.2% |
| | United Kingdom | 10.8% |
| | Switzerland | 8.1% |
| | Sweden | 5.5% |
| | Germany | 5.3% |
| | Belgium | 4.1% |
| | Spain | 4.1% |
| | Australia | 3.7% |
| | Other | 26.0% |
* Includes Short-Term investments and Net Other Assets (Liabilities).
Percentages are based on country or territory of incorporation and are adjusted for the effect of futures contracts, if applicable.
| As of April 30, 2017 |
| | United States of America* | 20.2% |
| | Japan | 11.7% |
| | United Kingdom | 11.5% |
| | Switzerland | 10.8% |
| | Sweden | 5.6% |
| | Germany | 4.8% |
| | Spain | 4.7% |
| | Belgium | 3.9% |
| | Australia | 3.7% |
| | Other | 23.1% |

* Includes Short-Term investments and Net Other Assets (Liabilities).
Percentages are based on country or territory of incorporation and are adjusted for the effect of futures contracts, if applicable.
Asset Allocation as of October 31, 2017
| | % of fund's net assets | % of fund's net assets 6 months ago |
| Stocks | 98.6 | 97.1 |
| Short-Term Investments and Net Other Assets (Liabilities) | 1.4 | 2.9 |
Top Ten Stocks as of October 31, 2017
| | % of fund's net assets | % of fund's net assets 6 months ago |
| Nestle SA (Reg. S) (Switzerland, Food Products) | 4.9 | 5.8 |
| Anheuser-Busch InBev SA NV (Belgium, Beverages) | 3.4 | 3.4 |
| SAP SE (Germany, Software) | 3.2 | 2.7 |
| CSL Ltd. (Australia, Biotechnology) | 3.0 | 3.0 |
| Keyence Corp. (Japan, Electronic Equipment & Components) | 2.8 | 2.2 |
| Visa, Inc. Class A (United States of America, IT Services) | 2.8 | 2.4 |
| ASML Holding NV (Netherlands) (Netherlands, Semiconductors & Semiconductor Equipment) | 2.5 | 2.0 |
| MasterCard, Inc. Class A (United States of America, IT Services) | 2.4 | 2.0 |
| AIA Group Ltd. (Hong Kong, Insurance) | 2.3 | 2.2 |
| Reckitt Benckiser Group PLC (United Kingdom, Household Products) | 2.3 | 2.2 |
| | 29.6 | |
Top Market Sectors as of October 31, 2017
| | % of fund's net assets | % of fund's net assets 6 months ago |
| Information Technology | 22.1 | 18.3 |
| Consumer Staples | 17.6 | 19.2 |
| Industrials | 14.9 | 13.4 |
| Health Care | 12.1 | 14.7 |
| Financials | 11.4 | 10.7 |
| Consumer Discretionary | 10.4 | 10.7 |
| Materials | 6.7 | 6.8 |
| Real Estate | 2.2 | 2.3 |
| Energy | 0.6 | 0.6 |
| Telecommunication Services | 0.6 | 0.4 |
Fidelity® Series International Growth Fund
Investments October 31, 2017
Showing Percentage of Net Assets
| Common Stocks - 98.2% | | | |
| | | Shares | Value |
| Australia - 3.7% | | | |
| CSL Ltd. | | 4,192,956 | $445,837,326 |
| Transurban Group unit | | 10,725,055 | 99,568,144 |
|
| TOTAL AUSTRALIA | | | 545,405,470 |
|
| Austria - 1.7% | | | |
| Andritz AG | | 3,091,198 | 174,781,958 |
| BUWOG-Gemeinnuetzige Wohnung | | 2,712,660 | 78,237,688 |
|
| TOTAL AUSTRIA | | | 253,019,646 |
|
| Belgium - 4.1% | | | |
| Anheuser-Busch InBev SA NV | | 4,118,081 | 504,964,225 |
| KBC Groep NV | | 1,286,957 | 106,901,667 |
|
| TOTAL BELGIUM | | | 611,865,892 |
|
| Brazil - 0.1% | | | |
| Itau Unibanco Holding SA | | 1,106,900 | 13,000,061 |
| Canada - 1.4% | | | |
| Alimentation Couche-Tard, Inc. Class B (sub. vtg.) | | 1,288,400 | 60,410,291 |
| Franco-Nevada Corp. | | 1,002,400 | 79,657,428 |
| Pason Systems, Inc. | | 1,851,469 | 26,880,098 |
| PrairieSky Royalty Ltd. | | 1,283,800 | 34,172,306 |
|
| TOTAL CANADA | | | 201,120,123 |
|
| Cayman Islands - 1.9% | | | |
| 58.com, Inc. ADR (a) | | 993,900 | 66,760,263 |
| Alibaba Group Holding Ltd. sponsored ADR (a) | | 1,095,700 | 202,583,973 |
| China Biologic Products Holdings, Inc. | | 73,552 | 5,715,726 |
|
| TOTAL CAYMAN ISLANDS | | | 275,059,962 |
|
| Denmark - 1.3% | | | |
| Jyske Bank A/S (Reg.) | | 1,346,300 | 76,079,411 |
| Novo Nordisk A/S Series B sponsored ADR | | 2,432,281 | 121,103,271 |
|
| TOTAL DENMARK | | | 197,182,682 |
|
| Finland - 0.3% | | | |
| Tikkurila Oyj | | 1,985,479 | 39,247,965 |
| France - 1.7% | | | |
| Edenred SA | | 2,154,600 | 62,117,199 |
| Elis SA | | 2,875,341 | 75,008,491 |
| Essilor International SA | | 957,612 | 121,252,061 |
|
| TOTAL FRANCE | | | 258,377,751 |
|
| Germany - 5.3% | | | |
| Bayer AG | | 2,407,200 | 313,126,118 |
| SAP SE | | 4,079,913 | 466,181,568 |
|
| TOTAL GERMANY | | | 779,307,686 |
|
| Hong Kong - 2.3% | | | |
| AIA Group Ltd. | | 44,835,400 | 337,354,575 |
| India - 1.0% | | | |
| Housing Development Finance Corp. Ltd. | | 5,813,740 | 153,303,161 |
| Ireland - 3.3% | | | |
| CRH PLC sponsored ADR (b) | | 7,727,805 | 289,947,244 |
| James Hardie Industries PLC CDI | | 13,092,924 | 199,311,113 |
|
| TOTAL IRELAND | | | 489,258,357 |
|
| Isle of Man - 0.6% | | | |
| Playtech Ltd. | | 6,558,106 | 85,707,862 |
| Israel - 0.2% | | | |
| Azrieli Group | | 604,584 | 34,115,965 |
| Italy - 1.1% | | | |
| Azimut Holding SpA | | 1,548,506 | 30,592,062 |
| Interpump Group SpA | | 3,841,749 | 129,374,023 |
|
| TOTAL ITALY | | | 159,966,085 |
|
| Japan - 13.2% | | | |
| Astellas Pharma, Inc. | | 6,911,500 | 91,984,166 |
| DENSO Corp. | | 2,836,300 | 156,206,346 |
| East Japan Railway Co. | | 1,548,500 | 150,172,933 |
| Hoya Corp. | | 3,109,600 | 168,946,873 |
| Keyence Corp. | | 754,000 | 418,639,620 |
| Komatsu Ltd. | | 4,826,400 | 157,706,339 |
| Misumi Group, Inc. | | 5,980,800 | 163,859,280 |
| Mitsui Fudosan Co. Ltd. | | 4,190,100 | 97,801,077 |
| Nintendo Co. Ltd. | | 197,400 | 76,583,659 |
| Olympus Corp. | | 2,591,400 | 96,438,104 |
| OSG Corp. | | 3,497,000 | 75,691,889 |
| SHO-BOND Holdings Co. Ltd. (c) | | 1,512,200 | 93,058,290 |
| USS Co. Ltd. | | 10,445,500 | 211,153,801 |
|
| TOTAL JAPAN | | | 1,958,242,377 |
|
| Kenya - 0.6% | | | |
| Safaricom Ltd. | | 340,192,300 | 83,613,529 |
| Korea (South) - 1.1% | | | |
| BGFretail Co. Ltd. (d) | | 1,345,914 | 95,217,556 |
| NAVER Corp. | | 80,310 | 64,214,097 |
|
| TOTAL KOREA (SOUTH) | | | 159,431,653 |
|
| Mexico - 0.4% | | | |
| Fomento Economico Mexicano S.A.B. de CV sponsored ADR | | 709,312 | 62,242,128 |
| Netherlands - 2.5% | | | |
| ASML Holding NV (Netherlands) | | 2,063,500 | 372,316,228 |
| New Zealand - 0.3% | | | |
| Auckland International Airport Ltd. | | 10,102,611 | 43,069,340 |
| South Africa - 2.5% | | | |
| Clicks Group Ltd. | | 6,973,952 | 78,145,749 |
| Naspers Ltd. Class N | | 1,167,610 | 284,495,903 |
|
| TOTAL SOUTH AFRICA | | | 362,641,652 |
|
| Spain - 4.1% | | | |
| Amadeus IT Holding SA Class A | | 3,725,400 | 252,777,751 |
| Hispania Activos Inmobiliarios SA | | 2,517,010 | 43,407,358 |
| Inditex SA (b) | | 5,274,462 | 197,190,302 |
| Merlin Properties Socimi SA | | 2,837,600 | 37,449,937 |
| Prosegur Compania de Seguridad SA (Reg.) | | 10,062,989 | 76,778,267 |
|
| TOTAL SPAIN | | | 607,603,615 |
|
| Sweden - 5.5% | | | |
| ASSA ABLOY AB (B Shares) | | 14,545,417 | 306,659,034 |
| Atlas Copco AB (A Shares) (b) | | 5,305,600 | 232,715,931 |
| Essity AB Class B | | 2,724,700 | 81,464,515 |
| Fagerhult AB | | 4,083,792 | 51,830,034 |
| Svenska Cellulosa AB (SCA) (B Shares) | | 2,598,000 | 24,392,181 |
| Svenska Handelsbanken AB (A Shares) | | 8,019,213 | 114,948,136 |
|
| TOTAL SWEDEN | | | 812,009,831 |
|
| Switzerland - 8.1% | | | |
| Nestle SA (Reg. S) | | 8,655,646 | 728,273,371 |
| Roche Holding AG (participation certificate) | | 1,319,670 | 305,016,801 |
| Schindler Holding AG: | | | |
| (participation certificate) | | 579,078 | 131,237,945 |
| (Reg.) | | 154,309 | 34,074,347 |
|
| TOTAL SWITZERLAND | | | 1,198,602,464 |
|
| Taiwan - 1.1% | | | |
| Taiwan Semiconductor Manufacturing Co. Ltd. | | 20,541,000 | 166,178,139 |
| Turkey - 0.2% | | | |
| Tupras Turkiye Petrol Rafinerileri A/S | | 943,924 | 33,964,394 |
| United Kingdom - 10.8% | | | |
| BAE Systems PLC | | 15,580,800 | 122,735,238 |
| British American Tobacco PLC (United Kingdom) | | 4,908,200 | 317,117,978 |
| Elementis PLC | | 8,627,647 | 32,577,395 |
| Howden Joinery Group PLC | | 5,574,200 | 30,361,236 |
| Informa PLC | | 15,456,952 | 143,088,182 |
| InterContinental Hotel Group PLC ADR (b) | | 4,280,039 | 237,927,368 |
| Prudential PLC | | 10,870,968 | 266,832,000 |
| Reckitt Benckiser Group PLC | | 3,697,987 | 330,846,561 |
| Rightmove PLC | | 613,870 | 33,868,037 |
| Shaftesbury PLC | | 2,600,200 | 34,189,211 |
| Spectris PLC | | 1,367,400 | 46,492,475 |
|
| TOTAL UNITED KINGDOM | | | 1,596,035,681 |
|
| United States of America - 17.8% | | | |
| Alphabet, Inc. Class A (a) | | 247,094 | 255,257,986 |
| Autoliv, Inc. (b) | | 1,300,827 | 162,421,259 |
| Berkshire Hathaway, Inc. Class B (a) | | 1,011,750 | 189,136,545 |
| Martin Marietta Materials, Inc. | | 640,300 | 138,849,055 |
| MasterCard, Inc. Class A | | 2,361,010 | 351,247,458 |
| Mohawk Industries, Inc. (a) | | 587,415 | 153,761,750 |
| Molson Coors Brewing Co. Class B | | 821,800 | 66,458,966 |
| Moody's Corp. | | 660,100 | 94,004,841 |
| MSCI, Inc. | | 1,030,400 | 120,927,744 |
| Philip Morris International, Inc. | | 1,998,092 | 209,080,347 |
| PriceSmart, Inc. | | 586,175 | 49,121,465 |
| ResMed, Inc. | | 1,534,600 | 129,182,628 |
| S&P Global, Inc. | | 830,971 | 130,022,032 |
| Sherwin-Williams Co. | | 454,100 | 179,437,615 |
| Visa, Inc. Class A | | 3,700,096 | 406,936,558 |
|
| TOTAL UNITED STATES OF AMERICA | | | 2,635,846,249 |
|
| TOTAL COMMON STOCKS | | | |
| (Cost $9,548,346,141) | | | 14,525,090,523 |
|
| Nonconvertible Preferred Stocks - 0.4% | | | |
| Brazil - 0.4% | | | |
| Itau Unibanco Holding SA | | | |
| (Cost $59,873,924) | | 4,681,800 | 60,180,873 |
|
| Money Market Funds - 3.4% | | | |
| Fidelity Cash Central Fund, 1.10% (e) | | 169,282,312 | 169,316,168 |
| Fidelity Securities Lending Cash Central Fund 1.11% (e)(f) | | 330,306,491 | 330,339,522 |
| TOTAL MONEY MARKET FUNDS | | | |
| (Cost $499,653,771) | | | 499,655,690 |
| TOTAL INVESTMENT IN SECURITIES - 102.0% | | | |
| (Cost $10,107,873,836) | | | 15,084,927,086 |
| NET OTHER ASSETS (LIABILITIES) - (2.0)% | | | (300,112,620) |
| NET ASSETS - 100% | | | $14,784,814,466 |
Categorizations in the Schedule of Investments are based on country or territory of incorporation.
Legend
(a) Non-income producing
(b) Security or a portion of the security is on loan at period end.
(c) Affiliated company
(d) Level 3 security
(e) Affiliated fund that is generally available only to investment companies and other accounts managed by Fidelity Investments. The rate quoted is the annualized seven-day yield of the fund at period end. A complete unaudited listing of the fund's holdings as of its most recent quarter end is available upon request. In addition, each Fidelity Central Fund's financial statements, which are not covered by the Fund's Report of Independent Registered Public Accounting Firm, are available on the SEC's website or upon request.
(f) Investment made with cash collateral received from securities on loan.
Affiliated Central Funds
Information regarding fiscal year to date income earned by the Fund from investments in Fidelity Central Funds is as follows:
| Fund | Income earned |
| Fidelity Cash Central Fund | $2,860,338 |
| Fidelity Securities Lending Cash Central Fund | 1,549,442 |
| Total | $4,409,780 |
Other Affiliated Issuers
An affiliated company is a company in which the Fund has ownership of at least 5% of the voting securities. Fiscal year to date transactions with companies which are or were affiliates are as follows:
| Affiliate | Value, beginning of period | Purchases | Sales Proceeds | Dividend Income | Realized Gain (loss) | Change in Unrealized appreciation (depreciation) | Value, end of period |
| SHO-BOND Holdings Co. Ltd. | $72,329,808 | $2,413,583 | $2,197,702 | $1,273,590 | $391,489 | $20,121,112 | $93,058,290 |
| Total | $72,329,808 | $2,413,583 | $2,197,702 | $1,273,590 | $391,489 | $20,121,112 | $93,058,290 |
Investment Valuation
The following is a summary of the inputs used, as of October 31, 2017, involving the Fund's assets and liabilities carried at fair value. The inputs or methodology used for valuing securities may not be an indication of the risk associated with investing in those securities. For more information on valuation inputs, and their aggregation into the levels used below, please refer to the Investment Valuation section in the accompanying Notes to Financial Statements.
| | Valuation Inputs at Reporting Date: |
| Description | Total | Level 1 | Level 2 | Level 3 |
| Investments in Securities: | | | | |
| Equities: | | | | |
| Consumer Discretionary | $1,546,244,911 | $1,178,884,764 | $367,360,147 | $-- |
| Consumer Staples | 2,583,343,152 | 606,923,461 | 1,881,202,135 | 95,217,556 |
| Energy | 95,016,798 | 95,016,798 | -- | -- |
| Financials | 1,693,283,108 | 1,426,451,108 | 266,832,000 | -- |
| Health Care | 1,798,603,074 | 823,091,012 | 975,512,062 | -- |
| Industrials | 2,210,799,918 | 1,140,916,915 | 1,069,883,003 | -- |
| Information Technology | 3,265,745,674 | 1,765,846,460 | 1,499,899,214 | -- |
| Materials | 983,419,996 | 983,419,996 | -- | -- |
| Real Estate | 325,201,236 | 227,400,159 | 97,801,077 | -- |
| Telecommunication Services | 83,613,529 | 83,613,529 | -- | -- |
| Money Market Funds | 499,655,690 | 499,655,690 | -- | -- |
| Total Investments in Securities: | $15,084,927,086 | $8,831,219,892 | $6,158,489,638 | $95,217,556 |
The following is a summary of transfers between Level 1 and Level 2 for the period ended October 31, 2017. Transfers are assumed to have occurred at the beginning of the period, and are primarily attributable to the valuation techniques used for foreign equity securities, as discussed in the accompanying Notes to Financial Statements:
| Transfers | Total |
| Level 1 to Level 2 | $1,676,653,483 |
| Level 2 to Level 1 | $90,128,766 |
See accompanying notes which are an integral part of the financial statements.
Fidelity® Series International Growth Fund
Financial Statements
Statement of Assets and Liabilities
| | | October 31, 2017 |
| Assets | | |
Investment in securities, at value (including securities loaned of $316,811,978) — See accompanying schedule:
Unaffiliated issuers (cost $9,563,426,256) | $14,492,213,106 | |
| Fidelity Central Funds (cost $499,653,771) | 499,655,690 | |
| Other affiliated issuers (cost $44,793,809) | 93,058,290 | |
| Total Investment in Securities (cost $10,107,873,836) | | $15,084,927,086 |
| Foreign currency held at value (cost $2,069,764) | | 2,078,350 |
| Receivable for investments sold | | 396,417 |
| Receivable for fund shares sold | | 5,939,772 |
| Dividends receivable | | 44,036,459 |
| Distributions receivable from Fidelity Central Funds | | 232,655 |
| Other receivables | | 52,780 |
| Total assets | | 15,137,663,519 |
| Liabilities | | |
| Payable for fund shares redeemed | $21,979,995 | |
| Other payables and accrued expenses | 559,976 | |
| Collateral on securities loaned | 330,309,082 | |
| Total liabilities | | 352,849,053 |
| Net Assets | | $14,784,814,466 |
| Net Assets consist of: | | |
| Paid in capital | | $9,412,717,775 |
| Undistributed net investment income | | 192,507,196 |
| Accumulated undistributed net realized gain (loss) on investments and foreign currency transactions | | 202,446,141 |
| Net unrealized appreciation (depreciation) on investments and assets and liabilities in foreign currencies | | 4,977,143,354 |
| Net Assets | | $14,784,814,466 |
| Series International Growth: | | |
| Net Asset Value, offering price and redemption price per share ($14,784,814,466 ÷ 911,275,744 shares) | | $16.22 |
See accompanying notes which are an integral part of the financial statements.
Statement of Operations
| | | Year ended October 31, 2017 |
| Investment Income | | |
| Dividends (including $1,273,590 earned from other affiliated issuers) | | $294,836,074 |
| Income from Fidelity Central Funds | | 4,409,780 |
| Income before foreign taxes withheld | | 299,245,854 |
| Less foreign taxes withheld | | (26,906,051) |
| Total income | | 272,339,803 |
| Expenses | | |
| Management fee | | |
| Basic fee | $55,329,225 | |
| Performance adjustment | 3,980,778 | |
| Transfer agent fees | 5,629,357 | |
| Accounting and security lending fees | 1,136,793 | |
| Custodian fees and expenses | 1,506,510 | |
| Independent trustees' fees and expenses | 55,500 | |
| Registration fees | 5,896 | |
| Audit | 40,513 | |
| Legal | 26,877 | |
| Interest | 5,163 | |
| Miscellaneous | 92,525 | |
| Total expenses before reductions | 67,809,137 | |
| Expense reductions | (522,628) | 67,286,509 |
| Net investment income (loss) | | 205,053,294 |
| Realized and Unrealized Gain (Loss) | | |
| Net realized gain (loss) on: | | |
| Investment securities: | | |
| Unaffiliated issuers | 232,387,196 | |
| Fidelity Central Funds | 75,668 | |
| Other affiliated issuers | 391,489 | |
| Foreign currency transactions | (726,880) | |
| Total net realized gain (loss) | | 232,127,473 |
| Change in net unrealized appreciation (depreciation) on: | | |
| Investment securities: | | |
| Unaffiliated issuers | 2,706,482,705 | |
| Fidelity Central Funds | (126,429) | |
| Other affiliated issuers | 20,121,112 | |
| Assets and liabilities in foreign currencies | 1,579,933 | |
| Total change in net unrealized appreciation (depreciation) | | 2,728,057,321 |
| Net gain (loss) | | 2,960,184,794 |
| Net increase (decrease) in net assets resulting from operations | | $3,165,238,088 |
See accompanying notes which are an integral part of the financial statements.
Statement of Changes in Net Assets
| | Year ended October 31, 2017 | Year ended October 31, 2016 |
| Increase (Decrease) in Net Assets | | |
| Operations | | |
| Net investment income (loss) | $205,053,294 | $165,399,336 |
| Net realized gain (loss) | 232,127,473 | 166,506,812 |
| Change in net unrealized appreciation (depreciation) | 2,728,057,321 | (656,844,150) |
| Net increase (decrease) in net assets resulting from operations | 3,165,238,088 | (324,938,002) |
| Distributions to shareholders from net investment income | (170,410,130) | (141,417,551) |
| Distributions to shareholders from net realized gain | (166,389,831) | (272,101,876) |
| Total distributions | (336,799,961) | (413,519,427) |
| Share transactions - net increase (decrease) | (561,512,168) | 1,248,358,990 |
| Total increase (decrease) in net assets | 2,266,925,959 | 509,901,561 |
| Net Assets | | |
| Beginning of period | 12,517,888,507 | 12,007,986,946 |
| End of period | $14,784,814,466 | $12,517,888,507 |
| Other Information | | |
| Undistributed net investment income end of period | $192,507,196 | $157,868,017 |
See accompanying notes which are an integral part of the financial statements.
Financial Highlights
Fidelity Series International Growth Fund
| Years ended October 31, | 2017 | 2016 | 2015 | 2014 | 2013 |
| Selected Per–Share Data | | | | | |
| Net asset value, beginning of period | $13.37 | $14.28 | $14.17 | $13.95 | $11.55 |
| Income from Investment Operations | | | | | |
| Net investment income (loss)A | .21 | .17B | .15 | .17 | .16 |
| Net realized and unrealized gain (loss) | 2.97 | (.60) | .36 | .20 | 2.43 |
| Total from investment operations | 3.18 | (.43) | .51 | .37 | 2.59 |
| Distributions from net investment income | (.16) | (.16) | (.19) | (.10) | (.19) |
| Distributions from net realized gain | (.17) | (.33) | (.21) | (.05) | – |
| Total distributions | (.33) | (.48)C | (.40) | (.15) | (.19) |
| Net asset value, end of period | $16.22 | $13.37 | $14.28 | $14.17 | $13.95 |
| Total ReturnD | 24.42% | (3.10)% | 3.65% | 2.66% | 22.72% |
| Ratios to Average Net AssetsE,F | | | | | |
| Expenses before reductions | .51% | .94% | .92% | .97% | 1.04% |
| Expenses net of fee waivers, if any | .51% | .94% | .91% | .97% | 1.04% |
| Expenses net of all reductions | .51% | .94% | .91% | .97% | 1.02% |
| Net investment income (loss) | 1.41% | 1.27%B | 1.06% | 1.23% | 1.26% |
| Supplemental Data | | | | | |
| Net assets, end of period (000 omitted) | $14,784,814 | $5,618,983 | $5,563,674 | $6,049,347 | $5,642,298 |
| Portfolio turnover rateG | 23% | 26% | 24% | 33% | 41% |
A Calculated based on average shares outstanding during the period.
B Net Investment income per share reflects a large, non-recurring dividend which amounted to $.05 per share. Excluding this non-recurring dividend, the ratio of net investment income (loss) to average net assets would have been .93%.
C Total distributions of $.48 per share is comprised of distributions from net investment income of $.156 and distributions from net realized gain of $.326 per share.
D Total returns would have been lower if certain expenses had not been reduced during the applicable periods shown.
E Fees and expenses of any underlying Fidelity Central Funds are not included in the Fund's expense ratio. The Fund indirectly bears its proportionate share of the expenses of any underlying Fidelity Central Funds.
F Expense ratios reflect operating expenses of the class. Expenses before reductions do not reflect amounts reimbursed by the investment adviser or reductions from brokerage service arrangements or reductions from other expense offset arrangements and do not represent the amount paid by the class during periods when reimbursements or reductions occur. Expenses net of fee waivers reflect expenses after reimbursement by the investment adviser but prior to reductions from brokerage service arrangements or other expense offset arrangements. Expenses net of all reductions represent the net expenses paid by the class.
G Amount does not include the portfolio activity of any underlying Fidelity Central Funds.
See accompanying notes which are an integral part of the financial statements.
Fidelity® Series International Small Cap Fund
Performance: The Bottom Line
Average annual total return reflects the change in the value of an investment, assuming reinvestment of distributions from dividend income and capital gains (the profits earned upon the sale of securities that have grown in value, if any) and assuming a constant rate of performance each year. The hypothetical investment and the average annual total returns do not reflect the deduction of taxes that a shareholder would pay on fund distributions or the redemption of fund shares. During periods of reimbursement by Fidelity, a fund’s total return will be greater than it would be had the reimbursement not occurred. How a fund did yesterday is no guarantee of how it will do tomorrow.
Average Annual Total Returns
| For the periods ended October 31, 2017 | Past 1 year | Past 5 years | Life of fundA |
| Fidelity® Series International Small Cap Fund | 25.87% | 11.83% | 10.66% |
A From December 3, 2009
$10,000 Over Life of Fund
Let's say hypothetically that $10,000 was invested in Fidelity® Series International Small Cap Fund on December 3, 2009, when the fund started.
The chart shows how the value of your investment would have changed, and also shows how the MSCI EAFE Small Cap Index performed over the same period.
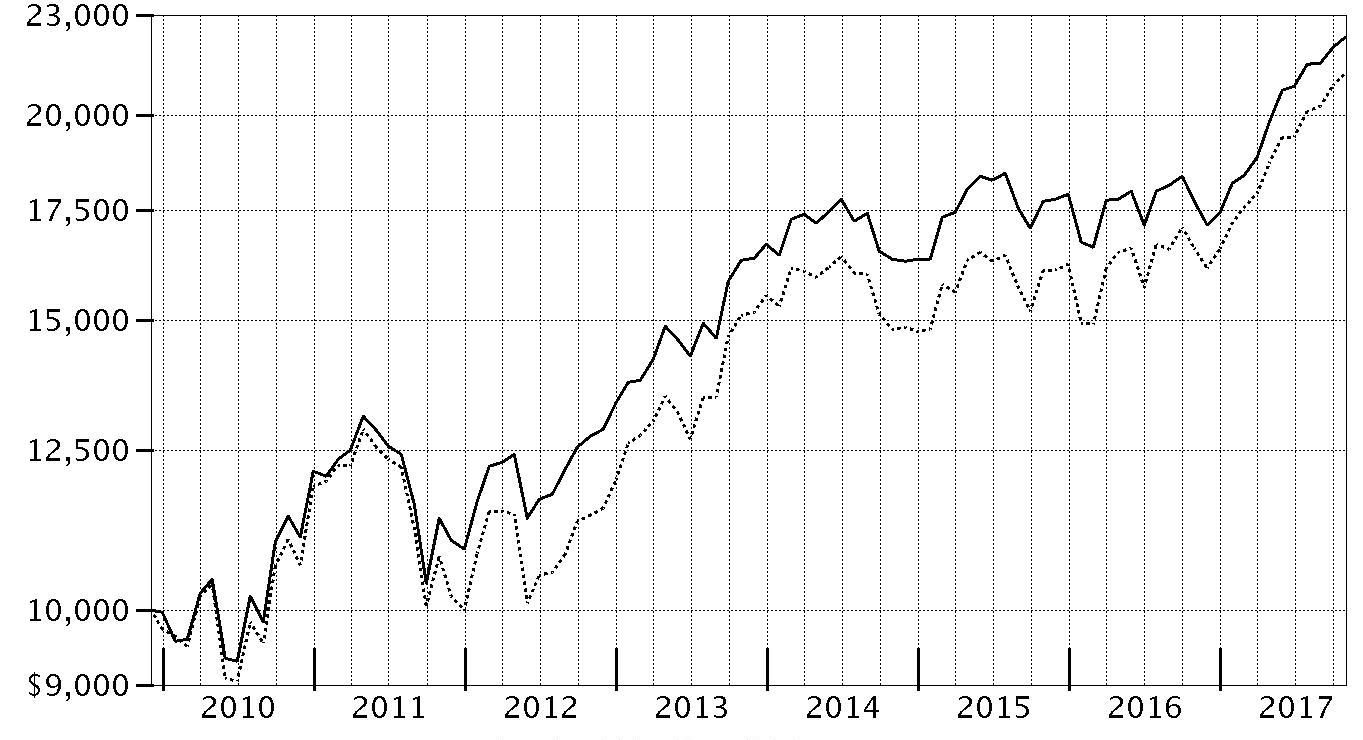
| Period Ending Values |
| $22,294 | Fidelity® Series International Small Cap Fund |
| $21,187 | MSCI EAFE Small Cap Index |
Fidelity® Series International Small Cap Fund
Management's Discussion of Fund Performance
Market Recap: The MSCI ACWI (All Country World Index) ex USA Index returned 23.85% for the 12 months ending October 31, 2017, helped partly by a generally weak U.S. dollar. Some favorable election results in continental Europe (+30%) suggested ebbing political uncertainty and near-term risk there, but the U.K. (+20%) faced more-mixed conditions ahead of its expected exit from the European Union. Despite central-bank easing – and pressured recently by yen strength – Japan (+18%) lagged the rest of the Asia-Pacific group (+22%). Commodity-price volatility slowed Canada (+17%), but the emerging-markets group (+26%) sped ahead. Sector-wise, information technology (+47%) was driven by a surge among several Chinese internet-related names. Financials (+27%) rode rising interest rates that, at the same time, weighed on real estate (+17%), utilities (+16%), consumer staples (+14%) and telecommunication services (+9%) – so-called “bond proxy” sectors. Materials (+28%) and industrials (+27%) responded to demand from China and price gains for certain commodities. In the energy sector (+20%), oil prices lost ground in the spring before rebounding through October 31 to end well above where they started 12 months ago. Lastly, health care (+14%) was hurt by early-period turmoil around drug pricing and health care legislation.
Comments from Lead Portfolio Manager Jed Weiss: For the year, the fund gained 25.87%, versus 27.70% for the MSCI EAFE Small Cap Index. Relative to the benchmark, security selection in emerging markets, especially South Korea, hurt the most. Choices in Germany and Australia also detracted. Conversely, the fund benefited from stock selection in Japan and, to a lesser extent, Sweden and Italy. The biggest individual detractor was out-of-index Korean convenience store operator BGF Retail. The company's shares were hit hard by minimum-wage hikes in its home market. Also hurting results was an overweighting in RCG, an Australia-based shoe retailer whose business has struggled along with the Australian consumer. Other laggards included non-index SK Kaken, a Japan-based paint manufacturer, and Australian sandalwood producer Quintis. On the positive side, our top individual contributor was a large overweighting in Interpump Group, an Italian maker of specialty pumps. Japanese semiconductor-equipment maker Lasertec also helped, as did Britain's Dechra Pharmaceuticals.
The views expressed above reflect those of the portfolio manager(s) only through the end of the period as stated on the cover of this report and do not necessarily represent the views of Fidelity or any other person in the Fidelity organization. Any such views are subject to change at any time based upon market or other conditions and Fidelity disclaims any responsibility to update such views. These views may not be relied on as investment advice and, because investment decisions for a Fidelity fund are based on numerous factors, may not be relied on as an indication of trading intent on behalf of any Fidelity fund.
Notes to shareholders: Following a roughly five-month leave of absence, Jed Weiss returned to Fidelity on November 29, 2017, and resumed his day-to-day responsibilities as Lead Portfolio Manager. In his stead, Patrick Drouot and Patrick Buchanan served (and remain) as Co-Managers of the fund.
Effective May 24, 2017, Michael Luciano is no longer a Co-Manager on the fund.
Fidelity® Series International Small Cap Fund
Investment Summary (Unaudited)
Geographic Diversification (% of fund's net assets)
| As of October 31, 2017 |
| | Japan | 32.6% |
| | United Kingdom | 16.0% |
| | Germany | 6.0% |
| | Sweden | 4.9% |
| | United States of America* | 4.5% |
| | France | 3.2% |
| | Italy | 3.1% |
| | Netherlands | 2.7% |
| | Australia | 2.6% |
| | Other | 24.4% |

* Includes Short-Term investments and Net Other Assets (Liabilities).
Percentages are based on country or territory of incorporation and are adjusted for the effect of futures contracts, if applicable.
| As of April 30, 2017 |
| | Japan | 27.7% |
| | United Kingdom | 17.9% |
| | United States of America* | 10.0% |
| | Germany | 6.3% |
| | Sweden | 5.1% |
| | Italy | 3.3% |
| | Australia | 2.6% |
| | France | 2.4% |
| | Netherlands | 2.3% |
| | Other | 22.4% |
* Includes Short-Term investments and Net Other Assets (Liabilities).
Percentages are based on country or territory of incorporation and are adjusted for the effect of futures contracts, if applicable.
Asset Allocation as of October 31, 2017
| | % of fund's net assets | % of fund's net assets 6 months ago |
| Stocks | 98.0 | 93.4 |
| Short-Term Investments and Net Other Assets (Liabilities) | 2.0 | 6.6 |
Top Ten Stocks as of October 31, 2017
| | % of fund's net assets | % of fund's net assets 6 months ago |
| Azbil Corp. (Japan, Electronic Equipment & Components) | 2.2 | 1.7 |
| USS Co. Ltd. (Japan, Specialty Retail) | 2.0 | 1.9 |
| Spirax-Sarco Engineering PLC (United Kingdom, Machinery) | 2.0 | 2.0 |
| CompuGroup Medical AG (Germany, Health Care Technology) | 1.9 | 2.0 |
| Spectris PLC (United Kingdom, Electronic Equipment & Components) | 1.9 | 1.9 |
| Elis SA (France, Commercial Services & Supplies) | 1.9 | 0.9 |
| Interpump Group SpA (Italy, Machinery) | 1.9 | 2.0 |
| OBIC Co. Ltd. (Japan, IT Services) | 1.7 | 1.5 |
| Nihon Parkerizing Co. Ltd. (Japan, Chemicals) | 1.7 | 1.4 |
| Sartorius AG (non-vtg.) (Germany, Health Care Equipment & Supplies) | 1.7 | 1.9 |
| | 18.9 | |
Top Market Sectors as of October 31, 2017
| | % of fund's net assets | % of fund's net assets 6 months ago |
| Industrials | 23.8 | 22.0 |
| Consumer Discretionary | 14.6 | 14.3 |
| Information Technology | 13.3 | 12.2 |
| Health Care | 11.3 | 11.9 |
| Consumer Staples | 9.3 | 9.1 |
| Financials | 8.5 | 7.2 |
| Materials | 8.2 | 7.8 |
| Real Estate | 7.0 | 6.8 |
| Energy | 2.0 | 2.1 |
| Utilities | 0.0 | 0.0 |
Percentages shown as 0.0% may reflect amounts less than 0.05%.
Fidelity® Series International Small Cap Fund
Investments October 31, 2017
Showing Percentage of Net Assets
| Common Stocks - 96.1% | | | |
| | | Shares | Value |
| Australia - 2.6% | | | |
| Adelaide Brighton Ltd. | | 2,707,269 | $12,867,172 |
| Austal Ltd. | | 2,412,861 | 3,259,396 |
| Bapcor Ltd. | | 810,786 | 3,375,711 |
| Beacon Lighting Group Ltd. | | 6,523,255 | 7,289,157 |
| DuluxGroup Ltd. | | 4,919,853 | 27,751,068 |
| Imdex Ltd. (a) | | 16,634,283 | 12,349,117 |
| John Fairfax Holdings Ltd. | | 2,854,785 | 2,403,401 |
| Nanosonics Ltd. (a) | | 572,068 | 1,313,497 |
| Pact Group Holdings Ltd. | | 825,000 | 3,662,200 |
| Quintis Ltd. (b)(c) | | 9,242,850 | 2,086,834 |
| RCG Corp. Ltd. (b) | | 16,393,344 | 9,409,984 |
| Reckon Ltd. (d) | | 5,931,406 | 5,651,804 |
| Sigma Healthcare Ltd. | | 2,407,905 | 1,391,382 |
| SomnoMed Ltd. (a) | | 246,575 | 685,040 |
|
| TOTAL AUSTRALIA | | | 93,495,763 |
|
| Austria - 1.8% | | | |
| Andritz AG | | 483,024 | 27,311,056 |
| BUWOG-Gemeinnuetzige Wohnung | | 919,906 | 26,531,640 |
| IMMOFINANZ Immobilien Anlagen AG | | 2,169,441 | 5,486,276 |
| Wienerberger AG | | 136,600 | 3,510,154 |
|
| TOTAL AUSTRIA | | | 62,839,126 |
|
| Bailiwick of Jersey - 0.5% | | | |
| Integrated Diagnostics Holdings PLC | | 4,317,632 | 16,838,765 |
| IWG PLC | | 872,700 | 2,496,651 |
|
| TOTAL BAILIWICK OF JERSEY | | | 19,335,416 |
|
| Belgium - 1.5% | | | |
| Barco NV | | 16,700 | 1,710,113 |
| Econocom Group SA | | 677,914 | 5,218,127 |
| KBC Ancora | | 779,573 | 46,493,983 |
|
| TOTAL BELGIUM | | | 53,422,223 |
|
| Bermuda - 0.6% | | | |
| APT Satellite Holdings Ltd. | | 528,500 | 250,654 |
| BW Offshore Ltd. (a) | | 275,000 | 902,302 |
| Vostok New Ventures Ltd. (depositary receipt) (a) | | 2,608,342 | 21,498,223 |
|
| TOTAL BERMUDA | | | 22,651,179 |
|
| Brazil - 0.2% | | | |
| Magnesita Refratarios SA | | 186,800 | 2,626,723 |
| Sul America SA unit | | 919,702 | 5,040,888 |
|
| TOTAL BRAZIL | | | 7,667,611 |
|
| Canada - 1.6% | | | |
| McCoy Global, Inc. (a) | | 1,118,050 | 1,568,615 |
| New Look Vision Group, Inc. | | 597,900 | 15,933,495 |
| Pason Systems, Inc. | | 777,100 | 11,282,135 |
| PrairieSky Royalty Ltd. | | 319,000 | 8,491,171 |
| ShawCor Ltd. Class A | | 483,200 | 10,472,267 |
| Total Energy Services, Inc. | | 360,000 | 4,238,741 |
| Whitecap Resources, Inc. | | 325,000 | 2,332,765 |
| ZCL Composites, Inc. | | 280,000 | 2,951,709 |
|
| TOTAL CANADA | | | 57,270,898 |
|
| Cayman Islands - 1.4% | | | |
| 58.com, Inc. ADR (a) | | 192,200 | 12,910,074 |
| China Biologic Products Holdings, Inc. | | 174,408 | 13,553,246 |
| SITC International Holdings Co. Ltd. | | 5,260,000 | 5,070,269 |
| Value Partners Group Ltd. | | 17,091,000 | 16,934,580 |
|
| TOTAL CAYMAN ISLANDS | | | 48,468,169 |
|
| Denmark - 2.2% | | | |
| Jyske Bank A/S (Reg.) | | 495,519 | 28,001,778 |
| Royal Unibrew A/S | | 40,600 | 2,337,523 |
| Scandinavian Tobacco Group A/S | | 1,157,059 | 19,561,284 |
| Spar Nord Bank A/S | | 2,375,285 | 30,210,450 |
|
| TOTAL DENMARK | | | 80,111,035 |
|
| Finland - 0.7% | | | |
| Olvi PLC (A Shares) | | 119,900 | 3,917,618 |
| Oriola-KD Oyj | | 242,700 | 910,323 |
| Tikkurila Oyj | | 977,930 | 19,331,236 |
|
| TOTAL FINLAND | | | 24,159,177 |
|
| France - 3.2% | | | |
| Cegedim SA (a) | | 36,892 | 1,435,320 |
| Elis SA (b) | | 2,562,104 | 66,837,135 |
| Laurent-Perrier Group SA | | 135,868 | 12,741,983 |
| Rubis | | 17,600 | 1,104,613 |
| Somfy SA | | 13,500 | 1,368,116 |
| Vetoquinol SA | | 301,927 | 19,487,679 |
| Virbac SA (a) | | 99,200 | 12,774,397 |
|
| TOTAL FRANCE | | | 115,749,243 |
|
| Germany - 4.3% | | | |
| CompuGroup Medical AG | | 1,193,653 | 68,589,749 |
| CTS Eventim AG | | 1,064,701 | 43,978,094 |
| Fielmann AG | | 201,790 | 17,687,895 |
| MLP AG | | 672,245 | 4,616,166 |
| Nexus AG | | 519,508 | 15,767,154 |
| SMA Solar Technology AG (b) | | 88,053 | 4,081,715 |
|
| TOTAL GERMANY | | | 154,720,773 |
|
| Greece - 0.4% | | | |
| Fourlis Holdings SA | | 752,500 | 4,882,381 |
| Motor Oil (HELLAS) Corinth Refineries SA | | 200,000 | 4,787,534 |
| Mytilineos Holdings SA (a) | | 318,300 | 3,333,238 |
|
| TOTAL GREECE | | | 13,003,153 |
|
| India - 0.6% | | | |
| Jyothy Laboratories Ltd. | | 3,507,063 | 21,307,777 |
| Torrent Pharmaceuticals Ltd. | | 40,264 | 789,641 |
|
| TOTAL INDIA | | | 22,097,418 |
|
| Ireland - 1.6% | | | |
| Cairn Homes PLC (a) | | 1,233,100 | 2,560,341 |
| FBD Holdings PLC (a) | | 1,298,400 | 13,536,349 |
| James Hardie Industries PLC CDI | | 2,524,307 | 38,427,049 |
| United Drug PLC (United Kingdom) | | 204,200 | 2,507,320 |
|
| TOTAL IRELAND | | | 57,031,059 |
|
| Isle of Man - 0.9% | | | |
| Playtech Ltd. | | 2,406,347 | 31,448,539 |
| Israel - 2.2% | | | |
| Azrieli Group | | 334,879 | 18,896,828 |
| Ituran Location & Control Ltd. | | 959,086 | 34,047,553 |
| Strauss Group Ltd. | | 1,265,055 | 25,759,160 |
|
| TOTAL ISRAEL | | | 78,703,541 |
|
| Italy - 3.1% | | | |
| Astm SpA | | 30,000 | 831,703 |
| Azimut Holding SpA | | 1,284,364 | 25,373,710 |
| Beni Stabili SpA SIIQ | | 19,947,820 | 17,659,526 |
| Interpump Group SpA | | 1,954,966 | 65,835,071 |
|
| TOTAL ITALY | | | 109,700,010 |
|
| Japan - 32.6% | | | |
| A/S One Corp. | | 12,000 | 659,732 |
| Aeon Delight Co. Ltd. | | 63,800 | 2,388,164 |
| Ai Holdings Corp. | | 635,600 | 15,605,062 |
| Aoki Super Co. Ltd. | | 285,000 | 3,264,634 |
| Arcland Service Holdings Co. Ltd. | | 113,200 | 2,497,107 |
| Artnature, Inc. (d) | | 1,778,400 | 11,683,496 |
| Asahi Co. Ltd. | | 1,015,500 | 12,344,483 |
| Asante, Inc. | | 216,400 | 4,008,693 |
| Aucnet, Inc. | | 94,800 | 1,253,678 |
| Azbil Corp. | | 1,790,100 | 78,167,901 |
| Bank of Kyoto Ltd. | | 117,200 | 6,155,004 |
| Broadleaf Co. Ltd. | | 771,500 | 6,334,147 |
| Central Automotive Products Ltd. | | 121,079 | 1,970,259 |
| Chugoku Marine Paints Ltd. | | 275,000 | 2,336,510 |
| Coca-Cola West Co. Ltd. | | 457,650 | 16,012,876 |
| Daiichikosho Co. Ltd. | | 631,000 | 29,734,394 |
| Daikokutenbussan Co. Ltd. | | 569,400 | 25,922,964 |
| Funai Soken Holdings, Inc. | | 639,000 | 23,477,734 |
| GCA Savvian Group Corp. | | 1,935,687 | 17,718,059 |
| GMO Internet, Inc. | | 306,280 | 4,731,814 |
| Goldcrest Co. Ltd. | | 1,493,510 | 32,357,472 |
| Iwatani Corp. | | 51,200 | 1,544,025 |
| Iwatsuka Confectionary Co. Ltd. | | 121,100 | 5,394,624 |
| Kamigumi Co. Ltd. | | 155,850 | 3,730,892 |
| Kobayashi Pharmaceutical Co. Ltd. | | 617,100 | 35,681,351 |
| Konoike Transport Co. Ltd. | | 205,200 | 3,157,511 |
| Koshidaka Holdings Co. Ltd. (b) | | 612,700 | 24,784,801 |
| Kusuri No Aoki Holdings Co. Ltd. | | 337,500 | 18,730,904 |
| Lasertec Corp. | | 1,456,000 | 32,034,536 |
| Leopalace21 Corp. | | 834,096 | 6,228,395 |
| Mandom Corp. | | 83,600 | 2,490,988 |
| Medikit Co. Ltd. | | 271,400 | 13,121,510 |
| Mirait Holdings Corp. | | 196,900 | 2,573,015 |
| Miroku Jyoho Service Co., Ltd. | | 419,800 | 9,803,885 |
| Misumi Group, Inc. | | 1,411,500 | 38,671,645 |
| Mitsuboshi Belting Ltd. | | 184,000 | 2,297,374 |
| Monex Group, Inc. | | 2,402,932 | 7,663,337 |
| Morinaga & Co. Ltd. | | 70,900 | 4,027,814 |
| Nabtesco Corp. | | 737,200 | 29,286,524 |
| Nagaileben Co. Ltd. | | 1,488,300 | 37,135,928 |
| Nakanishi, Inc. | | 37,600 | 1,704,020 |
| Nakano Refrigerators Co. Ltd. | | 285,100 | 10,156,863 |
| ND Software Co. Ltd. | | 224,536 | 2,735,118 |
| Nihon Parkerizing Co. Ltd. | | 3,715,200 | 60,904,206 |
| Nitto Kohki Co. Ltd. | | 83,400 | 2,066,447 |
| NOF Corp. | | 175,000 | 5,057,558 |
| NS Tool Co. Ltd. | | 4,000 | 78,241 |
| OBIC Co. Ltd. | | 943,400 | 62,444,756 |
| Okamoto Industries, Inc. | | 300,000 | 3,264,125 |
| OSG Corp. (b) | | 2,240,800 | 48,501,683 |
| PALTAC Corp. | | 145,200 | 5,766,769 |
| Paramount Bed Holdings Co. Ltd. | | 717,160 | 31,626,153 |
| ProNexus, Inc. | | 1,241,000 | 15,060,493 |
| S Foods, Inc. | | 113,500 | 4,316,445 |
| Sakai Moving Service Co. Ltd. | | 5,100 | 296,348 |
| San-Ai Oil Co. Ltd. | | 2,176,900 | 25,999,846 |
| Sekisui Jushi Corp. | | 160,100 | 3,575,763 |
| Shinko Plantech Co. Ltd. | | 138,200 | 1,193,261 |
| Shinsei Bank Ltd. | | 276,600 | 4,667,838 |
| Ship Healthcare Holdings, Inc. | | 41,100 | 1,285,275 |
| SHO-BOND Holdings Co. Ltd. | | 759,300 | 46,726,068 |
| Shoei Co. Ltd. (d) | | 815,800 | 27,389,174 |
| SK Kaken Co. Ltd. | | 217,000 | 18,029,102 |
| Software Service, Inc. | | 168,400 | 7,758,161 |
| Techno Medica Co. Ltd. | | 283,000 | 4,919,603 |
| The Monogatari Corp. | | 219,000 | 16,136,124 |
| TKC Corp. | | 666,600 | 20,981,729 |
| Tocalo Co. Ltd. | | 458,400 | 18,497,333 |
| Toshiba Plant Systems & Services Corp. | | 178,800 | 3,084,191 |
| Tsuruha Holdings, Inc. | | 30,270 | 3,752,955 |
| USS Co. Ltd. | | 3,561,200 | 71,988,982 |
| Welcia Holdings Co. Ltd. | | 634,400 | 24,076,888 |
| Workman Co. Ltd. | | 650,700 | 20,282,907 |
| Yamato Kogyo Co. Ltd. | | 336,200 | 8,993,030 |
| Yuasa Trading Co. Ltd. | | 100,900 | 3,720,004 |
| Yusen Logistics Co. Ltd. | | 152,500 | 2,011,785 |
|
| TOTAL JAPAN | | | 1,166,032,486 |
|
| Korea (South) - 1.5% | | | |
| BGFretail Co. Ltd. (c) | | 638,968 | 45,204,204 |
| iMarketKorea, Inc. | | 103,160 | 882,971 |
| Leeno Industrial, Inc. | | 186,094 | 8,521,687 |
|
| TOTAL KOREA (SOUTH) | | | 54,608,862 |
|
| Luxembourg - 0.1% | | | |
| B&M European Value Retail S.A. | | 653,731 | 3,449,569 |
| Mexico - 0.3% | | | |
| Consorcio ARA S.A.B. de CV | | 28,647,495 | 10,131,053 |
| Genomma Lab Internacional SA de CV (a) | | 852,700 | 994,948 |
|
| TOTAL MEXICO | | | 11,126,001 |
|
| Netherlands - 2.7% | | | |
| Aalberts Industries NV | | 984,900 | 48,580,757 |
| Arcadis NV | | 64,918 | 1,501,052 |
| BinckBank NV | | 641,961 | 3,271,574 |
| Intertrust NV | | 158,486 | 2,436,884 |
| PostNL NV | | 652,200 | 2,781,317 |
| RHI Magnesita NV | | 52,548 | 2,333,346 |
| Takeaway.com Holding BV (a)(e) | | 222,278 | 10,505,700 |
| Van Lanschot NV (Bearer) | | 227,504 | 6,904,784 |
| VastNed Retail NV | | 402,554 | 17,621,827 |
|
| TOTAL NETHERLANDS | | | 95,937,241 |
|
| New Zealand - 0.2% | | | |
| EBOS Group Ltd. | | 124,107 | 1,494,705 |
| The a2 Milk Co. Ltd. (a) | | 888,554 | 5,182,018 |
|
| TOTAL NEW ZEALAND | | | 6,676,723 |
|
| Norway - 1.2% | | | |
| ABG Sundal Collier ASA | | 5,878,388 | 4,073,418 |
| Borregaard ASA | | 290,000 | 2,795,972 |
| Kongsberg Gruppen ASA (b) | | 924,448 | 16,863,706 |
| Schibsted ASA (A Shares) | | 82,366 | 2,123,688 |
| Skandiabanken ASA | | 1,442,449 | 14,613,449 |
| Spectrum ASA (a) | | 350,000 | 1,585,455 |
|
| TOTAL NORWAY | | | 42,055,688 |
|
| Philippines - 0.6% | | | |
| Jollibee Food Corp. | | 3,845,490 | 18,561,941 |
| Pilipinas Shell Petroleum Corp. | | 1,288,850 | 1,555,300 |
|
| TOTAL PHILIPPINES | | | 20,117,241 |
|
| Singapore - 0.1% | | | |
| Boustead Singapore Ltd. | | 5,027,300 | 3,319,324 |
| Hour Glass Ltd. | | 1,558,300 | 777,378 |
|
| TOTAL SINGAPORE | | | 4,096,702 |
|
| South Africa - 0.7% | | | |
| Clicks Group Ltd. | | 2,335,481 | 26,169,941 |
| Spain - 2.6% | | | |
| Baron de Ley SA (a) | | 9,415 | 1,228,311 |
| Hispania Activos Inmobiliarios SA | | 1,100,650 | 18,981,374 |
| Merlin Properties Socimi SA | | 1,590,500 | 20,991,022 |
| Prosegur Cash SA | | 973,400 | 3,174,822 |
| Prosegur Compania de Seguridad SA (Reg.) | | 6,199,186 | 47,298,348 |
|
| TOTAL SPAIN | | | 91,673,877 |
|
| Sweden - 4.9% | | | |
| Addlife AB | | 526,400 | 10,375,016 |
| AddTech AB (B Shares) | | 1,281,610 | 28,398,064 |
| Fagerhult AB | | 4,237,305 | 53,778,366 |
| Granges AB | | 300,000 | 3,108,706 |
| Lagercrantz Group AB (B Shares) | | 1,961,454 | 20,852,449 |
| Loomis AB (B Shares) | | 622,000 | 24,956,825 |
| Mekonomen AB (b) | | 71,125 | 1,435,813 |
| Saab AB (B Shares) | | 612,300 | 31,289,165 |
|
| TOTAL SWEDEN | | | 174,194,404 |
|
| Switzerland - 0.3% | | | |
| Daetwyler Holdings AG | | 335 | 56,211 |
| EDAG Engineering Group AG | | 91,500 | 1,433,019 |
| Tecan Group AG | | 17,063 | 3,608,774 |
| Vontobel Holdings AG | | 88,220 | 5,486,945 |
|
| TOTAL SWITZERLAND | | | 10,584,949 |
|
| Taiwan - 0.4% | | | |
| Addcn Technology Co. Ltd. | | 1,655,570 | 14,996,702 |
| United Kingdom - 16.0% | | | |
| Alliance Pharma PLC | | 14,372,548 | 11,405,618 |
| Ascential PLC | | 853,376 | 3,818,463 |
| Cineworld Group PLC | | 357,800 | 3,157,784 |
| Countrywide PLC | | 2,763,869 | 4,579,364 |
| Dechra Pharmaceuticals PLC | | 1,830,863 | 49,994,944 |
| Dignity PLC | | 111,207 | 3,578,761 |
| DP Poland PLC (a) | | 6,918,000 | 3,859,020 |
| Elementis PLC | | 8,174,282 | 30,865,520 |
| Equiniti Group PLC | | 1,517,223 | 6,103,737 |
| GetBusy PLC | | 2,405,905 | 1,326,092 |
| Great Portland Estates PLC | | 2,738,800 | 22,607,294 |
| H&T Group PLC | | 1,385,653 | 6,116,880 |
| Hill & Smith Holdings PLC | | 61,530 | 1,080,353 |
| Hilton Food Group PLC | | 1,018,638 | 12,067,904 |
| Howden Joinery Group PLC | | 5,872,800 | 31,987,633 |
| Informa PLC | | 5,154,938 | 47,720,321 |
| InterContinental Hotel Group PLC ADR | | 297,247 | 16,523,961 |
| ITE Group PLC | | 8,444,572 | 19,935,833 |
| LivaNova PLC (a) | | 29,284 | 2,164,088 |
| LSL Property Services PLC | | 500,000 | 1,550,615 |
| Luxfer Holdings PLC sponsored ADR | | 335,000 | 4,147,300 |
| Mears Group PLC | | 791,912 | 4,767,183 |
| Mitie Group PLC | | 577,891 | 1,819,036 |
| PayPoint PLC | | 110,600 | 1,349,216 |
| Polypipe Group PLC | | 353,800 | 1,938,335 |
| Rightmove PLC | | 529,647 | 29,221,341 |
| Shaftesbury PLC | | 3,047,755 | 40,073,971 |
| Sinclair Pharma PLC (a) | | 3,250,907 | 1,262,925 |
| Spectris PLC | | 1,980,616 | 67,342,212 |
| Spirax-Sarco Engineering PLC | | 955,628 | 71,710,779 |
| Topps Tiles PLC (d) | | 10,691,339 | 9,904,292 |
| Tullett Prebon PLC | | 1,076,603 | 7,785,753 |
| Ultra Electronics Holdings PLC | | 1,181,412 | 28,620,245 |
| Unite Group PLC | | 2,020,063 | 18,861,115 |
| Zpg PLC | | 505,923 | 2,351,796 |
|
| TOTAL UNITED KINGDOM | | | 571,599,684 |
|
| United States of America - 2.5% | | | |
| Autoliv, Inc. | | 123,800 | 15,457,668 |
| Compass Minerals International, Inc. (b) | | 41,000 | 2,689,600 |
| Martin Marietta Materials, Inc. | | 72,080 | 15,630,548 |
| Mohawk Industries, Inc. (a) | | 53,962 | 14,125,093 |
| PriceSmart, Inc. | | 257,926 | 21,614,199 |
| ResMed, Inc. | | 209,700 | 17,652,546 |
| Resources Connection, Inc. | | 46,200 | 727,650 |
| Utah Medical Products, Inc. | | 14,850 | 1,119,690 |
|
| TOTAL UNITED STATES OF AMERICA | | | 89,016,994 |
|
| TOTAL COMMON STOCKS | | | |
| (Cost $2,324,468,724) | | | 3,434,211,397 |
|
| Nonconvertible Preferred Stocks - 1.9% | | | |
| Brazil - 0.2% | | | |
| Banco ABC Brasil SA | | 1,149,100 | 6,305,244 |
| Germany - 1.7% | | | |
| Sartorius AG (non-vtg.) | | 653,472 | 60,903,361 |
| TOTAL NONCONVERTIBLE PREFERRED STOCKS | | | |
| (Cost $24,626,450) | | | 67,208,605 |
|
| Money Market Funds - 2.7% | | | |
| Fidelity Cash Central Fund, 1.10%(f) | | 66,668,136 | 66,681,470 |
| Fidelity Securities Lending Cash Central Fund 1.11%(f)(g) | | 29,551,017 | 29,553,972 |
| TOTAL MONEY MARKET FUNDS | | | |
| (Cost $96,229,103) | | | 96,235,442 |
| TOTAL INVESTMENT IN SECURITIES - 100.7% | | | |
| (Cost $2,445,324,277) | | | 3,597,655,444 |
| NET OTHER ASSETS (LIABILITIES) - (0.7)% | | | (25,494,507) |
| NET ASSETS - 100% | | | $3,572,160,937 |
Categorizations in the Schedule of Investments are based on country or territory of incorporation.
Legend
(a) Non-income producing
(b) Security or a portion of the security is on loan at period end.
(c) Level 3 security
(d) Affiliated company
(e) Security exempt from registration under Rule 144A of the Securities Act of 1933. These securities may be resold in transactions exempt from registration, normally to qualified institutional buyers. At the end of the period, the value of these securities amounted to $10,505,700 or 0.3% of net assets.
(f) Affiliated fund that is generally available only to investment companies and other accounts managed by Fidelity Investments. The rate quoted is the annualized seven-day yield of the fund at period end. A complete unaudited listing of the fund's holdings as of its most recent quarter end is available upon request. In addition, each Fidelity Central Fund's financial statements, which are not covered by the Fund's Report of Independent Registered Public Accounting Firm, are available on the SEC's website or upon request.
(g) Investment made with cash collateral received from securities on loan.
Affiliated Central Funds
Information regarding fiscal year to date income earned by the Fund from investments in Fidelity Central Funds is as follows:
| Fund | Income earned |
| Fidelity Cash Central Fund | $1,154,031 |
| Fidelity Securities Lending Cash Central Fund | 1,133,364 |
| Total | $2,287,395 |
Other Affiliated Issuers
An affiliated company is a company in which the Fund has ownership of at least 5% of the voting securities. Fiscal year to date transactions with companies which are or were affiliates are as follows:
| Affiliate | Value, beginning of period | Purchases | Sales Proceeds | Dividend Income | Realized Gain (loss) | Change in Unrealized appreciation (depreciation) | Value, end of period |
| Artnature, Inc. | $12,038,036 | $-- | $1,157,148 | $429,430 | $(1,000,856) | $1,803,464 | $11,683,496 |
| Reckon Ltd. | -- | 7,084,119 | -- | 64,575 | -- | (1,432,315) | 5,651,804 |
| Shoei Co. Ltd. | 13,379,931 | 2,279,518 | -- | 541,232 | -- | 11,729,725 | 27,389,174 |
| Topps Tiles PLC | 9,638,880 | 2,227,097 | -- | 432,639 | -- | (1,961,685) | 9,904,292 |
| Total | $35,056,847 | $11,590,734 | $1,157,148 | $1,467,876 | $(1,000,856) | $10,139,189 | $54,628,766 |
Investment Valuation
The following is a summary of the inputs used, as of October 31, 2017, involving the Fund's assets and liabilities carried at fair value. The inputs or methodology used for valuing securities may not be an indication of the risk associated with investing in those securities. For more information on valuation inputs, and their aggregation into the levels used below, please refer to the Investment Valuation section in the accompanying Notes to Financial Statements.
| | Valuation Inputs at Reporting Date: |
| Description | Total | Level 1 | Level 2 | Level 3 |
| Investments in Securities: | | | | |
| Equities: | | | | |
| Consumer Discretionary | $510,923,509 | $294,019,816 | $216,903,693 | $-- |
| Consumer Staples | 332,886,577 | 132,326,434 | 155,355,939 | 45,204,204 |
| Energy | 77,361,101 | 50,167,994 | 27,193,107 | -- |
| Financials | 305,204,518 | 269,000,280 | 36,204,238 | -- |
| Health Care | 417,965,628 | 317,020,128 | 100,945,500 | -- |
| Industrials | 846,455,105 | 587,564,787 | 258,890,318 | -- |
| Information Technology | 477,141,449 | 245,783,941 | 231,357,508 | -- |
| Materials | 279,700,129 | 179,028,764 | 98,584,531 | 2,086,834 |
| Real Estate | 252,426,719 | 213,840,852 | 38,585,867 | -- |
| Telecommunication Services | 250,654 | 250,654 | -- | -- |
| Utilities | 1,104,613 | 1,104,613 | -- | -- |
| Money Market Funds | 96,235,442 | 96,235,442 | -- | -- |
| Total Investments in Securities: | $3,597,655,444 | $2,386,343,705 | $1,164,020,701 | $47,291,038 |
The following is a summary of transfers between Level 1 and Level 2 for the period ended October 31, 2017. Transfers are assumed to have occurred at the beginning of the period, and are primarily attributable to the valuation techniques used for foreign equity securities, as discussed in the accompanying Notes to Financial Statements:
| Transfers | Total |
| Level 1 to Level 2 | $740,758,093 |
| Level 2 to Level 1 | $0 |
The following is a reconciliation of Investments in Securities for which Level 3 inputs were used in determining value:
| Investments in Securities: | |
| Consumer Staples | |
| Beginning Balance | $-- |
| Net Realized Gain (Loss) on Investment Securities | -- |
| Net Unrealized Gain (Loss) on Investment Securities | (3,483,373) |
| Cost of Purchases | 9,778,533 |
| Proceeds of Sales | -- |
| Amortization/Accretion | -- |
| Transfers into Level 3 | 38,909,044 |
| Transfers out of Level 3 | -- |
| Ending Balance | $45,204,204 |
| The change in unrealized gain (loss) for the period attributable to Level 3 securities held at October 31, 2017 | $(3,483,373) |
| Other Investments in Securities | |
| Beginning Balance | $-- |
| Net Realized Gain (Loss) on Investment Securities | (6,773,507) |
| Net Unrealized Gain (Loss) on Investment Securities | (4,736,217) |
| Cost of Purchases | 5,542,258 |
| Proceeds of Sales | (5,439,747) |
| Amortization/Accretion | -- |
| Transfers into Level 3 | 13,494,047 |
| Transfers out of Level 3 | -- |
| Ending Balance | $2,086,834 |
| The change in unrealized gain (loss) for the period attributable to Level 3 securities held at October 31, 2017 | $(4,736,217) |
The information used in the above reconciliation represents fiscal year to date activity for any Investments in Securities identified as using Level 3 inputs at either the beginning or the end of the current fiscal period. Transfers into Level 3 were attributable to a lack of observable market data resulting from decreases in market activity, decreases in liquidity, security restructurings or corporate actions. Transfers out of Level 3 were attributable to observable market data becoming available for those securities. Transfers in or out of Level 3 represent the beginning value of any Security or Instrument where a change in the pricing level occurred from the beginning to the end of the period. The cost of purchases and the proceeds of sales may include securities received or delivered through corporate actions or exchanges.
See accompanying notes which are an integral part of the financial statements.
Fidelity® Series International Small Cap Fund
Financial Statements
Statement of Assets and Liabilities
| | | October 31, 2017 |
| Assets | | |
Investment in securities, at value (including securities loaned of $27,973,817) — See accompanying schedule:
Unaffiliated issuers (cost $2,293,841,745) | $3,446,791,236 | |
| Fidelity Central Funds (cost $96,229,103) | 96,235,442 | |
| Other affiliated issuers (cost $55,253,429) | 54,628,766 | |
| Total Investment in Securities (cost $2,445,324,277) | | $3,597,655,444 |
| Cash | | 40,526 |
| Foreign currency held at value (cost $125,816) | | 125,727 |
| Receivable for investments sold | | 553,765 |
| Receivable for fund shares sold | | 510,360 |
| Dividends receivable | | 9,517,610 |
| Distributions receivable from Fidelity Central Funds | | 146,660 |
| Other receivables | | 37,289 |
| Total assets | | 3,608,587,381 |
| Liabilities | | |
| Payable for investments purchased | $2,799,858 | |
| Payable for fund shares redeemed | 3,921,597 | |
| Other payables and accrued expenses | 153,125 | |
| Collateral on securities loaned | 29,551,864 | |
| Total liabilities | | 36,426,444 |
| Net Assets | | $3,572,160,937 |
| Net Assets consist of: | | |
| Paid in capital | | $2,274,254,074 |
| Undistributed net investment income | | 47,513,563 |
| Accumulated undistributed net realized gain (loss) on investments and foreign currency transactions | | 98,055,955 |
| Net unrealized appreciation (depreciation) on investments and assets and liabilities in foreign currencies | | 1,152,337,345 |
| Net Assets | | $3,572,160,937 |
| Series International Small Cap: | | |
| Net Asset Value, offering price and redemption price per share ($3,572,160,937 ÷ 196,545,718 shares) | | $18.17 |
See accompanying notes which are an integral part of the financial statements.
Statement of Operations
| | | Year ended October 31, 2017 |
| Investment Income | | |
| Dividends (including $1,467,876 earned from other affiliated issuers) | | $72,771,712 |
| Interest | | 35 |
| Income from Fidelity Central Funds | | 2,287,395 |
| Income before foreign taxes withheld | | 75,059,142 |
| Less foreign taxes withheld | | (6,783,392) |
| Total income | | 68,275,750 |
| Expenses | | |
| Management fee | | |
| Basic fee | $15,437,211 | |
| Performance adjustment | (710,298) | |
| Transfer agent fees | 1,294,486 | |
| Accounting and security lending fees | 791,863 | |
| Custodian fees and expenses | 399,447 | |
| Independent trustees' fees and expenses | 12,802 | |
| Registration fees | 930 | |
| Audit | 35,740 | |
| Legal | 6,091 | |
| Miscellaneous | 26,290 | |
| Total expenses before reductions | 17,294,562 | |
| Expense reductions | (144,879) | 17,149,683 |
| Net investment income (loss) | | 51,126,067 |
| Realized and Unrealized Gain (Loss) | | |
| Net realized gain (loss) on: | | |
| Investment securities: | | |
| Unaffiliated issuers | 130,788,614 | |
| Fidelity Central Funds | 18,747 | |
| Other affiliated issuers | (1,000,856) | |
| Foreign currency transactions | (132,817) | |
| Total net realized gain (loss) | | 129,673,688 |
| Change in net unrealized appreciation (depreciation) on: | | |
| Investment securities: | | |
| Unaffiliated issuers | 584,425,041 | |
| Fidelity Central Funds | (38,503) | |
| Other affiliated issuers | 10,139,189 | |
| Assets and liabilities in foreign currencies | 288,295 | |
| Total change in net unrealized appreciation (depreciation) | | 594,814,022 |
| Net gain (loss) | | 724,487,710 |
| Net increase (decrease) in net assets resulting from operations | | $775,613,777 |
See accompanying notes which are an integral part of the financial statements.
Statement of Changes in Net Assets
| | Year ended October 31, 2017 | Year ended October 31, 2016 |
| Increase (Decrease) in Net Assets | | |
| Operations | | |
| Net investment income (loss) | $51,126,067 | $30,865,970 |
| Net realized gain (loss) | 129,673,688 | 86,017,298 |
| Change in net unrealized appreciation (depreciation) | 594,814,022 | (100,087,153) |
| Net increase (decrease) in net assets resulting from operations | 775,613,777 | 16,796,115 |
| Distributions to shareholders from net investment income | (34,157,192) | (27,359,738) |
| Distributions to shareholders from net realized gain | (85,456,930) | (162,604,163) |
| Total distributions | (119,614,122) | (189,963,901) |
| Share transactions - net increase (decrease) | 11,810,740 | 324,362,862 |
| Total increase (decrease) in net assets | 667,810,395 | 151,195,076 |
| Net Assets | | |
| Beginning of period | 2,904,350,542 | 2,753,155,466 |
| End of period | $3,572,160,937 | $2,904,350,542 |
| Other Information | | |
| Undistributed net investment income end of period | $47,513,563 | $30,407,595 |
See accompanying notes which are an integral part of the financial statements.
Financial Highlights
Fidelity Series International Small Cap Fund
| Years ended October 31, | 2017 | 2016 | 2015 | 2014 | 2013 |
| Selected Per–Share Data | | | | | |
| Net asset value, beginning of period | $15.02 | $16.11 | $15.21 | $15.75 | $12.44 |
| Income from Investment Operations | | | | | |
| Net investment income (loss)A | .25 | .15 | .14 | .14 | .15 |
| Net realized and unrealized gain (loss) | 3.47 | (.13) | 1.10 | (.11) | 3.29 |
| Total from investment operations | 3.72 | .02 | 1.24 | .03 | 3.44 |
| Distributions from net investment income | (.15) | (.15) | (.14) | (.13) | (.12) |
| Distributions from net realized gain | (.42) | (.96) | (.20) | (.44) | (.01) |
| Total distributions | (.57) | (1.11) | (.34) | (.57) | (.13) |
| Net asset value, end of period | $18.17 | $15.02 | $16.11 | $15.21 | $15.75 |
| Total ReturnB | 25.87% | .02% | 8.36% | .21% | 27.95% |
| Ratios to Average Net AssetsC,D | | | | | |
| Expenses before reductions | .56% | 1.06% | 1.10% | 1.18% | 1.23% |
| Expenses net of fee waivers, if any | .56% | 1.06% | 1.10% | 1.18% | 1.23% |
| Expenses net of all reductions | .55% | 1.05% | 1.10% | 1.18% | 1.22% |
| Net investment income (loss) | 1.52% | 1.01% | .89% | .86% | 1.05% |
| Supplemental Data | | | | | |
| Net assets, end of period (000 omitted) | $3,572,161 | $1,303,650 | $1,276,570 | $1,330,809 | $1,163,381 |
| Portfolio turnover rateE | 21% | 21% | 16% | 18% | 29% |
A Calculated based on average shares outstanding during the period.
B Total returns would have been lower if certain expenses had not been reduced during the applicable periods shown.
C Fees and expenses of any underlying Fidelity Central Funds are not included in the Fund's expense ratio. The Fund indirectly bears its proportionate share of the expenses of any underlying Fidelity Central Funds.
D Expense ratios reflect operating expenses of the class. Expenses before reductions do not reflect amounts reimbursed by the investment adviser or reductions from brokerage service arrangements or reductions from other expense offset arrangements and do not represent the amount paid by the class during periods when reimbursements or reductions occur. Expenses net of fee waivers reflect expenses after reimbursement by the investment adviser but prior to reductions from brokerage service arrangements or other expense offset arrangements. Expenses net of all reductions represent the net expenses paid by the class.
E Amount does not include the portfolio activity of any underlying Fidelity Central Funds.
See accompanying notes which are an integral part of the financial statements.
Fidelity® Series International Value Fund
Performance: The Bottom Line
Average annual total return reflects the change in the value of an investment, assuming reinvestment of distributions from dividend income and capital gains (the profits earned upon the sale of securities that have grown in value, if any) and assuming a constant rate of performance each year. The hypothetical investment and the average annual total returns do not reflect the deduction of taxes that a shareholder would pay on fund distributions or the redemption of fund shares. During periods of reimbursement by Fidelity, a fund’s total return will be greater than it would be had the reimbursement not occurred. How a fund did yesterday is no guarantee of how it will do tomorrow.
Average Annual Total Returns
| For the periods ended October 31, 2017 | Past 1 year | Past 5 years | Life of fundA |
| Fidelity® Series International Value Fund | 20.33% | 7.40% | 3.94% |
A From December 3, 2009
$10,000 Over Life of Fund
Let's say hypothetically that $10,000 was invested in Fidelity® Series International Value Fund on December 3, 2009, when the fund started.
The chart shows how the value of your investment would have changed, and also shows how the MSCI EAFE Value Index performed over the same period.
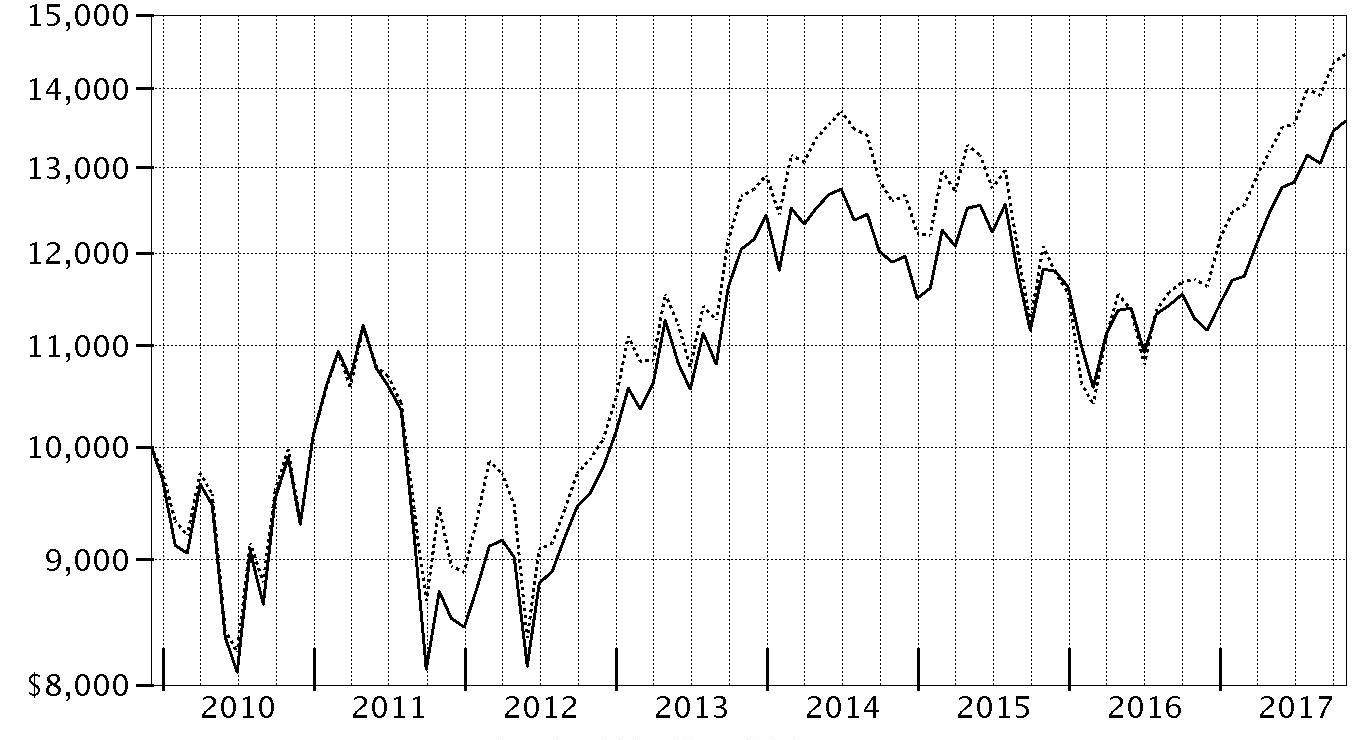
| Period Ending Values |
| $13,577 | Fidelity® Series International Value Fund |
| $14,452 | MSCI EAFE Value Index |
Fidelity® Series International Value Fund
Management's Discussion of Fund Performance
Market Recap: The MSCI ACWI (All Country World Index) ex USA Index returned 23.85% for the 12 months ending October 31, 2017, helped partly by a generally weak U.S. dollar. Some favorable election results in continental Europe (+30%) suggested ebbing political uncertainty and near-term risk there, but the U.K. (+20%) faced more-mixed conditions ahead of its expected exit from the European Union. Despite central-bank easing – and pressured recently by yen strength – Japan (+18%) lagged the rest of the Asia-Pacific group (+22%). Commodity-price volatility slowed Canada (+17%), but the emerging-markets group (+26%) sped ahead. Sector-wise, information technology (+47%) was driven by a surge among several Chinese internet-related names. Financials (+27%) rode rising interest rates that, at the same time, weighed on real estate (+17%), utilities (+16%), consumer staples (+14%) and telecommunication services (+9%) – so-called “bond proxy” sectors. Materials (+28%) and industrials (+27%) responded to demand from China and price gains for certain commodities. In the energy sector (+20%), oil prices lost ground in the spring before rebounding through October 31 to end well above where they started 12 months ago. Lastly, health care (+14%) was hurt by early-period turmoil around drug pricing and health care legislation.
Comments from Portfolio Manager Alexander Zavratsky: For the year, the fund advanced 20.33%, underperforming the 23.50% return of the benchmark MSCI EAFE Value Index. From a geographical perspective, choices in the U.K. and out-of-index picks in the U.S. hurt the fund’s relative performance the most. An underweighting in index heavyweight Royal Dutch Shell detracted more than any other individual holding. Shares of the Anglo-Dutch multinational energy giant recovered late in the period on positive quarterly results and an uptick in oil prices, but the fund missed out because we'd sold the position in April. Avoiding German financial services company and index constituent Allianz also detracted, as shares advanced partly due to the firm’s stock-buyback program. Elsewhere, an overweighting in U.K. cigarette maker Imperial Brands hurt the fund's relative return. This stock fell along with the tobacco industry after the U.S. Food and Drug Administration announced its plan to lower nicotine levels in cigarettes. Conversely, two non-index positions contributed: French software & services firm Atos, and Recruit Holdings, a Japan-based staffing agency. Shares of Atos benefited from the company's continued revenue growth. Meanwhile, Recruit’s stock was helped by a tightening labor market in Japan and the success of its online jobs portal.
The views expressed above reflect those of the portfolio manager(s) only through the end of the period as stated on the cover of this report and do not necessarily represent the views of Fidelity or any other person in the Fidelity organization. Any such views are subject to change at any time based upon market or other conditions and Fidelity disclaims any responsibility to update such views. These views may not be relied on as investment advice and, because investment decisions for a Fidelity fund are based on numerous factors, may not be relied on as an indication of trading intent on behalf of any Fidelity fund.
Fidelity® Series International Value Fund
Investment Summary (Unaudited)
Geographic Diversification (% of fund's net assets)
| As of October 31, 2017 |
| | Japan | 22.2% |
| | United Kingdom | 15.9% |
| | France | 14.4% |
| | Switzerland | 9.3% |
| | Germany | 7.8% |
| | Spain | 4.6% |
| | Sweden | 4.5% |
| | Australia | 3.8% |
| | Netherlands | 3.7% |
| | Other* | 13.8% |

* Includes Short-Term investments and Net Other Assets (Liabilities).
Percentages are based on country or territory of incorporation and are adjusted for the effect of futures contracts, if applicable.
| As of April 30, 2017 |
| | Japan | 22.6% |
| | United Kingdom | 17.2% |
| | France | 15.2% |
| | Germany | 7.4% |
| | Switzerland | 7.0% |
| | Australia | 5.7% |
| | Spain | 4.3% |
| | United States of America* | 4.2% |
| | Netherlands | 3.8% |
| | Other | 12.6% |
* Includes Short-Term investments and Net Other Assets (Liabilities).
Percentages are based on country or territory of incorporation and are adjusted for the effect of futures contracts, if applicable.
Asset Allocation as of October 31, 2017
| | % of fund's net assets | % of fund's net assets 6 months ago |
| Stocks | 99.2 | 98.9 |
| Short-Term Investments and Net Other Assets (Liabilities) | 0.8 | 1.1 |
Top Ten Stocks as of October 31, 2017
| | % of fund's net assets | % of fund's net assets 6 months ago |
| Total SA (France, Oil, Gas & Consumable Fuels) | 3.2 | 3.0 |
| Novartis AG (Switzerland, Pharmaceuticals) | 3.0 | 1.2 |
| BP PLC (United Kingdom, Oil, Gas & Consumable Fuels) | 2.7 | 1.9 |
| Mitsubishi UFJ Financial Group, Inc. (Japan, Banks) | 2.3 | 2.5 |
| Banco Santander SA (Spain) (Spain, Banks) | 2.2 | 1.4 |
| Toyota Motor Corp. (Japan, Automobiles) | 2.0 | 2.2 |
| BASF AG (Germany, Chemicals) | 1.9 | 1.7 |
| Australia & New Zealand Banking Group Ltd. (Australia, Banks) | 1.8 | 1.7 |
| Nestle SA (Reg. S) (Switzerland, Food Products) | 1.6 | 0.6 |
| AstraZeneca PLC (United Kingdom) (United Kingdom, Pharmaceuticals) | 1.7 | 1.4 |
| | 22.4 | |
Top Market Sectors as of October 31, 2017
| | % of fund's net assets | % of fund's net assets 6 months ago |
| Financials | 35.7 | 36.4 |
| Industrials | 12.5 | 13.5 |
| Health Care | 11.7 | 9.6 |
| Energy | 9.0 | 7.4 |
| Materials | 8.0 | 7.7 |
| Consumer Discretionary | 6.3 | 8.5 |
| Information Technology | 6.2 | 5.1 |
| Consumer Staples | 5.3 | 4.9 |
| Telecommunication Services | 2.6 | 3.4 |
| Real Estate | 1.0 | 0.6 |
Fidelity® Series International Value Fund
Investments October 31, 2017
Showing Percentage of Net Assets
| Common Stocks - 98.7% | | | |
| | | Shares | Value |
| Australia - 3.8% | | | |
| Australia & New Zealand Banking Group Ltd. | | 11,720,429 | $268,389,291 |
| Insurance Australia Group Ltd. | | 17,127,164 | 85,990,283 |
| Macquarie Group Ltd. | | 2,005,897 | 150,988,224 |
| Magellan Financial Group Ltd. | | 2,868,826 | 53,288,570 |
|
| TOTAL AUSTRALIA | | | 558,656,368 |
|
| Austria - 0.8% | | | |
| Erste Group Bank AG | | 2,831,900 | 121,690,472 |
| Bailiwick of Jersey - 1.0% | | | |
| Shire PLC | | 1,075,300 | 52,964,541 |
| Wolseley PLC | | 1,301,121 | 90,983,615 |
|
| TOTAL BAILIWICK OF JERSEY | | | 143,948,156 |
|
| Belgium - 1.4% | | | |
| KBC Groep NV | | 2,537,968 | 210,817,464 |
| Canada - 0.5% | | | |
| Potash Corp. of Saskatchewan, Inc. | | 3,536,700 | 68,836,941 |
| Finland - 1.0% | | | |
| Sampo Oyj (A Shares) | | 2,957,513 | 154,958,755 |
| France - 14.4% | | | |
| Atos Origin SA | | 1,140,659 | 177,248,132 |
| AXA SA | | 7,829,073 | 236,347,409 |
| Bouygues SA | | 1,812,901 | 87,036,095 |
| Capgemini SA | | 1,080,505 | 131,337,650 |
| Compagnie de St. Gobain | | 1,560,000 | 91,512,480 |
| Natixis SA | | 11,903,100 | 93,341,375 |
| Sanofi SA | | 1,744,076 | 165,140,716 |
| Societe Generale Series A | | 3,897,700 | 216,924,659 |
| SR Teleperformance SA | | 807,100 | 117,894,865 |
| Total SA | | 8,608,447 | 479,818,816 |
| VINCI SA (a) | | 2,050,300 | 200,735,939 |
| Vivendi SA | | 5,091,481 | 126,474,559 |
|
| TOTAL FRANCE | | | 2,123,812,695 |
|
| Germany - 7.8% | | | |
| BASF AG | | 2,581,611 | 281,533,089 |
| Brenntag AG | | 1,215,600 | 68,838,435 |
| Deutsche Post AG | | 2,548,779 | 116,738,926 |
| Deutsche Telekom AG | | 7,501,970 | 135,840,649 |
| Fresenius SE & Co. KGaA | | 904,400 | 75,545,793 |
| HeidelbergCement Finance AG | | 1,012,300 | 103,142,670 |
| Linde AG (b) | | 508,900 | 109,636,911 |
| SAP SE | | 1,039,809 | 118,811,305 |
| Vonovia SE | | 3,315,904 | 145,849,162 |
|
| TOTAL GERMANY | | | 1,155,936,940 |
|
| Hong Kong - 0.3% | | | |
| AIA Group Ltd. | | 5,940,600 | 44,698,800 |
| Indonesia - 0.7% | | | |
| PT Bank Rakyat Indonesia Tbk | | 85,715,700 | 98,592,805 |
| Ireland - 1.3% | | | |
| Allergan PLC | | 299,300 | 53,044,939 |
| CRH PLC | | 2,596,681 | 97,718,202 |
| Medtronic PLC | | 575,600 | 46,347,312 |
|
| TOTAL IRELAND | | | 197,110,453 |
|
| Israel - 0.1% | | | |
| Teva Pharmaceutical Industries Ltd. sponsored ADR | | 1,152,392 | 15,903,010 |
| Italy - 1.2% | | | |
| Intesa Sanpaolo SpA | | 54,821,700 | 184,305,478 |
| Japan - 22.2% | | | |
| AEON Financial Service Co. Ltd. | | 2,996,900 | 64,362,874 |
| East Japan Railway Co. | | 866,200 | 84,003,742 |
| Fujitsu Ltd. | | 6,544,000 | 50,994,089 |
| Hoya Corp. | | 2,241,000 | 121,755,191 |
| Itochu Corp. | | 10,138,800 | 177,597,758 |
| Japan Tobacco, Inc. | | 3,332,600 | 110,309,732 |
| Kao Corp. | | 1,457,200 | 88,066,095 |
| KDDI Corp. | | 5,116,300 | 136,311,743 |
| Makita Corp. | | 2,492,700 | 104,465,686 |
| Mitsubishi UFJ Financial Group, Inc. | | 49,363,500 | 334,839,752 |
| Nintendo Co. Ltd. | | 236,700 | 91,830,558 |
| Nippon Telegraph & Telephone Corp. | | 2,552,300 | 123,397,390 |
| Nomura Holdings, Inc. | | 13,823,100 | 79,106,458 |
| OBIC Co. Ltd. | | 1,579,100 | 104,522,488 |
| Olympus Corp. | | 2,237,900 | 83,282,717 |
| Oracle Corp. Japan | | 888,600 | 75,189,358 |
| ORIX Corp. | | 9,720,000 | 167,121,932 |
| Panasonic Corp. | | 7,305,409 | 110,307,035 |
| Recruit Holdings Co. Ltd. | | 4,437,400 | 108,794,631 |
| Seven & i Holdings Co. Ltd. | | 2,199,130 | 88,634,776 |
| Shin-Etsu Chemical Co. Ltd. | | 1,399,100 | 147,550,807 |
| Shinsei Bank Ltd. | | 4,747,000 | 80,109,276 |
| Sony Corp. | | 2,412,300 | 100,917,829 |
| Sony Financial Holdings, Inc. | | 4,982,200 | 82,771,680 |
| Subaru Corp. | | 1,855,400 | 64,102,423 |
| Taiheiyo Cement Corp. | | 1,968,000 | 78,658,976 |
| Tokio Marine Holdings, Inc. | | 2,955,800 | 127,416,336 |
| Toyota Motor Corp. | | 4,758,500 | 295,151,119 |
|
| TOTAL JAPAN | | | 3,281,572,451 |
|
| Netherlands - 3.7% | | | |
| ING Groep NV (Certificaten Van Aandelen) | | 12,415,534 | 229,432,699 |
| Koninklijke Philips Electronics NV | | 2,383,000 | 97,114,264 |
| RELX NV | | 6,034,066 | 136,288,079 |
| Wolters Kluwer NV | | 1,735,661 | 85,076,701 |
|
| TOTAL NETHERLANDS | | | 547,911,743 |
|
| Norway - 1.5% | | | |
| Statoil ASA (a) | | 10,711,192 | 217,624,868 |
| Portugal - 0.6% | | | |
| Galp Energia SGPS SA Class B | | 4,892,124 | 90,949,507 |
| Spain - 4.1% | | | |
| Banco Santander SA (Spain) | | 46,922,850 | 318,104,817 |
| Banco Santander SA (Spain) rights 11/1/17 (b) | | 45,382,950 | 2,167,438 |
| CaixaBank SA (a) | | 23,226,308 | 108,707,653 |
| Iberdrola SA | | 16,583,654 | 134,024,603 |
| Unicaja Banco SA | | 30,777,400 | 44,813,818 |
|
| TOTAL SPAIN | | | 607,818,329 |
|
| Sweden - 4.5% | | | |
| Alfa Laval AB | | 4,491,900 | 113,804,565 |
| Investor AB (B Shares) | | 2,994,343 | 148,400,006 |
| Nordea Bank AB | | 17,813,333 | 215,335,006 |
| Swedbank AB (A Shares) | | 6,177,100 | 153,327,167 |
| Telefonaktiebolaget LM Ericsson (B Shares) | | 6,454,100 | 40,616,167 |
|
| TOTAL SWEDEN | | | 671,482,911 |
|
| Switzerland - 9.3% | | | |
| Credit Suisse Group AG | | 11,266,821 | 177,551,988 |
| Lafargeholcim Ltd. (Reg.) | | 1,549,470 | 87,518,303 |
| Nestle SA (Reg. S) | | 2,907,882 | 244,664,930 |
| Novartis AG | | 5,351,251 | 441,367,425 |
| UBS Group AG | | 12,739,271 | 216,695,000 |
| Zurich Insurance Group AG | | 680,452 | 207,685,695 |
|
| TOTAL SWITZERLAND | | | 1,375,483,341 |
|
| United Kingdom - 15.9% | | | |
| AstraZeneca PLC (United Kingdom) | | 3,602,829 | 243,770,884 |
| Aviva PLC | | 18,928,528 | 126,956,619 |
| BAE Systems PLC | | 15,432,807 | 121,569,447 |
| BHP Billiton PLC | | 11,300,582 | 204,604,353 |
| BP PLC | | 59,539,759 | 403,837,948 |
| British American Tobacco PLC (United Kingdom) | | 1,607,241 | 103,843,571 |
| Bunzl PLC | | 4,048,512 | 126,091,383 |
| Compass Group PLC | | 5,649,559 | 124,032,224 |
| GlaxoSmithKline PLC | | 9,833,246 | 176,480,681 |
| HSBC Holdings PLC sponsored ADR (a) | | 3,058,226 | 149,149,682 |
| Imperial Tobacco Group PLC | | 1,856,198 | 75,697,325 |
| Informa PLC | | 11,233,963 | 103,995,105 |
| Micro Focus International PLC | | 3,253,905 | 114,308,276 |
| Standard Chartered PLC (United Kingdom) (b) | | 14,582,417 | 145,334,750 |
| Standard Life PLC | | 21,950,092 | 125,299,658 |
|
| TOTAL UNITED KINGDOM | | | 2,344,971,906 |
|
| United States of America - 2.6% | | | |
| Amgen, Inc. | | 438,500 | 76,833,970 |
| ConocoPhillips Co. | | 2,894,500 | 148,053,675 |
| Edgewell Personal Care Co. (b) | | 527,600 | 34,257,068 |
| Molson Coors Brewing Co. Class B | | 497,700 | 40,248,999 |
| S&P Global, Inc. | | 586,200 | 91,722,714 |
|
| TOTAL UNITED STATES OF AMERICA | | | 391,116,426 |
|
| TOTAL COMMON STOCKS | | | |
| (Cost $12,041,623,413) | | | 14,608,199,819 |
|
| Nonconvertible Preferred Stocks - 0.5% | | | |
| Spain - 0.5% | | | |
| Grifols SA Class B | | | |
| (Cost $51,388,129) | | 3,312,338 | 77,799,321 |
|
| Money Market Funds - 3.8% | | | |
| Fidelity Cash Central Fund, 1.10% (c) | | 56,082,839 | 56,094,056 |
| Fidelity Securities Lending Cash Central Fund 1.11% (c)(d) | | 499,888,727 | 499,938,716 |
| TOTAL MONEY MARKET FUNDS | | | |
| (Cost $556,038,961) | | | 556,032,772 |
| TOTAL INVESTMENT IN SECURITIES - 103.0% | | | |
| (Cost $12,649,050,503) | | | 15,242,031,912 |
| NET OTHER ASSETS (LIABILITIES) - (3.0)% | | | (448,897,771) |
| NET ASSETS - 100% | | | $14,793,134,141 |
Categorizations in the Schedule of Investments are based on country or territory of incorporation.
Legend
(a) Security or a portion of the security is on loan at period end.
(b) Non-income producing
(c) Affiliated fund that is generally available only to investment companies and other accounts managed by Fidelity Investments. The rate quoted is the annualized seven-day yield of the fund at period end. A complete unaudited listing of the fund's holdings as of its most recent quarter end is available upon request. In addition, each Fidelity Central Fund's financial statements, which are not covered by the Fund's Report of Independent Registered Public Accounting Firm, are available on the SEC's website or upon request.
(d) Investment made with cash collateral received from securities on loan.
Affiliated Central Funds
Information regarding fiscal year to date income earned by the Fund from investments in Fidelity Central Funds is as follows:
| Fund | Income earned |
| Fidelity Cash Central Fund | $819,996 |
| Fidelity Securities Lending Cash Central Fund | 7,242,580 |
| Total | $8,062,576 |
Investment Valuation
The following is a summary of the inputs used, as of October 31, 2017, involving the Fund's assets and liabilities carried at fair value. The inputs or methodology used for valuing securities may not be an indication of the risk associated with investing in those securities. For more information on valuation inputs, and their aggregation into the levels used below, please refer to the Investment Valuation section in the accompanying Notes to Financial Statements.
| | Valuation Inputs at Reporting Date: |
| Description | Total | Level 1 | Level 2 | Level 3 |
| Investments in Securities: | | | | |
| Equities: | | | | |
| Consumer Discretionary | $924,980,294 | $354,501,888 | $570,478,406 | $-- |
| Consumer Staples | 785,722,496 | 150,203,392 | 635,519,104 | -- |
| Energy | 1,340,284,814 | 239,003,182 | 1,101,281,632 | -- |
| Financials | 5,316,746,603 | 3,018,351,245 | 2,298,395,358 | -- |
| Health Care | 1,727,350,764 | 267,675,024 | 1,459,675,740 | -- |
| Industrials | 1,831,432,347 | 1,235,001,083 | 596,431,264 | -- |
| Information Technology | 904,858,023 | 422,894,058 | 481,963,965 | -- |
| Materials | 1,179,200,252 | 650,667,914 | 528,532,338 | -- |
| Real Estate | 145,849,162 | 145,849,162 | -- | -- |
| Telecommunication Services | 395,549,782 | -- | 395,549,782 | -- |
| Utilities | 134,024,603 | 134,024,603 | -- | -- |
| Money Market Funds | 556,032,772 | 556,032,772 | -- | -- |
| Total Investments in Securities: | $15,242,031,912 | $7,174,204,323 | $8,067,827,589 | $-- |
The following is a summary of transfers between Level 1 and Level 2 for the period ended October 31, 2017. Transfers are assumed to have occurred at the beginning of the period, and are primarily attributable to the valuation techniques used for foreign equity securities, as discussed in the accompanying Notes to Financial Statements:
| Transfers | Total |
| Level 1 to Level 2 | $1,269,546,659 |
| Level 2 to Level 1 | $780,932,688 |
See accompanying notes which are an integral part of the financial statements.
Fidelity® Series International Value Fund
Financial Statements
Statement of Assets and Liabilities
| | | October 31, 2017 |
| Assets | | |
Investment in securities, at value (including securities loaned of $473,506,868) — See accompanying schedule:
Unaffiliated issuers (cost $12,093,011,542) | $14,685,999,140 | |
| Fidelity Central Funds (cost $556,038,961) | 556,032,772 | |
| Total Investment in Securities (cost $12,649,050,503) | | $15,242,031,912 |
| Foreign currency held at value (cost $5,199,590) | | 5,199,590 |
| Receivable for investments sold | | 31,803,033 |
| Receivable for fund shares sold | | 3,565,599 |
| Dividends receivable | | 42,361,547 |
| Distributions receivable from Fidelity Central Funds | | 286,913 |
| Other receivables | | 568,653 |
| Total assets | | 15,325,817,247 |
| Liabilities | | |
| Payable to custodian bank | $100 | |
| Payable for investments purchased | 5,833,260 | |
| Payable for fund shares redeemed | 26,490,017 | |
| Other payables and accrued expenses | 441,404 | |
| Collateral on securities loaned | 499,918,325 | |
| Total liabilities | | 532,683,106 |
| Net Assets | | $14,793,134,141 |
| Net Assets consist of: | | |
| Paid in capital | | $12,647,691,182 |
| Undistributed net investment income | | 383,332,093 |
| Accumulated undistributed net realized gain (loss) on investments and foreign currency transactions | | (830,761,152) |
| Net unrealized appreciation (depreciation) on investments and assets and liabilities in foreign currencies | | 2,592,872,018 |
| Net Assets | | $14,793,134,141 |
| Series International Value: | | |
| Net Asset Value, offering price and redemption price per share ($14,793,134,141 ÷ 1,361,535,652 shares) | | $10.87 |
See accompanying notes which are an integral part of the financial statements.
Statement of Operations
| | | Year ended October 31, 2017 |
| Investment Income | | |
| Dividends | | $505,144,760 |
| Income from Fidelity Central Funds | | 8,062,576 |
| Income before foreign taxes withheld | | 513,207,336 |
| Less foreign taxes withheld | | (39,471,581) |
| Total income | | 473,735,755 |
| Expenses | | |
| Management fee | | |
| Basic fee | $55,647,438 | |
| Performance adjustment | (690,919) | |
| Transfer agent fees | 5,660,830 | |
| Accounting and security lending fees | 1,132,828 | |
| Custodian fees and expenses | 1,175,001 | |
| Independent trustees' fees and expenses | 55,708 | |
| Registration fees | 7,112 | |
| Audit | 39,814 | |
| Legal | 27,240 | |
| Interest | 21,592 | |
| Miscellaneous | 92,266 | |
| Total expenses before reductions | 63,168,910 | |
| Expense reductions | (1,533,128) | 61,635,782 |
| Net investment income (loss) | | 412,099,973 |
| Realized and Unrealized Gain (Loss) | | |
| Net realized gain (loss) on: | | |
| Investment securities: | | |
| Unaffiliated issuers | 52,065,156 | |
| Fidelity Central Funds | (42,171) | |
| Foreign currency transactions | (1,967,968) | |
| Total net realized gain (loss) | | 50,055,017 |
| Change in net unrealized appreciation (depreciation) on: | | |
| Investment securities: | | |
| Unaffiliated issuers | 2,176,454,524 | |
| Fidelity Central Funds | (17,753) | |
| Assets and liabilities in foreign currencies | 1,715,969 | |
| Total change in net unrealized appreciation (depreciation) | | 2,178,152,740 |
| Net gain (loss) | | 2,228,207,757 |
| Net increase (decrease) in net assets resulting from operations | | $2,640,307,730 |
See accompanying notes which are an integral part of the financial statements.
Statement of Changes in Net Assets
| | Year ended October 31, 2017 | Year ended October 31, 2016 |
| Increase (Decrease) in Net Assets | | |
| Operations | | |
| Net investment income (loss) | $412,099,973 | $323,480,918 |
| Net realized gain (loss) | 50,055,017 | (488,635,728) |
| Change in net unrealized appreciation (depreciation) | 2,178,152,740 | (314,124,333) |
| Net increase (decrease) in net assets resulting from operations | 2,640,307,730 | (479,279,143) |
| Distributions to shareholders from net investment income | (329,576,938) | (256,925,581) |
| Distributions to shareholders from net realized gain | (24,285,362) | – |
| Total distributions | (353,862,300) | (256,925,581) |
| Share transactions - net increase (decrease) | (355,425,913) | 1,605,266,994 |
| Total increase (decrease) in net assets | 1,931,019,517 | 869,062,270 |
| Net Assets | | |
| Beginning of period | 12,862,114,624 | 11,993,052,354 |
| End of period | $14,793,134,141 | $12,862,114,624 |
| Other Information | | |
| Undistributed net investment income end of period | $383,332,093 | $300,818,093 |
See accompanying notes which are an integral part of the financial statements.
Financial Highlights
Fidelity Series International Value Fund
| Years ended October 31, | 2017 | 2016 | 2015 | 2014 | 2013 |
| Selected Per–Share Data | | | | | |
| Net asset value, beginning of period | $9.27 | $9.91 | $10.73 | $11.14 | $9.16 |
| Income from Investment Operations | | | | | |
| Net investment income (loss)A | .29 | .24 | .22 | .45B | .26 |
| Net realized and unrealized gain (loss) | 1.55 | (.68) | (.28) | (.59) | 2.03 |
| Total from investment operations | 1.84 | (.44) | (.06) | (.14) | 2.29 |
| Distributions from net investment income | (.22) | (.20) | (.44) | (.24) | (.26) |
| Distributions from net realized gain | (.02) | – | (.32) | (.04) | (.06) |
| Total distributions | (.24) | (.20) | (.76) | (.27)C | (.31)D |
| Net asset value, end of period | $10.87 | $9.27 | $9.91 | $10.73 | $11.14 |
| Total ReturnE | 20.33% | (4.49)% | (.65)% | (1.25)% | 25.78% |
| Ratios to Average Net AssetsF,G | | | | | |
| Expenses before reductions | .48% | .96% | .89% | .82% | .88% |
| Expenses net of fee waivers, if any | .47% | .96% | .89% | .82% | .88% |
| Expenses net of all reductions | .46% | .95% | .88% | .81% | .85% |
| Net investment income (loss) | 2.86% | 2.58% | 2.12% | 4.05%B | 2.58% |
| Supplemental Data | | | | | |
| Net assets, end of period (000 omitted) | $14,793,134 | $5,774,976 | $5,556,957 | $5,971,189 | $5,710,397 |
| Portfolio turnover rateH | 51% | 45% | 44% | 70% | 80% |
A Calculated based on average shares outstanding during the period.
B Net Investment income per share reflects a large, non-recurring dividend which amounted to $.18 per share. Excluding this non-recurring dividend, the ratio of net investment income (loss) to average net assets would have been 2.46%.
C Total distributions of $.27 per share is comprised of distributions from net investment income of $.237 and distributions from net realized gain of $.036 per share.
D Total distributions of $.31 per share is comprised of distributions from net investment income of $.256 and distributions from net realized gain of $.057 per share.
E Total returns would have been lower if certain expenses had not been reduced during the applicable periods shown.
F Fees and expenses of any underlying Fidelity Central Funds are not included in the Fund's expense ratio. The Fund indirectly bears its proportionate share of the expenses of any underlying Fidelity Central Funds.
G Expense ratios reflect operating expenses of the class. Expenses before reductions do not reflect amounts reimbursed by the investment adviser or reductions from brokerage service arrangements or reductions from other expense offset arrangements and do not represent the amount paid by the class during periods when reimbursements or reductions occur. Expenses net of fee waivers reflect expenses after reimbursement by the investment adviser but prior to reductions from brokerage service arrangements or other expense offset arrangements. Expenses net of all reductions represent the net expenses paid by the class.
H Amount does not include the portfolio activity of any underlying Fidelity Central Funds.
See accompanying notes which are an integral part of the financial statements.
Notes to Financial Statements
For the period ended October 31, 2017
1. Organization.
Fidelity Series Emerging Markets Fund, Fidelity Series International Growth Fund, Fidelity Series International Small Cap Fund and Fidelity Series International Value Fund (the Funds) are funds of Fidelity Investment Trust (the Trust). The Trust is registered under the Investment Company Act of 1940, as amended (the 1940 Act), as an open-end management investment company organized as a Massachusetts business trust. Each Fund is authorized to issue an unlimited number of shares. Shares of the Funds are only available for purchase by mutual funds for which Fidelity Management & Research Company (FMR) or an affiliate serves as an investment manager. Effective August 28, 2017, each Fund no longer offered Class F shares, and all outstanding shares of Class F were exchanged for shares of Series Emerging Markets, Series International Growth, Series International Small Cap and Series International Value, respectively.
2. Investments in Fidelity Central Funds.
The Funds invest in Fidelity Central Funds, which are open-end investment companies generally available only to other investment companies and accounts managed by the investment adviser and its affiliates. The Funds' Schedules of Investments list each of the Fidelity Central Funds held as of period end, if any, as an investment of each Fund, but do not include the underlying holdings of each Fidelity Central Fund. As an Investing Fund, each Fund indirectly bears its proportionate share of the expenses of the underlying Fidelity Central Funds.
The Money Market Central Funds seek preservation of capital and current income and are managed by Fidelity Investments Money Management, Inc. (FIMM), an affiliate of the investment adviser. Annualized expenses of the Money Market Central Funds as of their most recent shareholder report date are less than .005%.
A complete unaudited list of holdings for each Fidelity Central Fund is available upon request or at the Securities and Exchange Commission (the SEC) website at www.sec.gov. In addition, the financial statements of the Fidelity Central Funds, which are not covered by the Funds' Report of Independent Registered Public Accounting Firm, are available on the SEC website or upon request.
3. Significant Accounting Policies.
Each Fund is an investment company and applies the accounting and reporting guidance of the Financial Accounting Standards Board (FASB) Accounting Standards Codification Topic 946 Financial Services – Investments Companies. The financial statements have been prepared in conformity with accounting principles generally accepted in the United States of America (GAAP), which require management to make certain estimates and assumptions at the date of the financial statements. Actual results could differ from those estimates. Subsequent events, if any, through the date that the financial statements were issued have been evaluated in the preparation of the financial statements. The following summarizes the significant accounting policies of the Funds:
Investment Valuation. Investments are valued as of 4:00 p.m. Eastern time on the last calendar day of the period. The Board of Trustees (the Board) has delegated the day to day responsibility for the valuation of each Fund's investments to the Fair Value Committee (the Committee) established by each Fund's investment adviser. In accordance with valuation policies and procedures approved by the Board, each Fund attempts to obtain prices from one or more third party pricing vendors or brokers to value its investments. When current market prices, quotations or currency exchange rates are not readily available or reliable, investments will be fair valued in good faith by the Committee, in accordance with procedures adopted by the Board. Factors used in determining fair value vary by investment type and may include market or investment specific events, changes in interest rates and credit quality. The frequency with which these procedures are used cannot be predicted and they may be utilized to a significant extent. The Committee oversees each Fund's valuation policies and procedures and reports to the Board on the Committee's activities and fair value determinations. The Board monitors the appropriateness of the procedures used in valuing each Fund's investments and ratifies the fair value determinations of the Committee.
Each Fund categorizes the inputs to valuation techniques used to value its investments into a disclosure hierarchy consisting of three levels as shown below:
- Level 1 – quoted prices in active markets for identical investments
- Level 2 – other significant observable inputs (including quoted prices for similar investments, interest rates, prepayment speeds, etc.)
- Level 3 – unobservable inputs (including the Fund's own assumptions based on the best information available)
Valuation techniques used to value each Fund's investments by major category are as follows:
Equity securities, including restricted securities, for which market quotations are readily available, are valued at the last reported sale price or official closing price as reported by a third party pricing vendor on the primary market or exchange on which they are traded and are categorized as Level 1 in the hierarchy. In the event there were no sales during the day or closing prices are not available, securities are valued at the last quoted bid price or may be valued using the last available price and are generally categorized as Level 2 in the hierarchy. For foreign equity securities, when market or security specific events arise, comparisons to the valuation of American Depositary Receipts (ADRs), futures contracts, Exchange-Traded Funds (ETFs) and certain indexes as well as quoted prices for similar securities may be used and would be categorized as Level 2 in the hierarchy. Utilizing these techniques may result in transfers between Level 1 and Level 2. For equity securities, including restricted securities, where observable inputs are limited, assumptions about market activity and risk are used and these securities may be categorized as Level 3 in the hierarchy. Equity securities, including restricted securities, for which observable inputs are not available are valued using alternate valuation approaches, including the market approach and the income approach and are categorized as Level 3 in the hierarchy. The market approach generally consists of using comparable market transactions while the income approach generally consists of using the net present value of estimated future cash flows, adjusted as appropriate for liquidity, credit, market and/or other risk factors.
Debt securities, including restricted securities, are valued based on evaluated prices received from third party pricing vendors or from brokers who make markets in such securities. U.S. government and government agency obligations are valued by pricing vendors who utilize matrix pricing which considers prepayment speed assumptions, attributes of the collateral, yield or price of bonds of comparable quality, coupon, maturity and type or by broker-supplied prices. When independent prices are unavailable or unreliable, debt securities may be valued utilizing pricing methodologies which consider similar factors that would be used by third party pricing vendors. Debt securities are generally categorized as Level 2 in the hierarchy but may be Level 3 depending on the circumstances.
Investments in open-end mutual funds, including the Fidelity Central Funds, are valued at their closing net asset value (NAV) each business day and are categorized as Level 1 in the hierarchy.
The following provides information on Level 3 securities held by Series International Small Cap Fund that were valued at period end based on unobservable inputs. These amounts exclude valuations provided by a broker.
| Asset Type | Fair Value | Valuation Technique(s) | Unobservable Input | Amount or Range/Weighted Average | Impact to Valuation from an Increase in Input(a) |
| Equities | $47,291,038 | Market Approach | Transaction price | $0.23-$70.75-
/$67.63 | Increase |
(a) Represents the expected directional change in the fair value of the Level 3 investments that would result from an increase in the corresponding input. A decrease to the unobservable input would have the opposite effect. Significant changes in these inputs could result in significantly higher or lower fair value measurements.
Changes in valuation techniques may result in transfers in or out of an assigned level within the disclosure hierarchy. The aggregate value of investments by input level as of October 31, 2017, including information on transfers between Levels 1 and 2, as well as a roll forward of Level 3 investments, is included at the end of each applicable Fund's Schedule of Investments.
Foreign Currency. The Funds may use foreign currency contracts to facilitate transactions in foreign-denominated securities. Gains and losses from these transactions may arise from changes in the value of the foreign currency or if the counterparties do not perform under the contracts' terms.
Foreign-denominated assets, including investment securities, and liabilities are translated into U.S. dollars at the exchange rates at period end. Purchases and sales of investment securities, income and dividends received and expenses denominated in foreign currencies are translated into U.S. dollars at the exchange rate in effect on the transaction date.
The effects of exchange rate fluctuations on investments are included with the net realized and unrealized gain (loss) on investment securities. Other foreign currency transactions resulting in realized and unrealized gain (loss) are disclosed separately.
Investment Transactions and Income. For financial reporting purposes, the Funds' investment holdings and NAV include trades executed through the end of the last business day of the period. The NAV per share for processing shareholder transactions is calculated as of the close of business of the New York Stock Exchange (NYSE), normally 4:00 p.m. Eastern time and includes trades executed through the end of the prior business day. Gains and losses on securities sold are determined on the basis of identified cost and includes proceeds received from litigation. Dividend income is recorded on the ex-dividend date, except for certain dividends from foreign securities where the ex-dividend date may have passed, which are recorded as soon as the Funds are informed of the ex-dividend date. Non-cash dividends included in dividend income, if any, are recorded at the fair market value of the securities received. Income and capital gain distributions from Fidelity Central Funds, if any, are recorded on the ex-dividend date. Certain distributions received by the Funds represent a return of capital or capital gain. The Funds determine the components of these distributions subsequent to the ex-dividend date, based upon receipt of tax filings or other correspondence relating to the underlying investment. These distributions are recorded as a reduction of cost of investments and/or as a realized gain. Interest income is accrued as earned and includes coupon interest and amortization of premium and accretion of discount on debt securities as applicable. Investment income is recorded net of foreign taxes withheld where recovery of such taxes is uncertain.
Class Allocations and Expenses. Investment income, realized and unrealized capital gains and losses, common expenses of each Fund, and certain fund-level expense reductions, if any, are allocated daily on a pro-rata basis to each class based on the relative net assets of each class to the total net assets of each Fund. Each class differs with respect to transfer agent fees incurred. Certain expense reductions may also differ by class. For the reporting period, the allocated portion of income and expenses to each class as a percent of its average net assets may vary due to the timing of recording these transactions in relation to fluctuating net assets of the classes. Expenses directly attributable to a fund are charged to that fund. Expenses attributable to more than one fund are allocated among the respective funds on the basis of relative net assets or other appropriate methods. Expense estimates are accrued in the period to which they relate and adjustments are made when actual amounts are known.
Income Tax Information and Distributions to Shareholders. Each year, each Fund intends to qualify as a regulated investment company under Subchapter M of the Internal Revenue Code, including distributing substantially all of its taxable income and realized gains. As a result, no provision for U.S. Federal income taxes is required. As of October 31, 2017, each Fund did not have any unrecognized tax benefits in the financial statements; nor is each Fund aware of any tax positions for which it is reasonably possible that the total amounts of unrecognized tax benefits will significantly change in the next twelve months. Each Fund files a U.S. federal tax return, in addition to state and local tax returns as required. Each Fund's federal income tax returns are subject to examination by the Internal Revenue Service (IRS) for a period of three fiscal years after they are filed. State and local tax returns may be subject to examination for an additional fiscal year depending on the jurisdiction. Foreign taxes are provided for based on each Fund's understanding of the tax rules and rates that exist in the foreign markets in which it invests. Fidelity Series Emerging Markets Fund is subject to a tax imposed on capital gains by certain countries in which it invests. An estimated deferred tax liability for net unrealized appreciation on the applicable securities is included in Other payables and accrued expenses on Fidelity Series Emerging Markets Fund's Statement of Assets & Liabilities.
Distributions are declared and recorded on the ex-dividend date. Income dividends and capital gain distributions are declared separately for each class. Income and capital gain distributions are determined in accordance with income tax regulations, which may differ from GAAP.
Capital accounts within the financial statements are adjusted for permanent book-tax differences. These adjustments have no impact on net assets or the results of operations. Capital accounts are not adjusted for temporary book-tax differences which will reverse in a subsequent period.
Book-tax differences are primarily due to futures contracts, foreign currency transactions, certain foreign taxes, passive foreign investment companies (PFIC), market discount, partnerships, capital loss carryforwards and losses deferred due to wash sales.
As of period end, the cost and unrealized appreciation (depreciation) in securities, and derivatives if applicable, for federal income tax purposes were as follows for each Fund:
| | Tax cost | Gross unrealized appreciation | Gross unrealized depreciation | Net unrealized appreciation (depreciation) |
| Fidelity Series Emerging Markets Fund | $11,428,910,029 | $4,667,343,346 | $(376,837,999) | $4,290,505,347 |
| Fidelity Series International Growth Fund | 10,147,816,922 | 5,018,542,873 | (81,432,709) | 4,937,110,164 |
| Fidelity Series International Small Cap Fund | 2,510,289,539 | 1,197,612,041 | (110,246,136) | 1,087,365,905 |
| Fidelity Series International Value Fund | 12,755,944,773 | 2,713,117,788 | (227,030,649) | 2,486,087,139 |
The tax-based components of distributable earnings as of period end were as follows for each Fund:
| | Undistributed ordinary income | Undistributed long-term capital gain | Capital loss carryforward | Net unrealized appreciation (depreciation) on securities and other investments |
| Fidelity Series Emerging Markets Fund | $286,058,280 | $103,684,017 | $– | $4,290,686,024
|
| Fidelity Series Intenational Growth Fund | 210,567,227 | 224,329,196 | – | 4,937,200,268 |
| Fidelity Series International Small Cap Fund | 97,967,825 | 112,571,202 | – | 1,087,367,837 |
| Fidelity Series International Value Fund | 418,051,808 | – | (758,586,597) | 2,485,977,748 |
Capital loss carryforwards are only available to offset future capital gains of the Funds to the extent provided by regulations and may be limited. Under the Regulated Investment Company Modernization Act of 2010 (the Act), the Funds are permitted to carry forward capital losses incurred in taxable years beginning after December 22, 2010 for an unlimited period and such capital losses are required to be used prior to any losses that expire. The capital loss carryforward information presented below, including any applicable limitation, is estimated as of fiscal period end and is subject to adjustment.
| | No expiration | | | |
| | Short-term | Long-term | Total no expiration | Total capital loss carryfoward |
| Fidelity Series International Value Fund | (497,362,833) | (261,223,764) | (758,586,597) | (758,586,597) |
The tax character of distributions paid was as follows:
| October 31, 2017 | | | |
| | Ordinary Income | Long-term Capital Gains | Total |
| Fidelity Series Emerging Markets Fund | $227,179,652 | $– | $227,179,652 |
| Fidelity Series International Growth Fund | 170,410,130 | 166,389,831 | 336,799,961 |
| Fidelity Series International Small Cap Fund | 38,460,779 | 81,153,343 | 119,614,122 |
| Fidelity Series International Value Fund | 353,862,300 | – | 353,862,300 |
| October 31, 2016 | | | |
| | Ordinary Income | Long-term Capital Gains | Total |
| Fidelity Series Emerging Markets Fund | $158,339,864 | $– | $158,339,864 |
| Fidelity Series International Growth Fund | 154,772,244 | 258,747,183 | 413,519,427 |
| Fidelity Series International Small Cap Fund | 43,062,944 | 146,900,957 | 189,963,901 |
| Fidelity Series International Value Fund | 256,925,581 | – | 256,925,581 |
Restricted Securities. The Funds may invest in securities that are subject to legal or contractual restrictions on resale. These securities generally may be resold in transactions exempt from registration or to the public if the securities are registered. Disposal of these securities may involve time-consuming negotiations and expense, and prompt sale at an acceptable price may be difficult. Information regarding restricted securities is included at the end of each applicable Fund's Schedule of Investments.
4. Derivative Instruments.
Risk Exposures and the Use of Derivative Instruments. The Funds' investment objective allows the Funds to enter into various types of derivative contracts, including futures contracts. Derivatives are investments whose value is primarily derived from underlying assets, indices or reference rates and may be transacted on an exchange or over-the-counter (OTC). Derivatives may involve a future commitment to buy or sell a specified asset based on specified terms, to exchange future cash flows at periodic intervals based on a notional principal amount, or for one party to make one or more payments upon the occurrence of specified events in exchange for periodic payments from the other party.
The Funds used derivatives to increase returns and to manage exposure to certain risks as defined below. The success of any strategy involving derivatives depends on analysis of numerous economic factors, and if the strategies for investment do not work as intended, the Funds may not achieve their objectives.
The Funds' use of derivatives increased or decreased their exposure to the following risk:
| Equity Risk | Equity risk relates to the fluctuations in the value of financial instruments as a result of changes in market prices (other than those arising from interest rate risk or foreign exchange risk), whether caused by factors specific to an individual investment, its issuer, or all factors affecting all instruments traded in a market or market segment.
|
The Funds are also exposed to additional risks from investing in derivatives, such as liquidity risk and counterparty credit risk. Liquidity risk is the risk that the Funds will be unable to close out the derivative in the open market in a timely manner. Counterparty credit risk is the risk that the counterparty will not be able to fulfill its obligation to the Funds. Counterparty credit risk related to exchange-traded futures contracts may be mitigated by the protection provided by the exchange on which they trade.
Investing in derivatives may involve greater risks than investing in the underlying assets directly and, to varying degrees, may involve risk of loss in excess of any initial investment and collateral received and amounts recognized in the Statement of Assets and Liabilities. In addition, there may be the risk that the change in value of the derivative contract does not correspond to the change in value of the underlying instrument.
Futures Contracts. A futures contract is an agreement between two parties to buy or sell a specified underlying instrument for a fixed price at a specified future date. The Funds used futures contracts to manage their exposure to the stock market.
Upon entering into a futures contract, a fund is required to deposit either cash or securities (initial margin) with a clearing broker in an amount equal to a certain percentage of the face value of the contract. Futures contracts are marked-to-market daily and subsequent daily payments (variation margin) are made or received by a fund depending on the daily fluctuations in the value of the futures contracts and are recorded as unrealized appreciation or (depreciation). This receivable and/or payable, if any, is included in daily variation margin on futures contracts in the Statement of Assets and Liabilities. Realized gain or (loss) is recorded upon the expiration or closing of a futures contract. The net realized gain (loss) and change in net unrealized appreciation (depreciation) on futures contracts during the period is presented in the Statement of Operations.
Any open futures contracts at period end are presented in the Schedule of Investments under the caption "Futures Contracts". The notional amount at value reflects each contract's exposure to the underlying instrument or index at period end.
5. Purchases and Sales of Investments.
Purchases and sales of securities, other than short-term securities, are noted in the table below.
| | Purchases ($) | Sales ($) |
| Fidelity Series Emerging Markets Fund | 8,763,389,961 | 12,274,681,453 |
| Fidelity Series International Growth Fund | 3,094,584,328 | 3,339,539,628 |
| Fidelity Series International Small Cap Fund | 672,184,780 | 658,435,513 |
| Fidelity Series International Value Fund | 7,166,865,199 | 7,421,542,476 |
6. Fees and Other Transactions with Affiliates.
Management Fee. Effective June 1, 2017, under the management contract approved by the Board and shareholders, Fidelity Management & Research Company (the investment adviser) and its affiliates provide the Funds with investment management related services for which the Funds do not pay a management fee. In addition, the investment adviser pays all ordinary operating expenses of the Funds, except custody fees, fees and expenses of the independent Trustees, and certain miscellaneous expenses such as proxy and shareholder meeting expenses.
Prior to June 1, 2017, the investment adviser and its affiliates provided the Funds with investment management related services for which the Funds paid a monthly management fee. The management fee was the sum of an individual fund fee rate and an annualized group fee rate, as presented in the table below. The individual fund fee rate was applied to each Fund's average net assets. The group fee rate was based upon the average net assets of all the mutual funds advised by the investment adviser, including any mutual funds previously advised by the investment adviser that are currently advised by Fidelity SelectCo, LLC, an affiliate of the investment adviser. The group fee rate decreased as assets under management increased and increased as assets under management decreased. In addition, the management fee for Fidelity Series International Growth Fund, Fidelity Series International Small Cap Fund and Fidelity Series International Value Fund was subject to a performance adjustment (up to a maximum of +/- .20% of each applicable Fund's average net assets over a 36 month performance period.) The upward or downward adjustment to the management fee was based on relative investment performance of Series International Growth, Series International Small Cap and Series International Value as compared to its benchmark index over the same 36 month performance period. The performance adjustment included in the management fee rate may be higher or lower than the maximum performance adjustment rate due to the difference between the average net asset for the reporting and performance periods.
| | Individual Rate | Group Rate |
| Fidelity Series Emerging Markets Fund | .55% | .25% |
| Fidelity Series International Growth Fund | .45% | .25% |
| Fidelity Series International Small Cap Fund | .60% | .25% |
| Fidelity Series International Value Fund | .45% | .25% |
| | Performance Benchmark |
| Fidelity Series International Growth Fund | MSCI EAFE Growth Index |
| Fidelity Series International Small Cap Fund | MSCI EAFE Small Cap Index |
| Fidelity Series International Value Fund | MSCI EAFE Value Index |
Transfer Agent Fees. Fidelity Investments Institutional Operations Company, Inc., (FIIOC), an affiliate of the investment adviser, is the transfer, dividend disbursing and shareholder servicing agent for each class of the Funds. Effective June 1, 2017, fees for these services are no longer charged to the classes. Prior to June 1, 2017, FIIOC received account fees and asset-based fees that varied according to the account size and type of account of the shareholders of the respective classes of each Fund. FIIOC received no fees for providing transfer agency services to Class F. FIIOC pays for typesetting, printing and mailing of shareholder reports, except proxy statements. For the period, transfer agent fees for each applicable class were as follows:
| | Amount | % of
Class-Level Average
Net Assets |
| Fidelity Series Emerging Markets Fund | | |
| Series Emerging Markets | $6,504,328 | .07 |
| Fidelity Series International Growth Fund | | |
| Series International Growth | $5,629,357 | .07 |
| Fidelity Series International Small Cap Fund | | |
| Series International Small Cap | $1,294,486 | .07 |
| Fidelity Series International Value Fund | | |
| Series International Value | $5,660,830 | .07 |
Accounting and Security Lending Fees. Fidelity Service Company, Inc. (FSC), an affiliate of the investment adviser, maintains each Fund's accounting records. The accounting fee is based on the level of average net assets for each month. Under a separate contract, FSC administers the security lending program. The security lending fee is based on the number and duration of lending transactions. Effective June 1, 2017, these fees are paid by the investment adviser or an affiliate.
Brokerage Commissions. Certain Funds placed a portion of their portfolio transactions with brokerage firms which are affiliates of the investment adviser. Brokerage commissions are included in net realized gain (loss) and change in net unrealized appreciation (depreciation) in the Statement of Operations. The commissions paid to these affiliated firms were as follows:
| | Amount |
| Fidelity Series Emerging Markets Fund | $126,469 |
| Fidelity Series International Growth Fund | 10,349 |
| Fidelity Series International Small Cap Fund | 2,123 |
| Fidelity Series International Value Fund | 5,725 |
Interfund Lending Program. Pursuant to an Exemptive Order issued by the SEC, the Funds, along with other registered investment companies having management contracts with FMR or other affiliated entities of FMR, may participate in an interfund lending program. This program provides an alternative credit facility allowing the funds to borrow from, or lend money to, other participating affiliated funds. At period end, there were no interfund loans outstanding. Each applicable fund's activity in this program during the period for which loans were outstanding was as follows:
| | Borrower or Lender | Average Loan Balance | Weighted Average Interest Rate | Interest Expense
|
| Fidelity Series Emerging Markets Fund | Borrower | $46,876,286 | 1.34% | $12,247 |
| Fidelity Series International Growth Fund | Borrower | $138,706,000 | 1.34% | $5,163 |
| Fidelity Series International Value Fund | Borrower | $59,188,900 | 1.31% | $21,592 |
Interfund Trades. The Funds may purchase from or sell securities to other Fidelity Funds under procedures adopted by the Board. The procedures have been designed to ensure these interfund trades are executed in accordance with Rule 17a-7 of the 1940 Act. Interfund trades are included within the respective purchases and sales amounts shown in the Purchases and Sales of Investments note.
Other. During the period, the investment adviser reimbursed Fidelity Series International Small Cap Fund for certain losses in the amount of $3,899.
7. Committed Line of Credit.
Certain Funds participate with other funds managed by the investment adviser or an affiliate in a $4.25 billion credit facility (the "line of credit") to be utilized for temporary or emergency purposes to fund shareholder redemptions or for other short-term liquidity purposes. The participating funds have agreed to pay commitment fees on their pro-rata portion of the line of credit, which are reflected in Miscellaneous expenses on the Statement of Operations, and are as follows:
| Fidelity Series Emerging Markets Fund | $51,352 |
| Fidelity Series International Growth Fund | 44,755 |
| Fidelity Series International Small Cap Fund | 10,307 |
| Fidelity Series International Value Fund | 44,961 |
During the period, the Funds did not borrow on this line of credit.
8. Security Lending.
Certain Funds lend portfolio securities through a lending agent from time to time in order to earn additional income. For equity securities, a lending agent is used and may loan securities to certain qualified borrowers, including Fidelity Capital Markets (FCM), a broker-dealer affiliated with the Funds. On the settlement date of the loan, each applicable Fund receives collateral (in the form of U.S. Treasury obligations, letters of credit and/or cash) against the loaned securities and maintains collateral in an amount not less than 100% of the market value of the loaned securities during the period of the loan. The market value of the loaned securities is determined at the close of business of the Funds and any additional required collateral is delivered to the Funds on the next business day. The Funds or borrower may terminate the loan at any time, and if the borrower defaults on its obligation to return the securities loaned because of insolvency or other reasons, the Funds may apply collateral received from the borrower against the obligation. The Funds may experience delays and costs in recovering the securities loaned. Any cash collateral received is invested in the Fidelity Securities Lending Cash Central Fund. The value of loaned securities and cash collateral at period end are disclosed on each applicable Fund's Statement of Assets and Liabilities. Security lending income represents the income earned on investing cash collateral, less rebates paid to borrowers and any lending agent fees associated with the loan, plus any premium payments received for lending certain types of securities. Security lending income is presented on each applicable Fund's Statement of Operations as a component of income from Fidelity Central Funds. FCM security lending activity was as follows:
| | Total Security Lending Income | Security Lending Income From Securities Loaned to FCM | Value of Securities Loaned to FCM at Period End |
| Fidelity Series Emerging Markets Fund | $893,173 | $17,793 | $– |
| Fidelity Series International Growth Fund | $1,549,442 | $ 11,742 | $27,718,920 |
| Fidelity Series International Small Cap Fund | $1,133,364 | $129 | $– |
| Fidelity Series International Value Fund | $7,242,580 | $3,373 | $– |
9. Expense Reductions.
Effective June 1, 2017, the investment adviser contractually agreed to reimburse funds to the extent annual operating expenses exceeded certain levels of average net assets as noted in the table below. This reimbursement will remain in place through December 31, 2020. Some expenses, for example the compensation of the independent Trustees, and certain miscellaneous expenses such as proxy and shareholder meeting expenses are excluded from this reimbursement.
The following classes of each applicable Fund were in reimbursement during the period:
| | Expense
Limitations | Reimbursement |
| Fidelity Series Emerging Markets Fund | | |
| Series Emerging Markets | .014% | $1,848,917 |
| Class F | .014% | 1,347,924 |
Commissions paid to certain brokers with whom the investment adviser, or its affiliates, places trades on behalf of Certain Funds include an amount in addition to trade execution, which may be rebated back to the Funds to offset certain expenses. In addition, through arrangements with each applicable Fund's custodian, credits realized as a result of certain uninvested cash balances were used to reduce the Fund's expenses. All of the applicable expense reductions are noted in the table below.
| | Brokerage Service reduction | Custody
expense
reduction |
| Fidelity Series Emerging Markets Fund | $1,626,921 | $1,033 |
| Fidelity Series International Growth Fund | 404,246 | 520 |
| Fidelity Series International Small Cap Fund | 117,764 | – |
| Fidelity Series International Value Fund | 1,411,770 | 464 |
In addition, during the period the investment adviser reimbursed and/or waived a portion of fund-level operating expenses as follows:
| | Fund-Level Amount |
| Fidelity Series Emerging Markets Fund | $134,122 |
| Fidelity Series International Growth Fund | 117,862 |
| Fidelity Series International Small Cap Fund | 27,115 |
| Fidelity Series International Value Fund | 120,894 |
10. Distributions to Shareholders.
Distributions to shareholders of each class were as follows:
| | Year ended
October 31, 2017 | Year ended
October 31, 2016 |
| Fidelity Series Emerging Markets Fund | | |
| From net investment income | | |
| Series Emerging Markets | $82,269,688 | $69,080,205 |
| Class F | 111,268,765 | 89,259,659 |
| Total | $193,538,453 | $158,339,864 |
| From net realized gain | | |
| Series Emerging Markets | $15,266,540 | $– |
| Class F | 18,374,659 | – |
| Total | $33,641,199 | $– |
| Fidelity Series International Growth Fund | | |
| From net investment income | | |
| Series International Growth | $71,631,335 | $60,262,280 |
| Class F | 98,778,795 | 81,155,271 |
| Total | $170,410,130 | $141,417,551 |
| From net realized gain | | |
| Series International Growth | $74,784,915 | $125,932,714 |
| Class F | 91,604,916 | 146,169,162 |
| Total | $166,389,831 | $272,101,876 |
| Fidelity Series International Small Cap Fund | | |
| From net investment income | | |
| Series International Small Cap | $14,167,288 | $11,493,851 |
| Class F | 19,989,904 | 15,865,887 |
| Total | $34,157,192 | $27,359,738 |
| From net realized gain | | |
| Series International Small Cap | $38,362,071 | $75,296,455 |
| Class F | 47,094,859 | 87,307,708 |
| Total | $85,456,930 | $162,604,163 |
| Fidelity Series International Value Fund | | |
| From net investment income | | |
| Series International Value | $143,191,242 | $113,519,073 |
| Class F | 186,385,696 | 143,406,508 |
| Total | $329,576,938 | $256,925,581 |
| From net realized gain | | |
| Series International Value | $10,915,924 | $– |
| Class F | 13,369,438 | – |
| Total | $24,285,362 | $– |
11. Share Transactions.
Transactions for each class of shares were as follows:
| | Shares | Shares | Dollars | Dollars |
| | Year ended
October 31, 2017 | Year ended
October 31, 2016 | Year ended
October 31, 2017 | Year ended
October 31, 2016 |
| Fidelity Series Emerging Markets Fund | | | | |
| Series Emerging Markets | | | | |
| Shares sold | 519,778,624 | 86,255,737 | $10,628,254,799 | $1,225,904,043 |
| Reinvestment of distributions | 6,260,348 | 4,686,581 | 97,536,228 | 69,080,205 |
| Shares redeemed | (205,349,586) | (38,072,375) | (4,080,491,417) | (572,922,905) |
| Net increase (decrease) | 320,689,386 | 52,869,943 | $6,645,299,610 | $722,061,343 |
| Class F | | | | |
| Shares sold | 47,966,801 | 121,860,800 | $834,470,841 | $1,759,396,538 |
| Reinvestment of distributions | 8,299,835 | 6,043,308 | 129,643,424 | 89,259,659 |
| Shares redeemed | (558,565,734) | (38,417,155) | (11,293,892,850) | (573,269,735) |
| Net increase (decrease) | (502,299,098) | 89,486,953 | $(10,329,778,585) | $1,275,386,462 |
| Fidelity Series International Growth Fund | | | | |
| Series International Growth | | | | |
| Shares sold | 616,887,379 | 71,557,147 | $9,472,471,861 | $950,043,740 |
| Reinvestment of distributions | 11,528,839 | 13,492,391 | 146,416,250 | 186,194,994 |
| Shares redeemed | (137,272,697) | (54,629,273) | (2,083,470,910) | (742,386,563) |
| Net increase (decrease) | 491,143,521 | 30,420,265 | $7,535,417,201 | $393,852,171 |
| Class F | | | | |
| Shares sold | 82,432,313 | 111,047,353 | $1,122,218,322 | $1,484,673,797 |
| Reinvestment of distributions | 14,967,273 | 16,448,946 | 190,383,711 | 227,324,433 |
| Shares redeemed | (611,580,376) | (63,260,483) | (9,409,531,402) | (857,491,411) |
| Net increase (decrease) | (514,180,790) | 64,235,816 | $(8,096,929,369) | $854,506,819 |
| Fidelity Series International Small Cap Fund | | | | |
| Series International Small Cap | | | | |
| Shares sold | 126,808,547 | 13,970,665 | $2,182,522,510 | $203,844,367 |
| Reinvestment of distributions | 3,725,486 | 5,687,438 | 52,529,358 | 86,790,306 |
| Shares redeemed | (20,793,540) | (12,099,806) | (347,551,675) | (183,237,403) |
| Net increase (decrease) | 109,740,493 | 7,558,297 | $1,887,500,193 | $107,397,270 |
| Class F | | | | |
| Shares sold | 15,972,969 | 21,616,390 | $242,899,916 | $317,805,284 |
| Reinvestment of distributions | 4,751,046 | 6,752,199 | 67,084,763 | 103,173,595 |
| Shares redeemed | (126,992,159) | (13,495,964) | (2,185,674,132) | (204,013,287) |
| Net increase (decrease) | (106,268,144) | 14,872,625 | $(1,875,689,453) | $216,965,592 |
| Fidelity Series International Value Fund | | | | |
| Series International Value | | | | |
| Shares sold | 901,998,924 | 127,074,626 | $9,348,838,001 | $1,158,126,260 |
| Reinvestment of distributions | 16,805,580 | 11,715,075 | 154,107,166 | 113,519,073 |
| Shares redeemed | (180,222,845) | (76,426,474) | (1,855,842,145) | (713,679,690) |
| Net increase (decrease) | 738,581,659 | 62,363,227 | $7,647,103,022 | $557,965,643 |
| Class F | | | | |
| Shares sold | 100,477,660 | 189,019,529 | $970,415,947 | $1,732,715,824 |
| Reinvestment of distributions | 21,759,819 | 14,784,176 | 199,755,135 | 143,406,508 |
| Shares redeemed | (884,352,197) | (88,864,488) | (9,172,700,017) | (828,820,981) |
| Net increase (decrease) | (762,114,718) | 114,939,217 | $(8,002,528,935) | $1,047,301,351 |
12. Other.
The Funds' organizational documents provide former and current trustees and officers with a limited indemnification against liabilities arising in connection with the performance of their duties to the Funds. In the normal course of business, the Funds may also enter into contracts that provide general indemnifications. The Funds' maximum exposure under these arrangements is unknown as this would be dependent on future claims that may be made against the Funds. The risk of material loss from such claims is considered remote.
At the end of the period, mutual funds managed by the investment adviser or its affiliates were the owners of record of all of the outstanding shares of the Funds.
Report of Independent Registered Public Accounting Firm
To the Trustees of Fidelity Investment Trust and the Shareholders of Fidelity Series International Growth Fund:
In our opinion, the accompanying statement of assets and liabilities, including the schedule of investments, and the related statements of operations and of changes in net assets and the financial highlights present fairly, in all material respects, the financial position of Fidelity Series International Growth Fund (a Fund of Fidelity Investment Trust) (the "Fund") as of October 31, 2017, the results of its operations for the year then ended, the changes in its net assets for each of the two years in the period then ended and the financial highlights for each of the five years in the period then ended, in conformity with accounting principles generally accepted in the United States of America. These financial statements and financial highlights (hereafter referred to as “financial statements”) are the responsibility of the Fund's management. Our responsibility is to express an opinion on these financial statements based on our audits. We conducted our audits of these financial statements in accordance with the standards of the Public Company Accounting Oversight Board (United States). Those standards require that we plan and perform the audit to obtain reasonable assurance about whether the financial statements are free of material misstatement. An audit includes examining, on a test basis, evidence supporting the amounts and disclosures in the financial statements, assessing the accounting principles used and significant estimates made by management, and evaluating the overall financial statement presentation. Our procedures included confirmation of securities owned as of October 31, 2017 by correspondence with the custodians and brokers; when replies were not received from brokers, we performed other auditing procedures. We believe that our audits provide a reasonable basis for our opinion.
PricewaterhouseCoopers LLP
Boston, Massachusetts
December 22, 2017
Report of Independent Registered Public Accounting Firm
To the Trustees of Fidelity Investment Trust and the Shareholders of Fidelity Series Emerging Markets Fund, Fidelity Series International Small Cap Fund and Fidelity Series International Value Fund:
We have audited the accompanying statements of assets and liabilities of Fidelity Series Emerging Markets Fund, Fidelity Series International Small Cap Fund and Fidelity Series International Value Fund (the Funds), each a fund of the Fidelity Investment Trust, including the schedules of investments, as of October 31, 2017, and the related statements of operations for the year then ended, the statements of changes in net assets for each of the two years in the period then ended, and the financial highlights for each of the five years in the period then ended. These financial statements and financial highlights are the responsibility of the Funds' management. Our responsibility is to express an opinion on these financial statements and financial highlights based on our audits.
We conducted our audits in accordance with the standards of the Public Company Accounting Oversight Board (United States). Those standards require that we plan and perform the audit to obtain reasonable assurance about whether the financial statements and financial highlights are free of material misstatement. The Funds are not required to have, nor were we engaged to perform, an audit of its internal control over financial reporting. Our audits included consideration of internal control over financial reporting as a basis for designing audit procedures that are appropriate in the circumstances, but not for the purpose of expressing an opinion on the effectiveness of the Funds' internal control over financial reporting. Accordingly, we express no such opinion. An audit also includes examining, on a test basis, evidence supporting the amounts and disclosures in the financial statements, assessing the accounting principles used and significant estimates made by management, as well as evaluating the overall financial statement presentation. Our procedures included confirmation of securities owned as of October 31, 2017, by correspondence with the custodians and brokers when replies were not received from brokers, we performed other auditing procedures. We believe that our audits provide a reasonable basis for our opinion.
In our opinion, such financial statements and financial highlights referred to above present fairly, in all material respects, the financial position of Fidelity Series Emerging Markets Fund, Fidelity Series International Small Cap Fund and Fidelity Series International Value Fund as of October 31, 2017, the results of their operations for the year then ended, the changes in their net assets for each of the two years in the period then ended, and the financial highlights for each of the five years in the period then ended, in conformity with accounting principles generally accepted in the United States of America.
DELOITTE & TOUCHE LLP
Boston, Massachusetts
December 22, 2017
Trustees and Officers
The Trustees, Members of the Advisory Board (if any), and officers of the trust and funds, as applicable, are listed below. The Board of Trustees governs each fund and is responsible for protecting the interests of shareholders. The Trustees are experienced executives who meet periodically throughout the year to oversee each fund's activities, review contractual arrangements with companies that provide services to each fund, oversee management of the risks associated with such activities and contractual arrangements, and review each fund's performance. Except for Jonathan Chiel, each of the Trustees oversees 190 funds. Mr. Chiel oversees 143 funds.
The Trustees hold office without limit in time except that (a) any Trustee may resign; (b) any Trustee may be removed by written instrument, signed by at least two-thirds of the number of Trustees prior to such removal; (c) any Trustee who requests to be retired or who has become incapacitated by illness or injury may be retired by written instrument signed by a majority of the other Trustees; and (d) any Trustee may be removed at any special meeting of shareholders by a two-thirds vote of the outstanding voting securities of the trust. Each Trustee who is not an interested person (as defined in the 1940 Act) of the trust and the funds is referred to herein as an Independent Trustee. Each Independent Trustee shall retire not later than the last day of the calendar year in which his or her 75th birthday occurs. The Independent Trustees may waive this mandatory retirement age policy with respect to individual Trustees. Officers and Advisory Board Members hold office without limit in time, except that any officer or Advisory Board Member may resign or may be removed by a vote of a majority of the Trustees at any regular meeting or any special meeting of the Trustees. Except as indicated, each individual has held the office shown or other offices in the same company for the past five years.
Each fund’s Statement of Additional Information (SAI) includes more information about the Trustees. To request a free copy, call Fidelity at 1-800-544-8544.
Experience, Skills, Attributes, and Qualifications of the Trustees. The Governance and Nominating Committee has adopted a statement of policy that describes the experience, qualifications, attributes, and skills that are necessary and desirable for potential Independent Trustee candidates (Statement of Policy). The Board believes that each Trustee satisfied at the time he or she was initially elected or appointed a Trustee, and continues to satisfy, the standards contemplated by the Statement of Policy. The Governance and Nominating Committee also engages professional search firms to help identify potential Independent Trustee candidates who have the experience, qualifications, attributes, and skills consistent with the Statement of Policy. From time to time, additional criteria based on the composition and skills of the current Independent Trustees, as well as experience or skills that may be appropriate in light of future changes to board composition, business conditions, and regulatory or other developments, have also been considered by the professional search firms and the Governance and Nominating Committee. In addition, the Board takes into account the Trustees' commitment and participation in Board and committee meetings, as well as their leadership of standing and ad hoc committees throughout their tenure.
In determining that a particular Trustee was and continues to be qualified to serve as a Trustee, the Board has considered a variety of criteria, none of which, in isolation, was controlling. The Board believes that, collectively, the Trustees have balanced and diverse experience, qualifications, attributes, and skills, which allow the Board to operate effectively in governing each fund and protecting the interests of shareholders. Information about the specific experience, skills, attributes, and qualifications of each Trustee, which in each case led to the Board's conclusion that the Trustee should serve (or continue to serve) as a trustee of the funds, is provided below.
Board Structure and Oversight Function. James C. Curvey is an interested person and currently serves as Chairman. The Trustees have determined that an interested Chairman is appropriate and benefits shareholders because an interested Chairman has a personal and professional stake in the quality and continuity of services provided to the funds. Independent Trustees exercise their informed business judgment to appoint an individual of their choosing to serve as Chairman, regardless of whether the Trustee happens to be independent or a member of management. The Independent Trustees have determined that they can act independently and effectively without having an Independent Trustee serve as Chairman and that a key structural component for assuring that they are in a position to do so is for the Independent Trustees to constitute a substantial majority for the Board. The Independent Trustees also regularly meet in executive session. Ned C. Lautenbach serves as Chairman of the Independent Trustees and as such (i) acts as a liaison between the Independent Trustees and management with respect to matters important to the Independent Trustees and (ii) with management prepares agendas for Board meetings.
Fidelity® funds are overseen by different Boards of Trustees. The funds' Board oversees Fidelity's high income and certain equity funds, and other Boards oversee Fidelity's investment-grade bond, money market, asset allocation, and sector funds. The asset allocation funds may invest in Fidelity® funds overseen by the funds' Board. The use of separate Boards, each with its own committee structure, allows the Trustees of each group of Fidelity® funds to focus on the unique issues of the funds they oversee, including common research, investment, and operational issues. On occasion, the separate Boards establish joint committees to address issues of overlapping consequences for the Fidelity® funds overseen by each Board.
The Trustees operate using a system of committees to facilitate the timely and efficient consideration of all matters of importance to the Trustees, each fund, and fund shareholders and to facilitate compliance with legal and regulatory requirements and oversight of the funds' activities and associated risks. The Board, acting through its committees, has charged FMR and its affiliates with (i) identifying events or circumstances the occurrence of which could have demonstrably adverse effects on the funds' business and/or reputation; (ii) implementing processes and controls to lessen the possibility that such events or circumstances occur or to mitigate the effects of such events or circumstances if they do occur; and (iii) creating and maintaining a system designed to evaluate continuously business and market conditions in order to facilitate the identification and implementation processes described in (i) and (ii) above. Because the day-to-day operations and activities of the funds are carried out by or through FMR, its affiliates, and other service providers, the funds' exposure to risks is mitigated but not eliminated by the processes overseen by the Trustees. While each of the Board's committees has responsibility for overseeing different aspects of the funds' activities, oversight is exercised primarily through the Operations, Audit, and Compliance Committees. In addition, the Independent Trustees have worked with FMR to enhance the Board's oversight of investment and financial risks, legal and regulatory risks, technology risks, and operational risks, including the development of additional risk reporting to the Board. For example, a working group comprised of Independent Trustees and FMR has worked and continues to work to review the Fidelity® funds' valuation-related activities, reporting and risk management. Appropriate personnel, including but not limited to the funds' Chief Compliance Officer (CCO), FMR's internal auditor, the independent accountants, the funds' Treasurer and portfolio management personnel, make periodic reports to the Board's committees, as appropriate, including an annual review of Fidelity's risk management program for the Fidelity® funds. The responsibilities of each standing committee, including their oversight responsibilities, are described further under "Standing Committees of the Trustees."
Interested Trustees*:
Correspondence intended for a Trustee who is an interested person may be sent to Fidelity Investments, 245 Summer Street, Boston, Massachusetts 02210.
Name, Year of Birth; Principal Occupations and Other Relevant Experience+
Jonathan Chiel (1957)
Year of Election or Appointment: 2016
Trustee
Mr. Chiel also serves as Trustee of other Fidelity® funds. Mr. Chiel is Executive Vice President and General Counsel for FMR LLC (diversified financial services company, 2012-present). Previously, Mr. Chiel served as general counsel (2004-2012) and senior vice president and deputy general counsel (2000-2004) for John Hancock Financial Services; a partner with Choate, Hall & Stewart (1996-2000) (law firm); and an Assistant United States Attorney for the United States Attorney’s Office of the District of Massachusetts (1986-95), including Chief of the Criminal Division (1993-1995). Mr. Chiel is a director on the boards of the Boston Bar Foundation and the Maimonides School.
James C. Curvey (1935)
Year of Election or Appointment: 2007
Trustee
Chairman of the Board of Trustees
Mr. Curvey also serves as Trustee of other Fidelity® funds. Mr. Curvey is a Director of Fidelity Research & Analysis Co. (investment adviser firm, 2009-present), and Vice Chairman (2007-present) and Director of FMR LLC (diversified financial services company). In addition, Mr. Curvey serves as an Overseer for the Boston Symphony Orchestra and a member of the board of Artis-Naples, Naples, Florida, and as a Trustee for Brewster Academy, Wolfeboro, New Hampshire. Previously, Mr. Curvey served as a Director of Fidelity Investments Money Management, Inc. (investment adviser firm, 2009-2014) and a Director of FMR and FMR Co., Inc. (investment adviser firms, 2007-2014).
Charles S. Morrison (1960)
Year of Election or Appointment: 2014
Trustee
Mr. Morrison also serves as Trustee of other funds. He serves as President of Fidelity Management & Research Company (FMR) (investment adviser firm, 2016-present), a Director of Fidelity Investments Money Management, Inc. (FIMM) (investment adviser firm, 2014-present), Director of Fidelity SelectCo, LLC (investment adviser firm, 2014-present), President, Asset Management (2014-present), and is an employee of Fidelity Investments. Previously, Mr. Morrison served as Vice President of Fidelity's Fixed Income and Asset Allocation Funds (2012-2014), President, Fixed Income (2011-2014), Vice President of Fidelity's Money Market Funds (2005-2009), President, Money Market Group Leader of FMR (investment adviser firm, 2009), and Senior Vice President, Money Market Group of FMR (2004-2009). Mr. Morrison also served as Vice President of Fidelity's Bond Funds (2002-2005), certain Balanced Funds (2002-2005), and certain Asset Allocation Funds (2002-2007), and as Senior Vice President (2002-2005) of Fidelity's Bond Division.
* Determined to be an “Interested Trustee” by virtue of, among other things, his or her affiliation with the trust or various entities under common control with FMR.
+ The information includes the Trustee's principal occupation during the last five years and other information relating to the experience, attributes, and skills relevant to the Trustee's qualifications to serve as a Trustee, which led to the conclusion that the Trustee should serve as a Trustee for each fund.
Independent Trustees:
Correspondence intended for an Independent Trustee may be sent to Fidelity Investments, P.O. Box 55235, Boston, Massachusetts 02205-5235.
Name, Year of Birth; Principal Occupations and Other Relevant Experience+
Dennis J. Dirks (1948)
Year of Election or Appointment: 2005
Trustee
Mr. Dirks also serves as Trustee of other Fidelity® funds. Prior to his retirement in May 2003, Mr. Dirks was Chief Operating Officer and a member of the Board of The Depository Trust & Clearing Corporation (DTCC). He also served as President, Chief Operating Officer, and Board member of The Depository Trust Company (DTC) and President and Board member of the National Securities Clearing Corporation (NSCC). In addition, Mr. Dirks served as Chief Executive Officer and Board member of the Government Securities Clearing Corporation, Chief Executive Officer and Board member of the Mortgage-Backed Securities Clearing Corporation, as a Trustee and a member of the Finance Committee of Manhattan College (2005-2008), as a Trustee and a member of the Finance Committee of AHRC of Nassau County (2006-2008), as a member of the Independent Directors Council (IDC) Governing Council (2010-2015), and as a member of the Board of Directors for The Brookville Center for Children’s Services, Inc. (2009-2017). Mr. Dirks is a member of the Finance Committee (2016-present) and Board of Directors (2017-present) of the Asolo Repertory Theatre.
Alan J. Lacy (1953)
Year of Election or Appointment: 2008
Trustee
Mr. Lacy also serves as Trustee of other Fidelity® funds. Mr. Lacy serves as a Director of Bristol-Myers Squibb Company (global pharmaceuticals, 2008-present). He is a Trustee of the California Chapter of The Nature Conservancy (2015-present) and a Director of the Center for Advanced Study in the Behavioral Sciences at Stanford University (2015-present). In addition, Mr. Lacy served as Senior Adviser (2007-2014) of Oak Hill Capital Partners, L.P. (private equity) and also served as Chief Executive Officer (2005) and Vice Chairman (2005-2006) of Sears Holdings Corporation (retail) and Chief Executive Officer and Chairman of the Board of Sears, Roebuck and Co. (retail, 2000-2005). Previously, Mr. Lacy served as Chairman (2014-2017) and a member (2010-2017) of the Board of Directors of Dave & Buster’s Entertainment, Inc. (restaurant and entertainment complexes), as Chairman (2008-2011) and a member (2006-2015) of the Board of Trustees of the National Parks Conservation Association, and as a member of the Board of Directors for The Hillman Companies, Inc. (hardware wholesalers, 2010-2014), Earth Fare, Inc. (retail grocery, 2010-2014), and The Western Union Company (global money transfer, 2006-2011).
Ned C. Lautenbach (1944)
Year of Election or Appointment: 2000
Trustee
Chairman of the Independent Trustees
Mr. Lautenbach also serves as Trustee of other Fidelity® funds. Mr. Lautenbach currently serves as Vice Chair of the Board of Governors, State University System of Florida (2013-present) and is a member of the Council on Foreign Relations (1994-present). He is also a member and has most recently served as Chairman of the Board of Directors of Artis-Naples (2012-present). Previously, Mr. Lautenbach served as a member and then Lead Director of the Board of Directors of Eaton Corporation (diversified industrial, 1997-2016). He was also a Partner and Advisory Partner at Clayton, Dubilier & Rice, LLC (private equity investment, 1998-2010), as well as a Director of Sony Corporation (2006-2007). In addition, Mr. Lautenbach also had a 30-year career with IBM (technology company) during which time he served as Senior Vice President and a member of the Corporate Executive Committee (1968-1998).
Joseph Mauriello (1944)
Year of Election or Appointment: 2008
Trustee
Mr. Mauriello also serves as Trustee of other Fidelity® funds. Prior to his retirement in January 2006, Mr. Mauriello served in numerous senior management positions including Deputy Chairman and Chief Operating Officer (2004-2005), and Vice Chairman of Financial Services (2002-2004) of KPMG LLP US (professional services, 1965-2005). Mr. Mauriello currently serves as a member of the Board of Directors of XL Group plc. (global insurance and re-insurance, 2006-present) and the Independent Directors Council (IDC) Governing Council (2015-present). Previously, Mr. Mauriello served as a Director of the Hamilton Funds of the Bank of New York (2006-2007) and of Arcadia Resources Inc. (health care services and products, 2007-2012).
Cornelia M. Small (1944)
Year of Election or Appointment: 2005
Trustee
Ms. Small also serves as Trustee of other Fidelity® funds. Ms. Small is a member of the Board of Directors (2009-present) and Chair of the Investment Committee (2010-present) of the Teagle Foundation. Ms. Small also serves on the Investment Committee of the Berkshire Taconic Community Foundation (2008-present). Previously, Ms. Small served as Chairperson (2002-2008) and a member of the Investment Committee and Chairperson (2008-2012) and a member of the Board of Trustees of Smith College. In addition, Ms. Small served as Chief Investment Officer, Director of Global Equity Investments, and a member of the Board of Directors of Scudder, Stevens & Clark and Scudder Kemper Investments.
William S. Stavropoulos (1939)
Year of Election or Appointment: 2001
Trustee
Vice Chairman of the Independent Trustees
Mr. Stavropoulos also serves as Trustee of other Fidelity® funds. Mr. Stavropoulos serves as President and Founder of the Michigan Baseball Foundation, the Great Lakes Loons (2007-present). Mr. Stavropoulos is Chairman Emeritus of the Board of Directors of The Dow Chemical Company, where he previously served in numerous senior management positions, including President, CEO (1995-2000; 2002-2004), Chairman of the Executive Committee (2000-2006), and as a member of the Board of Directors (1990-2006). Currently, Mr. Stavropoulos is Chairman of the Board of Directors of Univar Inc. (global distributor of commodity and specialty chemicals), a Director of Teradata Corporation (data warehousing and technology solutions), and a member of the Advisory Board for Metalmark Capital LLC (private equity investment, 2005-present). Mr. Stavropoulos is an operating advisor to Clayton, Dubilier & Rice, LLC (private equity investment). In addition, Mr. Stavropoulos is a member of the University of Notre Dame Advisory Council for the College of Science, a Trustee of the Rollin L. Gerstacker Foundation, and a Director of Artis-Naples in Naples, Florida. Previously, Mr. Stavropoulos served as a Director of Chemical Financial Corporation (bank holding company, 1993-2012) and Tyco International, Ltd. (multinational manufacturing and services, 2007-2012).
David M. Thomas (1949)
Year of Election or Appointment: 2008
Trustee
Mr. Thomas also serves as Trustee of other Fidelity® funds. Mr. Thomas serves as Non-Executive Chairman of the Board of Directors of Fortune Brands Home and Security (home and security products, 2011-present), as a member of the Board of Directors (2004-present) and Presiding Director (2013-present) of Interpublic Group of Companies, Inc. (marketing communication), and as a member of the Board of Trustees of the University of Florida (2013-present). Previously, Mr. Thomas served as Executive Chairman (2005-2006) and Chairman and Chief Executive Officer (2000-2005) of IMS Health, Inc. (pharmaceutical and healthcare information solutions), and a Director of Fortune Brands, Inc. (consumer products, 2000-2011).
+ The information includes the Trustee's principal occupation during the last five years and other information relating to the experience, attributes, and skills relevant to the Trustee's qualifications to serve as a Trustee, which led to the conclusion that the Trustee should serve as a Trustee for each fund.
Advisory Board Members and Officers:
Correspondence intended for an officer or Peter S. Lynch may be sent to Fidelity Investments, 245 Summer Street, Boston, Massachusetts 02210. Officers appear below in alphabetical order.
Name, Year of Birth; Principal Occupation
Peter S. Lynch (1944)
Year of Election or Appointment: 2003
Member of the Advisory Board
Mr. Lynch also serves as Member of the Advisory Board of other Fidelity® funds. Mr. Lynch is Vice Chairman and a Director of FMR (investment adviser firm) and FMR Co., Inc. (investment adviser firm). In addition, Mr. Lynch serves as a Trustee of Boston College and as the Chairman of the Inner-City Scholarship Fund. Previously, Mr. Lynch served on the Special Olympics International Board of Directors (1997-2006).
Elizabeth Paige Baumann (1968)
Year of Election or Appointment: 2017
Anti-Money Laundering (AML) Officer
Ms. Baumann also serves as AML Officer of other funds. She is Chief AML Officer (2012-present) and Senior Vice President (2014-present) of FMR LLC (diversified financial services company) and is an employee of Fidelity Investments. Previously, Ms. Baumann served as AML Officer of the funds (2012-2016), and Vice President (2007-2014) and Deputy Anti-Money Laundering Officer (2007-2012) of FMR LLC.
Marc R. Bryant (1966)
Year of Election or Appointment: 2015
Secretary and Chief Legal Officer (CLO)
Mr. Bryant also serves as Secretary and CLO of other funds. Mr. Bryant serves as CLO, Secretary, and Senior Vice President of Fidelity Management & Research Company (investment adviser firm, 2015-present) and FMR Co., Inc. (investment adviser firm, 2015-present); Secretary of Fidelity SelectCo, LLC (investment adviser firm, 2015-present) and Fidelity Investments Money Management, Inc. (investment adviser firm, 2015-present); and CLO of Fidelity Management & Research (Hong Kong) Limited and FMR Investment Management (UK) Limited (investment adviser firms, 2015-present) and Fidelity Management & Research (Japan) Limited (investment adviser firm, 2016-present). He is Senior Vice President and Deputy General Counsel of FMR LLC (diversified financial services company). Previously, Mr. Bryant served as Secretary and CLO of Fidelity Rutland Square Trust II (2010-2014) and Assistant Secretary of Fidelity's Fixed Income and Asset Allocation Funds (2013-2015). Prior to joining Fidelity Investments, Mr. Bryant served as a Senior Vice President and the Head of Global Retail Legal for AllianceBernstein L.P. (2006-2010), and as the General Counsel for ProFund Advisors LLC (2001-2006).
William C. Coffey (1969)
Year of Election or Appointment: 2009
Assistant Secretary
Mr. Coffey also serves as Assistant Secretary of other funds. He is Senior Vice President and Deputy General Counsel of FMR LLC (diversified financial services company, 2010-present), and is an employee of Fidelity Investments. Previously, Mr. Coffey served as Vice President and Associate General Counsel of FMR LLC (2005-2009).
Jonathan Davis (1968)
Year of Election or Appointment: 2010
Assistant Treasurer
Mr. Davis also serves as Assistant Treasurer of other funds, and is an employee of Fidelity Investments. Previously, Mr. Davis served as Vice President and Associate General Counsel of FMR LLC (diversified financial services company, 2003-2010).
Adrien E. Deberghes (1967)
Year of Election or Appointment: 2016
Assistant Treasurer
Mr. Deberghes also serves as an officer of other funds. He serves as Executive Vice President of Fidelity Investments Money Management, Inc. (FIMM) (investment adviser firm, 2016-present) and is an employee of Fidelity Investments (2008-present). Prior to joining Fidelity Investments, Mr. Deberghes was Senior Vice President of Mutual Fund Administration at State Street Corporation (2007-2008), Senior Director of Mutual Fund Administration at Investors Bank & Trust (2005-2007), and Director of Finance for Dunkin' Brands (2000-2005). Previously, Mr. Deberghes served in other fund officer roles.
Joseph DeSantis (1959)
Year of Election or Appointment: 2017
Vice President
Mr. DeSantis also serves as Vice President of other funds. Mr. DeSantis serves as a Director of Fidelity Management & Research (Japan) Limited (investment adviser firm, 2016-present), Chief Investment Officer, Equities (2010-present) and is an employee of Fidelity Investments.
Stephanie J. Dorsey (1969)
Year of Election or Appointment: 2010
Assistant Treasurer
Ms. Dorsey also serves as an officer of other funds. She is an employee of Fidelity Investments (2008-present) and has served in other fund officer roles. Prior to joining Fidelity Investments, Ms. Dorsey served as Treasurer (2004-2008) of the JPMorgan Mutual Funds and Vice President (2004-2008) of JPMorgan Chase Bank.
Howard J. Galligan III (1966)
Year of Election or Appointment: 2014
Chief Financial Officer
Mr. Galligan also serves as Chief Financial Officer of other funds. Mr. Galligan serves as President of Fidelity Pricing and Cash Management Services (FPCMS) (2014-present) and as a Director of Strategic Advisers, Inc. (investment adviser firm, 2008-present). Previously, Mr. Galligan served as Chief Administrative Officer of Asset Management (2011-2014) and Chief Operating Officer and Senior Vice President of Investment Support for Strategic Advisers, Inc. (2003-2011).
Brian B. Hogan (1964)
Year of Election or Appointment: 2009
Vice President
Mr. Hogan also serves as Trustee or Vice President of other funds. Mr. Hogan serves as a Director of FMR Investment Management (UK) Limited (investment adviser firm, 2015-present) and Fidelity SelectCo, LLC (investment adviser firm, 2014-present) and President of the Equity Division of FMR (investment adviser firm, 2009-present). Previously, Mr. Hogan served as Senior Vice President, Equity Research of FMR (2006-2009) and as a portfolio manager. Mr. Brian B. Hogan is not related to Mr. Colm A. Hogan.
Colm A. Hogan (1973)
Year of Election or Appointment: 2016
Deputy Treasurer
Mr. Hogan also serves as an officer of other funds. Mr. Hogan is an employee of Fidelity Investments (2005-present). Mr. Colm A. Hogan is not related to Mr. Brian B. Hogan.
Chris Maher (1972)
Year of Election or Appointment: 2013
Assistant Treasurer
Mr. Maher serves as Assistant Treasurer of other funds. Mr. Maher is Vice President of Valuation Oversight and is an employee of Fidelity Investments. Previously, Mr. Maher served as Vice President of Asset Management Compliance (2013), Vice President of the Program Management Group of FMR (investment adviser firm, 2010-2013), and Vice President of Valuation Oversight (2008-2010).
Rieco E. Mello (1969)
Year of Election or Appointment: 2017
Assistant Treasurer
Mr. Mello also serves as Assistant Treasurer of other funds. Mr. Mello is an employee of Fidelity Investments (1995-present).
Kenneth B. Robins (1969)
Year of Election or Appointment: 2016
Chief Compliance Officer
Mr. Robins also serves as an officer of other funds. Mr. Robins serves as Compliance Officer of Fidelity Management & Research Company and FMR Co., Inc. (investment adviser firms, 2016-present) and is an employee of Fidelity Investments (2004-present). Previously, Mr. Robins served as Executive Vice President of Fidelity Investments Money Management, Inc. (investment adviser firm, 2013-2016) and served in other fund officer roles.
Stacie M. Smith (1974)
Year of Election or Appointment: 2016
President and Treasurer
Ms. Smith also serves as an officer of other funds. She is an employee of Fidelity Investments (2009-present) and has served in other fund officer roles. Prior to joining Fidelity Investments, Ms. Smith served as Senior Audit Manager of Ernst & Young LLP (accounting firm, 1996-2009). Previously, Ms. Smith served as Deputy Treasurer of certain Fidelity® funds (2013-2016).
Marc L. Spector (1972)
Year of Election or Appointment: 2016
Assistant Treasurer
Mr. Spector also serves as an officer of other funds. Mr. Spector is an employee of Fidelity Investments (2016-present). Prior to joining Fidelity Investments, Mr. Spector served as Director at the Siegfried Group (accounting firm, 2013-2016), and prior to Siegfried Group as audit senior manager at Deloitte & Touche (accounting firm, 2005-2013).
Renee Stagnone (1975)
Year of Election or Appointment: 2016
Assistant Treasurer
Ms. Stagnone also serves as an officer of other funds. Ms. Stagnone is an employee of Fidelity Investments (1997-present). Previously, Ms. Stagnone served as Deputy Treasurer of certain Fidelity® funds (2013-2016).
Shareholder Expense Example
As a shareholder of a Fund, you incur two types of costs: (1) transaction costs and (2) ongoing costs, including management fees and other Fund expenses. This Example is intended to help you understand your ongoing costs (in dollars) of investing in the Funds and to compare these costs with the ongoing costs of investing in other mutual funds.
The Example is based on an investment of $1,000 invested at the beginning of the period and held for the entire period (May 1, 2017 to October 31, 2017).
Actual Expenses
The first line of the accompanying table provides information about actual account values and actual expenses. You may use the information in this line, together with the amount you invested, to estimate the expenses that you paid over the period. Simply divide your account value by $1,000.00 (for example, an $8,600 account value divided by $1,000.00 = 8.6), then multiply the result by the number in the first line under the heading entitled “Expenses Paid During Period” to estimate the expenses you paid on your account during this period. In addition, each Fund, as a shareholder in the underlying Fidelity Central Funds, will indirectly bear its pro-rata share of the fees and expenses incurred by the underlying Fidelity Central Funds. These fees and expenses are not included in the Fund's annualized expense ratio used to calculate the expense estimate in the table below.
Hypothetical Example for Comparison Purposes
The second line of the accompanying table provides information about hypothetical account values and hypothetical expenses based on each Funds’ actual expense ratio and an assumed rate of return of 5% per year before expenses, which is not the Funds’ actual return. The hypothetical account values and expenses may not be used to estimate the actual ending account balance or expenses you paid for the period. You may use this information to compare the ongoing costs of investing in the Fund and other funds. To do so, compare this 5% hypothetical example with the 5% hypothetical examples that appear in the shareholder reports of the other funds. In addition, each Fund, as a shareholder in the underlying Fidelity Central Funds, will indirectly bear its pro-rata share of the fees and expenses incurred by the underlying Fidelity Central Funds. These fees and expenses are not included in the Fund's annualized expense ratio used to calculate the expense estimate in the table below.
Please note that the expenses shown in the table are meant to highlight your ongoing costs only and do not reflect any transaction costs. Therefore, the second line of the table is useful in comparing ongoing costs only, and will not help you determine the relative total costs of owning different funds.
| | Annualized Expense Ratio-A | Beginning
Account Value
May 1, 2017 | Ending
Account Value
October 31, 2017 | Expenses Paid
During Period-B
May 1, 2017
to October 31, 2017 |
| Fidelity Series Emerging Markets Fund | | | | |
| Series Emerging Markets | .28% | | | |
| Actual | | $1,000.00 | $1,167.90 | $1.53** |
| Hypothetical-C | | $1,000.00 | $1,023.79 | $1.43** |
| Fidelity Series International Growth Fund | | | | |
| Series International Growth | .25% | | | |
| Actual | | $1,000.00 | $1,114.80 | $1.33** |
| Hypothetical-C | | $1,000.00 | $1,023.95 | $1.28** |
| Fidelity Series International Small Cap Fund | | | | |
| Series International Small Cap | .28% | | | |
| Actual | | $1,000.00 | $1,125.80 | $1.50** |
| Hypothetical-C | | $1,000.00 | $1,023.79 | $1.43** |
| Fidelity Series International Value Fund | | | | |
| Series International Value | .23% | | | |
| Actual | | $1,000.00 | $1,090.30 | $1.21** |
| Hypothetical-C | | $1,000.00 | $1,024.05 | $1.17** |
A Annualized expense ratio reflects expenses net of applicable fee waivers.
B Expenses are equal to each Funds' annualized expense ratio, multiplied by the average account value over the period, multiplied by 184/ 365 (to reflect the one-half year period).
C 5% return per year before expenses
** If fees and changes to the Funds’ expense contract and/or expense cap, effective June 1, 2017 had been in effect during the entire period, the annualized expense ratio and the expenses paid in the actual and hypothetical examples above would have been as shown in table below:
| | Annualized Expense Ratio-(a)
| Expenses Paid
|
| Fidelity Series Emerging Markets Fund | | |
| Series Emerging Markets | .01% | |
| Actual | | $.05 |
| Hypothetical-(b) | | $.05 |
| Fidelity Series International Growth Fund | | |
| Series International Growth | .01% | |
| Actual | | $.05 |
| Hypothetical-(b) | | $.05 |
| Fidelity Series International Small Cap Fund | | |
| Series International Small Cap | .01% | |
| Actual | | $.05 |
| Hypothetical-(b) | | $.05 |
| Fidelity Series International Value Fund | | |
| Series International Value | .01% | |
| Actual | | $.05 |
| Hypothetical-(b) | | $.05 |
(a) Annualized expense ratio reflects expenses net of applicable fee waivers.
(b) 5% return per year before expenses
Distributions (Unaudited)
The Board of Trustees of each fund voted to pay to shareholders of record at the opening of business on record date, the following distributions per share derived from capital gains realized from sales of portfolio securities, and dividends derived from net investment income:
| | Pay Date | Record Date | Dividends | Capital Gains |
| Fidelity Series Emerging Markets Fund | 12/18/17 | 12/15/17 | $0.387 | $0.230 |
| Fidelity Series International Growth Fund | 12/18/17 | 12/15/17 | $0.240 | $0.267 |
| Fidelity Series International Small Cap Fund | 12/18/17 | 12/15/17 | $0.285 | $0.848 |
Fidelity Series International Value
Fund | 12/18/17 | 12/15/17 | $0.310 | $0.026 |
|
The funds hereby designate as capital gain dividend the amounts noted below for the taxable year ended October 31, 2017, or, if subsequently determined to be different, the net capital gain of such year.
| Fidelity Series Emerging Markets Fund | $103,684,017 |
| Fidelity Series International Growth Fund | $224,386,012 |
| Fidelity Series International Small Cap Fund | $112,704,467 |
|
A percentage of the dividends distributed during the fiscal year for the following funds qualify for the dividends–received deduction for corporate shareholders:
| | December 16, 2016 |
| Fidelity Series Emerging Markets Fund | |
| Series Emerging Markets | 0% |
| Class F | 0% |
| Fidelity Series International Growth Fund | |
| Series International Growth | 16% |
| Class F | 14% |
| Fidelity Series International Small Cap Fund | |
| Series International Small Cap | 6% |
| Class F | 5% |
| Fidelity Series International Value Fund | |
| Series International Value | 3% |
| Class F | 3% |
|
A percentage of the dividends distributed during the fiscal year for the following funds may be taken into account as a dividend for purposes of the maximum rate under section 1(h)(11) of the Internal Revenue Code.
| | December 16, 2016 |
| Fidelity Series Emerging Markets Fund | |
| Series Emerging Markets | 100% |
| Class F | 100% |
| Fidelity Series International Growth Fund | |
| Series International Growth | 100% |
| Class F | 100% |
| Fidelity Series International Small Cap Fund | |
| Series International Small Cap | 100% |
| Class F | 100% |
| Fidelity Series International Value Fund | |
| Series International Value | 96% |
| Class F | 91% |
|
The funds will notify shareholders in January 2018 of amounts for use in preparing 2017 income tax returns.
Board Approval of Investment Advisory Contracts and Management Fees
Fidelity Series Emerging Markets Fund
Fidelity Series International Growth Fund
Fidelity Series International Small Cap Fund
Fidelity Series International Value Fund
Each year, the Board of Trustees, including the Independent Trustees (together, the Board), votes on the renewal of the management contract with Fidelity Management & Research Company (FMR) and the sub-advisory agreements (together, the Advisory Contracts) for each fund. FMR and the sub-advisers are referred to herein as the Investment Advisers. The Board, assisted by the advice of fund counsel and Independent Trustees' counsel, requests and considers a broad range of information relevant to the renewal of the Advisory Contracts throughout the year.
The Board meets regularly and, at each of its meetings, covers an extensive agenda of topics and materials and considers factors that are relevant to its annual consideration of the renewal of each fund's Advisory Contracts, including the services and support provided to each fund and its shareholders. The Board has established various standing committees (Committees), each composed of and chaired by Independent Trustees with varying backgrounds, to which the Board has assigned specific subject matter responsibilities in order to enhance effective decision-making by the Board. The Board, acting directly and through its Committees, requests and receives information concerning the annual consideration of the renewal of each fund's Advisory Contracts. The Board also meets as needed to review matters specifically related to the Board's annual consideration of the renewal of the Advisory Contracts. Members of the Board may also meet with trustees of other Fidelity funds through ad hoc joint committees to discuss certain matters relevant to all of the Fidelity funds.
At its July 2017 meeting, the Board unanimously determined to renew each fund's Advisory Contracts. In reaching its determination, the Board considered that the Advisory Contracts currently in place had become effective on June 1, 2017 in connection with shareholders of certain other Fidelity funds that invest in the funds (referred to herein as Freedom Funds) voting to approve new management contracts for the Freedom Funds. The Board noted the Advisory Contracts implemented a new fee structure pursuant to which the funds do not pay a management fee to FMR. The Board also approved certain amendments to the sub-advisory agreements for each fund to ensure consistency in the sub-advisory fees paid under the new fee structure compared to the sub-advisory fees paid under the prior fee structure. The Board noted that the amendments will not result in any changes to the nature, extent, and quality of services provided to each fund.
In considering whether to renew the Advisory Contracts for each fund, the Board considered all factors it believed relevant and reached a determination, with the assistance of fund counsel and Independent Trustees' counsel and through the exercise of its business judgment, that the renewal of the Advisory Contracts was in the best interests of each fund and its shareholders and the fact that no fee is payable under the management contracts was fair and reasonable.
Nature, Extent, and Quality of Services Provided. The Board considered Fidelity's staffing as it relates to the funds, including the backgrounds of investment personnel of Fidelity, and also considered the funds' investment objectives, strategies, and related investment philosophies. The Independent Trustees also had discussions with senior management of Fidelity's investment operations and investment groups. The Board considered the structure of the investment personnel compensation program and whether this structure provides appropriate incentives to act in the best interests of each fund.
Resources Dedicated to Investment Management and Support Services. The Board and the Fund Oversight and Research Committees reviewed the general qualifications and capabilities of Fidelity's investment staff, including its size, education, experience, and resources, as well as Fidelity's approach to recruiting, training, managing, and compensating investment personnel. The Board noted that Fidelity has continued to increase the resources devoted to non-U.S. offices, including expansion of Fidelity's global investment organization. The Board also noted that Fidelity's analysts have extensive resources, tools and capabilities that allow them to conduct sophisticated quantitative and fundamental analysis, as well as credit analysis of issuers, counterparties and guarantors. Further, the Board considered that Fidelity's investment professionals have sufficient access to global information and data so as to provide competitive investment results over time, and that those professionals also have access to sophisticated tools that permit them to assess portfolio construction and risk and performance attribution characteristics continuously, as well as to transmit new information and research conclusions rapidly around the world. Additionally, in its deliberations, the Board considered Fidelity's trading, risk management, compliance, and technology and operations capabilities and resources, which are integral parts of the investment management process.
Administrative Services. The Board considered (i) the nature, extent, quality, and cost of advisory and administrative services performed by the Investment Advisers and their affiliates under the Advisory Contracts and under separate agreements covering transfer agency, pricing and bookkeeping, and securities lending services for each fund; (ii) the nature and extent of the supervision of third party service providers, principally custodians, subcustodians, and pricing vendors; and (iii) the resources devoted to, and the record of compliance with, each fund's compliance policies and procedures. The Board also reviewed the allocation of fund brokerage, including allocations to brokers affiliated with the Investment Advisers, the use of brokerage commissions to pay fund expenses, and the use of "soft" commission dollars to pay for research services.
Investment Performance. The Board considered whether each fund has operated in accordance with its investment objective, as well as its record of compliance with its investment restrictions. The Board reviewed each fund's absolute investment performance, as well as each fund's relative investment performance, but did not consider performance to be a material factor in its decision to renew each fund's Advisory Contracts, as the funds are not publicly offered as stand-alone investment products. In this regard, the Board noted that each fund is designed to offer an investment option for other investment companies managed by Fidelity and ultimately to enhance the performance of those investment companies.
Based on its review, the Board concluded that the nature, extent, and quality of services provided to each fund under the Advisory Contracts should continue to benefit the shareholders of each fund.
Competitiveness of Management Fee and Total Expense Ratio. The Board considered that each fund does not pay FMR a management fee for investment advisory services. The Board also noted that FMR or an affiliate undertakes to pay all operating expenses of each fund, except transfer agent fees, 12b-1 fees, Independent Trustee fees and expenses, custodian fees and expenses, proxy and shareholder meeting expenses, interest, taxes, brokerage expenses, and extraordinary expenses (such as litigation expenses).
The Board further considered that, effective June 1, 2017, FMR has contractually agreed to reimburse each fund to the extent that total operating expenses (excluding interest, certain taxes, certain securities lending costs, brokerage commissions, fees and expenses of the Independent Trustees, proxy and shareholder meeting expenses, extraordinary expenses, and acquired fund fees and expenses, if any), as a percentage of its average net assets, exceed 0.014% through December 31, 2020.
Based on its review, the Board considered that each fund does not pay a management fee and concluded that the total expense ratio of each class of each fund was reasonable in light of the services that the fund and its shareholders receive and the other factors considered.
Costs of the Services and Profitability. The Board considered the level of Fidelity's profits in respect of all the Fidelity funds.
PricewaterhouseCoopers LLP (PwC), independent registered public accounting firm and auditor to Fidelity and certain Fidelity funds, has been engaged annually by the Board as part of the Board's assessment of Fidelity's profitability analysis. PwC's engagement includes the review and assessment of the methodologies used by Fidelity in determining the revenues and expenses attributable to Fidelity's mutual fund business, and completion of agreed-upon procedures in respect of the mathematical accuracy of the fund profitability information and its conformity to established allocation methodologies. After considering PwC's reports issued under the engagement and information provided by Fidelity, the Board concluded that while other allocation methods may also be reasonable, Fidelity's profitability methodologies are reasonable in all material respects.
The Board also reviewed Fidelity's non-fund businesses and potential fall-out benefits related to the mutual fund business as well as cases where Fidelity's affiliates may benefit from or be related to the funds' business.
The Board concluded that the costs of the services provided by and the profits realized by Fidelity in connection with the operation of each fund were not relevant to the renewal of the Advisory Contracts because each fund pays no advisory fees and FMR or an affiliate bears all expenses of each fund, with limited exceptions.
Economies of Scale. The Board concluded that because each fund pays no advisory fees and FMR or an affiliate bears all expenses of each fund, with limited exceptions, economies of scale cannot be realized by the funds.
Additional Information Requested by the Board. In order to develop fully the factual basis for consideration of the Fidelity funds' advisory contracts, the Board requested and received additional information on certain topics, including: (i) fund performance trends, in particular the underperformance of certain funds, and Fidelity's long-term strategies for certain funds; (ii) Fidelity's fund profitability methodology, profitability trends for certain funds, and the impact of certain factors on fund profitability results, including the impact of market trends on actively managed funds; (iii) the use of performance fees and the calculation of performance adjustments, including the impact of underperformance and fund outflows on performance adjustments; (iv) metrics for evaluating index fund performance; (v) Fidelity's group fee structure, including the group fee breakpoint schedules; (vi) the terms of Fidelity's contractual and voluntary expense cap arrangements with the funds; (vii) the methodology with respect to evaluating competitive fund data and peer group classifications and fee comparisons; (viii) the expense structures for different funds and classes; (ix) Fidelity's arrangements with affiliated sub-advisers on behalf of the funds; (x) information regarding other accounts managed by Fidelity, including institutional accounts and collective investment trusts; (xi) recent changes to the fee structure for certain funds of funds; and (xii) the impact of the Department of Labor's new fiduciary rule on the funds' comparative expense information.
Based on its evaluation of all of the conclusions noted above, and after considering all factors it believed relevant, the Board concluded that the advisory fee structures are fair and reasonable, and that each fund's Advisory Contracts should be renewed.
GSV-S-ANN-1217
1.907943.107
Fidelity Advisor® International Small Cap Fund - Class A, Class M (formerly Class T), Class C and Class I
Annual Report October 31, 2017 Class A, Class M, Class C and Class I are classes of Fidelity® International Small Cap Fund |
|
Contents
To view a fund's proxy voting guidelines and proxy voting record for the 12-month period ended June 30, visit http://www.fidelity.com/proxyvotingresults or visit the Securities and Exchange Commission's (SEC) web site at http://www.sec.gov.
You may also call 1-877-208-0098 to request a free copy of the proxy voting guidelines.
Standard & Poor's, S&P and S&P 500 are registered service marks of The McGraw-Hill Companies, Inc. and have been licensed for use by Fidelity Distributors Corporation.
Other third-party marks appearing herein are the property of their respective owners.
All other marks appearing herein are registered or unregistered trademarks or service marks of FMR LLC or an affiliated company. © 2017 FMR LLC. All rights reserved.
This report and the financial statements contained herein are submitted for the general information of the shareholders of the Fund. This report is not authorized for distribution to prospective investors in the Fund unless preceded or accompanied by an effective prospectus.
A fund files its complete schedule of portfolio holdings with the SEC for the first and third quarters of each fiscal year on Form N-Q. Forms N-Q are available on the SEC’s web site at http://www.sec.gov. A fund's Forms N-Q may be reviewed and copied at the SEC’s Public Reference Room in Washington, DC. Information regarding the operation of the SEC's Public Reference Room may be obtained by calling 1-800-SEC-0330.
For a complete list of a fund's portfolio holdings, view the most recent holdings listing, semiannual report, or annual report on Fidelity's web site at http://www.fidelity.com, http://www.institutional.fidelity.com, or http://www.401k.com, as applicable.
NOT FDIC INSURED •MAY LOSE VALUE •NO BANK GUARANTEE
Neither the Fund nor Fidelity Distributors Corporation is a bank.
Performance: The Bottom Line
Average annual total return reflects the change in the value of an investment, assuming reinvestment of distributions from dividend income and capital gains (the profits earned upon the sale of securities that have grown in value, if any) and assuming a constant rate of performance each year. The hypothetical investment and the average annual total returns do not reflect the deduction of taxes that a shareholder would pay on fund distributions or the redemption of fund shares. During periods of reimbursement by Fidelity, a fund’s total return will be greater than it would be had the reimbursement not occurred. How a fund did yesterday is no guarantee of how it will do tomorrow.
Average Annual Total Returns
| For the periods ended October 31, 2017 | Past 1 year | Past 5 years | Past 10 years |
| Class A (incl. 5.75% sales charge) | 18.59% | 12.72% | 4.26% |
| Class M (incl. 3.50% sales charge) | 21.08% | 12.94% | 4.24% |
| Class C (incl. contingent deferred sales charge) | 23.85% | 13.20% | 4.10% |
| Class I | 26.17% | 14.46% | 5.23% |
Class C shares' contingent deferred sales charges included in the past one year, past five years and past ten years total return figures are 1%, 0% and 0%, respectively.
$10,000 Over 10 Years
Let's say hypothetically that $10,000 was invested in Fidelity Advisor® International Small Cap Fund - Class A on October 31, 2007, and the current 5.75% sales charge was paid.
The chart shows how the value of your investment would have changed, and also shows how the MSCI ACWI (All Country World Index) ex USA Small Cap Index performed over the same period.
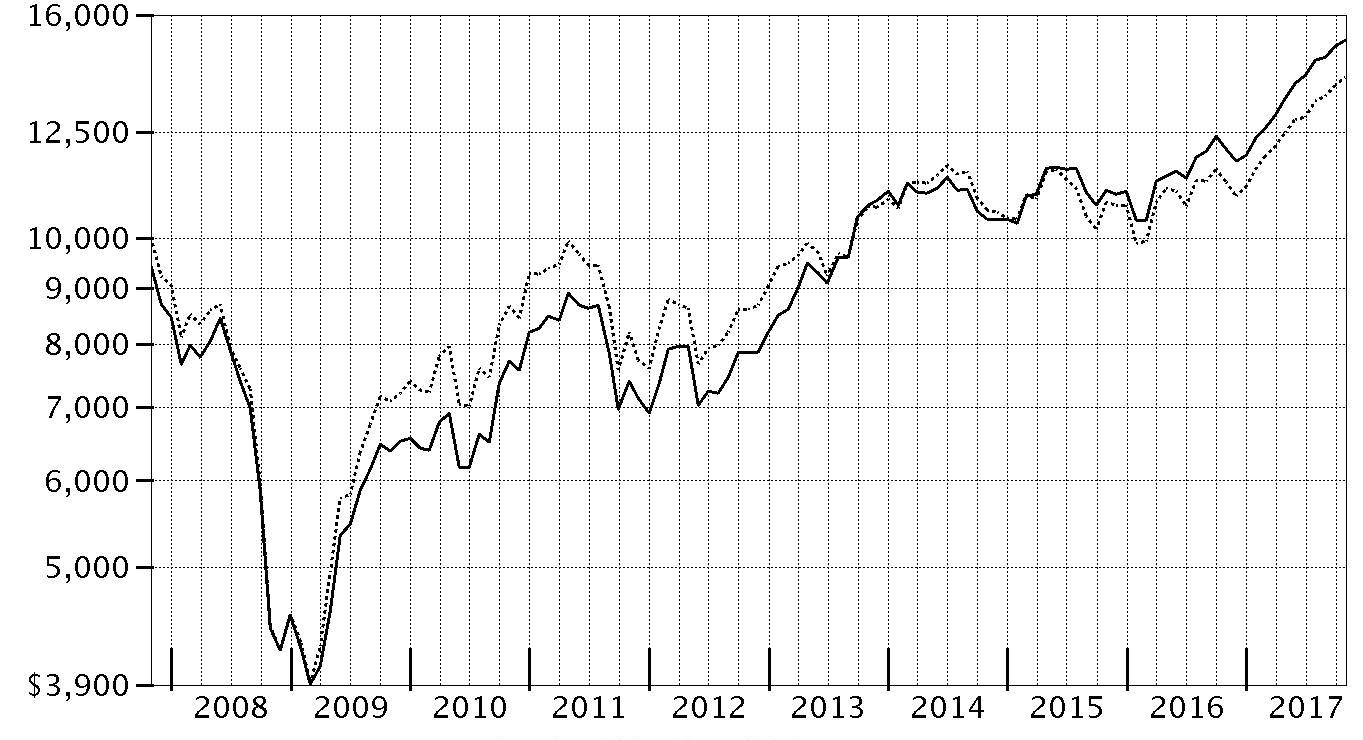
| Period Ending Values |
| $15,181 | Fidelity Advisor® International Small Cap Fund - Class A |
| $14,044 | MSCI ACWI (All Country World Index) ex USA Small Cap Index |
Management's Discussion of Fund Performance
Market Recap: The MSCI ACWI (All Country World Index) ex USA Index returned 23.85% for the 12 months ending October 31, 2017, helped partly by a generally weak U.S. dollar. Some favorable election results in continental Europe (+30%) suggested ebbing political uncertainty and near-term risk there, but the U.K. (+20%) faced more-mixed conditions ahead of its expected exit from the European Union. Despite central-bank easing – and pressured recently by yen strength – Japan (+18%) lagged the rest of the Asia-Pacific group (+22%). Commodity-price volatility slowed Canada (+17%), but the emerging-markets group (+26%) sped ahead. Sector-wise, information technology (+47%) was driven by a surge among several Chinese internet-related names. Financials (+27%) rode rising interest rates that, at the same time, weighed on real estate (+17%), utilities (+16%), consumer staples (+14%) and telecommunication services (+9%) – so-called “bond proxy” sectors. Materials (+28%) and industrials (+27%) responded to demand from China and price gains for certain commodities. In the energy sector (+20%), oil prices lost ground in the spring before rebounding through October 31 to end well above where they started 12 months ago. Lastly, health care (+14%) was hurt by early-period turmoil around drug pricing and health care legislation.
Comments from Portfolio Manager Samuel Chamovitz: For the year, the fund’s share classes (excluding sales charges, if applicable) posted gains in the range of roughly 25% to 26%, generally topping the 24.85% advance of the benchmark MSCI ACWI (All Country World Index) ex USA Small Cap Index. Stock picks in the industrials and consumer discretionary sectors aided relative performance the most. Overall, active management added value in eight of 11 market sectors this period. Geographically, stock picking in Japan contributed meaningfully. As a group, emerging markets also positively influenced the return. A sizable overweighting in Taiwan-based Yageo, maker of resistors and other so-called passive electrical components, helped the relative return more than any other individual holding. Other contributors included Brazil-based for-profit education provider Estacio Participacoes and Programmed Maintenance Services, an Australia-based company providing facilities maintenance that I sold by period end. Conversely, positioning in information technology and health care detracted, as did a roughly 5% cash position, on average. Among countries, positioning in Germany, the U.K. and Finland worked against us. Petra Diamonds, where we had a large overweighting, was the fund’s biggest relative detractor. The fund's overweighted exposure to U.K.-based real estate brokerage Countrywide and to Oriola, a Finland-based drug distributor, also hurt relative results.
The views expressed above reflect those of the portfolio manager(s) only through the end of the period as stated on the cover of this report and do not necessarily represent the views of Fidelity or any other person in the Fidelity organization. Any such views are subject to change at any time based upon market or other conditions and Fidelity disclaims any responsibility to update such views. These views may not be relied on as investment advice and, because investment decisions for a Fidelity fund are based on numerous factors, may not be relied on as an indication of trading intent on behalf of any Fidelity fund.
Investment Summary (Unaudited)
Geographic Diversification (% of fund's net assets)
| As of October 31, 2017 |
| | Japan | 20.2% |
| | United Kingdom | 15.5% |
| | Canada | 5.3% |
| | United States of America* | 5.1% |
| | Australia | 5.1% |
| | Taiwan | 4.2% |
| | France | 4.0% |
| | Cayman Islands | 3.8% |
| | Netherlands | 3.5% |
| | Other | 33.3% |
* Includes Short-Term investments and Net Other Assets (Liabilities).
Percentages are based on country or territory of incorporation and are adjusted for the effect of futures contracts, if applicable.
| As of April 30, 2017 |
| | Japan | 20.1% |
| | United Kingdom | 15.0% |
| | United States of America* | 5.6% |
| | Canada | 5.0% |
| | Australia | 4.9% |
| | Cayman Islands | 3.7% |
| | France | 3.5% |
| | Austria | 3.3% |
| | Finland | 3.0% |
| | Other | 35.9% |

* Includes Short-Term investments and Net Other Assets (Liabilities).
Percentages are based on country or territory of incorporation and are adjusted for the effect of futures contracts, if applicable.
Asset Allocation as of October 31, 2017
| | % of fund's net assets | % of fund's net assets 6 months ago |
| Stocks | 94.9 | 94.8 |
| Short-Term Investments and Net Other Assets (Liabilities) | 5.1 | 5.2 |
Top Ten Stocks as of October 31, 2017
| | % of fund's net assets | % of fund's net assets 6 months ago |
| Micro Focus International PLC (United Kingdom, Software) | 1.1 | 1.2 |
| John Wood Group PLC (United Kingdom, Energy Equipment & Services) | 1.0 | 0.6 |
| JSR Corp. (Japan, Chemicals) | 1.0 | 0.9 |
| LivaNova PLC (United Kingdom, Health Care Equipment & Supplies) | 0.9 | 0.8 |
| S Foods, Inc. (Japan, Food Products) | 0.9 | 0.9 |
| Iida Group Holdings Co. Ltd. (Japan, Household Durables) | 0.8 | 0.6 |
| McColl's Retail Group PLC (United Kingdom, Food & Staples Retailing) | 0.8 | 0.6 |
| PALTAC Corp. (Japan, Distributors) | 0.8 | 0.5 |
| SITC International Holdings Co. Ltd. (Cayman Islands, Marine) | 0.8 | 0.8 |
| Mears Group PLC (United Kingdom, Commercial Services & Supplies) | 0.8 | 0.7 |
| | 8.9 | |
Top Market Sectors as of October 31, 2017
| | % of fund's net assets | % of fund's net assets 6 months ago |
| Industrials | 19.0 | 18.3 |
| Consumer Discretionary | 17.0 | 17.2 |
| Financials | 12.2 | 12.7 |
| Information Technology | 10.3 | 9.3 |
| Materials | 9.7 | 9.8 |
| Consumer Staples | 8.6 | 8.8 |
| Health Care | 7.9 | 8.6 |
| Real Estate | 6.1 | 6.1 |
| Energy | 3.8 | 3.7 |
| Utilities | 0.3 | 0.3 |
Investments October 31, 2017
Showing Percentage of Net Assets
| Common Stocks - 93.8% | | | |
| | | Shares | Value |
| Australia - 5.1% | | | |
| Aub Group Ltd. | | 681,041 | $6,895,935 |
| Austal Ltd. | | 5,521,804 | 7,459,089 |
| Challenger Ltd. | | 576,380 | 5,867,061 |
| GUD Holdings Ltd. | | 1,220,600 | 11,154,183 |
| Imdex Ltd. (a) | | 15,668,852 | 11,632,391 |
| Life Healthcare Group Ltd. | | 2,219,795 | 4,502,138 |
| Nanosonics Ltd. (a) | | 3,352,347 | 7,697,156 |
| Pact Group Holdings Ltd. | | 2,384,465 | 10,584,712 |
| Reckon Ltd. | | 4,332,829 | 4,128,583 |
| Servcorp Ltd. | | 1,818,739 | 7,753,283 |
| Sigma Healthcare Ltd. | | 13,905,982 | 8,035,422 |
| SomnoMed Ltd. (a)(b) | | 1,267,444 | 3,521,239 |
|
| TOTAL AUSTRALIA | | | 89,231,192 |
|
| Austria - 2.5% | | | |
| Andritz AG | | 179,532 | 10,151,066 |
| BUWOG-Gemeinnuetzige Wohnung | | 422,446 | 12,184,055 |
| IMMOFINANZ Immobilien Anlagen AG | | 4,431,943 | 11,207,893 |
| Wienerberger AG | | 435,600 | 11,193,435 |
|
| TOTAL AUSTRIA | | | 44,736,449 |
|
| Bailiwick of Jersey - 0.4% | | | |
| IWG PLC | | 2,744,800 | 7,852,420 |
| Belgium - 0.5% | | | |
| Barco NV | | 94,183 | 9,644,524 |
| Bermuda - 1.4% | | | |
| BW Offshore Ltd. (a) | | 1,659,938 | 5,446,418 |
| Hiscox Ltd. | | 599,099 | 11,362,501 |
| Petra Diamonds Ltd. (a) | | 8,480,474 | 8,672,773 |
|
| TOTAL BERMUDA | | | 25,481,692 |
|
| Brazil - 0.9% | | | |
| Estacio Participacoes SA | | 1,487,100 | 13,333,122 |
| Sul America SA unit | | 331,900 | 1,819,144 |
|
| TOTAL BRAZIL | | | 15,152,266 |
|
| British Virgin Islands - 0.3% | | | |
| Gem Diamonds Ltd. (a) | | 4,248,962 | 4,514,607 |
| Canada - 5.3% | | | |
| AutoCanada, Inc. (b) | | 552,484 | 9,982,484 |
| Dorel Industries, Inc. Class B (sub. vtg.) | | 353,403 | 9,215,159 |
| Genesis Land Development Corp. | | 2,038,722 | 6,005,072 |
| Lassonde Industries, Inc. Class A (sub. vtg.) | | 55,569 | 10,552,984 |
| McCoy Global, Inc. (a) | | 1,341,170 | 1,881,651 |
| North West Co., Inc. | | 384,500 | 9,382,265 |
| Open Text Corp. | | 284,996 | 9,965,250 |
| Total Energy Services, Inc. | | 524,980 | 6,181,262 |
| TransForce, Inc. | | 364,300 | 8,793,351 |
| Western Forest Products, Inc. | | 5,000,600 | 10,155,470 |
| Whitecap Resources, Inc. | | 1,496,253 | 10,739,712 |
|
| TOTAL CANADA | | | 92,854,660 |
|
| Cayman Islands - 3.8% | | | |
| AMVIG Holdings Ltd. | | 23,634,000 | 6,695,098 |
| Best Pacific International Holdings Ltd. (b) | | 13,900,000 | 8,053,426 |
| China High Precision Automation Group Ltd. (a)(c) | | 712,000 | 1 |
| China Metal Recycling (Holdings) Ltd. (a)(c) | | 436,800 | 1 |
| Haitian International Holdings Ltd. | | 2,192,000 | 6,560,771 |
| Pico Far East Holdings Ltd. | | 20,466,000 | 8,657,138 |
| Precision Tsugami China Corp. Ltd. | | 4,200,000 | 4,360,756 |
| SITC International Holdings Co. Ltd. | | 14,024,000 | 13,518,148 |
| Value Partners Group Ltd. (b) | | 9,903,000 | 9,812,366 |
| Xingda International Holdings Ltd. | | 22,589,629 | 8,628,848 |
|
| TOTAL CAYMAN ISLANDS | | | 66,286,553 |
|
| Chile - 0.7% | | | |
| Quinenco SA | | 2,326,244 | 7,200,775 |
| Vina San Pedro SA | | 394,698,308 | 4,403,108 |
|
| TOTAL CHILE | | | 11,603,883 |
|
| China - 1.1% | | | |
| Qingdao Port International Co. Ltd. | | 15,265,000 | 10,781,417 |
| Weifu High-Technology Co. Ltd. (B Shares) | | 3,747,554 | 8,814,779 |
|
| TOTAL CHINA | | | 19,596,196 |
|
| Denmark - 1.1% | | | |
| Jyske Bank A/S (Reg.) | | 162,703 | 9,194,346 |
| Scandinavian Tobacco Group A/S | | 609,715 | 10,307,865 |
|
| TOTAL DENMARK | | | 19,502,211 |
|
| Finland - 2.7% | | | |
| Amer Group PLC (A Shares) | | 417,245 | 10,386,415 |
| Asiakastieto Group Oyj | | 404,523 | 10,743,556 |
| Cramo Oyj (B Shares) | | 280,810 | 6,234,555 |
| Olvi PLC (A Shares) | | 231,238 | 7,555,480 |
| Oriola-KD Oyj | | 1,925,400 | 7,221,823 |
| Tikkurila Oyj | | 298,465 | 5,899,908 |
|
| TOTAL FINLAND | | | 48,041,737 |
|
| France - 4.0% | | | |
| Altarea SCA | | 48,130 | 10,834,413 |
| Elis SA (b) | | 405,700 | 10,583,421 |
| Maisons du Monde SA | | 176,717 | 7,647,283 |
| Rexel SA | | 547,200 | 9,768,246 |
| The Vicat Group | | 154,056 | 11,917,416 |
| Thermador Groupe SA | | 64,683 | 7,906,055 |
| Wendel SA | | 71,635 | 12,082,696 |
|
| TOTAL FRANCE | | | 70,739,530 |
|
| Germany - 0.4% | | | |
| SHW Group | | 182,639 | 7,245,100 |
| Greece - 0.6% | | | |
| Mytilineos Holdings SA (a) | | 1,028,516 | 10,770,621 |
| Hong Kong - 2.5% | | | |
| Dah Sing Banking Group Ltd. | | 5,004,400 | 11,071,852 |
| Far East Horizon Ltd. | | 7,833,000 | 7,781,392 |
| Magnificent Hotel Investment Ltd. | | 187,662,000 | 5,652,905 |
| Sino Land Ltd. | | 6,190,440 | 10,664,690 |
| Techtronic Industries Co. Ltd. | | 1,423,000 | 8,344,945 |
|
| TOTAL HONG KONG | | | 43,515,784 |
|
| India - 0.7% | | | |
| PC Jeweller Ltd. | | 1,088,000 | 5,894,524 |
| Torrent Pharmaceuticals Ltd. | | 366,773 | 7,192,999 |
|
| TOTAL INDIA | | | 13,087,523 |
|
| Indonesia - 0.6% | | | |
| PT ACE Hardware Indonesia Tbk | | 71,443,900 | 6,611,030 |
| PT Media Nusantara Citra Tbk | | 38,452,100 | 4,422,877 |
|
| TOTAL INDONESIA | | | 11,033,907 |
|
| Ireland - 1.5% | | | |
| Mincon Group PLC | | 6,351,743 | 7,842,758 |
| Origin Enterprises PLC | | 920,300 | 7,289,678 |
| United Drug PLC (United Kingdom) | | 872,449 | 10,712,580 |
|
| TOTAL IRELAND | | | 25,845,016 |
|
| Isle of Man - 0.7% | | | |
| Playtech Ltd. | | 942,487 | 12,317,359 |
| Israel - 0.7% | | | |
| Frutarom Industries Ltd. | | 159,889 | 13,163,456 |
| Italy - 0.9% | | | |
| Banca Generali SpA | | 290,200 | 9,559,756 |
| Banco di Desio e della Brianza SpA | | 2,124,136 | 6,062,035 |
|
| TOTAL ITALY | | | 15,621,791 |
|
| Japan - 20.2% | | | |
| A/S One Corp. | | 154,400 | 8,488,553 |
| Aeon Delight Co. Ltd. | | 289,900 | 10,851,548 |
| Arc Land Sakamoto Co. Ltd. | | 653,200 | 10,676,382 |
| Aucnet, Inc. | | 336,200 | 4,446,060 |
| Broadleaf Co. Ltd. | | 819,600 | 6,729,056 |
| Central Automotive Products Ltd. | | 339,100 | 5,518,006 |
| Daiwa Industries Ltd. | | 488,300 | 5,485,160 |
| Dexerials Corp. | | 882,500 | 9,944,046 |
| Fuji Corp. | | 149,100 | 2,789,944 |
| Funai Soken Holdings, Inc. | | 198,120 | 7,279,200 |
| GMO Internet, Inc. | | 620,600 | 9,587,841 |
| Iida Group Holdings Co. Ltd. | | 758,851 | 14,557,275 |
| Isuzu Motors Ltd. | | 726,400 | 10,609,367 |
| Japan Meat Co. Ltd. | | 452,000 | 7,230,043 |
| JSR Corp. | | 888,700 | 17,227,334 |
| Kirindo Holdings Co. Ltd. (d) | | 627,000 | 8,403,137 |
| Kotobuki Spirits Co. Ltd. (b) | | 137,000 | 5,638,889 |
| Meitec Corp. | | 198,300 | 9,686,447 |
| Minebea Mitsumi, Inc. | | 323,400 | 5,928,930 |
| Mitani Shoji Co. Ltd. | | 257,100 | 10,196,120 |
| Morinaga & Co. Ltd. | | 175,200 | 9,953,075 |
| Nihon Parkerizing Co. Ltd. | | 715,000 | 11,721,175 |
| Nitori Holdings Co. Ltd. | | 37,100 | 5,391,793 |
| Otsuka Corp. | | 119,200 | 8,125,686 |
| PALTAC Corp. | | 347,100 | 13,785,438 |
| Paramount Bed Holdings Co. Ltd. | | 294,700 | 12,996,022 |
| Renesas Electronics Corp. (a) | | 670,300 | 8,666,370 |
| Ricoh Leasing Co. Ltd. | | 186,900 | 6,716,351 |
| S Foods, Inc. | | 396,300 | 15,071,430 |
| San-Ai Oil Co. Ltd. | | 737,100 | 8,803,568 |
| Shinsei Bank Ltd. | | 643,400 | 10,857,870 |
| Ship Healthcare Holdings, Inc. | | 371,900 | 11,630,018 |
| TKC Corp. | | 242,200 | 7,623,425 |
| Toshiba Plant Systems & Services Corp. | | 750,900 | 12,952,567 |
| Tsuruha Holdings, Inc. | | 100,600 | 12,472,654 |
| VT Holdings Co. Ltd. | | 1,252,000 | 6,815,416 |
| Welcia Holdings Co. Ltd. | | 216,300 | 8,209,065 |
| Yamada Consulting Group Co. Ltd. (b) | | 681,580 | 13,167,714 |
|
| TOTAL JAPAN | | | 356,232,975 |
|
| Korea (South) - 1.8% | | | |
| BGFretail Co. Ltd. (c) | | 88,758 | 6,279,242 |
| Hy-Lok Corp. | | 132,477 | 2,926,582 |
| Hyundai Fire & Marine Insurance Co. Ltd. | | 234,807 | 9,523,829 |
| Hyundai Mipo Dockyard Co. Ltd. (a) | | 77,708 | 7,540,822 |
| NS Shopping Co. Ltd. | | 455,325 | 6,128,882 |
|
| TOTAL KOREA (SOUTH) | | | 32,399,357 |
|
| Luxembourg - 0.3% | | | |
| SAF-Holland SA | | 302,900 | 5,999,926 |
| Mexico - 1.0% | | | |
| Credito Real S.A.B. de CV | | 5,034,200 | 8,071,840 |
| Genomma Lab Internacional SA de CV (a) | | 8,144,900 | 9,503,640 |
|
| TOTAL MEXICO | | | 17,575,480 |
|
| Netherlands - 3.5% | | | |
| Amsterdam Commodities NV | | 287,255 | 8,059,057 |
| Arcadis NV | | 324,689 | 7,507,548 |
| Basic-Fit NV (a) | | 379,800 | 8,722,114 |
| BinckBank NV | | 1,088,658 | 5,548,039 |
| IMCD Group BV | | 156,000 | 9,812,696 |
| Philips Lighting NV | | 270,500 | 10,248,365 |
| RHI Magnesita NV | | 268,710 | 11,236,946 |
|
| TOTAL NETHERLANDS | | | 61,134,765 |
|
| New Zealand - 0.9% | | | |
| Air New Zealand Ltd. | | 3,371,740 | 7,614,030 |
| EBOS Group Ltd. | | 740,450 | 8,917,743 |
|
| TOTAL NEW ZEALAND | | | 16,531,773 |
|
| Norway - 0.8% | | | |
| ABG Sundal Collier ASA | | 9,028,610 | 6,256,358 |
| Ekornes A/S | | 533,899 | 7,484,260 |
|
| TOTAL NORWAY | | | 13,740,618 |
|
| Philippines - 0.3% | | | |
| Century Pacific Food, Inc. | | 15,141,700 | 4,461,599 |
| Romania - 0.4% | | | |
| Banca Transilvania SA | | 13,456,284 | 7,490,846 |
| Singapore - 1.6% | | | |
| Boustead Singapore Ltd. | | 7,623,069 | 5,033,205 |
| Hour Glass Ltd. | | 8,112,100 | 4,046,826 |
| Mapletree Industrial (REIT) | | 6,087,794 | 8,664,310 |
| Wing Tai Holdings Ltd. | | 6,441,400 | 11,341,325 |
|
| TOTAL SINGAPORE | | | 29,085,666 |
|
| South Africa - 0.5% | | | |
| Clicks Group Ltd. | | 726,051 | 8,135,674 |
| Spain - 0.6% | | | |
| Hispania Activos Inmobiliarios SA | | 594,185 | 10,247,079 |
| Sweden - 1.4% | | | |
| Addlife AB | | 99,154 | 1,954,264 |
| AddTech AB (B Shares) | | 306,019 | 6,780,805 |
| Coor Service Management Holding AB | | 631,700 | 4,980,165 |
| Granges AB | | 1,037,021 | 10,745,979 |
|
| TOTAL SWEDEN | | | 24,461,213 |
|
| Switzerland - 0.5% | | | |
| Vontobel Holdings AG | | 152,905 | 9,510,104 |
| Taiwan - 4.2% | | | |
| King's Town Bank | | 5,554,000 | 6,072,211 |
| Lumax International Corp. Ltd. | | 4,027,600 | 7,697,583 |
| Makalot Industrial Co. Ltd. | | 2,170,540 | 10,046,796 |
| Micro-Star International Co. Ltd. | | 3,074,000 | 7,496,815 |
| Test Research, Inc. | | 4,131,000 | 5,756,918 |
| Tripod Technology Corp. | | 2,865,000 | 10,551,961 |
| United Microelectronics Corp. | | 17,285,000 | 8,927,242 |
| Yageo Corp. | | 1,517,457 | 12,058,894 |
| Yung Chi Paint & Varnish Manufacturing Co. Ltd. | | 1,872,000 | 4,938,085 |
|
| TOTAL TAIWAN | | | 73,546,505 |
|
| Thailand - 1.6% | | | |
| Delta Electronics PCL (For. Reg.) | | 2,983,800 | 7,724,467 |
| Star Petroleum Refining PCL | | 20,830,300 | 10,910,512 |
| TISCO Financial Group PCL | | 3,363,400 | 8,884,357 |
|
| TOTAL THAILAND | | | 27,519,336 |
|
| Turkey - 0.3% | | | |
| Aygaz A/S | | 1,273,000 | 5,406,026 |
| United Kingdom - 15.5% | | | |
| AEW UK REIT PLC (b) | | 4,299,768 | 5,796,398 |
| Alliance Pharma PLC | | 8,828,765 | 7,006,240 |
| Bond International Software PLC (a)(c) | | 899,666 | 12 |
| Cineworld Group PLC | | 564,776 | 4,984,463 |
| Close Brothers Group PLC | | 397,980 | 7,341,936 |
| Countrywide PLC (b) | | 5,028,907 | 8,332,231 |
| Diploma PLC | | 362,851 | 5,199,923 |
| Elementis PLC | | 2,605,500 | 9,838,187 |
| Empiric Student Property PLC | | 4,048,310 | 5,228,902 |
| Essentra PLC | | 1,150,455 | 8,128,837 |
| Indivior PLC (a) | | 1,571,500 | 7,755,990 |
| Informa PLC | | 1,270,341 | 11,759,808 |
| ITE Group PLC | | 3,302,019 | 7,795,362 |
| James Fisher and Sons PLC | | 228,000 | 4,711,851 |
| Jardine Lloyd Thompson Group PLC | | 445,940 | 7,717,346 |
| John Wood Group PLC | | 1,887,400 | 17,835,529 |
| LivaNova PLC (a) | | 220,900 | 16,324,510 |
| Luxfer Holdings PLC sponsored ADR | | 970,009 | 12,008,711 |
| McColl's Retail Group PLC | | 3,753,081 | 14,243,650 |
| Mears Group PLC | | 2,236,510 | 13,463,432 |
| Melrose Industries PLC | | 2,680,650 | 7,829,111 |
| Micro Focus International PLC | | 567,640 | 19,940,949 |
| PayPoint PLC | | 455,211 | 5,553,145 |
| Sinclair Pharma PLC (a) | | 16,601,028 | 6,449,232 |
| Spectris PLC | | 251,690 | 8,557,621 |
| Ten Entertainment Group PLC (d) | | 3,545,819 | 10,172,260 |
| The Restaurant Group PLC | | 761,100 | 3,069,967 |
| Topps Tiles PLC | | 5,534,175 | 5,126,775 |
| Tullett Prebon PLC | | 1,677,600 | 12,132,029 |
| Ultra Electronics Holdings PLC | | 399,497 | 9,677,997 |
| Volution Group PLC | | 3,328,300 | 9,327,216 |
|
| TOTAL UNITED KINGDOM | | | 273,309,620 |
|
| TOTAL COMMON STOCKS | | | |
| (Cost $1,353,262,021) | | | 1,654,627,039 |
|
| Nonconvertible Preferred Stocks - 1.1% | | | |
| Brazil - 1.1% | | | |
| Alpargatas SA (PN) | | 1,788,400 | 9,457,806 |
| Banco ABC Brasil SA | | 1,704,022 | 9,350,165 |
| TOTAL NONCONVERTIBLE PREFERRED STOCKS | | | |
| (Cost $12,349,925) | | | 18,807,971 |
|
| Money Market Funds - 4.8% | | | |
| Fidelity Cash Central Fund, 1.10% (e) | | 80,047,770 | 80,063,780 |
| Fidelity Securities Lending Cash Central Fund 1.11% (e)(f) | | 4,733,258 | 4,733,731 |
| TOTAL MONEY MARKET FUNDS | | | |
| (Cost $84,788,724) | | | 84,797,511 |
| TOTAL INVESTMENT IN SECURITIES - 99.7% | | | |
| (Cost $1,450,400,670) | | | 1,758,232,521 |
| NET OTHER ASSETS (LIABILITIES) - 0.3% | | | 5,300,728 |
| NET ASSETS - 100% | | | $1,763,533,249 |
Categorizations in the Schedule of Investments are based on country or territory of incorporation.
Legend
(a) Non-income producing
(b) Security or a portion of the security is on loan at period end.
(c) Level 3 security
(d) Affiliated company
(e) Affiliated fund that is generally available only to investment companies and other accounts managed by Fidelity Investments. The rate quoted is the annualized seven-day yield of the fund at period end. A complete unaudited listing of the fund's holdings as of its most recent quarter end is available upon request. In addition, each Fidelity Central Fund's financial statements, which are not covered by the Fund's Report of Independent Registered Public Accounting Firm, are available on the SEC's website or upon request.
(f) Investment made with cash collateral received from securities on loan.
Affiliated Central Funds
Information regarding fiscal year to date income earned by the Fund from investments in Fidelity Central Funds is as follows:
| Fund | Income earned |
| Fidelity Cash Central Fund | $563,190 |
| Fidelity Securities Lending Cash Central Fund | 246,284 |
| Total | $809,474 |
Other Affiliated Issuers
An affiliated company is a company in which the Fund has ownership of at least 5% of the voting securities. Fiscal year to date transactions with companies which are or were affiliates are as follows:
| Affiliate | Value, beginning of period | Purchases | Sales Proceeds | Dividend Income | Realized Gain (loss) | Change in Unrealized appreciation (depreciation) | Value, end of period |
| Kirindo Holdings Co. Ltd. | $-- | $6,269,413 | $-- | $40,210 | $-- | $2,133,724 | $8,403,137 |
| Ten Entertainment Group PLC | -- | 7,649,521 | -- | -- | -- | 2,522,739 | 10,172,260 |
| Total | $-- | $13,918,934 | $-- | $40,210 | $-- | $4,656,463 | $18,575,397 |
Investment Valuation
The following is a summary of the inputs used, as of October 31, 2017, involving the Fund's assets and liabilities carried at fair value. The inputs or methodology used for valuing securities may not be an indication of the risk associated with investing in those securities. For more information on valuation inputs, and their aggregation into the levels used below, please refer to the Investment Valuation section in the accompanying Notes to Financial Statements.
| | Valuation Inputs at Reporting Date: |
| Description | Total | Level 1 | Level 2 | Level 3 |
| Investments in Securities: | | | | |
| Equities: | | | | |
| Consumer Discretionary | $298,983,084 | $228,839,463 | $70,143,621 | $-- |
| Consumer Staples | 147,341,030 | 74,083,495 | 66,978,293 | 6,279,242 |
| Energy | 66,510,503 | 57,706,935 | 8,803,568 | -- |
| Financials | 217,290,230 | 199,716,009 | 17,574,221 | -- |
| Health Care | 139,909,569 | 106,794,976 | 33,114,593 | -- |
| Industrials | 339,027,662 | 263,479,976 | 75,547,686 | -- |
| Information Technology | 182,441,445 | 118,391,706 | 64,049,726 | 13 |
| Materials | 168,265,810 | 139,317,300 | 28,948,509 | 1 |
| Real Estate | 108,259,651 | 108,259,651 | -- | -- |
| Utilities | 5,406,026 | 5,406,026 | -- | -- |
| Money Market Funds | 84,797,511 | 84,797,511 | -- | -- |
| Total Investments in Securities: | $1,758,232,521 | $1,386,793,048 | $365,160,217 | $6,279,256 |
The following is a summary of transfers between Level 1 and Level 2 for the period ended October 31, 2017. Transfers are assumed to have occurred at the beginning of the period, and are primarily attributable to the valuation techniques used for foreign equity securities, as discussed in the accompanying Notes to Financial Statements:
| Transfers | Total |
| Level 1 to Level 2 | $193,833,983 |
| Level 2 to Level 1 | $0 |
See accompanying notes which are an integral part of the financial statements.
Financial Statements
Statement of Assets and Liabilities
| | | October 31, 2017 |
| Assets | | |
Investment in securities, at value (including securities loaned of $4,377,708) — See accompanying schedule:
Unaffiliated issuers (cost $1,351,693,012) | $1,654,859,613 | |
| Fidelity Central Funds (cost $84,788,724) | 84,797,511 | |
| Other affiliated issuers (cost $13,918,934) | 18,575,397 | |
| Total Investment in Securities (cost $1,450,400,670) | | $1,758,232,521 |
| Foreign currency held at value (cost $1,384,184) | | 1,391,808 |
| Receivable for investments sold | | 9,267,471 |
| Receivable for fund shares sold | | 3,110,146 |
| Dividends receivable | | 4,322,314 |
| Distributions receivable from Fidelity Central Funds | | 87,901 |
| Prepaid expenses | | 3,372 |
| Other receivables | | 38,000 |
| Total assets | | 1,776,453,533 |
| Liabilities | | |
| Payable for investments purchased | $4,767,186 | |
| Payable for fund shares redeemed | 1,450,903 | |
| Accrued management fee | 1,390,011 | |
| Distribution and service plan fees payable | 40,728 | |
| Other affiliated payables | 316,738 | |
| Other payables and accrued expenses | 219,534 | |
| Collateral on securities loaned | 4,735,184 | |
| Total liabilities | | 12,920,284 |
| Net Assets | | $1,763,533,249 |
| Net Assets consist of: | | |
| Paid in capital | | $1,410,903,777 |
| Undistributed net investment income | | 16,549,081 |
| Accumulated undistributed net realized gain (loss) on investments and foreign currency transactions | | 28,338,669 |
| Net unrealized appreciation (depreciation) on investments and assets and liabilities in foreign currencies | | 307,741,722 |
| Net Assets | | $1,763,533,249 |
| Calculation of Maximum Offering Price | | |
| Class A: | | |
| Net Asset Value and redemption price per share ($63,459,255 ÷ 2,170,243 shares) | | $29.24 |
| Maximum offering price per share (100/94.25 of $29.24) | | $31.02 |
| Class M: | | |
| Net Asset Value and redemption price per share ($18,147,582 ÷ 624,377 shares) | | $29.07 |
| Maximum offering price per share (100/96.50 of $29.07) | | $30.12 |
| Class C: | | |
| Net Asset Value and offering price per share ($26,004,972 ÷ 921,858 shares)(a) | | $28.21 |
| International Small Cap: | | |
| Net Asset Value, offering price and redemption price per share ($1,418,451,950 ÷ 47,642,070 shares) | | $29.77 |
| Class I: | | |
| Net Asset Value, offering price and redemption price per share ($237,469,490 ÷ 7,923,881 shares) | | $29.97 |
(a) Redemption price per share is equal to net asset value less any applicable contingent deferred sales charge.
See accompanying notes which are an integral part of the financial statements.
Statement of Operations
| | | Year ended October 31, 2017 |
| Investment Income | | |
| Dividends (including $40,210 earned from other affiliated issuers) | | $38,217,276 |
| Income from Fidelity Central Funds | | 809,474 |
| Income before foreign taxes withheld | | 39,026,750 |
| Less foreign taxes withheld | | (3,654,408) |
| Total income | | 35,372,342 |
| Expenses | | |
| Management fee | | |
| Basic fee | $11,222,416 | |
| Performance adjustment | 1,741,296 | |
| Transfer agent fees | 2,494,393 | |
| Distribution and service plan fees | 355,772 | |
| Accounting and security lending fees | 604,845 | |
| Custodian fees and expenses | 426,022 | |
| Independent trustees' fees and expenses | 4,976 | |
| Registration fees | 148,235 | |
| Audit | 91,755 | |
| Legal | 2,686 | |
| Miscellaneous | 9,362 | |
| Total expenses before reductions | 17,101,758 | |
| Expense reductions | (85,624) | 17,016,134 |
| Net investment income (loss) | | 18,356,208 |
| Realized and Unrealized Gain (Loss) | | |
| Net realized gain (loss) on: | | |
| Investment securities: | | |
| Unaffiliated issuers (net of foreign taxes of $86,242) | 41,116,774 | |
| Fidelity Central Funds | (665) | |
| Foreign currency transactions | 79,704 | |
| Total net realized gain (loss) | | 41,195,813 |
| Change in net unrealized appreciation (depreciation) on: | | |
| Unaffiliated issuers (net of decrease in deferred foreign taxes of $79,683) | 253,968,304 | |
| Fidelity Central Funds | (6,149) | |
| Other affiliated issuers | 4,656,463 | |
| Assets and liabilities in foreign currencies | 39,119 | |
| Total change in net unrealized appreciation (depreciation) | | 258,657,737 |
| Net gain (loss) | | 299,853,550 |
| Net increase (decrease) in net assets resulting from operations | | $318,209,758 |
See accompanying notes which are an integral part of the financial statements.
Statement of Changes in Net Assets
| | Year ended October 31, 2017 | Year ended October 31, 2016 |
| Increase (Decrease) in Net Assets | | |
| Operations | | |
| Net investment income (loss) | $18,356,208 | $15,277,971 |
| Net realized gain (loss) | 41,195,813 | 12,084,769 |
| Change in net unrealized appreciation (depreciation) | 258,657,737 | 49,975,496 |
| Net increase (decrease) in net assets resulting from operations | 318,209,758 | 77,338,236 |
| Distributions to shareholders from net investment income | (14,393,212) | (10,933,091) |
| Distributions to shareholders from net realized gain | (12,478,859) | (23,540,154) |
| Total distributions | (26,872,071) | (34,473,245) |
| Share transactions - net increase (decrease) | 480,792,049 | 74,066,306 |
| Redemption fees | 258,237 | 222,176 |
| Total increase (decrease) in net assets | 772,387,973 | 117,153,473 |
| Net Assets | | |
| Beginning of period | 991,145,276 | 873,991,803 |
| End of period | $1,763,533,249 | $991,145,276 |
| Other Information | | |
| Undistributed net investment income end of period | $16,549,081 | $13,974,440 |
See accompanying notes which are an integral part of the financial statements.
Financial Highlights
Fidelity International Small Cap Fund Class A
| Years ended October 31, | 2017 | 2016 | 2015 | 2014 | 2013 |
| Selected Per–Share Data | | | | | |
| Net asset value, beginning of period | $23.81 | $22.69 | $24.98 | $26.34 | $19.74 |
| Income from Investment Operations | | | | | |
| Net investment income (loss)A | .29 | .34 | .27 | .17 | .06 |
| Net realized and unrealized gain (loss) | 5.70 | 1.64 | 1.05 | (.89) | 6.94 |
| Total from investment operations | 5.99 | 1.98 | 1.32 | (.72) | 7.00 |
| Distributions from net investment income | (.28) | (.25) | (.16) | (.05) | (.07) |
| Distributions from net realized gain | (.29) | (.62) | (3.45) | (.60) | (.33) |
| Total distributions | (.57) | (.87) | (3.61) | (.65) | (.40) |
| Redemption fees added to paid in capitalA | .01 | .01 | –B | .01 | –B |
| Net asset value, end of period | $29.24 | $23.81 | $22.69 | $24.98 | $26.34 |
| Total ReturnC,D | 25.83% | 9.11% | 6.21% | (2.79)% | 36.18% |
| Ratios to Average Net AssetsE,F | | | | | |
| Expenses before reductions | 1.55% | 1.61% | 1.59% | 1.50% | 1.61% |
| Expenses net of fee waivers, if any | 1.55% | 1.61% | 1.58% | 1.50% | 1.61% |
| Expenses net of all reductions | 1.55% | 1.61% | 1.58% | 1.50% | 1.60% |
| Net investment income (loss) | 1.11% | 1.50% | 1.18% | .65% | .25% |
| Supplemental Data | | | | | |
| Net assets, end of period (000 omitted) | $63,459 | $36,480 | $28,238 | $24,572 | $24,020 |
| Portfolio turnover rateG | 22% | 29% | 36% | 102% | 54% |
A Calculated based on average shares outstanding during the period.
B Amount represents less than $.005 per share.
C Total returns would have been lower if certain expenses had not been reduced during the applicable periods shown.
D Total returns do not include the effect of the sales charges.
E Fees and expenses of any underlying Fidelity Central Funds are not included in the Fund's expense ratio. The Fund indirectly bears its proportionate share of the expenses of any underlying Fidelity Central Funds.
F Expense ratios reflect operating expenses of the class. Expenses before reductions do not reflect amounts reimbursed by the investment adviser or reductions from brokerage service arrangements or reductions from other expense offset arrangements and do not represent the amount paid by the class during periods when reimbursements or reductions occur. Expenses net of fee waivers reflect expenses after reimbursement by the investment adviser but prior to reductions from brokerage service arrangements or other expense offset arrangements. Expenses net of all reductions represent the net expenses paid by the class.
G Amount does not include the portfolio activity of any underlying Fidelity Central Funds.
See accompanying notes which are an integral part of the financial statements.
Fidelity International Small Cap Fund Class M
| Years ended October 31, | 2017 | 2016 | 2015 | 2014 | 2013 |
| Selected Per–Share Data | | | | | |
| Net asset value, beginning of period | $23.65 | $22.55 | $24.81 | $26.17 | $19.59 |
| Income from Investment Operations | | | | | |
| Net investment income (loss)A | .21 | .27 | .21 | .10 | –B |
| Net realized and unrealized gain (loss) | 5.69 | 1.63 | 1.04 | (.87) | 6.90 |
| Total from investment operations | 5.90 | 1.90 | 1.25 | (.77) | 6.90 |
| Distributions from net investment income | (.19) | (.19) | (.06) | – | – |
| Distributions from net realized gain | (.29) | (.62) | (3.45) | (.60) | (.32) |
| Total distributions | (.48) | (.81) | (3.51) | (.60) | (.32) |
| Redemption fees added to paid in capitalA | –B | .01 | –B | .01 | –B |
| Net asset value, end of period | $29.07 | $23.65 | $22.55 | $24.81 | $26.17 |
| Total ReturnC,D | 25.47% | 8.79% | 5.90% | (3.00)% | 35.80% |
| Ratios to Average Net AssetsE,F | | | | | |
| Expenses before reductions | 1.84% | 1.90% | 1.87% | 1.77% | 1.87% |
| Expenses net of fee waivers, if any | 1.84% | 1.90% | 1.86% | 1.77% | 1.87% |
| Expenses net of all reductions | 1.84% | 1.90% | 1.86% | 1.76% | 1.85% |
| Net investment income (loss) | .82% | 1.21% | .90% | .38% | (.01)% |
| Supplemental Data | | | | | |
| Net assets, end of period (000 omitted) | $18,148 | $13,331 | $12,400 | $12,296 | $13,530 |
| Portfolio turnover rateG | 22% | 29% | 36% | 102% | 54% |
A Calculated based on average shares outstanding during the period.
B Amount represents less than $.005 per share.
C Total returns would have been lower if certain expenses had not been reduced during the applicable periods shown.
D Total returns do not include the effect of the sales charges.
E Fees and expenses of any underlying Fidelity Central Funds are not included in the Fund's expense ratio. The Fund indirectly bears its proportionate share of the expenses of any underlying Fidelity Central Funds.
F Expense ratios reflect operating expenses of the class. Expenses before reductions do not reflect amounts reimbursed by the investment adviser or reductions from brokerage service arrangements or reductions from other expense offset arrangements and do not represent the amount paid by the class during periods when reimbursements or reductions occur. Expenses net of fee waivers reflect expenses after reimbursement by the investment adviser but prior to reductions from brokerage service arrangements or other expense offset arrangements. Expenses net of all reductions represent the net expenses paid by the class.
G Amount does not include the portfolio activity of any underlying Fidelity Central Funds.
See accompanying notes which are an integral part of the financial statements.
Fidelity International Small Cap Fund Class C
| Years ended October 31, | 2017 | 2016 | 2015 | 2014 | 2013 |
| Selected Per–Share Data | | | | | |
| Net asset value, beginning of period | $22.97 | $21.96 | $24.27 | $25.68 | $19.18 |
| Income from Investment Operations | | | | | |
| Net investment income (loss)A | .08 | .16 | .09 | (.02) | (.11) |
| Net realized and unrealized gain (loss) | 5.53 | 1.59 | 1.02 | (.85) | 6.79 |
| Total from investment operations | 5.61 | 1.75 | 1.11 | (.87) | 6.68 |
| Distributions from net investment income | (.08) | (.13) | – | – | – |
| Distributions from net realized gain | (.29) | (.62) | (3.42) | (.55) | (.18) |
| Total distributions | (.37) | (.75) | (3.42) | (.55) | (.18) |
| Redemption fees added to paid in capitalA | –B | .01 | –B | .01 | –B |
| Net asset value, end of period | $28.21 | $22.97 | $21.96 | $24.27 | $25.68 |
| Total ReturnC,D | 24.85% | 8.26% | 5.37% | (3.43)% | 35.15% |
| Ratios to Average Net AssetsE,F | | | | | |
| Expenses before reductions | 2.33% | 2.40% | 2.36% | 2.23% | 2.33% |
| Expenses net of fee waivers, if any | 2.33% | 2.40% | 2.35% | 2.22% | 2.33% |
| Expenses net of all reductions | 2.32% | 2.39% | 2.35% | 2.22% | 2.32% |
| Net investment income (loss) | .33% | .71% | .41% | (.07)% | (.47)% |
| Supplemental Data | | | | | |
| Net assets, end of period (000 omitted) | $26,005 | $12,187 | $11,359 | $12,576 | $13,426 |
| Portfolio turnover rateG | 22% | 29% | 36% | 102% | 54% |
A Calculated based on average shares outstanding during the period.
B Amount represents less than $.005 per share.
C Total returns would have been lower if certain expenses had not been reduced during the applicable periods shown.
D Total returns do not include the effect of the contingent deferred sales charge.
E Fees and expenses of any underlying Fidelity Central Funds are not included in the Fund's expense ratio. The Fund indirectly bears its proportionate share of the expenses of any underlying Fidelity Central Funds.
F Expense ratios reflect operating expenses of the class. Expenses before reductions do not reflect amounts reimbursed by the investment adviser or reductions from brokerage service arrangements or reductions from other expense offset arrangements and do not represent the amount paid by the class during periods when reimbursements or reductions occur. Expenses net of fee waivers reflect expenses after reimbursement by the investment adviser but prior to reductions from brokerage service arrangements or other expense offset arrangements. Expenses net of all reductions represent the net expenses paid by the class.
G Amount does not include the portfolio activity of any underlying Fidelity Central Funds.
See accompanying notes which are an integral part of the financial statements.
Fidelity International Small Cap Fund
| Years ended October 31, | 2017 | 2016 | 2015 | 2014 | 2013 |
| Selected Per–Share Data | | | | | |
| Net asset value, beginning of period | $24.23 | $23.06 | $25.34 | $26.67 | $19.99 |
| Income from Investment Operations | | | | | |
| Net investment income (loss)A | .37 | .40 | .34 | .25 | .12 |
| Net realized and unrealized gain (loss) | 5.79 | 1.67 | 1.07 | (.90) | 7.02 |
| Total from investment operations | 6.16 | 2.07 | 1.41 | (.65) | 7.14 |
| Distributions from net investment income | (.34) | (.29) | (.24) | (.09) | (.14) |
| Distributions from net realized gain | (.29) | (.62) | (3.45) | (.60) | (.33) |
| Total distributions | (.63) | (.91) | (3.69) | (.69) | (.46)B |
| Redemption fees added to paid in capitalA | .01 | .01 | –C | .01 | –C |
| Net asset value, end of period | $29.77 | $24.23 | $23.06 | $25.34 | $26.67 |
| Total ReturnD | 26.18% | 9.39% | 6.53% | (2.48)% | 36.56% |
| Ratios to Average Net AssetsE,F | | | | | |
| Expenses before reductions | 1.25% | 1.34% | 1.31% | 1.21% | 1.33% |
| Expenses net of fee waivers, if any | 1.25% | 1.34% | 1.31% | 1.20% | 1.32% |
| Expenses net of all reductions | 1.24% | 1.33% | 1.31% | 1.20% | 1.31% |
| Net investment income (loss) | 1.41% | 1.77% | 1.45% | .95% | .53% |
| Supplemental Data | | | | | |
| Net assets, end of period (000 omitted) | $1,418,452 | $906,420 | $811,534 | $842,031 | $1,029,629 |
| Portfolio turnover rateG | 22% | 29% | 36% | 102% | 54% |
A Calculated based on average shares outstanding during the period.
B Total distributions of $.46 per share is comprised of distributions from net investment income of $.136 and distributions from net realized gain of $.327 per share.
C Amount represents less than $.005 per share.
D Total returns would have been lower if certain expenses had not been reduced during the applicable periods shown.
E Fees and expenses of any underlying Fidelity Central Funds are not included in the Fund's expense ratio. The Fund indirectly bears its proportionate share of the expenses of any underlying Fidelity Central Funds.
F Expense ratios reflect operating expenses of the class. Expenses before reductions do not reflect amounts reimbursed by the investment adviser or reductions from brokerage service arrangements or reductions from other expense offset arrangements and do not represent the amount paid by the class during periods when reimbursements or reductions occur. Expenses net of fee waivers reflect expenses after reimbursement by the investment adviser but prior to reductions from brokerage service arrangements or other expense offset arrangements. Expenses net of all reductions represent the net expenses paid by the class.
G Amount does not include the portfolio activity of any underlying Fidelity Central Funds.
See accompanying notes which are an integral part of the financial statements.
Fidelity International Small Cap Fund Class I
| Years ended October 31, | 2017 | 2016 | 2015 | 2014 | 2013 |
| Selected Per–Share Data | | | | | |
| Net asset value, beginning of period | $24.42 | $23.24 | $25.34 | $26.67 | $20.00 |
| Income from Investment Operations | | | | | |
| Net investment income (loss)A | .38 | .41 | .36 | .29 | .16 |
| Net realized and unrealized gain (loss) | 5.82 | 1.69 | 1.07 | (.90) | 7.00 |
| Total from investment operations | 6.20 | 2.10 | 1.43 | (.61) | 7.16 |
| Distributions from net investment income | (.37) | (.31) | (.08) | (.13) | (.16) |
| Distributions from net realized gain | (.29) | (.62) | (3.45) | (.60) | (.33) |
| Total distributions | (.66) | (.93) | (3.53) | (.73) | (.49) |
| Redemption fees added to paid in capitalA | .01 | .01 | –B | .01 | –B |
| Net asset value, end of period | $29.97 | $24.42 | $23.24 | $25.34 | $26.67 |
| Total ReturnC | 26.17% | 9.43% | 6.60% | (2.35)% | 36.68% |
| Ratios to Average Net AssetsD,E | | | | | |
| Expenses before reductions | 1.28% | 1.31% | 1.24% | 1.08% | 1.20% |
| Expenses net of fee waivers, if any | 1.28% | 1.31% | 1.23% | 1.08% | 1.20% |
| Expenses net of all reductions | 1.27% | 1.31% | 1.23% | 1.08% | 1.18% |
| Net investment income (loss) | 1.39% | 1.80% | 1.53% | 1.07% | .66% |
| Supplemental Data | | | | | |
| Net assets, end of period (000 omitted) | $237,469 | $22,727 | $10,070 | $8,092 | $67,038 |
| Portfolio turnover rateF | 22% | 29% | 36% | 102% | 54% |
A Calculated based on average shares outstanding during the period.
B Amount represents less than $.005 per share.
C Total returns would have been lower if certain expenses had not been reduced during the applicable periods shown.
D Fees and expenses of any underlying Fidelity Central Funds are not included in the Fund's expense ratio. The Fund indirectly bears its proportionate share of the expenses of any underlying Fidelity Central Funds.
E Expense ratios reflect operating expenses of the class. Expenses before reductions do not reflect amounts reimbursed by the investment adviser or reductions from brokerage service arrangements or reductions from other expense offset arrangements and do not represent the amount paid by the class during periods when reimbursements or reductions occur. Expenses net of fee waivers reflect expenses after reimbursement by the investment adviser but prior to reductions from brokerage service arrangements or other expense offset arrangements. Expenses net of all reductions represent the net expenses paid by the class.
F Amount does not include the portfolio activity of any underlying Fidelity Central Funds.
See accompanying notes which are an integral part of the financial statements.
Notes to Financial Statements
For the period ended October 31, 2017
1. Organization.
Fidelity International Small Cap Fund (the Fund) is a fund of Fidelity Investment Trust (the Trust) and is authorized to issue an unlimited number of shares. The Trust is registered under the Investment Company Act of 1940, as amended (the 1940 Act), as an open-end management investment company organized as a Massachusetts business trust. The Fund offers Class A, Class M (formerly Class T), Class C, International Small Cap and Class I shares, each of which has equal rights as to assets and voting privileges. Each class has exclusive voting rights with respect to matters that affect that class. The Fund's investments in emerging markets can be subject to social, economic, regulatory, and political uncertainties and can be extremely volatile.
After the close of business on June 24, 2016, all outstanding Class B shares were converted to Class A shares. All prior fiscal period dollar and share amounts for Class B presented in the Notes to Financial Statements are for the period November 1, 2015 through June 24, 2016.
2. Investments in Fidelity Central Funds.
The Fund invests in Fidelity Central Funds, which are open-end investment companies generally available only to other investment companies and accounts managed by the investment adviser and its affiliates. The Fund's Schedule of Investments lists each of the Fidelity Central Funds held as of period end, if any, as an investment of the Fund, but does not include the underlying holdings of each Fidelity Central Fund. As an Investing Fund, the Fund indirectly bears its proportionate share of the expenses of the underlying Fidelity Central Funds.
The Money Market Central Funds seek preservation of capital and current income and are managed by Fidelity Investments Money Management, Inc. (FIMM), an affiliate of the investment adviser. Annualized expenses of the Money Market Central Funds as of their most recent shareholder report date are less than .005%.
A complete unaudited list of holdings for each Fidelity Central Fund is available upon request or at the Securities and Exchange Commission (the SEC) website at www.sec.gov. In addition, the financial statements of the Fidelity Central Funds, which are not covered by the Fund's Report of Independent Registered Public Accounting Firm, are available on the SEC website or upon request.
3. Significant Accounting Policies.
The Fund is an investment company and applies the accounting and reporting guidance of the Financial Accounting Standards Board (FASB) Accounting Standards Codification Topic 946 Financial Services – Investments Companies. The financial statements have been prepared in conformity with accounting principles generally accepted in the United States of America (GAAP), which require management to make certain estimates and assumptions at the date of the financial statements. Actual results could differ from those estimates. Subsequent events, if any, through the date that the financial statements were issued have been evaluated in the preparation of the financial statements. The following summarizes the significant accounting policies of the Fund:
Investment Valuation. Investments are valued as of 4:00 p.m. Eastern time on the last calendar day of the period. The Board of Trustees (the Board) has delegated the day to day responsibility for the valuation of the Fund's investments to the Fair Value Committee (the Committee) established by the Fund's investment adviser. In accordance with valuation policies and procedures approved by the Board, the Fund attempts to obtain prices from one or more third party pricing vendors or brokers to value its investments. When current market prices, quotations or currency exchange rates are not readily available or reliable, investments will be fair valued in good faith by the Committee, in accordance with procedures adopted by the Board. Factors used in determining fair value vary by investment type and may include market or investment specific events. The frequency with which these procedures are used cannot be predicted and they may be utilized to a significant extent. The Committee oversees the Fund's valuation policies and procedures and reports to the Board on the Committee's activities and fair value determinations. The Board monitors the appropriateness of the procedures used in valuing the Fund's investments and ratifies the fair value determinations of the Committee.
The Fund categorizes the inputs to valuation techniques used to value its investments into a disclosure hierarchy consisting of three levels as shown below:
- Level 1 – quoted prices in active markets for identical investments
- Level 2 – other significant observable inputs (including quoted prices for similar investments, interest rates, prepayment speeds, etc.)
- Level 3 – unobservable inputs (including the Fund's own assumptions based on the best information available)
Valuation techniques used to value the Fund's investments by major category are as follows:
Equity securities, including restricted securities, for which market quotations are readily available, are valued at the last reported sale price or official closing price as reported by a third party pricing vendor on the primary market or exchange on which they are traded and are categorized as Level 1 in the hierarchy. In the event there were no sales during the day or closing prices are not available, securities are valued at the last quoted bid price or may be valued using the last available price and are generally categorized as Level 2 in the hierarchy. For foreign equity securities, when market or security specific events arise, comparisons to the valuation of American Depositary Receipts (ADRs), futures contracts, Exchange-Traded Funds (ETFs)and certain indexes as well as quoted prices for similar securities may be used and would be categorized as Level 2 in the hierarchy. Utilizing these techniques may result in transfers between Level 1 and Level 2. For equity securities, including restricted securities, where observable inputs are limited, assumptions about market activity and risk are used and these securities may be categorized as Level 3 in the hierarchy.
Investments in open-end mutual funds, including the Fidelity Central Funds, are valued at their closing net asset value (NAV) each business day and are categorized as Level 1 in the hierarchy.
Changes in valuation techniques may result in transfers in or out of an assigned level within the disclosure hierarchy. The aggregate value of investments by input level as of October 31, 2017, including information on transfers between Levels 1 and 2, is included at the end of the Fund's Schedule of Investments.
Foreign Currency. The Fund may use foreign currency contracts to facilitate transactions in foreign-denominated securities. Gains and losses from these transactions may arise from changes in the value of the foreign currency or if the counterparties do not perform under the contracts' terms.
Foreign-denominated assets, including investment securities, and liabilities are translated into U.S. dollars at the exchange rates at period end. Purchases and sales of investment securities, income and dividends received and expenses denominated in foreign currencies are translated into U.S. dollars at the exchange rate in effect on the transaction date.
The effects of exchange rate fluctuations on investments are included with the net realized and unrealized gain (loss) on investment securities. Other foreign currency transactions resulting in realized and unrealized gain (loss) are disclosed separately.
Investment Transactions and Income. For financial reporting purposes, the Fund's investment holdings and NAV include trades executed through the end of the last business day of the period. The NAV per share for processing shareholder transactions is calculated as of the close of business of the New York Stock Exchange (NYSE), normally 4:00 p.m. Eastern time and includes trades executed through the end of the prior business day. Gains and losses on securities sold are determined on the basis of identified cost and includes proceeds received from litigation. Dividend income is recorded on the ex-dividend date, except for certain dividends from foreign securities where the ex-dividend date may have passed, which are recorded as soon as the Fund is informed of the ex-dividend date. Non-cash dividends included in dividend income, if any, are recorded at the fair market value of the securities received. Income and capital gain distributions from Fidelity Central Funds, if any, are recorded on the ex-dividend date. Certain distributions received by the Fund represent a return of capital or capital gain. The Fund determines the components of these distributions subsequent to the ex-dividend date, based upon receipt of tax filings or other correspondence relating to the underlying investment. These distributions are recorded as a reduction of cost of investments and/or as a realized gain. Investment income is recorded net of foreign taxes withheld where recovery of such taxes is uncertain.
Class Allocations and Expenses. Investment income, realized and unrealized capital gains and losses, common expenses of the Fund, and certain fund-level expense reductions, if any, are allocated daily on a pro-rata basis to each class based on the relative net assets of each class to the total net assets of the Fund. Each class differs with respect to transfer agent and distribution and service plan fees incurred. Certain expense reductions may also differ by class. For the reporting period, the allocated portion of income and expenses to each class as a percent of its average net assets may vary due to the timing of recording these transactions in relation to fluctuating net assets of the classes. Expenses directly attributable to a fund are charged to that fund. Expenses attributable to more than one fund are allocated among the respective funds on the basis of relative net assets or other appropriate methods. Expense estimates are accrued in the period to which they relate and adjustments are made when actual amounts are known.
Income Tax Information and Distributions to Shareholders. Each year, the Fund intends to qualify as a regulated investment company under Subchapter M of the Internal Revenue Code, including distributing substantially all of its taxable income and realized gains. As a result, no provision for U.S. Federal income taxes is required. As of October 31, 2017, the Fund did not have any unrecognized tax benefits in the financial statements; nor is the Fund aware of any tax positions for which it is reasonably possible that the total amounts of unrecognized tax benefits will significantly change in the next twelve months. The Fund files a U.S. federal tax return, in addition to state and local tax returns as required. The Fund's federal income tax returns are subject to examination by the Internal Revenue Service (IRS) for a period of three fiscal years after they are filed. State and local tax returns may be subject to examination for an additional fiscal year depending on the jurisdiction. Foreign taxes are provided for based on the Fund's understanding of the tax rules and rates that exist in the foreign markets in which it invests. The Fund is subject to a tax imposed on capital gains by certain countries in which it invests.
Distributions are declared and recorded on the ex-dividend date. Income dividends and capital gain distributions are declared separately for each class. Income and capital gain distributions are determined in accordance with income tax regulations, which may differ from GAAP. In addition, the Fund claimed a portion of the payment made to redeeming shareholders as a distribution for income tax purposes.
Capital accounts within the financial statements are adjusted for permanent book-tax differences. These adjustments have no impact on net assets or the results of operations. Capital accounts are not adjusted for temporary book-tax differences which will reverse in a subsequent period.
Book-tax differences are primarily due to foreign currency transactions, certain foreign taxes, passive foreign investment companies (PFIC) and losses deferred due to wash sales.
As of period end, the cost and unrealized appreciation (depreciation) in securities, and derivatives if applicable, for federal income tax purposes were as follows:
| Gross unrealized appreciation | $368,862,454 |
| Gross unrealized depreciation | (76,868,724) |
| Net unrealized appreciation (depreciation) | $291,993,730 |
| Tax Cost | $1,466,238,791 |
The tax-based components of distributable earnings as of period end were as follows:
| Undistributed ordinary income | $35,357,334 |
| Undistributed long-term capital gain | $25,367,408 |
| Net unrealized appreciation (depreciation) on securities and other investments | $291,904,730 |
The tax character of distributions paid was as follows:
| | October 31, 2017 | October 31, 2016 |
| Ordinary Income | $16,336,287 | $ 15,375,346 |
| Long-term Capital Gains | 10,535,784 | 19,097,899 |
| Total | $26,872,071 | $ 34,473,245 |
Short-Term Trading (Redemption) Fees. Shares held by investors in the Fund less than 90 days may have been subject to a redemption fee equal to 2.00% of the NAV of shares redeemed. All redemption fees, which reduce the proceeds of the shareholder redemption, are retained by the Fund and accounted for as an addition to paid in capital. In November 2017, the Board of Trustees approved the elimination of these redemption fees effective December 18, 2017.
4. Purchases and Sales of Investments.
Purchases and sales of securities, other than short-term securities, aggregated $716,974,743 and $282,441,072, respectively.
5. Fees and Other Transactions with Affiliates.
Management Fee. Fidelity Management & Research Company (the investment adviser) and its affiliates provide the Fund with investment management related services for which the Fund pays a monthly management fee. The management fee is the sum of an individual fund fee rate that is based on an annual rate of .60% of the Fund's average net assets and an annualized group fee rate that averaged .25% during the period. The group fee rate is based upon the average net assets of all the mutual funds advised by the investment adviser, including any mutual funds previously advised by the investment adviser that are currently advised by Fidelity SelectCo, LLC, an affiliate of the investment adviser. The group fee rate decreases as assets under management increase and increases as assets under management decrease. In addition, the management fee is subject to a performance adjustment (up to a maximum of +/- .20% of the Fund's average net assets over a 36 month performance period). The upward or downward adjustment to the management fee is based on the relative investment performance of International Small Cap as compared to its benchmark index, the MSCI ACWI (All Country World Index) ex USA Small Cap Index effective April 1, 2014 (the MSCI EAFE Small Cap Index prior to April 1, 2014), over the same 36 month performance period. For the reporting period, the total annual management fee rate, including the performance adjustment, was .97% of the Fund's average net assets. The performance adjustment included in the management fee rate may be higher or lower than the maximum performance adjustment rate due to the difference between the average net assets for the reporting and performance periods.
Distribution and Service Plan Fees. In accordance with Rule 12b-1 of the 1940 Act, the Fund has adopted separate Distribution and Service Plans for each class of shares. Certain classes pay Fidelity Distributors Corporation (FDC), an affiliate of the investment adviser, separate Distribution and Service Fees, each of which is based on an annual percentage of each class' average net assets. In addition, FDC may pay financial intermediaries for selling shares of the Fund and providing shareholder support services. For the period, the Distribution and Service Fee rates, total fees and amounts retained by FDC were as follows:
| | Distribution
Fee | Service
Fee | Total Fees | Retained
by FDC |
| Class A | -% | .25% | $113,953 | $– |
| Class M | .25% | .25% | 76,138 | – |
| Class C | .75% | .25% | 165,681 | 50,183 |
| | | | $355,772 | $50,183 |
Sales Load. FDC may receive a front-end sales charge of up to 5.75% for selling Class A shares and 3.50% for selling Class M shares, some of which is paid to financial intermediaries for selling shares of the Fund. Depending on the holding period, FDC may receive contingent deferred sales charges levied on Class A, Class M and Class C redemptions. The deferred sales charges are 1.00% for Class C shares, 1.00% for certain purchases of Class A shares and .25% for certain purchases of Class M shares.
For the period, sales charge amounts retained by FDC were as follows:
| | Retained
by FDC |
| Class A | $48,163 |
| Class M | 3,241 |
| Class C(a) | 3,064 |
| | $54,468 |
(a) When Class C shares are initially sold, FDC pays commissions from its own resources to financial intermediaries through which the sales are made.
Transfer Agent Fees. Fidelity Investments Institutional Operations Company, Inc., (FIIOC), an affiliate of the investment adviser, is the transfer, dividend disbursing and shareholder servicing agent for each class of the Fund. FIIOC receives account fees and asset-based fees that vary according to the account size and type of account of the shareholders of the respective classes of the Fund. FIIOC pays for typesetting, printing and mailing of shareholder reports, except proxy statements.
For the period, transfer agent fees for each class were as follows:
| | Amount | % of
Class-Level Average
Net Assets |
| Class A | $107,596 | .24 |
| Class M | 41,674 | .27 |
| Class C | 44,185 | .27 |
| International Small Cap | 2,096,814 | .18 |
| Class I | 204,124 | .21 |
| | $2,494,393 | |
Accounting and Security Lending Fees. Fidelity Service Company, Inc. (FSC), an affiliate of the investment adviser, maintains the Fund's accounting records. The accounting fee is based on the level of average net assets for each month. Under a separate contract, FSC administers the security lending program. The security lending fee is based on the number and duration of lending transactions.
Brokerage Commissions. The Fund placed a portion of its portfolio transactions with brokerage firms which are affiliates of the investment adviser. Brokerage commissions are included in net realized gain (loss) and change in net unrealized appreciation (depreciation) in the Statement of Operations. The commissions paid to these affiliated firms were $2,875 for the period.
Interfund Trades. The Fund may purchase from or sell securities to other Fidelity Funds under procedures adopted by the Board. The procedures have been designed to ensure these interfund trades are executed in accordance with Rule 17a-7 of the 1940 Act. Interfund trades are included within the respective purchases and sales amounts shown in the Purchases and Sales of Investments note.
6. Committed Line of Credit.
The Fund participates with other funds managed by the investment adviser or an affiliate in a $4.25 billion credit facility (the "line of credit") to be utilized for temporary or emergency purposes to fund shareholder redemptions or for other short-term liquidity purposes. The Fund has agreed to pay commitment fees on its pro-rata portion of the line of credit, which amounted to $3,978 and is reflected in Miscellaneous expenses on the Statement of Operations.
7. Security Lending.
The Fund lends portfolio securities through a lending agent from time to time in order to earn additional income. For equity securities, a lending agent is used and may loan securities to certain qualified borrowers, including Fidelity Capital Markets (FCM), a broker-dealer affiliated with the Fund. On the settlement date of the loan, the Fund receives collateral (in the form of U.S. Treasury obligations, letters of credit and/or cash) against the loaned securities and maintains collateral in an amount not less than 100% of the market value of the loaned securities during the period of the loan. The market value of the loaned securities is determined at the close of business of the Fund and any additional required collateral is delivered to the Fund on the next business day. The Fund or borrower may terminate the loan at any time, and if the borrower defaults on its obligation to return the securities loaned because of insolvency or other reasons, the Fund may apply collateral received from the borrower against the obligation. The Fund may experience delays and costs in recovering the securities loaned. Any cash collateral received is invested in the Fidelity Securities Lending Cash Central Fund. The value of loaned securities and cash collateral at period end are disclosed on the Fund's Statement of Assets and Liabilities. The value of securities loaned to FCM at period end was $2,532. Security lending income represents the income earned on investing cash collateral, less rebates paid to borrowers and any lending agent fees associated with the loan, plus any premium payments received for lending certain types of securities. Security lending income is presented in the Statement of Operations as a component of income from Fidelity Central Funds. Total security lending income during the period amounted to $246,284, including $30,742 from securities loaned to FCM.
8. Expense Reductions.
Commissions paid to certain brokers with whom the investment adviser, or its affiliates, places trades on behalf of the Fund include an amount in addition to trade execution, which may be rebated back to the Fund to offset certain expenses. This amount totaled $75,969 for the period. In addition, through arrangements with the Fund's custodian, credits realized as a result of certain uninvested cash balances were used to reduce the Fund's expenses. During the period, these credits reduced the Fund's custody expenses by $409.
In addition, during the period the investment adviser reimbursed and/or waived a portion of fund-level operating expenses in the amount of $9,246.
9. Distributions to Shareholders.
Distributions to shareholders of each class were as follows:
| | Year ended
October 31, 2017 | Year ended
October 31, 2016 |
| From net investment income | | |
| Class A | $440,395 | $319,347 |
| Class M | 105,144 | 106,306 |
| Class B | – | 996 |
| Class C | 42,573 | 64,383 |
| International Small Cap | 13,342,577 | 10,307,620 |
| Class I | 462,523 | 134,439 |
| Total | $14,393,212 | $10,933,091 |
| From net realized gain | | |
| Class A | $461,138 | $788,825 |
| Class M | 163,369 | 339,739 |
| Class B | – | 10,287 |
| Class C | 151,895 | 319,340 |
| International Small Cap | 11,341,189 | 21,811,338 |
| Class I | 361,268 | 270,625 |
| Total | $12,478,859 | $23,540,154 |
10. Share Transactions.
Share transactions for each class were as follows and may contain automatic conversions between classes or exchanges between affiliated funds:
| | Shares | Shares | Dollars | Dollars |
| | Year ended October 31, 2017 | Year ended October 31, 2016 | Year ended October 31, 2017 | Year ended October 31, 2016 |
| Class A | | | | |
| Shares sold | 1,346,483 | 622,254 | $35,353,222 | $13,846,907 |
| Reinvestment of distributions | 38,390 | 49,226 | 881,445 | 1,077,561 |
| Shares redeemed | (746,471) | (383,922) | (18,879,894) | (8,560,022) |
| Net increase (decrease) | 638,402 | 287,558 | $17,354,773 | $6,364,446 |
| Class M | | | | |
| Shares sold | 165,476 | 133,036 | $4,273,457 | $2,846,482 |
| Reinvestment of distributions | 11,602 | 20,220 | 265,460 | 440,798 |
| Shares redeemed | (116,364) | (139,487) | (2,968,272) | (3,059,683) |
| Net increase (decrease) | 60,714 | 13,769 | $1,570,645 | $227,597 |
| Class B | | | | |
| Shares sold | – | 2,210 | $– | $44,410 |
| Reinvestment of distributions | – | 493 | – | 10,648 |
| Shares redeemed | – | (20,270) | – | (435,806) |
| Net increase (decrease) | – | (17,567) | $– | $(380,748) |
| Class C | | | | |
| Shares sold | 554,853 | 222,957 | $14,330,189 | $4,942,382 |
| Reinvestment of distributions | 8,175 | 16,869 | 182,379 | 358,801 |
| Shares redeemed | (171,623) | (226,514) | (4,225,035) | (4,770,771) |
| Net increase (decrease) | 391,405 | 13,312 | $10,287,533 | $530,412 |
| International Small Cap | | | | |
| Shares sold | 20,105,455 | 11,991,539 | $528,374,537 | $277,123,750 |
| Reinvestment of distributions | 1,029,746 | 1,408,054 | 24,013,687 | 31,286,953 |
| Shares redeemed | (10,901,622) | (11,188,601) | (292,534,899) | (253,612,350) |
| Net increase (decrease) | 10,233,579 | 2,210,992 | $259,853,325 | $54,798,353 |
| Class I | | | | |
| Shares sold | 7,788,345 | 924,076 | $213,872,926 | $21,994,159 |
| Reinvestment of distributions | 29,052 | 16,670 | 682,131 | 373,252 |
| Shares redeemed | (824,089) | (443,477) | (22,829,284) | (9,841,165) |
| Net increase (decrease) | 6,993,308 | 497,269 | $191,725,773 | $12,526,246 |
11. Other.
The Fund's organizational documents provide former and current trustees and officers with a limited indemnification against liabilities arising in connection with the performance of their duties to the Fund. In the normal course of business, the Fund may also enter into contracts that provide general indemnifications. The Fund's maximum exposure under these arrangements is unknown as this would be dependent on future claims that may be made against the Fund. The risk of material loss from such claims is considered remote.
Report of Independent Registered Public Accounting Firm
To the Trustees of Fidelity Investment Trust and Shareholders of Fidelity International Small Cap Fund:
We have audited the accompanying statement of assets and liabilities of Fidelity International Small Cap Fund (the Fund), a fund of Fidelity Investment Trust, including the schedule of investments, as of October 31, 2017, and the related statement of operations for the year then ended, the statement of changes in net assets for each of the two years in the period then ended, and the financial highlights for each of the five years in the period then ended. These financial statements and financial highlights are the responsibility of the Fund's management. Our responsibility is to express an opinion on these financial statements and financial highlights based on our audits.
We conducted our audits in accordance with the standards of the Public Company Accounting Oversight Board (United States). Those standards require that we plan and perform the audit to obtain reasonable assurance about whether the financial statements and financial highlights are free of material misstatement. The Fund is not required to have, nor were we engaged to perform, an audit of its internal control over financial reporting. Our audits included consideration of internal control over financial reporting as a basis for designing audit procedures that are appropriate in the circumstances, but not for the purpose of expressing an opinion on the effectiveness of the Fund's internal control over financial reporting. Accordingly, we express no such opinion. An audit also includes examining, on a test basis, evidence supporting the amounts and disclosures in the financial statements, assessing the accounting principles used and significant estimates made by management, as well as evaluating the overall financial statement presentation. Our procedures included confirmation of securities owned as of October 31, 2017, by correspondence with the custodians and brokers; when replies were not received from brokers, we performed other auditing procedures. We believe that our audits provide a reasonable basis for our opinion.
In our opinion, such financial statements and financial highlights referred to above present fairly, in all material respects, the financial position of Fidelity International Small Cap Fund as of October 31, 2017, the results of its operations for the year then ended, the changes in its net assets for each of the two years in the period then ended, and the financial highlights for each of the five years in the period then ended in conformity with accounting principles generally accepted in the United States of America.
DELOITTE & TOUCHE LLP
Boston, Massachusetts
December 15, 2017
Trustees and Officers
The Trustees, Members of the Advisory Board (if any), and officers of the trust and fund, as applicable, are listed below. The Board of Trustees governs the fund and is responsible for protecting the interests of shareholders. The Trustees are experienced executives who meet periodically throughout the year to oversee the fund's activities, review contractual arrangements with companies that provide services to the fund, oversee management of the risks associated with such activities and contractual arrangements, and review the fund's performance. Except for Jonathan Chiel, each of the Trustees oversees 190 funds. Mr. Chiel oversees 143 funds.
The Trustees hold office without limit in time except that (a) any Trustee may resign; (b) any Trustee may be removed by written instrument, signed by at least two-thirds of the number of Trustees prior to such removal; (c) any Trustee who requests to be retired or who has become incapacitated by illness or injury may be retired by written instrument signed by a majority of the other Trustees; and (d) any Trustee may be removed at any special meeting of shareholders by a two-thirds vote of the outstanding voting securities of the trust. Each Trustee who is not an interested person (as defined in the 1940 Act) of the trust and the fund is referred to herein as an Independent Trustee. Each Independent Trustee shall retire not later than the last day of the calendar year in which his or her 75th birthday occurs. The Independent Trustees may waive this mandatory retirement age policy with respect to individual Trustees. Officers and Advisory Board Members hold office without limit in time, except that any officer or Advisory Board Member may resign or may be removed by a vote of a majority of the Trustees at any regular meeting or any special meeting of the Trustees. Except as indicated, each individual has held the office shown or other offices in the same company for the past five years.
The fund’s Statement of Additional Information (SAI) includes more information about the Trustees. To request a free copy, call Fidelity at 1-877-208-0098.
Experience, Skills, Attributes, and Qualifications of the Trustees. The Governance and Nominating Committee has adopted a statement of policy that describes the experience, qualifications, attributes, and skills that are necessary and desirable for potential Independent Trustee candidates (Statement of Policy). The Board believes that each Trustee satisfied at the time he or she was initially elected or appointed a Trustee, and continues to satisfy, the standards contemplated by the Statement of Policy. The Governance and Nominating Committee also engages professional search firms to help identify potential Independent Trustee candidates who have the experience, qualifications, attributes, and skills consistent with the Statement of Policy. From time to time, additional criteria based on the composition and skills of the current Independent Trustees, as well as experience or skills that may be appropriate in light of future changes to board composition, business conditions, and regulatory or other developments, have also been considered by the professional search firms and the Governance and Nominating Committee. In addition, the Board takes into account the Trustees' commitment and participation in Board and committee meetings, as well as their leadership of standing and ad hoc committees throughout their tenure.
In determining that a particular Trustee was and continues to be qualified to serve as a Trustee, the Board has considered a variety of criteria, none of which, in isolation, was controlling. The Board believes that, collectively, the Trustees have balanced and diverse experience, qualifications, attributes, and skills, which allow the Board to operate effectively in governing the fund and protecting the interests of shareholders. Information about the specific experience, skills, attributes, and qualifications of each Trustee, which in each case led to the Board's conclusion that the Trustee should serve (or continue to serve) as a trustee of the fund, is provided below.
Board Structure and Oversight Function. James C. Curvey is an interested person and currently serves as Chairman. The Trustees have determined that an interested Chairman is appropriate and benefits shareholders because an interested Chairman has a personal and professional stake in the quality and continuity of services provided to the fund. Independent Trustees exercise their informed business judgment to appoint an individual of their choosing to serve as Chairman, regardless of whether the Trustee happens to be independent or a member of management. The Independent Trustees have determined that they can act independently and effectively without having an Independent Trustee serve as Chairman and that a key structural component for assuring that they are in a position to do so is for the Independent Trustees to constitute a substantial majority for the Board. The Independent Trustees also regularly meet in executive session. Ned C. Lautenbach serves as Chairman of the Independent Trustees and as such (i) acts as a liaison between the Independent Trustees and management with respect to matters important to the Independent Trustees and (ii) with management prepares agendas for Board meetings.
Fidelity® funds are overseen by different Boards of Trustees. The fund's Board oversees Fidelity's high income and certain equity funds, and other Boards oversee Fidelity's investment-grade bond, money market, asset allocation, and sector funds. The asset allocation funds may invest in Fidelity® funds overseen by the fund's Board. The use of separate Boards, each with its own committee structure, allows the Trustees of each group of Fidelity® funds to focus on the unique issues of the funds they oversee, including common research, investment, and operational issues. On occasion, the separate Boards establish joint committees to address issues of overlapping consequences for the Fidelity® funds overseen by each Board.
The Trustees operate using a system of committees to facilitate the timely and efficient consideration of all matters of importance to the Trustees, the fund, and fund shareholders and to facilitate compliance with legal and regulatory requirements and oversight of the fund's activities and associated risks. The Board, acting through its committees, has charged FMR and its affiliates with (i) identifying events or circumstances the occurrence of which could have demonstrably adverse effects on the fund's business and/or reputation; (ii) implementing processes and controls to lessen the possibility that such events or circumstances occur or to mitigate the effects of such events or circumstances if they do occur; and (iii) creating and maintaining a system designed to evaluate continuously business and market conditions in order to facilitate the identification and implementation processes described in (i) and (ii) above. Because the day-to-day operations and activities of the fund are carried out by or through FMR, its affiliates, and other service providers, the fund's exposure to risks is mitigated but not eliminated by the processes overseen by the Trustees. While each of the Board's committees has responsibility for overseeing different aspects of the fund's activities, oversight is exercised primarily through the Operations, Audit, and Compliance Committees. In addition, the Independent Trustees have worked with FMR to enhance the Board's oversight of investment and financial risks, legal and regulatory risks, technology risks, and operational risks, including the development of additional risk reporting to the Board. For example, a working group comprised of Independent Trustees and FMR has worked and continues to work to review the Fidelity® funds' valuation-related activities, reporting and risk management. Appropriate personnel, including but not limited to the fund's Chief Compliance Officer (CCO), FMR's internal auditor, the independent accountants, the fund's Treasurer and portfolio management personnel, make periodic reports to the Board's committees, as appropriate, including an annual review of Fidelity's risk management program for the Fidelity® funds. The responsibilities of each standing committee, including their oversight responsibilities, are described further under "Standing Committees of the Trustees."
Interested Trustees*:
Correspondence intended for a Trustee who is an interested person may be sent to Fidelity Investments, 245 Summer Street, Boston, Massachusetts 02210.
Name, Year of Birth; Principal Occupations and Other Relevant Experience+
Jonathan Chiel (1957)
Year of Election or Appointment: 2016
Trustee
Mr. Chiel also serves as Trustee of other Fidelity® funds. Mr. Chiel is Executive Vice President and General Counsel for FMR LLC (diversified financial services company, 2012-present). Previously, Mr. Chiel served as general counsel (2004-2012) and senior vice president and deputy general counsel (2000-2004) for John Hancock Financial Services; a partner with Choate, Hall & Stewart (1996-2000) (law firm); and an Assistant United States Attorney for the United States Attorney’s Office of the District of Massachusetts (1986-95), including Chief of the Criminal Division (1993-1995). Mr. Chiel is a director on the boards of the Boston Bar Foundation and the Maimonides School.
James C. Curvey (1935)
Year of Election or Appointment: 2007
Trustee
Chairman of the Board of Trustees
Mr. Curvey also serves as Trustee of other Fidelity® funds. Mr. Curvey is a Director of Fidelity Research & Analysis Co. (investment adviser firm, 2009-present), and Vice Chairman (2007-present) and Director of FMR LLC (diversified financial services company). In addition, Mr. Curvey serves as an Overseer for the Boston Symphony Orchestra and a member of the board of Artis-Naples, Naples, Florida, and as a Trustee for Brewster Academy, Wolfeboro, New Hampshire. Previously, Mr. Curvey served as a Director of Fidelity Investments Money Management, Inc. (investment adviser firm, 2009-2014) and a Director of FMR and FMR Co., Inc. (investment adviser firms, 2007-2014).
Charles S. Morrison (1960)
Year of Election or Appointment: 2014
Trustee
Mr. Morrison also serves as Trustee of other funds. He serves as President of Fidelity Management & Research Company (FMR) (investment adviser firm, 2016-present), a Director of Fidelity Investments Money Management, Inc. (FIMM) (investment adviser firm, 2014-present), Director of Fidelity SelectCo, LLC (investment adviser firm, 2014-present), President, Asset Management (2014-present), and is an employee of Fidelity Investments. Previously, Mr. Morrison served as Vice President of Fidelity's Fixed Income and Asset Allocation Funds (2012-2014), President, Fixed Income (2011-2014), Vice President of Fidelity's Money Market Funds (2005-2009), President, Money Market Group Leader of FMR (investment adviser firm, 2009), and Senior Vice President, Money Market Group of FMR (2004-2009). Mr. Morrison also served as Vice President of Fidelity's Bond Funds (2002-2005), certain Balanced Funds (2002-2005), and certain Asset Allocation Funds (2002-2007), and as Senior Vice President (2002-2005) of Fidelity's Bond Division.
* Determined to be an “Interested Trustee” by virtue of, among other things, his or her affiliation with the trust or various entities under common control with FMR.
+ The information includes the Trustee's principal occupation during the last five years and other information relating to the experience, attributes, and skills relevant to the Trustee's qualifications to serve as a Trustee, which led to the conclusion that the Trustee should serve as a Trustee for the fund.
Independent Trustees:
Correspondence intended for an Independent Trustee may be sent to Fidelity Investments, P.O. Box 55235, Boston, Massachusetts 02205-5235.
Name, Year of Birth; Principal Occupations and Other Relevant Experience+
Dennis J. Dirks (1948)
Year of Election or Appointment: 2005
Trustee
Mr. Dirks also serves as Trustee of other Fidelity® funds. Prior to his retirement in May 2003, Mr. Dirks was Chief Operating Officer and a member of the Board of The Depository Trust & Clearing Corporation (DTCC). He also served as President, Chief Operating Officer, and Board member of The Depository Trust Company (DTC) and President and Board member of the National Securities Clearing Corporation (NSCC). In addition, Mr. Dirks served as Chief Executive Officer and Board member of the Government Securities Clearing Corporation, Chief Executive Officer and Board member of the Mortgage-Backed Securities Clearing Corporation, as a Trustee and a member of the Finance Committee of Manhattan College (2005-2008), as a Trustee and a member of the Finance Committee of AHRC of Nassau County (2006-2008), as a member of the Independent Directors Council (IDC) Governing Council (2010-2015), and as a member of the Board of Directors for The Brookville Center for Children’s Services, Inc. (2009-2017). Mr. Dirks is a member of the Finance Committee (2016-present) and Board of Directors (2017-present) of the Asolo Repertory Theatre.
Alan J. Lacy (1953)
Year of Election or Appointment: 2008
Trustee
Mr. Lacy also serves as Trustee of other Fidelity® funds. Mr. Lacy serves as a Director of Bristol-Myers Squibb Company (global pharmaceuticals, 2008-present). He is a Trustee of the California Chapter of The Nature Conservancy (2015-present) and a Director of the Center for Advanced Study in the Behavioral Sciences at Stanford University (2015-present). In addition, Mr. Lacy served as Senior Adviser (2007-2014) of Oak Hill Capital Partners, L.P. (private equity) and also served as Chief Executive Officer (2005) and Vice Chairman (2005-2006) of Sears Holdings Corporation (retail) and Chief Executive Officer and Chairman of the Board of Sears, Roebuck and Co. (retail, 2000-2005). Previously, Mr. Lacy served as Chairman (2014-2017) and a member (2010-2017) of the Board of Directors of Dave & Buster’s Entertainment, Inc. (restaurant and entertainment complexes), as Chairman (2008-2011) and a member (2006-2015) of the Board of Trustees of the National Parks Conservation Association, and as a member of the Board of Directors for The Hillman Companies, Inc. (hardware wholesalers, 2010-2014), Earth Fare, Inc. (retail grocery, 2010-2014), and The Western Union Company (global money transfer, 2006-2011).
Ned C. Lautenbach (1944)
Year of Election or Appointment: 2000
Trustee
Chairman of the Independent Trustees
Mr. Lautenbach also serves as Trustee of other Fidelity® funds. Mr. Lautenbach currently serves as Vice Chair of the Board of Governors, State University System of Florida (2013-present) and is a member of the Council on Foreign Relations (1994-present). He is also a member and has most recently served as Chairman of the Board of Directors of Artis-Naples (2012-present). Previously, Mr. Lautenbach served as a member and then Lead Director of the Board of Directors of Eaton Corporation (diversified industrial, 1997-2016). He was also a Partner and Advisory Partner at Clayton, Dubilier & Rice, LLC (private equity investment, 1998-2010), as well as a Director of Sony Corporation (2006-2007). In addition, Mr. Lautenbach also had a 30-year career with IBM (technology company) during which time he served as Senior Vice President and a member of the Corporate Executive Committee (1968-1998).
Joseph Mauriello (1944)
Year of Election or Appointment: 2008
Trustee
Mr. Mauriello also serves as Trustee of other Fidelity® funds. Prior to his retirement in January 2006, Mr. Mauriello served in numerous senior management positions including Deputy Chairman and Chief Operating Officer (2004-2005), and Vice Chairman of Financial Services (2002-2004) of KPMG LLP US (professional services, 1965-2005). Mr. Mauriello currently serves as a member of the Board of Directors of XL Group plc. (global insurance and re-insurance, 2006-present) and the Independent Directors Council (IDC) Governing Council (2015-present). Previously, Mr. Mauriello served as a Director of the Hamilton Funds of the Bank of New York (2006-2007) and of Arcadia Resources Inc. (health care services and products, 2007-2012).
Cornelia M. Small (1944)
Year of Election or Appointment: 2005
Trustee
Ms. Small also serves as Trustee of other Fidelity® funds. Ms. Small is a member of the Board of Directors (2009-present) and Chair of the Investment Committee (2010-present) of the Teagle Foundation. Ms. Small also serves on the Investment Committee of the Berkshire Taconic Community Foundation (2008-present). Previously, Ms. Small served as Chairperson (2002-2008) and a member of the Investment Committee and Chairperson (2008-2012) and a member of the Board of Trustees of Smith College. In addition, Ms. Small served as Chief Investment Officer, Director of Global Equity Investments, and a member of the Board of Directors of Scudder, Stevens & Clark and Scudder Kemper Investments.
William S. Stavropoulos (1939)
Year of Election or Appointment: 2001
Trustee
Vice Chairman of the Independent Trustees
Mr. Stavropoulos also serves as Trustee of other Fidelity® funds. Mr. Stavropoulos serves as President and Founder of the Michigan Baseball Foundation, the Great Lakes Loons (2007-present). Mr. Stavropoulos is Chairman Emeritus of the Board of Directors of The Dow Chemical Company, where he previously served in numerous senior management positions, including President, CEO (1995-2000; 2002-2004), Chairman of the Executive Committee (2000-2006), and as a member of the Board of Directors (1990-2006). Currently, Mr. Stavropoulos is Chairman of the Board of Directors of Univar Inc. (global distributor of commodity and specialty chemicals), a Director of Teradata Corporation (data warehousing and technology solutions), and a member of the Advisory Board for Metalmark Capital LLC (private equity investment, 2005-present). Mr. Stavropoulos is an operating advisor to Clayton, Dubilier & Rice, LLC (private equity investment). In addition, Mr. Stavropoulos is a member of the University of Notre Dame Advisory Council for the College of Science, a Trustee of the Rollin L. Gerstacker Foundation, and a Director of Artis-Naples in Naples, Florida. Previously, Mr. Stavropoulos served as a Director of Chemical Financial Corporation (bank holding company, 1993-2012) and Tyco International, Ltd. (multinational manufacturing and services, 2007-2012).
David M. Thomas (1949)
Year of Election or Appointment: 2008
Trustee
Mr. Thomas also serves as Trustee of other Fidelity® funds. Mr. Thomas serves as Non-Executive Chairman of the Board of Directors of Fortune Brands Home and Security (home and security products, 2011-present), as a member of the Board of Directors (2004-present) and Presiding Director (2013-present) of Interpublic Group of Companies, Inc. (marketing communication), and as a member of the Board of Trustees of the University of Florida (2013-present). Previously, Mr. Thomas served as Executive Chairman (2005-2006) and Chairman and Chief Executive Officer (2000-2005) of IMS Health, Inc. (pharmaceutical and healthcare information solutions), and a Director of Fortune Brands, Inc. (consumer products, 2000-2011).
+ The information includes the Trustee's principal occupation during the last five years and other information relating to the experience, attributes, and skills relevant to the Trustee's qualifications to serve as a Trustee, which led to the conclusion that the Trustee should serve as a Trustee for the fund.
Advisory Board Members and Officers:
Correspondence intended for an officer or Peter S. Lynch may be sent to Fidelity Investments, 245 Summer Street, Boston, Massachusetts 02210. Officers appear below in alphabetical order.
Name, Year of Birth; Principal Occupation
Peter S. Lynch (1944)
Year of Election or Appointment: 2003
Member of the Advisory Board
Mr. Lynch also serves as Member of the Advisory Board of other Fidelity® funds. Mr. Lynch is Vice Chairman and a Director of FMR (investment adviser firm) and FMR Co., Inc. (investment adviser firm). In addition, Mr. Lynch serves as a Trustee of Boston College and as the Chairman of the Inner-City Scholarship Fund. Previously, Mr. Lynch served on the Special Olympics International Board of Directors (1997-2006).
Elizabeth Paige Baumann (1968)
Year of Election or Appointment: 2017
Anti-Money Laundering (AML) Officer
Ms. Baumann also serves as AML Officer of other funds. She is Chief AML Officer (2012-present) and Senior Vice President (2014-present) of FMR LLC (diversified financial services company) and is an employee of Fidelity Investments. Previously, Ms. Baumann served as AML Officer of the funds (2012-2016), and Vice President (2007-2014) and Deputy Anti-Money Laundering Officer (2007-2012) of FMR LLC.
Marc R. Bryant (1966)
Year of Election or Appointment: 2015
Secretary and Chief Legal Officer (CLO)
Mr. Bryant also serves as Secretary and CLO of other funds. Mr. Bryant serves as CLO, Secretary, and Senior Vice President of Fidelity Management & Research Company (investment adviser firm, 2015-present) and FMR Co., Inc. (investment adviser firm, 2015-present); Secretary of Fidelity SelectCo, LLC (investment adviser firm, 2015-present) and Fidelity Investments Money Management, Inc. (investment adviser firm, 2015-present); and CLO of Fidelity Management & Research (Hong Kong) Limited and FMR Investment Management (UK) Limited (investment adviser firms, 2015-present) and Fidelity Management & Research (Japan) Limited (investment adviser firm, 2016-present). He is Senior Vice President and Deputy General Counsel of FMR LLC (diversified financial services company). Previously, Mr. Bryant served as Secretary and CLO of Fidelity Rutland Square Trust II (2010-2014) and Assistant Secretary of Fidelity's Fixed Income and Asset Allocation Funds (2013-2015). Prior to joining Fidelity Investments, Mr. Bryant served as a Senior Vice President and the Head of Global Retail Legal for AllianceBernstein L.P. (2006-2010), and as the General Counsel for ProFund Advisors LLC (2001-2006).
William C. Coffey (1969)
Year of Election or Appointment: 2009
Assistant Secretary
Mr. Coffey also serves as Assistant Secretary of other funds. He is Senior Vice President and Deputy General Counsel of FMR LLC (diversified financial services company, 2010-present), and is an employee of Fidelity Investments. Previously, Mr. Coffey served as Vice President and Associate General Counsel of FMR LLC (2005-2009).
Jonathan Davis (1968)
Year of Election or Appointment: 2010
Assistant Treasurer
Mr. Davis also serves as Assistant Treasurer of other funds, and is an employee of Fidelity Investments. Previously, Mr. Davis served as Vice President and Associate General Counsel of FMR LLC (diversified financial services company, 2003-2010).
Adrien E. Deberghes (1967)
Year of Election or Appointment: 2016
Assistant Treasurer
Mr. Deberghes also serves as an officer of other funds. He serves as Executive Vice President of Fidelity Investments Money Management, Inc. (FIMM) (investment adviser firm, 2016-present) and is an employee of Fidelity Investments (2008-present). Prior to joining Fidelity Investments, Mr. Deberghes was Senior Vice President of Mutual Fund Administration at State Street Corporation (2007-2008), Senior Director of Mutual Fund Administration at Investors Bank & Trust (2005-2007), and Director of Finance for Dunkin' Brands (2000-2005). Previously, Mr. Deberghes served in other fund officer roles.
Stephanie J. Dorsey (1969)
Year of Election or Appointment: 2010
Assistant Treasurer
Ms. Dorsey also serves as an officer of other funds. She is an employee of Fidelity Investments (2008-present) and has served in other fund officer roles. Prior to joining Fidelity Investments, Ms. Dorsey served as Treasurer (2004-2008) of the JPMorgan Mutual Funds and Vice President (2004-2008) of JPMorgan Chase Bank.
Howard J. Galligan III (1966)
Year of Election or Appointment: 2014
Chief Financial Officer
Mr. Galligan also serves as Chief Financial Officer of other funds. Mr. Galligan serves as President of Fidelity Pricing and Cash Management Services (FPCMS) (2014-present) and as a Director of Strategic Advisers, Inc. (investment adviser firm, 2008-present). Previously, Mr. Galligan served as Chief Administrative Officer of Asset Management (2011-2014) and Chief Operating Officer and Senior Vice President of Investment Support for Strategic Advisers, Inc. (2003-2011).
Thomas C. Hense (1964)
Year of Election or Appointment: 2008, 2010, or 2015
Vice President
Mr. Hense serves as Vice President of Fidelity Advisor® Multi-Asset Income Fund (2015) and other funds (High Income (2008), Small Cap (2008), and Value (2010) funds), and is an employee of Fidelity Investments (1993-present). Previously, Mr. Hense served as a portfolio manager for Fidelity's Institutional Money Management Group (Pyramis) (2003-2008).
Brian B. Hogan (1964)
Year of Election or Appointment: 2009
Vice President
Mr. Hogan also serves as Trustee or Vice President of other funds. Mr. Hogan serves as a Director of FMR Investment Management (UK) Limited (investment adviser firm, 2015-present) and Fidelity SelectCo, LLC (investment adviser firm, 2014-present) and President of the Equity Division of FMR (investment adviser firm, 2009-present). Previously, Mr. Hogan served as Senior Vice President, Equity Research of FMR (2006-2009) and as a portfolio manager. Mr. Brian B. Hogan is not related to Mr. Colm A. Hogan.
Colm A. Hogan (1973)
Year of Election or Appointment: 2016
Deputy Treasurer
Mr. Hogan also serves as an officer of other funds. Mr. Hogan is an employee of Fidelity Investments (2005-present). Mr. Colm A. Hogan is not related to Mr. Brian B. Hogan.
Chris Maher (1972)
Year of Election or Appointment: 2013
Assistant Treasurer
Mr. Maher serves as Assistant Treasurer of other funds. Mr. Maher is Vice President of Valuation Oversight and is an employee of Fidelity Investments. Previously, Mr. Maher served as Vice President of Asset Management Compliance (2013), Vice President of the Program Management Group of FMR (investment adviser firm, 2010-2013), and Vice President of Valuation Oversight (2008-2010).
Rieco E. Mello (1969)
Year of Election or Appointment: 2017
Assistant Treasurer
Mr. Mello also serves as Assistant Treasurer of other funds. Mr. Mello is an employee of Fidelity Investments (1995-present).
Kenneth B. Robins (1969)
Year of Election or Appointment: 2016
Chief Compliance Officer
Mr. Robins also serves as an officer of other funds. Mr. Robins serves as Compliance Officer of Fidelity Management & Research Company and FMR Co., Inc. (investment adviser firms, 2016-present) and is an employee of Fidelity Investments (2004-present). Previously, Mr. Robins served as Executive Vice President of Fidelity Investments Money Management, Inc. (investment adviser firm, 2013-2016) and served in other fund officer roles.
Stacie M. Smith (1974)
Year of Election or Appointment: 2016
President and Treasurer
Ms. Smith also serves as an officer of other funds. She is an employee of Fidelity Investments (2009-present) and has served in other fund officer roles. Prior to joining Fidelity Investments, Ms. Smith served as Senior Audit Manager of Ernst & Young LLP (accounting firm, 1996-2009). Previously, Ms. Smith served as Deputy Treasurer of certain Fidelity® funds (2013-2016).
Marc L. Spector (1972)
Year of Election or Appointment: 2016
Assistant Treasurer
Mr. Spector also serves as an officer of other funds. Mr. Spector is an employee of Fidelity Investments (2016-present). Prior to joining Fidelity Investments, Mr. Spector served as Director at the Siegfried Group (accounting firm, 2013-2016), and prior to Siegfried Group as audit senior manager at Deloitte & Touche (accounting firm, 2005-2013).
Renee Stagnone (1975)
Year of Election or Appointment: 2016
Assistant Treasurer
Ms. Stagnone also serves as an officer of other funds. Ms. Stagnone is an employee of Fidelity Investments (1997-present). Previously, Ms. Stagnone served as Deputy Treasurer of certain Fidelity® funds (2013-2016).
Shareholder Expense Example
As a shareholder of the Fund, you incur two types of costs: (1) transaction costs, including sales charges (loads) on purchase payments or redemption proceeds, redemption fees and (2) ongoing costs, including management fees, distribution and/or service (12b-1) fees and other Fund expenses. This Example is intended to help you understand your ongoing costs (in dollars) of investing in the Fund and to compare these costs with the ongoing costs of investing in other mutual funds.
The Example is based on an investment of $1,000 invested at the beginning of the period and held for the entire period (May 1, 2017 to October 31, 2017).
Actual Expenses
The first line of the accompanying table for each class of the Fund provides information about actual account values and actual expenses. You may use the information in this line, together with the amount you invested, to estimate the expenses that you paid over the period. Simply divide your account value by $1,000.00 (for example, an $8,600 account value divided by $1,000.00 = 8.6), then multiply the result by the number in the first line for a class of the Fund under the heading entitled "Expenses Paid During Period" to estimate the expenses you paid on your account during this period. A small balance maintenance fee of $12.00 that is charged once a year may apply for certain accounts with a value of less than $2,000. This fee is not included in the table below. If it was, the estimate of expenses you paid during the period would be higher, and your ending account value lower, by this amount. In addition, the Fund, as a shareholder in the underlying Fidelity Central Funds, will indirectly bear its pro-rata share of the fees and expenses incurred by the underlying Fidelity Central Funds. These fees and expenses are not included in the Fund's annualized expense ratio used to calculate the expense estimate in the table below.
Hypothetical Example for Comparison Purposes
The second line of the accompanying table for each class of the Fund provides information about hypothetical account values and hypothetical expenses based on a Class' actual expense ratio and an assumed rate of return of 5% per year before expenses, which is not the Class' actual return. The hypothetical account values and expenses may not be used to estimate the actual ending account balance or expenses you paid for the period. You may use this information to compare the ongoing costs of investing in the Fund and other funds. To do so, compare this 5% hypothetical example with the 5% hypothetical examples that appear in the shareholder reports of the other funds. A small balance maintenance fee of $12.00 that is charged once a year may apply for certain accounts with a value of less than $2,000. This fee is not included in the table below. If it was, the estimate of expenses you paid during the period would be higher, and your ending account value lower, by this amount. In addition, the Fund, as a shareholder in the underlying Fidelity Central Funds, will indirectly bear its pro-rata share of the fees and expenses incurred by the underlying Fidelity Central Funds. These fees and expenses are not included in the Fund's annualized expense ratio used to calculate the expense estimate in the table below.
Please note that the expenses shown in the table are meant to highlight your ongoing costs only and do not reflect any transaction costs. Therefore, the second line of the table is useful in comparing ongoing costs only, and will not help you determine the relative total costs of owning different funds. In addition, if these transactional costs were included, your costs would have been higher.
| | Annualized Expense Ratio-A | Beginning
Account Value
May 1, 2017 | Ending
Account Value
October 31, 2017 | Expenses Paid
During Period-B
May 1, 2017
to October 31, 2017 |
| Class A | 1.54% | | | |
| Actual | | $1,000.00 | $1,131.60 | $8.27 |
| Hypothetical-C | | $1,000.00 | $1,017.44 | $7.83 |
| Class M | 1.82% | | | |
| Actual | | $1,000.00 | $1,130.20 | $9.77 |
| Hypothetical-C | | $1,000.00 | $1,016.03 | $9.25 |
| Class C | 2.32% | | | |
| Actual | | $1,000.00 | $1,127.50 | $12.44 |
| Hypothetical-C | | $1,000.00 | $1,013.51 | $11.77 |
| International Small Cap | 1.24% | | | |
| Actual | | $1,000.00 | $1,133.20 | $6.67 |
| Hypothetical-C | | $1,000.00 | $1,018.95 | $6.31 |
| Class I | 1.29% | | | |
| Actual | | $1,000.00 | $1,133.50 | $6.94 |
| Hypothetical-C | | $1,000.00 | $1,018.70 | $6.56 |
A Annualized expense ratio reflects expenses net of applicable fee waivers.
B Expenses are equal to each Class' annualized expense ratio, multiplied by the average account value over the period, multiplied by 184/365 (to reflect the one-half year period).
C 5% return per year before expenses
Distributions (Unaudited)
The Board of Trustees of Fidelity International Small Cap Fund voted to pay to shareholders of record at the opening of business on record date, the following distributions per share derived from capital gains realized from sales of portfolio securities, and dividends derived from net investment income:
| | Pay Date | Record Date | Dividends | Capital Gains |
| Fidelity International Small Cap Fund | | | | |
| Class A | 12/11/17 | 12/08/17 | $0.230 | $0.737 |
| Class M | 12/11/17 | 12/08/17 | $0.151 | $0.737 |
| Class C | 12/11/17 | 12/08/17 | $0.103 | $0.737 |
| Fidelity International Small Cap | 12/11/17 | 12/08/17 | $0.292 | $0.737 |
| Class I | 12/11/17 | 12/08/17 | $0.304 | $0.737 |
|
The fund hereby designates as a capital gain dividend with respect to the taxable year ended October 31, 2017, $25,367,408, or, if subsequently determined to be different, the net capital gain of such year.
Class A, Class M, Class C, Fidelity International Small Cap, and Class I designate 100% of the dividend distributed during the fiscal year as amounts which may be taken into account as a dividend for purposes of the maximum rate under section 1(h)(11) of the Internal Revenue Code.
The amounts per share which represent income derived from sources within, and taxes paid to, foreign countries or possessions of the United States are as follows:
| | Pay Date | Income | Taxes |
| Fidelity International Small Cap Fund | | | |
| Class A | 12/12/16 | $0.3637 | $0.0427 |
| Class M | 12/12/16 | $0.2737 | $0.0427 |
| Class C | 12/12/16 | $0.1687 | $0.0427 |
| Fidelity International Small Cap | 12/12/16 | $0.4277 | $0.0427 |
| Class I | 12/12/16 | $0.4577 | $0.0427 |
|
The fund will notify shareholders in January 2018 of amounts for use in preparing 2017 income tax returns.
Board Approval of Investment Advisory Contracts and Management Fees
Fidelity International Small Cap Fund
Each year, the Board of Trustees, including the Independent Trustees (together, the Board), votes on the renewal of the management contract with Fidelity Management & Research Company (FMR) and the sub-advisory agreements (together, the Advisory Contracts) for the fund. FMR and the sub-advisers are referred to herein as the Investment Advisers. The Board, assisted by the advice of fund counsel and Independent Trustees' counsel, requests and considers a broad range of information relevant to the renewal of the Advisory Contracts throughout the year.
The Board meets regularly and, at each of its meetings, covers an extensive agenda of topics and materials and considers factors that are relevant to its annual consideration of the renewal of the fund's Advisory Contracts, including the services and support provided to the fund and its shareholders. The Board has established various standing committees (Committees), each composed of and chaired by Independent Trustees with varying backgrounds, to which the Board has assigned specific subject matter responsibilities in order to enhance effective decision-making by the Board. The Board, acting directly and through its Committees, requests and receives information concerning the annual consideration of the renewal of the fund's Advisory Contracts. The Board also meets as needed to review matters specifically related to the Board's annual consideration of the renewal of the Advisory Contracts. Members of the Board may also meet with trustees of other Fidelity funds through ad hoc joint committees to discuss certain matters relevant to all of the Fidelity funds.
At its July 2017 meeting, the Board unanimously determined to renew the fund's Advisory Contracts. In reaching its determination, the Board considered all factors it believed relevant, including (i) the nature, extent, and quality of the services to be provided to the fund and its shareholders (including the investment performance of the fund); (ii) the competitiveness of the fund's management fee and total expense ratio relative to peer funds; (iii) the total costs of the services to be provided by and the profits to be realized by Fidelity from its relationships with the fund; and (iv) the extent to which, if any, economies of scale exist and would be realized as the fund grows, and whether any economies of scale are appropriately shared with fund shareholders.
In considering whether to renew the Advisory Contracts for the fund, the Board reached a determination, with the assistance of fund counsel and Independent Trustees' counsel and through the exercise of its business judgment, that the renewal of the Advisory Contracts was in the best interests of the fund and its shareholders and that the compensation payable under the Advisory Contracts was fair and reasonable. The Board's decision to renew the Advisory Contracts was not based on any single factor, but rather was based on a comprehensive consideration of all the information provided to the Board at its meetings throughout the year. The Board, in reaching its determination to renew the Advisory Contracts, was aware that shareholders of the fund have a broad range of investment choices available to them, including a wide choice among funds offered by Fidelity's competitors, and that the fund's shareholders, who have the opportunity to review and weigh the disclosure provided by the fund in its prospectus and other public disclosures, have chosen to invest in this fund, which is part of the Fidelity family of funds.
Amendment to Group Fee Rate. The Board also approved an amendment to the management contract for the fund to add an additional breakpoint to the group fee schedule, effective October 1, 2017. The Board noted that the additional breakpoint would result in lower management fee rates as Fidelity's assets under management increase.
Nature, Extent, and Quality of Services Provided. The Board considered Fidelity's staffing as it relates to the fund, including the backgrounds of investment personnel of Fidelity, and also considered the fund's investment objective, strategies, and related investment philosophy. The Independent Trustees also had discussions with senior management of Fidelity's investment operations and investment groups. The Board considered the structure of the investment personnel compensation program and whether this structure provides appropriate incentives to act in the best interests of the fund. Additionally, the Board considered the portfolio managers' investments, if any, in the funds that they manage.
Resources Dedicated to Investment Management and Support Services. The Board and the Fund Oversight and Research Committees reviewed the general qualifications and capabilities of Fidelity's investment staff, including its size, education, experience, and resources, as well as Fidelity's approach to recruiting, training, managing, and compensating investment personnel. The Board noted that Fidelity has continued to increase the resources devoted to non-U.S. offices, including expansion of Fidelity's global investment organization. The Board also noted that Fidelity's analysts have extensive resources, tools and capabilities that allow them to conduct sophisticated quantitative and fundamental analysis, as well as credit analysis of issuers, counterparties and guarantors. Further, the Board considered that Fidelity's investment professionals have sufficient access to global information and data so as to provide competitive investment results over time, and that those professionals also have access to sophisticated tools that permit them to assess portfolio construction and risk and performance attribution characteristics continuously, as well as to transmit new information and research conclusions rapidly around the world. Additionally, in its deliberations, the Board considered Fidelity's trading, risk management, compliance, and technology and operations capabilities and resources, which are integral parts of the investment management process.
Shareholder and Administrative Services. The Board considered (i) the nature, extent, quality, and cost of advisory, administrative, and shareholder services performed by the Investment Advisers and their affiliates under the Advisory Contracts and under separate agreements covering transfer agency, pricing and bookkeeping, and securities lending services for the fund; (ii) the nature and extent of the supervision of third party service providers, principally custodians, subcustodians, and pricing vendors; and (iii) the resources devoted to, and the record of compliance with, the fund's compliance policies and procedures. The Board also reviewed the allocation of fund brokerage, including allocations to brokers affiliated with the Investment Advisers, the use of brokerage commissions to pay fund expenses, and the use of "soft" commission dollars to pay for research services.
The Board noted that the growth of fund assets over time across the complex allows Fidelity to reinvest in the development of services designed to enhance the value or convenience of the Fidelity funds as investment vehicles. These services include 24-hour access to account information and market information through telephone representatives and over the Internet, investor education materials and asset allocation tools, and the expanded availability of Fidelity Investor Centers.
In 2014, the Board formed an ad hoc Committee on Transfer Agency Fees to review the variety of transfer agency fee structures throughout the industry and Fidelity's competitive positioning with respect to industry participants.
Investment in a Large Fund Family. The Board considered the benefits to shareholders of investing in a Fidelity fund, including the benefits of investing in a fund that is part of a large family of funds offering a variety of investment disciplines and providing a large variety of mutual fund investor services. The Board noted that Fidelity had taken, or had made recommendations that resulted in the Fidelity funds taking, a number of actions over the previous year that benefited particular funds, including: (i) continuing to dedicate additional resources to Fidelity's investment research process, and to the support of the senior management team that oversees asset management; (ii) continuing efforts to enhance Fidelity's global research capabilities; (iii) launching new funds and making other enhancements to meet client needs; (iv) launching new share classes of existing funds; (v) eliminating purchase minimums and broadening eligibility requirements for certain lower-priced share classes; (vi) reducing management fees and total expenses for certain growth equity funds and index funds; (vii) lowering expense caps for certain existing funds and classes to reduce expenses borne by shareholders; (viii) eliminating short-term redemption fees for certain funds; (ix) introducing a new pricing structure for certain funds of funds that is expected to reduce overall expenses paid by shareholders; (x) rationalizing product lines and gaining increased efficiencies through proposals for fund mergers and share class consolidations; (xi) continuing to develop, acquire and implement systems and technology to improve services to the funds and shareholders, strengthen information security, and increase efficiency; and (xii) implementing enhancements to further strengthen Fidelity's product line to increase investors' probability of success in achieving their investment goals, including retirement income goals.
Investment Performance. The Board considered whether the fund has operated in accordance with its investment objective, as well as its record of compliance with its investment restrictions and its performance history. The Board noted that there was a portfolio management change for the fund in March 2014.
The Board took into account discussions with representatives of the Investment Advisers about fund investment performance that occur at Board meetings throughout the year. In this regard the Board noted that as part of regularly scheduled fund reviews and other reports to the Board on fund performance, the Board considers annualized return information for the fund for different time periods, measured against a securities market index ("benchmark index") and a peer group of funds with similar objectives ("peer group"), if any. In its evaluation of fund investment performance, the Board gave particular attention to information indicating changes in performance of certain Fidelity funds for specific time periods and discussed with the Investment Advisers the reasons for any overperformance or underperformance.
In addition to reviewing absolute and relative fund performance, the Independent Trustees periodically consider the appropriateness of fund performance metrics in evaluating the results achieved. In general, the Independent Trustees believe that fund performance should be evaluated based on net performance (after fees and expenses) of both the highest performing and lowest performing fund share classes, where applicable, compared to appropriate benchmark indices, over appropriate time periods that may include full market cycles, and compared to peer groups, as applicable, over the same periods, taking into account relevant factors including the following: general market conditions; issuer-specific information; and fund cash flows and other factors.
The Independent Trustees recognize that shareholders evaluate performance on a net basis over their own holding periods, for which one-, three-, and five-year periods are often used as a proxy. For this reason, the performance information reviewed by the Board also included net cumulative calendar year total return information for the fund and an appropriate benchmark index and peer group for the most recent
one-, three-, and five-year periods, as shown below. Returns are shown compared to the 25th percentile (top of box, 75% beaten) and 75th percentile (bottom of box, 25% beaten) of the peer universe. Returns of the benchmark index are "net MA," i.e., adjusted for tax withholding rates applicable to U.S.-based funds organized as Massachusetts business trusts.Fidelity International Small Cap Fund
The Board also considered that the fund's management fee is subject to upward or downward adjustment depending upon whether, and to what extent, the fund's investment performance for the performance period (a rolling 36-month period) exceeds, or is exceeded by, a securities index, thus leading to a performance adjustment for the same period. The Board noted that the performance adjustment provides FMR with a strong economic incentive to seek to achieve superior long-term performance for the fund's shareholders and helps to more closely align the interests of FMR and the shareholders of the fund.
Based on its review, the Board concluded that the nature, extent, and quality of services provided to the fund under the Advisory Contracts should continue to benefit the shareholders of the fund.
Competitiveness of Management Fee and Total Expense Ratio. The Board considered the fund's management fee and total expense ratio compared to "mapped groups" of competitive funds and classes created for the purpose of facilitating the Trustees' competitive analysis of management fees and total expenses. Fidelity creates "mapped groups" by combining similar Lipper investment objective categories that have comparable investment mandates. Combining Lipper investment objective categories aids the Board's management fee and total expense ratio comparisons by broadening the competitive group used for comparison.
Management Fee. The Board considered two proprietary management fee comparisons for the 12-month periods shown in basis points (BP) in the chart below. The group of Lipper funds used by the Board for management fee comparisons is referred to below as the "Total Mapped Group." The Total Mapped Group is broader than the Lipper peer group used by the Board for performance comparisons because the Total Mapped Group combines several Lipper investment objective categories while the Lipper peer group does not. The Total Mapped Group comparison focuses on a fund's standing in terms of gross management fees before expense reimbursements or caps, and without giving effect to the fund's performance adjustment, relative to the total universe of funds with comparable investment mandates, regardless of whether their management fee structures also are comparable. Funds with comparable investment mandates offer exposure to similar types of securities. Funds with comparable management fee structures have similar management fee contractual arrangements (
e.g., flat rate charged for advisory services, all-inclusive fee rate,
etc.). "TMG %" represents the percentage of funds in the Total Mapped Group that had management fees that were lower than the fund's. For example, a hypothetical TMG % of 20% would mean that 80% of the funds in the Total Mapped Group had higher, and 20% had lower, management fees than the fund. The fund's actual TMG %s and the number of funds in the Total Mapped Group are in the chart below. The "Asset-Size Peer Group" (ASPG) comparison focuses on a fund's standing relative to a subset of non-Fidelity funds within the Total Mapped Group that are similar in size and management fee structure without taking into account performance adjustments, if any. For example, if a fund is in the first quartile of the ASPG, the fund's management fee ranks in the least expensive or lowest 25% of funds in the ASPG. The ASPG represents at least 15% of the funds in the Total Mapped Group with comparable asset size and management fee structures, subject to a minimum of 50 funds (or all funds in the Total Mapped Group if fewer than 50). Additional information, such as the ASPG quartile in which the fund's management fee rate ranked and the impact of the fund's performance adjustment, is also included in the chart and considered by the Board.
Fidelity International Small Cap Fund
The Board noted that the fund's management fee rate ranked below the median of its Total Mapped Group and below the median of its ASPG for 2016. The Board also noted the effect of the fund's performance adjustment, if any, on the fund's management fee ranking.
Furthermore, the Board considered that shareholders approved a prospective change in the index used to calculate the fund's performance adjustment, beginning April 1, 2014. The Board also considered that, because the performance adjustment is based on a rolling 36-month measurement period, during a transition period the fund's performance is compared to a blended index return that reflects the performance of the former index for the portion of the measurement period prior to April 1, 2014 and the performance of the current index for the remainder of the measurement period. The Board noted that the fund's performance adjustments for 2014 through 2016 shown in the chart above reflect the effect of using the blended index return to calculate the fund's performance adjustment.
The Board noted that, in 2014, the Board and the boards of other Fidelity funds formed the ad hoc Committee on Group Fee to conduct an in-depth review of the "group fee" component of the management fee of funds with such management fee structures. The Committee's focus included the mechanics of the group fee, the competitive landscape of group fee structures, Fidelity funds with no group fee component and investment products not included in group fee assets. The Board also considered that, for funds subject to the group fee, FMR agreed to voluntarily waive fees over a specified period of time in amounts designed to account for assets converted from certain funds to certain collective investment trusts.
The Board also noted that, in 2013, the ad hoc Committee on Management Fees was formed to conduct an in-depth review of the management fee rates of Fidelity's active equity mutual funds. The Committee focused on the following areas: (i) standard fee structures; (ii) research consumption and trading evolution; (iii) management fee competitiveness/profitability by category; and (iv) factors that drive institutional pricing.
Based on its review, the Board concluded that the fund's management fee is fair and reasonable in light of the services that the fund receives and the other factors considered.
Total Expense Ratio. In its review of each class's total expense ratio, the Board considered the fund's management fee rate as well as other fund or class expenses, as applicable, such as transfer agent fees, pricing and bookkeeping fees, fund-paid 12b-1 fees, and custodial, legal, and audit fees. The Board noted the impact of the fund's performance adjustment. The Board also noted that Fidelity may agree to waive fees and expenses from time to time, and the extent to which, if any, it has done so for the fund. As part of its review, the Board also considered the current and historical total expense ratios of each class of the fund compared to competitive fund median expenses. Each class of the fund is compared to those funds and classes in the Total Mapped Group (used by the Board for management fee comparisons) that have a similar sales load structure.
The Board noted that the total expense ratio of each of Class A and the retail class ranked below the competitive median for 2016 and the total expense ratio of each of Class M (formerly Class T), Class C, and Class I ranked above the competitive median for 2016. The Board considered that, in general, various factors can affect total expense ratios. The Board noted that the total expense ratio of Class M was above the competitive median primarily because of higher 12b-1 fees on Class M as compared to most competitor funds. Class M has a higher 12b-1 fee, but a lower front-end sales charge, than traditionally priced front-end sales charge classes. The Board considered that Class M is primarily sold load-waived in the retirement plan market where its 0.50% 12b-1 fee is comparable to competing no-load, higher 12b-1 fee classes designed specifically for retirement plans. The Board noted that the total expense ratio of Class C was above the competitive median primarily because of its 12b-1 fees. The Board noted that, although Class I is categorized by Lipper as an institutional class, Class I has a significantly lower investment minimum than most other funds and classes categorized as institutional. As a result, FMR believes that Class I is generally more comparable to retail funds and classes. The Board considered that, when compared to retail funds and classes, Class I would not be above the competitive median for 2016. The Board noted that the fund offers multiple classes, each of which has a different sales load and 12b-1 fee structure, and that the multiple structures are intended to offer a range of pricing options for the intermediary market. The Board also noted that the total expense ratios of the classes vary primarily by the level of their 12b-1 fees, although differences in transfer agent fees may also cause expenses to vary from class to class.
Fees Charged to Other Fidelity Clients. The Board also considered Fidelity fee structures and other information with respect to clients of Fidelity, such as other funds advised or subadvised by Fidelity, pension plan clients, and other institutional clients with similar mandates. The Board noted that an ad hoc joint committee created by it and the boards of other Fidelity funds periodically (most recently in 2013) reviews and compares Fidelity's institutional investment advisory business with its business of providing services to the Fidelity funds, including the differences in services provided, fees charged, and costs incurred, as well as competition in their respective marketplaces.
Based on its review of total expense ratios and fees charged to other Fidelity clients, the Board concluded that, although some classes were above the median of the universe presented for comparison, the total expense ratio of each class of the fund was reasonable in light of the services that the fund and its shareholders receive and the other factors considered.
Costs of the Services and Profitability. The Board considered the revenues earned and the expenses incurred by Fidelity in conducting the business of developing, marketing, distributing, managing, administering and servicing the fund and servicing the fund's shareholders. The Board also considered the level of Fidelity's profits in respect of all the Fidelity funds.
On an annual basis, Fidelity presents to the Board information about the profitability of its relationships with the fund. Fidelity calculates profitability information for each fund, as well as aggregate profitability information for groups of Fidelity funds and all Fidelity funds, using a series of detailed revenue and cost allocation methodologies which originate with the books and records of Fidelity on which Fidelity's audited financial statements are based. The Audit Committee of the Board reviews any significant changes from the prior year's methodologies.
PricewaterhouseCoopers LLP (PwC), independent registered public accounting firm and auditor to Fidelity and certain Fidelity funds, has been engaged annually by the Board as part of the Board's assessment of Fidelity's profitability analysis. PwC's engagement includes the review and assessment of the methodologies used by Fidelity in determining the revenues and expenses attributable to Fidelity's mutual fund business, and completion of agreed-upon procedures in respect of the mathematical accuracy of the fund profitability information and its conformity to established allocation methodologies. After considering PwC's reports issued under the engagement and information provided by Fidelity, the Board concluded that while other allocation methods may also be reasonable, Fidelity's profitability methodologies are reasonable in all material respects.
The Board also reviewed Fidelity's non-fund businesses and potential fall-out benefits related to the mutual fund business as well as cases where Fidelity's affiliates may benefit from or be related to the fund's business.
The Board considered the costs of the services provided by and the profits realized by Fidelity in connection with the operation of the fund and was satisfied that the profitability was not excessive.
Economies of Scale. The Board considered whether there have been economies of scale in respect of the management of the Fidelity funds, whether the Fidelity funds (including the fund) have appropriately benefited from any such economies of scale, and whether there is potential for realization of any further economies of scale. The Board considered the extent to which the fund will benefit from economies of scale as assets grow through increased services to the fund, through waivers or reimbursements, or through fee or expense ratio reductions. The Board also noted that a committee (the Economies of Scale Committee) created by it and the boards of other Fidelity funds periodically (most recently in 2013) analyzes whether Fidelity attains economies of scale in respect of the management and servicing of the Fidelity funds, whether the Fidelity funds have appropriately benefited from such economies of scale, and whether there is potential for realization of any further economies of scale.
The Board recognized that the fund's management contract incorporates a "group fee" structure, which provides for lower group fee rates as total group assets increase, and for higher group fee rates as total group assets decrease (with "group assets" defined to include fund assets under FMR's management plus the assets of sector funds previously under FMR's management). FMR calculates the group fee rates based on a tiered asset "breakpoint" schedule that varies based on asset class. The Board considered that the group fee is designed to deliver the benefits of economies of scale to fund shareholders when total Fidelity fund assets increase, even if assets of any particular fund are unchanged or have declined, because some portion of Fidelity's costs are attributable to services provided to all Fidelity funds, and all funds benefit if those costs can be allocated among more assets. The Board concluded that, given the group fee structure, fund shareholders will benefit from lower management fees as group assets increase at the fund complex level, regardless of whether Fidelity achieves any such economies of scale.
The Board concluded, taking into account the analysis of the Economies of Scale Committee, that economies of scale, if any, are being appropriately shared between fund shareholders and Fidelity.
Additional Information Requested by the Board. In order to develop fully the factual basis for consideration of the Fidelity funds' advisory contracts, the Board requested and received additional information on certain topics, including: (i) fund performance trends, in particular the underperformance of certain funds, and Fidelity's long-term strategies for certain funds; (ii) Fidelity's fund profitability methodology, profitability trends for certain funds, and the impact of certain factors on fund profitability results, including the impact of market trends on actively managed funds; (iii) the use of performance fees and the calculation of performance adjustments, including the impact of underperformance and fund outflows on performance adjustments; (iv) metrics for evaluating index fund performance; (v) Fidelity's group fee structure, including the group fee breakpoint schedules; (vi) the terms of Fidelity's contractual and voluntary expense cap arrangements with the funds; (vii) the methodology with respect to evaluating competitive fund data and peer group classifications and fee comparisons; (viii) the expense structures for different funds and classes; (ix) Fidelity's arrangements with affiliated sub-advisers on behalf of the funds; (x) information regarding other accounts managed by Fidelity, including institutional accounts and collective investment trusts; (xi) recent changes to the fee structure for certain funds of funds; and (xii) the impact of the Department of Labor's new fiduciary rule on the funds' comparative expense information.
Based on its evaluation of all of the conclusions noted above, and after considering all factors it believed relevant, the Board concluded that the advisory fee structures are fair and reasonable, and that the fund's Advisory Contracts should be renewed.
AISC-ANN-1217
1.793569.114
Fidelity® Emerging Europe, Middle East, Africa (EMEA) Fund
Annual Report October 31, 2017 |
|
Contents
To view a fund's proxy voting guidelines and proxy voting record for the 12-month period ended June 30, visit http://www.fidelity.com/proxyvotingresults or visit the Securities and Exchange Commission's (SEC) web site at http://www.sec.gov.
You may also call 1-800-544-8544 to request a free copy of the proxy voting guidelines.
Standard & Poor's, S&P and S&P 500 are registered service marks of The McGraw-Hill Companies, Inc. and have been licensed for use by Fidelity Distributors Corporation.
Other third-party marks appearing herein are the property of their respective owners.
All other marks appearing herein are registered or unregistered trademarks or service marks of FMR LLC or an affiliated company. © 2017 FMR LLC. All rights reserved.
This report and the financial statements contained herein are submitted for the general information of the shareholders of the Fund. This report is not authorized for distribution to prospective investors in the Fund unless preceded or accompanied by an effective prospectus.
A fund files its complete schedule of portfolio holdings with the SEC for the first and third quarters of each fiscal year on Form N-Q. Forms N-Q are available on the SEC’s web site at http://www.sec.gov. A fund's Forms N-Q may be reviewed and copied at the SEC’s Public Reference Room in Washington, DC. Information regarding the operation of the SEC's Public Reference Room may be obtained by calling 1-800-SEC-0330.
For a complete list of a fund's portfolio holdings, view the most recent holdings listing, semiannual report, or annual report on Fidelity's web site at http://www.fidelity.com, http://www.institutional.fidelity.com, or http://www.401k.com, as applicable.
NOT FDIC INSURED •MAY LOSE VALUE •NO BANK GUARANTEE
Neither the Fund nor Fidelity Distributors Corporation is a bank.
Performance: The Bottom Line
Average annual total return reflects the change in the value of an investment, assuming reinvestment of distributions from dividend income and capital gains (the profits earned upon the sale of securities that have grown in value, if any) and assuming a constant rate of performance each year. The hypothetical investment and the average annual total returns do not reflect the deduction of taxes that a shareholder would pay on fund distributions or the redemption of fund shares. During periods of reimbursement by Fidelity, a fund’s total return will be greater than it would be had the reimbursement not occurred. How a fund did yesterday is no guarantee of how it will do tomorrow.
Average Annual Total Returns
| For the periods ended October 31, 2017 | Past 1 year | Past 5 years | Life of fundA |
| Fidelity® Emerging Europe, Middle East, Africa (EMEA) Fund | 17.04% | 3.48% | 0.94% |
A From May 8, 2008
$10,000 Over Life of Fund
Let's say hypothetically that $10,000 was invested in Fidelity® Emerging Europe, Middle East, Africa (EMEA) Fund, a class of the fund, on May 8, 2008, when the fund started.
The chart shows how the value of your investment would have changed, and also shows how the MSCI EM (Emerging Markets) Europe, Middle East and Africa Index performed over the same period.
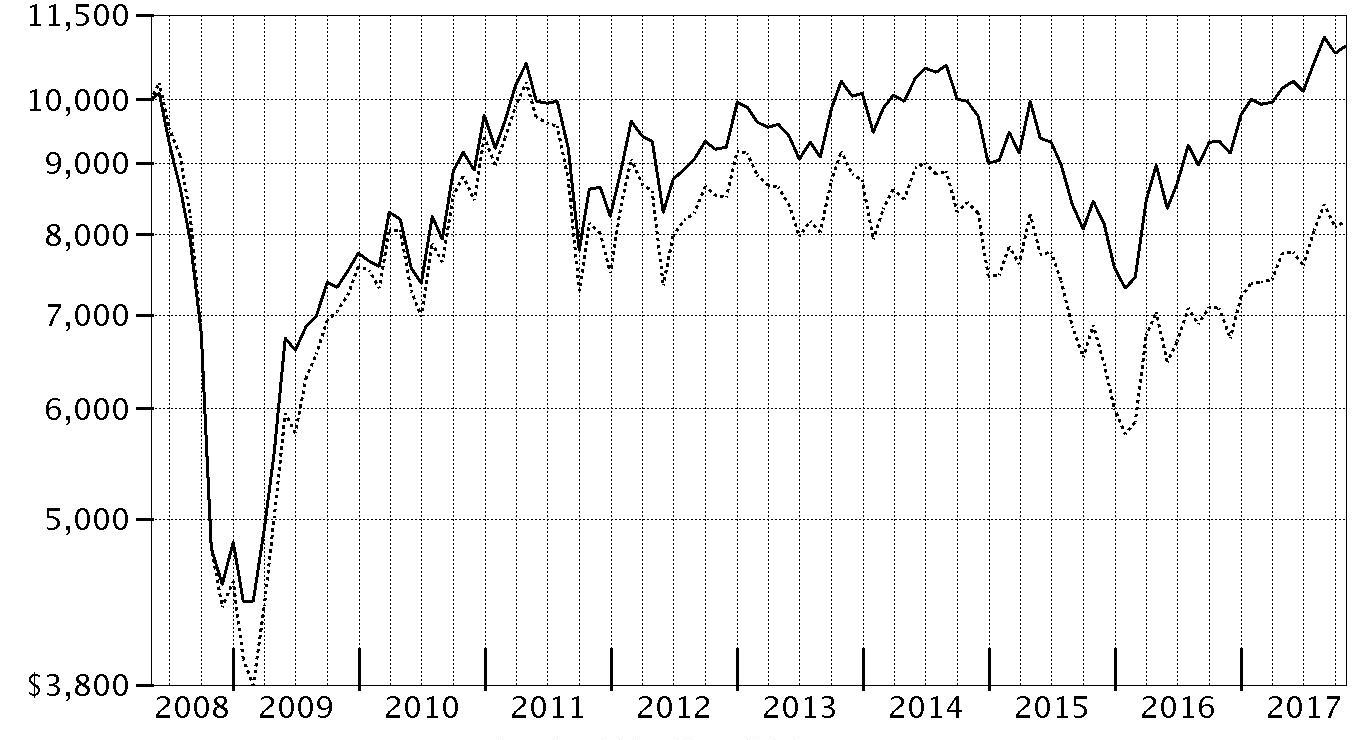
| Period Ending Values |
| $10,928 | Fidelity® Emerging Europe, Middle East, Africa (EMEA) Fund |
| $8,179 | MSCI EM (Emerging Markets) Europe, Middle East and Africa Index |
Management's Discussion of Fund Performance
Market Recap: The MSCI ACWI (All Country World Index) ex USA Index returned 23.85% for the 12 months ending October 31, 2017, helped partly by a generally weak U.S. dollar. Some favorable election results in continental Europe (+30%) suggested ebbing political uncertainty and near-term risk there, but the U.K. (+20%) faced more-mixed conditions ahead of its expected exit from the European Union. Despite central-bank easing – and pressured recently by yen strength – Japan (+18%) lagged the rest of the Asia-Pacific group (+22%). Commodity-price volatility slowed Canada (+17%), but the emerging-markets group (+26%) sped ahead. Sector-wise, information technology (+47%) was driven by a surge among several Chinese internet-related names. Financials (+27%) rode rising interest rates that, at the same time, weighed on real estate (+17%), utilities (+16%), consumer staples (+14%) and telecommunication services (+9%) – so-called “bond proxy” sectors. Materials (+28%) and industrials (+27%) responded to demand from China and price gains for certain commodities. In the energy sector (+20%), oil prices lost ground in the spring before rebounding through October 31 to end well above where they started 12 months ago. Lastly, health care (+14%) was hurt by early-period turmoil around drug pricing and health care legislation.
Comments from Portfolio Manager Adam Kutas: For the fiscal year ending October 31, 2017, the fund’s share classes gained about 16% to 17%, outpacing the 15.44% return of the MSCI EM (Emerging Markets) Europe, Middle East and Africa Index. Emerging EMEA countries, especially those with significant exposure to commodities, rallied strongly after investors decided that commodities likely had hit a bottom in late 2016. Our relatively conservative approach, which emphasizes higher-quality companies, gave the fund an edge over its MSCI benchmark, as these stocks generally posted the best returns this period. Stock selection delivered almost all of the our outperformance versus the benchmark, led by choices in financials and industrials. At the stock level, underweighting poorly performing Steinhoff International Holdings, a private-equity investor based in South Africa, was the fund’s biggest individual relative contributor. Steinhoff owns a variety of businesses, including a chain of European furniture retailers, and I found the business too opaque. While I had owned a small position early in the period to help mitigate risk, I ultimately sold it because it failed to meet my investment criteria. Also contributing was an underweighting in another weak index component, Russian retailer Magnit, which struggled amid competition. Conversely, stock picking in materials detracted notably; however, on an individual basis, underweighting South African internet company Naspers (+46%), a very large benchmark component weighed most on the fund’s relative results.
The views expressed above reflect those of the portfolio manager(s) only through the end of the period as stated on the cover of this report and do not necessarily represent the views of Fidelity or any other person in the Fidelity organization. Any such views are subject to change at any time based upon market or other conditions and Fidelity disclaims any responsibility to update such views. These views may not be relied on as investment advice and, because investment decisions for a Fidelity fund are based on numerous factors, may not be relied on as an indication of trading intent on behalf of any Fidelity fund.
Investment Summary (Unaudited)
Geographic Diversification (% of fund's net assets)
| As of October 31, 2017 |
| | South Africa | 42.4% |
| | Russia | 19.3% |
| | United Arab Emirates | 6.4% |
| | United Kingdom | 5.0% |
| | Hungary | 4.1% |
| | Poland | 4.0% |
| | Nigeria | 2.3% |
| | Greece | 2.3% |
| | Romania | 2.2% |
| | Other* | 12.0% |
* Includes Short-Term investments and Net Other Assets (Liabilities).
Percentages are based on country or territory of incorporation and are adjusted for the effect of futures contracts, if applicable.
| As of April 30, 2017 |
| | South Africa | 41.3% |
| | Russia | 21.6% |
| | United Arab Emirates | 5.8% |
| | Poland | 5.6% |
| | United Kingdom | 4.1% |
| | Romania | 2.4% |
| | Greece | 1.9% |
| | Nigeria | 1.9% |
| | Hungary | 1.8% |
| | Other* | 13.6% |

* Includes Short-Term investments and Net Other Assets (Liabilities).
Percentages are based on country or territory of incorporation and are adjusted for the effect of futures contracts, if applicable.
Asset Allocation as of October 31, 2017
| | % of fund's net assets | % of fund's net assets 6 months ago |
| Stocks | 99.6 | 99.5 |
| Short-Term Investments and Net Other Assets (Liabilities) | 0.4 | 0.5 |
Top Ten Stocks as of October 31, 2017
| | % of fund's net assets | % of fund's net assets 6 months ago |
| Naspers Ltd. Class N (South Africa, Media) | 11.7 | 8.3 |
| Sberbank of Russia (Russia, Banks) | 5.8 | 5.5 |
| Lukoil PJSC (Russia, Oil, Gas & Consumable Fuels) | 3.7 | 3.9 |
| Standard Bank Group Ltd. (South Africa, Banks) | 2.8 | 2.7 |
| Tatneft PAO (Russia, Oil, Gas & Consumable Fuels) | 2.3 | 1.6 |
| MTN Group Ltd. (South Africa, Wireless Telecommunication Services) | 2.3 | 0.9 |
| OTP Bank PLC (Hungary, Banks) | 2.2 | 1.8 |
| FirstRand Ltd. (South Africa, Diversified Financial Services) | 2.2 | 3.1 |
| NOVATEK OAO (Russia, Oil, Gas & Consumable Fuels) | 2.1 | 2.1 |
| Shoprite Holdings Ltd. (South Africa, Food & Staples Retailing) | 1.7 | 2.0 |
| | 36.8 | |
Top Market Sectors as of October 31, 2017
| | % of fund's net assets | % of fund's net assets 6 months ago |
| Financials | 31.7 | 31.1 |
| Consumer Discretionary | 20.6 | 18.9 |
| Energy | 15.5 | 16.3 |
| Materials | 9.9 | 11.3 |
| Consumer Staples | 9.0 | 10.3 |
| Industrials | 5.7 | 4.6 |
| Telecommunication Services | 3.0 | 2.1 |
| Real Estate | 2.7 | 2.7 |
| Health Care | 1.5 | 1.7 |
| Utilities | 0.0 | 0.3 |
Market Sectors may include more than one industry category.
The Fund may invest up to 35% of its total assets in any industry that represents more than 20% of the emerging Europe, Middle East and Africa markets. As of October 31, 2017, the Fund did not have more than 25% of its total assets invested in any one industry.
Percentages shown as 0.0% may reflect amounts less than 0.05%.
Investments October 31, 2017
Showing Percentage of Net Assets
| Common Stocks - 95.7% | | | |
| | | Shares | Value |
| Austria - 1.1% | | | |
| BUWOG-Gemeinnuetzige Wohnung | | 17,100 | $493,193 |
| Erste Group Bank AG | | 14,300 | 614,490 |
|
| TOTAL AUSTRIA | | | 1,107,683 |
|
| Bailiwick of Jersey - 1.1% | | | |
| Glencore Xstrata PLC | | 112,200 | 542,004 |
| Wizz Air Holdings PLC (a) | | 11,688 | 508,392 |
|
| TOTAL BAILIWICK OF JERSEY | | | 1,050,396 |
|
| Bermuda - 1.0% | | | |
| Central European Media Enterprises Ltd. Class A (a)(b) | | 220,900 | 1,016,140 |
| Botswana - 0.2% | | | |
| First National Bank of Botswana Ltd. | | 1,042,331 | 229,488 |
| British Virgin Islands - 0.5% | | | |
| Lenta Ltd. GDR (a) | | 80,900 | 510,479 |
| Canada - 0.2% | | | |
| Detour Gold Corp. (a) | | 19,100 | 203,569 |
| Cyprus - 0.5% | | | |
| Globaltrans Investment PLC GDR (Reg. S) | | 58,100 | 536,844 |
| Finland - 0.2% | | | |
| Nokian Tyres PLC | | 4,400 | 201,785 |
| Greece - 2.3% | | | |
| Fourlis Holdings SA | | 70,000 | 454,175 |
| Jumbo SA | | 26,536 | 426,564 |
| Motor Oil (HELLAS) Corinth Refineries SA | | 21,500 | 514,660 |
| Mytilineos Holdings SA (a) | | 31,000 | 324,632 |
| Sarantis SA | | 37,800 | 543,787 |
|
| TOTAL GREECE | | | 2,263,818 |
|
| Hungary - 4.1% | | | |
| MOL Hungarian Oil and Gas PLC Series A (For. Reg.) | | 120,000 | 1,436,988 |
| OTP Bank PLC | | 54,700 | 2,205,933 |
| Richter Gedeon PLC | | 16,000 | 398,041 |
|
| TOTAL HUNGARY | | | 4,040,962 |
|
| Israel - 0.5% | | | |
| Elbit Systems Ltd. (Israel) | | 3,400 | 504,026 |
| Kenya - 1.3% | | | |
| KCB Group Ltd. | | 1,771,800 | 648,948 |
| Safaricom Ltd. | | 2,640,544 | 649,001 |
|
| TOTAL KENYA | | | 1,297,949 |
|
| Morocco - 1.0% | | | |
| Attijariwafa Bank | | 11,000 | 547,765 |
| Douja Promotion Groupe Addoha SA | | 100,000 | 454,277 |
|
| TOTAL MOROCCO | | | 1,002,042 |
|
| Netherlands - 0.7% | | | |
| X5 Retail Group NV GDR (Reg. S) (a) | | 18,000 | 739,800 |
| Nigeria - 2.3% | | | |
| Dangote Cement PLC | | 888,994 | 553,152 |
| Guaranty Trust Bank PLC | | 4,000,000 | 466,667 |
| Nigerian Breweries PLC | | 1,529,339 | 637,225 |
| Zenith Bank PLC | | 9,251,272 | 655,041 |
|
| TOTAL NIGERIA | | | 2,312,085 |
|
| Oman - 0.6% | | | |
| BankMuscat SAOG | | 575,400 | 589,004 |
| Pakistan - 1.0% | | | |
| Engro Corp. Ltd. | | 185,500 | 489,607 |
| United Bank Ltd. | | 274,400 | 466,533 |
|
| TOTAL PAKISTAN | | | 956,140 |
|
| Poland - 4.0% | | | |
| Fabryki Mebli Forte SA | | 27,200 | 497,079 |
| Globe Trade Centre SA | | 273,300 | 675,751 |
| Inter Cars SA | | 7,200 | 569,678 |
| Kruk SA | | 5,900 | 452,231 |
| LPP SA | | 320 | 753,755 |
| Orbis SA | | 20,500 | 492,795 |
| Pfleiderer Grajewo SA | | 49,900 | 548,359 |
|
| TOTAL POLAND | | | 3,989,648 |
|
| Romania - 2.2% | | | |
| Banca Transilvania SA | | 953,183 | 530,618 |
| BRD-Groupe Societe Generale | | 385,088 | 1,212,170 |
| Fondul Propietatea SA GDR | | 43,000 | 464,400 |
|
| TOTAL ROMANIA | | | 2,207,188 |
|
| Russia - 15.4% | | | |
| Alrosa Co. Ltd. | | 844,400 | 1,085,822 |
| Gazprom OAO | | 599,673 | 1,291,020 |
| Lukoil PJSC | | 17,400 | 922,784 |
| Lukoil PJSC sponsored ADR | | 52,095 | 2,766,245 |
| MMC Norilsk Nickel PJSC | | 2,100 | 380,356 |
| NOVATEK OAO | | 188,100 | 2,093,931 |
| Novolipetsk Steel OJSC GDR (Reg. S) | | 45,800 | 1,055,690 |
| Sberbank of Russia | | 1,748,280 | 5,793,155 |
|
| TOTAL RUSSIA | | | 15,389,003 |
|
| South Africa - 42.4% | | | |
| African Rainbow Minerals Ltd. | | 96,000 | 842,349 |
| AngloGold Ashanti Ltd. | | 53,600 | 494,081 |
| ArcelorMittal South Africa Ltd. (a) | | 780,000 | 350,866 |
| Aveng Ltd. (a) | | 1,189,200 | 211,955 |
| AVI Ltd. | | 99,900 | 697,030 |
| Barloworld Ltd. | | 89,000 | 839,217 |
| Cashbuild Ltd. | | 21,000 | 540,642 |
| City Lodge Hotels Ltd. | | 58,200 | 518,619 |
| Clicks Group Ltd. | | 89,954 | 1,007,968 |
| Dis-Chem Pharmacies Pty Ltd. | | 212,000 | 496,310 |
| DRDGOLD Ltd. | | 2,856,814 | 972,940 |
| Exxaro Resources Ltd. | | 100,400 | 1,020,847 |
| FirstRand Ltd. | | 602,000 | 2,182,124 |
| Grindrod Ltd. (a) | | 633,200 | 697,298 |
| Hulamin Ltd. | | 1,096,900 | 558,584 |
| Imperial Holdings Ltd. | | 83,000 | 1,189,517 |
| KAP Industrial Holdings Ltd. | | 887,200 | 533,371 |
| Mr Price Group Ltd. | | 79,500 | 985,404 |
| MTN Group Ltd. | | 265,350 | 2,304,095 |
| Murray & Roberts Holdings Ltd. | | 399,000 | 451,525 |
| Nampak Ltd. (a) | | 932,900 | 1,227,261 |
| Naspers Ltd. Class N | | 47,800 | 11,646,786 |
| Pioneer Foods Ltd. | | 87,100 | 733,085 |
| Pretoria Portland Cement Co. Ltd. (a) | | 1,118,549 | 583,058 |
| PSG Group Ltd. | | 75,000 | 1,392,397 |
| Remgro Ltd. | | 89,500 | 1,354,646 |
| RMB Holdings Ltd. | | 200,000 | 884,095 |
| Sanlam Ltd. | | 312,000 | 1,560,138 |
| Shoprite Holdings Ltd. | | 120,000 | 1,717,493 |
| Spar Group Ltd. | | 82,800 | 974,245 |
| Spur Corp. Ltd. | | 241,500 | 459,301 |
| Standard Bank Group Ltd. | | 239,571 | 2,778,863 |
|
| TOTAL SOUTH AFRICA | | | 42,206,110 |
|
| Turkey - 1.7% | | | |
| Migros Turk Ticaret A/S (a) | | 75,000 | 516,007 |
| Tupras Turkiye Petrol Rafinerileri A/S | | 32,000 | 1,151,428 |
|
| TOTAL TURKEY | | | 1,667,435 |
|
| United Arab Emirates - 6.4% | | | |
| Agthia Group PJSC | | 344,787 | 490,990 |
| Aldar Properties PJSC | | 1,498,798 | 971,271 |
| DP World Ltd. | | 49,046 | 1,164,843 |
| Dubai Financial Market PJSC (a) | | 2,571,539 | 812,216 |
| Dubai Islamic Bank Pakistan Ltd. | | 609,253 | 1,015,242 |
| Dubai Parks and Resorts PJSC (a) | | 3,643,602 | 734,147 |
| National Bank of Abu Dhabi PJSC | | 418,750 | 1,180,091 |
|
| TOTAL UNITED ARAB EMIRATES | | | 6,368,800 |
|
| United Kingdom - 5.0% | | | |
| ALDREES Petroleum and Transport Services Co. ELS (HSBC Warrant Program) warrants 1/30/20 (a)(c) | | 90,625 | 708,036 |
| Banque Saudi Fransi ELS (HSBC Bank Warrant Program) warrants 3/24/20 (a)(c) | | 67,000 | 507,737 |
| BGEO Group PLC | | 7,200 | 340,431 |
| Bupa Arabia ELS (HSBC Warrant Program) warrants 10/19/18 (a)(c) | | 13,300 | 385,852 |
| Fawaz Alhokair Group ELS (HSBC Bank Warrant Program) warrants 2/28/20 (a)(c) | | 39,500 | 375,172 |
| Georgia Healthcare Group PLC (a) | | 107,500 | 499,716 |
| NMC Health PLC | | 15,349 | 589,557 |
| The Savola Group ELS (HSBC Warrant Program) warrants 1/24/20 (a)(c) | | 46,800 | 489,183 |
| Tullow Oil PLC (a) | | 140,000 | 338,413 |
| United International Transportation Co. ELS (HSBC Bank Warrant Program) warrants 7/8/20 (a)(c) | | 98,004 | 699,571 |
|
| TOTAL UNITED KINGDOM | | | 4,933,668 |
|
| TOTAL COMMON STOCKS | | | |
| (Cost $70,629,112) | | | 95,324,062 |
|
| Nonconvertible Preferred Stocks - 3.9% | | | |
| Russia - 3.9% | | | |
| Surgutneftegas OJSC | | 3,124,400 | 1,549,378 |
| Tatneft PAO | | 431,800 | 2,339,163 |
| TOTAL NONCONVERTIBLE PREFERRED STOCKS | | | |
| (Cost $2,925,647) | | | 3,888,541 |
|
| Money Market Funds - 1.2% | | | |
| Fidelity Cash Central Fund, 1.10% (d) | | 609,627 | 609,749 |
| Fidelity Securities Lending Cash Central Fund 1.11% (d)(e) | | 593,791 | 593,850 |
| TOTAL MONEY MARKET FUNDS | | | |
| (Cost $1,203,599) | | | 1,203,599 |
| TOTAL INVESTMENT IN SECURITIES - 100.8% | | | |
| (Cost $74,758,358) | | | 100,416,202 |
| NET OTHER ASSETS (LIABILITIES) - (0.8)% | | | (769,403) |
| NET ASSETS - 100% | | | $99,646,799 |
Security Type Abbreviations
ELS – Equity-Linked Security
Categorizations in the Schedule of Investments are based on country or territory of incorporation.
Legend
(a) Non-income producing
(b) Security or a portion of the security is on loan at period end.
(c) Security exempt from registration under Rule 144A of the Securities Act of 1933. These securities may be resold in transactions exempt from registration, normally to qualified institutional buyers. At the end of the period, the value of these securities amounted to $3,165,551 or 3.2% of net assets.
(d) Affiliated fund that is generally available only to investment companies and other accounts managed by Fidelity Investments. The rate quoted is the annualized seven-day yield of the fund at period end. A complete unaudited listing of the fund's holdings as of its most recent quarter end is available upon request. In addition, each Fidelity Central Fund's financial statements, which are not covered by the Fund's Report of Independent Registered Public Accounting Firm, are available on the SEC's website or upon request.
(e) Investment made with cash collateral received from securities on loan.
Affiliated Central Funds
Information regarding fiscal year to date income earned by the Fund from investments in Fidelity Central Funds is as follows:
| Fund | Income earned |
| Fidelity Cash Central Fund | $4,280 |
| Fidelity Securities Lending Cash Central Fund | 6,144 |
| Total | $10,424 |
Investment Valuation
The following is a summary of the inputs used, as of October 31, 2017, involving the Fund's assets and liabilities carried at fair value. The inputs or methodology used for valuing securities may not be an indication of the risk associated with investing in those securities. For more information on valuation inputs, and their aggregation into the levels used below, please refer to the Investment Valuation section in the accompanying Notes to Financial Statements.
| | Valuation Inputs at Reporting Date: |
| Description | Total | Level 1 | Level 2 | Level 3 |
| Investments in Securities: | | | | |
| Equities: | | | | |
| Consumer Discretionary | $20,486,387 | $20,486,387 | $-- | $-- |
| Consumer Staples | 9,064,419 | 9,064,419 | -- | -- |
| Energy | 15,424,857 | 14,502,073 | 922,784 | -- |
| Financials | 31,542,237 | 22,583,531 | 8,958,706 | -- |
| Health Care | 1,487,314 | 1,487,314 | -- | -- |
| Industrials | 5,772,103 | 5,772,103 | -- | -- |
| Materials | 9,887,698 | 8,914,758 | 972,940 | -- |
| Real Estate | 2,594,492 | 2,594,492 | -- | -- |
| Telecommunication Services | 2,953,096 | 2,953,096 | -- | -- |
| Money Market Funds | 1,203,599 | 1,203,599 | -- | -- |
| Total Investments in Securities: | $100,416,202 | $89,561,772 | $10,854,430 | $-- |
The following is a summary of transfers between Level 1 and Level 2 for the period ended October 31, 2017. Transfers are assumed to have occurred at the beginning of the period, and are primarily attributable to the valuation techniques used for foreign equity securities, as discussed in the accompanying Notes to Financial Statements:
| Transfers | Total |
| Level 1 to Level 2 | $0 |
| Level 2 to Level 1 | $7,595,313 |
See accompanying notes which are an integral part of the financial statements.
Financial Statements
Statement of Assets and Liabilities
| | | October 31, 2017 |
| Assets | | |
Investment in securities, at value (including securities loaned of $575,000) — See accompanying schedule:
Unaffiliated issuers (cost $73,554,759) | $99,212,603 | |
| Fidelity Central Funds (cost $1,203,599) | 1,203,599 | |
| Total Investment in Securities (cost $74,758,358) | | $100,416,202 |
| Foreign currency held at value (cost $5,495) | | 5,490 |
| Receivable for investments sold | | 278,032 |
| Receivable for fund shares sold | | 33,076 |
| Dividends receivable | | 91,581 |
| Distributions receivable from Fidelity Central Funds | | 504 |
| Prepaid expenses | | 228 |
| Other receivables | | 4,557 |
| Total assets | | 100,829,670 |
| Liabilities | | |
| Payable for investments purchased | $303,522 | |
| Payable for fund shares redeemed | 102,400 | |
| Accrued management fee | 67,391 | |
| Distribution and service plan fees payable | 5,785 | |
| Other affiliated payables | 25,994 | |
| Other payables and accrued expenses | 84,029 | |
| Collateral on securities loaned | 593,750 | |
| Total liabilities | | 1,182,871 |
| Net Assets | | $99,646,799 |
| Net Assets consist of: | | |
| Paid in capital | | $92,428,507 |
| Undistributed net investment income | | 1,355,176 |
| Accumulated undistributed net realized gain (loss) on investments and foreign currency transactions | | (19,793,467) |
| Net unrealized appreciation (depreciation) on investments and assets and liabilities in foreign currencies | | 25,656,583 |
| Net Assets | | $99,646,799 |
| Calculation of Maximum Offering Price | | |
| Class A: | | |
| Net Asset Value and redemption price per share ($5,537,939 ÷ 589,832 shares) | | $9.39 |
| Maximum offering price per share (100/94.25 of $9.39) | | $9.96 |
| Class M: | | |
| Net Asset Value and redemption price per share ($2,489,928 ÷ 266,258 shares) | | $9.35 |
| Maximum offering price per share (100/96.50 of $9.35) | | $9.69 |
| Class C: | | |
| Net Asset Value and offering price per share ($4,335,699 ÷ 466,209 shares)(a) | | $9.30 |
| Emerging Europe, Middle East, Africa (EMEA): | | |
| Net Asset Value, offering price and redemption price per share ($80,391,847 ÷ 8,543,299 shares) | | $9.41 |
| Class I: | | |
| Net Asset Value, offering price and redemption price per share ($6,891,386 ÷ 732,788 shares) | | $9.40 |
(a) Redemption price per share is equal to net asset value less any applicable contingent deferred sales charge.
See accompanying notes which are an integral part of the financial statements.
Statement of Operations
| | | Year ended October 31, 2017 |
| Investment Income | | |
| Dividends | | $3,497,074 |
| Income from Fidelity Central Funds | | 10,424 |
| Income before foreign taxes withheld | | 3,507,498 |
| Less foreign taxes withheld | | (365,366) |
| Total income | | 3,142,132 |
| Expenses | | |
| Management fee | $827,200 | |
| Transfer agent fees | 267,682 | |
| Distribution and service plan fees | 84,704 | |
| Accounting and security lending fees | 53,979 | |
| Custodian fees and expenses | 135,008 | |
| Independent trustees' fees and expenses | 413 | |
| Registration fees | 78,462 | |
| Audit | 69,733 | |
| Legal | 262 | |
| Miscellaneous | 837 | |
| Total expenses before reductions | 1,518,280 | |
| Expense reductions | (20,686) | 1,497,594 |
| Net investment income (loss) | | 1,644,538 |
| Realized and Unrealized Gain (Loss) | | |
| Net realized gain (loss) on: | | |
| Investment securities: | | |
| Unaffiliated issuers (net of foreign taxes of $30,875) | 4,055,484 | |
| Fidelity Central Funds | 25 | |
| Foreign currency transactions | (88,621) | |
| Total net realized gain (loss) | | 3,966,888 |
| Change in net unrealized appreciation (depreciation) on: | | |
| Unaffiliated issuers (net of decrease in deferred foreign taxes of $20,682) | 10,352,417 | |
| Fidelity Central Funds | (17) | |
| Assets and liabilities in foreign currencies | (1,597) | |
| Total change in net unrealized appreciation (depreciation) | | 10,350,803 |
| Net gain (loss) | | 14,317,691 |
| Net increase (decrease) in net assets resulting from operations | | $15,962,229 |
See accompanying notes which are an integral part of the financial statements.
Statement of Changes in Net Assets
| | Year ended October 31, 2017 | Year ended October 31, 2016 |
| Increase (Decrease) in Net Assets | | |
| Operations | | |
| Net investment income (loss) | $1,644,538 | $1,751,403 |
| Net realized gain (loss) | 3,966,888 | (6,335,400) |
| Change in net unrealized appreciation (depreciation) | 10,350,803 | 12,445,434 |
| Net increase (decrease) in net assets resulting from operations | 15,962,229 | 7,861,437 |
| Distributions to shareholders from net investment income | (1,167,439) | (1,323,710) |
| Share transactions - net increase (decrease) | (13,935,496) | 9,065,893 |
| Redemption fees | 71,905 | 36,545 |
| Total increase (decrease) in net assets | 931,199 | 15,640,165 |
| Net Assets | | |
| Beginning of period | 98,715,600 | 83,075,435 |
| End of period | $99,646,799 | $98,715,600 |
| Other Information | | |
| Undistributed net investment income end of period | $1,355,176 | $1,115,481 |
See accompanying notes which are an integral part of the financial statements.
Financial Highlights
Fidelity Emerging Europe, Middle East, Africa (EMEA) Fund Class A
| Years ended October 31, | 2017 | 2016 | 2015 | 2014 | 2013 |
| Selected Per–Share Data | | | | | |
| Net asset value, beginning of period | $8.13 | $7.49 | $9.04 | $9.49 | $8.71 |
| Income from Investment Operations | | | | | |
| Net investment income (loss)A | .12 | .14 | .12 | .13 | .16 |
| Net realized and unrealized gain (loss) | 1.22 | .61 | (1.50) | (.46) | .85 |
| Total from investment operations | 1.34 | .75 | (1.38) | (.33) | 1.01 |
| Distributions from net investment income | (.09) | (.11) | (.14) | (.12) | (.15) |
| Distributions from net realized gain | – | – | (.04) | – | (.07) |
| Total distributions | (.09) | (.11) | (.17)B | (.12) | (.23)C |
| Redemption fees added to paid in capitalA | .01 | –D | –D | –D | –D |
| Net asset value, end of period | $9.39 | $8.13 | $7.49 | $9.04 | $9.49 |
| Total ReturnE,F | 16.69% | 10.22% | (15.42)% | (3.48)% | 11.75% |
| Ratios to Average Net AssetsG,H | | | | | |
| Expenses before reductions | 1.63% | 1.69% | 1.61% | 1.60% | 1.64% |
| Expenses net of fee waivers, if any | 1.62% | 1.65% | 1.61% | 1.60% | 1.63% |
| Expenses net of all reductions | 1.61% | 1.64% | 1.60% | 1.60% | 1.62% |
| Net investment income (loss) | 1.41% | 1.90% | 1.51% | 1.45% | 1.82% |
| Supplemental Data | | | | | |
| Net assets, end of period (000 omitted) | $5,538 | $7,867 | $5,788 | $7,889 | $10,883 |
| Portfolio turnover rateI | 47% | 54% | 50% | 38% | 64% |
A Calculated based on average shares outstanding during the period.
B Total distributions of $.17 per share is comprised of distributions from net investment income of $.135 and distributions from net realized gain of $.039 per share.
C Total distributions of $.23 per share is comprised of distributions from net investment income of $.151 and distributions from net realized gain of $.074 per share.
D Amount represents less than $.005 per share.
E Total returns would have been lower if certain expenses had not been reduced during the applicable periods shown.
F Total returns do not include the effect of the sales charges.
G Fees and expenses of any underlying Fidelity Central Funds are not included in the Fund's expense ratio. The Fund indirectly bears its proportionate share of the expenses of any underlying Fidelity Central Funds.
H Expense ratios reflect operating expenses of the class. Expenses before reductions do not reflect amounts reimbursed by the investment adviser or reductions from brokerage service arrangements or reductions from other expense offset arrangements and do not represent the amount paid by the class during periods when reimbursements or reductions occur. Expenses net of fee waivers reflect expenses after reimbursement by the investment adviser but prior to reductions from brokerage service arrangements or other expense offset arrangements. Expenses net of all reductions represent the net expenses paid by the class.
I Amount does not include the portfolio activity of any underlying Fidelity Central Funds.
See accompanying notes which are an integral part of the financial statements.
Fidelity Emerging Europe, Middle East, Africa (EMEA) Fund Class M
| Years ended October 31, | 2017 | 2016 | 2015 | 2014 | 2013 |
| Selected Per–Share Data | | | | | |
| Net asset value, beginning of period | $8.10 | $7.44 | $9.01 | $9.46 | $8.68 |
| Income from Investment Operations | | | | | |
| Net investment income (loss)A | .10 | .12 | .10 | .11 | .14 |
| Net realized and unrealized gain (loss) | 1.21 | .61 | (1.51) | (.46) | .84 |
| Total from investment operations | 1.31 | .73 | (1.41) | (.35) | .98 |
| Distributions from net investment income | (.07) | (.07) | (.13) | (.10) | (.12) |
| Distributions from net realized gain | – | – | (.04) | – | (.07) |
| Total distributions | (.07) | (.07) | (.16)B | (.10) | (.20)C |
| Redemption fees added to paid in capitalA | .01 | –D | –D | –D | –D |
| Net asset value, end of period | $9.35 | $8.10 | $7.44 | $9.01 | $9.46 |
| Total ReturnE,F | 16.40% | 9.98% | (15.80)% | (3.67)% | 11.42% |
| Ratios to Average Net AssetsG,H | | | | | |
| Expenses before reductions | 1.95% | 2.00% | 1.92% | 1.92% | 1.93% |
| Expenses net of fee waivers, if any | 1.90% | 1.90% | 1.90% | 1.90% | 1.90% |
| Expenses net of all reductions | 1.88% | 1.89% | 1.89% | 1.90% | 1.88% |
| Net investment income (loss) | 1.14% | 1.65% | 1.22% | 1.15% | 1.55% |
| Supplemental Data | | | | | |
| Net assets, end of period (000 omitted) | $2,490 | $2,580 | $2,003 | $2,465 | $3,465 |
| Portfolio turnover rateI | 47% | 54% | 50% | 38% | 64% |
A Calculated based on average shares outstanding during the period.
B Total distributions of $.16 per share is comprised of distributions from net investment income of $.125 and distributions from net realized gain of $.039 per share.
C Total distributions of $.20 per share is comprised of distributions from net investment income of $.122 and distributions from net realized gain of $.074 per share.
D Amount represents less than $.005 per share.
E Total returns would have been lower if certain expenses had not been reduced during the applicable periods shown.
F Total returns do not include the effect of the sales charges.
G Fees and expenses of any underlying Fidelity Central Funds are not included in the Fund's expense ratio. The Fund indirectly bears its proportionate share of the expenses of any underlying Fidelity Central Funds.
H Expense ratios reflect operating expenses of the class. Expenses before reductions do not reflect amounts reimbursed by the investment adviser or reductions from brokerage service arrangements or reductions from other expense offset arrangements and do not represent the amount paid by the class during periods when reimbursements or reductions occur. Expenses net of fee waivers reflect expenses after reimbursement by the investment adviser but prior to reductions from brokerage service arrangements or other expense offset arrangements. Expenses net of all reductions represent the net expenses paid by the class.
I Amount does not include the portfolio activity of any underlying Fidelity Central Funds.
See accompanying notes which are an integral part of the financial statements.
Fidelity Emerging Europe, Middle East, Africa (EMEA) Fund Class C
| Years ended October 31, | 2017 | 2016 | 2015 | 2014 | 2013 |
| Selected Per–Share Data | | | | | |
| Net asset value, beginning of period | $8.06 | $7.39 | $8.93 | $9.39 | $8.62 |
| Income from Investment Operations | | | | | |
| Net investment income (loss)A | .06 | .09 | .06 | .06 | .09 |
| Net realized and unrealized gain (loss) | 1.20 | .60 | (1.48) | (.46) | .83 |
| Total from investment operations | 1.26 | .69 | (1.42) | (.40) | .92 |
| Distributions from net investment income | (.03) | (.02) | (.08) | (.06) | (.08) |
| Distributions from net realized gain | – | – | (.04) | – | (.07) |
| Total distributions | (.03) | (.02) | (.12) | (.06) | (.15) |
| Redemption fees added to paid in capitalA | .01 | –B | –B | –B | –B |
| Net asset value, end of period | $9.30 | $8.06 | $7.39 | $8.93 | $9.39 |
| Total ReturnC,D | 15.85% | 9.33% | (16.08)% | (4.24)% | 10.83% |
| Ratios to Average Net AssetsE,F | | | | | |
| Expenses before reductions | 2.42% | 2.47% | 2.41% | 2.40% | 2.42% |
| Expenses net of fee waivers, if any | 2.39% | 2.40% | 2.40% | 2.40% | 2.40% |
| Expenses net of all reductions | 2.37% | 2.39% | 2.39% | 2.40% | 2.38% |
| Net investment income (loss) | .65% | 1.15% | .72% | .65% | 1.05% |
| Supplemental Data | | | | | |
| Net assets, end of period (000 omitted) | $4,336 | $6,269 | $4,104 | $6,662 | $6,782 |
| Portfolio turnover rateG | 47% | 54% | 50% | 38% | 64% |
A Calculated based on average shares outstanding during the period.
B Amount represents less than $.005 per share.
C Total returns would have been lower if certain expenses had not been reduced during the applicable periods shown.
D Total returns do not include the effect of the contingent deferred sales charge.
E Fees and expenses of any underlying Fidelity Central Funds are not included in the Fund's expense ratio. The Fund indirectly bears its proportionate share of the expenses of any underlying Fidelity Central Funds.
F Expense ratios reflect operating expenses of the class. Expenses before reductions do not reflect amounts reimbursed by the investment adviser or reductions from brokerage service arrangements or reductions from other expense offset arrangements and do not represent the amount paid by the class during periods when reimbursements or reductions occur. Expenses net of fee waivers reflect expenses after reimbursement by the investment adviser but prior to reductions from brokerage service arrangements or other expense offset arrangements. Expenses net of all reductions represent the net expenses paid by the class.
G Amount does not include the portfolio activity of any underlying Fidelity Central Funds.
See accompanying notes which are an integral part of the financial statements.
Fidelity Emerging Europe, Middle East, Africa (EMEA) Fund
| Years ended October 31, | 2017 | 2016 | 2015 | 2014 | 2013 |
| Selected Per–Share Data | | | | | |
| Net asset value, beginning of period | $8.14 | $7.50 | $9.08 | $9.52 | $8.75 |
| Income from Investment Operations | | | | | |
| Net investment income (loss)A | .15 | .16 | .14 | .16 | .18 |
| Net realized and unrealized gain (loss) | 1.21 | .61 | (1.51) | (.47) | .84 |
| Total from investment operations | 1.36 | .77 | (1.37) | (.31) | 1.02 |
| Distributions from net investment income | (.10) | (.13) | (.17) | (.13) | (.18) |
| Distributions from net realized gain | – | – | (.04) | – | (.07) |
| Total distributions | (.10) | (.13) | (.21) | (.13) | (.25) |
| Redemption fees added to paid in capitalA | .01 | –B | –B | –B | –B |
| Net asset value, end of period | $9.41 | $8.14 | $7.50 | $9.08 | $9.52 |
| Total ReturnC | 17.04% | 10.54% | (15.33)% | (3.21)% | 11.90% |
| Ratios to Average Net AssetsD,E | | | | | |
| Expenses before reductions | 1.38% | 1.46% | 1.39% | 1.37% | 1.40% |
| Expenses net of fee waivers, if any | 1.38% | 1.40% | 1.38% | 1.37% | 1.40% |
| Expenses net of all reductions | 1.37% | 1.39% | 1.38% | 1.37% | 1.38% |
| Net investment income (loss) | 1.66% | 2.15% | 1.74% | 1.68% | 2.05% |
| Supplemental Data | | | | | |
| Net assets, end of period (000 omitted) | $80,392 | $76,193 | $67,521 | $96,784 | $110,265 |
| Portfolio turnover rateF | 47% | 54% | 50% | 38% | 64% |
A Calculated based on average shares outstanding during the period.
B Amount represents less than $.005 per share.
C Total returns would have been lower if certain expenses had not been reduced during the applicable periods shown.
D Fees and expenses of any underlying Fidelity Central Funds are not included in the Fund's expense ratio. The Fund indirectly bears its proportionate share of the expenses of any underlying Fidelity Central Funds.
E Expense ratios reflect operating expenses of the class. Expenses before reductions do not reflect amounts reimbursed by the investment adviser or reductions from brokerage service arrangements or reductions from other expense offset arrangements and do not represent the amount paid by the class during periods when reimbursements or reductions occur. Expenses net of fee waivers reflect expenses after reimbursement by the investment adviser but prior to reductions from brokerage service arrangements or other expense offset arrangements. Expenses net of all reductions represent the net expenses paid by the class.
F Amount does not include the portfolio activity of any underlying Fidelity Central Funds.
See accompanying notes which are an integral part of the financial statements.
Fidelity Emerging Europe, Middle East, Africa (EMEA) Fund Class I
| Years ended October 31, | 2017 | 2016 | 2015 | 2014 | 2013 |
| Selected Per–Share Data | | | | | |
| Net asset value, beginning of period | $8.14 | $7.50 | $9.08 | $9.52 | $8.75 |
| Income from Investment Operations | | | | | |
| Net investment income (loss)A | .16 | .17 | .15 | .16 | .19 |
| Net realized and unrealized gain (loss) | 1.20 | .61 | (1.51) | (.46) | .84 |
| Total from investment operations | 1.36 | .78 | (1.36) | (.30) | 1.03 |
| Distributions from net investment income | (.11) | (.14) | (.18) | (.14) | (.19) |
| Distributions from net realized gain | – | – | (.04) | – | (.07) |
| Total distributions | (.11) | (.14) | (.22) | (.14) | (.26) |
| Redemption fees added to paid in capitalA | .01 | –B | –B | –B | –B |
| Net asset value, end of period | $9.40 | $8.14 | $7.50 | $9.08 | $9.52 |
| Total ReturnC | 17.01% | 10.69% | (15.23)% | (3.09)% | 12.05% |
| Ratios to Average Net AssetsD,E | | | | | |
| Expenses before reductions | 1.27% | 1.31% | 1.25% | 1.26% | 1.30% |
| Expenses net of fee waivers, if any | 1.27% | 1.31% | 1.25% | 1.26% | 1.30% |
| Expenses net of all reductions | 1.26% | 1.30% | 1.24% | 1.26% | 1.28% |
| Net investment income (loss) | 1.77% | 2.24% | 1.88% | 1.79% | 2.15% |
| Supplemental Data | | | | | |
| Net assets, end of period (000 omitted) | $6,891 | $5,807 | $3,478 | $5,596 | $10,231 |
| Portfolio turnover rateF | 47% | 54% | 50% | 38% | 64% |
A Calculated based on average shares outstanding during the period.
B Amount represents less than $.005 per share.
C Total returns would have been lower if certain expenses had not been reduced during the applicable periods shown.
D Fees and expenses of any underlying Fidelity Central Funds are not included in the Fund's expense ratio. The Fund indirectly bears its proportionate share of the expenses of any underlying Fidelity Central Funds.
E Expense ratios reflect operating expenses of the class. Expenses before reductions do not reflect amounts reimbursed by the investment adviser or reductions from brokerage service arrangements or reductions from other expense offset arrangements and do not represent the amount paid by the class during periods when reimbursements or reductions occur. Expenses net of fee waivers reflect expenses after reimbursement by the investment adviser but prior to reductions from brokerage service arrangements or other expense offset arrangements. Expenses net of all reductions represent the net expenses paid by the class.
F Amount does not include the portfolio activity of any underlying Fidelity Central Funds.
See accompanying notes which are an integral part of the financial statements.
Notes to Financial Statements
For the period ended October 31, 2017
1. Organization.
Fidelity Emerging Europe, Middle East, Africa (EMEA) Fund (the Fund) is a non-diversified fund of Fidelity Investment Trust (the Trust) and is authorized to issue an unlimited number of shares. The Trust is registered under the Investment Company Act of 1940, as amended (the 1940 Act), as an open-end management investment company organized as a Massachusetts business trust. The Fund offers Class A, Class M (formerly Class T), Class C, Emerging Europe, Middle East, Africa (EMEA) and Class I shares, each of which has equal rights as to assets and voting privileges. Each class has exclusive voting rights with respect to matters that affect that class. The Fund's investments in emerging markets can be subject to social, economic, regulatory, and political uncertainties and can be extremely volatile.
After the close of business on June 24, 2016, all outstanding Class B shares were converted to Class A shares. All prior fiscal period dollar and share amounts for Class B presented in the Notes to Financial Statements are for the period November 1, 2015 through June 24, 2016.
2. Investments in Fidelity Central Funds.
The Fund invests in Fidelity Central Funds, which are open-end investment companies generally available only to other investment companies and accounts managed by the investment adviser and its affiliates. The Fund's Schedule of Investments lists each of the Fidelity Central Funds held as of period end, if any, as an investment of the Fund, but does not include the underlying holdings of each Fidelity Central Fund. As an Investing Fund, the Fund indirectly bears its proportionate share of the expenses of the underlying Fidelity Central Funds.
The Money Market Central Funds seek preservation of capital and current income and are managed by Fidelity Investments Money Management, Inc. (FIMM), an affiliate of the investment adviser. Annualized expenses of the Money Market Central Funds as of their most recent shareholder report date are less than .005%.
A complete unaudited list of holdings for each Fidelity Central Fund is available upon request or at the Securities and Exchange Commission (the SEC) website at www.sec.gov. In addition, the financial statements of the Fidelity Central Funds, which are not covered by the Fund's Report of Independent Registered Public Accounting Firm, are available on the SEC website or upon request.
3. Significant Accounting Policies.
The Fund is an investment company and applies the accounting and reporting guidance of the Financial Accounting Standards Board (FASB) Accounting Standards Codification Topic 946 Financial Services – Investments Companies. The financial statements have been prepared in conformity with accounting principles generally accepted in the United States of America (GAAP), which require management to make certain estimates and assumptions at the date of the financial statements. Actual results could differ from those estimates. Subsequent events, if any, through the date that the financial statements were issued have been evaluated in the preparation of the financial statements. The following summarizes the significant accounting policies of the Fund:
Investment Valuation. Investments are valued as of 4:00 p.m. Eastern time on the last calendar day of the period. The Board of Trustees (the Board) has delegated the day to day responsibility for the valuation of the Fund's investments to the Fair Value Committee (the Committee) established by the Fund's investment adviser. In accordance with valuation policies and procedures approved by the Board, the Fund attempts to obtain prices from one or more third party pricing vendors or brokers to value its investments. When current market prices, quotations or currency exchange rates are not readily available or reliable, investments will be fair valued in good faith by the Committee, in accordance with procedures adopted by the Board. Factors used in determining fair value vary by investment type and may include market or investment specific events. The frequency with which these procedures are used cannot be predicted and they may be utilized to a significant extent. The Committee oversees the Fund's valuation policies and procedures and reports to the Board on the Committee's activities and fair value determinations. The Board monitors the appropriateness of the procedures used in valuing the Fund's investments and ratifies the fair value determinations of the Committee.
The Fund categorizes the inputs to valuation techniques used to value its investments into a disclosure hierarchy consisting of three levels as shown below:
- Level 1 – quoted prices in active markets for identical investments
- Level 2 – other significant observable inputs (including quoted prices for similar investments, interest rates, prepayment speeds, etc.)
- Level 3 – unobservable inputs (including the Fund's own assumptions based on the best information available)
Valuation techniques used to value the Fund's investments by major category are as follows:
Equity securities, including restricted securities, for which market quotations are readily available, are valued at the last reported sale price or official closing price as reported by a third party pricing vendor on the primary market or exchange on which they are traded and are categorized as Level 1 in the hierarchy. In the event there were no sales during the day or closing prices are not available, securities are valued at the last quoted bid price or may be valued using the last available price and are generally categorized as Level 2 in the hierarchy. For foreign equity securities, when market or security specific events arise, comparisons to the valuation of American Depositary Receipts (ADRs), futures contracts, Exchange-Traded Funds (ETFs) and certain indexes as well as quoted prices for similar securities may be used and would be categorized as Level 2 in the hierarchy. Utilizing these techniques may result in transfers between Level 1 and Level 2. For equity securities, including restricted securities, where observable inputs are limited, assumptions about market activity and risk are used and these securities may be categorized as Level 3 in the hierarchy.
Investments in open-end mutual funds, including the Fidelity Central Funds, are valued at their closing net asset value (NAV) each business day and are categorized as Level 1 in the hierarchy.
Changes in valuation techniques may result in transfers in or out of an assigned level within the disclosure hierarchy. The aggregate value of investments by input level as of October 31, 2017, including information on transfers between Levels 1 and 2 is included at the end of the Fund's Schedule of Investments.
Foreign Currency. The Fund may use foreign currency contracts to facilitate transactions in foreign-denominated securities. Gains and losses from these transactions may arise from changes in the value of the foreign currency or if the counterparties do not perform under the contracts' terms.
Foreign-denominated assets, including investment securities, and liabilities are translated into U.S. dollars at the exchange rates at period end. Purchases and sales of investment securities, income and dividends received and expenses denominated in foreign currencies are translated into U.S. dollars at the exchange rate in effect on the transaction date.
The effects of exchange rate fluctuations on investments are included with the net realized and unrealized gain (loss) on investment securities. Other foreign currency transactions resulting in realized and unrealized gain (loss) are disclosed separately.
Investment Transactions and Income. For financial reporting purposes, the Fund's investment holdings and NAV include trades executed through the end of the last business day of the period. The NAV per share for processing shareholder transactions is calculated as of the close of business of the New York Stock Exchange (NYSE), normally 4:00 p.m. Eastern time and includes trades executed through the end of the prior business day. Gains and losses on securities sold are determined on the basis of identified cost. Dividend income is recorded on the ex-dividend date, except for certain dividends from foreign securities where the ex-dividend date may have passed, which are recorded as soon as the Fund is informed of the ex-dividend date. Non-cash dividends included in dividend income, if any, are recorded at the fair market value of the securities received. Income and capital gain distributions from Fidelity Central Funds, if any, are recorded on the ex-dividend date. Investment income is recorded net of foreign taxes withheld where recovery of such taxes is uncertain.
Class Allocations and Expenses. Investment income, realized and unrealized capital gains and losses, common expenses of the Fund, and certain fund-level expense reductions, if any, are allocated daily on a pro-rata basis to each class based on the relative net assets of each class to the total net assets of the Fund. Each class differs with respect to transfer agent and distribution and service plan fees incurred. Certain expense reductions may also differ by class. For the reporting period, the allocated portion of income and expenses to each class as a percent of its average net assets may vary due to the timing of recording these transactions in relation to fluctuating net assets of the classes. Expenses directly attributable to a fund are charged to that fund. Expenses attributable to more than one fund are allocated among the respective funds on the basis of relative net assets or other appropriate methods. Expense estimates are accrued in the period to which they relate and adjustments are made when actual amounts are known.
Income Tax Information and Distributions to Shareholders. Each year, the Fund intends to qualify as a regulated investment company under Subchapter M of the Internal Revenue Code, including distributing substantially all of its taxable income and realized gains. As a result, no provision for U.S. Federal income taxes is required. As of October 31, 2017, the Fund did not have any unrecognized tax benefits in the financial statements; nor is the Fund aware of any tax positions for which it is reasonably possible that the total amounts of unrecognized tax benefits will significantly change in the next twelve months. The Fund files a U.S. federal tax return, in addition to state and local tax returns as required. The Fund's federal income tax returns are subject to examination by the Internal Revenue Service (IRS) for a period of three fiscal years after they are filed. State and local tax returns may be subject to examination for an additional fiscal year depending on the jurisdiction. Foreign taxes are provided for based on the Fund's understanding of the tax rules and rates that exist in the foreign markets in which it invests. The Fund is subject to a tax imposed on capital gains by certain countries in which it invests.
Distributions are declared and recorded on the ex-dividend date. Income dividends and capital gain distributions are declared separately for each class. Income and capital gain distributions are determined in accordance with income tax regulations, which may differ from GAAP. In addition, the Fund claimed a portion of the payment made to redeeming shareholders as a distribution for income tax purposes.
Capital accounts within the financial statements are adjusted for permanent book-tax differences. These adjustments have no impact on net assets or the results of operations. Capital accounts are not adjusted for temporary book-tax differences which will reverse in a subsequent period.
Book-tax differences are primarily due to foreign currency transactions, certain foreign taxes, passive foreign investment companies (PFIC), capital loss carryforwards and losses deferred due to wash sales.
As of period end, the cost and unrealized appreciation (depreciation) in securities, and derivatives if applicable, for federal income tax purposes were as follows:
| Gross unrealized appreciation | $29,225,765 |
| Gross unrealized depreciation | (4,129,931) |
| Net unrealized appreciation (depreciation) | $25,095,834 |
| Tax Cost | $75,320,368 |
The tax-based components of distributable earnings as of period end were as follows:
| Undistributed ordinary income | $1,418,934 |
| Capital loss carryforward | $(19,295,216) |
| Net unrealized appreciation (depreciation) on securities and other investments | $25,094,573 |
Capital loss carryforwards are only available to offset future capital gains of the Fund to the extent provided by regulations and may be limited. Under the Regulated Investment Company Modernization Act of 2010 (the Act), the Fund is permitted to carry forward capital losses incurred in taxable years beginning after December 22, 2010 for an unlimited period and such capital losses are required to be used prior to any losses that expire. The capital loss carryforward information presented below, including any applicable limitation, is estimated as of fiscal period end and is subject to adjustment.
| Fiscal year of expiration | |
| 2018 | $(1,624,705) |
| No expiration | |
| Short-term | (2,621,070) |
| Long-term | (15,049,441) |
| Total no expiration | (17,670,511) |
| Total capital loss carryforward | $(19,295,216) |
The tax character of distributions paid was as follows:
| | October 31, 2017 | October 31, 2016 |
| Ordinary Income | $1,167,439 | $ 1,323,710 |
Short-Term Trading (Redemption) Fees. Shares held by investors in the Fund less than 90 days may have been subject to a redemption fee equal to 1.50% of the NAV of shares redeemed. All redemption fees, which reduce the proceeds of the shareholder redemption, are retained by the Fund and accounted for as an addition to paid in capital.
In November 2017, the Board of Trustees approved the elimination of these redemption fees effective December 18, 2017.
Restricted Securities. The Fund may invest in securities that are subject to legal or contractual restrictions on resale. These securities generally may be resold in transactions exempt from registration or to the public if the securities are registered. Disposal of these securities may involve time-consuming negotiations and expense, and prompt sale at an acceptable price may be difficult. Information regarding restricted securities is included at the end of the Fund's Schedule of Investments.
4. Purchases and Sales of Investments.
Purchases and sales of securities, other than short-term securities, aggregated $47,999,938 and $60,426,962, respectively.
5. Fees and Other Transactions with Affiliates.
Management Fee. Fidelity Management & Research Company (the investment adviser) and its affiliates provide the Fund with investment management related services for which the Fund pays a monthly management fee. The management fee is the sum of an individual fund fee rate that is based on an annual rate of .55% of the Fund's average net assets and an annualized group fee rate that averaged .25% during the period. The group fee rate is based upon the average net assets of all the mutual funds advised by the investment adviser, including any mutual funds previously advised by the investment adviser that are currently advised by Fidelity SelectCo, LLC, an affiliate of the investment adviser. The group fee rate decreases as assets under management increase and increases as assets under management decrease. For the reporting period, the total annual management fee rate was .80% of the Fund's average net assets.
Distribution and Service Plan Fees. In accordance with Rule 12b-1 of the 1940 Act, the Fund has adopted separate Distribution and Service Plans for each class of shares. Certain classes pay Fidelity Distributors Corporation (FDC), an affiliate of the investment adviser, separate Distribution and Service Fees, each of which is based on an annual percentage of each class' average net assets. In addition, FDC may pay financial intermediaries for selling shares of the Fund and providing shareholder support services. For the period, the Distribution and Service Fee rates, total fees and amounts retained by FDC were as follows:
| | Distribution
Fee | Service
Fee | Total Fees | Retained
by FDC |
| Class A | -% | .25% | $16,881 | $– |
| Class M | .25% | .25% | 12,548 | 158 |
| Class C | .75% | .25% | 55,275 | 6,686 |
| | | | $84,704 | $6,844 |
Sales Load. FDC may receive a front-end sales charge of up to 5.75% for selling Class A shares and 3.50% for selling Class M shares, some of which is paid to financial intermediaries for selling shares of the Fund. Depending on the holding period, FDC may receive contingent deferred sales charges levied on Class A, Class M and Class C redemptions. The deferred sales charges are 1.00% for Class C shares, 1.00% for certain purchases of Class A shares and .25% for certain purchases of Class M shares.
For the period, sales charge amounts retained by FDC were as follows:
| | Retained
by FDC |
| Class A | $2,438 |
| Class M | 540 |
| Class C(a) | 399 |
| | $3,377 |
(a) When Class C shares are initially sold, FDC pays commissions from its own resources to financial intermediaries through which the sales are made.
Transfer Agent Fees. Fidelity Investments Institutional Operations Company, Inc., (FIIOC), an affiliate of the investment adviser, is the transfer, dividend disbursing and shareholder servicing agent for each class of the Fund. FIIOC receives account fees and asset-based fees that vary according to the account size and type of account of the shareholders of the respective classes of the Fund. FIIOC pays for typesetting, printing and mailing of shareholder reports, except proxy statements.
For the period, transfer agent fees for each applicable class were as follows:
| | Amount | % of
Class-Level Average
Net Assets |
| Class A | $16,971 | .25 |
| Class M | 8,275 | .33 |
| Class C | 16,248 | .29 |
| Emerging Europe, Middle East, Africa (EMEA) | 214,883 | .26 |
| Class I | 11,305 | .15 |
| | $ 267,682 | |
Accounting and Security Lending Fees. Fidelity Service Company, Inc. (FSC), an affiliate of the investment adviser, maintains the Fund's accounting records. The accounting fee is based on the level of average net assets for each month. Under a separate contract, FSC administers the security lending program. The security lending fee is based on the number and duration of lending transactions.
Brokerage Commissions. The Fund placed a portion of its portfolio transactions with brokerage firms which are affiliates of the investment adviser. Brokerage commissions are included in net realized gain (loss) and change in net unrealized appreciation (depreciation) in the Statement of Operations. The commissions paid to these affiliated firms were $171 for the period.
Interfund Trades. The Fund may purchase from or sell securities to other Fidelity Funds under procedures adopted by the Board. The procedures have been designed to ensure these interfund trades are executed in accordance with Rule 17a-7 of the 1940 Act. Interfund trades are included within the respective purchases and sales amounts shown in the Purchases and Sales of Investments note.
Other. During the period, the investment adviser reimbursed the Fund for certain losses in the amount of $5,490.
6. Committed Line of Credit.
The Fund participates with other funds managed by the investment adviser or an affiliate in a $4.25 billion credit facility (the "line of credit") to be utilized for temporary or emergency purposes to fund shareholder redemptions or for other short-term liquidity purposes. The Fund has agreed to pay commitment fees on its pro-rata portion of the line of credit, which amounted to $333 and is reflected in Miscellaneous expenses on the Statement of Operations. During the period, the Fund did not borrow on this line of credit.
7. Security Lending.
The Fund lends portfolio securities through a lending agent from time to time in order to earn additional income. For equity securities, a lending agent is used and may loan securities to certain qualified borrowers, including Fidelity Capital Markets (FCM), a broker-dealer affiliated with the Fund. On the settlement date of the loan, the Fund receives collateral (in the form of U.S. Treasury obligations, letters of credit and/or cash) against the loaned securities and maintains collateral in an amount not less than 100% of the market value of the loaned securities during the period of the loan. The market value of the loaned securities is determined at the close of business of the Fund and any additional required collateral is delivered to the Fund on the next business day. The Fund or borrower may terminate the loan at any time, and if the borrower defaults on its obligation to return the securities loaned because of insolvency or other reasons, the Fund may apply collateral received from the borrower against the obligation. The Fund may experience delays and costs in recovering the securities loaned. Any cash collateral received is invested in the Fidelity Securities Lending Cash Central Fund. The value of loaned securities and cash collateral at period end are disclosed on the Fund's Statement of Assets and Liabilities. Security lending income represents the income earned on investing cash collateral, less rebates paid to borrowers and any lending agent fees associated with the loan, plus any premium payments received for lending certain types of securities. Security lending income is presented in the Statement of Operations as a component of income from Fidelity Central Funds. Total security lending income during the period amounted to $6,144. During the period, there were no securities loaned to FCM.
8. Expense Reductions.
The investment adviser voluntarily agreed to reimburse each class to the extent annual operating expenses exceeded certain levels of average net assets as noted in the table below. Some expenses, for example the compensation of the independent Trustees, and certain miscellaneous expenses such as proxy and shareholder meeting expenses are excluded from this reimbursement.
The following classes were in reimbursement during the period:
| | Expense
Limitations | Reimbursement |
| Class M | 1.90% | $1,327 |
| Class C | 2.40% | 1,816 |
| | | $3,143 |
Commissions paid to certain brokers with whom the investment adviser, or its affiliates, places trades on behalf of the Fund include an amount in addition to trade execution, which may be rebated back to the Fund to offset certain expenses. This amount totaled $16,630 for the period.
In addition, during the period the investment adviser reimbursed and/or waived a portion of fund-level operating expenses in the amount of $913.
9. Distributions to Shareholders.
Distributions to shareholders of each class were as follows:
| | Year ended
October 31, 2017 | Year ended
October 31, 2016 |
| From net investment income | | |
| Class A | $82,211 | $80,414 |
| Class M | 22,957 | 18,230 |
| Class B | – | 201 |
| Class C | 25,148 | 9,270 |
| Emerging Europe, Middle East, Africa (EMEA) | 957,314 | 1,152,813 |
| Class I | 79,809 | 62,782 |
| Total | $1,167,439 | $1,323,710 |
10. Share Transactions.
Share transactions for each class were as follows and may contain automatic conversions between classes or exchanges between affiliated funds:
| | Shares | Shares | Dollars | Dollars |
| | Year ended October 31, 2017 | Year ended October 31, 2016 | Year ended October 31, 2017 | Year ended October 31, 2016 |
| Class A | | | | |
| Shares sold | 288,036 | 455,903 | $2,454,533 | $3,437,125 |
| Reinvestment of distributions | 9,506 | 10,903 | 78,136 | 75,669 |
| Shares redeemed | (675,335) | (272,430) | (5,836,992) | (1,968,300) |
| Net increase (decrease) | (377,793) | 194,376 | $(3,304,323) | $1,544,494 |
| Class M | | | | |
| Shares sold | 66,562 | 127,263 | $565,838 | $957,632 |
| Reinvestment of distributions | 2,795 | 2,627 | 22,945 | 18,230 |
| Shares redeemed | (121,397) | (80,720) | (1,049,817) | (600,724) |
| Net increase (decrease) | (52,040) | 49,170 | $(461,034) | $375,138 |
| Class B | | | | |
| Shares sold | – | 6,222 | $– | $48,688 |
| Reinvestment of distributions | – | 29 | – | 201 |
| Shares redeemed | – | (30,363) | – | (224,475) |
| Net increase (decrease) | – | (24,112) | $– | $(175,586) |
| Class C | | | | |
| Shares sold | 157,368 | 511,536 | $1,360,245 | $3,858,488 |
| Reinvestment of distributions | 2,631 | 776 | 21,571 | 5,381 |
| Shares redeemed | (471,197) | (290,654) | (4,103,204) | (2,107,856) |
| Net increase (decrease) | (311,198) | 221,658 | $(2,721,388) | $1,756,013 |
| Emerging Europe, Middle East, Africa (EMEA) | | | | |
| Shares sold | 3,934,827 | 3,096,394 | $34,220,494 | $23,505,412 |
| Reinvestment of distributions | 108,986 | 155,366 | 895,866 | 1,078,225 |
| Shares redeemed | (4,855,547) | (2,896,341) | (42,616,730) | (21,342,473) |
| Net increase (decrease) | (811,734) | 355,419 | $(7,500,370) | $3,241,164 |
| Class I | | | | |
| Shares sold | 791,073 | 627,690 | $6,865,207 | $5,110,628 |
| Reinvestment of distributions | 9,024 | 7,594 | 74,090 | 52,629 |
| Shares redeemed | (780,970) | (385,176) | (6,887,678) | (2,838,587) |
| Net increase (decrease) | 19,127 | 250,108 | $51,619 | $2,324,670 |
11. Other.
The Fund's organizational documents provide former and current trustees and officers with a limited indemnification against liabilities arising in connection with the performance of their duties to the Fund. In the normal course of business, the Fund may also enter into contracts that provide general indemnifications. The Fund's maximum exposure under these arrangements is unknown as this would be dependent on future claims that may be made against the Fund. The risk of material loss from such claims is considered remote.
Report of Independent Registered Public Accounting Firm
To the Trustees of Fidelity Investment Trust and Shareholders of Fidelity Emerging Europe, Middle East, Africa (EMEA) Fund:
We have audited the accompanying statement of assets and liabilities of Fidelity Emerging Europe, Middle East, Africa (EMEA) Fund (the Fund), a fund of Fidelity Investment Trust, including the schedule of investments, as of October 31, 2017, and the related statement of operations for the year then ended, the statement of changes in net assets for each of the two years in the period then ended, and the financial highlights for each of the five years in the period then ended. These financial statements and financial highlights are the responsibility of the Fund's management. Our responsibility is to express an opinion on these financial statements and financial highlights based on our audits.
We conducted our audits in accordance with the standards of the Public Company Accounting Oversight Board (United States). Those standards require that we plan and perform the audit to obtain reasonable assurance about whether the financial statements and financial highlights are free of material misstatement. The Fund is not required to have, nor were we engaged to perform, an audit of its internal control over financial reporting. Our audits included consideration of internal control over financial reporting as a basis for designing audit procedures that are appropriate in the circumstances, but not for the purpose of expressing an opinion on the effectiveness of the Fund's internal control over financial reporting. Accordingly, we express no such opinion. An audit also includes examining, on a test basis, evidence supporting the amounts and disclosures in the financial statements, assessing the accounting principles used and significant estimates made by management, as well as evaluating the overall financial statement presentation. Our procedures included confirmation of securities owned as of October 31, 2017, by correspondence with the custodians and brokers; when replies were not received from brokers, we performed other auditing procedures. We believe that our audits provide a reasonable basis for our opinion.
In our opinion, such financial statements and financial highlights referred to above present fairly, in all material respects, the financial position of Fidelity Emerging Europe, Middle East, Africa (EMEA) Fund as of October 31, 2017, the results of its operations for the year then ended, the changes in its net assets for each of the two years in the period then ended, and the financial highlights for each of the five years in the period then ended in conformity with accounting principles generally accepted in the United States of America.
DELOITTE & TOUCHE LLP
Boston, Massachusetts
December 14, 2017
Trustees and Officers
The Trustees, Members of the Advisory Board (if any), and officers of the trust and fund, as applicable, are listed below. The Board of Trustees governs the fund and is responsible for protecting the interests of shareholders. The Trustees are experienced executives who meet periodically throughout the year to oversee the fund's activities, review contractual arrangements with companies that provide services to the fund, oversee management of the risks associated with such activities and contractual arrangements, and review the fund's performance. Except for Jonathan Chiel, each of the Trustees oversees 190 funds. Mr. Chiel oversees 143 funds.
The Trustees hold office without limit in time except that (a) any Trustee may resign; (b) any Trustee may be removed by written instrument, signed by at least two-thirds of the number of Trustees prior to such removal; (c) any Trustee who requests to be retired or who has become incapacitated by illness or injury may be retired by written instrument signed by a majority of the other Trustees; and (d) any Trustee may be removed at any special meeting of shareholders by a two-thirds vote of the outstanding voting securities of the trust. Each Trustee who is not an interested person (as defined in the 1940 Act) of the trust and the fund is referred to herein as an Independent Trustee. Each Independent Trustee shall retire not later than the last day of the calendar year in which his or her 75th birthday occurs. The Independent Trustees may waive this mandatory retirement age policy with respect to individual Trustees. Officers and Advisory Board Members hold office without limit in time, except that any officer or Advisory Board Member may resign or may be removed by a vote of a majority of the Trustees at any regular meeting or any special meeting of the Trustees. Except as indicated, each individual has held the office shown or other offices in the same company for the past five years.
The fund’s Statement of Additional Information (SAI) includes more information about the Trustees. To request a free copy, call Fidelity at 1-800-544-8544.
Experience, Skills, Attributes, and Qualifications of the Trustees. The Governance and Nominating Committee has adopted a statement of policy that describes the experience, qualifications, attributes, and skills that are necessary and desirable for potential Independent Trustee candidates (Statement of Policy). The Board believes that each Trustee satisfied at the time he or she was initially elected or appointed a Trustee, and continues to satisfy, the standards contemplated by the Statement of Policy. The Governance and Nominating Committee also engages professional search firms to help identify potential Independent Trustee candidates who have the experience, qualifications, attributes, and skills consistent with the Statement of Policy. From time to time, additional criteria based on the composition and skills of the current Independent Trustees, as well as experience or skills that may be appropriate in light of future changes to board composition, business conditions, and regulatory or other developments, have also been considered by the professional search firms and the Governance and Nominating Committee. In addition, the Board takes into account the Trustees' commitment and participation in Board and committee meetings, as well as their leadership of standing and ad hoc committees throughout their tenure.
In determining that a particular Trustee was and continues to be qualified to serve as a Trustee, the Board has considered a variety of criteria, none of which, in isolation, was controlling. The Board believes that, collectively, the Trustees have balanced and diverse experience, qualifications, attributes, and skills, which allow the Board to operate effectively in governing the fund and protecting the interests of shareholders. Information about the specific experience, skills, attributes, and qualifications of each Trustee, which in each case led to the Board's conclusion that the Trustee should serve (or continue to serve) as a trustee of the fund, is provided below.
Board Structure and Oversight Function. James C. Curvey is an interested person and currently serves as Chairman. The Trustees have determined that an interested Chairman is appropriate and benefits shareholders because an interested Chairman has a personal and professional stake in the quality and continuity of services provided to the fund. Independent Trustees exercise their informed business judgment to appoint an individual of their choosing to serve as Chairman, regardless of whether the Trustee happens to be independent or a member of management. The Independent Trustees have determined that they can act independently and effectively without having an Independent Trustee serve as Chairman and that a key structural component for assuring that they are in a position to do so is for the Independent Trustees to constitute a substantial majority for the Board. The Independent Trustees also regularly meet in executive session. Ned C. Lautenbach serves as Chairman of the Independent Trustees and as such (i) acts as a liaison between the Independent Trustees and management with respect to matters important to the Independent Trustees and (ii) with management prepares agendas for Board meetings.
Fidelity® funds are overseen by different Boards of Trustees. The fund's Board oversees Fidelity's high income and certain equity funds, and other Boards oversee Fidelity's investment-grade bond, money market, asset allocation, and sector funds. The asset allocation funds may invest in Fidelity® funds overseen by the fund's Board. The use of separate Boards, each with its own committee structure, allows the Trustees of each group of Fidelity® funds to focus on the unique issues of the funds they oversee, including common research, investment, and operational issues. On occasion, the separate Boards establish joint committees to address issues of overlapping consequences for the Fidelity® funds overseen by each Board.
The Trustees operate using a system of committees to facilitate the timely and efficient consideration of all matters of importance to the Trustees, the fund, and fund shareholders and to facilitate compliance with legal and regulatory requirements and oversight of the fund's activities and associated risks. The Board, acting through its committees, has charged FMR and its affiliates with (i) identifying events or circumstances the occurrence of which could have demonstrably adverse effects on the fund's business and/or reputation; (ii) implementing processes and controls to lessen the possibility that such events or circumstances occur or to mitigate the effects of such events or circumstances if they do occur; and (iii) creating and maintaining a system designed to evaluate continuously business and market conditions in order to facilitate the identification and implementation processes described in (i) and (ii) above. Because the day-to-day operations and activities of the fund are carried out by or through FMR, its affiliates, and other service providers, the fund's exposure to risks is mitigated but not eliminated by the processes overseen by the Trustees. While each of the Board's committees has responsibility for overseeing different aspects of the fund's activities, oversight is exercised primarily through the Operations, Audit, and Compliance Committees. In addition, the Independent Trustees have worked with FMR to enhance the Board's oversight of investment and financial risks, legal and regulatory risks, technology risks, and operational risks, including the development of additional risk reporting to the Board. For example, a working group comprised of Independent Trustees and FMR has worked and continues to work to review the Fidelity® funds' valuation-related activities, reporting and risk management. Appropriate personnel, including but not limited to the fund's Chief Compliance Officer (CCO), FMR's internal auditor, the independent accountants, the fund's Treasurer and portfolio management personnel, make periodic reports to the Board's committees, as appropriate, including an annual review of Fidelity's risk management program for the Fidelity® funds. The responsibilities of each standing committee, including their oversight responsibilities, are described further under "Standing Committees of the Trustees."
Interested Trustees*:
Correspondence intended for a Trustee who is an interested person may be sent to Fidelity Investments, 245 Summer Street, Boston, Massachusetts 02210.
Name, Year of Birth; Principal Occupations and Other Relevant Experience+
Jonathan Chiel (1957)
Year of Election or Appointment: 2016
Trustee
Mr. Chiel also serves as Trustee of other Fidelity® funds. Mr. Chiel is Executive Vice President and General Counsel for FMR LLC (diversified financial services company, 2012-present). Previously, Mr. Chiel served as general counsel (2004-2012) and senior vice president and deputy general counsel (2000-2004) for John Hancock Financial Services; a partner with Choate, Hall & Stewart (1996-2000) (law firm); and an Assistant United States Attorney for the United States Attorney’s Office of the District of Massachusetts (1986-95), including Chief of the Criminal Division (1993-1995). Mr. Chiel is a director on the boards of the Boston Bar Foundation and the Maimonides School.
James C. Curvey (1935)
Year of Election or Appointment: 2007
Trustee
Chairman of the Board of Trustees
Mr. Curvey also serves as Trustee of other Fidelity® funds. Mr. Curvey is a Director of Fidelity Research & Analysis Co. (investment adviser firm, 2009-present), and Vice Chairman (2007-present) and Director of FMR LLC (diversified financial services company). In addition, Mr. Curvey serves as an Overseer for the Boston Symphony Orchestra and a member of the board of Artis-Naples, Naples, Florida, and as a Trustee for Brewster Academy, Wolfeboro, New Hampshire. Previously, Mr. Curvey served as a Director of Fidelity Investments Money Management, Inc. (investment adviser firm, 2009-2014) and a Director of FMR and FMR Co., Inc. (investment adviser firms, 2007-2014).
Charles S. Morrison (1960)
Year of Election or Appointment: 2014
Trustee
Mr. Morrison also serves as Trustee of other funds. He serves as President of Fidelity Management & Research Company (FMR) (investment adviser firm, 2016-present), a Director of Fidelity Investments Money Management, Inc. (FIMM) (investment adviser firm, 2014-present), Director of Fidelity SelectCo, LLC (investment adviser firm, 2014-present), President, Asset Management (2014-present), and is an employee of Fidelity Investments. Previously, Mr. Morrison served as Vice President of Fidelity's Fixed Income and Asset Allocation Funds (2012-2014), President, Fixed Income (2011-2014), Vice President of Fidelity's Money Market Funds (2005-2009), President, Money Market Group Leader of FMR (investment adviser firm, 2009), and Senior Vice President, Money Market Group of FMR (2004-2009). Mr. Morrison also served as Vice President of Fidelity's Bond Funds (2002-2005), certain Balanced Funds (2002-2005), and certain Asset Allocation Funds (2002-2007), and as Senior Vice President (2002-2005) of Fidelity's Bond Division.
* Determined to be an “Interested Trustee” by virtue of, among other things, his or her affiliation with the trust or various entities under common control with FMR.
+ The information includes the Trustee's principal occupation during the last five years and other information relating to the experience, attributes, and skills relevant to the Trustee's qualifications to serve as a Trustee, which led to the conclusion that the Trustee should serve as a Trustee for the fund.
Independent Trustees:
Correspondence intended for an Independent Trustee may be sent to Fidelity Investments, P.O. Box 55235, Boston, Massachusetts 02205-5235.
Name, Year of Birth; Principal Occupations and Other Relevant Experience+
Dennis J. Dirks (1948)
Year of Election or Appointment: 2005
Trustee
Mr. Dirks also serves as Trustee of other Fidelity® funds. Prior to his retirement in May 2003, Mr. Dirks was Chief Operating Officer and a member of the Board of The Depository Trust & Clearing Corporation (DTCC). He also served as President, Chief Operating Officer, and Board member of The Depository Trust Company (DTC) and President and Board member of the National Securities Clearing Corporation (NSCC). In addition, Mr. Dirks served as Chief Executive Officer and Board member of the Government Securities Clearing Corporation, Chief Executive Officer and Board member of the Mortgage-Backed Securities Clearing Corporation, as a Trustee and a member of the Finance Committee of Manhattan College (2005-2008), as a Trustee and a member of the Finance Committee of AHRC of Nassau County (2006-2008), as a member of the Independent Directors Council (IDC) Governing Council (2010-2015), and as a member of the Board of Directors for The Brookville Center for Children’s Services, Inc. (2009-2017). Mr. Dirks is a member of the Finance Committee (2016-present) and Board of Directors (2017-present) of the Asolo Repertory Theatre.
Alan J. Lacy (1953)
Year of Election or Appointment: 2008
Trustee
Mr. Lacy also serves as Trustee of other Fidelity® funds. Mr. Lacy serves as a Director of Bristol-Myers Squibb Company (global pharmaceuticals, 2008-present). He is a Trustee of the California Chapter of The Nature Conservancy (2015-present) and a Director of the Center for Advanced Study in the Behavioral Sciences at Stanford University (2015-present). In addition, Mr. Lacy served as Senior Adviser (2007-2014) of Oak Hill Capital Partners, L.P. (private equity) and also served as Chief Executive Officer (2005) and Vice Chairman (2005-2006) of Sears Holdings Corporation (retail) and Chief Executive Officer and Chairman of the Board of Sears, Roebuck and Co. (retail, 2000-2005). Previously, Mr. Lacy served as Chairman (2014-2017) and a member (2010-2017) of the Board of Directors of Dave & Buster’s Entertainment, Inc. (restaurant and entertainment complexes), as Chairman (2008-2011) and a member (2006-2015) of the Board of Trustees of the National Parks Conservation Association, and as a member of the Board of Directors for The Hillman Companies, Inc. (hardware wholesalers, 2010-2014), Earth Fare, Inc. (retail grocery, 2010-2014), and The Western Union Company (global money transfer, 2006-2011).
Ned C. Lautenbach (1944)
Year of Election or Appointment: 2000
Trustee
Chairman of the Independent Trustees
Mr. Lautenbach also serves as Trustee of other Fidelity® funds. Mr. Lautenbach currently serves as Vice Chair of the Board of Governors, State University System of Florida (2013-present) and is a member of the Council on Foreign Relations (1994-present). He is also a member and has most recently served as Chairman of the Board of Directors of Artis-Naples (2012-present). Previously, Mr. Lautenbach served as a member and then Lead Director of the Board of Directors of Eaton Corporation (diversified industrial, 1997-2016). He was also a Partner and Advisory Partner at Clayton, Dubilier & Rice, LLC (private equity investment, 1998-2010), as well as a Director of Sony Corporation (2006-2007). In addition, Mr. Lautenbach also had a 30-year career with IBM (technology company) during which time he served as Senior Vice President and a member of the Corporate Executive Committee (1968-1998).
Joseph Mauriello (1944)
Year of Election or Appointment: 2008
Trustee
Mr. Mauriello also serves as Trustee of other Fidelity® funds. Prior to his retirement in January 2006, Mr. Mauriello served in numerous senior management positions including Deputy Chairman and Chief Operating Officer (2004-2005), and Vice Chairman of Financial Services (2002-2004) of KPMG LLP US (professional services, 1965-2005). Mr. Mauriello currently serves as a member of the Board of Directors of XL Group plc. (global insurance and re-insurance, 2006-present) and the Independent Directors Council (IDC) Governing Council (2015-present). Previously, Mr. Mauriello served as a Director of the Hamilton Funds of the Bank of New York (2006-2007) and of Arcadia Resources Inc. (health care services and products, 2007-2012).
Cornelia M. Small (1944)
Year of Election or Appointment: 2005
Trustee
Ms. Small also serves as Trustee of other Fidelity® funds. Ms. Small is a member of the Board of Directors (2009-present) and Chair of the Investment Committee (2010-present) of the Teagle Foundation. Ms. Small also serves on the Investment Committee of the Berkshire Taconic Community Foundation (2008-present). Previously, Ms. Small served as Chairperson (2002-2008) and a member of the Investment Committee and Chairperson (2008-2012) and a member of the Board of Trustees of Smith College. In addition, Ms. Small served as Chief Investment Officer, Director of Global Equity Investments, and a member of the Board of Directors of Scudder, Stevens & Clark and Scudder Kemper Investments.
William S. Stavropoulos (1939)
Year of Election or Appointment: 2001
Trustee
Vice Chairman of the Independent Trustees
Mr. Stavropoulos also serves as Trustee of other Fidelity® funds. Mr. Stavropoulos serves as President and Founder of the Michigan Baseball Foundation, the Great Lakes Loons (2007-present). Mr. Stavropoulos is Chairman Emeritus of the Board of Directors of The Dow Chemical Company, where he previously served in numerous senior management positions, including President, CEO (1995-2000; 2002-2004), Chairman of the Executive Committee (2000-2006), and as a member of the Board of Directors (1990-2006). Currently, Mr. Stavropoulos is Chairman of the Board of Directors of Univar Inc. (global distributor of commodity and specialty chemicals), a Director of Teradata Corporation (data warehousing and technology solutions), and a member of the Advisory Board for Metalmark Capital LLC (private equity investment, 2005-present). Mr. Stavropoulos is an operating advisor to Clayton, Dubilier & Rice, LLC (private equity investment). In addition, Mr. Stavropoulos is a member of the University of Notre Dame Advisory Council for the College of Science, a Trustee of the Rollin L. Gerstacker Foundation, and a Director of Artis-Naples in Naples, Florida. Previously, Mr. Stavropoulos served as a Director of Chemical Financial Corporation (bank holding company, 1993-2012) and Tyco International, Ltd. (multinational manufacturing and services, 2007-2012).
David M. Thomas (1949)
Year of Election or Appointment: 2008
Trustee
Mr. Thomas also serves as Trustee of other Fidelity® funds. Mr. Thomas serves as Non-Executive Chairman of the Board of Directors of Fortune Brands Home and Security (home and security products, 2011-present), as a member of the Board of Directors (2004-present) and Presiding Director (2013-present) of Interpublic Group of Companies, Inc. (marketing communication), and as a member of the Board of Trustees of the University of Florida (2013-present). Previously, Mr. Thomas served as Executive Chairman (2005-2006) and Chairman and Chief Executive Officer (2000-2005) of IMS Health, Inc. (pharmaceutical and healthcare information solutions), and a Director of Fortune Brands, Inc. (consumer products, 2000-2011).
+ The information includes the Trustee's principal occupation during the last five years and other information relating to the experience, attributes, and skills relevant to the Trustee's qualifications to serve as a Trustee, which led to the conclusion that the Trustee should serve as a Trustee for the fund.
Advisory Board Members and Officers:
Correspondence intended for an officer or Peter S. Lynch may be sent to Fidelity Investments, 245 Summer Street, Boston, Massachusetts 02210. Officers appear below in alphabetical order.
Name, Year of Birth; Principal Occupation
Peter S. Lynch (1944)
Year of Election or Appointment: 2003
Member of the Advisory Board
Mr. Lynch also serves as Member of the Advisory Board of other Fidelity® funds. Mr. Lynch is Vice Chairman and a Director of FMR (investment adviser firm) and FMR Co., Inc. (investment adviser firm). In addition, Mr. Lynch serves as a Trustee of Boston College and as the Chairman of the Inner-City Scholarship Fund. Previously, Mr. Lynch served on the Special Olympics International Board of Directors (1997-2006).
Elizabeth Paige Baumann (1968)
Year of Election or Appointment: 2017
Anti-Money Laundering (AML) Officer
Ms. Baumann also serves as AML Officer of other funds. She is Chief AML Officer (2012-present) and Senior Vice President (2014-present) of FMR LLC (diversified financial services company) and is an employee of Fidelity Investments. Previously, Ms. Baumann served as AML Officer of the funds (2012-2016), and Vice President (2007-2014) and Deputy Anti-Money Laundering Officer (2007-2012) of FMR LLC.
Marc R. Bryant (1966)
Year of Election or Appointment: 2015
Secretary and Chief Legal Officer (CLO)
Mr. Bryant also serves as Secretary and CLO of other funds. Mr. Bryant serves as CLO, Secretary, and Senior Vice President of Fidelity Management & Research Company (investment adviser firm, 2015-present) and FMR Co., Inc. (investment adviser firm, 2015-present); Secretary of Fidelity SelectCo, LLC (investment adviser firm, 2015-present) and Fidelity Investments Money Management, Inc. (investment adviser firm, 2015-present); and CLO of Fidelity Management & Research (Hong Kong) Limited and FMR Investment Management (UK) Limited (investment adviser firms, 2015-present) and Fidelity Management & Research (Japan) Limited (investment adviser firm, 2016-present). He is Senior Vice President and Deputy General Counsel of FMR LLC (diversified financial services company). Previously, Mr. Bryant served as Secretary and CLO of Fidelity Rutland Square Trust II (2010-2014) and Assistant Secretary of Fidelity's Fixed Income and Asset Allocation Funds (2013-2015). Prior to joining Fidelity Investments, Mr. Bryant served as a Senior Vice President and the Head of Global Retail Legal for AllianceBernstein L.P. (2006-2010), and as the General Counsel for ProFund Advisors LLC (2001-2006).
William C. Coffey (1969)
Year of Election or Appointment: 2009
Assistant Secretary
Mr. Coffey also serves as Assistant Secretary of other funds. He is Senior Vice President and Deputy General Counsel of FMR LLC (diversified financial services company, 2010-present), and is an employee of Fidelity Investments. Previously, Mr. Coffey served as Vice President and Associate General Counsel of FMR LLC (2005-2009).
Jonathan Davis (1968)
Year of Election or Appointment: 2010
Assistant Treasurer
Mr. Davis also serves as Assistant Treasurer of other funds, and is an employee of Fidelity Investments. Previously, Mr. Davis served as Vice President and Associate General Counsel of FMR LLC (diversified financial services company, 2003-2010).
Adrien E. Deberghes (1967)
Year of Election or Appointment: 2016
Assistant Treasurer
Mr. Deberghes also serves as an officer of other funds. He serves as Executive Vice President of Fidelity Investments Money Management, Inc. (FIMM) (investment adviser firm, 2016-present) and is an employee of Fidelity Investments (2008-present). Prior to joining Fidelity Investments, Mr. Deberghes was Senior Vice President of Mutual Fund Administration at State Street Corporation (2007-2008), Senior Director of Mutual Fund Administration at Investors Bank & Trust (2005-2007), and Director of Finance for Dunkin' Brands (2000-2005). Previously, Mr. Deberghes served in other fund officer roles.
Joseph DeSantis (1959)
Year of Election or Appointment: 2017
Vice President
Mr. DeSantis also serves as Vice President of other funds. Mr. DeSantis serves as a Director of Fidelity Management & Research (Japan) Limited (investment adviser firm, 2016-present), Chief Investment Officer, Equities (2010-present) and is an employee of Fidelity Investments.
Stephanie J. Dorsey (1969)
Year of Election or Appointment: 2010
Assistant Treasurer
Ms. Dorsey also serves as an officer of other funds. She is an employee of Fidelity Investments (2008-present) and has served in other fund officer roles. Prior to joining Fidelity Investments, Ms. Dorsey served as Treasurer (2004-2008) of the JPMorgan Mutual Funds and Vice President (2004-2008) of JPMorgan Chase Bank.
Howard J. Galligan III (1966)
Year of Election or Appointment: 2014
Chief Financial Officer
Mr. Galligan also serves as Chief Financial Officer of other funds. Mr. Galligan serves as President of Fidelity Pricing and Cash Management Services (FPCMS) (2014-present) and as a Director of Strategic Advisers, Inc. (investment adviser firm, 2008-present). Previously, Mr. Galligan served as Chief Administrative Officer of Asset Management (2011-2014) and Chief Operating Officer and Senior Vice President of Investment Support for Strategic Advisers, Inc. (2003-2011).
Brian B. Hogan (1964)
Year of Election or Appointment: 2009
Vice President
Mr. Hogan also serves as Trustee or Vice President of other funds. Mr. Hogan serves as a Director of FMR Investment Management (UK) Limited (investment adviser firm, 2015-present) and Fidelity SelectCo, LLC (investment adviser firm, 2014-present) and President of the Equity Division of FMR (investment adviser firm, 2009-present). Previously, Mr. Hogan served as Senior Vice President, Equity Research of FMR (2006-2009) and as a portfolio manager. Mr. Brian B. Hogan is not related to Mr. Colm A. Hogan.
Colm A. Hogan (1973)
Year of Election or Appointment: 2016
Deputy Treasurer
Mr. Hogan also serves as an officer of other funds. Mr. Hogan is an employee of Fidelity Investments (2005-present). Mr. Colm A. Hogan is not related to Mr. Brian B. Hogan.
Chris Maher (1972)
Year of Election or Appointment: 2013
Assistant Treasurer
Mr. Maher serves as Assistant Treasurer of other funds. Mr. Maher is Vice President of Valuation Oversight and is an employee of Fidelity Investments. Previously, Mr. Maher served as Vice President of Asset Management Compliance (2013), Vice President of the Program Management Group of FMR (investment adviser firm, 2010-2013), and Vice President of Valuation Oversight (2008-2010).
Rieco E. Mello (1969)
Year of Election or Appointment: 2017
Assistant Treasurer
Mr. Mello also serves as Assistant Treasurer of other funds. Mr. Mello is an employee of Fidelity Investments (1995-present).
Kenneth B. Robins (1969)
Year of Election or Appointment: 2016
Chief Compliance Officer
Mr. Robins also serves as an officer of other funds. Mr. Robins serves as Compliance Officer of Fidelity Management & Research Company and FMR Co., Inc. (investment adviser firms, 2016-present) and is an employee of Fidelity Investments (2004-present). Previously, Mr. Robins served as Executive Vice President of Fidelity Investments Money Management, Inc. (investment adviser firm, 2013-2016) and served in other fund officer roles.
Stacie M. Smith (1974)
Year of Election or Appointment: 2016
President and Treasurer
Ms. Smith also serves as an officer of other funds. She is an employee of Fidelity Investments (2009-present) and has served in other fund officer roles. Prior to joining Fidelity Investments, Ms. Smith served as Senior Audit Manager of Ernst & Young LLP (accounting firm, 1996-2009). Previously, Ms. Smith served as Deputy Treasurer of certain Fidelity® funds (2013-2016).
Marc L. Spector (1972)
Year of Election or Appointment: 2016
Assistant Treasurer
Mr. Spector also serves as an officer of other funds. Mr. Spector is an employee of Fidelity Investments (2016-present). Prior to joining Fidelity Investments, Mr. Spector served as Director at the Siegfried Group (accounting firm, 2013-2016), and prior to Siegfried Group as audit senior manager at Deloitte & Touche (accounting firm, 2005-2013).
Renee Stagnone (1975)
Year of Election or Appointment: 2016
Assistant Treasurer
Ms. Stagnone also serves as an officer of other funds. Ms. Stagnone is an employee of Fidelity Investments (1997-present). Previously, Ms. Stagnone served as Deputy Treasurer of certain Fidelity® funds (2013-2016).
Shareholder Expense Example
As a shareholder of the Fund, you incur two types of costs: (1) transaction costs, including sales charges (loads) on purchase payments or redemption proceeds, redemption fees and (2) ongoing costs, including management fees, distribution and/or service (12b-1) fees and other Fund expenses. This Example is intended to help you understand your ongoing costs (in dollars) of investing in the Fund and to compare these costs with the ongoing costs of investing in other mutual funds.
The Example is based on an investment of $1,000 invested at the beginning of the period and held for the entire period (May 1, 2017 to October 31, 2017).
Actual Expenses
The first line of the accompanying table for each class of the Fund provides information about actual account values and actual expenses. You may use the information in this line, together with the amount you invested, to estimate the expenses that you paid over the period. Simply divide your account value by $1,000.00 (for example, an $8,600 account value divided by $1,000.00 = 8.6), then multiply the result by the number in the first line for a class of the Fund under the heading entitled "Expenses Paid During Period" to estimate the expenses you paid on your account during this period. A small balance maintenance fee of $12.00 that is charged once a year may apply for certain accounts with a value of less than $2,000. This fee is not included in the table below. If it was, the estimate of expenses you paid during the period would be higher, and your ending account value lower, by this amount. In addition, the Fund, as a shareholder in the underlying Fidelity Central Funds, will indirectly bear its pro-rata share of the fees and expenses incurred by the underlying Fidelity Central Funds. These fees and expenses are not included in the Fund's annualized expense ratio used to calculate the expense estimate in the table below.
Hypothetical Example for Comparison Purposes
The second line of the accompanying table for each class of the Fund provides information about hypothetical account values and hypothetical expenses based on a Class' actual expense ratio and an assumed rate of return of 5% per year before expenses, which is not the Class' actual return. The hypothetical account values and expenses may not be used to estimate the actual ending account balance or expenses you paid for the period. You may use this information to compare the ongoing costs of investing in the Fund and other funds. To do so, compare this 5% hypothetical example with the 5% hypothetical examples that appear in the shareholder reports of the other funds. A small balance maintenance fee of $12.00 that is charged once a year may apply for certain accounts with a value of less than $2,000. This fee is not included in the table below. If it was, the estimate of expenses you paid during the period would be higher, and your ending account value lower, by this amount. In addition, the Fund, as a shareholder in the underlying Fidelity Central Funds, will indirectly bear its pro-rata share of the fees and expenses incurred by the underlying Fidelity Central Funds. These fees and expenses are not included in the Fund's annualized expense ratio used to calculate the expense estimate in the table below.
Please note that the expenses shown in the table are meant to highlight your ongoing costs only and do not reflect any transaction costs. Therefore, the second line of the table is useful in comparing ongoing costs only, and will not help you determine the relative total costs of owning different funds. In addition, if these transactional costs were included, your costs would have been higher.
| | Annualized Expense Ratio-A | Beginning
Account Value
May 1, 2017 | Ending
Account Value
October 31, 2017 | Expenses Paid
During Period-B
May 1, 2017
to October 31, 2017 |
| Class A | 1.57% | | | |
| Actual | | $1,000.00 | $1,071.90 | $8.20 |
| Hypothetical-C | | $1,000.00 | $1,017.29 | $7.98 |
| Class M | 1.89% | | | |
| Actual | | $1,000.00 | $1,069.80 | $9.86 |
| Hypothetical-C | | $1,000.00 | $1,015.68 | $9.60 |
| Class C | 2.35% | | | |
| Actual | | $1,000.00 | $1,067.70 | $12.25 |
| Hypothetical-C | | $1,000.00 | $1,013.36 | $11.93 |
| Emerging Europe, Middle East, Africa (EMEA) | 1.37% | | | |
| Actual | | $1,000.00 | $1,073.00 | $7.16 |
| Hypothetical-C | | $1,000.00 | $1,018.30 | $6.97 |
| Class I | 1.18% | | | |
| Actual | | $1,000.00 | $1,073.10 | $6.17 |
| Hypothetical-C | | $1,000.00 | $1,019.26 | $6.01 |
A Annualized expense ratio reflects expenses net of applicable fee waivers.
B Expenses are equal to each Class' annualized expense ratio, multiplied by the average account value over the period, multiplied by 184/365 (to reflect the one-half year period).
C 5% return per year before expenses
Distributions (Unaudited)
The Board of Trustees of Fidelity Advisor Emerging Europe, Middle East, Africa (EMEA) Fund voted to pay to shareholders of record at the opening of business on record date, the following distributions per share derived from capital gains realized from sales of portfolio securities, and dividends derived from net investment income:
| | Pay Date | Record Date | Dividends | Capital Gains |
| Fidelity Advisor Emerging Europe, Middle East, Africa (EMEA) Fund | | | | |
| Class A | 12/11/17 | 12/08/17 | $0.130 | $0.008 |
| Class M | 12/11/17 | 12/08/17 | $0.109 | $0.008 |
| Class C | 12/11/17 | 12/08/17 | $0.038 | $0.008 |
| Emerging Europe, Middle East, Africa (EMEA) | 12/11/17 | 12/08/17 | $0.157 | $0.008 |
| Class I | 12/11/17 | 12/08/17 | $0.167 | $0.008 |
|
Class A, Class M, Class C, Emerging Europe, Middle East, Africa (EMEA), and Class I designate 100% of the dividends distributed during the fiscal year as amounts which may be taken into account as a dividend for purposes of the maximum rate under section 1(h)(11) of the Internal Revenue Code.
The amounts per share which represent income derived from sources within, and taxes paid to, foreign countries or possessions of the United States are as follows:
| | Pay Date | Income | Taxes |
| Fidelity Advisor Emerging Europe, Middle East, Africa (EMEA) Fund | | | |
| Class A | 12/12/16 | $0.1186 | $0.0336 |
| Class M | 12/12/16 | $0.1026 | $0.0336 |
| Class C | 12/12/16 | $0.0666 | $0.0336 |
| Emerging Europe, Middle East, Africa (EMEA) | 12/12/16 | $0.1356 | $0.0336 |
| Class I | 12/12/16 | $0.1426 | $0.0336 |
|
The fund will notify shareholders in January 2018 of amounts for use in preparing 2017 income tax returns.
Board Approval of Investment Advisory Contracts and Management Fees
Fidelity Emerging Europe, Middle East, Africa (EMEA) Fund
Each year, the Board of Trustees, including the Independent Trustees (together, the Board), votes on the renewal of the management contract with Fidelity Management & Research Company (FMR) and the sub-advisory agreements (together, the Advisory Contracts) for the fund. FMR and the sub-advisers are referred to herein as the Investment Advisers. The Board, assisted by the advice of fund counsel and Independent Trustees' counsel, requests and considers a broad range of information relevant to the renewal of the Advisory Contracts throughout the year.
The Board meets regularly and, at each of its meetings, covers an extensive agenda of topics and materials and considers factors that are relevant to its annual consideration of the renewal of the fund's Advisory Contracts, including the services and support provided to the fund and its shareholders. The Board has established various standing committees (Committees), each composed of and chaired by Independent Trustees with varying backgrounds, to which the Board has assigned specific subject matter responsibilities in order to enhance effective decision-making by the Board. The Board, acting directly and through its Committees, requests and receives information concerning the annual consideration of the renewal of the fund's Advisory Contracts. The Board also meets as needed to review matters specifically related to the Board's annual consideration of the renewal of the Advisory Contracts. Members of the Board may also meet with trustees of other Fidelity funds through ad hoc joint committees to discuss certain matters relevant to all of the Fidelity funds.
At its July 2017 meeting, the Board unanimously determined to renew the fund's Advisory Contracts. In reaching its determination, the Board considered all factors it believed relevant, including (i) the nature, extent, and quality of the services to be provided to the fund and its shareholders (including the investment performance of the fund); (ii) the competitiveness of the fund's management fee and total expense ratio relative to peer funds; (iii) the total costs of the services to be provided by and the profits to be realized by Fidelity from its relationships with the fund; and (iv) the extent to which, if any, economies of scale exist and would be realized as the fund grows, and whether any economies of scale are appropriately shared with fund shareholders.
In considering whether to renew the Advisory Contracts for the fund, the Board reached a determination, with the assistance of fund counsel and Independent Trustees' counsel and through the exercise of its business judgment, that the renewal of the Advisory Contracts was in the best interests of the fund and its shareholders and that the compensation payable under the Advisory Contracts was fair and reasonable. The Board's decision to renew the Advisory Contracts was not based on any single factor, but rather was based on a comprehensive consideration of all the information provided to the Board at its meetings throughout the year. The Board, in reaching its determination to renew the Advisory Contracts, was aware that shareholders of the fund have a broad range of investment choices available to them, including a wide choice among funds offered by Fidelity's competitors, and that the fund's shareholders, who have the opportunity to review and weigh the disclosure provided by the fund in its prospectus and other public disclosures, have chosen to invest in this fund, which is part of the Fidelity family of funds.
Amendment to Group Fee Rate. The Board also approved an amendment to the management contract for the fund to add an additional breakpoint to the group fee schedule, effective October 1, 2017. The Board noted that the additional breakpoint would result in lower management fee rates as Fidelity's assets under management increase.
Nature, Extent, and Quality of Services Provided. The Board considered Fidelity's staffing as it relates to the fund, including the backgrounds of investment personnel of Fidelity, and also considered the fund's investment objective, strategies, and related investment philosophy. The Independent Trustees also had discussions with senior management of Fidelity's investment operations and investment groups. The Board considered the structure of the investment personnel compensation program and whether this structure provides appropriate incentives to act in the best interests of the fund. Additionally, the Board considered the portfolio managers' investments, if any, in the funds that they manage.
Resources Dedicated to Investment Management and Support Services. The Board and the Fund Oversight and Research Committees reviewed the general qualifications and capabilities of Fidelity's investment staff, including its size, education, experience, and resources, as well as Fidelity's approach to recruiting, training, managing, and compensating investment personnel. The Board noted that Fidelity has continued to increase the resources devoted to non-U.S. offices, including expansion of Fidelity's global investment organization. The Board also noted that Fidelity's analysts have extensive resources, tools and capabilities that allow them to conduct sophisticated quantitative and fundamental analysis, as well as credit analysis of issuers, counterparties and guarantors. Further, the Board considered that Fidelity's investment professionals have sufficient access to global information and data so as to provide competitive investment results over time, and that those professionals also have access to sophisticated tools that permit them to assess portfolio construction and risk and performance attribution characteristics continuously, as well as to transmit new information and research conclusions rapidly around the world. Additionally, in its deliberations, the Board considered Fidelity's trading, risk management, compliance, and technology and operations capabilities and resources, which are integral parts of the investment management process.
Shareholder and Administrative Services. The Board considered (i) the nature, extent, quality, and cost of advisory, administrative, and shareholder services performed by the Investment Advisers and their affiliates under the Advisory Contracts and under separate agreements covering transfer agency, pricing and bookkeeping, and securities lending services for the fund; (ii) the nature and extent of the supervision of third party service providers, principally custodians, subcustodians, and pricing vendors; and (iii) the resources devoted to, and the record of compliance with, the fund's compliance policies and procedures. The Board also reviewed the allocation of fund brokerage, including allocations to brokers affiliated with the Investment Advisers, the use of brokerage commissions to pay fund expenses, and the use of "soft" commission dollars to pay for research services.
The Board noted that the growth of fund assets over time across the complex allows Fidelity to reinvest in the development of services designed to enhance the value or convenience of the Fidelity funds as investment vehicles. These services include 24-hour access to account information and market information through telephone representatives and over the Internet, investor education materials and asset allocation tools, and the expanded availability of Fidelity Investor Centers.
In 2014, the Board formed an ad hoc Committee on Transfer Agency Fees to review the variety of transfer agency fee structures throughout the industry and Fidelity's competitive positioning with respect to industry participants.
Investment in a Large Fund Family. The Board considered the benefits to shareholders of investing in a Fidelity fund, including the benefits of investing in a fund that is part of a large family of funds offering a variety of investment disciplines and providing a large variety of mutual fund investor services. The Board noted that Fidelity had taken, or had made recommendations that resulted in the Fidelity funds taking, a number of actions over the previous year that benefited particular funds, including: (i) continuing to dedicate additional resources to Fidelity's investment research process, and to the support of the senior management team that oversees asset management; (ii) continuing efforts to enhance Fidelity's global research capabilities; (iii) launching new funds and making other enhancements to meet client needs; (iv) launching new share classes of existing funds; (v) eliminating purchase minimums and broadening eligibility requirements for certain lower-priced share classes; (vi) reducing management fees and total expenses for certain growth equity funds and index funds; (vii) lowering expense caps for certain existing funds and classes to reduce expenses borne by shareholders; (viii) eliminating short-term redemption fees for certain funds; (ix) introducing a new pricing structure for certain funds of funds that is expected to reduce overall expenses paid by shareholders; (x) rationalizing product lines and gaining increased efficiencies through proposals for fund mergers and share class consolidations; (xi) continuing to develop, acquire and implement systems and technology to improve services to the funds and shareholders, strengthen information security, and increase efficiency; and (xii) implementing enhancements to further strengthen Fidelity's product line to increase investors' probability of success in achieving their investment goals, including retirement income goals.
Investment Performance. The Board considered whether the fund has operated in accordance with its investment objective, as well as its record of compliance with its investment restrictions and its performance history. The Board noted that there was a portfolio management change for the fund in May 2017.
The Board took into account discussions with representatives of the Investment Advisers about fund investment performance that occur at Board meetings throughout the year. In this regard the Board noted that as part of regularly scheduled fund reviews and other reports to the Board on fund performance, the Board considers annualized return information for the fund for different time periods, measured against a securities market index ("benchmark index") and a peer group of funds with similar objectives ("peer group"), if any. In its evaluation of fund investment performance, the Board gave particular attention to information indicating changes in performance of certain Fidelity funds for specific time periods and discussed with the Investment Advisers the reasons for any overperformance or underperformance.
In addition to reviewing absolute and relative fund performance, the Independent Trustees periodically consider the appropriateness of fund performance metrics in evaluating the results achieved. In general, the Independent Trustees believe that fund performance should be evaluated based on net performance (after fees and expenses) of both the highest performing and lowest performing fund share classes, where applicable, compared to appropriate benchmark indices, over appropriate time periods that may include full market cycles, and compared to peer groups, as applicable, over the same periods, taking into account relevant factors including the following: general market conditions; issuer-specific information; and fund cash flows and other factors.
The Independent Trustees recognize that shareholders evaluate performance on a net basis over their own holding periods, for which one-, three-, and five-year periods are often used as a proxy. For this reason, the performance information reviewed by the Board also included net cumulative calendar year total return information for the fund and an appropriate benchmark index for the most recent one-, three-, and five-year periods, as shown below. A peer group is not shown below because the fund does not generally utilize a peer group for performance comparison purposes.
Fidelity Emerging Europe, Middle East, Africa (EMEA) Fund
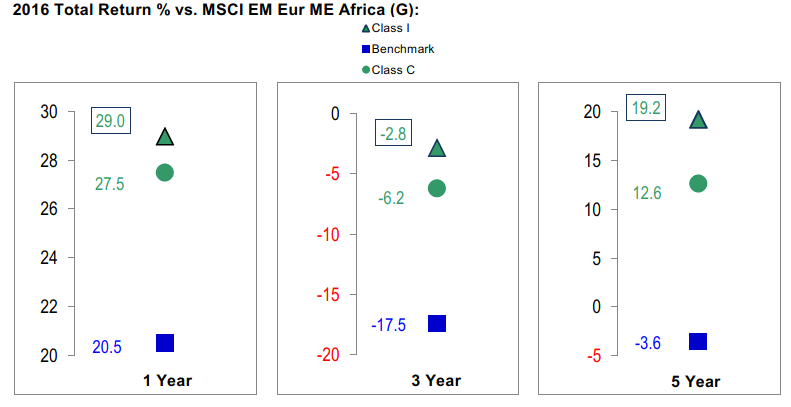
Based on its review, the Board concluded that the nature, extent, and quality of services provided to the fund under the Advisory Contracts should continue to benefit the shareholders of the fund.
Competitiveness of Management Fee and Total Expense Ratio. The Board considered the fund's management fee and total expense ratio compared to "mapped groups" of competitive funds and classes created for the purpose of facilitating the Trustees' competitive analysis of management fees and total expenses. Fidelity creates "mapped groups" by combining similar Lipper investment objective categories that have comparable investment mandates. Combining Lipper investment objective categories aids the Board's management fee and total expense ratio comparisons by broadening the competitive group used for comparison.
Management Fee. The Board considered two proprietary management fee comparisons for the 12-month periods shown in basis points (BP) in the chart below. The group of Lipper funds used by the Board for management fee comparisons is referred to below as the "Total Mapped Group." The Total Mapped Group comparison focuses on a fund's standing in terms of gross management fees before expense reimbursements or caps relative to the total universe of funds with comparable investment mandates, regardless of whether their management fee structures also are comparable. Funds with comparable investment mandates offer exposure to similar types of securities. Funds with comparable management fee structures have similar management fee contractual arrangements (
e.g., flat rate charged for advisory services, all-inclusive fee rate,
etc.). "TMG %" represents the percentage of funds in the Total Mapped Group that had management fees that were lower than the fund's. For example, a hypothetical TMG % of 20% would mean that 80% of the funds in the Total Mapped Group had higher, and 20% had lower, management fees than the fund. The fund's actual TMG %s and the number of funds in the Total Mapped Group are in the chart below. The "Asset-Size Peer Group" (ASPG) comparison focuses on a fund's standing relative to a subset of non-Fidelity funds within the Total Mapped Group that are similar in size and management fee structure. For example, if a fund is in the first quartile of the ASPG, the fund's management fee ranks in the least expensive or lowest 25% of funds in the ASPG. The ASPG represents at least 15% of the funds in the Total Mapped Group with comparable asset size and management fee structures, subject to a minimum of 50 funds (or all funds in the Total Mapped Group if fewer than 50). Additional information, such as the ASPG quartile in which the fund's management fee rate ranked, is also included in the chart and considered by the Board.
Fidelity Emerging Europe, Middle East, Africa (EMEA) Fund
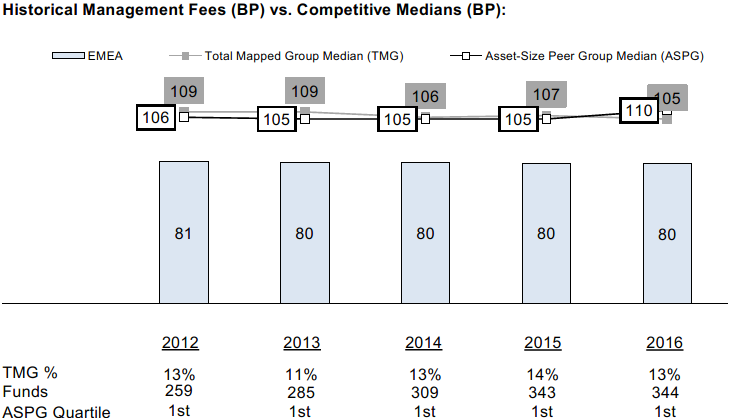
The Board noted that the fund's management fee rate ranked below the median of its Total Mapped Group and below the median of its ASPG for 2016.
The Board noted that, in 2014, the Board and the boards of other Fidelity funds formed the ad hoc Committee on Group Fee to conduct an in-depth review of the "group fee" component of the management fee of funds with such management fee structures. The Committee's focus included the mechanics of the group fee, the competitive landscape of group fee structures, Fidelity funds with no group fee component and investment products not included in group fee assets. The Board also considered that, for funds subject to the group fee, FMR agreed to voluntarily waive fees over a specified period of time in amounts designed to account for assets converted from certain funds to certain collective investment trusts.
The Board also noted that, in 2013, the ad hoc Committee on Management Fees was formed to conduct an in-depth review of the management fee rates of Fidelity's active equity mutual funds. The Committee focused on the following areas: (i) standard fee structures; (ii) research consumption and trading evolution; (iii) management fee competitiveness/profitability by category; and (iv) factors that drive institutional pricing.
Based on its review, the Board concluded that the fund's management fee is fair and reasonable in light of the services that the fund receives and the other factors considered.
Total Expense Ratio. In its review of each class's total expense ratio, the Board considered the fund's management fee rate as well as other fund or class expenses, as applicable, such as transfer agent fees, pricing and bookkeeping fees, fund-paid 12b-1 fees, and custodial, legal, and audit fees. The Board also noted that Fidelity may agree to waive fees and expenses from time to time, and the extent to which, if any, it has done so for the fund. As part of its review, the Board also considered the current and historical total expense ratios of each class of the fund compared to competitive fund median expenses. Each class of the fund is compared to those funds and classes in the Total Mapped Group (used by the Board for management fee comparisons) that have a similar sales load structure.
The Board noted that the total expense ratio of the retail class ranked below the competitive median for 2016 and the total expense ratio of each of Class A, Class M (formerly Class T), Class C, and Class I ranked above the competitive median for 2016. The Board considered that, in general, various factors can affect total expense ratios. The Board noted that the total expense ratio of each of Class A, Class M, Class C, and Class I was above the competitive median because of relatively higher other expenses due to low asset levels. The Board noted that the total expense ratio of Class M was also above the competitive median because of higher 12b-1 fees on Class M as compared to most competitor funds. Class M has a higher 12b-1 fee, but a lower front-end sales charge, than traditionally priced front-end sales charge classes. The Board considered that Class M is primarily sold load-waived in the retirement plan market where its 0.50% 12b-1 fee is comparable to competing no-load, higher 12b-1 fee classes designed specifically for retirement plans. The Board noted that the total expense ratio of Class C was also above the competitive median because of its 12b-1 fees. The Board also noted that, although Class I is categorized by Lipper as an institutional class, Class I has a significantly lower investment minimum than most other funds and classes categorized as institutional. As a result, FMR believes Class I is generally more comparable to retail funds and classes. The Board noted that the fund offers multiple classes, each of which has a different sales load and 12b-1 fee structure, and that the multiple structures are intended to offer a range of pricing options for the intermediary market. The Board also noted that the total expense ratios of the classes vary primarily by the level of their 12b-1 fees, although differences in transfer agent fees may also cause expenses to vary from class to class.
Fees Charged to Other Fidelity Clients. The Board also considered Fidelity fee structures and other information with respect to clients of Fidelity, such as other funds advised or subadvised by Fidelity, pension plan clients, and other institutional clients with similar mandates. The Board noted that an ad hoc joint committee created by it and the boards of other Fidelity funds periodically (most recently in 2013) reviews and compares Fidelity's institutional investment advisory business with its business of providing services to the Fidelity funds, including the differences in services provided, fees charged, and costs incurred, as well as competition in their respective marketplaces.
Based on its review of total expense ratios and fees charged to other Fidelity clients, the Board concluded that, although some classes were above the median of the universe presented for comparison, the total expense ratio of each class of the fund was reasonable in light of the services that the fund and its shareholders receive and the other factors considered.
Costs of the Services and Profitability. The Board considered the revenues earned and the expenses incurred by Fidelity in conducting the business of developing, marketing, distributing, managing, administering and servicing the fund and servicing the fund's shareholders. The Board also considered the level of Fidelity's profits in respect of all the Fidelity funds.
On an annual basis, Fidelity presents to the Board information about the profitability of its relationships with the fund. Fidelity calculates profitability information for each fund, as well as aggregate profitability information for groups of Fidelity funds and all Fidelity funds, using a series of detailed revenue and cost allocation methodologies which originate with the books and records of Fidelity on which Fidelity's audited financial statements are based. The Audit Committee of the Board reviews any significant changes from the prior year's methodologies.
PricewaterhouseCoopers LLP (PwC), independent registered public accounting firm and auditor to Fidelity and certain Fidelity funds, has been engaged annually by the Board as part of the Board's assessment of Fidelity's profitability analysis. PwC's engagement includes the review and assessment of the methodologies used by Fidelity in determining the revenues and expenses attributable to Fidelity's mutual fund business, and completion of agreed-upon procedures in respect of the mathematical accuracy of the fund profitability information and its conformity to established allocation methodologies. After considering PwC's reports issued under the engagement and information provided by Fidelity, the Board concluded that while other allocation methods may also be reasonable, Fidelity's profitability methodologies are reasonable in all material respects.
The Board also reviewed Fidelity's non-fund businesses and potential fall-out benefits related to the mutual fund business as well as cases where Fidelity's affiliates may benefit from or be related to the fund's business.
The Board considered the costs of the services provided by and the profits realized by Fidelity in connection with the operation of the fund and was satisfied that the profitability was not excessive.
Economies of Scale. The Board considered whether there have been economies of scale in respect of the management of the Fidelity funds, whether the Fidelity funds (including the fund) have appropriately benefited from any such economies of scale, and whether there is potential for realization of any further economies of scale. The Board considered the extent to which the fund will benefit from economies of scale as assets grow through increased services to the fund, through waivers or reimbursements, or through fee or expense ratio reductions. The Board also noted that a committee (the Economies of Scale Committee) created by it and the boards of other Fidelity funds periodically (most recently in 2013) analyzes whether Fidelity attains economies of scale in respect of the management and servicing of the Fidelity funds, whether the Fidelity funds have appropriately benefited from such economies of scale, and whether there is potential for realization of any further economies of scale.
The Board recognized that the fund's management contract incorporates a "group fee" structure, which provides for lower group fee rates as total group assets increase, and for higher group fee rates as total group assets decrease (with "group assets" defined to include fund assets under FMR's management plus the assets of sector funds previously under FMR's management). FMR calculates the group fee rates based on a tiered asset "breakpoint" schedule that varies based on asset class. The Board considered that the group fee is designed to deliver the benefits of economies of scale to fund shareholders when total Fidelity fund assets increase, even if assets of any particular fund are unchanged or have declined, because some portion of Fidelity's costs are attributable to services provided to all Fidelity funds, and all funds benefit if those costs can be allocated among more assets. The Board concluded that, given the group fee structure, fund shareholders will benefit from lower management fees as group assets increase at the fund complex level, regardless of whether Fidelity achieves any such economies of scale.
The Board concluded, taking into account the analysis of the Economies of Scale Committee, that economies of scale, if any, are being appropriately shared between fund shareholders and Fidelity.
Additional Information Requested by the Board. In order to develop fully the factual basis for consideration of the Fidelity funds' advisory contracts, the Board requested and received additional information on certain topics, including: (i) fund performance trends, in particular the underperformance of certain funds, and Fidelity's long-term strategies for certain funds; (ii) Fidelity's fund profitability methodology, profitability trends for certain funds, and the impact of certain factors on fund profitability results, including the impact of market trends on actively managed funds; (iii) the use of performance fees and the calculation of performance adjustments, including the impact of underperformance and fund outflows on performance adjustments; (iv) metrics for evaluating index fund performance; (v) Fidelity's group fee structure, including the group fee breakpoint schedules; (vi) the terms of Fidelity's contractual and voluntary expense cap arrangements with the funds; (vii) the methodology with respect to evaluating competitive fund data and peer group classifications and fee comparisons; (viii) the expense structures for different funds and classes; (ix) Fidelity's arrangements with affiliated sub-advisers on behalf of the funds; (x) information regarding other accounts managed by Fidelity, including institutional accounts and collective investment trusts; (xi) recent changes to the fee structure for certain funds of funds; and (xii) the impact of the Department of Labor's new fiduciary rule on the funds' comparative expense information.
Based on its evaluation of all of the conclusions noted above, and after considering all factors it believed relevant, the Board concluded that the advisory fee structures are fair and reasonable, and that the fund's Advisory Contracts should be renewed.
Corporate Headquarters
245 Summer St.
Boston, MA 02210
www.fidelity.com
EME-ANN-1217
1.861972.109
Fidelity Flex℠ Funds Fidelity Flex℠ International Fund
Annual Report October 31, 2017 |
|
Contents
To view a fund's proxy voting guidelines and proxy voting record for the 12-month period ended June 30, visit http://www.fidelity.com/proxyvotingresults or visit the Securities and Exchange Commission's (SEC) web site at http://www.sec.gov.
You may also call 1-800-835-5092 to request a free copy of the proxy voting guidelines.
Standard & Poor's, S&P and S&P 500 are registered service marks of The McGraw-Hill Companies, Inc. and have been licensed for use by Fidelity Distributors Corporation.
Other third-party marks appearing herein are the property of their respective owners.
All other marks appearing herein are registered or unregistered trademarks or service marks of FMR LLC or an affiliated company. © 2017 FMR LLC. All rights reserved.
This report and the financial statements contained herein are submitted for the general information of the shareholders of the Fund. This report is not authorized for distribution to prospective investors in the Fund unless preceded or accompanied by an effective prospectus.
A fund files its complete schedule of portfolio holdings with the SEC for the first and third quarters of each fiscal year on Form N-Q. Forms N-Q are available on the SEC’s web site at http://www.sec.gov. A fund's Forms N-Q may be reviewed and copied at the SEC’s Public Reference Room in Washington, DC. Information regarding the operation of the SEC's Public Reference Room may be obtained by calling 1-800-SEC-0330.
For a complete list of a fund's portfolio holdings, view the most recent holdings listing, semiannual report, or annual report on Fidelity's web site at http://www.fidelity.com, http://www.institutional.fidelity.com, or http://www.401k.com, as applicable.
NOT FDIC INSURED •MAY LOSE VALUE •NO BANK GUARANTEE
Neither the Fund nor Fidelity Distributors Corporation is a bank.
Performance: The Bottom Line
Average annual total return reflects the change in the value of an investment, assuming reinvestment of distributions from dividend income and capital gains (the profits earned upon the sale of securities that have grown in value, if any) and assuming a constant rate of performance each year. The hypothetical investment and the average annual total returns do not reflect the deduction of taxes that a shareholder would pay on fund distributions or the redemption of fund shares. During periods of reimbursement by Fidelity, a fund’s total return will be greater than it would be had the reimbursement not occurred. How a fund did yesterday is no guarantee of how it will do tomorrow.
Average annual total returns for Fidelity Flex℠ International Fund will be reported once the fund is a year old.
$10,000 Over Life of Fund
Let's say hypothetically that $10,000 was invested in Fidelity Flex℠ International Fund on March 7, 2017, when the fund started.
The chart shows how the value of your investment would have changed, and also shows how the MSCI ACWI (All Country World Index) ex USA Index performed over the same period.
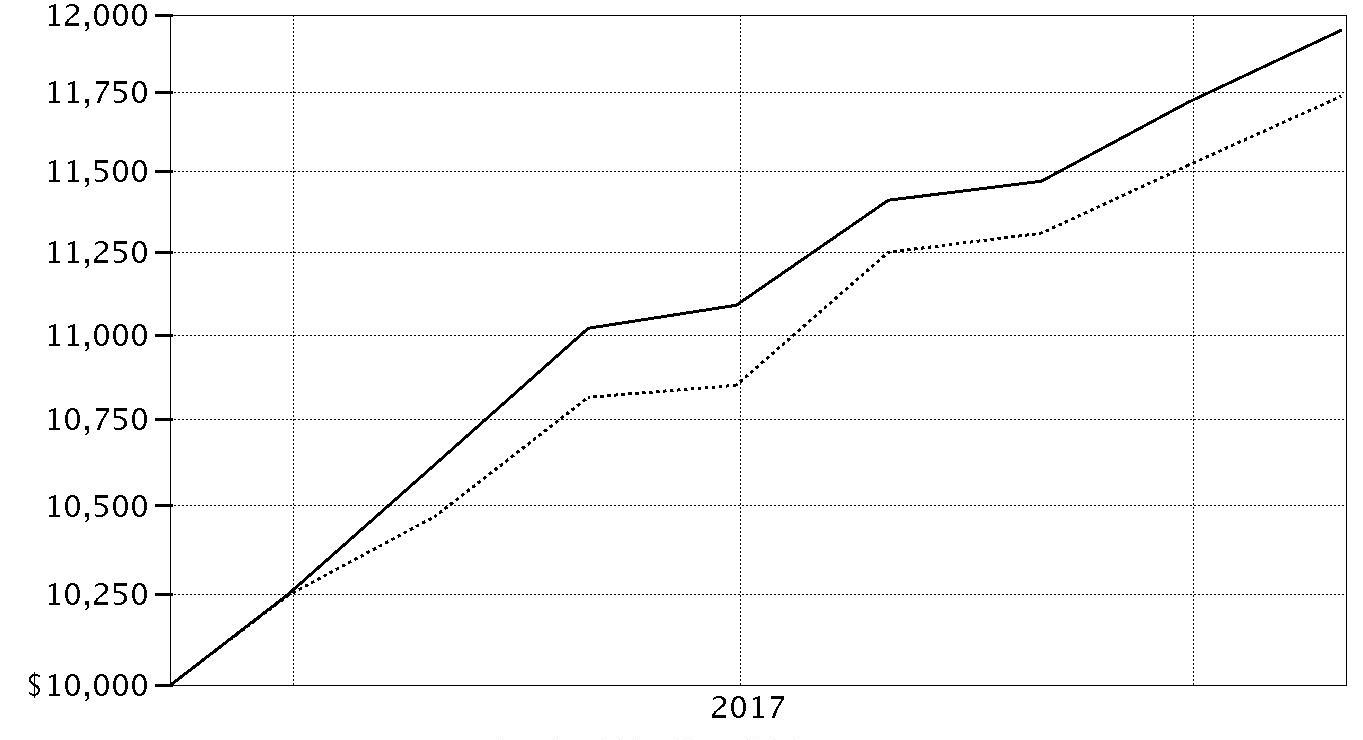
| Period Ending Values |
| $11,950 | Fidelity Flex℠ International Fund |
| $11,737 | MSCI ACWI (All Country World Index) ex USA Index |
Management's Discussion of Fund Performance
Market Recap: The MSCI ACWI (All Country World Index) ex USA Index returned 23.85% for the year ending October 31, 2017, helped partly by a generally weak U.S. dollar. Some favorable election results in continental Europe (+30%) suggested ebbing political uncertainty and near-term risk there, but the U.K. (+20%) faced more-mixed conditions ahead of its expected exit from the EU. Despite central-bank easing – and pressured recently by yen strength – Japan (+18%) lagged the rest of the Asia-Pacific group (+22%). Commodity-price volatility slowed Canada (+17%), but the emerging-markets (EM) group (+26%) sped ahead. Sector-wise, information technology (+47%) was driven by a surge among several Chinese internet-related names. Financials (+27%) rode rising interest rates that, at the same time, weighed on real estate (+17%), utilities (+16%), consumer staples (+14%) and telecommunication services (+9%) – so-called “bond proxy” sectors. Materials (+28%) and industrials (+27%) responded to demand from China and price gains for certain commodities. In energy (+20%), oil prices lost ground in the spring before rebounding through October 31 to end well above where they started 12 months ago. Lastly, health care (+14%) was hurt by early-period turmoil around drug pricing and health care legislation.
Comments from Co-Portfolio Managers Alex Zavratsky and Sammy Simnegar: From its inception on March 7, 2017, through October 31, 2017, the fund gained 19.50%, versus 17.37% for the MSCI ACWI ex USA Index. Relative to the benchmark, the fund was aided by security selection in the EM group, especially China. Picks in Japan and the rest of Asia-Pacific also helped. In contrast, the fund was hampered by exposure to the U.S., where we invest in companies that do most or all of their business abroad. Among sectors, the fund benefited from overweighting strong-performing tech stocks. Selections within consumer discretionary also helped, but the effect was largely offset by picks in consumer staples. A small cash position also curbed results. Our top individual contributor was Chinese e-commerce firm Alibaba Group Holding. Other standouts included South African internet company Naspers; ASML Holding, a Dutch semiconductor-equipment maker; and Interpump, an Italy-based producer of specialty pumps. Conversely, the fund was hurt by overweightings in convenience-store operators BGF Retail of South Korea and Canada's Alimentation-Couche Tard.
The views expressed above reflect those of the portfolio manager(s) only through the end of the period as stated on the cover of this report and do not necessarily represent the views of Fidelity or any other person in the Fidelity organization. Any such views are subject to change at any time based upon market or other conditions and Fidelity disclaims any responsibility to update such views. These views may not be relied on as investment advice and, because investment decisions for a Fidelity fund are based on numerous factors, may not be relied on as an indication of trading intent on behalf of any Fidelity fund.
Note to Shareholders: Following a roughly five-month leave of absence, Jed Weiss returned to Fidelity on November 29, 2017, and resumed his day-to-day responsibilities as Co-Portfolio Manager. In his stead, Vincent Montemaggiore served as interim manager of the fund's developed-growth subportfolio, while Patrick Drouot and Patrick Buchanan served (and remain) as co-managers of the developed small-cap sleeve.
Investment Summary (Unaudited)
Geographic Diversification (% of fund's net assets)
| As of October 31, 2017 |
| | Japan | 13.4% |
| | United States of America* | 12.9% |
| | United Kingdom | 10.2% |
| | France | 6.1% |
| | Switzerland | 6.0% |
| | Canada | 5.1% |
| | Cayman Islands | 5.0% |
| | Germany | 4.7% |
| | Sweden | 3.7% |
| | Other | 32.9% |
* Includes Short-Term investments and Net Other Assets (Liabilities).
Percentages are based on country or territory of incorporation and include the effect of futures contracts, as applicable.
| As of April 30, 2017 |
| | United States of America* | 14.7% |
| | Japan | 13.2% |
| | United Kingdom | 11.0% |
| | Switzerland | 5.9% |
| | France | 5.7% |
| | Canada | 4.7% |
| | Germany | 4.5% |
| | Sweden | 3.5% |
| | Australia | 3.4% |
| | Other | 33.4% |
* Includes Short-Term investments and Net Other Assets (Liabilities).
Percentages are based on country or territory of incorporation and include the effect of futures contracts, as applicable.
Asset Allocation as of October 31, 2017
| | % of fund's net assets | % of fund's net assets 6 months ago |
| Stocks | 99.0 | 96.9 |
| Short-Term Investments and Net Other Assets (Liabilities) | 1.0 | 3.1 |
Top Ten Stocks as of October 31, 2017
| | % of fund's net assets | % of fund's net assets 6 months ago |
| WisdomTree India Earnings ETF (United States of America, Investment Companies) | 3.5 | 2.8 |
| Nestle SA (Reg. S) (Switzerland, Food Products) | 2.2 | 2.1 |
| Alibaba Group Holding Ltd. sponsored ADR (Cayman Islands, Internet Software & Services) | 1.6 | 1.1 |
| Samsung Electronics Co. Ltd. (Korea (South), Technology Hardware, Storage & Peripherals) | 1.5 | 1.4 |
| Tencent Holdings Ltd. (Cayman Islands, Internet Software & Services) | 1.4 | 1.2 |
| SAP SE (Germany, Software) | 1.3 | 1.1 |
| Naspers Ltd. Class N (South Africa, Media) | 1.3 | 1.2 |
| Taiwan Semiconductor Manufacturing Co. Ltd. (Taiwan, Semiconductors & Semiconductor Equipment) | 1.3 | 0.0 |
| Anheuser-Busch InBev SA NV (Belgium, Beverages) | 1.1 | 1.2 |
| Total SA (France, Oil, Gas & Consumable Fuels) | 1.1 | 1.0 |
| | 16.3 | |
Top Market Sectors as of October 31, 2017
| | % of fund's net assets | % of fund's net assets 6 months ago |
| Financials | 19.2 | 18.9 |
| Information Technology | 18.0 | 13.9 |
| Industrials | 13.4 | 13.1 |
| Consumer Staples | 10.2 | 11.9 |
| Consumer Discretionary | 9.4 | 9.6 |
| Health Care | 9.2 | 9.8 |
| Materials | 7.5 | 8.4 |
| Energy | 4.2 | 3.8 |
| Real Estate | 2.1 | 2.0 |
| Telecommunication Services | 1.7 | 1.7 |
Percentages shown as 0.0% may reflect amounts less than 0.05%.
Investments October 31, 2017
Showing Percentage of Net Assets
| Common Stocks - 94.8% | | | |
| | | Shares | Value |
| Argentina - 0.4% | | | |
| Banco Macro SA sponsored ADR | | 165 | $20,777 |
| IRSA Propiedades Comerciales SA sponsored ADR | | 317 | 17,752 |
| Telecom Argentina SA Class B sponsored ADR (a) | | 558 | 18,196 |
|
| TOTAL ARGENTINA | | | 56,725 |
|
| Australia - 2.7% | | | |
| Adelaide Brighton Ltd. | | 830 | 3,945 |
| Amcor Ltd. | | 1,483 | 17,979 |
| Australia & New Zealand Banking Group Ltd. | | 3,936 | 90,132 |
| Beacon Lighting Group Ltd. | | 2,066 | 2,309 |
| CSL Ltd. | | 1,368 | 145,460 |
| DuluxGroup Ltd. | | 1,338 | 7,547 |
| Imdex Ltd. (a) | | 3,036 | 2,254 |
| Insurance Australia Group Ltd. | | 5,179 | 26,002 |
| Macquarie Group Ltd. | | 637 | 47,948 |
| Magellan Financial Group Ltd. | | 835 | 15,510 |
| RCG Corp. Ltd. | | 4,782 | 2,745 |
| Transurban Group unit | | 3,499 | 32,484 |
|
| TOTAL AUSTRALIA | | | 394,315 |
|
| Austria - 0.9% | | | |
| Andritz AG | | 1,137 | 64,288 |
| BUWOG-Gemeinnuetzige Wohnung | | 1,160 | 33,456 |
| Erste Group Bank AG | | 873 | 37,514 |
|
| TOTAL AUSTRIA | | | 135,258 |
|
| Bailiwick of Jersey - 0.3% | | | |
| Integrated Diagnostics Holdings PLC | | 1,143 | 4,458 |
| Shire PLC | | 361 | 17,781 |
| Wolseley PLC | | 396 | 27,691 |
|
| TOTAL BAILIWICK OF JERSEY | | | 49,930 |
|
| Belgium - 1.9% | | | |
| Anheuser-Busch InBev SA NV | | 1,341 | 164,435 |
| KBC Ancora | | 70 | 4,175 |
| KBC Groep NV | | 1,250 | 103,832 |
|
| TOTAL BELGIUM | | | 272,442 |
|
| Bermuda - 0.2% | | | |
| Credicorp Ltd. (United States) | | 94 | 19,687 |
| Vostok New Ventures Ltd. (depositary receipt) (a) | | 541 | 4,459 |
|
| TOTAL BERMUDA | | | 24,146 |
|
| Brazil - 1.2% | | | |
| BM&F BOVESPA SA | | 3,800 | 27,763 |
| BTG Pactual Participations Ltd. unit | | 2,800 | 18,839 |
| Equatorial Energia SA | | 1,000 | 18,647 |
| Estacio Participacoes SA | | 2,000 | 17,932 |
| IRB Brasil Resseguros SA | | 1,900 | 19,056 |
| Itau Unibanco Holding SA | | 800 | 9,396 |
| Kroton Educacional SA | | 3,800 | 20,898 |
| Qualicorp SA | | 1,800 | 19,258 |
| Smiles Fidelidade SA | | 700 | 18,295 |
|
| TOTAL BRAZIL | | | 170,084 |
|
| Canada - 5.1% | | | |
| Alimentation Couche-Tard, Inc. Class B (sub. vtg.) | | 2,505 | 117,454 |
| Canadian National Railway Co. | | 1,269 | 102,112 |
| Canadian Pacific Railway Ltd. | | 241 | 41,785 |
| CCL Industries, Inc. Class B | | 1,676 | 80,780 |
| Constellation Software, Inc. | | 150 | 85,340 |
| Franco-Nevada Corp. | | 897 | 71,282 |
| Imperial Oil Ltd. | | 1,987 | 64,426 |
| McCoy Global, Inc. (a) | | 50 | 70 |
| New Look Vision Group, Inc. | | 160 | 4,264 |
| Pason Systems, Inc. | | 2,383 | 34,597 |
| Potash Corp. of Saskatchewan, Inc. | | 4,986 | 97,046 |
| PrairieSky Royalty Ltd. | | 1,580 | 42,057 |
| ShawCor Ltd. Class A | | 94 | 2,037 |
|
| TOTAL CANADA | | | 743,250 |
|
| Cayman Islands - 5.0% | | | |
| 58.com, Inc. ADR (a) | | 750 | 50,378 |
| Alibaba Group Holding Ltd. sponsored ADR (a) | | 1,251 | 231,297 |
| Baidu.com, Inc. sponsored ADR (a) | | 263 | 64,156 |
| China Biologic Products Holdings, Inc. | | 55 | 4,274 |
| China Literature Ltd. | | 3 | 21 |
| Ctrip.com International Ltd. ADR (a) | | 603 | 28,878 |
| JD.com, Inc. sponsored ADR (a) | | 921 | 34,556 |
| Melco Crown Entertainment Ltd. sponsored ADR | | 757 | 19,137 |
| NetEase, Inc. ADR | | 122 | 34,394 |
| New Oriental Education & Technology Group, Inc. sponsored ADR | | 308 | 25,638 |
| Sands China Ltd. | | 3,600 | 16,958 |
| Shenzhou International Group Holdings Ltd. | | 3,000 | 25,611 |
| Tencent Holdings Ltd. | | 4,400 | 197,758 |
| Value Partners Group Ltd. | | 3,000 | 2,973 |
|
| TOTAL CAYMAN ISLANDS | | | 736,029 |
|
| China - 1.9% | | | |
| Gree Electric Appliances, Inc. of Zhuhai Class A | | 2,900 | 18,598 |
| Hangzhou Hikvision Digital Technology Co. Ltd. Class A | | 3,625 | 21,461 |
| Hangzhou Robam Appliances Co. Ltd. Class A | | 2,800 | 19,611 |
| Inner Mongoli Yili Industries Co. Ltd. (A Shares) | | 4,200 | 18,706 |
| Jiangsu Yanghe Brewery Joint-Stock Co. Ltd. Class A | | 1,100 | 18,277 |
| Kweichow Moutai Co. Ltd. (A Shares) | | 200 | 18,630 |
| Midea Group Co. Ltd. Class A | | 2,600 | 19,985 |
| Ping An Insurance (Group) Co. of China Ltd. (H Shares) | | 6,000 | 52,683 |
| Shanghai International Airport Co. Ltd. (A Shares) | | 3,100 | 20,441 |
| Shenzhen Inovance Technology Co. Ltd. Class A | | 4,200 | 19,535 |
| Tonghua Dongbao Pharmaceutical Co. Ltd. Class A | | 5,400 | 17,596 |
| Wuliangye Yibin Co. Ltd. Class A | | 2,100 | 21,086 |
| Yunnan Baiyao Group Co. Ltd. | | 1,200 | 18,962 |
|
| TOTAL CHINA | | | 285,571 |
|
| Denmark - 0.6% | | | |
| Jyske Bank A/S (Reg.) | | 602 | 34,019 |
| Novo Nordisk A/S Series B sponsored ADR | | 817 | 40,678 |
| Scandinavian Tobacco Group A/S | | 277 | 4,683 |
| Spar Nord Bank A/S | | 502 | 6,385 |
|
| TOTAL DENMARK | | | 85,765 |
|
| Finland - 0.4% | | | |
| Sampo Oyj (A Shares) | | 962 | 50,404 |
| Tikkurila Oyj | | 651 | 12,869 |
|
| TOTAL FINLAND | | | 63,273 |
|
| France - 6.1% | | | |
| Atos Origin SA | | 393 | 61,069 |
| AXA SA | | 2,491 | 75,199 |
| Bouygues SA | | 560 | 26,885 |
| Capgemini SA | | 362 | 44,002 |
| Compagnie de St. Gobain | | 503 | 29,507 |
| Dassault Systemes SA | | 172 | 18,266 |
| Edenred SA | | 699 | 20,152 |
| Elis SA | | 1,588 | 41,426 |
| Elis SA | | 230 | 5,945 |
| Essilor International SA | | 312 | 39,505 |
| Kering SA | | 45 | 20,627 |
| Laurent-Perrier Group SA | | 39 | 3,658 |
| LVMH Moet Hennessy - Louis Vuitton SA | | 67 | 19,984 |
| Natixis SA | | 3,781 | 29,650 |
| Rubis | | 300 | 18,829 |
| Sanofi SA | | 568 | 53,782 |
| Societe Generale Series A | | 1,277 | 71,071 |
| SR Teleperformance SA | | 258 | 37,687 |
| Total SA | | 2,812 | 156,736 |
| Vetoquinol SA | | 78 | 5,034 |
| VINCI SA | | 671 | 65,695 |
| Virbac SA (a) | | 25 | 3,219 |
| Vivendi SA | | 1,684 | 41,831 |
|
| TOTAL FRANCE | | | 889,759 |
|
| Germany - 4.6% | | | |
| adidas AG | | 74 | 16,468 |
| BASF AG | | 832 | 90,732 |
| Bayer AG | | 791 | 102,892 |
| Brenntag AG | | 387 | 21,916 |
| CompuGroup Medical AG | | 302 | 17,354 |
| CTS Eventim AG | | 278 | 11,483 |
| Deutsche Post AG | | 824 | 37,741 |
| Deutsche Telekom AG | | 2,568 | 46,500 |
| Fielmann AG | | 53 | 4,646 |
| Fresenius SE & Co. KGaA | | 284 | 23,723 |
| HeidelbergCement Finance AG | | 323 | 32,910 |
| Linde AG (a) | | 168 | 36,194 |
| Nexus AG | | 217 | 6,586 |
| SAP SE | | 1,668 | 190,590 |
| Vonovia SE | | 930 | 40,906 |
|
| TOTAL GERMANY | | | 680,641 |
|
| Greece - 0.1% | | | |
| Titan Cement Co. SA (Reg.) | | 600 | 14,481 |
| Hong Kong - 1.4% | | | |
| AIA Group Ltd. | | 18,560 | 139,651 |
| CSPC Pharmaceutical Group Ltd. | | 14,000 | 24,334 |
| Guangdong Investment Ltd. | | 14,000 | 20,278 |
| Techtronic Industries Co. Ltd. | | 3,500 | 20,525 |
|
| TOTAL HONG KONG | | | 204,788 |
|
| Hungary - 0.2% | | | |
| OTP Bank PLC | | 700 | 28,229 |
| India - 0.1% | | | |
| HDFC Bank Ltd. sponsored ADR | | 99 | 9,138 |
| Indonesia - 0.8% | | | |
| PT Bank Central Asia Tbk | | 19,600 | 30,204 |
| PT Bank Rakyat Indonesia Tbk | | 50,734 | 58,356 |
| PT Telkomunikasi Indonesia Tbk Series B | | 96,600 | 28,822 |
|
| TOTAL INDONESIA | | | 117,382 |
|
| Ireland - 1.6% | | | |
| Allergan PLC | | 103 | 18,255 |
| CRH PLC | | 845 | 31,799 |
| CRH PLC sponsored ADR | | 2,522 | 94,625 |
| James Hardie Industries PLC CDI | | 4,961 | 75,520 |
| Medtronic PLC | | 118 | 9,501 |
|
| TOTAL IRELAND | | | 229,700 |
|
| Isle of Man - 0.2% | | | |
| Playtech Ltd. | | 2,791 | 36,476 |
| Israel - 0.6% | | | |
| Azrieli Group | | 287 | 16,195 |
| Check Point Software Technologies Ltd. (a) | | 159 | 18,716 |
| Elbit Systems Ltd. (Israel) | | 126 | 18,679 |
| Frutarom Industries Ltd. | | 223 | 18,359 |
| Ituran Location & Control Ltd. | | 232 | 8,236 |
| Strauss Group Ltd. | | 372 | 7,575 |
| Teva Pharmaceutical Industries Ltd. sponsored ADR | | 362 | 4,996 |
|
| TOTAL ISRAEL | | | 92,756 |
|
| Italy - 1.0% | | | |
| Azimut Holding SpA | | 884 | 17,464 |
| Beni Stabili SpA SIIQ | | 5,091 | 4,507 |
| Interpump Group SpA | | 1,795 | 60,448 |
| Intesa Sanpaolo SpA | | 17,974 | 60,427 |
|
| TOTAL ITALY | | | 142,846 |
|
| Japan - 13.4% | | | |
| AEON Financial Service Co. Ltd. | | 903 | 19,393 |
| Ai Holdings Corp. | | 200 | 4,910 |
| Artnature, Inc. | | 400 | 2,628 |
| Asahi Co. Ltd. | | 300 | 3,647 |
| Astellas Pharma, Inc. | | 2,300 | 30,610 |
| Azbil Corp. | | 500 | 21,833 |
| Broadleaf Co. Ltd. | | 200 | 1,642 |
| Central Automotive Products Ltd. | | 100 | 1,627 |
| Century21 Real Estate Japan Ltd. | | 100 | 1,204 |
| Coca-Cola West Co. Ltd. | | 100 | 3,499 |
| Daiichikosho Co. Ltd. | | 200 | 9,425 |
| Daikokutenbussan Co. Ltd. | | 100 | 4,553 |
| DENSO Corp. | | 880 | 48,465 |
| East Japan Railway Co. | | 771 | 74,771 |
| Fujitsu Ltd. | | 2,064 | 16,084 |
| Funai Soken Holdings, Inc. | | 200 | 7,348 |
| GCA Savvian Group Corp. | | 400 | 3,661 |
| Goldcrest Co. Ltd. | | 400 | 8,666 |
| Hoya Corp. | | 1,761 | 95,676 |
| Itochu Corp. | | 3,277 | 57,402 |
| Japan Tobacco, Inc. | | 1,086 | 35,947 |
| Kao Corp. | | 452 | 27,317 |
| KDDI Corp. | | 1,742 | 46,411 |
| Keyence Corp. | | 200 | 111,045 |
| Kobayashi Pharmaceutical Co. Ltd. | | 200 | 11,564 |
| Komatsu Ltd. | | 1,600 | 52,281 |
| Koshidaka Holdings Co. Ltd. | | 200 | 8,090 |
| Kusuri No Aoki Holdings Co. Ltd. | | 100 | 5,550 |
| Lasertec Corp. | | 400 | 8,801 |
| Makita Corp. | | 787 | 32,982 |
| Medikit Co. Ltd. | | 100 | 4,835 |
| Miroku Jyoho Service Co., Ltd. | | 100 | 2,335 |
| Misumi Group, Inc. | | 2,400 | 65,754 |
| Mitsubishi UFJ Financial Group, Inc. | | 15,677 | 106,339 |
| Mitsui Fudosan Co. Ltd. | | 1,400 | 32,677 |
| Nabtesco Corp. | | 200 | 7,945 |
| Nagaileben Co. Ltd. | | 400 | 9,981 |
| Nakano Refrigerators Co. Ltd. | | 100 | 3,563 |
| ND Software Co. Ltd. | | 100 | 1,218 |
| Nihon Parkerizing Co. Ltd. | | 1,000 | 16,393 |
| Nintendo Co. Ltd. | | 177 | 68,669 |
| Nippon Telegraph & Telephone Corp. | | 864 | 41,772 |
| Nomura Holdings, Inc. | | 4,464 | 25,546 |
| NS Tool Co. Ltd. | | 100 | 1,956 |
| OBIC Co. Ltd. | | 777 | 51,431 |
| Olympus Corp. | | 1,610 | 59,916 |
| Oracle Corp. Japan | | 284 | 24,031 |
| ORIX Corp. | | 3,084 | 53,025 |
| OSG Corp. | | 1,700 | 36,796 |
| Panasonic Corp. | | 2,322 | 35,061 |
| Paramount Bed Holdings Co. Ltd. | | 200 | 8,820 |
| ProNexus, Inc. | | 387 | 4,697 |
| Recruit Holdings Co. Ltd. | | 1,394 | 34,178 |
| San-Ai Oil Co. Ltd. | | 600 | 7,166 |
| Seven & i Holdings Co. Ltd. | | 697 | 28,092 |
| Shin-Etsu Chemical Co. Ltd. | | 452 | 47,668 |
| Shinsei Bank Ltd. | | 1,419 | 23,947 |
| SHO-BOND Holdings Co. Ltd. | | 360 | 22,154 |
| Shoei Co. Ltd. | | 200 | 6,715 |
| Sony Corp. | | 761 | 31,836 |
| Sony Financial Holdings, Inc. | | 1,587 | 26,366 |
| Subaru Corp. | | 581 | 20,073 |
| Taiheiyo Cement Corp. | | 632 | 25,260 |
| The Monogatari Corp. | | 100 | 7,368 |
| TKC Corp. | | 200 | 6,295 |
| Tokio Marine Holdings, Inc. | | 955 | 41,167 |
| Toyota Motor Corp. | | 1,626 | 100,854 |
| USS Co. Ltd. | | 4,100 | 82,881 |
| Welcia Holdings Co. Ltd. | | 100 | 3,795 |
| Workman Co. Ltd. | | 200 | 6,234 |
| Yamada Consulting Group Co. Ltd. | | 400 | 7,728 |
| Yamato Kogyo Co. Ltd. | | 100 | 2,675 |
|
| TOTAL JAPAN | | | 1,952,244 |
|
| Kenya - 0.3% | | | |
| Safaricom Ltd. | | 187,300 | 46,035 |
| Korea (South) - 1.9% | | | |
| BGFretail Co. Ltd. (b) | | 619 | 43,792 |
| Leeno Industrial, Inc. | | 49 | 2,244 |
| NAVER Corp. | | 26 | 20,789 |
| Samsung Electronics Co. Ltd. | | 87 | 214,292 |
|
| TOTAL KOREA (SOUTH) | | | 281,117 |
|
| Mexico - 1.3% | | | |
| CEMEX S.A.B. de CV sponsored ADR | | 3,418 | 27,720 |
| Consorcio ARA S.A.B. de CV | | 8,114 | 2,869 |
| Embotelladoras Arca S.A.B. de CV | | 3,000 | 19,092 |
| Fomento Economico Mexicano S.A.B. de CV: | | | |
| unit | | 3,400 | 29,682 |
| sponsored ADR | | 228 | 20,007 |
| Gruma S.A.B. de CV Series B | | 1,425 | 18,666 |
| Grupo Aeroportuario del Pacifico S.A.B. de CV Series B | | 2,100 | 19,917 |
| Grupo Aeroportuario del Sureste S.A.B. de CV Series B | | 1,220 | 21,758 |
| Grupo Aeroportuario Norte S.A.B. de CV | | 3,500 | 17,661 |
| Grupo Cementos de Chihuahua S.A.B. de CV | | 3,500 | 16,717 |
|
| TOTAL MEXICO | | | 194,089 |
|
| Netherlands - 2.4% | | | |
| ASML Holding NV (Netherlands) | | 767 | 138,389 |
| ING Groep NV (Certificaten Van Aandelen) | | 3,958 | 73,142 |
| Koninklijke Philips Electronics NV | | 640 | 26,082 |
| RELX NV | | 1,722 | 38,894 |
| Takeaway.com Holding BV (a)(c) | | 58 | 2,741 |
| VastNed Retail NV | | 99 | 4,334 |
| Wolters Kluwer NV | | 529 | 25,930 |
| X5 Retail Group NV GDR (Reg. S) (a) | | 431 | 17,714 |
| Yandex NV Series A (a) | | 567 | 19,182 |
|
| TOTAL NETHERLANDS | | | 346,408 |
|
| New Zealand - 0.1% | | | |
| Auckland International Airport Ltd. | | 3,069 | 13,084 |
| Norway - 0.5% | | | |
| Kongsberg Gruppen ASA | | 255 | 4,652 |
| Skandiabanken ASA | | 336 | 3,404 |
| Statoil ASA | | 3,491 | 70,928 |
|
| TOTAL NORWAY | | | 78,984 |
|
| Panama - 0.1% | | | |
| Copa Holdings SA Class A | | 144 | 17,739 |
| Philippines - 0.7% | | | |
| Ayala Corp. | | 1,115 | 22,285 |
| Ayala Land, Inc. | | 28,000 | 23,448 |
| Jollibee Food Corp. | | 1,010 | 4,875 |
| SM Investments Corp. | | 1,260 | 23,326 |
| SM Prime Holdings, Inc. | | 33,300 | 23,885 |
|
| TOTAL PHILIPPINES | | | 97,819 |
|
| Portugal - 0.2% | | | |
| Galp Energia SGPS SA Class B | | 1,554 | 28,890 |
| Russia - 0.3% | | | |
| Sberbank of Russia | | 12,840 | 42,547 |
| South Africa - 2.4% | | | |
| Bidcorp Ltd. | | 1,100 | 24,196 |
| Capitec Bank Holdings Ltd. | | 300 | 19,942 |
| Clicks Group Ltd. | | 2,958 | 33,146 |
| Discovery Ltd. | | 1,900 | 19,694 |
| FirstRand Ltd. | | 6,700 | 24,286 |
| Mondi Ltd. | | 800 | 19,190 |
| Naspers Ltd. Class N | | 782 | 190,539 |
| Sanlam Ltd. | | 4,400 | 22,002 |
|
| TOTAL SOUTH AFRICA | | | 352,995 |
|
| Spain - 2.9% | | | |
| Amadeus IT Holding SA Class A | | 1,492 | 101,236 |
| Banco Santander SA: | | | |
| (Spain) rights 11/1/17(a) | | 12,680 | 606 |
| (Spain) | | 15,140 | 102,639 |
| CaixaBank SA | | 7,613 | 35,632 |
| Hispania Activos Inmobiliarios SA | | 1,120 | 19,315 |
| Iberdrola SA | | 4,713 | 38,089 |
| Inditex SA | | 1,722 | 64,378 |
| Merlin Properties Socimi SA | | 1,382 | 18,239 |
| Prosegur Compania de Seguridad SA (Reg.) | | 4,991 | 38,080 |
| Unicaja Banco SA | | 8,886 | 12,939 |
|
| TOTAL SPAIN | | | 431,153 |
|
| Sweden - 3.7% | | | |
| Addlife AB | | 60 | 1,183 |
| AddTech AB (B Shares) | | 331 | 7,334 |
| Alfa Laval AB | | 1,432 | 36,280 |
| ASSA ABLOY AB (B Shares) | | 4,654 | 98,120 |
| Atlas Copco AB (A Shares) | | 1,727 | 75,750 |
| Essity AB Class B | | 883 | 26,400 |
| Fagerhult AB | | 3,541 | 44,941 |
| Investor AB (B Shares) | | 979 | 48,519 |
| Lagercrantz Group AB (B Shares) | | 528 | 5,613 |
| Loomis AB (B Shares) | | 173 | 6,941 |
| Nordea Bank AB | | 5,970 | 72,168 |
| Saab AB (B Shares) | | 163 | 8,329 |
| Svenska Cellulosa AB (SCA) (B Shares) | | 883 | 8,290 |
| Svenska Handelsbanken AB (A Shares) | | 2,616 | 37,498 |
| Swedbank AB (A Shares) | | 1,961 | 48,676 |
| Telefonaktiebolaget LM Ericsson (B Shares) | | 1,935 | 12,177 |
|
| TOTAL SWEDEN | | | 538,219 |
|
| Switzerland - 6.0% | | | |
| Compagnie Financiere Richemont SA Series A | | 187 | 17,239 |
| Credit Suisse Group AG | | 3,578 | 56,385 |
| Lafargeholcim Ltd. (Reg.) | | 492 | 27,790 |
| Nestle SA (Reg. S) | | 3,834 | 322,587 |
| Novartis AG | | 1,709 | 140,957 |
| Roche Holding AG (participation certificate) | | 430 | 99,386 |
| Schindler Holding AG: | | | |
| (participation certificate) | | 191 | 43,287 |
| (Reg.) | | 43 | 9,495 |
| Sika AG | | 2 | 14,805 |
| Tecan Group AG | | 27 | 5,710 |
| UBS Group AG | | 4,244 | 72,190 |
| Zurich Insurance Group AG | | 216 | 65,927 |
|
| TOTAL SWITZERLAND | | | 875,758 |
|
| Taiwan - 1.6% | | | |
| Advantech Co. Ltd. | | 3,000 | 20,506 |
| Taiwan Semiconductor Manufacturing Co. Ltd. | | 23,000 | 186,072 |
| United Microelectronics Corp. | | 44,000 | 22,725 |
|
| TOTAL TAIWAN | | | 229,303 |
|
| Thailand - 0.2% | | | |
| Airports of Thailand PCL (For. Reg.) | | 13,200 | 23,642 |
| Turkey - 0.8% | | | |
| Koc Holding A/S | | 5,000 | 22,354 |
| Tofas Turk Otomobil Fabrikasi A/S | | 2,099 | 17,086 |
| Tupras Turkiye Petrol Rafinerileri A/S | | 1,396 | 50,231 |
| Turkcell Iletisim Hizmet A/S | | 6,000 | 22,412 |
|
| TOTAL TURKEY | | | 112,083 |
|
| United Arab Emirates - 0.1% | | | |
| DP World Ltd. | | 826 | 19,618 |
| United Kingdom - 10.2% | | | |
| Alliance Pharma PLC | | 1,187 | 942 |
| AstraZeneca PLC (United Kingdom) | | 1,148 | 77,675 |
| Aviva PLC | | 6,200 | 41,584 |
| Avon Rubber PLC | | 144 | 1,872 |
| BAE Systems PLC | | 10,057 | 79,222 |
| BHP Billiton PLC | | 3,623 | 65,597 |
| BP PLC | | 19,145 | 129,854 |
| British American Tobacco PLC (United Kingdom) | | 2,350 | 151,833 |
| Bunzl PLC | | 1,270 | 39,554 |
| Compass Group PLC | | 1,582 | 34,732 |
| Dechra Pharmaceuticals PLC | | 474 | 12,943 |
| Diageo PLC | | 500 | 17,074 |
| DP Poland PLC (a) | | 5,438 | 3,033 |
| Elementis PLC | | 5,271 | 19,903 |
| GlaxoSmithKline PLC | | 2,782 | 49,930 |
| Great Portland Estates PLC | | 850 | 7,016 |
| Hilton Food Group PLC (d) | | 301 | 3,566 |
| Howden Joinery Group PLC | | 3,346 | 18,225 |
| HSBC Holdings PLC sponsored ADR | | 966 | 47,112 |
| Imperial Tobacco Group PLC | | 581 | 23,694 |
| Informa PLC | | 10,077 | 93,285 |
| InterContinental Hotel Group PLC | | 347 | 19,227 |
| InterContinental Hotel Group PLC ADR | | 1,468 | 81,606 |
| ITE Group PLC | | 2,373 | 5,602 |
| Micro Focus International PLC | | 1,040 | 36,535 |
| NMC Health PLC | | 495 | 19,013 |
| Prudential PLC | | 4,261 | 104,588 |
| Reckitt Benckiser Group PLC | | 1,207 | 107,986 |
| Rightmove PLC | | 361 | 19,917 |
| Shaftesbury PLC | | 1,599 | 21,025 |
| Spectris PLC | | 1,013 | 34,443 |
| Spirax-Sarco Engineering PLC | | 262 | 19,661 |
| Standard Chartered PLC (United Kingdom) (a) | | 4,500 | 44,849 |
| Standard Life PLC | | 7,150 | 40,815 |
| Ultra Electronics Holdings PLC | | 253 | 6,129 |
| Unite Group PLC | | 520 | 4,855 |
|
| TOTAL UNITED KINGDOM | | | 1,484,897 |
|
| United States of America - 8.4% | | | |
| A.O. Smith Corp. | | 308 | 18,234 |
| Alphabet, Inc.: | | | |
| Class A (a) | | 81 | 83,676 |
| Class C (a) | | 19 | 19,316 |
| American Tower Corp. | | 129 | 18,533 |
| Amgen, Inc. | | 142 | 24,881 |
| Amphenol Corp. Class A | | 211 | 18,357 |
| Autoliv, Inc. | | 462 | 57,685 |
| Berkshire Hathaway, Inc. Class B (a) | | 332 | 62,064 |
| ConocoPhillips Co. | | 916 | 46,853 |
| Edgewell Personal Care Co. (a) | | 155 | 10,064 |
| Facebook, Inc. Class A (a) | | 103 | 18,546 |
| Martin Marietta Materials, Inc. | | 230 | 49,876 |
| MasterCard, Inc. Class A | | 895 | 133,149 |
| Mohawk Industries, Inc. (a) | | 210 | 54,970 |
| Molson Coors Brewing Co. Class B | | 438 | 35,421 |
| Moody's Corp. | | 346 | 49,274 |
| MSCI, Inc. | | 489 | 57,389 |
| Philip Morris International, Inc. | | 646 | 67,597 |
| PriceSmart, Inc. | | 263 | 22,039 |
| ResMed, Inc. | | 559 | 47,057 |
| S&P Global, Inc. | | 573 | 89,657 |
| Sherwin-Williams Co. | | 145 | 57,297 |
| Visa, Inc. Class A | | 1,367 | 150,343 |
| Yum China Holdings, Inc. | | 728 | 29,375 |
|
| TOTAL UNITED STATES OF AMERICA | | | 1,221,653 |
|
| TOTAL COMMON STOCKS | | | |
| (Cost $12,763,713) | | | 13,851,261 |
|
| Nonconvertible Preferred Stocks - 0.7% | | | |
| Brazil - 0.4% | | | |
| Itau Unibanco Holding SA | | 5,100 | 65,557 |
| Germany - 0.1% | | | |
| Sartorius AG (non-vtg.) | | 166 | 15,471 |
| Spain - 0.2% | | | |
| Grifols SA Class B | | 967 | 22,713 |
| TOTAL NONCONVERTIBLE PREFERRED STOCKS | | | |
| (Cost $96,779) | | | 103,741 |
|
| Investment Companies - 3.5% | | | |
| United States of America - 3.5% | | | |
| WisdomTree India Earnings ETF | | | |
| (Cost $469,146) | | 18,699 | 505,060 |
|
| Money Market Funds - 1.5% | | | |
| Fidelity Cash Central Fund, 1.10%(e) | | | |
| (Cost $225,748) | | 225,703 | 225,748 |
| TOTAL INVESTMENT IN SECURITIES - 100.5% | | | |
| (Cost $13,555,386) | | | 14,685,810 |
| NET OTHER ASSETS (LIABILITIES) - (0.5)% | | | (74,601) |
| NET ASSETS - 100% | | | $14,611,209 |
Security Type Abbreviations
ETF – Exchange-Traded Fund
Categorizations in the Schedule of Investments are based on country or territory of incorporation.
Legend
(a) Non-income producing
(b) Level 3 security
(c) Security exempt from registration under Rule 144A of the Securities Act of 1933. These securities may be resold in transactions exempt from registration, normally to qualified institutional buyers. At the end of the period, the value of these securities amounted to $2,741 or 0.0% of net assets.
(d) Security or a portion of the security purchased on a delayed delivery or when-issued basis.
(e) Affiliated fund that is generally available only to investment companies and other accounts managed by Fidelity Investments. The rate quoted is the annualized seven-day yield of the fund at period end. A complete unaudited listing of the fund's holdings as of its most recent quarter end is available upon request. In addition, each Fidelity Central Fund's financial statements, which are not covered by the Fund's Report of Independent Registered Public Accounting Firm, are available on the SEC's website or upon request.
Affiliated Central Funds
Information regarding fiscal year to date income earned by the Fund from investments in Fidelity Central Funds is as follows:
| Fund | Income earned |
| Fidelity Cash Central Fund | $1,592 |
| Total | $1,592 |
Investment Valuation
The following is a summary of the inputs used, as of October 31, 2017, involving the Fund's assets and liabilities carried at fair value. The inputs or methodology used for valuing securities may not be an indication of the risk associated with investing in those securities. For more information on valuation inputs, and their aggregation into the levels used below, please refer to the Investment Valuation section in the accompanying Notes to Financial Statements.
| | Valuation Inputs at Reporting Date: |
| Description | Total | Level 1 | Level 2 | Level 3 |
| Investments in Securities: | | | | |
| Equities: | | | | |
| Consumer Discretionary | $1,452,518 | $1,052,998 | $399,520 | $-- |
| Consumer Staples | 1,487,322 | 556,670 | 886,860 | 43,792 |
| Energy | 633,845 | 269,161 | 364,684 | -- |
| Financials | 2,798,440 | 1,912,998 | 885,442 | -- |
| Health Care | 1,332,647 | 530,393 | 802,254 | -- |
| Industrials | 1,884,001 | 1,297,104 | 586,897 | -- |
| Information Technology | 2,636,722 | 1,571,935 | 1,064,787 | -- |
| Materials | 1,087,503 | 898,111 | 189,392 | -- |
| Real Estate | 296,013 | 253,466 | 42,547 | -- |
| Telecommunication Services | 250,148 | 86,643 | 163,505 | -- |
| Utilities | 95,843 | 95,843 | -- | -- |
| Investment Companies | 505,060 | 505,060 | -- | -- |
| Money Market Funds | 225,748 | 225,748 | -- | -- |
| Total Investments in Securities: | $14,685,810 | $9,256,130 | $5,385,888 | $43,792 |
See accompanying notes which are an integral part of the financial statements.
Financial Statements
Statement of Assets and Liabilities
| | | October 31, 2017 |
| Assets | | |
Investment in securities, at value — See accompanying schedule:
Unaffiliated issuers (cost $13,329,638) | $14,460,062 | |
| Fidelity Central Funds (cost $225,748) | 225,748 | |
| Total Investment in Securities (cost $13,555,386) | | $14,685,810 |
| Receivable for fund shares sold | | 343 |
| Dividends receivable | | 18,424 |
| Distributions receivable from Fidelity Central Funds | | 323 |
| Other receivables | | 34 |
| Total assets | | 14,704,934 |
| Liabilities | | |
| Payable to custodian bank | $45,380 | |
| Payable for investments purchased | | |
| Regular delivery | 46,329 | |
| Delayed delivery | 2,016 | |
| Total liabilities | | 93,725 |
| Net Assets | | $14,611,209 |
| Net Assets consist of: | | |
| Paid in capital | | $13,332,609 |
| Undistributed net investment income | | 113,847 |
| Accumulated undistributed net realized gain (loss) on investments and foreign currency transactions | | 34,434 |
| Net unrealized appreciation (depreciation) on investments and assets and liabilities in foreign currencies | | 1,130,319 |
| Net Assets, for 1,222,410 shares outstanding | | $14,611,209 |
| Net Asset Value, offering price and redemption price per share ($14,611,209 ÷ 1,222,410 shares) | | $11.95 |
See accompanying notes which are an integral part of the financial statements.
Statement of Operations
| | | For the period
March 7, 2017 (commencement of operations) to
October 31, 2017 |
| Investment Income | | |
| Dividends | | $125,025 |
| Income from Fidelity Central Funds | | 1,592 |
| Income before foreign taxes withheld | | 126,617 |
| Less foreign taxes withheld | | (12,725) |
| Total income | | 113,892 |
| Expenses | | |
| Independent trustees' fees and expenses | $15 | |
| Miscellaneous | 12 | |
| Total expenses | | 27 |
| Net investment income (loss) | | 113,865 |
| Realized and Unrealized Gain (Loss) | | |
| Net realized gain (loss) on: | | |
| Investment securities: | | |
| Unaffiliated issuers | 35,812 | |
| Foreign currency transactions | (1,395) | |
| Total net realized gain (loss) | | 34,417 |
| Change in net unrealized appreciation (depreciation) on: | | |
| Investment securities: | | |
| Unaffiliated issuers | 1,130,424 | |
| Assets and liabilities in foreign currencies | (105) | |
| Total change in net unrealized appreciation (depreciation) | | 1,130,319 |
| Net gain (loss) | | 1,164,736 |
| Net increase (decrease) in net assets resulting from operations | | $1,278,601 |
See accompanying notes which are an integral part of the financial statements.
Statement of Changes in Net Assets
| | For the period
March 7, 2017 (commencement of operations) to
October 31, 2017 |
| Increase (Decrease) in Net Assets | |
| Operations | |
| Net investment income (loss) | $113,865 |
| Net realized gain (loss) | 34,417 |
| Change in net unrealized appreciation (depreciation) | 1,130,319 |
| Net increase (decrease) in net assets resulting from operations | 1,278,601 |
| Share transactions | |
| Proceeds from sales of shares | 14,011,215 |
| Cost of shares redeemed | (678,607) |
| Net increase (decrease) in net assets resulting from share transactions | 13,332,608 |
| Total increase (decrease) in net assets | 14,611,209 |
| Net Assets | |
| Beginning of period | – |
| End of period | $14,611,209 |
| Other Information | |
| Undistributed net investment income end of period | $113,847 |
| Shares | |
| Sold | 1,281,107 |
| Redeemed | (58,697) |
| Net increase (decrease) | 1,222,410 |
See accompanying notes which are an integral part of the financial statements.
Financial Highlights
Fidelity Flex International Fund
| Years ended October 31, | 2017 A |
| Selected Per–Share Data | |
| Net asset value, beginning of period | $10.00 |
| Income from Investment Operations | |
| Net investment income (loss)B | .16 |
| Net realized and unrealized gain (loss) | 1.79 |
| Total from investment operations | 1.95 |
| Net asset value, end of period | $11.95 |
| Total ReturnC | 19.50% |
| Ratios to Average Net AssetsD,E | |
| Expenses before reductionsF | - %G |
| Expenses net of fee waivers, if anyF | - %G |
| Expenses net of all reductionsF | - %G |
| Net investment income (loss) | 2.24%G |
| Supplemental Data | |
| Net assets, end of period (000 omitted) | $14,611 |
| Portfolio turnover rateH | 35%G |
A For the period March 7, 2017 (commencement of operations) to October 31, 2017.
B Calculated based on average shares outstanding during the period.
C Total returns for periods of less than one year are not annualized.
D Fees and expenses of any underlying Fidelity Central Funds are not included in the Fund's expense ratio. The Fund indirectly bears its proportionate share of the expenses of any underlying Fidelity Central Funds.
E Expense ratios reflect operating expenses of the Fund. Expenses before reductions do not reflect amounts reimbursed by the investment adviser or reductions from expense offset arrangements and do not represent the amount paid by the Fund during periods when reimbursements or reductions occur. Expense ratios before reductions for start-up periods may not be representative of longer term operating periods. Expenses net of fee waivers reflect expenses after reimbursement by the investment adviser but prior to reductions from expense offset arrangements. Expenses net of all reductions represent the net expenses paid by the Fund.
F Amount represents less than .005%.
G Annualized
H Amount does not include the portfolio activity of any underlying Fidelity Central Funds.
See accompanying notes which are an integral part of the financial statements.
Notes to Financial Statements
For the period ended October 31, 2017
1. Organization.
Fidelity Flex International Fund (the Fund) is a fund of Fidelity Investment Trust (the Trust) and is authorized to issue an unlimited number of shares. Share transactions on the Statement of Changes in Net Assets may contain exchanges between affiliated funds. The Trust is registered under the Investment Company Act of 1940, as amended (the 1940 Act), as an open-end management investment company organized as a Massachusetts business trust. The Fund is available only to certain fee-based accounts offered by Fidelity. The Fund's investments in emerging markets can be subject to social, economic, regulatory, and political uncertainties and can be extremely volatile.
2. Investments in Fidelity Central Funds.
The Fund invests in Fidelity Central Funds, which are open-end investment companies generally available only to other investment companies and accounts managed by the investment adviser and its affiliates. The Fund's Schedule of Investments lists each of the Fidelity Central Funds held as of period end, if any, as an investment of the Fund, but does not include the underlying holdings of each Fidelity Central Fund. As an Investing Fund, the Fund indirectly bears its proportionate share of the expenses of the underlying Fidelity Central Funds.
The Money Market Central Funds seek preservation of capital and current income and are managed by Fidelity Investments Money Management, Inc. (FIMM), an affiliate of the investment adviser. Annualized expenses of the Money Market Central Funds as of their most recent shareholder report date are less than .005%.
A complete unaudited list of holdings for each Fidelity Central Fund is available upon request or at the Securities and Exchange Commission (the SEC) website at www.sec.gov. In addition, the financial statements of the Fidelity Central Funds, which are not covered by the Fund's Report of Independent Registered Public Accounting Firm, are available on the SEC website or upon request.
3. Significant Accounting Policies.
The Fund is an investment company and applies the accounting and reporting guidance of the Financial Accounting Standards Board (FASB) Accounting Standards Codification Topic 946 Financial Services – Investments Companies. The financial statements have been prepared in conformity with accounting principles generally accepted in the United States of America (GAAP), which require management to make certain estimates and assumptions at the date of the financial statements. Actual results could differ from those estimates. Subsequent events, if any, through the date that the financial statements were issued have been evaluated in the preparation of the financial statements. The following summarizes the significant accounting policies of the Fund:
Investment Valuation. Investments are valued as of 4:00 p.m. Eastern time on the last calendar day of the period. The Board of Trustees (the Board) has delegated the day to day responsibility for the valuation of the Fund's investments to the Fair Value Committee (the Committee) established by the Fund's investment adviser. In accordance with valuation policies and procedures approved by the Board, the Fund attempts to obtain prices from one or more third party pricing vendors or brokers to value its investments. When current market prices, quotations or currency exchange rates are not readily available or reliable, investments will be fair valued in good faith by the Committee, in accordance with procedures adopted by the Board. Factors used in determining fair value vary by investment type and may include market or investment specific events. The frequency with which these procedures are used cannot be predicted and they may be utilized to a significant extent. The Committee oversees the Fund's valuation policies and procedures and reports to the Board on the Committee's activities and fair value determinations. The Board monitors the appropriateness of the procedures used in valuing the Fund's investments and ratifies the fair value determinations of the Committee.
The Fund categorizes the inputs to valuation techniques used to value its investments into a disclosure hierarchy consisting of three levels as shown below:
- Level 1 – quoted prices in active markets for identical investments
- Level 2 – other significant observable inputs (including quoted prices for similar investments, interest rates, prepayment speeds, etc.)
- Level 3 – unobservable inputs (including the Fund's own assumptions based on the best information available)
Valuation techniques used to value the Fund's investments by major category are as follows:
Equity securities, including restricted securities, for which market quotations are readily available, are valued at the last reported sale price or official closing price as reported by a third party pricing vendor on the primary market or exchange on which they are traded and are categorized as Level 1 in the hierarchy. In the event there were no sales during the day or closing prices are not available, securities are valued at the last quoted bid price or may be valued using the last available price and are generally categorized as Level 2 in the hierarchy. For foreign equity securities, when market or security specific events arise, comparisons to the valuation of American Depositary Receipts (ADRs), futures contracts, Exchange-Traded Funds (ETFs) and certain indexes as well as quoted prices for similar securities may be used and would be categorized as Level 2 in the hierarchy. Utilizing these techniques may result in transfers between Level 1 and Level 2. For equity securities, including restricted securities, where observable inputs are limited, assumptions about market activity and risk are used and these securities may be categorized as Level 3 in the hierarchy.
ETFs are valued at their last sale price or official closing price as reported by a third party pricing vendor on the primary market or exchange on which they are traded and are categorized as Level 1 in the hierarchy. In the event there were no sales during the day but the exchange reports a closing bid level, ETFs are valued at the closing bid and would be categorized as Level 1 in the hierarchy. In the event there was no closing bid, ETFs may be valued by another method that the Board believes reflects fair value in accordance with the Board's fair value pricing policies and may be categorized as Level 2 in the hierarchy.
Investments in open-end mutual funds, including the Fidelity Central Funds, are valued at their closing net asset value (NAV) each business day and are categorized as Level 1 in the hierarchy.
Changes in valuation techniques may result in transfers in or out of an assigned level within the disclosure hierarchy. The aggregate value of investments by input level as of October 31, 2017 is included at the end of the Fund's Schedule of Investments.
Foreign Currency. The Fund may use foreign currency contracts to facilitate transactions in foreign-denominated securities. Gains and losses from these transactions may arise from changes in the value of the foreign currency or if the counterparties do not perform under the contracts' terms.
Foreign-denominated assets, including investment securities, and liabilities are translated into U.S. dollars at the exchange rates at period end. Purchases and sales of investment securities, income and dividends received and expenses denominated in foreign currencies are translated into U.S. dollars at the exchange rate in effect on the transaction date.
The effects of exchange rate fluctuations on investments are included with the net realized and unrealized gain (loss) on investment securities. Other foreign currency transactions resulting in realized and unrealized gain (loss) are disclosed separately.
Investment Transactions and Income. For financial reporting purposes, the Fund's investment holdings and NAV include trades executed through the end of the last business day of the period. The NAV per share for processing shareholder transactions is calculated as of the close of business of the New York Stock Exchange (NYSE), normally 4:00 p.m. Eastern time and includes trades executed through the end of the prior business day. Gains and losses on securities sold are determined on the basis of identified cost. Dividend income is recorded on the ex-dividend date, except for certain dividends from foreign securities where the ex-dividend date may have passed, which are recorded as soon as the Fund is informed of the ex-dividend date. Non-cash dividends included in dividend income, if any, are recorded at the fair market value of the securities received. Income and capital gain distributions from Fidelity Central Funds, if any, are recorded on the ex-dividend date. Investment income is recorded net of foreign taxes withheld where recovery of such taxes is uncertain.
Expenses. Expenses directly attributable to a fund are charged to that fund. Expenses attributable to more than one fund are allocated among the respective funds on the basis of relative net assets or other appropriate methods. Expense estimates are accrued in the period to which they relate and adjustments are made when actual amounts are known.
Income Tax Information and Distributions to Shareholders. Each year, the Fund intends to qualify as a regulated investment company under Subchapter M of the Internal Revenue Code, including distributing substantially all of its taxable income and realized gains. As a result, no provision for U.S. Federal income taxes is required. As of October 31, 2017, the Fund did not have any unrecognized tax benefits in the financial statements; nor is the Fund aware of any tax positions for which it is reasonably possible that the total amounts of unrecognized tax benefits will significantly change in the next twelve months. The Fund files a U.S. federal tax return, in addition to state and local tax returns as required. The Fund's federal income tax returns are subject to examination by the Internal Revenue Service (IRS) for a period of three fiscal years after they are filed. State and local tax returns may be subject to examination for an additional fiscal year depending on the jurisdiction. Foreign taxes are provided for based on the Fund's understanding of the tax rules and rates that exist in the foreign markets in which it invests.
Distributions are declared and recorded on the ex-dividend date. Income and capital gain distributions are determined in accordance with income tax regulations, which may differ from GAAP.
Capital accounts within the financial statements are adjusted for permanent book-tax differences. These adjustments have no impact on net assets or the results of operations. Capital accounts are not adjusted for temporary book-tax differences which will reverse in a subsequent period.
Book-tax differences are primarily due to foreign currency transactions, passive foreign investment companies (PFIC) and losses deferred due to wash sales.
As of period end, the cost and unrealized appreciation (depreciation) in securities, and derivatives if applicable, for federal income tax purposes were as follows:
| Gross unrealized appreciation | $1,270,202 |
| Gross unrealized depreciation | (178,327) |
| Net unrealized appreciation (depreciation) | $1,091,875 |
| Tax Cost | $13,593,935 |
The tax-based components of distributable earnings as of period end were as follows:
| Undistributed ordinary income | $186,847 |
| Net unrealized appreciation (depreciation) on securities and other investments | $1,091,753 |
Delayed Delivery Transactions and When-Issued Securities. During the period, the Fund transacted in securities on a delayed delivery or when-issued basis. Payment and delivery may take place after the customary settlement period for that security. The price of the underlying securities and the date when the securities will be delivered and paid for are fixed at the time the transaction is negotiated. The securities purchased on a delayed delivery or when-issued basis are identified as such in the Fund's Schedule of Investments. With respect to purchase commitments, the Fund identifies securities as segregated in its records with a value at least equal to the amount of the commitment. Losses may arise due to changes in the value of the underlying securities or if the counterparty does not perform under the contract's terms, or if the issuer does not issue the securities due to political, economic, or other factors.
Restricted Securities. The Fund may invest in securities that are subject to legal or contractual restrictions on resale. These securities generally may be resold in transactions exempt from registration or to the public if the securities are registered. Disposal of these securities may involve time-consuming negotiations and expense, and prompt sale at an acceptable price may be difficult. Information regarding restricted securities is included at the end of the Fund's Schedule of Investments.
4. Purchases and Sales of Investments.
Purchases and sales of securities, other than short-term securities, aggregated $15,116,593 and $1,823,176, respectively.
5. Fees and Other Transactions with Affiliates.
Management Fee. Fidelity Management & Research Company (the investment adviser) and its affiliates provide the Fund with investment management related services and the Fund does not pay any fees for these services. Under the management contract, the investment adviser or an affiliate pays all other expenses of the Fund, excluding fees and expenses of the independent Trustees, and certain miscellaneous expenses such as proxy and shareholder meeting expenses.
Brokerage Commissions. The Fund placed a portion of its portfolio transactions with brokerage firms which are affiliates of the investment adviser. Brokerage commissions are included in net realized gain (loss) and change in net unrealized appreciation (depreciation) in the Statement of Operations. The commissions paid to these affiliated firms were $97 for the period.
Interfund Trades. The Funds may purchase from or sell securities to other Fidelity Funds under procedures adopted by the Board. The procedures have been designed to ensure these interfund trades are executed in accordance with Rule 17a-7 of the 1940 Act. Interfund trades are included within the respective purchases and sales amounts shown in the Purchases and Sales of Investments note.
6. Committed Line of Credit.
The Fund participates with other funds managed by the investment adviser or an affiliate in a $4.25 billion credit facility (the "line of credit") to be utilized for temporary or emergency purposes to fund shareholder redemptions or for other short-term liquidity purposes. The Fund has agreed to pay commitment fees on its pro-rata portion of the line of credit, which amounted to $12 and is reflected in Miscellaneous expenses on the Statement of Operations. During the period, the Fund did not borrow on this line of credit.
7. Other.
The Fund's organizational documents provide former and current trustees and officers with a limited indemnification against liabilities arising in connection with the performance of their duties to the Fund. In the normal course of business, the Fund may also enter into contracts that provide general indemnifications. The Fund's maximum exposure under these arrangements is unknown as this would be dependent on future claims that may be made against the Fund. The risk of material loss from such claims is considered remote.
At the end of the period, the investment adviser or its affiliates were the owners of record of 41% of the total outstanding shares of the Fund.
Report of Independent Registered Public Accounting Firm
To the Trustees of Fidelity Investment Trust and Shareholders of Fidelity Flex International Fund:
We have audited the accompanying statement of assets and liabilities of Fidelity Flex International Fund (the Fund), a fund of Fidelity Investment Trust, including the schedule of investments, as of October 31, 2017, and the related statement of operations, the statement of changes in net assets, and the financial highlights for the period from March 7, 2017 (commencement of operations) to October 31, 2017. These financial statements and financial highlights are the responsibility of the Fund's management. Our responsibility is to express an opinion on these financial statements and financial highlights based on our audit.
We conducted our audit in accordance with the standards of the Public Company Accounting Oversight Board (United States). Those standards require that we plan and perform the audit to obtain reasonable assurance about whether the financial statements and financial highlights are free of material misstatement. The Fund is not required to have, nor were we engaged to perform, an audit of its internal control over financial reporting. Our audits included consideration of internal control over financial reporting as a basis for designing audit procedures that are appropriate in the circumstances, but not for the purpose of expressing an opinion on the effectiveness of the Fund's internal control over financial reporting. Accordingly, we express no such opinion. An audit also includes examining, on a test basis, evidence supporting the amounts and disclosures in the financial statements, assessing the accounting principles used and significant estimates made by management, as well as evaluating the overall financial statement presentation. Our procedures included confirmation of securities owned as of October 31, 2017, by correspondence with the custodians and brokers; when replies were not received from brokers, we performed other auditing procedures. We believe that our audit provides a reasonable basis for our opinion.
In our opinion, such financial statements and financial highlights referred to above present fairly, in all material respects, the financial position of Fidelity Flex International Fund as of October 31, 2017, the results of its operations, the changes in net assets, and the financial highlights for the period from March 7, 2017 (commencement of operations) to October 31, 2017 in conformity with accounting principles generally accepted in the United States of America.
DELOITTE & TOUCHE LLP
Boston, Massachusetts
December 15, 2017
Trustees and Officers
The Trustees, Members of the Advisory Board (if any) and fund, as applicable, are listed below. The Board of Trustees governs the fund and is responsible for protecting the interests of shareholders. The Trustees are experienced executives who meet periodically throughout the year to oversee the fund's activities, review contractual arrangements with companies that provide services to the fund, oversee management of the risks associated with such activities and contractual arrangements, and review the fund's performance. Except for Jonathan Chiel, each of the Trustees oversees 190 funds. Mr. Chiel oversees 143 funds.
The Trustees hold office without limit in time except that (a) any Trustee may resign; (b) any Trustee may be removed by written instrument, signed by at least two-thirds of the number of Trustees prior to such removal; (c) any Trustee who requests to be retired or who has become incapacitated by illness or injury may be retired by written instrument signed by a majority of the other Trustees; and (d) any Trustee may be removed at any special meeting of shareholders by a two-thirds vote of the outstanding voting securities of the trust. Each Trustee who is not an interested person (as defined in the 1940 Act) of the trust and the fund is referred to herein as an Independent Trustee. Each Independent Trustee shall retire not later than the last day of the calendar year in which his or her 75th birthday occurs. The Independent Trustees may waive this mandatory retirement age policy with respect to individual Trustees. Officers and Advisory Board Members hold office without limit in time, except that any officer or Advisory Board Member may resign or may be removed by a vote of a majority of the Trustees at any regular meeting or any special meeting of the Trustees. Except as indicated, each individual has held the office shown or other offices in the same company for the past five years.
The fund’s Statement of Additional Information (SAI) includes more information about the Trustees. To request a free copy, call Fidelity at 1-800-835-5092.
Experience, Skills, Attributes, and Qualifications of the Trustees. The Governance and Nominating Committee has adopted a statement of policy that describes the experience, qualifications, attributes, and skills that are necessary and desirable for potential Independent Trustee candidates (Statement of Policy). The Board believes that each Trustee satisfied at the time he or she was initially elected or appointed a Trustee, and continues to satisfy, the standards contemplated by the Statement of Policy. The Governance and Nominating Committee also engages professional search firms to help identify potential Independent Trustee candidates who have the experience, qualifications, attributes, and skills consistent with the Statement of Policy. From time to time, additional criteria based on the composition and skills of the current Independent Trustees, as well as experience or skills that may be appropriate in light of future changes to board composition, business conditions, and regulatory or other developments, have also been considered by the professional search firms and the Governance and Nominating Committee. In addition, the Board takes into account the Trustees' commitment and participation in Board and committee meetings, as well as their leadership of standing and ad hoc committees throughout their tenure.
In determining that a particular Trustee was and continues to be qualified to serve as a Trustee, the Board has considered a variety of criteria, none of which, in isolation, was controlling. The Board believes that, collectively, the Trustees have balanced and diverse experience, qualifications, attributes, and skills, which allow the Board to operate effectively in governing the fund and protecting the interests of shareholders. Information about the specific experience, skills, attributes, and qualifications of each Trustee, which in each case led to the Board's conclusion that the Trustee should serve (or continue to serve) as a trustee of the fund, is provided below.
Board Structure and Oversight Function. James C. Curvey is an interested person and currently serves as Chairman. The Trustees have determined that an interested Chairman is appropriate and benefits shareholders because an interested Chairman has a personal and professional stake in the quality and continuity of services provided to the fund. Independent Trustees exercise their informed business judgment to appoint an individual of their choosing to serve as Chairman, regardless of whether the Trustee happens to be independent or a member of management. The Independent Trustees have determined that they can act independently and effectively without having an Independent Trustee serve as Chairman and that a key structural component for assuring that they are in a position to do so is for the Independent Trustees to constitute a substantial majority for the Board. The Independent Trustees also regularly meet in executive session. Ned C. Lautenbach serves as Chairman of the Independent Trustees and as such (i) acts as a liaison between the Independent Trustees and management with respect to matters important to the Independent Trustees and (ii) with management prepares agendas for Board meetings.
Fidelity® funds are overseen by different Boards of Trustees. The fund's Board oversees Fidelity's high income and certain equity funds, and other Boards oversee Fidelity's investment-grade bond, money market, asset allocation, and sector funds. The asset allocation funds may invest in Fidelity® funds overseen by the fund's Board. The use of separate Boards, each with its own committee structure, allows the Trustees of each group of Fidelity® funds to focus on the unique issues of the funds they oversee, including common research, investment, and operational issues. On occasion, the separate Boards establish joint committees to address issues of overlapping consequences for the Fidelity® funds overseen by each Board.
The Trustees operate using a system of committees to facilitate the timely and efficient consideration of all matters of importance to the Trustees, the fund, and fund shareholders and to facilitate compliance with legal and regulatory requirements and oversight of the fund's activities and associated risks. The Board, acting through its committees, has charged FMR and its affiliates with (i) identifying events or circumstances the occurrence of which could have demonstrably adverse effects on the fund's business and/or reputation; (ii) implementing processes and controls to lessen the possibility that such events or circumstances occur or to mitigate the effects of such events or circumstances if they do occur; and (iii) creating and maintaining a system designed to evaluate continuously business and market conditions in order to facilitate the identification and implementation processes described in (i) and (ii) above. Because the day-to-day operations and activities of the fund are carried out by or through FMR, its affiliates, and other service providers, the fund's exposure to risks is mitigated but not eliminated by the processes overseen by the Trustees. While each of the Board's committees has responsibility for overseeing different aspects of the fund's activities, oversight is exercised primarily through the Operations, Audit, and Compliance Committees. In addition, the Independent Trustees have worked with FMR to enhance the Board's oversight of investment and financial risks, legal and regulatory risks, technology risks, and operational risks, including the development of additional risk reporting to the Board. For example, a working group comprised of Independent Trustees and FMR has worked and continues to work to review the Fidelity® funds' valuation-related activities, reporting and risk management. Appropriate personnel, including but not limited to the fund's Chief Compliance Officer (CCO), FMR's internal auditor, the independent accountants, the fund's Treasurer and portfolio management personnel, make periodic reports to the Board's committees, as appropriate, including an annual review of Fidelity's risk management program for the Fidelity® funds. The responsibilities of each standing committee, including their oversight responsibilities, are described further under "Standing Committees of the Trustees."
Interested Trustees*:
Correspondence intended for a Trustee who is an interested person may be sent to Fidelity Investments, 245 Summer Street, Boston, Massachusetts 02210.
Name, Year of Birth; Principal Occupations and Other Relevant Experience+
Jonathan Chiel (1957)
Year of Election or Appointment: 2016
Trustee
Mr. Chiel also serves as Trustee of other Fidelity® funds. Mr. Chiel is Executive Vice President and General Counsel for FMR LLC (diversified financial services company, 2012-present). Previously, Mr. Chiel served as general counsel (2004-2012) and senior vice president and deputy general counsel (2000-2004) for John Hancock Financial Services; a partner with Choate, Hall & Stewart (1996-2000) (law firm); and an Assistant United States Attorney for the United States Attorney’s Office of the District of Massachusetts (1986-95), including Chief of the Criminal Division (1993-1995). Mr. Chiel is a director on the boards of the Boston Bar Foundation and the Maimonides School.
James C. Curvey (1935)
Year of Election or Appointment: 2007
Trustee
Chairman of the Board of Trustees
Mr. Curvey also serves as Trustee of other Fidelity® funds. Mr. Curvey is a Director of Fidelity Research & Analysis Co. (investment adviser firm, 2009-present), and Vice Chairman (2007-present) and Director of FMR LLC (diversified financial services company). In addition, Mr. Curvey serves as an Overseer for the Boston Symphony Orchestra and a member of the board of Artis-Naples, Naples, Florida, and as a Trustee for Brewster Academy, Wolfeboro, New Hampshire. Previously, Mr. Curvey served as a Director of Fidelity Investments Money Management, Inc. (investment adviser firm, 2009-2014) and a Director of FMR and FMR Co., Inc. (investment adviser firms, 2007-2014).
Charles S. Morrison (1960)
Year of Election or Appointment: 2014
Trustee
Mr. Morrison also serves as Trustee of other funds. He serves as President of Fidelity Management & Research Company (FMR) (investment adviser firm, 2016-present), a Director of Fidelity Investments Money Management, Inc. (FIMM) (investment adviser firm, 2014-present), Director of Fidelity SelectCo, LLC (investment adviser firm, 2014-present), President, Asset Management (2014-present), and is an employee of Fidelity Investments. Previously, Mr. Morrison served as Vice President of Fidelity's Fixed Income and Asset Allocation Funds (2012-2014), President, Fixed Income (2011-2014), Vice President of Fidelity's Money Market Funds (2005-2009), President, Money Market Group Leader of FMR (investment adviser firm, 2009), and Senior Vice President, Money Market Group of FMR (2004-2009). Mr. Morrison also served as Vice President of Fidelity's Bond Funds (2002-2005), certain Balanced Funds (2002-2005), and certain Asset Allocation Funds (2002-2007), and as Senior Vice President (2002-2005) of Fidelity's Bond Division.
* Determined to be an “Interested Trustee” by virtue of, among other things, his or her affiliation with the trust or various entities under common control with FMR.
+ The information includes the Trustee's principal occupation during the last five years and other information relating to the experience, attributes, and skills relevant to the Trustee's qualifications to serve as a Trustee, which led to the conclusion that the Trustee should serve as a Trustee for the fund.
Independent Trustees:
Correspondence intended for an Independent Trustee may be sent to Fidelity Investments, P.O. Box 55235, Boston, Massachusetts 02205-5235.
Name, Year of Birth; Principal Occupations and Other Relevant Experience+
Dennis J. Dirks (1948)
Year of Election or Appointment: 2005
Trustee
Mr. Dirks also serves as Trustee of other Fidelity® funds. Prior to his retirement in May 2003, Mr. Dirks was Chief Operating Officer and a member of the Board of The Depository Trust & Clearing Corporation (DTCC). He also served as President, Chief Operating Officer, and Board member of The Depository Trust Company (DTC) and President and Board member of the National Securities Clearing Corporation (NSCC). In addition, Mr. Dirks served as Chief Executive Officer and Board member of the Government Securities Clearing Corporation, Chief Executive Officer and Board member of the Mortgage-Backed Securities Clearing Corporation, as a Trustee and a member of the Finance Committee of Manhattan College (2005-2008), as a Trustee and a member of the Finance Committee of AHRC of Nassau County (2006-2008), as a member of the Independent Directors Council (IDC) Governing Council (2010-2015), and as a member of the Board of Directors for The Brookville Center for Children’s Services, Inc. (2009-2017). Mr. Dirks is a member of the Finance Committee (2016-present) and Board of Directors (2017-present) of the Asolo Repertory Theatre.
Alan J. Lacy (1953)
Year of Election or Appointment: 2008
Trustee
Mr. Lacy also serves as Trustee of other Fidelity® funds. Mr. Lacy serves as a Director of Bristol-Myers Squibb Company (global pharmaceuticals, 2008-present). He is a Trustee of the California Chapter of The Nature Conservancy (2015-present) and a Director of the Center for Advanced Study in the Behavioral Sciences at Stanford University (2015-present). In addition, Mr. Lacy served as Senior Adviser (2007-2014) of Oak Hill Capital Partners, L.P. (private equity) and also served as Chief Executive Officer (2005) and Vice Chairman (2005-2006) of Sears Holdings Corporation (retail) and Chief Executive Officer and Chairman of the Board of Sears, Roebuck and Co. (retail, 2000-2005). Previously, Mr. Lacy served as Chairman (2014-2017) and a member (2010-2017) of the Board of Directors of Dave & Buster’s Entertainment, Inc. (restaurant and entertainment complexes), as Chairman (2008-2011) and a member (2006-2015) of the Board of Trustees of the National Parks Conservation Association, and as a member of the Board of Directors for The Hillman Companies, Inc. (hardware wholesalers, 2010-2014), Earth Fare, Inc. (retail grocery, 2010-2014), and The Western Union Company (global money transfer, 2006-2011).
Ned C. Lautenbach (1944)
Year of Election or Appointment: 2000
Trustee
Chairman of the Independent Trustees
Mr. Lautenbach also serves as Trustee of other Fidelity® funds. Mr. Lautenbach currently serves as Vice Chair of the Board of Governors, State University System of Florida (2013-present) and is a member of the Council on Foreign Relations (1994-present). He is also a member and has most recently served as Chairman of the Board of Directors of Artis-Naples (2012-present). Previously, Mr. Lautenbach served as a member and then Lead Director of the Board of Directors of Eaton Corporation (diversified industrial, 1997-2016). He was also a Partner and Advisory Partner at Clayton, Dubilier & Rice, LLC (private equity investment, 1998-2010), as well as a Director of Sony Corporation (2006-2007). In addition, Mr. Lautenbach also had a 30-year career with IBM (technology company) during which time he served as Senior Vice President and a member of the Corporate Executive Committee (1968-1998).
Joseph Mauriello (1944)
Year of Election or Appointment: 2008
Trustee
Mr. Mauriello also serves as Trustee of other Fidelity® funds. Prior to his retirement in January 2006, Mr. Mauriello served in numerous senior management positions including Deputy Chairman and Chief Operating Officer (2004-2005), and Vice Chairman of Financial Services (2002-2004) of KPMG LLP US (professional services, 1965-2005). Mr. Mauriello currently serves as a member of the Board of Directors of XL Group plc. (global insurance and re-insurance, 2006-present) and the Independent Directors Council (IDC) Governing Council (2015-present). Previously, Mr. Mauriello served as a Director of the Hamilton Funds of the Bank of New York (2006-2007) and of Arcadia Resources Inc. (health care services and products, 2007-2012).
Cornelia M. Small (1944)
Year of Election or Appointment: 2005
Trustee
Ms. Small also serves as Trustee of other Fidelity® funds. Ms. Small is a member of the Board of Directors (2009-present) and Chair of the Investment Committee (2010-present) of the Teagle Foundation. Ms. Small also serves on the Investment Committee of the Berkshire Taconic Community Foundation (2008-present). Previously, Ms. Small served as Chairperson (2002-2008) and a member of the Investment Committee and Chairperson (2008-2012) and a member of the Board of Trustees of Smith College. In addition, Ms. Small served as Chief Investment Officer, Director of Global Equity Investments, and a member of the Board of Directors of Scudder, Stevens & Clark and Scudder Kemper Investments.
William S. Stavropoulos (1939)
Year of Election or Appointment: 2001
Trustee
Vice Chairman of the Independent Trustees
Mr. Stavropoulos also serves as Trustee of other Fidelity® funds. Mr. Stavropoulos serves as President and Founder of the Michigan Baseball Foundation, the Great Lakes Loons (2007-present). Mr. Stavropoulos is Chairman Emeritus of the Board of Directors of The Dow Chemical Company, where he previously served in numerous senior management positions, including President, CEO (1995-2000; 2002-2004), Chairman of the Executive Committee (2000-2006), and as a member of the Board of Directors (1990-2006). Currently, Mr. Stavropoulos is Chairman of the Board of Directors of Univar Inc. (global distributor of commodity and specialty chemicals), a Director of Teradata Corporation (data warehousing and technology solutions), and a member of the Advisory Board for Metalmark Capital LLC (private equity investment, 2005-present). Mr. Stavropoulos is an operating advisor to Clayton, Dubilier & Rice, LLC (private equity investment). In addition, Mr. Stavropoulos is a member of the University of Notre Dame Advisory Council for the College of Science, a Trustee of the Rollin L. Gerstacker Foundation, and a Director of Artis-Naples in Naples, Florida. Previously, Mr. Stavropoulos served as a Director of Chemical Financial Corporation (bank holding company, 1993-2012) and Tyco International, Ltd. (multinational manufacturing and services, 2007-2012).
David M. Thomas (1949)
Year of Election or Appointment: 2008
Trustee
Mr. Thomas also serves as Trustee of other Fidelity® funds. Mr. Thomas serves as Non-Executive Chairman of the Board of Directors of Fortune Brands Home and Security (home and security products, 2011-present), as a member of the Board of Directors (2004-present) and Presiding Director (2013-present) of Interpublic Group of Companies, Inc. (marketing communication), and as a member of the Board of Trustees of the University of Florida (2013-present). Previously, Mr. Thomas served as Executive Chairman (2005-2006) and Chairman and Chief Executive Officer (2000-2005) of IMS Health, Inc. (pharmaceutical and healthcare information solutions), and a Director of Fortune Brands, Inc. (consumer products, 2000-2011).
+ The information includes the Trustee's principal occupation during the last five years and other information relating to the experience, attributes, and skills relevant to the Trustee's qualifications to serve as a Trustee, which led to the conclusion that the Trustee should serve as a Trustee for the fund.
Advisory Board Members and Officers:
Correspondence intended for an officer or Peter S. Lynch may be sent to Fidelity Investments, 245 Summer Street, Boston, Massachusetts 02210. Officers appear below in alphabetical order.
Name, Year of Birth; Principal Occupation
Peter S. Lynch (1944)
Year of Election or Appointment: 2003
Member of the Advisory Board
Mr. Lynch also serves as Member of the Advisory Board of other Fidelity® funds. Mr. Lynch is Vice Chairman and a Director of FMR (investment adviser firm) and FMR Co., Inc. (investment adviser firm). In addition, Mr. Lynch serves as a Trustee of Boston College and as the Chairman of the Inner-City Scholarship Fund. Previously, Mr. Lynch served on the Special Olympics International Board of Directors (1997-2006).
Elizabeth Paige Baumann (1968)
Year of Election or Appointment: 2017
Anti-Money Laundering (AML) Officer
Ms. Baumann also serves as AML Officer of other funds. She is Chief AML Officer (2012-present) and Senior Vice President (2014-present) of FMR LLC (diversified financial services company) and is an employee of Fidelity Investments. Previously, Ms. Baumann served as AML Officer of the funds (2012-2016), and Vice President (2007-2014) and Deputy Anti-Money Laundering Officer (2007-2012) of FMR LLC.
Marc R. Bryant (1966)
Year of Election or Appointment: 2015
Secretary and Chief Legal Officer (CLO)
Mr. Bryant also serves as Secretary and CLO of other funds. Mr. Bryant serves as CLO, Secretary, and Senior Vice President of Fidelity Management & Research Company (investment adviser firm, 2015-present) and FMR Co., Inc. (investment adviser firm, 2015-present); Secretary of Fidelity SelectCo, LLC (investment adviser firm, 2015-present) and Fidelity Investments Money Management, Inc. (investment adviser firm, 2015-present); and CLO of Fidelity Management & Research (Hong Kong) Limited and FMR Investment Management (UK) Limited (investment adviser firms, 2015-present) and Fidelity Management & Research (Japan) Limited (investment adviser firm, 2016-present). He is Senior Vice President and Deputy General Counsel of FMR LLC (diversified financial services company). Previously, Mr. Bryant served as Secretary and CLO of Fidelity Rutland Square Trust II (2010-2014) and Assistant Secretary of Fidelity's Fixed Income and Asset Allocation Funds (2013-2015). Prior to joining Fidelity Investments, Mr. Bryant served as a Senior Vice President and the Head of Global Retail Legal for AllianceBernstein L.P. (2006-2010), and as the General Counsel for ProFund Advisors LLC (2001-2006).
William C. Coffey (1969)
Year of Election or Appointment: 2009
Assistant Secretary
Mr. Coffey also serves as Assistant Secretary of other funds. He is Senior Vice President and Deputy General Counsel of FMR LLC (diversified financial services company, 2010-present), and is an employee of Fidelity Investments. Previously, Mr. Coffey served as Vice President and Associate General Counsel of FMR LLC (2005-2009).
Jonathan Davis (1968)
Year of Election or Appointment: 2010
Assistant Treasurer
Mr. Davis also serves as Assistant Treasurer of other funds, and is an employee of Fidelity Investments. Previously, Mr. Davis served as Vice President and Associate General Counsel of FMR LLC (diversified financial services company, 2003-2010).
Adrien E. Deberghes (1967)
Year of Election or Appointment: 2016
Assistant Treasurer
Mr. Deberghes also serves as an officer of other funds. He serves as Executive Vice President of Fidelity Investments Money Management, Inc. (FIMM) (investment adviser firm, 2016-present) and is an employee of Fidelity Investments (2008-present). Prior to joining Fidelity Investments, Mr. Deberghes was Senior Vice President of Mutual Fund Administration at State Street Corporation (2007-2008), Senior Director of Mutual Fund Administration at Investors Bank & Trust (2005-2007), and Director of Finance for Dunkin' Brands (2000-2005). Previously, Mr. Deberghes served in other fund officer roles.
Joseph DeSantis (1959)
Year of Election or Appointment: 2017
Vice President
Mr. DeSantis also serves as Vice President of other funds. Mr. DeSantis serves as a Director of Fidelity Management & Research (Japan) Limited (investment adviser firm, 2016-present), Chief Investment Officer, Equities (2010-present) and is an employee of Fidelity Investments.
Stephanie J. Dorsey (1969)
Year of Election or Appointment: 2010
Assistant Treasurer
Ms. Dorsey also serves as an officer of other funds. She is an employee of Fidelity Investments (2008-present) and has served in other fund officer roles. Prior to joining Fidelity Investments, Ms. Dorsey served as Treasurer (2004-2008) of the JPMorgan Mutual Funds and Vice President (2004-2008) of JPMorgan Chase Bank.
Howard J. Galligan III (1966)
Year of Election or Appointment: 2014
Chief Financial Officer
Mr. Galligan also serves as Chief Financial Officer of other funds. Mr. Galligan serves as President of Fidelity Pricing and Cash Management Services (FPCMS) (2014-present) and as a Director of Strategic Advisers, Inc. (investment adviser firm, 2008-present). Previously, Mr. Galligan served as Chief Administrative Officer of Asset Management (2011-2014) and Chief Operating Officer and Senior Vice President of Investment Support for Strategic Advisers, Inc. (2003-2011).
Brian B. Hogan (1964)
Year of Election or Appointment: 2009
Vice President
Mr. Hogan also serves as Trustee or Vice President of other funds. Mr. Hogan serves as a Director of FMR Investment Management (UK) Limited (investment adviser firm, 2015-present) and Fidelity SelectCo, LLC (investment adviser firm, 2014-present) and President of the Equity Division of FMR (investment adviser firm, 2009-present). Previously, Mr. Hogan served as Senior Vice President, Equity Research of FMR (2006-2009) and as a portfolio manager. Mr. Brian B. Hogan is not related to Mr. Colm A. Hogan.
Colm A. Hogan (1973)
Year of Election or Appointment: 2016
Deputy Treasurer
Mr. Hogan also serves as an officer of other funds. Mr. Hogan is an employee of Fidelity Investments (2005-present). Mr. Colm A. Hogan is not related to Mr. Brian B. Hogan.
Chris Maher (1972)
Year of Election or Appointment: 2013
Assistant Treasurer
Mr. Maher serves as Assistant Treasurer of other funds. Mr. Maher is Vice President of Valuation Oversight and is an employee of Fidelity Investments. Previously, Mr. Maher served as Vice President of Asset Management Compliance (2013), Vice President of the Program Management Group of FMR (investment adviser firm, 2010-2013), and Vice President of Valuation Oversight (2008-2010).
Rieco E. Mello (1969)
Year of Election or Appointment: 2017
Assistant Treasurer
Mr. Mello also serves as Assistant Treasurer of other funds. Mr. Mello is an employee of Fidelity Investments (1995-present).
Kenneth B. Robins (1969)
Year of Election or Appointment: 2016
Chief Compliance Officer
Mr. Robins also serves as an officer of other funds. Mr. Robins serves as Compliance Officer of Fidelity Management & Research Company and FMR Co., Inc. (investment adviser firms, 2016-present) and is an employee of Fidelity Investments (2004-present). Previously, Mr. Robins served as Executive Vice President of Fidelity Investments Money Management, Inc. (investment adviser firm, 2013-2016) and served in other fund officer roles.
Stacie M. Smith (1974)
Year of Election or Appointment: 2016
President and Treasurer
Ms. Smith also serves as an officer of other funds. She is an employee of Fidelity Investments (2009-present) and has served in other fund officer roles. Prior to joining Fidelity Investments, Ms. Smith served as Senior Audit Manager of Ernst & Young LLP (accounting firm, 1996-2009). Previously, Ms. Smith served as Deputy Treasurer of certain Fidelity® funds (2013-2016).
Marc L. Spector (1972)
Year of Election or Appointment: 2016
Assistant Treasurer
Mr. Spector also serves as an officer of other funds. Mr. Spector is an employee of Fidelity Investments (2016-present). Prior to joining Fidelity Investments, Mr. Spector served as Director at the Siegfried Group (accounting firm, 2013-2016), and prior to Siegfried Group as audit senior manager at Deloitte & Touche (accounting firm, 2005-2013).
Renee Stagnone (1975)
Year of Election or Appointment: 2016
Assistant Treasurer
Ms. Stagnone also serves as an officer of other funds. Ms. Stagnone is an employee of Fidelity Investments (1997-present). Previously, Ms. Stagnone served as Deputy Treasurer of certain Fidelity® funds (2013-2016).
Shareholder Expense Example
As a shareholder of the Fund, you incur two types of costs: (1) transaction costs and (2) ongoing costs, including other Fund expenses. This Example is intended to help you understand your ongoing costs (in dollars) of investing in the Fund and to compare these costs with the ongoing costs of investing in other mutual funds.
The Example is based on an investment of $1,000 invested at the beginning of the period and held for the entire period (May 1, 2017 to October 31, 2017).
Actual Expenses
The first line of the accompanying table provides information about actual account values and actual expenses. You may use the information in this line, together with the amount you invested, to estimate the expenses that you paid over the period. Simply divide your account value by $1,000.00 (for example, an $8,600 account value divided by $1,000.00 = 8.6), then multiply the result by the number in the first line under the heading entitled "Expenses Paid During Period" to estimate the expenses you paid on your account during this period. In addition, the Fund, as a shareholder in the underlying Fidelity Central Funds, will indirectly bear its pro-rata share of the fees and expenses incurred by the underlying Fidelity Central Funds. These fees and expenses are not included in the Fund's annualized expense ratio used to calculate the expense estimate in the table below.
Hypothetical Example for Comparison Purposes
The second line of the accompanying table provides information about hypothetical account values and hypothetical expenses based on the Fund's actual expense ratio and an assumed rate of return of 5% per year before expenses, which is not the Fund's actual return. The hypothetical account values and expenses may not be used to estimate the actual ending account balance or expenses you paid for the period. You may use this information to compare the ongoing costs of investing in the Fund and other funds. To do so, compare this 5% hypothetical example with the 5% hypothetical examples that appear in the shareholder reports of the other funds. In addition, the Fund, as a shareholder in the underlying Fidelity Central Funds, will indirectly bear its pro-rata share of the fees and expenses incurred by the underlying Fidelity Central Funds. These fees and expenses are not included in the Fund's annualized expense ratio used to calculate the expense estimate in the table below.
Please note that the expenses shown in the table are meant to highlight your ongoing costs only and do not reflect any transaction costs. Therefore, the second line of the table is useful in comparing ongoing costs only, and will not help you determine the relative total costs of owning different funds.
| | Annualized Expense Ratio-A | Beginning
Account Value
May 1, 2017 | Ending
Account Value
October 31, 2017 | Expenses Paid
During Period-B
May 1, 2017
to October 31, 2017 |
| Actual | - %-C | $1,000.00 | $1,125.20 | $- |
| Hypothetical-D | | $1,000.00 | $1,025.21 | $- |
A Annualized expense ratio reflects expenses net of applicable fee waivers.
B Expenses are equal to the Fund's annualized expense ratio, multiplied by the average account value over the period, multiplied by 184/365 (to reflect the one-half year period).
C Amount represents less than .005%.
D 5% return per year before expenses
Distributions (Unaudited)
The Board of Trustees of Fidelity Flex International Fund voted to pay on December 11, 2017, to shareholders of record at the opening of business on December 8, 2017, a distribution of $0.032 per share derived from capital gains realized from sales of portfolio securities and a dividend of $0.073 per share from net investment income.
The fund will notify shareholders in January 2018 of amounts for use in preparing 2017 income tax returns.
Board Approval of Investment Advisory Contracts and Management Fees
Fidelity Flex International Fund
On January 18, 2017, the Board of Trustees, including the Independent Trustees (together, the Board), voted to approve the management contract with Fidelity Management & Research Company (FMR) and the sub-advisory agreements with affiliates of FMR (together, the Advisory Contracts) for the fund. The Board, assisted by the advice of fund counsel and Independent Trustees' counsel, considered a broad range of information.
Nature, Extent, and Quality of Services Provided. The Board considered Fidelity's staffing as it relates to the fund, including the backgrounds of investment personnel of Fidelity, and also considered the fund's investment objective, strategies, and related investment philosophy. The Board considered the structure of the investment personnel compensation program and whether this structure provides appropriate incentives to act in the best interests of the fund.
Resources Dedicated to Investment Management and Support Services. The Board and the Fund Oversight and Research Committees reviewed the general qualifications and capabilities of Fidelity's investment staff, including its size, education, experience, and resources, as well as Fidelity's approach to recruiting,training, managing, and compensating investment personnel. The Board noted that Fidelity has continued to increase the resources devoted to non-U.S. offices, including expansion of Fidelity's global investment organization. The Board also noted that Fidelity's analysts have extensive resources, tools and capabilities that allow them to conduct sophisticated quantitative and fundamental analysis, as well as credit analysis of issuers, counterparties and guarantors. Further, the Board considered that Fidelity's investment professionals have sufficient access to global information and data so as to provide competitive investment results over time, and that those professionals also have access to sophisticated tools that permit them to assess portfolio construction and risk and performance attribution characteristics continuously, as well as to transmit new information and research conclusions rapidly around the world. Additionally, in its deliberations, the Board considered Fidelity's trading, risk management, compliance, and technology and operationscapabilities and resources, which are integral parts of the investment management process.
Shareholder and Administrative Services. The Board considered the nature, extent, quality, and cost of advisory, administrative, and shareholder services to be performed by FMR, the sub-advisers (together with FMR, the Investment Advisers), and their affiliates under the Advisory Contracts and under separate agreements covering transfer agency, pricing and bookkeeping, and securities lending services for the fund. The Board also considered the nature and extent of the supervision of third party service providers, principally custodians, subcustodians, and pricing vendors.
The Board noted that the growth of fund assets over time across the complex allows Fidelity to reinvest in the development of services designed to enhance the value or convenience of the Fidelity funds as investment vehicles. These services include 24-hour access to account information and market information through telephone representatives and over the Internet, investor education materials and asset allocation tools, and the expanded availability of Fidelity Investor Centers.
Investment Performance. The fund is a new fund and therefore had no historical performance for the Board to review at the time it approved the fund's Advisory Contracts. The Board considered the Investment Advisers' strength in fundamental, research-driven security selection, which the Board is familiar with through its supervision of other Fidelity funds.
Based on its review, the Board concluded that the nature, extent, and quality of services to be provided to the fund under the Advisory Contracts should benefit the shareholders of the fund.
Competitiveness of Management Fee and Total Expense Ratio ..The Board noted that the fund is available exclusively to retirement plans offered through certain Fidelity fee-based programs. The Board considered that while the fund does not pay a management fee, FMR is indirectly compensated for its services out of the program fee. The Board noted that FMR pays all operating expenses, with certain limited exceptions, on behalf of the fund. Based on its review, the Board concluded that the fund's management fee and projected total expense ratio were reasonable in light of the services that the fund and its shareholders will receive and the other factors considered.
Costs of the Services and Profitability. The fund is a new fund and therefore no revenue, cost, or profitability data was available for the Board to review in respect of the fund at the time it approved the Advisory Contracts. In connection with its future renewal of the fund's Advisory Contracts, the Board will consider the revenues earned and the expenses incurred by Fidelity in conducting the business of developing, marketing, distributing, managing, administering and servicing the fund and servicing the fund's shareholders.
Economies of Scale. The Board will consider economies of scale when there is operating experience to permit assessment thereof. It noted, however, that because the fund pays no advisory fees and FMR bears most expenses of the fund, economies of scale cannot be realized by the fund.
Based on its evaluation of all of the conclusions noted above, and after considering all factors it believed relevant, the Board concluded that the advisory fee structures are fair and reasonable, and that the fund's Advisory Contracts should be approved.
Corporate Headquarters
245 Summer St.
Boston, MA 02210
www.fidelity.com
ZNL-ANN-1217
1.9881587.100
Fidelity® International Discovery Fund
Annual Report October 31, 2017 |
|
Contents
To view a fund's proxy voting guidelines and proxy voting record for the 12-month period ended June 30, visit http://www.fidelity.com/proxyvotingresults or visit the Securities and Exchange Commission's (SEC) web site at http://www.sec.gov.
You may also call 1-800-544-8544 to request a free copy of the proxy voting guidelines.
Standard & Poor's, S&P and S&P 500 are registered service marks of The McGraw-Hill Companies, Inc. and have been licensed for use by Fidelity Distributors Corporation.
Other third-party marks appearing herein are the property of their respective owners.
All other marks appearing herein are registered or unregistered trademarks or service marks of FMR LLC or an affiliated company. © 2017 FMR LLC. All rights reserved.
This report and the financial statements contained herein are submitted for the general information of the shareholders of the Fund. This report is not authorized for distribution to prospective investors in the Fund unless preceded or accompanied by an effective prospectus.
A fund files its complete schedule of portfolio holdings with the SEC for the first and third quarters of each fiscal year on Form N-Q. Forms N-Q are available on the SEC’s web site at http://www.sec.gov. A fund's Forms N-Q may be reviewed and copied at the SEC’s Public Reference Room in Washington, DC. Information regarding the operation of the SEC's Public Reference Room may be obtained by calling 1-800-SEC-0330.
For a complete list of a fund's portfolio holdings, view the most recent holdings listing, semiannual report, or annual report on Fidelity's web site at http://www.fidelity.com, http://www.institutional.fidelity.com, or http://www.401k.com, as applicable.
NOT FDIC INSURED •MAY LOSE VALUE •NO BANK GUARANTEE
Neither the Fund nor Fidelity Distributors Corporation is a bank.
Performance: The Bottom Line
Average annual total return reflects the change in the value of an investment, assuming reinvestment of distributions from dividend income and capital gains (the profits earned upon the sale of securities that have grown in value, if any) and assuming a constant rate of performance each year. The hypothetical investment and the average annual total returns do not reflect the deduction of taxes that a shareholder would pay on fund distributions or the redemption of fund shares. During periods of reimbursement by Fidelity, a fund’s total return will be greater than it would be had the reimbursement not occurred. How a fund did yesterday is no guarantee of how it will do tomorrow.
Average Annual Total Returns
| For the periods ended October 31, 2017 | Past 1 year | Past 5 years | Past 10 years |
| Fidelity® International Discovery Fund | 26.33% | 9.65% | 1.69% |
$10,000 Over 10 Years
Let's say hypothetically that $10,000 was invested in Fidelity® International Discovery Fund, a class of the fund, on October 31, 2007.
The chart shows how the value of your investment would have changed, and also shows how the MSCI EAFE Index performed over the same period.
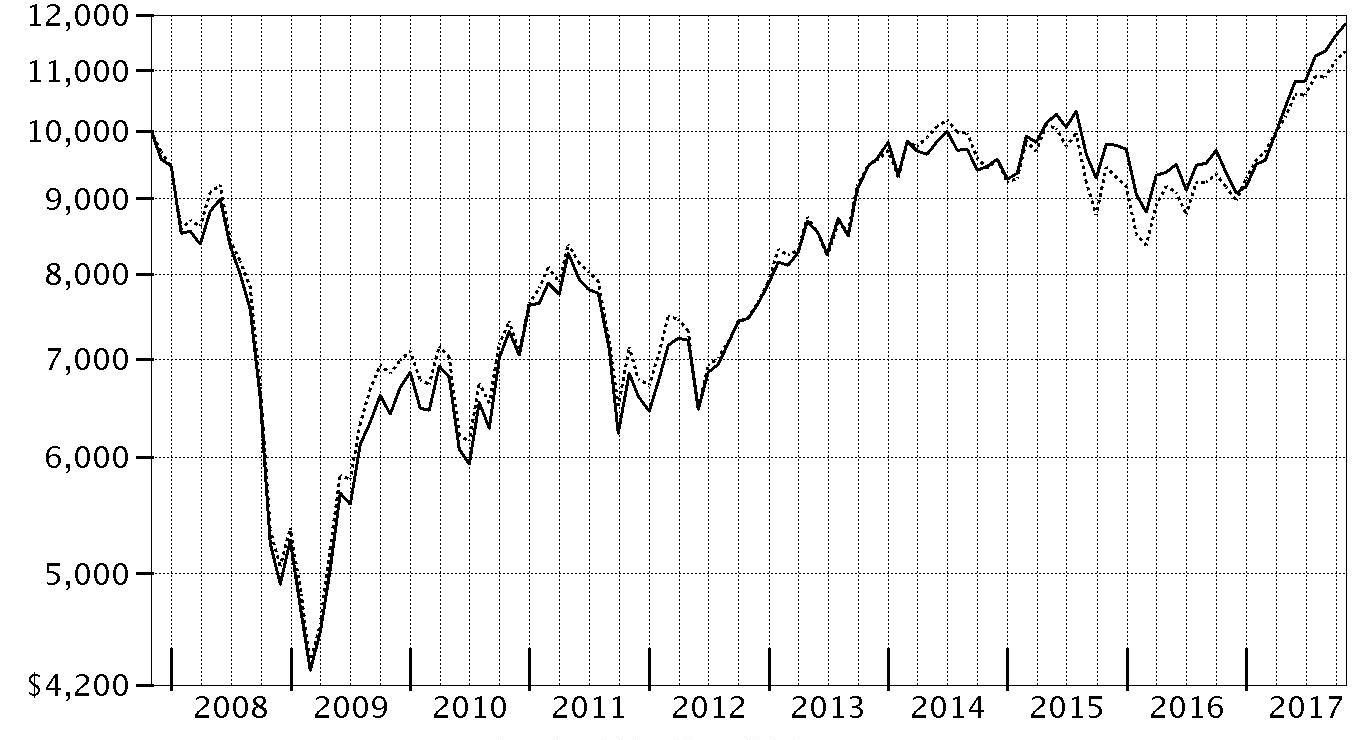
| Period Ending Values |
| $11,823 | Fidelity® International Discovery Fund |
| $11,334 | MSCI EAFE Index |
Management's Discussion of Fund Performance
Market Recap: The MSCI ACWI (All Country World Index) ex USA Index returned 23.85% for the 12 months ending October 31, 2017, helped partly by a generally weak U.S. dollar. Some favorable election results in continental Europe (+30%) suggested ebbing political uncertainty and near-term risk there, but the U.K. (+20%) faced more-mixed conditions ahead of its expected exit from the European Union. Despite central-bank easing – and pressured recently by yen strength – Japan (+18%) lagged the rest of the Asia-Pacific group (+22%). Commodity-price volatility slowed Canada (+17%), but the emerging-markets group (+26%) sped ahead. Sector-wise, information technology (+47%) was driven by a surge among several Chinese internet-related names. Financials (+27%) rode rising interest rates that, at the same time, weighed on real estate (+17%), utilities (+16%), consumer staples (+14%) and telecommunication services (+9%) – so-called “bond proxy” sectors. Materials (+28%) and industrials (+27%) responded to demand from China and price gains for certain commodities. In the energy sector (+20%), oil prices lost ground in the spring before rebounding through October 31 to end well above where they started 12 months ago. Lastly, health care (+14%) was hurt by early-period turmoil around drug pricing and health care legislation.
Comments from Portfolio Manager William Kennedy: For the fiscal year, the fund’s share classes (excluding sales charges, if applicable) gained about 25% to 26%, beating the 23.69% return of the benchmark MSCI EAFE Index. Versus the benchmark, security selection, most notably in industrials, and sector allocations, especially an overweighting in the top-performing information technology sector, helped relative performance. Geographically, investments in emerging markets, which are outside the benchmark, as well as in picks in Japan and continental Europe aided fund results the most. Top individual relative contributors included China-based e-commerce giant Alibaba Group Holding. Its stock price surged as expanding e-commerce sales worldwide and the firm's broad offerings drove strong earnings growth. Shares of educational company New Oriental Education & Technology gained as China’s growing middle class invested in their children’s education. On the downside, security selection in the energy sector and, geographically, in out-of-index Canada and the U.S. nicked relative performance. Stock-level detractors included telecommunications-services company KDDI in Japan, which fell from favor as investors shifted toward more economically sensitive names after the Trump election. A non-benchmark stake in Canada's Cenovus Energy and a small cash position also hurt.
The views expressed above reflect those of the portfolio manager(s) only through the end of the period as stated on the cover of this report and do not necessarily represent the views of Fidelity or any other person in the Fidelity organization. Any such views are subject to change at any time based upon market or other conditions and Fidelity disclaims any responsibility to update such views. These views may not be relied on as investment advice and, because investment decisions for a Fidelity fund are based on numerous factors, may not be relied on as an indication of trading intent on behalf of any Fidelity fund.
Investment Summary (Unaudited)
Geographic Diversification (% of fund's net assets)
| As of October 31, 2017 |
| | Japan | 17.8% |
| | United Kingdom | 13.7% |
| | France | 10.3% |
| | Germany | 6.7% |
| | Switzerland | 6.3% |
| | Netherlands | 5.3% |
| | Spain | 4.6% |
| | India | 3.6% |
| | Sweden | 3.2% |
| | Other* | 28.5% |

* Includes Short-Term Investments and Net Other Assets (Liabilities).
| As of April 30, 2017 |
| | Japan | 17.6% |
| | United Kingdom | 15.4% |
| | France | 8.6% |
| | Switzerland | 5.8% |
| | Netherlands | 5.7% |
| | Germany | 5.7% |
| | Sweden | 4.2% |
| | Spain | 4.1% |
| | United States of America* | 3.4% |
| | Other | 29.5% |

* Includes Short-Term Investments and Net Other Assets (Liabilities).
Percentages are based on country or territory of incorporation and are adjusted for the effect of futures contracts, if applicable.
Asset Allocation as of October 31, 2017
| | % of fund's net assets | % of fund's net assets 6 months ago |
| Stocks and Equity Futures | 97.6 | 98.3 |
| Short-Term Investments and Net Other Assets (Liabilities) | 2.4 | 1.7 |
Top Ten Stocks as of October 31, 2017
| | % of fund's net assets | % of fund's net assets 6 months ago |
| Total SA (France, Oil, Gas & Consumable Fuels) | 2.0 | 2.1 |
| Unilever NV (Certificaten Van Aandelen) (Bearer) (Netherlands, Personal Products) | 1.7 | 1.2 |
| SAP SE (Germany, Software) | 1.6 | 1.7 |
| Statoil ASA (Norway, Oil, Gas & Consumable Fuels) | 1.5 | 1.3 |
| ORIX Corp. (Japan, Diversified Financial Services) | 1.2 | 1.1 |
| VINCI SA (France, Construction & Engineering) | 1.2 | 0.9 |
| Sony Corp. (Japan, Household Durables) | 1.2 | 1.1 |
| Micro Focus International PLC (United Kingdom, Software) | 1.0 | 1.4 |
| KBC Groep NV (Belgium, Banks) | 1.0 | 1.0 |
| British American Tobacco PLC (United Kingdom, Tobacco) | 1.0 | 1.2 |
| | 13.4 | |
Top Market Sectors as of October 31, 2017
| | % of fund's net assets | % of fund's net assets 6 months ago |
| Financials | 21.0 | 20.8 |
| Industrials | 14.0 | 16.4 |
| Consumer Discretionary | 13.0 | 13.9 |
| Health Care | 11.0 | 7.7 |
| Information Technology | 10.7 | 13.3 |
| Consumer Staples | 10.4 | 10.0 |
| Materials | 5.6 | 6.2 |
| Energy | 5.3 | 4.8 |
| Telecommunication Services | 2.9 | 2.8 |
| Real Estate | 1.9 | 1.1 |
Investments October 31, 2017
Showing Percentage of Net Assets
| Common Stocks - 95.3% | | | |
| | | Shares | Value (000s) |
| Australia - 2.0% | | | |
| Altium Ltd. | | 1,569,213 | $14,388 |
| Australia & New Zealand Banking Group Ltd. | | 2,498,457 | 57,213 |
| Bapcor Ltd. | | 8,747,451 | 36,420 |
| Magellan Financial Group Ltd. | | 1,204,177 | 22,368 |
| Ramsay Health Care Ltd. | | 1,002,986 | 51,362 |
| Spark Infrastructure Group unit | | 18,522,715 | 36,008 |
|
| TOTAL AUSTRALIA | | | 217,759 |
|
| Austria - 1.0% | | | |
| Erste Group Bank AG | | 1,238,700 | 53,229 |
| Wienerberger AG | | 2,081,200 | 53,480 |
|
| TOTAL AUSTRIA | | | 106,709 |
|
| Bailiwick of Jersey - 1.4% | | | |
| Glencore Xstrata PLC | | 20,685,349 | 99,728 |
| Randgold Resources Ltd. sponsored ADR | | 189,614 | 18,633 |
| Shire PLC | | 552,000 | 27,189 |
|
| TOTAL BAILIWICK OF JERSEY | | | 145,550 |
|
| Belgium - 1.5% | | | |
| Anheuser-Busch InBev SA NV | | 423,027 | 51,872 |
| KBC Groep NV | | 1,297,261 | 107,758 |
|
| TOTAL BELGIUM | | | 159,630 |
|
| Bermuda - 0.3% | | | |
| Hiscox Ltd. | | 1,872,000 | 35,504 |
| British Virgin Islands - 0.1% | | | |
| Mail.Ru Group Ltd. GDR (Reg. S) (a) | | 219,200 | 7,124 |
| Canada - 1.9% | | | |
| Alimentation Couche-Tard, Inc. Class B (sub. vtg.) | | 725,100 | 33,998 |
| Cenovus Energy, Inc. | | 3,404,200 | 33,037 |
| Constellation Software, Inc. | | 76,000 | 43,239 |
| Franco-Nevada Corp. | | 227,700 | 18,088 |
| PrairieSky Royalty Ltd. (b) | | 1,763,973 | 46,954 |
| Suncor Energy, Inc. | | 676,200 | 22,958 |
|
| TOTAL CANADA | | | 198,274 |
|
| Cayman Islands - 1.5% | | | |
| Alibaba Group Holding Ltd. sponsored ADR (a) | | 446,500 | 82,553 |
| ASM Pacific Technology Ltd. | | 1,577,700 | 22,953 |
| JD.com, Inc. sponsored ADR (a) | | 762,600 | 28,613 |
| New Oriental Education & Technology Group, Inc. sponsored ADR | | 255,900 | 21,301 |
|
| TOTAL CAYMAN ISLANDS | | | 155,420 |
|
| China - 1.4% | | | |
| Kweichow Moutai Co. Ltd. (A Shares) | | 607,482 | 56,586 |
| Qingdao Port International Co. Ltd. | | 11,154,000 | 7,878 |
| Shanghai International Airport Co. Ltd. (A Shares) | | 5,861,900 | 38,653 |
| Wuliangye Yibin Co. Ltd. Class A | | 4,443,400 | 44,615 |
|
| TOTAL CHINA | | | 147,732 |
|
| Denmark - 0.7% | | | |
| Novo Nordisk A/S Series B | | 966,145 | 48,103 |
| Novozymes A/S Series B | | 393,200 | 21,715 |
|
| TOTAL DENMARK | | | 69,818 |
|
| Finland - 0.5% | | | |
| Sampo Oyj (A Shares) | | 929,800 | 48,717 |
| France - 10.3% | | | |
| Accor SA | | 664,400 | 33,151 |
| ALTEN | | 336,259 | 29,436 |
| Altran Technologies SA | | 1,492,300 | 27,604 |
| Amundi SA | | 567,258 | 48,091 |
| Atos Origin SA | | 252,720 | 39,270 |
| AXA SA | | 1,278,800 | 38,605 |
| BNP Paribas SA | | 774,100 | 60,451 |
| Capgemini SA | | 486,200 | 59,099 |
| Cegedim SA (a) | | 536,390 | 20,869 |
| Elis SA | | 1,199,800 | 31,299 |
| Kaufman & Broad SA | | 454,247 | 20,070 |
| Maisons du Monde SA | | 1,122,200 | 48,562 |
| Rexel SA | | 1,540,100 | 27,493 |
| Sanofi SA | | 952,591 | 90,198 |
| Sartorius Stedim Biotech | | 306,000 | 20,856 |
| SMCP S.A.S. | | 644,668 | 16,250 |
| Societe Generale Series A | | 1,243,700 | 69,218 |
| Sodexo SA | | 558,700 | 71,100 |
| Total SA | | 3,896,574 | 217,042 |
| VINCI SA (b) | | 1,321,700 | 129,402 |
|
| TOTAL FRANCE | | | 1,098,066 |
|
| Germany - 6.7% | | | |
| adidas AG | | 360,212 | 80,163 |
| Aumann AG | | 133,851 | 12,411 |
| Deutsche Borse AG | | 164,581 | 17,045 |
| Deutsche Post AG | | 2,254,367 | 103,254 |
| Deutsche Telekom AG | | 1,845,500 | 33,417 |
| Fresenius SE & Co. KGaA | | 429,100 | 35,843 |
| Henkel AG & Co. KGaA | | 333,900 | 42,084 |
| MTU Aero Engines Holdings AG | | 380,800 | 64,207 |
| Muenchener Rueckversicherungs AG | | 122,700 | 27,449 |
| Nexus AG | | 604,505 | 18,347 |
| Rational AG | | 76,305 | 50,042 |
| Rheinmetall AG | | 313,900 | 37,022 |
| SAP SE | | 1,522,370 | 173,950 |
| Wirecard AG | | 222,600 | 21,923 |
|
| TOTAL GERMANY | | | 717,157 |
|
| Hong Kong - 1.2% | | | |
| AIA Group Ltd. | | 9,260,800 | 69,681 |
| Techtronic Industries Co. Ltd. | | 10,229,000 | 59,986 |
|
| TOTAL HONG KONG | | | 129,667 |
|
| India - 3.6% | | | |
| Avenue Supermarts Ltd. | | 595,148 | 10,484 |
| Bharat Petroleum Corp. Ltd. | | 3,495,188 | 29,235 |
| Bharti Infratel Ltd. | | 8,217,708 | 56,115 |
| HDFC Bank Ltd. | | 1,034,409 | 28,953 |
| HDFC Bank Ltd. sponsored ADR | | 694,884 | 64,138 |
| Housing Development Finance Corp. Ltd. | | 3,719,156 | 98,071 |
| Kajaria Ceramics Ltd. | | 2,444,763 | 25,682 |
| Kotak Mahindra Bank Ltd. | | 1,211,049 | 19,172 |
| Petronet LNG Ltd. | | 6,098,248 | 24,473 |
| PNB Housing Finance Ltd. | | 838,105 | 18,420 |
| PVR Ltd. | | 442,801 | 9,486 |
|
| TOTAL INDIA | | | 384,229 |
|
| Indonesia - 0.6% | | | |
| PT Bank Central Asia Tbk | | 16,688,600 | 25,717 |
| PT Bank Rakyat Indonesia Tbk | | 32,624,300 | 37,525 |
|
| TOTAL INDONESIA | | | 63,242 |
|
| Ireland - 3.1% | | | |
| Allied Irish Banks PLC | | 2,202,142 | 13,016 |
| Cairn Homes PLC (a) | | 20,930,170 | 43,458 |
| CRH PLC | | 2,162,910 | 81,395 |
| DCC PLC (United Kingdom) | | 366,900 | 34,793 |
| Glenveagh Properties PLC | | 13,703,776 | 17,958 |
| Green REIT PLC | | 9,492,200 | 16,696 |
| James Hardie Industries PLC CDI | | 1,790,532 | 27,257 |
| Kerry Group PLC Class A | | 571,300 | 57,531 |
| Ryanair Holdings PLC sponsored ADR (a) | | 355,466 | 39,851 |
|
| TOTAL IRELAND | | | 331,955 |
|
| Israel - 0.5% | | | |
| Frutarom Industries Ltd. | | 692,800 | 57,037 |
| Italy - 0.9% | | | |
| De Longhi SpA | | 734,500 | 24,085 |
| Intesa Sanpaolo SpA | | 22,174,600 | 74,549 |
|
| TOTAL ITALY | | | 98,634 |
|
| Japan - 16.3% | | | |
| AEON Financial Service Co. Ltd. | | 1,637,700 | 35,172 |
| Daito Trust Construction Co. Ltd. | | 170,800 | 29,862 |
| Hoya Corp. | | 1,466,200 | 79,660 |
| Investors Cloud Co. Ltd. (b) | | 442,100 | 26,961 |
| KDDI Corp. | | 3,906,500 | 104,079 |
| Keyence Corp. | | 137,820 | 76,521 |
| Komatsu Ltd. | | 1,572,500 | 51,383 |
| Misumi Group, Inc. | | 1,138,800 | 31,200 |
| Mitsubishi UFJ Financial Group, Inc. | | 13,323,000 | 90,372 |
| Monex Group, Inc. | | 10,069,949 | 32,115 |
| Morinaga & Co. Ltd. | | 578,200 | 32,847 |
| Nidec Corp. | | 324,300 | 43,126 |
| Nintendo Co. Ltd. | | 109,300 | 42,404 |
| Nitori Holdings Co. Ltd. | | 490,500 | 71,285 |
| Olympus Corp. | | 2,074,600 | 77,206 |
| ORIX Corp. | | 7,596,400 | 130,610 |
| Panasonic Corp. | | 6,185,200 | 93,393 |
| Recruit Holdings Co. Ltd. | | 951,600 | 23,331 |
| Relo Holdings Corp. | | 2,579,800 | 63,870 |
| Renesas Electronics Corp. (a) | | 6,360,600 | 82,237 |
| SMC Corp. | | 135,700 | 51,913 |
| SMS Co., Ltd. | | 1,148,500 | 34,598 |
| SoftBank Corp. | | 816,200 | 72,333 |
| Sony Corp. | | 2,969,500 | 124,228 |
| Start Today Co. Ltd. | | 1,828,300 | 50,076 |
| Sundrug Co. Ltd. | | 870,200 | 37,870 |
| Toto Ltd. | | 61,000 | 2,987 |
| Tsuruha Holdings, Inc. | | 468,800 | 58,123 |
| VT Holdings Co. Ltd. | | 3,872,500 | 21,080 |
| Welcia Holdings Co. Ltd. | | 1,666,500 | 63,247 |
|
| TOTAL JAPAN | | | 1,734,089 |
|
| Korea (South) - 0.3% | | | |
| Hyundai Fire & Marine Insurance Co. Ltd. | | 331,774 | 13,457 |
| KB Financial Group, Inc. | | 437,375 | 22,914 |
|
| TOTAL KOREA (SOUTH) | | | 36,371 |
|
| Luxembourg - 0.7% | | | |
| Eurofins Scientific SA | | 122,139 | 76,401 |
| Marshall Islands - 0.1% | | | |
| Hoegh LNG Partners LP | | 715,655 | 13,562 |
| Netherlands - 5.3% | | | |
| ASML Holding NV (Netherlands) | | 438,700 | 79,154 |
| Basic-Fit NV (a) | | 579,100 | 13,299 |
| IMCD Group BV | | 1,264,300 | 79,527 |
| ING Groep NV (Certificaten Van Aandelen) | | 4,861,400 | 89,836 |
| Intertrust NV (b) | | 715,684 | 11,004 |
| Koninklijke Philips Electronics NV | | 2,599,026 | 105,918 |
| Unilever NV (Certificaten Van Aandelen) (Bearer) | | 3,031,776 | 176,116 |
| Van Lanschot NV (Bearer) | | 223,700 | 6,789 |
|
| TOTAL NETHERLANDS | | | 561,643 |
|
| New Zealand - 1.1% | | | |
| EBOS Group Ltd. | | 3,154,998 | 37,998 |
| Fisher & Paykel Healthcare Corp. | | 3,744,125 | 33,948 |
| Ryman Healthcare Group Ltd. | | 6,393,204 | 40,686 |
|
| TOTAL NEW ZEALAND | | | 112,632 |
|
| Norway - 1.5% | | | |
| Statoil ASA (b) | | 7,822,109 | 158,926 |
| Philippines - 0.3% | | | |
| SM Investments Corp. | | 1,974,665 | 36,557 |
| Romania - 0.3% | | | |
| Banca Transilvania SA | | 63,057,091 | 35,103 |
| Russia - 0.4% | | | |
| Sberbank of Russia sponsored ADR | | 3,048,700 | 43,749 |
| South Africa - 0.9% | | | |
| Aspen Pharmacare Holdings Ltd. | | 656,700 | 14,837 |
| Naspers Ltd. Class N | | 320,800 | 78,165 |
|
| TOTAL SOUTH AFRICA | | | 93,002 |
|
| Spain - 4.6% | | | |
| Aedas Homes SAU | | 406,831 | 14,217 |
| Amadeus IT Holding SA Class A | | 790,100 | 53,610 |
| Atresmedia Corporacion de Medios de Comunicacion SA | | 1,229,800 | 12,635 |
| CaixaBank SA (b) | | 18,391,133 | 86,077 |
| Grifols SA ADR | | 2,461,958 | 58,225 |
| Hispania Activos Inmobiliarios SA | | 1,424,325 | 24,563 |
| Inditex SA (b) | | 1,333,256 | 49,845 |
| Masmovil Ibercom SA (a)(b) | | 323,297 | 26,708 |
| Mediaset Espana Comunicacion SA | | 2,378,700 | 25,857 |
| Neinor Homes SLU | | 2,255,500 | 46,359 |
| Prosegur Cash SA | | 19,469,700 | 63,502 |
| Zardoya Otis SA | | 2,111,573 | 22,875 |
|
| TOTAL SPAIN | | | 484,473 |
|
| Sweden - 3.2% | | | |
| ASSA ABLOY AB (B Shares) | | 3,321,800 | 70,033 |
| Com Hem Holding AB | | 847,200 | 12,721 |
| Essity AB Class B | | 2,669,400 | 79,811 |
| HEXPOL AB (B Shares) | | 1,872,700 | 18,947 |
| Indutrade AB | | 1,342,200 | 37,228 |
| Nordea Bank AB | | 4,487,200 | 54,243 |
| Saab AB (B Shares) | | 650,800 | 33,257 |
| Svenska Cellulosa AB (SCA) (B Shares) | | 4,118,900 | 38,672 |
|
| TOTAL SWEDEN | | | 344,912 |
|
| Switzerland - 6.3% | | | |
| ABB Ltd. (Reg.) | | 3,695,570 | 96,510 |
| Credit Suisse Group AG | | 3,492,359 | 55,036 |
| Forbo Holding AG (Reg.) | | 20,130 | 30,428 |
| Julius Baer Group Ltd. | | 868,620 | 51,377 |
| Kaba Holding AG (B Shares) (Reg.) | | 41,400 | 40,958 |
| Lonza Group AG | | 204,259 | 54,256 |
| Nestle SA (Reg. S) | | 821,706 | 69,137 |
| Partners Group Holding AG | | 77,036 | 51,813 |
| Roche Holding AG (participation certificate) | | 305,286 | 70,561 |
| Schindler Holding AG (participation certificate) | | 170,348 | 38,606 |
| Swatch Group AG (Bearer) | | 155,600 | 60,983 |
| UBS Group AG | | 3,179,340 | 54,112 |
|
| TOTAL SWITZERLAND | | | 673,777 |
|
| Taiwan - 0.5% | | | |
| Taiwan Semiconductor Manufacturing Co. Ltd. | | 2,732,000 | 22,102 |
| United Microelectronics Corp. | | 62,100,000 | 32,073 |
|
| TOTAL TAIWAN | | | 54,175 |
|
| United Kingdom - 13.7% | | | |
| Anglo American PLC (United Kingdom) | | 1,384,500 | 26,111 |
| AstraZeneca PLC (United Kingdom) | | 1,048,809 | 70,963 |
| BAE Systems PLC | | 4,102,004 | 32,313 |
| Barclays PLC | | 58,542 | 144 |
| BCA Marketplace PLC | | 7,762,300 | 21,470 |
| BHP Billiton PLC | | 3,418,385 | 61,892 |
| Booker Group PLC | | 17,550,700 | 46,900 |
| British American Tobacco PLC (United Kingdom) | | 1,219,764 | 78,809 |
| Bunzl PLC | | 1,995,172 | 62,140 |
| Cineworld Group PLC | | 2,055,200 | 18,138 |
| CMC Markets PLC | | 12,570,100 | 26,628 |
| Compass Group PLC | | 1,853,606 | 40,695 |
| Conviviality PLC | | 3,508,273 | 19,815 |
| Countryside Properties PLC | | 3,344,076 | 15,785 |
| Cranswick PLC | | 1,341,488 | 54,876 |
| GlaxoSmithKline PLC | | 3,585,419 | 64,349 |
| Hastings Group Holdings PLC | | 3,610,729 | 15,111 |
| Imperial Tobacco Group PLC | | 865,288 | 35,287 |
| Jiangsu Yanghe Brewery JSC Ltd. ELS (HSBC Warrant Program) warrants 9/19/19 (a)(c) | | 2,466,200 | 40,976 |
| John Wood Group PLC | | 2,221,100 | 20,989 |
| Liberty Global PLC Class A (a) | | 1,294,500 | 39,935 |
| LivaNova PLC (a) | | 682,328 | 50,424 |
| London Stock Exchange Group PLC | | 949,236 | 47,416 |
| Melrose Industries PLC | | 23,769,234 | 69,420 |
| Micro Focus International PLC | | 3,150,505 | 110,676 |
| Moneysupermarket.com Group PLC | | 5,256,022 | 22,681 |
| NCC Group Ltd. (b) | | 9,151,300 | 27,955 |
| Reckitt Benckiser Group PLC | | 769,819 | 68,873 |
| Rex Bionics PLC (a)(d)(e) | | 1,297,286 | 30 |
| Rio Tinto PLC | | 922,450 | 43,596 |
| Senior Engineering Group PLC | | 7,132,100 | 27,309 |
| Spirax-Sarco Engineering PLC | | 312,000 | 23,413 |
| St. James's Place Capital PLC | | 2,427,309 | 37,944 |
| Standard Chartered PLC (United Kingdom) (a) | | 9,043,920 | 90,136 |
| Zpg PLC | | 8,675,409 | 40,328 |
|
| TOTAL UNITED KINGDOM | | | 1,453,527 |
|
| United States of America - 0.6% | | | |
| British American Tobacco PLC sponsored ADR | | 423,000 | 27,241 |
| Monsanto Co. | | 287,400 | 34,804 |
| MSCI, Inc. | | 42,200 | 4,953 |
|
| TOTAL UNITED STATES OF AMERICA | | | 66,998 |
|
| TOTAL COMMON STOCKS | | | |
| (Cost $7,887,727) | | | 10,152,121 |
|
| Preferred Stocks - 0.8% | | | |
| Convertible Preferred Stocks - 0.3% | | | |
| Cayman Islands - 0.3% | | | |
| China Internet Plus Holdings Ltd. Series A-11 (a)(e)(f) | | 5,958,244 | 33,301 |
| Nonconvertible Preferred Stocks - 0.5% | | | |
| Brazil - 0.5% | | | |
| Itausa-Investimentos Itau SA (PN) | | 16,420,200 | 52,604 |
| TOTAL PREFERRED STOCKS | | | |
| (Cost $76,501) | | | 85,905 |
| | | Principal Amount (000s) | Value (000s) |
|
| Government Obligations - 0.0% | | | |
| United States of America - 0.0% | | | |
U.S. Treasury Bills, yield at date of purchase 0.99% to 1.04% 11/30/17 to 12/7/17
(Cost $4,516)(g) | | 4,520 | 4,516 |
| | | Shares | Value (000s) |
|
| Money Market Funds - 7.6% | | | |
| Fidelity Cash Central Fund, 1.10% (h) | | 388,022,983 | 388,101 |
| Fidelity Securities Lending Cash Central Fund 1.11% (h)(i) | | 417,529,962 | 417,572 |
| TOTAL MONEY MARKET FUNDS | | | |
| (Cost $805,681) | | | 805,673 |
| TOTAL INVESTMENT IN SECURITIES - 103.7% | | | |
| (Cost $8,774,425) | | | 11,048,215 |
| NET OTHER ASSETS (LIABILITIES) - (3.7)% | | | (398,953) |
| NET ASSETS - 100% | | | $10,649,262 |
| Futures Contracts | | | | | |
| | Number of contracts | Expiration Date | Notional Amount (000s) | Value (000s) | Unrealized Appreciation/(Depreciation) (000s) |
| Purchased | | | | | |
| Equity Index Contracts | | | | | |
| TSE TOPIX Index Contracts (Japan) | 1,035 | Dec. 2017 | $160,477 | $16,840 | $16,840 |
The notional amount of futures purchased as a percentage of Net Assets is 1.5%
Security Type Abbreviations
ELS – Equity-Linked Security
Categorizations in the Schedule of Investments are based on country or territory of incorporation.
Legend
(a) Non-income producing
(b) Security or a portion of the security is on loan at period end.
(c) Security exempt from registration under Rule 144A of the Securities Act of 1933. These securities may be resold in transactions exempt from registration, normally to qualified institutional buyers. At the end of the period, the value of these securities amounted to $40,976,000 or 0.4% of net assets.
(d) Affiliated company
(e) Level 3 security
(f) Restricted securities - Investment in securities not registered under the Securities Act of 1933 (excluding 144A issues). At the end of the period, the value of restricted securities (excluding 144A issues) amounted to $33,301,000 or 0.3% of net assets.
(g) Security or a portion of the security was pledged to cover margin requirements for futures contracts. At period end, the value of securities pledged amounted to $4,516,000.
(h) Affiliated fund that is generally available only to investment companies and other accounts managed by Fidelity Investments. The rate quoted is the annualized seven-day yield of the fund at period end. A complete unaudited listing of the fund's holdings as of its most recent quarter end is available upon request. In addition, each Fidelity Central Fund's financial statements, which are not covered by the Fund's Report of Independent Registered Public Accounting Firm, are available on the SEC's website or upon request.
(i) Investment made with cash collateral received from securities on loan.
Additional information on each restricted holding is as follows:
| Security | Acquisition Date | Acquisition Cost (000s) |
| China Internet Plus Holdings Ltd. Series A-11 | 1/26/15 | $18,833 |
Affiliated Central Funds
Information regarding fiscal year to date income earned by the Fund from investments in Fidelity Central Funds is as follows:
| Fund | Income earned |
| | (Amounts in thousands) |
| Fidelity Cash Central Fund | $1,715 |
| Fidelity Securities Lending Cash Central Fund | 4,300 |
| Total | $6,015 |
Other Affiliated Issuers
An affiliated company is a company in which the Fund has ownership of at least 5% of the voting securities. Fiscal year to date transactions with companies which are or were affiliates are as follows:
| Affiliate (Amounts in thousands) | Value, beginning of period | Purchases | Sales Proceeds | Dividend Income | Realized Gain (loss) | Change in Unrealized appreciation (depreciation) | Value, end of period |
| Hoegh LNG Partners LP | $12,739 | $-- | $-- | $975 | $-- | $1,746 | $-- |
| Rex Bionics PLC | 357 | -- | -- | -- | -- | (327) | 30 |
| Total | $13,096 | $-- | $-- | $975 | $-- | $1,419 | $30 |
Investment Valuation
The following is a summary of the inputs used, as of October 31, 2017, involving the Fund's assets and liabilities carried at fair value. The inputs or methodology used for valuing securities may not be an indication of the risk associated with investing in those securities. For more information on valuation inputs, and their aggregation into the levels used below, please refer to the Investment Valuation section in the accompanying Notes to Financial Statements.
| | Valuation Inputs at Reporting Date: |
| Description | Total | Level 1 | Level 2 | Level 3 |
| (Amounts in thousands) | | | | |
| Investments in Securities: | | | | |
| Equities: | | | | |
| Consumer Discretionary | $1,350,086 | $956,723 | $360,062 | $33,301 |
| Consumer Staples | 1,135,638 | 498,744 | 636,894 | -- |
| Energy | 567,176 | 191,208 | 375,968 | -- |
| Financials | 2,267,079 | 1,490,157 | 776,922 | -- |
| Health Care | 1,148,229 | 514,052 | 634,147 | 30 |
| Industrials | 1,487,077 | 1,084,281 | 402,796 | -- |
| Information Technology | 1,145,878 | 602,839 | 543,039 | -- |
| Materials | 601,355 | 414,472 | 186,883 | -- |
| Real Estate | 194,127 | 73,434 | 120,693 | -- |
| Telecommunication Services | 305,373 | 95,544 | 209,829 | -- |
| Utilities | 36,008 | 36,008 | -- | -- |
| Government Obligations | 4,516 | -- | 4,516 | -- |
| Money Market Funds | 805,673 | 805,673 | -- | -- |
| Total Investments in Securities: | $11,048,215 | $6,763,135 | $4,251,749 | $33,331 |
| Derivative Instruments: | | | | |
| Assets | | | | |
| Futures Contracts | $16,840 | $16,840 | $-- | $-- |
| Total Assets | $16,840 | $16,840 | $-- | $-- |
| Total Derivative Instruments: | $16,840 | $16,840 | $-- | $-- |
The following is a summary of transfers between Level 1 and Level 2 for the period ended October 31, 2017. Transfers are assumed to have occurred at the beginning of the period, and are primarily attributable to the valuation techniques used for foreign equity securities, as discussed in the accompanying Notes to Financial Statements:
| Transfers | Total (000s) |
| Level 1 to Level 2 | $1,142,021 |
| Level 2 to Level 1 | $181,730 |
Value of Derivative Instruments
The following table is a summary of the Fund's value of derivative instruments by primary risk exposure as of October 31, 2017. For additional information on derivative instruments, please refer to the Derivative Instruments section in the accompanying Notes to Financial Statements.
| Primary Risk Exposure / Derivative Type | Value |
| | Asset | Liability |
| (Amounts in thousands) | | |
| Equity Risk | | |
| Futures Contracts(a) | $16,840 | $0 |
| Total Equity Risk | 16,840 | 0 |
| Total Value of Derivatives | $16,840 | $0 |
(a) Reflects gross cumulative appreciation (depreciation) on futures contracts as presented in the Schedule of Investments. In the Statement of Assets and Liabilities, the period end daily variation margin is included in receivable or payable for daily variation margin on futures contracts, and the net cumulative appreciation (depreciation) is included in net unrealized appreciation (depreciation).
See accompanying notes which are an integral part of the financial statements.
Financial Statements
Statement of Assets and Liabilities
| Amounts in thousands (except per-share amounts) | | October 31, 2017 |
| Assets | | |
Investment in securities, at value (including securities loaned of $394,457) — See accompanying schedule:
Unaffiliated issuers (cost $7,964,803) | $10,242,512 | |
| Fidelity Central Funds (cost $805,681) | 805,673 | |
| Other affiliated issuers (cost $3,941) | 30 | |
| Total Investment in Securities (cost $8,774,425) | | $11,048,215 |
| Foreign currency held at value (cost $10) | | 10 |
| Receivable for investments sold | | 12,605 |
| Receivable for fund shares sold | | 6,444 |
| Dividends receivable | | 26,726 |
| Distributions receivable from Fidelity Central Funds | | 696 |
| Prepaid expenses | | 23 |
| Other receivables | | 4,694 |
| Total assets | | 11,099,413 |
| Liabilities | | |
| Payable to custodian bank | $19 | |
| Payable for investments purchased | 11,110 | |
| Payable for fund shares redeemed | 11,664 | |
| Accrued management fee | 6,647 | |
| Distribution and service plan fees payable | 89 | |
| Payable for daily variation margin on futures contracts | 683 | |
| Other affiliated payables | 1,374 | |
| Other payables and accrued expenses | 966 | |
| Collateral on securities loaned | 417,599 | |
| Total liabilities | | 450,151 |
| Net Assets | | $10,649,262 |
| Net Assets consist of: | | |
| Paid in capital | | $7,869,998 |
| Undistributed net investment income | | 108,446 |
| Accumulated undistributed net realized gain (loss) on investments and foreign currency transactions | | 381,985 |
| Net unrealized appreciation (depreciation) on investments and assets and liabilities in foreign currencies | | 2,288,833 |
| Net Assets | | $10,649,262 |
| Calculation of Maximum Offering Price | | |
| Class A: | | |
| Net Asset Value and redemption price per share ($247,565 ÷ 5,306.0 shares) | | $46.66 |
| Maximum offering price per share (100/94.25 of $46.66) | | $49.51 |
| Class M: | | |
| Net Asset Value and redemption price per share ($34,856 ÷ 752.0 shares) | | $46.35 |
| Maximum offering price per share (100/96.50 of $46.35) | | $48.03 |
| Class C: | | |
| Net Asset Value and offering price per share ($28,404 ÷ 618.3 shares)(a) | | $45.94 |
| International Discovery: | | |
| Net Asset Value, offering price and redemption price per share ($7,350,693 ÷ 156,279.9 shares) | | $47.04 |
| Class K: | | |
| Net Asset Value, offering price and redemption price per share ($2,228,308 ÷ 47,456.1 shares) | | $46.96 |
| Class I: | | |
| Net Asset Value, offering price and redemption price per share ($658,324 ÷ 14,031.2 shares) | | $46.92 |
| Class Z: | | |
| Net Asset Value, offering price and redemption price per share ($101,112 ÷ 2,154.8 shares) | | $46.92 |
(a) Redemption price per share is equal to net asset value less any applicable contingent deferred sales charge.
See accompanying notes which are an integral part of the financial statements.
Statement of Operations
| Amounts in thousands | | Year ended October 31, 2017 |
| Investment Income | | |
| Dividends (including $975 earned from other affiliated issuers) | | $219,771 |
| Interest | | 20 |
| Income from Fidelity Central Funds | | 6,015 |
| Income before foreign taxes withheld | | 225,806 |
| Less foreign taxes withheld | | (19,098) |
| Total income | | 206,708 |
| Expenses | | |
| Management fee | | |
| Basic fee | $64,306 | |
| Performance adjustment | 6,041 | |
| Transfer agent fees | 14,185 | |
| Distribution and service plan fees | 1,008 | |
| Accounting and security lending fees | 1,784 | |
| Custodian fees and expenses | 1,428 | |
| Independent trustees' fees and expenses | 38 | |
| Registration fees | 173 | |
| Audit | 122 | |
| Legal | 48 | |
| Miscellaneous | 81 | |
| Total expenses before reductions | 89,214 | |
| Expense reductions | (1,429) | 87,785 |
| Net investment income (loss) | | 118,923 |
| Realized and Unrealized Gain (Loss) | | |
| Net realized gain (loss) on: | | |
| Investment securities: | | |
| Unaffiliated issuers | 1,016,110 | |
| Fidelity Central Funds | (12) | |
| Foreign currency transactions | (163) | |
| Futures contracts | 14,541 | |
| Total net realized gain (loss) | | 1,030,476 |
| Change in net unrealized appreciation (depreciation) on: | | |
| Investment securities: | | |
| Unaffiliated issuers | 1,087,126 | |
| Fidelity Central Funds | (36) | |
| Other affiliated issuers | 1,419 | |
| Assets and liabilities in foreign currencies | 858 | |
| Futures contracts | 13,054 | |
| Total change in net unrealized appreciation (depreciation) | | 1,102,421 |
| Net gain (loss) | | 2,132,897 |
| Net increase (decrease) in net assets resulting from operations | | $2,251,820 |
See accompanying notes which are an integral part of the financial statements.
Statement of Changes in Net Assets
| Amounts in thousands | Year ended October 31, 2017 | Year ended October 31, 2016 |
| Increase (Decrease) in Net Assets | | |
| Operations | | |
| Net investment income (loss) | $118,923 | $162,246 |
| Net realized gain (loss) | 1,030,476 | (541,847) |
| Change in net unrealized appreciation (depreciation) | 1,102,421 | (131,024) |
| Net increase (decrease) in net assets resulting from operations | 2,251,820 | (510,625) |
| Distributions to shareholders from net investment income | (150,174) | (113,434) |
| Distributions to shareholders from net realized gain | (11,939) | (1,362) |
| Total distributions | (162,113) | (114,796) |
| Share transactions - net increase (decrease) | (822,002) | (960,274) |
| Redemption fees | 9 | 70 |
| Total increase (decrease) in net assets | 1,267,714 | (1,585,625) |
| Net Assets | | |
| Beginning of period | 9,381,548 | 10,967,173 |
| End of period | $10,649,262 | $9,381,548 |
| Other Information | | |
| Undistributed net investment income end of period | $108,446 | $142,052 |
See accompanying notes which are an integral part of the financial statements.
Financial Highlights
Fidelity International Discovery Fund Class A
| Years ended October 31, | 2017 | 2016 | 2015 | 2014 | 2013 |
| Selected Per–Share Data | | | | | |
| Net asset value, beginning of period | $37.60 | $39.78 | $38.70 | $39.49 | $31.66 |
| Income from Investment Operations | | | | | |
| Net investment income (loss)A | .36 | .47B | .40C | .53D | .34 |
| Net realized and unrealized gain (loss) | 9.22 | (2.38) | .79 | (.67) | 7.97 |
| Total from investment operations | 9.58 | (1.91) | 1.19 | (.14) | 8.31 |
| Distributions from net investment income | (.47) | (.27) | (.11) | (.33) | (.45) |
| Distributions from net realized gain | (.05) | (.01) | – | (.31) | (.03) |
| Total distributions | (.52) | (.27)E | (.11) | (.65)F | (.48) |
| Redemption fees added to paid in capitalA,G | – | – | – | – | – |
| Net asset value, end of period | $46.66 | $37.60 | $39.78 | $38.70 | $39.49 |
| Total ReturnH,I | 25.87% | (4.83)% | 3.09% | (.36)% | 26.59% |
| Ratios to Average Net AssetsJ,K | | | | | |
| Expenses before reductions | 1.29% | 1.35% | 1.33% | 1.28% | 1.35% |
| Expenses net of fee waivers, if any | 1.29% | 1.35% | 1.33% | 1.28% | 1.35% |
| Expenses net of all reductions | 1.27% | 1.34% | 1.32% | 1.28% | 1.33% |
| Net investment income (loss) | .88% | 1.26%B | 1.00%C | 1.35%D | .97% |
| Supplemental Data | | | | | |
| Net assets, end of period (in millions) | $248 | $236 | $283 | $297 | $347 |
| Portfolio turnover rateL | 42% | 50%M | 60%M | 57% | 65% |
A Calculated based on average shares outstanding during the period.
B Net Investment income per share reflects a large, non-recurring dividend which amounted to $.14 per share. Excluding this non-recurring dividend, the ratio of net investment income (loss) to average net assets would have been .88%.
C Net Investment income per share reflects a large, non-recurring dividend which amounted to $.12 per share. Excluding this non-recurring dividend, the ratio of net investment income (loss) to average net assets would have been .69%.
D Net Investment income per share reflects a large, non-recurring dividend which amounted to $.22 per share. Excluding this non-recurring dividend, the ratio of net investment income (loss) to average net assets would have been .80%.
E Total distributions of $.27 per share is comprised of distributions from net investment income of $.269 and distributions from net realized gain of $.005 per share.
F Total distributions of $.65 per share is comprised of distributions from net investment income of $.334 and distributions from net realized gain of $.311 per share.
G Amount represents less than $.005 per share.
H Total returns would have been lower if certain expenses had not been reduced during the applicable periods shown.
I Total returns do not include the effect of the sales charges.
J Fees and expenses of any underlying Fidelity Central Funds are not included in the Fund's expense ratio. The Fund indirectly bears its proportionate share of the expenses of any underlying Fidelity Central Funds.
K Expense ratios reflect operating expenses of the class. Expenses before reductions do not reflect amounts reimbursed by the investment adviser or reductions from brokerage service arrangements or reductions from other expense offset arrangements and do not represent the amount paid by the class during periods when reimbursements or reductions occur. Expenses net of fee waivers reflect expenses after reimbursement by the investment adviser but prior to reductions from brokerage service arrangements or other expense offset arrangements. Expenses net of all reductions represent the net expenses paid by the class.
L Amount does not include the portfolio activity of any underlying Fidelity Central Funds.
M Portfolio turnover rate excludes securities received or delivered in-kind.
See accompanying notes which are an integral part of the financial statements.
Fidelity International Discovery Fund Class M
| Years ended October 31, | 2017 | 2016 | 2015 | 2014 | 2013 |
| Selected Per–Share Data | | | | | |
| Net asset value, beginning of period | $37.34 | $39.51 | $38.43 | $39.23 | $31.42 |
| Income from Investment Operations | | | | | |
| Net investment income (loss)A | .26 | .38B | .30C | .44D | .26 |
| Net realized and unrealized gain (loss) | 9.17 | (2.37) | .80 | (.68) | 7.92 |
| Total from investment operations | 9.43 | (1.99) | 1.10 | (.24) | 8.18 |
| Distributions from net investment income | (.37) | (.17) | (.02) | (.25) | (.34) |
| Distributions from net realized gain | (.05) | (.01) | – | (.31) | (.03) |
| Total distributions | (.42) | (.18) | (.02) | (.56) | (.37) |
| Redemption fees added to paid in capitalA,E | – | – | – | – | – |
| Net asset value, end of period | $46.35 | $37.34 | $39.51 | $38.43 | $39.23 |
| Total ReturnF,G | 25.57% | (5.07)% | 2.86% | (.60)% | 26.31% |
| Ratios to Average Net AssetsH,I | | | | | |
| Expenses before reductions | 1.53% | 1.58% | 1.57% | 1.51% | 1.59% |
| Expenses net of fee waivers, if any | 1.52% | 1.58% | 1.57% | 1.51% | 1.59% |
| Expenses net of all reductions | 1.51% | 1.57% | 1.56% | 1.51% | 1.57% |
| Net investment income (loss) | .64% | 1.02%B | .76%C | 1.11%D | .73% |
| Supplemental Data | | | | | |
| Net assets, end of period (in millions) | $35 | $35 | $43 | $49 | $53 |
| Portfolio turnover rateJ | 42% | 50%K | 60%K | 57% | 65% |
A Calculated based on average shares outstanding during the period.
B Net Investment income per share reflects a large, non-recurring dividend which amounted to $.14 per share. Excluding this non-recurring dividend, the ratio of net investment income (loss) to average net assets would have been .64%.
C Net Investment income per share reflects a large, non-recurring dividend which amounted to $.12 per share. Excluding this non-recurring dividend, the ratio of net investment income (loss) to average net assets would have been .45%.
D Net Investment income per share reflects a large, non-recurring dividend which amounted to $.21 per share. Excluding this non-recurring dividend, the ratio of net investment income (loss) to average net assets would have been .56%.
E Amount represents less than $.005 per share.
F Total returns would have been lower if certain expenses had not been reduced during the applicable periods shown.
G Total returns do not include the effect of the sales charges.
H Fees and expenses of any underlying Fidelity Central Funds are not included in the Fund's expense ratio. The Fund indirectly bears its proportionate share of the expenses of any underlying Fidelity Central Funds.
I Expense ratios reflect operating expenses of the class. Expenses before reductions do not reflect amounts reimbursed by the investment adviser or reductions from brokerage service arrangements or reductions from other expense offset arrangements and do not represent the amount paid by the class during periods when reimbursements or reductions occur. Expenses net of fee waivers reflect expenses after reimbursement by the investment adviser but prior to reductions from brokerage service arrangements or other expense offset arrangements. Expenses net of all reductions represent the net expenses paid by the class.
J Amount does not include the portfolio activity of any underlying Fidelity Central Funds.
K Portfolio turnover rate excludes securities received or delivered in-kind.
See accompanying notes which are an integral part of the financial statements.
Fidelity International Discovery Fund Class C
| Years ended October 31, | 2017 | 2016 | 2015 | 2014 | 2013 |
| Selected Per–Share Data | | | | | |
| Net asset value, beginning of period | $36.96 | $39.14 | $38.25 | $39.07 | $31.32 |
| Income from Investment Operations | | | | | |
| Net investment income (loss)A | .04 | .19B | .10C | .23D | .08 |
| Net realized and unrealized gain (loss) | 9.12 | (2.37) | .79 | (.66) | 7.90 |
| Total from investment operations | 9.16 | (2.18) | .89 | (.43) | 7.98 |
| Distributions from net investment income | (.13) | – | – | (.08) | (.20) |
| Distributions from net realized gain | (.05) | – | – | (.31) | (.03) |
| Total distributions | (.18) | – | – | (.39) | (.23) |
| Redemption fees added to paid in capitalA,E | – | – | – | – | – |
| Net asset value, end of period | $45.94 | $36.96 | $39.14 | $38.25 | $39.07 |
| Total ReturnF,G | 24.93% | (5.57)% | 2.33% | (1.10)% | 25.65% |
| Ratios to Average Net AssetsH,I | | | | | |
| Expenses before reductions | 2.05% | 2.10% | 2.09% | 2.03% | 2.10% |
| Expenses net of fee waivers, if any | 2.05% | 2.10% | 2.09% | 2.03% | 2.09% |
| Expenses net of all reductions | 2.04% | 2.09% | 2.08% | 2.02% | 2.07% |
| Net investment income (loss) | .11% | .50%B | .24%C | .60%D | .23% |
| Supplemental Data | | | | | |
| Net assets, end of period (in millions) | $28 | $26 | $32 | $35 | $36 |
| Portfolio turnover rateJ | 42% | 50%K | 60%K | 57% | 65% |
A Calculated based on average shares outstanding during the period.
B Net Investment income per share reflects a large, non-recurring dividend which amounted to $.14 per share. Excluding this non-recurring dividend, the ratio of net investment income (loss) to average net assets would have been .13%.
C Net Investment income per share reflects a large, non-recurring dividend which amounted to $.12 per share. Excluding this non-recurring dividend, the ratio of net investment income (loss) to average net assets would have been (.06) %.
D Net Investment income per share reflects a large, non-recurring dividend which amounted to $.21 per share. Excluding this non-recurring dividend, the ratio of net investment income (loss) to average net assets would have been .05%.
E Amount represents less than $.005 per share.
F Total returns would have been lower if certain expenses had not been reduced during the applicable periods shown.
G Total returns do not include the effect of the contingent deferred sales charge.
H Fees and expenses of any underlying Fidelity Central Funds are not included in the Fund's expense ratio. The Fund indirectly bears its proportionate share of the expenses of any underlying Fidelity Central Funds.
I Expense ratios reflect operating expenses of the class. Expenses before reductions do not reflect amounts reimbursed by the investment adviser or reductions from brokerage service arrangements or reductions from other expense offset arrangements and do not represent the amount paid by the class during periods when reimbursements or reductions occur. Expenses net of fee waivers reflect expenses after reimbursement by the investment adviser but prior to reductions from brokerage service arrangements or other expense offset arrangements. Expenses net of all reductions represent the net expenses paid by the class.
J Amount does not include the portfolio activity of any underlying Fidelity Central Funds.
K Portfolio turnover rate excludes securities received or delivered in-kind.
See accompanying notes which are an integral part of the financial statements.
Fidelity International Discovery Fund
| Years ended October 31, | 2017 | 2016 | 2015 | 2014 | 2013 |
| Selected Per–Share Data | | | | | |
| Net asset value, beginning of period | $37.91 | $40.12 | $39.03 | $39.82 | $31.91 |
| Income from Investment Operations | | | | | |
| Net investment income (loss)A | .50 | .61B | .54C | .67D | .47 |
| Net realized and unrealized gain (loss) | 9.29 | (2.41) | .81 | (.68) | 8.02 |
| Total from investment operations | 9.79 | (1.80) | 1.35 | (.01) | 8.49 |
| Distributions from net investment income | (.61) | (.41) | (.26) | (.47) | (.55) |
| Distributions from net realized gain | (.05) | (.01) | – | (.31) | (.03) |
| Total distributions | (.66) | (.41)E | (.26) | (.78) | (.58) |
| Redemption fees added to paid in capitalA,F | – | – | – | – | – |
| Net asset value, end of period | $47.04 | $37.91 | $40.12 | $39.03 | $39.82 |
| Total ReturnG | 26.33% | (4.53)% | 3.47% | (.01)% | 27.03% |
| Ratios to Average Net AssetsH,I | | | | | |
| Expenses before reductions | .94% | 1.00% | .99% | .93% | 1.00% |
| Expenses net of fee waivers, if any | .94% | 1.00% | .99% | .93% | 1.00% |
| Expenses net of all reductions | .92% | .99% | .98% | .93% | .98% |
| Net investment income (loss) | 1.22% | 1.61%B | 1.34%C | 1.69%D | 1.32% |
| Supplemental Data | | | | | |
| Net assets, end of period (in millions) | $7,351 | $6,421 | $7,209 | $7,464 | $7,800 |
| Portfolio turnover rateJ | 42% | 50%K | 60%K | 57% | 65% |
A Calculated based on average shares outstanding during the period.
B Net Investment income per share reflects a large, non-recurring dividend which amounted to $.14 per share. Excluding this non-recurring dividend, the ratio of net investment income (loss) to average net assets would have been 1.23%.
C Net Investment income per share reflects a large, non-recurring dividend which amounted to $.12 per share. Excluding this non-recurring dividend, the ratio of net investment income (loss) to average net assets would have been 1.03%.
D Net Investment income per share reflects a large, non-recurring dividend which amounted to $.22 per share. Excluding this non-recurring dividend, the ratio of net investment income (loss) to average net assets would have been 1.15%.
E Total distributions of $.41 per share is comprised of distributions from net investment income of $.409 and distributions from net realized gain of $.005 per share.
F Amount represents less than $.005 per share.
G Total returns would have been lower if certain expenses had not been reduced during the applicable periods shown.
H Fees and expenses of any underlying Fidelity Central Funds are not included in the Fund's expense ratio. The Fund indirectly bears its proportionate share of the expenses of any underlying Fidelity Central Funds.
I Expense ratios reflect operating expenses of the class. Expenses before reductions do not reflect amounts reimbursed by the investment adviser or reductions from brokerage service arrangements or reductions from other expense offset arrangements and do not represent the amount paid by the class during periods when reimbursements or reductions occur. Expenses net of fee waivers reflect expenses after reimbursement by the investment adviser but prior to reductions from brokerage service arrangements or other expense offset arrangements. Expenses net of all reductions represent the net expenses paid by the class.
J Amount does not include the portfolio activity of any underlying Fidelity Central Funds.
K Portfolio turnover rate excludes securities received or delivered in-kind.
See accompanying notes which are an integral part of the financial statements.
Fidelity International Discovery Fund Class K
| Years ended October 31, | 2017 | 2016 | 2015 | 2014 | 2013 |
| Selected Per–Share Data | | | | | |
| Net asset value, beginning of period | $37.86 | $40.06 | $38.97 | $39.76 | $31.87 |
| Income from Investment Operations | | | | | |
| Net investment income (loss)A | .55 | .66B | .59C | .72D | .52 |
| Net realized and unrealized gain (loss) | 9.26 | (2.39) | .81 | (.67) | 8.01 |
| Total from investment operations | 9.81 | (1.73) | 1.40 | .05 | 8.53 |
| Distributions from net investment income | (.66) | (.46) | (.31) | (.53) | (.61) |
| Distributions from net realized gain | (.05) | (.01) | – | (.31) | (.03) |
| Total distributions | (.71) | (.47) | (.31) | (.84) | (.64) |
| Redemption fees added to paid in capitalA,E | – | – | – | – | – |
| Net asset value, end of period | $46.96 | $37.86 | $40.06 | $38.97 | $39.76 |
| Total ReturnF | 26.47% | (4.38)% | 3.61% | .13% | 27.23% |
| Ratios to Average Net AssetsG,H | | | | | |
| Expenses before reductions | .82% | .86% | .86% | .80% | .85% |
| Expenses net of fee waivers, if any | .82% | .86% | .86% | .80% | .85% |
| Expenses net of all reductions | .80% | .85% | .85% | .79% | .83% |
| Net investment income (loss) | 1.35% | 1.74%B | 1.47%C | 1.83%D | 1.47% |
| Supplemental Data | | | | | |
| Net assets, end of period (in millions) | $2,228 | $1,880 | $2,308 | $2,464 | $2,576 |
| Portfolio turnover rateI | 42% | 50%J | 60%J | 57% | 65% |
A Calculated based on average shares outstanding during the period.
B Net Investment income per share reflects a large, non-recurring dividend which amounted to $.14 per share. Excluding this non-recurring dividend, the ratio of net investment income (loss) to average net assets would have been 1.36%.
C Net Investment income per share reflects a large, non-recurring dividend which amounted to $.12 per share. Excluding this non-recurring dividend, the ratio of net investment income (loss) to average net assets would have been 1.16%.
D Net Investment income per share reflects a large, non-recurring dividend which amounted to $.22 per share. Excluding this non-recurring dividend, the ratio of net investment income (loss) to average net assets would have been 1.28%.
E Amount represents less than $.005 per share.
F Total returns would have been lower if certain expenses had not been reduced during the applicable periods shown.
G Fees and expenses of any underlying Fidelity Central Funds are not included in the Fund's expense ratio. The Fund indirectly bears its proportionate share of the expenses of any underlying Fidelity Central Funds.
H Expense ratios reflect operating expenses of the class. Expenses before reductions do not reflect amounts reimbursed by the investment adviser or reductions from brokerage service arrangements or reductions from other expense offset arrangements and do not represent the amount paid by the class during periods when reimbursements or reductions occur. Expenses net of fee waivers reflect expenses after reimbursement by the investment adviser but prior to reductions from brokerage service arrangements or other expense offset arrangements. Expenses net of all reductions represent the net expenses paid by the class.
I Amount does not include the portfolio activity of any underlying Fidelity Central Funds.
J Portfolio turnover rate excludes securities received or delivered in-kind.
See accompanying notes which are an integral part of the financial statements.
Fidelity International Discovery Fund Class I
| Years ended October 31, | 2017 | 2016 | 2015 | 2014 | 2013 |
| Selected Per–Share Data | | | | | |
| Net asset value, beginning of period | $37.82 | $40.03 | $38.96 | $39.76 | $31.87 |
| Income from Investment Operations | | | | | |
| Net investment income (loss)A | .49 | .61B | .53C | .67D | .47 |
| Net realized and unrealized gain (loss) | 9.27 | (2.40) | .80 | (.68) | 8.01 |
| Total from investment operations | 9.76 | (1.79) | 1.33 | (.01) | 8.48 |
| Distributions from net investment income | (.61) | (.42) | (.26) | (.48) | (.56) |
| Distributions from net realized gain | (.05) | (.01) | – | (.31) | (.03) |
| Total distributions | (.66) | (.42)E | (.26) | (.79) | (.59) |
| Redemption fees added to paid in capitalA,F | – | – | – | – | – |
| Net asset value, end of period | $46.92 | $37.82 | $40.03 | $38.96 | $39.76 |
| Total ReturnG | 26.29% | (4.52)% | 3.44% | (.01)% | 27.03% |
| Ratios to Average Net AssetsH,I | | | | | |
| Expenses before reductions | .96% | 1.00% | 1.00% | .93% | 1.00% |
| Expenses net of fee waivers, if any | .96% | 1.00% | .99% | .93% | 1.00% |
| Expenses net of all reductions | .94% | .99% | .98% | .93% | .97% |
| Net investment income (loss) | 1.21% | 1.60%B | 1.33%C | 1.69%D | 1.33% |
| Supplemental Data | | | | | |
| Net assets, end of period (in millions) | $658 | $745 | $1,061 | $650 | $476 |
| Portfolio turnover rateJ | 42% | 50%K | 60%K | 57% | 65% |
A Calculated based on average shares outstanding during the period.
B Net Investment income per share reflects a large, non-recurring dividend which amounted to $.14 per share. Excluding this non-recurring dividend, the ratio of net investment income (loss) to average net assets would have been 1.22%.
C Net Investment income per share reflects a large, non-recurring dividend which amounted to $.12 per share. Excluding this non-recurring dividend, the ratio of net investment income (loss) to average net assets would have been 1.03%.
D Net Investment income per share reflects a large, non-recurring dividend which amounted to $.22 per share. Excluding this non-recurring dividend, the ratio of net investment income (loss) to average net assets would have been 1.14%.
E Total distributions of $.42 per share is comprised of distributions from net investment income of $.418 and distributions from net realized gain of $.005 per share.
F Amount represents less than $.005 per share.
G Total returns would have been lower if certain expenses had not been reduced during the applicable periods shown.
H Fees and expenses of any underlying Fidelity Central Funds are not included in the Fund's expense ratio. The Fund indirectly bears its proportionate share of the expenses of any underlying Fidelity Central Funds.
I Expense ratios reflect operating expenses of the class. Expenses before reductions do not reflect amounts reimbursed by the investment adviser or reductions from brokerage service arrangements or reductions from other expense offset arrangements and do not represent the amount paid by the class during periods when reimbursements or reductions occur. Expenses net of fee waivers reflect expenses after reimbursement by the investment adviser but prior to reductions from brokerage service arrangements or other expense offset arrangements. Expenses net of all reductions represent the net expenses paid by the class.
J Amount does not include the portfolio activity of any underlying Fidelity Central Funds.
K Portfolio turnover rate excludes securities received or delivered in-kind.
See accompanying notes which are an integral part of the financial statements.
Fidelity International Discovery Fund Class Z
| Years ended October 31, | 2017 | 2016 | 2015 | 2014 | 2013 A |
| Selected Per–Share Data | | | | | |
| Net asset value, beginning of period | $37.84 | $40.03 | $38.96 | $39.77 | $37.22 |
| Income from Investment Operations | | | | | |
| Net investment income (loss)B | .56 | .66C | .59D | .72E | .07 |
| Net realized and unrealized gain (loss) | 9.24 | (2.38) | .80 | (.68) | 2.48 |
| Total from investment operations | 9.80 | (1.72) | 1.39 | .04 | 2.55 |
| Distributions from net investment income | (.67) | (.46) | (.32) | (.54) | – |
| Distributions from net realized gain | (.05) | (.01) | – | (.31) | – |
| Total distributions | (.72) | (.47) | (.32) | (.85) | – |
| Redemption fees added to paid in capitalB,F | – | – | – | – | – |
| Net asset value, end of period | $46.92 | $37.84 | $40.03 | $38.96 | $39.77 |
| Total ReturnG,H | 26.44% | (4.36)% | 3.58% | .12% | 6.85% |
| Ratios to Average Net AssetsI,J | | | | | |
| Expenses before reductions | .82% | .86% | .86% | .80% | .85%K |
| Expenses net of fee waivers, if any | .82% | .86% | .86% | .80% | .85%K |
| Expenses net of all reductions | .80% | .85% | .85% | .79% | .83%K |
| Net investment income (loss) | 1.35% | 1.74%C | 1.47%D | 1.83%E | .76%K |
| Supplemental Data | | | | | |
| Net assets, end of period (in millions) | $101 | $38 | $30 | $35 | $– |
| Portfolio turnover rateL | 42% | 50%M | 60%M | 57% | 65% |
A For the period August 13, 2013 (commencement of sale of shares) to October 31, 2013.
B Calculated based on average shares outstanding during the period.
C Net Investment income per share reflects a large, non-recurring dividend which amounted to $.14 per share. Excluding this non-recurring dividend, the ratio of net investment income (loss) to average net assets would have been 1.36%.
D Net Investment income per share reflects a large, non-recurring dividend which amounted to $.12 per share. Excluding this non-recurring dividend, the ratio of net investment income (loss) to average net assets would have been 1.16%.
E Net Investment income per share reflects a large, non-recurring dividend which amounted to $.21 per share. Excluding this non-recurring dividend, the ratio of net investment income (loss) to average net assets would have been 1.28%.
F Amount represents less than $.005 per share.
G Total returns for periods of less than one year are not annualized.
H Total returns would have been lower if certain expenses had not been reduced during the applicable periods shown.
I Fees and expenses of any underlying Fidelity Central Funds are not included in the Fund's expense ratio. The Fund indirectly bears its proportionate share of the expenses of any underlying Fidelity Central Funds.
J Expense ratios reflect operating expenses of the class. Expenses before reductions do not reflect amounts reimbursed by the investment adviser or reductions from brokerage service arrangements or reductions from other expense offset arrangements and do not represent the amount paid by the class during periods when reimbursements or reductions occur. Expense ratios before reductions for start-up periods may not be representative of longer-term operating periods. Expenses net of fee waivers reflect expenses after reimbursement by the investment adviser but prior to reductions from brokerage service arrangements or other expense offset arrangements. Expenses net of all reductions represent the net expenses paid by the class.
K Annualized
L Amount does not include the portfolio activity of any underlying Fidelity Central Funds.
M Portfolio turnover rate excludes securities received or delivered in-kind.
See accompanying notes which are an integral part of the financial statements.
Notes to Financial Statements
For the period ended October 31, 2017
(Amounts in thousands except percentages)
1. Organization.
Fidelity International Discovery Fund (the Fund) is a fund of Fidelity Investment Trust (the Trust) and is authorized to issue an unlimited number of shares. The Trust is registered under the Investment Company Act of 1940, as amended (the 1940 Act), as an open-end management investment company organized as a Massachusetts business trust. The Fund offers Class A, Class M (formerly Class T), Class C, International Discovery, Class K, Class I and Class Z shares, each of which has equal rights as to assets and voting privileges. Each class has exclusive voting rights with respect to matters that affect that class.
After the close of business on June 24, 2016, all outstanding Class B shares were converted to Class A shares. All prior fiscal period dollar and share amounts for Class B presented in the Notes to Financial Statements are for the period November 1, 2015 through June 24, 2016.
2. Investments in Fidelity Central Funds.
The Fund invests in Fidelity Central Funds, which are open-end investment companies generally available only to other investment companies and accounts managed by the investment adviser and its affiliates. The Fund's Schedule of Investments lists each of the Fidelity Central Funds held as of period end, if any, as an investment of the Fund, but does not include the underlying holdings of each Fidelity Central Fund. As an Investing Fund, the Fund indirectly bears its proportionate share of the expenses of the underlying Fidelity Central Funds.
The Money Market Central Funds seek preservation of capital and current income and are managed by Fidelity Investments Money Management, Inc. (FIMM), an affiliate of the investment adviser. Annualized expenses of the Money Market Central Funds as of their most recent shareholder report date are less than .005%.
A complete unaudited list of holdings for each Fidelity Central Fund is available upon request or at the Securities and Exchange Commission (the SEC) website at www.sec.gov. In addition, the financial statements of the Fidelity Central Funds, which are not covered by the Fund's Report of Independent Registered Public Accounting Firm, are available on the SEC website or upon request.
3. Significant Accounting Policies.
The Fund is an investment company and applies the accounting and reporting guidance of the Financial Accounting Standards Board (FASB) Accounting Standards Codification Topic 946 Financial Services – Investments Companies. The financial statements have been prepared in conformity with accounting principles generally accepted in the United States of America (GAAP), which require management to make certain estimates and assumptions at the date of the financial statements. Actual results could differ from those estimates. Subsequent events, if any, through the date that the financial statements were issued have been evaluated in the preparation of the financial statements. The following summarizes the significant accounting policies of the Fund:
Investment Valuation. Investments are valued as of 4:00 p.m. Eastern time on the last calendar day of the period. The Board of Trustees (the Board) has delegated the day to day responsibility for the valuation of the Fund's investments to the Fair Value Committee (the Committee) established by the Fund's investment adviser. In accordance with valuation policies and procedures approved by the Board, the Fund attempts to obtain prices from one or more third party pricing vendors or brokers to value its investments. When current market prices, quotations or currency exchange rates are not readily available or reliable, investments will be fair valued in good faith by the Committee, in accordance with procedures adopted by the Board. Factors used in determining fair value vary by investment type and may include market or investment specific events, changes in interest rates and credit quality. The frequency with which these procedures are used cannot be predicted and they may be utilized to a significant extent. The Committee oversees the Fund's valuation policies and procedures and reports to the Board on the Committee's activities and fair value determinations. The Board monitors the appropriateness of the procedures used in valuing the Fund's investments and ratifies the fair value determinations of the Committee.
The Fund categorizes the inputs to valuation techniques used to value its investments into a disclosure hierarchy consisting of three levels as shown below:
- Level 1 – quoted prices in active markets for identical investments
- Level 2 – other significant observable inputs (including quoted prices for similar investments, interest rates, prepayment speeds, etc.)
- Level 3 – unobservable inputs (including the Fund's own assumptions based on the best information available)
Valuation techniques used to value the Fund's investments by major category are as follows:
Equity securities, including restricted securities, for which market quotations are readily available, are valued at the last reported sale price or official closing price as reported by a third party pricing vendor on the primary market or exchange on which they are traded and are categorized as Level 1 in the hierarchy. In the event there were no sales during the day or closing prices are not available, securities are valued at the last quoted bid price or may be valued using the last available price and are generally categorized as Level 2 in the hierarchy. For foreign equity securities, when market or security specific events arise, comparisons to the valuation of American Depositary Receipts (ADRs), futures contracts, Exchange-Traded Funds (ETFs) and certain indexes as well as quoted prices for similar securities may be used and would be categorized as Level 2 in the hierarchy. Utilizing these techniques may result in transfers between Level 1 and Level 2. For equity securities, including restricted securities, where observable inputs are limited, assumptions about market activity and risk are used and these securities may be categorized as Level 3 in the hierarchy.
Debt securities, including restricted securities, are valued based on evaluated prices received from third party pricing vendors or from brokers who make markets in such securities. U.S. government and government agency obligations are valued by pricing vendors who utilize matrix pricing which considers yield or price of bonds of comparable quality, coupon, maturity and type or by broker-supplied prices. When independent prices are unavailable or unreliable, debt securities may be valued utilizing pricing methodologies which consider similar factors that would be used by third party pricing vendors. Debt securities are generally categorized as Level 2 in the hierarchy but may be Level 3 depending on the circumstances.
Futures contracts are valued at the settlement price established each day by the board of trade or exchange on which they are traded and are categorized as Level 1 in the hierarchy. Investments in open-end mutual funds, including the Fidelity Central Funds, are valued at their closing net asset value (NAV) each business day and are categorized as Level 1 in the hierarchy.
Changes in valuation techniques may result in transfers in or out of an assigned level within the disclosure hierarchy. The aggregate value of investments by input level as of October 31, 2017, including information on transfers between Levels 1 and 2, is included at the end of the Fund's Schedule of Investments.
Foreign Currency. The Fund may use foreign currency contracts to facilitate transactions in foreign-denominated securities. Gains and losses from these transactions may arise from changes in the value of the foreign currency or if the counterparties do not perform under the contracts' terms.
Foreign-denominated assets, including investment securities, and liabilities are translated into U.S. dollars at the exchange rates at period end. Purchases and sales of investment securities, income and dividends received and expenses denominated in foreign currencies are translated into U.S. dollars at the exchange rate in effect on the transaction date.
The effects of exchange rate fluctuations on investments are included with the net realized and unrealized gain (loss) on investment securities. Other foreign currency transactions resulting in realized and unrealized gain (loss) are disclosed separately.
Investment Transactions and Income. For financial reporting purposes, the Fund's investment holdings and NAV include trades executed through the end of the last business day of the period. The NAV per share for processing shareholder transactions is calculated as of the close of business of the New York Stock Exchange (NYSE), normally 4:00 p.m. Eastern time and includes trades executed through the end of the prior business day. Gains and losses on securities sold are determined on the basis of identified cost and proceeds received from litigation. Dividend income is recorded on the ex-dividend date, except for certain dividends from foreign securities where the ex-dividend date may have passed, which are recorded as soon as the Fund is informed of the ex-dividend date. Non-cash dividends included in dividend income, if any, are recorded at the fair market value of the securities received. Income and capital gain distributions from Fidelity Central Funds, if any, are recorded on the ex-dividend date. Certain distributions received by the Fund represent a return of capital or capital gain. The Fund determines the components of these distributions subsequent to the ex-dividend date, based upon receipt of tax filings or other correspondence relating to the underlying investment. These distributions are recorded as a reduction of cost of investments and/or as a realized gain. Interest income is accrued as earned and includes coupon interest and amortization of premium and accretion of discount on debt securities as applicable. Investment income is recorded net of foreign taxes withheld where recovery of such taxes is uncertain.
Class Allocations and Expenses. Investment income, realized and unrealized capital gains and losses, common expenses of the Fund, and certain fund-level expense reductions, if any, are allocated daily on a pro-rata basis to each class based on the relative net assets of each class to the total net assets of the Fund. Each class differs with respect to transfer agent and distribution and service plan fees incurred. Certain expense reductions may also differ by class. For the reporting period, the allocated portion of income and expenses to each class as a percent of its average net assets may vary due to the timing of recording these transactions in relation to fluctuating net assets of the classes. Expenses directly attributable to a fund are charged to that fund. Expenses attributable to more than one fund are allocated among the respective funds on the basis of relative net assets or other appropriate methods. Expense estimates are accrued in the period to which they relate and adjustments are made when actual amounts are known.
Deferred Trustee Compensation. Under a Deferred Compensation Plan (the Plan), independent Trustees may elect to defer receipt of a portion of their annual compensation. Deferred amounts are invested in a cross-section of Fidelity funds, are marked-to-market and remain in the Fund until distributed in accordance with the Plan. The investment of deferred amounts and the offsetting payable to the Trustees are included in the accompanying Statement of Assets and Liabilities.
Income Tax Information and Distributions to Shareholders. Each year, the Fund intends to qualify as a regulated investment company under Subchapter M of the Internal Revenue Code, including distributing substantially all of its taxable income and realized gains. As a result, no provision for U.S. Federal income taxes is required. As of October 31, 2017, the Fund did not have any unrecognized tax benefits in the financial statements; nor is the Fund aware of any tax positions for which it is reasonably possible that the total amounts of unrecognized tax benefits will significantly change in the next twelve months. The Fund files a U.S. federal tax return, in addition to state and local tax returns as required. The Fund's federal income tax returns are subject to examination by the Internal Revenue Service (IRS) for a period of three fiscal years after they are filed. State and local tax returns may be subject to examination for an additional fiscal year depending on the jurisdiction. Foreign taxes are provided for based on the Fund's understanding of the tax rules and rates that exist in the foreign markets in which it invests.
Distributions are declared and recorded on the ex-dividend date. Income dividends and capital gain distributions are declared separately for each class. Income and capital gain distributions are determined in accordance with income tax regulations, which may differ from GAAP. In addition, the Fund claimed a portion of the payment made to redeeming shareholders as a distribution for income tax purposes.
Capital accounts within the financial statements are adjusted for permanent book-tax differences. These adjustments have no impact on net assets or the results of operations. Capital accounts are not adjusted for temporary book-tax differences which will reverse in a subsequent period.
Book-tax differences are primarily due to foreign currency transactions, passive foreign investment companies (PFIC), market discount, deferred trustees compensation and losses deferred due to wash sales.
As of period end, the cost and unrealized appreciation (depreciation) in securities, and derivatives if applicable, for federal income tax purposes were as follows:
| Gross unrealized appreciation | $2,412,009 |
| Gross unrealized depreciation | (158,816) |
| Net unrealized appreciation (depreciation) | $2,253,193 |
| Tax Cost | $8,811,862 |
The tax-based components of distributable earnings as of period end were as follows:
| Undistributed ordinary income | $115,404 |
| Undistributed long-term capital gain | $412,934 |
| Net unrealized appreciation (depreciation) on securities and other investments | $2,251,367 |
The tax character of distributions paid was as follows:
| | October 31, 2017 | October 31, 2016 |
| Ordinary Income | $162,113 | $ 114,796 |
Short-Term Trading (Redemption) Fees. Shares held by investors in the Fund less than 30 days may have been subject to a redemption fee equal to 1.00% of the NAV of shares redeemed. All redemption fees, which reduce the proceeds of the shareholder redemption, are retained by the Fund and accounted for as an addition to paid in capital. In November 2016, the Board of Trustees approved the elimination of these redemption fees effective December 12, 2016.
Restricted Securities. The Fund may invest in securities that are subject to legal or contractual restrictions on resale. These securities generally may be resold in transactions exempt from registration or to the public if the securities are registered. Disposal of these securities may involve time-consuming negotiations and expense, and prompt sale at an acceptable price may be difficult. Information regarding restricted securities is included at the end of the Fund's Schedule of Investments.
4. Derivative Instruments.
Risk Exposures and the Use of Derivative Instruments. The Fund's investment objective allows the Fund to enter into various types of derivative contracts, including futures contracts. Derivatives are investments whose value is primarily derived from underlying assets, indices or reference rates and may be transacted on an exchange or over-the-counter (OTC). Derivatives may involve a future commitment to buy or sell a specified asset based on specified terms, to exchange future cash flows at periodic intervals based on a notional principal amount, or for one party to make one or more payments upon the occurrence of specified events in exchange for periodic payments from the other party.
The Fund used derivatives to increase returns and to manage exposure to certain risks as defined below. The success of any strategy involving derivatives depends on analysis of numerous economic factors, and if the strategies for investment do not work as intended, the Fund may not achieve its objectives.
The Fund's use of derivatives increased or decreased its exposure to the following risk:
| Equity Risk | Equity risk relates to the fluctuations in the value of financial instruments as a result of changes in market prices (other than those arising from interest rate risk or foreign exchange risk), whether caused by factors specific to an individual investment, its issuer, or all factors affecting all instruments traded in a market or market segment.
|
The Fund is also exposed to additional risks from investing in derivatives, such as liquidity risk and counterparty credit risk. Liquidity risk is the risk that the Fund will be unable to close out the derivative in the open market in a timely manner. Counterparty credit risk is the risk that the counterparty will not be able to fulfill its obligation to the Fund. Counterparty credit risk related to exchange-traded futures contracts may be mitigated by the protection provided by the exchange on which they trade.
Investing in derivatives may involve greater risks than investing in the underlying assets directly and, to varying degrees, may involve risk of loss in excess of any initial investment and collateral received and amounts recognized in the Statement of Assets and Liabilities. In addition, there may be the risk that the change in value of the derivative contract does not correspond to the change in value of the underlying instrument.
Futures Contracts. A futures contract is an agreement between two parties to buy or sell a specified underlying instrument for a fixed price at a specified future date. The Fund used futures contracts to manage its exposure to the stock market.
Upon entering into a futures contract, a fund is required to deposit either cash or securities (initial margin) with a clearing broker in an amount equal to a certain percentage of the face value of the contract. Futures contracts are marked-to-market daily and subsequent daily payments (variation margin) are made or received by a fund depending on the daily fluctuations in the value of the futures contracts and are recorded as unrealized appreciation or (depreciation). This receivable and/or payable, if any, is included in daily variation margin on futures contracts in the Statement of Assets and Liabilities. Realized gain or (loss) is recorded upon the expiration or closing of a futures contract. The net realized gain (loss) and change in net unrealized appreciation (depreciation) on futures contracts during the period is presented in the Statement of Operations.
Any open futures contracts at period end are presented in the Schedule of Investments under the caption "Futures Contracts". The notional amount at value reflects each contract's exposure to the underlying instrument or index at period end and is representative of volume of activity during the period. Securities deposited to meet initial margin requirements are identified in the Schedule of Investments.
5. Purchases and Sales of Investments.
Purchases and sales of securities, other than short-term securities, aggregated $3,991,057 and $5,033,189, respectively.
Prior Fiscal Year Redemptions In-Kind. During the prior period, 1,487 shares of the Fund held by an unaffiliated entity were redeemed for investments and cash with a value of $55,670. The Fund had a net gain of $10,064 on investments delivered through the in-kind redemptions. The amount of the redemptions is included in share transactions activity shown in the accompanying Statement of Changes in Net Assets as well as the Notes to Financial Statements. The Fund recognized no gain or loss for federal income tax purposes.
6. Fees and Other Transactions with Affiliates.
Management Fee. Fidelity Management & Research Company (the investment adviser) and its affiliates provide the Fund with investment management related services for which the Fund pays a monthly management fee. The management fee is the sum of an individual fund fee rate that is based on an annual rate of .424% of the Fund's average net assets and an annualized group fee rate that averaged .25% during the period. The group fee rate is based upon the average net assets of all the mutual funds advised by the investment adviser, including any mutual funds previously advised by the investment adviser that are currently advised by Fidelity SelectCo, LLC, an affiliate of the investment adviser. The group fee rate decreases as assets under management increase and increases as assets under management decrease. In addition, the management fee is subject to a performance adjustment (up to a maximum of +/- .20% of the Fund's average net assets over a 36 month performance period). The upward or downward adjustment to the management fee is based on the relative investment performance of International Discovery as compared to its benchmark index, the MSCI EAFE Index, over the same 36 month performance period. For the reporting period, the total annual management fee rate, including the performance adjustment, was .73% of the Fund's average net assets. The performance adjustment included in the management fee rate may be higher or lower than the maximum performance adjustment rate due to the difference between the average net assets for the reporting and performance periods.
Distribution and Service Plan Fees. In accordance with Rule 12b-1 of the 1940 Act, the Fund has adopted separate Distribution and Service Plans for each class of shares. Certain classes pay Fidelity Distributors Corporation (FDC), an affiliate of the investment adviser, separate Distribution and Service Fees, each of which is based on an annual percentage of each class' average net assets. In addition, FDC may pay financial intermediaries for selling shares of the Fund and providing shareholder support services. For the period, the Distribution and Service Fee rates, total fees and amounts retained by FDC were as follows:
| | Distribution
Fee | Service
Fee | Total Fees | Retained
by FDC |
| Class A | -% | .25% | $585 | $3 |
| Class M | .25% | .25% | 166 | – |
| Class C | .75% | .25% | 257 | 17 |
| | | | $1,008 | $20 |
Sales Load. FDC may receive a front-end sales charge of up to 5.75% for selling Class A shares and 3.50% for selling Class M shares, some of which is paid to financial intermediaries for selling shares of the Fund. Depending on the holding period, FDC may receive contingent deferred sales charges levied on Class A, Class M and Class C redemptions. The deferred sales charges are 1.00% for Class C shares, 1.00% for certain purchases of Class A shares and .25% for certain purchases of Class M shares.
For the period, sales charge amounts retained by FDC were as follows:
| | Retained
by FDC |
| Class A | $30 |
| Class M | 2 |
| Class C(a) | 3 |
| | $35 |
(a) When Class C shares are initially sold, FDC pays commissions from its own resources to financial intermediaries through which the sales are made.
Transfer Agent Fees. Fidelity Investments Institutional Operations Company, Inc., (FIIOC), an affiliate of the investment adviser, is the transfer, dividend disbursing and shareholder servicing agent for each class of the Fund. FIIOC receives account fees and asset-based fees that vary according to the account size and type of account of the shareholders of the respective classes of the Fund, except for Class K and Class Z. FIIOC receives an asset-based fee of Class K's and Class Z's average net assets. FIIOC pays for typesetting, printing and mailing of shareholder reports, except proxy statements.
For the period, transfer agent fees for each class were as follows:
| | Amount | % of
Class-Level Average
Net Assets |
| Class A | $627 | .27 |
| Class M | 85 | .26 |
| Class C | 73 | .28 |
| International Discovery | 11,267 | .17 |
| Class K | 916 | .05 |
| Class I | 1,182 | .19 |
| Class Z | 35 | .05 |
| | $14,185 | |
Accounting and Security Lending Fees. Fidelity Service Company, Inc. (FSC), an affiliate of the investment adviser, maintains the Fund's accounting records. The accounting fee is based on the level of average net assets for each month. Under a separate contract, FSC administers the security lending program. The security lending fee is based on the number and duration of lending transactions.
Brokerage Commissions. The Fund placed a portion of its portfolio transactions with brokerage firms which are affiliates of the investment adviser. Brokerage commissions are included in net realized gain (loss) and change in net unrealized appreciation (depreciation) in the Statement of Operations. The commissions paid to these affiliated firms were $13 for the period.
Interfund Trades. The Fund may purchase from or sell securities to other Fidelity Funds under procedures adopted by the Board. The procedures have been designed to ensure these interfund trades are executed in accordance with Rule 17a-7 of the 1940 Act. Interfund trades are included within the respective purchases and sales amounts shown in the Purchases and Sales of Investments note.
7. Committed Line of Credit.
The Fund participates with other funds managed by the investment adviser or an affiliate in a $4.25 billion credit facility (the "line of credit") to be utilized for temporary or emergency purposes to fund shareholder redemptions or for other short-term liquidity purposes. The Fund has agreed to pay commitment fees on its pro-rata portion of the line of credit, which amounted to $30 and is reflected in Miscellaneous expenses on the Statement of Operations. During the period, the Fund did not borrow on this line of credit.
8. Security Lending.
The Fund lends portfolio securities through a lending agent from time to time in order to earn additional income. For equity securities, a lending agent is used and may loan securities to certain qualified borrowers, including Fidelity Capital Markets (FCM), a broker-dealer affiliated with the Fund. On the settlement date of the loan, the Fund receives collateral (in the form of U.S. Treasury obligations, letters of credit and/or cash) against the loaned securities and maintains collateral in an amount not less than 100% of the market value of the loaned securities during the period of the loan. The market value of the loaned securities is determined at the close of business of the Fund and any additional required collateral is delivered to the Fund on the next business day. The Fund or borrower may terminate the loan at any time, and if the borrower defaults on its obligation to return the securities loaned because of insolvency or other reasons, the Fund may apply collateral received from the borrower against the obligation. The Fund may experience delays and costs in recovering the securities loaned. Any cash collateral received is invested in the Fidelity Securities Lending Cash Central Fund. The value of loaned securities and cash collateral at period end are disclosed on the Fund's Statement of Assets and Liabilities. Security lending income represents the income earned on investing cash collateral, less rebates paid to borrowers and any lending agent fees associated with the loan, plus any premium payments received for lending certain types of securities. Security lending income is presented in the Statement of Operations as a component of income from Fidelity Central Funds. Total security lending income during the period amounted to $4,300. During the period, there were no securities loaned to FCM.
9. Expense Reductions.
Commissions paid to certain brokers with whom the investment adviser, or its affiliates, places trades on behalf of the Fund include an amount in addition to trade execution, which may be rebated back to the Fund to offset certain expenses. This amount totaled $1,346 for the period. In addition, through arrangements with the Fund's custodian, credits realized as a result of certain uninvested cash balances were used to reduce the Fund's expenses. During the period, these credits reduced the Fund's custody expenses by $2.
In addition, during the period the investment adviser reimbursed and/or waived a portion of fund-level operating expenses in the amount of $81.
10. Distributions to Shareholders.
Distributions to shareholders of each class were as follows:
| | Year ended October 31, 2017 | Year ended October 31, 2016 |
| From net investment income | | |
| Class A | $2,894 | $1,912 |
| Class M | 333 | 184 |
| Class C | 92 | – |
| International Discovery | 102,284 | 73,519 |
| Class K | 32,411 | 26,239 |
| Class I | 11,493 | 11,205 |
| Class Z | 667 | 375 |
| Total | $150,174 | $113,434 |
| From net realized gain | | |
| Class A | $302 | $36 |
| Class M | 44 | 5 |
| Class C | 33 | – |
| International Discovery | 8,190 | 899 |
| Class K | 2,392 | 284 |
| Class I | 929 | 134 |
| Class Z | 49 | 4 |
| Total | $11,939 | $1,362 |
11. Share Transactions.
Share transactions for each class were as follows and may contain automatic conversions between classes or exchanges between affiliated funds:
| | Shares | Shares | Dollars | Dollars |
| | Year ended October 31, 2017 | Year ended October 31, 2016 | Year ended October 31, 2017 | Year ended October 31, 2016 |
| Class A | | | | |
| Shares sold | 712 | 885 | $29,106 | $33,250 |
| Reinvestment of distributions | 87 | 48 | 3,152 | 1,922 |
| Shares redeemed | (1,774) | (1,758) | (71,253) | (66,337) |
| Net increase (decrease) | (975) | (825) | $(38,995) | $(31,165) |
| Class M | | | | |
| Shares sold | 80 | 126 | $3,246 | $4,736 |
| Reinvestment of distributions | 10 | 5 | 365 | 183 |
| Shares redeemed | (274) | (282) | (10,830) | (10,546) |
| Net increase (decrease) | (184) | (151) | $(7,219) | $(5,627) |
| Class B | | | | |
| Shares sold | – | 1 | $– | $16 |
| Shares redeemed | – | (58) | – | (2,118) |
| Net increase (decrease) | – | (57) | $– | $(2,102) |
| Class C | | | | |
| Shares sold | 83 | 193 | $3,499 | $7,216 |
| Reinvestment of distributions | 3 | – | 116 | – |
| Shares redeemed | (174) | (298) | (6,878) | (11,125) |
| Net increase (decrease) | (88) | (105) | $(3,263) | $(3,909) |
| International Discovery | | | | |
| Shares sold | 19,989 | 18,319 | $812,564 | $696,598 |
| Reinvestment of distributions | 2,884 | 1,781 | 105,223 | 70,961 |
| Shares redeemed | (35,967) | (30,424) | (1,442,640) | (1,154,409) |
| Net increase (decrease) | (13,094) | (10,324) | $(524,853) | $(386,850) |
| Class K | | | | |
| Shares sold | 10,877 | 12,391 | $448,875 | $466,861 |
| Reinvestment of distributions | 957 | 667 | 34,802 | 26,523 |
| Shares redeemed | (14,039) | (21,012)(a) | (560,342) | (800,081)(a) |
| Net increase (decrease) | (2,205) | (7,954) | $(76,665) | $(306,697) |
| Class I | | | | |
| Shares sold | 3,202 | 8,874 | $130,302 | $334,588 |
| Reinvestment of distributions | 82 | 52 | 2,985 | 2,069 |
| Shares redeemed | (8,961) | (15,719) | (349,072) | (569,974) |
| Net increase (decrease) | (5,677) | (6,793) | $(215,785) | $(233,317) |
| Class Z | | | | |
| Shares sold | 1,483 | 497 | $58,502 | $18,760 |
| Reinvestment of distributions | 20 | 10 | 716 | 379 |
| Shares redeemed | (351) | (256) | (14,440) | (9,746) |
| Net increase (decrease) | 1,152 | 251 | $44,778 | $9,393 |
(a) Amount includes in-kind redemptions (see the prior Redemptions In-Kind note for additional details).
12. Other.
The Fund's organizational documents provide former and current trustees and officers with a limited indemnification against liabilities arising in connection with the performance of their duties to the Fund. In the normal course of business, the Fund may also enter into contracts that provide general indemnifications. The Fund's maximum exposure under these arrangements is unknown as this would be dependent on future claims that may be made against the Fund. The risk of material loss from such claims is considered remote.
At the end of the period, Strategic Advisers International Fund was the owner of record of approximately 12% of the total outstanding shares of the Fund.
Report of Independent Registered Public Accounting Firm
To the Trustees of Fidelity Investment Trust and Shareholders of Fidelity International Discovery Fund:
In our opinion, the accompanying statement of assets and liabilities, including the schedule of investments, and the related statements of operations and of changes in net assets and the financial highlights present fairly, in all material respects, the financial position of Fidelity International Discovery Fund (a fund of Fidelity Investment Trust) as of October 31, 2017, the results of its operations for the year then ended, the changes in its net assets for each of the two years in the period then ended and the financial highlights for each of the periods indicated, in conformity with accounting principles generally accepted in the United States of America. These financial statements and financial highlights (hereafter referred to as “financial statements”) are the responsibility of the Fidelity International Discovery Fund’s management. Our responsibility is to express an opinion on these financial statements based on our audits. We conducted our audits of these financial statements in accordance with the standards of the Public Company Accounting Oversight Board (United States). Those standards require that we plan and perform the audit to obtain reasonable assurance about whether the financial statements are free of material misstatement. An audit includes examining, on a test basis, evidence supporting the amounts and disclosures in the financial statements, assessing the accounting principles used and significant estimates made by management, and evaluating the overall financial statement presentation. Our procedures included confirmation of securities owned as of October 31, 2017 by correspondence with the custodian and brokers; when replies were not received from brokers, we performed other auditing procedures. We believe that our audits provide a reasonable basis for our opinion.
PricewaterhouseCoopers LLP
Boston, Massachusetts
December 12, 2017
Trustees and Officers
The Trustees, Members of the Advisory Board (if any), and officers of the trust and fund, as applicable, are listed below. The Board of Trustees governs the fund and is responsible for protecting the interests of shareholders. The Trustees are experienced executives who meet periodically throughout the year to oversee the fund's activities, review contractual arrangements with companies that provide services to the fund, oversee management of the risks associated with such activities and contractual arrangements, and review the fund's performance. Except for Jonathan Chiel, each of the Trustees oversees 190 funds. Mr. Chiel oversees 143 funds.
The Trustees hold office without limit in time except that (a) any Trustee may resign; (b) any Trustee may be removed by written instrument, signed by at least two-thirds of the number of Trustees prior to such removal; (c) any Trustee who requests to be retired or who has become incapacitated by illness or injury may be retired by written instrument signed by a majority of the other Trustees; and (d) any Trustee may be removed at any special meeting of shareholders by a two-thirds vote of the outstanding voting securities of the trust. Each Trustee who is not an interested person (as defined in the 1940 Act) of the trust and the fund is referred to herein as an Independent Trustee. Each Independent Trustee shall retire not later than the last day of the calendar year in which his or her 75th birthday occurs. The Independent Trustees may waive this mandatory retirement age policy with respect to individual Trustees. Officers and Advisory Board Members hold office without limit in time, except that any officer or Advisory Board Member may resign or may be removed by a vote of a majority of the Trustees at any regular meeting or any special meeting of the Trustees. Except as indicated, each individual has held the office shown or other offices in the same company for the past five years.
The fund’s Statement of Additional Information (SAI) includes more information about the Trustees. To request a free copy, call Fidelity at 1-800-544-8544.
Experience, Skills, Attributes, and Qualifications of the Trustees. The Governance and Nominating Committee has adopted a statement of policy that describes the experience, qualifications, attributes, and skills that are necessary and desirable for potential Independent Trustee candidates (Statement of Policy). The Board believes that each Trustee satisfied at the time he or she was initially elected or appointed a Trustee, and continues to satisfy, the standards contemplated by the Statement of Policy. The Governance and Nominating Committee also engages professional search firms to help identify potential Independent Trustee candidates who have the experience, qualifications, attributes, and skills consistent with the Statement of Policy. From time to time, additional criteria based on the composition and skills of the current Independent Trustees, as well as experience or skills that may be appropriate in light of future changes to board composition, business conditions, and regulatory or other developments, have also been considered by the professional search firms and the Governance and Nominating Committee. In addition, the Board takes into account the Trustees' commitment and participation in Board and committee meetings, as well as their leadership of standing and ad hoc committees throughout their tenure.
In determining that a particular Trustee was and continues to be qualified to serve as a Trustee, the Board has considered a variety of criteria, none of which, in isolation, was controlling. The Board believes that, collectively, the Trustees have balanced and diverse experience, qualifications, attributes, and skills, which allow the Board to operate effectively in governing the fund and protecting the interests of shareholders. Information about the specific experience, skills, attributes, and qualifications of each Trustee, which in each case led to the Board's conclusion that the Trustee should serve (or continue to serve) as a trustee of the fund, is provided below.
Board Structure and Oversight Function. James C. Curvey is an interested person and currently serves as Chairman. The Trustees have determined that an interested Chairman is appropriate and benefits shareholders because an interested Chairman has a personal and professional stake in the quality and continuity of services provided to the fund. Independent Trustees exercise their informed business judgment to appoint an individual of their choosing to serve as Chairman, regardless of whether the Trustee happens to be independent or a member of management. The Independent Trustees have determined that they can act independently and effectively without having an Independent Trustee serve as Chairman and that a key structural component for assuring that they are in a position to do so is for the Independent Trustees to constitute a substantial majority for the Board. The Independent Trustees also regularly meet in executive session. Ned C. Lautenbach serves as Chairman of the Independent Trustees and as such (i) acts as a liaison between the Independent Trustees and management with respect to matters important to the Independent Trustees and (ii) with management prepares agendas for Board meetings.
Fidelity® funds are overseen by different Boards of Trustees. The fund's Board oversees Fidelity's high income and certain equity funds, and other Boards oversee Fidelity's investment-grade bond, money market, asset allocation, and sector funds. The asset allocation funds may invest in Fidelity® funds overseen by the fund's Board. The use of separate Boards, each with its own committee structure, allows the Trustees of each group of Fidelity® funds to focus on the unique issues of the funds they oversee, including common research, investment, and operational issues. On occasion, the separate Boards establish joint committees to address issues of overlapping consequences for the Fidelity® funds overseen by each Board.
The Trustees operate using a system of committees to facilitate the timely and efficient consideration of all matters of importance to the Trustees, the fund, and fund shareholders and to facilitate compliance with legal and regulatory requirements and oversight of the fund's activities and associated risks. The Board, acting through its committees, has charged FMR and its affiliates with (i) identifying events or circumstances the occurrence of which could have demonstrably adverse effects on the fund's business and/or reputation; (ii) implementing processes and controls to lessen the possibility that such events or circumstances occur or to mitigate the effects of such events or circumstances if they do occur; and (iii) creating and maintaining a system designed to evaluate continuously business and market conditions in order to facilitate the identification and implementation processes described in (i) and (ii) above. Because the day-to-day operations and activities of the fund are carried out by or through FMR, its affiliates, and other service providers, the fund's exposure to risks is mitigated but not eliminated by the processes overseen by the Trustees. While each of the Board's committees has responsibility for overseeing different aspects of the fund's activities, oversight is exercised primarily through the Operations, Audit, and Compliance Committees. In addition, the Independent Trustees have worked with FMR to enhance the Board's oversight of investment and financial risks, legal and regulatory risks, technology risks, and operational risks, including the development of additional risk reporting to the Board. For example, a working group comprised of Independent Trustees and FMR has worked and continues to work to review the Fidelity® funds' valuation-related activities, reporting and risk management. Appropriate personnel, including but not limited to the fund's Chief Compliance Officer (CCO), FMR's internal auditor, the independent accountants, the fund's Treasurer and portfolio management personnel, make periodic reports to the Board's committees, as appropriate, including an annual review of Fidelity's risk management program for the Fidelity® funds. The responsibilities of each standing committee, including their oversight responsibilities, are described further under "Standing Committees of the Trustees."
Interested Trustees*:
Correspondence intended for a Trustee who is an interested person may be sent to Fidelity Investments, 245 Summer Street, Boston, Massachusetts 02210.
Name, Year of Birth; Principal Occupations and Other Relevant Experience+
Jonathan Chiel (1957)
Year of Election or Appointment: 2016
Trustee
Mr. Chiel also serves as Trustee of other Fidelity® funds. Mr. Chiel is Executive Vice President and General Counsel for FMR LLC (diversified financial services company, 2012-present). Previously, Mr. Chiel served as general counsel (2004-2012) and senior vice president and deputy general counsel (2000-2004) for John Hancock Financial Services; a partner with Choate, Hall & Stewart (1996-2000) (law firm); and an Assistant United States Attorney for the United States Attorney’s Office of the District of Massachusetts (1986-95), including Chief of the Criminal Division (1993-1995). Mr. Chiel is a director on the boards of the Boston Bar Foundation and the Maimonides School.
James C. Curvey (1935)
Year of Election or Appointment: 2007
Trustee
Chairman of the Board of Trustees
Mr. Curvey also serves as Trustee of other Fidelity® funds. Mr. Curvey is a Director of Fidelity Research & Analysis Co. (investment adviser firm, 2009-present), and Vice Chairman (2007-present) and Director of FMR LLC (diversified financial services company). In addition, Mr. Curvey serves as an Overseer for the Boston Symphony Orchestra and a member of the board of Artis-Naples, Naples, Florida, and as a Trustee for Brewster Academy, Wolfeboro, New Hampshire. Previously, Mr. Curvey served as a Director of Fidelity Investments Money Management, Inc. (investment adviser firm, 2009-2014) and a Director of FMR and FMR Co., Inc. (investment adviser firms, 2007-2014).
Charles S. Morrison (1960)
Year of Election or Appointment: 2014
Trustee
Mr. Morrison also serves as Trustee of other funds. He serves as President of Fidelity Management & Research Company (FMR) (investment adviser firm, 2016-present), a Director of Fidelity Investments Money Management, Inc. (FIMM) (investment adviser firm, 2014-present), Director of Fidelity SelectCo, LLC (investment adviser firm, 2014-present), President, Asset Management (2014-present), and is an employee of Fidelity Investments. Previously, Mr. Morrison served as Vice President of Fidelity's Fixed Income and Asset Allocation Funds (2012-2014), President, Fixed Income (2011-2014), Vice President of Fidelity's Money Market Funds (2005-2009), President, Money Market Group Leader of FMR (investment adviser firm, 2009), and Senior Vice President, Money Market Group of FMR (2004-2009). Mr. Morrison also served as Vice President of Fidelity's Bond Funds (2002-2005), certain Balanced Funds (2002-2005), and certain Asset Allocation Funds (2002-2007), and as Senior Vice President (2002-2005) of Fidelity's Bond Division.
* Determined to be an “Interested Trustee” by virtue of, among other things, his or her affiliation with the trust or various entities under common control with FMR.
+ The information includes the Trustee's principal occupation during the last five years and other information relating to the experience, attributes, and skills relevant to the Trustee's qualifications to serve as a Trustee, which led to the conclusion that the Trustee should serve as a Trustee for the fund.
Independent Trustees:
Correspondence intended for an Independent Trustee may be sent to Fidelity Investments, P.O. Box 55235, Boston, Massachusetts 02205-5235.
Name, Year of Birth; Principal Occupations and Other Relevant Experience+
Dennis J. Dirks (1948)
Year of Election or Appointment: 2005
Trustee
Mr. Dirks also serves as Trustee of other Fidelity® funds. Prior to his retirement in May 2003, Mr. Dirks was Chief Operating Officer and a member of the Board of The Depository Trust & Clearing Corporation (DTCC). He also served as President, Chief Operating Officer, and Board member of The Depository Trust Company (DTC) and President and Board member of the National Securities Clearing Corporation (NSCC). In addition, Mr. Dirks served as Chief Executive Officer and Board member of the Government Securities Clearing Corporation, Chief Executive Officer and Board member of the Mortgage-Backed Securities Clearing Corporation, as a Trustee and a member of the Finance Committee of Manhattan College (2005-2008), as a Trustee and a member of the Finance Committee of AHRC of Nassau County (2006-2008), as a member of the Independent Directors Council (IDC) Governing Council (2010-2015), and as a member of the Board of Directors for The Brookville Center for Children’s Services, Inc. (2009-2017). Mr. Dirks is a member of the Finance Committee (2016-present) and Board of Directors (2017-present) of the Asolo Repertory Theatre.
Alan J. Lacy (1953)
Year of Election or Appointment: 2008
Trustee
Mr. Lacy also serves as Trustee of other Fidelity® funds. Mr. Lacy serves as a Director of Bristol-Myers Squibb Company (global pharmaceuticals, 2008-present). He is a Trustee of the California Chapter of The Nature Conservancy (2015-present) and a Director of the Center for Advanced Study in the Behavioral Sciences at Stanford University (2015-present). In addition, Mr. Lacy served as Senior Adviser (2007-2014) of Oak Hill Capital Partners, L.P. (private equity) and also served as Chief Executive Officer (2005) and Vice Chairman (2005-2006) of Sears Holdings Corporation (retail) and Chief Executive Officer and Chairman of the Board of Sears, Roebuck and Co. (retail, 2000-2005). Previously, Mr. Lacy served as Chairman (2014-2017) and a member (2010-2017) of the Board of Directors of Dave & Buster’s Entertainment, Inc. (restaurant and entertainment complexes), as Chairman (2008-2011) and a member (2006-2015) of the Board of Trustees of the National Parks Conservation Association, and as a member of the Board of Directors for The Hillman Companies, Inc. (hardware wholesalers, 2010-2014), Earth Fare, Inc. (retail grocery, 2010-2014), and The Western Union Company (global money transfer, 2006-2011).
Ned C. Lautenbach (1944)
Year of Election or Appointment: 2000
Trustee
Chairman of the Independent Trustees
Mr. Lautenbach also serves as Trustee of other Fidelity® funds. Mr. Lautenbach currently serves as Vice Chair of the Board of Governors, State University System of Florida (2013-present) and is a member of the Council on Foreign Relations (1994-present). He is also a member and has most recently served as Chairman of the Board of Directors of Artis-Naples (2012-present). Previously, Mr. Lautenbach served as a member and then Lead Director of the Board of Directors of Eaton Corporation (diversified industrial, 1997-2016). He was also a Partner and Advisory Partner at Clayton, Dubilier & Rice, LLC (private equity investment, 1998-2010), as well as a Director of Sony Corporation (2006-2007). In addition, Mr. Lautenbach also had a 30-year career with IBM (technology company) during which time he served as Senior Vice President and a member of the Corporate Executive Committee (1968-1998).
Joseph Mauriello (1944)
Year of Election or Appointment: 2008
Trustee
Mr. Mauriello also serves as Trustee of other Fidelity® funds. Prior to his retirement in January 2006, Mr. Mauriello served in numerous senior management positions including Deputy Chairman and Chief Operating Officer (2004-2005), and Vice Chairman of Financial Services (2002-2004) of KPMG LLP US (professional services, 1965-2005). Mr. Mauriello currently serves as a member of the Board of Directors of XL Group plc. (global insurance and re-insurance, 2006-present) and the Independent Directors Council (IDC) Governing Council (2015-present). Previously, Mr. Mauriello served as a Director of the Hamilton Funds of the Bank of New York (2006-2007) and of Arcadia Resources Inc. (health care services and products, 2007-2012).
Cornelia M. Small (1944)
Year of Election or Appointment: 2005
Trustee
Ms. Small also serves as Trustee of other Fidelity® funds. Ms. Small is a member of the Board of Directors (2009-present) and Chair of the Investment Committee (2010-present) of the Teagle Foundation. Ms. Small also serves on the Investment Committee of the Berkshire Taconic Community Foundation (2008-present). Previously, Ms. Small served as Chairperson (2002-2008) and a member of the Investment Committee and Chairperson (2008-2012) and a member of the Board of Trustees of Smith College. In addition, Ms. Small served as Chief Investment Officer, Director of Global Equity Investments, and a member of the Board of Directors of Scudder, Stevens & Clark and Scudder Kemper Investments.
William S. Stavropoulos (1939)
Year of Election or Appointment: 2001
Trustee
Vice Chairman of the Independent Trustees
Mr. Stavropoulos also serves as Trustee of other Fidelity® funds. Mr. Stavropoulos serves as President and Founder of the Michigan Baseball Foundation, the Great Lakes Loons (2007-present). Mr. Stavropoulos is Chairman Emeritus of the Board of Directors of The Dow Chemical Company, where he previously served in numerous senior management positions, including President, CEO (1995-2000; 2002-2004), Chairman of the Executive Committee (2000-2006), and as a member of the Board of Directors (1990-2006). Currently, Mr. Stavropoulos is Chairman of the Board of Directors of Univar Inc. (global distributor of commodity and specialty chemicals), a Director of Teradata Corporation (data warehousing and technology solutions), and a member of the Advisory Board for Metalmark Capital LLC (private equity investment, 2005-present). Mr. Stavropoulos is an operating advisor to Clayton, Dubilier & Rice, LLC (private equity investment). In addition, Mr. Stavropoulos is a member of the University of Notre Dame Advisory Council for the College of Science, a Trustee of the Rollin L. Gerstacker Foundation, and a Director of Artis-Naples in Naples, Florida. Previously, Mr. Stavropoulos served as a Director of Chemical Financial Corporation (bank holding company, 1993-2012) and Tyco International, Ltd. (multinational manufacturing and services, 2007-2012).
David M. Thomas (1949)
Year of Election or Appointment: 2008
Trustee
Mr. Thomas also serves as Trustee of other Fidelity® funds. Mr. Thomas serves as Non-Executive Chairman of the Board of Directors of Fortune Brands Home and Security (home and security products, 2011-present), as a member of the Board of Directors (2004-present) and Presiding Director (2013-present) of Interpublic Group of Companies, Inc. (marketing communication), and as a member of the Board of Trustees of the University of Florida (2013-present). Previously, Mr. Thomas served as Executive Chairman (2005-2006) and Chairman and Chief Executive Officer (2000-2005) of IMS Health, Inc. (pharmaceutical and healthcare information solutions), and a Director of Fortune Brands, Inc. (consumer products, 2000-2011).
+ The information includes the Trustee's principal occupation during the last five years and other information relating to the experience, attributes, and skills relevant to the Trustee's qualifications to serve as a Trustee, which led to the conclusion that the Trustee should serve as a Trustee for the fund.
Advisory Board Members and Officers:
Correspondence intended for an officer or Peter S. Lynch may be sent to Fidelity Investments, 245 Summer Street, Boston, Massachusetts 02210. Officers appear below in alphabetical order.
Name, Year of Birth; Principal Occupation
Peter S. Lynch (1944)
Year of Election or Appointment: 2003
Member of the Advisory Board
Mr. Lynch also serves as Member of the Advisory Board of other Fidelity® funds. Mr. Lynch is Vice Chairman and a Director of FMR (investment adviser firm) and FMR Co., Inc. (investment adviser firm). In addition, Mr. Lynch serves as a Trustee of Boston College and as the Chairman of the Inner-City Scholarship Fund. Previously, Mr. Lynch served on the Special Olympics International Board of Directors (1997-2006).
Elizabeth Paige Baumann (1968)
Year of Election or Appointment: 2017
Anti-Money Laundering (AML) Officer
Ms. Baumann also serves as AML Officer of other funds. She is Chief AML Officer (2012-present) and Senior Vice President (2014-present) of FMR LLC (diversified financial services company) and is an employee of Fidelity Investments. Previously, Ms. Baumann served as AML Officer of the funds (2012-2016), and Vice President (2007-2014) and Deputy Anti-Money Laundering Officer (2007-2012) of FMR LLC.
Marc R. Bryant (1966)
Year of Election or Appointment: 2015
Secretary and Chief Legal Officer (CLO)
Mr. Bryant also serves as Secretary and CLO of other funds. Mr. Bryant serves as CLO, Secretary, and Senior Vice President of Fidelity Management & Research Company (investment adviser firm, 2015-present) and FMR Co., Inc. (investment adviser firm, 2015-present); Secretary of Fidelity SelectCo, LLC (investment adviser firm, 2015-present) and Fidelity Investments Money Management, Inc. (investment adviser firm, 2015-present); and CLO of Fidelity Management & Research (Hong Kong) Limited and FMR Investment Management (UK) Limited (investment adviser firms, 2015-present) and Fidelity Management & Research (Japan) Limited (investment adviser firm, 2016-present). He is Senior Vice President and Deputy General Counsel of FMR LLC (diversified financial services company). Previously, Mr. Bryant served as Secretary and CLO of Fidelity Rutland Square Trust II (2010-2014) and Assistant Secretary of Fidelity's Fixed Income and Asset Allocation Funds (2013-2015). Prior to joining Fidelity Investments, Mr. Bryant served as a Senior Vice President and the Head of Global Retail Legal for AllianceBernstein L.P. (2006-2010), and as the General Counsel for ProFund Advisors LLC (2001-2006).
William C. Coffey (1969)
Year of Election or Appointment: 2009
Assistant Secretary
Mr. Coffey also serves as Assistant Secretary of other funds. He is Senior Vice President and Deputy General Counsel of FMR LLC (diversified financial services company, 2010-present), and is an employee of Fidelity Investments. Previously, Mr. Coffey served as Vice President and Associate General Counsel of FMR LLC (2005-2009).
Jonathan Davis (1968)
Year of Election or Appointment: 2010
Assistant Treasurer
Mr. Davis also serves as Assistant Treasurer of other funds, and is an employee of Fidelity Investments. Previously, Mr. Davis served as Vice President and Associate General Counsel of FMR LLC (diversified financial services company, 2003-2010).
Adrien E. Deberghes (1967)
Year of Election or Appointment: 2016
Assistant Treasurer
Mr. Deberghes also serves as an officer of other funds. He serves as Executive Vice President of Fidelity Investments Money Management, Inc. (FIMM) (investment adviser firm, 2016-present) and is an employee of Fidelity Investments (2008-present). Prior to joining Fidelity Investments, Mr. Deberghes was Senior Vice President of Mutual Fund Administration at State Street Corporation (2007-2008), Senior Director of Mutual Fund Administration at Investors Bank & Trust (2005-2007), and Director of Finance for Dunkin' Brands (2000-2005). Previously, Mr. Deberghes served in other fund officer roles.
Joseph DeSantis (1959)
Year of Election or Appointment: 2017
Vice President
Mr. DeSantis also serves as Vice President of other funds. Mr. DeSantis serves as a Director of Fidelity Management & Research (Japan) Limited (investment adviser firm, 2016-present), Chief Investment Officer, Equities (2010-present) and is an employee of Fidelity Investments.
Stephanie J. Dorsey (1969)
Year of Election or Appointment: 2010
Assistant Treasurer
Ms. Dorsey also serves as an officer of other funds. She is an employee of Fidelity Investments (2008-present) and has served in other fund officer roles. Prior to joining Fidelity Investments, Ms. Dorsey served as Treasurer (2004-2008) of the JPMorgan Mutual Funds and Vice President (2004-2008) of JPMorgan Chase Bank.
Howard J. Galligan III (1966)
Year of Election or Appointment: 2014
Chief Financial Officer
Mr. Galligan also serves as Chief Financial Officer of other funds. Mr. Galligan serves as President of Fidelity Pricing and Cash Management Services (FPCMS) (2014-present) and as a Director of Strategic Advisers, Inc. (investment adviser firm, 2008-present). Previously, Mr. Galligan served as Chief Administrative Officer of Asset Management (2011-2014) and Chief Operating Officer and Senior Vice President of Investment Support for Strategic Advisers, Inc. (2003-2011).
Brian B. Hogan (1964)
Year of Election or Appointment: 2009
Vice President
Mr. Hogan also serves as Trustee or Vice President of other funds. Mr. Hogan serves as a Director of FMR Investment Management (UK) Limited (investment adviser firm, 2015-present) and Fidelity SelectCo, LLC (investment adviser firm, 2014-present) and President of the Equity Division of FMR (investment adviser firm, 2009-present). Previously, Mr. Hogan served as Senior Vice President, Equity Research of FMR (2006-2009) and as a portfolio manager. Mr. Brian B. Hogan is not related to Mr. Colm A. Hogan.
Colm A. Hogan (1973)
Year of Election or Appointment: 2016
Deputy Treasurer
Mr. Hogan also serves as an officer of other funds. Mr. Hogan is an employee of Fidelity Investments (2005-present). Mr. Colm A. Hogan is not related to Mr. Brian B. Hogan.
Chris Maher (1972)
Year of Election or Appointment: 2013
Assistant Treasurer
Mr. Maher serves as Assistant Treasurer of other funds. Mr. Maher is Vice President of Valuation Oversight and is an employee of Fidelity Investments. Previously, Mr. Maher served as Vice President of Asset Management Compliance (2013), Vice President of the Program Management Group of FMR (investment adviser firm, 2010-2013), and Vice President of Valuation Oversight (2008-2010).
Rieco E. Mello (1969)
Year of Election or Appointment: 2017
Assistant Treasurer
Mr. Mello also serves as Assistant Treasurer of other funds. Mr. Mello is an employee of Fidelity Investments (1995-present).
Kenneth B. Robins (1969)
Year of Election or Appointment: 2016
Chief Compliance Officer
Mr. Robins also serves as an officer of other funds. Mr. Robins serves as Compliance Officer of Fidelity Management & Research Company and FMR Co., Inc. (investment adviser firms, 2016-present) and is an employee of Fidelity Investments (2004-present). Previously, Mr. Robins served as Executive Vice President of Fidelity Investments Money Management, Inc. (investment adviser firm, 2013-2016) and served in other fund officer roles.
Stacie M. Smith (1974)
Year of Election or Appointment: 2016
President and Treasurer
Ms. Smith also serves as an officer of other funds. She is an employee of Fidelity Investments (2009-present) and has served in other fund officer roles. Prior to joining Fidelity Investments, Ms. Smith served as Senior Audit Manager of Ernst & Young LLP (accounting firm, 1996-2009). Previously, Ms. Smith served as Deputy Treasurer of certain Fidelity® funds (2013-2016).
Marc L. Spector (1972)
Year of Election or Appointment: 2016
Assistant Treasurer
Mr. Spector also serves as an officer of other funds. Mr. Spector is an employee of Fidelity Investments (2016-present). Prior to joining Fidelity Investments, Mr. Spector served as Director at the Siegfried Group (accounting firm, 2013-2016), and prior to Siegfried Group as audit senior manager at Deloitte & Touche (accounting firm, 2005-2013).
Renee Stagnone (1975)
Year of Election or Appointment: 2016
Assistant Treasurer
Ms. Stagnone also serves as an officer of other funds. Ms. Stagnone is an employee of Fidelity Investments (1997-present). Previously, Ms. Stagnone served as Deputy Treasurer of certain Fidelity® funds (2013-2016).
Shareholder Expense Example
As a shareholder of the Fund, you incur two types of costs: (1) transaction costs, including sales charges (loads) on purchase payments or redemption proceeds, redemption fees and (2) ongoing costs, including management fees, distribution and/or service (12b-1) fees and other Fund expenses. This Example is intended to help you understand your ongoing costs (in dollars) of investing in the Fund and to compare these costs with the ongoing costs of investing in other mutual funds.
The Example is based on an investment of $1,000 invested at the beginning of the period and held for the entire period (May 1, 2017 to October 31, 2017).
Actual Expenses
The first line of the accompanying table for each class of the Fund provides information about actual account values and actual expenses. You may use the information in this line, together with the amount you invested, to estimate the expenses that you paid over the period. Simply divide your account value by $1,000.00 (for example, an $8,600 account value divided by $1,000.00 = 8.6), then multiply the result by the number in the first line for a class of the Fund under the heading entitled "Expenses Paid During Period" to estimate the expenses you paid on your account during this period. A small balance maintenance fee of $12.00 that is charged once a year may apply for certain accounts with a value of less than $2,000. This fee is not included in the table below. If it was, the estimate of expenses you paid during the period would be higher, and your ending account value lower, by this amount. In addition, the Fund, as a shareholder in the underlying Fidelity Central Funds, will indirectly bear its pro-rata share of the fees and expenses incurred by the underlying Fidelity Central Funds. These fees and expenses are not included in the Fund's annualized expense ratio used to calculate the expense estimate in the table below.
Hypothetical Example for Comparison Purposes
The second line of the accompanying table for each class of the Fund provides information about hypothetical account values and hypothetical expenses based on a Class' actual expense ratio and an assumed rate of return of 5% per year before expenses, which is not the Class' actual return. The hypothetical account values and expenses may not be used to estimate the actual ending account balance or expenses you paid for the period. You may use this information to compare the ongoing costs of investing in the Fund and other funds. To do so, compare this 5% hypothetical example with the 5% hypothetical examples that appear in the shareholder reports of the other funds. A small balance maintenance fee of $12.00 that is charged once a year may apply for certain accounts with a value of less than $2,000. This fee is not included in the table below. If it was, the estimate of expenses you paid during the period would be higher, and your ending account value lower, by this amount. In addition, the Fund, as a shareholder in the underlying Fidelity Central Funds, will indirectly bear its pro-rata share of the fees and expenses incurred by the underlying Fidelity Central Funds. These fees and expenses are not included in the Fund's annualized expense ratio used to calculate the expense estimate in the table below.
Please note that the expenses shown in the table are meant to highlight your ongoing costs only and do not reflect any transaction costs. Therefore, the second line of the table is useful in comparing ongoing costs only, and will not help you determine the relative total costs of owning different funds. In addition, if these transactional costs were included, your costs would have been higher.
| | Annualized Expense Ratio-A | Beginning
Account Value
May 1, 2017 | Ending
Account Value
October 31, 2017 | Expenses Paid
During Period-B
May 1, 2017
to October 31, 2017 |
| Class A | 1.33% | | | |
| Actual | | $1,000.00 | $1,136.90 | $7.16 |
| Hypothetical-C | | $1,000.00 | $1,018.50 | $6.77 |
| Class M | 1.57% | | | |
| Actual | | $1,000.00 | $1,135.50 | $8.45 |
| Hypothetical-C | | $1,000.00 | $1,017.29 | $7.98 |
| Class C | 2.10% | | | |
| Actual | | $1,000.00 | $1,132.60 | $11.29 |
| Hypothetical-C | | $1,000.00 | $1,014.62 | $10.66 |
| International Discovery | .98% | | | |
| Actual | | $1,000.00 | $1,139.00 | $5.28 |
| Hypothetical-C | | $1,000.00 | $1,020.27 | $4.99 |
| Class K | .87% | | | |
| Actual | | $1,000.00 | $1,139.50 | $4.69 |
| Hypothetical-C | | $1,000.00 | $1,020.82 | $4.43 |
| Class I | 1.01% | | | |
| Actual | | $1,000.00 | $1,138.80 | $5.44 |
| Hypothetical-C | | $1,000.00 | $1,020.11 | $5.14 |
| Class Z | .86% | | | |
| Actual | | $1,000.00 | $1,139.40 | $4.64 |
| Hypothetical-C | | $1,000.00 | $1,020.87 | $4.38 |
A Annualized expense ratio reflects expenses net of applicable fee waivers.
B Expenses are equal to each Class' annualized expense ratio, multiplied by the average account value over the period, multiplied by 184/365 (to reflect the one-half year period).
C 5% return per year before expenses
Distributions (Unaudited)
The Board of Trustees of Fidelity International Discovery fund voted to pay to shareholders of record at the opening of business on record date, the following distributions per share derived from capital gains realized from sales of portfolio securities, and dividends derived from net investment income:
| | Pay Date | Record Date | Dividends | Capital Gains |
| Fidelity International Discovery Fund | | | | |
| Class A | 12/11/17 | 12/08/17 | $0.340 | $1.832 |
| Class M | 12/11/17 | 12/08/17 | $0.240 | $1.832 |
| Class C | 12/11/17 | 12/08/17 | $0.022 | $1.832 |
| International Discovery | 12/11/17 | 12/08/17 | $0.502 | $1.832 |
| Class K | 12/11/17 | 12/08/17 | $0.554 | $1.832 |
| Class I | 12/11/17 | 12/08/17 | $0.490 | $1.832 |
| Class Z | 12/11/17 | 12/08/17 | $0.555 | $1.832 |
|
The fund hereby designates as a capital gain dividend with respect to the taxable year ended October 31, 2017, $412,933,613, or, if subsequently determined to be different, the net capital gain of such year.
Class A designates 2%; Class M designates 3%; Class C designates 5%; International Discovery designates 2%; Class K designates 2%; Class I designates 2% and Class Z designates 2% of the dividends distributed in during the fiscal year as qualifying for the dividends–received deduction for corporate shareholders.
Class A, Class M, Class C, International Discovery, Class K, Class I and Class Z designate 100% of dividends distributed during the fiscal year as amounts which may be taken into account as a dividend for purposes of the maximum rate under section 1(h)(11) of the Internal Revenue Code.
The amounts per share which represent income derived from sources within, and taxes paid to, foreign countries or possessions of the United States are as follows:
| | Pay Date | Income | Taxes |
| Fidelity International Discovery Fund | | | |
| Class A | 12/12/16 | $0.5749 | $0.0559 |
| Class M | 12/12/16 | $0.4739 | $0.0559 |
| Class C | 12/12/16 | $0.2389 | $0.0559 |
| International Discovery | 12/12/16 | $0.7169 | $0.0559 |
| Class K | 12/12/16 | $0.7689 | $0.0559 |
| Class I | 12/12/16 | $0.7109 | $0.0559 |
| Class Z | 12/12/16 | $0.7729 | $0.0559 |
|
The fund will notify shareholders in January 2018 of amounts for use in preparing 2017 income tax returns.
Board Approval of Investment Advisory Contracts and Management Fees
Fidelity International Discovery Fund
Each year, the Board of Trustees, including the Independent Trustees (together, the Board), votes on the renewal of the management contract with Fidelity Management & Research Company (FMR) and the sub-advisory agreements (together, the Advisory Contracts) for the fund. FMR and the sub-advisers are referred to herein as the Investment Advisers. The Board, assisted by the advice of fund counsel and Independent Trustees' counsel, requests and considers a broad range of information relevant to the renewal of the Advisory Contracts throughout the year.
The Board meets regularly and, at each of its meetings, covers an extensive agenda of topics and materials and considers factors that are relevant to its annual consideration of the renewal of the fund's Advisory Contracts, including the services and support provided to the fund and its shareholders. The Board has established various standing committees (Committees), each composed of and chaired by Independent Trustees with varying backgrounds, to which the Board has assigned specific subject matter responsibilities in order to enhance effective decision-making by the Board. The Board, acting directly and through its Committees, requests and receives information concerning the annual consideration of the renewal of the fund's Advisory Contracts. The Board also meets as needed to review matters specifically related to the Board's annual consideration of the renewal of the Advisory Contracts. Members of the Board may also meet with trustees of other Fidelity funds through ad hoc joint committees to discuss certain matters relevant to all of the Fidelity funds.
At its July 2017 meeting, the Board unanimously determined to renew the fund's Advisory Contracts. In reaching its determination, the Board considered all factors it believed relevant, including (i) the nature, extent, and quality of the services to be provided to the fund and its shareholders (including the investment performance of the fund); (ii) the competitiveness of the fund's management fee and total expense ratio relative to peer funds; (iii) the total costs of the services to be provided by and the profits to be realized by Fidelity from its relationships with the fund; and (iv) the extent to which, if any, economies of scale exist and would be realized as the fund grows, and whether any economies of scale are appropriately shared with fund shareholders.
In considering whether to renew the Advisory Contracts for the fund, the Board reached a determination, with the assistance of fund counsel and Independent Trustees' counsel and through the exercise of its business judgment, that the renewal of the Advisory Contracts was in the best interests of the fund and its shareholders and that the compensation payable under the Advisory Contracts was fair and reasonable. The Board's decision to renew the Advisory Contracts was not based on any single factor, but rather was based on a comprehensive consideration of all the information provided to the Board at its meetings throughout the year. The Board, in reaching its determination to renew the Advisory Contracts, was aware that shareholders of the fund have a broad range of investment choices available to them, including a wide choice among funds offered by Fidelity's competitors, and that the fund's shareholders, who have the opportunity to review and weigh the disclosure provided by the fund in its prospectus and other public disclosures, have chosen to invest in this fund, which is part of the Fidelity family of funds.
Amendment to Group Fee Rate. The Board also approved an amendment to the management contract for the fund to add an additional breakpoint to the group fee schedule, effective October 1, 2017. The Board noted that the additional breakpoint would result in lower management fee rates as Fidelity's assets under management increase.
Nature, Extent, and Quality of Services Provided. The Board considered Fidelity's staffing as it relates to the fund, including the backgrounds of investment personnel of Fidelity, and also considered the fund's investment objective, strategies, and related investment philosophy. The Independent Trustees also had discussions with senior management of Fidelity's investment operations and investment groups. The Board considered the structure of the investment personnel compensation program and whether this structure provides appropriate incentives to act in the best interests of the fund. Additionally, the Board considered the portfolio managers' investments, if any, in the funds that they manage.
Resources Dedicated to Investment Management and Support Services. The Board and the Fund Oversight and Research Committees reviewed the general qualifications and capabilities of Fidelity's investment staff, including its size, education, experience, and resources, as well as Fidelity's approach to recruiting, training, managing, and compensating investment personnel. The Board noted that Fidelity has continued to increase the resources devoted to non-U.S. offices, including expansion of Fidelity's global investment organization. The Board also noted that Fidelity's analysts have extensive resources, tools and capabilities that allow them to conduct sophisticated quantitative and fundamental analysis, as well as credit analysis of issuers, counterparties and guarantors. Further, the Board considered that Fidelity's investment professionals have sufficient access to global information and data so as to provide competitive investment results over time, and that those professionals also have access to sophisticated tools that permit them to assess portfolio construction and risk and performance attribution characteristics continuously, as well as to transmit new information and research conclusions rapidly around the world. Additionally, in its deliberations, the Board considered Fidelity's trading, risk management, compliance, and technology and operations capabilities and resources, which are integral parts of the investment management process.
Shareholder and Administrative Services. The Board considered (i) the nature, extent, quality, and cost of advisory, administrative, and shareholder services performed by the Investment Advisers and their affiliates under the Advisory Contracts and under separate agreements covering transfer agency, pricing and bookkeeping, and securities lending services for the fund; (ii) the nature and extent of the supervision of third party service providers, principally custodians, subcustodians, and pricing vendors; and (iii) the resources devoted to, and the record of compliance with, the fund's compliance policies and procedures. The Board also reviewed the allocation of fund brokerage, including allocations to brokers affiliated with the Investment Advisers, the use of brokerage commissions to pay fund expenses, and the use of "soft" commission dollars to pay for research services.
The Board noted that the growth of fund assets over time across the complex allows Fidelity to reinvest in the development of services designed to enhance the value or convenience of the Fidelity funds as investment vehicles. These services include 24-hour access to account information and market information through telephone representatives and over the Internet, investor education materials and asset allocation tools, and the expanded availability of Fidelity Investor Centers.
In 2014, the Board formed an ad hoc Committee on Transfer Agency Fees to review the variety of transfer agency fee structures throughout the industry and Fidelity's competitive positioning with respect to industry participants.
Investment in a Large Fund Family. The Board considered the benefits to shareholders of investing in a Fidelity fund, including the benefits of investing in a fund that is part of a large family of funds offering a variety of investment disciplines and providing a large variety of mutual fund investor services. The Board noted that Fidelity had taken, or had made recommendations that resulted in the Fidelity funds taking, a number of actions over the previous year that benefited particular funds, including: (i) continuing to dedicate additional resources to Fidelity's investment research process, and to the support of the senior management team that oversees asset management; (ii) continuing efforts to enhance Fidelity's global research capabilities; (iii) launching new funds and making other enhancements to meet client needs; (iv) launching new share classes of existing funds; (v) eliminating purchase minimums and broadening eligibility requirements for certain lower-priced share classes; (vi) reducing management fees and total expenses for certain growth equity funds and index funds; (vii) lowering expense caps for certain existing funds and classes to reduce expenses borne by shareholders; (viii) eliminating short-term redemption fees for certain funds; (ix) introducing a new pricing structure for certain funds of funds that is expected to reduce overall expenses paid by shareholders; (x) rationalizing product lines and gaining increased efficiencies through proposals for fund mergers and share class consolidations; (xi) continuing to develop, acquire and implement systems and technology to improve services to the funds and shareholders, strengthen information security, and increase efficiency; and (xii) implementing enhancements to further strengthen Fidelity's product line to increase investors' probability of success in achieving their investment goals, including retirement income goals.
Investment Performance. The Board considered whether the fund has operated in accordance with its investment objective, as well as its record of compliance with its investment restrictions and its performance history.
The Board took into account discussions with representatives of the Investment Advisers about fund investment performance that occur at Board meetings throughout the year. In this regard the Board noted that as part of regularly scheduled fund reviews and other reports to the Board on fund performance, the Board considers annualized return information for the fund for different time periods, measured against a securities market index ("benchmark index") and a peer group of funds with similar objectives ("peer group"), if any. In its evaluation of fund investment performance, the Board gave particular attention to information indicating changes in performance of certain Fidelity funds for specific time periods and discussed with the Investment Advisers the reasons for any overperformance or underperformance.
In addition to reviewing absolute and relative fund performance, the Independent Trustees periodically consider the appropriateness of fund performance metrics in evaluating the results achieved. In general, the Independent Trustees believe that fund performance should be evaluated based on net performance (after fees and expenses) of both the highest performing and lowest performing fund share classes, where applicable, compared to appropriate benchmark indices, over appropriate time periods that may include full market cycles, and compared to peer groups, as applicable, over the same periods, taking into account relevant factors including the following: general market conditions; issuer-specific information; and fund cash flows and other factors.
The Independent Trustees recognize that shareholders evaluate performance on a net basis over their own holding periods, for which one-, three-, and five-year periods are often used as a proxy. For this reason, the performance information reviewed by the Board also included net cumulative calendar year total return information for the fund and an appropriate benchmark index and peer group for the most recent one-, three-, and five-year periods, as shown below. Returns are shown compared to the 25th percentile (top of box, 75% beaten) and 75th percentile (bottom of box, 25% beaten) of the peer universe. Returns of the benchmark index are "net MA,"
i.e., adjusted for tax withholding rates applicable to U.S.-based funds organized as Massachusetts business trusts.
Fidelity International Discovery Fund
The Board has discussed the fund's underperformance (based on the December 31, 2016 data presented herein) with FMR, including the fund's investment strategy, the portfolio management team, and broader trends in the market that may have impacted the fund's performance, and has engaged with FMR to consider what steps might be taken to remediate the fund's underperformance. The Board noted that the fund's performance has improved since the period shown.
The Board also considered that the fund's management fee is subject to upward or downward adjustment depending upon whether, and to what extent, the fund's investment performance for the performance period (a rolling 36-month period) exceeds, or is exceeded by, a securities index, thus leading to a performance adjustment for the same period. The Board noted that the performance adjustment provides FMR with a strong economic incentive to seek to achieve superior long-term performance for the fund's shareholders and helps to more closely align the interests of FMR and the shareholders of the fund.
Based on its review, the Board concluded that the nature, extent, and quality of services provided to the fund under the Advisory Contracts should continue to benefit the shareholders of the fund.
Competitiveness of Management Fee and Total Expense Ratio. The Board considered the fund's management fee and total expense ratio compared to "mapped groups" of competitive funds and classes created for the purpose of facilitating the Trustees' competitive analysis of management fees and total expenses. Fidelity creates "mapped groups" by combining similar Lipper investment objective categories that have comparable investment mandates. Combining Lipper investment objective categories aids the Board's management fee and total expense ratio comparisons by broadening the competitive group used for comparison.
Management Fee. The Board considered two proprietary management fee comparisons for the 12-month periods shown in basis points (BP) in the chart below. The group of Lipper funds used by the Board for management fee comparisons is referred to below as the "Total Mapped Group." The Total Mapped Group comparison focuses on a fund's standing in terms of gross management fees before expense reimbursements or caps, and without giving effect to the fund's performance adjustment, relative to the total universe of funds with comparable investment mandates, regardless of whether their management fee structures also are comparable. Funds with comparable investment mandates offer exposure to similar types of securities. Funds with comparable management fee structures have similar management fee contractual arrangements (
e.g., flat rate charged for advisory services, all-inclusive fee rate,
etc.). "TMG %" represents the percentage of funds in the Total Mapped Group that had management fees that were lower than the fund's. For example, a hypothetical TMG % of 20% would mean that 80% of the funds in the Total Mapped Group had higher, and 20% had lower, management fees than the fund. The fund's actual TMG %s and the number of funds in the Total Mapped Group are in the chart below. The "Asset-Size Peer Group" (ASPG) comparison focuses on a fund's standing relative to a subset of non-Fidelity funds within the Total Mapped Group that are similar in size and management fee structure without taking into account performance adjustments, if any. For example, if a fund is in the first quartile of the ASPG, the fund's management fee ranks in the least expensive or lowest 25% of funds in the ASPG. The ASPG represents at least 15% of the funds in the Total Mapped Group with comparable asset size and management fee structures, subject to a minimum of 50 funds (or all funds in the Total Mapped Group if fewer than 50). Additional information, such as the ASPG quartile in which the fund's management fee rate ranked and the impact of the fund's performance adjustment, is also included in the chart and considered by the Board.
Fidelity International Discovery Fund
The Board noted that the fund's management fee rate ranked below the median of its Total Mapped Group and below the median of its ASPG for 2016. The Board also noted the effect of the fund's performance adjustment, if any, on the fund's management fee ranking.
Furthermore, the Board considered that it had approved a reduction (effective August 1, 2014) in the individual fund fee rate component of the management fee rate for the fund from 0.450% to 0.424%. The Board considered that the chart reflects the fund's lower management fee rate for 2014, as if the lower fee rate were in effect for the entire year.
The Board noted that, in 2014, the Board and the boards of other Fidelity funds formed the ad hoc Committee on Group Fee to conduct an in-depth review of the "group fee" component of the management fee of funds with such management fee structures. The Committee's focus included the mechanics of the group fee, the competitive landscape of group fee structures, Fidelity funds with no group fee component and investment products not included in group fee assets. The Board also considered that, for funds subject to the group fee, FMR agreed to voluntarily waive fees over a specified period of time in amounts designed to account for assets converted from certain funds to certain collective investment trusts.
The Board also noted that, in 2013, the ad hoc Committee on Management Fees was formed to conduct an in-depth review of the management fee rates of Fidelity's active equity mutual funds. The Committee focused on the following areas: (i) standard fee structures; (ii) research consumption and trading evolution; (iii) management fee competitiveness/profitability by category; and (iv) factors that drive institutional pricing.
Based on its review, the Board concluded that the fund's management fee is fair and reasonable in light of the services that the fund receives and the other factors considered.
Total Expense Ratio. In its review of each class's total expense ratio, the Board considered the fund's management fee rate as well as other fund or class expenses, as applicable, such as transfer agent fees, pricing and bookkeeping fees, fund-paid 12b-1 fees, and custodial, legal, and audit fees. The Board noted the impact of the fund's performance adjustment. The Board also noted that Fidelity may agree to waive fees and expenses from time to time, and the extent to which, if any, it has done so for the fund. As part of its review, the Board also considered the current and historical total expense ratios of each class of the fund compared to competitive fund median expenses. Each class of the fund is compared to those funds and classes in the Total Mapped Group (used by the Board for management fee comparisons) that have a similar sales load structure.
The Board noted that the total expense ratio of each of Class A, Class I, Class Z, the retail class, and Class K ranked below the competitive median for 2016 and the total expense ratio of each of Class M (formerly Class T) and Class C ranked above the competitive median for 2016. The Board considered that, in general, various factors can affect total expense ratios. The Board noted that the total expense ratio of Class M was above the competitive median primarily because of higher 12b-1 fees on Class M as compared to most competitor funds. Class M has a higher 12b-1 fee, but a lower front-end sales charge, than traditionally priced front-end sales charge classes. The Board considered that Class M is primarily sold load-waived in the retirement plan market where its 0.50% 12b-1 fee is comparable to competing no-load, higher 12b-1 fee classes designed specifically for retirement plans. The Board noted that the total expense ratio of Class C was above the competitive median primarily because of its 12b-1 fees. The Board noted that the fund offers multiple classes, each of which has a different sales load and 12b-1 fee structure, and that the multiple structures are intended to offer a range of pricing options for the intermediary market. The Board also noted that the total expense ratios of the classes vary primarily by the level of their 12b-1 fees, although differences in transfer agent fees may also cause expenses to vary from class to class.
Fees Charged to Other Fidelity Clients. The Board also considered Fidelity fee structures and other information with respect to clients of Fidelity, such as other funds advised or subadvised by Fidelity, pension plan clients, and other institutional clients with similar mandates. The Board noted that an ad hoc joint committee created by it and the boards of other Fidelity funds periodically (most recently in 2013) reviews and compares Fidelity's institutional investment advisory business with its business of providing services to the Fidelity funds, including the differences in services provided, fees charged, and costs incurred, as well as competition in their respective marketplaces.
Based on its review of total expense ratios and fees charged to other Fidelity clients, the Board concluded that, although some classes were above the median of the universe presented for comparison, the total expense ratio of each class of the fund was reasonable in light of the services that the fund and its shareholders receive and the other factors considered.
Costs of the Services and Profitability. The Board considered the revenues earned and the expenses incurred by Fidelity in conducting the business of developing, marketing, distributing, managing, administering and servicing the fund and servicing the fund's shareholders. The Board also considered the level of Fidelity's profits in respect of all the Fidelity funds.
On an annual basis, Fidelity presents to the Board information about the profitability of its relationships with the fund. Fidelity calculates profitability information for each fund, as well as aggregate profitability information for groups of Fidelity funds and all Fidelity funds, using a series of detailed revenue and cost allocation methodologies which originate with the books and records of Fidelity on which Fidelity's audited financial statements are based. The Audit Committee of the Board reviews any significant changes from the prior year's methodologies.
PricewaterhouseCoopers LLP (PwC), independent registered public accounting firm and auditor to Fidelity and certain Fidelity funds, has been engaged annually by the Board as part of the Board's assessment of Fidelity's profitability analysis. PwC's engagement includes the review and assessment of the methodologies used by Fidelity in determining the revenues and expenses attributable to Fidelity's mutual fund business, and completion of agreed-upon procedures in respect of the mathematical accuracy of the fund profitability information and its conformity to established allocation methodologies. After considering PwC's reports issued under the engagement and information provided by Fidelity, the Board concluded that while other allocation methods may also be reasonable, Fidelity's profitability methodologies are reasonable in all material respects.
The Board also reviewed Fidelity's non-fund businesses and potential fall-out benefits related to the mutual fund business as well as cases where Fidelity's affiliates may benefit from or be related to the fund's business.
The Board considered the costs of the services provided by and the profits realized by Fidelity in connection with the operation of the fund and was satisfied that the profitability was not excessive.
Economies of Scale. The Board considered whether there have been economies of scale in respect of the management of the Fidelity funds, whether the Fidelity funds (including the fund) have appropriately benefited from any such economies of scale, and whether there is potential for realization of any further economies of scale. The Board considered the extent to which the fund will benefit from economies of scale as assets grow through increased services to the fund, through waivers or reimbursements, or through fee or expense ratio reductions. The Board also noted that a committee (the Economies of Scale Committee) created by it and the boards of other Fidelity funds periodically (most recently in 2013) analyzes whether Fidelity attains economies of scale in respect of the management and servicing of the Fidelity funds, whether the Fidelity funds have appropriately benefited from such economies of scale, and whether there is potential for realization of any further economies of scale.
The Board recognized that the fund's management contract incorporates a "group fee" structure, which provides for lower group fee rates as total group assets increase, and for higher group fee rates as total group assets decrease (with "group assets" defined to include fund assets under FMR's management plus the assets of sector funds previously under FMR's management). FMR calculates the group fee rates based on a tiered asset "breakpoint" schedule that varies based on asset class. The Board considered that the group fee is designed to deliver the benefits of economies of scale to fund shareholders when total Fidelity fund assets increase, even if assets of any particular fund are unchanged or have declined, because some portion of Fidelity's costs are attributable to services provided to all Fidelity funds, and all funds benefit if those costs can be allocated among more assets. The Board concluded that, given the group fee structure, fund shareholders will benefit from lower management fees as group assets increase at the fund complex level, regardless of whether Fidelity achieves any such economies of scale.
The Board concluded, taking into account the analysis of the Economies of Scale Committee, that economies of scale, if any, are being appropriately shared between fund shareholders and Fidelity.
Additional Information Requested by the Board. In order to develop fully the factual basis for consideration of the Fidelity funds' advisory contracts, the Board requested and received additional information on certain topics, including: (i) fund performance trends, in particular the underperformance of certain funds, and Fidelity's long-term strategies for certain funds; (ii) Fidelity's fund profitability methodology, profitability trends for certain funds, and the impact of certain factors on fund profitability results, including the impact of market trends on actively managed funds; (iii) the use of performance fees and the calculation of performance adjustments, including the impact of underperformance and fund outflows on performance adjustments; (iv) metrics for evaluating index fund performance; (v) Fidelity's group fee structure, including the group fee breakpoint schedules; (vi) the terms of Fidelity's contractual and voluntary expense cap arrangements with the funds; (vii) the methodology with respect to evaluating competitive fund data and peer group classifications and fee comparisons; (viii) the expense structures for different funds and classes; (ix) Fidelity's arrangements with affiliated sub-advisers on behalf of the funds; (x) information regarding other accounts managed by Fidelity, including institutional accounts and collective investment trusts; (xi) recent changes to the fee structure for certain funds of funds; and (xii) the impact of the Department of Labor's new fiduciary rule on the funds' comparative expense information.
Based on its evaluation of all of the conclusions noted above, and after considering all factors it believed relevant, the Board concluded that the advisory fee structures are fair and reasonable, and that the fund's Advisory Contracts should be renewed.
Corporate Headquarters
245 Summer St.
Boston, MA 02210
www.fidelity.com
IGI-ANN-1217
1.807258.113
Fidelity® International Discovery Fund Class K
Annual Report October 31, 2017 |
|
Contents
To view a fund's proxy voting guidelines and proxy voting record for the 12-month period ended June 30, visit http://www.fidelity.com/proxyvotingresults or visit the Securities and Exchange Commission's (SEC) web site at http://www.sec.gov.
You may also call 1-800-835-5092 to request a free copy of the proxy voting guidelines.
Standard & Poor's, S&P and S&P 500 are registered service marks of The McGraw-Hill Companies, Inc. and have been licensed for use by Fidelity Distributors Corporation.
Other third-party marks appearing herein are the property of their respective owners.
All other marks appearing herein are registered or unregistered trademarks or service marks of FMR LLC or an affiliated company. © 2017 FMR LLC. All rights reserved.
This report and the financial statements contained herein are submitted for the general information of the shareholders of the Fund. This report is not authorized for distribution to prospective investors in the Fund unless preceded or accompanied by an effective prospectus.
A fund files its complete schedule of portfolio holdings with the SEC for the first and third quarters of each fiscal year on Form N-Q. Forms N-Q are available on the SEC’s web site at http://www.sec.gov. A fund's Forms N-Q may be reviewed and copied at the SEC’s Public Reference Room in Washington, DC. Information regarding the operation of the SEC's Public Reference Room may be obtained by calling 1-800-SEC-0330.
For a complete list of a fund's portfolio holdings, view the most recent holdings listing, semiannual report, or annual report on Fidelity's web site at http://www.fidelity.com, http://www.institutional.fidelity.com, or http://www.401k.com, as applicable.
NOT FDIC INSURED •MAY LOSE VALUE •NO BANK GUARANTEE
Neither the Fund nor Fidelity Distributors Corporation is a bank.
Performance: The Bottom Line
Average annual total return reflects the change in the value of an investment, assuming reinvestment of distributions from dividend income and capital gains (the profits earned upon the sale of securities that have grown in value, if any) and assuming a constant rate of performance each year. The hypothetical investment and the average annual total returns do not reflect the deduction of taxes that a shareholder would pay on fund distributions or the redemption of fund shares. During periods of reimbursement by Fidelity, a fund’s total return will be greater than it would be had the reimbursement not occurred. How a fund did yesterday is no guarantee of how it will do tomorrow.
Average Annual Total Returns
| For the periods ended October 31, 2017 | Past 1 year | Past 5 years | Past 10 years |
| Class K | 26.47% | 9.80% | 1.85% |
The initial offering of Class K shares took place on May 9, 2008. Returns prior to May 9, 2008 are those of Fidelity® International Discovery Fund, the original class of the fund.
$10,000 Over 10 Years
Let's say hypothetically that $10,000 was invested in Fidelity® International Discovery Fund - Class K on October 31, 2007.
The chart shows how the value of your investment would have changed, and also shows how the MSCI EAFE Index performed over the same period.
See (above) for additional information regarding the performance of Class K.

| Period Ending Values |
| $12,011 | Fidelity® International Discovery Fund - Class K |
| $11,334 | MSCI EAFE Index |
Management's Discussion of Fund Performance
Market Recap: The MSCI ACWI (All Country World Index) ex USA Index returned 23.85% for the 12 months ending October 31, 2017, helped partly by a generally weak U.S. dollar. Some favorable election results in continental Europe (+30%) suggested ebbing political uncertainty and near-term risk there, but the U.K. (+20%) faced more-mixed conditions ahead of its expected exit from the European Union. Despite central-bank easing – and pressured recently by yen strength – Japan (+18%) lagged the rest of the Asia-Pacific group (+22%). Commodity-price volatility slowed Canada (+17%), but the emerging-markets group (+26%) sped ahead. Sector-wise, information technology (+47%) was driven by a surge among several Chinese internet-related names. Financials (+27%) rode rising interest rates that, at the same time, weighed on real estate (+17%), utilities (+16%), consumer staples (+14%) and telecommunication services (+9%) – so-called “bond proxy” sectors. Materials (+28%) and industrials (+27%) responded to demand from China and price gains for certain commodities. In the energy sector (+20%), oil prices lost ground in the spring before rebounding through October 31 to end well above where they started 12 months ago. Lastly, health care (+14%) was hurt by early-period turmoil around drug pricing and health care legislation.
Comments from Portfolio Manager William Kennedy: For the fiscal year, the fund’s share classes (excluding sales charges, if applicable) gained about 25% to 26%, beating the 23.69% return of the benchmark MSCI EAFE Index. Versus the benchmark, security selection, most notably in industrials, and sector allocations, especially an overweighting in the top-performing information technology sector, helped relative performance. Geographically, investments in emerging markets, which are outside the benchmark, as well as in picks in Japan and continental Europe aided fund results the most. Top individual relative contributors included China-based e-commerce giant Alibaba Group Holding. Its stock price surged as expanding e-commerce sales worldwide and the firm's broad offerings drove strong earnings growth. Shares of educational company New Oriental Education & Technology gained as China’s growing middle class invested in their children’s education. On the downside, security selection in the energy sector and, geographically, in out-of-index Canada and the U.S. nicked relative performance. Stock-level detractors included telecommunications-services company KDDI in Japan, which fell from favor as investors shifted toward more economically sensitive names after the Trump election. A non-benchmark stake in Canada's Cenovus Energy and a small cash position also hurt.
The views expressed above reflect those of the portfolio manager(s) only through the end of the period as stated on the cover of this report and do not necessarily represent the views of Fidelity or any other person in the Fidelity organization. Any such views are subject to change at any time based upon market or other conditions and Fidelity disclaims any responsibility to update such views. These views may not be relied on as investment advice and, because investment decisions for a Fidelity fund are based on numerous factors, may not be relied on as an indication of trading intent on behalf of any Fidelity fund.
Investment Summary (Unaudited)
Geographic Diversification (% of fund's net assets)
| As of October 31, 2017 |
| | Japan | 17.8% |
| | United Kingdom | 13.7% |
| | France | 10.3% |
| | Germany | 6.7% |
| | Switzerland | 6.3% |
| | Netherlands | 5.3% |
| | Spain | 4.6% |
| | India | 3.6% |
| | Sweden | 3.2% |
| | Other* | 28.5% |
* Includes Short-Term Investments and Net Other Assets (Liabilities).
| As of April 30, 2017 |
| | Japan | 17.6% |
| | United Kingdom | 15.4% |
| | France | 8.6% |
| | Switzerland | 5.8% |
| | Netherlands | 5.7% |
| | Germany | 5.7% |
| | Sweden | 4.2% |
| | Spain | 4.1% |
| | United States of America* | 3.4% |
| | Other | 29.5% |
* Includes Short-Term Investments and Net Other Assets (Liabilities).
Percentages are based on country or territory of incorporation and are adjusted for the effect of futures contracts, if applicable.
Asset Allocation as of October 31, 2017
| | % of fund's net assets | % of fund's net assets 6 months ago |
| Stocks and Equity Futures | 97.6 | 98.3 |
| Short-Term Investments and Net Other Assets (Liabilities) | 2.4 | 1.7 |
Top Ten Stocks as of October 31, 2017
| | % of fund's net assets | % of fund's net assets 6 months ago |
| Total SA (France, Oil, Gas & Consumable Fuels) | 2.0 | 2.1 |
| Unilever NV (Certificaten Van Aandelen) (Bearer) (Netherlands, Personal Products) | 1.7 | 1.2 |
| SAP SE (Germany, Software) | 1.6 | 1.7 |
| Statoil ASA (Norway, Oil, Gas & Consumable Fuels) | 1.5 | 1.3 |
| ORIX Corp. (Japan, Diversified Financial Services) | 1.2 | 1.1 |
| VINCI SA (France, Construction & Engineering) | 1.2 | 0.9 |
| Sony Corp. (Japan, Household Durables) | 1.2 | 1.1 |
| Micro Focus International PLC (United Kingdom, Software) | 1.0 | 1.4 |
| KBC Groep NV (Belgium, Banks) | 1.0 | 1.0 |
| British American Tobacco PLC (United Kingdom, Tobacco) | 1.0 | 1.2 |
| | 13.4 | |
Top Market Sectors as of October 31, 2017
| | % of fund's net assets | % of fund's net assets 6 months ago |
| Financials | 21.0 | 20.8 |
| Industrials | 14.0 | 16.4 |
| Consumer Discretionary | 13.0 | 13.9 |
| Health Care | 11.0 | 7.7 |
| Information Technology | 10.7 | 13.3 |
| Consumer Staples | 10.4 | 10.0 |
| Materials | 5.6 | 6.2 |
| Energy | 5.3 | 4.8 |
| Telecommunication Services | 2.9 | 2.8 |
| Real Estate | 1.9 | 1.1 |
Investments October 31, 2017
Showing Percentage of Net Assets
| Common Stocks - 95.3% | | | |
| | | Shares | Value (000s) |
| Australia - 2.0% | | | |
| Altium Ltd. | | 1,569,213 | $14,388 |
| Australia & New Zealand Banking Group Ltd. | | 2,498,457 | 57,213 |
| Bapcor Ltd. | | 8,747,451 | 36,420 |
| Magellan Financial Group Ltd. | | 1,204,177 | 22,368 |
| Ramsay Health Care Ltd. | | 1,002,986 | 51,362 |
| Spark Infrastructure Group unit | | 18,522,715 | 36,008 |
|
| TOTAL AUSTRALIA | | | 217,759 |
|
| Austria - 1.0% | | | |
| Erste Group Bank AG | | 1,238,700 | 53,229 |
| Wienerberger AG | | 2,081,200 | 53,480 |
|
| TOTAL AUSTRIA | | | 106,709 |
|
| Bailiwick of Jersey - 1.4% | | | |
| Glencore Xstrata PLC | | 20,685,349 | 99,728 |
| Randgold Resources Ltd. sponsored ADR | | 189,614 | 18,633 |
| Shire PLC | | 552,000 | 27,189 |
|
| TOTAL BAILIWICK OF JERSEY | | | 145,550 |
|
| Belgium - 1.5% | | | |
| Anheuser-Busch InBev SA NV | | 423,027 | 51,872 |
| KBC Groep NV | | 1,297,261 | 107,758 |
|
| TOTAL BELGIUM | | | 159,630 |
|
| Bermuda - 0.3% | | | |
| Hiscox Ltd. | | 1,872,000 | 35,504 |
| British Virgin Islands - 0.1% | | | |
| Mail.Ru Group Ltd. GDR (Reg. S) (a) | | 219,200 | 7,124 |
| Canada - 1.9% | | | |
| Alimentation Couche-Tard, Inc. Class B (sub. vtg.) | | 725,100 | 33,998 |
| Cenovus Energy, Inc. | | 3,404,200 | 33,037 |
| Constellation Software, Inc. | | 76,000 | 43,239 |
| Franco-Nevada Corp. | | 227,700 | 18,088 |
| PrairieSky Royalty Ltd. (b) | | 1,763,973 | 46,954 |
| Suncor Energy, Inc. | | 676,200 | 22,958 |
|
| TOTAL CANADA | | | 198,274 |
|
| Cayman Islands - 1.5% | | | |
| Alibaba Group Holding Ltd. sponsored ADR (a) | | 446,500 | 82,553 |
| ASM Pacific Technology Ltd. | | 1,577,700 | 22,953 |
| JD.com, Inc. sponsored ADR (a) | | 762,600 | 28,613 |
| New Oriental Education & Technology Group, Inc. sponsored ADR | | 255,900 | 21,301 |
|
| TOTAL CAYMAN ISLANDS | | | 155,420 |
|
| China - 1.4% | | | |
| Kweichow Moutai Co. Ltd. (A Shares) | | 607,482 | 56,586 |
| Qingdao Port International Co. Ltd. | | 11,154,000 | 7,878 |
| Shanghai International Airport Co. Ltd. (A Shares) | | 5,861,900 | 38,653 |
| Wuliangye Yibin Co. Ltd. Class A | | 4,443,400 | 44,615 |
|
| TOTAL CHINA | | | 147,732 |
|
| Denmark - 0.7% | | | |
| Novo Nordisk A/S Series B | | 966,145 | 48,103 |
| Novozymes A/S Series B | | 393,200 | 21,715 |
|
| TOTAL DENMARK | | | 69,818 |
|
| Finland - 0.5% | | | |
| Sampo Oyj (A Shares) | | 929,800 | 48,717 |
| France - 10.3% | | | |
| Accor SA | | 664,400 | 33,151 |
| ALTEN | | 336,259 | 29,436 |
| Altran Technologies SA | | 1,492,300 | 27,604 |
| Amundi SA | | 567,258 | 48,091 |
| Atos Origin SA | | 252,720 | 39,270 |
| AXA SA | | 1,278,800 | 38,605 |
| BNP Paribas SA | | 774,100 | 60,451 |
| Capgemini SA | | 486,200 | 59,099 |
| Cegedim SA (a) | | 536,390 | 20,869 |
| Elis SA | | 1,199,800 | 31,299 |
| Kaufman & Broad SA | | 454,247 | 20,070 |
| Maisons du Monde SA | | 1,122,200 | 48,562 |
| Rexel SA | | 1,540,100 | 27,493 |
| Sanofi SA | | 952,591 | 90,198 |
| Sartorius Stedim Biotech | | 306,000 | 20,856 |
| SMCP S.A.S. | | 644,668 | 16,250 |
| Societe Generale Series A | | 1,243,700 | 69,218 |
| Sodexo SA | | 558,700 | 71,100 |
| Total SA | | 3,896,574 | 217,042 |
| VINCI SA (b) | | 1,321,700 | 129,402 |
|
| TOTAL FRANCE | | | 1,098,066 |
|
| Germany - 6.7% | | | |
| adidas AG | | 360,212 | 80,163 |
| Aumann AG | | 133,851 | 12,411 |
| Deutsche Borse AG | | 164,581 | 17,045 |
| Deutsche Post AG | | 2,254,367 | 103,254 |
| Deutsche Telekom AG | | 1,845,500 | 33,417 |
| Fresenius SE & Co. KGaA | | 429,100 | 35,843 |
| Henkel AG & Co. KGaA | | 333,900 | 42,084 |
| MTU Aero Engines Holdings AG | | 380,800 | 64,207 |
| Muenchener Rueckversicherungs AG | | 122,700 | 27,449 |
| Nexus AG | | 604,505 | 18,347 |
| Rational AG | | 76,305 | 50,042 |
| Rheinmetall AG | | 313,900 | 37,022 |
| SAP SE | | 1,522,370 | 173,950 |
| Wirecard AG | | 222,600 | 21,923 |
|
| TOTAL GERMANY | | | 717,157 |
|
| Hong Kong - 1.2% | | | |
| AIA Group Ltd. | | 9,260,800 | 69,681 |
| Techtronic Industries Co. Ltd. | | 10,229,000 | 59,986 |
|
| TOTAL HONG KONG | | | 129,667 |
|
| India - 3.6% | | | |
| Avenue Supermarts Ltd. | | 595,148 | 10,484 |
| Bharat Petroleum Corp. Ltd. | | 3,495,188 | 29,235 |
| Bharti Infratel Ltd. | | 8,217,708 | 56,115 |
| HDFC Bank Ltd. | | 1,034,409 | 28,953 |
| HDFC Bank Ltd. sponsored ADR | | 694,884 | 64,138 |
| Housing Development Finance Corp. Ltd. | | 3,719,156 | 98,071 |
| Kajaria Ceramics Ltd. | | 2,444,763 | 25,682 |
| Kotak Mahindra Bank Ltd. | | 1,211,049 | 19,172 |
| Petronet LNG Ltd. | | 6,098,248 | 24,473 |
| PNB Housing Finance Ltd. | | 838,105 | 18,420 |
| PVR Ltd. | | 442,801 | 9,486 |
|
| TOTAL INDIA | | | 384,229 |
|
| Indonesia - 0.6% | | | |
| PT Bank Central Asia Tbk | | 16,688,600 | 25,717 |
| PT Bank Rakyat Indonesia Tbk | | 32,624,300 | 37,525 |
|
| TOTAL INDONESIA | | | 63,242 |
|
| Ireland - 3.1% | | | |
| Allied Irish Banks PLC | | 2,202,142 | 13,016 |
| Cairn Homes PLC (a) | | 20,930,170 | 43,458 |
| CRH PLC | | 2,162,910 | 81,395 |
| DCC PLC (United Kingdom) | | 366,900 | 34,793 |
| Glenveagh Properties PLC | | 13,703,776 | 17,958 |
| Green REIT PLC | | 9,492,200 | 16,696 |
| James Hardie Industries PLC CDI | | 1,790,532 | 27,257 |
| Kerry Group PLC Class A | | 571,300 | 57,531 |
| Ryanair Holdings PLC sponsored ADR (a) | | 355,466 | 39,851 |
|
| TOTAL IRELAND | | | 331,955 |
|
| Israel - 0.5% | | | |
| Frutarom Industries Ltd. | | 692,800 | 57,037 |
| Italy - 0.9% | | | |
| De Longhi SpA | | 734,500 | 24,085 |
| Intesa Sanpaolo SpA | | 22,174,600 | 74,549 |
|
| TOTAL ITALY | | | 98,634 |
|
| Japan - 16.3% | | | |
| AEON Financial Service Co. Ltd. | | 1,637,700 | 35,172 |
| Daito Trust Construction Co. Ltd. | | 170,800 | 29,862 |
| Hoya Corp. | | 1,466,200 | 79,660 |
| Investors Cloud Co. Ltd. (b) | | 442,100 | 26,961 |
| KDDI Corp. | | 3,906,500 | 104,079 |
| Keyence Corp. | | 137,820 | 76,521 |
| Komatsu Ltd. | | 1,572,500 | 51,383 |
| Misumi Group, Inc. | | 1,138,800 | 31,200 |
| Mitsubishi UFJ Financial Group, Inc. | | 13,323,000 | 90,372 |
| Monex Group, Inc. | | 10,069,949 | 32,115 |
| Morinaga & Co. Ltd. | | 578,200 | 32,847 |
| Nidec Corp. | | 324,300 | 43,126 |
| Nintendo Co. Ltd. | | 109,300 | 42,404 |
| Nitori Holdings Co. Ltd. | | 490,500 | 71,285 |
| Olympus Corp. | | 2,074,600 | 77,206 |
| ORIX Corp. | | 7,596,400 | 130,610 |
| Panasonic Corp. | | 6,185,200 | 93,393 |
| Recruit Holdings Co. Ltd. | | 951,600 | 23,331 |
| Relo Holdings Corp. | | 2,579,800 | 63,870 |
| Renesas Electronics Corp. (a) | | 6,360,600 | 82,237 |
| SMC Corp. | | 135,700 | 51,913 |
| SMS Co., Ltd. | | 1,148,500 | 34,598 |
| SoftBank Corp. | | 816,200 | 72,333 |
| Sony Corp. | | 2,969,500 | 124,228 |
| Start Today Co. Ltd. | | 1,828,300 | 50,076 |
| Sundrug Co. Ltd. | | 870,200 | 37,870 |
| Toto Ltd. | | 61,000 | 2,987 |
| Tsuruha Holdings, Inc. | | 468,800 | 58,123 |
| VT Holdings Co. Ltd. | | 3,872,500 | 21,080 |
| Welcia Holdings Co. Ltd. | | 1,666,500 | 63,247 |
|
| TOTAL JAPAN | | | 1,734,089 |
|
| Korea (South) - 0.3% | | | |
| Hyundai Fire & Marine Insurance Co. Ltd. | | 331,774 | 13,457 |
| KB Financial Group, Inc. | | 437,375 | 22,914 |
|
| TOTAL KOREA (SOUTH) | | | 36,371 |
|
| Luxembourg - 0.7% | | | |
| Eurofins Scientific SA | | 122,139 | 76,401 |
| Marshall Islands - 0.1% | | | |
| Hoegh LNG Partners LP | | 715,655 | 13,562 |
| Netherlands - 5.3% | | | |
| ASML Holding NV (Netherlands) | | 438,700 | 79,154 |
| Basic-Fit NV (a) | | 579,100 | 13,299 |
| IMCD Group BV | | 1,264,300 | 79,527 |
| ING Groep NV (Certificaten Van Aandelen) | | 4,861,400 | 89,836 |
| Intertrust NV (b) | | 715,684 | 11,004 |
| Koninklijke Philips Electronics NV | | 2,599,026 | 105,918 |
| Unilever NV (Certificaten Van Aandelen) (Bearer) | | 3,031,776 | 176,116 |
| Van Lanschot NV (Bearer) | | 223,700 | 6,789 |
|
| TOTAL NETHERLANDS | | | 561,643 |
|
| New Zealand - 1.1% | | | |
| EBOS Group Ltd. | | 3,154,998 | 37,998 |
| Fisher & Paykel Healthcare Corp. | | 3,744,125 | 33,948 |
| Ryman Healthcare Group Ltd. | | 6,393,204 | 40,686 |
|
| TOTAL NEW ZEALAND | | | 112,632 |
|
| Norway - 1.5% | | | |
| Statoil ASA (b) | | 7,822,109 | 158,926 |
| Philippines - 0.3% | | | |
| SM Investments Corp. | | 1,974,665 | 36,557 |
| Romania - 0.3% | | | |
| Banca Transilvania SA | | 63,057,091 | 35,103 |
| Russia - 0.4% | | | |
| Sberbank of Russia sponsored ADR | | 3,048,700 | 43,749 |
| South Africa - 0.9% | | | |
| Aspen Pharmacare Holdings Ltd. | | 656,700 | 14,837 |
| Naspers Ltd. Class N | | 320,800 | 78,165 |
|
| TOTAL SOUTH AFRICA | | | 93,002 |
|
| Spain - 4.6% | | | |
| Aedas Homes SAU | | 406,831 | 14,217 |
| Amadeus IT Holding SA Class A | | 790,100 | 53,610 |
| Atresmedia Corporacion de Medios de Comunicacion SA | | 1,229,800 | 12,635 |
| CaixaBank SA (b) | | 18,391,133 | 86,077 |
| Grifols SA ADR | | 2,461,958 | 58,225 |
| Hispania Activos Inmobiliarios SA | | 1,424,325 | 24,563 |
| Inditex SA (b) | | 1,333,256 | 49,845 |
| Masmovil Ibercom SA (a)(b) | | 323,297 | 26,708 |
| Mediaset Espana Comunicacion SA | | 2,378,700 | 25,857 |
| Neinor Homes SLU | | 2,255,500 | 46,359 |
| Prosegur Cash SA | | 19,469,700 | 63,502 |
| Zardoya Otis SA | | 2,111,573 | 22,875 |
|
| TOTAL SPAIN | | | 484,473 |
|
| Sweden - 3.2% | | | |
| ASSA ABLOY AB (B Shares) | | 3,321,800 | 70,033 |
| Com Hem Holding AB | | 847,200 | 12,721 |
| Essity AB Class B | | 2,669,400 | 79,811 |
| HEXPOL AB (B Shares) | | 1,872,700 | 18,947 |
| Indutrade AB | | 1,342,200 | 37,228 |
| Nordea Bank AB | | 4,487,200 | 54,243 |
| Saab AB (B Shares) | | 650,800 | 33,257 |
| Svenska Cellulosa AB (SCA) (B Shares) | | 4,118,900 | 38,672 |
|
| TOTAL SWEDEN | | | 344,912 |
|
| Switzerland - 6.3% | | | |
| ABB Ltd. (Reg.) | | 3,695,570 | 96,510 |
| Credit Suisse Group AG | | 3,492,359 | 55,036 |
| Forbo Holding AG (Reg.) | | 20,130 | 30,428 |
| Julius Baer Group Ltd. | | 868,620 | 51,377 |
| Kaba Holding AG (B Shares) (Reg.) | | 41,400 | 40,958 |
| Lonza Group AG | | 204,259 | 54,256 |
| Nestle SA (Reg. S) | | 821,706 | 69,137 |
| Partners Group Holding AG | | 77,036 | 51,813 |
| Roche Holding AG (participation certificate) | | 305,286 | 70,561 |
| Schindler Holding AG (participation certificate) | | 170,348 | 38,606 |
| Swatch Group AG (Bearer) | | 155,600 | 60,983 |
| UBS Group AG | | 3,179,340 | 54,112 |
|
| TOTAL SWITZERLAND | | | 673,777 |
|
| Taiwan - 0.5% | | | |
| Taiwan Semiconductor Manufacturing Co. Ltd. | | 2,732,000 | 22,102 |
| United Microelectronics Corp. | | 62,100,000 | 32,073 |
|
| TOTAL TAIWAN | | | 54,175 |
|
| United Kingdom - 13.7% | | | |
| Anglo American PLC (United Kingdom) | | 1,384,500 | 26,111 |
| AstraZeneca PLC (United Kingdom) | | 1,048,809 | 70,963 |
| BAE Systems PLC | | 4,102,004 | 32,313 |
| Barclays PLC | | 58,542 | 144 |
| BCA Marketplace PLC | | 7,762,300 | 21,470 |
| BHP Billiton PLC | | 3,418,385 | 61,892 |
| Booker Group PLC | | 17,550,700 | 46,900 |
| British American Tobacco PLC (United Kingdom) | | 1,219,764 | 78,809 |
| Bunzl PLC | | 1,995,172 | 62,140 |
| Cineworld Group PLC | | 2,055,200 | 18,138 |
| CMC Markets PLC | | 12,570,100 | 26,628 |
| Compass Group PLC | | 1,853,606 | 40,695 |
| Conviviality PLC | | 3,508,273 | 19,815 |
| Countryside Properties PLC | | 3,344,076 | 15,785 |
| Cranswick PLC | | 1,341,488 | 54,876 |
| GlaxoSmithKline PLC | | 3,585,419 | 64,349 |
| Hastings Group Holdings PLC | | 3,610,729 | 15,111 |
| Imperial Tobacco Group PLC | | 865,288 | 35,287 |
| Jiangsu Yanghe Brewery JSC Ltd. ELS (HSBC Warrant Program) warrants 9/19/19 (a)(c) | | 2,466,200 | 40,976 |
| John Wood Group PLC | | 2,221,100 | 20,989 |
| Liberty Global PLC Class A (a) | | 1,294,500 | 39,935 |
| LivaNova PLC (a) | | 682,328 | 50,424 |
| London Stock Exchange Group PLC | | 949,236 | 47,416 |
| Melrose Industries PLC | | 23,769,234 | 69,420 |
| Micro Focus International PLC | | 3,150,505 | 110,676 |
| Moneysupermarket.com Group PLC | | 5,256,022 | 22,681 |
| NCC Group Ltd. (b) | | 9,151,300 | 27,955 |
| Reckitt Benckiser Group PLC | | 769,819 | 68,873 |
| Rex Bionics PLC (a)(d)(e) | | 1,297,286 | 30 |
| Rio Tinto PLC | | 922,450 | 43,596 |
| Senior Engineering Group PLC | | 7,132,100 | 27,309 |
| Spirax-Sarco Engineering PLC | | 312,000 | 23,413 |
| St. James's Place Capital PLC | | 2,427,309 | 37,944 |
| Standard Chartered PLC (United Kingdom) (a) | | 9,043,920 | 90,136 |
| Zpg PLC | | 8,675,409 | 40,328 |
|
| TOTAL UNITED KINGDOM | | | 1,453,527 |
|
| United States of America - 0.6% | | | |
| British American Tobacco PLC sponsored ADR | | 423,000 | 27,241 |
| Monsanto Co. | | 287,400 | 34,804 |
| MSCI, Inc. | | 42,200 | 4,953 |
|
| TOTAL UNITED STATES OF AMERICA | | | 66,998 |
|
| TOTAL COMMON STOCKS | | | |
| (Cost $7,887,727) | | | 10,152,121 |
|
| Preferred Stocks - 0.8% | | | |
| Convertible Preferred Stocks - 0.3% | | | |
| Cayman Islands - 0.3% | | | |
| China Internet Plus Holdings Ltd. Series A-11 (a)(e)(f) | | 5,958,244 | 33,301 |
| Nonconvertible Preferred Stocks - 0.5% | | | |
| Brazil - 0.5% | | | |
| Itausa-Investimentos Itau SA (PN) | | 16,420,200 | 52,604 |
| TOTAL PREFERRED STOCKS | | | |
| (Cost $76,501) | | | 85,905 |
| | | Principal Amount (000s) | Value (000s) |
|
| Government Obligations - 0.0% | | | |
| United States of America - 0.0% | | | |
U.S. Treasury Bills, yield at date of purchase 0.99% to 1.04% 11/30/17 to 12/7/17
(Cost $4,516)(g) | | 4,520 | 4,516 |
| | | Shares | Value (000s) |
|
| Money Market Funds - 7.6% | | | |
| Fidelity Cash Central Fund, 1.10% (h) | | 388,022,983 | 388,101 |
| Fidelity Securities Lending Cash Central Fund 1.11% (h)(i) | | 417,529,962 | 417,572 |
| TOTAL MONEY MARKET FUNDS | | | |
| (Cost $805,681) | | | 805,673 |
| TOTAL INVESTMENT IN SECURITIES - 103.7% | | | |
| (Cost $8,774,425) | | | 11,048,215 |
| NET OTHER ASSETS (LIABILITIES) - (3.7)% | | | (398,953) |
| NET ASSETS - 100% | | | $10,649,262 |
| Futures Contracts | | | | | |
| | Number of contracts | Expiration Date | Notional Amount (000s) | Value (000s) | Unrealized Appreciation/(Depreciation) (000s) |
| Purchased | | | | | |
| Equity Index Contracts | | | | | |
| TSE TOPIX Index Contracts (Japan) | 1,035 | Dec. 2017 | $160,477 | $16,840 | $16,840 |
The notional amount of futures purchased as a percentage of Net Assets is 1.5%
Security Type Abbreviations
ELS – Equity-Linked Security
Categorizations in the Schedule of Investments are based on country or territory of incorporation.
Legend
(a) Non-income producing
(b) Security or a portion of the security is on loan at period end.
(c) Security exempt from registration under Rule 144A of the Securities Act of 1933. These securities may be resold in transactions exempt from registration, normally to qualified institutional buyers. At the end of the period, the value of these securities amounted to $40,976,000 or 0.4% of net assets.
(d) Affiliated company
(e) Level 3 security
(f) Restricted securities - Investment in securities not registered under the Securities Act of 1933 (excluding 144A issues). At the end of the period, the value of restricted securities (excluding 144A issues) amounted to $33,301,000 or 0.3% of net assets.
(g) Security or a portion of the security was pledged to cover margin requirements for futures contracts. At period end, the value of securities pledged amounted to $4,516,000.
(h) Affiliated fund that is generally available only to investment companies and other accounts managed by Fidelity Investments. The rate quoted is the annualized seven-day yield of the fund at period end. A complete unaudited listing of the fund's holdings as of its most recent quarter end is available upon request. In addition, each Fidelity Central Fund's financial statements, which are not covered by the Fund's Report of Independent Registered Public Accounting Firm, are available on the SEC's website or upon request.
(i) Investment made with cash collateral received from securities on loan.
Additional information on each restricted holding is as follows:
| Security | Acquisition Date | Acquisition Cost (000s) |
| China Internet Plus Holdings Ltd. Series A-11 | 1/26/15 | $18,833 |
Affiliated Central Funds
Information regarding fiscal year to date income earned by the Fund from investments in Fidelity Central Funds is as follows:
| Fund | Income earned |
| | (Amounts in thousands) |
| Fidelity Cash Central Fund | $1,715 |
| Fidelity Securities Lending Cash Central Fund | 4,300 |
| Total | $6,015 |
Other Affiliated Issuers
An affiliated company is a company in which the Fund has ownership of at least 5% of the voting securities. Fiscal year to date transactions with companies which are or were affiliates are as follows:
| Affiliate (Amounts in thousands) | Value, beginning of period | Purchases | Sales Proceeds | Dividend Income | Realized Gain (loss) | Change in Unrealized appreciation (depreciation) | Value, end of period |
| Hoegh LNG Partners LP | $12,739 | $-- | $-- | $975 | $-- | $1,746 | $-- |
| Rex Bionics PLC | 357 | -- | -- | -- | -- | (327) | 30 |
| Total | $13,096 | $-- | $-- | $975 | $-- | $1,419 | $30 |
Investment Valuation
The following is a summary of the inputs used, as of October 31, 2017, involving the Fund's assets and liabilities carried at fair value. The inputs or methodology used for valuing securities may not be an indication of the risk associated with investing in those securities. For more information on valuation inputs, and their aggregation into the levels used below, please refer to the Investment Valuation section in the accompanying Notes to Financial Statements.
| | Valuation Inputs at Reporting Date: |
| Description | Total | Level 1 | Level 2 | Level 3 |
| (Amounts in thousands) | | | | |
| Investments in Securities: | | | | |
| Equities: | | | | |
| Consumer Discretionary | $1,350,086 | $956,723 | $360,062 | $33,301 |
| Consumer Staples | 1,135,638 | 498,744 | 636,894 | -- |
| Energy | 567,176 | 191,208 | 375,968 | -- |
| Financials | 2,267,079 | 1,490,157 | 776,922 | -- |
| Health Care | 1,148,229 | 514,052 | 634,147 | 30 |
| Industrials | 1,487,077 | 1,084,281 | 402,796 | -- |
| Information Technology | 1,145,878 | 602,839 | 543,039 | -- |
| Materials | 601,355 | 414,472 | 186,883 | -- |
| Real Estate | 194,127 | 73,434 | 120,693 | -- |
| Telecommunication Services | 305,373 | 95,544 | 209,829 | -- |
| Utilities | 36,008 | 36,008 | -- | -- |
| Government Obligations | 4,516 | -- | 4,516 | -- |
| Money Market Funds | 805,673 | 805,673 | -- | -- |
| Total Investments in Securities: | $11,048,215 | $6,763,135 | $4,251,749 | $33,331 |
| Derivative Instruments: | | | | |
| Assets | | | | |
| Futures Contracts | $16,840 | $16,840 | $-- | $-- |
| Total Assets | $16,840 | $16,840 | $-- | $-- |
| Total Derivative Instruments: | $16,840 | $16,840 | $-- | $-- |
The following is a summary of transfers between Level 1 and Level 2 for the period ended October 31, 2017. Transfers are assumed to have occurred at the beginning of the period, and are primarily attributable to the valuation techniques used for foreign equity securities, as discussed in the accompanying Notes to Financial Statements:
| Transfers | Total (000s) |
| Level 1 to Level 2 | $1,142,021 |
| Level 2 to Level 1 | $181,730 |
Value of Derivative Instruments
The following table is a summary of the Fund's value of derivative instruments by primary risk exposure as of October 31, 2017. For additional information on derivative instruments, please refer to the Derivative Instruments section in the accompanying Notes to Financial Statements.
| Primary Risk Exposure / Derivative Type | Value |
| | Asset | Liability |
| (Amounts in thousands) | | |
| Equity Risk | | |
| Futures Contracts(a) | $16,840 | $0 |
| Total Equity Risk | 16,840 | 0 |
| Total Value of Derivatives | $16,840 | $0 |
(a) Reflects gross cumulative appreciation (depreciation) on futures contracts as presented in the Schedule of Investments. In the Statement of Assets and Liabilities, the period end daily variation margin is included in receivable or payable for daily variation margin on futures contracts, and the net cumulative appreciation (depreciation) is included in net unrealized appreciation (depreciation).
See accompanying notes which are an integral part of the financial statements.
Financial Statements
Statement of Assets and Liabilities
| Amounts in thousands (except per-share amounts) | | October 31, 2017 |
| Assets | | |
Investment in securities, at value (including securities loaned of $394,457) — See accompanying schedule:
Unaffiliated issuers (cost $7,964,803) | $10,242,512 | |
| Fidelity Central Funds (cost $805,681) | 805,673 | |
| Other affiliated issuers (cost $3,941) | 30 | |
| Total Investment in Securities (cost $8,774,425) | | $11,048,215 |
| Foreign currency held at value (cost $10) | | 10 |
| Receivable for investments sold | | 12,605 |
| Receivable for fund shares sold | | 6,444 |
| Dividends receivable | | 26,726 |
| Distributions receivable from Fidelity Central Funds | | 696 |
| Prepaid expenses | | 23 |
| Other receivables | | 4,694 |
| Total assets | | 11,099,413 |
| Liabilities | | |
| Payable to custodian bank | $19 | |
| Payable for investments purchased | 11,110 | |
| Payable for fund shares redeemed | 11,664 | |
| Accrued management fee | 6,647 | |
| Distribution and service plan fees payable | 89 | |
| Payable for daily variation margin on futures contracts | 683 | |
| Other affiliated payables | 1,374 | |
| Other payables and accrued expenses | 966 | |
| Collateral on securities loaned | 417,599 | |
| Total liabilities | | 450,151 |
| Net Assets | | $10,649,262 |
| Net Assets consist of: | | |
| Paid in capital | | $7,869,998 |
| Undistributed net investment income | | 108,446 |
| Accumulated undistributed net realized gain (loss) on investments and foreign currency transactions | | 381,985 |
| Net unrealized appreciation (depreciation) on investments and assets and liabilities in foreign currencies | | 2,288,833 |
| Net Assets | | $10,649,262 |
| Calculation of Maximum Offering Price | | |
| Class A: | | |
| Net Asset Value and redemption price per share ($247,565 ÷ 5,306.0 shares) | | $46.66 |
| Maximum offering price per share (100/94.25 of $46.66) | | $49.51 |
| Class M: | | |
| Net Asset Value and redemption price per share ($34,856 ÷ 752.0 shares) | | $46.35 |
| Maximum offering price per share (100/96.50 of $46.35) | | $48.03 |
| Class C: | | |
| Net Asset Value and offering price per share ($28,404 ÷ 618.3 shares)(a) | | $45.94 |
| International Discovery: | | |
| Net Asset Value, offering price and redemption price per share ($7,350,693 ÷ 156,279.9 shares) | | $47.04 |
| Class K: | | |
| Net Asset Value, offering price and redemption price per share ($2,228,308 ÷ 47,456.1 shares) | | $46.96 |
| Class I: | | |
| Net Asset Value, offering price and redemption price per share ($658,324 ÷ 14,031.2 shares) | | $46.92 |
| Class Z: | | |
| Net Asset Value, offering price and redemption price per share ($101,112 ÷ 2,154.8 shares) | | $46.92 |
(a) Redemption price per share is equal to net asset value less any applicable contingent deferred sales charge.
See accompanying notes which are an integral part of the financial statements.
Statement of Operations
| Amounts in thousands | | Year ended October 31, 2017 |
| Investment Income | | |
| Dividends (including $975 earned from other affiliated issuers) | | $219,771 |
| Interest | | 20 |
| Income from Fidelity Central Funds | | 6,015 |
| Income before foreign taxes withheld | | 225,806 |
| Less foreign taxes withheld | | (19,098) |
| Total income | | 206,708 |
| Expenses | | |
| Management fee | | |
| Basic fee | $64,306 | |
| Performance adjustment | 6,041 | |
| Transfer agent fees | 14,185 | |
| Distribution and service plan fees | 1,008 | |
| Accounting and security lending fees | 1,784 | |
| Custodian fees and expenses | 1,428 | |
| Independent trustees' fees and expenses | 38 | |
| Registration fees | 173 | |
| Audit | 122 | |
| Legal | 48 | |
| Miscellaneous | 81 | |
| Total expenses before reductions | 89,214 | |
| Expense reductions | (1,429) | 87,785 |
| Net investment income (loss) | | 118,923 |
| Realized and Unrealized Gain (Loss) | | |
| Net realized gain (loss) on: | | |
| Investment securities: | | |
| Unaffiliated issuers | 1,016,110 | |
| Fidelity Central Funds | (12) | |
| Foreign currency transactions | (163) | |
| Futures contracts | 14,541 | |
| Total net realized gain (loss) | | 1,030,476 |
| Change in net unrealized appreciation (depreciation) on: | | |
| Investment securities: | | |
| Unaffiliated issuers | 1,087,126 | |
| Fidelity Central Funds | (36) | |
| Other affiliated issuers | 1,419 | |
| Assets and liabilities in foreign currencies | 858 | |
| Futures contracts | 13,054 | |
| Total change in net unrealized appreciation (depreciation) | | 1,102,421 |
| Net gain (loss) | | 2,132,897 |
| Net increase (decrease) in net assets resulting from operations | | $2,251,820 |
See accompanying notes which are an integral part of the financial statements.
Statement of Changes in Net Assets
| Amounts in thousands | Year ended October 31, 2017 | Year ended October 31, 2016 |
| Increase (Decrease) in Net Assets | | |
| Operations | | |
| Net investment income (loss) | $118,923 | $162,246 |
| Net realized gain (loss) | 1,030,476 | (541,847) |
| Change in net unrealized appreciation (depreciation) | 1,102,421 | (131,024) |
| Net increase (decrease) in net assets resulting from operations | 2,251,820 | (510,625) |
| Distributions to shareholders from net investment income | (150,174) | (113,434) |
| Distributions to shareholders from net realized gain | (11,939) | (1,362) |
| Total distributions | (162,113) | (114,796) |
| Share transactions - net increase (decrease) | (822,002) | (960,274) |
| Redemption fees | 9 | 70 |
| Total increase (decrease) in net assets | 1,267,714 | (1,585,625) |
| Net Assets | | |
| Beginning of period | 9,381,548 | 10,967,173 |
| End of period | $10,649,262 | $9,381,548 |
| Other Information | | |
| Undistributed net investment income end of period | $108,446 | $142,052 |
See accompanying notes which are an integral part of the financial statements.
Financial Highlights
Fidelity International Discovery Fund Class A
| Years ended October 31, | 2017 | 2016 | 2015 | 2014 | 2013 |
| Selected Per–Share Data | | | | | |
| Net asset value, beginning of period | $37.60 | $39.78 | $38.70 | $39.49 | $31.66 |
| Income from Investment Operations | | | | | |
| Net investment income (loss)A | .36 | .47B | .40C | .53D | .34 |
| Net realized and unrealized gain (loss) | 9.22 | (2.38) | .79 | (.67) | 7.97 |
| Total from investment operations | 9.58 | (1.91) | 1.19 | (.14) | 8.31 |
| Distributions from net investment income | (.47) | (.27) | (.11) | (.33) | (.45) |
| Distributions from net realized gain | (.05) | (.01) | – | (.31) | (.03) |
| Total distributions | (.52) | (.27)E | (.11) | (.65)F | (.48) |
| Redemption fees added to paid in capitalA,G | – | – | – | – | – |
| Net asset value, end of period | $46.66 | $37.60 | $39.78 | $38.70 | $39.49 |
| Total ReturnH,I | 25.87% | (4.83)% | 3.09% | (.36)% | 26.59% |
| Ratios to Average Net AssetsJ,K | | | | | |
| Expenses before reductions | 1.29% | 1.35% | 1.33% | 1.28% | 1.35% |
| Expenses net of fee waivers, if any | 1.29% | 1.35% | 1.33% | 1.28% | 1.35% |
| Expenses net of all reductions | 1.27% | 1.34% | 1.32% | 1.28% | 1.33% |
| Net investment income (loss) | .88% | 1.26%B | 1.00%C | 1.35%D | .97% |
| Supplemental Data | | | | | |
| Net assets, end of period (in millions) | $248 | $236 | $283 | $297 | $347 |
| Portfolio turnover rateL | 42% | 50%M | 60%M | 57% | 65% |
A Calculated based on average shares outstanding during the period.
B Net Investment income per share reflects a large, non-recurring dividend which amounted to $.14 per share. Excluding this non-recurring dividend, the ratio of net investment income (loss) to average net assets would have been .88%.
C Net Investment income per share reflects a large, non-recurring dividend which amounted to $.12 per share. Excluding this non-recurring dividend, the ratio of net investment income (loss) to average net assets would have been .69%.
D Net Investment income per share reflects a large, non-recurring dividend which amounted to $.22 per share. Excluding this non-recurring dividend, the ratio of net investment income (loss) to average net assets would have been .80%.
E Total distributions of $.27 per share is comprised of distributions from net investment income of $.269 and distributions from net realized gain of $.005 per share.
F Total distributions of $.65 per share is comprised of distributions from net investment income of $.334 and distributions from net realized gain of $.311 per share.
G Amount represents less than $.005 per share.
H Total returns would have been lower if certain expenses had not been reduced during the applicable periods shown.
I Total returns do not include the effect of the sales charges.
J Fees and expenses of any underlying Fidelity Central Funds are not included in the Fund's expense ratio. The Fund indirectly bears its proportionate share of the expenses of any underlying Fidelity Central Funds.
K Expense ratios reflect operating expenses of the class. Expenses before reductions do not reflect amounts reimbursed by the investment adviser or reductions from brokerage service arrangements or reductions from other expense offset arrangements and do not represent the amount paid by the class during periods when reimbursements or reductions occur. Expenses net of fee waivers reflect expenses after reimbursement by the investment adviser but prior to reductions from brokerage service arrangements or other expense offset arrangements. Expenses net of all reductions represent the net expenses paid by the class.
L Amount does not include the portfolio activity of any underlying Fidelity Central Funds.
M Portfolio turnover rate excludes securities received or delivered in-kind.
See accompanying notes which are an integral part of the financial statements.
Fidelity International Discovery Fund Class M
| Years ended October 31, | 2017 | 2016 | 2015 | 2014 | 2013 |
| Selected Per–Share Data | | | | | |
| Net asset value, beginning of period | $37.34 | $39.51 | $38.43 | $39.23 | $31.42 |
| Income from Investment Operations | | | | | |
| Net investment income (loss)A | .26 | .38B | .30C | .44D | .26 |
| Net realized and unrealized gain (loss) | 9.17 | (2.37) | .80 | (.68) | 7.92 |
| Total from investment operations | 9.43 | (1.99) | 1.10 | (.24) | 8.18 |
| Distributions from net investment income | (.37) | (.17) | (.02) | (.25) | (.34) |
| Distributions from net realized gain | (.05) | (.01) | – | (.31) | (.03) |
| Total distributions | (.42) | (.18) | (.02) | (.56) | (.37) |
| Redemption fees added to paid in capitalA,E | – | – | – | – | – |
| Net asset value, end of period | $46.35 | $37.34 | $39.51 | $38.43 | $39.23 |
| Total ReturnF,G | 25.57% | (5.07)% | 2.86% | (.60)% | 26.31% |
| Ratios to Average Net AssetsH,I | | | | | |
| Expenses before reductions | 1.53% | 1.58% | 1.57% | 1.51% | 1.59% |
| Expenses net of fee waivers, if any | 1.52% | 1.58% | 1.57% | 1.51% | 1.59% |
| Expenses net of all reductions | 1.51% | 1.57% | 1.56% | 1.51% | 1.57% |
| Net investment income (loss) | .64% | 1.02%B | .76%C | 1.11%D | .73% |
| Supplemental Data | | | | | |
| Net assets, end of period (in millions) | $35 | $35 | $43 | $49 | $53 |
| Portfolio turnover rateJ | 42% | 50%K | 60%K | 57% | 65% |
A Calculated based on average shares outstanding during the period.
B Net Investment income per share reflects a large, non-recurring dividend which amounted to $.14 per share. Excluding this non-recurring dividend, the ratio of net investment income (loss) to average net assets would have been .64%.
C Net Investment income per share reflects a large, non-recurring dividend which amounted to $.12 per share. Excluding this non-recurring dividend, the ratio of net investment income (loss) to average net assets would have been .45%.
D Net Investment income per share reflects a large, non-recurring dividend which amounted to $.21 per share. Excluding this non-recurring dividend, the ratio of net investment income (loss) to average net assets would have been .56%.
E Amount represents less than $.005 per share.
F Total returns would have been lower if certain expenses had not been reduced during the applicable periods shown.
G Total returns do not include the effect of the sales charges.
H Fees and expenses of any underlying Fidelity Central Funds are not included in the Fund's expense ratio. The Fund indirectly bears its proportionate share of the expenses of any underlying Fidelity Central Funds.
I Expense ratios reflect operating expenses of the class. Expenses before reductions do not reflect amounts reimbursed by the investment adviser or reductions from brokerage service arrangements or reductions from other expense offset arrangements and do not represent the amount paid by the class during periods when reimbursements or reductions occur. Expenses net of fee waivers reflect expenses after reimbursement by the investment adviser but prior to reductions from brokerage service arrangements or other expense offset arrangements. Expenses net of all reductions represent the net expenses paid by the class.
J Amount does not include the portfolio activity of any underlying Fidelity Central Funds.
K Portfolio turnover rate excludes securities received or delivered in-kind.
See accompanying notes which are an integral part of the financial statements.
Fidelity International Discovery Fund Class C
| Years ended October 31, | 2017 | 2016 | 2015 | 2014 | 2013 |
| Selected Per–Share Data | | | | | |
| Net asset value, beginning of period | $36.96 | $39.14 | $38.25 | $39.07 | $31.32 |
| Income from Investment Operations | | | | | |
| Net investment income (loss)A | .04 | .19B | .10C | .23D | .08 |
| Net realized and unrealized gain (loss) | 9.12 | (2.37) | .79 | (.66) | 7.90 |
| Total from investment operations | 9.16 | (2.18) | .89 | (.43) | 7.98 |
| Distributions from net investment income | (.13) | – | – | (.08) | (.20) |
| Distributions from net realized gain | (.05) | – | – | (.31) | (.03) |
| Total distributions | (.18) | – | – | (.39) | (.23) |
| Redemption fees added to paid in capitalA,E | – | – | – | – | – |
| Net asset value, end of period | $45.94 | $36.96 | $39.14 | $38.25 | $39.07 |
| Total ReturnF,G | 24.93% | (5.57)% | 2.33% | (1.10)% | 25.65% |
| Ratios to Average Net AssetsH,I | | | | | |
| Expenses before reductions | 2.05% | 2.10% | 2.09% | 2.03% | 2.10% |
| Expenses net of fee waivers, if any | 2.05% | 2.10% | 2.09% | 2.03% | 2.09% |
| Expenses net of all reductions | 2.04% | 2.09% | 2.08% | 2.02% | 2.07% |
| Net investment income (loss) | .11% | .50%B | .24%C | .60%D | .23% |
| Supplemental Data | | | | | |
| Net assets, end of period (in millions) | $28 | $26 | $32 | $35 | $36 |
| Portfolio turnover rateJ | 42% | 50%K | 60%K | 57% | 65% |
A Calculated based on average shares outstanding during the period.
B Net Investment income per share reflects a large, non-recurring dividend which amounted to $.14 per share. Excluding this non-recurring dividend, the ratio of net investment income (loss) to average net assets would have been .13%.
C Net Investment income per share reflects a large, non-recurring dividend which amounted to $.12 per share. Excluding this non-recurring dividend, the ratio of net investment income (loss) to average net assets would have been (.06) %.
D Net Investment income per share reflects a large, non-recurring dividend which amounted to $.21 per share. Excluding this non-recurring dividend, the ratio of net investment income (loss) to average net assets would have been .05%.
E Amount represents less than $.005 per share.
F Total returns would have been lower if certain expenses had not been reduced during the applicable periods shown.
G Total returns do not include the effect of the contingent deferred sales charge.
H Fees and expenses of any underlying Fidelity Central Funds are not included in the Fund's expense ratio. The Fund indirectly bears its proportionate share of the expenses of any underlying Fidelity Central Funds.
I Expense ratios reflect operating expenses of the class. Expenses before reductions do not reflect amounts reimbursed by the investment adviser or reductions from brokerage service arrangements or reductions from other expense offset arrangements and do not represent the amount paid by the class during periods when reimbursements or reductions occur. Expenses net of fee waivers reflect expenses after reimbursement by the investment adviser but prior to reductions from brokerage service arrangements or other expense offset arrangements. Expenses net of all reductions represent the net expenses paid by the class.
J Amount does not include the portfolio activity of any underlying Fidelity Central Funds.
K Portfolio turnover rate excludes securities received or delivered in-kind.
See accompanying notes which are an integral part of the financial statements.
Fidelity International Discovery Fund
| Years ended October 31, | 2017 | 2016 | 2015 | 2014 | 2013 |
| Selected Per–Share Data | | | | | |
| Net asset value, beginning of period | $37.91 | $40.12 | $39.03 | $39.82 | $31.91 |
| Income from Investment Operations | | | | | |
| Net investment income (loss)A | .50 | .61B | .54C | .67D | .47 |
| Net realized and unrealized gain (loss) | 9.29 | (2.41) | .81 | (.68) | 8.02 |
| Total from investment operations | 9.79 | (1.80) | 1.35 | (.01) | 8.49 |
| Distributions from net investment income | (.61) | (.41) | (.26) | (.47) | (.55) |
| Distributions from net realized gain | (.05) | (.01) | – | (.31) | (.03) |
| Total distributions | (.66) | (.41)E | (.26) | (.78) | (.58) |
| Redemption fees added to paid in capitalA,F | – | – | – | – | – |
| Net asset value, end of period | $47.04 | $37.91 | $40.12 | $39.03 | $39.82 |
| Total ReturnG | 26.33% | (4.53)% | 3.47% | (.01)% | 27.03% |
| Ratios to Average Net AssetsH,I | | | | | |
| Expenses before reductions | .94% | 1.00% | .99% | .93% | 1.00% |
| Expenses net of fee waivers, if any | .94% | 1.00% | .99% | .93% | 1.00% |
| Expenses net of all reductions | .92% | .99% | .98% | .93% | .98% |
| Net investment income (loss) | 1.22% | 1.61%B | 1.34%C | 1.69%D | 1.32% |
| Supplemental Data | | | | | |
| Net assets, end of period (in millions) | $7,351 | $6,421 | $7,209 | $7,464 | $7,800 |
| Portfolio turnover rateJ | 42% | 50%K | 60%K | 57% | 65% |
A Calculated based on average shares outstanding during the period.
B Net Investment income per share reflects a large, non-recurring dividend which amounted to $.14 per share. Excluding this non-recurring dividend, the ratio of net investment income (loss) to average net assets would have been 1.23%.
C Net Investment income per share reflects a large, non-recurring dividend which amounted to $.12 per share. Excluding this non-recurring dividend, the ratio of net investment income (loss) to average net assets would have been 1.03%.
D Net Investment income per share reflects a large, non-recurring dividend which amounted to $.22 per share. Excluding this non-recurring dividend, the ratio of net investment income (loss) to average net assets would have been 1.15%.
E Total distributions of $.41 per share is comprised of distributions from net investment income of $.409 and distributions from net realized gain of $.005 per share.
F Amount represents less than $.005 per share.
G Total returns would have been lower if certain expenses had not been reduced during the applicable periods shown.
H Fees and expenses of any underlying Fidelity Central Funds are not included in the Fund's expense ratio. The Fund indirectly bears its proportionate share of the expenses of any underlying Fidelity Central Funds.
I Expense ratios reflect operating expenses of the class. Expenses before reductions do not reflect amounts reimbursed by the investment adviser or reductions from brokerage service arrangements or reductions from other expense offset arrangements and do not represent the amount paid by the class during periods when reimbursements or reductions occur. Expenses net of fee waivers reflect expenses after reimbursement by the investment adviser but prior to reductions from brokerage service arrangements or other expense offset arrangements. Expenses net of all reductions represent the net expenses paid by the class.
J Amount does not include the portfolio activity of any underlying Fidelity Central Funds.
K Portfolio turnover rate excludes securities received or delivered in-kind.
See accompanying notes which are an integral part of the financial statements.
Fidelity International Discovery Fund Class K
| Years ended October 31, | 2017 | 2016 | 2015 | 2014 | 2013 |
| Selected Per–Share Data | | | | | |
| Net asset value, beginning of period | $37.86 | $40.06 | $38.97 | $39.76 | $31.87 |
| Income from Investment Operations | | | | | |
| Net investment income (loss)A | .55 | .66B | .59C | .72D | .52 |
| Net realized and unrealized gain (loss) | 9.26 | (2.39) | .81 | (.67) | 8.01 |
| Total from investment operations | 9.81 | (1.73) | 1.40 | .05 | 8.53 |
| Distributions from net investment income | (.66) | (.46) | (.31) | (.53) | (.61) |
| Distributions from net realized gain | (.05) | (.01) | – | (.31) | (.03) |
| Total distributions | (.71) | (.47) | (.31) | (.84) | (.64) |
| Redemption fees added to paid in capitalA,E | – | – | – | – | – |
| Net asset value, end of period | $46.96 | $37.86 | $40.06 | $38.97 | $39.76 |
| Total ReturnF | 26.47% | (4.38)% | 3.61% | .13% | 27.23% |
| Ratios to Average Net AssetsG,H | | | | | |
| Expenses before reductions | .82% | .86% | .86% | .80% | .85% |
| Expenses net of fee waivers, if any | .82% | .86% | .86% | .80% | .85% |
| Expenses net of all reductions | .80% | .85% | .85% | .79% | .83% |
| Net investment income (loss) | 1.35% | 1.74%B | 1.47%C | 1.83%D | 1.47% |
| Supplemental Data | | | | | |
| Net assets, end of period (in millions) | $2,228 | $1,880 | $2,308 | $2,464 | $2,576 |
| Portfolio turnover rateI | 42% | 50%J | 60%J | 57% | 65% |
A Calculated based on average shares outstanding during the period.
B Net Investment income per share reflects a large, non-recurring dividend which amounted to $.14 per share. Excluding this non-recurring dividend, the ratio of net investment income (loss) to average net assets would have been 1.36%.
C Net Investment income per share reflects a large, non-recurring dividend which amounted to $.12 per share. Excluding this non-recurring dividend, the ratio of net investment income (loss) to average net assets would have been 1.16%.
D Net Investment income per share reflects a large, non-recurring dividend which amounted to $.22 per share. Excluding this non-recurring dividend, the ratio of net investment income (loss) to average net assets would have been 1.28%.
E Amount represents less than $.005 per share.
F Total returns would have been lower if certain expenses had not been reduced during the applicable periods shown.
G Fees and expenses of any underlying Fidelity Central Funds are not included in the Fund's expense ratio. The Fund indirectly bears its proportionate share of the expenses of any underlying Fidelity Central Funds.
H Expense ratios reflect operating expenses of the class. Expenses before reductions do not reflect amounts reimbursed by the investment adviser or reductions from brokerage service arrangements or reductions from other expense offset arrangements and do not represent the amount paid by the class during periods when reimbursements or reductions occur. Expenses net of fee waivers reflect expenses after reimbursement by the investment adviser but prior to reductions from brokerage service arrangements or other expense offset arrangements. Expenses net of all reductions represent the net expenses paid by the class.
I Amount does not include the portfolio activity of any underlying Fidelity Central Funds.
J Portfolio turnover rate excludes securities received or delivered in-kind.
See accompanying notes which are an integral part of the financial statements.
Fidelity International Discovery Fund Class I
| Years ended October 31, | 2017 | 2016 | 2015 | 2014 | 2013 |
| Selected Per–Share Data | | | | | |
| Net asset value, beginning of period | $37.82 | $40.03 | $38.96 | $39.76 | $31.87 |
| Income from Investment Operations | | | | | |
| Net investment income (loss)A | .49 | .61B | .53C | .67D | .47 |
| Net realized and unrealized gain (loss) | 9.27 | (2.40) | .80 | (.68) | 8.01 |
| Total from investment operations | 9.76 | (1.79) | 1.33 | (.01) | 8.48 |
| Distributions from net investment income | (.61) | (.42) | (.26) | (.48) | (.56) |
| Distributions from net realized gain | (.05) | (.01) | – | (.31) | (.03) |
| Total distributions | (.66) | (.42)E | (.26) | (.79) | (.59) |
| Redemption fees added to paid in capitalA,F | – | – | – | – | – |
| Net asset value, end of period | $46.92 | $37.82 | $40.03 | $38.96 | $39.76 |
| Total ReturnG | 26.29% | (4.52)% | 3.44% | (.01)% | 27.03% |
| Ratios to Average Net AssetsH,I | | | | | |
| Expenses before reductions | .96% | 1.00% | 1.00% | .93% | 1.00% |
| Expenses net of fee waivers, if any | .96% | 1.00% | .99% | .93% | 1.00% |
| Expenses net of all reductions | .94% | .99% | .98% | .93% | .97% |
| Net investment income (loss) | 1.21% | 1.60%B | 1.33%C | 1.69%D | 1.33% |
| Supplemental Data | | | | | |
| Net assets, end of period (in millions) | $658 | $745 | $1,061 | $650 | $476 |
| Portfolio turnover rateJ | 42% | 50%K | 60%K | 57% | 65% |
A Calculated based on average shares outstanding during the period.
B Net Investment income per share reflects a large, non-recurring dividend which amounted to $.14 per share. Excluding this non-recurring dividend, the ratio of net investment income (loss) to average net assets would have been 1.22%.
C Net Investment income per share reflects a large, non-recurring dividend which amounted to $.12 per share. Excluding this non-recurring dividend, the ratio of net investment income (loss) to average net assets would have been 1.03%.
D Net Investment income per share reflects a large, non-recurring dividend which amounted to $.22 per share. Excluding this non-recurring dividend, the ratio of net investment income (loss) to average net assets would have been 1.14%.
E Total distributions of $.42 per share is comprised of distributions from net investment income of $.418 and distributions from net realized gain of $.005 per share.
F Amount represents less than $.005 per share.
G Total returns would have been lower if certain expenses had not been reduced during the applicable periods shown.
H Fees and expenses of any underlying Fidelity Central Funds are not included in the Fund's expense ratio. The Fund indirectly bears its proportionate share of the expenses of any underlying Fidelity Central Funds.
I Expense ratios reflect operating expenses of the class. Expenses before reductions do not reflect amounts reimbursed by the investment adviser or reductions from brokerage service arrangements or reductions from other expense offset arrangements and do not represent the amount paid by the class during periods when reimbursements or reductions occur. Expenses net of fee waivers reflect expenses after reimbursement by the investment adviser but prior to reductions from brokerage service arrangements or other expense offset arrangements. Expenses net of all reductions represent the net expenses paid by the class.
J Amount does not include the portfolio activity of any underlying Fidelity Central Funds.
K Portfolio turnover rate excludes securities received or delivered in-kind.
See accompanying notes which are an integral part of the financial statements.
Fidelity International Discovery Fund Class Z
| Years ended October 31, | 2017 | 2016 | 2015 | 2014 | 2013 A |
| Selected Per–Share Data | | | | | |
| Net asset value, beginning of period | $37.84 | $40.03 | $38.96 | $39.77 | $37.22 |
| Income from Investment Operations | | | | | |
| Net investment income (loss)B | .56 | .66C | .59D | .72E | .07 |
| Net realized and unrealized gain (loss) | 9.24 | (2.38) | .80 | (.68) | 2.48 |
| Total from investment operations | 9.80 | (1.72) | 1.39 | .04 | 2.55 |
| Distributions from net investment income | (.67) | (.46) | (.32) | (.54) | – |
| Distributions from net realized gain | (.05) | (.01) | – | (.31) | – |
| Total distributions | (.72) | (.47) | (.32) | (.85) | – |
| Redemption fees added to paid in capitalB,F | – | – | – | – | – |
| Net asset value, end of period | $46.92 | $37.84 | $40.03 | $38.96 | $39.77 |
| Total ReturnG,H | 26.44% | (4.36)% | 3.58% | .12% | 6.85% |
| Ratios to Average Net AssetsI,J | | | | | |
| Expenses before reductions | .82% | .86% | .86% | .80% | .85%K |
| Expenses net of fee waivers, if any | .82% | .86% | .86% | .80% | .85%K |
| Expenses net of all reductions | .80% | .85% | .85% | .79% | .83%K |
| Net investment income (loss) | 1.35% | 1.74%C | 1.47%D | 1.83%E | .76%K |
| Supplemental Data | | | | | |
| Net assets, end of period (in millions) | $101 | $38 | $30 | $35 | $– |
| Portfolio turnover rateL | 42% | 50%M | 60%M | 57% | 65% |
A For the period August 13, 2013 (commencement of sale of shares) to October 31, 2013.
B Calculated based on average shares outstanding during the period.
C Net Investment income per share reflects a large, non-recurring dividend which amounted to $.14 per share. Excluding this non-recurring dividend, the ratio of net investment income (loss) to average net assets would have been 1.36%.
D Net Investment income per share reflects a large, non-recurring dividend which amounted to $.12 per share. Excluding this non-recurring dividend, the ratio of net investment income (loss) to average net assets would have been 1.16%.
E Net Investment income per share reflects a large, non-recurring dividend which amounted to $.21 per share. Excluding this non-recurring dividend, the ratio of net investment income (loss) to average net assets would have been 1.28%.
F Amount represents less than $.005 per share.
G Total returns for periods of less than one year are not annualized.
H Total returns would have been lower if certain expenses had not been reduced during the applicable periods shown.
I Fees and expenses of any underlying Fidelity Central Funds are not included in the Fund's expense ratio. The Fund indirectly bears its proportionate share of the expenses of any underlying Fidelity Central Funds.
J Expense ratios reflect operating expenses of the class. Expenses before reductions do not reflect amounts reimbursed by the investment adviser or reductions from brokerage service arrangements or reductions from other expense offset arrangements and do not represent the amount paid by the class during periods when reimbursements or reductions occur. Expense ratios before reductions for start-up periods may not be representative of longer-term operating periods. Expenses net of fee waivers reflect expenses after reimbursement by the investment adviser but prior to reductions from brokerage service arrangements or other expense offset arrangements. Expenses net of all reductions represent the net expenses paid by the class.
K Annualized
L Amount does not include the portfolio activity of any underlying Fidelity Central Funds.
M Portfolio turnover rate excludes securities received or delivered in-kind.
See accompanying notes which are an integral part of the financial statements.
Notes to Financial Statements
For the period ended October 31, 2017
(Amounts in thousands except percentages)
1. Organization.
Fidelity International Discovery Fund (the Fund) is a fund of Fidelity Investment Trust (the Trust) and is authorized to issue an unlimited number of shares. The Trust is registered under the Investment Company Act of 1940, as amended (the 1940 Act), as an open-end management investment company organized as a Massachusetts business trust. The Fund offers Class A, Class M (formerly Class T), Class C, International Discovery, Class K, Class I and Class Z shares, each of which has equal rights as to assets and voting privileges. Each class has exclusive voting rights with respect to matters that affect that class.
After the close of business on June 24, 2016, all outstanding Class B shares were converted to Class A shares. All prior fiscal period dollar and share amounts for Class B presented in the Notes to Financial Statements are for the period November 1, 2015 through June 24, 2016.
2. Investments in Fidelity Central Funds.
The Fund invests in Fidelity Central Funds, which are open-end investment companies generally available only to other investment companies and accounts managed by the investment adviser and its affiliates. The Fund's Schedule of Investments lists each of the Fidelity Central Funds held as of period end, if any, as an investment of the Fund, but does not include the underlying holdings of each Fidelity Central Fund. As an Investing Fund, the Fund indirectly bears its proportionate share of the expenses of the underlying Fidelity Central Funds.
The Money Market Central Funds seek preservation of capital and current income and are managed by Fidelity Investments Money Management, Inc. (FIMM), an affiliate of the investment adviser. Annualized expenses of the Money Market Central Funds as of their most recent shareholder report date are less than .005%.
A complete unaudited list of holdings for each Fidelity Central Fund is available upon request or at the Securities and Exchange Commission (the SEC) website at www.sec.gov. In addition, the financial statements of the Fidelity Central Funds, which are not covered by the Fund's Report of Independent Registered Public Accounting Firm, are available on the SEC website or upon request.
3. Significant Accounting Policies.
The Fund is an investment company and applies the accounting and reporting guidance of the Financial Accounting Standards Board (FASB) Accounting Standards Codification Topic 946 Financial Services – Investments Companies. The financial statements have been prepared in conformity with accounting principles generally accepted in the United States of America (GAAP), which require management to make certain estimates and assumptions at the date of the financial statements. Actual results could differ from those estimates. Subsequent events, if any, through the date that the financial statements were issued have been evaluated in the preparation of the financial statements. The following summarizes the significant accounting policies of the Fund:
Investment Valuation. Investments are valued as of 4:00 p.m. Eastern time on the last calendar day of the period. The Board of Trustees (the Board) has delegated the day to day responsibility for the valuation of the Fund's investments to the Fair Value Committee (the Committee) established by the Fund's investment adviser. In accordance with valuation policies and procedures approved by the Board, the Fund attempts to obtain prices from one or more third party pricing vendors or brokers to value its investments. When current market prices, quotations or currency exchange rates are not readily available or reliable, investments will be fair valued in good faith by the Committee, in accordance with procedures adopted by the Board. Factors used in determining fair value vary by investment type and may include market or investment specific events, changes in interest rates and credit quality. The frequency with which these procedures are used cannot be predicted and they may be utilized to a significant extent. The Committee oversees the Fund's valuation policies and procedures and reports to the Board on the Committee's activities and fair value determinations. The Board monitors the appropriateness of the procedures used in valuing the Fund's investments and ratifies the fair value determinations of the Committee.
The Fund categorizes the inputs to valuation techniques used to value its investments into a disclosure hierarchy consisting of three levels as shown below:
- Level 1 – quoted prices in active markets for identical investments
- Level 2 – other significant observable inputs (including quoted prices for similar investments, interest rates, prepayment speeds, etc.)
- Level 3 – unobservable inputs (including the Fund's own assumptions based on the best information available)
Valuation techniques used to value the Fund's investments by major category are as follows:
Equity securities, including restricted securities, for which market quotations are readily available, are valued at the last reported sale price or official closing price as reported by a third party pricing vendor on the primary market or exchange on which they are traded and are categorized as Level 1 in the hierarchy. In the event there were no sales during the day or closing prices are not available, securities are valued at the last quoted bid price or may be valued using the last available price and are generally categorized as Level 2 in the hierarchy. For foreign equity securities, when market or security specific events arise, comparisons to the valuation of American Depositary Receipts (ADRs), futures contracts, Exchange-Traded Funds (ETFs) and certain indexes as well as quoted prices for similar securities may be used and would be categorized as Level 2 in the hierarchy. Utilizing these techniques may result in transfers between Level 1 and Level 2. For equity securities, including restricted securities, where observable inputs are limited, assumptions about market activity and risk are used and these securities may be categorized as Level 3 in the hierarchy.
Debt securities, including restricted securities, are valued based on evaluated prices received from third party pricing vendors or from brokers who make markets in such securities. U.S. government and government agency obligations are valued by pricing vendors who utilize matrix pricing which considers yield or price of bonds of comparable quality, coupon, maturity and type or by broker-supplied prices. When independent prices are unavailable or unreliable, debt securities may be valued utilizing pricing methodologies which consider similar factors that would be used by third party pricing vendors. Debt securities are generally categorized as Level 2 in the hierarchy but may be Level 3 depending on the circumstances.
Futures contracts are valued at the settlement price established each day by the board of trade or exchange on which they are traded and are categorized as Level 1 in the hierarchy. Investments in open-end mutual funds, including the Fidelity Central Funds, are valued at their closing net asset value (NAV) each business day and are categorized as Level 1 in the hierarchy.
Changes in valuation techniques may result in transfers in or out of an assigned level within the disclosure hierarchy. The aggregate value of investments by input level as of October 31, 2017, including information on transfers between Levels 1 and 2, is included at the end of the Fund's Schedule of Investments.
Foreign Currency. The Fund may use foreign currency contracts to facilitate transactions in foreign-denominated securities. Gains and losses from these transactions may arise from changes in the value of the foreign currency or if the counterparties do not perform under the contracts' terms.
Foreign-denominated assets, including investment securities, and liabilities are translated into U.S. dollars at the exchange rates at period end. Purchases and sales of investment securities, income and dividends received and expenses denominated in foreign currencies are translated into U.S. dollars at the exchange rate in effect on the transaction date.
The effects of exchange rate fluctuations on investments are included with the net realized and unrealized gain (loss) on investment securities. Other foreign currency transactions resulting in realized and unrealized gain (loss) are disclosed separately.
Investment Transactions and Income. For financial reporting purposes, the Fund's investment holdings and NAV include trades executed through the end of the last business day of the period. The NAV per share for processing shareholder transactions is calculated as of the close of business of the New York Stock Exchange (NYSE), normally 4:00 p.m. Eastern time and includes trades executed through the end of the prior business day. Gains and losses on securities sold are determined on the basis of identified cost and proceeds received from litigation. Dividend income is recorded on the ex-dividend date, except for certain dividends from foreign securities where the ex-dividend date may have passed, which are recorded as soon as the Fund is informed of the ex-dividend date. Non-cash dividends included in dividend income, if any, are recorded at the fair market value of the securities received. Income and capital gain distributions from Fidelity Central Funds, if any, are recorded on the ex-dividend date. Certain distributions received by the Fund represent a return of capital or capital gain. The Fund determines the components of these distributions subsequent to the ex-dividend date, based upon receipt of tax filings or other correspondence relating to the underlying investment. These distributions are recorded as a reduction of cost of investments and/or as a realized gain. Interest income is accrued as earned and includes coupon interest and amortization of premium and accretion of discount on debt securities as applicable. Investment income is recorded net of foreign taxes withheld where recovery of such taxes is uncertain.
Class Allocations and Expenses. Investment income, realized and unrealized capital gains and losses, common expenses of the Fund, and certain fund-level expense reductions, if any, are allocated daily on a pro-rata basis to each class based on the relative net assets of each class to the total net assets of the Fund. Each class differs with respect to transfer agent and distribution and service plan fees incurred. Certain expense reductions may also differ by class. For the reporting period, the allocated portion of income and expenses to each class as a percent of its average net assets may vary due to the timing of recording these transactions in relation to fluctuating net assets of the classes. Expenses directly attributable to a fund are charged to that fund. Expenses attributable to more than one fund are allocated among the respective funds on the basis of relative net assets or other appropriate methods. Expense estimates are accrued in the period to which they relate and adjustments are made when actual amounts are known.
Deferred Trustee Compensation. Under a Deferred Compensation Plan (the Plan), independent Trustees may elect to defer receipt of a portion of their annual compensation. Deferred amounts are invested in a cross-section of Fidelity funds, are marked-to-market and remain in the Fund until distributed in accordance with the Plan. The investment of deferred amounts and the offsetting payable to the Trustees are included in the accompanying Statement of Assets and Liabilities.
Income Tax Information and Distributions to Shareholders. Each year, the Fund intends to qualify as a regulated investment company under Subchapter M of the Internal Revenue Code, including distributing substantially all of its taxable income and realized gains. As a result, no provision for U.S. Federal income taxes is required. As of October 31, 2017, the Fund did not have any unrecognized tax benefits in the financial statements; nor is the Fund aware of any tax positions for which it is reasonably possible that the total amounts of unrecognized tax benefits will significantly change in the next twelve months. The Fund files a U.S. federal tax return, in addition to state and local tax returns as required. The Fund's federal income tax returns are subject to examination by the Internal Revenue Service (IRS) for a period of three fiscal years after they are filed. State and local tax returns may be subject to examination for an additional fiscal year depending on the jurisdiction. Foreign taxes are provided for based on the Fund's understanding of the tax rules and rates that exist in the foreign markets in which it invests.
Distributions are declared and recorded on the ex-dividend date. Income dividends and capital gain distributions are declared separately for each class. Income and capital gain distributions are determined in accordance with income tax regulations, which may differ from GAAP. In addition, the Fund claimed a portion of the payment made to redeeming shareholders as a distribution for income tax purposes.
Capital accounts within the financial statements are adjusted for permanent book-tax differences. These adjustments have no impact on net assets or the results of operations. Capital accounts are not adjusted for temporary book-tax differences which will reverse in a subsequent period.
Book-tax differences are primarily due to foreign currency transactions, passive foreign investment companies (PFIC), market discount, deferred trustees compensation and losses deferred due to wash sales.
As of period end, the cost and unrealized appreciation (depreciation) in securities, and derivatives if applicable, for federal income tax purposes were as follows:
| Gross unrealized appreciation | $2,412,009 |
| Gross unrealized depreciation | (158,816) |
| Net unrealized appreciation (depreciation) | $2,253,193 |
| Tax Cost | $8,811,862 |
The tax-based components of distributable earnings as of period end were as follows:
| Undistributed ordinary income | $115,404 |
| Undistributed long-term capital gain | $412,934 |
| Net unrealized appreciation (depreciation) on securities and other investments | $2,251,367 |
The tax character of distributions paid was as follows:
| | October 31, 2017 | October 31, 2016 |
| Ordinary Income | $162,113 | $ 114,796 |
Short-Term Trading (Redemption) Fees. Shares held by investors in the Fund less than 30 days may have been subject to a redemption fee equal to 1.00% of the NAV of shares redeemed. All redemption fees, which reduce the proceeds of the shareholder redemption, are retained by the Fund and accounted for as an addition to paid in capital. In November 2016, the Board of Trustees approved the elimination of these redemption fees effective December 12, 2016.
Restricted Securities. The Fund may invest in securities that are subject to legal or contractual restrictions on resale. These securities generally may be resold in transactions exempt from registration or to the public if the securities are registered. Disposal of these securities may involve time-consuming negotiations and expense, and prompt sale at an acceptable price may be difficult. Information regarding restricted securities is included at the end of the Fund's Schedule of Investments.
4. Derivative Instruments.
Risk Exposures and the Use of Derivative Instruments. The Fund's investment objective allows the Fund to enter into various types of derivative contracts, including futures contracts. Derivatives are investments whose value is primarily derived from underlying assets, indices or reference rates and may be transacted on an exchange or over-the-counter (OTC). Derivatives may involve a future commitment to buy or sell a specified asset based on specified terms, to exchange future cash flows at periodic intervals based on a notional principal amount, or for one party to make one or more payments upon the occurrence of specified events in exchange for periodic payments from the other party.
The Fund used derivatives to increase returns and to manage exposure to certain risks as defined below. The success of any strategy involving derivatives depends on analysis of numerous economic factors, and if the strategies for investment do not work as intended, the Fund may not achieve its objectives.
The Fund's use of derivatives increased or decreased its exposure to the following risk:
| Equity Risk | Equity risk relates to the fluctuations in the value of financial instruments as a result of changes in market prices (other than those arising from interest rate risk or foreign exchange risk), whether caused by factors specific to an individual investment, its issuer, or all factors affecting all instruments traded in a market or market segment.
|
The Fund is also exposed to additional risks from investing in derivatives, such as liquidity risk and counterparty credit risk. Liquidity risk is the risk that the Fund will be unable to close out the derivative in the open market in a timely manner. Counterparty credit risk is the risk that the counterparty will not be able to fulfill its obligation to the Fund. Counterparty credit risk related to exchange-traded futures contracts may be mitigated by the protection provided by the exchange on which they trade.
Investing in derivatives may involve greater risks than investing in the underlying assets directly and, to varying degrees, may involve risk of loss in excess of any initial investment and collateral received and amounts recognized in the Statement of Assets and Liabilities. In addition, there may be the risk that the change in value of the derivative contract does not correspond to the change in value of the underlying instrument.
Futures Contracts. A futures contract is an agreement between two parties to buy or sell a specified underlying instrument for a fixed price at a specified future date. The Fund used futures contracts to manage its exposure to the stock market.
Upon entering into a futures contract, a fund is required to deposit either cash or securities (initial margin) with a clearing broker in an amount equal to a certain percentage of the face value of the contract. Futures contracts are marked-to-market daily and subsequent daily payments (variation margin) are made or received by a fund depending on the daily fluctuations in the value of the futures contracts and are recorded as unrealized appreciation or (depreciation). This receivable and/or payable, if any, is included in daily variation margin on futures contracts in the Statement of Assets and Liabilities. Realized gain or (loss) is recorded upon the expiration or closing of a futures contract. The net realized gain (loss) and change in net unrealized appreciation (depreciation) on futures contracts during the period is presented in the Statement of Operations.
Any open futures contracts at period end are presented in the Schedule of Investments under the caption "Futures Contracts". The notional amount at value reflects each contract's exposure to the underlying instrument or index at period end and is representative of volume of activity during the period. Securities deposited to meet initial margin requirements are identified in the Schedule of Investments.
5. Purchases and Sales of Investments.
Purchases and sales of securities, other than short-term securities, aggregated $3,991,057 and $5,033,189, respectively.
Prior Fiscal Year Redemptions In-Kind. During the prior period, 1,487 shares of the Fund held by an unaffiliated entity were redeemed for investments and cash with a value of $55,670. The Fund had a net gain of $10,064 on investments delivered through the in-kind redemptions. The amount of the redemptions is included in share transactions activity shown in the accompanying Statement of Changes in Net Assets as well as the Notes to Financial Statements. The Fund recognized no gain or loss for federal income tax purposes.
6. Fees and Other Transactions with Affiliates.
Management Fee. Fidelity Management & Research Company (the investment adviser) and its affiliates provide the Fund with investment management related services for which the Fund pays a monthly management fee. The management fee is the sum of an individual fund fee rate that is based on an annual rate of .424% of the Fund's average net assets and an annualized group fee rate that averaged .25% during the period. The group fee rate is based upon the average net assets of all the mutual funds advised by the investment adviser, including any mutual funds previously advised by the investment adviser that are currently advised by Fidelity SelectCo, LLC, an affiliate of the investment adviser. The group fee rate decreases as assets under management increase and increases as assets under management decrease. In addition, the management fee is subject to a performance adjustment (up to a maximum of +/- .20% of the Fund's average net assets over a 36 month performance period). The upward or downward adjustment to the management fee is based on the relative investment performance of International Discovery as compared to its benchmark index, the MSCI EAFE Index, over the same 36 month performance period. For the reporting period, the total annual management fee rate, including the performance adjustment, was .73% of the Fund's average net assets. The performance adjustment included in the management fee rate may be higher or lower than the maximum performance adjustment rate due to the difference between the average net assets for the reporting and performance periods.
Distribution and Service Plan Fees. In accordance with Rule 12b-1 of the 1940 Act, the Fund has adopted separate Distribution and Service Plans for each class of shares. Certain classes pay Fidelity Distributors Corporation (FDC), an affiliate of the investment adviser, separate Distribution and Service Fees, each of which is based on an annual percentage of each class' average net assets. In addition, FDC may pay financial intermediaries for selling shares of the Fund and providing shareholder support services. For the period, the Distribution and Service Fee rates, total fees and amounts retained by FDC were as follows:
| | Distribution
Fee | Service
Fee | Total Fees | Retained
by FDC |
| Class A | -% | .25% | $585 | $3 |
| Class M | .25% | .25% | 166 | – |
| Class C | .75% | .25% | 257 | 17 |
| | | | $1,008 | $20 |
Sales Load. FDC may receive a front-end sales charge of up to 5.75% for selling Class A shares and 3.50% for selling Class M shares, some of which is paid to financial intermediaries for selling shares of the Fund. Depending on the holding period, FDC may receive contingent deferred sales charges levied on Class A, Class M and Class C redemptions. The deferred sales charges are 1.00% for Class C shares, 1.00% for certain purchases of Class A shares and .25% for certain purchases of Class M shares.
For the period, sales charge amounts retained by FDC were as follows:
| | Retained
by FDC |
| Class A | $30 |
| Class M | 2 |
| Class C(a) | 3 |
| | $35 |
(a) When Class C shares are initially sold, FDC pays commissions from its own resources to financial intermediaries through which the sales are made.
Transfer Agent Fees. Fidelity Investments Institutional Operations Company, Inc., (FIIOC), an affiliate of the investment adviser, is the transfer, dividend disbursing and shareholder servicing agent for each class of the Fund. FIIOC receives account fees and asset-based fees that vary according to the account size and type of account of the shareholders of the respective classes of the Fund, except for Class K and Class Z. FIIOC receives an asset-based fee of Class K's and Class Z's average net assets. FIIOC pays for typesetting, printing and mailing of shareholder reports, except proxy statements.
For the period, transfer agent fees for each class were as follows:
| | Amount | % of
Class-Level Average
Net Assets |
| Class A | $627 | .27 |
| Class M | 85 | .26 |
| Class C | 73 | .28 |
| International Discovery | 11,267 | .17 |
| Class K | 916 | .05 |
| Class I | 1,182 | .19 |
| Class Z | 35 | .05 |
| | $14,185 | |
Accounting and Security Lending Fees. Fidelity Service Company, Inc. (FSC), an affiliate of the investment adviser, maintains the Fund's accounting records. The accounting fee is based on the level of average net assets for each month. Under a separate contract, FSC administers the security lending program. The security lending fee is based on the number and duration of lending transactions.
Brokerage Commissions. The Fund placed a portion of its portfolio transactions with brokerage firms which are affiliates of the investment adviser. Brokerage commissions are included in net realized gain (loss) and change in net unrealized appreciation (depreciation) in the Statement of Operations. The commissions paid to these affiliated firms were $13 for the period.
Interfund Trades. The Fund may purchase from or sell securities to other Fidelity Funds under procedures adopted by the Board. The procedures have been designed to ensure these interfund trades are executed in accordance with Rule 17a-7 of the 1940 Act. Interfund trades are included within the respective purchases and sales amounts shown in the Purchases and Sales of Investments note.
7. Committed Line of Credit.
The Fund participates with other funds managed by the investment adviser or an affiliate in a $4.25 billion credit facility (the "line of credit") to be utilized for temporary or emergency purposes to fund shareholder redemptions or for other short-term liquidity purposes. The Fund has agreed to pay commitment fees on its pro-rata portion of the line of credit, which amounted to $30 and is reflected in Miscellaneous expenses on the Statement of Operations. During the period, the Fund did not borrow on this line of credit.
8. Security Lending.
The Fund lends portfolio securities through a lending agent from time to time in order to earn additional income. For equity securities, a lending agent is used and may loan securities to certain qualified borrowers, including Fidelity Capital Markets (FCM), a broker-dealer affiliated with the Fund. On the settlement date of the loan, the Fund receives collateral (in the form of U.S. Treasury obligations, letters of credit and/or cash) against the loaned securities and maintains collateral in an amount not less than 100% of the market value of the loaned securities during the period of the loan. The market value of the loaned securities is determined at the close of business of the Fund and any additional required collateral is delivered to the Fund on the next business day. The Fund or borrower may terminate the loan at any time, and if the borrower defaults on its obligation to return the securities loaned because of insolvency or other reasons, the Fund may apply collateral received from the borrower against the obligation. The Fund may experience delays and costs in recovering the securities loaned. Any cash collateral received is invested in the Fidelity Securities Lending Cash Central Fund. The value of loaned securities and cash collateral at period end are disclosed on the Fund's Statement of Assets and Liabilities. Security lending income represents the income earned on investing cash collateral, less rebates paid to borrowers and any lending agent fees associated with the loan, plus any premium payments received for lending certain types of securities. Security lending income is presented in the Statement of Operations as a component of income from Fidelity Central Funds. Total security lending income during the period amounted to $4,300. During the period, there were no securities loaned to FCM.
9. Expense Reductions.
Commissions paid to certain brokers with whom the investment adviser, or its affiliates, places trades on behalf of the Fund include an amount in addition to trade execution, which may be rebated back to the Fund to offset certain expenses. This amount totaled $1,346 for the period. In addition, through arrangements with the Fund's custodian, credits realized as a result of certain uninvested cash balances were used to reduce the Fund's expenses. During the period, these credits reduced the Fund's custody expenses by $2.
In addition, during the period the investment adviser reimbursed and/or waived a portion of fund-level operating expenses in the amount of $81.
10. Distributions to Shareholders.
Distributions to shareholders of each class were as follows:
| | Year ended October 31, 2017 | Year ended October 31, 2016 |
| From net investment income | | |
| Class A | $2,894 | $1,912 |
| Class M | 333 | 184 |
| Class C | 92 | – |
| International Discovery | 102,284 | 73,519 |
| Class K | 32,411 | 26,239 |
| Class I | 11,493 | 11,205 |
| Class Z | 667 | 375 |
| Total | $150,174 | $113,434 |
| From net realized gain | | |
| Class A | $302 | $36 |
| Class M | 44 | 5 |
| Class C | 33 | – |
| International Discovery | 8,190 | 899 |
| Class K | 2,392 | 284 |
| Class I | 929 | 134 |
| Class Z | 49 | 4 |
| Total | $11,939 | $1,362 |
11. Share Transactions.
Share transactions for each class were as follows and may contain automatic conversions between classes or exchanges between affiliated funds:
| | Shares | Shares | Dollars | Dollars |
| | Year ended October 31, 2017 | Year ended October 31, 2016 | Year ended October 31, 2017 | Year ended October 31, 2016 |
| Class A | | | | |
| Shares sold | 712 | 885 | $29,106 | $33,250 |
| Reinvestment of distributions | 87 | 48 | 3,152 | 1,922 |
| Shares redeemed | (1,774) | (1,758) | (71,253) | (66,337) |
| Net increase (decrease) | (975) | (825) | $(38,995) | $(31,165) |
| Class M | | | | |
| Shares sold | 80 | 126 | $3,246 | $4,736 |
| Reinvestment of distributions | 10 | 5 | 365 | 183 |
| Shares redeemed | (274) | (282) | (10,830) | (10,546) |
| Net increase (decrease) | (184) | (151) | $(7,219) | $(5,627) |
| Class B | | | | |
| Shares sold | – | 1 | $– | $16 |
| Shares redeemed | – | (58) | – | (2,118) |
| Net increase (decrease) | – | (57) | $– | $(2,102) |
| Class C | | | | |
| Shares sold | 83 | 193 | $3,499 | $7,216 |
| Reinvestment of distributions | 3 | – | 116 | – |
| Shares redeemed | (174) | (298) | (6,878) | (11,125) |
| Net increase (decrease) | (88) | (105) | $(3,263) | $(3,909) |
| International Discovery | | | | |
| Shares sold | 19,989 | 18,319 | $812,564 | $696,598 |
| Reinvestment of distributions | 2,884 | 1,781 | 105,223 | 70,961 |
| Shares redeemed | (35,967) | (30,424) | (1,442,640) | (1,154,409) |
| Net increase (decrease) | (13,094) | (10,324) | $(524,853) | $(386,850) |
| Class K | | | | |
| Shares sold | 10,877 | 12,391 | $448,875 | $466,861 |
| Reinvestment of distributions | 957 | 667 | 34,802 | 26,523 |
| Shares redeemed | (14,039) | (21,012)(a) | (560,342) | (800,081)(a) |
| Net increase (decrease) | (2,205) | (7,954) | $(76,665) | $(306,697) |
| Class I | | | | |
| Shares sold | 3,202 | 8,874 | $130,302 | $334,588 |
| Reinvestment of distributions | 82 | 52 | 2,985 | 2,069 |
| Shares redeemed | (8,961) | (15,719) | (349,072) | (569,974) |
| Net increase (decrease) | (5,677) | (6,793) | $(215,785) | $(233,317) |
| Class Z | | | | |
| Shares sold | 1,483 | 497 | $58,502 | $18,760 |
| Reinvestment of distributions | 20 | 10 | 716 | 379 |
| Shares redeemed | (351) | (256) | (14,440) | (9,746) |
| Net increase (decrease) | 1,152 | 251 | $44,778 | $9,393 |
(a) Amount includes in-kind redemptions (see the prior Redemptions In-Kind note for additional details).
12. Other.
The Fund's organizational documents provide former and current trustees and officers with a limited indemnification against liabilities arising in connection with the performance of their duties to the Fund. In the normal course of business, the Fund may also enter into contracts that provide general indemnifications. The Fund's maximum exposure under these arrangements is unknown as this would be dependent on future claims that may be made against the Fund. The risk of material loss from such claims is considered remote.
At the end of the period, Strategic Advisers International Fund was the owner of record of approximately 12% of the total outstanding shares of the Fund.
Report of Independent Registered Public Accounting Firm
To the Trustees of Fidelity Investment Trust and Shareholders of Fidelity International Discovery Fund:
In our opinion, the accompanying statement of assets and liabilities, including the schedule of investments, and the related statements of operations and of changes in net assets and the financial highlights present fairly, in all material respects, the financial position of Fidelity International Discovery Fund (a fund of Fidelity Investment Trust) as of October 31, 2017, the results of its operations for the year then ended, the changes in its net assets for each of the two years in the period then ended and the financial highlights for each of the periods indicated, in conformity with accounting principles generally accepted in the United States of America. These financial statements and financial highlights (hereafter referred to as “financial statements”) are the responsibility of the Fidelity International Discovery Fund’s management. Our responsibility is to express an opinion on these financial statements based on our audits. We conducted our audits of these financial statements in accordance with the standards of the Public Company Accounting Oversight Board (United States). Those standards require that we plan and perform the audit to obtain reasonable assurance about whether the financial statements are free of material misstatement. An audit includes examining, on a test basis, evidence supporting the amounts and disclosures in the financial statements, assessing the accounting principles used and significant estimates made by management, and evaluating the overall financial statement presentation. Our procedures included confirmation of securities owned as of October 31, 2017 by correspondence with the custodian and brokers; when replies were not received from brokers, we performed other auditing procedures. We believe that our audits provide a reasonable basis for our opinion.
PricewaterhouseCoopers LLP
Boston, Massachusetts
December 12, 2017
Trustees and Officers
The Trustees, Members of the Advisory Board (if any), and officers of the trust and fund, as applicable, are listed below. The Board of Trustees governs the fund and is responsible for protecting the interests of shareholders. The Trustees are experienced executives who meet periodically throughout the year to oversee the fund's activities, review contractual arrangements with companies that provide services to the fund, oversee management of the risks associated with such activities and contractual arrangements, and review the fund's performance. Except for Jonathan Chiel, each of the Trustees oversees 190 funds. Mr. Chiel oversees 143 funds.
The Trustees hold office without limit in time except that (a) any Trustee may resign; (b) any Trustee may be removed by written instrument, signed by at least two-thirds of the number of Trustees prior to such removal; (c) any Trustee who requests to be retired or who has become incapacitated by illness or injury may be retired by written instrument signed by a majority of the other Trustees; and (d) any Trustee may be removed at any special meeting of shareholders by a two-thirds vote of the outstanding voting securities of the trust. Each Trustee who is not an interested person (as defined in the 1940 Act) of the trust and the fund is referred to herein as an Independent Trustee. Each Independent Trustee shall retire not later than the last day of the calendar year in which his or her 75th birthday occurs. The Independent Trustees may waive this mandatory retirement age policy with respect to individual Trustees. Officers and Advisory Board Members hold office without limit in time, except that any officer or Advisory Board Member may resign or may be removed by a vote of a majority of the Trustees at any regular meeting or any special meeting of the Trustees. Except as indicated, each individual has held the office shown or other offices in the same company for the past five years.
The fund’s Statement of Additional Information (SAI) includes more information about the Trustees. To request a free copy, call Fidelity at 1-800-835-5092.
Experience, Skills, Attributes, and Qualifications of the Trustees. The Governance and Nominating Committee has adopted a statement of policy that describes the experience, qualifications, attributes, and skills that are necessary and desirable for potential Independent Trustee candidates (Statement of Policy). The Board believes that each Trustee satisfied at the time he or she was initially elected or appointed a Trustee, and continues to satisfy, the standards contemplated by the Statement of Policy. The Governance and Nominating Committee also engages professional search firms to help identify potential Independent Trustee candidates who have the experience, qualifications, attributes, and skills consistent with the Statement of Policy. From time to time, additional criteria based on the composition and skills of the current Independent Trustees, as well as experience or skills that may be appropriate in light of future changes to board composition, business conditions, and regulatory or other developments, have also been considered by the professional search firms and the Governance and Nominating Committee. In addition, the Board takes into account the Trustees' commitment and participation in Board and committee meetings, as well as their leadership of standing and ad hoc committees throughout their tenure.
In determining that a particular Trustee was and continues to be qualified to serve as a Trustee, the Board has considered a variety of criteria, none of which, in isolation, was controlling. The Board believes that, collectively, the Trustees have balanced and diverse experience, qualifications, attributes, and skills, which allow the Board to operate effectively in governing the fund and protecting the interests of shareholders. Information about the specific experience, skills, attributes, and qualifications of each Trustee, which in each case led to the Board's conclusion that the Trustee should serve (or continue to serve) as a trustee of the fund, is provided below.
Board Structure and Oversight Function. James C. Curvey is an interested person and currently serves as Chairman. The Trustees have determined that an interested Chairman is appropriate and benefits shareholders because an interested Chairman has a personal and professional stake in the quality and continuity of services provided to the fund. Independent Trustees exercise their informed business judgment to appoint an individual of their choosing to serve as Chairman, regardless of whether the Trustee happens to be independent or a member of management. The Independent Trustees have determined that they can act independently and effectively without having an Independent Trustee serve as Chairman and that a key structural component for assuring that they are in a position to do so is for the Independent Trustees to constitute a substantial majority for the Board. The Independent Trustees also regularly meet in executive session. Ned C. Lautenbach serves as Chairman of the Independent Trustees and as such (i) acts as a liaison between the Independent Trustees and management with respect to matters important to the Independent Trustees and (ii) with management prepares agendas for Board meetings.
Fidelity® funds are overseen by different Boards of Trustees. The fund's Board oversees Fidelity's high income and certain equity funds, and other Boards oversee Fidelity's investment-grade bond, money market, asset allocation, and sector funds. The asset allocation funds may invest in Fidelity® funds overseen by the fund's Board. The use of separate Boards, each with its own committee structure, allows the Trustees of each group of Fidelity® funds to focus on the unique issues of the funds they oversee, including common research, investment, and operational issues. On occasion, the separate Boards establish joint committees to address issues of overlapping consequences for the Fidelity® funds overseen by each Board.
The Trustees operate using a system of committees to facilitate the timely and efficient consideration of all matters of importance to the Trustees, the fund, and fund shareholders and to facilitate compliance with legal and regulatory requirements and oversight of the fund's activities and associated risks. The Board, acting through its committees, has charged FMR and its affiliates with (i) identifying events or circumstances the occurrence of which could have demonstrably adverse effects on the fund's business and/or reputation; (ii) implementing processes and controls to lessen the possibility that such events or circumstances occur or to mitigate the effects of such events or circumstances if they do occur; and (iii) creating and maintaining a system designed to evaluate continuously business and market conditions in order to facilitate the identification and implementation processes described in (i) and (ii) above. Because the day-to-day operations and activities of the fund are carried out by or through FMR, its affiliates, and other service providers, the fund's exposure to risks is mitigated but not eliminated by the processes overseen by the Trustees. While each of the Board's committees has responsibility for overseeing different aspects of the fund's activities, oversight is exercised primarily through the Operations, Audit, and Compliance Committees. In addition, the Independent Trustees have worked with FMR to enhance the Board's oversight of investment and financial risks, legal and regulatory risks, technology risks, and operational risks, including the development of additional risk reporting to the Board. For example, a working group comprised of Independent Trustees and FMR has worked and continues to work to review the Fidelity® funds' valuation-related activities, reporting and risk management. Appropriate personnel, including but not limited to the fund's Chief Compliance Officer (CCO), FMR's internal auditor, the independent accountants, the fund's Treasurer and portfolio management personnel, make periodic reports to the Board's committees, as appropriate, including an annual review of Fidelity's risk management program for the Fidelity® funds. The responsibilities of each standing committee, including their oversight responsibilities, are described further under "Standing Committees of the Trustees."
Interested Trustees*:
Correspondence intended for a Trustee who is an interested person may be sent to Fidelity Investments, 245 Summer Street, Boston, Massachusetts 02210.
Name, Year of Birth; Principal Occupations and Other Relevant Experience+
Jonathan Chiel (1957)
Year of Election or Appointment: 2016
Trustee
Mr. Chiel also serves as Trustee of other Fidelity® funds. Mr. Chiel is Executive Vice President and General Counsel for FMR LLC (diversified financial services company, 2012-present). Previously, Mr. Chiel served as general counsel (2004-2012) and senior vice president and deputy general counsel (2000-2004) for John Hancock Financial Services; a partner with Choate, Hall & Stewart (1996-2000) (law firm); and an Assistant United States Attorney for the United States Attorney’s Office of the District of Massachusetts (1986-95), including Chief of the Criminal Division (1993-1995). Mr. Chiel is a director on the boards of the Boston Bar Foundation and the Maimonides School.
James C. Curvey (1935)
Year of Election or Appointment: 2007
Trustee
Chairman of the Board of Trustees
Mr. Curvey also serves as Trustee of other Fidelity® funds. Mr. Curvey is a Director of Fidelity Research & Analysis Co. (investment adviser firm, 2009-present), and Vice Chairman (2007-present) and Director of FMR LLC (diversified financial services company). In addition, Mr. Curvey serves as an Overseer for the Boston Symphony Orchestra and a member of the board of Artis-Naples, Naples, Florida, and as a Trustee for Brewster Academy, Wolfeboro, New Hampshire. Previously, Mr. Curvey served as a Director of Fidelity Investments Money Management, Inc. (investment adviser firm, 2009-2014) and a Director of FMR and FMR Co., Inc. (investment adviser firms, 2007-2014).
Charles S. Morrison (1960)
Year of Election or Appointment: 2014
Trustee
Mr. Morrison also serves as Trustee of other funds. He serves as President of Fidelity Management & Research Company (FMR) (investment adviser firm, 2016-present), a Director of Fidelity Investments Money Management, Inc. (FIMM) (investment adviser firm, 2014-present), Director of Fidelity SelectCo, LLC (investment adviser firm, 2014-present), President, Asset Management (2014-present), and is an employee of Fidelity Investments. Previously, Mr. Morrison served as Vice President of Fidelity's Fixed Income and Asset Allocation Funds (2012-2014), President, Fixed Income (2011-2014), Vice President of Fidelity's Money Market Funds (2005-2009), President, Money Market Group Leader of FMR (investment adviser firm, 2009), and Senior Vice President, Money Market Group of FMR (2004-2009). Mr. Morrison also served as Vice President of Fidelity's Bond Funds (2002-2005), certain Balanced Funds (2002-2005), and certain Asset Allocation Funds (2002-2007), and as Senior Vice President (2002-2005) of Fidelity's Bond Division.
* Determined to be an “Interested Trustee” by virtue of, among other things, his or her affiliation with the trust or various entities under common control with FMR.
+ The information includes the Trustee's principal occupation during the last five years and other information relating to the experience, attributes, and skills relevant to the Trustee's qualifications to serve as a Trustee, which led to the conclusion that the Trustee should serve as a Trustee for the fund.
Independent Trustees:
Correspondence intended for an Independent Trustee may be sent to Fidelity Investments, P.O. Box 55235, Boston, Massachusetts 02205-5235.
Name, Year of Birth; Principal Occupations and Other Relevant Experience+
Dennis J. Dirks (1948)
Year of Election or Appointment: 2005
Trustee
Mr. Dirks also serves as Trustee of other Fidelity® funds. Prior to his retirement in May 2003, Mr. Dirks was Chief Operating Officer and a member of the Board of The Depository Trust & Clearing Corporation (DTCC). He also served as President, Chief Operating Officer, and Board member of The Depository Trust Company (DTC) and President and Board member of the National Securities Clearing Corporation (NSCC). In addition, Mr. Dirks served as Chief Executive Officer and Board member of the Government Securities Clearing Corporation, Chief Executive Officer and Board member of the Mortgage-Backed Securities Clearing Corporation, as a Trustee and a member of the Finance Committee of Manhattan College (2005-2008), as a Trustee and a member of the Finance Committee of AHRC of Nassau County (2006-2008), as a member of the Independent Directors Council (IDC) Governing Council (2010-2015), and as a member of the Board of Directors for The Brookville Center for Children’s Services, Inc. (2009-2017). Mr. Dirks is a member of the Finance Committee (2016-present) and Board of Directors (2017-present) of the Asolo Repertory Theatre.
Alan J. Lacy (1953)
Year of Election or Appointment: 2008
Trustee
Mr. Lacy also serves as Trustee of other Fidelity® funds. Mr. Lacy serves as a Director of Bristol-Myers Squibb Company (global pharmaceuticals, 2008-present). He is a Trustee of the California Chapter of The Nature Conservancy (2015-present) and a Director of the Center for Advanced Study in the Behavioral Sciences at Stanford University (2015-present). In addition, Mr. Lacy served as Senior Adviser (2007-2014) of Oak Hill Capital Partners, L.P. (private equity) and also served as Chief Executive Officer (2005) and Vice Chairman (2005-2006) of Sears Holdings Corporation (retail) and Chief Executive Officer and Chairman of the Board of Sears, Roebuck and Co. (retail, 2000-2005). Previously, Mr. Lacy served as Chairman (2014-2017) and a member (2010-2017) of the Board of Directors of Dave & Buster’s Entertainment, Inc. (restaurant and entertainment complexes), as Chairman (2008-2011) and a member (2006-2015) of the Board of Trustees of the National Parks Conservation Association, and as a member of the Board of Directors for The Hillman Companies, Inc. (hardware wholesalers, 2010-2014), Earth Fare, Inc. (retail grocery, 2010-2014), and The Western Union Company (global money transfer, 2006-2011).
Ned C. Lautenbach (1944)
Year of Election or Appointment: 2000
Trustee
Chairman of the Independent Trustees
Mr. Lautenbach also serves as Trustee of other Fidelity® funds. Mr. Lautenbach currently serves as Vice Chair of the Board of Governors, State University System of Florida (2013-present) and is a member of the Council on Foreign Relations (1994-present). He is also a member and has most recently served as Chairman of the Board of Directors of Artis-Naples (2012-present). Previously, Mr. Lautenbach served as a member and then Lead Director of the Board of Directors of Eaton Corporation (diversified industrial, 1997-2016). He was also a Partner and Advisory Partner at Clayton, Dubilier & Rice, LLC (private equity investment, 1998-2010), as well as a Director of Sony Corporation (2006-2007). In addition, Mr. Lautenbach also had a 30-year career with IBM (technology company) during which time he served as Senior Vice President and a member of the Corporate Executive Committee (1968-1998).
Joseph Mauriello (1944)
Year of Election or Appointment: 2008
Trustee
Mr. Mauriello also serves as Trustee of other Fidelity® funds. Prior to his retirement in January 2006, Mr. Mauriello served in numerous senior management positions including Deputy Chairman and Chief Operating Officer (2004-2005), and Vice Chairman of Financial Services (2002-2004) of KPMG LLP US (professional services, 1965-2005). Mr. Mauriello currently serves as a member of the Board of Directors of XL Group plc. (global insurance and re-insurance, 2006-present) and the Independent Directors Council (IDC) Governing Council (2015-present). Previously, Mr. Mauriello served as a Director of the Hamilton Funds of the Bank of New York (2006-2007) and of Arcadia Resources Inc. (health care services and products, 2007-2012).
Cornelia M. Small (1944)
Year of Election or Appointment: 2005
Trustee
Ms. Small also serves as Trustee of other Fidelity® funds. Ms. Small is a member of the Board of Directors (2009-present) and Chair of the Investment Committee (2010-present) of the Teagle Foundation. Ms. Small also serves on the Investment Committee of the Berkshire Taconic Community Foundation (2008-present). Previously, Ms. Small served as Chairperson (2002-2008) and a member of the Investment Committee and Chairperson (2008-2012) and a member of the Board of Trustees of Smith College. In addition, Ms. Small served as Chief Investment Officer, Director of Global Equity Investments, and a member of the Board of Directors of Scudder, Stevens & Clark and Scudder Kemper Investments.
William S. Stavropoulos (1939)
Year of Election or Appointment: 2001
Trustee
Vice Chairman of the Independent Trustees
Mr. Stavropoulos also serves as Trustee of other Fidelity® funds. Mr. Stavropoulos serves as President and Founder of the Michigan Baseball Foundation, the Great Lakes Loons (2007-present). Mr. Stavropoulos is Chairman Emeritus of the Board of Directors of The Dow Chemical Company, where he previously served in numerous senior management positions, including President, CEO (1995-2000; 2002-2004), Chairman of the Executive Committee (2000-2006), and as a member of the Board of Directors (1990-2006). Currently, Mr. Stavropoulos is Chairman of the Board of Directors of Univar Inc. (global distributor of commodity and specialty chemicals), a Director of Teradata Corporation (data warehousing and technology solutions), and a member of the Advisory Board for Metalmark Capital LLC (private equity investment, 2005-present). Mr. Stavropoulos is an operating advisor to Clayton, Dubilier & Rice, LLC (private equity investment). In addition, Mr. Stavropoulos is a member of the University of Notre Dame Advisory Council for the College of Science, a Trustee of the Rollin L. Gerstacker Foundation, and a Director of Artis-Naples in Naples, Florida. Previously, Mr. Stavropoulos served as a Director of Chemical Financial Corporation (bank holding company, 1993-2012) and Tyco International, Ltd. (multinational manufacturing and services, 2007-2012).
David M. Thomas (1949)
Year of Election or Appointment: 2008
Trustee
Mr. Thomas also serves as Trustee of other Fidelity® funds. Mr. Thomas serves as Non-Executive Chairman of the Board of Directors of Fortune Brands Home and Security (home and security products, 2011-present), as a member of the Board of Directors (2004-present) and Presiding Director (2013-present) of Interpublic Group of Companies, Inc. (marketing communication), and as a member of the Board of Trustees of the University of Florida (2013-present). Previously, Mr. Thomas served as Executive Chairman (2005-2006) and Chairman and Chief Executive Officer (2000-2005) of IMS Health, Inc. (pharmaceutical and healthcare information solutions), and a Director of Fortune Brands, Inc. (consumer products, 2000-2011).
+ The information includes the Trustee's principal occupation during the last five years and other information relating to the experience, attributes, and skills relevant to the Trustee's qualifications to serve as a Trustee, which led to the conclusion that the Trustee should serve as a Trustee for the fund.
Advisory Board Members and Officers:
Correspondence intended for an officer or Peter S. Lynch may be sent to Fidelity Investments, 245 Summer Street, Boston, Massachusetts 02210. Officers appear below in alphabetical order.
Name, Year of Birth; Principal Occupation
Peter S. Lynch (1944)
Year of Election or Appointment: 2003
Member of the Advisory Board
Mr. Lynch also serves as Member of the Advisory Board of other Fidelity® funds. Mr. Lynch is Vice Chairman and a Director of FMR (investment adviser firm) and FMR Co., Inc. (investment adviser firm). In addition, Mr. Lynch serves as a Trustee of Boston College and as the Chairman of the Inner-City Scholarship Fund. Previously, Mr. Lynch served on the Special Olympics International Board of Directors (1997-2006).
Elizabeth Paige Baumann (1968)
Year of Election or Appointment: 2017
Anti-Money Laundering (AML) Officer
Ms. Baumann also serves as AML Officer of other funds. She is Chief AML Officer (2012-present) and Senior Vice President (2014-present) of FMR LLC (diversified financial services company) and is an employee of Fidelity Investments. Previously, Ms. Baumann served as AML Officer of the funds (2012-2016), and Vice President (2007-2014) and Deputy Anti-Money Laundering Officer (2007-2012) of FMR LLC.
Marc R. Bryant (1966)
Year of Election or Appointment: 2015
Secretary and Chief Legal Officer (CLO)
Mr. Bryant also serves as Secretary and CLO of other funds. Mr. Bryant serves as CLO, Secretary, and Senior Vice President of Fidelity Management & Research Company (investment adviser firm, 2015-present) and FMR Co., Inc. (investment adviser firm, 2015-present); Secretary of Fidelity SelectCo, LLC (investment adviser firm, 2015-present) and Fidelity Investments Money Management, Inc. (investment adviser firm, 2015-present); and CLO of Fidelity Management & Research (Hong Kong) Limited and FMR Investment Management (UK) Limited (investment adviser firms, 2015-present) and Fidelity Management & Research (Japan) Limited (investment adviser firm, 2016-present). He is Senior Vice President and Deputy General Counsel of FMR LLC (diversified financial services company). Previously, Mr. Bryant served as Secretary and CLO of Fidelity Rutland Square Trust II (2010-2014) and Assistant Secretary of Fidelity's Fixed Income and Asset Allocation Funds (2013-2015). Prior to joining Fidelity Investments, Mr. Bryant served as a Senior Vice President and the Head of Global Retail Legal for AllianceBernstein L.P. (2006-2010), and as the General Counsel for ProFund Advisors LLC (2001-2006).
William C. Coffey (1969)
Year of Election or Appointment: 2009
Assistant Secretary
Mr. Coffey also serves as Assistant Secretary of other funds. He is Senior Vice President and Deputy General Counsel of FMR LLC (diversified financial services company, 2010-present), and is an employee of Fidelity Investments. Previously, Mr. Coffey served as Vice President and Associate General Counsel of FMR LLC (2005-2009).
Jonathan Davis (1968)
Year of Election or Appointment: 2010
Assistant Treasurer
Mr. Davis also serves as Assistant Treasurer of other funds, and is an employee of Fidelity Investments. Previously, Mr. Davis served as Vice President and Associate General Counsel of FMR LLC (diversified financial services company, 2003-2010).
Adrien E. Deberghes (1967)
Year of Election or Appointment: 2016
Assistant Treasurer
Mr. Deberghes also serves as an officer of other funds. He serves as Executive Vice President of Fidelity Investments Money Management, Inc. (FIMM) (investment adviser firm, 2016-present) and is an employee of Fidelity Investments (2008-present). Prior to joining Fidelity Investments, Mr. Deberghes was Senior Vice President of Mutual Fund Administration at State Street Corporation (2007-2008), Senior Director of Mutual Fund Administration at Investors Bank & Trust (2005-2007), and Director of Finance for Dunkin' Brands (2000-2005). Previously, Mr. Deberghes served in other fund officer roles.
Joseph DeSantis (1959)
Year of Election or Appointment: 2017
Vice President
Mr. DeSantis also serves as Vice President of other funds. Mr. DeSantis serves as a Director of Fidelity Management & Research (Japan) Limited (investment adviser firm, 2016-present), Chief Investment Officer, Equities (2010-present) and is an employee of Fidelity Investments.
Stephanie J. Dorsey (1969)
Year of Election or Appointment: 2010
Assistant Treasurer
Ms. Dorsey also serves as an officer of other funds. She is an employee of Fidelity Investments (2008-present) and has served in other fund officer roles. Prior to joining Fidelity Investments, Ms. Dorsey served as Treasurer (2004-2008) of the JPMorgan Mutual Funds and Vice President (2004-2008) of JPMorgan Chase Bank.
Howard J. Galligan III (1966)
Year of Election or Appointment: 2014
Chief Financial Officer
Mr. Galligan also serves as Chief Financial Officer of other funds. Mr. Galligan serves as President of Fidelity Pricing and Cash Management Services (FPCMS) (2014-present) and as a Director of Strategic Advisers, Inc. (investment adviser firm, 2008-present). Previously, Mr. Galligan served as Chief Administrative Officer of Asset Management (2011-2014) and Chief Operating Officer and Senior Vice President of Investment Support for Strategic Advisers, Inc. (2003-2011).
Brian B. Hogan (1964)
Year of Election or Appointment: 2009
Vice President
Mr. Hogan also serves as Trustee or Vice President of other funds. Mr. Hogan serves as a Director of FMR Investment Management (UK) Limited (investment adviser firm, 2015-present) and Fidelity SelectCo, LLC (investment adviser firm, 2014-present) and President of the Equity Division of FMR (investment adviser firm, 2009-present). Previously, Mr. Hogan served as Senior Vice President, Equity Research of FMR (2006-2009) and as a portfolio manager. Mr. Brian B. Hogan is not related to Mr. Colm A. Hogan.
Colm A. Hogan (1973)
Year of Election or Appointment: 2016
Deputy Treasurer
Mr. Hogan also serves as an officer of other funds. Mr. Hogan is an employee of Fidelity Investments (2005-present). Mr. Colm A. Hogan is not related to Mr. Brian B. Hogan.
Chris Maher (1972)
Year of Election or Appointment: 2013
Assistant Treasurer
Mr. Maher serves as Assistant Treasurer of other funds. Mr. Maher is Vice President of Valuation Oversight and is an employee of Fidelity Investments. Previously, Mr. Maher served as Vice President of Asset Management Compliance (2013), Vice President of the Program Management Group of FMR (investment adviser firm, 2010-2013), and Vice President of Valuation Oversight (2008-2010).
Rieco E. Mello (1969)
Year of Election or Appointment: 2017
Assistant Treasurer
Mr. Mello also serves as Assistant Treasurer of other funds. Mr. Mello is an employee of Fidelity Investments (1995-present).
Kenneth B. Robins (1969)
Year of Election or Appointment: 2016
Chief Compliance Officer
Mr. Robins also serves as an officer of other funds. Mr. Robins serves as Compliance Officer of Fidelity Management & Research Company and FMR Co., Inc. (investment adviser firms, 2016-present) and is an employee of Fidelity Investments (2004-present). Previously, Mr. Robins served as Executive Vice President of Fidelity Investments Money Management, Inc. (investment adviser firm, 2013-2016) and served in other fund officer roles.
Stacie M. Smith (1974)
Year of Election or Appointment: 2016
President and Treasurer
Ms. Smith also serves as an officer of other funds. She is an employee of Fidelity Investments (2009-present) and has served in other fund officer roles. Prior to joining Fidelity Investments, Ms. Smith served as Senior Audit Manager of Ernst & Young LLP (accounting firm, 1996-2009). Previously, Ms. Smith served as Deputy Treasurer of certain Fidelity® funds (2013-2016).
Marc L. Spector (1972)
Year of Election or Appointment: 2016
Assistant Treasurer
Mr. Spector also serves as an officer of other funds. Mr. Spector is an employee of Fidelity Investments (2016-present). Prior to joining Fidelity Investments, Mr. Spector served as Director at the Siegfried Group (accounting firm, 2013-2016), and prior to Siegfried Group as audit senior manager at Deloitte & Touche (accounting firm, 2005-2013).
Renee Stagnone (1975)
Year of Election or Appointment: 2016
Assistant Treasurer
Ms. Stagnone also serves as an officer of other funds. Ms. Stagnone is an employee of Fidelity Investments (1997-present). Previously, Ms. Stagnone served as Deputy Treasurer of certain Fidelity® funds (2013-2016).
Shareholder Expense Example
As a shareholder of the Fund, you incur two types of costs: (1) transaction costs, including sales charges (loads) on purchase payments or redemption proceeds, redemption fees and (2) ongoing costs, including management fees, distribution and/or service (12b-1) fees and other Fund expenses. This Example is intended to help you understand your ongoing costs (in dollars) of investing in the Fund and to compare these costs with the ongoing costs of investing in other mutual funds.
The Example is based on an investment of $1,000 invested at the beginning of the period and held for the entire period (May 1, 2017 to October 31, 2017).
Actual Expenses
The first line of the accompanying table for each class of the Fund provides information about actual account values and actual expenses. You may use the information in this line, together with the amount you invested, to estimate the expenses that you paid over the period. Simply divide your account value by $1,000.00 (for example, an $8,600 account value divided by $1,000.00 = 8.6), then multiply the result by the number in the first line for a class of the Fund under the heading entitled "Expenses Paid During Period" to estimate the expenses you paid on your account during this period. A small balance maintenance fee of $12.00 that is charged once a year may apply for certain accounts with a value of less than $2,000. This fee is not included in the table below. If it was, the estimate of expenses you paid during the period would be higher, and your ending account value lower, by this amount. In addition, the Fund, as a shareholder in the underlying Fidelity Central Funds, will indirectly bear its pro-rata share of the fees and expenses incurred by the underlying Fidelity Central Funds. These fees and expenses are not included in the Fund's annualized expense ratio used to calculate the expense estimate in the table below.
Hypothetical Example for Comparison Purposes
The second line of the accompanying table for each class of the Fund provides information about hypothetical account values and hypothetical expenses based on a Class' actual expense ratio and an assumed rate of return of 5% per year before expenses, which is not the Class' actual return. The hypothetical account values and expenses may not be used to estimate the actual ending account balance or expenses you paid for the period. You may use this information to compare the ongoing costs of investing in the Fund and other funds. To do so, compare this 5% hypothetical example with the 5% hypothetical examples that appear in the shareholder reports of the other funds. A small balance maintenance fee of $12.00 that is charged once a year may apply for certain accounts with a value of less than $2,000. This fee is not included in the table below. If it was, the estimate of expenses you paid during the period would be higher, and your ending account value lower, by this amount. In addition, the Fund, as a shareholder in the underlying Fidelity Central Funds, will indirectly bear its pro-rata share of the fees and expenses incurred by the underlying Fidelity Central Funds. These fees and expenses are not included in the Fund's annualized expense ratio used to calculate the expense estimate in the table below.
Please note that the expenses shown in the table are meant to highlight your ongoing costs only and do not reflect any transaction costs. Therefore, the second line of the table is useful in comparing ongoing costs only, and will not help you determine the relative total costs of owning different funds. In addition, if these transactional costs were included, your costs would have been higher.
| | Annualized Expense Ratio-A | Beginning
Account Value
May 1, 2017 | Ending
Account Value
October 31, 2017 | Expenses Paid
During Period-B
May 1, 2017
to October 31, 2017 |
| Class A | 1.33% | | | |
| Actual | | $1,000.00 | $1,136.90 | $7.16 |
| Hypothetical-C | | $1,000.00 | $1,018.50 | $6.77 |
| Class M | 1.57% | | | |
| Actual | | $1,000.00 | $1,135.50 | $8.45 |
| Hypothetical-C | | $1,000.00 | $1,017.29 | $7.98 |
| Class C | 2.10% | | | |
| Actual | | $1,000.00 | $1,132.60 | $11.29 |
| Hypothetical-C | | $1,000.00 | $1,014.62 | $10.66 |
| International Discovery | .98% | | | |
| Actual | | $1,000.00 | $1,139.00 | $5.28 |
| Hypothetical-C | | $1,000.00 | $1,020.27 | $4.99 |
| Class K | .87% | | | |
| Actual | | $1,000.00 | $1,139.50 | $4.69 |
| Hypothetical-C | | $1,000.00 | $1,020.82 | $4.43 |
| Class I | 1.01% | | | |
| Actual | | $1,000.00 | $1,138.80 | $5.44 |
| Hypothetical-C | | $1,000.00 | $1,020.11 | $5.14 |
| Class Z | .86% | | | |
| Actual | | $1,000.00 | $1,139.40 | $4.64 |
| Hypothetical-C | | $1,000.00 | $1,020.87 | $4.38 |
A Annualized expense ratio reflects expenses net of applicable fee waivers.
B Expenses are equal to each Class' annualized expense ratio, multiplied by the average account value over the period, multiplied by 184/365 (to reflect the one-half year period).
C 5% return per year before expenses
Distributions (Unaudited)
The Board of Trustees of Fidelity International Discovery fund voted to pay to shareholders of record at the opening of business on record date, the following distributions per share derived from capital gains realized from sales of portfolio securities, and dividends derived from net investment income:
| | Pay Date | Record Date | Dividends | Capital Gains |
| Fidelity International Discovery Fund | | | | |
| Class A | 12/11/17 | 12/08/17 | $0.340 | $1.832 |
| Class M | 12/11/17 | 12/08/17 | $0.240 | $1.832 |
| Class C | 12/11/17 | 12/08/17 | $0.022 | $1.832 |
| International Discovery | 12/11/17 | 12/08/17 | $0.502 | $1.832 |
| Class K | 12/11/17 | 12/08/17 | $0.554 | $1.832 |
| Class I | 12/11/17 | 12/08/17 | $0.490 | $1.832 |
| Class Z | 12/11/17 | 12/08/17 | $0.555 | $1.832 |
|
The fund hereby designates as a capital gain dividend with respect to the taxable year ended October 31, 2017, $412,933,613, or, if subsequently determined to be different, the net capital gain of such year.
Class A designates 2%; Class M designates 3%; Class C designates 5%; International Discovery designates 2%; Class K designates 2%; Class I designates 2% and Class Z designates 2% of the dividends distributed in during the fiscal year as qualifying for the dividends–received deduction for corporate shareholders.
Class A, Class M, Class C, International Discovery, Class K, Class I and Class Z designate 100% of dividends distributed during the fiscal year as amounts which may be taken into account as a dividend for purposes of the maximum rate under section 1(h)(11) of the Internal Revenue Code.
The amounts per share which represent income derived from sources within, and taxes paid to, foreign countries or possessions of the United States are as follows:
| | Pay Date | Income | Taxes |
| Fidelity International Discovery Fund | | | |
| Class A | 12/12/16 | $0.5749 | $0.0559 |
| Class M | 12/12/16 | $0.4739 | $0.0559 |
| Class C | 12/12/16 | $0.2389 | $0.0559 |
| International Discovery | 12/12/16 | $0.7169 | $0.0559 |
| Class K | 12/12/16 | $0.7689 | $0.0559 |
| Class I | 12/12/16 | $0.7109 | $0.0559 |
| Class Z | 12/12/16 | $0.7729 | $0.0559 |
|
The fund will notify shareholders in January 2018 of amounts for use in preparing 2017 income tax returns.
Board Approval of Investment Advisory Contracts and Management Fees
Fidelity International Discovery Fund
Each year, the Board of Trustees, including the Independent Trustees (together, the Board), votes on the renewal of the management contract with Fidelity Management & Research Company (FMR) and the sub-advisory agreements (together, the Advisory Contracts) for the fund. FMR and the sub-advisers are referred to herein as the Investment Advisers. The Board, assisted by the advice of fund counsel and Independent Trustees' counsel, requests and considers a broad range of information relevant to the renewal of the Advisory Contracts throughout the year.
The Board meets regularly and, at each of its meetings, covers an extensive agenda of topics and materials and considers factors that are relevant to its annual consideration of the renewal of the fund's Advisory Contracts, including the services and support provided to the fund and its shareholders. The Board has established various standing committees (Committees), each composed of and chaired by Independent Trustees with varying backgrounds, to which the Board has assigned specific subject matter responsibilities in order to enhance effective decision-making by the Board. The Board, acting directly and through its Committees, requests and receives information concerning the annual consideration of the renewal of the fund's Advisory Contracts. The Board also meets as needed to review matters specifically related to the Board's annual consideration of the renewal of the Advisory Contracts. Members of the Board may also meet with trustees of other Fidelity funds through ad hoc joint committees to discuss certain matters relevant to all of the Fidelity funds.
At its July 2017 meeting, the Board unanimously determined to renew the fund's Advisory Contracts. In reaching its determination, the Board considered all factors it believed relevant, including (i) the nature, extent, and quality of the services to be provided to the fund and its shareholders (including the investment performance of the fund); (ii) the competitiveness of the fund's management fee and total expense ratio relative to peer funds; (iii) the total costs of the services to be provided by and the profits to be realized by Fidelity from its relationships with the fund; and (iv) the extent to which, if any, economies of scale exist and would be realized as the fund grows, and whether any economies of scale are appropriately shared with fund shareholders.
In considering whether to renew the Advisory Contracts for the fund, the Board reached a determination, with the assistance of fund counsel and Independent Trustees' counsel and through the exercise of its business judgment, that the renewal of the Advisory Contracts was in the best interests of the fund and its shareholders and that the compensation payable under the Advisory Contracts was fair and reasonable. The Board's decision to renew the Advisory Contracts was not based on any single factor, but rather was based on a comprehensive consideration of all the information provided to the Board at its meetings throughout the year. The Board, in reaching its determination to renew the Advisory Contracts, was aware that shareholders of the fund have a broad range of investment choices available to them, including a wide choice among funds offered by Fidelity's competitors, and that the fund's shareholders, who have the opportunity to review and weigh the disclosure provided by the fund in its prospectus and other public disclosures, have chosen to invest in this fund, which is part of the Fidelity family of funds.
Amendment to Group Fee Rate. The Board also approved an amendment to the management contract for the fund to add an additional breakpoint to the group fee schedule, effective October 1, 2017. The Board noted that the additional breakpoint would result in lower management fee rates as Fidelity's assets under management increase.
Nature, Extent, and Quality of Services Provided. The Board considered Fidelity's staffing as it relates to the fund, including the backgrounds of investment personnel of Fidelity, and also considered the fund's investment objective, strategies, and related investment philosophy. The Independent Trustees also had discussions with senior management of Fidelity's investment operations and investment groups. The Board considered the structure of the investment personnel compensation program and whether this structure provides appropriate incentives to act in the best interests of the fund. Additionally, the Board considered the portfolio managers' investments, if any, in the funds that they manage.
Resources Dedicated to Investment Management and Support Services. The Board and the Fund Oversight and Research Committees reviewed the general qualifications and capabilities of Fidelity's investment staff, including its size, education, experience, and resources, as well as Fidelity's approach to recruiting, training, managing, and compensating investment personnel. The Board noted that Fidelity has continued to increase the resources devoted to non-U.S. offices, including expansion of Fidelity's global investment organization. The Board also noted that Fidelity's analysts have extensive resources, tools and capabilities that allow them to conduct sophisticated quantitative and fundamental analysis, as well as credit analysis of issuers, counterparties and guarantors. Further, the Board considered that Fidelity's investment professionals have sufficient access to global information and data so as to provide competitive investment results over time, and that those professionals also have access to sophisticated tools that permit them to assess portfolio construction and risk and performance attribution characteristics continuously, as well as to transmit new information and research conclusions rapidly around the world. Additionally, in its deliberations, the Board considered Fidelity's trading, risk management, compliance, and technology and operations capabilities and resources, which are integral parts of the investment management process.
Shareholder and Administrative Services. The Board considered (i) the nature, extent, quality, and cost of advisory, administrative, and shareholder services performed by the Investment Advisers and their affiliates under the Advisory Contracts and under separate agreements covering transfer agency, pricing and bookkeeping, and securities lending services for the fund; (ii) the nature and extent of the supervision of third party service providers, principally custodians, subcustodians, and pricing vendors; and (iii) the resources devoted to, and the record of compliance with, the fund's compliance policies and procedures. The Board also reviewed the allocation of fund brokerage, including allocations to brokers affiliated with the Investment Advisers, the use of brokerage commissions to pay fund expenses, and the use of "soft" commission dollars to pay for research services.
The Board noted that the growth of fund assets over time across the complex allows Fidelity to reinvest in the development of services designed to enhance the value or convenience of the Fidelity funds as investment vehicles. These services include 24-hour access to account information and market information through telephone representatives and over the Internet, investor education materials and asset allocation tools, and the expanded availability of Fidelity Investor Centers.
In 2014, the Board formed an ad hoc Committee on Transfer Agency Fees to review the variety of transfer agency fee structures throughout the industry and Fidelity's competitive positioning with respect to industry participants.
Investment in a Large Fund Family. The Board considered the benefits to shareholders of investing in a Fidelity fund, including the benefits of investing in a fund that is part of a large family of funds offering a variety of investment disciplines and providing a large variety of mutual fund investor services. The Board noted that Fidelity had taken, or had made recommendations that resulted in the Fidelity funds taking, a number of actions over the previous year that benefited particular funds, including: (i) continuing to dedicate additional resources to Fidelity's investment research process, and to the support of the senior management team that oversees asset management; (ii) continuing efforts to enhance Fidelity's global research capabilities; (iii) launching new funds and making other enhancements to meet client needs; (iv) launching new share classes of existing funds; (v) eliminating purchase minimums and broadening eligibility requirements for certain lower-priced share classes; (vi) reducing management fees and total expenses for certain growth equity funds and index funds; (vii) lowering expense caps for certain existing funds and classes to reduce expenses borne by shareholders; (viii) eliminating short-term redemption fees for certain funds; (ix) introducing a new pricing structure for certain funds of funds that is expected to reduce overall expenses paid by shareholders; (x) rationalizing product lines and gaining increased efficiencies through proposals for fund mergers and share class consolidations; (xi) continuing to develop, acquire and implement systems and technology to improve services to the funds and shareholders, strengthen information security, and increase efficiency; and (xii) implementing enhancements to further strengthen Fidelity's product line to increase investors' probability of success in achieving their investment goals, including retirement income goals.
Investment Performance. The Board considered whether the fund has operated in accordance with its investment objective, as well as its record of compliance with its investment restrictions and its performance history.
The Board took into account discussions with representatives of the Investment Advisers about fund investment performance that occur at Board meetings throughout the year. In this regard the Board noted that as part of regularly scheduled fund reviews and other reports to the Board on fund performance, the Board considers annualized return information for the fund for different time periods, measured against a securities market index ("benchmark index") and a peer group of funds with similar objectives ("peer group"), if any. In its evaluation of fund investment performance, the Board gave particular attention to information indicating changes in performance of certain Fidelity funds for specific time periods and discussed with the Investment Advisers the reasons for any overperformance or underperformance.
In addition to reviewing absolute and relative fund performance, the Independent Trustees periodically consider the appropriateness of fund performance metrics in evaluating the results achieved. In general, the Independent Trustees believe that fund performance should be evaluated based on net performance (after fees and expenses) of both the highest performing and lowest performing fund share classes, where applicable, compared to appropriate benchmark indices, over appropriate time periods that may include full market cycles, and compared to peer groups, as applicable, over the same periods, taking into account relevant factors including the following: general market conditions; issuer-specific information; and fund cash flows and other factors.
The Independent Trustees recognize that shareholders evaluate performance on a net basis over their own holding periods, for which one-, three-, and five-year periods are often used as a proxy. For this reason, the performance information reviewed by the Board also included net cumulative calendar year total return information for the fund and an appropriate benchmark index and peer group for the most recent one-, three-, and five-year periods, as shown below. Returns are shown compared to the 25th percentile (top of box, 75% beaten) and 75th percentile (bottom of box, 25% beaten) of the peer universe. Returns of the benchmark index are "net MA,"
i.e., adjusted for tax withholding rates applicable to U.S.-based funds organized as Massachusetts business trusts.
Fidelity International Discovery Fund
The Board has discussed the fund's underperformance (based on the December 31, 2016 data presented herein) with FMR, including the fund's investment strategy, the portfolio management team, and broader trends in the market that may have impacted the fund's performance, and has engaged with FMR to consider what steps might be taken to remediate the fund's underperformance. The Board noted that the fund's performance has improved since the period shown.
The Board also considered that the fund's management fee is subject to upward or downward adjustment depending upon whether, and to what extent, the fund's investment performance for the performance period (a rolling 36-month period) exceeds, or is exceeded by, a securities index, thus leading to a performance adjustment for the same period. The Board noted that the performance adjustment provides FMR with a strong economic incentive to seek to achieve superior long-term performance for the fund's shareholders and helps to more closely align the interests of FMR and the shareholders of the fund.
Based on its review, the Board concluded that the nature, extent, and quality of services provided to the fund under the Advisory Contracts should continue to benefit the shareholders of the fund.
Competitiveness of Management Fee and Total Expense Ratio. The Board considered the fund's management fee and total expense ratio compared to "mapped groups" of competitive funds and classes created for the purpose of facilitating the Trustees' competitive analysis of management fees and total expenses. Fidelity creates "mapped groups" by combining similar Lipper investment objective categories that have comparable investment mandates. Combining Lipper investment objective categories aids the Board's management fee and total expense ratio comparisons by broadening the competitive group used for comparison.
Management Fee. The Board considered two proprietary management fee comparisons for the 12-month periods shown in basis points (BP) in the chart below. The group of Lipper funds used by the Board for management fee comparisons is referred to below as the "Total Mapped Group." The Total Mapped Group comparison focuses on a fund's standing in terms of gross management fees before expense reimbursements or caps, and without giving effect to the fund's performance adjustment, relative to the total universe of funds with comparable investment mandates, regardless of whether their management fee structures also are comparable. Funds with comparable investment mandates offer exposure to similar types of securities. Funds with comparable management fee structures have similar management fee contractual arrangements (
e.g., flat rate charged for advisory services, all-inclusive fee rate,
etc.). "TMG %" represents the percentage of funds in the Total Mapped Group that had management fees that were lower than the fund's. For example, a hypothetical TMG % of 20% would mean that 80% of the funds in the Total Mapped Group had higher, and 20% had lower, management fees than the fund. The fund's actual TMG %s and the number of funds in the Total Mapped Group are in the chart below. The "Asset-Size Peer Group" (ASPG) comparison focuses on a fund's standing relative to a subset of non-Fidelity funds within the Total Mapped Group that are similar in size and management fee structure without taking into account performance adjustments, if any. For example, if a fund is in the first quartile of the ASPG, the fund's management fee ranks in the least expensive or lowest 25% of funds in the ASPG. The ASPG represents at least 15% of the funds in the Total Mapped Group with comparable asset size and management fee structures, subject to a minimum of 50 funds (or all funds in the Total Mapped Group if fewer than 50). Additional information, such as the ASPG quartile in which the fund's management fee rate ranked and the impact of the fund's performance adjustment, is also included in the chart and considered by the Board.
Fidelity International Discovery Fund
The Board noted that the fund's management fee rate ranked below the median of its Total Mapped Group and below the median of its ASPG for 2016. The Board also noted the effect of the fund's performance adjustment, if any, on the fund's management fee ranking.
Furthermore, the Board considered that it had approved a reduction (effective August 1, 2014) in the individual fund fee rate component of the management fee rate for the fund from 0.450% to 0.424%. The Board considered that the chart reflects the fund's lower management fee rate for 2014, as if the lower fee rate were in effect for the entire year.
The Board noted that, in 2014, the Board and the boards of other Fidelity funds formed the ad hoc Committee on Group Fee to conduct an in-depth review of the "group fee" component of the management fee of funds with such management fee structures. The Committee's focus included the mechanics of the group fee, the competitive landscape of group fee structures, Fidelity funds with no group fee component and investment products not included in group fee assets. The Board also considered that, for funds subject to the group fee, FMR agreed to voluntarily waive fees over a specified period of time in amounts designed to account for assets converted from certain funds to certain collective investment trusts.
The Board also noted that, in 2013, the ad hoc Committee on Management Fees was formed to conduct an in-depth review of the management fee rates of Fidelity's active equity mutual funds. The Committee focused on the following areas: (i) standard fee structures; (ii) research consumption and trading evolution; (iii) management fee competitiveness/profitability by category; and (iv) factors that drive institutional pricing.
Based on its review, the Board concluded that the fund's management fee is fair and reasonable in light of the services that the fund receives and the other factors considered.
Total Expense Ratio. In its review of each class's total expense ratio, the Board considered the fund's management fee rate as well as other fund or class expenses, as applicable, such as transfer agent fees, pricing and bookkeeping fees, fund-paid 12b-1 fees, and custodial, legal, and audit fees. The Board noted the impact of the fund's performance adjustment. The Board also noted that Fidelity may agree to waive fees and expenses from time to time, and the extent to which, if any, it has done so for the fund. As part of its review, the Board also considered the current and historical total expense ratios of each class of the fund compared to competitive fund median expenses. Each class of the fund is compared to those funds and classes in the Total Mapped Group (used by the Board for management fee comparisons) that have a similar sales load structure.
The Board noted that the total expense ratio of each of Class A, Class I, Class Z, the retail class, and Class K ranked below the competitive median for 2016 and the total expense ratio of each of Class M (formerly Class T) and Class C ranked above the competitive median for 2016. The Board considered that, in general, various factors can affect total expense ratios. The Board noted that the total expense ratio of Class M was above the competitive median primarily because of higher 12b-1 fees on Class M as compared to most competitor funds. Class M has a higher 12b-1 fee, but a lower front-end sales charge, than traditionally priced front-end sales charge classes. The Board considered that Class M is primarily sold load-waived in the retirement plan market where its 0.50% 12b-1 fee is comparable to competing no-load, higher 12b-1 fee classes designed specifically for retirement plans. The Board noted that the total expense ratio of Class C was above the competitive median primarily because of its 12b-1 fees. The Board noted that the fund offers multiple classes, each of which has a different sales load and 12b-1 fee structure, and that the multiple structures are intended to offer a range of pricing options for the intermediary market. The Board also noted that the total expense ratios of the classes vary primarily by the level of their 12b-1 fees, although differences in transfer agent fees may also cause expenses to vary from class to class.
Fees Charged to Other Fidelity Clients. The Board also considered Fidelity fee structures and other information with respect to clients of Fidelity, such as other funds advised or subadvised by Fidelity, pension plan clients, and other institutional clients with similar mandates. The Board noted that an ad hoc joint committee created by it and the boards of other Fidelity funds periodically (most recently in 2013) reviews and compares Fidelity's institutional investment advisory business with its business of providing services to the Fidelity funds, including the differences in services provided, fees charged, and costs incurred, as well as competition in their respective marketplaces.
Based on its review of total expense ratios and fees charged to other Fidelity clients, the Board concluded that, although some classes were above the median of the universe presented for comparison, the total expense ratio of each class of the fund was reasonable in light of the services that the fund and its shareholders receive and the other factors considered.
Costs of the Services and Profitability. The Board considered the revenues earned and the expenses incurred by Fidelity in conducting the business of developing, marketing, distributing, managing, administering and servicing the fund and servicing the fund's shareholders. The Board also considered the level of Fidelity's profits in respect of all the Fidelity funds.
On an annual basis, Fidelity presents to the Board information about the profitability of its relationships with the fund. Fidelity calculates profitability information for each fund, as well as aggregate profitability information for groups of Fidelity funds and all Fidelity funds, using a series of detailed revenue and cost allocation methodologies which originate with the books and records of Fidelity on which Fidelity's audited financial statements are based. The Audit Committee of the Board reviews any significant changes from the prior year's methodologies.
PricewaterhouseCoopers LLP (PwC), independent registered public accounting firm and auditor to Fidelity and certain Fidelity funds, has been engaged annually by the Board as part of the Board's assessment of Fidelity's profitability analysis. PwC's engagement includes the review and assessment of the methodologies used by Fidelity in determining the revenues and expenses attributable to Fidelity's mutual fund business, and completion of agreed-upon procedures in respect of the mathematical accuracy of the fund profitability information and its conformity to established allocation methodologies. After considering PwC's reports issued under the engagement and information provided by Fidelity, the Board concluded that while other allocation methods may also be reasonable, Fidelity's profitability methodologies are reasonable in all material respects.
The Board also reviewed Fidelity's non-fund businesses and potential fall-out benefits related to the mutual fund business as well as cases where Fidelity's affiliates may benefit from or be related to the fund's business.
The Board considered the costs of the services provided by and the profits realized by Fidelity in connection with the operation of the fund and was satisfied that the profitability was not excessive.
Economies of Scale. The Board considered whether there have been economies of scale in respect of the management of the Fidelity funds, whether the Fidelity funds (including the fund) have appropriately benefited from any such economies of scale, and whether there is potential for realization of any further economies of scale. The Board considered the extent to which the fund will benefit from economies of scale as assets grow through increased services to the fund, through waivers or reimbursements, or through fee or expense ratio reductions. The Board also noted that a committee (the Economies of Scale Committee) created by it and the boards of other Fidelity funds periodically (most recently in 2013) analyzes whether Fidelity attains economies of scale in respect of the management and servicing of the Fidelity funds, whether the Fidelity funds have appropriately benefited from such economies of scale, and whether there is potential for realization of any further economies of scale.
The Board recognized that the fund's management contract incorporates a "group fee" structure, which provides for lower group fee rates as total group assets increase, and for higher group fee rates as total group assets decrease (with "group assets" defined to include fund assets under FMR's management plus the assets of sector funds previously under FMR's management). FMR calculates the group fee rates based on a tiered asset "breakpoint" schedule that varies based on asset class. The Board considered that the group fee is designed to deliver the benefits of economies of scale to fund shareholders when total Fidelity fund assets increase, even if assets of any particular fund are unchanged or have declined, because some portion of Fidelity's costs are attributable to services provided to all Fidelity funds, and all funds benefit if those costs can be allocated among more assets. The Board concluded that, given the group fee structure, fund shareholders will benefit from lower management fees as group assets increase at the fund complex level, regardless of whether Fidelity achieves any such economies of scale.
The Board concluded, taking into account the analysis of the Economies of Scale Committee, that economies of scale, if any, are being appropriately shared between fund shareholders and Fidelity.
Additional Information Requested by the Board. In order to develop fully the factual basis for consideration of the Fidelity funds' advisory contracts, the Board requested and received additional information on certain topics, including: (i) fund performance trends, in particular the underperformance of certain funds, and Fidelity's long-term strategies for certain funds; (ii) Fidelity's fund profitability methodology, profitability trends for certain funds, and the impact of certain factors on fund profitability results, including the impact of market trends on actively managed funds; (iii) the use of performance fees and the calculation of performance adjustments, including the impact of underperformance and fund outflows on performance adjustments; (iv) metrics for evaluating index fund performance; (v) Fidelity's group fee structure, including the group fee breakpoint schedules; (vi) the terms of Fidelity's contractual and voluntary expense cap arrangements with the funds; (vii) the methodology with respect to evaluating competitive fund data and peer group classifications and fee comparisons; (viii) the expense structures for different funds and classes; (ix) Fidelity's arrangements with affiliated sub-advisers on behalf of the funds; (x) information regarding other accounts managed by Fidelity, including institutional accounts and collective investment trusts; (xi) recent changes to the fee structure for certain funds of funds; and (xii) the impact of the Department of Labor's new fiduciary rule on the funds' comparative expense information.
Based on its evaluation of all of the conclusions noted above, and after considering all factors it believed relevant, the Board concluded that the advisory fee structures are fair and reasonable, and that the fund's Advisory Contracts should be renewed.
Corporate Headquarters
245 Summer St.
Boston, MA 02210
www.fidelity.com
IGI-K-ANN-1217
1.863307.109
Fidelity Advisor® Emerging Europe, Middle East, Africa (EMEA) Fund - Class A, Class M (formerly Class T), Class C and Class I
Annual Report October 31, 2017 Class A, Class M, Class C and Class I are classes of Fidelity® Emerging Europe, Middle East, Africa (EMEA) Fund |
|
Contents
To view a fund's proxy voting guidelines and proxy voting record for the 12-month period ended June 30, visit http://www.fidelity.com/proxyvotingresults or visit the Securities and Exchange Commission's (SEC) web site at http://www.sec.gov.
You may also call 1-877-208-0098 to request a free copy of the proxy voting guidelines.
Standard & Poor's, S&P and S&P 500 are registered service marks of The McGraw-Hill Companies, Inc. and have been licensed for use by Fidelity Distributors Corporation.
Other third-party marks appearing herein are the property of their respective owners.
All other marks appearing herein are registered or unregistered trademarks or service marks of FMR LLC or an affiliated company. © 2017 FMR LLC. All rights reserved.
This report and the financial statements contained herein are submitted for the general information of the shareholders of the Fund. This report is not authorized for distribution to prospective investors in the Fund unless preceded or accompanied by an effective prospectus.
A fund files its complete schedule of portfolio holdings with the SEC for the first and third quarters of each fiscal year on Form N-Q. Forms N-Q are available on the SEC’s web site at http://www.sec.gov. A fund's Forms N-Q may be reviewed and copied at the SEC’s Public Reference Room in Washington, DC. Information regarding the operation of the SEC's Public Reference Room may be obtained by calling 1-800-SEC-0330.
For a complete list of a fund's portfolio holdings, view the most recent holdings listing, semiannual report, or annual report on Fidelity's web site at http://www.fidelity.com, http://www.institutional.fidelity.com, or http://www.401k.com, as applicable.
NOT FDIC INSURED •MAY LOSE VALUE •NO BANK GUARANTEE
Neither the Fund nor Fidelity Distributors Corporation is a bank.
Performance: The Bottom Line
Average annual total return reflects the change in the value of an investment, assuming reinvestment of distributions from dividend income and capital gains (the profits earned upon the sale of securities that have grown in value, if any) and assuming a constant rate of performance each year. The hypothetical investment and the average annual total returns do not reflect the deduction of taxes that a shareholder would pay on fund distributions or the redemption of fund shares. During periods of reimbursement by Fidelity, a fund’s total return will be greater than it would be had the reimbursement not occurred. How a fund did yesterday is no guarantee of how it will do tomorrow.
Average Annual Total Returns
| For the periods ended October 31, 2017 | Past 1 year | Past 5 years | Life of fundA |
| Class A (incl. 5.75% sales charge) | 9.98% | 2.03% | 0.07% |
| Class M (incl. 3.50% sales charge) | 12.33% | 2.23% | 0.04% |
| Class C (incl. contingent deferred sales charge) | 14.85% | 2.44% | (0.07)% |
| Class I | 17.01% | 3.58% | 1.01% |
A From May 8, 2008
Class C shares' contingent deferred sales charges included in the past one year, past five years, and life of fund total return figures are 1%, 0%, and 0%, respectively.
$10,000 Over Life of Fund
Let's say hypothetically that $10,000 was invested in Fidelity Advisor® Emerging Europe, Middle East, Africa (EMEA) Fund - Class A on May 8, 2008, when the fund started, and the current 5.75% sales charge was paid.
The chart shows how the value of your investment would have changed, and also shows how the MSCI EM (Emerging Markets) Europe, Middle East and Africa Index performed over the same period.
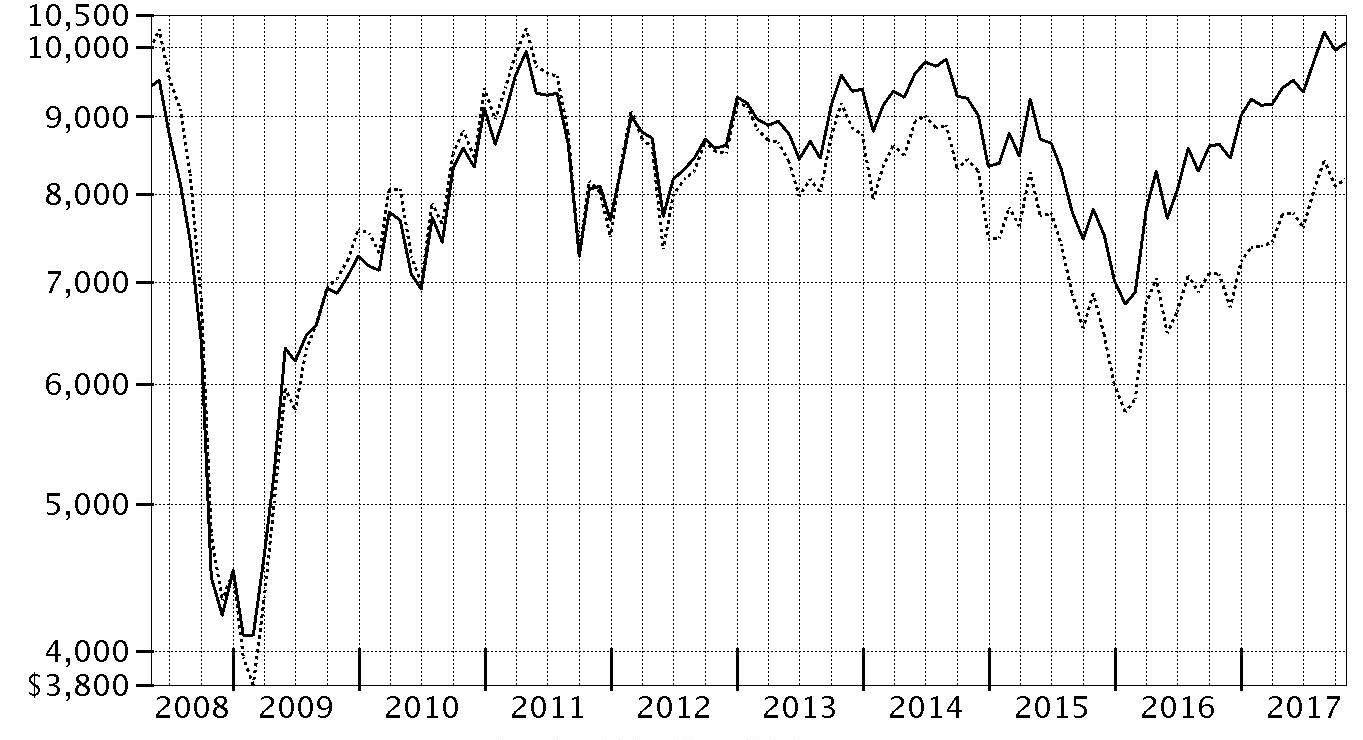
| Period Ending Values |
| $10,065 | Fidelity Advisor® Emerging Europe, Middle East, Africa (EMEA) Fund - Class A |
| $8,179 | MSCI EM (Emerging Markets) Europe, Middle East and Africa Index |
Management's Discussion of Fund Performance
Market Recap: The MSCI ACWI (All Country World Index) ex USA Index returned 23.85% for the 12 months ending October 31, 2017, helped partly by a generally weak U.S. dollar. Some favorable election results in continental Europe (+30%) suggested ebbing political uncertainty and near-term risk there, but the U.K. (+20%) faced more-mixed conditions ahead of its expected exit from the European Union. Despite central-bank easing – and pressured recently by yen strength – Japan (+18%) lagged the rest of the Asia-Pacific group (+22%). Commodity-price volatility slowed Canada (+17%), but the emerging-markets group (+26%) sped ahead. Sector-wise, information technology (+47%) was driven by a surge among several Chinese internet-related names. Financials (+27%) rode rising interest rates that, at the same time, weighed on real estate (+17%), utilities (+16%), consumer staples (+14%) and telecommunication services (+9%) – so-called “bond proxy” sectors. Materials (+28%) and industrials (+27%) responded to demand from China and price gains for certain commodities. In the energy sector (+20%), oil prices lost ground in the spring before rebounding through October 31 to end well above where they started 12 months ago. Lastly, health care (+14%) was hurt by early-period turmoil around drug pricing and health care legislation.
Comments from Portfolio Manager Adam Kutas: For the fiscal year ending October 31, 2017, the fund’s share classes gained about 16% to 17%, outpacing the 15.44% return of the MSCI EM (Emerging Markets) Europe, Middle East and Africa Index. Emerging EMEA countries, especially those with significant exposure to commodities, rallied strongly after investors decided that commodities likely had hit a bottom in late 2016. Our relatively conservative approach, which emphasizes higher-quality companies, gave the fund an edge over its MSCI benchmark, as these stocks generally posted the best returns this period. Stock selection delivered almost all of the our outperformance versus the benchmark, led by choices in financials and industrials. At the stock level, underweighting poorly performing Steinhoff International Holdings, a private-equity investor based in South Africa, was the fund’s biggest individual relative contributor. Steinhoff owns a variety of businesses, including a chain of European furniture retailers, and I found the business too opaque. While I had owned a small position early in the period to help mitigate risk, I ultimately sold it because it failed to meet my investment criteria. Also contributing was an underweighting in another weak index component, Russian retailer Magnit, which struggled amid competition. Conversely, stock picking in materials detracted notably; however, on an individual basis, underweighting South African internet company Naspers (+46%), a very large benchmark component weighed most on the fund’s relative results.
The views expressed above reflect those of the portfolio manager(s) only through the end of the period as stated on the cover of this report and do not necessarily represent the views of Fidelity or any other person in the Fidelity organization. Any such views are subject to change at any time based upon market or other conditions and Fidelity disclaims any responsibility to update such views. These views may not be relied on as investment advice and, because investment decisions for a Fidelity fund are based on numerous factors, may not be relied on as an indication of trading intent on behalf of any Fidelity fund.
Investment Summary (Unaudited)
Geographic Diversification (% of fund's net assets)
| As of October 31, 2017 |
| | South Africa | 42.4% |
| | Russia | 19.3% |
| | United Arab Emirates | 6.4% |
| | United Kingdom | 5.0% |
| | Hungary | 4.1% |
| | Poland | 4.0% |
| | Nigeria | 2.3% |
| | Greece | 2.3% |
| | Romania | 2.2% |
| | Other* | 12.0% |

* Includes Short-Term investments and Net Other Assets (Liabilities).
Percentages are based on country or territory of incorporation and are adjusted for the effect of futures contracts, if applicable.
| As of April 30, 2017 |
| | South Africa | 41.3% |
| | Russia | 21.6% |
| | United Arab Emirates | 5.8% |
| | Poland | 5.6% |
| | United Kingdom | 4.1% |
| | Romania | 2.4% |
| | Greece | 1.9% |
| | Nigeria | 1.9% |
| | Hungary | 1.8% |
| | Other* | 13.6% |

* Includes Short-Term investments and Net Other Assets (Liabilities).
Percentages are based on country or territory of incorporation and are adjusted for the effect of futures contracts, if applicable.
Asset Allocation as of October 31, 2017
| | % of fund's net assets | % of fund's net assets 6 months ago |
| Stocks | 99.6 | 99.5 |
| Short-Term Investments and Net Other Assets (Liabilities) | 0.4 | 0.5 |
Top Ten Stocks as of October 31, 2017
| | % of fund's net assets | % of fund's net assets 6 months ago |
| Naspers Ltd. Class N (South Africa, Media) | 11.7 | 8.3 |
| Sberbank of Russia (Russia, Banks) | 5.8 | 5.5 |
| Lukoil PJSC (Russia, Oil, Gas & Consumable Fuels) | 3.7 | 3.9 |
| Standard Bank Group Ltd. (South Africa, Banks) | 2.8 | 2.7 |
| Tatneft PAO (Russia, Oil, Gas & Consumable Fuels) | 2.3 | 1.6 |
| MTN Group Ltd. (South Africa, Wireless Telecommunication Services) | 2.3 | 0.9 |
| OTP Bank PLC (Hungary, Banks) | 2.2 | 1.8 |
| FirstRand Ltd. (South Africa, Diversified Financial Services) | 2.2 | 3.1 |
| NOVATEK OAO (Russia, Oil, Gas & Consumable Fuels) | 2.1 | 2.1 |
| Shoprite Holdings Ltd. (South Africa, Food & Staples Retailing) | 1.7 | 2.0 |
| | 36.8 | |
Top Market Sectors as of October 31, 2017
| | % of fund's net assets | % of fund's net assets 6 months ago |
| Financials | 31.7 | 31.1 |
| Consumer Discretionary | 20.6 | 18.9 |
| Energy | 15.5 | 16.3 |
| Materials | 9.9 | 11.3 |
| Consumer Staples | 9.0 | 10.3 |
| Industrials | 5.7 | 4.6 |
| Telecommunication Services | 3.0 | 2.1 |
| Real Estate | 2.7 | 2.7 |
| Health Care | 1.5 | 1.7 |
| Utilities | 0.0 | 0.3 |
Market Sectors may include more than one industry category.
The Fund may invest up to 35% of its total assets in any industry that represents more than 20% of the emerging Europe, Middle East and Africa markets. As of October 31, 2017, the Fund did not have more than 25% of its total assets invested in any one industry.
Percentages shown as 0.0% may reflect amounts less than 0.05%.
Investments October 31, 2017
Showing Percentage of Net Assets
| Common Stocks - 95.7% | | | |
| | | Shares | Value |
| Austria - 1.1% | | | |
| BUWOG-Gemeinnuetzige Wohnung | | 17,100 | $493,193 |
| Erste Group Bank AG | | 14,300 | 614,490 |
|
| TOTAL AUSTRIA | | | 1,107,683 |
|
| Bailiwick of Jersey - 1.1% | | | |
| Glencore Xstrata PLC | | 112,200 | 542,004 |
| Wizz Air Holdings PLC (a) | | 11,688 | 508,392 |
|
| TOTAL BAILIWICK OF JERSEY | | | 1,050,396 |
|
| Bermuda - 1.0% | | | |
| Central European Media Enterprises Ltd. Class A (a)(b) | | 220,900 | 1,016,140 |
| Botswana - 0.2% | | | |
| First National Bank of Botswana Ltd. | | 1,042,331 | 229,488 |
| British Virgin Islands - 0.5% | | | |
| Lenta Ltd. GDR (a) | | 80,900 | 510,479 |
| Canada - 0.2% | | | |
| Detour Gold Corp. (a) | | 19,100 | 203,569 |
| Cyprus - 0.5% | | | |
| Globaltrans Investment PLC GDR (Reg. S) | | 58,100 | 536,844 |
| Finland - 0.2% | | | |
| Nokian Tyres PLC | | 4,400 | 201,785 |
| Greece - 2.3% | | | |
| Fourlis Holdings SA | | 70,000 | 454,175 |
| Jumbo SA | | 26,536 | 426,564 |
| Motor Oil (HELLAS) Corinth Refineries SA | | 21,500 | 514,660 |
| Mytilineos Holdings SA (a) | | 31,000 | 324,632 |
| Sarantis SA | | 37,800 | 543,787 |
|
| TOTAL GREECE | | | 2,263,818 |
|
| Hungary - 4.1% | | | |
| MOL Hungarian Oil and Gas PLC Series A (For. Reg.) | | 120,000 | 1,436,988 |
| OTP Bank PLC | | 54,700 | 2,205,933 |
| Richter Gedeon PLC | | 16,000 | 398,041 |
|
| TOTAL HUNGARY | | | 4,040,962 |
|
| Israel - 0.5% | | | |
| Elbit Systems Ltd. (Israel) | | 3,400 | 504,026 |
| Kenya - 1.3% | | | |
| KCB Group Ltd. | | 1,771,800 | 648,948 |
| Safaricom Ltd. | | 2,640,544 | 649,001 |
|
| TOTAL KENYA | | | 1,297,949 |
|
| Morocco - 1.0% | | | |
| Attijariwafa Bank | | 11,000 | 547,765 |
| Douja Promotion Groupe Addoha SA | | 100,000 | 454,277 |
|
| TOTAL MOROCCO | | | 1,002,042 |
|
| Netherlands - 0.7% | | | |
| X5 Retail Group NV GDR (Reg. S) (a) | | 18,000 | 739,800 |
| Nigeria - 2.3% | | | |
| Dangote Cement PLC | | 888,994 | 553,152 |
| Guaranty Trust Bank PLC | | 4,000,000 | 466,667 |
| Nigerian Breweries PLC | | 1,529,339 | 637,225 |
| Zenith Bank PLC | | 9,251,272 | 655,041 |
|
| TOTAL NIGERIA | | | 2,312,085 |
|
| Oman - 0.6% | | | |
| BankMuscat SAOG | | 575,400 | 589,004 |
| Pakistan - 1.0% | | | |
| Engro Corp. Ltd. | | 185,500 | 489,607 |
| United Bank Ltd. | | 274,400 | 466,533 |
|
| TOTAL PAKISTAN | | | 956,140 |
|
| Poland - 4.0% | | | |
| Fabryki Mebli Forte SA | | 27,200 | 497,079 |
| Globe Trade Centre SA | | 273,300 | 675,751 |
| Inter Cars SA | | 7,200 | 569,678 |
| Kruk SA | | 5,900 | 452,231 |
| LPP SA | | 320 | 753,755 |
| Orbis SA | | 20,500 | 492,795 |
| Pfleiderer Grajewo SA | | 49,900 | 548,359 |
|
| TOTAL POLAND | | | 3,989,648 |
|
| Romania - 2.2% | | | |
| Banca Transilvania SA | | 953,183 | 530,618 |
| BRD-Groupe Societe Generale | | 385,088 | 1,212,170 |
| Fondul Propietatea SA GDR | | 43,000 | 464,400 |
|
| TOTAL ROMANIA | | | 2,207,188 |
|
| Russia - 15.4% | | | |
| Alrosa Co. Ltd. | | 844,400 | 1,085,822 |
| Gazprom OAO | | 599,673 | 1,291,020 |
| Lukoil PJSC | | 17,400 | 922,784 |
| Lukoil PJSC sponsored ADR | | 52,095 | 2,766,245 |
| MMC Norilsk Nickel PJSC | | 2,100 | 380,356 |
| NOVATEK OAO | | 188,100 | 2,093,931 |
| Novolipetsk Steel OJSC GDR (Reg. S) | | 45,800 | 1,055,690 |
| Sberbank of Russia | | 1,748,280 | 5,793,155 |
|
| TOTAL RUSSIA | | | 15,389,003 |
|
| South Africa - 42.4% | | | |
| African Rainbow Minerals Ltd. | | 96,000 | 842,349 |
| AngloGold Ashanti Ltd. | | 53,600 | 494,081 |
| ArcelorMittal South Africa Ltd. (a) | | 780,000 | 350,866 |
| Aveng Ltd. (a) | | 1,189,200 | 211,955 |
| AVI Ltd. | | 99,900 | 697,030 |
| Barloworld Ltd. | | 89,000 | 839,217 |
| Cashbuild Ltd. | | 21,000 | 540,642 |
| City Lodge Hotels Ltd. | | 58,200 | 518,619 |
| Clicks Group Ltd. | | 89,954 | 1,007,968 |
| Dis-Chem Pharmacies Pty Ltd. | | 212,000 | 496,310 |
| DRDGOLD Ltd. | | 2,856,814 | 972,940 |
| Exxaro Resources Ltd. | | 100,400 | 1,020,847 |
| FirstRand Ltd. | | 602,000 | 2,182,124 |
| Grindrod Ltd. (a) | | 633,200 | 697,298 |
| Hulamin Ltd. | | 1,096,900 | 558,584 |
| Imperial Holdings Ltd. | | 83,000 | 1,189,517 |
| KAP Industrial Holdings Ltd. | | 887,200 | 533,371 |
| Mr Price Group Ltd. | | 79,500 | 985,404 |
| MTN Group Ltd. | | 265,350 | 2,304,095 |
| Murray & Roberts Holdings Ltd. | | 399,000 | 451,525 |
| Nampak Ltd. (a) | | 932,900 | 1,227,261 |
| Naspers Ltd. Class N | | 47,800 | 11,646,786 |
| Pioneer Foods Ltd. | | 87,100 | 733,085 |
| Pretoria Portland Cement Co. Ltd. (a) | | 1,118,549 | 583,058 |
| PSG Group Ltd. | | 75,000 | 1,392,397 |
| Remgro Ltd. | | 89,500 | 1,354,646 |
| RMB Holdings Ltd. | | 200,000 | 884,095 |
| Sanlam Ltd. | | 312,000 | 1,560,138 |
| Shoprite Holdings Ltd. | | 120,000 | 1,717,493 |
| Spar Group Ltd. | | 82,800 | 974,245 |
| Spur Corp. Ltd. | | 241,500 | 459,301 |
| Standard Bank Group Ltd. | | 239,571 | 2,778,863 |
|
| TOTAL SOUTH AFRICA | | | 42,206,110 |
|
| Turkey - 1.7% | | | |
| Migros Turk Ticaret A/S (a) | | 75,000 | 516,007 |
| Tupras Turkiye Petrol Rafinerileri A/S | | 32,000 | 1,151,428 |
|
| TOTAL TURKEY | | | 1,667,435 |
|
| United Arab Emirates - 6.4% | | | |
| Agthia Group PJSC | | 344,787 | 490,990 |
| Aldar Properties PJSC | | 1,498,798 | 971,271 |
| DP World Ltd. | | 49,046 | 1,164,843 |
| Dubai Financial Market PJSC (a) | | 2,571,539 | 812,216 |
| Dubai Islamic Bank Pakistan Ltd. | | 609,253 | 1,015,242 |
| Dubai Parks and Resorts PJSC (a) | | 3,643,602 | 734,147 |
| National Bank of Abu Dhabi PJSC | | 418,750 | 1,180,091 |
|
| TOTAL UNITED ARAB EMIRATES | | | 6,368,800 |
|
| United Kingdom - 5.0% | | | |
| ALDREES Petroleum and Transport Services Co. ELS (HSBC Warrant Program) warrants 1/30/20 (a)(c) | | 90,625 | 708,036 |
| Banque Saudi Fransi ELS (HSBC Bank Warrant Program) warrants 3/24/20 (a)(c) | | 67,000 | 507,737 |
| BGEO Group PLC | | 7,200 | 340,431 |
| Bupa Arabia ELS (HSBC Warrant Program) warrants 10/19/18 (a)(c) | | 13,300 | 385,852 |
| Fawaz Alhokair Group ELS (HSBC Bank Warrant Program) warrants 2/28/20 (a)(c) | | 39,500 | 375,172 |
| Georgia Healthcare Group PLC (a) | | 107,500 | 499,716 |
| NMC Health PLC | | 15,349 | 589,557 |
| The Savola Group ELS (HSBC Warrant Program) warrants 1/24/20 (a)(c) | | 46,800 | 489,183 |
| Tullow Oil PLC (a) | | 140,000 | 338,413 |
| United International Transportation Co. ELS (HSBC Bank Warrant Program) warrants 7/8/20 (a)(c) | | 98,004 | 699,571 |
|
| TOTAL UNITED KINGDOM | | | 4,933,668 |
|
| TOTAL COMMON STOCKS | | | |
| (Cost $70,629,112) | | | 95,324,062 |
|
| Nonconvertible Preferred Stocks - 3.9% | | | |
| Russia - 3.9% | | | |
| Surgutneftegas OJSC | | 3,124,400 | 1,549,378 |
| Tatneft PAO | | 431,800 | 2,339,163 |
| TOTAL NONCONVERTIBLE PREFERRED STOCKS | | | |
| (Cost $2,925,647) | | | 3,888,541 |
|
| Money Market Funds - 1.2% | | | |
| Fidelity Cash Central Fund, 1.10% (d) | | 609,627 | 609,749 |
| Fidelity Securities Lending Cash Central Fund 1.11% (d)(e) | | 593,791 | 593,850 |
| TOTAL MONEY MARKET FUNDS | | | |
| (Cost $1,203,599) | | | 1,203,599 |
| TOTAL INVESTMENT IN SECURITIES - 100.8% | | | |
| (Cost $74,758,358) | | | 100,416,202 |
| NET OTHER ASSETS (LIABILITIES) - (0.8)% | | | (769,403) |
| NET ASSETS - 100% | | | $99,646,799 |
Security Type Abbreviations
ELS – Equity-Linked Security
Categorizations in the Schedule of Investments are based on country or territory of incorporation.
Legend
(a) Non-income producing
(b) Security or a portion of the security is on loan at period end.
(c) Security exempt from registration under Rule 144A of the Securities Act of 1933. These securities may be resold in transactions exempt from registration, normally to qualified institutional buyers. At the end of the period, the value of these securities amounted to $3,165,551 or 3.2% of net assets.
(d) Affiliated fund that is generally available only to investment companies and other accounts managed by Fidelity Investments. The rate quoted is the annualized seven-day yield of the fund at period end. A complete unaudited listing of the fund's holdings as of its most recent quarter end is available upon request. In addition, each Fidelity Central Fund's financial statements, which are not covered by the Fund's Report of Independent Registered Public Accounting Firm, are available on the SEC's website or upon request.
(e) Investment made with cash collateral received from securities on loan.
Affiliated Central Funds
Information regarding fiscal year to date income earned by the Fund from investments in Fidelity Central Funds is as follows:
| Fund | Income earned |
| Fidelity Cash Central Fund | $4,280 |
| Fidelity Securities Lending Cash Central Fund | 6,144 |
| Total | $10,424 |
Investment Valuation
The following is a summary of the inputs used, as of October 31, 2017, involving the Fund's assets and liabilities carried at fair value. The inputs or methodology used for valuing securities may not be an indication of the risk associated with investing in those securities. For more information on valuation inputs, and their aggregation into the levels used below, please refer to the Investment Valuation section in the accompanying Notes to Financial Statements.
| | Valuation Inputs at Reporting Date: |
| Description | Total | Level 1 | Level 2 | Level 3 |
| Investments in Securities: | | | | |
| Equities: | | | | |
| Consumer Discretionary | $20,486,387 | $20,486,387 | $-- | $-- |
| Consumer Staples | 9,064,419 | 9,064,419 | -- | -- |
| Energy | 15,424,857 | 14,502,073 | 922,784 | -- |
| Financials | 31,542,237 | 22,583,531 | 8,958,706 | -- |
| Health Care | 1,487,314 | 1,487,314 | -- | -- |
| Industrials | 5,772,103 | 5,772,103 | -- | -- |
| Materials | 9,887,698 | 8,914,758 | 972,940 | -- |
| Real Estate | 2,594,492 | 2,594,492 | -- | -- |
| Telecommunication Services | 2,953,096 | 2,953,096 | -- | -- |
| Money Market Funds | 1,203,599 | 1,203,599 | -- | -- |
| Total Investments in Securities: | $100,416,202 | $89,561,772 | $10,854,430 | $-- |
The following is a summary of transfers between Level 1 and Level 2 for the period ended October 31, 2017. Transfers are assumed to have occurred at the beginning of the period, and are primarily attributable to the valuation techniques used for foreign equity securities, as discussed in the accompanying Notes to Financial Statements:
| Transfers | Total |
| Level 1 to Level 2 | $0 |
| Level 2 to Level 1 | $7,595,313 |
See accompanying notes which are an integral part of the financial statements.
Financial Statements
Statement of Assets and Liabilities
| | | October 31, 2017 |
| Assets | | |
Investment in securities, at value (including securities loaned of $575,000) — See accompanying schedule:
Unaffiliated issuers (cost $73,554,759) | $99,212,603 | |
| Fidelity Central Funds (cost $1,203,599) | 1,203,599 | |
| Total Investment in Securities (cost $74,758,358) | | $100,416,202 |
| Foreign currency held at value (cost $5,495) | | 5,490 |
| Receivable for investments sold | | 278,032 |
| Receivable for fund shares sold | | 33,076 |
| Dividends receivable | | 91,581 |
| Distributions receivable from Fidelity Central Funds | | 504 |
| Prepaid expenses | | 228 |
| Other receivables | | 4,557 |
| Total assets | | 100,829,670 |
| Liabilities | | |
| Payable for investments purchased | $303,522 | |
| Payable for fund shares redeemed | 102,400 | |
| Accrued management fee | 67,391 | |
| Distribution and service plan fees payable | 5,785 | |
| Other affiliated payables | 25,994 | |
| Other payables and accrued expenses | 84,029 | |
| Collateral on securities loaned | 593,750 | |
| Total liabilities | | 1,182,871 |
| Net Assets | | $99,646,799 |
| Net Assets consist of: | | |
| Paid in capital | | $92,428,507 |
| Undistributed net investment income | | 1,355,176 |
| Accumulated undistributed net realized gain (loss) on investments and foreign currency transactions | | (19,793,467) |
| Net unrealized appreciation (depreciation) on investments and assets and liabilities in foreign currencies | | 25,656,583 |
| Net Assets | | $99,646,799 |
| Calculation of Maximum Offering Price | | |
| Class A: | | |
| Net Asset Value and redemption price per share ($5,537,939 ÷ 589,832 shares) | | $9.39 |
| Maximum offering price per share (100/94.25 of $9.39) | | $9.96 |
| Class M: | | |
| Net Asset Value and redemption price per share ($2,489,928 ÷ 266,258 shares) | | $9.35 |
| Maximum offering price per share (100/96.50 of $9.35) | | $9.69 |
| Class C: | | |
| Net Asset Value and offering price per share ($4,335,699 ÷ 466,209 shares)(a) | | $9.30 |
| Emerging Europe, Middle East, Africa (EMEA): | | |
| Net Asset Value, offering price and redemption price per share ($80,391,847 ÷ 8,543,299 shares) | | $9.41 |
| Class I: | | |
| Net Asset Value, offering price and redemption price per share ($6,891,386 ÷ 732,788 shares) | | $9.40 |
(a) Redemption price per share is equal to net asset value less any applicable contingent deferred sales charge.
See accompanying notes which are an integral part of the financial statements.
Statement of Operations
| | | Year ended October 31, 2017 |
| Investment Income | | |
| Dividends | | $3,497,074 |
| Income from Fidelity Central Funds | | 10,424 |
| Income before foreign taxes withheld | | 3,507,498 |
| Less foreign taxes withheld | | (365,366) |
| Total income | | 3,142,132 |
| Expenses | | |
| Management fee | $827,200 | |
| Transfer agent fees | 267,682 | |
| Distribution and service plan fees | 84,704 | |
| Accounting and security lending fees | 53,979 | |
| Custodian fees and expenses | 135,008 | |
| Independent trustees' fees and expenses | 413 | |
| Registration fees | 78,462 | |
| Audit | 69,733 | |
| Legal | 262 | |
| Miscellaneous | 837 | |
| Total expenses before reductions | 1,518,280 | |
| Expense reductions | (20,686) | 1,497,594 |
| Net investment income (loss) | | 1,644,538 |
| Realized and Unrealized Gain (Loss) | | |
| Net realized gain (loss) on: | | |
| Investment securities: | | |
| Unaffiliated issuers (net of foreign taxes of $30,875) | 4,055,484 | |
| Fidelity Central Funds | 25 | |
| Foreign currency transactions | (88,621) | |
| Total net realized gain (loss) | | 3,966,888 |
| Change in net unrealized appreciation (depreciation) on: | | |
| Unaffiliated issuers (net of decrease in deferred foreign taxes of $20,682) | 10,352,417 | |
| Fidelity Central Funds | (17) | |
| Assets and liabilities in foreign currencies | (1,597) | |
| Total change in net unrealized appreciation (depreciation) | | 10,350,803 |
| Net gain (loss) | | 14,317,691 |
| Net increase (decrease) in net assets resulting from operations | | $15,962,229 |
See accompanying notes which are an integral part of the financial statements.
Statement of Changes in Net Assets
| | Year ended October 31, 2017 | Year ended October 31, 2016 |
| Increase (Decrease) in Net Assets | | |
| Operations | | |
| Net investment income (loss) | $1,644,538 | $1,751,403 |
| Net realized gain (loss) | 3,966,888 | (6,335,400) |
| Change in net unrealized appreciation (depreciation) | 10,350,803 | 12,445,434 |
| Net increase (decrease) in net assets resulting from operations | 15,962,229 | 7,861,437 |
| Distributions to shareholders from net investment income | (1,167,439) | (1,323,710) |
| Share transactions - net increase (decrease) | (13,935,496) | 9,065,893 |
| Redemption fees | 71,905 | 36,545 |
| Total increase (decrease) in net assets | 931,199 | 15,640,165 |
| Net Assets | | |
| Beginning of period | 98,715,600 | 83,075,435 |
| End of period | $99,646,799 | $98,715,600 |
| Other Information | | |
| Undistributed net investment income end of period | $1,355,176 | $1,115,481 |
See accompanying notes which are an integral part of the financial statements.
Financial Highlights
Fidelity Emerging Europe, Middle East, Africa (EMEA) Fund Class A
| Years ended October 31, | 2017 | 2016 | 2015 | 2014 | 2013 |
| Selected Per–Share Data | | | | | |
| Net asset value, beginning of period | $8.13 | $7.49 | $9.04 | $9.49 | $8.71 |
| Income from Investment Operations | | | | | |
| Net investment income (loss)A | .12 | .14 | .12 | .13 | .16 |
| Net realized and unrealized gain (loss) | 1.22 | .61 | (1.50) | (.46) | .85 |
| Total from investment operations | 1.34 | .75 | (1.38) | (.33) | 1.01 |
| Distributions from net investment income | (.09) | (.11) | (.14) | (.12) | (.15) |
| Distributions from net realized gain | – | – | (.04) | – | (.07) |
| Total distributions | (.09) | (.11) | (.17)B | (.12) | (.23)C |
| Redemption fees added to paid in capitalA | .01 | –D | –D | –D | –D |
| Net asset value, end of period | $9.39 | $8.13 | $7.49 | $9.04 | $9.49 |
| Total ReturnE,F | 16.69% | 10.22% | (15.42)% | (3.48)% | 11.75% |
| Ratios to Average Net AssetsG,H | | | | | |
| Expenses before reductions | 1.63% | 1.69% | 1.61% | 1.60% | 1.64% |
| Expenses net of fee waivers, if any | 1.62% | 1.65% | 1.61% | 1.60% | 1.63% |
| Expenses net of all reductions | 1.61% | 1.64% | 1.60% | 1.60% | 1.62% |
| Net investment income (loss) | 1.41% | 1.90% | 1.51% | 1.45% | 1.82% |
| Supplemental Data | | | | | |
| Net assets, end of period (000 omitted) | $5,538 | $7,867 | $5,788 | $7,889 | $10,883 |
| Portfolio turnover rateI | 47% | 54% | 50% | 38% | 64% |
A Calculated based on average shares outstanding during the period.
B Total distributions of $.17 per share is comprised of distributions from net investment income of $.135 and distributions from net realized gain of $.039 per share.
C Total distributions of $.23 per share is comprised of distributions from net investment income of $.151 and distributions from net realized gain of $.074 per share.
D Amount represents less than $.005 per share.
E Total returns would have been lower if certain expenses had not been reduced during the applicable periods shown.
F Total returns do not include the effect of the sales charges.
G Fees and expenses of any underlying Fidelity Central Funds are not included in the Fund's expense ratio. The Fund indirectly bears its proportionate share of the expenses of any underlying Fidelity Central Funds.
H Expense ratios reflect operating expenses of the class. Expenses before reductions do not reflect amounts reimbursed by the investment adviser or reductions from brokerage service arrangements or reductions from other expense offset arrangements and do not represent the amount paid by the class during periods when reimbursements or reductions occur. Expenses net of fee waivers reflect expenses after reimbursement by the investment adviser but prior to reductions from brokerage service arrangements or other expense offset arrangements. Expenses net of all reductions represent the net expenses paid by the class.
I Amount does not include the portfolio activity of any underlying Fidelity Central Funds.
See accompanying notes which are an integral part of the financial statements.
Fidelity Emerging Europe, Middle East, Africa (EMEA) Fund Class M
| Years ended October 31, | 2017 | 2016 | 2015 | 2014 | 2013 |
| Selected Per–Share Data | | | | | |
| Net asset value, beginning of period | $8.10 | $7.44 | $9.01 | $9.46 | $8.68 |
| Income from Investment Operations | | | | | |
| Net investment income (loss)A | .10 | .12 | .10 | .11 | .14 |
| Net realized and unrealized gain (loss) | 1.21 | .61 | (1.51) | (.46) | .84 |
| Total from investment operations | 1.31 | .73 | (1.41) | (.35) | .98 |
| Distributions from net investment income | (.07) | (.07) | (.13) | (.10) | (.12) |
| Distributions from net realized gain | – | – | (.04) | – | (.07) |
| Total distributions | (.07) | (.07) | (.16)B | (.10) | (.20)C |
| Redemption fees added to paid in capitalA | .01 | –D | –D | –D | –D |
| Net asset value, end of period | $9.35 | $8.10 | $7.44 | $9.01 | $9.46 |
| Total ReturnE,F | 16.40% | 9.98% | (15.80)% | (3.67)% | 11.42% |
| Ratios to Average Net AssetsG,H | | | | | |
| Expenses before reductions | 1.95% | 2.00% | 1.92% | 1.92% | 1.93% |
| Expenses net of fee waivers, if any | 1.90% | 1.90% | 1.90% | 1.90% | 1.90% |
| Expenses net of all reductions | 1.88% | 1.89% | 1.89% | 1.90% | 1.88% |
| Net investment income (loss) | 1.14% | 1.65% | 1.22% | 1.15% | 1.55% |
| Supplemental Data | | | | | |
| Net assets, end of period (000 omitted) | $2,490 | $2,580 | $2,003 | $2,465 | $3,465 |
| Portfolio turnover rateI | 47% | 54% | 50% | 38% | 64% |
A Calculated based on average shares outstanding during the period.
B Total distributions of $.16 per share is comprised of distributions from net investment income of $.125 and distributions from net realized gain of $.039 per share.
C Total distributions of $.20 per share is comprised of distributions from net investment income of $.122 and distributions from net realized gain of $.074 per share.
D Amount represents less than $.005 per share.
E Total returns would have been lower if certain expenses had not been reduced during the applicable periods shown.
F Total returns do not include the effect of the sales charges.
G Fees and expenses of any underlying Fidelity Central Funds are not included in the Fund's expense ratio. The Fund indirectly bears its proportionate share of the expenses of any underlying Fidelity Central Funds.
H Expense ratios reflect operating expenses of the class. Expenses before reductions do not reflect amounts reimbursed by the investment adviser or reductions from brokerage service arrangements or reductions from other expense offset arrangements and do not represent the amount paid by the class during periods when reimbursements or reductions occur. Expenses net of fee waivers reflect expenses after reimbursement by the investment adviser but prior to reductions from brokerage service arrangements or other expense offset arrangements. Expenses net of all reductions represent the net expenses paid by the class.
I Amount does not include the portfolio activity of any underlying Fidelity Central Funds.
See accompanying notes which are an integral part of the financial statements.
Fidelity Emerging Europe, Middle East, Africa (EMEA) Fund Class C
| Years ended October 31, | 2017 | 2016 | 2015 | 2014 | 2013 |
| Selected Per–Share Data | | | | | |
| Net asset value, beginning of period | $8.06 | $7.39 | $8.93 | $9.39 | $8.62 |
| Income from Investment Operations | | | | | |
| Net investment income (loss)A | .06 | .09 | .06 | .06 | .09 |
| Net realized and unrealized gain (loss) | 1.20 | .60 | (1.48) | (.46) | .83 |
| Total from investment operations | 1.26 | .69 | (1.42) | (.40) | .92 |
| Distributions from net investment income | (.03) | (.02) | (.08) | (.06) | (.08) |
| Distributions from net realized gain | – | – | (.04) | – | (.07) |
| Total distributions | (.03) | (.02) | (.12) | (.06) | (.15) |
| Redemption fees added to paid in capitalA | .01 | –B | –B | –B | –B |
| Net asset value, end of period | $9.30 | $8.06 | $7.39 | $8.93 | $9.39 |
| Total ReturnC,D | 15.85% | 9.33% | (16.08)% | (4.24)% | 10.83% |
| Ratios to Average Net AssetsE,F | | | | | |
| Expenses before reductions | 2.42% | 2.47% | 2.41% | 2.40% | 2.42% |
| Expenses net of fee waivers, if any | 2.39% | 2.40% | 2.40% | 2.40% | 2.40% |
| Expenses net of all reductions | 2.37% | 2.39% | 2.39% | 2.40% | 2.38% |
| Net investment income (loss) | .65% | 1.15% | .72% | .65% | 1.05% |
| Supplemental Data | | | | | |
| Net assets, end of period (000 omitted) | $4,336 | $6,269 | $4,104 | $6,662 | $6,782 |
| Portfolio turnover rateG | 47% | 54% | 50% | 38% | 64% |
A Calculated based on average shares outstanding during the period.
B Amount represents less than $.005 per share.
C Total returns would have been lower if certain expenses had not been reduced during the applicable periods shown.
D Total returns do not include the effect of the contingent deferred sales charge.
E Fees and expenses of any underlying Fidelity Central Funds are not included in the Fund's expense ratio. The Fund indirectly bears its proportionate share of the expenses of any underlying Fidelity Central Funds.
F Expense ratios reflect operating expenses of the class. Expenses before reductions do not reflect amounts reimbursed by the investment adviser or reductions from brokerage service arrangements or reductions from other expense offset arrangements and do not represent the amount paid by the class during periods when reimbursements or reductions occur. Expenses net of fee waivers reflect expenses after reimbursement by the investment adviser but prior to reductions from brokerage service arrangements or other expense offset arrangements. Expenses net of all reductions represent the net expenses paid by the class.
G Amount does not include the portfolio activity of any underlying Fidelity Central Funds.
See accompanying notes which are an integral part of the financial statements.
Fidelity Emerging Europe, Middle East, Africa (EMEA) Fund
| Years ended October 31, | 2017 | 2016 | 2015 | 2014 | 2013 |
| Selected Per–Share Data | | | | | |
| Net asset value, beginning of period | $8.14 | $7.50 | $9.08 | $9.52 | $8.75 |
| Income from Investment Operations | | | | | |
| Net investment income (loss)A | .15 | .16 | .14 | .16 | .18 |
| Net realized and unrealized gain (loss) | 1.21 | .61 | (1.51) | (.47) | .84 |
| Total from investment operations | 1.36 | .77 | (1.37) | (.31) | 1.02 |
| Distributions from net investment income | (.10) | (.13) | (.17) | (.13) | (.18) |
| Distributions from net realized gain | – | – | (.04) | – | (.07) |
| Total distributions | (.10) | (.13) | (.21) | (.13) | (.25) |
| Redemption fees added to paid in capitalA | .01 | –B | –B | –B | –B |
| Net asset value, end of period | $9.41 | $8.14 | $7.50 | $9.08 | $9.52 |
| Total ReturnC | 17.04% | 10.54% | (15.33)% | (3.21)% | 11.90% |
| Ratios to Average Net AssetsD,E | | | | | |
| Expenses before reductions | 1.38% | 1.46% | 1.39% | 1.37% | 1.40% |
| Expenses net of fee waivers, if any | 1.38% | 1.40% | 1.38% | 1.37% | 1.40% |
| Expenses net of all reductions | 1.37% | 1.39% | 1.38% | 1.37% | 1.38% |
| Net investment income (loss) | 1.66% | 2.15% | 1.74% | 1.68% | 2.05% |
| Supplemental Data | | | | | |
| Net assets, end of period (000 omitted) | $80,392 | $76,193 | $67,521 | $96,784 | $110,265 |
| Portfolio turnover rateF | 47% | 54% | 50% | 38% | 64% |
A Calculated based on average shares outstanding during the period.
B Amount represents less than $.005 per share.
C Total returns would have been lower if certain expenses had not been reduced during the applicable periods shown.
D Fees and expenses of any underlying Fidelity Central Funds are not included in the Fund's expense ratio. The Fund indirectly bears its proportionate share of the expenses of any underlying Fidelity Central Funds.
E Expense ratios reflect operating expenses of the class. Expenses before reductions do not reflect amounts reimbursed by the investment adviser or reductions from brokerage service arrangements or reductions from other expense offset arrangements and do not represent the amount paid by the class during periods when reimbursements or reductions occur. Expenses net of fee waivers reflect expenses after reimbursement by the investment adviser but prior to reductions from brokerage service arrangements or other expense offset arrangements. Expenses net of all reductions represent the net expenses paid by the class.
F Amount does not include the portfolio activity of any underlying Fidelity Central Funds.
See accompanying notes which are an integral part of the financial statements.
Fidelity Emerging Europe, Middle East, Africa (EMEA) Fund Class I
| Years ended October 31, | 2017 | 2016 | 2015 | 2014 | 2013 |
| Selected Per–Share Data | | | | | |
| Net asset value, beginning of period | $8.14 | $7.50 | $9.08 | $9.52 | $8.75 |
| Income from Investment Operations | | | | | |
| Net investment income (loss)A | .16 | .17 | .15 | .16 | .19 |
| Net realized and unrealized gain (loss) | 1.20 | .61 | (1.51) | (.46) | .84 |
| Total from investment operations | 1.36 | .78 | (1.36) | (.30) | 1.03 |
| Distributions from net investment income | (.11) | (.14) | (.18) | (.14) | (.19) |
| Distributions from net realized gain | – | – | (.04) | – | (.07) |
| Total distributions | (.11) | (.14) | (.22) | (.14) | (.26) |
| Redemption fees added to paid in capitalA | .01 | –B | –B | –B | –B |
| Net asset value, end of period | $9.40 | $8.14 | $7.50 | $9.08 | $9.52 |
| Total ReturnC | 17.01% | 10.69% | (15.23)% | (3.09)% | 12.05% |
| Ratios to Average Net AssetsD,E | | | | | |
| Expenses before reductions | 1.27% | 1.31% | 1.25% | 1.26% | 1.30% |
| Expenses net of fee waivers, if any | 1.27% | 1.31% | 1.25% | 1.26% | 1.30% |
| Expenses net of all reductions | 1.26% | 1.30% | 1.24% | 1.26% | 1.28% |
| Net investment income (loss) | 1.77% | 2.24% | 1.88% | 1.79% | 2.15% |
| Supplemental Data | | | | | |
| Net assets, end of period (000 omitted) | $6,891 | $5,807 | $3,478 | $5,596 | $10,231 |
| Portfolio turnover rateF | 47% | 54% | 50% | 38% | 64% |
A Calculated based on average shares outstanding during the period.
B Amount represents less than $.005 per share.
C Total returns would have been lower if certain expenses had not been reduced during the applicable periods shown.
D Fees and expenses of any underlying Fidelity Central Funds are not included in the Fund's expense ratio. The Fund indirectly bears its proportionate share of the expenses of any underlying Fidelity Central Funds.
E Expense ratios reflect operating expenses of the class. Expenses before reductions do not reflect amounts reimbursed by the investment adviser or reductions from brokerage service arrangements or reductions from other expense offset arrangements and do not represent the amount paid by the class during periods when reimbursements or reductions occur. Expenses net of fee waivers reflect expenses after reimbursement by the investment adviser but prior to reductions from brokerage service arrangements or other expense offset arrangements. Expenses net of all reductions represent the net expenses paid by the class.
F Amount does not include the portfolio activity of any underlying Fidelity Central Funds.
See accompanying notes which are an integral part of the financial statements.
Notes to Financial Statements
For the period ended October 31, 2017
1. Organization.
Fidelity Emerging Europe, Middle East, Africa (EMEA) Fund (the Fund) is a non-diversified fund of Fidelity Investment Trust (the Trust) and is authorized to issue an unlimited number of shares. The Trust is registered under the Investment Company Act of 1940, as amended (the 1940 Act), as an open-end management investment company organized as a Massachusetts business trust. The Fund offers Class A, Class M (formerly Class T), Class C, Emerging Europe, Middle East, Africa (EMEA) and Class I shares, each of which has equal rights as to assets and voting privileges. Each class has exclusive voting rights with respect to matters that affect that class. The Fund's investments in emerging markets can be subject to social, economic, regulatory, and political uncertainties and can be extremely volatile.
After the close of business on June 24, 2016, all outstanding Class B shares were converted to Class A shares. All prior fiscal period dollar and share amounts for Class B presented in the Notes to Financial Statements are for the period November 1, 2015 through June 24, 2016.
2. Investments in Fidelity Central Funds.
The Fund invests in Fidelity Central Funds, which are open-end investment companies generally available only to other investment companies and accounts managed by the investment adviser and its affiliates. The Fund's Schedule of Investments lists each of the Fidelity Central Funds held as of period end, if any, as an investment of the Fund, but does not include the underlying holdings of each Fidelity Central Fund. As an Investing Fund, the Fund indirectly bears its proportionate share of the expenses of the underlying Fidelity Central Funds.
The Money Market Central Funds seek preservation of capital and current income and are managed by Fidelity Investments Money Management, Inc. (FIMM), an affiliate of the investment adviser. Annualized expenses of the Money Market Central Funds as of their most recent shareholder report date are less than .005%.
A complete unaudited list of holdings for each Fidelity Central Fund is available upon request or at the Securities and Exchange Commission (the SEC) website at www.sec.gov. In addition, the financial statements of the Fidelity Central Funds, which are not covered by the Fund's Report of Independent Registered Public Accounting Firm, are available on the SEC website or upon request.
3. Significant Accounting Policies.
The Fund is an investment company and applies the accounting and reporting guidance of the Financial Accounting Standards Board (FASB) Accounting Standards Codification Topic 946 Financial Services – Investments Companies. The financial statements have been prepared in conformity with accounting principles generally accepted in the United States of America (GAAP), which require management to make certain estimates and assumptions at the date of the financial statements. Actual results could differ from those estimates. Subsequent events, if any, through the date that the financial statements were issued have been evaluated in the preparation of the financial statements. The following summarizes the significant accounting policies of the Fund:
Investment Valuation. Investments are valued as of 4:00 p.m. Eastern time on the last calendar day of the period. The Board of Trustees (the Board) has delegated the day to day responsibility for the valuation of the Fund's investments to the Fair Value Committee (the Committee) established by the Fund's investment adviser. In accordance with valuation policies and procedures approved by the Board, the Fund attempts to obtain prices from one or more third party pricing vendors or brokers to value its investments. When current market prices, quotations or currency exchange rates are not readily available or reliable, investments will be fair valued in good faith by the Committee, in accordance with procedures adopted by the Board. Factors used in determining fair value vary by investment type and may include market or investment specific events. The frequency with which these procedures are used cannot be predicted and they may be utilized to a significant extent. The Committee oversees the Fund's valuation policies and procedures and reports to the Board on the Committee's activities and fair value determinations. The Board monitors the appropriateness of the procedures used in valuing the Fund's investments and ratifies the fair value determinations of the Committee.
The Fund categorizes the inputs to valuation techniques used to value its investments into a disclosure hierarchy consisting of three levels as shown below:
- Level 1 – quoted prices in active markets for identical investments
- Level 2 – other significant observable inputs (including quoted prices for similar investments, interest rates, prepayment speeds, etc.)
- Level 3 – unobservable inputs (including the Fund's own assumptions based on the best information available)
Valuation techniques used to value the Fund's investments by major category are as follows:
Equity securities, including restricted securities, for which market quotations are readily available, are valued at the last reported sale price or official closing price as reported by a third party pricing vendor on the primary market or exchange on which they are traded and are categorized as Level 1 in the hierarchy. In the event there were no sales during the day or closing prices are not available, securities are valued at the last quoted bid price or may be valued using the last available price and are generally categorized as Level 2 in the hierarchy. For foreign equity securities, when market or security specific events arise, comparisons to the valuation of American Depositary Receipts (ADRs), futures contracts, Exchange-Traded Funds (ETFs) and certain indexes as well as quoted prices for similar securities may be used and would be categorized as Level 2 in the hierarchy. Utilizing these techniques may result in transfers between Level 1 and Level 2. For equity securities, including restricted securities, where observable inputs are limited, assumptions about market activity and risk are used and these securities may be categorized as Level 3 in the hierarchy.
Investments in open-end mutual funds, including the Fidelity Central Funds, are valued at their closing net asset value (NAV) each business day and are categorized as Level 1 in the hierarchy.
Changes in valuation techniques may result in transfers in or out of an assigned level within the disclosure hierarchy. The aggregate value of investments by input level as of October 31, 2017, including information on transfers between Levels 1 and 2 is included at the end of the Fund's Schedule of Investments.
Foreign Currency. The Fund may use foreign currency contracts to facilitate transactions in foreign-denominated securities. Gains and losses from these transactions may arise from changes in the value of the foreign currency or if the counterparties do not perform under the contracts' terms.
Foreign-denominated assets, including investment securities, and liabilities are translated into U.S. dollars at the exchange rates at period end. Purchases and sales of investment securities, income and dividends received and expenses denominated in foreign currencies are translated into U.S. dollars at the exchange rate in effect on the transaction date.
The effects of exchange rate fluctuations on investments are included with the net realized and unrealized gain (loss) on investment securities. Other foreign currency transactions resulting in realized and unrealized gain (loss) are disclosed separately.
Investment Transactions and Income. For financial reporting purposes, the Fund's investment holdings and NAV include trades executed through the end of the last business day of the period. The NAV per share for processing shareholder transactions is calculated as of the close of business of the New York Stock Exchange (NYSE), normally 4:00 p.m. Eastern time and includes trades executed through the end of the prior business day. Gains and losses on securities sold are determined on the basis of identified cost. Dividend income is recorded on the ex-dividend date, except for certain dividends from foreign securities where the ex-dividend date may have passed, which are recorded as soon as the Fund is informed of the ex-dividend date. Non-cash dividends included in dividend income, if any, are recorded at the fair market value of the securities received. Income and capital gain distributions from Fidelity Central Funds, if any, are recorded on the ex-dividend date. Investment income is recorded net of foreign taxes withheld where recovery of such taxes is uncertain.
Class Allocations and Expenses. Investment income, realized and unrealized capital gains and losses, common expenses of the Fund, and certain fund-level expense reductions, if any, are allocated daily on a pro-rata basis to each class based on the relative net assets of each class to the total net assets of the Fund. Each class differs with respect to transfer agent and distribution and service plan fees incurred. Certain expense reductions may also differ by class. For the reporting period, the allocated portion of income and expenses to each class as a percent of its average net assets may vary due to the timing of recording these transactions in relation to fluctuating net assets of the classes. Expenses directly attributable to a fund are charged to that fund. Expenses attributable to more than one fund are allocated among the respective funds on the basis of relative net assets or other appropriate methods. Expense estimates are accrued in the period to which they relate and adjustments are made when actual amounts are known.
Income Tax Information and Distributions to Shareholders. Each year, the Fund intends to qualify as a regulated investment company under Subchapter M of the Internal Revenue Code, including distributing substantially all of its taxable income and realized gains. As a result, no provision for U.S. Federal income taxes is required. As of October 31, 2017, the Fund did not have any unrecognized tax benefits in the financial statements; nor is the Fund aware of any tax positions for which it is reasonably possible that the total amounts of unrecognized tax benefits will significantly change in the next twelve months. The Fund files a U.S. federal tax return, in addition to state and local tax returns as required. The Fund's federal income tax returns are subject to examination by the Internal Revenue Service (IRS) for a period of three fiscal years after they are filed. State and local tax returns may be subject to examination for an additional fiscal year depending on the jurisdiction. Foreign taxes are provided for based on the Fund's understanding of the tax rules and rates that exist in the foreign markets in which it invests. The Fund is subject to a tax imposed on capital gains by certain countries in which it invests.
Distributions are declared and recorded on the ex-dividend date. Income dividends and capital gain distributions are declared separately for each class. Income and capital gain distributions are determined in accordance with income tax regulations, which may differ from GAAP. In addition, the Fund claimed a portion of the payment made to redeeming shareholders as a distribution for income tax purposes.
Capital accounts within the financial statements are adjusted for permanent book-tax differences. These adjustments have no impact on net assets or the results of operations. Capital accounts are not adjusted for temporary book-tax differences which will reverse in a subsequent period.
Book-tax differences are primarily due to foreign currency transactions, certain foreign taxes, passive foreign investment companies (PFIC), capital loss carryforwards and losses deferred due to wash sales.
As of period end, the cost and unrealized appreciation (depreciation) in securities, and derivatives if applicable, for federal income tax purposes were as follows:
| Gross unrealized appreciation | $29,225,765 |
| Gross unrealized depreciation | (4,129,931) |
| Net unrealized appreciation (depreciation) | $25,095,834 |
| Tax Cost | $75,320,368 |
The tax-based components of distributable earnings as of period end were as follows:
| Undistributed ordinary income | $1,418,934 |
| Capital loss carryforward | $(19,295,216) |
| Net unrealized appreciation (depreciation) on securities and other investments | $25,094,573 |
Capital loss carryforwards are only available to offset future capital gains of the Fund to the extent provided by regulations and may be limited. Under the Regulated Investment Company Modernization Act of 2010 (the Act), the Fund is permitted to carry forward capital losses incurred in taxable years beginning after December 22, 2010 for an unlimited period and such capital losses are required to be used prior to any losses that expire. The capital loss carryforward information presented below, including any applicable limitation, is estimated as of fiscal period end and is subject to adjustment.
| Fiscal year of expiration | |
| 2018 | $(1,624,705) |
| No expiration | |
| Short-term | (2,621,070) |
| Long-term | (15,049,441) |
| Total no expiration | (17,670,511) |
| Total capital loss carryforward | $(19,295,216) |
The tax character of distributions paid was as follows:
| | October 31, 2017 | October 31, 2016 |
| Ordinary Income | $1,167,439 | $ 1,323,710 |
Short-Term Trading (Redemption) Fees. Shares held by investors in the Fund less than 90 days may have been subject to a redemption fee equal to 1.50% of the NAV of shares redeemed. All redemption fees, which reduce the proceeds of the shareholder redemption, are retained by the Fund and accounted for as an addition to paid in capital.
In November 2017, the Board of Trustees approved the elimination of these redemption fees effective December 18, 2017.
Restricted Securities. The Fund may invest in securities that are subject to legal or contractual restrictions on resale. These securities generally may be resold in transactions exempt from registration or to the public if the securities are registered. Disposal of these securities may involve time-consuming negotiations and expense, and prompt sale at an acceptable price may be difficult. Information regarding restricted securities is included at the end of the Fund's Schedule of Investments.
4. Purchases and Sales of Investments.
Purchases and sales of securities, other than short-term securities, aggregated $47,999,938 and $60,426,962, respectively.
5. Fees and Other Transactions with Affiliates.
Management Fee. Fidelity Management & Research Company (the investment adviser) and its affiliates provide the Fund with investment management related services for which the Fund pays a monthly management fee. The management fee is the sum of an individual fund fee rate that is based on an annual rate of .55% of the Fund's average net assets and an annualized group fee rate that averaged .25% during the period. The group fee rate is based upon the average net assets of all the mutual funds advised by the investment adviser, including any mutual funds previously advised by the investment adviser that are currently advised by Fidelity SelectCo, LLC, an affiliate of the investment adviser. The group fee rate decreases as assets under management increase and increases as assets under management decrease. For the reporting period, the total annual management fee rate was .80% of the Fund's average net assets.
Distribution and Service Plan Fees. In accordance with Rule 12b-1 of the 1940 Act, the Fund has adopted separate Distribution and Service Plans for each class of shares. Certain classes pay Fidelity Distributors Corporation (FDC), an affiliate of the investment adviser, separate Distribution and Service Fees, each of which is based on an annual percentage of each class' average net assets. In addition, FDC may pay financial intermediaries for selling shares of the Fund and providing shareholder support services. For the period, the Distribution and Service Fee rates, total fees and amounts retained by FDC were as follows:
| | Distribution
Fee | Service
Fee | Total Fees | Retained
by FDC |
| Class A | -% | .25% | $16,881 | $– |
| Class M | .25% | .25% | 12,548 | 158 |
| Class C | .75% | .25% | 55,275 | 6,686 |
| | | | $84,704 | $6,844 |
Sales Load. FDC may receive a front-end sales charge of up to 5.75% for selling Class A shares and 3.50% for selling Class M shares, some of which is paid to financial intermediaries for selling shares of the Fund. Depending on the holding period, FDC may receive contingent deferred sales charges levied on Class A, Class M and Class C redemptions. The deferred sales charges are 1.00% for Class C shares, 1.00% for certain purchases of Class A shares and .25% for certain purchases of Class M shares.
For the period, sales charge amounts retained by FDC were as follows:
| | Retained
by FDC |
| Class A | $2,438 |
| Class M | 540 |
| Class C(a) | 399 |
| | $3,377 |
(a) When Class C shares are initially sold, FDC pays commissions from its own resources to financial intermediaries through which the sales are made.
Transfer Agent Fees. Fidelity Investments Institutional Operations Company, Inc., (FIIOC), an affiliate of the investment adviser, is the transfer, dividend disbursing and shareholder servicing agent for each class of the Fund. FIIOC receives account fees and asset-based fees that vary according to the account size and type of account of the shareholders of the respective classes of the Fund. FIIOC pays for typesetting, printing and mailing of shareholder reports, except proxy statements.
For the period, transfer agent fees for each applicable class were as follows:
| | Amount | % of
Class-Level Average
Net Assets |
| Class A | $16,971 | .25 |
| Class M | 8,275 | .33 |
| Class C | 16,248 | .29 |
| Emerging Europe, Middle East, Africa (EMEA) | 214,883 | .26 |
| Class I | 11,305 | .15 |
| | $ 267,682 | |
Accounting and Security Lending Fees. Fidelity Service Company, Inc. (FSC), an affiliate of the investment adviser, maintains the Fund's accounting records. The accounting fee is based on the level of average net assets for each month. Under a separate contract, FSC administers the security lending program. The security lending fee is based on the number and duration of lending transactions.
Brokerage Commissions. The Fund placed a portion of its portfolio transactions with brokerage firms which are affiliates of the investment adviser. Brokerage commissions are included in net realized gain (loss) and change in net unrealized appreciation (depreciation) in the Statement of Operations. The commissions paid to these affiliated firms were $171 for the period.
Interfund Trades. The Fund may purchase from or sell securities to other Fidelity Funds under procedures adopted by the Board. The procedures have been designed to ensure these interfund trades are executed in accordance with Rule 17a-7 of the 1940 Act. Interfund trades are included within the respective purchases and sales amounts shown in the Purchases and Sales of Investments note.
Other. During the period, the investment adviser reimbursed the Fund for certain losses in the amount of $5,490.
6. Committed Line of Credit.
The Fund participates with other funds managed by the investment adviser or an affiliate in a $4.25 billion credit facility (the "line of credit") to be utilized for temporary or emergency purposes to fund shareholder redemptions or for other short-term liquidity purposes. The Fund has agreed to pay commitment fees on its pro-rata portion of the line of credit, which amounted to $333 and is reflected in Miscellaneous expenses on the Statement of Operations. During the period, the Fund did not borrow on this line of credit.
7. Security Lending.
The Fund lends portfolio securities through a lending agent from time to time in order to earn additional income. For equity securities, a lending agent is used and may loan securities to certain qualified borrowers, including Fidelity Capital Markets (FCM), a broker-dealer affiliated with the Fund. On the settlement date of the loan, the Fund receives collateral (in the form of U.S. Treasury obligations, letters of credit and/or cash) against the loaned securities and maintains collateral in an amount not less than 100% of the market value of the loaned securities during the period of the loan. The market value of the loaned securities is determined at the close of business of the Fund and any additional required collateral is delivered to the Fund on the next business day. The Fund or borrower may terminate the loan at any time, and if the borrower defaults on its obligation to return the securities loaned because of insolvency or other reasons, the Fund may apply collateral received from the borrower against the obligation. The Fund may experience delays and costs in recovering the securities loaned. Any cash collateral received is invested in the Fidelity Securities Lending Cash Central Fund. The value of loaned securities and cash collateral at period end are disclosed on the Fund's Statement of Assets and Liabilities. Security lending income represents the income earned on investing cash collateral, less rebates paid to borrowers and any lending agent fees associated with the loan, plus any premium payments received for lending certain types of securities. Security lending income is presented in the Statement of Operations as a component of income from Fidelity Central Funds. Total security lending income during the period amounted to $6,144. During the period, there were no securities loaned to FCM.
8. Expense Reductions.
The investment adviser voluntarily agreed to reimburse each class to the extent annual operating expenses exceeded certain levels of average net assets as noted in the table below. Some expenses, for example the compensation of the independent Trustees, and certain miscellaneous expenses such as proxy and shareholder meeting expenses are excluded from this reimbursement.
The following classes were in reimbursement during the period:
| | Expense
Limitations | Reimbursement |
| Class M | 1.90% | $1,327 |
| Class C | 2.40% | 1,816 |
| | | $3,143 |
Commissions paid to certain brokers with whom the investment adviser, or its affiliates, places trades on behalf of the Fund include an amount in addition to trade execution, which may be rebated back to the Fund to offset certain expenses. This amount totaled $16,630 for the period.
In addition, during the period the investment adviser reimbursed and/or waived a portion of fund-level operating expenses in the amount of $913.
9. Distributions to Shareholders.
Distributions to shareholders of each class were as follows:
| | Year ended
October 31, 2017 | Year ended
October 31, 2016 |
| From net investment income | | |
| Class A | $82,211 | $80,414 |
| Class M | 22,957 | 18,230 |
| Class B | – | 201 |
| Class C | 25,148 | 9,270 |
| Emerging Europe, Middle East, Africa (EMEA) | 957,314 | 1,152,813 |
| Class I | 79,809 | 62,782 |
| Total | $1,167,439 | $1,323,710 |
10. Share Transactions.
Share transactions for each class were as follows and may contain automatic conversions between classes or exchanges between affiliated funds:
| | Shares | Shares | Dollars | Dollars |
| | Year ended October 31, 2017 | Year ended October 31, 2016 | Year ended October 31, 2017 | Year ended October 31, 2016 |
| Class A | | | | |
| Shares sold | 288,036 | 455,903 | $2,454,533 | $3,437,125 |
| Reinvestment of distributions | 9,506 | 10,903 | 78,136 | 75,669 |
| Shares redeemed | (675,335) | (272,430) | (5,836,992) | (1,968,300) |
| Net increase (decrease) | (377,793) | 194,376 | $(3,304,323) | $1,544,494 |
| Class M | | | | |
| Shares sold | 66,562 | 127,263 | $565,838 | $957,632 |
| Reinvestment of distributions | 2,795 | 2,627 | 22,945 | 18,230 |
| Shares redeemed | (121,397) | (80,720) | (1,049,817) | (600,724) |
| Net increase (decrease) | (52,040) | 49,170 | $(461,034) | $375,138 |
| Class B | | | | |
| Shares sold | – | 6,222 | $– | $48,688 |
| Reinvestment of distributions | – | 29 | – | 201 |
| Shares redeemed | – | (30,363) | – | (224,475) |
| Net increase (decrease) | – | (24,112) | $– | $(175,586) |
| Class C | | | | |
| Shares sold | 157,368 | 511,536 | $1,360,245 | $3,858,488 |
| Reinvestment of distributions | 2,631 | 776 | 21,571 | 5,381 |
| Shares redeemed | (471,197) | (290,654) | (4,103,204) | (2,107,856) |
| Net increase (decrease) | (311,198) | 221,658 | $(2,721,388) | $1,756,013 |
| Emerging Europe, Middle East, Africa (EMEA) | | | | |
| Shares sold | 3,934,827 | 3,096,394 | $34,220,494 | $23,505,412 |
| Reinvestment of distributions | 108,986 | 155,366 | 895,866 | 1,078,225 |
| Shares redeemed | (4,855,547) | (2,896,341) | (42,616,730) | (21,342,473) |
| Net increase (decrease) | (811,734) | 355,419 | $(7,500,370) | $3,241,164 |
| Class I | | | | |
| Shares sold | 791,073 | 627,690 | $6,865,207 | $5,110,628 |
| Reinvestment of distributions | 9,024 | 7,594 | 74,090 | 52,629 |
| Shares redeemed | (780,970) | (385,176) | (6,887,678) | (2,838,587) |
| Net increase (decrease) | 19,127 | 250,108 | $51,619 | $2,324,670 |
11. Other.
The Fund's organizational documents provide former and current trustees and officers with a limited indemnification against liabilities arising in connection with the performance of their duties to the Fund. In the normal course of business, the Fund may also enter into contracts that provide general indemnifications. The Fund's maximum exposure under these arrangements is unknown as this would be dependent on future claims that may be made against the Fund. The risk of material loss from such claims is considered remote.
Report of Independent Registered Public Accounting Firm
To the Trustees of Fidelity Investment Trust and Shareholders of Fidelity Emerging Europe, Middle East, Africa (EMEA) Fund:
We have audited the accompanying statement of assets and liabilities of Fidelity Emerging Europe, Middle East, Africa (EMEA) Fund (the Fund), a fund of Fidelity Investment Trust, including the schedule of investments, as of October 31, 2017, and the related statement of operations for the year then ended, the statement of changes in net assets for each of the two years in the period then ended, and the financial highlights for each of the five years in the period then ended. These financial statements and financial highlights are the responsibility of the Fund's management. Our responsibility is to express an opinion on these financial statements and financial highlights based on our audits.
We conducted our audits in accordance with the standards of the Public Company Accounting Oversight Board (United States). Those standards require that we plan and perform the audit to obtain reasonable assurance about whether the financial statements and financial highlights are free of material misstatement. The Fund is not required to have, nor were we engaged to perform, an audit of its internal control over financial reporting. Our audits included consideration of internal control over financial reporting as a basis for designing audit procedures that are appropriate in the circumstances, but not for the purpose of expressing an opinion on the effectiveness of the Fund's internal control over financial reporting. Accordingly, we express no such opinion. An audit also includes examining, on a test basis, evidence supporting the amounts and disclosures in the financial statements, assessing the accounting principles used and significant estimates made by management, as well as evaluating the overall financial statement presentation. Our procedures included confirmation of securities owned as of October 31, 2017, by correspondence with the custodians and brokers; when replies were not received from brokers, we performed other auditing procedures. We believe that our audits provide a reasonable basis for our opinion.
In our opinion, such financial statements and financial highlights referred to above present fairly, in all material respects, the financial position of Fidelity Emerging Europe, Middle East, Africa (EMEA) Fund as of October 31, 2017, the results of its operations for the year then ended, the changes in its net assets for each of the two years in the period then ended, and the financial highlights for each of the five years in the period then ended in conformity with accounting principles generally accepted in the United States of America.
DELOITTE & TOUCHE LLP
Boston, Massachusetts
December 14, 2017
Trustees and Officers
The Trustees, Members of the Advisory Board (if any), and officers of the trust and fund, as applicable, are listed below. The Board of Trustees governs the fund and is responsible for protecting the interests of shareholders. The Trustees are experienced executives who meet periodically throughout the year to oversee the fund's activities, review contractual arrangements with companies that provide services to the fund, oversee management of the risks associated with such activities and contractual arrangements, and review the fund's performance. Except for Jonathan Chiel, each of the Trustees oversees 190 funds. Mr. Chiel oversees 143 funds.
The Trustees hold office without limit in time except that (a) any Trustee may resign; (b) any Trustee may be removed by written instrument, signed by at least two-thirds of the number of Trustees prior to such removal; (c) any Trustee who requests to be retired or who has become incapacitated by illness or injury may be retired by written instrument signed by a majority of the other Trustees; and (d) any Trustee may be removed at any special meeting of shareholders by a two-thirds vote of the outstanding voting securities of the trust. Each Trustee who is not an interested person (as defined in the 1940 Act) of the trust and the fund is referred to herein as an Independent Trustee. Each Independent Trustee shall retire not later than the last day of the calendar year in which his or her 75th birthday occurs. The Independent Trustees may waive this mandatory retirement age policy with respect to individual Trustees. Officers and Advisory Board Members hold office without limit in time, except that any officer or Advisory Board Member may resign or may be removed by a vote of a majority of the Trustees at any regular meeting or any special meeting of the Trustees. Except as indicated, each individual has held the office shown or other offices in the same company for the past five years.
The fund’s Statement of Additional Information (SAI) includes more information about the Trustees. To request a free copy, call Fidelity at 1-877-208-0098.
Experience, Skills, Attributes, and Qualifications of the Trustees. The Governance and Nominating Committee has adopted a statement of policy that describes the experience, qualifications, attributes, and skills that are necessary and desirable for potential Independent Trustee candidates (Statement of Policy). The Board believes that each Trustee satisfied at the time he or she was initially elected or appointed a Trustee, and continues to satisfy, the standards contemplated by the Statement of Policy. The Governance and Nominating Committee also engages professional search firms to help identify potential Independent Trustee candidates who have the experience, qualifications, attributes, and skills consistent with the Statement of Policy. From time to time, additional criteria based on the composition and skills of the current Independent Trustees, as well as experience or skills that may be appropriate in light of future changes to board composition, business conditions, and regulatory or other developments, have also been considered by the professional search firms and the Governance and Nominating Committee. In addition, the Board takes into account the Trustees' commitment and participation in Board and committee meetings, as well as their leadership of standing and ad hoc committees throughout their tenure.
In determining that a particular Trustee was and continues to be qualified to serve as a Trustee, the Board has considered a variety of criteria, none of which, in isolation, was controlling. The Board believes that, collectively, the Trustees have balanced and diverse experience, qualifications, attributes, and skills, which allow the Board to operate effectively in governing the fund and protecting the interests of shareholders. Information about the specific experience, skills, attributes, and qualifications of each Trustee, which in each case led to the Board's conclusion that the Trustee should serve (or continue to serve) as a trustee of the fund, is provided below.
Board Structure and Oversight Function. James C. Curvey is an interested person and currently serves as Chairman. The Trustees have determined that an interested Chairman is appropriate and benefits shareholders because an interested Chairman has a personal and professional stake in the quality and continuity of services provided to the fund. Independent Trustees exercise their informed business judgment to appoint an individual of their choosing to serve as Chairman, regardless of whether the Trustee happens to be independent or a member of management. The Independent Trustees have determined that they can act independently and effectively without having an Independent Trustee serve as Chairman and that a key structural component for assuring that they are in a position to do so is for the Independent Trustees to constitute a substantial majority for the Board. The Independent Trustees also regularly meet in executive session. Ned C. Lautenbach serves as Chairman of the Independent Trustees and as such (i) acts as a liaison between the Independent Trustees and management with respect to matters important to the Independent Trustees and (ii) with management prepares agendas for Board meetings.
Fidelity® funds are overseen by different Boards of Trustees. The fund's Board oversees Fidelity's high income and certain equity funds, and other Boards oversee Fidelity's investment-grade bond, money market, asset allocation, and sector funds. The asset allocation funds may invest in Fidelity® funds overseen by the fund's Board. The use of separate Boards, each with its own committee structure, allows the Trustees of each group of Fidelity® funds to focus on the unique issues of the funds they oversee, including common research, investment, and operational issues. On occasion, the separate Boards establish joint committees to address issues of overlapping consequences for the Fidelity® funds overseen by each Board.
The Trustees operate using a system of committees to facilitate the timely and efficient consideration of all matters of importance to the Trustees, the fund, and fund shareholders and to facilitate compliance with legal and regulatory requirements and oversight of the fund's activities and associated risks. The Board, acting through its committees, has charged FMR and its affiliates with (i) identifying events or circumstances the occurrence of which could have demonstrably adverse effects on the fund's business and/or reputation; (ii) implementing processes and controls to lessen the possibility that such events or circumstances occur or to mitigate the effects of such events or circumstances if they do occur; and (iii) creating and maintaining a system designed to evaluate continuously business and market conditions in order to facilitate the identification and implementation processes described in (i) and (ii) above. Because the day-to-day operations and activities of the fund are carried out by or through FMR, its affiliates, and other service providers, the fund's exposure to risks is mitigated but not eliminated by the processes overseen by the Trustees. While each of the Board's committees has responsibility for overseeing different aspects of the fund's activities, oversight is exercised primarily through the Operations, Audit, and Compliance Committees. In addition, the Independent Trustees have worked with FMR to enhance the Board's oversight of investment and financial risks, legal and regulatory risks, technology risks, and operational risks, including the development of additional risk reporting to the Board. For example, a working group comprised of Independent Trustees and FMR has worked and continues to work to review the Fidelity® funds' valuation-related activities, reporting and risk management. Appropriate personnel, including but not limited to the fund's Chief Compliance Officer (CCO), FMR's internal auditor, the independent accountants, the fund's Treasurer and portfolio management personnel, make periodic reports to the Board's committees, as appropriate, including an annual review of Fidelity's risk management program for the Fidelity® funds. The responsibilities of each standing committee, including their oversight responsibilities, are described further under "Standing Committees of the Trustees."
Interested Trustees*:
Correspondence intended for a Trustee who is an interested person may be sent to Fidelity Investments, 245 Summer Street, Boston, Massachusetts 02210.
Name, Year of Birth; Principal Occupations and Other Relevant Experience+
Jonathan Chiel (1957)
Year of Election or Appointment: 2016
Trustee
Mr. Chiel also serves as Trustee of other Fidelity® funds. Mr. Chiel is Executive Vice President and General Counsel for FMR LLC (diversified financial services company, 2012-present). Previously, Mr. Chiel served as general counsel (2004-2012) and senior vice president and deputy general counsel (2000-2004) for John Hancock Financial Services; a partner with Choate, Hall & Stewart (1996-2000) (law firm); and an Assistant United States Attorney for the United States Attorney’s Office of the District of Massachusetts (1986-95), including Chief of the Criminal Division (1993-1995). Mr. Chiel is a director on the boards of the Boston Bar Foundation and the Maimonides School.
James C. Curvey (1935)
Year of Election or Appointment: 2007
Trustee
Chairman of the Board of Trustees
Mr. Curvey also serves as Trustee of other Fidelity® funds. Mr. Curvey is a Director of Fidelity Research & Analysis Co. (investment adviser firm, 2009-present), and Vice Chairman (2007-present) and Director of FMR LLC (diversified financial services company). In addition, Mr. Curvey serves as an Overseer for the Boston Symphony Orchestra and a member of the board of Artis-Naples, Naples, Florida, and as a Trustee for Brewster Academy, Wolfeboro, New Hampshire. Previously, Mr. Curvey served as a Director of Fidelity Investments Money Management, Inc. (investment adviser firm, 2009-2014) and a Director of FMR and FMR Co., Inc. (investment adviser firms, 2007-2014).
Charles S. Morrison (1960)
Year of Election or Appointment: 2014
Trustee
Mr. Morrison also serves as Trustee of other funds. He serves as President of Fidelity Management & Research Company (FMR) (investment adviser firm, 2016-present), a Director of Fidelity Investments Money Management, Inc. (FIMM) (investment adviser firm, 2014-present), Director of Fidelity SelectCo, LLC (investment adviser firm, 2014-present), President, Asset Management (2014-present), and is an employee of Fidelity Investments. Previously, Mr. Morrison served as Vice President of Fidelity's Fixed Income and Asset Allocation Funds (2012-2014), President, Fixed Income (2011-2014), Vice President of Fidelity's Money Market Funds (2005-2009), President, Money Market Group Leader of FMR (investment adviser firm, 2009), and Senior Vice President, Money Market Group of FMR (2004-2009). Mr. Morrison also served as Vice President of Fidelity's Bond Funds (2002-2005), certain Balanced Funds (2002-2005), and certain Asset Allocation Funds (2002-2007), and as Senior Vice President (2002-2005) of Fidelity's Bond Division.
* Determined to be an “Interested Trustee” by virtue of, among other things, his or her affiliation with the trust or various entities under common control with FMR.
+ The information includes the Trustee's principal occupation during the last five years and other information relating to the experience, attributes, and skills relevant to the Trustee's qualifications to serve as a Trustee, which led to the conclusion that the Trustee should serve as a Trustee for the fund.
Independent Trustees:
Correspondence intended for an Independent Trustee may be sent to Fidelity Investments, P.O. Box 55235, Boston, Massachusetts 02205-5235.
Name, Year of Birth; Principal Occupations and Other Relevant Experience+
Dennis J. Dirks (1948)
Year of Election or Appointment: 2005
Trustee
Mr. Dirks also serves as Trustee of other Fidelity® funds. Prior to his retirement in May 2003, Mr. Dirks was Chief Operating Officer and a member of the Board of The Depository Trust & Clearing Corporation (DTCC). He also served as President, Chief Operating Officer, and Board member of The Depository Trust Company (DTC) and President and Board member of the National Securities Clearing Corporation (NSCC). In addition, Mr. Dirks served as Chief Executive Officer and Board member of the Government Securities Clearing Corporation, Chief Executive Officer and Board member of the Mortgage-Backed Securities Clearing Corporation, as a Trustee and a member of the Finance Committee of Manhattan College (2005-2008), as a Trustee and a member of the Finance Committee of AHRC of Nassau County (2006-2008), as a member of the Independent Directors Council (IDC) Governing Council (2010-2015), and as a member of the Board of Directors for The Brookville Center for Children’s Services, Inc. (2009-2017). Mr. Dirks is a member of the Finance Committee (2016-present) and Board of Directors (2017-present) of the Asolo Repertory Theatre.
Alan J. Lacy (1953)
Year of Election or Appointment: 2008
Trustee
Mr. Lacy also serves as Trustee of other Fidelity® funds. Mr. Lacy serves as a Director of Bristol-Myers Squibb Company (global pharmaceuticals, 2008-present). He is a Trustee of the California Chapter of The Nature Conservancy (2015-present) and a Director of the Center for Advanced Study in the Behavioral Sciences at Stanford University (2015-present). In addition, Mr. Lacy served as Senior Adviser (2007-2014) of Oak Hill Capital Partners, L.P. (private equity) and also served as Chief Executive Officer (2005) and Vice Chairman (2005-2006) of Sears Holdings Corporation (retail) and Chief Executive Officer and Chairman of the Board of Sears, Roebuck and Co. (retail, 2000-2005). Previously, Mr. Lacy served as Chairman (2014-2017) and a member (2010-2017) of the Board of Directors of Dave & Buster’s Entertainment, Inc. (restaurant and entertainment complexes), as Chairman (2008-2011) and a member (2006-2015) of the Board of Trustees of the National Parks Conservation Association, and as a member of the Board of Directors for The Hillman Companies, Inc. (hardware wholesalers, 2010-2014), Earth Fare, Inc. (retail grocery, 2010-2014), and The Western Union Company (global money transfer, 2006-2011).
Ned C. Lautenbach (1944)
Year of Election or Appointment: 2000
Trustee
Chairman of the Independent Trustees
Mr. Lautenbach also serves as Trustee of other Fidelity® funds. Mr. Lautenbach currently serves as Vice Chair of the Board of Governors, State University System of Florida (2013-present) and is a member of the Council on Foreign Relations (1994-present). He is also a member and has most recently served as Chairman of the Board of Directors of Artis-Naples (2012-present). Previously, Mr. Lautenbach served as a member and then Lead Director of the Board of Directors of Eaton Corporation (diversified industrial, 1997-2016). He was also a Partner and Advisory Partner at Clayton, Dubilier & Rice, LLC (private equity investment, 1998-2010), as well as a Director of Sony Corporation (2006-2007). In addition, Mr. Lautenbach also had a 30-year career with IBM (technology company) during which time he served as Senior Vice President and a member of the Corporate Executive Committee (1968-1998).
Joseph Mauriello (1944)
Year of Election or Appointment: 2008
Trustee
Mr. Mauriello also serves as Trustee of other Fidelity® funds. Prior to his retirement in January 2006, Mr. Mauriello served in numerous senior management positions including Deputy Chairman and Chief Operating Officer (2004-2005), and Vice Chairman of Financial Services (2002-2004) of KPMG LLP US (professional services, 1965-2005). Mr. Mauriello currently serves as a member of the Board of Directors of XL Group plc. (global insurance and re-insurance, 2006-present) and the Independent Directors Council (IDC) Governing Council (2015-present). Previously, Mr. Mauriello served as a Director of the Hamilton Funds of the Bank of New York (2006-2007) and of Arcadia Resources Inc. (health care services and products, 2007-2012).
Cornelia M. Small (1944)
Year of Election or Appointment: 2005
Trustee
Ms. Small also serves as Trustee of other Fidelity® funds. Ms. Small is a member of the Board of Directors (2009-present) and Chair of the Investment Committee (2010-present) of the Teagle Foundation. Ms. Small also serves on the Investment Committee of the Berkshire Taconic Community Foundation (2008-present). Previously, Ms. Small served as Chairperson (2002-2008) and a member of the Investment Committee and Chairperson (2008-2012) and a member of the Board of Trustees of Smith College. In addition, Ms. Small served as Chief Investment Officer, Director of Global Equity Investments, and a member of the Board of Directors of Scudder, Stevens & Clark and Scudder Kemper Investments.
William S. Stavropoulos (1939)
Year of Election or Appointment: 2001
Trustee
Vice Chairman of the Independent Trustees
Mr. Stavropoulos also serves as Trustee of other Fidelity® funds. Mr. Stavropoulos serves as President and Founder of the Michigan Baseball Foundation, the Great Lakes Loons (2007-present). Mr. Stavropoulos is Chairman Emeritus of the Board of Directors of The Dow Chemical Company, where he previously served in numerous senior management positions, including President, CEO (1995-2000; 2002-2004), Chairman of the Executive Committee (2000-2006), and as a member of the Board of Directors (1990-2006). Currently, Mr. Stavropoulos is Chairman of the Board of Directors of Univar Inc. (global distributor of commodity and specialty chemicals), a Director of Teradata Corporation (data warehousing and technology solutions), and a member of the Advisory Board for Metalmark Capital LLC (private equity investment, 2005-present). Mr. Stavropoulos is an operating advisor to Clayton, Dubilier & Rice, LLC (private equity investment). In addition, Mr. Stavropoulos is a member of the University of Notre Dame Advisory Council for the College of Science, a Trustee of the Rollin L. Gerstacker Foundation, and a Director of Artis-Naples in Naples, Florida. Previously, Mr. Stavropoulos served as a Director of Chemical Financial Corporation (bank holding company, 1993-2012) and Tyco International, Ltd. (multinational manufacturing and services, 2007-2012).
David M. Thomas (1949)
Year of Election or Appointment: 2008
Trustee
Mr. Thomas also serves as Trustee of other Fidelity® funds. Mr. Thomas serves as Non-Executive Chairman of the Board of Directors of Fortune Brands Home and Security (home and security products, 2011-present), as a member of the Board of Directors (2004-present) and Presiding Director (2013-present) of Interpublic Group of Companies, Inc. (marketing communication), and as a member of the Board of Trustees of the University of Florida (2013-present). Previously, Mr. Thomas served as Executive Chairman (2005-2006) and Chairman and Chief Executive Officer (2000-2005) of IMS Health, Inc. (pharmaceutical and healthcare information solutions), and a Director of Fortune Brands, Inc. (consumer products, 2000-2011).
+ The information includes the Trustee's principal occupation during the last five years and other information relating to the experience, attributes, and skills relevant to the Trustee's qualifications to serve as a Trustee, which led to the conclusion that the Trustee should serve as a Trustee for the fund.
Advisory Board Members and Officers:
Correspondence intended for an officer or Peter S. Lynch may be sent to Fidelity Investments, 245 Summer Street, Boston, Massachusetts 02210. Officers appear below in alphabetical order.
Name, Year of Birth; Principal Occupation
Peter S. Lynch (1944)
Year of Election or Appointment: 2003
Member of the Advisory Board
Mr. Lynch also serves as Member of the Advisory Board of other Fidelity® funds. Mr. Lynch is Vice Chairman and a Director of FMR (investment adviser firm) and FMR Co., Inc. (investment adviser firm). In addition, Mr. Lynch serves as a Trustee of Boston College and as the Chairman of the Inner-City Scholarship Fund. Previously, Mr. Lynch served on the Special Olympics International Board of Directors (1997-2006).
Elizabeth Paige Baumann (1968)
Year of Election or Appointment: 2017
Anti-Money Laundering (AML) Officer
Ms. Baumann also serves as AML Officer of other funds. She is Chief AML Officer (2012-present) and Senior Vice President (2014-present) of FMR LLC (diversified financial services company) and is an employee of Fidelity Investments. Previously, Ms. Baumann served as AML Officer of the funds (2012-2016), and Vice President (2007-2014) and Deputy Anti-Money Laundering Officer (2007-2012) of FMR LLC.
Marc R. Bryant (1966)
Year of Election or Appointment: 2015
Secretary and Chief Legal Officer (CLO)
Mr. Bryant also serves as Secretary and CLO of other funds. Mr. Bryant serves as CLO, Secretary, and Senior Vice President of Fidelity Management & Research Company (investment adviser firm, 2015-present) and FMR Co., Inc. (investment adviser firm, 2015-present); Secretary of Fidelity SelectCo, LLC (investment adviser firm, 2015-present) and Fidelity Investments Money Management, Inc. (investment adviser firm, 2015-present); and CLO of Fidelity Management & Research (Hong Kong) Limited and FMR Investment Management (UK) Limited (investment adviser firms, 2015-present) and Fidelity Management & Research (Japan) Limited (investment adviser firm, 2016-present). He is Senior Vice President and Deputy General Counsel of FMR LLC (diversified financial services company). Previously, Mr. Bryant served as Secretary and CLO of Fidelity Rutland Square Trust II (2010-2014) and Assistant Secretary of Fidelity's Fixed Income and Asset Allocation Funds (2013-2015). Prior to joining Fidelity Investments, Mr. Bryant served as a Senior Vice President and the Head of Global Retail Legal for AllianceBernstein L.P. (2006-2010), and as the General Counsel for ProFund Advisors LLC (2001-2006).
William C. Coffey (1969)
Year of Election or Appointment: 2009
Assistant Secretary
Mr. Coffey also serves as Assistant Secretary of other funds. He is Senior Vice President and Deputy General Counsel of FMR LLC (diversified financial services company, 2010-present), and is an employee of Fidelity Investments. Previously, Mr. Coffey served as Vice President and Associate General Counsel of FMR LLC (2005-2009).
Jonathan Davis (1968)
Year of Election or Appointment: 2010
Assistant Treasurer
Mr. Davis also serves as Assistant Treasurer of other funds, and is an employee of Fidelity Investments. Previously, Mr. Davis served as Vice President and Associate General Counsel of FMR LLC (diversified financial services company, 2003-2010).
Adrien E. Deberghes (1967)
Year of Election or Appointment: 2016
Assistant Treasurer
Mr. Deberghes also serves as an officer of other funds. He serves as Executive Vice President of Fidelity Investments Money Management, Inc. (FIMM) (investment adviser firm, 2016-present) and is an employee of Fidelity Investments (2008-present). Prior to joining Fidelity Investments, Mr. Deberghes was Senior Vice President of Mutual Fund Administration at State Street Corporation (2007-2008), Senior Director of Mutual Fund Administration at Investors Bank & Trust (2005-2007), and Director of Finance for Dunkin' Brands (2000-2005). Previously, Mr. Deberghes served in other fund officer roles.
Joseph DeSantis (1959)
Year of Election or Appointment: 2017
Vice President
Mr. DeSantis also serves as Vice President of other funds. Mr. DeSantis serves as a Director of Fidelity Management & Research (Japan) Limited (investment adviser firm, 2016-present), Chief Investment Officer, Equities (2010-present) and is an employee of Fidelity Investments.
Stephanie J. Dorsey (1969)
Year of Election or Appointment: 2010
Assistant Treasurer
Ms. Dorsey also serves as an officer of other funds. She is an employee of Fidelity Investments (2008-present) and has served in other fund officer roles. Prior to joining Fidelity Investments, Ms. Dorsey served as Treasurer (2004-2008) of the JPMorgan Mutual Funds and Vice President (2004-2008) of JPMorgan Chase Bank.
Howard J. Galligan III (1966)
Year of Election or Appointment: 2014
Chief Financial Officer
Mr. Galligan also serves as Chief Financial Officer of other funds. Mr. Galligan serves as President of Fidelity Pricing and Cash Management Services (FPCMS) (2014-present) and as a Director of Strategic Advisers, Inc. (investment adviser firm, 2008-present). Previously, Mr. Galligan served as Chief Administrative Officer of Asset Management (2011-2014) and Chief Operating Officer and Senior Vice President of Investment Support for Strategic Advisers, Inc. (2003-2011).
Brian B. Hogan (1964)
Year of Election or Appointment: 2009
Vice President
Mr. Hogan also serves as Trustee or Vice President of other funds. Mr. Hogan serves as a Director of FMR Investment Management (UK) Limited (investment adviser firm, 2015-present) and Fidelity SelectCo, LLC (investment adviser firm, 2014-present) and President of the Equity Division of FMR (investment adviser firm, 2009-present). Previously, Mr. Hogan served as Senior Vice President, Equity Research of FMR (2006-2009) and as a portfolio manager. Mr. Brian B. Hogan is not related to Mr. Colm A. Hogan.
Colm A. Hogan (1973)
Year of Election or Appointment: 2016
Deputy Treasurer
Mr. Hogan also serves as an officer of other funds. Mr. Hogan is an employee of Fidelity Investments (2005-present). Mr. Colm A. Hogan is not related to Mr. Brian B. Hogan.
Chris Maher (1972)
Year of Election or Appointment: 2013
Assistant Treasurer
Mr. Maher serves as Assistant Treasurer of other funds. Mr. Maher is Vice President of Valuation Oversight and is an employee of Fidelity Investments. Previously, Mr. Maher served as Vice President of Asset Management Compliance (2013), Vice President of the Program Management Group of FMR (investment adviser firm, 2010-2013), and Vice President of Valuation Oversight (2008-2010).
Rieco E. Mello (1969)
Year of Election or Appointment: 2017
Assistant Treasurer
Mr. Mello also serves as Assistant Treasurer of other funds. Mr. Mello is an employee of Fidelity Investments (1995-present).
Kenneth B. Robins (1969)
Year of Election or Appointment: 2016
Chief Compliance Officer
Mr. Robins also serves as an officer of other funds. Mr. Robins serves as Compliance Officer of Fidelity Management & Research Company and FMR Co., Inc. (investment adviser firms, 2016-present) and is an employee of Fidelity Investments (2004-present). Previously, Mr. Robins served as Executive Vice President of Fidelity Investments Money Management, Inc. (investment adviser firm, 2013-2016) and served in other fund officer roles.
Stacie M. Smith (1974)
Year of Election or Appointment: 2016
President and Treasurer
Ms. Smith also serves as an officer of other funds. She is an employee of Fidelity Investments (2009-present) and has served in other fund officer roles. Prior to joining Fidelity Investments, Ms. Smith served as Senior Audit Manager of Ernst & Young LLP (accounting firm, 1996-2009). Previously, Ms. Smith served as Deputy Treasurer of certain Fidelity® funds (2013-2016).
Marc L. Spector (1972)
Year of Election or Appointment: 2016
Assistant Treasurer
Mr. Spector also serves as an officer of other funds. Mr. Spector is an employee of Fidelity Investments (2016-present). Prior to joining Fidelity Investments, Mr. Spector served as Director at the Siegfried Group (accounting firm, 2013-2016), and prior to Siegfried Group as audit senior manager at Deloitte & Touche (accounting firm, 2005-2013).
Renee Stagnone (1975)
Year of Election or Appointment: 2016
Assistant Treasurer
Ms. Stagnone also serves as an officer of other funds. Ms. Stagnone is an employee of Fidelity Investments (1997-present). Previously, Ms. Stagnone served as Deputy Treasurer of certain Fidelity® funds (2013-2016).
Shareholder Expense Example
As a shareholder of the Fund, you incur two types of costs: (1) transaction costs, including sales charges (loads) on purchase payments or redemption proceeds, redemption fees and (2) ongoing costs, including management fees, distribution and/or service (12b-1) fees and other Fund expenses. This Example is intended to help you understand your ongoing costs (in dollars) of investing in the Fund and to compare these costs with the ongoing costs of investing in other mutual funds.
The Example is based on an investment of $1,000 invested at the beginning of the period and held for the entire period (May 1, 2017 to October 31, 2017).
Actual Expenses
The first line of the accompanying table for each class of the Fund provides information about actual account values and actual expenses. You may use the information in this line, together with the amount you invested, to estimate the expenses that you paid over the period. Simply divide your account value by $1,000.00 (for example, an $8,600 account value divided by $1,000.00 = 8.6), then multiply the result by the number in the first line for a class of the Fund under the heading entitled "Expenses Paid During Period" to estimate the expenses you paid on your account during this period. A small balance maintenance fee of $12.00 that is charged once a year may apply for certain accounts with a value of less than $2,000. This fee is not included in the table below. If it was, the estimate of expenses you paid during the period would be higher, and your ending account value lower, by this amount. In addition, the Fund, as a shareholder in the underlying Fidelity Central Funds, will indirectly bear its pro-rata share of the fees and expenses incurred by the underlying Fidelity Central Funds. These fees and expenses are not included in the Fund's annualized expense ratio used to calculate the expense estimate in the table below.
Hypothetical Example for Comparison Purposes
The second line of the accompanying table for each class of the Fund provides information about hypothetical account values and hypothetical expenses based on a Class' actual expense ratio and an assumed rate of return of 5% per year before expenses, which is not the Class' actual return. The hypothetical account values and expenses may not be used to estimate the actual ending account balance or expenses you paid for the period. You may use this information to compare the ongoing costs of investing in the Fund and other funds. To do so, compare this 5% hypothetical example with the 5% hypothetical examples that appear in the shareholder reports of the other funds. A small balance maintenance fee of $12.00 that is charged once a year may apply for certain accounts with a value of less than $2,000. This fee is not included in the table below. If it was, the estimate of expenses you paid during the period would be higher, and your ending account value lower, by this amount. In addition, the Fund, as a shareholder in the underlying Fidelity Central Funds, will indirectly bear its pro-rata share of the fees and expenses incurred by the underlying Fidelity Central Funds. These fees and expenses are not included in the Fund's annualized expense ratio used to calculate the expense estimate in the table below.
Please note that the expenses shown in the table are meant to highlight your ongoing costs only and do not reflect any transaction costs. Therefore, the second line of the table is useful in comparing ongoing costs only, and will not help you determine the relative total costs of owning different funds. In addition, if these transactional costs were included, your costs would have been higher.
| | Annualized Expense Ratio-A | Beginning
Account Value
May 1, 2017 | Ending
Account Value
October 31, 2017 | Expenses Paid
During Period-B
May 1, 2017
to October 31, 2017 |
| Class A | 1.57% | | | |
| Actual | | $1,000.00 | $1,071.90 | $8.20 |
| Hypothetical-C | | $1,000.00 | $1,017.29 | $7.98 |
| Class M | 1.89% | | | |
| Actual | | $1,000.00 | $1,069.80 | $9.86 |
| Hypothetical-C | | $1,000.00 | $1,015.68 | $9.60 |
| Class C | 2.35% | | | |
| Actual | | $1,000.00 | $1,067.70 | $12.25 |
| Hypothetical-C | | $1,000.00 | $1,013.36 | $11.93 |
| Emerging Europe, Middle East, Africa (EMEA) | 1.37% | | | |
| Actual | | $1,000.00 | $1,073.00 | $7.16 |
| Hypothetical-C | | $1,000.00 | $1,018.30 | $6.97 |
| Class I | 1.18% | | | |
| Actual | | $1,000.00 | $1,073.10 | $6.17 |
| Hypothetical-C | | $1,000.00 | $1,019.26 | $6.01 |
A Annualized expense ratio reflects expenses net of applicable fee waivers.
B Expenses are equal to each Class' annualized expense ratio, multiplied by the average account value over the period, multiplied by 184/365 (to reflect the one-half year period).
C 5% return per year before expenses
Distributions (Unaudited)
The Board of Trustees of Fidelity Advisor Emerging Europe, Middle East, Africa (EMEA) Fund voted to pay to shareholders of record at the opening of business on record date, the following distributions per share derived from capital gains realized from sales of portfolio securities, and dividends derived from net investment income:
| | Pay Date | Record Date | Dividends | Capital Gains |
| Fidelity Advisor Emerging Europe, Middle East, Africa (EMEA) Fund | | | | |
| Class A | 12/11/17 | 12/08/17 | $0.130 | $0.008 |
| Class M | 12/11/17 | 12/08/17 | $0.109 | $0.008 |
| Class C | 12/11/17 | 12/08/17 | $0.038 | $0.008 |
| Emerging Europe, Middle East, Africa (EMEA) | 12/11/17 | 12/08/17 | $0.157 | $0.008 |
| Class I | 12/11/17 | 12/08/17 | $0.167 | $0.008 |
|
Class A, Class M, Class C, Emerging Europe, Middle East, Africa (EMEA), and Class I designate 100% of the dividends distributed during the fiscal year as amounts which may be taken into account as a dividend for purposes of the maximum rate under section 1(h)(11) of the Internal Revenue Code.
The amounts per share which represent income derived from sources within, and taxes paid to, foreign countries or possessions of the United States are as follows:
| | Pay Date | Income | Taxes |
| Fidelity Advisor Emerging Europe, Middle East, Africa (EMEA) Fund | | | |
| Class A | 12/12/16 | $0.1186 | $0.0336 |
| Class M | 12/12/16 | $0.1026 | $0.0336 |
| Class C | 12/12/16 | $0.0666 | $0.0336 |
| Emerging Europe, Middle East, Africa (EMEA) | 12/12/16 | $0.1356 | $0.0336 |
| Class I | 12/12/16 | $0.1426 | $0.0336 |
|
The fund will notify shareholders in January 2018 of amounts for use in preparing 2017 income tax returns.
Board Approval of Investment Advisory Contracts and Management Fees
Fidelity Emerging Europe, Middle East, Africa (EMEA) Fund
Each year, the Board of Trustees, including the Independent Trustees (together, the Board), votes on the renewal of the management contract with Fidelity Management & Research Company (FMR) and the sub-advisory agreements (together, the Advisory Contracts) for the fund. FMR and the sub-advisers are referred to herein as the Investment Advisers. The Board, assisted by the advice of fund counsel and Independent Trustees' counsel, requests and considers a broad range of information relevant to the renewal of the Advisory Contracts throughout the year.
The Board meets regularly and, at each of its meetings, covers an extensive agenda of topics and materials and considers factors that are relevant to its annual consideration of the renewal of the fund's Advisory Contracts, including the services and support provided to the fund and its shareholders. The Board has established various standing committees (Committees), each composed of and chaired by Independent Trustees with varying backgrounds, to which the Board has assigned specific subject matter responsibilities in order to enhance effective decision-making by the Board. The Board, acting directly and through its Committees, requests and receives information concerning the annual consideration of the renewal of the fund's Advisory Contracts. The Board also meets as needed to review matters specifically related to the Board's annual consideration of the renewal of the Advisory Contracts. Members of the Board may also meet with trustees of other Fidelity funds through ad hoc joint committees to discuss certain matters relevant to all of the Fidelity funds.
At its July 2017 meeting, the Board unanimously determined to renew the fund's Advisory Contracts. In reaching its determination, the Board considered all factors it believed relevant, including (i) the nature, extent, and quality of the services to be provided to the fund and its shareholders (including the investment performance of the fund); (ii) the competitiveness of the fund's management fee and total expense ratio relative to peer funds; (iii) the total costs of the services to be provided by and the profits to be realized by Fidelity from its relationships with the fund; and (iv) the extent to which, if any, economies of scale exist and would be realized as the fund grows, and whether any economies of scale are appropriately shared with fund shareholders.
In considering whether to renew the Advisory Contracts for the fund, the Board reached a determination, with the assistance of fund counsel and Independent Trustees' counsel and through the exercise of its business judgment, that the renewal of the Advisory Contracts was in the best interests of the fund and its shareholders and that the compensation payable under the Advisory Contracts was fair and reasonable. The Board's decision to renew the Advisory Contracts was not based on any single factor, but rather was based on a comprehensive consideration of all the information provided to the Board at its meetings throughout the year. The Board, in reaching its determination to renew the Advisory Contracts, was aware that shareholders of the fund have a broad range of investment choices available to them, including a wide choice among funds offered by Fidelity's competitors, and that the fund's shareholders, who have the opportunity to review and weigh the disclosure provided by the fund in its prospectus and other public disclosures, have chosen to invest in this fund, which is part of the Fidelity family of funds.
Amendment to Group Fee Rate. The Board also approved an amendment to the management contract for the fund to add an additional breakpoint to the group fee schedule, effective October 1, 2017. The Board noted that the additional breakpoint would result in lower management fee rates as Fidelity's assets under management increase.
Nature, Extent, and Quality of Services Provided. The Board considered Fidelity's staffing as it relates to the fund, including the backgrounds of investment personnel of Fidelity, and also considered the fund's investment objective, strategies, and related investment philosophy. The Independent Trustees also had discussions with senior management of Fidelity's investment operations and investment groups. The Board considered the structure of the investment personnel compensation program and whether this structure provides appropriate incentives to act in the best interests of the fund. Additionally, the Board considered the portfolio managers' investments, if any, in the funds that they manage.
Resources Dedicated to Investment Management and Support Services. The Board and the Fund Oversight and Research Committees reviewed the general qualifications and capabilities of Fidelity's investment staff, including its size, education, experience, and resources, as well as Fidelity's approach to recruiting, training, managing, and compensating investment personnel. The Board noted that Fidelity has continued to increase the resources devoted to non-U.S. offices, including expansion of Fidelity's global investment organization. The Board also noted that Fidelity's analysts have extensive resources, tools and capabilities that allow them to conduct sophisticated quantitative and fundamental analysis, as well as credit analysis of issuers, counterparties and guarantors. Further, the Board considered that Fidelity's investment professionals have sufficient access to global information and data so as to provide competitive investment results over time, and that those professionals also have access to sophisticated tools that permit them to assess portfolio construction and risk and performance attribution characteristics continuously, as well as to transmit new information and research conclusions rapidly around the world. Additionally, in its deliberations, the Board considered Fidelity's trading, risk management, compliance, and technology and operations capabilities and resources, which are integral parts of the investment management process.
Shareholder and Administrative Services. The Board considered (i) the nature, extent, quality, and cost of advisory, administrative, and shareholder services performed by the Investment Advisers and their affiliates under the Advisory Contracts and under separate agreements covering transfer agency, pricing and bookkeeping, and securities lending services for the fund; (ii) the nature and extent of the supervision of third party service providers, principally custodians, subcustodians, and pricing vendors; and (iii) the resources devoted to, and the record of compliance with, the fund's compliance policies and procedures. The Board also reviewed the allocation of fund brokerage, including allocations to brokers affiliated with the Investment Advisers, the use of brokerage commissions to pay fund expenses, and the use of "soft" commission dollars to pay for research services.
The Board noted that the growth of fund assets over time across the complex allows Fidelity to reinvest in the development of services designed to enhance the value or convenience of the Fidelity funds as investment vehicles. These services include 24-hour access to account information and market information through telephone representatives and over the Internet, investor education materials and asset allocation tools, and the expanded availability of Fidelity Investor Centers.
In 2014, the Board formed an ad hoc Committee on Transfer Agency Fees to review the variety of transfer agency fee structures throughout the industry and Fidelity's competitive positioning with respect to industry participants.
Investment in a Large Fund Family. The Board considered the benefits to shareholders of investing in a Fidelity fund, including the benefits of investing in a fund that is part of a large family of funds offering a variety of investment disciplines and providing a large variety of mutual fund investor services. The Board noted that Fidelity had taken, or had made recommendations that resulted in the Fidelity funds taking, a number of actions over the previous year that benefited particular funds, including: (i) continuing to dedicate additional resources to Fidelity's investment research process, and to the support of the senior management team that oversees asset management; (ii) continuing efforts to enhance Fidelity's global research capabilities; (iii) launching new funds and making other enhancements to meet client needs; (iv) launching new share classes of existing funds; (v) eliminating purchase minimums and broadening eligibility requirements for certain lower-priced share classes; (vi) reducing management fees and total expenses for certain growth equity funds and index funds; (vii) lowering expense caps for certain existing funds and classes to reduce expenses borne by shareholders; (viii) eliminating short-term redemption fees for certain funds; (ix) introducing a new pricing structure for certain funds of funds that is expected to reduce overall expenses paid by shareholders; (x) rationalizing product lines and gaining increased efficiencies through proposals for fund mergers and share class consolidations; (xi) continuing to develop, acquire and implement systems and technology to improve services to the funds and shareholders, strengthen information security, and increase efficiency; and (xii) implementing enhancements to further strengthen Fidelity's product line to increase investors' probability of success in achieving their investment goals, including retirement income goals.
Investment Performance. The Board considered whether the fund has operated in accordance with its investment objective, as well as its record of compliance with its investment restrictions and its performance history. The Board noted that there was a portfolio management change for the fund in May 2017.
The Board took into account discussions with representatives of the Investment Advisers about fund investment performance that occur at Board meetings throughout the year. In this regard the Board noted that as part of regularly scheduled fund reviews and other reports to the Board on fund performance, the Board considers annualized return information for the fund for different time periods, measured against a securities market index ("benchmark index") and a peer group of funds with similar objectives ("peer group"), if any. In its evaluation of fund investment performance, the Board gave particular attention to information indicating changes in performance of certain Fidelity funds for specific time periods and discussed with the Investment Advisers the reasons for any overperformance or underperformance.
In addition to reviewing absolute and relative fund performance, the Independent Trustees periodically consider the appropriateness of fund performance metrics in evaluating the results achieved. In general, the Independent Trustees believe that fund performance should be evaluated based on net performance (after fees and expenses) of both the highest performing and lowest performing fund share classes, where applicable, compared to appropriate benchmark indices, over appropriate time periods that may include full market cycles, and compared to peer groups, as applicable, over the same periods, taking into account relevant factors including the following: general market conditions; issuer-specific information; and fund cash flows and other factors.
The Independent Trustees recognize that shareholders evaluate performance on a net basis over their own holding periods, for which one-, three-, and five-year periods are often used as a proxy. For this reason, the performance information reviewed by the Board also included net cumulative calendar year total return information for the fund and an appropriate benchmark index for the most recent one-, three-, and five-year periods, as shown below. A peer group is not shown below because the fund does not generally utilize a peer group for performance comparison purposes.
Fidelity Emerging Europe, Middle East, Africa (EMEA) Fund
Based on its review, the Board concluded that the nature, extent, and quality of services provided to the fund under the Advisory Contracts should continue to benefit the shareholders of the fund.
Competitiveness of Management Fee and Total Expense Ratio. The Board considered the fund's management fee and total expense ratio compared to "mapped groups" of competitive funds and classes created for the purpose of facilitating the Trustees' competitive analysis of management fees and total expenses. Fidelity creates "mapped groups" by combining similar Lipper investment objective categories that have comparable investment mandates. Combining Lipper investment objective categories aids the Board's management fee and total expense ratio comparisons by broadening the competitive group used for comparison.
Management Fee. The Board considered two proprietary management fee comparisons for the 12-month periods shown in basis points (BP) in the chart below. The group of Lipper funds used by the Board for management fee comparisons is referred to below as the "Total Mapped Group." The Total Mapped Group comparison focuses on a fund's standing in terms of gross management fees before expense reimbursements or caps relative to the total universe of funds with comparable investment mandates, regardless of whether their management fee structures also are comparable. Funds with comparable investment mandates offer exposure to similar types of securities. Funds with comparable management fee structures have similar management fee contractual arrangements (
e.g., flat rate charged for advisory services, all-inclusive fee rate,
etc.). "TMG %" represents the percentage of funds in the Total Mapped Group that had management fees that were lower than the fund's. For example, a hypothetical TMG % of 20% would mean that 80% of the funds in the Total Mapped Group had higher, and 20% had lower, management fees than the fund. The fund's actual TMG %s and the number of funds in the Total Mapped Group are in the chart below. The "Asset-Size Peer Group" (ASPG) comparison focuses on a fund's standing relative to a subset of non-Fidelity funds within the Total Mapped Group that are similar in size and management fee structure. For example, if a fund is in the first quartile of the ASPG, the fund's management fee ranks in the least expensive or lowest 25% of funds in the ASPG. The ASPG represents at least 15% of the funds in the Total Mapped Group with comparable asset size and management fee structures, subject to a minimum of 50 funds (or all funds in the Total Mapped Group if fewer than 50). Additional information, such as the ASPG quartile in which the fund's management fee rate ranked, is also included in the chart and considered by the Board.
Fidelity Emerging Europe, Middle East, Africa (EMEA) Fund
The Board noted that the fund's management fee rate ranked below the median of its Total Mapped Group and below the median of its ASPG for 2016.
The Board noted that, in 2014, the Board and the boards of other Fidelity funds formed the ad hoc Committee on Group Fee to conduct an in-depth review of the "group fee" component of the management fee of funds with such management fee structures. The Committee's focus included the mechanics of the group fee, the competitive landscape of group fee structures, Fidelity funds with no group fee component and investment products not included in group fee assets. The Board also considered that, for funds subject to the group fee, FMR agreed to voluntarily waive fees over a specified period of time in amounts designed to account for assets converted from certain funds to certain collective investment trusts.
The Board also noted that, in 2013, the ad hoc Committee on Management Fees was formed to conduct an in-depth review of the management fee rates of Fidelity's active equity mutual funds. The Committee focused on the following areas: (i) standard fee structures; (ii) research consumption and trading evolution; (iii) management fee competitiveness/profitability by category; and (iv) factors that drive institutional pricing.
Based on its review, the Board concluded that the fund's management fee is fair and reasonable in light of the services that the fund receives and the other factors considered.
Total Expense Ratio. In its review of each class's total expense ratio, the Board considered the fund's management fee rate as well as other fund or class expenses, as applicable, such as transfer agent fees, pricing and bookkeeping fees, fund-paid 12b-1 fees, and custodial, legal, and audit fees. The Board also noted that Fidelity may agree to waive fees and expenses from time to time, and the extent to which, if any, it has done so for the fund. As part of its review, the Board also considered the current and historical total expense ratios of each class of the fund compared to competitive fund median expenses. Each class of the fund is compared to those funds and classes in the Total Mapped Group (used by the Board for management fee comparisons) that have a similar sales load structure.
The Board noted that the total expense ratio of the retail class ranked below the competitive median for 2016 and the total expense ratio of each of Class A, Class M (formerly Class T), Class C, and Class I ranked above the competitive median for 2016. The Board considered that, in general, various factors can affect total expense ratios. The Board noted that the total expense ratio of each of Class A, Class M, Class C, and Class I was above the competitive median because of relatively higher other expenses due to low asset levels. The Board noted that the total expense ratio of Class M was also above the competitive median because of higher 12b-1 fees on Class M as compared to most competitor funds. Class M has a higher 12b-1 fee, but a lower front-end sales charge, than traditionally priced front-end sales charge classes. The Board considered that Class M is primarily sold load-waived in the retirement plan market where its 0.50% 12b-1 fee is comparable to competing no-load, higher 12b-1 fee classes designed specifically for retirement plans. The Board noted that the total expense ratio of Class C was also above the competitive median because of its 12b-1 fees. The Board also noted that, although Class I is categorized by Lipper as an institutional class, Class I has a significantly lower investment minimum than most other funds and classes categorized as institutional. As a result, FMR believes Class I is generally more comparable to retail funds and classes. The Board noted that the fund offers multiple classes, each of which has a different sales load and 12b-1 fee structure, and that the multiple structures are intended to offer a range of pricing options for the intermediary market. The Board also noted that the total expense ratios of the classes vary primarily by the level of their 12b-1 fees, although differences in transfer agent fees may also cause expenses to vary from class to class.
Fees Charged to Other Fidelity Clients. The Board also considered Fidelity fee structures and other information with respect to clients of Fidelity, such as other funds advised or subadvised by Fidelity, pension plan clients, and other institutional clients with similar mandates. The Board noted that an ad hoc joint committee created by it and the boards of other Fidelity funds periodically (most recently in 2013) reviews and compares Fidelity's institutional investment advisory business with its business of providing services to the Fidelity funds, including the differences in services provided, fees charged, and costs incurred, as well as competition in their respective marketplaces.
Based on its review of total expense ratios and fees charged to other Fidelity clients, the Board concluded that, although some classes were above the median of the universe presented for comparison, the total expense ratio of each class of the fund was reasonable in light of the services that the fund and its shareholders receive and the other factors considered.
Costs of the Services and Profitability. The Board considered the revenues earned and the expenses incurred by Fidelity in conducting the business of developing, marketing, distributing, managing, administering and servicing the fund and servicing the fund's shareholders. The Board also considered the level of Fidelity's profits in respect of all the Fidelity funds.
On an annual basis, Fidelity presents to the Board information about the profitability of its relationships with the fund. Fidelity calculates profitability information for each fund, as well as aggregate profitability information for groups of Fidelity funds and all Fidelity funds, using a series of detailed revenue and cost allocation methodologies which originate with the books and records of Fidelity on which Fidelity's audited financial statements are based. The Audit Committee of the Board reviews any significant changes from the prior year's methodologies.
PricewaterhouseCoopers LLP (PwC), independent registered public accounting firm and auditor to Fidelity and certain Fidelity funds, has been engaged annually by the Board as part of the Board's assessment of Fidelity's profitability analysis. PwC's engagement includes the review and assessment of the methodologies used by Fidelity in determining the revenues and expenses attributable to Fidelity's mutual fund business, and completion of agreed-upon procedures in respect of the mathematical accuracy of the fund profitability information and its conformity to established allocation methodologies. After considering PwC's reports issued under the engagement and information provided by Fidelity, the Board concluded that while other allocation methods may also be reasonable, Fidelity's profitability methodologies are reasonable in all material respects.
The Board also reviewed Fidelity's non-fund businesses and potential fall-out benefits related to the mutual fund business as well as cases where Fidelity's affiliates may benefit from or be related to the fund's business.
The Board considered the costs of the services provided by and the profits realized by Fidelity in connection with the operation of the fund and was satisfied that the profitability was not excessive.
Economies of Scale. The Board considered whether there have been economies of scale in respect of the management of the Fidelity funds, whether the Fidelity funds (including the fund) have appropriately benefited from any such economies of scale, and whether there is potential for realization of any further economies of scale. The Board considered the extent to which the fund will benefit from economies of scale as assets grow through increased services to the fund, through waivers or reimbursements, or through fee or expense ratio reductions. The Board also noted that a committee (the Economies of Scale Committee) created by it and the boards of other Fidelity funds periodically (most recently in 2013) analyzes whether Fidelity attains economies of scale in respect of the management and servicing of the Fidelity funds, whether the Fidelity funds have appropriately benefited from such economies of scale, and whether there is potential for realization of any further economies of scale.
The Board recognized that the fund's management contract incorporates a "group fee" structure, which provides for lower group fee rates as total group assets increase, and for higher group fee rates as total group assets decrease (with "group assets" defined to include fund assets under FMR's management plus the assets of sector funds previously under FMR's management). FMR calculates the group fee rates based on a tiered asset "breakpoint" schedule that varies based on asset class. The Board considered that the group fee is designed to deliver the benefits of economies of scale to fund shareholders when total Fidelity fund assets increase, even if assets of any particular fund are unchanged or have declined, because some portion of Fidelity's costs are attributable to services provided to all Fidelity funds, and all funds benefit if those costs can be allocated among more assets. The Board concluded that, given the group fee structure, fund shareholders will benefit from lower management fees as group assets increase at the fund complex level, regardless of whether Fidelity achieves any such economies of scale.
The Board concluded, taking into account the analysis of the Economies of Scale Committee, that economies of scale, if any, are being appropriately shared between fund shareholders and Fidelity.
Additional Information Requested by the Board. In order to develop fully the factual basis for consideration of the Fidelity funds' advisory contracts, the Board requested and received additional information on certain topics, including: (i) fund performance trends, in particular the underperformance of certain funds, and Fidelity's long-term strategies for certain funds; (ii) Fidelity's fund profitability methodology, profitability trends for certain funds, and the impact of certain factors on fund profitability results, including the impact of market trends on actively managed funds; (iii) the use of performance fees and the calculation of performance adjustments, including the impact of underperformance and fund outflows on performance adjustments; (iv) metrics for evaluating index fund performance; (v) Fidelity's group fee structure, including the group fee breakpoint schedules; (vi) the terms of Fidelity's contractual and voluntary expense cap arrangements with the funds; (vii) the methodology with respect to evaluating competitive fund data and peer group classifications and fee comparisons; (viii) the expense structures for different funds and classes; (ix) Fidelity's arrangements with affiliated sub-advisers on behalf of the funds; (x) information regarding other accounts managed by Fidelity, including institutional accounts and collective investment trusts; (xi) recent changes to the fee structure for certain funds of funds; and (xii) the impact of the Department of Labor's new fiduciary rule on the funds' comparative expense information.
Based on its evaluation of all of the conclusions noted above, and after considering all factors it believed relevant, the Board concluded that the advisory fee structures are fair and reasonable, and that the fund's Advisory Contracts should be renewed.
AEME-ANN-1217
1.861989.109
Item 2.
Code of Ethics
As of the end of the period, October 31, 2017, Fidelity Investment Trust (the trust) has adopted a code of ethics, as defined in Item 2 of Form N-CSR, that applies to its President and Treasurer and its Chief Financial Officer. A copy of the code of ethics is filed as an exhibit to this Form N-CSR.
Item 3.
Audit Committee Financial Expert
The Board of Trustees of the trust has determined that Joseph Mauriello is an audit committee financial expert, as defined in Item 3 of Form N-CSR. Mr. Mauriello is independent for purposes of Item 3 of Form N-CSR.
Item 4.
Principal Accountant Fees and Services
Fees and Services
The following table presents fees billed by Deloitte & Touche LLP, the member firms of Deloitte Touche Tohmatsu, and their respective affiliates (collectively, “Deloitte Entities”) in each of the last two fiscal years for services rendered to Fidelity Diversified International K6 Fund, Fidelity Emerging Europe, Middle East, Africa (EMEA) Fund, Fidelity Flex International Fund, Fidelity Global Equity Income Fund, Fidelity International Capital Appreciation K6 Fund, Fidelity International Small Cap Fund, Fidelity International Small Cap Opportunities Fund, Fidelity International Value Fund, Fidelity Series Emerging Markets Fund, Fidelity Series International Small Cap Fund, Fidelity Series International Value Fund, and Fidelity Total International Equity Fund (the “Funds”):
Services Billed by Deloitte Entities
October 31, 2017 FeesA,B
| | | | |
| Audit Fees | Audit-Related Fees | Tax Fees | All Other Fees |
| | | | |
Fidelity Diversified International K6 Fund | $47,000 | $- | $7,200 | $600 |
Fidelity Emerging Europe, Middle East, Africa (EMEA) Fund | $52,000 | $100 | $6,300 | $1,500 |
Fidelity Flex International Fund | $47,000 | $100 | $7,000 | $800 |
Fidelity Global Equity Income Fund | $48,000 | $100 | $6,100 | $1,400 |
Fidelity International Capital Appreciation K6 Fund | $46,000 | $- | $7,200 | $600 |
Fidelity International Small Cap Fund | $59,000 | $100 | $7,200 | $1,700 |
Fidelity International Small Cap Opportunities Fund | $53,000 | $100 | $6,100 | $1,500 |
Fidelity International Value Fund | $51,000 | $100 | $6,100 | $1,400 |
Fidelity Series Emerging Markets Fund | $45,000 | $100 | $7,500 | $1,300 |
Fidelity Series International Small Cap Fund | $47,000 | $100 | $6,100 | $1,300 |
Fidelity Series International Value Fund | $47,000 | $100 | $6,100 | $1,300 |
Fidelity Total International Equity Fund | $65,000 | $100 | $7,000 | $1,800 |
October 31, 2016 FeesA,B,C
| | | | |
| Audit Fees | Audit-Related Fees | Tax Fees | All Other Fees |
Fidelity Diversified International K6 Fund | $- | $- | $- | $- |
Fidelity Emerging Europe, Middle East, Africa (EMEA) Fund | $52,000 | $100 | $6,300 | $1,400 |
Fidelity Flex International Fund | $- | $- | $- | $- |
Fidelity Global Equity Income Fund | $49,000 | $100 | $6,200 | $1,300 |
Fidelity International Capital Appreciation K6 Fund | $- | $- | $- | $- |
Fidelity International Small Cap Fund | $60,000 | $100 | $7,200 | $1,600 |
Fidelity International Small Cap Opportunities Fund | $53,000 | $100 | $6,100 | $1,400 |
Fidelity International Value Fund | $51,000 | $100 | $6,100 | $1,400 |
Fidelity Series Emerging Markets Fund | $45,000 | $100 | $7,500 | $1,600 |
Fidelity Series International Small Cap Fund | $47,000 | $100 | $6,100 | $1,400 |
Fidelity Series International Value Fund | $47,000 | $100 | $6,100 | $1,700 |
Fidelity Total International Equity Fund | $62,000 | $100 | $7,000 | $1,600 |
A Amounts may reflect rounding.
B Fidelity Flex International Fund commenced operations on March 7, 2017 and Fidelity Diversified International K6 Fund and Fidelity International Capital Appreciation K6 Fund commenced operations on May 25, 2017.
C Certain amounts have been reclassified to align with current period presentation.
The following table presents fees billed by PricewaterhouseCoopers LLP (“PwC”) in each of the last two fiscal years for services rendered to Fidelity Emerging Markets Discovery Fund, Fidelity Global Commodity Stock Fund, Fidelity International Discovery Fund, Fidelity International Growth Fund, Fidelity Series Canada Fund, Fidelity Series International Growth Fund, and Fidelity Total Emerging Markets Fund (the “Funds”):
Services Billed by PwC
October 31, 2017 FeesA,B
| | | | |
| Audit Fees | Audit-Related Fees | Tax Fees | All Other Fees |
Fidelity Emerging Markets Discovery Fund | $54,000 | $5,200 | $5,500 | $2,500 |
Fidelity Global Commodity Stock Fund | $41,000 | $3,900 | $3,000 | $1,800 |
Fidelity International Discovery Fund | $75,000 | $6,800 | $8,100 | $3,300 |
Fidelity International Growth Fund | $56,000 | $5,400 | $5,500 | $2,600 |
Fidelity Series Canada Fund | $44,000 | $700 | $5,500 | $300 |
Fidelity Series International Growth Fund | $47,000 | $4,600 | $5,500 | $2,200 |
Fidelity Total Emerging Markets Fund | $61,000 | $5,800 | $4,600 | $2,800 |
October 31, 2016 FeesA,B,C
| | | | |
| Audit Fees | Audit-Related Fees | Tax Fees | All Other Fees |
Fidelity Emerging Markets Discovery Fund | $54,000 | $5,300 | $5,500 | $2,500 |
Fidelity Global Commodity Stock Fund | $42,000 | $4,000 | $3,000 | $1,900 |
Fidelity International Discovery Fund | $79,000 | $8,200 | $14,400 | $3,800 |
Fidelity International Growth Fund | $56,000 | $5,700 | $6,300 | $2,700 |
Fidelity Series Canada Fund | $- | $- | $- | $- |
Fidelity Series International Growth Fund | $47,000 | $6,400 | $16,800 | $2,900 |
Fidelity Total Emerging Markets Fund | $61,000 | $5,800 | $4,600 | $2,700 |
A Amounts may reflect rounding.
B Fidelity Series Canada Fund commenced operations on August 15, 2017.
C Certain amounts have been reclassified to align with current period presentation.
The following table presents fees billed by PwC and Deloitte Entities that were required to be approved by the Audit Committee for services that relate directly to the operations and financial reporting of the Funds and that are rendered on behalf of Fidelity Management & Research Company (“FMR”) and entities controlling, controlled by, or under common control with FMR (not including any sub-adviser whose role is primarily portfolio management and is subcontracted with or overseen by another investment adviser) that provide ongoing services to the Funds (“Fund Service Providers”):
Services Billed by Deloitte Entities
| | |
| October 31, 2017A,B | October 31, 2016A,B |
Audit-Related Fees | $- | $40,000 |
Tax Fees | $25,000 | $- |
All Other Fees | $- | $- |
A Amounts may reflect rounding.
B May include amounts billed prior to the Fidelity Diversified International K6 Fund, Flex International Fund and Fidelity International Capital Appreciation K6 Fund’s commencement of operations.
Services Billed by PwC
| | |
| October 31, 2017A,B | October 31, 2016A,B,C |
Audit-Related Fees | $12,525,000 | $5,550,000 |
Tax Fees | $155,000 | $10,000 |
All Other Fees | $- | $- |
A Amounts may reflect rounding.
B May include amounts billed prior to the Fidelity Series Canada Fund’s commencement of operations.
C Certain amounts have been reclassified to align with current period presentation.
“Audit-Related Fees” represent fees billed for assurance and related services that are reasonably related to the performance of the fund audit or the review of the fund's financial statements and that are not reported under Audit Fees.
“Tax Fees” represent fees billed for tax compliance, tax advice or tax planning that relate directly to the operations and financial reporting of the fund.
“All Other Fees” represent fees billed for services provided to the fund or Fund Service Provider, a significant portion of which are assurance related, that relate directly to the operations and financial reporting of the fund, excluding those services that are reported under Audit Fees, Audit-Related Fees or Tax Fees.
Assurance services must be performed by an independent public accountant.
* * *
The aggregate non-audit fees billed by PwC and Deloitte Entities for services rendered to the Funds, FMR (not including any sub-adviser whose role is primarily portfolio management and is subcontracted with or overseen by another investment adviser), and any Fund Service Provider for each of the last two fiscal years of the Funds are as follows:
| | |
Billed By | October 31, 2017A.B.C | October 31, 2016A,B,C,D |
PwC | $16,300,000 | $6,665,000 |
Deloitte Entities | $625,000 | $145,000 |
A Amounts may reflect rounding.
B May include amounts billed prior to the Fidelity Diversified International K6 Fund, Flex International Fund and Fidelity International Capital Appreciation K6 Fund’s commencement of operations.
C May include amounts billed prior to the Fidelity Series Canada Fund’s commencement of operations.
D Certain amounts have been reclassified to align with current period presentation.
The trust's Audit Committee has considered non-audit services that were not pre-approved that were provided by PwC and Deloitte Entities to Fund Service Providers to be compatible with maintaining the independence of PwC and Deloitte Entities in their audits of the Funds, taking into account representations from PwC and Deloitte Entities, in accordance with Public Company Accounting Oversight Board rules, regarding their independence from the Funds and their related entities and FMR’s review of the appropriateness and permissibility under applicable law of such non-audit services prior to their provision to the Fund Service Providers.
Audit Committee Pre-Approval Policies and Procedures
The trust’s Audit Committee must pre-approve all audit and non-audit services provided by a fund’s independent registered public accounting firm relating to the operations or financial reporting of the fund. Prior to the commencement of any audit or non-audit services to a fund, the Audit Committee reviews the services to determine whether they are appropriate and permissible under applicable law.
The Audit Committee has adopted policies and procedures to, among other purposes, provide a framework for the Committee’s consideration of non-audit services by the audit firms that audit the Fidelity funds. The policies and procedures require that any non-audit service provided by a fund audit firm to a Fidelity fund and any non-audit service provided by a fund auditor to a Fund Service Provider that relates directly to the operations and financial reporting of a Fidelity fund (“Covered Service”) are subject to approval by the Audit Committee before such service is provided.
All Covered Services must be approved in advance of provision of the service either: (i) by formal resolution of the Audit Committee, or (ii) by oral or written approval of the service by the Chair of the Audit Committee (or if the Chair is unavailable, such other member of the Audit Committee as may be designated by the Chair to act in the Chair’s absence). The approval contemplated by (ii) above is permitted where the Treasurer determines that action on such an engagement is necessary before the next meeting of the Audit Committee.
Non-audit services provided by a fund audit firm to a Fund Service Provider that do not relate directly to the operations and financial reporting of a Fidelity fund are reported to the Audit Committee on a periodic basis.
Non-Audit Services Approved Pursuant to Rule 2-01(c)(7)(i)(C) and (ii) of Regulation S-X (“De Minimis Exception”)
There were no non-audit services approved or required to be approved by the Audit Committee pursuant to the De Minimis Exception during the Funds’ last two fiscal years relating to services provided to (i) the Funds or (ii) any Fund Service Provider that relate directly to the operations and financial reporting of the Funds.
Item 5.
Audit Committee of Listed Registrants
Not applicable.
Item 6.
Investments
(a)
Not applicable.
(b)
Not applicable
Item 7.
Disclosure of Proxy Voting Policies and Procedures for Closed-End Management Investment Companies
Not applicable.
Item 8.
Portfolio Managers of Closed-End Management Investment Companies
Not applicable.
Item 9.
Purchase of Equity Securities by Closed-End Management Investment Company and Affiliated Purchasers
Not applicable.
Item 10.
Submission of Matters to a Vote of Security Holders
There were no material changes to the procedures by which shareholders may recommend nominees to the trust’s Board of Trustees.
Item 11.
Controls and Procedures
(a)(i) The President and Treasurer and the Chief Financial Officer have concluded that the trust’s disclosure controls and procedures (as defined in Rule 30a-3(c) under the Investment Company Act) provide reasonable assurances that material information relating to the trust is made known to them by the appropriate persons, based on their evaluation of these controls and procedures as of a date within 90 days of the filing date of this report.
(a)(ii) There was no change in the trust’s internal control over financial reporting (as defined in Rule 30a-3(d) under the Investment Company Act) that occurred during the second fiscal quarter of the period covered by this report that has materially affected, or is reasonably likely to materially affect, the trust’s internal control over financial reporting.
Item 12.
Exhibits
| | |
(a) | (1) | Code of Ethics pursuant to Item 2 of Form N-CSR is filed and attached hereto as EX-99.CODE ETH. |
(a) | (2) | Certification pursuant to Rule 30a-2(a) under the Investment Company Act of 1940 (17 CFR 270.30a-2(a)) is filed and attached hereto as Exhibit 99.CERT. |
(a) | (3) | Not applicable. |
(b) | | Certification pursuant to Rule 30a-2(b) under the Investment Company Act of 1940 (17 CFR 270.30a-2(b)) is furnished and attached hereto as Exhibit 99.906CERT. |
SIGNATURES
Pursuant to the requirements of the Securities Exchange Act of 1934 and the Investment Company Act of 1940, the registrant has duly caused this report to be signed on its behalf by the undersigned, thereunto duly authorized.
Fidelity Investment Trust
| |
By: | /s/Stacie M. Smith |
| Stacie M. Smith |
| President and Treasurer |
| |
Date: | December 27, 2017 |
Pursuant to the requirements of the Securities Exchange Act of 1934 and the Investment Company Act of 1940, this report has been signed below by the following persons on behalf of the registrant and in the capacities and on the dates indicated.
| |
By: | /s/ Stacie M. Smith |
| Stacie M. Smith |
| President and Treasurer |
| |
Date: | December 27, 2017 |
| |
By: | /s/Howard J. Galligan III |
| Howard J. Galligan III |
| Chief Financial Officer |
| |
Date: | December 27, 2017 |