UNITED STATES
SECURITIES AND EXCHANGE COMMISSION
Washington, D.C. 20549
FORM N-CSR
CERTIFIED SHAREHOLDER REPORT OF REGISTERED
MANAGEMENT INVESTMENT COMPANIES
Investment Company Act file number 811-4008
Fidelity Investment Trust
(Exact name of registrant as specified in charter)
245 Summer St., Boston, Massachusetts 02210
(Address of principal executive offices) (Zip code)
William C. Coffey, Secretary
245 Summer St.
Boston, Massachusetts 02210
(Name and address of agent for service)
Registrant's telephone number, including area code:
617-563-7000
| |
Date of fiscal year end: | October 31 |
|
|
Date of reporting period: | October 31, 2018 |
This report on Form N-CSR relates solely to the Registrant’s Fidelity Diversified International Fund, Fidelity International Capital Appreciation Fund, Fidelity Overseas Fund, and Fidelity Worldwide Fund (each, a “Fund” and collectively, the “Funds”).
Item 1.
Reports to Stockholders
Fidelity® Diversified International Fund Class K
Annual Report October 31, 2018 |
 |
Contents
To view a fund's proxy voting guidelines and proxy voting record for the 12-month period ended June 30, visit http://www.fidelity.com/proxyvotingresults or visit the Securities and Exchange Commission's (SEC) web site at http://www.sec.gov.
You may also call 1-800-835-5092 to request a free copy of the proxy voting guidelines.
Standard & Poor's, S&P and S&P 500 are registered service marks of The McGraw-Hill Companies, Inc. and have been licensed for use by Fidelity Distributors Corporation.
Other third-party marks appearing herein are the property of their respective owners.
All other marks appearing herein are registered or unregistered trademarks or service marks of FMR LLC or an affiliated company. © 2018 FMR LLC. All rights reserved.
This report and the financial statements contained herein are submitted for the general information of the shareholders of the Fund. This report is not authorized for distribution to prospective investors in the Fund unless preceded or accompanied by an effective prospectus.
A fund files its complete schedule of portfolio holdings with the SEC for the first and third quarters of each fiscal year on Form N-Q. Forms N-Q are available on the SEC’s web site at http://www.sec.gov. A fund's Forms N-Q may be reviewed and copied at the SEC’s Public Reference Room in Washington, DC. Information regarding the operation of the SEC's Public Reference Room may be obtained by calling 1-800-SEC-0330.
For a complete list of a fund's portfolio holdings, view the most recent holdings listing, semiannual report, or annual report on Fidelity's web site at http://www.fidelity.com, http://www.institutional.fidelity.com, or http://www.401k.com, as applicable.
NOT FDIC INSURED •MAY LOSE VALUE •NO BANK GUARANTEE
Neither the Fund nor Fidelity Distributors Corporation is a bank.
Performance: The Bottom Line
Average annual total return reflects the change in the value of an investment, assuming reinvestment of distributions from dividend income and capital gains (the profits earned upon the sale of securities that have grown in value, if any) and assuming a constant rate of performance each year. The hypothetical investment and the average annual total returns do not reflect the deduction of taxes that a shareholder would pay on fund distributions or the redemption of fund shares. During periods of reimbursement by Fidelity, a fund’s total return will be greater than it would be had the reimbursement not occurred. How a fund did yesterday is no guarantee of how it will do tomorrow.
Average Annual Total Returns
| For the periods ended October 31, 2018 | Past 1 year | Past 5 years | Past 10 years |
| Class K | (8.95)% | 2.69% | 7.42% |
The initial offering of Class K shares took place on May 9, 2008. Returns prior to May 9, 2008 are those of Fidelity® Diversified International Fund, the original class of the fund.
$10,000 Over 10 Years
Let's say hypothetically that $10,000 was invested in Fidelity® Diversified International Fund - Class K on October 31, 2008.
The chart shows how the value of your investment would have changed, and also shows how the MSCI EAFE Index performed over the same period.
See above for additional information regarding the performance of Class K.

| Period Ending Values |
| $20,462 | Fidelity® Diversified International Fund - Class K |
| $19,780 | MSCI EAFE Index |
Management's Discussion of Fund Performance
Market Recap: International equities returned -8.08% for the 12 months ending October 31, 2018, according to the MSCI ACWI (All Country World Index) ex USA Index. A modestly positive first half of the period gave way to a confluence of overwhelmingly negative factors – including escalating trade tensions, a surging U.S. dollar, tepid economic growth in Europe, global central bank tightening, concerns about Italy’s budget stalemate with the EU, and weakness in China’s stock market – that yielded a -11% second-half return. The index lost 8% in October alone, its largest monthly drop in more than six years. Among sectors, new-media-infused communications services (-15%) was hit the hardest, while economically sensitive consumer discretionary (-13%), information technology (-12%), financials (-10%), industrials (-9%) and materials (-7%) stocks also fared poorly. Even the more defensive real estate (-9%), utilities (-6%) and consumer staples (-5%) sectors weren’t spared this period. Conversely, elevated crude-oil prices fueled a positive return for energy (+7%), the top-performing sector, followed by the relatively stable-growing health care segment (+2%). Regionally, emerging markets (-12%) fared the worst, hampered by the impact of foreign exchange and concerns about economic weakness in China, India and South Korea. Sluggish growth also pressured shares in continental Europe (-9%). Stocks in Japan (-3%) and the U.K. (-4%) held up better, followed by Canada (-5%) and Asia-Pacific ex Japan (-6%).
Comments from Portfolio Manager William Bower: For the fiscal year, the fund's share classes returned roughly -9%, trailing the -6.65% return of the benchmark MSCI EAFE Index. Versus the benchmark, security selection – notably in the health care and consumer staples sectors – detracted from performance, along with positioning in financials and energy. Geographically, stock picks in the U.K. and Japan held back the fund's performance versus the index. Individual disappointments included U.K. based software company Micro Focus International. Shares of the company returned -54% for the period, largely because a recent acquisition proved challenging, with revenue declining faster than anticipated amid heavy sales-force attrition. In Japan, an average overweighting in semiconductor manufacturer Renesas Electronics hurt, as excess industry capacity and weakening demand from end markets pressured the stock, which returned roughly -58%. Not owning index heavyweight Royal Dutch Shell was another notable detractor because shares of the Anglo-Dutch multinational oil and gas giant advanced about 8% on higher crude-oil prices and solid quarterly financial results. Conversely, security selection in information technology and materials added value. Top individual contributors included Norway-based exploration and production company Equinor (formerly Statoil), a top holding that benefited from higher crude-oil prices. By region, a non-index stake in the U.S. was helpful. Out-of-benchmark stakes in U.S.-based payment-processing firms Mastercard and Visa also worked out well, as the stocks gained about 34% and 26%, respectively.
The views expressed above reflect those of the portfolio manager(s) only through the end of the period as stated on the cover of this report and do not necessarily represent the views of Fidelity or any other person in the Fidelity organization. Any such views are subject to change at any time based upon market or other conditions and Fidelity disclaims any responsibility to update such views. These views may not be relied on as investment advice and, because investment decisions for a Fidelity fund are based on numerous factors, may not be relied on as an indication of trading intent on behalf of any Fidelity fund.
Investment Summary (Unaudited)
Geographic Diversification (% of fund's net assets)
| As of October 31, 2018 |
| | Japan | 17.0% |
| | United Kingdom | 15.9% |
| | United States of America* | 13.7% |
| | Germany | 8.2% |
| | France | 7.2% |
| | Switzerland | 4.7% |
| | Netherlands | 4.3% |
| | India | 3.7% |
| | Canada | 3.3% |
| | Other | 22.0% |
* Includes Short-Term investments and Net Other Assets (Liabilities).
Percentages are based on country or territory of incorporation and are adjusted for the effect of futures contracts, if applicable.
Asset Allocation as of October 31, 2018
| | % of fund's net assets |
| Stocks | 93.1 |
| Short-Term Investments and Net Other Assets (Liabilities) | 6.9 |
Top Ten Stocks as of October 31, 2018
| | % of fund's net assets |
| Prudential PLC (United Kingdom, Insurance) | 1.4 |
| Roche Holding AG (participation certificate) (Switzerland, Pharmaceuticals) | 1.4 |
| ORIX Corp. (Japan, Diversified Financial Services) | 1.4 |
| British American Tobacco PLC sponsored ADR (United Kingdom, Tobacco) | 1.3 |
| SAP SE (Germany, Software) | 1.3 |
| Keyence Corp. (Japan, Electronic Equipment & Components) | 1.3 |
| Hoya Corp. (Japan, Health Care Equipment & Supplies) | 1.3 |
| Equinor ASA (Norway, Oil, Gas & Consumable Fuels) | 1.3 |
| Unilever NV (Certificaten Van Aandelen) (Bearer) (Netherlands, Personal Products) | 1.3 |
| AstraZeneca PLC (United Kingdom) (United Kingdom, Pharmaceuticals) | 1.2 |
| | 13.2 |
Top Market Sectors as of October 31, 2018
| | % of fund's net assets |
| Financials | 24.3 |
| Industrials | 14.4 |
| Health Care | 12.6 |
| Information Technology | 11.1 |
| Consumer Staples | 10.3 |
| Consumer Discretionary | 7.9 |
| Energy | 4.6 |
| Materials | 4.0 |
| Communication Services | 3.2 |
| Real Estate | 0.4 |
Schedule of Investments October 31, 2018
Showing Percentage of Net Assets
| Common Stocks - 92.4% | | | |
| | | Shares | Value |
| Australia - 0.8% | | | |
| CSL Ltd. | | 547,051 | $72,830,103 |
| Magellan Financial Group Ltd. | | 2,293,393 | 43,265,125 |
|
| TOTAL AUSTRALIA | | | 116,095,228 |
|
| Bailiwick of Jersey - 1.8% | | | |
| Ferguson PLC | | 1,863,395 | 125,830,044 |
| Glencore Xstrata PLC | | 7,812,245 | 31,839,122 |
| Shire PLC | | 1,607,087 | 96,989,211 |
|
| TOTAL BAILIWICK OF JERSEY | | | 254,658,377 |
|
| Belgium - 1.1% | | | |
| KBC Groep NV | | 1,880,228 | 129,695,091 |
| Umicore SA | | 482,507 | 22,729,415 |
|
| TOTAL BELGIUM | | | 152,424,506 |
|
| Bermuda - 1.4% | | | |
| Credicorp Ltd. (United States) | | 315,700 | 71,256,647 |
| Hiscox Ltd. | | 3,557,200 | 74,022,116 |
| IHS Markit Ltd. (a) | | 1,078,200 | 56,637,846 |
|
| TOTAL BERMUDA | | | 201,916,609 |
|
| Canada - 3.3% | | | |
| Alimentation Couche-Tard, Inc. Class B (sub. vtg.) | | 3,402,681 | 162,502,605 |
| CCL Industries, Inc. Class B | | 327,800 | 13,789,786 |
| Cenovus Energy, Inc. (Canada) | | 7,622,903 | 64,506,164 |
| Constellation Software, Inc. | | 53,866 | 37,071,772 |
| Fairfax India Holdings Corp. (a)(b) | | 3,908,200 | 49,595,058 |
| PrairieSky Royalty Ltd. | | 151,898 | 2,307,691 |
| Suncor Energy, Inc. | | 4,038,900 | 135,483,933 |
|
| TOTAL CANADA | | | 465,257,009 |
|
| Cayman Islands - 0.7% | | | |
| Alibaba Group Holding Ltd. sponsored ADR (a) | | 394,900 | 56,186,372 |
| ENN Energy Holdings Ltd. | | 2,825,100 | 24,010,981 |
| Shenzhou International Group Holdings Ltd. | | 667,000 | 7,365,796 |
| Zai Lab Ltd. ADR (a) | | 524,627 | 8,582,898 |
|
| TOTAL CAYMAN ISLANDS | | | 96,146,047 |
|
| China - 0.8% | | | |
| Kweichow Moutai Co. Ltd. (A Shares) | | 484,010 | 38,085,783 |
| Ping An Insurance (Group) Co. of China Ltd. (H Shares) | | 3,683,000 | 34,683,918 |
| Shanghai International Airport Co. Ltd. (A Shares) | | 4,446,338 | 31,583,587 |
| Tonghua Dongbao Pharmaceutical Co. Ltd. Class A | | 5,545,560 | 10,636,943 |
|
| TOTAL CHINA | | | 114,990,231 |
|
| Denmark - 0.6% | | | |
| DONG Energy A/S (b) | | 111,700 | 7,096,882 |
| Netcompany Group A/S | | 547,565 | 18,109,738 |
| NNIT A/S (b) | | 280,100 | 7,909,426 |
| Novozymes A/S Series B | | 973,800 | 48,121,559 |
| SimCorp A/S | | 24,317 | 1,873,549 |
|
| TOTAL DENMARK | | | 83,111,154 |
|
| Finland - 0.8% | | | |
| Nordea Bank ABP (a) | | 7,271,500 | 63,242,181 |
| Sampo Oyj (A Shares) | | 1,235,400 | 56,894,554 |
|
| TOTAL FINLAND | | | 120,136,735 |
|
| France - 7.2% | | | |
| Aeroports de Paris | | 210,400 | 44,063,438 |
| Amundi SA (b) | | 1,578,013 | 93,978,149 |
| BNP Paribas SA | | 2,231,000 | 116,567,841 |
| Capgemini SA | | 821,000 | 100,429,810 |
| Danone SA | | 297,000 | 21,031,577 |
| Eiffage SA | | 286,700 | 28,063,232 |
| Elis SA | | 2,225,400 | 44,942,286 |
| Kering SA | | 76,919 | 34,291,339 |
| LVMH Moet Hennessy - Louis Vuitton SA | | 424,538 | 128,807,134 |
| Maisons du Monde SA (b) | | 273,900 | 6,868,555 |
| Sanofi SA | | 1,877,832 | 167,804,142 |
| Societe Generale Series A | | 1,643,100 | 60,232,351 |
| SR Teleperformance SA | | 236,600 | 39,018,615 |
| Thales SA | | 375,100 | 48,008,843 |
| VINCI SA (c) | | 1,093,500 | 97,320,811 |
|
| TOTAL FRANCE | | | 1,031,428,123 |
|
| Germany - 7.5% | | | |
| adidas AG | | 397,402 | 93,624,414 |
| Allianz SE | | 200,800 | 41,830,649 |
| Aumann AG (b) | | 263,361 | 13,005,698 |
| Axel Springer Verlag AG | | 70,492 | 4,686,770 |
| Bayer AG | | 1,442,176 | 110,546,337 |
| Deutsche Borse AG | | 297,800 | 37,633,754 |
| Deutsche Post AG | | 2,201,019 | 69,497,770 |
| Fresenius SE & Co. KGaA | | 1,658,500 | 105,407,342 |
| Hannover Reuck SE | | 419,400 | 56,576,479 |
| Linde PLC | | 742,434 | 121,806,953 |
| Merck KGaA | | 82,977 | 8,892,757 |
| Morphosys AG (a) | | 120,900 | 11,201,478 |
| Morphosys AG sponsored ADR | | 775,673 | 17,855,992 |
| MTU Aero Engines Holdings AG | | 70,300 | 14,953,630 |
| Rational AG | | 17,189 | 9,968,190 |
| SAP SE | | 1,739,489 | 186,253,164 |
| Scout24 AG (b) | | 710,100 | 29,485,446 |
| Symrise AG | | 819,800 | 68,861,006 |
| Vonovia SE | | 967,900 | 44,312,120 |
| Wirecard AG | | 146,100 | 27,370,419 |
|
| TOTAL GERMANY | | | 1,073,770,368 |
|
| Hong Kong - 1.8% | | | |
| AIA Group Ltd. | | 22,629,800 | 171,268,451 |
| BOC Hong Kong (Holdings) Ltd. | | 9,360,500 | 34,973,782 |
| Techtronic Industries Co. Ltd. | | 10,608,500 | 49,647,339 |
|
| TOTAL HONG KONG | | | 255,889,572 |
|
| India - 3.7% | | | |
| Adani Ports & Special Economic Zone Ltd. | | 6,259,436 | 26,985,143 |
| Axis Bank Ltd. (a) | | 4,220,805 | 33,236,842 |
| Godrej Consumer Products Ltd. | | 1,268,140 | 12,428,492 |
| HDFC Bank Ltd. | | 5,707,097 | 148,157,750 |
| Housing Development Finance Corp. Ltd. | | 6,235,447 | 149,162,583 |
| Kajaria Ceramics Ltd. (a) | | 11,000 | 58,629 |
| Kotak Mahindra Bank Ltd. | | 2,387,505 | 36,127,315 |
| LIC Housing Finance Ltd. | | 3,114,373 | 17,310,962 |
| Reliance Industries Ltd. | | 7,744,112 | 111,120,049 |
|
| TOTAL INDIA | | | 534,587,765 |
|
| Indonesia - 0.9% | | | |
| PT Bank Central Asia Tbk | | 40,781,700 | 63,442,671 |
| PT Bank Rakyat Indonesia Tbk | | 290,755,000 | 60,245,239 |
|
| TOTAL INDONESIA | | | 123,687,910 |
|
| Ireland - 2.4% | | | |
| CRH PLC | | 2,057,500 | 61,437,988 |
| DCC PLC (United Kingdom) | | 385,689 | 33,104,123 |
| Kerry Group PLC Class A | | 836,500 | 85,745,286 |
| Kingspan Group PLC (Ireland) | | 1,673,900 | 72,804,205 |
| Ryanair Holdings PLC sponsored ADR (a) | | 1,112,299 | 92,098,357 |
|
| TOTAL IRELAND | | | 345,189,959 |
|
| Israel - 0.5% | | | |
| Check Point Software Technologies Ltd. (a) | | 595,800 | 66,133,800 |
| Italy - 0.7% | | | |
| FinecoBank SpA | | 872,300 | 9,135,146 |
| Intesa Sanpaolo SpA | | 19,674,300 | 43,580,045 |
| Prada SpA | | 8,521,200 | 30,099,304 |
| Recordati SpA | | 550,100 | 18,642,277 |
|
| TOTAL ITALY | | | 101,456,772 |
|
| Japan - 17.0% | | | |
| Bandai Namco Holdings, Inc. | | 638,000 | 22,701,910 |
| Daikin Industries Ltd. | | 911,600 | 105,665,311 |
| GMO Internet, Inc. | | 823,800 | 11,769,093 |
| Hoya Corp. | | 3,179,300 | 180,724,334 |
| Iriso Electronics Co. Ltd. | | 126,300 | 5,344,818 |
| Itochu Corp. | | 1,567,700 | 29,074,514 |
| Kao Corp. | | 1,140,100 | 75,841,991 |
| Keyence Corp. | | 372,320 | 182,472,602 |
| Minebea Mitsumi, Inc. | | 7,428,800 | 113,645,974 |
| Misumi Group, Inc. | | 1,449,500 | 29,109,470 |
| Mitsubishi UFJ Financial Group, Inc. | | 23,319,000 | 141,138,081 |
| Morinaga & Co. Ltd. | | 528,700 | 21,249,209 |
| Nabtesco Corp. | | 640,200 | 14,116,343 |
| Nidec Corp. | | 640,100 | 82,200,106 |
| Nintendo Co. Ltd. | | 39,200 | 12,238,353 |
| Nissan Chemical Corp. | | 386,200 | 18,209,826 |
| Nitori Holdings Co. Ltd. | | 776,500 | 101,402,291 |
| NOF Corp. | | 100,000 | 2,840,431 |
| Olympus Corp. | | 1,229,600 | 40,984,779 |
| ORIX Corp. | | 11,856,300 | 193,445,724 |
| Outsourcing, Inc. | | 1,280,300 | 16,225,719 |
| PALTAC Corp. | | 438,800 | 22,399,858 |
| Panasonic Corp. | | 1,300,800 | 13,959,478 |
| Recruit Holdings Co. Ltd. | | 4,628,500 | 124,227,052 |
| Renesas Electronics Corp. (a) | | 5,289,300 | 28,032,095 |
| Seria Co. Ltd. (c) | | 179,800 | 6,063,181 |
| Shin-Etsu Chemical Co. Ltd. | | 576,800 | 48,197,708 |
| Shiseido Co. Ltd. | | 1,045,200 | 65,947,418 |
| SMC Corp. | | 208,800 | 66,895,201 |
| SoftBank Corp. | | 1,468,300 | 116,199,528 |
| Sony Corp. | | 2,866,200 | 155,109,436 |
| Subaru Corp. | | 800,300 | 21,587,850 |
| Sundrug Co. Ltd. | | 493,700 | 17,939,203 |
| Suzuki Motor Corp. | | 1,234,200 | 61,545,505 |
| Temp Holdings Co., Ltd. | | 1,014,200 | 19,306,967 |
| Tsubaki Nakashima Co. Ltd. | | 567,300 | 10,457,606 |
| Tsuruha Holdings, Inc. | | 1,003,900 | 104,629,450 |
| Welcia Holdings Co. Ltd. | | 1,487,400 | 75,928,781 |
| Yahoo! Japan Corp. | | 6,910,100 | 21,558,122 |
| Zozo, Inc. | | 1,746,100 | 42,076,004 |
|
| TOTAL JAPAN | | | 2,422,461,322 |
|
| Korea (South) - 0.3% | | | |
| Cafe24 Corp. (a) | | 107,400 | 10,401,139 |
| LG Chemical Ltd. | | 107,468 | 32,683,082 |
|
| TOTAL KOREA (SOUTH) | | | 43,084,221 |
|
| Luxembourg - 0.8% | | | |
| B&M European Value Retail S.A. | | 17,096,063 | 91,079,918 |
| Samsonite International SA | | 8,327,100 | 23,891,985 |
|
| TOTAL LUXEMBOURG | | | 114,971,903 |
|
| Netherlands - 4.3% | | | |
| Adyen BV (b) | | 49,983 | 32,331,824 |
| ASML Holding NV | | 759,400 | 130,890,184 |
| Heineken NV (Bearer) | | 367,200 | 33,106,363 |
| ING Groep NV (Certificaten Van Aandelen) | | 3,530,600 | 41,770,513 |
| Koninklijke Philips Electronics NV | | 2,382,200 | 88,846,192 |
| LyondellBasell Industries NV Class A | | 84,016 | 7,500,108 |
| Unilever NV (Certificaten Van Aandelen) (Bearer) | | 3,329,457 | 178,908,375 |
| Wolters Kluwer NV | | 1,829,400 | 103,935,027 |
|
| TOTAL NETHERLANDS | | | 617,288,586 |
|
| New Zealand - 0.3% | | | |
| Ryman Healthcare Group Ltd. | | 4,872,728 | 38,474,354 |
| Norway - 1.6% | | | |
| Equinor ASA | | 6,914,700 | 179,884,898 |
| Schibsted ASA (A Shares) | | 1,550,840 | 53,737,973 |
|
| TOTAL NORWAY | | | 233,622,871 |
|
| South Africa - 0.1% | | | |
| Capitec Bank Holdings Ltd. | | 267,300 | 17,949,913 |
| Spain - 1.9% | | | |
| Aedas Homes SAU (b) | | 101,364 | 2,622,259 |
| Amadeus IT Holding SA Class A | | 1,505,200 | 121,352,275 |
| CaixaBank SA (c) | | 23,209,800 | 93,923,355 |
| Masmovil Ibercom SA (a) | | 179,353 | 23,280,322 |
| Neinor Homes SLU (a)(b) | | 258,400 | 4,156,010 |
| Prosegur Cash SA (b) | | 16,685,574 | 33,073,102 |
|
| TOTAL SPAIN | | | 278,407,323 |
|
| Sweden - 1.8% | | | |
| Alfa Laval AB | | 1,318,900 | 33,681,770 |
| ASSA ABLOY AB (B Shares) | | 4,382,500 | 87,171,273 |
| Coor Service Management Holding AB (b) | | 4,086,300 | 28,801,446 |
| HEXPOL AB (B Shares) | | 3,518,000 | 32,561,438 |
| Indutrade AB | | 790,900 | 18,979,215 |
| Swedbank AB (A Shares) | | 1,560,500 | 35,145,206 |
| Telefonaktiebolaget LM Ericsson (B Shares) | | 1,921,100 | 16,726,554 |
|
| TOTAL SWEDEN | | | 253,066,902 |
|
| Switzerland - 4.7% | | | |
| Credit Suisse Group AG | | 6,415,863 | 83,878,857 |
| Julius Baer Group Ltd. | | 1,239,630 | 56,533,058 |
| Lonza Group AG | | 221,677 | 69,706,703 |
| Roche Holding AG (participation certificate) | | 813,384 | 197,947,090 |
| Sig Combibloc Group AG (a) | | 1,373,900 | 15,232,058 |
| Sika AG | | 892,844 | 114,536,509 |
| Swatch Group AG (Bearer) | | 122,860 | 41,573,438 |
| TE Connectivity Ltd. | | 179,900 | 13,568,058 |
| UBS Group AG | | 5,118,487 | 71,607,488 |
|
| TOTAL SWITZERLAND | | | 664,583,259 |
|
| Taiwan - 0.9% | | | |
| Taiwan Semiconductor Manufacturing Co. Ltd. sponsored ADR | | 3,472,100 | 132,287,010 |
| United Kingdom - 15.9% | | | |
| Admiral Group PLC | | 1,593,700 | 41,006,166 |
| Aon PLC | | 237,900 | 37,155,222 |
| Ascential PLC | | 7,800,273 | 37,568,124 |
| Ashtead Group PLC | | 12,148 | 300,536 |
| AstraZeneca PLC (United Kingdom) | | 2,275,639 | 174,062,871 |
| Beazley PLC | | 4,203,700 | 28,343,468 |
| Big Yellow Group PLC | | 937,900 | 10,339,855 |
| BP PLC sponsored ADR | | 2,221,700 | 96,355,129 |
| British American Tobacco PLC sponsored ADR | | 4,363,400 | 189,371,560 |
| Bunzl PLC | | 2,979,770 | 88,020,028 |
| Coca-Cola European Partners PLC | | 1,052,100 | 47,860,029 |
| Compass Group PLC | | 4,429,588 | 87,193,250 |
| Cranswick PLC | | 376,246 | 13,898,520 |
| DS Smith PLC | | 3,028,109 | 15,207,308 |
| Halma PLC | | 1,791,056 | 30,402,273 |
| Hastings Group Holdings PLC (b) | | 12,725,078 | 30,106,875 |
| Indivior PLC (a) | | 8,140,200 | 19,597,448 |
| Informa PLC | | 2,785,793 | 25,409,873 |
| InterContinental Hotel Group PLC | | 531,000 | 27,895,565 |
| ITV PLC | | 12,415,100 | 23,636,847 |
| John Wood Group PLC | | 4,104,800 | 37,472,327 |
| LivaNova PLC (a) | | 166,100 | 18,601,539 |
| Lloyds Banking Group PLC | | 131,962,100 | 96,298,030 |
| London Stock Exchange Group PLC | | 1,820,700 | 100,419,489 |
| Melrose Industries PLC | | 21,678,900 | 46,732,864 |
| Micro Focus International PLC | | 3,177,195 | 49,253,565 |
| Ocado Group PLC (a) | | 232,700 | 2,543,682 |
| Prudential PLC | | 9,885,981 | 197,953,172 |
| Reckitt Benckiser Group PLC | | 1,830,587 | 148,028,797 |
| RELX PLC | | 4,939,899 | 97,747,735 |
| Rentokil Initial PLC | | 3,810,500 | 15,400,777 |
| Smith & Nephew PLC | | 3,011,400 | 48,949,876 |
| Spectris PLC | | 1,318,600 | 36,135,716 |
| St. James's Place Capital PLC | | 7,754,100 | 100,450,930 |
| Standard Chartered PLC (United Kingdom) | | 5,685,457 | 39,932,996 |
| Standard Life PLC | | 16,652,764 | 57,577,448 |
| Tesco PLC | | 35,805,719 | 97,514,210 |
| The Weir Group PLC | | 2,785,500 | 56,468,358 |
|
| TOTAL UNITED KINGDOM | | | 2,271,212,458 |
|
| United States of America - 6.8% | | | |
| Alphabet, Inc. Class C (a) | | 99,203 | 106,818,814 |
| Amgen, Inc. | | 520,800 | 100,405,032 |
| Becton, Dickinson & Co. | | 206,300 | 47,552,150 |
| Boston Scientific Corp. (a) | | 2,117,528 | 76,527,462 |
| Citigroup, Inc. | | 1,198,400 | 78,447,264 |
| Coty, Inc. Class A | | 4,273,000 | 45,080,150 |
| DowDuPont, Inc. | | 363,300 | 19,589,136 |
| FleetCor Technologies, Inc. (a) | | 120,000 | 24,003,600 |
| International Flavors & Fragrances, Inc. | | 297,400 | 43,021,884 |
| International Flavors & Fragrances, Inc. (Israel) | | 31,584 | 4,560,336 |
| Marsh & McLennan Companies, Inc. | | 144,047 | 12,207,983 |
| MasterCard, Inc. Class A | | 723,700 | 143,053,779 |
| Microsoft Corp. | | 135,100 | 14,430,031 |
| Oceaneering International, Inc. (a) | | 284,947 | 5,396,896 |
| Quintiles Transnational Holdings, Inc. (a) | | 360,200 | 44,279,386 |
| S&P Global, Inc. | | 321,400 | 58,597,648 |
| Visa, Inc. Class A | | 1,020,300 | 140,648,355 |
|
| TOTAL UNITED STATES OF AMERICA | | | 964,619,906 |
|
| TOTAL COMMON STOCKS | | | |
| (Cost $11,030,516,204) | | | 13,188,910,193 |
|
| Nonconvertible Preferred Stocks - 0.7% | | | |
| Germany - 0.7% | | | |
| Henkel AG & Co. KGaA | | 627,700 | 68,664,942 |
| Jungheinrich AG | | 484,800 | 16,088,885 |
| Sartorius AG (non-vtg.) | | 134,984 | 19,569,872 |
| TOTAL NONCONVERTIBLE PREFERRED STOCKS | | | |
| (Cost $76,302,976) | | | 104,323,699 |
|
| Money Market Funds - 7.4% | | | |
| Fidelity Cash Central Fund, 2.23% (d) | | 874,641,587 | 874,816,515 |
| Fidelity Securities Lending Cash Central Fund 2.23% (d)(e) | | 175,554,514 | 175,572,069 |
| TOTAL MONEY MARKET FUNDS | | | |
| (Cost $1,050,365,851) | | | 1,050,388,584 |
| TOTAL INVESTMENT IN SECURITIES - 100.5% | | | |
| (Cost $12,157,185,031) | | | 14,343,622,476 |
| NET OTHER ASSETS (LIABILITIES) - (0.5)% | | | (69,434,476) |
| NET ASSETS - 100% | | | $14,274,188,000 |
Categorizations in the Schedule of Investments are based on country or territory of incorporation.
Legend
(a) Non-income producing
(b) Security exempt from registration under Rule 144A of the Securities Act of 1933. These securities may be resold in transactions exempt from registration, normally to qualified institutional buyers. At the end of the period, the value of these securities amounted to $339,030,730 or 2.4% of net assets.
(c) Security or a portion of the security is on loan at period end.
(d) Affiliated fund that is generally available only to investment companies and other accounts managed by Fidelity Investments. The rate quoted is the annualized seven-day yield of the fund at period end. A complete unaudited listing of the fund's holdings as of its most recent quarter end is available upon request. In addition, each Fidelity Central Fund's financial statements, which are not covered by the Fund's Report of Independent Registered Public Accounting Firm, are available on the SEC's website or upon request.
(e) Investment made with cash collateral received from securities on loan.
Affiliated Central Funds
Information regarding fiscal year to date income earned by the Fund from investments in Fidelity Central Funds is as follows:
| Fund | Income earned |
| Fidelity Cash Central Fund | $6,470,983 |
| Fidelity Securities Lending Cash Central Fund | 3,702,220 |
| Total | $10,173,203 |
Amounts in the income column in the above table include any capital gain distributions from underlying funds, which are presented in the corresponding line-item in the Statement of Operations if applicable.
Investment Valuation
The following is a summary of the inputs used, as of October 31, 2018, involving the Fund's assets and liabilities carried at fair value. The inputs or methodology used for valuing securities may not be an indication of the risk associated with investing in those securities. For more information on valuation inputs, and their aggregation into the levels used below, please refer to the Investment Valuation section in the accompanying Notes to Financial Statements.
| | Valuation Inputs at Reporting Date: |
| Description | Total | Level 1 | Level 2 | Level 3 |
| Investments in Securities: | | | | |
| Equities: | | | | |
| Communication Services | $425,134,726 | $275,138,723 | $149,996,003 | $-- |
| Consumer Discretionary | 1,132,069,614 | 751,060,211 | 381,009,403 | -- |
| Consumer Staples | 1,503,762,741 | 916,490,373 | 587,272,368 | -- |
| Energy | 632,527,087 | 632,527,087 | -- | -- |
| Financials | 3,464,883,640 | 2,421,954,025 | 1,042,929,615 | -- |
| Health Care | 1,803,527,994 | 771,990,154 | 1,031,537,840 | -- |
| Industrials | 2,052,196,624 | 1,425,593,919 | 626,602,705 | -- |
| Information Technology | 1,589,830,669 | 1,337,597,386 | 252,233,283 | -- |
| Materials | 600,918,700 | 473,073,178 | 127,845,522 | -- |
| Real Estate | 57,274,234 | 57,274,234 | -- | -- |
| Utilities | 31,107,863 | 31,107,863 | -- | -- |
| Money Market Funds | 1,050,388,584 | 1,050,388,584 | -- | -- |
| Total Investments in Securities: | $14,343,622,476 | $10,144,195,737 | $4,199,426,739 | $-- |
The following is a summary of transfers between Level 1 and Level 2 for the period ended October 31, 2018. Transfers are assumed to have occurred at the beginning of the period, and are primarily attributable to the valuation techniques used for foreign equity securities, as discussed in the accompanying Notes to Financial Statements:
| Transfers | Total |
| Level 1 to Level 2 | $694,766,645 |
| Level 2 to Level 1 | $2,068,649,687 |
See accompanying notes which are an integral part of the financial statements.
Financial Statements
Statement of Assets and Liabilities
| | | October 31, 2018 |
| Assets | | |
Investment in securities, at value (including securities loaned of $167,449,786) — See accompanying schedule:
Unaffiliated issuers (cost $11,106,819,180) | $13,293,233,892 | |
| Fidelity Central Funds (cost $1,050,365,851) | 1,050,388,584 | |
| Total Investment in Securities (cost $12,157,185,031) | | $14,343,622,476 |
| Foreign currency held at value (cost $455,935) | | 456,027 |
| Receivable for investments sold | | 60,363,383 |
| Receivable for fund shares sold | | 46,615,846 |
| Dividends receivable | | 60,587,438 |
| Distributions receivable from Fidelity Central Funds | | 1,150,040 |
| Prepaid expenses | | 31,777 |
| Other receivables | | 2,820,262 |
| Total assets | | 14,515,647,249 |
| Liabilities | | |
| Payable for investments purchased | $44,643,378 | |
| Payable for fund shares redeemed | 10,039,183 | |
| Accrued management fee | 6,584,575 | |
| Other affiliated payables | 1,759,378 | |
| Other payables and accrued expenses | 2,884,873 | |
| Collateral on securities loaned | 175,547,862 | |
| Total liabilities | | 241,459,249 |
| Net Assets | | $14,274,188,000 |
| Net Assets consist of: | | |
| Paid in capital | | $11,328,551,998 |
| Total distributable earnings (loss) | | 2,945,636,002 |
| Net Assets | | $14,274,188,000 |
| Net Asset Value and Maximum Offering Price | | |
| Diversified International: | | |
| Net Asset Value, offering price and redemption price per share ($9,275,298,576 ÷ 259,685,883 shares) | | $35.72 |
| Class K: | | |
| Net Asset Value, offering price and redemption price per share ($4,998,889,424 ÷ 140,115,318 shares) | | $35.68 |
See accompanying notes which are an integral part of the financial statements.
Statement of Operations
| | | Year ended October 31, 2018 |
| Investment Income | | |
| Dividends | | $383,493,275 |
| Income from Fidelity Central Funds | | 10,173,203 |
| Income before foreign taxes withheld | | 393,666,478 |
| Less foreign taxes withheld | | (35,520,671) |
| Total income | | 358,145,807 |
| Expenses | | |
| Management fee | | |
| Basic fee | $115,895,597 | |
| Performance adjustment | (8,804,399) | |
| Transfer agent fees | 20,666,926 | |
| Accounting and security lending fees | 2,091,606 | |
| Custodian fees and expenses | 2,028,086 | |
| Independent trustees' fees and expenses | 88,278 | |
| Registration fees | 96,020 | |
| Audit | 117,125 | |
| Legal | 52,385 | |
| Miscellaneous | 131,291 | |
| Total expenses before reductions | 132,362,915 | |
| Expense reductions | (2,722,337) | |
| Total expenses after reductions | | 129,640,578 |
| Net investment income (loss) | | 228,505,229 |
| Realized and Unrealized Gain (Loss) | | |
| Net realized gain (loss) on: | | |
| Investment securities: | | |
| Unaffiliated issuers | 1,831,038,559 | |
| Fidelity Central Funds | 45,947 | |
| Foreign currency transactions | (3,832,936) | |
| Total net realized gain (loss) | | 1,827,251,570 |
| Change in net unrealized appreciation (depreciation) on: | | |
| Investment securities: | | |
| Unaffiliated issuers (net of decrease in deferred foreign taxes of $2,897,453) | (3,416,875,425) | |
| Fidelity Central Funds | (20,420) | |
| Assets and liabilities in foreign currencies | (556,046) | |
| Total change in net unrealized appreciation (depreciation) | | (3,417,451,891) |
| Net gain (loss) | | (1,590,200,321) |
| Net increase (decrease) in net assets resulting from operations | | $(1,361,695,092) |
See accompanying notes which are an integral part of the financial statements.
Statement of Changes in Net Assets
| | Year ended October 31, 2018 | Year ended October 31, 2017 |
| Increase (Decrease) in Net Assets | | |
| Operations | | |
| Net investment income (loss) | $228,505,229 | $220,004,102 |
| Net realized gain (loss) | 1,827,251,570 | 1,655,511,842 |
| Change in net unrealized appreciation (depreciation) | (3,417,451,891) | 1,955,253,295 |
| Net increase (decrease) in net assets resulting from operations | (1,361,695,092) | 3,830,769,239 |
| Distributions to shareholders | (992,277,149) | – |
| Distributions to shareholders from net investment income | – | (223,211,879) |
| Distributions to shareholders from net realized gain | – | (38,126,771) |
| Total distributions | (992,277,149) | (261,338,650) |
| Share transactions - net increase (decrease) | (3,220,213,051) | (3,320,742,656) |
| Redemption fees | – | 26,003 |
| Total increase (decrease) in net assets | (5,574,185,292) | 248,713,936 |
| Net Assets | | |
| Beginning of period | 19,848,373,292 | 19,599,659,356 |
| End of period | $14,274,188,000 | $19,848,373,292 |
| Other Information | | |
| Undistributed net investment income end of period | | $198,580,550 |
See accompanying notes which are an integral part of the financial statements.
Financial Highlights
Fidelity Diversified International Fund
| Years ended October 31, | 2018 | 2017 | 2016 | 2015 | 2014 |
| Selected Per–Share Data | | | | | |
| Net asset value, beginning of period | $41.39 | $34.28 | $36.07 | $36.22 | $35.89 |
| Income from Investment Operations | | | | | |
| Net investment income (loss)A | .50 | .41 | .39 | .36 | .60B |
| Net realized and unrealized gain (loss) | (4.05) | 7.15 | (1.71) | .80 | .28 |
| Total from investment operations | (3.55) | 7.56 | (1.32) | 1.16 | .88 |
| Distributions from net investment income | (.43) | (.38) | (.33)C | (.40) | (.32) |
| Distributions from net realized gain | (1.69) | (.07) | (.14)C | (.92) | (.23) |
| Total distributions | (2.12) | (.45) | (.47) | (1.31)D | (.55) |
| Redemption fees added to paid in capitalA | – | –E | –E | –E | –E |
| Net asset value, end of period | $35.72 | $41.39 | $34.28 | $36.07 | $36.22 |
| Total ReturnF | (9.05)% | 22.38% | (3.70)% | 3.29% | 2.48% |
| Ratios to Average Net AssetsG,H | | | | | |
| Expenses before reductions | .81% | .94% | 1.05% | 1.00% | .93% |
| Expenses net of fee waivers, if any | .80% | .94% | 1.05% | .99% | .93% |
| Expenses net of all reductions | .79% | .93% | 1.05% | .99% | .92% |
| Net investment income (loss) | 1.27% | 1.10% | 1.15% | .98% | 1.65%B |
| Supplemental Data | | | | | |
| Net assets, end of period (000 omitted) | $9,275,299 | $11,349,633 | $10,990,703 | $13,059,983 | $13,781,306 |
| Portfolio turnover rateI | 30%J | 37%J | 24%J | 31%J | 39%J |
A Calculated based on average shares outstanding during the period.
B Net investment income per share reflects a large, non-recurring dividend which amounted to $.18 per share. Excluding this non-recurring dividend, the ratio of net investment income (loss) to average net assets would have been 1.16%.
C The amounts shown reflect certain reclassifications related to book to tax differences that were made in the year shown.
D Total distributions of $1.31 per share is comprised of distributions from net investment income of $.397 and distributions from net realized gain of $.917 per share.
E Amount represents less than $.005 per share.
F Total returns would have been lower if certain expenses had not been reduced during the applicable periods shown.
G Fees and expenses of any underlying Fidelity Central Funds are not included in the Fund's expense ratio. The Fund indirectly bears its proportionate share of the expenses of any underlying Fidelity Central Funds.
H Expense ratios reflect operating expenses of the class. Expenses before reductions do not reflect amounts reimbursed by the investment adviser or reductions from brokerage service arrangements or reductions from other expense offset arrangements and do not represent the amount paid by the class during periods when reimbursements or reductions occur. Expenses net of fee waivers reflect expenses after reimbursement by the investment adviser but prior to reductions from brokerage service arrangements or other expense offset arrangements. Expenses net of all reductions represent the net expenses paid by the class.
I Amount does not include the portfolio activity of any underlying Fidelity Central Funds.
J Portfolio turnover rate excludes securities received or delivered in-kind.
See accompanying notes which are an integral part of the financial statements.
Fidelity Diversified International Fund Class K
| Years ended October 31, | 2018 | 2017 | 2016 | 2015 | 2014 |
| Selected Per–Share Data | | | | | |
| Net asset value, beginning of period | $41.35 | $34.25 | $36.04 | $36.20 | $35.87 |
| Income from Investment Operations | | | | | |
| Net investment income (loss)A | .55 | .45 | .44 | .40 | .65B |
| Net realized and unrealized gain (loss) | (4.05) | 7.15 | (1.71) | .80 | .28 |
| Total from investment operations | (3.50) | 7.60 | (1.27) | 1.20 | .93 |
| Distributions from net investment income | (.48) | (.43) | (.38)C | (.45) | (.37) |
| Distributions from net realized gain | (1.69) | (.07) | (.14)C | (.92) | (.23) |
| Total distributions | (2.17) | (.50) | (.52) | (1.36)D | (.60) |
| Redemption fees added to paid in capitalA | – | –E | –E | –E | –E |
| Net asset value, end of period | $35.68 | $41.35 | $34.25 | $36.04 | $36.20 |
| Total ReturnF | (8.95)% | 22.55% | (3.57)% | 3.40% | 2.63% |
| Ratios to Average Net AssetsG,H | | | | | |
| Expenses before reductions | .69% | .82% | .92% | .87% | .80% |
| Expenses net of fee waivers, if any | .69% | .81% | .92% | .87% | .80% |
| Expenses net of all reductions | .67% | .81% | .92% | .86% | .79% |
| Net investment income (loss) | 1.39% | 1.22% | 1.28% | 1.10% | 1.78%B |
| Supplemental Data | | | | | |
| Net assets, end of period (000 omitted) | $4,998,889 | $8,498,740 | $8,608,956 | $10,143,540 | $11,134,431 |
| Portfolio turnover rateI | 30%J | 37%J | 24%J | 31%J | 39%J |
A Calculated based on average shares outstanding during the period.
B Net investment income per share reflects a large, non-recurring dividend which amounted to $.18 per share. Excluding this non-recurring dividend, the ratio of net investment income (loss) to average net assets would have been 1.29%.
C The amounts shown reflect certain reclassifications related to book to tax differences that were made in the year shown.
D Total distributions of $1.36 per share is comprised of distributions from net investment income of $.446 and distributions from net realized gain of $.917 per share.
E Amount represents less than $.005 per share.
F Total returns would have been lower if certain expenses had not been reduced during the applicable periods shown.
G Fees and expenses of any underlying Fidelity Central Funds are not included in the Fund's expense ratio. The Fund indirectly bears its proportionate share of the expenses of any underlying Fidelity Central Funds.
H Expense ratios reflect operating expenses of the class. Expenses before reductions do not reflect amounts reimbursed by the investment adviser or reductions from brokerage service arrangements or reductions from other expense offset arrangements and do not represent the amount paid by the class during periods when reimbursements or reductions occur. Expenses net of fee waivers reflect expenses after reimbursement by the investment adviser but prior to reductions from brokerage service arrangements or other expense offset arrangements. Expenses net of all reductions represent the net expenses paid by the class.
I Amount does not include the portfolio activity of any underlying Fidelity Central Funds.
J Portfolio turnover rate excludes securities received or delivered in-kind.
See accompanying notes which are an integral part of the financial statements.
Notes to Financial Statements
For the period ended October 31, 2018
1. Organization.
Fidelity Diversified International Fund (the Fund) is a fund of Fidelity Investment Trust (the Trust) and is authorized to issue an unlimited number of shares. The Trust is registered under the Investment Company Act of 1940, as amended (the 1940 Act), as an open-end management investment company organized as a Massachusetts business trust. The Fund offers Diversified International and Class K shares, each of which has equal rights as to assets and voting privileges. Each class has exclusive voting rights with respect to matters that affect that class. The Fund's investments in emerging markets can be subject to social, economic, regulatory, and political uncertainties and can be extremely volatile.
2. Investments in Fidelity Central Funds.
The Fund invests in Fidelity Central Funds, which are open-end investment companies generally available only to other investment companies and accounts managed by the investment adviser and its affiliates. The Fund's Schedule of Investments lists each of the Fidelity Central Funds held as of period end, if any, as an investment of the Fund, but does not include the underlying holdings of each Fidelity Central Fund. As an Investing Fund, the Fund indirectly bears its proportionate share of the expenses of the underlying Fidelity Central Funds.
The Money Market Central Funds seek preservation of capital and current income and are managed by Fidelity Investments Money Management, Inc. (FIMM), an affiliate of the investment adviser. Annualized expenses of the Money Market Central Funds as of their most recent shareholder report date are less than .005%.
A complete unaudited list of holdings for each Fidelity Central Fund is available upon request or at the Securities and Exchange Commission (the SEC) website at www.sec.gov. In addition, the financial statements of the Fidelity Central Funds, which are not covered by the Fund's Report of Independent Registered Public Accounting Firm, are available on the SEC website or upon request.
3. Significant Accounting Policies.
The Fund is an investment company and applies the accounting and reporting guidance of the Financial Accounting Standards Board (FASB) Accounting Standards Codification Topic 946 Financial Services – Investments Companies. The financial statements have been prepared in conformity with accounting principles generally accepted in the United States of America (GAAP), which require management to make certain estimates and assumptions at the date of the financial statements. Actual results could differ from those estimates. Subsequent events, if any, through the date that the financial statements were issued have been evaluated in the preparation of the financial statements. The following summarizes the significant accounting policies of the Fund:
Investment Valuation. Investments are valued as of 4:00 p.m. Eastern time on the last calendar day of the period. The Board of Trustees (the Board) has delegated the day to day responsibility for the valuation of the Fund's investments to the Fair Value Committee (the Committee) established by the Fund's investment adviser. In accordance with valuation policies and procedures approved by the Board, the Fund attempts to obtain prices from one or more third party pricing vendors or brokers to value its investments. When current market prices, quotations or currency exchange rates are not readily available or reliable, investments will be fair valued in good faith by the Committee, in accordance with procedures adopted by the Board. Factors used in determining fair value vary by investment type and may include market or investment specific events. The frequency with which these procedures are used cannot be predicted and they may be utilized to a significant extent. The Committee oversees the Fund's valuation policies and procedures and reports to the Board on the Committee's activities and fair value determinations. The Board monitors the appropriateness of the procedures used in valuing the Fund's investments and ratifies the fair value determinations of the Committee.
The Fund categorizes the inputs to valuation techniques used to value its investments into a disclosure hierarchy consisting of three levels as shown below:
- Level 1 – quoted prices in active markets for identical investments
- Level 2 – other significant observable inputs (including quoted prices for similar investments, interest rates, prepayment speeds, etc.)
- Level 3 – unobservable inputs (including the Fund's own assumptions based on the best information available)
Valuation techniques used to value the Fund's investments by major category are as follows:
Equity securities, including restricted securities, for which market quotations are readily available, are valued at the last reported sale price or official closing price as reported by a third party pricing vendor on the primary market or exchange on which they are traded and are categorized as Level 1 in the hierarchy. In the event there were no sales during the day or closing prices are not available, securities are valued at the last quoted bid price or may be valued using the last available price and are generally categorized as Level 2 in the hierarchy. For foreign equity securities, when market or security specific events arise, comparisons to the valuation of American Depositary Receipts (ADRs), futures contracts, Exchange-Traded Funds (ETFs) and certain indexes as well as quoted prices for similar securities may be used and would be categorized as Level 2 in the hierarchy. Utilizing these techniques may result in transfers between Level 1 and Level 2. For equity securities, including restricted securities, where observable inputs are limited, assumptions about market activity and risk are used and these securities may be categorized as Level 3 in the hierarchy.
Investments in open-end mutual funds, including the Fidelity Central Funds, are valued at their closing net asset value (NAV) each business day and are categorized as Level 1 in the hierarchy.
Changes in valuation techniques may result in transfers in or out of an assigned level within the disclosure hierarchy. The aggregate value of investments by input level as of October 31, 2018, including information on transfers between Levels 1 and 2 is included at the end of the Fund's Schedule of Investments.
Foreign Currency. The Fund may use foreign currency contracts to facilitate transactions in foreign-denominated securities. Gains and losses from these transactions may arise from changes in the value of the foreign currency or if the counterparties do not perform under the contracts' terms.
Foreign-denominated assets, including investment securities, and liabilities are translated into U.S. dollars at the exchange rates at period end. Purchases and sales of investment securities, income and dividends received and expenses denominated in foreign currencies are translated into U.S. dollars at the exchange rate in effect on the transaction date.
The effects of exchange rate fluctuations on investments are included with the net realized and unrealized gain (loss) on investment securities. Other foreign currency transactions resulting in realized and unrealized gain (loss) are disclosed separately.
Investment Transactions and Income. For financial reporting purposes, the Fund's investment holdings and NAV include trades executed through the end of the last business day of the period. The NAV per share for processing shareholder transactions is calculated as of the close of business of the New York Stock Exchange (NYSE), normally 4:00 p.m. Eastern time and includes trades executed through the end of the prior business day. Gains and losses on securities sold are determined on the basis of identified cost and include proceeds received from litigation. Dividend income is recorded on the ex-dividend date, except for certain dividends from foreign securities where the ex-dividend date may have passed, which are recorded as soon as the Fund is informed of the ex-dividend date. Non-cash dividends included in dividend income, if any, are recorded at the fair market value of the securities received. Income and capital gain distributions from Fidelity Central Funds, if any, are recorded on the ex-dividend date. Certain distributions received by the Fund represent a return of capital or capital gain. The Fund determines the components of these distributions subsequent to the ex-dividend date, based upon receipt of tax filings or other correspondence relating to the underlying investment. These distributions are recorded as a reduction of cost of investments and/or as a realized gain. Investment income is recorded net of foreign taxes withheld where recovery of such taxes is uncertain.
Class Allocations and Expenses. Investment income, realized and unrealized capital gains and losses, common expenses of the Fund, and certain fund-level expense reductions, if any, are allocated daily on a pro-rata basis to each class based on the relative net assets of each class to the total net assets of the Fund. Each class differs with respect to transfer agent fees incurred. Certain expense reductions may also differ by class. For the reporting period, the allocated portion of income and expenses to each class as a percent of its average net assets may vary due to the timing of recording these transactions in relation to fluctuating net assets of the classes. Expenses directly attributable to a fund are charged to that fund. Expenses attributable to more than one fund are allocated among the respective funds on the basis of relative net assets or other appropriate methods. Expense estimates are accrued in the period to which they relate and adjustments are made when actual amounts are known.
Deferred Trustee Compensation. Under a Deferred Compensation Plan (the Plan) for the Fund, certain independent Trustees have elected to defer receipt of a portion of their annual compensation. Deferred amounts are invested in a cross-section of Fidelity funds, are marked-to-market and remain in the Fund until distributed in accordance with the Plan. The investment of deferred amounts and the offsetting payable to the Trustees of $2,050,969 are included in the accompanying Statement of Assets and Liabilities in other receivables and other payables and accrued expenses, respectively.
Income Tax Information and Distributions to Shareholders. Each year, the Fund intends to qualify as a regulated investment company under Subchapter M of the Internal Revenue Code, including distributing substantially all of its taxable income and realized gains. As a result, no provision for U.S. Federal income taxes is required. As of October 31, 2018, the Fund did not have any unrecognized tax benefits in the financial statements; nor is the Fund aware of any tax positions for which it is reasonably possible that the total amounts of unrecognized tax benefits will significantly change in the next twelve months. The Fund files a U.S. federal tax return, in addition to state and local tax returns as required. The Fund's federal income tax returns are subject to examination by the Internal Revenue Service (IRS) for a period of three fiscal years after they are filed. State and local tax returns may be subject to examination for an additional fiscal year depending on the jurisdiction. Foreign taxes are provided for based on the Fund's understanding of the tax rules and rates that exist in the foreign markets in which it invests. The Fund is subject to a tax imposed on capital gains by certain countries in which it invests. An estimated deferred tax liability for net unrealized appreciation on the applicable securities is included in Other payables and accrued expenses on the Statement of Assets and Liabilities.
Distributions are declared and recorded on the ex-dividend date. Income and capital gain distributions are declared separately for each class. Income and capital gain distributions are determined in accordance with income tax regulations, which may differ from GAAP. In addition, the Fund claimed a portion of the payment made to redeeming shareholders as a distribution for income tax purposes.
Capital accounts within the financial statements are adjusted for permanent book-tax differences. These adjustments have no impact on net assets or the results of operations. Capital accounts are not adjusted for temporary book-tax differences which will reverse in a subsequent period.
Book-tax differences are primarily due to foreign currency transactions, passive foreign investment companies (PFIC), certain deemed distributions, redemptions in kind, deferred trustees compensation and losses deferred due to wash sales.
As of period end, the cost and unrealized appreciation (depreciation) in securities, and derivatives if applicable, for federal income tax purposes were as follows:
| Gross unrealized appreciation | $2,961,313,286 |
| Gross unrealized depreciation | (906,360,887) |
| Net unrealized appreciation (depreciation) | $2,054,952,399 |
| Tax Cost | $12,288,670,077 |
The tax-based components of distributable earnings as of period end were as follows:
| Undistributed ordinary income | $160,266,162 |
| Undistributed long-term capital gain | $733,529,456 |
| Net unrealized appreciation (depreciation) on securities and other investments | $2,053,891,353 |
The tax character of distributions paid was as follows:
| | October 31, 2018 | October 31, 2017 |
| Ordinary Income | $221,765,143 | $ 261,338,650 |
| Long-term Capital Gains | 770,512,006 | – |
| Total | $992,277,149 | $ 261,338,650 |
Restricted Securities. The Fund may invest in securities that are subject to legal or contractual restrictions on resale. These securities generally may be resold in transactions exempt from registration or to the public if the securities are registered. Disposal of these securities may involve time-consuming negotiations and expense, and prompt sale at an acceptable price may be difficult. Information regarding restricted securities is included at the end of the Fund's Schedule of Investments.
New Rule Issuance. During August 2018, the U.S. Securities and Exchange Commission issued Final Rule Release No. 33-10532, Disclosure Update and Simplification. This Final Rule includes amendments specific to registered investment companies that are intended to eliminate overlap in disclosure requirements between Regulation S-X and GAAP. In accordance with these amendments, certain line-items in the Fund's financial statements have been combined or removed for the current period as outlined in the table below.
| Financial Statement | Current Line-Item Presentation | Prior Line-Item Presentation |
| Statement of Assets and Liabilities | Total distributable earnings (loss) | Undistributed/Distributions in excess of/Accumulated net investment income (loss)
Accumulated/Undistributed net realized gain (loss)
Net unrealized appreciation (depreciation) |
| Statement of Changes in Net Assets | N/A - removed | Undistributed/Distributions in excess of/Accumulated net investment income (loss) end of period |
| Statement of Changes in Net Assets | Distributions to shareholders | Distributions to shareholders from net investment income
Distributions to shareholders from net realized gain |
| Distributions to Shareholders Note to Financial Statements | Distributions to shareholders | Distributions to shareholders from net investment income
Distributions to shareholders from net realized gain |
4. Purchases and Sales of Investments.
Purchases and sales of securities, other than short-term securities and in-kind transactions, aggregated $5,171,526,763 and $6,902,318,684, respectively.
Redemptions In-Kind. During the period, 64,249,823 shares of the Fund held by unaffiliated entities were redeemed in-kind for investments and cash with a value of $2,569,847,364. The net realized gain of $907,269,340 on investments delivered through the in-kind redemptions is included in the accompanying Statement of Operations. The amount of the redemptions is included in share transactions activity shown in the accompanying Statement of Changes in Net Assets as well as the Notes to Financial Statements. The Fund recognized no gain or loss for federal income tax purposes.
Prior Fiscal Year Redemptions In-Kind. During the prior period, 42,309,077 shares of the Fund held by an unaffiliated entity were redeemed in-kind for investments and cash with a value of $1,506,770,841. The Fund had a net realized gain of $488,334,715 on investments delivered through the in-kind redemptions. The amount of the redemptions is included in share transactions activity shown in the accompanying Statement of Changes in Net Assets as well as the Notes to Financial Statements. The Fund recognized no gain or loss for federal income tax purposes.
5. Fees and Other Transactions with Affiliates.
Management Fee. Fidelity Management & Research Company (the investment adviser) and its affiliates provide the Fund with investment management related services for which the Fund pays a monthly management fee. The management fee is the sum of an individual fund fee rate that is based on an annual rate of .424% of the Fund's average net assets and an annualized group fee rate that averaged .24% during the period. The group fee rate is based upon the average net assets of all the mutual funds advised by the investment adviser, including any mutual funds previously advised by the investment adviser that are currently advised by Fidelity SelectCo, LLC, an affiliate of the investment adviser. The group fee rate decreases as assets under management increase and increases as assets under management decrease. In addition, the management fee is subject to a performance adjustment (up to a maximum of +/- .20% of the Fund's average net assets over a 36 month performance period). The upward or downward adjustment to the management fee is based on the relative investment performance of Diversified International as compared to its benchmark index, the MSCI EAFE Index, over the same 36 month performance period. For the reporting period, the total annual management fee rate, including the performance adjustment, was .61% of the Fund's average net assets. The performance adjustment included in the management fee rate may be higher or lower than the maximum performance adjustment rate due to the difference between the average net assets for the reporting and performance periods.
Transfer Agent Fees. Fidelity Investments Institutional Operations Company, Inc., (FIIOC), an affiliate of the investment adviser, is the transfer, dividend disbursing and shareholder servicing agent for each class of the Fund. FIIOC receives account fees and asset-based fees that vary according to the account size and type of account of the shareholders of Diversified International. FIIOC receives an asset-based fee of Class K's average net assets. FIIOC pays for typesetting, printing and mailing of shareholder reports, except proxy statements.
For the period, transfer agent fees for each class were as follows:
| | Amount | % of Class-Level Average Net Assets |
| Diversified International | $17,624,257 | .16 |
| Class K | 3,042,669 | .05 |
| | $20,666,926 | |
Accounting and Security Lending Fees. Fidelity Service Company, Inc. (FSC), an affiliate of the investment adviser, maintains the Fund's accounting records. The accounting fee is based on the level of average net assets for each month. Under a separate contract, FSC administers the security lending program. The security lending fee is based on the number and duration of lending transactions. For the period, the fees were equivalent to an annual rate of .01%.
Brokerage Commissions. The Fund placed a portion of its portfolio transactions with brokerage firms which are affiliates of the investment adviser. Brokerage commissions are included in net realized gain (loss) and change in net unrealized appreciation (depreciation) in the Statement of Operations. The commissions paid to these affiliated firms were $32,529 for the period.
Interfund Trades. The Fund may purchase from or sell securities to other Fidelity Funds under procedures adopted by the Board. The procedures have been designed to ensure these interfund trades are executed in accordance with Rule 17a-7 of the 1940 Act. Interfund trades are included within the respective purchases and sales amounts shown in the Purchases and Sales of Investments note.
Prior Fiscal Year Redemptions In-Kind. During the prior period, 6,219,500 shares of the Fund held by an affiliated entity were redeemed in-kind for investments and cash, including accrued interest, with a value of $252,875,067. The Fund had a net realized gain of $95,146,213 on investments delivered through in-kind redemptions. The amount of the in-kind redemptions is included in share transactions in the accompanying Statement of Changes in Net Assets as well as the Notes to Financial Statements. The Fund recognized no gain or loss for federal income tax purposes.
6. Committed Line of Credit.
The Fund participates with other funds managed by the investment adviser or an affiliate in a $4.25 billion credit facility (the "line of credit") to be utilized for temporary or emergency purposes to fund shareholder redemptions or for other short-term liquidity purposes. The Fund has agreed to pay commitment fees on its pro-rata portion of the line of credit, which amounted to $49,236 and is reflected in Miscellaneous expenses on the Statement of Operations. During the period, the Fund did not borrow on this line of credit.
7. Security Lending.
The Fund lends portfolio securities through a lending agent from time to time in order to earn additional income. For equity securities, a lending agent is used and may loan securities to certain qualified borrowers, including Fidelity Capital Markets (FCM), a broker-dealer affiliated with the Fund. On the settlement date of the loan, the Fund receives collateral (in the form of U.S. Treasury obligations, letters of credit and/or cash) against the loaned securities and maintains collateral in an amount not less than 100% of the market value of the loaned securities during the period of the loan. The market value of the loaned securities is determined at the close of business of the Fund and any additional required collateral is delivered to the Fund on the next business day. The Fund or borrower may terminate the loan at any time, and if the borrower defaults on its obligation to return the securities loaned because of insolvency or other reasons, the Fund may apply collateral received from the borrower against the obligation. The Fund may experience delays and costs in recovering the securities loaned. Any cash collateral received is invested in the Fidelity Securities Lending Cash Central Fund. The value of loaned securities and cash collateral at period end are disclosed on the Fund's Statement of Assets and Liabilities. Security lending income represents the income earned on investing cash collateral, less rebates paid to borrowers and any lending agent fees associated with the loan, plus any premium payments received for lending certain types of securities. Security lending income is presented in the Statement of Operations as a component of income from Fidelity Central Funds. Total security lending income during the period amounted to $3,702,220. During the period, there were no securities loaned to FCM.
8. Expense Reductions.
Commissions paid to certain brokers with whom the investment adviser, or its affiliates, places trades on behalf of the Fund include an amount in addition to trade execution, which may be rebated back to the Fund to offset certain expenses. This amount totaled $2,526,068 for the period. In addition, through arrangements with the Fund's custodian, credits realized as a result of certain uninvested cash balances were used to reduce the Fund's expenses. During the period, these credits reduced the Fund's custody expenses by $5,241.
In addition, during the period the investment adviser reimbursed and/or waived a portion of fund-level operating expenses in the amount of $191,028.
9. Distributions to Shareholders.
Distributions to shareholders of each class were as follows:
| | Year ended
October 31, 2018 | Year ended
October 31, 2017 |
| Distributions to shareholders | | |
| Diversified International | $578,499,998 | $– |
| Class K | 413,777,151 | – |
| Total | $992,277,149 | $– |
| From net investment income | | |
| Diversified International | $– | $117,261,561 |
| Class K | – | 105,950,318 |
| Total | $– | $223,211,879 |
| From net realized gain | | |
| Diversified International | $– | $21,125,448 |
| Class K | – | 17,001,323 |
| Total | $– | $38,126,771 |
10. Share Transactions.
Share transactions for each class were as follows and may contain automatic conversions between classes or exchanges between affiliated funds:
| | Shares | Shares | Dollars | Dollars |
| | Year ended October 31, 2018 | Year ended October 31, 2017 | Year ended October 31, 2018 | Year ended October 31, 2017 |
| Diversified International | | | | |
| Shares sold | 29,835,455 | 29,659,523 | $1,174,373,008 | $1,086,343,758 |
| Reinvestment of distributions | 13,661,964 | 3,851,054 | 537,871,482 | 128,009,018 |
| Shares redeemed | (57,997,016)(a) | (79,920,304)(b) | (2,309,553,360)(a) | (2,857,242,109)(b) |
| Net increase (decrease) | (14,499,597) | (46,409,727) | $(597,308,870) | $(1,642,889,333) |
| Class K | | | | |
| Shares sold | 29,277,888 | 40,529,599 | $1,163,459,637 | $1,505,583,540 |
| Reinvestment of distributions | 10,532,806 | 3,707,830 | 413,728,634 | 122,951,641 |
| Shares redeemed | (105,246,564)(a) | (90,053,301)(b) | (4,200,092,452)(a) | (3,306,388,504)(b) |
| Net increase (decrease) | (65,435,870) | (45,815,872) | $(2,622,904,181) | $(1,677,853,323) |
(a) Amount includes in-kind redemptions (see the Redemptions In-Kind note for additional details).
(b) Amount includes in-kind redemptions (see the Prior Fiscal Year Redemptions In-Kind note for additional details).
11. Other.
The Fund's organizational documents provide former and current trustees and officers with a limited indemnification against liabilities arising in connection with the performance of their duties to the Fund. In the normal course of business, the Fund may also enter into contracts that provide general indemnifications. The Fund's maximum exposure under these arrangements is unknown as this would be dependent on future claims that may be made against the Fund. The risk of material loss from such claims is considered remote.
Report of Independent Registered Public Accounting Firm
To the Trustees of Fidelity Investment Trust and Shareholders of Fidelity Diversified International Fund:
Opinion on the Financial Statements and Financial Highlights
We have audited the accompanying statement of assets and liabilities of Fidelity Diversified International Fund (the "Fund"), a fund of Fidelity Investment Trust, including the schedule of investments, as of October 31, 2018, and the related statement of operations for the year then ended, the statement of changes in net assets for each of the two years in the period then ended, the financial highlights for each of the five years in the period then ended, and the related notes. In our opinion, the financial statements and financial highlights present fairly, in all material respects, the financial position of the Fund as of October 31, 2018, and the results of its operations for the year then ended, the changes in its net assets for each of the two years in the period then ended, and the financial highlights for each of the five years in the period then ended, in conformity with accounting principles generally accepted in the United States of America.
Basis for Opinion
These financial statements and financial highlights are the responsibility of the Fund's management. Our responsibility is to express an opinion on the Fund's financial statements and financial highlights based on our audits. We are a public accounting firm registered with the Public Company Accounting Oversight Board (United States) (PCAOB) and are required to be independent with respect to the Fund in accordance with the U.S. federal securities laws and the applicable rules and regulations of the Securities and Exchange Commission and the PCAOB.
We conducted our audits in accordance with the standards of the PCAOB. Those standards require that we plan and perform the audit to obtain reasonable assurance about whether the financial statements and financial highlights are free of material misstatement, whether due to error or fraud. The Fund is not required to have, nor were we engaged to perform, an audit of its internal control over financial reporting. As part of our audits we are required to obtain an understanding of internal control over financial reporting but not for the purpose of expressing an opinion on the effectiveness of the Fund’s internal control over financial reporting. Accordingly, we express no such opinion.
Our audits included performing procedures to assess the risks of material misstatement of the financial statements and financial highlights, whether due to error or fraud, and performing procedures that respond to those risks. Such procedures included examining, on a test basis, evidence regarding the amounts and disclosures in the financial statements and financial highlights. Our audits also included evaluating the accounting principles used and significant estimates made by management, as well as evaluating the overall presentation of the financial statements and financial highlights. Our procedures included confirmation of securities owned as of October 31, 2018, by correspondence with the custodians and brokers; when replies were not received from brokers, we performed other auditing procedures. We believe that our audits provide a reasonable basis for our opinion.
/s/ Deloitte & Touche LLP
Boston, Massachusetts
December 13, 2018
We have served as the auditor of one or more of the Fidelity investment companies since 1999.
Trustees and Officers
The Trustees, Members of the Advisory Board (if any), and officers of the trust and fund, as applicable, are listed below. The Board of Trustees governs the fund and is responsible for protecting the interests of shareholders. The Trustees are experienced executives who meet periodically throughout the year to oversee the fund's activities, review contractual arrangements with companies that provide services to the fund, oversee management of the risks associated with such activities and contractual arrangements, and review the fund's performance. Except for Jonathan Chiel, each of the Trustees oversees 283 funds. Mr. Chiel oversees 154 funds.
The Trustees hold office without limit in time except that (a) any Trustee may resign; (b) any Trustee may be removed by written instrument, signed by at least two-thirds of the number of Trustees prior to such removal; (c) any Trustee who requests to be retired or who has become incapacitated by illness or injury may be retired by written instrument signed by a majority of the other Trustees; and (d) any Trustee may be removed at any special meeting of shareholders by a two-thirds vote of the outstanding voting securities of the trust. Each Trustee who is not an interested person (as defined in the 1940 Act) of the trust and the fund is referred to herein as an Independent Trustee. Each Independent Trustee shall retire not later than the last day of the calendar year in which his or her 75th birthday occurs. The Independent Trustees may waive this mandatory retirement age policy with respect to individual Trustees. Officers and Advisory Board Members hold office without limit in time, except that any officer or Advisory Board Member may resign or may be removed by a vote of a majority of the Trustees at any regular meeting or any special meeting of the Trustees. Except as indicated, each individual has held the office shown or other offices in the same company for the past five years.
The fund’s Statement of Additional Information (SAI) includes more information about the Trustees. To request a free copy, call Fidelity at 1-800-835-5092.
Experience, Skills, Attributes, and Qualifications of the Trustees. The Governance and Nominating Committee has adopted a statement of policy that describes the experience, qualifications, attributes, and skills that are necessary and desirable for potential Independent Trustee candidates (Statement of Policy). The Board believes that each Trustee satisfied at the time he or she was initially elected or appointed a Trustee, and continues to satisfy, the standards contemplated by the Statement of Policy. The Governance and Nominating Committee also engages professional search firms to help identify potential Independent Trustee candidates who have the experience, qualifications, attributes, and skills consistent with the Statement of Policy. From time to time, additional criteria based on the composition and skills of the current Independent Trustees, as well as experience or skills that may be appropriate in light of future changes to board composition, business conditions, and regulatory or other developments, have also been considered by the professional search firms and the Governance and Nominating Committee. In addition, the Board takes into account the Trustees' commitment and participation in Board and committee meetings, as well as their leadership of standing and ad hoc committees throughout their tenure.
In determining that a particular Trustee was and continues to be qualified to serve as a Trustee, the Board has considered a variety of criteria, none of which, in isolation, was controlling. The Board believes that, collectively, the Trustees have balanced and diverse experience, qualifications, attributes, and skills, which allow the Board to operate effectively in governing the fund and protecting the interests of shareholders. Information about the specific experience, skills, attributes, and qualifications of each Trustee, which in each case led to the Board's conclusion that the Trustee should serve (or continue to serve) as a trustee of the fund, is provided below.
Board Structure and Oversight Function. James C. Curvey is an interested person and currently serves as Chairman. The Trustees have determined that an interested Chairman is appropriate and benefits shareholders because an interested Chairman has a personal and professional stake in the quality and continuity of services provided to the fund. Independent Trustees exercise their informed business judgment to appoint an individual of their choosing to serve as Chairman, regardless of whether the Trustee happens to be independent or a member of management. The Independent Trustees have determined that they can act independently and effectively without having an Independent Trustee serve as Chairman and that a key structural component for assuring that they are in a position to do so is for the Independent Trustees to constitute a substantial majority for the Board. The Independent Trustees also regularly meet in executive session. Ned C. Lautenbach serves as Chairman of the Independent Trustees and as such (i) acts as a liaison between the Independent Trustees and management with respect to matters important to the Independent Trustees and (ii) with management prepares agendas for Board meetings.
Fidelity® funds are overseen by different Boards of Trustees. The fund's Board oversees Fidelity's high income and certain equity funds, and other Boards oversee Fidelity's investment-grade bond, money market, asset allocation, and other equity funds. The asset allocation funds may invest in Fidelity® funds overseen by the fund's Board. The use of separate Boards, each with its own committee structure, allows the Trustees of each group of Fidelity® funds to focus on the unique issues of the funds they oversee, including common research, investment, and operational issues. On occasion, the separate Boards establish joint committees to address issues of overlapping consequences for the Fidelity® funds overseen by each Board.
The Trustees operate using a system of committees to facilitate the timely and efficient consideration of all matters of importance to the Trustees, the fund, and fund shareholders and to facilitate compliance with legal and regulatory requirements and oversight of the fund's activities and associated risks. The Board, acting through its committees, has charged FMR and its affiliates with (i) identifying events or circumstances the occurrence of which could have demonstrably adverse effects on the fund's business and/or reputation; (ii) implementing processes and controls to lessen the possibility that such events or circumstances occur or to mitigate the effects of such events or circumstances if they do occur; and (iii) creating and maintaining a system designed to evaluate continuously business and market conditions in order to facilitate the identification and implementation processes described in (i) and (ii) above. Because the day-to-day operations and activities of the fund are carried out by or through FMR, its affiliates, and other service providers, the fund's exposure to risks is mitigated but not eliminated by the processes overseen by the Trustees. While each of the Board's committees has responsibility for overseeing different aspects of the fund's activities, oversight is exercised primarily through the Operations, Audit, and Compliance Committees. In addition, the Independent Trustees have worked with Fidelity to enhance the Board's oversight of investment and financial risks, legal and regulatory risks, technology risks, and operational risks, including the development of additional risk reporting to the Board. Appropriate personnel, including but not limited to the fund's Chief Compliance Officer (CCO), FMR's internal auditor, the independent accountants, the fund's Treasurer and portfolio management personnel, make periodic reports to the Board's committees, as appropriate, including an annual review of Fidelity's risk management program for the Fidelity® funds. The responsibilities of each standing committee, including their oversight responsibilities, are described further under "Standing Committees of the Trustees."
Interested Trustees*:
Correspondence intended for a Trustee who is an interested person may be sent to Fidelity Investments, 245 Summer Street, Boston, Massachusetts 02210.
Name, Year of Birth; Principal Occupations and Other Relevant Experience+
Jonathan Chiel (1957)
Year of Election or Appointment: 2016
Trustee
Mr. Chiel also serves as Trustee of other Fidelity® funds. Mr. Chiel is Executive Vice President and General Counsel for FMR LLC (diversified financial services company, 2012-present). Previously, Mr. Chiel served as general counsel (2004-2012) and senior vice president and deputy general counsel (2000-2004) for John Hancock Financial Services; a partner with Choate, Hall & Stewart (1996-2000) (law firm); and an Assistant United States Attorney for the United States Attorney’s Office of the District of Massachusetts (1986-95), including Chief of the Criminal Division (1993-1995). Mr. Chiel is a director on the boards of the Boston Bar Foundation and the Maimonides School.
James C. Curvey (1935)
Year of Election or Appointment: 2007
Trustee
Chairman of the Board of Trustees
Mr. Curvey also serves as Trustee of other Fidelity® funds. Mr. Curvey is Vice Chairman (2007-present) and Director of FMR LLC (diversified financial services company). In addition, Mr. Curvey is an Overseer Emeritus for the Boston Symphony Orchestra, a Director of Artis-Naples, and a Trustee of Brewster Academy in Wolfeboro, New Hampshire. Previously, Mr. Curvey served as a Director of Fidelity Research & Analysis Co. (investment adviser firm, 2009-2018), Director of Fidelity Investments Money Management, Inc. (investment adviser firm, 2009-2014) and a Director of FMR and FMR Co., Inc. (investment adviser firms, 2007-2014).
Charles S. Morrison (1960)
Year of Election or Appointment: 2014
Trustee
Mr. Morrison also serves as Trustee of other funds. He serves as President of Fidelity SelectCo, LLC (investment adviser firm, 2017-present) and Fidelity Management & Research Company (FMR) (investment adviser firm, 2016-present), a Director of Fidelity Investments Money Management, Inc. (FIMM) (investment adviser firm, 2014-present), Director of Fidelity SelectCo, LLC (investment adviser firm, 2014-present), President, Asset Management (2014-present), and is an employee of Fidelity Investments. Previously, Mr. Morrison served as Vice President of Fidelity's Fixed Income and Asset Allocation Funds (2012-2014), President, Fixed Income (2011-2014), Vice President of Fidelity's Money Market Funds (2005-2009), President, Money Market Group Leader of FMR (investment adviser firm, 2009), and Senior Vice President, Money Market Group of FMR (2004-2009). Mr. Morrison also served as Vice President of Fidelity's Bond Funds (2002-2005), certain Balanced Funds (2002-2005), and certain Asset Allocation Funds (2002-2007), and as Senior Vice President (2002-2005) of Fidelity's Bond Division.
* Determined to be an “Interested Trustee” by virtue of, among other things, his or her affiliation with the trust or various entities under common control with FMR.
+ The information includes the Trustee's principal occupation during the last five years and other information relating to the experience, attributes, and skills relevant to the Trustee's qualifications to serve as a Trustee, which led to the conclusion that the Trustee should serve as a Trustee for the fund.
Independent Trustees:
Correspondence intended for an Independent Trustee may be sent to Fidelity Investments, P.O. Box 55235, Boston, Massachusetts 02205-5235.
Name, Year of Birth; Principal Occupations and Other Relevant Experience+
Dennis J. Dirks (1948)
Year of Election or Appointment: 2005
Trustee
Mr. Dirks also serves as Trustee of other Fidelity® funds. Prior to his retirement in May 2003, Mr. Dirks was Chief Operating Officer and a member of the Board of The Depository Trust & Clearing Corporation (DTCC). He also served as President, Chief Operating Officer, and Board member of The Depository Trust Company (DTC) and President and Board member of the National Securities Clearing Corporation (NSCC). In addition, Mr. Dirks served as Chief Executive Officer and Board member of the Government Securities Clearing Corporation, Chief Executive Officer and Board member of the Mortgage-Backed Securities Clearing Corporation, as a Trustee and a member of the Finance Committee of Manhattan College (2005-2008), as a Trustee and a member of the Finance Committee of AHRC of Nassau County (2006-2008), as a member of the Independent Directors Council (IDC) Governing Council (2010-2015), and as a member of the Board of Directors for The Brookville Center for Children’s Services, Inc. (2009-2017). Mr. Dirks is a member of the Finance Committee (2016-present), Board of Directors (2017-present) and Board of Trustees (2018-present) and is Treasurer (2018-present) of the Asolo Repertory Theatre.
Donald F. Donahue (1950)
Year of Election or Appointment: 2018
Trustee
Mr. Donahue also serves as a Trustee of other Fidelity® funds. Mr. Donahue is President and Chief Executive Officer of Miranda Partners, LLC (risk consulting for the financial services industry, 2012-present). Previously, Mr. Donahue served as a Member of the Advisory Board of certain Fidelity® funds (2015-2018) and Chief Executive Officer (2006-2012), Chief Operating Officer (2003-2006), and Managing Director, Customer Marketing and Development (1999-2003) of The Depository Trust & Clearing Corporation (financial markets infrastructure). Mr. Donahue serves as a Member (2007-present) and Co-Chairman (2016-present) of the Board of Directors of United Way of New York, Member of the Board of Directors of NYC Leadership Academy (2012-present) and Member of the Board of Advisors of Ripple Labs, Inc. (financial services, 2015-present). He also served as Chairman (2010-2012) and Member of the Board of Directors (2012-2013) of Omgeo, LLC (financial services), Treasurer of United Way of New York (2012-2016), and Member of the Board of Directors of XBRL US (financial services non-profit, 2009-2012) and the International Securities Services Association (2009-2012).
Alan J. Lacy (1953)
Year of Election or Appointment: 2008
Trustee
Mr. Lacy also serves as Trustee of other Fidelity® funds. Mr. Lacy serves as a Director of Bristol-Myers Squibb Company (global pharmaceuticals, 2008-present). He is a Trustee of the California Chapter of The Nature Conservancy (2015-present) and a Director of the Center for Advanced Study in the Behavioral Sciences at Stanford University (2015-present). In addition, Mr. Lacy served as Senior Adviser (2007-2014) of Oak Hill Capital Partners, L.P. (private equity) and also served as Chief Executive Officer (2005) and Vice Chairman (2005-2006) of Sears Holdings Corporation (retail) and Chief Executive Officer and Chairman of the Board of Sears, Roebuck and Co. (retail, 2000-2005). Previously, Mr. Lacy served as Chairman (2014-2017) and a member (2010-2017) of the Board of Directors of Dave & Buster’s Entertainment, Inc. (restaurant and entertainment complexes), as Chairman (2008-2011) and a member (2006-2015) of the Board of Trustees of the National Parks Conservation Association, and as a member of the Board of Directors for The Hillman Companies, Inc. (hardware wholesalers, 2010-2014), Earth Fare, Inc. (retail grocery, 2010-2014), and The Western Union Company (global money transfer, 2006-2011).
Ned C. Lautenbach (1944)
Year of Election or Appointment: 2000
Trustee
Chairman of the Independent Trustees
Mr. Lautenbach also serves as Trustee of other Fidelity® funds. Mr. Lautenbach currently serves as Vice Chair of the Board of Governors, State University System of Florida (2013-present) and is a member of the Council on Foreign Relations (1994-present). He is also a member and has most recently served as Chairman of the Board of Directors of Artis-Naples (2012-present). Previously, Mr. Lautenbach served as a member and then Lead Director of the Board of Directors of Eaton Corporation (diversified industrial, 1997-2016). He was also a Partner and Advisory Partner at Clayton, Dubilier & Rice, LLC (private equity investment, 1998-2010), as well as a Director of Sony Corporation (2006-2007). In addition, Mr. Lautenbach also had a 30-year career with IBM (technology company) during which time he served as Senior Vice President and a member of the Corporate Executive Committee (1968-1998).
Joseph Mauriello (1944)
Year of Election or Appointment: 2008
Trustee
Mr. Mauriello also serves as Trustee of other Fidelity® funds. Prior to his retirement in January 2006, Mr. Mauriello served in numerous senior management positions including Deputy Chairman and Chief Operating Officer (2004-2005), and Vice Chairman of Financial Services (2002-2004) of KPMG LLP US (professional services, 1965-2005). Mr. Mauriello currently serves as a member of the Independent Directors Council (IDC) Governing Council (2015-present). Previously, Mr. Mauriello served as a member of the Board of Directors of XL Group plc. (global insurance and re-insurance, 2006-2018).
Cornelia M. Small (1944)
Year of Election or Appointment: 2005
Trustee
Ms. Small also serves as Trustee of other Fidelity® funds. Ms. Small is a member of the Board of Directors (2009-present) and Chair of the Investment Committee (2010-present) of the Teagle Foundation. Ms. Small also serves on the Investment Committee of the Berkshire Taconic Community Foundation (2008-present). Previously, Ms. Small served as Chairperson (2002-2008) and a member of the Investment Committee and Chairperson (2008-2012) and a member of the Board of Trustees of Smith College. In addition, Ms. Small served as Chief Investment Officer, Director of Global Equity Investments, and a member of the Board of Directors of Scudder, Stevens & Clark and Scudder Kemper Investments.
Garnett A. Smith (1947)
Year of Election or Appointment: 2018
Trustee
Mr. Smith also serves as Trustee of other Fidelity® funds. Prior to Mr. Smith's retirement, he served as Chairman and Chief Executive Officer of Inbrand Corp. (manufacturer of personal absorbent products, 1990-1997). He also served as President (1986-1990) of Inbrand Corp. Prior to his employment with Inbrand Corp., he was employed by a retail fabric chain and North Carolina National Bank. In addition, Mr. Smith served as a Member of the Advisory Board of certain Fidelity® funds (2012-2013) and as a board member of the Jackson Hole Land Trust (2009-2012).
David M. Thomas (1949)
Year of Election or Appointment: 2008
Trustee
Mr. Thomas also serves as Trustee of other Fidelity® funds. Mr. Thomas serves as Non-Executive Chairman of the Board of Directors of Fortune Brands Home and Security (home and security products, 2011-present), as a member of the Board of Directors (2004-present) and Presiding Director (2013-present) of Interpublic Group of Companies, Inc. (marketing communication), and as a member of the Board of Trustees of the University of Florida (2013-present). Previously, Mr. Thomas served as Executive Chairman (2005-2006) and Chairman and Chief Executive Officer (2000-2005) of IMS Health, Inc. (pharmaceutical and healthcare information solutions), and a Director of Fortune Brands, Inc. (consumer products, 2000-2011).
+ The information includes the Trustee's principal occupation during the last five years and other information relating to the experience, attributes, and skills relevant to the Trustee's qualifications to serve as a Trustee, which led to the conclusion that the Trustee should serve as a Trustee for the fund.
Advisory Board Members and Officers:
Correspondence intended for a Member of the Advisory Board (if any) may be sent to Fidelity Investments, P.O. Box 55235, Boston, Massachusetts 02205-5235. Correspondence intended for an officer or Peter S. Lynch may be sent to Fidelity Investments, 245 Summer Street, Boston, Massachusetts 02210. Officers appear below in alphabetical order.
Name, Year of Birth; Principal Occupation
Vicki L. Fuller (1957)
Year of Election or Appointment: 2018
Member of the Advisory Board
Ms. Fuller also serves as Member of the Advisory Board of other Fidelity® funds. Ms. Fuller serves as a member of the Board of Directors, Audit Committee, and Nominating and Governance Committee of The Williams Companies, Inc. (natural gas infrastructure, 2018-present). Previously, Ms. Fuller served as the Chief Investment Officer of the New York State Common Retirement Fund (2012-2018) and held a variety of positions at AllianceBernstein L.P. (global asset management, 1985-2012), including Managing Director (2006-2012) and Senior Vice President and Senior Portfolio Manager (2001-2006).
Peter S. Lynch (1944)
Year of Election or Appointment: 2003
Member of the Advisory Board
Mr. Lynch also serves as Member of the Advisory Board of other Fidelity® funds. Mr. Lynch is Vice Chairman and a Director of FMR (investment adviser firm) and FMR Co., Inc. (investment adviser firm). In addition, Mr. Lynch serves as a Trustee of Boston College and as the Chairman of the Inner-City Scholarship Fund. Previously, Mr. Lynch served on the Special Olympics International Board of Directors (1997-2006).
William S. Stavropoulos (1939)
Year of Election or Appointment: 2018
Member of the Advisory Board
Mr. Stavropoulos also serves as Member of the Advisory Board of other Fidelity® funds. Mr. Stavropoulos serves as President and Founder of the Michigan Baseball Foundation, the Great Lakes Loons (2007-present). Mr. Stavropoulos is Chairman Emeritus of the Board of Directors of The Dow Chemical Company, where he previously served in numerous senior management positions, including President, CEO (1995-2000; 2002-2004), Chairman of the Executive Committee (2000-2006), and as a member of the Board of Directors (1990-2006). Currently, Mr. Stavropoulos is Chairman of the Board of Directors of Univar Inc. (global distributor of commodity and specialty chemicals), a Director of Teradata Corporation (data warehousing and technology solutions), and a member of the Advisory Board for Metalmark Capital LLC (private equity investment, 2005-present). Mr. Stavropoulos is an operating advisor to Clayton, Dubilier & Rice, LLC (private equity investment). In addition, Mr. Stavropoulos is a member of the University of Notre Dame Advisory Council for the College of Science, a Trustee of the Rollin L. Gerstacker Foundation, and a Director of Artis-Naples in Naples, Florida. Previously, Mr. Stavropoulos served as Trustee of certain Fidelity® funds (2001-2018) and as a Director of Chemical Financial Corporation (bank holding company, 1993-2012) and Tyco International, Ltd. (multinational manufacturing and services, 2007-2012).
Carol B. Tomé (1957)
Year of Election or Appointment: 2018
Member of the Advisory Board
Ms. Tomé also serves as Member of the Advisory Board of other Fidelity® funds. Ms. Tomé is Chief Financial Officer (2001-present) and Executive Vice President of Corporate Services (2007-present) of The Home Depot, Inc. (home improvement retailer) and a Director (2003-present) and Chair of the Audit Committee (2004-present) of United Parcel Service, Inc. (package delivery and supply chain management). Previously, Ms. Tomé served as Trustee of certain Fidelity® funds (2017), Senior Vice President of Finance and Accounting/Treasurer (2000-2007) and Vice President and Treasurer (1995-2000) of The Home Depot, Inc. and Chair of the Board (2010-2012), Vice Chair of the Board (2009 and 2013), and a Director (2008-2013) of the Federal Reserve Bank of Atlanta. Ms. Tomé is also a director or trustee of many community and professional organizations.
Michael E. Wiley (1950)
Year of Election or Appointment: 2018
Member of the Advisory Board
Mr. Wiley also serves as Trustee or Member of the Advisory Board of other Fidelity® funds. Mr. Wiley serves as a Director of High Point Resources (exploration and production, 2005-present). Previously, Mr. Wiley served as a Director of Andeavor Corporation (independent oil refiner and marketer, 2005-2018), a Director of Andeavor Logistics LP (natural resources logistics, 2015-2018), a Director of Post Oak Bank (privately-held bank, 2004-2018), a Director of Asia Pacific Exploration Consolidated (international oil and gas exploration and production, 2008-2013), a member of the Board of Trustees of the University of Tulsa (2000-2006; 2007-2010), a Senior Energy Advisor of Katzenbach Partners, LLC (consulting, 2006-2007), an Advisory Director of Riverstone Holdings (private investment), a Director of Spinnaker Exploration Company (exploration and production, 2001-2005) and Chairman, President, and CEO of Baker Hughes, Inc. (oilfield services, 2000-2004).
Elizabeth Paige Baumann (1968)
Year of Election or Appointment: 2017
Anti-Money Laundering (AML) Officer
Ms. Baumann also serves as AML Officer of other funds. She is Chief AML Officer (2012-present) and Senior Vice President (2014-present) of FMR LLC (diversified financial services company) and is an employee of Fidelity Investments. Previously, Ms. Baumann served as AML Officer of the funds (2012-2016), and Vice President (2007-2014) and Deputy Anti-Money Laundering Officer (2007-2012) of FMR LLC.
John J. Burke III (1964)
Year of Election or Appointment: 2018
Chief Financial Officer
Mr. Burke also serves as Chief Financial Officer of other funds. Mr. Burke serves as Head of Investment Operations for Fidelity Fund and Investment Operations (2018-present) and is an employee of Fidelity Investments (1998-present). Previously Mr. Burke served as head of Asset Management Investment Operations (2012-2018).
William C. Coffey (1969)
Year of Election or Appointment: 2018
Secretary and Chief Legal Officer (CLO)
Mr. Coffey also serves as Secretary and CLO of other funds. Mr. Coffey serves as CLO, Secretary, and Senior Vice President of Fidelity Management & Research Company and FMR Co., Inc. (investment adviser firms, 2018-present); Secretary of Fidelity SelectCo, LLC and Fidelity Investments Money Management, Inc. (investment adviser firms, 2018-present); and CLO of Fidelity Management & Research (Hong Kong) Limited, FMR Investment Management (UK) Limited, and Fidelity Management & Research (Japan) Limited (investment adviser firms, 2018-present). He is Senior Vice President and Deputy General Counsel of FMR LLC (diversified financial services company, 2010-present), and is an employee of Fidelity Investments. Previously, Mr. Coffey served as Assistant Secretary of certain funds (2009-2018) and as Vice President and Associate General Counsel of FMR LLC (2005-2009).
Timothy M. Cohen (1969)
Year of Election or Appointment: 2018
Vice President
Mr. Cohen also serves as Vice President of other funds. Mr. Cohen serves as Co-Head of Global Equity Research (2016-present), a Director of Fidelity Management & Research (Japan) Limited (investment adviser firm, 2016-present), and is an employee of Fidelity Investments. Previously, Mr. Cohen served as Chief Investment Officer - Equity and a Director of Fidelity Management & Research (U.K.) Inc. (investment adviser firm, 2013-2015) and as a Director of Fidelity Management & Research (Hong Kong) Limited (investment adviser firm, 2017).
Jonathan Davis (1968)
Year of Election or Appointment: 2010
Assistant Treasurer
Mr. Davis also serves as Assistant Treasurer of other funds. Mr. Davis serves as Assistant Treasurer of FMR Capital, Inc. (2017-present) and is an employee of Fidelity Investments. Previously, Mr. Davis served as Vice President and Associate General Counsel of FMR LLC (diversified financial services company, 2003-2010).
Adrien E. Deberghes (1967)
Year of Election or Appointment: 2016
Assistant Treasurer
Mr. Deberghes also serves as an officer of other funds. He serves as Assistant Treasurer of FMR Capital, Inc. (2017-present), Executive Vice President of Fidelity Investments Money Management, Inc. (FIMM) (investment adviser firm, 2016-present), and is an employee of Fidelity Investments (2008-present). Previously, Mr. Deberghes served as President and Treasurer of certain Fidelity® funds (2013-2018). Prior to joining Fidelity Investments, Mr. Deberghes was Senior Vice President of Mutual Fund Administration at State Street Corporation (2007-2008), Senior Director of Mutual Fund Administration at Investors Bank & Trust (2005-2007), and Director of Finance for Dunkin' Brands (2000-2005). Previously, Mr. Deberghes served in other fund officer roles.
Laura M. Del Prato (1964)
Year of Election or Appointment: 2018
Assistant Treasurer
Ms. Del Prato also serves as an officer of other funds. Ms. Del Prato is an employee of Fidelity Investments (2017-present). Prior to joining Fidelity Investments, Ms. Del Prato served as a Managing Director and Treasurer of the JPMorgan Mutual Funds (2014-2017). Prior to JPMorgan, Ms. Del Prato served as a partner at Cohen Fund Audit Services (accounting firm, 2012-2013) and KPMG LLP (accounting firm, 2004-2012).
Colm A. Hogan (1973)
Year of Election or Appointment: 2016
Deputy Treasurer
Mr. Hogan also serves as an officer of other funds. Mr. Hogan serves as Assistant Treasurer of FMR Capital, Inc. (2017-present) and is an employee of Fidelity Investments (2005-present). Previously, Mr. Hogan served as Assistant Treasurer of certain Fidelity® funds (2016-2018).
Pamela R. Holding (1964)
Year of Election or Appointment: 2018
Vice President
Ms. Holding also serves as Vice President of other funds. Ms. Holding serves as Co-Head of Global Equity Research (2018-present) and is an employee of Fidelity Investments (2013-present).
Chris Maher (1972)
Year of Election or Appointment: 2013
Assistant Treasurer
Mr. Maher serves as Assistant Treasurer of other funds. Mr. Maher is Vice President of Valuation Oversight, serves as Assistant Treasurer of FMR Capital, Inc. (2017-present), and is an employee of Fidelity Investments. Previously, Mr. Maher served as Vice President of Asset Management Compliance (2013), Vice President of the Program Management Group of FMR (investment adviser firm, 2010-2013), and Vice President of Valuation Oversight (2008-2010).
Rieco E. Mello (1969)
Year of Election or Appointment: 2017
Assistant Treasurer
Mr. Mello also serves as Assistant Treasurer of other funds. Mr. Mello serves as Assistant Treasurer of FMR Capital, Inc. (2017-present) and is an employee of Fidelity Investments (1995-present).
Kenneth B. Robins (1969)
Year of Election or Appointment: 2016
Chief Compliance Officer
Mr. Robins also serves as an officer of other funds. Mr. Robins serves as Compliance Officer of Fidelity Management & Research Company and FMR Co., Inc. (investment adviser firms, 2016-present) and is an employee of Fidelity Investments (2004-present). Previously, Mr. Robins served as Executive Vice President of Fidelity Investments Money Management, Inc. (investment adviser firm, 2013-2016) and served in other fund officer roles.
Stacie M. Smith (1974)
Year of Election or Appointment: 2016
President and Treasurer
Ms. Smith also serves as an officer of other funds. Ms. Smith serves as Assistant Treasurer of FMR Capital, Inc. (2017-present), is an employee of Fidelity Investments (2009-present), and has served in other fund officer roles. Prior to joining Fidelity Investments, Ms. Smith served as Senior Audit Manager of Ernst & Young LLP (accounting firm, 1996-2009). Previously, Ms. Smith served as Assistant Treasurer (2013-2018) and Deputy Treasurer (2013-2016) of certain Fidelity® funds.
Marc L. Spector (1972)
Year of Election or Appointment: 2016
Assistant Treasurer
Mr. Spector also serves as an officer of other funds. Mr. Spector serves as Assistant Treasurer of FMR Capital, Inc. (2017-present) and is an employee of Fidelity Investments (2016-present). Prior to joining Fidelity Investments, Mr. Spector served as Director at the Siegfried Group (accounting firm, 2013-2016), and prior to Siegfried Group as audit senior manager at Deloitte & Touche (accounting firm, 2005-2013).
Shareholder Expense Example
As a shareholder of the Fund, you incur two types of costs: (1) transaction costs and (2) ongoing costs, including management fees and other Fund expenses. This Example is intended to help you understand your ongoing costs (in dollars) of investing in the Fund and to compare these costs with the ongoing costs of investing in other mutual funds.
The Example is based on an investment of $1,000 invested at the beginning of the period and held for the entire period (May 1, 2018 to October 31, 2018).
Actual Expenses
The first line of the accompanying table for each class of the Fund provides information about actual account values and actual expenses. You may use the information in this line, together with the amount you invested, to estimate the expenses that you paid over the period. Simply divide your account value by $1,000.00 (for example, an $8,600 account value divided by $1,000.00 = 8.6), then multiply the result by the number in the first line for a class of the Fund under the heading entitled "Expenses Paid During Period" to estimate the expenses you paid on your account during this period. A small balance maintenance fee of $12.00 that is charged once a year may apply for certain accounts with a value of less than $2,000. This fee, which was eliminated effective August 1, 2018, is not included in the table below. If it was, the estimate of expenses you paid during the period would be higher, and your ending account value lower, by this amount. In addition, the Fund, as a shareholder in the underlying Fidelity Central Funds, will indirectly bear its pro-rata share of the fees and expenses incurred by the underlying Fidelity Central Funds. These fees and expenses are not included in the Fund's annualized expense ratio used to calculate the expense estimate in the table below.
Hypothetical Example for Comparison Purposes
The second line of the accompanying table for each class of the Fund provides information about hypothetical account values and hypothetical expenses based on a Class' actual expense ratio and an assumed rate of return of 5% per year before expenses, which is not the Class' actual return. The hypothetical account values and expenses may not be used to estimate the actual ending account balance or expenses you paid for the period. You may use this information to compare the ongoing costs of investing in the Fund and other funds. To do so, compare this 5% hypothetical example with the 5% hypothetical examples that appear in the shareholder reports of the other funds. A small balance maintenance fee of $12.00 that is charged once a year may apply for certain accounts with a value of less than $2,000. This fee, which was eliminated effective August 1, 2018, is not included in the table below. If it was, the estimate of expenses you paid during the period would be higher, and your ending account value lower, by this amount. In addition, the Fund, as a shareholder in the underlying Fidelity Central Funds, will indirectly bear its pro-rata share of the fees and expenses incurred by the underlying Fidelity Central Funds. These fees and expenses are not included in the Fund's annualized expense ratio used to calculate the expense estimate in the table below.
Please note that the expenses shown in the table are meant to highlight your ongoing costs only and do not reflect any transaction costs. Therefore, the second line of the table is useful in comparing ongoing costs only, and will not help you determine the relative total costs of owning different funds.
| | Annualized Expense Ratio-A | Beginning
Account Value
May 1, 2018 | Ending
Account Value
October 31, 2018 | Expenses Paid
During Period-B
May 1, 2018
to October 31, 2018 |
| Diversified International | .77% | | | |
| Actual | | $1,000.00 | $901.30 | $3.69 |
| Hypothetical-C | | $1,000.00 | $1,021.32 | $3.92 |
| Class K | .64% | | | |
| Actual | | $1,000.00 | $901.90 | $3.07 |
| Hypothetical-C | | $1,000.00 | $1,021.98 | $3.26 |
A Annualized expense ratio reflects expenses net of applicable fee waivers.
B Expenses are equal to each Class' annualized expense ratio, multiplied by the average account value over the period, multiplied by 184/365 (to reflect the one-half year period).
C 5% return per year before expenses
Distributions (Unaudited)
The Board of Trustees of each fund voted to pay to shareholders of record at the opening of business on record date, the following distributions per share derived from capital gains realized from sales of portfolio securities and dividends derived from net investment income:
| | Pay Date | Record Date | Dividends | Capital Gains |
| Fidelity Diversified International Fund | | | | |
| Diversified International | 12/10/18 | 12/07/18 | $0.428 | $1.890 |
| Class K | 12/10/18 | 12/07/18 | $0.473 | $1.890 |
|
The fund hereby designates as a capital gain dividend with respect to the taxable year ended October 31, 2018, $870,816,242, or, if subsequently determined to be different, the net capital gain of such year.
Diversified International designates 9%; Class K designates 8%; of the dividend distributed during the fiscal year as qualifying for the dividends–received deduction for corporate shareholders.
Diversified International and Class K designate 100% of the dividend distributed during the fiscal year as amounts which may be taken into account as a dividend for purposes of the maximum rate under section 1(h)(11) of the Internal Revenue Code.
The amounts per share which represent income derived from sources within, and taxes paid to, foreign countries or possessions of the United States are as follows:
| | Pay Date | Income | Taxes |
| Fidelity Diversified International Fund | | | |
| Diversified International | 12/11/17 | $0.5088 | $0.0498 |
| Class K | 12/11/17 | $0.5558 | $0.0498 |
|
The fund will notify shareholders in January 2019 of amounts for use in preparing 2018 income tax returns.
Board Approval of Investment Advisory Contracts
Fidelity Diversified International Fund
At its July 2018 meeting, the Board of Trustees, including the Independent Trustees (together, the Board), voted to continue the management contract with Fidelity Management & Research Company (FMR) and the sub-advisory agreements (together, the Advisory Contracts) for the fund for six months through January 31, 2019, in connection with the reunification of the Fidelity Equity High Income Funds Board, which oversees the fund, and the Sector Portfolios Board.
The Board considered that the approval of the fund's Advisory Contracts will not result in any changes in (i) the investment process or strategies employed in the management of the fund's assets; (ii) the fees and expenses paid by shareholders; (iii) the nature, extent or quality of services provided under the fund's Advisory Contracts; or (iv) the day-to-day management of the fund or the persons primarily responsible for such management. The Board concluded that the fund's Advisory Contracts are fair and reasonable, and that the fund's Advisory Contracts should be renewed, without modification, through January 31, 2019, with the understanding that the Board will consider the annual renewal for a full one year period in January 2019.
In connection with its consideration of future renewals of the fund's Advisory Contracts, the Board will consider: (i) the nature, extent and quality of services provided to the fund, including shareholder and administrative services and investment performance; (ii) the competitiveness of the management fee and total expenses for the fund; (iii) the costs of the services and profitability, including the revenues earned and the expenses incurred in conducting the business of developing, marketing, distributing, managing, administering, and servicing the fund and its shareholders, to the extent applicable, as well as potential fall-out benefits from Fidelity's non-fund businesses; and (iv) whether there have been economies of scale in respect of the Fidelity funds, whether the Fidelity funds (including the fund) have appropriately benefited from any such economies of scale, and whether there is the potential for realization of any further economies.
Based on its evaluation of all of the conclusions noted above, and after considering all factors it believed relevant, the Board ultimately concluded that the fund's management fee structure is fair and reasonable, and that the continuation of the fund's Advisory Contracts should be approved.

Corporate Headquarters
245 Summer St.
Boston, MA 02210
www.fidelity.com
DIF-K-ANN-1218
1.863005.110
Fidelity® Overseas Fund Class K
Annual Report October 31, 2018 |
|
Contents
To view a fund's proxy voting guidelines and proxy voting record for the 12-month period ended June 30, visit http://www.fidelity.com/proxyvotingresults or visit the Securities and Exchange Commission's (SEC) web site at http://www.sec.gov.
You may also call 1-800-835-5092 to request a free copy of the proxy voting guidelines.
Standard & Poor's, S&P and S&P 500 are registered service marks of The McGraw-Hill Companies, Inc. and have been licensed for use by Fidelity Distributors Corporation.
Other third-party marks appearing herein are the property of their respective owners.
All other marks appearing herein are registered or unregistered trademarks or service marks of FMR LLC or an affiliated company. © 2018 FMR LLC. All rights reserved.
This report and the financial statements contained herein are submitted for the general information of the shareholders of the Fund. This report is not authorized for distribution to prospective investors in the Fund unless preceded or accompanied by an effective prospectus.
A fund files its complete schedule of portfolio holdings with the SEC for the first and third quarters of each fiscal year on Form N-Q. Forms N-Q are available on the SEC’s web site at http://www.sec.gov. A fund's Forms N-Q may be reviewed and copied at the SEC’s Public Reference Room in Washington, DC. Information regarding the operation of the SEC's Public Reference Room may be obtained by calling 1-800-SEC-0330.
For a complete list of a fund's portfolio holdings, view the most recent holdings listing, semiannual report, or annual report on Fidelity's web site at http://www.fidelity.com, http://www.institutional.fidelity.com, or http://www.401k.com, as applicable.
NOT FDIC INSURED •MAY LOSE VALUE •NO BANK GUARANTEE
Neither the Fund nor Fidelity Distributors Corporation is a bank.
Performance: The Bottom Line
Average annual total return reflects the change in the value of an investment, assuming reinvestment of distributions from dividend income and capital gains (the profits earned upon the sale of securities that have grown in value, if any) and assuming a constant rate of performance each year. The hypothetical investment and the average annual total returns do not reflect the deduction of taxes that a shareholder would pay on fund distributions or the redemption of fund shares. During periods of reimbursement by Fidelity, a fund’s total return will be greater than it would be had the reimbursement not occurred. How a fund did yesterday is no guarantee of how it will do tomorrow.
Average Annual Total Returns
| For the periods ended October 31, 2018 | Past 1 year | Past 5 years | Past 10 years |
| Class K | (7.13)% | 4.97% | 8.18% |
The initial offering of Class K shares took place on May 9, 2008. Returns prior to May 9, 2008 are those of Fidelity® Overseas Fund, the original class of the fund.
$10,000 Over 10 Years
Let's say hypothetically that $10,000 was invested in Fidelity® Overseas Fund - Class K on October 31, 2008.
The chart shows how the value of your investment would have changed, and also shows how the MSCI EAFE Index performed over the same period.
See above for additional information regarding the performance of Class K.
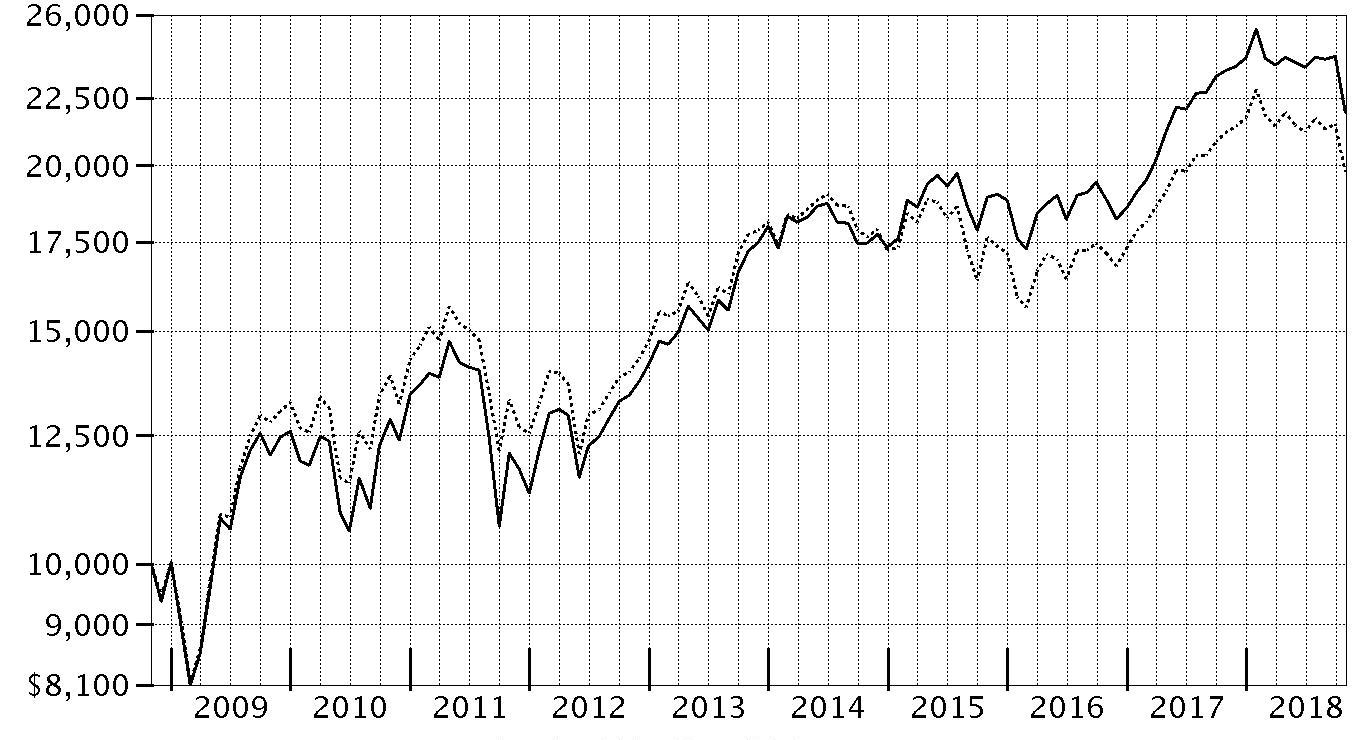
| Period Ending Values |
| $21,951 | Fidelity® Overseas Fund - Class K |
| $19,780 | MSCI EAFE Index |
Management's Discussion of Fund Performance
Market Recap: International equities returned -8.08% for the 12 months ending October 31, 2018, according to the MSCI ACWI (All Country World Index) ex USA Index. A modestly positive first half of the period gave way to a confluence of overwhelmingly negative factors – including escalating trade tensions, a surging U.S. dollar, tepid economic growth in Europe, global central bank tightening, concerns about Italy’s budget stalemate with the EU, and weakness in China’s stock market – that yielded a -11% second-half return. The index lost 8% in October alone, its largest monthly drop in more than six years. Among sectors, new-media-infused communications services (-15%) was hit the hardest, while economically sensitive consumer discretionary (-13%), information technology (-12%), financials (-10%), industrials (-9%) and materials (-7%) stocks also fared poorly. Even the more defensive real estate (-9%), utilities (-6%) and consumer staples (-5%) sectors weren’t spared this period. Conversely, elevated crude-oil prices fueled a positive return for energy (+7%), the top-performing sector, followed by the relatively stable-growing health care segment (+2%). Regionally, emerging markets (-12%) fared the worst, hampered by the impact of foreign exchange and concerns about economic weakness in China, India and South Korea. Sluggish growth also pressured shares in continental Europe (-9%). Stocks in Japan (-3%) and the U.K. (-4%) held up better, followed by Canada (-5%) and Asia-Pacific ex Japan (-6%).
Comments from Portfolio Manager Vincent Montemaggiore: For the fiscal year, the fund’s share classes returned roughly -7%, trailing the -6.65% return of the benchmark MSCI EAFE Index. Versus the benchmark, security selection within consumer staples was the biggest detractor, though picks in health care and a sizable underweighting in the strong-performing energy sector, also weighed on relative results. Geographically, our investment choices in the U.K. notably detracted. Among stocks, our sizable overweighting in enterprise software provider Micro Focus International was the largest relative detractor. A recent acquisition proved challenging, with revenue declining faster than anticipated amid heavy sales-force attrition. The fund’s out-of-benchmark stake in Conviviality, another U.K.-based holding and distributor of alcoholic beverages, also hurt, as did overweighting Germany-based drugmaker and chemical company Bayer. Conversely, stock selection in communication services, information technology, materials and industrials all bolstered relative performance. By region, non-benchmark exposure to the United States and stock selection in continental Europe added value. The top individual relative contributor was an out-of-benchmark position in Japan-based Nakanishi, a manufacturer of dental equipment. Non-benchmark exposure to LivaNova, a London-based maker of medical devices, as well as an overweighting in Edenred, a France-based company providing payment solutions, also aided results.
The views expressed above reflect those of the portfolio manager(s) only through the end of the period as stated on the cover of this report and do not necessarily represent the views of Fidelity or any other person in the Fidelity organization. Any such views are subject to change at any time based upon market or other conditions and Fidelity disclaims any responsibility to update such views. These views may not be relied on as investment advice and, because investment decisions for a Fidelity fund are based on numerous factors, may not be relied on as an indication of trading intent on behalf of any Fidelity fund.
Investment Summary (Unaudited)
Geographic Diversification (% of fund's net assets)
| As of October 31, 2018 |
| | United Kingdom | 21.7% |
| | Japan | 17.5% |
| | France | 9.7% |
| | Germany | 8.4% |
| | United States of America* | 8.3% |
| | Switzerland | 6.4% |
| | Netherlands | 3.3% |
| | Spain | 3.2% |
| | Ireland | 3.0% |
| | Other | 18.5% |

* Includes Short-Term investments and Net Other Assets (Liabilities).
Percentages are based on country or territory of incorporation and are adjusted for the effect of futures contracts, if applicable.
Asset Allocation as of October 31, 2018
| | % of fund's net assets |
| Stocks | 97.1 |
| Short-Term Investments and Net Other Assets (Liabilities) | 2.9 |
Top Ten Stocks as of October 31, 2018
| | % of fund's net assets |
| Roche Holding AG (participation certificate) (Switzerland, Pharmaceuticals) | 2.0 |
| SAP SE (Germany, Software) | 1.6 |
| Total SA (France, Oil, Gas & Consumable Fuels) | 1.6 |
| Hoya Corp. (Japan, Health Care Equipment & Supplies) | 1.3 |
| Diageo PLC (United Kingdom, Beverages) | 1.3 |
| AIA Group Ltd. (Hong Kong, Insurance) | 1.3 |
| Reckitt Benckiser Group PLC (United Kingdom, Household Products) | 1.3 |
| Sanofi SA (France, Pharmaceuticals) | 1.3 |
| LVMH Moet Hennessy - Louis Vuitton SA (France, Textiles, Apparel & Luxury Goods) | 1.3 |
| Equinor ASA (Norway, Oil, Gas & Consumable Fuels) | 1.2 |
| | 14.2 |
Top Market Sectors as of October 31, 2018
| | % of fund's net assets |
| Financials | 22.7 |
| Industrials | 16.5 |
| Health Care | 14.9 |
| Information Technology | 11.0 |
| Consumer Staples | 10.5 |
| Consumer Discretionary | 7.4 |
| Materials | 6.8 |
| Communication Services | 4.1 |
| Energy | 3.2 |
Schedule of Investments October 31, 2018
Showing Percentage of Net Assets
| Common Stocks - 96.2% | | | |
| | | Shares | Value |
| Australia - 0.8% | | | |
| Adelaide Brighton Ltd. | | 6,442,640 | $25,868,556 |
| Aub Group Ltd. | | 2,726,553 | 26,007,991 |
|
| TOTAL AUSTRALIA | | | 51,876,547 |
|
| Austria - 0.6% | | | |
| Erste Group Bank AG | | 978,300 | 39,890,574 |
| Bailiwick of Jersey - 1.0% | | | |
| Ferguson PLC | | 615,161 | 41,540,165 |
| Sanne Group PLC | | 3,785,354 | 27,095,261 |
|
| TOTAL BAILIWICK OF JERSEY | | | 68,635,426 |
|
| Belgium - 1.1% | | | |
| KBC Groep NV | | 1,077,554 | 74,327,935 |
| Bermuda - 2.1% | | | |
| Credicorp Ltd. (United States) | | 177,600 | 40,086,096 |
| Hiscox Ltd. | | 2,503,600 | 52,097,653 |
| IHS Markit Ltd. (a) | | 938,300 | 49,288,899 |
|
| TOTAL BERMUDA | | | 141,472,648 |
|
| Canada - 0.7% | | | |
| Constellation Software, Inc. | | 72,000 | 49,551,992 |
| Cayman Islands - 0.2% | | | |
| ZTO Express (Cayman), Inc. sponsored ADR | | 752,521 | 12,205,891 |
| Denmark - 1.4% | | | |
| DSV de Sammensluttede Vognmaend A/S | | 665,200 | 53,483,417 |
| Netcompany Group A/S | | 637,687 | 21,090,363 |
| NNIT A/S (b) | | 688,597 | 19,444,510 |
|
| TOTAL DENMARK | | | 94,018,290 |
|
| France - 9.7% | | | |
| ALTEN (c) | | 386,035 | 37,231,202 |
| Amundi SA (b) | | 572,606 | 34,101,400 |
| Capgemini SA | | 570,433 | 69,778,901 |
| Compagnie de St. Gobain | | 1,045,218 | 39,374,850 |
| Danone SA | | 998,900 | 70,735,495 |
| Edenred SA | | 1,696,600 | 64,433,058 |
| Elior SA | | 1,094,400 | 15,779,754 |
| Elis SA | | 6,716 | 135,631 |
| LVMH Moet Hennessy - Louis Vuitton SA | | 283,263 | 85,943,532 |
| Sanofi SA | | 981,181 | 87,678,895 |
| SR Teleperformance SA | | 311,100 | 51,304,696 |
| Total SA | | 1,822,360 | 106,927,746 |
|
| TOTAL FRANCE | | | 663,425,160 |
|
| Germany - 7.5% | | | |
| adidas AG | | 243,842 | 57,447,029 |
| Axel Springer Verlag AG | | 668,042 | 44,415,811 |
| Bayer AG | | 938,188 | 71,914,418 |
| Deutsche Post AG | | 1,889,247 | 59,653,485 |
| Fresenius Medical Care AG & Co. KGaA | | 513,236 | 40,297,498 |
| Fresenius SE & Co. KGaA | | 980,196 | 62,297,169 |
| Hannover Reuck SE | | 353,700 | 47,713,640 |
| SAP SE | | 999,345 | 107,003,360 |
| Scout24 AG (b) | | 482,800 | 20,047,280 |
|
| TOTAL GERMANY | | | 510,789,690 |
|
| Hong Kong - 1.3% | | | |
| AIA Group Ltd. | | 11,761,400 | 89,013,458 |
| India - 0.7% | | | |
| Axis Bank Ltd. (a) | | 3,318,035 | 26,127,955 |
| HDFC Bank Ltd. sponsored ADR | | 286,600 | 25,481,606 |
|
| TOTAL INDIA | | | 51,609,561 |
|
| Indonesia - 0.5% | | | |
| PT Bank Rakyat Indonesia Tbk | | 165,352,600 | 34,261,516 |
| Ireland - 3.0% | | | |
| CRH PLC | | 881,600 | 26,325,021 |
| DCC PLC (United Kingdom) | | 648,812 | 55,688,267 |
| Kerry Group PLC Class A | | 539,448 | 55,296,023 |
| Kingspan Group PLC (Ireland) | | 739,780 | 32,175,814 |
| United Drug PLC (United Kingdom) | | 4,165,303 | 33,648,251 |
|
| TOTAL IRELAND | | | 203,133,376 |
|
| Italy - 1.3% | | | |
| Banca Generali SpA | | 356,218 | 6,871,100 |
| FinecoBank SpA | | 1,981,500 | 20,751,223 |
| Prada SpA | | 7,066,000 | 24,959,124 |
| Recordati SpA | | 1,127,300 | 38,202,943 |
|
| TOTAL ITALY | | | 90,784,390 |
|
| Japan - 17.5% | | | |
| AEON Financial Service Co. Ltd. | | 1,642,500 | 32,257,544 |
| Daiichikosho Co. Ltd. | | 647,500 | 29,840,032 |
| Daikin Industries Ltd. | | 314,400 | 36,442,709 |
| Elecom Co. Ltd. | | 349,200 | 8,287,833 |
| Hoya Corp. | | 1,601,000 | 91,007,347 |
| Iriso Electronics Co. Ltd. | | 576,800 | 24,409,270 |
| Keyence Corp. | | 125,780 | 61,644,295 |
| KH Neochem Co. Ltd. | | 1,404,800 | 39,840,121 |
| Miroku Jyoho Service Co., Ltd. | | 1,016,800 | 19,194,257 |
| Misumi Group, Inc. | | 328,100 | 6,589,042 |
| Mitsubishi UFJ Financial Group, Inc. | | 12,071,400 | 73,062,062 |
| Morinaga & Co. Ltd. | | 492,700 | 19,802,318 |
| Nabtesco Corp. | | 771,100 | 17,002,675 |
| Nakanishi, Inc. | | 2,384,400 | 55,851,192 |
| Nissan Chemical Corp. | | 652,300 | 30,756,783 |
| Nitori Holdings Co. Ltd. | | 349,500 | 45,640,825 |
| NOF Corp. | | 940,200 | 26,705,730 |
| OBIC Co. Ltd. | | 547,000 | 49,835,246 |
| Olympus Corp. | | 1,330,900 | 44,361,290 |
| ORIX Corp. | | 5,117,400 | 83,494,779 |
| Otsuka Corp. | | 967,700 | 32,160,899 |
| PALTAC Corp. | | 489,100 | 24,967,572 |
| Recruit Holdings Co. Ltd. | | 2,291,600 | 61,505,609 |
| S Foods, Inc. | | 610,200 | 24,632,968 |
| SMC Corp. | | 141,400 | 45,301,635 |
| Sundrug Co. Ltd. | | 550,000 | 19,984,934 |
| Suzuki Motor Corp. | | 768,700 | 38,332,547 |
| Temp Holdings Co., Ltd. | | 1,682,900 | 32,036,772 |
| Tsuruha Holdings, Inc. | | 404,600 | 42,168,618 |
| USS Co. Ltd. | | 1,668,400 | 30,119,474 |
| Welcia Holdings Co. Ltd. | | 1,038,300 | 53,003,128 |
|
| TOTAL JAPAN | | | 1,200,239,506 |
|
| Kenya - 0.3% | | | |
| Safaricom Ltd. | | 97,623,300 | 22,230,575 |
| Korea (South) - 0.3% | | | |
| LG Chemical Ltd. | | 71,240 | 21,665,451 |
| Netherlands - 3.3% | | | |
| Adyen BV (b) | | 9,600 | 6,209,822 |
| Grandvision NV (b) | | 1,249,800 | 31,624,191 |
| Heineken NV (Bearer) | | 613,100 | 55,276,446 |
| IMCD Group BV | | 1,047,578 | 71,133,026 |
| Koninklijke Philips Electronics NV | | 1,692,645 | 63,128,647 |
|
| TOTAL NETHERLANDS | | | 227,372,132 |
|
| New Zealand - 0.8% | | | |
| EBOS Group Ltd. | | 2,276,701 | 30,961,180 |
| Trade Maine Group Ltd. | | 7,426,198 | 23,502,933 |
|
| TOTAL NEW ZEALAND | | | 54,464,113 |
|
| Norway - 1.9% | | | |
| Equinor ASA | | 3,211,459 | 83,545,631 |
| Schibsted ASA (A Shares) | | 1,379,800 | 47,811,286 |
|
| TOTAL NORWAY | | | 131,356,917 |
|
| Spain - 3.2% | | | |
| Amadeus IT Holding SA Class A | | 758,730 | 61,170,350 |
| CaixaBank SA (c) | | 14,075,816 | 56,960,761 |
| Grifols SA ADR | | 2,684,937 | 54,826,414 |
| Masmovil Ibercom SA (a) | | 114,890 | 14,912,916 |
| Prosegur Cash SA (b) | | 15,610,356 | 30,941,872 |
|
| TOTAL SPAIN | | | 218,812,313 |
|
| Sweden - 2.9% | | | |
| Addlife AB | | 839,841 | 19,272,617 |
| Alfa Laval AB | | 986,050 | 25,181,522 |
| HEXPOL AB (B Shares) | | 4,020,852 | 37,215,668 |
| Indutrade AB | | 1,920,923 | 46,096,358 |
| Swedbank AB (A Shares) | | 3,042,523 | 68,522,971 |
|
| TOTAL SWEDEN | | | 196,289,136 |
|
| Switzerland - 6.4% | | | |
| Credit Suisse Group AG | | 3,994,641 | 52,224,607 |
| Julius Baer Group Ltd. | | 843,159 | 38,452,084 |
| Kaba Holding AG (B Shares) (Reg.) (c) | | 50,195 | 36,232,701 |
| Lonza Group AG | | 206,492 | 64,931,754 |
| Roche Holding AG (participation certificate) | | 569,128 | 138,504,359 |
| Sika AG | | 391,927 | 50,277,484 |
| UBS Group AG | | 4,398,787 | 61,538,906 |
|
| TOTAL SWITZERLAND | | | 442,161,895 |
|
| Taiwan - 0.6% | | | �� |
| Taiwan Semiconductor Manufacturing Co. Ltd. | | 5,162,000 | 38,731,202 |
| United Kingdom - 21.7% | | | |
| Admiral Group PLC | | 1,870,200 | 48,120,556 |
| Ascential PLC | | 8,887,887 | 42,806,353 |
| Beazley PLC | | 5,153,400 | 34,746,825 |
| British American Tobacco PLC (United Kingdom) | | 1,832,460 | 79,437,633 |
| Cineworld Group PLC | | 14,248,039 | 53,652,091 |
| Compass Group PLC | | 3,239,794 | 63,773,012 |
| Conviviality PLC (d) | | 5,450,078 | 70 |
| Cranswick PLC | | 801,170 | 29,595,204 |
| Dechra Pharmaceuticals PLC | | 785,595 | 22,954,813 |
| Diageo PLC | | 2,579,000 | 89,159,932 |
| Diploma PLC | | 2,211,136 | 37,165,504 |
| Halma PLC | | 2,384,970 | 40,483,664 |
| Hastings Group Holdings PLC (b) | | 8,060,163 | 19,069,928 |
| Hilton Food Group PLC | | 2,135,189 | 25,163,211 |
| InterContinental Hotel Group PLC | | 943,400 | 49,560,594 |
| Intertek Group PLC | | 720,045 | 43,146,548 |
| James Fisher and Sons PLC | | 1,005,258 | 21,766,558 |
| John Wood Group PLC | | 2,834,592 | 25,876,719 |
| JTC PLC | | 2,888,200 | 12,367,186 |
| LivaNova PLC (a) | | 296,629 | 33,219,482 |
| London Stock Exchange Group PLC | | 1,233,130 | 68,012,459 |
| Melrose Industries PLC | | 3,500,863 | 7,546,755 |
| Micro Focus International PLC | | 1,627,923 | 25,236,415 |
| Mondi PLC | | 1,568,100 | 36,970,151 |
| Prudential PLC | | 3,890,071 | 77,893,321 |
| Reckitt Benckiser Group PLC | | 1,096,424 | 88,661,356 |
| Rentokil Initial PLC | | 9,621,600 | 38,887,317 |
| Rio Tinto PLC | | 1,178,154 | 57,200,287 |
| Rolls-Royce Holdings PLC | | 3,236,492 | 34,708,763 |
| Rotork PLC | | 8,734,106 | 33,469,475 |
| Schroders PLC | | 385,533 | 13,206,726 |
| Spectris PLC | | 1,434,344 | 39,307,635 |
| St. James's Place Capital PLC | | 3,946,863 | 51,129,862 |
| Standard Life PLC | | 8,566,461 | 29,618,804 |
| The Weir Group PLC | | 1,958,200 | 39,697,124 |
| Ultra Electronics Holdings PLC | | 1,340,794 | 24,644,486 |
| Victrex PLC | | 907,931 | 30,776,922 |
| Volution Group PLC | | 9,088,967 | 20,098,305 |
|
| TOTAL UNITED KINGDOM | | | 1,489,132,046 |
|
| United States of America - 5.4% | | | |
| Alphabet, Inc. Class C (a) | | 30,393 | 32,726,271 |
| Boston Scientific Corp. (a) | | 1,413,700 | 51,091,118 |
| International Flavors & Fragrances, Inc. | | 231,195 | 33,444,669 |
| International Flavors & Fragrances, Inc. (Israel) | | 95,117 | 13,733,710 |
| Marsh & McLennan Companies, Inc. | | 588,900 | 49,909,275 |
| Moody's Corp. | | 292,300 | 42,523,804 |
| S&P Global, Inc. | | 348,441 | 63,527,763 |
| Sherwin-Williams Co. | | 111,300 | 43,793,211 |
| Worldpay, Inc. (a) | | 456,600 | 41,934,144 |
|
| TOTAL UNITED STATES OF AMERICA | | | 372,683,965 |
|
| TOTAL COMMON STOCKS | | | |
| (Cost $5,843,867,778) | | | 6,590,135,705 |
|
| Nonconvertible Preferred Stocks - 0.9% | | | |
| Germany - 0.9% | | | |
| Henkel AG & Co. KGaA | | 554,944 | 60,706,066 |
| United Kingdom - 0.0% | | | |
| Rolls-Royce Holdings PLC Series C (a) | | 143,694,432 | 183,670 |
| TOTAL NONCONVERTIBLE PREFERRED STOCKS | | | |
| (Cost $56,093,831) | | | 60,889,736 |
|
| Money Market Funds - 4.7% | | | |
| Fidelity Cash Central Fund, 2.23% (e) | | 254,742,826 | 254,793,774 |
| Fidelity Securities Lending Cash Central Fund 2.23% (e)(f) | | 71,450,945 | 71,458,090 |
| TOTAL MONEY MARKET FUNDS | | | |
| (Cost $326,251,864) | | | 326,251,864 |
| TOTAL INVESTMENT IN SECURITIES - 101.8% | | | |
| (Cost $6,226,213,473) | | | 6,977,277,305 |
| NET OTHER ASSETS (LIABILITIES) - (1.8)% | | | (125,429,622) |
| NET ASSETS - 100% | | | $6,851,847,683 |
Categorizations in the Schedule of Investments are based on country or territory of incorporation.
Legend
(a) Non-income producing
(b) Security exempt from registration under Rule 144A of the Securities Act of 1933. These securities may be resold in transactions exempt from registration, normally to qualified institutional buyers. At the end of the period, the value of these securities amounted to $161,439,003 or 2.4% of net assets.
(c) Security or a portion of the security is on loan at period end.
(d) Level 3 security
(e) Affiliated fund that is generally available only to investment companies and other accounts managed by Fidelity Investments. The rate quoted is the annualized seven-day yield of the fund at period end. A complete unaudited listing of the fund's holdings as of its most recent quarter end is available upon request. In addition, each Fidelity Central Fund's financial statements, which are not covered by the Fund's Report of Independent Registered Public Accounting Firm, are available on the SEC's website or upon request.
(f) Investment made with cash collateral received from securities on loan.
Affiliated Central Funds
Information regarding fiscal year to date income earned by the Fund from investments in Fidelity Central Funds is as follows:
| Fund | Income earned |
| Fidelity Cash Central Fund | $1,167,490 |
| Fidelity Securities Lending Cash Central Fund | 2,365,560 |
| Total | $3,533,050 |
Amounts in the income column in the above table include any capital gain distributions from underlying funds, which are presented in the corresponding line-item in the Statement of Operations if applicable.
Investment Valuation
The following is a summary of the inputs used, as of October 31, 2018, involving the Fund's assets and liabilities carried at fair value. The inputs or methodology used for valuing securities may not be an indication of the risk associated with investing in those securities. For more information on valuation inputs, and their aggregation into the levels used below, please refer to the Investment Valuation section in the accompanying Notes to Financial Statements.
| | Valuation Inputs at Reporting Date: |
| Description | Total | Level 1 | Level 2 | Level 3 |
| Investments in Securities: | | | | |
| Equities: | | | | |
| Communication Services | $288,395,335 | $288,395,335 | $-- | $-- |
| Consumer Discretionary | 503,856,478 | 379,580,399 | 124,276,079 | -- |
| Consumer Staples | 713,623,402 | 385,628,916 | 327,994,416 | 70 |
| Energy | 216,350,096 | 109,422,350 | 106,927,746 | -- |
| Financials | 1,551,409,503 | 1,252,816,668 | 298,592,835 | -- |
| Health Care | 1,023,593,897 | 515,411,621 | 508,182,276 | -- |
| Industrials | 1,125,914,836 | 894,229,420 | 231,685,416 | -- |
| Information Technology | 753,308,130 | 582,337,153 | 170,970,977 | -- |
| Materials | 474,573,764 | 360,291,673 | 114,282,091 | -- |
| Money Market Funds | 326,251,864 | 326,251,864 | -- | -- |
| Total Investments in Securities: | $6,977,277,305 | $5,094,365,399 | $1,882,911,836 | $70 |
The following is a summary of transfers between Level 1 and Level 2 for the period ended October 31, 2018. Transfers are assumed to have occurred at the beginning of the period, and are primarily attributable to the valuation techniques used for foreign equity securities, as discussed in the accompanying Notes to Financial Statements:
| Transfers | Total |
| Level 1 to Level 2 | $345,754,342 |
| Level 2 to Level 1 | $916,928,196 |
See accompanying notes which are an integral part of the financial statements.
Financial Statements
Statement of Assets and Liabilities
| | | October 31, 2018 |
| Assets | | |
Investment in securities, at value (including securities loaned of $68,281,363) — See accompanying schedule:
Unaffiliated issuers (cost $5,899,961,609) | $6,651,025,441 | |
| Fidelity Central Funds (cost $326,251,864) | 326,251,864 | |
| Total Investment in Securities (cost $6,226,213,473) | | $6,977,277,305 |
| Receivable for investments sold | | 40,995,005 |
| Receivable for fund shares sold | | 86,401,010 |
| Dividends receivable | | 26,172,107 |
| Distributions receivable from Fidelity Central Funds | | 246,205 |
| Prepaid expenses | | 14,121 |
| Other receivables | | 600,350 |
| Total assets | | 7,131,706,103 |
| Liabilities | | |
| Payable to custodian bank | $61,386 | |
| Payable for investments purchased | 194,766,847 | |
| Payable for fund shares redeemed | 7,581,053 | |
| Accrued management fee | 4,159,311 | |
| Other affiliated payables | 1,005,784 | |
| Other payables and accrued expenses | 817,484 | |
| Collateral on securities loaned | 71,466,555 | |
| Total liabilities | | 279,858,420 |
| Net Assets | | $6,851,847,683 |
| Net Assets consist of: | | |
| Paid in capital | | $5,758,733,606 |
| Total distributable earnings (loss) | | 1,093,114,077 |
| Net Assets | | $6,851,847,683 |
| Net Asset Value and Maximum Offering Price | | |
| Overseas: | | |
| Net Asset Value, offering price and redemption price per share ($5,825,756,648 ÷ 126,526,889 shares) | | $46.04 |
| Class K: | | |
| Net Asset Value, offering price and redemption price per share ($1,026,091,035 ÷ 22,317,544 shares) | | $45.98 |
See accompanying notes which are an integral part of the financial statements.
Statement of Operations
| | | Year ended October 31, 2018 |
| Investment Income | | |
| Dividends | | $188,805,729 |
| Income from Fidelity Central Funds | | 3,533,050 |
| Income before foreign taxes withheld | | 192,338,779 |
| Less foreign taxes withheld | | (16,171,173) |
| Total income | | 176,167,606 |
| Expenses | | |
| Management fee | | |
| Basic fee | $50,790,352 | |
| Performance adjustment | 8,379,007 | |
| Transfer agent fees | 10,749,183 | |
| Accounting and security lending fees | 1,689,727 | |
| Custodian fees and expenses | 898,145 | |
| Independent trustees' fees and expenses | 38,286 | |
| Registration fees | 136,895 | |
| Audit | 86,557 | |
| Legal | 21,245 | |
| Interest | 23,248 | |
| Miscellaneous | 52,008 | |
| Total expenses before reductions | 72,864,653 | |
| Expense reductions | (833,020) | |
| Total expenses after reductions | | 72,031,633 |
| Net investment income (loss) | | 104,135,973 |
| Realized and Unrealized Gain (Loss) | | |
| Net realized gain (loss) on: | | |
| Investment securities: | | |
| Unaffiliated issuers | 255,186,200 | |
| Fidelity Central Funds | (17,834) | |
| Foreign currency transactions | (1,863,296) | |
| Total net realized gain (loss) | | 253,305,070 |
| Change in net unrealized appreciation (depreciation) on: | | |
| Investment securities: | | |
| Unaffiliated issuers | (873,587,045) | |
| Fidelity Central Funds | 11,865 | |
| Assets and liabilities in foreign currencies | (290,293) | |
| Total change in net unrealized appreciation (depreciation) | | (873,865,473) |
| Net gain (loss) | | (620,560,403) |
| Net increase (decrease) in net assets resulting from operations | | $(516,424,430) |
See accompanying notes which are an integral part of the financial statements.
Statement of Changes in Net Assets
| | Year ended October 31, 2018 | Year ended October 31, 2017 |
| Increase (Decrease) in Net Assets | | |
| Operations | | |
| Net investment income (loss) | $104,135,973 | $85,275,934 |
| Net realized gain (loss) | 253,305,070 | 136,914,624 |
| Change in net unrealized appreciation (depreciation) | (873,865,473) | 1,248,492,417 |
| Net increase (decrease) in net assets resulting from operations | (516,424,430) | 1,470,682,975 |
| Distributions to shareholders | (89,089,141) | – |
| Distributions to shareholders from net investment income | – | (95,770,528) |
| Distributions to shareholders from net realized gain | – | (6,822,064) |
| Total distributions | (89,089,141) | (102,592,592) |
| Share transactions - net increase (decrease) | (528,598,495) | 1,304,095,173 |
| Redemption fees | – | 11,066 |
| Total increase (decrease) in net assets | (1,134,112,066) | 2,672,196,622 |
| Net Assets | | |
| Beginning of period | 7,985,959,749 | 5,313,763,127 |
| End of period | $6,851,847,683 | $7,985,959,749 |
| Other Information | | |
| Undistributed net investment income end of period | | $82,288,871 |
See accompanying notes which are an integral part of the financial statements.
Financial Highlights
Fidelity Overseas Fund
| Years ended October 31, | 2018 | 2017 | 2016 | 2015 | 2014 |
| Selected Per–Share Data | | | | | |
| Net asset value, beginning of period | $50.18 | $40.73 | $41.56 | $39.02 | $39.22 |
| Income from Investment Operations | | | | | |
| Net investment income (loss)A | .68 | .58 | .75B | .52 | .77C |
| Net realized and unrealized gain (loss) | (4.27) | 9.65 | (1.15) | 2.69 | (.28) |
| Total from investment operations | (3.59) | 10.23 | (.40) | 3.21 | .49 |
| Distributions from net investment income | (.52) | (.72) | (.43) | (.67) | (.51) |
| Distributions from net realized gain | (.03) | (.05) | (.01) | – | (.18) |
| Total distributions | (.55) | (.78)D | (.43)E | (.67) | (.69) |
| Redemption fees added to paid in capitalA | – | –F | –F | –F | –F |
| Net asset value, end of period | $46.04 | $50.18 | $40.73 | $41.56 | $39.02 |
| Total ReturnG | (7.23)% | 25.63% | (.97)% | 8.34% | 1.27% |
| Ratios to Average Net AssetsH,I | | | | | |
| Expenses before reductions | .97% | 1.00% | 1.03% | 1.04% | 1.04% |
| Expenses net of fee waivers, if any | .97% | 1.00% | 1.03% | 1.04% | 1.04% |
| Expenses net of all reductions | .96% | 1.00% | 1.03% | 1.03% | 1.04% |
| Net investment income (loss) | 1.35% | 1.30% | 1.88%H | 1.28% | 1.93%J |
| Supplemental Data | | | | | |
| Net assets, end of period (000 omitted) | $5,825,757 | $6,828,078 | $4,569,084 | $3,844,290 | $2,738,667 |
| Portfolio turnover rateJ | 33% | 26%K | 33% | 28% | 41% |
A Calculated based on average shares outstanding during the period.
B Net investment income per share reflects a large, non-recurring dividend which amounted to $.18 per share. Excluding this non-recurring dividend, the ratio of net investment income (loss) to average net assets would have been 1.42%.
C Net investment income per share reflects a large, non-recurring dividend which amounted to $.24 per share. Excluding this non-recurring dividend, the ratio of net investment income (loss) to average net assets would have been 1.34%.
D Total distributions of $.78 per share is comprised of distributions from net investment income of $.723 and distributions from net realized gain of $.052 per share.
E Total distributions of $.43 per share is comprised of distributions from net investment income of $.428 and distributions from net realized gain of $.006 per share.
F Amount represents less than $.005 per share.
G Total returns would have been lower if certain expenses had not been reduced during the applicable periods shown.
H Fees and expenses of any underlying Fidelity Central Funds are not included in the Fund's expense ratio. The Fund indirectly bears its proportionate share of the expenses of any underlying Fidelity Central Funds.
I Expense ratios reflect operating expenses of the class. Expenses before reductions do not reflect amounts reimbursed by the investment adviser or reductions from brokerage service arrangements or reductions from other expense offset arrangements and do not represent the amount paid by the class during periods when reimbursements or reductions occur. Expenses net of fee waivers reflect expenses after reimbursement by the investment adviser but prior to reductions from brokerage service arrangements or other expense offset arrangements. Expenses net of all reductions represent the net expenses paid by the class.
J Amount does not include the portfolio activity of any underlying Fidelity Central Funds.
K Portfolio turnover rate excludes securities received or delivered in-kind.
See accompanying notes which are an integral part of the financial statements.
Fidelity Overseas Fund Class K
| Years ended October 31, | 2018 | 2017 | 2016 | 2015 | 2014 |
| Selected Per–Share Data | | | | | |
| Net asset value, beginning of period | $50.11 | $40.67 | $41.49 | $38.96 | $39.17 |
| Income from Investment Operations | | | | | |
| Net investment income (loss)A | .73 | .64 | .80B | .57 | .82C |
| Net realized and unrealized gain (loss) | (4.26) | 9.62 | (1.14) | 2.68 | (.28) |
| Total from investment operations | (3.53) | 10.26 | (.34) | 3.25 | .54 |
| Distributions from net investment income | (.57) | (.77) | (.47) | (.72) | (.58) |
| Distributions from net realized gain | (.03) | (.05) | (.01) | – | (.18) |
| Total distributions | (.60) | (.82) | (.48) | (.72) | (.75)D |
| Redemption fees added to paid in capitalA | – | –E | –E | –E | –E |
| Net asset value, end of period | $45.98 | $50.11 | $40.67 | $41.49 | $38.96 |
| Total ReturnF | (7.13)% | 25.80% | (.85)% | 8.47% | 1.41% |
| Ratios to Average Net AssetsG,H | | | | | |
| Expenses before reductions | .86% | .89% | .91% | .91% | .90% |
| Expenses net of fee waivers, if any | .86% | .89% | .91% | .91% | .90% |
| Expenses net of all reductions | .85% | .88% | .90% | .90% | .90% |
| Net investment income (loss) | 1.46% | 1.42% | 2.00%G | 1.40% | 2.06%I |
| Supplemental Data | | | | | |
| Net assets, end of period (000 omitted) | $1,026,091 | $1,157,882 | $744,679 | $691,585 | $626,817 |
| Portfolio turnover rateI | 33% | 26%J | 33% | 28% | 41% |
A Calculated based on average shares outstanding during the period.
B Net investment income per share reflects a large, non-recurring dividend which amounted to $.18 per share. Excluding this non-recurring dividend, the ratio of net investment income (loss) to average net assets would have been 1.55%.
C Net investment income per share reflects a large, non-recurring dividend which amounted to $.24 per share. Excluding this non-recurring dividend, the ratio of net investment income (loss) to average net assets would have been 1.47%.
D Total distributions of $.75 per share is comprised of distributions from net investment income of $.575 and distributions from net realized gain of $.177 per share.
E Amount represents less than $.005 per share.
F Total returns would have been lower if certain expenses had not been reduced during the applicable periods shown.
G Fees and expenses of any underlying Fidelity Central Funds are not included in the Fund's expense ratio. The Fund indirectly bears its proportionate share of the expenses of any underlying Fidelity Central Funds.
H Expense ratios reflect operating expenses of the class. Expenses before reductions do not reflect amounts reimbursed by the investment adviser or reductions from brokerage service arrangements or reductions from other expense offset arrangements and do not represent the amount paid by the class during periods when reimbursements or reductions occur. Expenses net of fee waivers reflect expenses after reimbursement by the investment adviser but prior to reductions from brokerage service arrangements or other expense offset arrangements. Expenses net of all reductions represent the net expenses paid by the class.
I Amount does not include the portfolio activity of any underlying Fidelity Central Funds.
J Portfolio turnover rate excludes securities received or delivered in-kind.
See accompanying notes which are an integral part of the financial statements.
Notes to Financial Statements
For the period ended October 31, 2018
1. Organization.
Fidelity Overseas Fund (the Fund) is a fund of Fidelity Investment Trust (the Trust) and is authorized to issue an unlimited number of shares. The Trust is registered under the Investment Company Act of 1940, as amended (the 1940 Act), as an open-end management investment company organized as a Massachusetts business trust. The Fund offers Overseas and Class K shares, each of which has equal rights as to assets and voting privileges. Each class has exclusive voting rights with respect to matters that affect that class.
2. Investments in Fidelity Central Funds.
The Fund invests in Fidelity Central Funds, which are open-end investment companies generally available only to other investment companies and accounts managed by the investment adviser and its affiliates. The Fund's Schedule of Investments lists each of the Fidelity Central Funds held as of period end, if any, as an investment of the Fund, but does not include the underlying holdings of each Fidelity Central Fund. As an Investing Fund, the Fund indirectly bears its proportionate share of the expenses of the underlying Fidelity Central Funds.
The Money Market Central Funds seek preservation of capital and current income and are managed by Fidelity Investments Money Management, Inc. (FIMM), an affiliate of the investment adviser. Annualized expenses of the Money Market Central Funds as of their most recent shareholder report date are less than .005%.
A complete unaudited list of holdings for each Fidelity Central Fund is available upon request or at the Securities and Exchange Commission (the SEC) website at www.sec.gov. In addition, the financial statements of the Fidelity Central Funds, which are not covered by the Fund's Report of Independent Registered Public Accounting Firm, are available on the SEC website or upon request.
3. Significant Accounting Policies.
The Fund is an investment company and applies the accounting and reporting guidance of the Financial Accounting Standards Board (FASB) Accounting Standards Codification Topic 946 Financial Services – Investments Companies. The financial statements have been prepared in conformity with accounting principles generally accepted in the United States of America (GAAP), which require management to make certain estimates and assumptions at the date of the financial statements. Actual results could differ from those estimates. Subsequent events, if any, through the date that the financial statements were issued have been evaluated in the preparation of the financial statements. The following summarizes the significant accounting policies of the Fund:
Investment Valuation. Investments are valued as of 4:00 p.m. Eastern time on the last calendar day of the period. The Board of Trustees (the Board) has delegated the day to day responsibility for the valuation of the Fund's investments to the Fair Value Committee (the Committee) established by the Fund's investment adviser. In accordance with valuation policies and procedures approved by the Board, the Fund attempts to obtain prices from one or more third party pricing vendors or brokers to value its investments. When current market prices, quotations or currency exchange rates are not readily available or reliable, investments will be fair valued in good faith by the Committee, in accordance with procedures adopted by the Board. Factors used in determining fair value vary by investment type and may include market or investment specific events. The frequency with which these procedures are used cannot be predicted and they may be utilized to a significant extent. The Committee oversees the Fund's valuation policies and procedures and reports to the Board on the Committee's activities and fair value determinations. The Board monitors the appropriateness of the procedures used in valuing the Fund's investments and ratifies the fair value determinations of the Committee.
The Fund categorizes the inputs to valuation techniques used to value its investments into a disclosure hierarchy consisting of three levels as shown below:
- Level 1 – quoted prices in active markets for identical investments
- Level 2 – other significant observable inputs (including quoted prices for similar investments, interest rates, prepayment speeds, etc.)
- Level 3 – unobservable inputs (including the Fund's own assumptions based on the best information available)
Valuation techniques used to value the Fund's investments by major category are as follows:
Equity securities, including restricted securities, for which market quotations are readily available, are valued at the last reported sale price or official closing price as reported by a third party pricing vendor on the primary market or exchange on which they are traded and are categorized as Level 1 in the hierarchy. In the event there were no sales during the day or closing prices are not available, securities are valued at the last quoted bid price or may be valued using the last available price and are generally categorized as Level 2 in the hierarchy. For foreign equity securities, when market or security specific events arise, comparisons to the valuation of American Depositary Receipts (ADRs), futures contracts, Exchange-Traded Funds (ETFs) and certain indexes as well as quoted prices for similar securities may be used and would be categorized as Level 2 in the hierarchy. Utilizing these techniques may result in transfers between Level 1 and Level 2. For equity securities, including restricted securities, where observable inputs are limited, assumptions about market activity and risk are used and these securities may be categorized as Level 3 in the hierarchy.
Investments in open-end mutual funds, including the Fidelity Central Funds, are valued at their closing net asset value (NAV) each business day and are categorized as Level 1 in the hierarchy.
Changes in valuation techniques may result in transfers in or out of an assigned level within the disclosure hierarchy. The aggregate value of investments by input level as of October 31, 2018, including information on transfers between Levels 1 and 2 is included at the end of the Fund's Schedule of Investments.
Foreign Currency. The Fund may use foreign currency contracts to facilitate transactions in foreign-denominated securities. Gains and losses from these transactions may arise from changes in the value of the foreign currency or if the counterparties do not perform under the contracts' terms.
Foreign-denominated assets, including investment securities, and liabilities are translated into U.S. dollars at the exchange rates at period end. Purchases and sales of investment securities, income and dividends received and expenses denominated in foreign currencies are translated into U.S. dollars at the exchange rate in effect on the transaction date.
The effects of exchange rate fluctuations on investments are included with the net realized and unrealized gain (loss) on investment securities. Other foreign currency transactions resulting in realized and unrealized gain (loss) are disclosed separately.
Investment Transactions and Income. For financial reporting purposes, the Fund's investment holdings and NAV include trades executed through the end of the last business day of the period. The NAV per share for processing shareholder transactions is calculated as of the close of business of the New York Stock Exchange (NYSE), normally 4:00 p.m. Eastern time and includes trades executed through the end of the prior business day. Gains and losses on securities sold are determined on the basis of identified cost and include proceeds received from litigation. Dividend income is recorded on the ex-dividend date, except for certain dividends from foreign securities where the ex-dividend date may have passed, which are recorded as soon as the Fund is informed of the ex-dividend date. Non-cash dividends included in dividend income, if any, are recorded at the fair market value of the securities received. Income and capital gain distributions from Fidelity Central Funds, if any, are recorded on the ex-dividend date. Certain distributions received by the Fund represent a return of capital or capital gain. The Fund determines the components of these distributions subsequent to the ex-dividend date, based upon receipt of tax filings or other correspondence relating to the underlying investment. These distributions are recorded as a reduction of cost of investments and/or as a realized gain. Investment income is recorded net of foreign taxes withheld where recovery of such taxes is uncertain.
Class Allocations and Expenses. Investment income, realized and unrealized capital gains and losses, common expenses of the Fund, and certain fund-level expense reductions, if any, are allocated daily on a pro-rata basis to each class based on the relative net assets of each class to the total net assets of the Fund. Each class differs with respect to transfer agent fees incurred. Certain expense reductions may also differ by class. For the reporting period, the allocated portion of income and expenses to each class as a percent of its average net assets may vary due to the timing of recording these transactions in relation to fluctuating net assets of the classes. Expenses directly attributable to a fund are charged to that fund. Expenses attributable to more than one fund are allocated among the respective funds on the basis of relative net assets or other appropriate methods. Expense estimates are accrued in the period to which they relate and adjustments are made when actual amounts are known.
Deferred Trustee Compensation. Under a Deferred Compensation Plan (the Plan) for the Fund, certain independent Trustees have elected to defer receipt of a portion of their annual compensation. Deferred amounts are invested in a cross-section of Fidelity funds, are marked-to-market and remain in the Fund until distributed in accordance with the Plan. The investment of deferred amounts and the offsetting payable to the Trustees of $392,074 are included in the accompanying Statement of Assets and Liabilities in other receivables and other payables and accrued expenses, respectively.
Income Tax Information and Distributions to Shareholders. Each year, the Fund intends to qualify as a regulated investment company under Subchapter M of the Internal Revenue Code, including distributing substantially all of its taxable income and realized gains. As a result, no provision for U.S. Federal income taxes is required. As of October 31, 2018, the Fund did not have any unrecognized tax benefits in the financial statements; nor is the Fund aware of any tax positions for which it is reasonably possible that the total amounts of unrecognized tax benefits will significantly change in the next twelve months. The Fund files a U.S. federal tax return, in addition to state and local tax returns as required. The Fund's federal income tax returns are subject to examination by the Internal Revenue Service (IRS) for a period of three fiscal years after they are filed. State and local tax returns may be subject to examination for an additional fiscal year depending on the jurisdiction. Foreign taxes are provided for based on the Fund's understanding of the tax rules and rates that exist in the foreign markets in which it invests.
Distributions are declared and recorded on the ex-dividend date. Income and capital gain distributions are declared separately for each class. Income and capital gain distributions are determined in accordance with income tax regulations, which may differ from GAAP.
Capital accounts within the financial statements are adjusted for permanent book-tax differences. These adjustments have no impact on net assets or the results of operations. Capital accounts are not adjusted for temporary book-tax differences which will reverse in a subsequent period.
Book-tax differences are primarily due to foreign currency transactions, passive foreign investment companies (PFIC), deferred trustees compensation and losses deferred due to wash sales.
As of period end, the cost and unrealized appreciation (depreciation) in securities, and derivatives if applicable, for federal income tax purposes were as follows:
| Gross unrealized appreciation | $1,126,112,493 |
| Gross unrealized depreciation | (386,461,335) |
| Net unrealized appreciation (depreciation) | $739,651,158 |
| Tax Cost | $6,237,626,147 |
The tax-based components of distributable earnings as of period end were as follows:
| Undistributed ordinary income | $97,422,444 |
| Undistributed long-term capital gain | $256,694,922 |
| Net unrealized appreciation (depreciation) on securities and other investments | $739,388,787 |
The tax character of distributions paid was as follows:
| | October 31, 2018 | October 31, 2017 |
| Ordinary Income | $89,089,141 | $ 102,592,592 |
Restricted Securities. The Fund may invest in securities that are subject to legal or contractual restrictions on resale. These securities generally may be resold in transactions exempt from registration or to the public if the securities are registered. Disposal of these securities may involve time-consuming negotiations and expense, and prompt sale at an acceptable price may be difficult. Information regarding restricted securities is included at the end of the Fund's Schedule of Investments.
New Rule Issuance. During August 2018, the U.S. Securities and Exchange Commission issued Final Rule Release No. 33-10532, Disclosure Update and Simplification. This Final Rule includes amendments specific to registered investment companies that are intended to eliminate overlap in disclosure requirements between Regulation S-X and GAAP. In accordance with these amendments, certain line-items in the Fund's financial statements have been combined or removed for the current period as outlined in the table below.
| Financial Statement | Current Line-Item Presentation | Prior Line-Item Presentation |
| Statement of Assets and Liabilities | Total distributable earnings (loss) | Undistributed/Distributions in excess of/Accumulated net investment income (loss)
Accumulated/Undistributed net realized gain (loss)
Net unrealized appreciation (depreciation) |
| Statement of Changes in Net Assets | N/A - removed | Undistributed/Distributions in excess of/Accumulated net investment income (loss) end of period |
| Statement of Changes in Net Assets | Distributions to shareholders | Distributions to shareholders from net investment income
Distributions to shareholders from net realized gain |
| Distributions to Shareholders Note to Financial Statements | Distributions to shareholders | Distributions to shareholders from net investment income
Distributions to shareholders from net realized gain |
4. Purchases and Sales of Investments.
Purchases and sales of securities, other than short-term securities, aggregated $2,468,136,118 and $3,058,005,551, respectively.
Prior Fiscal Year Exchanges In-Kind. During the prior period, investments and cash received in-kind through subscriptions totaled $257,590,200 in exchange for 5,518,213 shares of the Fund. The amount of in-kind exchanges is included in share transactions in the accompanying Statement of Changes in Net Assets as well as the Notes to Financial Statements. The Fund recognized no gain or loss for federal income tax purposes.
5. Fees and Other Transactions with Affiliates.
Management Fee. Fidelity Management & Research Company (the investment adviser) and its affiliates provide the Fund with investment management related services for which the Fund pays a monthly management fee. The management fee is the sum of an individual fund fee rate that is based on an annual rate of .424% of the Fund's average net assets and an annualized group fee rate that averaged .24% during the period. The group fee rate is based upon the average net assets of all the mutual funds advised by the investment adviser, including any mutual funds previously advised by the investment adviser that are currently advised by Fidelity SelectCo, LLC, an affiliate of the investment adviser. The group fee rate decreases as assets under management increase and increases as assets under management decrease. In addition, the management fee is subject to a performance adjustment (up to a maximum of +/- .20% of the Fund's average net assets over a 36 month performance period). The upward or downward adjustment to the management fee is based on the relative investment performance of Overseas as compared to its benchmark index, the MSCI EAFE Index, over the same 36 month performance period. For the reporting period, the total annual management fee rate, including the performance adjustment, was .77% of the Fund's average net assets. The performance adjustment included in the management fee rate may be higher or lower than the maximum performance adjustment rate due to the difference between the average net assets for the reporting and performance periods.
Transfer Agent Fees. Fidelity Investments Institutional Operations Company, Inc., (FIIOC), an affiliate of the investment adviser, is the transfer, dividend disbursing and shareholder servicing agent for each class of the Fund. FIIOC receives account fees and asset-based fees that vary according to the account size and type of account of the shareholders of Overseas. FIIOC receives an asset-based fee of Class K's average net assets. FIIOC pays for typesetting, printing and mailing of shareholder reports, except proxy statements.
For the period, transfer agent fees for each class were as follows:
| | Amount | % of Class-Level Average Net Assets |
| Overseas | $10,213,574 | .16 |
| Class K | 535,609 | .05 |
| | $10,749,183 | |
Accounting and Security Lending Fees. Fidelity Service Company, Inc. (FSC), an affiliate of the investment adviser, maintains the Fund's accounting records. The accounting fee is based on the level of average net assets for each month. Under a separate contract, FSC administers the security lending program. The security lending fee is based on the number and duration of lending transactions. For the period, the fees were equivalent to an annual rate of .02%.
Brokerage Commissions. The Fund placed a portion of its portfolio transactions with brokerage firms which are affiliates of the investment adviser. Brokerage commissions are included in net realized gain (loss) and change in net unrealized appreciation (depreciation) in the Statement of Operations. The commissions paid to these affiliated firms were $5,660 for the period.
Interfund Lending Program. Pursuant to an Exemptive Order issued by the SEC, the Fund, along with other registered investment companies having management contracts with Fidelity Management & Research Company (FMR) or other affiliated entities of FMR, may participate in an interfund lending program. This program provides an alternative credit facility allowing the funds to borrow from, or lend money to, other participating affiliated funds. At period end, there were no interfund loans outstanding. The Fund's activity in this program during the period for which loans were outstanding was as follows:
| Borrower or Lender | Average Loan Balance | Weighted Average Interest Rate | Interest Expense |
| Borrower | $18,373,800 | 1.79% | $22,792 |
Interfund Trades. The Fund may purchase from or sell securities to other Fidelity Funds under procedures adopted by the Board. The procedures have been designed to ensure these interfund trades are executed in accordance with Rule 17a-7 of the 1940 Act. Interfund trades are included within the respective purchases and sales amounts shown in the Purchases and Sales of Investments note.
6. Committed Line of Credit.
The Fund participates with other funds managed by the investment adviser or an affiliate in a $4.25 billion credit facility (the "line of credit") to be utilized for temporary or emergency purposes to fund shareholder redemptions or for other short-term liquidity purposes. The Fund has agreed to pay commitment fees on its pro-rata portion of the line of credit, which amounted to $21,142 and is reflected in Miscellaneous expenses on the Statement of Operations. Interest is charged to the Fund based on its borrowing at a rate equal to .75% plus the higher of the Federal Funds Rate or one-month LIBOR. The Fund's average daily loan balance during the period for which loans were outstanding amounted to $6,700,000. The weighted average interest rate and interest expense was 2.45% and $456, respectively. At period end, there were no borrowings outstanding.
7. Security Lending.
The Fund lends portfolio securities through a lending agent from time to time in order to earn additional income. For equity securities, a lending agent is used and may loan securities to certain qualified borrowers, including Fidelity Capital Markets (FCM), a broker-dealer affiliated with the Fund. On the settlement date of the loan, the Fund receives collateral (in the form of U.S. Treasury obligations, letters of credit and/or cash) against the loaned securities and maintains collateral in an amount not less than 100% of the market value of the loaned securities during the period of the loan. The market value of the loaned securities is determined at the close of business of the Fund and any additional required collateral is delivered to the Fund on the next business day. The Fund or borrower may terminate the loan at any time, and if the borrower defaults on its obligation to return the securities loaned because of insolvency or other reasons, the Fund may apply collateral received from the borrower against the obligation. The Fund may experience delays and costs in recovering the securities loaned. Any cash collateral received is invested in the Fidelity Securities Lending Cash Central Fund. The value of loaned securities and cash collateral at period end are disclosed on the Fund's Statement of Assets and Liabilities. Security lending income represents the income earned on investing cash collateral, less rebates paid to borrowers and any lending agent fees associated with the loan, plus any premium payments received for lending certain types of securities. Security lending income is presented in the Statement of Operations as a component of income from Fidelity Central Funds. Total security lending income during the period amounted to $2,365,560. During the period, there were no securities loaned to FCM.
8. Expense Reductions.
Commissions paid to certain brokers with whom the investment adviser, or its affiliates, places trades on behalf of the Fund include an amount in addition to trade execution, which may be rebated back to the Fund to offset certain expenses. This amount totaled $747,154 for the period. In addition, through arrangements with the Fund's custodian, credits realized as a result of certain uninvested cash balances were used to reduce the Fund's expenses. During the period, these credits reduced the Fund's custody expenses by $6,236.
In addition, during the period the investment adviser reimbursed and/or waived a portion of fund-level operating expenses in the amount of $79,630.
9. Distributions to Shareholders.
Distributions to shareholders of each class were as follows:
| | Year ended
October 31, 2018 | Year ended
October 31, 2017 |
| Distributions to shareholders | | |
| Overseas | $74,926,544 | $– |
| Class K | 14,162,597 | – |
| Total | $89,089,141 | $– |
| From net investment income | | |
| Overseas | $– | $81,032,285 |
| Class K | – | 14,738,243 |
| Total | $– | $95,770,528 |
| From net realized gain | | |
| Overseas | $– | $5,828,046 |
| Class K | – | 994,018 |
| Total | $– | $6,822,064 |
10. Share Transactions.
Share transactions for each class were as follows and may contain automatic conversions between classes or exchanges between affiliated funds:
| | Shares | Shares | Dollars | Dollars |
| | Year ended October 31, 2018 | Year ended October 31, 2017 | Year ended October 31, 2018 | Year ended October 31, 2017 |
| Overseas | | | | |
| Shares sold | 29,404,571 | 43,630,558(a) | $1,465,217,884 | $1,962,017,751(a) |
| Reinvestment of distributions | 1,397,531 | 2,111,926 | 69,429,338 | 82,914,195 |
| Shares redeemed | (40,342,442) | (21,850,358) | (2,020,744,759) | (954,218,064) |
| Net increase (decrease) | (9,540,340) | 23,892,126 | $(486,097,537) | $1,090,713,882 |
| Class K | | | | |
| Shares sold | 6,397,391 | 9,782,877 | $319,720,787 | $437,887,827 |
| Reinvestment of distributions | 285,767 | 401,743 | 14,162,597 | 15,732,261 |
| Shares redeemed | (7,474,394) | (5,385,134) | (376,384,342) | (240,238,797) |
| Net increase (decrease) | (791,236) | 4,799,486 | $(42,500,958) | $213,381,291 |
(a) Amount includes in-kind exchanges (see the Prior Fiscal Year Exchanges In-Kind note for additional details).
11. Other.
The Fund's organizational documents provide former and current trustees and officers with a limited indemnification against liabilities arising in connection with the performance of their duties to the Fund. In the normal course of business, the Fund may also enter into contracts that provide general indemnifications. The Fund's maximum exposure under these arrangements is unknown as this would be dependent on future claims that may be made against the Fund. The risk of material loss from such claims is considered remote.
At the end of the period, mutual funds managed by the investment adviser or its affiliates were the owners of record, in the aggregate, of approximately 28% of the total outstanding shares of the Fund.
Report of Independent Registered Public Accounting Firm
To the Board of Trustees of Fidelity Investment Trust and Shareholders of Fidelity Overseas Fund:
Opinion on the Financial Statements
We have audited the accompanying statement of assets and liabilities, including the schedule of investments, of Fidelity Overseas Fund (one of the funds constituting Fidelity Investment Trust, referred to hereafter as the "Fund") as of October 31, 2018, the related statement of operations for the year ended October 31, 2018, the statement of changes in net assets for each of the two years in the period ended October 31, 2018, including the related notes, and the financial highlights for each of the five years in the period ended October 31, 2018 (collectively referred to as the “financial statements”). In our opinion, the financial statements present fairly, in all material respects, the financial position of the Fund as of October 31, 2018, the results of its operations for the year then ended, the changes in its net assets for each of the two years in the period ended October 31, 2018 and the financial highlights for each of the five years in the period ended October 31, 2018 in conformity with accounting principles generally accepted in the United States of America.
Basis for Opinion
These financial statements are the responsibility of the Fund’s management. Our responsibility is to express an opinion on the Fund’s financial statements based on our audits. We are a public accounting firm registered with the Public Company Accounting Oversight Board (United States) (“PCAOB”) and are required to be independent with respect to the Fund in accordance with the U.S. federal securities laws and the applicable rules and regulations of the Securities and Exchange Commission and the PCAOB.
We conducted our audits of these financial statements in accordance with the standards of the PCAOB. Those standards require that we plan and perform the audit to obtain reasonable assurance about whether the financial statements are free of material misstatement, whether due to error or fraud.
Our audits included performing procedures to assess the risks of material misstatement of the financial statements, whether due to error or fraud, and performing procedures that respond to those risks. Such procedures included examining, on a test basis, evidence regarding the amounts and disclosures in the financial statements. Our audits also included evaluating the accounting principles used and significant estimates made by management, as well as evaluating the overall presentation of the financial statements. Our procedures included confirmation of securities owned as of October 31, 2018 by correspondence with the custodian, and brokers; when replies were not received from brokers, we performed other auditing procedures. We believe that our audits provide a reasonable basis for our opinion.
PricewaterhouseCoopers LLP
Boston, Massachusetts
December 13, 2018
We have served as the auditor of one or more investment companies in the Fidelity group of funds since 1932.
Trustees and Officers
The Trustees, Members of the Advisory Board (if any), and officers of the trust and fund, as applicable, are listed below. The Board of Trustees governs the fund and is responsible for protecting the interests of shareholders. The Trustees are experienced executives who meet periodically throughout the year to oversee the fund's activities, review contractual arrangements with companies that provide services to the fund, oversee management of the risks associated with such activities and contractual arrangements, and review the fund's performance. Except for Jonathan Chiel, each of the Trustees oversees 283 funds. Mr. Chiel oversees 154 funds.
The Trustees hold office without limit in time except that (a) any Trustee may resign; (b) any Trustee may be removed by written instrument, signed by at least two-thirds of the number of Trustees prior to such removal; (c) any Trustee who requests to be retired or who has become incapacitated by illness or injury may be retired by written instrument signed by a majority of the other Trustees; and (d) any Trustee may be removed at any special meeting of shareholders by a two-thirds vote of the outstanding voting securities of the trust. Each Trustee who is not an interested person (as defined in the 1940 Act) of the trust and the fund is referred to herein as an Independent Trustee. Each Independent Trustee shall retire not later than the last day of the calendar year in which his or her 75th birthday occurs. The Independent Trustees may waive this mandatory retirement age policy with respect to individual Trustees. Officers and Advisory Board Members hold office without limit in time, except that any officer or Advisory Board Member may resign or may be removed by a vote of a majority of the Trustees at any regular meeting or any special meeting of the Trustees. Except as indicated, each individual has held the office shown or other offices in the same company for the past five years.
The fund’s Statement of Additional Information (SAI) includes more information about the Trustees. To request a free copy, call Fidelity at 1-800-835-5092.
Experience, Skills, Attributes, and Qualifications of the Trustees. The Governance and Nominating Committee has adopted a statement of policy that describes the experience, qualifications, attributes, and skills that are necessary and desirable for potential Independent Trustee candidates (Statement of Policy). The Board believes that each Trustee satisfied at the time he or she was initially elected or appointed a Trustee, and continues to satisfy, the standards contemplated by the Statement of Policy. The Governance and Nominating Committee also engages professional search firms to help identify potential Independent Trustee candidates who have the experience, qualifications, attributes, and skills consistent with the Statement of Policy. From time to time, additional criteria based on the composition and skills of the current Independent Trustees, as well as experience or skills that may be appropriate in light of future changes to board composition, business conditions, and regulatory or other developments, have also been considered by the professional search firms and the Governance and Nominating Committee. In addition, the Board takes into account the Trustees' commitment and participation in Board and committee meetings, as well as their leadership of standing and ad hoc committees throughout their tenure.
In determining that a particular Trustee was and continues to be qualified to serve as a Trustee, the Board has considered a variety of criteria, none of which, in isolation, was controlling. The Board believes that, collectively, the Trustees have balanced and diverse experience, qualifications, attributes, and skills, which allow the Board to operate effectively in governing the fund and protecting the interests of shareholders. Information about the specific experience, skills, attributes, and qualifications of each Trustee, which in each case led to the Board's conclusion that the Trustee should serve (or continue to serve) as a trustee of the fund, is provided below.
Board Structure and Oversight Function. James C. Curvey is an interested person and currently serves as Chairman. The Trustees have determined that an interested Chairman is appropriate and benefits shareholders because an interested Chairman has a personal and professional stake in the quality and continuity of services provided to the fund. Independent Trustees exercise their informed business judgment to appoint an individual of their choosing to serve as Chairman, regardless of whether the Trustee happens to be independent or a member of management. The Independent Trustees have determined that they can act independently and effectively without having an Independent Trustee serve as Chairman and that a key structural component for assuring that they are in a position to do so is for the Independent Trustees to constitute a substantial majority for the Board. The Independent Trustees also regularly meet in executive session. Ned C. Lautenbach serves as Chairman of the Independent Trustees and as such (i) acts as a liaison between the Independent Trustees and management with respect to matters important to the Independent Trustees and (ii) with management prepares agendas for Board meetings.
Fidelity® funds are overseen by different Boards of Trustees. The fund's Board oversees Fidelity's high income and certain equity funds, and other Boards oversee Fidelity's investment-grade bond, money market, asset allocation, and other equity funds. The asset allocation funds may invest in Fidelity® funds overseen by the fund's Board. The use of separate Boards, each with its own committee structure, allows the Trustees of each group of Fidelity® funds to focus on the unique issues of the funds they oversee, including common research, investment, and operational issues. On occasion, the separate Boards establish joint committees to address issues of overlapping consequences for the Fidelity® funds overseen by each Board.
The Trustees operate using a system of committees to facilitate the timely and efficient consideration of all matters of importance to the Trustees, the fund, and fund shareholders and to facilitate compliance with legal and regulatory requirements and oversight of the fund's activities and associated risks. The Board, acting through its committees, has charged FMR and its affiliates with (i) identifying events or circumstances the occurrence of which could have demonstrably adverse effects on the fund's business and/or reputation; (ii) implementing processes and controls to lessen the possibility that such events or circumstances occur or to mitigate the effects of such events or circumstances if they do occur; and (iii) creating and maintaining a system designed to evaluate continuously business and market conditions in order to facilitate the identification and implementation processes described in (i) and (ii) above. Because the day-to-day operations and activities of the fund are carried out by or through FMR, its affiliates, and other service providers, the fund's exposure to risks is mitigated but not eliminated by the processes overseen by the Trustees. While each of the Board's committees has responsibility for overseeing different aspects of the fund's activities, oversight is exercised primarily through the Operations, Audit, and Compliance Committees. In addition, the Independent Trustees have worked with Fidelity to enhance the Board's oversight of investment and financial risks, legal and regulatory risks, technology risks, and operational risks, including the development of additional risk reporting to the Board. Appropriate personnel, including but not limited to the fund's Chief Compliance Officer (CCO), FMR's internal auditor, the independent accountants, the fund's Treasurer and portfolio management personnel, make periodic reports to the Board's committees, as appropriate, including an annual review of Fidelity's risk management program for the Fidelity® funds. The responsibilities of each standing committee, including their oversight responsibilities, are described further under "Standing Committees of the Trustees."
Interested Trustees*:
Correspondence intended for a Trustee who is an interested person may be sent to Fidelity Investments, 245 Summer Street, Boston, Massachusetts 02210.
Name, Year of Birth; Principal Occupations and Other Relevant Experience+
Jonathan Chiel (1957)
Year of Election or Appointment: 2016
Trustee
Mr. Chiel also serves as Trustee of other Fidelity® funds. Mr. Chiel is Executive Vice President and General Counsel for FMR LLC (diversified financial services company, 2012-present). Previously, Mr. Chiel served as general counsel (2004-2012) and senior vice president and deputy general counsel (2000-2004) for John Hancock Financial Services; a partner with Choate, Hall & Stewart (1996-2000) (law firm); and an Assistant United States Attorney for the United States Attorney’s Office of the District of Massachusetts (1986-95), including Chief of the Criminal Division (1993-1995). Mr. Chiel is a director on the boards of the Boston Bar Foundation and the Maimonides School.
James C. Curvey (1935)
Year of Election or Appointment: 2007
Trustee
Chairman of the Board of Trustees
Mr. Curvey also serves as Trustee of other Fidelity® funds. Mr. Curvey is Vice Chairman (2007-present) and Director of FMR LLC (diversified financial services company). In addition, Mr. Curvey is an Overseer Emeritus for the Boston Symphony Orchestra, a Director of Artis-Naples, and a Trustee of Brewster Academy in Wolfeboro, New Hampshire. Previously, Mr. Curvey served as a Director of Fidelity Research & Analysis Co. (investment adviser firm, 2009-2018), Director of Fidelity Investments Money Management, Inc. (investment adviser firm, 2009-2014) and a Director of FMR and FMR Co., Inc. (investment adviser firms, 2007-2014).
Charles S. Morrison (1960)
Year of Election or Appointment: 2014
Trustee
Mr. Morrison also serves as Trustee of other funds. He serves as President of Fidelity SelectCo, LLC (investment adviser firm, 2017-present) and Fidelity Management & Research Company (FMR) (investment adviser firm, 2016-present), a Director of Fidelity Investments Money Management, Inc. (FIMM) (investment adviser firm, 2014-present), Director of Fidelity SelectCo, LLC (investment adviser firm, 2014-present), President, Asset Management (2014-present), and is an employee of Fidelity Investments. Previously, Mr. Morrison served as Vice President of Fidelity's Fixed Income and Asset Allocation Funds (2012-2014), President, Fixed Income (2011-2014), Vice President of Fidelity's Money Market Funds (2005-2009), President, Money Market Group Leader of FMR (investment adviser firm, 2009), and Senior Vice President, Money Market Group of FMR (2004-2009). Mr. Morrison also served as Vice President of Fidelity's Bond Funds (2002-2005), certain Balanced Funds (2002-2005), and certain Asset Allocation Funds (2002-2007), and as Senior Vice President (2002-2005) of Fidelity's Bond Division.
* Determined to be an “Interested Trustee” by virtue of, among other things, his or her affiliation with the trust or various entities under common control with FMR.
+ The information includes the Trustee's principal occupation during the last five years and other information relating to the experience, attributes, and skills relevant to the Trustee's qualifications to serve as a Trustee, which led to the conclusion that the Trustee should serve as a Trustee for the fund.
Independent Trustees:
Correspondence intended for an Independent Trustee may be sent to Fidelity Investments, P.O. Box 55235, Boston, Massachusetts 02205-5235.
Name, Year of Birth; Principal Occupations and Other Relevant Experience+
Dennis J. Dirks (1948)
Year of Election or Appointment: 2005
Trustee
Mr. Dirks also serves as Trustee of other Fidelity® funds. Prior to his retirement in May 2003, Mr. Dirks was Chief Operating Officer and a member of the Board of The Depository Trust & Clearing Corporation (DTCC). He also served as President, Chief Operating Officer, and Board member of The Depository Trust Company (DTC) and President and Board member of the National Securities Clearing Corporation (NSCC). In addition, Mr. Dirks served as Chief Executive Officer and Board member of the Government Securities Clearing Corporation, Chief Executive Officer and Board member of the Mortgage-Backed Securities Clearing Corporation, as a Trustee and a member of the Finance Committee of Manhattan College (2005-2008), as a Trustee and a member of the Finance Committee of AHRC of Nassau County (2006-2008), as a member of the Independent Directors Council (IDC) Governing Council (2010-2015), and as a member of the Board of Directors for The Brookville Center for Children’s Services, Inc. (2009-2017). Mr. Dirks is a member of the Finance Committee (2016-present), Board of Directors (2017-present) and Board of Trustees (2018-present) and is Treasurer (2018-present) of the Asolo Repertory Theatre.
Donald F. Donahue (1950)
Year of Election or Appointment: 2018
Trustee
Mr. Donahue also serves as a Trustee of other Fidelity® funds. Mr. Donahue is President and Chief Executive Officer of Miranda Partners, LLC (risk consulting for the financial services industry, 2012-present). Previously, Mr. Donahue served as a Member of the Advisory Board of certain Fidelity® funds (2015-2018) and Chief Executive Officer (2006-2012), Chief Operating Officer (2003-2006), and Managing Director, Customer Marketing and Development (1999-2003) of The Depository Trust & Clearing Corporation (financial markets infrastructure). Mr. Donahue serves as a Member (2007-present) and Co-Chairman (2016-present) of the Board of Directors of United Way of New York, Member of the Board of Directors of NYC Leadership Academy (2012-present) and Member of the Board of Advisors of Ripple Labs, Inc. (financial services, 2015-present). He also served as Chairman (2010-2012) and Member of the Board of Directors (2012-2013) of Omgeo, LLC (financial services), Treasurer of United Way of New York (2012-2016), and Member of the Board of Directors of XBRL US (financial services non-profit, 2009-2012) and the International Securities Services Association (2009-2012).
Alan J. Lacy (1953)
Year of Election or Appointment: 2008
Trustee
Mr. Lacy also serves as Trustee of other Fidelity® funds. Mr. Lacy serves as a Director of Bristol-Myers Squibb Company (global pharmaceuticals, 2008-present). He is a Trustee of the California Chapter of The Nature Conservancy (2015-present) and a Director of the Center for Advanced Study in the Behavioral Sciences at Stanford University (2015-present). In addition, Mr. Lacy served as Senior Adviser (2007-2014) of Oak Hill Capital Partners, L.P. (private equity) and also served as Chief Executive Officer (2005) and Vice Chairman (2005-2006) of Sears Holdings Corporation (retail) and Chief Executive Officer and Chairman of the Board of Sears, Roebuck and Co. (retail, 2000-2005). Previously, Mr. Lacy served as Chairman (2014-2017) and a member (2010-2017) of the Board of Directors of Dave & Buster’s Entertainment, Inc. (restaurant and entertainment complexes), as Chairman (2008-2011) and a member (2006-2015) of the Board of Trustees of the National Parks Conservation Association, and as a member of the Board of Directors for The Hillman Companies, Inc. (hardware wholesalers, 2010-2014), Earth Fare, Inc. (retail grocery, 2010-2014), and The Western Union Company (global money transfer, 2006-2011).
Ned C. Lautenbach (1944)
Year of Election or Appointment: 2000
Trustee
Chairman of the Independent Trustees
Mr. Lautenbach also serves as Trustee of other Fidelity® funds. Mr. Lautenbach currently serves as Vice Chair of the Board of Governors, State University System of Florida (2013-present) and is a member of the Council on Foreign Relations (1994-present). He is also a member and has most recently served as Chairman of the Board of Directors of Artis-Naples (2012-present). Previously, Mr. Lautenbach served as a member and then Lead Director of the Board of Directors of Eaton Corporation (diversified industrial, 1997-2016). He was also a Partner and Advisory Partner at Clayton, Dubilier & Rice, LLC (private equity investment, 1998-2010), as well as a Director of Sony Corporation (2006-2007). In addition, Mr. Lautenbach also had a 30-year career with IBM (technology company) during which time he served as Senior Vice President and a member of the Corporate Executive Committee (1968-1998).
Joseph Mauriello (1944)
Year of Election or Appointment: 2008
Trustee
Mr. Mauriello also serves as Trustee of other Fidelity® funds. Prior to his retirement in January 2006, Mr. Mauriello served in numerous senior management positions including Deputy Chairman and Chief Operating Officer (2004-2005), and Vice Chairman of Financial Services (2002-2004) of KPMG LLP US (professional services, 1965-2005). Mr. Mauriello currently serves as a member of the Independent Directors Council (IDC) Governing Council (2015-present). Previously, Mr. Mauriello served as a member of the Board of Directors of XL Group plc. (global insurance and re-insurance, 2006-2018).
Cornelia M. Small (1944)
Year of Election or Appointment: 2005
Trustee
Ms. Small also serves as Trustee of other Fidelity® funds. Ms. Small is a member of the Board of Directors (2009-present) and Chair of the Investment Committee (2010-present) of the Teagle Foundation. Ms. Small also serves on the Investment Committee of the Berkshire Taconic Community Foundation (2008-present). Previously, Ms. Small served as Chairperson (2002-2008) and a member of the Investment Committee and Chairperson (2008-2012) and a member of the Board of Trustees of Smith College. In addition, Ms. Small served as Chief Investment Officer, Director of Global Equity Investments, and a member of the Board of Directors of Scudder, Stevens & Clark and Scudder Kemper Investments.
Garnett A. Smith (1947)
Year of Election or Appointment: 2018
Trustee
Mr. Smith also serves as Trustee of other Fidelity® funds. Prior to Mr. Smith's retirement, he served as Chairman and Chief Executive Officer of Inbrand Corp. (manufacturer of personal absorbent products, 1990-1997). He also served as President (1986-1990) of Inbrand Corp. Prior to his employment with Inbrand Corp., he was employed by a retail fabric chain and North Carolina National Bank. In addition, Mr. Smith served as a Member of the Advisory Board of certain Fidelity® funds (2012-2013) and as a board member of the Jackson Hole Land Trust (2009-2012).
David M. Thomas (1949)
Year of Election or Appointment: 2008
Trustee
Mr. Thomas also serves as Trustee of other Fidelity® funds. Mr. Thomas serves as Non-Executive Chairman of the Board of Directors of Fortune Brands Home and Security (home and security products, 2011-present), as a member of the Board of Directors (2004-present) and Presiding Director (2013-present) of Interpublic Group of Companies, Inc. (marketing communication), and as a member of the Board of Trustees of the University of Florida (2013-present). Previously, Mr. Thomas served as Executive Chairman (2005-2006) and Chairman and Chief Executive Officer (2000-2005) of IMS Health, Inc. (pharmaceutical and healthcare information solutions), and a Director of Fortune Brands, Inc. (consumer products, 2000-2011).
+ The information includes the Trustee's principal occupation during the last five years and other information relating to the experience, attributes, and skills relevant to the Trustee's qualifications to serve as a Trustee, which led to the conclusion that the Trustee should serve as a Trustee for the fund.
Advisory Board Members and Officers:
Correspondence intended for a Member of the Advisory Board (if any) may be sent to Fidelity Investments, P.O. Box 55235, Boston, Massachusetts 02205-5235. Correspondence intended for an officer or Peter S. Lynch may be sent to Fidelity Investments, 245 Summer Street, Boston, Massachusetts 02210. Officers appear below in alphabetical order.
Name, Year of Birth; Principal Occupation
Vicki L. Fuller (1957)
Year of Election or Appointment: 2018
Member of the Advisory Board
Ms. Fuller also serves as Member of the Advisory Board of other Fidelity® funds. Ms. Fuller serves as a member of the Board of Directors, Audit Committee, and Nominating and Governance Committee of The Williams Companies, Inc. (natural gas infrastructure, 2018-present). Previously, Ms. Fuller served as the Chief Investment Officer of the New York State Common Retirement Fund (2012-2018) and held a variety of positions at AllianceBernstein L.P. (global asset management, 1985-2012), including Managing Director (2006-2012) and Senior Vice President and Senior Portfolio Manager (2001-2006).
Peter S. Lynch (1944)
Year of Election or Appointment: 2003
Member of the Advisory Board
Mr. Lynch also serves as Member of the Advisory Board of other Fidelity® funds. Mr. Lynch is Vice Chairman and a Director of FMR (investment adviser firm) and FMR Co., Inc. (investment adviser firm). In addition, Mr. Lynch serves as a Trustee of Boston College and as the Chairman of the Inner-City Scholarship Fund. Previously, Mr. Lynch served on the Special Olympics International Board of Directors (1997-2006).
William S. Stavropoulos (1939)
Year of Election or Appointment: 2018
Member of the Advisory Board
Mr. Stavropoulos also serves as Member of the Advisory Board of other Fidelity® funds. Mr. Stavropoulos serves as President and Founder of the Michigan Baseball Foundation, the Great Lakes Loons (2007-present). Mr. Stavropoulos is Chairman Emeritus of the Board of Directors of The Dow Chemical Company, where he previously served in numerous senior management positions, including President, CEO (1995-2000; 2002-2004), Chairman of the Executive Committee (2000-2006), and as a member of the Board of Directors (1990-2006). Currently, Mr. Stavropoulos is Chairman of the Board of Directors of Univar Inc. (global distributor of commodity and specialty chemicals), a Director of Teradata Corporation (data warehousing and technology solutions), and a member of the Advisory Board for Metalmark Capital LLC (private equity investment, 2005-present). Mr. Stavropoulos is an operating advisor to Clayton, Dubilier & Rice, LLC (private equity investment). In addition, Mr. Stavropoulos is a member of the University of Notre Dame Advisory Council for the College of Science, a Trustee of the Rollin L. Gerstacker Foundation, and a Director of Artis-Naples in Naples, Florida. Previously, Mr. Stavropoulos served as Trustee of certain Fidelity® funds (2001-2018) and as a Director of Chemical Financial Corporation (bank holding company, 1993-2012) and Tyco International, Ltd. (multinational manufacturing and services, 2007-2012).
Carol B. Tomé (1957)
Year of Election or Appointment: 2018
Member of the Advisory Board
Ms. Tomé also serves as Member of the Advisory Board of other Fidelity® funds. Ms. Tomé is Chief Financial Officer (2001-present) and Executive Vice President of Corporate Services (2007-present) of The Home Depot, Inc. (home improvement retailer) and a Director (2003-present) and Chair of the Audit Committee (2004-present) of United Parcel Service, Inc. (package delivery and supply chain management). Previously, Ms. Tomé served as Trustee of certain Fidelity® funds (2017), Senior Vice President of Finance and Accounting/Treasurer (2000-2007) and Vice President and Treasurer (1995-2000) of The Home Depot, Inc. and Chair of the Board (2010-2012), Vice Chair of the Board (2009 and 2013), and a Director (2008-2013) of the Federal Reserve Bank of Atlanta. Ms. Tomé is also a director or trustee of many community and professional organizations.
Michael E. Wiley (1950)
Year of Election or Appointment: 2018
Member of the Advisory Board
Mr. Wiley also serves as Trustee or Member of the Advisory Board of other Fidelity® funds. Mr. Wiley serves as a Director of High Point Resources (exploration and production, 2005-present). Previously, Mr. Wiley served as a Director of Andeavor Corporation (independent oil refiner and marketer, 2005-2018), a Director of Andeavor Logistics LP (natural resources logistics, 2015-2018), a Director of Post Oak Bank (privately-held bank, 2004-2018), a Director of Asia Pacific Exploration Consolidated (international oil and gas exploration and production, 2008-2013), a member of the Board of Trustees of the University of Tulsa (2000-2006; 2007-2010), a Senior Energy Advisor of Katzenbach Partners, LLC (consulting, 2006-2007), an Advisory Director of Riverstone Holdings (private investment), a Director of Spinnaker Exploration Company (exploration and production, 2001-2005) and Chairman, President, and CEO of Baker Hughes, Inc. (oilfield services, 2000-2004).
Elizabeth Paige Baumann (1968)
Year of Election or Appointment: 2017
Anti-Money Laundering (AML) Officer
Ms. Baumann also serves as AML Officer of other funds. She is Chief AML Officer (2012-present) and Senior Vice President (2014-present) of FMR LLC (diversified financial services company) and is an employee of Fidelity Investments. Previously, Ms. Baumann served as AML Officer of the funds (2012-2016), and Vice President (2007-2014) and Deputy Anti-Money Laundering Officer (2007-2012) of FMR LLC.
John J. Burke III (1964)
Year of Election or Appointment: 2018
Chief Financial Officer
Mr. Burke also serves as Chief Financial Officer of other funds. Mr. Burke serves as Head of Investment Operations for Fidelity Fund and Investment Operations (2018-present) and is an employee of Fidelity Investments (1998-present). Previously Mr. Burke served as head of Asset Management Investment Operations (2012-2018).
William C. Coffey (1969)
Year of Election or Appointment: 2018
Secretary and Chief Legal Officer (CLO)
Mr. Coffey also serves as Secretary and CLO of other funds. Mr. Coffey serves as CLO, Secretary, and Senior Vice President of Fidelity Management & Research Company and FMR Co., Inc. (investment adviser firms, 2018-present); Secretary of Fidelity SelectCo, LLC and Fidelity Investments Money Management, Inc. (investment adviser firms, 2018-present); and CLO of Fidelity Management & Research (Hong Kong) Limited, FMR Investment Management (UK) Limited, and Fidelity Management & Research (Japan) Limited (investment adviser firms, 2018-present). He is Senior Vice President and Deputy General Counsel of FMR LLC (diversified financial services company, 2010-present), and is an employee of Fidelity Investments. Previously, Mr. Coffey served as Assistant Secretary of certain funds (2009-2018) and as Vice President and Associate General Counsel of FMR LLC (2005-2009).
Timothy M. Cohen (1969)
Year of Election or Appointment: 2018
Vice President
Mr. Cohen also serves as Vice President of other funds. Mr. Cohen serves as Co-Head of Global Equity Research (2016-present), a Director of Fidelity Management & Research (Japan) Limited (investment adviser firm, 2016-present), and is an employee of Fidelity Investments. Previously, Mr. Cohen served as Chief Investment Officer - Equity and a Director of Fidelity Management & Research (U.K.) Inc. (investment adviser firm, 2013-2015) and as a Director of Fidelity Management & Research (Hong Kong) Limited (investment adviser firm, 2017).
Jonathan Davis (1968)
Year of Election or Appointment: 2010
Assistant Treasurer
Mr. Davis also serves as Assistant Treasurer of other funds. Mr. Davis serves as Assistant Treasurer of FMR Capital, Inc. (2017-present) and is an employee of Fidelity Investments. Previously, Mr. Davis served as Vice President and Associate General Counsel of FMR LLC (diversified financial services company, 2003-2010).
Adrien E. Deberghes (1967)
Year of Election or Appointment: 2016
Assistant Treasurer
Mr. Deberghes also serves as an officer of other funds. He serves as Assistant Treasurer of FMR Capital, Inc. (2017-present), Executive Vice President of Fidelity Investments Money Management, Inc. (FIMM) (investment adviser firm, 2016-present), and is an employee of Fidelity Investments (2008-present). Previously, Mr. Deberghes served as President and Treasurer of certain Fidelity® funds (2013-2018). Prior to joining Fidelity Investments, Mr. Deberghes was Senior Vice President of Mutual Fund Administration at State Street Corporation (2007-2008), Senior Director of Mutual Fund Administration at Investors Bank & Trust (2005-2007), and Director of Finance for Dunkin' Brands (2000-2005). Previously, Mr. Deberghes served in other fund officer roles.
Laura M. Del Prato (1964)
Year of Election or Appointment: 2018
Assistant Treasurer
Ms. Del Prato also serves as an officer of other funds. Ms. Del Prato is an employee of Fidelity Investments (2017-present). Prior to joining Fidelity Investments, Ms. Del Prato served as a Managing Director and Treasurer of the JPMorgan Mutual Funds (2014-2017). Prior to JPMorgan, Ms. Del Prato served as a partner at Cohen Fund Audit Services (accounting firm, 2012-2013) and KPMG LLP (accounting firm, 2004-2012).
Colm A. Hogan (1973)
Year of Election or Appointment: 2016
Deputy Treasurer
Mr. Hogan also serves as an officer of other funds. Mr. Hogan serves as Assistant Treasurer of FMR Capital, Inc. (2017-present) and is an employee of Fidelity Investments (2005-present). Previously, Mr. Hogan served as Assistant Treasurer of certain Fidelity® funds (2016-2018).
Pamela R. Holding (1964)
Year of Election or Appointment: 2018
Vice President
Ms. Holding also serves as Vice President of other funds. Ms. Holding serves as Co-Head of Global Equity Research (2018-present) and is an employee of Fidelity Investments (2013-present).
Chris Maher (1972)
Year of Election or Appointment: 2013
Assistant Treasurer
Mr. Maher serves as Assistant Treasurer of other funds. Mr. Maher is Vice President of Valuation Oversight, serves as Assistant Treasurer of FMR Capital, Inc. (2017-present), and is an employee of Fidelity Investments. Previously, Mr. Maher served as Vice President of Asset Management Compliance (2013), Vice President of the Program Management Group of FMR (investment adviser firm, 2010-2013), and Vice President of Valuation Oversight (2008-2010).
Rieco E. Mello (1969)
Year of Election or Appointment: 2017
Assistant Treasurer
Mr. Mello also serves as Assistant Treasurer of other funds. Mr. Mello serves as Assistant Treasurer of FMR Capital, Inc. (2017-present) and is an employee of Fidelity Investments (1995-present).
Kenneth B. Robins (1969)
Year of Election or Appointment: 2016
Chief Compliance Officer
Mr. Robins also serves as an officer of other funds. Mr. Robins serves as Compliance Officer of Fidelity Management & Research Company and FMR Co., Inc. (investment adviser firms, 2016-present) and is an employee of Fidelity Investments (2004-present). Previously, Mr. Robins served as Executive Vice President of Fidelity Investments Money Management, Inc. (investment adviser firm, 2013-2016) and served in other fund officer roles.
Stacie M. Smith (1974)
Year of Election or Appointment: 2016
President and Treasurer
Ms. Smith also serves as an officer of other funds. Ms. Smith serves as Assistant Treasurer of FMR Capital, Inc. (2017-present), is an employee of Fidelity Investments (2009-present), and has served in other fund officer roles. Prior to joining Fidelity Investments, Ms. Smith served as Senior Audit Manager of Ernst & Young LLP (accounting firm, 1996-2009). Previously, Ms. Smith served as Assistant Treasurer (2013-2018) and Deputy Treasurer (2013-2016) of certain Fidelity® funds.
Marc L. Spector (1972)
Year of Election or Appointment: 2016
Assistant Treasurer
Mr. Spector also serves as an officer of other funds. Mr. Spector serves as Assistant Treasurer of FMR Capital, Inc. (2017-present) and is an employee of Fidelity Investments (2016-present). Prior to joining Fidelity Investments, Mr. Spector served as Director at the Siegfried Group (accounting firm, 2013-2016), and prior to Siegfried Group as audit senior manager at Deloitte & Touche (accounting firm, 2005-2013).
Shareholder Expense Example
As a shareholder of the Fund, you incur two types of costs: (1) transaction costs and (2) ongoing costs, including management fees and other Fund expenses. This Example is intended to help you understand your ongoing costs (in dollars) of investing in the Fund and to compare these costs with the ongoing costs of investing in other mutual funds.
The Example is based on an investment of $1,000 invested at the beginning of the period and held for the entire period (May 1, 2018 to October 31, 2018).
Actual Expenses
The first line of the accompanying table for each class of the Fund provides information about actual account values and actual expenses. You may use the information in this line, together with the amount you invested, to estimate the expenses that you paid over the period. Simply divide your account value by $1,000.00 (for example, an $8,600 account value divided by $1,000.00 = 8.6), then multiply the result by the number in the first line for a class of the Fund under the heading entitled "Expenses Paid During Period" to estimate the expenses you paid on your account during this period. A small balance maintenance fee of $12.00 that is charged once a year may apply for certain accounts with a value of less than $2,000. This fee, which was eliminated effective August 1, 2018, is not included in the table below. If it was, the estimate of expenses you paid during the period would be higher, and your ending account value lower, by this amount. In addition, the Fund, as a shareholder in the underlying Fidelity Central Funds, will indirectly bear its pro-rata share of the fees and expenses incurred by the underlying Fidelity Central Funds. These fees and expenses are not included in the Fund's annualized expense ratio used to calculate the expense estimate in the table below.
Hypothetical Example for Comparison Purposes
The second line of the accompanying table for each class of the Fund provides information about hypothetical account values and hypothetical expenses based on a Class' actual expense ratio and an assumed rate of return of 5% per year before expenses, which is not the Class' actual return. The hypothetical account values and expenses may not be used to estimate the actual ending account balance or expenses you paid for the period. You may use this information to compare the ongoing costs of investing in the Fund and other funds. To do so, compare this 5% hypothetical example with the 5% hypothetical examples that appear in the shareholder reports of the other funds. A small balance maintenance fee of $12.00 that is charged once a year may apply for certain accounts with a value of less than $2,000. This fee, which was eliminated effective August 1, 2018, is not included in the table below. If it was, the estimate of expenses you paid during the period would be higher, and your ending account value lower, by this amount. In addition, the Fund, as a shareholder in the underlying Fidelity Central Funds, will indirectly bear its pro-rata share of the fees and expenses incurred by the underlying Fidelity Central Funds. These fees and expenses are not included in the Fund's annualized expense ratio used to calculate the expense estimate in the table below.
Please note that the expenses shown in the table are meant to highlight your ongoing costs only and do not reflect any transaction costs. Therefore, the second line of the table is useful in comparing ongoing costs only, and will not help you determine the relative total costs of owning different funds.
| | Annualized Expense Ratio-A | Beginning
Account Value
May 1, 2018 | Ending
Account Value
October 31, 2018 | Expenses Paid
During Period-B
May 1, 2018
to October 31, 2018 |
| Overseas | .95% | | | |
| Actual | | $1,000.00 | $908.60 | $4.57 |
| Hypothetical-C | | $1,000.00 | $1,020.42 | $4.84 |
| Class K | .83% | | | |
| Actual | | $1,000.00 | $909.20 | $3.99 |
| Hypothetical-C | | $1,000.00 | $1,021.02 | $4.23 |
A Annualized expense ratio reflects expenses net of applicable fee waivers.
B Expenses are equal to each Class' annualized expense ratio, multiplied by the average account value over the period, multiplied by 184/365 (to reflect the one-half year period).
C 5% return per year before expenses
Distributions (Unaudited)
The Board of Trustees of Fidelity Overseas Fund voted to pay to shareholders of record at the opening of business on record date, the following distributions per share derived from capital gains realized from sales of portfolio securities, and dividends derived from net investment income:
| | Pay Date | Record Date | Dividends | Capital Gains |
| Fidelity Overseas Fund | | | | |
| Overseas | 12/10/18 | 12/07/18 | $0.678 | $1.744 |
| Class K | 12/10/18 | 12/07/18 | $0.733 | $1.744 |
|
The fund hereby designates as a capital gain dividend with respect to the taxable year ended October 31, 2018, $256,694,922 or, if subsequently determined to be different, the net capital gain of such year.
Fidelity Overseas Fund and Class K designate 2% of the dividend distributed during the fiscal year as qualifying for the dividends–received deduction for corporate shareholders.
Fidelity Overseas Fund and Class K designate 100% of the dividend distributed during the fiscal year as amounts which may be taken into account as a dividend for purposes of the maximum rate under section 1(h)(11) of the Internal Revenue Code.
The amounts per share which represent income derived from sources within, and taxes paid to, foreign countries or possessions of the United States are as follows:
| | Pay Date | Income | Taxes |
| Fidelity Overseas Fund | | | |
| Overseas | 12/11/17 | $0.6076 | $0.0566 |
| Class K | 12/11/17 | $0.6596 | $0.0566 |
|
The fund will notify shareholders in January 2019 of amounts for use in preparing 2018 income tax returns.
Board Approval of Investment Advisory Contracts
Fidelity Overseas Fund
At its July 2018 meeting, the Board of Trustees, including the Independent Trustees (together, the Board), voted to continue the management contract with Fidelity Management & Research Company (FMR) and the sub-advisory agreements (together, the Advisory Contracts) for the fund for six months through January 31, 2019, in connection with the reunification of the Fidelity Equity High Income Funds Board, which oversees the fund, and the Sector Portfolios Board.
The Board considered that the approval of the fund's Advisory Contracts will not result in any changes in (i) the investment process or strategies employed in the management of the fund's assets; (ii) the fees and expenses paid by shareholders; (iii) the nature, extent or quality of services provided under the fund's Advisory Contracts; or (iv) the day-to-day management of the fund or the persons primarily responsible for such management. The Board concluded that the fund's Advisory Contracts are fair and reasonable, and that the fund's Advisory Contracts should be renewed, without modification, through January 31, 2019, with the understanding that the Board will consider the annual renewal for a full one year period in January 2019.
In connection with its consideration of future renewals of the fund's Advisory Contracts, the Board will consider: (i) the nature, extent and quality of services provided to the fund, including shareholder and administrative services and investment performance; (ii) the competitiveness of the management fee and total expenses for the fund; (iii) the costs of the services and profitability, including the revenues earned and the expenses incurred in conducting the business of developing, marketing, distributing, managing, administering, and servicing the fund and its shareholders, to the extent applicable, as well as potential fall-out benefits from Fidelity's non-fund businesses; and (iv) whether there have been economies of scale in respect of the Fidelity funds, whether the Fidelity funds (including the fund) have appropriately benefited from any such economies of scale, and whether there is the potential for realization of any further economies.
Based on its evaluation of all of the conclusions noted above, and after considering all factors it believed relevant, the Board ultimately concluded that the fund's management fee structure is fair and reasonable, and that the continuation of the fund's Advisory Contracts should be approved.
Corporate Headquarters
245 Summer St.
Boston, MA 02210
www.fidelity.com
OVE-K-ANN-1218
1.863319.110
Fidelity Advisor® Worldwide Fund - Class A, Class M, Class C, Class I and Class Z
Annual Report October 31, 2018 Class A, Class M, Class C, Class I and Class Z are classes of Fidelity® Worldwide Fund |
|
Contents
To view a fund's proxy voting guidelines and proxy voting record for the 12-month period ended June 30, visit http://www.fidelity.com/proxyvotingresults or visit the Securities and Exchange Commission's (SEC) web site at http://www.sec.gov.
You may also call 1-877-208-0098 to request a free copy of the proxy voting guidelines.
Standard & Poor's, S&P and S&P 500 are registered service marks of The McGraw-Hill Companies, Inc. and have been licensed for use by Fidelity Distributors Corporation.
Other third-party marks appearing herein are the property of their respective owners.
All other marks appearing herein are registered or unregistered trademarks or service marks of FMR LLC or an affiliated company. © 2018 FMR LLC. All rights reserved.
This report and the financial statements contained herein are submitted for the general information of the shareholders of the Fund. This report is not authorized for distribution to prospective investors in the Fund unless preceded or accompanied by an effective prospectus.
A fund files its complete schedule of portfolio holdings with the SEC for the first and third quarters of each fiscal year on Form N-Q. Forms N-Q are available on the SEC’s web site at http://www.sec.gov. A fund's Forms N-Q may be reviewed and copied at the SEC’s Public Reference Room in Washington, DC. Information regarding the operation of the SEC's Public Reference Room may be obtained by calling 1-800-SEC-0330.
For a complete list of a fund's portfolio holdings, view the most recent holdings listing, semiannual report, or annual report on Fidelity's web site at http://www.fidelity.com, http://www.institutional.fidelity.com, or http://www.401k.com, as applicable.
NOT FDIC INSURED •MAY LOSE VALUE •NO BANK GUARANTEE
Neither the Fund nor Fidelity Distributors Corporation is a bank.
Performance: The Bottom Line
Average annual total return reflects the change in the value of an investment, assuming reinvestment of distributions from dividend income and capital gains (the profits earned upon the sale of securities that have grown in value, if any) and assuming a constant rate of performance each year. The hypothetical investment and the average annual total returns do not reflect the deduction of taxes that a shareholder would pay on fund distributions or the redemption of fund shares. During periods of reimbursement by Fidelity, a fund’s total return will be greater than it would be had the reimbursement not occurred. How a fund did yesterday is no guarantee of how it will do tomorrow.
Average Annual Total Returns
| For the periods ended October 31, 2018 | Past 1 year | Past 5 years | Past 10 years |
| Class A (incl. 5.75% sales charge) | (2.02)% | 5.93% | 10.06% |
| Class M (incl. 3.50% sales charge) | 0.02% | 6.12% | 10.02% |
| Class C (incl. contingent deferred sales charge) | 2.15% | 6.37% | 9.90% |
| Class I | 4.22% | 7.49% | 11.00% |
| Class Z | 4.26% | 7.50% | 11.01% |
Class A shares bear a 0.25% 12b-1 fee. The initial offering of Class A shares took place on February 19, 2009. Returns prior to February 19, 2009, are those of Fidelity® Worldwide Fund, the original class of the fund, which has no 12b-1 fee. Had Class A's 12b-1 fee been reflected, returns prior to February 19, 2009, would have been lower.
Class M shares bear a 0.50% 12b-1 fee. The initial offering of Class M shares took place on February 19, 2009. Returns prior to February 19, 2009, are those of Fidelity® Worldwide Fund, the original class of the fund, which has no 12b-1 fee. Had Class M's 12b-1 fee been reflected, returns prior to February 19, 2009, would have been lower.
Class C shares bear a 1.00% 12b-1 fee. The initial offering of Class C shares took place on February 19, 2009. Returns prior to February 19, 2009, are those of Fidelity® Worldwide Fund, the original class of the fund, which has no 12b-1 fee. Had Class C's 12b-1 fee been reflected, returns prior to February 19, 2009, would have been lower.
Class C shares' contingent deferred sales charges included in the past one year, past five years and past ten years total return figures are 1%, 0% and 0%, respectively.
The initial offering of Class I shares took place on February 19, 2009. Returns prior to February 19, 2009 are those of Fidelity® Worldwide Fund, the original class of the fund.
The initial offering of Class Z shares took place on October 2, 2018. Returns prior to October 2, 2018, are those of Class I. Returns between February 19, 2009 and October 2, 2018, are those of Class I. Returns prior to February 19, 2009, are those of the Fidelity® Worldwide Fund, the original class of the fund.
$10,000 Over 10 Years
Let's say hypothetically that $10,000 was invested in Fidelity Advisor® Worldwide Fund - Class A on October 31, 2008, and the current 5.75% sales charge was paid.
The chart shows how the value of your investment would have changed, and also shows how the MSCI World Index performed over the same period.
See above for additional information regarding the performance of Class A.
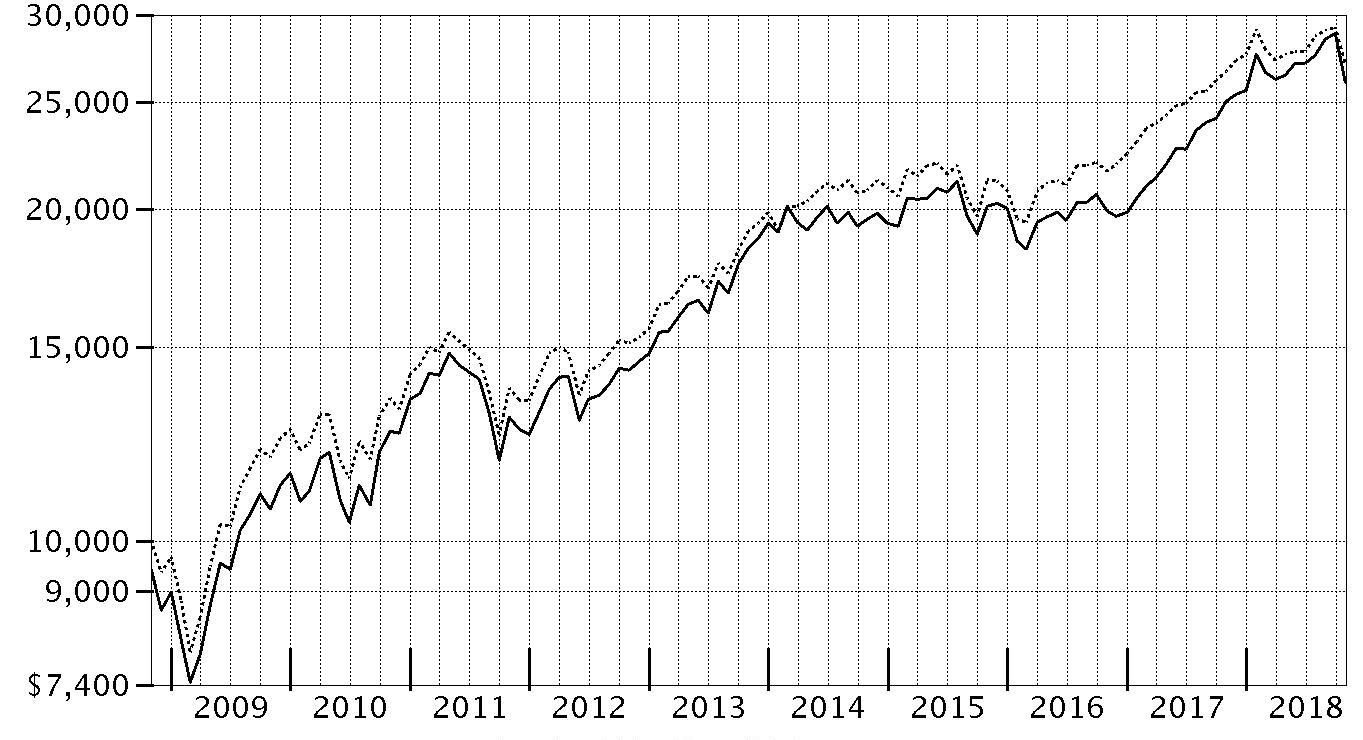
| Period Ending Values |
| $26,071 | Fidelity Advisor® Worldwide Fund - Class A |
| $27,101 | MSCI World Index |
Management's Discussion of Fund Performance
Market Recap: Global equities returned -0.14% for the 12 months ending October 31, 2018, according to the MSCI ACWI (All Country World Index) Index. A modestly positive first half of the period gave way to a confluence of negative factors – including escalating trade tension, a surging U.S. dollar, tepid economic growth in Europe, global central bank tightening, concerns about Italy’s budget stalemate with the EU, and weakness in China’s stock market – that yielded a -4% second-half return. The index lost 7.5% in October alone, its largest monthly drop in more than six years. Among sectors, economically sensitive materials (-8%), financials (-6%) and industrials (-5%) stocks suffered from concerns about slowing growth in some key markets. Rising interest rates in the U.S. exerted pressure on real estate (-4%) and utilities (-2%). Conversely, information technology (+9%) benefited from better-than-expected earnings from some major index constituents. Stable profit growth helped health care (+8%) perform well, while elevated crude-oil prices supported energy (+5%). Regionally, emerging markets (-12%) fared the worst, hampered by the impact of foreign exchange and concerns about economic weakness in China, India and South Korea. Sluggish growth pressured shares in continental Europe (-9%). Stocks in Japan (-3%) and the U.K. (-4%) held up better, followed by Canada (-5%) and Asia-Pacific ex Japan (-6%). The U.S. (+7%) was the only region with a positive return, helped by steady economic and corporate profit growth.
Comments from William Kennedy, Lead Portfolio Manager and manager of the non-U.S. equity subportfolio, and Stephen DuFour, Co-Manager and manager of the U.S. equity subportfolio: For the fiscal year, the fund’s share classes (excluding sales charges, if applicable) gained about 4%, beating the 1.59% return of the benchmark MSCI World Index. Stock picks in the U.S. and the top-performing information technology sector gave the biggest boost by far to relative performance. Security selection in the financials and industrials sectors also helped. Individual standouts included U.S.-based software & services companies Square, which does payments processing; Adobe, which focuses on desktop publishing; and Intuit, known for its Quickbooks
® bookkeeping and TurboTax
® tax preparation products. Elsewhere, shares of U.S.-based health insurer Humana benefited from the company’s exposure to Medicare supplement plans. Cost controls and favorable pricing trends also helped. Adobe, Intuit and Humana were top holdings and overweightings at period end. By contrast, a non-benchmark stake in emerging markets, along with stock picks in consumer discretionary, consumer staples and communication services, hindered relative performance. Individual detractors included consumer technology leader Apple and discount retailing giant Walmart, largely because the fund was underexposed to each when the stock rallied most. The fund did not own Walmart at period end.
The views expressed above reflect those of the portfolio manager(s) only through the end of the period as stated on the cover of this report and do not necessarily represent the views of Fidelity or any other person in the Fidelity organization. Any such views are subject to change at any time based upon market or other conditions and Fidelity disclaims any responsibility to update such views. These views may not be relied on as investment advice and, because investment decisions for a Fidelity fund are based on numerous factors, may not be relied on as an indication of trading intent on behalf of any Fidelity fund.
Investment Summary (Unaudited)
Geographic Diversification (% of fund's net assets)
| As of October 31, 2018 |
| | United States of America* | 62.9% |
| | Japan | 6.4% |
| | United Kingdom | 6.4% |
| | Germany | 4.0% |
| | Switzerland | 3.2% |
| | France | 3.0% |
| | Ireland | 2.2% |
| | Netherlands | 2.0% |
| | Spain | 1.4% |
| | Other | 8.5% |

* Includes Short-Term investments and Net Other Assets (Liabilities).
Percentages are based on country or territory of incorporation and are adjusted for the effect of futures contracts, if applicable.
Asset Allocation as of October 31, 2018
| | % of fund's net assets |
| Stocks and Equity Futures | 91.4 |
| Short-Term Investments and Net Other Assets (Liabilities) | 8.6 |
Top Ten Stocks as of October 31, 2018
| | % of fund's net assets |
| AstraZeneca PLC (United Kingdom, Pharmaceuticals) | 3.1 |
| Microsoft Corp. (United States of America, Software) | 3.0 |
| Humana, Inc. (United States of America, Health Care Providers & Services) | 3.0 |
| PayPal Holdings, Inc. (United States of America, IT Services) | 2.9 |
| Adobe, Inc. (United States of America, Software) | 2.9 |
| Intuit, Inc. (United States of America, Software) | 2.9 |
| Amazon.com, Inc. (United States of America, Internet & Direct Marketing Retail) | 2.9 |
| Apple, Inc. (United States of America, Technology Hardware, Storage & Peripherals) | 2.9 |
| MasterCard, Inc. Class A (United States of America, IT Services) | 2.6 |
| Visa, Inc. Class A (United States of America, IT Services) | 2.4 |
| | 28.6 |
Top Market Sectors as of October 31, 2018
| | % of fund's net assets |
| Information Technology | 28.0 |
| Health Care | 19.8 |
| Consumer Discretionary | 8.8 |
| Industrials | 7.7 |
| Financials | 7.6 |
| Consumer Staples | 5.3 |
| Energy | 4.7 |
| Real Estate | 2.8 |
| Communication Services | 2.7 |
| Materials | 1.6 |
Schedule of Investments October 31, 2018
Showing Percentage of Net Assets
| Common Stocks - 90.4% | | | |
| | | Shares | Value |
| Australia - 0.4% | | | |
| Bapcor Ltd. (a) | | 831,321 | $4,020,821 |
| Blue Sky Alternative Investments Ltd.(b) | | 254,244 | 217,852 |
| Inghams Group Ltd. (a) | | 513,123 | 1,417,135 |
| Magellan Financial Group Ltd. | | 81,493 | 1,537,375 |
| National Storage (REIT) unit | | 1,830,453 | 2,210,081 |
| Rio Tinto Ltd. | | 263 | 14,229 |
|
| TOTAL AUSTRALIA | | | 9,417,493 |
|
| Austria - 0.6% | | | |
| Erste Group Bank AG | | 167,900 | 6,846,190 |
| Wienerberger AG | | 252,200 | 5,804,496 |
|
| TOTAL AUSTRIA | | | 12,650,686 |
|
| Bailiwick of Jersey - 0.1% | | | |
| Glencore Xstrata PLC | | 405,468 | 1,652,501 |
| Belgium - 0.4% | | | |
| KBC Groep NV | | 125,664 | 8,668,100 |
| Bermuda - 0.2% | | | |
| Hiscox Ltd. | | 258,027 | 5,369,309 |
| Canada - 1.1% | | | |
| Alimentation Couche-Tard, Inc. Class B (sub. vtg.) | | 95,000 | 4,536,936 |
| Cenovus Energy, Inc. (Canada) | | 228,100 | 1,930,217 |
| Constellation Software, Inc. | | 6,200 | 4,266,977 |
| Shopify, Inc. (a)(b) | | 48,000 | 6,631,200 |
| Suncor Energy, Inc. | | 209,700 | 7,034,336 |
|
| TOTAL CANADA | | | 24,399,666 |
|
| Cayman Islands - 0.4% | | | |
| Alibaba Group Holding Ltd. sponsored ADR (b) | | 27,400 | 3,898,472 |
| ENN Energy Holdings Ltd. | | 301,500 | 2,562,497 |
| Meituan Dianping Class B | | 369,166 | 2,148,068 |
|
| TOTAL CAYMAN ISLANDS | | | 8,609,037 |
|
| China - 0.1% | | | |
| Qingdao Port International Co. Ltd. (b)(c) | | 876,000 | 513,852 |
| Shanghai International Airport Co. Ltd. (A Shares) | | 212,329 | 1,508,232 |
|
| TOTAL CHINA | | | 2,022,084 |
|
| Denmark - 0.5% | | | |
| Netcompany Group A/S | | 83,500 | 2,761,614 |
| NNIT A/S (c) | | 150,414 | 4,247,370 |
| Novo Nordisk A/S Series B | | 67,280 | 2,905,592 |
| Novozymes A/S Series B | | 25,100 | 1,240,348 |
|
| TOTAL DENMARK | | | 11,154,924 |
|
| Finland - 0.1% | | | |
| Sampo Oyj (A Shares) | | 72,300 | 3,329,672 |
| France - 3.0% | | | |
| ALTEN | | 29,500 | 2,845,132 |
| Capgemini SA | | 63,400 | 7,755,481 |
| Cegedim SA (b) | | 39,210 | 981,488 |
| Elis SA | | 152,000 | 3,069,663 |
| LVMH Moet Hennessy - Louis Vuitton SA | | 22,839 | 6,929,477 |
| Sartorius Stedim Biotech | | 25,200 | 3,128,289 |
| SMCP S.A.S. (c) | | 47,694 | 1,129,031 |
| Societe Generale Series A | | 131,500 | 4,820,494 |
| Thales SA | | 38,700 | 4,953,192 |
| Total SA (a) | | 362,209 | 21,252,767 |
| VINCI SA (a) | | 107,600 | 9,576,332 |
|
| TOTAL FRANCE | | | 66,441,346 |
|
| Germany - 4.0% | | | |
| adidas AG | | 41,769 | 9,840,409 |
| Akasol AG | | 27,300 | 1,260,045 |
| Allianz SE | | 36,000 | 7,499,519 |
| Aumann AG (c) | | 8,815 | 435,316 |
| Deutsche Borse AG | | 9,362 | 1,183,100 |
| Deutsche Post AG | | 210,575 | 6,648,963 |
| Fresenius SE & Co. KGaA | | 112,600 | 7,156,386 |
| Instone Real Estate Group BV (c) | | 74,900 | 1,756,943 |
| JOST Werke AG (c) | | 14,800 | 516,307 |
| Linde PLC | | 49,434 | 8,110,357 |
| MTU Aero Engines Holdings AG | | 35,800 | 7,615,078 |
| Muenchener Rueckversicherungs AG | | 16,500 | 3,549,923 |
| Nexus AG | | 46,000 | 1,255,656 |
| Rational AG | | 3,670 | 2,128,295 |
| Rheinmetall AG | | 25,100 | 2,175,995 |
| SAP SE | | 147,484 | 15,791,627 |
| Vonovia SE | | 90,900 | 4,161,558 |
| WashTec AG | | 65,318 | 5,038,204 |
| Wirecard AG | | 23,000 | 4,308,827 |
|
| TOTAL GERMANY | | | 90,432,508 |
|
| Greece - 0.0% | | | |
| Ff Group (b)(d) | | 59,300 | 257,918 |
| Hong Kong - 0.4% | | | |
| AIA Group Ltd. | | 1,060,200 | 8,023,881 |
| Techtronic Industries Co. Ltd. | | 231,000 | 1,081,070 |
|
| TOTAL HONG KONG | | | 9,104,951 |
|
| India - 1.2% | | | |
| Avenue Supermarts Ltd. (b)(c) | | 1,642 | 29,704 |
| HDFC Bank Ltd. | | 149,162 | 3,872,285 |
| HDFC Bank Ltd. sponsored ADR | | 79,793 | 7,094,396 |
| Housing Development Finance Corp. Ltd. | | 299,294 | 7,159,626 |
| Lupin Ltd. (b) | | 1,335 | 15,983 |
| Sunteck Realty Ltd. (b) | | 304,120 | 1,332,889 |
| TCNS Clothing Co. Ltd. (b) | | 208,823 | 1,744,897 |
| V-Mart Retail Ltd. (b) | | 153,431 | 5,007,771 |
|
| TOTAL INDIA | | | 26,257,551 |
|
| Indonesia - 0.0% | | | |
| PT Kino Indonesia Tbk | | 234,500 | 31,467 |
| Ireland - 2.2% | | | |
| Accenture PLC Class A | | 108,000 | 17,022,960 |
| Alkermes PLC (b) | | 43,100 | 1,759,773 |
| Cairn Homes PLC (b) | | 2,774,039 | 4,455,378 |
| CRH PLC | | 82,065 | 2,447,850 |
| Dalata Hotel Group PLC | | 476,400 | 2,951,582 |
| DCC PLC (United Kingdom) | | 16,000 | 1,373,298 |
| Glenveagh Properties PLC (c) | | 1,327,224 | 1,256,742 |
| Green REIT PLC | | 621,300 | 1,026,017 |
| Greencore Group PLC | | 372,815 | 901,599 |
| Kerry Group PLC Class A | | 42,100 | 4,315,453 |
| Perrigo Co. PLC | | 82,000 | 5,764,600 |
| Ryanair Holdings PLC sponsored ADR (b) | | 31,670 | 2,622,276 |
| United Drug PLC (United Kingdom) | | 330,700 | 2,671,469 |
|
| TOTAL IRELAND | | | 48,568,997 |
|
| Italy - 0.3% | | | |
| Prada SpA | | 387,500 | 1,368,760 |
| Recordati SpA | | 134,100 | 4,544,500 |
|
| TOTAL ITALY | | | 5,913,260 |
|
| Japan - 5.4% | | | |
| A/S One Corp. | | 87,200 | 6,197,935 |
| AEON Financial Service Co. Ltd. | | 142,200 | 2,792,708 |
| Ain Holdings, Inc. | | 51,100 | 4,003,403 |
| Daiichikosho Co. Ltd. | | 62,500 | 2,880,312 |
| Hoya Corp. | | 148,000 | 8,412,922 |
| Keyence Corp. | | 10,220 | 5,008,783 |
| Mercari, Inc. (a)(b) | | 16,300 | 412,574 |
| Minebea Mitsumi, Inc. | | 283,600 | 4,338,520 |
| Misumi Group, Inc. | | 64,700 | 1,299,333 |
| Mitsubishi UFJ Financial Group, Inc. | | 946,000 | 5,725,658 |
| Monex Group, Inc. (a) | | 297,500 | 1,173,284 |
| Morinaga & Co. Ltd. | | 37,000 | 1,487,083 |
| Murata Manufacturing Co. Ltd. | | 17,600 | 2,677,396 |
| Nidec Corp. | | 30,600 | 3,929,579 |
| Nitori Holdings Co. Ltd. | | 44,600 | 5,824,266 |
| ORIX Corp. | | 512,400 | 8,360,246 |
| PALTAC Corp. | | 43,700 | 2,230,797 |
| Panasonic Corp. | | 563,100 | 6,042,883 |
| Recruit Holdings Co. Ltd. | | 48,000 | 1,288,300 |
| Relo Group, Inc. | | 233,500 | 5,517,003 |
| Shiseido Co. Ltd. | | 20,900 | 1,318,696 |
| SMC Corp. | | 21,000 | 6,727,966 |
| SoftBank Corp. | | 75,200 | 5,951,239 |
| Sony Corp. | | 190,000 | 10,282,183 |
| Takeda Pharmaceutical Co. Ltd. | | 101,100 | 4,191,560 |
| Tsuruha Holdings, Inc. | | 43,200 | 4,502,433 |
| VT Holdings Co. Ltd. | | 31,200 | 129,960 |
| Welcia Holdings Co. Ltd. | | 149,000 | 7,606,151 |
| Zozo, Inc. | | 46,600 | 1,122,926 |
|
| TOTAL JAPAN | | | 121,436,099 |
|
| Kenya - 0.1% | | | |
| Safaricom Ltd. | | 6,251,600 | 1,423,601 |
| Korea (South) - 0.2% | | | |
| Cafe24 Corp. (b) | | 17,437 | 1,688,684 |
| Hyundai Fire & Marine Insurance Co. Ltd. | | 21,488 | 787,203 |
| KB Financial Group, Inc. | | 28,328 | 1,178,198 |
|
| TOTAL KOREA (SOUTH) | | | 3,654,085 |
|
| Netherlands - 2.0% | | | |
| Adyen BV (c) | | 10,328 | 6,680,733 |
| ASML Holding NV (Netherlands) | | 51,000 | 8,784,451 |
| Basic-Fit NV (b)(c) | | 37,100 | 1,069,442 |
| IMCD Group BV | | 69,800 | 4,739,585 |
| Koninklijke Philips Electronics NV | | 246,363 | 9,188,319 |
| Unilever NV (Certificaten Van Aandelen) (Bearer) | | 233,427 | 12,543,200 |
| uniQure B.V. (b) | | 63,330 | 1,629,481 |
| Van Lanschot NV (Bearer) | | 17,200 | 421,776 |
|
| TOTAL NETHERLANDS | | | 45,056,987 |
|
| New Zealand - 0.5% | | | |
| EBOS Group Ltd. | | 210,137 | 2,857,683 |
| Fisher & Paykel Healthcare Corp. | | 310,683 | 2,757,212 |
| Ryman Healthcare Group Ltd. | | 617,875 | 4,878,651 |
|
| TOTAL NEW ZEALAND | | | 10,493,546 |
|
| Norway - 0.9% | | | |
| Equinor ASA | | 813,780 | 21,170,366 |
| Philippines - 0.1% | | | |
| D&L Industries, Inc. | | 8,349,900 | 1,781,329 |
| Spain - 1.4% | | | |
| Aedas Homes SAU (c) | | 32,625 | 844,000 |
| Amadeus IT Holding SA Class A | | 50,600 | 4,079,475 |
| CaixaBank SA | | 2,857,984 | 11,565,436 |
| Grifols SA ADR | | 289,773 | 5,917,165 |
| Masmovil Ibercom SA (b) | | 48,541 | 6,300,704 |
| Neinor Homes SLU (b)(c) | | 66,100 | 1,063,128 |
| Prosegur Cash SA (c) | | 321,606 | 637,467 |
| Zardoya Otis SA | | 254,611 | 1,744,730 |
|
| TOTAL SPAIN | | | 32,152,105 |
|
| Sweden - 0.9% | | | |
| ASSA ABLOY AB (B Shares) | | 270,600 | 5,382,441 |
| HEXPOL AB (B Shares) | | 118,900 | 1,100,499 |
| Indutrade AB | | 183,500 | 4,403,447 |
| Saab AB (B Shares) | | 71,000 | 2,782,230 |
| Svenska Cellulosa AB (SCA) (B Shares) | | 345,500 | 3,270,322 |
| Telefonaktiebolaget LM Ericsson (B Shares) | | 389,700 | 3,393,024 |
|
| TOTAL SWEDEN | | | 20,331,963 |
|
| Switzerland - 3.2% | | | |
| Credit Suisse Group AG | | 202,397 | 2,646,071 |
| EDAG Engineering Group AG | | 77,800 | 1,543,865 |
| Forbo Holding AG (Reg.) | | 1,430 | 2,099,955 |
| Julius Baer Group Ltd. | | 80,910 | 3,689,883 |
| Kaba Holding AG (B Shares) (Reg.) | | 2,860 | 2,064,459 |
| Lonza Group AG | | 18,382 | 5,780,251 |
| Nestle SA (Reg. S) | | 252,910 | 21,351,448 |
| Partners Group Holding AG | | 9,582 | 6,826,277 |
| Roche Holding AG (participation certificate) | | 73,419 | 17,867,425 |
| Schindler Holding AG (participation certificate) | | 14,628 | 3,084,930 |
| UBS Group AG | | 333,980 | 4,672,371 |
|
| TOTAL SWITZERLAND | | | 71,626,935 |
|
| United Kingdom - 6.4% | | | |
| Anglo American PLC (United Kingdom) | | 93,759 | 2,007,606 |
| AstraZeneca PLC: | | | |
| (United Kingdom) | | 217,292 | 16,620,593 |
| sponsored ADR | | 1,349,000 | 52,314,220 |
| Beazley PLC | | 335,600 | 2,262,785 |
| BHP Billiton PLC | | 292,606 | 5,837,107 |
| Big Yellow Group PLC | | 199,900 | 2,203,793 |
| British American Tobacco PLC: | | | |
| (United Kingdom) | | 137,307 | 5,952,295 |
| sponsored ADR | | 27,000 | 1,171,800 |
| Bunzl PLC | | 238,676 | 7,050,299 |
| Compass Group PLC | | 240,242 | 4,728,991 |
| Conviviality PLC (d) | | 367,080 | 5 |
| Cranswick PLC | | 123,087 | 4,546,831 |
| Dechra Pharmaceuticals PLC | | 102,400 | 2,992,092 |
| Hilton Food Group PLC | | 374,800 | 4,417,020 |
| Hotel Chocolat Group Ltd. | | 603,300 | 2,101,351 |
| JTC PLC | | 342,900 | 1,468,288 |
| Keywords Studios PLC | | 49,300 | 863,309 |
| LivaNova PLC (b) | | 27,600 | 3,090,924 |
| London Stock Exchange Group PLC | | 87,381 | 4,819,441 |
| Melrose Industries PLC | | 612,285 | 1,319,893 |
| Micro Focus International PLC | | 257,130 | 3,986,085 |
| Moneysupermarket.com Group PLC | | 63 | 236 |
| NCC Group Ltd. | | 584,200 | 1,468,060 |
| Reckitt Benckiser Group PLC | | 24,576 | 1,987,316 |
| Rio Tinto PLC | | 82,090 | 3,985,533 |
| Senior Engineering Group PLC | | 499,600 | 1,743,347 |
| St. James's Place Capital PLC | | 156,533 | 2,027,816 |
| Standard Chartered PLC (United Kingdom) | | 4,920 | 34,557 |
| The Weir Group PLC | | 53,754 | 1,089,715 |
|
| TOTAL UNITED KINGDOM | | | 142,091,308 |
|
| United States of America - 54.3% | | | |
| Abbott Laboratories | | 209,000 | 14,408,460 |
| Activision Blizzard, Inc. | | 99,000 | 6,835,950 |
| Adobe, Inc. (b) | | 261,124 | 64,173,834 |
| Akcea Therapeutics, Inc. (b) | | 1,900 | 42,408 |
| Alliant Energy Corp. | | 42,000 | 1,805,160 |
| Alphabet, Inc. Class A (b) | | 30,500 | 33,262,690 |
| Amazon.com, Inc. (b) | | 40,000 | 63,920,400 |
| American Tower Corp. | | 72,000 | 11,218,320 |
| Anadarko Petroleum Corp. | | 48,000 | 2,553,600 |
| Apple, Inc. | | 291,000 | 63,688,260 |
| Bank of America Corp. | | 528,000 | 14,520,000 |
| Berry Petroleum Corp. | | 326,292 | 4,568,088 |
| bluebird bio, Inc. (b) | | 28,697 | 3,291,546 |
| Boston Scientific Corp. (b) | | 1,035,159 | 37,410,646 |
| Burlington Stores, Inc. (b) | | 95,000 | 16,291,550 |
| Cardlytics, Inc. (b) | | 50,000 | 1,058,000 |
| Centene Corp. (b) | | 44,000 | 5,734,080 |
| Charles Schwab Corp. | | 62,000 | 2,866,880 |
| ConocoPhillips Co. | | 390,600 | 27,302,940 |
| Crown Castle International Corp. | | 147,000 | 15,984,780 |
| CSX Corp. | | 226,000 | 15,562,360 |
| Domino's Pizza, Inc. | | 11,000 | 2,956,690 |
| Duke Energy Corp. | | 48,000 | 3,966,240 |
| Edison International | | 25,000 | 1,734,750 |
| Edwards Lifesciences Corp. (b) | | 11,000 | 1,623,600 |
| Eli Lilly & Co. | | 239,000 | 25,917,160 |
| EOG Resources, Inc. | | 88,000 | 9,269,920 |
| Estee Lauder Companies, Inc. Class A | | 102,000 | 14,018,880 |
| Etsy, Inc. (b) | | 16,000 | 680,320 |
| HCA Holdings, Inc. | | 119,000 | 15,890,070 |
| HealthSouth Corp. | | 2 | 135 |
| Henry Schein, Inc. (b) | | 25,000 | 2,075,000 |
| Humana, Inc. | | 209,000 | 66,965,690 |
| Intercept Pharmaceuticals, Inc. (b) | | 17,060 | 1,637,931 |
| International Flavors & Fragrances, Inc. (Israel) | | 15,856 | 2,289,409 |
| Intuit, Inc. | | 303,000 | 63,933,000 |
| Johnson & Johnson | | 157,000 | 21,978,430 |
| Lowe's Companies, Inc. | | 36,000 | 3,427,920 |
| Marsh & McLennan Companies, Inc. | | 46,200 | 3,915,450 |
| MasterCard, Inc. Class A | | 288,000 | 56,928,960 |
| Microsoft Corp. | | 637,000 | 68,037,963 |
| Moody's Corp. | | 47,000 | 6,837,560 |
| NextEra Energy, Inc. | | 30,000 | 5,175,000 |
| Norfolk Southern Corp. | | 165,000 | 27,691,950 |
| Northrop Grumman Corp. | | 11,000 | 2,881,450 |
| Oasis Petroleum, Inc. (b) | | 105,000 | 1,056,300 |
| OGE Energy Corp. | | 40,000 | 1,446,000 |
| OptiNose, Inc. (a) | | 49,900 | 527,942 |
| Parametric Technology Corp. (b) | | 503,000 | 41,452,230 |
| PayPal Holdings, Inc. (b) | | 764,000 | 64,321,160 |
| PPL Corp. | | 190,000 | 5,776,000 |
| Procter & Gamble Co. | | 135,000 | 11,971,800 |
| Prologis, Inc. | | 189,000 | 12,184,830 |
| S&P Global, Inc. | | 15,092 | 2,751,573 |
| Salesforce.com, Inc. (b) | | 230,000 | 31,565,200 |
| Sarepta Therapeutics, Inc. (b) | | 5,000 | 668,800 |
| Simon Property Group, Inc. | | 22,000 | 4,037,440 |
| Spirit Airlines, Inc. (b) | | 110,000 | 5,709,000 |
| Square, Inc. (b) | | 88,000 | 6,463,600 |
| SVB Financial Group (b) | | 14,000 | 3,321,220 |
| T-Mobile U.S., Inc. (b) | | 36,000 | 2,467,800 |
| The AES Corp. | | 80,000 | 1,166,400 |
| The Coca-Cola Co. | | 195,000 | 9,336,600 |
| TJX Companies, Inc. | | 103,000 | 11,317,640 |
| Ulta Beauty, Inc. (b) | | 22,000 | 6,039,440 |
| Union Pacific Corp. | | 167,000 | 24,418,740 |
| UnitedHealth Group, Inc. | | 203,000 | 53,054,050 |
| VF Corp. | | 119,000 | 9,862,720 |
| Visa, Inc. Class A | | 393,000 | 54,175,050 |
| WEC Energy Group, Inc. | | 44,000 | 3,009,600 |
| Wellcare Health Plans, Inc. (b) | | 19,000 | 5,243,810 |
| Whiting Petroleum Corp. (b) | | 324,000 | 12,085,200 |
| Xcel Energy, Inc. | | 55,000 | 2,695,550 |
| Zoetis, Inc. Class A | | 45,000 | 4,056,750 |
| Zuora, Inc. | | 195,000 | 3,981,900 |
|
| TOTAL UNITED STATES OF AMERICA | | | 1,212,497,775 |
|
| TOTAL COMMON STOCKS | | | |
| (Cost $1,748,100,603) | | | 2,017,997,569 |
| | | Principal Amount | Value |
|
| Government Obligations - 0.0% | | | |
| United States of America - 0.0% | | | |
| U.S. Treasury Bills, yield at date of purchase 1.99% to 2.3% 11/1/18 to 1/31/19(e) | | | |
| (Cost $866,748) | | 870,000 | 866,754 |
| | | Shares | Value |
|
| Money Market Funds - 10.0% | | | |
| Fidelity Cash Central Fund, 2.23% (f) | | 215,829,130 | 215,872,296 |
| Fidelity Securities Lending Cash Central Fund 2.23% (f)(g) | | 6,958,997 | 6,959,693 |
| TOTAL MONEY MARKET FUNDS | | | |
| (Cost $222,831,574) | | | 222,831,989 |
| TOTAL INVESTMENT IN SECURITIES - 100.4% | | | |
| (Cost $1,971,798,925) | | | 2,241,696,312 |
| NET OTHER ASSETS (LIABILITIES) - (0.4)% | | | (9,021,010) |
| NET ASSETS - 100% | | | $2,232,675,302 |
| Futures Contracts | | | | | |
| | Number of contracts | Expiration Date | Notional Amount | Value | Unrealized Appreciation/(Depreciation) |
| Purchased | | | | | |
| Equity Index Contracts | | | | | |
| TSE TOPIX Index Contracts (Japan) | 150 | Dec. 2018 | $21,815,040 | $(459,866) | $(459,866) |
The notional amount of futures purchased as a percentage of Net Assets is 1.0%
Categorizations in the Schedule of Investments are based on country or territory of incorporation.
Legend
(a) Security or a portion of the security is on loan at period end.
(b) Non-income producing
(c) Security exempt from registration under Rule 144A of the Securities Act of 1933. These securities may be resold in transactions exempt from registration, normally to qualified institutional buyers. At the end of the period, the value of these securities amounted to $20,180,035 or 0.9% of net assets.
(d) Level 3 security
(e) Security or a portion of the security was pledged to cover margin requirements for futures contracts. At period end, the value of securities pledged amounted to $866,754.
(f) Affiliated fund that is generally available only to investment companies and other accounts managed by Fidelity Investments. The rate quoted is the annualized seven-day yield of the fund at period end. A complete unaudited listing of the fund's holdings as of its most recent quarter end is available upon request. In addition, each Fidelity Central Fund's financial statements, which are not covered by the Fund's Report of Independent Registered Public Accounting Firm, are available on the SEC's website or upon request.
(g) Investment made with cash collateral received from securities on loan.
Affiliated Central Funds
Information regarding fiscal year to date income earned by the Fund from investments in Fidelity Central Funds is as follows:
| Fund | Income earned |
| Fidelity Cash Central Fund | $1,573,418 |
| Fidelity Securities Lending Cash Central Fund | 224,535 |
| Total | $1,797,953 |
Amounts in the income column in the above table include any capital gain distributions from underlying funds, which are presented in the corresponding line-item in the Statement of Operations if applicable.
Investment Valuation
The following is a summary of the inputs used, as of October 31, 2018, involving the Fund's assets and liabilities carried at fair value. The inputs or methodology used for valuing securities may not be an indication of the risk associated with investing in those securities. For more information on valuation inputs, and their aggregation into the levels used below, please refer to the Investment Valuation section in the accompanying Notes to Financial Statements.
| | Valuation Inputs at Reporting Date: |
| Description | Total | Level 1 | Level 2 | Level 3 |
| Investments in Securities: | | | | |
| Equities: | | | | |
| Communication Services | $59,122,296 | $53,171,057 | $5,951,239 | $-- |
| Consumer Discretionary | 197,687,596 | 172,027,067 | 25,402,611 | 257,918 |
| Consumer Staples | 119,518,902 | 76,365,942 | 43,152,955 | 5 |
| Energy | 108,223,734 | 86,970,967 | 21,252,767 | -- |
| Financials | 172,584,227 | 130,403,583 | 42,180,644 | -- |
| Health Care | 439,654,047 | 381,724,172 | 57,929,875 | -- |
| Industrials | 176,910,970 | 149,676,414 | 27,234,556 | -- |
| Information Technology | 619,792,975 | 587,837,788 | 31,955,187 | -- |
| Materials | 31,431,229 | 19,160,739 | 12,270,490 | -- |
| Real Estate | 63,734,396 | 63,734,396 | -- | -- |
| Utilities | 29,337,197 | 29,337,197 | -- | -- |
| Government Obligations | 866,754 | -- | 866,754 | -- |
| Money Market Funds | 222,831,989 | 222,831,989 | -- | -- |
| Total Investments in Securities: | $2,241,696,312 | $1,973,241,311 | $268,197,078 | $257,923 |
| Derivative Instruments: | | | | |
| Liabilities | | | | |
| Futures Contracts | $(459,866) | $(459,866) | $-- | $-- |
| Total Liabilities | $(459,866) | $(459,866) | $-- | $-- |
| Total Derivative Instruments: | $(459,866) | $(459,866) | $-- | $-- |
The following is a summary of transfers between Level 1 and Level 2 for the period ended October 31, 2018. Transfers are assumed to have occurred at the beginning of the period, and are primarily attributable to the valuation techniques used for foreign equity securities, as discussed in the accompanying Notes to Financial Statements:
| Transfers | Total |
| Level 1 to Level 2 | $28,844,041 |
| Level 2 to Level 1 | $68,027,571 |
Value of Derivative Instruments
The following table is a summary of the Fund's value of derivative instruments by primary risk exposure as of October 31, 2018. For additional information on derivative instruments, please refer to the Derivative Instruments section in the accompanying Notes to Financial Statements.
| Primary Risk Exposure / Derivative Type | Value |
| | Asset | Liability |
| Equity Risk | | |
| Futures Contracts(a) | $0 | $(459,866) |
| Total Equity Risk | 0 | (459,866) |
| Total Value of Derivatives | $0 | $(459,866) |
(a) Reflects gross cumulative appreciation (depreciation) on futures contracts as presented in the Schedule of Investments. In the Statement of Assets and Liabilities, the period end daily variation margin is included in receivable or payable for daily variation margin on futures contracts, and the net cumulative appreciation (depreciation) is included in net unrealized appreciation (depreciation).
See accompanying notes which are an integral part of the financial statements.
Financial Statements
Statement of Assets and Liabilities
| | | October 31, 2018 |
| Assets | | |
Investment in securities, at value (including securities loaned of $6,843,918) — See accompanying schedule:
Unaffiliated issuers (cost $1,748,967,351) | $2,018,864,323 | |
| Fidelity Central Funds (cost $222,831,574) | 222,831,989 | |
| Total Investment in Securities (cost $1,971,798,925) | | $2,241,696,312 |
| Cash | | 730,281 |
| Foreign currency held at value (cost $830,284) | | 830,229 |
| Receivable for investments sold | | 21,215,778 |
| Receivable for fund shares sold | | 155,368,742 |
| Dividends receivable | | 2,285,924 |
| Distributions receivable from Fidelity Central Funds | | 365,574 |
| Receivable for daily variation margin on futures contracts | | 412,106 |
| Prepaid expenses | | 3,760 |
| Other receivables | | 88,111 |
| Total assets | | 2,422,996,817 |
| Liabilities | | |
| Payable for investments purchased | $178,882,900 | |
| Payable for fund shares redeemed | 2,632,233 | |
| Accrued management fee | 1,259,109 | |
| Distribution and service plan fees payable | 25,423 | |
| Other affiliated payables | 426,697 | |
| Other payables and accrued expenses | 134,085 | |
| Collateral on securities loaned | 6,961,068 | |
| Total liabilities | | 190,321,515 |
| Net Assets | | $2,232,675,302 |
| Net Assets consist of: | | |
| Paid in capital | | $1,778,635,445 |
| Total distributable earnings (loss) | | 454,039,857 |
| Net Assets | | $2,232,675,302 |
| Net Asset Value and Maximum Offering Price | | |
| Class A: | | |
| Net Asset Value and redemption price per share ($42,947,324 ÷ 1,616,663 shares) | | $26.57 |
| Maximum offering price per share (100/94.25 of $26.57) | | $28.19 |
| Class M: | | |
| Net Asset Value and redemption price per share ($12,745,920 ÷ 482,949 shares) | | $26.39 |
| Maximum offering price per share (100/96.50 of $26.39) | | $27.35 |
| Class C: | | |
| Net Asset Value and offering price per share ($12,744,228 ÷ 493,499 shares)(a) | | $25.82 |
| Worldwide: | | |
| Net Asset Value, offering price and redemption price per share ($2,112,987,719 ÷ 78,535,889 shares) | | $26.90 |
| Class I: | | |
| Net Asset Value, offering price and redemption price per share ($50,956,460 ÷ 1,903,294 shares) | | $26.77 |
| Class Z: | | |
| Net Asset Value, offering price and redemption price per share ($293,651 ÷ 10,966 shares) | | $26.78 |
(a) Redemption price per share is equal to net asset value less any applicable contingent deferred sales charge.
See accompanying notes which are an integral part of the financial statements.
Statement of Operations
| | | Year ended October 31, 2018 |
| Investment Income | | |
| Dividends | | $26,106,788 |
| Interest | | 8,153 |
| Income from Fidelity Central Funds | | 1,797,953 |
| Income before foreign taxes withheld | | 27,912,894 |
| Less foreign taxes withheld | | (1,526,321) |
| Total income | | 26,386,573 |
| Expenses | | |
| Management fee | | |
| Basic fee | $13,062,946 | |
| Performance adjustment | 940,052 | |
| Transfer agent fees | 3,598,353 | |
| Distribution and service plan fees | 268,610 | |
| Accounting and security lending fees | 600,318 | |
| Custodian fees and expenses | 182,519 | |
| Independent trustees' fees and expenses | 9,603 | |
| Registration fees | 144,714 | |
| Audit | 68,145 | |
| Legal | 15,481 | |
| Miscellaneous | 12,455 | |
| Total expenses before reductions | 18,903,196 | |
| Expense reductions | (222,036) | |
| Total expenses after reductions | | 18,681,160 |
| Net investment income (loss) | | 7,705,413 |
| Realized and Unrealized Gain (Loss) | | |
| Net realized gain (loss) on: | | |
| Investment securities: | | |
| Unaffiliated issuers | 203,225,468 | |
| Fidelity Central Funds | (191) | |
| Foreign currency transactions | 34,397 | |
| Futures contracts | (106,946) | |
| Total net realized gain (loss) | | 203,152,728 |
| Change in net unrealized appreciation (depreciation) on: | | |
| Investment securities: | | |
| Unaffiliated issuers (net of decrease in deferred foreign taxes of $79,392) | (147,849,880) | |
| Fidelity Central Funds | 12 | |
| Assets and liabilities in foreign currencies | (30,284) | |
| Futures contracts | (1,184,759) | |
| Total change in net unrealized appreciation (depreciation) | | (149,064,911) |
| Net gain (loss) | | 54,087,817 |
| Net increase (decrease) in net assets resulting from operations | | $61,793,230 |
See accompanying notes which are an integral part of the financial statements.
Statement of Changes in Net Assets
| | Year ended October 31, 2018 | Year ended October 31, 2017 |
| Increase (Decrease) in Net Assets | | |
| Operations | | |
| Net investment income (loss) | $7,705,413 | $11,957,628 |
| Net realized gain (loss) | 203,152,728 | 144,161,836 |
| Change in net unrealized appreciation (depreciation) | (149,064,911) | 210,799,339 |
| Net increase (decrease) in net assets resulting from operations | 61,793,230 | 366,918,803 |
| Distributions to shareholders | (114,348,791) | – |
| Distributions to shareholders from net investment income | – | (12,665,638) |
| Distributions to shareholders from net realized gain | – | (4,590,871) |
| Total distributions | (114,348,791) | (17,256,509) |
| Share transactions - net increase (decrease) | 553,625,621 | (100,984,602) |
| Redemption fees | – | 2,108 |
| Total increase (decrease) in net assets | 501,070,060 | 248,679,800 |
| Net Assets | | |
| Beginning of period | 1,731,605,242 | 1,482,925,442 |
| End of period | $2,232,675,302 | $1,731,605,242 |
| Other Information | | |
| Undistributed net investment income end of period | | $9,622,281 |
See accompanying notes which are an integral part of the financial statements.
Financial Highlights
Fidelity Worldwide Fund Class A
| Years ended October 31, | 2018 | 2017 | 2016 | 2015 | 2014 |
| Selected Per–Share Data | | | | | |
| Net asset value, beginning of period | $27.28 | $21.83 | $22.88 | $24.64 | $25.18 |
| Income from Investment Operations | | | | | |
| Net investment income (loss)A | .03 | .11 | .12 | .06 | .02 |
| Net realized and unrealized gain (loss) | 1.00 | 5.53 | (.35) | .58 | 1.46 |
| Total from investment operations | 1.03 | 5.64 | (.23) | .64 | 1.48 |
| Distributions from net investment income | (.09) | (.12) | (.07) | – | (.04) |
| Distributions from net realized gain | (1.65) | (.07) | (.75) | (2.40) | (1.98) |
| Total distributions | (1.74) | (.19) | (.82) | (2.40) | (2.02) |
| Redemption fees added to paid in capitalA | – | –B | –B | –B | –B |
| Net asset value, end of period | $26.57 | $27.28 | $21.83 | $22.88 | $24.64 |
| Total ReturnC,D | 3.96% | 26.06% | (1.09)% | 2.73% | 6.29% |
| Ratios to Average Net AssetsE,F | | | | | |
| Expenses before reductions | 1.23% | 1.12% | 1.22% | 1.27% | 1.31% |
| Expenses net of fee waivers, if any | 1.23% | 1.12% | 1.22% | 1.26% | 1.31% |
| Expenses net of all reductions | 1.22% | 1.11% | 1.22% | 1.26% | 1.31% |
| Net investment income (loss) | .12% | .47% | .55% | .27% | .10% |
| Supplemental Data | | | | | |
| Net assets, end of period (000 omitted) | $42,947 | $32,823 | $29,052 | $31,043 | $33,788 |
| Portfolio turnover rateG | 117% | 111% | 117% | 151% | 163% |
A Calculated based on average shares outstanding during the period.
B Amount represents less than $.005 per share.
C Total returns would have been lower if certain expenses had not been reduced during the applicable periods shown.
D Total returns do not include the effect of the sales charges.
E Fees and expenses of any underlying Fidelity Central Funds are not included in the Fund's expense ratio. The Fund indirectly bears its proportionate share of the expenses of any underlying Fidelity Central Funds.
F Expense ratios reflect operating expenses of the class. Expenses before reductions do not reflect amounts reimbursed by the investment adviser or reductions from brokerage service arrangements or reductions from other expense offset arrangements and do not represent the amount paid by the class during periods when reimbursements or reductions occur. Expenses net of fee waivers reflect expenses after reimbursement by the investment adviser but prior to reductions from brokerage service arrangements or other expense offset arrangements. Expenses net of all reductions represent the net expenses paid by the class.
G Amount does not include the portfolio activity of any underlying Fidelity Central Funds.
See accompanying notes which are an integral part of the financial statements.
Fidelity Worldwide Fund Class M
| Years ended October 31, | 2018 | 2017 | 2016 | 2015 | 2014 |
| Selected Per–Share Data | | | | | |
| Net asset value, beginning of period | $27.11 | $21.67 | $22.72 | $24.49 | $25.05 |
| Income from Investment Operations | | | | | |
| Net investment income (loss)A | (.05) | .04 | .05 | (.01) | (.04) |
| Net realized and unrealized gain (loss) | 1.00 | 5.50 | (.35) | .57 | 1.46 |
| Total from investment operations | .95 | 5.54 | (.30) | .56 | 1.42 |
| Distributions from net investment income | (.02) | (.03) | –B | – | – |
| Distributions from net realized gain | (1.65) | (.07) | (.75) | (2.33) | (1.98) |
| Total distributions | (1.67) | (.10) | (.75) | (2.33) | (1.98) |
| Redemption fees added to paid in capitalA | – | –B | –B | –B | –B |
| Net asset value, end of period | $26.39 | $27.11 | $21.67 | $22.72 | $24.49 |
| Total ReturnC,D | 3.65% | 25.68% | (1.38)% | 2.36% | 6.05% |
| Ratios to Average Net AssetsE,F | | | | | |
| Expenses before reductions | 1.52% | 1.42% | 1.53% | 1.57% | 1.58% |
| Expenses net of fee waivers, if any | 1.52% | 1.42% | 1.52% | 1.56% | 1.58% |
| Expenses net of all reductions | 1.51% | 1.41% | 1.52% | 1.56% | 1.58% |
| Net investment income (loss) | (.17)% | .17% | .25% | (.04)% | (.17)% |
| Supplemental Data | | | | | |
| Net assets, end of period (000 omitted) | $12,746 | $10,634 | $9,270 | $13,055 | $12,160 |
| Portfolio turnover rateG | 117% | 111% | 117% | 151% | 163% |
A Calculated based on average shares outstanding during the period.
B Amount represents less than $.005 per share.
C Total returns would have been lower if certain expenses had not been reduced during the applicable periods shown.
D Total returns do not include the effect of the sales charges.
E Fees and expenses of any underlying Fidelity Central Funds are not included in the Fund's expense ratio. The Fund indirectly bears its proportionate share of the expenses of any underlying Fidelity Central Funds.
F Expense ratios reflect operating expenses of the class. Expenses before reductions do not reflect amounts reimbursed by the investment adviser or reductions from brokerage service arrangements or reductions from other expense offset arrangements and do not represent the amount paid by the class during periods when reimbursements or reductions occur. Expenses net of fee waivers reflect expenses after reimbursement by the investment adviser but prior to reductions from brokerage service arrangements or other expense offset arrangements. Expenses net of all reductions represent the net expenses paid by the class.
G Amount does not include the portfolio activity of any underlying Fidelity Central Funds.
See accompanying notes which are an integral part of the financial statements.
Fidelity Worldwide Fund Class C
| Years ended October 31, | 2018 | 2017 | 2016 | 2015 | 2014 |
| Selected Per–Share Data | | | | | |
| Net asset value, beginning of period | $26.67 | $21.33 | $22.48 | $24.12 | $24.78 |
| Income from Investment Operations | | | | | |
| Net investment income (loss)A | (.18) | (.07) | (.05) | (.12) | (.15) |
| Net realized and unrealized gain (loss) | .98 | 5.42 | (.35) | .57 | 1.44 |
| Total from investment operations | .80 | 5.35 | (.40) | .45 | 1.29 |
| Distributions from net investment income | – | – | – | – | – |
| Distributions from net realized gain | (1.65) | (.01) | (.75) | (2.09) | (1.95) |
| Total distributions | (1.65) | (.01) | (.75) | (2.09) | (1.95) |
| Redemption fees added to paid in capitalA | – | –B | –B | –B | –B |
| Net asset value, end of period | $25.82 | $26.67 | $21.33 | $22.48 | $24.12 |
| Total ReturnC,D | 3.12% | 25.10% | (1.88)% | 1.90% | 5.55% |
| Ratios to Average Net AssetsE,F | | | | | |
| Expenses before reductions | 2.01% | 1.89% | 2.01% | 2.07% | 2.04% |
| Expenses net of fee waivers, if any | 2.01% | 1.89% | 2.01% | 2.07% | 2.04% |
| Expenses net of all reductions | 2.00% | 1.88% | 2.00% | 2.06% | 2.03% |
| Net investment income (loss) | (.66)% | (.30)% | (.24)% | (.54)% | (.63)% |
| Supplemental Data | | | | | |
| Net assets, end of period (000 omitted) | $12,744 | $10,264 | $10,315 | $11,231 | $9,229 |
| Portfolio turnover rateG | 117% | 111% | 117% | 151% | 163% |
A Calculated based on average shares outstanding during the period.
B Amount represents less than $.005 per share.
C Total returns would have been lower if certain expenses had not been reduced during the applicable periods shown.
D Total returns do not include the effect of the contingent deferred sales charge.
E Fees and expenses of any underlying Fidelity Central Funds are not included in the Fund's expense ratio. The Fund indirectly bears its proportionate share of the expenses of any underlying Fidelity Central Funds.
F Expense ratios reflect operating expenses of the class. Expenses before reductions do not reflect amounts reimbursed by the investment adviser or reductions from brokerage service arrangements or reductions from other expense offset arrangements and do not represent the amount paid by the class during periods when reimbursements or reductions occur. Expenses net of fee waivers reflect expenses after reimbursement by the investment adviser but prior to reductions from brokerage service arrangements or other expense offset arrangements. Expenses net of all reductions represent the net expenses paid by the class.
G Amount does not include the portfolio activity of any underlying Fidelity Central Funds.
See accompanying notes which are an integral part of the financial statements.
Fidelity Worldwide Fund
| Years ended October 31, | 2018 | 2017 | 2016 | 2015 | 2014 |
| Selected Per–Share Data | | | | | |
| Net asset value, beginning of period | $27.61 | $22.09 | $23.14 | $24.92 | $25.41 |
| Income from Investment Operations | | | | | |
| Net investment income (loss)A | .11 | .19 | .19 | .13 | .11 |
| Net realized and unrealized gain (loss) | 1.00 | 5.60 | (.35) | .58 | 1.47 |
| Total from investment operations | 1.11 | 5.79 | (.16) | .71 | 1.58 |
| Distributions from net investment income | (.17) | (.20) | (.14) | (.08) | (.09) |
| Distributions from net realized gain | (1.65) | (.07) | (.75) | (2.41) | (1.98) |
| Total distributions | (1.82) | (.27) | (.89) | (2.49) | (2.07) |
| Redemption fees added to paid in capitalA | – | –B | –B | –B | –B |
| Net asset value, end of period | $26.90 | $27.61 | $22.09 | $23.14 | $24.92 |
| Total ReturnC | 4.23% | 26.49% | (.78)% | 3.01% | 6.64% |
| Ratios to Average Net AssetsD,E | | | | | |
| Expenses before reductions | .94% | .81% | .91% | .96% | .98% |
| Expenses net of fee waivers, if any | .94% | .81% | .91% | .96% | .97% |
| Expenses net of all reductions | .93% | .80% | .90% | .95% | .97% |
| Net investment income (loss) | .41% | .79% | .87% | .57% | .44% |
| Supplemental Data | | | | | |
| Net assets, end of period (000 omitted) | $2,112,988 | $1,656,173 | $1,421,364 | $1,543,516 | $1,535,658 |
| Portfolio turnover rateF | 117% | 111% | 117% | 151% | 163% |
A Calculated based on average shares outstanding during the period.
B Amount represents less than $.005 per share.
C Total returns would have been lower if certain expenses had not been reduced during the applicable periods shown.
D Fees and expenses of any underlying Fidelity Central Funds are not included in the Fund's expense ratio. The Fund indirectly bears its proportionate share of the expenses of any underlying Fidelity Central Funds.
E Expense ratios reflect operating expenses of the class. Expenses before reductions do not reflect amounts reimbursed by the investment adviser or reductions from brokerage service arrangements or reductions from other expense offset arrangements and do not represent the amount paid by the class during periods when reimbursements or reductions occur. Expenses net of fee waivers reflect expenses after reimbursement by the investment adviser but prior to reductions from brokerage service arrangements or other expense offset arrangements. Expenses net of all reductions represent the net expenses paid by the class.
F Amount does not include the portfolio activity of any underlying Fidelity Central Funds.
See accompanying notes which are an integral part of the financial statements.
Fidelity Worldwide Fund Class I
| Years ended October 31, | 2018 | 2017 | 2016 | 2015 | 2014 |
| Selected Per–Share Data | | | | | |
| Net asset value, beginning of period | $27.49 | $21.99 | $23.03 | $24.81 | $25.31 |
| Income from Investment Operations | | | | | |
| Net investment income (loss)A | .11 | .19 | .17 | .13 | .10 |
| Net realized and unrealized gain (loss) | .99 | 5.56 | (.35) | .58 | 1.47 |
| Total from investment operations | 1.10 | 5.75 | (.18) | .71 | 1.57 |
| Distributions from net investment income | (.18) | (.18) | (.11) | (.07) | (.09) |
| Distributions from net realized gain | (1.65) | (.07) | (.75) | (2.41) | (1.98) |
| Total distributions | (1.82)B | (.25) | (.86) | (2.49)C | (2.07) |
| Redemption fees added to paid in capitalA | – | –D | –D | –D | –D |
| Net asset value, end of period | $26.77 | $27.49 | $21.99 | $23.03 | $24.81 |
| Total ReturnE | 4.22% | 26.45% | (.86)% | 3.00% | 6.63% |
| Ratios to Average Net AssetsF,G | | | | | |
| Expenses before reductions | .96% | .83% | .99% | .98% | 1.01% |
| Expenses net of fee waivers, if any | .95% | .83% | .99% | .98% | 1.01% |
| Expenses net of all reductions | .94% | .82% | .98% | .97% | 1.00% |
| Net investment income (loss) | .40% | .77% | .78% | .55% | .40% |
| Supplemental Data | | | | | |
| Net assets, end of period (000 omitted) | $50,956 | $21,711 | $12,924 | $25,173 | $19,107 |
| Portfolio turnover rateH | 117% | 111% | 117% | 151% | 163% |
A Calculated based on average shares outstanding during the period.
B Total distributions of $1.82 per share is comprised of distributions from net investment income of $.176 and distributions from net realized gain of $1.648 per share.
C Total distributions of $2.49 per share is comprised of distributions from net investment income of $.074 and distributions from net realized gain of $2.413 per share.
D Amount represents less than $.005 per share.
E Total returns would have been lower if certain expenses had not been reduced during the applicable periods shown.
F Fees and expenses of any underlying Fidelity Central Funds are not included in the Fund's expense ratio. The Fund indirectly bears its proportionate share of the expenses of any underlying Fidelity Central Funds.
G Expense ratios reflect operating expenses of the class. Expenses before reductions do not reflect amounts reimbursed by the investment adviser or reductions from brokerage service arrangements or reductions from other expense offset arrangements and do not represent the amount paid by the class during periods when reimbursements or reductions occur. Expenses net of fee waivers reflect expenses after reimbursement by the investment adviser but prior to reductions from brokerage service arrangements or other expense offset arrangements. Expenses net of all reductions represent the net expenses paid by the class.
H Amount does not include the portfolio activity of any underlying Fidelity Central Funds.
See accompanying notes which are an integral part of the financial statements.
Fidelity Worldwide Fund Class Z
| Year ended October 31, | 2018 A |
| Selected Per–Share Data | |
| Net asset value, beginning of period | $29.54 |
| Income from Investment Operations | |
| Net investment income (loss)B | (.01) |
| Net realized and unrealized gain (loss) | (2.75) |
| Total from investment operations | (2.76) |
| Net asset value, end of period | $26.78 |
| Total ReturnC,D | (9.34)% |
| Ratios to Average Net AssetsE,F | |
| Expenses before reductions | .88%G |
| Expenses net of fee waivers, if any | .88%G |
| Expenses net of all reductions | .87%G |
| Net investment income (loss) | (.27)%G |
| Supplemental Data | |
| Net assets, end of period (000 omitted) | $294 |
| Portfolio turnover rateH | 117% |
A For the period October 2, 2018 (commencement of sale of shares) to October 31, 2018.
B Calculated based on average shares outstanding during the period.
C Total returns for periods of less than one year are not annualized.
D Total returns would have been lower if certain expenses had not been reduced during the applicable periods shown.
E Fees and expenses of any underlying Fidelity Central Funds are not included in the Fund's expense ratio. The Fund indirectly bears its proportionate share of the expenses of any underlying Fidelity Central Funds.
F Expense ratios reflect operating expenses of the class. Expenses before reductions do not reflect amounts reimbursed by the investment adviser or reductions from brokerage service arrangements or reductions from other expense offset arrangements and do not represent the amount paid by the class during periods when reimbursements or reductions occur. Expense ratios before reductions for start-up periods may not be representative of longer-term operating periods. Expenses net of fee waivers reflect expenses after reimbursement by the investment adviser but prior to reductions from brokerage service arrangements or other expense offset arrangements. Expenses net of all reductions represent the net expenses paid by the class.
G Annualized
H Amount does not include the portfolio activity of any underlying Fidelity Central Funds.
See accompanying notes which are an integral part of the financial statements.
Notes to Financial Statements
For the period ended October 31, 2018
1. Organization.
Fidelity Worldwide Fund (the Fund) is a fund of Fidelity Investment Trust (the Trust) and is authorized to issue an unlimited number of shares. The Trust is registered under the Investment Company Act of 1940, as amended (the 1940 Act), as an open-end management investment company organized as a Massachusetts business trust. The Fund commenced sale of Class Z shares on October 2, 2018. The Fund offers Class A, Class M, Class C, Worldwide, Class I and Class Z shares, each of which has equal rights as to assets and voting privileges. Each class has exclusive voting rights with respect to matters that affect that class.
2. Investments in Fidelity Central Funds.
The Fund invests in Fidelity Central Funds, which are open-end investment companies generally available only to other investment companies and accounts managed by the investment adviser and its affiliates. The Fund's Schedule of Investments lists each of the Fidelity Central Funds held as of period end, if any, as an investment of the Fund, but does not include the underlying holdings of each Fidelity Central Fund. As an Investing Fund, the Fund indirectly bears its proportionate share of the expenses of the underlying Fidelity Central Funds.
The Money Market Central Funds seek preservation of capital and current income and are managed by Fidelity Investments Money Management, Inc. (FIMM), an affiliate of the investment adviser. Annualized expenses of the Money Market Central Funds as of their most recent shareholder report date are less than .005%.
A complete unaudited list of holdings for each Fidelity Central Fund is available upon request or at the Securities and Exchange Commission (the SEC) website at www.sec.gov. In addition, the financial statements of the Fidelity Central Funds, which are not covered by the Fund's Report of Independent Registered Public Accounting Firm, are available on the SEC website or upon request.
3. Significant Accounting Policies.
The Fund is an investment company and applies the accounting and reporting guidance of the Financial Accounting Standards Board (FASB) Accounting Standards Codification Topic 946 Financial Services – Investments Companies. The financial statements have been prepared in conformity with accounting principles generally accepted in the United States of America (GAAP), which require management to make certain estimates and assumptions at the date of the financial statements. Actual results could differ from those estimates. Subsequent events, if any, through the date that the financial statements were issued have been evaluated in the preparation of the financial statements. The following summarizes the significant accounting policies of the Fund:
Investment Valuation. Investments are valued as of 4:00 p.m. Eastern time on the last calendar day of the period. The Board of Trustees (the Board) has delegated the day to day responsibility for the valuation of the Fund's investments to the Fair Value Committee (the Committee) established by the Fund's investment adviser. In accordance with valuation policies and procedures approved by the Board, the Fund attempts to obtain prices from one or more third party pricing vendors or brokers to value its investments. When current market prices, quotations or currency exchange rates are not readily available or reliable, investments will be fair valued in good faith by the Committee, in accordance with procedures adopted by the Board. Factors used in determining fair value vary by investment type and may include market or investment specific events, changes in interest rates and credit quality. The frequency with which these procedures are used cannot be predicted and they may be utilized to a significant extent. The Committee oversees the Fund's valuation policies and procedures and reports to the Board on the Committee's activities and fair value determinations. The Board monitors the appropriateness of the procedures used in valuing the Fund's investments and ratifies the fair value determinations of the Committee.
The Fund categorizes the inputs to valuation techniques used to value its investments into a disclosure hierarchy consisting of three levels as shown below:
- Level 1 – quoted prices in active markets for identical investments
- Level 2 – other significant observable inputs (including quoted prices for similar investments, interest rates, prepayment speeds, etc.)
- Level 3 – unobservable inputs (including the Fund's own assumptions based on the best information available)
Valuation techniques used to value the Fund's investments by major category are as follows:
Equity securities, including restricted securities, for which market quotations are readily available, are valued at the last reported sale price or official closing price as reported by a third party pricing vendor on the primary market or exchange on which they are traded and are categorized as Level 1 in the hierarchy. In the event there were no sales during the day or closing prices are not available, securities are valued at the last quoted bid price or may be valued using the last available price and are generally categorized as Level 2 in the hierarchy. For foreign equity securities, when market or security specific events arise, comparisons to the valuation of American Depositary Receipts (ADRs), futures contracts, Exchange-Traded Funds (ETFs) and certain indexes as well as quoted prices for similar securities may be used and would be categorized as Level 2 in the hierarchy. Utilizing these techniques may result in transfers between Level 1 and Level 2. For equity securities, including restricted securities, where observable inputs are limited, assumptions about market activity and risk are used and these securities may be categorized as Level 3 in the hierarchy.
Debt securities, including restricted securities, are valued based on evaluated prices received from third party pricing vendors or from brokers who make markets in such securities. U.S. government and government agency obligations are valued by pricing vendors who utilize matrix pricing which considers yield or price of bonds of comparable quality, coupon, maturity and type or by broker-supplied prices. When independent prices are unavailable or unreliable, debt securities may be valued utilizing pricing methodologies which consider similar factors that would be used by third party pricing vendors. Debt securities are generally categorized as Level 2 in the hierarchy but may be Level 3 depending on the circumstances.
Futures contracts are valued at the settlement price established each day by the board of trade or exchange on which they are traded and are categorized as Level 1 in the hierarchy. Investments in open-end mutual funds, including the Fidelity Central Funds, are valued at their closing net asset value (NAV) each business day and are categorized as Level 1 in the hierarchy.
Changes in valuation techniques may result in transfers in or out of an assigned level within the disclosure hierarchy. The aggregate value of investments by input level as of October 31, 2018, including information on transfers between Levels 1 and 2 is included at the end of the Fund's Schedule of Investments.
Foreign Currency. The Fund may use foreign currency contracts to facilitate transactions in foreign-denominated securities. Gains and losses from these transactions may arise from changes in the value of the foreign currency or if the counterparties do not perform under the contracts' terms.
Foreign-denominated assets, including investment securities, and liabilities are translated into U.S. dollars at the exchange rates at period end. Purchases and sales of investment securities, income and dividends received and expenses denominated in foreign currencies are translated into U.S. dollars at the exchange rate in effect on the transaction date.
The effects of exchange rate fluctuations on investments are included with the net realized and unrealized gain (loss) on investment securities. Other foreign currency transactions resulting in realized and unrealized gain (loss) are disclosed separately.
Investment Transactions and Income. For financial reporting purposes, the Fund's investment holdings and NAV include trades executed through the end of the last business day of the period. The NAV per share for processing shareholder transactions is calculated as of the close of business of the New York Stock Exchange (NYSE), normally 4:00 p.m. Eastern time and includes trades executed through the end of the prior business day. Gains and losses on securities sold are determined on the basis of identified cost and include proceeds received from litigation. Dividend income is recorded on the ex-dividend date, except for certain dividends from foreign securities where the ex-dividend date may have passed, which are recorded as soon as the Fund is informed of the ex-dividend date. Non-cash dividends included in dividend income, if any, are recorded at the fair market value of the securities received. Income and capital gain distributions from Fidelity Central Funds, if any, are recorded on the ex-dividend date. Certain distributions received by the Fund represent a return of capital or capital gain. The Fund determines the components of these distributions subsequent to the ex-dividend date, based upon receipt of tax filings or other correspondence relating to the underlying investment. These distributions are recorded as a reduction of cost of investments and/or as a realized gain. Interest income is accrued as earned and includes coupon interest and amortization of premium and accretion of discount on debt securities as applicable. Investment income is recorded net of foreign taxes withheld where recovery of such taxes is uncertain.
Class Allocations and Expenses. Investment income, realized and unrealized capital gains and losses, common expenses of the Fund, and certain fund-level expense reductions, if any, are allocated daily on a pro-rata basis to each class based on the relative net assets of each class to the total net assets of the Fund. Each class differs with respect to transfer agent and distribution and service plan fees incurred. Certain expense reductions may also differ by class. For the reporting period, the allocated portion of income and expenses to each class as a percent of its average net assets may vary due to the timing of recording these transactions in relation to fluctuating net assets of the classes. Expenses directly attributable to a fund are charged to that fund. Expenses attributable to more than one fund are allocated among the respective funds on the basis of relative net assets or other appropriate methods. Expense estimates are accrued in the period to which they relate and adjustments are made when actual amounts are known.
Income Tax Information and Distributions to Shareholders. Each year, the Fund intends to qualify as a regulated investment company under Subchapter M of the Internal Revenue Code, including distributing substantially all of its taxable income and realized gains. As a result, no provision for U.S. Federal income taxes is required. As of October 31, 2018, the Fund did not have any unrecognized tax benefits in the financial statements; nor is the Fund aware of any tax positions for which it is reasonably possible that the total amounts of unrecognized tax benefits will significantly change in the next twelve months. The Fund files a U.S. federal tax return, in addition to state and local tax returns as required. The Fund's federal income tax returns are subject to examination by the Internal Revenue Service (IRS) for a period of three fiscal years after they are filed. State and local tax returns may be subject to examination for an additional fiscal year depending on the jurisdiction. Foreign taxes are provided for based on the Fund's understanding of the tax rules and rates that exist in the foreign markets in which it invests. The Fund is subject to a tax imposed on capital gains by certain countries in which it invests. An estimated deferred tax liability for net unrealized appreciation on the applicable securities is included in Other payables and accrued expenses on the Statement of Assets & Liabilities.
Distributions are declared and recorded on the ex-dividend date. Income and capital gain distributions are declared separately for each class. Income and capital gain distributions are determined in accordance with income tax regulations, which may differ from GAAP. In addition, the Fund claimed a portion of the payment made to redeeming shareholders as a distribution for income tax purposes.
Capital accounts within the financial statements are adjusted for permanent book-tax differences. These adjustments have no impact on net assets or the results of operations. Capital accounts are not adjusted for temporary book-tax differences which will reverse in a subsequent period.
Book-tax differences are primarily due to foreign currency transactions, passive foreign investment companies (PFIC), market discount, partnerships, deferred trustees compensation and losses deferred due to wash sales.
As of period end, the cost and unrealized appreciation (depreciation) in securities, and derivatives if applicable, for federal income tax purposes were as follows:
| Gross unrealized appreciation | $338,922,735 |
| Gross unrealized depreciation | (73,945,366) |
| Net unrealized appreciation (depreciation) | $264,977,369 |
| Tax Cost | $1,976,259,077 |
The tax-based components of distributable earnings as of period end were as follows:
| Undistributed ordinary income | $4,538,868 |
| Undistributed long-term capital gain | $184,620,580 |
| Net unrealized appreciation (depreciation) on securities and other investments | $264,880,409 |
The tax character of distributions paid was as follows:
| | October 31, 2018 | October 31, 2017 |
| Ordinary Income | $10,719,882 | $ 17,256,509 |
| Long-term Capital Gains | 103,628,909 | – |
| Total | $114,348,791 | $ 17,256,509 |
Restricted Securities. The Fund may invest in securities that are subject to legal or contractual restrictions on resale. These securities generally may be resold in transactions exempt from registration or to the public if the securities are registered. Disposal of these securities may involve time-consuming negotiations and expense, and prompt sale at an acceptable price may be difficult. Information regarding restricted securities is included at the end of the Fund's Schedule of Investments.
New Rule Issuance. During August 2018, the U.S. Securities and Exchange Commission issued Final Rule Release No. 33-10532, Disclosure Update and Simplification. This Final Rule includes amendments specific to registered investment companies that are intended to eliminate overlap in disclosure requirements between Regulation S-X and GAAP. In accordance with these amendments, certain line-items in the Fund financial statements have been combined or removed for the current period as outlined in the table below.
| Financial Statement | Current Line-Item Presentation | Prior Line-Item Presentation |
| Statement of Assets and Liabilities | Total distributable earnings (loss) | Undistributed/Distributions in excess of/Accumulated net investment income (loss)
Accumulated/Undistributed net realized gain (loss)
Net unrealized appreciation (depreciation) |
| Statement of Changes in Net Assets | N/A - removed | Undistributed/Distributions in excess of/Accumulated net investment income (loss) end of period |
| Statement of Changes in Net Assets | Distributions to shareholders | Distributions to shareholders from net investment income
Distributions to shareholders from net realized gain |
| Distributions to Shareholders Note to Financial Statements | Distributions to shareholders | Distributions to shareholders from net investment income
Distributions to shareholders from net realized gain |
4. Derivative Instruments.
Risk Exposures and the Use of Derivative Instruments. The Fund's investment objective allows the Fund to enter into various types of derivative contracts, including futures contracts. Derivatives are investments whose value is primarily derived from underlying assets, indices or reference rates and may be transacted on an exchange or over-the-counter (OTC). Derivatives may involve a future commitment to buy or sell a specified asset based on specified terms, to exchange future cash flows at periodic intervals based on a notional principal amount, or for one party to make one or more payments upon the occurrence of specified events in exchange for periodic payments from the other party.
The Fund used derivatives to increase returns and to manage exposure to certain risks as defined below. The success of any strategy involving derivatives depends on analysis of numerous economic factors, and if the strategies for investment do not work as intended, the Fund may not achieve its objectives.
The Fund's use of derivatives increased or decreased its exposure to the following risk:
| Equity Risk | Equity risk relates to the fluctuations in the value of financial instruments as a result of changes in market prices (other than those arising from interest rate risk or foreign exchange risk), whether caused by factors specific to an individual investment, its issuer, or all factors affecting all instruments traded in a market or market segment.
|
The Fund is also exposed to additional risks from investing in derivatives, such as liquidity risk and counterparty credit risk. Liquidity risk is the risk that the Fund will be unable to close out the derivative in the open market in a timely manner. Counterparty credit risk is the risk that the counterparty will not be able to fulfill its obligation to the Fund. Counterparty credit risk related to exchange-traded futures contracts may be mitigated by the protection provided by the exchange on which they trade.
Investing in derivatives may involve greater risks than investing in the underlying assets directly and, to varying degrees, may involve risk of loss in excess of any initial investment and collateral received and amounts recognized in the Statement of Assets and Liabilities. In addition, there may be the risk that the change in value of the derivative contract does not correspond to the change in value of the underlying instrument.
Futures Contracts. A futures contract is an agreement between two parties to buy or sell a specified underlying instrument for a fixed price at a specified future date. The Fund used futures contracts to manage its exposure to the stock market.
Upon entering into a futures contract, a fund is required to deposit either cash or securities (initial margin) with a clearing broker in an amount equal to a certain percentage of the face value of the contract. Futures contracts are marked-to-market daily and subsequent daily payments (variation margin) are made or received by a fund depending on the daily fluctuations in the value of the futures contracts and are recorded as unrealized appreciation or (depreciation). This receivable and/or payable, if any, is included in daily variation margin on futures contracts in the Statement of Assets and Liabilities. Realized gain or (loss) is recorded upon the expiration or closing of a futures contract. The net realized gain (loss) and change in net unrealized appreciation (depreciation) on futures contracts during the period is presented in the Statement of Operations.
Any open futures contracts at period end are presented in the Schedule of Investments under the caption "Futures Contracts". The notional amount at value reflects each contract's exposure to the underlying instrument or index at period end and is representative of volume of activity during the period. Securities deposited to meet initial margin requirements are identified in the Schedule of Investments.
5. Purchases and Sales of Investments.
Purchases and sales of securities, other than short-term securities, aggregated $2,490,102,268 and $2,214,133,504, respectively.
6. Fees and Other Transactions with Affiliates.
Management Fee. Fidelity Management & Research Company (the investment adviser) and its affiliates provide the Fund with investment management related services for which the Fund pays a monthly management fee. The management fee is the sum of an individual fund fee rate that is based on an annual rate of .424% of the Fund's average net assets and an annualized group fee rate that averaged .24% during the period. The group fee rate is based upon the average net assets of all the mutual funds advised by the investment adviser, including any mutual funds previously advised by the investment adviser that are currently advised by Fidelity SelectCo, LLC, an affiliate of the investment adviser. The group fee rate decreases as assets under management increase and increases as assets under management decrease. In addition, the management fee is subject to a performance adjustment (up to a maximum of +/- .20% of the Fund's average net assets over a 36 month performance period). The upward or downward adjustment to the management fee is based on the relative investment performance of Worldwide as compared to its benchmark index, the MSCI World Index, over the same 36 month performance period. For the reporting period, the total annual management fee rate, including the performance adjustment, was .71% of the Fund's average net assets. The performance adjustment included in the management fee rate may be higher or lower than the maximum performance adjustment rate due to the difference between the average net assets for the reporting and performance periods.
Distribution and Service Plan Fees. In accordance with Rule 12b-1 of the 1940 Act, the Fund has adopted separate Distribution and Service Plans for each class of shares. Certain classes pay Fidelity Distributors Corporation (FDC), an affiliate of the investment adviser, separate Distribution and Service Fees, each of which is based on an annual percentage of each class' average net assets. In addition, FDC may pay financial intermediaries for selling shares of the Fund and providing shareholder support services. For the period, the Distribution and Service Fee rates, total fees and amounts retained by FDC were as follows:
| | Distribution Fee | Service Fee | Total Fees | Retained by FDC |
| Class A | -% | .25% | $94,438 | $4,058 |
| Class M | .25% | .25% | 57,884 | 659 |
| Class C | .75% | .25% | 116,288 | 13,470 |
| | | | $268,610 | $18,187 |
Sales Load. FDC may receive a front-end sales charge of up to 5.75% for selling Class A shares and 3.50% for selling Class M shares, some of which is paid to financial intermediaries for selling shares of the Fund. Depending on the holding period, FDC may receive contingent deferred sales charges levied on Class A, Class M and Class C redemptions. The deferred sales charges are 1.00% for Class C shares, 1.00% for certain purchases of Class A shares and .25% for certain purchases of Class M shares.
For the period, sales charge amounts retained by FDC were as follows:
| | Retained by FDC |
| Class A | $26,918 |
| Class M | 3,647 |
| Class C(a) | 1,487 |
| | $32,052 |
(a) When Class C shares are initially sold, FDC pays commissions from its own resources to financial intermediaries through which the sales are made.
Transfer Agent Fees. Fidelity Investments Institutional Operations Company, Inc., (FIIOC), an affiliate of the investment adviser, is the transfer, dividend disbursing and shareholder servicing agent for each class of the Fund. FIIOC receives account fees and asset-based fees that vary according to the account size and type of account of the shareholders of the respective classes of the Fund, except Class Z. FIIOC receives an asset-based fee of Class Z's average net assets. FIIOC pays for typesetting, printing and mailing of shareholder reports, except proxy statements.
For the period, transfer agent fees for each class were as follows:
| | Amount | % of Class-Level Average Net Assets |
| Class A | $83,738 | .22 |
| Class M | 29,929 | .26 |
| Class C | 28,683 | .25 |
| Worldwide | 3,395,306 | .18 |
| Class I | 60,692 | .19 |
| Class Z | 5 | .05(a) |
| | $3,598,353 | |
(a) Annualized.
Accounting and Security Lending Fees. Fidelity Service Company, Inc. (FSC), an affiliate of the investment adviser, maintains the Fund's accounting records. The accounting fee is based on the level of average net assets for each month. Under a separate contract, FSC administers the security lending program. The security lending fee is based on the number and duration of lending transactions. For the period, the fees were equivalent to an annual rate of .03%.
Brokerage Commissions. The Fund placed a portion of its portfolio transactions with brokerage firms which are affiliates of the investment adviser. Brokerage commissions are included in net realized gain (loss) and change in net unrealized appreciation (depreciation) in the Statement of Operations. The commissions paid to these affiliated firms were $35,764 for the period.
Interfund Trades. The Fund may purchase from or sell securities to other Fidelity Funds under procedures adopted by the Board. The procedures have been designed to ensure these interfund trades are executed in accordance with Rule 17a-7 of the 1940 Act. Interfund trades are included within the respective purchases and sales amounts shown in the Purchases and Sales of Investments note.
Other. During the period, the investment adviser reimbursed the Fund for certain losses in the amount of $11,831.
7. Committed Line of Credit.
The Fund participates with other funds managed by the investment adviser or an affiliate in a $4.25 billion credit facility (the "line of credit") to be utilized for temporary or emergency purposes to fund shareholder redemptions or for other short-term liquidity purposes. The Fund has agreed to pay commitment fees on its pro-rata portion of the line of credit, which amounted to $5,193 and is reflected in Miscellaneous expenses on the Statement of Operations. During the period, the Fund did not borrow on this line of credit.
8. Security Lending.
The Fund lends portfolio securities through a lending agent from time to time in order to earn additional income. For equity securities, a lending agent is used and may loan securities to certain qualified borrowers, including Fidelity Capital Markets (FCM), a broker-dealer affiliated with the Fund. On the settlement date of the loan, the Fund receives collateral (in the form of U.S. Treasury obligations, letters of credit and/or cash) against the loaned securities and maintains collateral in an amount not less than 100% of the market value of the loaned securities during the period of the loan. The market value of the loaned securities is determined at the close of business of the Fund and any additional required collateral is delivered to the Fund on the next business day. The Fund or borrower may terminate the loan at any time, and if the borrower defaults on its obligation to return the securities loaned because of insolvency or other reasons, the Fund may apply collateral received from the borrower against the obligation. The Fund may experience delays and costs in recovering the securities loaned. Any cash collateral received is invested in the Fidelity Securities Lending Cash Central Fund. The value of loaned securities and cash collateral at period end are disclosed on the Fund's Statement of Assets and Liabilities. At period end, there were no security loans outstanding with FCM. Security lending income represents the income earned on investing cash collateral, less rebates paid to borrowers and any lending agent fees associated with the loan, plus any premium payments received for lending certain types of securities. Security lending income is presented in the Statement of Operations as a component of income from Fidelity Central Funds. Total security lending income during the period amounted to $224,535, including $5,425 from securities loaned to FCM.
9. Expense Reductions.
Commissions paid to certain brokers with whom the investment adviser, or its affiliates, places trades on behalf of the Fund include an amount in addition to trade execution, which may be rebated back to the Fund to offset certain expenses. This amount totaled $202,401 for the period. In addition, through arrangements with the Fund's custodian, credits realized as a result of certain uninvested cash balances were used to reduce the Fund's expenses. During the period, these credits reduced the Fund's custody expenses by $2,095.
In addition, during the period the investment adviser reimbursed and/or waived a portion of fund-level operating expenses in the amount of $17,540.
10. Distributions to Shareholders.
Distributions to shareholders of each class were as follows:
| | Year ended
October 31, 2018 | Year ended
October 31, 2017 |
| Distributions to shareholders | | |
| Class A | $2,051,466 | $– |
| Class M | 654,014 | – |
| Class C | 633,808 | – |
| Worldwide | 109,503,017 | – |
| Class I | 1,506,486 | – |
| Total | $114,348,791 | $– |
| From net investment income | | |
| Class A | $– | $156,512 |
| Class M | – | 13,192 |
| Worldwide | – | 12,387,164 |
| Class I | – | 108,770 |
| Total | $– | $12,665,638 |
| From net realized gain | | |
| Class A | $– | $90,544 |
| Class M | – | 29,788 |
| Class C | – | 5,172 |
| Worldwide | – | 4,423,987 |
| Class I | – | 41,380 |
| Total | $– | $4,590,871 |
11. Share Transactions.
Share transactions for each class were as follows and may contain automatic conversions between classes or exchanges between affiliated funds:
| | Shares | Shares | Dollars | Dollars |
| | Year ended October 31, 2018(a) | Year ended October 31, 2017 | Year ended October 31, 2018(a) | Year ended October 31, 2017 |
| Class A | | | | |
| Shares sold | 609,144 | 252,685 | $17,061,872 | $6,107,897 |
| Reinvestment of distributions | 78,436 | 11,049 | 2,026,788 | 241,860 |
| Shares redeemed | (274,061) | (391,649) | (7,593,781) | (9,231,105) |
| Net increase (decrease) | 413,519 | (127,915) | $11,494,879 | $(2,881,348) |
| Class M | | | | |
| Shares sold | 168,412 | 59,279 | $4,717,242 | $1,423,926 |
| Reinvestment of distributions | 25,202 | 1,947 | 648,710 | 42,456 |
| Shares redeemed | (102,871) | (96,788) | (2,844,892) | (2,279,691) |
| Net increase (decrease) | 90,743 | (35,562) | $2,521,060 | $(813,309) |
| Class C | | | | |
| Shares sold | 162,206 | 50,318 | $4,408,829 | $1,172,168 |
| Reinvestment of distributions | 23,576 | 220 | 596,476 | 4,750 |
| Shares redeemed | (77,137) | (149,358) | (2,067,888) | (3,414,844) |
| Net increase (decrease) | 108,645 | (98,820) | $2,937,417 | $(2,237,926) |
| Worldwide | | | | |
| Shares sold | 25,541,865 | 6,214,435 | $707,560,818 | $152,123,337 |
| Reinvestment of distributions | 4,051,546 | 735,217 | 105,785,859 | 16,240,943 |
| Shares redeemed | (11,038,188) | (11,303,639) | (308,523,854) | (268,415,255) |
| Net increase (decrease) | 18,555,223 | (4,353,987) | $504,822,823 | $(100,050,975) |
| Class I | | | | |
| Shares sold | 1,332,978 | 418,936 | $37,665,029 | $10,241,482 |
| Reinvestment of distributions | 55,805 | 6,375 | 1,449,814 | 140,244 |
| Shares redeemed | (275,288) | (223,274) | (7,566,057) | (5,382,770) |
| Net increase (decrease) | 1,113,495 | 202,037 | $31,548,786 | $4,998,956 |
| Class Z | | | | |
| Shares sold | 10,966 | – | $300,656 | $– |
| Net increase (decrease) | 10,966 | – | $300,656 | $– |
(a) Share transactions for Class Z are for the period October 2, 2018 (commencement of sale of shares) to October 31, 2018
12. Other.
The Fund's organizational documents provide former and current trustees and officers with a limited indemnification against liabilities arising in connection with the performance of their duties to the Fund. In the normal course of business, the Fund may also enter into contracts that provide general indemnifications. The Fund's maximum exposure under these arrangements is unknown as this would be dependent on future claims that may be made against the Fund. The risk of material loss from such claims is considered remote.
Report of Independent Registered Public Accounting Firm
To the Trustees of Fidelity Investment Trust and Shareholders of Fidelity Worldwide Fund:
Opinion on the Financial Statements and Financial Highlights
We have audited the accompanying statement of assets and liabilities of Fidelity Worldwide Fund (the "Fund"), a fund of Fidelity Investment Trust, including the schedule of investments, as of October 31, 2018, and the related statement of operations for the year then ended, the statement of changes in net assets for each of the two years in the period then ended, the financial highlights for each of the five years in the period then ended, and the related notes. In our opinion, the financial statements and financial highlights present fairly, in all material respects, the financial position of the Fund as of October 31, 2018, and the results of its operations for the year then ended, the changes in its net assets for each of the two years in the period then ended, and the financial highlights for each of the five years in the period then ended, in conformity with accounting principles generally accepted in the United States of America.
Basis for Opinion
These financial statements and financial highlights are the responsibility of the Fund's management. Our responsibility is to express an opinion on the Fund's financial statements and financial highlights based on our audits. We are a public accounting firm registered with the Public Company Accounting Oversight Board (United States) (PCAOB) and are required to be independent with respect to the Fund in accordance with the U.S. federal securities laws and the applicable rules and regulations of the Securities and Exchange Commission and the PCAOB.
We conducted our audits in accordance with the standards of the PCAOB. Those standards require that we plan and perform the audit to obtain reasonable assurance about whether the financial statements and financial highlights are free of material misstatement, whether due to error or fraud. The Fund is not required to have, nor were we engaged to perform, an audit of its internal control over financial reporting. As part of our audits we are required to obtain an understanding of internal control over financial reporting but not for the purpose of expressing an opinion on the effectiveness of the Fund’s internal control over financial reporting. Accordingly, we express no such opinion.
Our audits included performing procedures to assess the risks of material misstatement of the financial statements and financial highlights, whether due to error or fraud, and performing procedures that respond to those risks. Such procedures included examining, on a test basis, evidence regarding the amounts and disclosures in the financial statements and financial highlights. Our audits also included evaluating the accounting principles used and significant estimates made by management, as well as evaluating the overall presentation of the financial statements and financial highlights. Our procedures included confirmation of securities owned as of October 31, 2018, by correspondence with the custodians and brokers; when replies were not received from brokers, we performed other auditing procedures. We believe that our audits provide a reasonable basis for our opinion.
/s/ Deloitte & Touche LLP
Boston, Massachusetts
December 13, 2018
We have served as the auditor of one or more of the Fidelity investment companies since 1999.
Trustees and Officers
The Trustees, Members of the Advisory Board (if any), and officers of the trust and fund, as applicable, are listed below. The Board of Trustees governs the fund and is responsible for protecting the interests of shareholders. The Trustees are experienced executives who meet periodically throughout the year to oversee the fund's activities, review contractual arrangements with companies that provide services to the fund, oversee management of the risks associated with such activities and contractual arrangements, and review the fund's performance. Except for Jonathan Chiel, each of the Trustees oversees 283 funds. Mr. Chiel oversees 154 funds.
The Trustees hold office without limit in time except that (a) any Trustee may resign; (b) any Trustee may be removed by written instrument, signed by at least two-thirds of the number of Trustees prior to such removal; (c) any Trustee who requests to be retired or who has become incapacitated by illness or injury may be retired by written instrument signed by a majority of the other Trustees; and (d) any Trustee may be removed at any special meeting of shareholders by a two-thirds vote of the outstanding voting securities of the trust. Each Trustee who is not an interested person (as defined in the 1940 Act) of the trust and the fund is referred to herein as an Independent Trustee. Each Independent Trustee shall retire not later than the last day of the calendar year in which his or her 75th birthday occurs. The Independent Trustees may waive this mandatory retirement age policy with respect to individual Trustees. Officers and Advisory Board Members hold office without limit in time, except that any officer or Advisory Board Member may resign or may be removed by a vote of a majority of the Trustees at any regular meeting or any special meeting of the Trustees. Except as indicated, each individual has held the office shown or other offices in the same company for the past five years.
The fund’s Statement of Additional Information (SAI) includes more information about the Trustees. To request a free copy, call Fidelity at 1-877-208-0098.
Experience, Skills, Attributes, and Qualifications of the Trustees. The Governance and Nominating Committee has adopted a statement of policy that describes the experience, qualifications, attributes, and skills that are necessary and desirable for potential Independent Trustee candidates (Statement of Policy). The Board believes that each Trustee satisfied at the time he or she was initially elected or appointed a Trustee, and continues to satisfy, the standards contemplated by the Statement of Policy. The Governance and Nominating Committee also engages professional search firms to help identify potential Independent Trustee candidates who have the experience, qualifications, attributes, and skills consistent with the Statement of Policy. From time to time, additional criteria based on the composition and skills of the current Independent Trustees, as well as experience or skills that may be appropriate in light of future changes to board composition, business conditions, and regulatory or other developments, have also been considered by the professional search firms and the Governance and Nominating Committee. In addition, the Board takes into account the Trustees' commitment and participation in Board and committee meetings, as well as their leadership of standing and ad hoc committees throughout their tenure.
In determining that a particular Trustee was and continues to be qualified to serve as a Trustee, the Board has considered a variety of criteria, none of which, in isolation, was controlling. The Board believes that, collectively, the Trustees have balanced and diverse experience, qualifications, attributes, and skills, which allow the Board to operate effectively in governing the fund and protecting the interests of shareholders. Information about the specific experience, skills, attributes, and qualifications of each Trustee, which in each case led to the Board's conclusion that the Trustee should serve (or continue to serve) as a trustee of the fund, is provided below.
Board Structure and Oversight Function. James C. Curvey is an interested person and currently serves as Chairman. The Trustees have determined that an interested Chairman is appropriate and benefits shareholders because an interested Chairman has a personal and professional stake in the quality and continuity of services provided to the fund. Independent Trustees exercise their informed business judgment to appoint an individual of their choosing to serve as Chairman, regardless of whether the Trustee happens to be independent or a member of management. The Independent Trustees have determined that they can act independently and effectively without having an Independent Trustee serve as Chairman and that a key structural component for assuring that they are in a position to do so is for the Independent Trustees to constitute a substantial majority for the Board. The Independent Trustees also regularly meet in executive session. Ned C. Lautenbach serves as Chairman of the Independent Trustees and as such (i) acts as a liaison between the Independent Trustees and management with respect to matters important to the Independent Trustees and (ii) with management prepares agendas for Board meetings.
Fidelity® funds are overseen by different Boards of Trustees. The fund's Board oversees Fidelity's high income and certain equity funds, and other Boards oversee Fidelity's investment-grade bond, money market, asset allocation, and other equity funds. The asset allocation funds may invest in Fidelity® funds overseen by the fund's Board. The use of separate Boards, each with its own committee structure, allows the Trustees of each group of Fidelity® funds to focus on the unique issues of the funds they oversee, including common research, investment, and operational issues. On occasion, the separate Boards establish joint committees to address issues of overlapping consequences for the Fidelity® funds overseen by each Board.
The Trustees operate using a system of committees to facilitate the timely and efficient consideration of all matters of importance to the Trustees, the fund, and fund shareholders and to facilitate compliance with legal and regulatory requirements and oversight of the fund's activities and associated risks. The Board, acting through its committees, has charged FMR and its affiliates with (i) identifying events or circumstances the occurrence of which could have demonstrably adverse effects on the fund's business and/or reputation; (ii) implementing processes and controls to lessen the possibility that such events or circumstances occur or to mitigate the effects of such events or circumstances if they do occur; and (iii) creating and maintaining a system designed to evaluate continuously business and market conditions in order to facilitate the identification and implementation processes described in (i) and (ii) above. Because the day-to-day operations and activities of the fund are carried out by or through FMR, its affiliates, and other service providers, the fund's exposure to risks is mitigated but not eliminated by the processes overseen by the Trustees. While each of the Board's committees has responsibility for overseeing different aspects of the fund's activities, oversight is exercised primarily through the Operations, Audit, and Compliance Committees. In addition, the Independent Trustees have worked with Fidelity to enhance the Board's oversight of investment and financial risks, legal and regulatory risks, technology risks, and operational risks, including the development of additional risk reporting to the Board. Appropriate personnel, including but not limited to the fund's Chief Compliance Officer (CCO), FMR's internal auditor, the independent accountants, the fund's Treasurer and portfolio management personnel, make periodic reports to the Board's committees, as appropriate, including an annual review of Fidelity's risk management program for the Fidelity® funds. The responsibilities of each standing committee, including their oversight responsibilities, are described further under "Standing Committees of the Trustees."
Interested Trustees*:
Correspondence intended for a Trustee who is an interested person may be sent to Fidelity Investments, 245 Summer Street, Boston, Massachusetts 02210.
Name, Year of Birth; Principal Occupations and Other Relevant Experience+
Jonathan Chiel (1957)
Year of Election or Appointment: 2016
Trustee
Mr. Chiel also serves as Trustee of other Fidelity® funds. Mr. Chiel is Executive Vice President and General Counsel for FMR LLC (diversified financial services company, 2012-present). Previously, Mr. Chiel served as general counsel (2004-2012) and senior vice president and deputy general counsel (2000-2004) for John Hancock Financial Services; a partner with Choate, Hall & Stewart (1996-2000) (law firm); and an Assistant United States Attorney for the United States Attorney’s Office of the District of Massachusetts (1986-95), including Chief of the Criminal Division (1993-1995). Mr. Chiel is a director on the boards of the Boston Bar Foundation and the Maimonides School.
James C. Curvey (1935)
Year of Election or Appointment: 2007
Trustee
Chairman of the Board of Trustees
Mr. Curvey also serves as Trustee of other Fidelity® funds. Mr. Curvey is Vice Chairman (2007-present) and Director of FMR LLC (diversified financial services company). In addition, Mr. Curvey is an Overseer Emeritus for the Boston Symphony Orchestra, a Director of Artis-Naples, and a Trustee of Brewster Academy in Wolfeboro, New Hampshire. Previously, Mr. Curvey served as a Director of Fidelity Research & Analysis Co. (investment adviser firm, 2009-2018), Director of Fidelity Investments Money Management, Inc. (investment adviser firm, 2009-2014) and a Director of FMR and FMR Co., Inc. (investment adviser firms, 2007-2014).
Charles S. Morrison (1960)
Year of Election or Appointment: 2014
Trustee
Mr. Morrison also serves as Trustee of other funds. He serves as President of Fidelity SelectCo, LLC (investment adviser firm, 2017-present) and Fidelity Management & Research Company (FMR) (investment adviser firm, 2016-present), a Director of Fidelity Investments Money Management, Inc. (FIMM) (investment adviser firm, 2014-present), Director of Fidelity SelectCo, LLC (investment adviser firm, 2014-present), President, Asset Management (2014-present), and is an employee of Fidelity Investments. Previously, Mr. Morrison served as Vice President of Fidelity's Fixed Income and Asset Allocation Funds (2012-2014), President, Fixed Income (2011-2014), Vice President of Fidelity's Money Market Funds (2005-2009), President, Money Market Group Leader of FMR (investment adviser firm, 2009), and Senior Vice President, Money Market Group of FMR (2004-2009). Mr. Morrison also served as Vice President of Fidelity's Bond Funds (2002-2005), certain Balanced Funds (2002-2005), and certain Asset Allocation Funds (2002-2007), and as Senior Vice President (2002-2005) of Fidelity's Bond Division.
* Determined to be an “Interested Trustee” by virtue of, among other things, his or her affiliation with the trust or various entities under common control with FMR.
+ The information includes the Trustee's principal occupation during the last five years and other information relating to the experience, attributes, and skills relevant to the Trustee's qualifications to serve as a Trustee, which led to the conclusion that the Trustee should serve as a Trustee for the fund.
Independent Trustees:
Correspondence intended for an Independent Trustee may be sent to Fidelity Investments, P.O. Box 55235, Boston, Massachusetts 02205-5235.
Name, Year of Birth; Principal Occupations and Other Relevant Experience+
Dennis J. Dirks (1948)
Year of Election or Appointment: 2005
Trustee
Mr. Dirks also serves as Trustee of other Fidelity® funds. Prior to his retirement in May 2003, Mr. Dirks was Chief Operating Officer and a member of the Board of The Depository Trust & Clearing Corporation (DTCC). He also served as President, Chief Operating Officer, and Board member of The Depository Trust Company (DTC) and President and Board member of the National Securities Clearing Corporation (NSCC). In addition, Mr. Dirks served as Chief Executive Officer and Board member of the Government Securities Clearing Corporation, Chief Executive Officer and Board member of the Mortgage-Backed Securities Clearing Corporation, as a Trustee and a member of the Finance Committee of Manhattan College (2005-2008), as a Trustee and a member of the Finance Committee of AHRC of Nassau County (2006-2008), as a member of the Independent Directors Council (IDC) Governing Council (2010-2015), and as a member of the Board of Directors for The Brookville Center for Children’s Services, Inc. (2009-2017). Mr. Dirks is a member of the Finance Committee (2016-present), Board of Directors (2017-present) and Board of Trustees (2018-present) and is Treasurer (2018-present) of the Asolo Repertory Theatre.
Donald F. Donahue (1950)
Year of Election or Appointment: 2018
Trustee
Mr. Donahue also serves as a Trustee of other Fidelity® funds. Mr. Donahue is President and Chief Executive Officer of Miranda Partners, LLC (risk consulting for the financial services industry, 2012-present). Previously, Mr. Donahue served as a Member of the Advisory Board of certain Fidelity® funds (2015-2018) and Chief Executive Officer (2006-2012), Chief Operating Officer (2003-2006), and Managing Director, Customer Marketing and Development (1999-2003) of The Depository Trust & Clearing Corporation (financial markets infrastructure). Mr. Donahue serves as a Member (2007-present) and Co-Chairman (2016-present) of the Board of Directors of United Way of New York, Member of the Board of Directors of NYC Leadership Academy (2012-present) and Member of the Board of Advisors of Ripple Labs, Inc. (financial services, 2015-present). He also served as Chairman (2010-2012) and Member of the Board of Directors (2012-2013) of Omgeo, LLC (financial services), Treasurer of United Way of New York (2012-2016), and Member of the Board of Directors of XBRL US (financial services non-profit, 2009-2012) and the International Securities Services Association (2009-2012).
Alan J. Lacy (1953)
Year of Election or Appointment: 2008
Trustee
Mr. Lacy also serves as Trustee of other Fidelity® funds. Mr. Lacy serves as a Director of Bristol-Myers Squibb Company (global pharmaceuticals, 2008-present). He is a Trustee of the California Chapter of The Nature Conservancy (2015-present) and a Director of the Center for Advanced Study in the Behavioral Sciences at Stanford University (2015-present). In addition, Mr. Lacy served as Senior Adviser (2007-2014) of Oak Hill Capital Partners, L.P. (private equity) and also served as Chief Executive Officer (2005) and Vice Chairman (2005-2006) of Sears Holdings Corporation (retail) and Chief Executive Officer and Chairman of the Board of Sears, Roebuck and Co. (retail, 2000-2005). Previously, Mr. Lacy served as Chairman (2014-2017) and a member (2010-2017) of the Board of Directors of Dave & Buster’s Entertainment, Inc. (restaurant and entertainment complexes), as Chairman (2008-2011) and a member (2006-2015) of the Board of Trustees of the National Parks Conservation Association, and as a member of the Board of Directors for The Hillman Companies, Inc. (hardware wholesalers, 2010-2014), Earth Fare, Inc. (retail grocery, 2010-2014), and The Western Union Company (global money transfer, 2006-2011).
Ned C. Lautenbach (1944)
Year of Election or Appointment: 2000
Trustee
Chairman of the Independent Trustees
Mr. Lautenbach also serves as Trustee of other Fidelity® funds. Mr. Lautenbach currently serves as Vice Chair of the Board of Governors, State University System of Florida (2013-present) and is a member of the Council on Foreign Relations (1994-present). He is also a member and has most recently served as Chairman of the Board of Directors of Artis-Naples (2012-present). Previously, Mr. Lautenbach served as a member and then Lead Director of the Board of Directors of Eaton Corporation (diversified industrial, 1997-2016). He was also a Partner and Advisory Partner at Clayton, Dubilier & Rice, LLC (private equity investment, 1998-2010), as well as a Director of Sony Corporation (2006-2007). In addition, Mr. Lautenbach also had a 30-year career with IBM (technology company) during which time he served as Senior Vice President and a member of the Corporate Executive Committee (1968-1998).
Joseph Mauriello (1944)
Year of Election or Appointment: 2008
Trustee
Mr. Mauriello also serves as Trustee of other Fidelity® funds. Prior to his retirement in January 2006, Mr. Mauriello served in numerous senior management positions including Deputy Chairman and Chief Operating Officer (2004-2005), and Vice Chairman of Financial Services (2002-2004) of KPMG LLP US (professional services, 1965-2005). Mr. Mauriello currently serves as a member of the Independent Directors Council (IDC) Governing Council (2015-present). Previously, Mr. Mauriello served as a member of the Board of Directors of XL Group plc. (global insurance and re-insurance, 2006-2018).
Cornelia M. Small (1944)
Year of Election or Appointment: 2005
Trustee
Ms. Small also serves as Trustee of other Fidelity® funds. Ms. Small is a member of the Board of Directors (2009-present) and Chair of the Investment Committee (2010-present) of the Teagle Foundation. Ms. Small also serves on the Investment Committee of the Berkshire Taconic Community Foundation (2008-present). Previously, Ms. Small served as Chairperson (2002-2008) and a member of the Investment Committee and Chairperson (2008-2012) and a member of the Board of Trustees of Smith College. In addition, Ms. Small served as Chief Investment Officer, Director of Global Equity Investments, and a member of the Board of Directors of Scudder, Stevens & Clark and Scudder Kemper Investments.
Garnett A. Smith (1947)
Year of Election or Appointment: 2018
Trustee
Mr. Smith also serves as Trustee of other Fidelity® funds. Prior to Mr. Smith's retirement, he served as Chairman and Chief Executive Officer of Inbrand Corp. (manufacturer of personal absorbent products, 1990-1997). He also served as President (1986-1990) of Inbrand Corp. Prior to his employment with Inbrand Corp., he was employed by a retail fabric chain and North Carolina National Bank. In addition, Mr. Smith served as a Member of the Advisory Board of certain Fidelity® funds (2012-2013) and as a board member of the Jackson Hole Land Trust (2009-2012).
David M. Thomas (1949)
Year of Election or Appointment: 2008
Trustee
Mr. Thomas also serves as Trustee of other Fidelity® funds. Mr. Thomas serves as Non-Executive Chairman of the Board of Directors of Fortune Brands Home and Security (home and security products, 2011-present), as a member of the Board of Directors (2004-present) and Presiding Director (2013-present) of Interpublic Group of Companies, Inc. (marketing communication), and as a member of the Board of Trustees of the University of Florida (2013-present). Previously, Mr. Thomas served as Executive Chairman (2005-2006) and Chairman and Chief Executive Officer (2000-2005) of IMS Health, Inc. (pharmaceutical and healthcare information solutions), and a Director of Fortune Brands, Inc. (consumer products, 2000-2011).
+ The information includes the Trustee's principal occupation during the last five years and other information relating to the experience, attributes, and skills relevant to the Trustee's qualifications to serve as a Trustee, which led to the conclusion that the Trustee should serve as a Trustee for the fund.
Advisory Board Members and Officers:
Correspondence intended for a Member of the Advisory Board (if any) may be sent to Fidelity Investments, P.O. Box 55235, Boston, Massachusetts 02205-5235. Correspondence intended for an officer or Peter S. Lynch may be sent to Fidelity Investments, 245 Summer Street, Boston, Massachusetts 02210. Officers appear below in alphabetical order.
Name, Year of Birth; Principal Occupation
Vicki L. Fuller (1957)
Year of Election or Appointment: 2018
Member of the Advisory Board
Ms. Fuller also serves as Member of the Advisory Board of other Fidelity® funds. Ms. Fuller serves as a member of the Board of Directors, Audit Committee, and Nominating and Governance Committee of The Williams Companies, Inc. (natural gas infrastructure, 2018-present). Previously, Ms. Fuller served as the Chief Investment Officer of the New York State Common Retirement Fund (2012-2018) and held a variety of positions at AllianceBernstein L.P. (global asset management, 1985-2012), including Managing Director (2006-2012) and Senior Vice President and Senior Portfolio Manager (2001-2006).
Peter S. Lynch (1944)
Year of Election or Appointment: 2003
Member of the Advisory Board
Mr. Lynch also serves as Member of the Advisory Board of other Fidelity® funds. Mr. Lynch is Vice Chairman and a Director of FMR (investment adviser firm) and FMR Co., Inc. (investment adviser firm). In addition, Mr. Lynch serves as a Trustee of Boston College and as the Chairman of the Inner-City Scholarship Fund. Previously, Mr. Lynch served on the Special Olympics International Board of Directors (1997-2006).
William S. Stavropoulos (1939)
Year of Election or Appointment: 2018
Member of the Advisory Board
Mr. Stavropoulos also serves as Member of the Advisory Board of other Fidelity® funds. Mr. Stavropoulos serves as President and Founder of the Michigan Baseball Foundation, the Great Lakes Loons (2007-present). Mr. Stavropoulos is Chairman Emeritus of the Board of Directors of The Dow Chemical Company, where he previously served in numerous senior management positions, including President, CEO (1995-2000; 2002-2004), Chairman of the Executive Committee (2000-2006), and as a member of the Board of Directors (1990-2006). Currently, Mr. Stavropoulos is Chairman of the Board of Directors of Univar Inc. (global distributor of commodity and specialty chemicals), a Director of Teradata Corporation (data warehousing and technology solutions), and a member of the Advisory Board for Metalmark Capital LLC (private equity investment, 2005-present). Mr. Stavropoulos is an operating advisor to Clayton, Dubilier & Rice, LLC (private equity investment). In addition, Mr. Stavropoulos is a member of the University of Notre Dame Advisory Council for the College of Science, a Trustee of the Rollin L. Gerstacker Foundation, and a Director of Artis-Naples in Naples, Florida. Previously, Mr. Stavropoulos served as Trustee of certain Fidelity® funds (2001-2018) and as a Director of Chemical Financial Corporation (bank holding company, 1993-2012) and Tyco International, Ltd. (multinational manufacturing and services, 2007-2012).
Carol B. Tomé (1957)
Year of Election or Appointment: 2018
Member of the Advisory Board
Ms. Tomé also serves as Member of the Advisory Board of other Fidelity® funds. Ms. Tomé is Chief Financial Officer (2001-present) and Executive Vice President of Corporate Services (2007-present) of The Home Depot, Inc. (home improvement retailer) and a Director (2003-present) and Chair of the Audit Committee (2004-present) of United Parcel Service, Inc. (package delivery and supply chain management). Previously, Ms. Tomé served as Trustee of certain Fidelity® funds (2017), Senior Vice President of Finance and Accounting/Treasurer (2000-2007) and Vice President and Treasurer (1995-2000) of The Home Depot, Inc. and Chair of the Board (2010-2012), Vice Chair of the Board (2009 and 2013), and a Director (2008-2013) of the Federal Reserve Bank of Atlanta. Ms. Tomé is also a director or trustee of many community and professional organizations.
Michael E. Wiley (1950)
Year of Election or Appointment: 2018
Member of the Advisory Board
Mr. Wiley also serves as Trustee or Member of the Advisory Board of other Fidelity® funds. Mr. Wiley serves as a Director of High Point Resources (exploration and production, 2005-present). Previously, Mr. Wiley served as a Director of Andeavor Corporation (independent oil refiner and marketer, 2005-2018), a Director of Andeavor Logistics LP (natural resources logistics, 2015-2018), a Director of Post Oak Bank (privately-held bank, 2004-2018), a Director of Asia Pacific Exploration Consolidated (international oil and gas exploration and production, 2008-2013), a member of the Board of Trustees of the University of Tulsa (2000-2006; 2007-2010), a Senior Energy Advisor of Katzenbach Partners, LLC (consulting, 2006-2007), an Advisory Director of Riverstone Holdings (private investment), a Director of Spinnaker Exploration Company (exploration and production, 2001-2005) and Chairman, President, and CEO of Baker Hughes, Inc. (oilfield services, 2000-2004).
Elizabeth Paige Baumann (1968)
Year of Election or Appointment: 2017
Anti-Money Laundering (AML) Officer
Ms. Baumann also serves as AML Officer of other funds. She is Chief AML Officer (2012-present) and Senior Vice President (2014-present) of FMR LLC (diversified financial services company) and is an employee of Fidelity Investments. Previously, Ms. Baumann served as AML Officer of the funds (2012-2016), and Vice President (2007-2014) and Deputy Anti-Money Laundering Officer (2007-2012) of FMR LLC.
John J. Burke III (1964)
Year of Election or Appointment: 2018
Chief Financial Officer
Mr. Burke also serves as Chief Financial Officer of other funds. Mr. Burke serves as Head of Investment Operations for Fidelity Fund and Investment Operations (2018-present) and is an employee of Fidelity Investments (1998-present). Previously Mr. Burke served as head of Asset Management Investment Operations (2012-2018).
William C. Coffey (1969)
Year of Election or Appointment: 2018
Secretary and Chief Legal Officer (CLO)
Mr. Coffey also serves as Secretary and CLO of other funds. Mr. Coffey serves as CLO, Secretary, and Senior Vice President of Fidelity Management & Research Company and FMR Co., Inc. (investment adviser firms, 2018-present); Secretary of Fidelity SelectCo, LLC and Fidelity Investments Money Management, Inc. (investment adviser firms, 2018-present); and CLO of Fidelity Management & Research (Hong Kong) Limited, FMR Investment Management (UK) Limited, and Fidelity Management & Research (Japan) Limited (investment adviser firms, 2018-present). He is Senior Vice President and Deputy General Counsel of FMR LLC (diversified financial services company, 2010-present), and is an employee of Fidelity Investments. Previously, Mr. Coffey served as Assistant Secretary of certain funds (2009-2018) and as Vice President and Associate General Counsel of FMR LLC (2005-2009).
Timothy M. Cohen (1969)
Year of Election or Appointment: 2018
Vice President
Mr. Cohen also serves as Vice President of other funds. Mr. Cohen serves as Co-Head of Global Equity Research (2016-present), a Director of Fidelity Management & Research (Japan) Limited (investment adviser firm, 2016-present), and is an employee of Fidelity Investments. Previously, Mr. Cohen served as Chief Investment Officer - Equity and a Director of Fidelity Management & Research (U.K.) Inc. (investment adviser firm, 2013-2015) and as a Director of Fidelity Management & Research (Hong Kong) Limited (investment adviser firm, 2017).
Jonathan Davis (1968)
Year of Election or Appointment: 2010
Assistant Treasurer
Mr. Davis also serves as Assistant Treasurer of other funds. Mr. Davis serves as Assistant Treasurer of FMR Capital, Inc. (2017-present) and is an employee of Fidelity Investments. Previously, Mr. Davis served as Vice President and Associate General Counsel of FMR LLC (diversified financial services company, 2003-2010).
Adrien E. Deberghes (1967)
Year of Election or Appointment: 2016
Assistant Treasurer
Mr. Deberghes also serves as an officer of other funds. He serves as Assistant Treasurer of FMR Capital, Inc. (2017-present), Executive Vice President of Fidelity Investments Money Management, Inc. (FIMM) (investment adviser firm, 2016-present), and is an employee of Fidelity Investments (2008-present). Previously, Mr. Deberghes served as President and Treasurer of certain Fidelity® funds (2013-2018). Prior to joining Fidelity Investments, Mr. Deberghes was Senior Vice President of Mutual Fund Administration at State Street Corporation (2007-2008), Senior Director of Mutual Fund Administration at Investors Bank & Trust (2005-2007), and Director of Finance for Dunkin' Brands (2000-2005). Previously, Mr. Deberghes served in other fund officer roles.
Laura M. Del Prato (1964)
Year of Election or Appointment: 2018
Assistant Treasurer
Ms. Del Prato also serves as an officer of other funds. Ms. Del Prato is an employee of Fidelity Investments (2017-present). Prior to joining Fidelity Investments, Ms. Del Prato served as a Managing Director and Treasurer of the JPMorgan Mutual Funds (2014-2017). Prior to JPMorgan, Ms. Del Prato served as a partner at Cohen Fund Audit Services (accounting firm, 2012-2013) and KPMG LLP (accounting firm, 2004-2012).
Colm A. Hogan (1973)
Year of Election or Appointment: 2016
Deputy Treasurer
Mr. Hogan also serves as an officer of other funds. Mr. Hogan serves as Assistant Treasurer of FMR Capital, Inc. (2017-present) and is an employee of Fidelity Investments (2005-present). Previously, Mr. Hogan served as Assistant Treasurer of certain Fidelity® funds (2016-2018).
Pamela R. Holding (1964)
Year of Election or Appointment: 2018
Vice President
Ms. Holding also serves as Vice President of other funds. Ms. Holding serves as Co-Head of Global Equity Research (2018-present) and is an employee of Fidelity Investments (2013-present).
Chris Maher (1972)
Year of Election or Appointment: 2013
Assistant Treasurer
Mr. Maher serves as Assistant Treasurer of other funds. Mr. Maher is Vice President of Valuation Oversight, serves as Assistant Treasurer of FMR Capital, Inc. (2017-present), and is an employee of Fidelity Investments. Previously, Mr. Maher served as Vice President of Asset Management Compliance (2013), Vice President of the Program Management Group of FMR (investment adviser firm, 2010-2013), and Vice President of Valuation Oversight (2008-2010).
Rieco E. Mello (1969)
Year of Election or Appointment: 2017
Assistant Treasurer
Mr. Mello also serves as Assistant Treasurer of other funds. Mr. Mello serves as Assistant Treasurer of FMR Capital, Inc. (2017-present) and is an employee of Fidelity Investments (1995-present).
Kenneth B. Robins (1969)
Year of Election or Appointment: 2016
Chief Compliance Officer
Mr. Robins also serves as an officer of other funds. Mr. Robins serves as Compliance Officer of Fidelity Management & Research Company and FMR Co., Inc. (investment adviser firms, 2016-present) and is an employee of Fidelity Investments (2004-present). Previously, Mr. Robins served as Executive Vice President of Fidelity Investments Money Management, Inc. (investment adviser firm, 2013-2016) and served in other fund officer roles.
Stacie M. Smith (1974)
Year of Election or Appointment: 2016
President and Treasurer
Ms. Smith also serves as an officer of other funds. Ms. Smith serves as Assistant Treasurer of FMR Capital, Inc. (2017-present), is an employee of Fidelity Investments (2009-present), and has served in other fund officer roles. Prior to joining Fidelity Investments, Ms. Smith served as Senior Audit Manager of Ernst & Young LLP (accounting firm, 1996-2009). Previously, Ms. Smith served as Assistant Treasurer (2013-2018) and Deputy Treasurer (2013-2016) of certain Fidelity® funds.
Marc L. Spector (1972)
Year of Election or Appointment: 2016
Assistant Treasurer
Mr. Spector also serves as an officer of other funds. Mr. Spector serves as Assistant Treasurer of FMR Capital, Inc. (2017-present) and is an employee of Fidelity Investments (2016-present). Prior to joining Fidelity Investments, Mr. Spector served as Director at the Siegfried Group (accounting firm, 2013-2016), and prior to Siegfried Group as audit senior manager at Deloitte & Touche (accounting firm, 2005-2013).
Shareholder Expense Example
As a shareholder of the Fund, you incur two types of costs: (1) transaction costs, including sales charges (loads) on purchase payments or redemption proceeds, and (2) ongoing costs, including management fees, distribution and/or service (12b-1) fees and other Fund expenses. This Example is intended to help you understand your ongoing costs (in dollars) of investing in the Fund and to compare these costs with the ongoing costs of investing in other mutual funds.
The actual expense Example is based on an investment of $1,000 invested at the beginning of the period and held for the entire period (May 1, 2018 to October 31, 2018) for each Class, except Class Z, and for the period (October 2, 2018 to October 31, 2018) for Class Z. The hypothetical expense Example is based on an investment of $1,000 invested for the one-half year period (May 1, 2018 to October 31, 2018).
Actual Expenses
The first line of the accompanying table for each class of the Fund provides information about actual account values and actual expenses. You may use the information in this line, together with the amount you invested, to estimate the expenses that you paid over the period. Simply divide your account value by $1,000.00 (for example, an $8,600 account value divided by $1,000.00 = 8.6), then multiply the result by the number in the first line for a class of the Fund under the heading entitled "Expenses Paid During Period" to estimate the expenses you paid on your account during this period. A small balance maintenance fee of $12.00 that is charged once a year may apply for certain accounts with a value of less than $2,000. This fee, which was eliminated effective August 1, 2018, is not included in the table below. If it was, the estimate of expenses you paid during the period would be higher, and your ending account value lower, by this amount. In addition, the Fund, as a shareholder in the underlying Fidelity Central Funds, will indirectly bear its pro-rata share of the fees and expenses incurred by the underlying Fidelity Central Funds. These fees and expenses are not included in the Fund's annualized expense ratio used to calculate the expense estimate in the table below.
Hypothetical Example for Comparison Purposes
The second line of the accompanying table for each class of the Fund provides information about hypothetical account values and hypothetical expenses based on a Class' actual expense ratio and an assumed rate of return of 5% per year before expenses, which is not the Class' actual return. The hypothetical account values and expenses may not be used to estimate the actual ending account balance or expenses you paid for the period. You may use this information to compare the ongoing costs of investing in the Fund and other funds. To do so, compare this 5% hypothetical example with the 5% hypothetical examples that appear in the shareholder reports of the other funds. A small balance maintenance fee of $12.00 that is charged once a year may apply for certain accounts with a value of less than $2,000. This fee, which was eliminated effective August 1, 2018, is not included in the table below. If it was, the estimate of expenses you paid during the period would be higher, and your ending account value lower, by this amount. In addition, the Fund, as a shareholder in the underlying Fidelity Central Funds, will indirectly bear its pro-rata share of the fees and expenses incurred by the underlying Fidelity Central Funds. These fees and expenses are not included in the Fund's annualized expense ratio used to calculate the expense estimate in the table below.
Please note that the expenses shown in the table are meant to highlight your ongoing costs only and do not reflect any transaction costs. Therefore, the second line of the table is useful in comparing ongoing costs only, and will not help you determine the relative total costs of owning different funds. In addition, if these transactional costs were included, your costs would have been higher.
| | Annualized Expense Ratio-A | Beginning
Account Value | Ending
Account Value
October 31, 2018 | Expenses Paid
During Period |
| Class A | 1.24% | | | |
| Actual | | $1,000.00 | $986.60 | $6.21-B |
| Hypothetical-C | | $1,000.00 | $1,018.95 | $6.31-D |
| Class M | 1.52% | | | |
| Actual | | $1,000.00 | $985.10 | $7.61-B |
| Hypothetical-C | | $1,000.00 | $1,017.54 | $7.73-D |
| Class C | 2.01% | | | |
| Actual | | $1,000.00 | $982.50 | $10.04-B |
| Hypothetical-C | | $1,000.00 | $1,015.07 | $10.21-D |
| Worldwide | .96% | | | |
| Actual | | $1,000.00 | $987.90 | $4.81-B |
| Hypothetical-C | | $1,000.00 | $1,020.37 | $4.89-D |
| Class I | .96% | | | |
| Actual | | $1,000.00 | $987.80 | $4.81-B |
| Hypothetical-C | | $1,000.00 | $1,020.37 | $4.89-D |
| Class Z | .89% | | | |
| Actual | | $1,000.00 | $906.60 | $.70-B |
| Hypothetical-C | | $1,000.00 | $1,020.72 | $4.53-D |
A Annualized expense ratio reflects expenses net of applicable fee waivers.
B Actual expenses are equal to each Class' annualized expense ratio, multiplied by the average account value over the period, multiplied by 184/365 (to reflect the one-half year period) for Class A, Class M, Class C, Fidelity Worldwide Fund and Class I and multiplied by 30/365 (to reflect the period October 2, 2018 to October 31, 2018) for Class Z.
C 5% return per year before expenses
D Hypothetical expenses are equal to each Class' annualized expense ratio, multiplied by the average account value over the period, multiplied by 184/365 (to reflect the one-half year period).
Distributions (Unaudited)
The Board of Trustees of Fidelity Worldwide Fund voted to pay to shareholders of record at the opening of business on record date, the following distributions per share derived from capital gains realized from sales of portfolio securities, and dividends derived from net investment income:
| | Pay Date | Record Date | Dividends | Capital Gains |
| Fidelity Worldwide Fund | | | | |
| Class A | 12/10/18 | 12/07/18 | $0.015 | $2.140 |
| Class M | 12/10/18 | 12/07/18 | $0.000 | $2.140 |
| Class C | 12/10/18 | 12/07/18 | $0.000 | $2.140 |
| Worldwide | 12/10/18 | 12/07/18 | $0.085 | $2.140 |
| Class I | 12/10/18 | 12/07/18 | $0.093 | $2.140 |
| Class Z | 12/10/18 | 12/07/18 | $0.127 | $2.140 |
|
The fund hereby designates as a capital gain dividend with respect to the taxable year ended October 31, 2018, $192,777,005, or, if subsequently determined to be different, the net capital gain of such year.
Class A designates 100%; Class M designates 100%; Retail Class designates 75%; and Class I designates 74%; of the dividend distributed in December during the fiscal year as qualifying for the dividends–received deduction for corporate shareholders.
Class A, Class M, Retail Class and Class I designate 100% of the dividends distributed during the fiscal year as amounts which may be taken into account as a dividend for purposes of the maximum rate under section 1(h)(11) of the Internal Revenue Code.
The fund will notify shareholders in January 2019 of amounts for use in preparing 2018 income tax returns.
Board Approval of Investment Advisory Contracts
Fidelity Worldwide Fund
At its July 2018 meeting, the Board of Trustees, including the Independent Trustees (together, the Board), voted to continue the management contract with Fidelity Management & Research Company (FMR) and the sub-advisory agreements (together, the Advisory Contracts) for the fund for six months through January 31, 2019, in connection with the reunification of the Fidelity Equity High Income Funds Board, which oversees the fund, and the Sector Portfolios Board.
The Board considered that the approval of the fund's Advisory Contracts will not result in any changes in (i) the investment process or strategies employed in the management of the fund's assets; (ii) the fees and expenses paid by shareholders; (iii) the nature, extent or quality of services provided under the fund's Advisory Contracts; or (iv) the day-to-day management of the fund or the persons primarily responsible for such management. The Board concluded that the fund's Advisory Contracts are fair and reasonable, and that the fund's Advisory Contracts should be renewed, without modification, through January 31, 2019, with the understanding that the Board will consider the annual renewal for a full one year period in January 2019.
In connection with its consideration of future renewals of the fund's Advisory Contracts, the Board will consider: (i) the nature, extent and quality of services provided to the fund, including shareholder and administrative services and investment performance; (ii) the competitiveness of the management fee and total expenses for the fund; (iii) the costs of the services and profitability, including the revenues earned and the expenses incurred in conducting the business of developing, marketing, distributing, managing, administering, and servicing the fund and its shareholders, to the extent applicable, as well as potential fall-out benefits from Fidelity's non-fund businesses; and (iv) whether there have been economies of scale in respect of the Fidelity funds, whether the Fidelity funds (including the fund) have appropriately benefited from any such economies of scale, and whether there is the potential for realization of any further economies.
Based on its evaluation of all of the conclusions noted above, and after considering all factors it believed relevant, the Board ultimately concluded that the fund's management fee structure is fair and reasonable, and that the continuation of the fund's Advisory Contracts should be approved.
AWLD-ANN-1218
1.883447.109
Fidelity's Broadly Diversified International Equity Funds Fidelity® Diversified International Fund
Fidelity® International Capital Appreciation Fund
Fidelity® Overseas Fund
Fidelity® Worldwide Fund
Annual Report October 31, 2018 |
|
Contents
To view a fund's proxy voting guidelines and proxy voting record for the 12-month period ended June 30, visit http://www.fidelity.com/proxyvotingresults or visit the Securities and Exchange Commission's (SEC) web site at http://www.sec.gov.
You may also call 1-800-544-8544 to request a free copy of the proxy voting guidelines.
Standard & Poor's, S&P and S&P 500 are registered service marks of The McGraw-Hill Companies, Inc. and have been licensed for use by Fidelity Distributors Corporation.
Other third-party marks appearing herein are the property of their respective owners.
All other marks appearing herein are registered or unregistered trademarks or service marks of FMR LLC or an affiliated company. © 2018 FMR LLC. All rights reserved.
This report and the financial statements contained herein are submitted for the general information of the shareholders of the Funds. This report is not authorized for distribution to prospective investors in the Funds unless preceded or accompanied by an effective prospectus.
A fund files its complete schedule of portfolio holdings with the SEC for the first and third quarters of each fiscal year on Form N-Q. Forms N-Q are available on the SEC’s web site at http://www.sec.gov. A fund's Forms N-Q may be reviewed and copied at the SEC’s Public Reference Room in Washington, DC. Information regarding the operation of the SEC's Public Reference Room may be obtained by calling 1-800-SEC-0330.
For a complete list of a fund's portfolio holdings, view the most recent holdings listing, semiannual report, or annual report on Fidelity's web site at http://www.fidelity.com, http://www.institutional.fidelity.com, or http://www.401k.com, as applicable.
NOT FDIC INSURED •MAY LOSE VALUE •NO BANK GUARANTEE
Neither the Funds nor Fidelity Distributors Corporation is a bank.
Fidelity® Diversified International Fund
Performance: The Bottom Line
Average annual total return reflects the change in the value of an investment, assuming reinvestment of distributions from dividend income and capital gains (the profits earned upon the sale of securities that have grown in value, if any) and assuming a constant rate of performance each year. The hypothetical investment and the average annual total returns do not reflect the deduction of taxes that a shareholder would pay on fund distributions or the redemption of fund shares. During periods of reimbursement by Fidelity, a fund’s total return will be greater than it would be had the reimbursement not occurred. How a fund did yesterday is no guarantee of how it will do tomorrow.
Average Annual Total Returns
| For the periods ended October 31, 2018 | Past 1 year | Past 5 years | Past 10 years |
| Fidelity® Diversified International Fund | (9.05)% | 2.56% | 7.26% |
$10,000 Over 10 Years
Let's say hypothetically that $10,000 was invested in Fidelity® Diversified International Fund, a class of the fund, on October 31, 2008.
The chart shows how the value of your investment would have changed, and also shows how the MSCI EAFE Index performed over the same period.
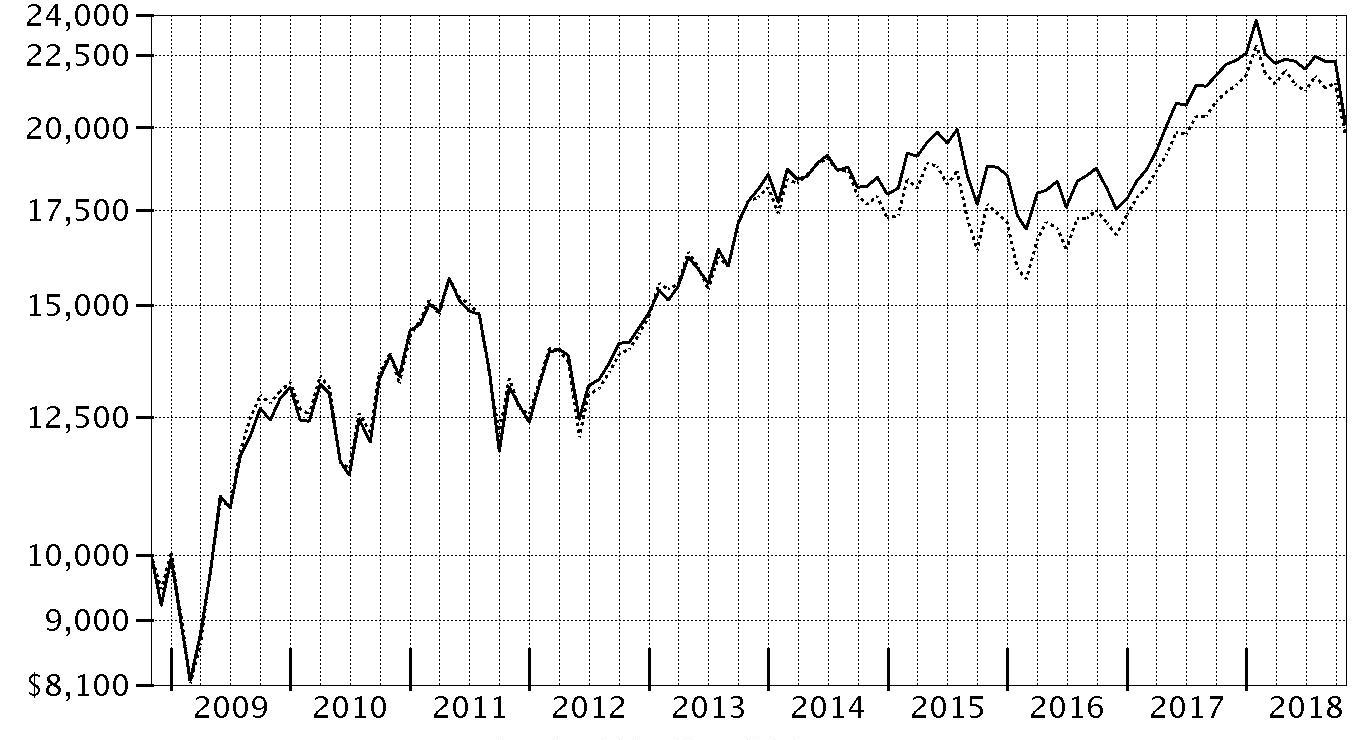
| Period Ending Values |
| $20,145 | Fidelity® Diversified International Fund |
| $19,780 | MSCI EAFE Index |
Fidelity® Diversified International Fund
Management's Discussion of Fund Performance
Market Recap: International equities returned -8.08% for the 12 months ending October 31, 2018, according to the MSCI ACWI (All Country World Index) ex USA Index. A modestly positive first half of the period gave way to a confluence of overwhelmingly negative factors – including escalating trade tensions, a surging U.S. dollar, tepid economic growth in Europe, global central bank tightening, concerns about Italy’s budget stalemate with the EU, and weakness in China’s stock market – that yielded a -11% second-half return. The index lost 8% in October alone, its largest monthly drop in more than six years. Among sectors, new-media-infused communications services (-15%) was hit the hardest, while economically sensitive consumer discretionary (-13%), information technology (-12%), financials (-10%), industrials (-9%) and materials (-7%) stocks also fared poorly. Even the more defensive real estate (-9%), utilities (-6%) and consumer staples (-5%) sectors weren’t spared this period. Conversely, elevated crude-oil prices fueled a positive return for energy (+7%), the top-performing sector, followed by the relatively stable-growing health care segment (+2%). Regionally, emerging markets (-12%) fared the worst, hampered by the impact of foreign exchange and concerns about economic weakness in China, India and South Korea. Sluggish growth also pressured shares in continental Europe (-9%). Stocks in Japan (-3%) and the U.K. (-4%) held up better, followed by Canada (-5%) and Asia-Pacific ex Japan (-6%).
Comments from Portfolio Manager William Bower: For the fiscal year, the fund's share classes returned roughly -9%, trailing the -6.65% return of the benchmark MSCI EAFE Index. Versus the benchmark, security selection – notably in the health care and consumer staples sectors – detracted from performance, along with positioning in financials and energy. Geographically, stock picks in the U.K. and Japan held back the fund's performance versus the index. Individual disappointments included U.K. based software company Micro Focus International. Shares of the company returned -54% for the period, largely because a recent acquisition proved challenging, with revenue declining faster than anticipated amid heavy sales-force attrition. In Japan, an average overweighting in semiconductor manufacturer Renesas Electronics hurt, as excess industry capacity and weakening demand from end markets pressured the stock, which returned roughly -58%. Not owning index heavyweight Royal Dutch Shell was another notable detractor because shares of the Anglo-Dutch multinational oil and gas giant advanced about 8% on higher crude-oil prices and solid quarterly financial results. Conversely, security selection in information technology and materials added value. Top individual contributors included Norway-based exploration and production company Equinor (formerly Statoil), a top holding that benefited from higher crude-oil prices. By region, a non-index stake in the U.S. was helpful. Out-of-benchmark stakes in U.S.-based payment-processing firms Mastercard and Visa also worked out well, as the stocks gained about 34% and 26%, respectively.
The views expressed above reflect those of the portfolio manager(s) only through the end of the period as stated on the cover of this report and do not necessarily represent the views of Fidelity or any other person in the Fidelity organization. Any such views are subject to change at any time based upon market or other conditions and Fidelity disclaims any responsibility to update such views. These views may not be relied on as investment advice and, because investment decisions for a Fidelity fund are based on numerous factors, may not be relied on as an indication of trading intent on behalf of any Fidelity fund.
Fidelity® Diversified International Fund
Investment Summary (Unaudited)
Geographic Diversification (% of fund's net assets)
| As of October 31, 2018 |
| | Japan | 17.0% |
| | United Kingdom | 15.9% |
| | United States of America* | 13.7% |
| | Germany | 8.2% |
| | France | 7.2% |
| | Switzerland | 4.7% |
| | Netherlands | 4.3% |
| | India | 3.7% |
| | Canada | 3.3% |
| | Other | 22.0% |

* Includes Short-Term investments and Net Other Assets (Liabilities).
Percentages are based on country or territory of incorporation and are adjusted for the effect of futures contracts, if applicable.
Asset Allocation as of October 31, 2018
| | % of fund's net assets |
| Stocks | 93.1 |
| Short-Term Investments and Net Other Assets (Liabilities) | 6.9 |
Top Ten Stocks as of October 31, 2018
| | % of fund's net assets |
| Prudential PLC (United Kingdom, Insurance) | 1.4 |
| Roche Holding AG (participation certificate) (Switzerland, Pharmaceuticals) | 1.4 |
| ORIX Corp. (Japan, Diversified Financial Services) | 1.4 |
| British American Tobacco PLC sponsored ADR (United Kingdom, Tobacco) | 1.3 |
| SAP SE (Germany, Software) | 1.3 |
| Keyence Corp. (Japan, Electronic Equipment & Components) | 1.3 |
| Hoya Corp. (Japan, Health Care Equipment & Supplies) | 1.3 |
| Equinor ASA (Norway, Oil, Gas & Consumable Fuels) | 1.3 |
| Unilever NV (Certificaten Van Aandelen) (Bearer) (Netherlands, Personal Products) | 1.3 |
| AstraZeneca PLC (United Kingdom) (United Kingdom, Pharmaceuticals) | 1.2 |
| | 13.2 |
Top Market Sectors as of October 31, 2018
| | % of fund's net assets |
| Financials | 24.3 |
| Industrials | 14.4 |
| Health Care | 12.6 |
| Information Technology | 11.1 |
| Consumer Staples | 10.3 |
| Consumer Discretionary | 7.9 |
| Energy | 4.6 |
| Materials | 4.0 |
| Communication Services | 3.2 |
| Real Estate | 0.4 |
Fidelity® Diversified International Fund
Schedule of Investments October 31, 2018
Showing Percentage of Net Assets
| Common Stocks - 92.4% | | | |
| | | Shares | Value |
| Australia - 0.8% | | | |
| CSL Ltd. | | 547,051 | $72,830,103 |
| Magellan Financial Group Ltd. | | 2,293,393 | 43,265,125 |
|
| TOTAL AUSTRALIA | | | 116,095,228 |
|
| Bailiwick of Jersey - 1.8% | | | |
| Ferguson PLC | | 1,863,395 | 125,830,044 |
| Glencore Xstrata PLC | | 7,812,245 | 31,839,122 |
| Shire PLC | | 1,607,087 | 96,989,211 |
|
| TOTAL BAILIWICK OF JERSEY | | | 254,658,377 |
|
| Belgium - 1.1% | | | |
| KBC Groep NV | | 1,880,228 | 129,695,091 |
| Umicore SA | | 482,507 | 22,729,415 |
|
| TOTAL BELGIUM | | | 152,424,506 |
|
| Bermuda - 1.4% | | | |
| Credicorp Ltd. (United States) | | 315,700 | 71,256,647 |
| Hiscox Ltd. | | 3,557,200 | 74,022,116 |
| IHS Markit Ltd. (a) | | 1,078,200 | 56,637,846 |
|
| TOTAL BERMUDA | | | 201,916,609 |
|
| Canada - 3.3% | | | |
| Alimentation Couche-Tard, Inc. Class B (sub. vtg.) | | 3,402,681 | 162,502,605 |
| CCL Industries, Inc. Class B | | 327,800 | 13,789,786 |
| Cenovus Energy, Inc. (Canada) | | 7,622,903 | 64,506,164 |
| Constellation Software, Inc. | | 53,866 | 37,071,772 |
| Fairfax India Holdings Corp. (a)(b) | | 3,908,200 | 49,595,058 |
| PrairieSky Royalty Ltd. | | 151,898 | 2,307,691 |
| Suncor Energy, Inc. | | 4,038,900 | 135,483,933 |
|
| TOTAL CANADA | | | 465,257,009 |
|
| Cayman Islands - 0.7% | | | |
| Alibaba Group Holding Ltd. sponsored ADR (a) | | 394,900 | 56,186,372 |
| ENN Energy Holdings Ltd. | | 2,825,100 | 24,010,981 |
| Shenzhou International Group Holdings Ltd. | | 667,000 | 7,365,796 |
| Zai Lab Ltd. ADR (a) | | 524,627 | 8,582,898 |
|
| TOTAL CAYMAN ISLANDS | | | 96,146,047 |
|
| China - 0.8% | | | |
| Kweichow Moutai Co. Ltd. (A Shares) | | 484,010 | 38,085,783 |
| Ping An Insurance (Group) Co. of China Ltd. (H Shares) | | 3,683,000 | 34,683,918 |
| Shanghai International Airport Co. Ltd. (A Shares) | | 4,446,338 | 31,583,587 |
| Tonghua Dongbao Pharmaceutical Co. Ltd. Class A | | 5,545,560 | 10,636,943 |
|
| TOTAL CHINA | | | 114,990,231 |
|
| Denmark - 0.6% | | | |
| DONG Energy A/S (b) | | 111,700 | 7,096,882 |
| Netcompany Group A/S | | 547,565 | 18,109,738 |
| NNIT A/S (b) | | 280,100 | 7,909,426 |
| Novozymes A/S Series B | | 973,800 | 48,121,559 |
| SimCorp A/S | | 24,317 | 1,873,549 |
|
| TOTAL DENMARK | | | 83,111,154 |
|
| Finland - 0.8% | | | |
| Nordea Bank ABP (a) | | 7,271,500 | 63,242,181 |
| Sampo Oyj (A Shares) | | 1,235,400 | 56,894,554 |
|
| TOTAL FINLAND | | | 120,136,735 |
|
| France - 7.2% | | | |
| Aeroports de Paris | | 210,400 | 44,063,438 |
| Amundi SA (b) | | 1,578,013 | 93,978,149 |
| BNP Paribas SA | | 2,231,000 | 116,567,841 |
| Capgemini SA | | 821,000 | 100,429,810 |
| Danone SA | | 297,000 | 21,031,577 |
| Eiffage SA | | 286,700 | 28,063,232 |
| Elis SA | | 2,225,400 | 44,942,286 |
| Kering SA | | 76,919 | 34,291,339 |
| LVMH Moet Hennessy - Louis Vuitton SA | | 424,538 | 128,807,134 |
| Maisons du Monde SA (b) | | 273,900 | 6,868,555 |
| Sanofi SA | | 1,877,832 | 167,804,142 |
| Societe Generale Series A | | 1,643,100 | 60,232,351 |
| SR Teleperformance SA | | 236,600 | 39,018,615 |
| Thales SA | | 375,100 | 48,008,843 |
| VINCI SA (c) | | 1,093,500 | 97,320,811 |
|
| TOTAL FRANCE | | | 1,031,428,123 |
|
| Germany - 7.5% | | | |
| adidas AG | | 397,402 | 93,624,414 |
| Allianz SE | | 200,800 | 41,830,649 |
| Aumann AG (b) | | 263,361 | 13,005,698 |
| Axel Springer Verlag AG | | 70,492 | 4,686,770 |
| Bayer AG | | 1,442,176 | 110,546,337 |
| Deutsche Borse AG | | 297,800 | 37,633,754 |
| Deutsche Post AG | | 2,201,019 | 69,497,770 |
| Fresenius SE & Co. KGaA | | 1,658,500 | 105,407,342 |
| Hannover Reuck SE | | 419,400 | 56,576,479 |
| Linde PLC | | 742,434 | 121,806,953 |
| Merck KGaA | | 82,977 | 8,892,757 |
| Morphosys AG (a) | | 120,900 | 11,201,478 |
| Morphosys AG sponsored ADR | | 775,673 | 17,855,992 |
| MTU Aero Engines Holdings AG | | 70,300 | 14,953,630 |
| Rational AG | | 17,189 | 9,968,190 |
| SAP SE | | 1,739,489 | 186,253,164 |
| Scout24 AG (b) | | 710,100 | 29,485,446 |
| Symrise AG | | 819,800 | 68,861,006 |
| Vonovia SE | | 967,900 | 44,312,120 |
| Wirecard AG | | 146,100 | 27,370,419 |
|
| TOTAL GERMANY | | | 1,073,770,368 |
|
| Hong Kong - 1.8% | | | |
| AIA Group Ltd. | | 22,629,800 | 171,268,451 |
| BOC Hong Kong (Holdings) Ltd. | | 9,360,500 | 34,973,782 |
| Techtronic Industries Co. Ltd. | | 10,608,500 | 49,647,339 |
|
| TOTAL HONG KONG | | | 255,889,572 |
|
| India - 3.7% | | | |
| Adani Ports & Special Economic Zone Ltd. | | 6,259,436 | 26,985,143 |
| Axis Bank Ltd. (a) | | 4,220,805 | 33,236,842 |
| Godrej Consumer Products Ltd. | | 1,268,140 | 12,428,492 |
| HDFC Bank Ltd. | | 5,707,097 | 148,157,750 |
| Housing Development Finance Corp. Ltd. | | 6,235,447 | 149,162,583 |
| Kajaria Ceramics Ltd. (a) | | 11,000 | 58,629 |
| Kotak Mahindra Bank Ltd. | | 2,387,505 | 36,127,315 |
| LIC Housing Finance Ltd. | | 3,114,373 | 17,310,962 |
| Reliance Industries Ltd. | | 7,744,112 | 111,120,049 |
|
| TOTAL INDIA | | | 534,587,765 |
|
| Indonesia - 0.9% | | | |
| PT Bank Central Asia Tbk | | 40,781,700 | 63,442,671 |
| PT Bank Rakyat Indonesia Tbk | | 290,755,000 | 60,245,239 |
|
| TOTAL INDONESIA | | | 123,687,910 |
|
| Ireland - 2.4% | | | |
| CRH PLC | | 2,057,500 | 61,437,988 |
| DCC PLC (United Kingdom) | | 385,689 | 33,104,123 |
| Kerry Group PLC Class A | | 836,500 | 85,745,286 |
| Kingspan Group PLC (Ireland) | | 1,673,900 | 72,804,205 |
| Ryanair Holdings PLC sponsored ADR (a) | | 1,112,299 | 92,098,357 |
|
| TOTAL IRELAND | | | 345,189,959 |
|
| Israel - 0.5% | | | |
| Check Point Software Technologies Ltd. (a) | | 595,800 | 66,133,800 |
| Italy - 0.7% | | | |
| FinecoBank SpA | | 872,300 | 9,135,146 |
| Intesa Sanpaolo SpA | | 19,674,300 | 43,580,045 |
| Prada SpA | | 8,521,200 | 30,099,304 |
| Recordati SpA | | 550,100 | 18,642,277 |
|
| TOTAL ITALY | | | 101,456,772 |
|
| Japan - 17.0% | | | |
| Bandai Namco Holdings, Inc. | | 638,000 | 22,701,910 |
| Daikin Industries Ltd. | | 911,600 | 105,665,311 |
| GMO Internet, Inc. | | 823,800 | 11,769,093 |
| Hoya Corp. | | 3,179,300 | 180,724,334 |
| Iriso Electronics Co. Ltd. | | 126,300 | 5,344,818 |
| Itochu Corp. | | 1,567,700 | 29,074,514 |
| Kao Corp. | | 1,140,100 | 75,841,991 |
| Keyence Corp. | | 372,320 | 182,472,602 |
| Minebea Mitsumi, Inc. | | 7,428,800 | 113,645,974 |
| Misumi Group, Inc. | | 1,449,500 | 29,109,470 |
| Mitsubishi UFJ Financial Group, Inc. | | 23,319,000 | 141,138,081 |
| Morinaga & Co. Ltd. | | 528,700 | 21,249,209 |
| Nabtesco Corp. | | 640,200 | 14,116,343 |
| Nidec Corp. | | 640,100 | 82,200,106 |
| Nintendo Co. Ltd. | | 39,200 | 12,238,353 |
| Nissan Chemical Corp. | | 386,200 | 18,209,826 |
| Nitori Holdings Co. Ltd. | | 776,500 | 101,402,291 |
| NOF Corp. | | 100,000 | 2,840,431 |
| Olympus Corp. | | 1,229,600 | 40,984,779 |
| ORIX Corp. | | 11,856,300 | 193,445,724 |
| Outsourcing, Inc. | | 1,280,300 | 16,225,719 |
| PALTAC Corp. | | 438,800 | 22,399,858 |
| Panasonic Corp. | | 1,300,800 | 13,959,478 |
| Recruit Holdings Co. Ltd. | | 4,628,500 | 124,227,052 |
| Renesas Electronics Corp. (a) | | 5,289,300 | 28,032,095 |
| Seria Co. Ltd. (c) | | 179,800 | 6,063,181 |
| Shin-Etsu Chemical Co. Ltd. | | 576,800 | 48,197,708 |
| Shiseido Co. Ltd. | | 1,045,200 | 65,947,418 |
| SMC Corp. | | 208,800 | 66,895,201 |
| SoftBank Corp. | | 1,468,300 | 116,199,528 |
| Sony Corp. | | 2,866,200 | 155,109,436 |
| Subaru Corp. | | 800,300 | 21,587,850 |
| Sundrug Co. Ltd. | | 493,700 | 17,939,203 |
| Suzuki Motor Corp. | | 1,234,200 | 61,545,505 |
| Temp Holdings Co., Ltd. | | 1,014,200 | 19,306,967 |
| Tsubaki Nakashima Co. Ltd. | | 567,300 | 10,457,606 |
| Tsuruha Holdings, Inc. | | 1,003,900 | 104,629,450 |
| Welcia Holdings Co. Ltd. | | 1,487,400 | 75,928,781 |
| Yahoo! Japan Corp. | | 6,910,100 | 21,558,122 |
| Zozo, Inc. | | 1,746,100 | 42,076,004 |
|
| TOTAL JAPAN | | | 2,422,461,322 |
|
| Korea (South) - 0.3% | | | |
| Cafe24 Corp. (a) | | 107,400 | 10,401,139 |
| LG Chemical Ltd. | | 107,468 | 32,683,082 |
|
| TOTAL KOREA (SOUTH) | | | 43,084,221 |
|
| Luxembourg - 0.8% | | | |
| B&M European Value Retail S.A. | | 17,096,063 | 91,079,918 |
| Samsonite International SA | | 8,327,100 | 23,891,985 |
|
| TOTAL LUXEMBOURG | | | 114,971,903 |
|
| Netherlands - 4.3% | | | |
| Adyen BV (b) | | 49,983 | 32,331,824 |
| ASML Holding NV | | 759,400 | 130,890,184 |
| Heineken NV (Bearer) | | 367,200 | 33,106,363 |
| ING Groep NV (Certificaten Van Aandelen) | | 3,530,600 | 41,770,513 |
| Koninklijke Philips Electronics NV | | 2,382,200 | 88,846,192 |
| LyondellBasell Industries NV Class A | | 84,016 | 7,500,108 |
| Unilever NV (Certificaten Van Aandelen) (Bearer) | | 3,329,457 | 178,908,375 |
| Wolters Kluwer NV | | 1,829,400 | 103,935,027 |
|
| TOTAL NETHERLANDS | | | 617,288,586 |
|
| New Zealand - 0.3% | | | |
| Ryman Healthcare Group Ltd. | | 4,872,728 | 38,474,354 |
| Norway - 1.6% | | | |
| Equinor ASA | | 6,914,700 | 179,884,898 |
| Schibsted ASA (A Shares) | | 1,550,840 | 53,737,973 |
|
| TOTAL NORWAY | | | 233,622,871 |
|
| South Africa - 0.1% | | | |
| Capitec Bank Holdings Ltd. | | 267,300 | 17,949,913 |
| Spain - 1.9% | | | |
| Aedas Homes SAU (b) | | 101,364 | 2,622,259 |
| Amadeus IT Holding SA Class A | | 1,505,200 | 121,352,275 |
| CaixaBank SA (c) | | 23,209,800 | 93,923,355 |
| Masmovil Ibercom SA (a) | | 179,353 | 23,280,322 |
| Neinor Homes SLU (a)(b) | | 258,400 | 4,156,010 |
| Prosegur Cash SA (b) | | 16,685,574 | 33,073,102 |
|
| TOTAL SPAIN | | | 278,407,323 |
|
| Sweden - 1.8% | | | |
| Alfa Laval AB | | 1,318,900 | 33,681,770 |
| ASSA ABLOY AB (B Shares) | | 4,382,500 | 87,171,273 |
| Coor Service Management Holding AB (b) | | 4,086,300 | 28,801,446 |
| HEXPOL AB (B Shares) | | 3,518,000 | 32,561,438 |
| Indutrade AB | | 790,900 | 18,979,215 |
| Swedbank AB (A Shares) | | 1,560,500 | 35,145,206 |
| Telefonaktiebolaget LM Ericsson (B Shares) | | 1,921,100 | 16,726,554 |
|
| TOTAL SWEDEN | | | 253,066,902 |
|
| Switzerland - 4.7% | | | |
| Credit Suisse Group AG | | 6,415,863 | 83,878,857 |
| Julius Baer Group Ltd. | | 1,239,630 | 56,533,058 |
| Lonza Group AG | | 221,677 | 69,706,703 |
| Roche Holding AG (participation certificate) | | 813,384 | 197,947,090 |
| Sig Combibloc Group AG (a) | | 1,373,900 | 15,232,058 |
| Sika AG | | 892,844 | 114,536,509 |
| Swatch Group AG (Bearer) | | 122,860 | 41,573,438 |
| TE Connectivity Ltd. | | 179,900 | 13,568,058 |
| UBS Group AG | | 5,118,487 | 71,607,488 |
|
| TOTAL SWITZERLAND | | | 664,583,259 |
|
| Taiwan - 0.9% | | | |
| Taiwan Semiconductor Manufacturing Co. Ltd. sponsored ADR | | 3,472,100 | 132,287,010 |
| United Kingdom - 15.9% | | | |
| Admiral Group PLC | | 1,593,700 | 41,006,166 |
| Aon PLC | | 237,900 | 37,155,222 |
| Ascential PLC | | 7,800,273 | 37,568,124 |
| Ashtead Group PLC | | 12,148 | 300,536 |
| AstraZeneca PLC (United Kingdom) | | 2,275,639 | 174,062,871 |
| Beazley PLC | | 4,203,700 | 28,343,468 |
| Big Yellow Group PLC | | 937,900 | 10,339,855 |
| BP PLC sponsored ADR | | 2,221,700 | 96,355,129 |
| British American Tobacco PLC sponsored ADR | | 4,363,400 | 189,371,560 |
| Bunzl PLC | | 2,979,770 | 88,020,028 |
| Coca-Cola European Partners PLC | | 1,052,100 | 47,860,029 |
| Compass Group PLC | | 4,429,588 | 87,193,250 |
| Cranswick PLC | | 376,246 | 13,898,520 |
| DS Smith PLC | | 3,028,109 | 15,207,308 |
| Halma PLC | | 1,791,056 | 30,402,273 |
| Hastings Group Holdings PLC (b) | | 12,725,078 | 30,106,875 |
| Indivior PLC (a) | | 8,140,200 | 19,597,448 |
| Informa PLC | | 2,785,793 | 25,409,873 |
| InterContinental Hotel Group PLC | | 531,000 | 27,895,565 |
| ITV PLC | | 12,415,100 | 23,636,847 |
| John Wood Group PLC | | 4,104,800 | 37,472,327 |
| LivaNova PLC (a) | | 166,100 | 18,601,539 |
| Lloyds Banking Group PLC | | 131,962,100 | 96,298,030 |
| London Stock Exchange Group PLC | | 1,820,700 | 100,419,489 |
| Melrose Industries PLC | | 21,678,900 | 46,732,864 |
| Micro Focus International PLC | | 3,177,195 | 49,253,565 |
| Ocado Group PLC (a) | | 232,700 | 2,543,682 |
| Prudential PLC | | 9,885,981 | 197,953,172 |
| Reckitt Benckiser Group PLC | | 1,830,587 | 148,028,797 |
| RELX PLC | | 4,939,899 | 97,747,735 |
| Rentokil Initial PLC | | 3,810,500 | 15,400,777 |
| Smith & Nephew PLC | | 3,011,400 | 48,949,876 |
| Spectris PLC | | 1,318,600 | 36,135,716 |
| St. James's Place Capital PLC | | 7,754,100 | 100,450,930 |
| Standard Chartered PLC (United Kingdom) | | 5,685,457 | 39,932,996 |
| Standard Life PLC | | 16,652,764 | 57,577,448 |
| Tesco PLC | | 35,805,719 | 97,514,210 |
| The Weir Group PLC | | 2,785,500 | 56,468,358 |
|
| TOTAL UNITED KINGDOM | | | 2,271,212,458 |
|
| United States of America - 6.8% | | | |
| Alphabet, Inc. Class C (a) | | 99,203 | 106,818,814 |
| Amgen, Inc. | | 520,800 | 100,405,032 |
| Becton, Dickinson & Co. | | 206,300 | 47,552,150 |
| Boston Scientific Corp. (a) | | 2,117,528 | 76,527,462 |
| Citigroup, Inc. | | 1,198,400 | 78,447,264 |
| Coty, Inc. Class A | | 4,273,000 | 45,080,150 |
| DowDuPont, Inc. | | 363,300 | 19,589,136 |
| FleetCor Technologies, Inc. (a) | | 120,000 | 24,003,600 |
| International Flavors & Fragrances, Inc. | | 297,400 | 43,021,884 |
| International Flavors & Fragrances, Inc. (Israel) | | 31,584 | 4,560,336 |
| Marsh & McLennan Companies, Inc. | | 144,047 | 12,207,983 |
| MasterCard, Inc. Class A | | 723,700 | 143,053,779 |
| Microsoft Corp. | | 135,100 | 14,430,031 |
| Oceaneering International, Inc. (a) | | 284,947 | 5,396,896 |
| Quintiles Transnational Holdings, Inc. (a) | | 360,200 | 44,279,386 |
| S&P Global, Inc. | | 321,400 | 58,597,648 |
| Visa, Inc. Class A | | 1,020,300 | 140,648,355 |
|
| TOTAL UNITED STATES OF AMERICA | | | 964,619,906 |
|
| TOTAL COMMON STOCKS | | | |
| (Cost $11,030,516,204) | | | 13,188,910,193 |
|
| Nonconvertible Preferred Stocks - 0.7% | | | |
| Germany - 0.7% | | | |
| Henkel AG & Co. KGaA | | 627,700 | 68,664,942 |
| Jungheinrich AG | | 484,800 | 16,088,885 |
| Sartorius AG (non-vtg.) | | 134,984 | 19,569,872 |
| TOTAL NONCONVERTIBLE PREFERRED STOCKS | | | |
| (Cost $76,302,976) | | | 104,323,699 |
|
| Money Market Funds - 7.4% | | | |
| Fidelity Cash Central Fund, 2.23% (d) | | 874,641,587 | 874,816,515 |
| Fidelity Securities Lending Cash Central Fund 2.23% (d)(e) | | 175,554,514 | 175,572,069 |
| TOTAL MONEY MARKET FUNDS | | | |
| (Cost $1,050,365,851) | | | 1,050,388,584 |
| TOTAL INVESTMENT IN SECURITIES - 100.5% | | | |
| (Cost $12,157,185,031) | | | 14,343,622,476 |
| NET OTHER ASSETS (LIABILITIES) - (0.5)% | | | (69,434,476) |
| NET ASSETS - 100% | | | $14,274,188,000 |
Categorizations in the Schedule of Investments are based on country or territory of incorporation.
Legend
(a) Non-income producing
(b) Security exempt from registration under Rule 144A of the Securities Act of 1933. These securities may be resold in transactions exempt from registration, normally to qualified institutional buyers. At the end of the period, the value of these securities amounted to $339,030,730 or 2.4% of net assets.
(c) Security or a portion of the security is on loan at period end.
(d) Affiliated fund that is generally available only to investment companies and other accounts managed by Fidelity Investments. The rate quoted is the annualized seven-day yield of the fund at period end. A complete unaudited listing of the fund's holdings as of its most recent quarter end is available upon request. In addition, each Fidelity Central Fund's financial statements, which are not covered by the Fund's Report of Independent Registered Public Accounting Firm, are available on the SEC's website or upon request.
(e) Investment made with cash collateral received from securities on loan.
Affiliated Central Funds
Information regarding fiscal year to date income earned by the Fund from investments in Fidelity Central Funds is as follows:
| Fund | Income earned |
| Fidelity Cash Central Fund | $6,470,983 |
| Fidelity Securities Lending Cash Central Fund | 3,702,220 |
| Total | $10,173,203 |
Amounts in the income column in the above table include any capital gain distributions from underlying funds, which are presented in the corresponding line-item in the Statement of Operations if applicable.
Investment Valuation
The following is a summary of the inputs used, as of October 31, 2018, involving the Fund's assets and liabilities carried at fair value. The inputs or methodology used for valuing securities may not be an indication of the risk associated with investing in those securities. For more information on valuation inputs, and their aggregation into the levels used below, please refer to the Investment Valuation section in the accompanying Notes to Financial Statements.
| | Valuation Inputs at Reporting Date: |
| Description | Total | Level 1 | Level 2 | Level 3 |
| Investments in Securities: | | | | |
| Equities: | | | | |
| Communication Services | $425,134,726 | $275,138,723 | $149,996,003 | $-- |
| Consumer Discretionary | 1,132,069,614 | 751,060,211 | 381,009,403 | -- |
| Consumer Staples | 1,503,762,741 | 916,490,373 | 587,272,368 | -- |
| Energy | 632,527,087 | 632,527,087 | -- | -- |
| Financials | 3,464,883,640 | 2,421,954,025 | 1,042,929,615 | -- |
| Health Care | 1,803,527,994 | 771,990,154 | 1,031,537,840 | -- |
| Industrials | 2,052,196,624 | 1,425,593,919 | 626,602,705 | -- |
| Information Technology | 1,589,830,669 | 1,337,597,386 | 252,233,283 | -- |
| Materials | 600,918,700 | 473,073,178 | 127,845,522 | -- |
| Real Estate | 57,274,234 | 57,274,234 | -- | -- |
| Utilities | 31,107,863 | 31,107,863 | -- | -- |
| Money Market Funds | 1,050,388,584 | 1,050,388,584 | -- | -- |
| Total Investments in Securities: | $14,343,622,476 | $10,144,195,737 | $4,199,426,739 | $-- |
The following is a summary of transfers between Level 1 and Level 2 for the period ended October 31, 2018. Transfers are assumed to have occurred at the beginning of the period, and are primarily attributable to the valuation techniques used for foreign equity securities, as discussed in the accompanying Notes to Financial Statements:
| Transfers | Total |
| Level 1 to Level 2 | $694,766,645 |
| Level 2 to Level 1 | $2,068,649,687 |
See accompanying notes which are an integral part of the financial statements.
Fidelity® Diversified International Fund
Financial Statements
Statement of Assets and Liabilities
| | | October 31, 2018 |
| Assets | | |
Investment in securities, at value (including securities loaned of $167,449,786) — See accompanying schedule:
Unaffiliated issuers (cost $11,106,819,180) | $13,293,233,892 | |
| Fidelity Central Funds (cost $1,050,365,851) | 1,050,388,584 | |
| Total Investment in Securities (cost $12,157,185,031) | | $14,343,622,476 |
| Foreign currency held at value (cost $455,935) | | 456,027 |
| Receivable for investments sold | | 60,363,383 |
| Receivable for fund shares sold | | 46,615,846 |
| Dividends receivable | | 60,587,438 |
| Distributions receivable from Fidelity Central Funds | | 1,150,040 |
| Prepaid expenses | | 31,777 |
| Other receivables | | 2,820,262 |
| Total assets | | 14,515,647,249 |
| Liabilities | | |
| Payable for investments purchased | $44,643,378 | |
| Payable for fund shares redeemed | 10,039,183 | |
| Accrued management fee | 6,584,575 | |
| Other affiliated payables | 1,759,378 | |
| Other payables and accrued expenses | 2,884,873 | |
| Collateral on securities loaned | 175,547,862 | |
| Total liabilities | | 241,459,249 |
| Net Assets | | $14,274,188,000 |
| Net Assets consist of: | | |
| Paid in capital | | $11,328,551,998 |
| Total distributable earnings (loss) | | 2,945,636,002 |
| Net Assets | | $14,274,188,000 |
| Net Asset Value and Maximum Offering Price | | |
| Diversified International: | | |
| Net Asset Value, offering price and redemption price per share ($9,275,298,576 ÷ 259,685,883 shares) | | $35.72 |
| Class K: | | |
| Net Asset Value, offering price and redemption price per share ($4,998,889,424 ÷ 140,115,318 shares) | | $35.68 |
See accompanying notes which are an integral part of the financial statements.
Statement of Operations
| | | Year ended October 31, 2018 |
| Investment Income | | |
| Dividends | | $383,493,275 |
| Income from Fidelity Central Funds | | 10,173,203 |
| Income before foreign taxes withheld | | 393,666,478 |
| Less foreign taxes withheld | | (35,520,671) |
| Total income | | 358,145,807 |
| Expenses | | |
| Management fee | | |
| Basic fee | $115,895,597 | |
| Performance adjustment | (8,804,399) | |
| Transfer agent fees | 20,666,926 | |
| Accounting and security lending fees | 2,091,606 | |
| Custodian fees and expenses | 2,028,086 | |
| Independent trustees' fees and expenses | 88,278 | |
| Registration fees | 96,020 | |
| Audit | 117,125 | |
| Legal | 52,385 | |
| Miscellaneous | 131,291 | |
| Total expenses before reductions | 132,362,915 | |
| Expense reductions | (2,722,337) | |
| Total expenses after reductions | | 129,640,578 |
| Net investment income (loss) | | 228,505,229 |
| Realized and Unrealized Gain (Loss) | | |
| Net realized gain (loss) on: | | |
| Investment securities: | | |
| Unaffiliated issuers | 1,831,038,559 | |
| Fidelity Central Funds | 45,947 | |
| Foreign currency transactions | (3,832,936) | |
| Total net realized gain (loss) | | 1,827,251,570 |
| Change in net unrealized appreciation (depreciation) on: | | |
| Investment securities: | | |
| Unaffiliated issuers (net of decrease in deferred foreign taxes of $2,897,453) | (3,416,875,425) | |
| Fidelity Central Funds | (20,420) | |
| Assets and liabilities in foreign currencies | (556,046) | |
| Total change in net unrealized appreciation (depreciation) | | (3,417,451,891) |
| Net gain (loss) | | (1,590,200,321) |
| Net increase (decrease) in net assets resulting from operations | | $(1,361,695,092) |
See accompanying notes which are an integral part of the financial statements.
Statement of Changes in Net Assets
| | Year ended October 31, 2018 | Year ended October 31, 2017 |
| Increase (Decrease) in Net Assets | | |
| Operations | | |
| Net investment income (loss) | $228,505,229 | $220,004,102 |
| Net realized gain (loss) | 1,827,251,570 | 1,655,511,842 |
| Change in net unrealized appreciation (depreciation) | (3,417,451,891) | 1,955,253,295 |
| Net increase (decrease) in net assets resulting from operations | (1,361,695,092) | 3,830,769,239 |
| Distributions to shareholders | (992,277,149) | – |
| Distributions to shareholders from net investment income | – | (223,211,879) |
| Distributions to shareholders from net realized gain | – | (38,126,771) |
| Total distributions | (992,277,149) | (261,338,650) |
| Share transactions - net increase (decrease) | (3,220,213,051) | (3,320,742,656) |
| Redemption fees | – | 26,003 |
| Total increase (decrease) in net assets | (5,574,185,292) | 248,713,936 |
| Net Assets | | |
| Beginning of period | 19,848,373,292 | 19,599,659,356 |
| End of period | $14,274,188,000 | $19,848,373,292 |
| Other Information | | |
| Undistributed net investment income end of period | | $198,580,550 |
See accompanying notes which are an integral part of the financial statements.
Financial Highlights
Fidelity Diversified International Fund
| Years ended October 31, | 2018 | 2017 | 2016 | 2015 | 2014 |
| Selected Per–Share Data | | | | | |
| Net asset value, beginning of period | $41.39 | $34.28 | $36.07 | $36.22 | $35.89 |
| Income from Investment Operations | | | | | |
| Net investment income (loss)A | .50 | .41 | .39 | .36 | .60B |
| Net realized and unrealized gain (loss) | (4.05) | 7.15 | (1.71) | .80 | .28 |
| Total from investment operations | (3.55) | 7.56 | (1.32) | 1.16 | .88 |
| Distributions from net investment income | (.43) | (.38) | (.33)C | (.40) | (.32) |
| Distributions from net realized gain | (1.69) | (.07) | (.14)C | (.92) | (.23) |
| Total distributions | (2.12) | (.45) | (.47) | (1.31)D | (.55) |
| Redemption fees added to paid in capitalA | – | –E | –E | –E | –E |
| Net asset value, end of period | $35.72 | $41.39 | $34.28 | $36.07 | $36.22 |
| Total ReturnF | (9.05)% | 22.38% | (3.70)% | 3.29% | 2.48% |
| Ratios to Average Net AssetsG,H | | | | | |
| Expenses before reductions | .81% | .94% | 1.05% | 1.00% | .93% |
| Expenses net of fee waivers, if any | .80% | .94% | 1.05% | .99% | .93% |
| Expenses net of all reductions | .79% | .93% | 1.05% | .99% | .92% |
| Net investment income (loss) | 1.27% | 1.10% | 1.15% | .98% | 1.65%B |
| Supplemental Data | | | | | |
| Net assets, end of period (000 omitted) | $9,275,299 | $11,349,633 | $10,990,703 | $13,059,983 | $13,781,306 |
| Portfolio turnover rateI | 30%J | 37%J | 24%J | 31%J | 39%J |
A Calculated based on average shares outstanding during the period.
B Net investment income per share reflects a large, non-recurring dividend which amounted to $.18 per share. Excluding this non-recurring dividend, the ratio of net investment income (loss) to average net assets would have been 1.16%.
C The amounts shown reflect certain reclassifications related to book to tax differences that were made in the year shown.
D Total distributions of $1.31 per share is comprised of distributions from net investment income of $.397 and distributions from net realized gain of $.917 per share.
E Amount represents less than $.005 per share.
F Total returns would have been lower if certain expenses had not been reduced during the applicable periods shown.
G Fees and expenses of any underlying Fidelity Central Funds are not included in the Fund's expense ratio. The Fund indirectly bears its proportionate share of the expenses of any underlying Fidelity Central Funds.
H Expense ratios reflect operating expenses of the class. Expenses before reductions do not reflect amounts reimbursed by the investment adviser or reductions from brokerage service arrangements or reductions from other expense offset arrangements and do not represent the amount paid by the class during periods when reimbursements or reductions occur. Expenses net of fee waivers reflect expenses after reimbursement by the investment adviser but prior to reductions from brokerage service arrangements or other expense offset arrangements. Expenses net of all reductions represent the net expenses paid by the class.
I Amount does not include the portfolio activity of any underlying Fidelity Central Funds.
J Portfolio turnover rate excludes securities received or delivered in-kind.
See accompanying notes which are an integral part of the financial statements.
Fidelity Diversified International Fund Class K
| Years ended October 31, | 2018 | 2017 | 2016 | 2015 | 2014 |
| Selected Per–Share Data | | | | | |
| Net asset value, beginning of period | $41.35 | $34.25 | $36.04 | $36.20 | $35.87 |
| Income from Investment Operations | | | | | |
| Net investment income (loss)A | .55 | .45 | .44 | .40 | .65B |
| Net realized and unrealized gain (loss) | (4.05) | 7.15 | (1.71) | .80 | .28 |
| Total from investment operations | (3.50) | 7.60 | (1.27) | 1.20 | .93 |
| Distributions from net investment income | (.48) | (.43) | (.38)C | (.45) | (.37) |
| Distributions from net realized gain | (1.69) | (.07) | (.14)C | (.92) | (.23) |
| Total distributions | (2.17) | (.50) | (.52) | (1.36)D | (.60) |
| Redemption fees added to paid in capitalA | – | –E | –E | –E | –E |
| Net asset value, end of period | $35.68 | $41.35 | $34.25 | $36.04 | $36.20 |
| Total ReturnF | (8.95)% | 22.55% | (3.57)% | 3.40% | 2.63% |
| Ratios to Average Net AssetsG,H | | | | | |
| Expenses before reductions | .69% | .82% | .92% | .87% | .80% |
| Expenses net of fee waivers, if any | .69% | .81% | .92% | .87% | .80% |
| Expenses net of all reductions | .67% | .81% | .92% | .86% | .79% |
| Net investment income (loss) | 1.39% | 1.22% | 1.28% | 1.10% | 1.78%B |
| Supplemental Data | | | | | |
| Net assets, end of period (000 omitted) | $4,998,889 | $8,498,740 | $8,608,956 | $10,143,540 | $11,134,431 |
| Portfolio turnover rateI | 30%J | 37%J | 24%J | 31%J | 39%J |
A Calculated based on average shares outstanding during the period.
B Net investment income per share reflects a large, non-recurring dividend which amounted to $.18 per share. Excluding this non-recurring dividend, the ratio of net investment income (loss) to average net assets would have been 1.29%.
C The amounts shown reflect certain reclassifications related to book to tax differences that were made in the year shown.
D Total distributions of $1.36 per share is comprised of distributions from net investment income of $.446 and distributions from net realized gain of $.917 per share.
E Amount represents less than $.005 per share.
F Total returns would have been lower if certain expenses had not been reduced during the applicable periods shown.
G Fees and expenses of any underlying Fidelity Central Funds are not included in the Fund's expense ratio. The Fund indirectly bears its proportionate share of the expenses of any underlying Fidelity Central Funds.
H Expense ratios reflect operating expenses of the class. Expenses before reductions do not reflect amounts reimbursed by the investment adviser or reductions from brokerage service arrangements or reductions from other expense offset arrangements and do not represent the amount paid by the class during periods when reimbursements or reductions occur. Expenses net of fee waivers reflect expenses after reimbursement by the investment adviser but prior to reductions from brokerage service arrangements or other expense offset arrangements. Expenses net of all reductions represent the net expenses paid by the class.
I Amount does not include the portfolio activity of any underlying Fidelity Central Funds.
J Portfolio turnover rate excludes securities received or delivered in-kind.
See accompanying notes which are an integral part of the financial statements.
Notes to Financial Statements
For the period ended October 31, 2018
1. Organization.
Fidelity Diversified International Fund (the Fund) is a fund of Fidelity Investment Trust (the Trust) and is authorized to issue an unlimited number of shares. The Trust is registered under the Investment Company Act of 1940, as amended (the 1940 Act), as an open-end management investment company organized as a Massachusetts business trust. The Fund offers Diversified International and Class K shares, each of which has equal rights as to assets and voting privileges. Each class has exclusive voting rights with respect to matters that affect that class. The Fund's investments in emerging markets can be subject to social, economic, regulatory, and political uncertainties and can be extremely volatile.
2. Investments in Fidelity Central Funds.
The Fund invests in Fidelity Central Funds, which are open-end investment companies generally available only to other investment companies and accounts managed by the investment adviser and its affiliates. The Fund's Schedule of Investments lists each of the Fidelity Central Funds held as of period end, if any, as an investment of the Fund, but does not include the underlying holdings of each Fidelity Central Fund. As an Investing Fund, the Fund indirectly bears its proportionate share of the expenses of the underlying Fidelity Central Funds.
The Money Market Central Funds seek preservation of capital and current income and are managed by Fidelity Investments Money Management, Inc. (FIMM), an affiliate of the investment adviser. Annualized expenses of the Money Market Central Funds as of their most recent shareholder report date are less than .005%.
A complete unaudited list of holdings for each Fidelity Central Fund is available upon request or at the Securities and Exchange Commission (the SEC) website at www.sec.gov. In addition, the financial statements of the Fidelity Central Funds, which are not covered by the Fund's Report of Independent Registered Public Accounting Firm, are available on the SEC website or upon request.
3. Significant Accounting Policies.
The Fund is an investment company and applies the accounting and reporting guidance of the Financial Accounting Standards Board (FASB) Accounting Standards Codification Topic 946 Financial Services – Investments Companies. The financial statements have been prepared in conformity with accounting principles generally accepted in the United States of America (GAAP), which require management to make certain estimates and assumptions at the date of the financial statements. Actual results could differ from those estimates. Subsequent events, if any, through the date that the financial statements were issued have been evaluated in the preparation of the financial statements. The following summarizes the significant accounting policies of the Fund:
Investment Valuation. Investments are valued as of 4:00 p.m. Eastern time on the last calendar day of the period. The Board of Trustees (the Board) has delegated the day to day responsibility for the valuation of the Fund's investments to the Fair Value Committee (the Committee) established by the Fund's investment adviser. In accordance with valuation policies and procedures approved by the Board, the Fund attempts to obtain prices from one or more third party pricing vendors or brokers to value its investments. When current market prices, quotations or currency exchange rates are not readily available or reliable, investments will be fair valued in good faith by the Committee, in accordance with procedures adopted by the Board. Factors used in determining fair value vary by investment type and may include market or investment specific events. The frequency with which these procedures are used cannot be predicted and they may be utilized to a significant extent. The Committee oversees the Fund's valuation policies and procedures and reports to the Board on the Committee's activities and fair value determinations. The Board monitors the appropriateness of the procedures used in valuing the Fund's investments and ratifies the fair value determinations of the Committee.
The Fund categorizes the inputs to valuation techniques used to value its investments into a disclosure hierarchy consisting of three levels as shown below:
- Level 1 – quoted prices in active markets for identical investments
- Level 2 – other significant observable inputs (including quoted prices for similar investments, interest rates, prepayment speeds, etc.)
- Level 3 – unobservable inputs (including the Fund's own assumptions based on the best information available)
Valuation techniques used to value the Fund's investments by major category are as follows:
Equity securities, including restricted securities, for which market quotations are readily available, are valued at the last reported sale price or official closing price as reported by a third party pricing vendor on the primary market or exchange on which they are traded and are categorized as Level 1 in the hierarchy. In the event there were no sales during the day or closing prices are not available, securities are valued at the last quoted bid price or may be valued using the last available price and are generally categorized as Level 2 in the hierarchy. For foreign equity securities, when market or security specific events arise, comparisons to the valuation of American Depositary Receipts (ADRs), futures contracts, Exchange-Traded Funds (ETFs) and certain indexes as well as quoted prices for similar securities may be used and would be categorized as Level 2 in the hierarchy. Utilizing these techniques may result in transfers between Level 1 and Level 2. For equity securities, including restricted securities, where observable inputs are limited, assumptions about market activity and risk are used and these securities may be categorized as Level 3 in the hierarchy.
Investments in open-end mutual funds, including the Fidelity Central Funds, are valued at their closing net asset value (NAV) each business day and are categorized as Level 1 in the hierarchy.
Changes in valuation techniques may result in transfers in or out of an assigned level within the disclosure hierarchy. The aggregate value of investments by input level as of October 31, 2018, including information on transfers between Levels 1 and 2 is included at the end of the Fund's Schedule of Investments.
Foreign Currency. The Fund may use foreign currency contracts to facilitate transactions in foreign-denominated securities. Gains and losses from these transactions may arise from changes in the value of the foreign currency or if the counterparties do not perform under the contracts' terms.
Foreign-denominated assets, including investment securities, and liabilities are translated into U.S. dollars at the exchange rates at period end. Purchases and sales of investment securities, income and dividends received and expenses denominated in foreign currencies are translated into U.S. dollars at the exchange rate in effect on the transaction date.
The effects of exchange rate fluctuations on investments are included with the net realized and unrealized gain (loss) on investment securities. Other foreign currency transactions resulting in realized and unrealized gain (loss) are disclosed separately.
Investment Transactions and Income. For financial reporting purposes, the Fund's investment holdings and NAV include trades executed through the end of the last business day of the period. The NAV per share for processing shareholder transactions is calculated as of the close of business of the New York Stock Exchange (NYSE), normally 4:00 p.m. Eastern time and includes trades executed through the end of the prior business day. Gains and losses on securities sold are determined on the basis of identified cost and include proceeds received from litigation. Dividend income is recorded on the ex-dividend date, except for certain dividends from foreign securities where the ex-dividend date may have passed, which are recorded as soon as the Fund is informed of the ex-dividend date. Non-cash dividends included in dividend income, if any, are recorded at the fair market value of the securities received. Income and capital gain distributions from Fidelity Central Funds, if any, are recorded on the ex-dividend date. Certain distributions received by the Fund represent a return of capital or capital gain. The Fund determines the components of these distributions subsequent to the ex-dividend date, based upon receipt of tax filings or other correspondence relating to the underlying investment. These distributions are recorded as a reduction of cost of investments and/or as a realized gain. Investment income is recorded net of foreign taxes withheld where recovery of such taxes is uncertain.
Class Allocations and Expenses. Investment income, realized and unrealized capital gains and losses, common expenses of the Fund, and certain fund-level expense reductions, if any, are allocated daily on a pro-rata basis to each class based on the relative net assets of each class to the total net assets of the Fund. Each class differs with respect to transfer agent fees incurred. Certain expense reductions may also differ by class. For the reporting period, the allocated portion of income and expenses to each class as a percent of its average net assets may vary due to the timing of recording these transactions in relation to fluctuating net assets of the classes. Expenses directly attributable to a fund are charged to that fund. Expenses attributable to more than one fund are allocated among the respective funds on the basis of relative net assets or other appropriate methods. Expense estimates are accrued in the period to which they relate and adjustments are made when actual amounts are known.
Deferred Trustee Compensation. Under a Deferred Compensation Plan (the Plan) for the Fund, certain independent Trustees have elected to defer receipt of a portion of their annual compensation. Deferred amounts are invested in a cross-section of Fidelity funds, are marked-to-market and remain in the Fund until distributed in accordance with the Plan. The investment of deferred amounts and the offsetting payable to the Trustees of $2,050,969 are included in the accompanying Statement of Assets and Liabilities in other receivables and other payables and accrued expenses, respectively.
Income Tax Information and Distributions to Shareholders. Each year, the Fund intends to qualify as a regulated investment company under Subchapter M of the Internal Revenue Code, including distributing substantially all of its taxable income and realized gains. As a result, no provision for U.S. Federal income taxes is required. As of October 31, 2018, the Fund did not have any unrecognized tax benefits in the financial statements; nor is the Fund aware of any tax positions for which it is reasonably possible that the total amounts of unrecognized tax benefits will significantly change in the next twelve months. The Fund files a U.S. federal tax return, in addition to state and local tax returns as required. The Fund's federal income tax returns are subject to examination by the Internal Revenue Service (IRS) for a period of three fiscal years after they are filed. State and local tax returns may be subject to examination for an additional fiscal year depending on the jurisdiction. Foreign taxes are provided for based on the Fund's understanding of the tax rules and rates that exist in the foreign markets in which it invests. The Fund is subject to a tax imposed on capital gains by certain countries in which it invests. An estimated deferred tax liability for net unrealized appreciation on the applicable securities is included in Other payables and accrued expenses on the Statement of Assets and Liabilities.
Distributions are declared and recorded on the ex-dividend date. Income and capital gain distributions are declared separately for each class. Income and capital gain distributions are determined in accordance with income tax regulations, which may differ from GAAP. In addition, the Fund claimed a portion of the payment made to redeeming shareholders as a distribution for income tax purposes.
Capital accounts within the financial statements are adjusted for permanent book-tax differences. These adjustments have no impact on net assets or the results of operations. Capital accounts are not adjusted for temporary book-tax differences which will reverse in a subsequent period.
Book-tax differences are primarily due to foreign currency transactions, passive foreign investment companies (PFIC), certain deemed distributions, redemptions in kind, deferred trustees compensation and losses deferred due to wash sales.
As of period end, the cost and unrealized appreciation (depreciation) in securities, and derivatives if applicable, for federal income tax purposes were as follows:
| Gross unrealized appreciation | $2,961,313,286 |
| Gross unrealized depreciation | (906,360,887) |
| Net unrealized appreciation (depreciation) | $2,054,952,399 |
| Tax Cost | $12,288,670,077 |
The tax-based components of distributable earnings as of period end were as follows:
| Undistributed ordinary income | $160,266,162 |
| Undistributed long-term capital gain | $733,529,456 |
| Net unrealized appreciation (depreciation) on securities and other investments | $2,053,891,353 |
The tax character of distributions paid was as follows:
| | October 31, 2018 | October 31, 2017 |
| Ordinary Income | $221,765,143 | $ 261,338,650 |
| Long-term Capital Gains | 770,512,006 | – |
| Total | $992,277,149 | $ 261,338,650 |
Restricted Securities. The Fund may invest in securities that are subject to legal or contractual restrictions on resale. These securities generally may be resold in transactions exempt from registration or to the public if the securities are registered. Disposal of these securities may involve time-consuming negotiations and expense, and prompt sale at an acceptable price may be difficult. Information regarding restricted securities is included at the end of the Fund's Schedule of Investments.
New Rule Issuance. During August 2018, the U.S. Securities and Exchange Commission issued Final Rule Release No. 33-10532, Disclosure Update and Simplification. This Final Rule includes amendments specific to registered investment companies that are intended to eliminate overlap in disclosure requirements between Regulation S-X and GAAP. In accordance with these amendments, certain line-items in the Fund's financial statements have been combined or removed for the current period as outlined in the table below.
| Financial Statement | Current Line-Item Presentation | Prior Line-Item Presentation |
| Statement of Assets and Liabilities | Total distributable earnings (loss) | Undistributed/Distributions in excess of/Accumulated net investment income (loss)
Accumulated/Undistributed net realized gain (loss)
Net unrealized appreciation (depreciation) |
| Statement of Changes in Net Assets | N/A - removed | Undistributed/Distributions in excess of/Accumulated net investment income (loss) end of period |
| Statement of Changes in Net Assets | Distributions to shareholders | Distributions to shareholders from net investment income
Distributions to shareholders from net realized gain |
| Distributions to Shareholders Note to Financial Statements | Distributions to shareholders | Distributions to shareholders from net investment income
Distributions to shareholders from net realized gain |
4. Purchases and Sales of Investments.
Purchases and sales of securities, other than short-term securities and in-kind transactions, aggregated $5,171,526,763 and $6,902,318,684, respectively.
Redemptions In-Kind. During the period, 64,249,823 shares of the Fund held by unaffiliated entities were redeemed in-kind for investments and cash with a value of $2,569,847,364. The net realized gain of $907,269,340 on investments delivered through the in-kind redemptions is included in the accompanying Statement of Operations. The amount of the redemptions is included in share transactions activity shown in the accompanying Statement of Changes in Net Assets as well as the Notes to Financial Statements. The Fund recognized no gain or loss for federal income tax purposes.
Prior Fiscal Year Redemptions In-Kind. During the prior period, 42,309,077 shares of the Fund held by an unaffiliated entity were redeemed in-kind for investments and cash with a value of $1,506,770,841. The Fund had a net realized gain of $488,334,715 on investments delivered through the in-kind redemptions. The amount of the redemptions is included in share transactions activity shown in the accompanying Statement of Changes in Net Assets as well as the Notes to Financial Statements. The Fund recognized no gain or loss for federal income tax purposes.
5. Fees and Other Transactions with Affiliates.
Management Fee. Fidelity Management & Research Company (the investment adviser) and its affiliates provide the Fund with investment management related services for which the Fund pays a monthly management fee. The management fee is the sum of an individual fund fee rate that is based on an annual rate of .424% of the Fund's average net assets and an annualized group fee rate that averaged .24% during the period. The group fee rate is based upon the average net assets of all the mutual funds advised by the investment adviser, including any mutual funds previously advised by the investment adviser that are currently advised by Fidelity SelectCo, LLC, an affiliate of the investment adviser. The group fee rate decreases as assets under management increase and increases as assets under management decrease. In addition, the management fee is subject to a performance adjustment (up to a maximum of +/- .20% of the Fund's average net assets over a 36 month performance period). The upward or downward adjustment to the management fee is based on the relative investment performance of Diversified International as compared to its benchmark index, the MSCI EAFE Index, over the same 36 month performance period. For the reporting period, the total annual management fee rate, including the performance adjustment, was .61% of the Fund's average net assets. The performance adjustment included in the management fee rate may be higher or lower than the maximum performance adjustment rate due to the difference between the average net assets for the reporting and performance periods.
Transfer Agent Fees. Fidelity Investments Institutional Operations Company, Inc., (FIIOC), an affiliate of the investment adviser, is the transfer, dividend disbursing and shareholder servicing agent for each class of the Fund. FIIOC receives account fees and asset-based fees that vary according to the account size and type of account of the shareholders of Diversified International. FIIOC receives an asset-based fee of Class K's average net assets. FIIOC pays for typesetting, printing and mailing of shareholder reports, except proxy statements.
For the period, transfer agent fees for each class were as follows:
| | Amount | % of Class-Level Average Net Assets |
| Diversified International | $17,624,257 | .16 |
| Class K | 3,042,669 | .05 |
| | $20,666,926 | |
Accounting and Security Lending Fees. Fidelity Service Company, Inc. (FSC), an affiliate of the investment adviser, maintains the Fund's accounting records. The accounting fee is based on the level of average net assets for each month. Under a separate contract, FSC administers the security lending program. The security lending fee is based on the number and duration of lending transactions. For the period, the fees were equivalent to an annual rate of .01%.
Brokerage Commissions. The Fund placed a portion of its portfolio transactions with brokerage firms which are affiliates of the investment adviser. Brokerage commissions are included in net realized gain (loss) and change in net unrealized appreciation (depreciation) in the Statement of Operations. The commissions paid to these affiliated firms were $32,529 for the period.
Interfund Trades. The Fund may purchase from or sell securities to other Fidelity Funds under procedures adopted by the Board. The procedures have been designed to ensure these interfund trades are executed in accordance with Rule 17a-7 of the 1940 Act. Interfund trades are included within the respective purchases and sales amounts shown in the Purchases and Sales of Investments note.
Prior Fiscal Year Redemptions In-Kind. During the prior period, 6,219,500 shares of the Fund held by an affiliated entity were redeemed in-kind for investments and cash, including accrued interest, with a value of $252,875,067. The Fund had a net realized gain of $95,146,213 on investments delivered through in-kind redemptions. The amount of the in-kind redemptions is included in share transactions in the accompanying Statement of Changes in Net Assets as well as the Notes to Financial Statements. The Fund recognized no gain or loss for federal income tax purposes.
6. Committed Line of Credit.
The Fund participates with other funds managed by the investment adviser or an affiliate in a $4.25 billion credit facility (the "line of credit") to be utilized for temporary or emergency purposes to fund shareholder redemptions or for other short-term liquidity purposes. The Fund has agreed to pay commitment fees on its pro-rata portion of the line of credit, which amounted to $49,236 and is reflected in Miscellaneous expenses on the Statement of Operations. During the period, the Fund did not borrow on this line of credit.
7. Security Lending.
The Fund lends portfolio securities through a lending agent from time to time in order to earn additional income. For equity securities, a lending agent is used and may loan securities to certain qualified borrowers, including Fidelity Capital Markets (FCM), a broker-dealer affiliated with the Fund. On the settlement date of the loan, the Fund receives collateral (in the form of U.S. Treasury obligations, letters of credit and/or cash) against the loaned securities and maintains collateral in an amount not less than 100% of the market value of the loaned securities during the period of the loan. The market value of the loaned securities is determined at the close of business of the Fund and any additional required collateral is delivered to the Fund on the next business day. The Fund or borrower may terminate the loan at any time, and if the borrower defaults on its obligation to return the securities loaned because of insolvency or other reasons, the Fund may apply collateral received from the borrower against the obligation. The Fund may experience delays and costs in recovering the securities loaned. Any cash collateral received is invested in the Fidelity Securities Lending Cash Central Fund. The value of loaned securities and cash collateral at period end are disclosed on the Fund's Statement of Assets and Liabilities. Security lending income represents the income earned on investing cash collateral, less rebates paid to borrowers and any lending agent fees associated with the loan, plus any premium payments received for lending certain types of securities. Security lending income is presented in the Statement of Operations as a component of income from Fidelity Central Funds. Total security lending income during the period amounted to $3,702,220. During the period, there were no securities loaned to FCM.
8. Expense Reductions.
Commissions paid to certain brokers with whom the investment adviser, or its affiliates, places trades on behalf of the Fund include an amount in addition to trade execution, which may be rebated back to the Fund to offset certain expenses. This amount totaled $2,526,068 for the period. In addition, through arrangements with the Fund's custodian, credits realized as a result of certain uninvested cash balances were used to reduce the Fund's expenses. During the period, these credits reduced the Fund's custody expenses by $5,241.
In addition, during the period the investment adviser reimbursed and/or waived a portion of fund-level operating expenses in the amount of $191,028.
9. Distributions to Shareholders.
Distributions to shareholders of each class were as follows:
| | Year ended
October 31, 2018 | Year ended
October 31, 2017 |
| Distributions to shareholders | | |
| Diversified International | $578,499,998 | $– |
| Class K | 413,777,151 | – |
| Total | $992,277,149 | $– |
| From net investment income | | |
| Diversified International | $– | $117,261,561 |
| Class K | – | 105,950,318 |
| Total | $– | $223,211,879 |
| From net realized gain | | |
| Diversified International | $– | $21,125,448 |
| Class K | – | 17,001,323 |
| Total | $– | $38,126,771 |
10. Share Transactions.
Share transactions for each class were as follows and may contain automatic conversions between classes or exchanges between affiliated funds:
| | Shares | Shares | Dollars | Dollars |
| | Year ended October 31, 2018 | Year ended October 31, 2017 | Year ended October 31, 2018 | Year ended October 31, 2017 |
| Diversified International | | | | |
| Shares sold | 29,835,455 | 29,659,523 | $1,174,373,008 | $1,086,343,758 |
| Reinvestment of distributions | 13,661,964 | 3,851,054 | 537,871,482 | 128,009,018 |
| Shares redeemed | (57,997,016)(a) | (79,920,304)(b) | (2,309,553,360)(a) | (2,857,242,109)(b) |
| Net increase (decrease) | (14,499,597) | (46,409,727) | $(597,308,870) | $(1,642,889,333) |
| Class K | | | | |
| Shares sold | 29,277,888 | 40,529,599 | $1,163,459,637 | $1,505,583,540 |
| Reinvestment of distributions | 10,532,806 | 3,707,830 | 413,728,634 | 122,951,641 |
| Shares redeemed | (105,246,564)(a) | (90,053,301)(b) | (4,200,092,452)(a) | (3,306,388,504)(b) |
| Net increase (decrease) | (65,435,870) | (45,815,872) | $(2,622,904,181) | $(1,677,853,323) |
(a) Amount includes in-kind redemptions (see the Redemptions In-Kind note for additional details).
(b) Amount includes in-kind redemptions (see the Prior Fiscal Year Redemptions In-Kind note for additional details).
11. Other.
The Fund's organizational documents provide former and current trustees and officers with a limited indemnification against liabilities arising in connection with the performance of their duties to the Fund. In the normal course of business, the Fund may also enter into contracts that provide general indemnifications. The Fund's maximum exposure under these arrangements is unknown as this would be dependent on future claims that may be made against the Fund. The risk of material loss from such claims is considered remote.
Fidelity® International Capital Appreciation Fund
Performance: The Bottom Line
Average annual total return reflects the change in the value of an investment, assuming reinvestment of distributions from dividend income and capital gains (the profits earned upon the sale of securities that have grown in value, if any) and assuming a constant rate of performance each year. The hypothetical investment and the average annual total returns do not reflect the deduction of taxes that a shareholder would pay on fund distributions or the redemption of fund shares. During periods of reimbursement by Fidelity, a fund’s total return will be greater than it would be had the reimbursement not occurred. How a fund did yesterday is no guarantee of how it will do tomorrow.
Average Annual Total Returns
| For the periods ended October 31, 2018 | Past 1 year | Past 5 years | Past 10 years |
| Fidelity® International Capital Appreciation Fund | (7.51)% | 5.37% | 11.72% |
$10,000 Over 10 Years
Let's say hypothetically that $10,000 was invested in Fidelity® International Capital Appreciation Fund on October 31, 2008.
The chart shows how the value of your investment would have changed, and also shows how the MSCI ACWI (All Country World Index) ex USA Index performed over the same period.
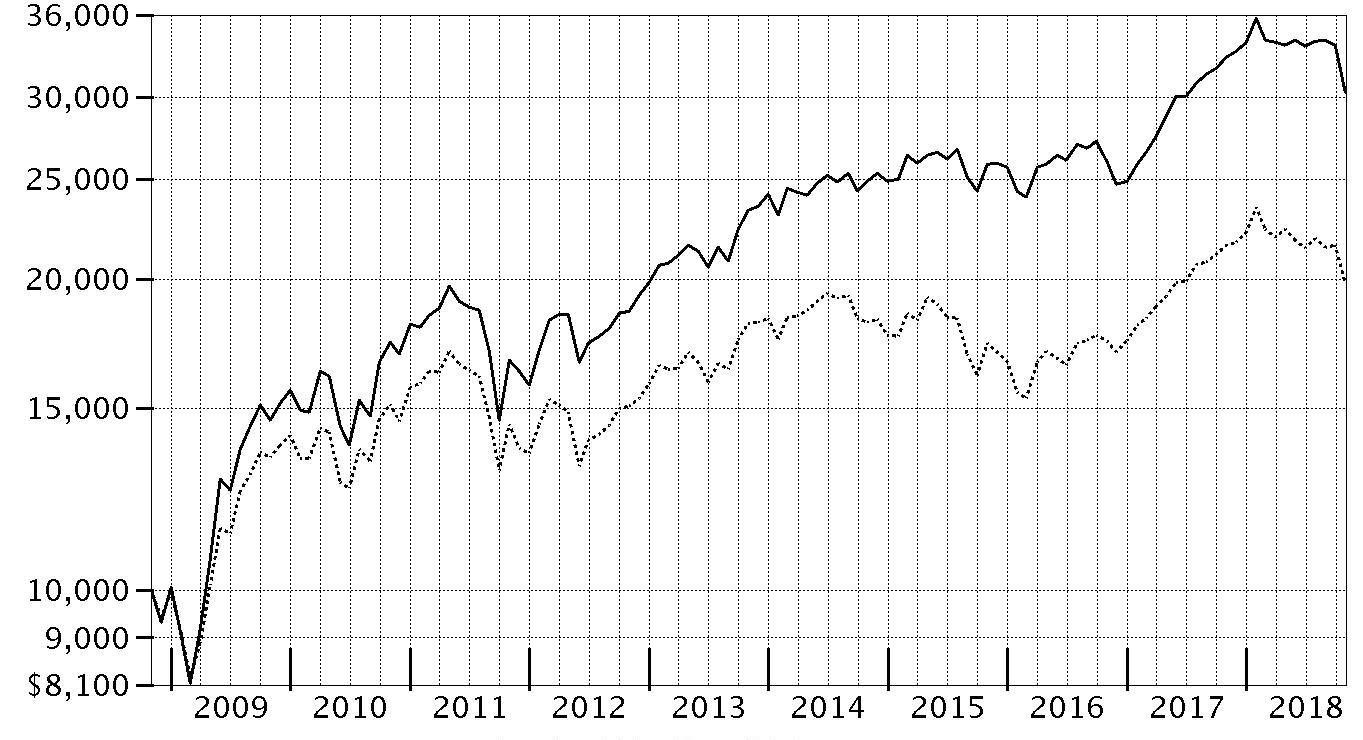
| Period Ending Values |
| $30,287 | Fidelity® International Capital Appreciation Fund |
| $19,812 | MSCI ACWI (All Country World Index) ex USA Index |
Fidelity® International Capital Appreciation Fund
Management's Discussion of Fund Performance
Market Recap: International equities returned -8.08% for the 12 months ending October 31, 2018, according to the MSCI ACWI (All Country World Index) ex USA Index. A modestly positive first half of the period gave way to a confluence of overwhelmingly negative factors – including escalating trade tensions, a surging U.S. dollar, tepid economic growth in Europe, global central bank tightening, concerns about Italy’s budget stalemate with the EU, and weakness in China’s stock market – that yielded a -11% second-half return. The index lost 8% in October alone, its largest monthly drop in more than six years. Among sectors, new-media-infused communications services (-15%) was hit the hardest, while economically sensitive consumer discretionary (-13%), information technology (-12%), financials (-10%), industrials (-9%) and materials (-7%) stocks also fared poorly. Even the more defensive real estate (-9%), utilities (-6%) and consumer staples (-5%) sectors weren’t spared this period. Conversely, elevated crude-oil prices fueled a positive return for energy (+7%), the top-performing sector, followed by the relatively stable-growing health care segment (+2%). Regionally, emerging markets (-12%) fared the worst, hampered by the impact of foreign exchange and concerns about economic weakness in China, India and South Korea. Sluggish growth also pressured shares in continental Europe (-9%). Stocks in Japan (-3%) and the U.K. (-4%) held up better, followed by Canada (-5%) and Asia-Pacific ex Japan (-6%).
Comments from Portfolio Manager Sammy Simnegar: For the fiscal year, the fund returned -7.51%, ahead of the benchmark MSCI ACWI (All Country World Index) ex USA Index. Versus the benchmark, favorable stock selection within the information technology, financials and industrials sectors notably lifted the fund's relative performance. Geographically, stock picks in continental Europe, Germany in particular, as well as out-of-benchmark exposure to the United States, added value. The fund’s top relative contributor was an overweight stake in Wirecard, a Germany-based provider of online payment processing that gained after the company reported strong financial results during the period. Other contributors included an out-of-benchmark position in Heico, a provider of aftermarket aerospace components, and a non-benchmark stake in online retailer Amazon.com. Conversely, the fund's relative result was curbed by stock choices in consumer staples and notable underweight in energy. By region, positioning in emerging markets was by far the biggest detractor. The fund’s three largest relative detractors were based in China, starting with TAL Education Group, a provider of after-school tutoring that was bought during the period and later sold. Midea Group, an electrical appliance manufacturer in China, is another stock purchased this period that underperformed. Lastly, China-based CSPC Pharmaceutical Group, which was also sold prior to period-end, detracted as well.
The views expressed above reflect those of the portfolio manager(s) only through the end of the period as stated on the cover of this report and do not necessarily represent the views of Fidelity or any other person in the Fidelity organization. Any such views are subject to change at any time based upon market or other conditions and Fidelity disclaims any responsibility to update such views. These views may not be relied on as investment advice and, because investment decisions for a Fidelity fund are based on numerous factors, may not be relied on as an indication of trading intent on behalf of any Fidelity fund.
Open for comments: Open for comments.
Fidelity® International Capital Appreciation Fund
Investment Summary (Unaudited)
Geographic Diversification (% of fund's net assets)
| As of October 31, 2018 |
| | United States of America* | 15.2% |
| | United Kingdom | 11.2% |
| | France | 9.1% |
| | Japan | 8.3% |
| | Canada | 6.1% |
| | India | 6.1% |
| | Germany | 5.8% |
| | Cayman Islands | 4.3% |
| | Netherlands | 4.0% |
| | Other | 29.9% |
* Includes Short-Term investments and Net Other Assets (Liabilities).
Percentages are based on country or territory of incorporation and are adjusted for the effect of futures contracts, if applicable.
Asset Allocation as of October 31, 2018
| | % of fund's net assets |
| Stocks | 98.9 |
| Short-Term Investments and Net Other Assets (Liabilities) | 1.1 |
Top Ten Stocks as of October 31, 2018
| | % of fund's net assets |
| Tencent Holdings Ltd. (Cayman Islands, Interactive Media & Services) | 1.6 |
| Taiwan Semiconductor Manufacturing Co. Ltd. sponsored ADR (Taiwan, Semiconductors & Semiconductor Equipment) | 1.5 |
| Alibaba Group Holding Ltd. sponsored ADR (Cayman Islands, Internet & Direct Marketing Retail) | 1.4 |
| SAP SE (Germany, Software) | 1.1 |
| AIA Group Ltd. (Hong Kong, Insurance) | 1.0 |
| The Toronto-Dominion Bank (Canada, Banks) | 1.0 |
| LVMH Moet Hennessy - Louis Vuitton SA (France, Textiles, Apparel & Luxury Goods) | 1.0 |
| Diageo PLC (United Kingdom, Beverages) | 1.0 |
| British American Tobacco PLC (United Kingdom) (United Kingdom, Tobacco) | 1.0 |
| Naspers Ltd. Class N (South Africa, Media) | 1.0 |
| | 11.6 |
Top Market Sectors as of October 31, 2018
| | % of fund's net assets |
| Industrials | 19.1 |
| Information Technology | 17.7 |
| Financials | 16.1 |
| Consumer Discretionary | 12.8 |
| Consumer Staples | 9.6 |
| Materials | 6.7 |
| Health Care | 6.7 |
| Communication Services | 4.8 |
| Real Estate | 2.9 |
| Energy | 1.4 |
Fidelity® International Capital Appreciation Fund
Schedule of Investments October 31, 2018
Showing Percentage of Net Assets
| Common Stocks - 97.6% | | | |
| | | Shares | Value |
| Australia - 2.0% | | | |
| Aristocrat Leisure Ltd. | | 653,533 | $12,264,184 |
| CSL Ltd. | | 140,589 | 18,716,923 |
| realestate.com.au Ltd. | | 233,663 | 11,850,851 |
|
| TOTAL AUSTRALIA | | | 42,831,958 |
|
| Bailiwick of Jersey - 0.7% | | | |
| Experian PLC | | 629,400 | 14,475,697 |
| Belgium - 0.6% | | | |
| Umicore SA | | 280,335 | 13,205,717 |
| Bermuda - 1.7% | | | |
| Credicorp Ltd. (United States) | | 63,712 | 14,380,436 |
| Hiscox Ltd. | | 558,812 | 11,628,373 |
| IHS Markit Ltd. (a) | | 220,700 | 11,593,371 |
|
| TOTAL BERMUDA | | | 37,602,180 |
|
| Brazil - 0.6% | | | |
| BM&F BOVESPA SA | | 1,886,400 | 13,452,924 |
| Canada - 6.1% | | | |
| Alimentation Couche-Tard, Inc. Class B (sub. vtg.) | | 292,300 | 13,959,437 |
| Canadian National Railway Co. | | 213,884 | 18,284,405 |
| Canadian Pacific Railway Ltd. | | 71,611 | 14,685,572 |
| CCL Industries, Inc. Class B | | 296,532 | 12,474,414 |
| Constellation Software, Inc. | | 19,609 | 13,495,347 |
| Dollarama, Inc. | | 428,500 | 11,851,331 |
| Open Text Corp. | | 366,900 | 12,385,610 |
| The Toronto-Dominion Bank | | 403,100 | 22,361,953 |
| Waste Connection, Inc. (Canada) | | 160,159 | 12,243,839 |
|
| TOTAL CANADA | | | 131,741,908 |
|
| Cayman Islands - 4.3% | | | |
| Alibaba Group Holding Ltd. sponsored ADR (a) | | 216,645 | 30,824,251 |
| New Oriental Education & Technology Group, Inc. sponsored ADR | | 241,147 | 14,109,511 |
| Shenzhou International Group Holdings Ltd. | | 1,133,000 | 12,511,913 |
| Tencent Holdings Ltd. | | 1,034,500 | 35,441,208 |
|
| TOTAL CAYMAN ISLANDS | | | 92,886,883 |
|
| Chile - 0.6% | | | |
| Sociedad Quimica y Minera de Chile SA (PN-B) sponsored ADR (b) | | 296,500 | 12,989,665 |
| China - 3.7% | | | |
| China International Travel Service Corp. Ltd. (A Shares) | | 1,648,600 | 12,686,538 |
| Hangzhou Hikvision Digital Technology Co. Ltd. Class A | | 3,277,500 | 11,370,338 |
| Kweichow Moutai Co. Ltd. (A Shares) | | 163,000 | 12,826,145 |
| Midea Group Co. Ltd. Class A | | 2,308,548 | 12,258,158 |
| Ping An Insurance (Group) Co. of China Ltd. (H Shares) | | 1,939,500 | 18,264,854 |
| Shanghai International Airport Co. Ltd. (A Shares) | | 1,731,400 | 12,298,620 |
|
| TOTAL CHINA | | | 79,704,653 |
|
| Denmark - 1.2% | | | |
| DONG Energy A/S (c) | | 204,300 | 12,980,241 |
| DSV de Sammensluttede Vognmaend A/S | | 169,500 | 13,628,141 |
|
| TOTAL DENMARK | | | 26,608,382 |
|
| Finland - 0.6% | | | |
| Neste Oyj | | 160,000 | 13,185,858 |
| France - 9.1% | | | |
| Dassault Systemes SA | | 106,500 | 13,371,528 |
| Eiffage SA | | 132,634 | 12,982,695 |
| Hermes International SCA | | 23,866 | 13,651,072 |
| Kering SA | | 36,405 | 16,229,751 |
| L'Oreal SA | | 84,000 | 18,923,863 |
| Legrand SA | | 215,649 | 14,103,274 |
| LVMH Moet Hennessy - Louis Vuitton SA | | 71,529 | 21,702,287 |
| Orpea | | 98,765 | 12,176,633 |
| Pernod Ricard SA | | 101,685 | 15,525,390 |
| Safran SA | | 129,100 | 16,683,312 |
| SR Teleperformance SA | | 72,594 | 11,971,755 |
| Thales SA | | 101,833 | 13,033,550 |
| VINCI SA (b) | | 191,814 | 17,071,325 |
|
| TOTAL FRANCE | | | 197,426,435 |
|
| Germany - 5.8% | | | |
| adidas AG | | 69,311 | 16,329,062 |
| Deutsche Wohnen AG (Bearer) | | 295,500 | 13,535,190 |
| Infineon Technologies AG | | 736,400 | 14,755,168 |
| Linde PLC | | 102,872 | 16,877,628 |
| SAP SE | | 218,705 | 23,417,508 |
| Symrise AG | | 156,800 | 13,170,780 |
| Vonovia SE | | 317,700 | 14,544,850 |
| Wirecard AG | | 74,511 | 13,958,914 |
|
| TOTAL GERMANY | | | 126,589,100 |
|
| Hong Kong - 1.0% | | | |
| AIA Group Ltd. | | 2,978,800 | 22,544,365 |
| India - 6.1% | | | |
| Asian Paints Ltd. | | 739,344 | 12,299,741 |
| Eicher Motors Ltd. | | 43,436 | 12,840,870 |
| Godrej Consumer Products Ltd. | | 1,165,050 | 11,418,152 |
| HDFC Bank Ltd. | | 459,782 | 11,936,062 |
| Housing Development Finance Corp. Ltd. | | 735,404 | 17,592,124 |
| IndusInd Bank Ltd. | | 607,771 | 11,710,850 |
| Kotak Mahindra Bank Ltd. | | 820,764 | 12,419,660 |
| Maruti Suzuki India Ltd. | | 131,854 | 11,795,549 |
| Reliance Industries Ltd. | | 1,178,613 | 16,911,885 |
| Titan Co. Ltd. | | 1,103,319 | 12,599,557 |
|
| TOTAL INDIA | | | 131,524,450 |
|
| Indonesia - 0.6% | | | |
| PT Bank Central Asia Tbk | | 8,820,600 | 13,721,900 |
| Ireland - 2.3% | | | |
| Accenture PLC Class A | | 72,145 | 11,371,495 |
| DCC PLC (United Kingdom) | | 142,400 | 12,222,353 |
| Kerry Group PLC Class A | | 130,700 | 13,397,381 |
| Kingspan Group PLC (Ireland) | | 277,508 | 12,069,866 |
|
| TOTAL IRELAND | | | 49,061,095 |
|
| Italy - 1.1% | | | |
| Amplifon SpA | | 617,600 | 10,954,556 |
| Recordati SpA | | 357,900 | 12,128,833 |
|
| TOTAL ITALY | | | 23,083,389 |
|
| Japan - 8.3% | | | |
| Daikin Industries Ltd. | | 10,600 | 1,228,666 |
| Hoya Corp. | | 262,500 | 14,921,567 |
| Kao Corp. | | 236,900 | 15,759,116 |
| Keyence Corp. | | 35,680 | 17,486,631 |
| Misumi Group, Inc. | | 605,000 | 12,149,865 |
| Nidec Corp. | | 122,300 | 15,705,473 |
| Nissan Chemical Corp. | | 233,500 | 11,009,825 |
| Nitori Holdings Co. Ltd. | | 104,980 | 13,709,224 |
| OBIC Co. Ltd. | | 136,500 | 12,436,035 |
| Recruit Holdings Co. Ltd. | | 603,600 | 16,200,378 |
| Relo Group, Inc. | | 484,400 | 11,445,123 |
| Tsuruha Holdings, Inc. | | 120,300 | 12,538,025 |
| Unicharm Corp. | | 482,200 | 13,128,182 |
| Zozo, Inc. | | 479,100 | 11,544,936 |
|
| TOTAL JAPAN | | | 179,263,046 |
|
| Korea (South) - 0.6% | | | |
| LG Household & Health Care Ltd. | | 13,837 | 12,660,673 |
| Mexico - 0.5% | | | |
| Grupo Aeroportuario del Sureste S.A.B. de CV Series B | | 695,397 | 11,558,655 |
| Netherlands - 4.0% | | | |
| ASML Holding NV (Netherlands) | | 117,260 | 20,197,347 |
| Ferrari NV | | 115,500 | 13,539,981 |
| Heineken NV (Bearer) | | 175,100 | 15,786,830 |
| Interxion Holding N.V. (a) | | 196,533 | 11,569,898 |
| Wolters Kluwer NV | | 234,600 | 13,328,500 |
| Yandex NV Series A (a) | | 394,000 | 11,871,220 |
|
| TOTAL NETHERLANDS | | | 86,293,776 |
|
| Philippines - 0.6% | | | |
| SM Prime Holdings, Inc. | | 20,394,600 | 12,900,003 |
| South Africa - 2.2% | | | |
| Capitec Bank Holdings Ltd. | | 182,821 | 12,276,921 |
| FirstRand Ltd. | | 3,018,300 | 13,157,558 |
| Naspers Ltd. Class N | | 121,557 | 21,363,051 |
|
| TOTAL SOUTH AFRICA | | | 46,797,530 |
|
| Spain - 0.7% | | | |
| Amadeus IT Holding SA Class A | | 191,900 | 15,471,367 |
| Sweden - 1.9% | | | |
| Alfa Laval AB | | 495,600 | 12,656,521 |
| ASSA ABLOY AB (B Shares) | | 694,300 | 13,810,157 |
| Hexagon AB (B Shares) | | 284,300 | 13,936,716 |
|
| TOTAL SWEDEN | | | 40,403,394 |
|
| Switzerland - 3.9% | | | |
| Givaudan SA | | 5,866 | 14,234,726 |
| Lonza Group AG | | 45,476 | 14,300,004 |
| Partners Group Holding AG | | 19,414 | 13,830,656 |
| Schindler Holding AG (participation certificate) | | 61,560 | 12,982,519 |
| Sika AG | | 117,239 | 15,039,745 |
| Temenos Group AG | | 99,200 | 13,641,662 |
|
| TOTAL SWITZERLAND | | | 84,029,312 |
|
| Taiwan - 1.5% | | | |
| Taiwan Semiconductor Manufacturing Co. Ltd. sponsored ADR | | 854,262 | 32,547,382 |
| United Kingdom - 11.2% | | | |
| Beazley PLC | | 1,848,600 | 12,464,195 |
| British American Tobacco PLC (United Kingdom) | | 497,200 | 21,553,753 |
| Bunzl PLC | | 452,642 | 13,370,683 |
| Compass Group PLC | | 769,188 | 15,140,912 |
| Croda International PLC | | 207,500 | 12,783,917 |
| Diageo PLC | | 626,822 | 21,670,185 |
| Halma PLC | | 714,200 | 12,123,185 |
| Hargreaves Lansdown PLC | | 536,000 | 12,797,952 |
| InterContinental Hotel Group PLC | | 260,427 | 13,681,277 |
| Intertek Group PLC | | 218,300 | 13,080,976 |
| London Stock Exchange Group PLC | | 246,200 | 13,578,996 |
| Mondi PLC | | 568,200 | 13,396,110 |
| NMC Health PLC | | 299,000 | 13,498,661 |
| RELX PLC | | 823,099 | 16,286,985 |
| Rentokil Initial PLC | | 3,284,700 | 13,275,668 |
| Rightmove PLC | | 2,079,300 | 12,017,068 |
| St. James's Place Capital PLC | | 982,400 | 12,726,557 |
|
| TOTAL UNITED KINGDOM | | | 243,447,080 |
|
| United States of America - 14.1% | | | |
| Activision Blizzard, Inc. | | 168,200 | 11,614,210 |
| Adobe, Inc. (a) | | 46,400 | 11,403,264 |
| American Tower Corp. | | 74,400 | 11,592,264 |
| Amphenol Corp. Class A | | 134,928 | 12,076,056 |
| Becton, Dickinson & Co. | | 48,400 | 11,156,200 |
| Constellation Brands, Inc. Class A (sub. vtg.) | | 55,980 | 11,152,895 |
| Fiserv, Inc. (a) | | 149,000 | 11,815,700 |
| FleetCor Technologies, Inc. (a) | | 60,000 | 12,001,800 |
| Global Payments, Inc. | | 102,384 | 11,695,324 |
| HEICO Corp. Class A | | 177,600 | 11,838,816 |
| Marsh & McLennan Companies, Inc. | | 144,700 | 12,263,325 |
| MasterCard, Inc. Class A | | 57,753 | 11,416,036 |
| Microsoft Corp. | | 107,600 | 11,492,756 |
| Moody's Corp. | | 78,692 | 11,448,112 |
| MSCI, Inc. | | 76,284 | 11,471,588 |
| NextEra Energy, Inc. | | 65,900 | 11,367,750 |
| NVIDIA Corp. | | 60,220 | 12,696,183 |
| ResMed, Inc. | | 111,200 | 11,778,304 |
| S&P Global, Inc. | | 63,445 | 11,567,292 |
| Sherwin-Williams Co. | | 31,414 | 12,360,467 |
| SS&C Technologies Holdings, Inc. | | 231,000 | 11,817,960 |
| Thermo Fisher Scientific, Inc. | | 49,880 | 11,654,462 |
| TransDigm Group, Inc. (a) | | 36,400 | 12,021,100 |
| UnitedHealth Group, Inc. | | 43,080 | 11,258,958 |
| Verisk Analytics, Inc. (a) | | 99,300 | 11,900,112 |
| Visa, Inc. Class A | | 82,226 | 11,334,854 |
|
| TOTAL UNITED STATES OF AMERICA | | | 304,195,788 |
|
| TOTAL COMMON STOCKS | | | |
| (Cost $1,919,974,000) | | | 2,112,204,565 |
|
| Nonconvertible Preferred Stocks - 1.3% | | | |
| Brazil - 1.3% | | | |
| Itau Unibanco Holding SA sponsored ADR | | 1,270,993 | 16,738,978 |
| Itausa-Investimentos Itau SA (PN) | | 4,080,400 | 12,323,981 |
| TOTAL NONCONVERTIBLE PREFERRED STOCKS | | | |
| (Cost $25,876,061) | | | 29,062,959 |
|
| Money Market Funds - 1.4% | | | |
| Fidelity Cash Central Fund, 2.23% (d) | | 1,929,325 | 1,929,711 |
| Fidelity Securities Lending Cash Central Fund 2.23% (d)(e) | | 29,335,110 | 29,338,044 |
| TOTAL MONEY MARKET FUNDS | | | |
| (Cost $31,267,755) | | | 31,267,755 |
| TOTAL INVESTMENT IN SECURITIES - 100.3% | | | |
| (Cost $1,977,117,816) | | | 2,172,535,279 |
| NET OTHER ASSETS (LIABILITIES) - (0.3)% | | | (7,453,458) |
| NET ASSETS - 100% | | | $2,165,081,821 |
Categorizations in the Schedule of Investments are based on country or territory of incorporation.
Legend
(a) Non-income producing
(b) Security or a portion of the security is on loan at period end.
(c) Security exempt from registration under Rule 144A of the Securities Act of 1933. These securities may be resold in transactions exempt from registration, normally to qualified institutional buyers. At the end of the period, the value of these securities amounted to $12,980,241 or 0.6% of net assets.
(d) Affiliated fund that is generally available only to investment companies and other accounts managed by Fidelity Investments. The rate quoted is the annualized seven-day yield of the fund at period end. A complete unaudited listing of the fund's holdings as of its most recent quarter end is available upon request. In addition, each Fidelity Central Fund's financial statements, which are not covered by the Fund's Report of Independent Registered Public Accounting Firm, are available on the SEC's website or upon request.
(e) Investment made with cash collateral received from securities on loan.
Affiliated Central Funds
Information regarding fiscal year to date income earned by the Fund from investments in Fidelity Central Funds is as follows:
| Fund | Income earned |
| Fidelity Cash Central Fund | $384,533 |
| Fidelity Securities Lending Cash Central Fund | 226,909 |
| Total | $611,442 |
Amounts in the income column in the above table include any capital gain distributions from underlying funds, which are presented in the corresponding line-item in the Statement of Operations if applicable.
Investment Valuation
The following is a summary of the inputs used, as of October 31, 2018, involving the Fund's assets and liabilities carried at fair value. The inputs or methodology used for valuing securities may not be an indication of the risk associated with investing in those securities. For more information on valuation inputs, and their aggregation into the levels used below, please refer to the Investment Valuation section in the accompanying Notes to Financial Statements.
| | Valuation Inputs at Reporting Date: |
| Description | Total | Level 1 | Level 2 | Level 3 |
| Investments in Securities: | | | | |
| Equities: | | | | |
| Communication Services | $104,157,608 | $68,716,400 | $35,441,208 | $-- |
| Consumer Discretionary | 279,270,364 | 257,568,077 | 21,702,287 | -- |
| Consumer Staples | 210,300,027 | 151,316,973 | 58,983,054 | -- |
| Energy | 30,097,743 | 30,097,743 | -- | -- |
| Financials | 353,537,240 | 341,601,178 | 11,936,062 | -- |
| Health Care | 142,545,101 | 142,545,101 | -- | -- |
| Industrials | 408,742,849 | 329,273,314 | 79,469,535 | -- |
| Information Technology | 381,286,064 | 322,916,041 | 58,370,023 | -- |
| Materials | 142,965,107 | 131,955,282 | 11,009,825 | -- |
| Real Estate | 64,017,430 | 64,017,430 | -- | -- |
| Utilities | 24,347,991 | 24,347,991 | -- | -- |
| Money Market Funds | 31,267,755 | 31,267,755 | -- | -- |
| Total Investments in Securities: | $2,172,535,279 | $1,895,623,285 | $276,911,994 | $-- |
The following is a summary of transfers between Level 1 and Level 2 for the period ended October 31, 2018. Transfers are assumed to have occurred at the beginning of the period, and are primarily attributable to the valuation techniques used for foreign equity securities, as discussed in the accompanying Notes to Financial Statements:
| Transfers | Total |
| Level 1 to Level 2 | $15,978,201 |
| Level 2 to Level 1 | $97,266,250 |
See accompanying notes which are an integral part of the financial statements.
Fidelity® International Capital Appreciation Fund
Financial Statements
Statement of Assets and Liabilities
| | | October 31, 2018 |
| Assets | | |
Investment in securities, at value (including securities loaned of $28,645,994) — See accompanying schedule:
Unaffiliated issuers (cost $1,945,850,061) | $2,141,267,524 | |
| Fidelity Central Funds (cost $31,267,755) | 31,267,755 | |
| Total Investment in Securities (cost $1,977,117,816) | | $2,172,535,279 |
| Cash | | 702,533 |
| Receivable for investments sold | | 73,706,592 |
| Receivable for fund shares sold | | 7,216,383 |
| Dividends receivable | | 3,310,058 |
| Distributions receivable from Fidelity Central Funds | | 48,938 |
| Prepaid expenses | | 4,437 |
| Other receivables | | 1,273,371 |
| Total assets | | 2,258,797,591 |
| Liabilities | | |
| Payable to custodian bank | $382,021 | |
| Payable for investments purchased | 53,385,190 | |
| Payable for fund shares redeemed | 8,536,959 | |
| Accrued management fee | 1,378,081 | |
| Other affiliated payables | 424,468 | |
| Other payables and accrued expenses | 271,007 | |
| Collateral on securities loaned | 29,338,044 | |
| Total liabilities | | 93,715,770 |
| Net Assets | | $2,165,081,821 |
| Net Assets consist of: | | |
| Paid in capital | | $1,922,581,751 |
| Total distributable earnings (loss) | | 242,500,070 |
| Net Assets, for 114,894,360 shares outstanding | | $2,165,081,821 |
| Net Asset Value, offering price and redemption price per share ($2,165,081,821 ÷ 114,894,360 shares) | | $18.84 |
See accompanying notes which are an integral part of the financial statements.
Statement of Operations
| | | Year ended October 31, 2018 |
| Investment Income | | |
| Dividends | | $38,561,303 |
| Income from Fidelity Central Funds | | 611,442 |
| Income before foreign taxes withheld | | 39,172,745 |
| Less foreign taxes withheld | | (3,419,884) |
| Total income | | 35,752,861 |
| Expenses | | |
| Management fee | | |
| Basic fee | $15,903,625 | |
| Performance adjustment | 2,954,287 | |
| Transfer agent fees | 3,906,032 | |
| Accounting and security lending fees | 1,010,257 | |
| Custodian fees and expenses | 528,991 | |
| Independent trustees' fees and expenses | 11,355 | |
| Registration fees | 91,939 | |
| Audit | 92,797 | |
| Legal | 6,257 | |
| Interest | 7,759 | |
| Miscellaneous | 15,047 | |
| Total expenses before reductions | 24,528,346 | |
| Expense reductions | (1,309,473) | |
| Total expenses after reductions | | 23,218,873 |
| Net investment income (loss) | | 12,533,988 |
| Realized and Unrealized Gain (Loss) | | |
| Net realized gain (loss) on: | | |
| Investment securities: | | |
| Unaffiliated issuers (net of foreign taxes of $737,805) | 61,986,891 | |
| Fidelity Central Funds | (1,088) | |
| Foreign currency transactions | 100,095 | |
| Total net realized gain (loss) | | 62,085,898 |
| Change in net unrealized appreciation (depreciation) on: | | |
| Investment securities: | | |
| Unaffiliated issuers (net of decrease in deferred foreign taxes of $3,011,599) | (264,120,230) | |
| Assets and liabilities in foreign currencies | (134,622) | |
| Total change in net unrealized appreciation (depreciation) | | (264,254,852) |
| Net gain (loss) | | (202,168,954) |
| Net increase (decrease) in net assets resulting from operations | | $(189,634,966) |
See accompanying notes which are an integral part of the financial statements.
Statement of Changes in Net Assets
| | Year ended October 31, 2018 | Year ended October 31, 2017 |
| Increase (Decrease) in Net Assets | | |
| Operations | | |
| Net investment income (loss) | $12,533,988 | $9,178,583 |
| Net realized gain (loss) | 62,085,898 | 143,871,997 |
| Change in net unrealized appreciation (depreciation) | (264,254,852) | 278,001,565 |
| Net increase (decrease) in net assets resulting from operations | (189,634,966) | 431,052,145 |
| Distributions to shareholders | (70,699,058) | – |
| Distributions to shareholders from net investment income | – | (11,269,814) |
| Total distributions | (70,699,058) | (11,269,814) |
| Share transactions | | |
| Proceeds from sales of shares | 806,157,755 | 565,638,950 |
| Reinvestment of distributions | 55,240,406 | 8,894,166 |
| Cost of shares redeemed | (548,013,633) | (665,201,653) |
| Net increase (decrease) in net assets resulting from share transactions | 313,384,528 | (90,668,537) |
| Redemption fees | – | 5,994 |
| Total increase (decrease) in net assets | 53,050,504 | 329,119,788 |
| Net Assets | | |
| Beginning of period | 2,112,031,317 | 1,782,911,529 |
| End of period | $2,165,081,821 | $2,112,031,317 |
| Other Information | | |
| Undistributed net investment income end of period | | $6,983,838 |
| Shares | | |
| Sold | 38,562,264 | 30,558,983 |
| Issued in reinvestment of distributions | 2,676,277 | 557,628 |
| Redeemed | (26,615,439) | (36,901,606) |
| Net increase (decrease) | 14,623,102 | (5,784,995) |
See accompanying notes which are an integral part of the financial statements.
Financial Highlights
Fidelity International Capital Appreciation Fund
| | | | | | |
| Years ended October 31, | 2018 | 2017 | 2016 | 2015 | 2014 |
| Selected Per–Share Data | | | | | |
| Net asset value, beginning of period | $21.06 | $16.81 | $16.98 | $17.22 | $16.28 |
| Income from Investment Operations | | | | | |
| Net investment income (loss)A | .11 | .09 | .12 | .11 | .13 |
| Net realized and unrealized gain (loss) | (1.63) | 4.27 | (.03) | .56 | .93 |
| Total from investment operations | (1.52) | 4.36 | .09 | .67 | 1.06 |
| Distributions from net investment income | (.07) | (.11) | (.07) | (.09) | (.12) |
| Distributions from net realized gain | (.63) | – | (.19) | (.81) | – |
| Total distributions | (.70) | (.11) | (.26) | (.91)B | (.12) |
| Redemption fees added to paid in capitalA | – | –C | –C | –C | –C |
| Net asset value, end of period | $18.84 | $21.06 | $16.81 | $16.98 | $17.22 |
| Total ReturnD | (7.51)% | 26.13% | .53% | 3.96% | 6.55% |
| Ratios to Average Net AssetsE,F | | | | | |
| Expenses before reductions | 1.06% | 1.12% | 1.14% | 1.13% | 1.14% |
| Expenses net of fee waivers, if any | 1.06% | 1.12% | 1.14% | 1.13% | 1.14% |
| Expenses net of all reductions | 1.01% | 1.10% | 1.12% | 1.11% | 1.14% |
| Net investment income (loss) | .54% | .50% | .69% | .64% | .74% |
| Supplemental Data | | | | | |
| Net assets, end of period (000 omitted) | $2,165,082 | $2,112,031 | $1,782,912 | $1,379,660 | $1,145,744 |
| Portfolio turnover rateG | 157%H | 178%H | 167% | 187% | 178% |
A Calculated based on average shares outstanding during the period.
B Total distributions of $.91 per share is comprised of distributions from net investment income of $.092 and distributions from net realized gain of $.813 per share.
C Amount represents less than $.005 per share.
D Total returns would have been lower if certain expenses had not been reduced during the applicable periods shown.
E Fees and expenses of any underlying Fidelity Central Funds are not included in the Fund's expense ratio. The Fund indirectly bears its proportionate share of the expenses of any underlying Fidelity Central Funds.
F Expense ratios reflect operating expenses of the Fund. Expenses before reductions do not reflect amounts reimbursed by the investment adviser or reductions from brokerage service arrangements or reductions from other expense offset arrangements and do not represent the amount paid by the Fund during periods when reimbursements or reductions occur. Expenses net of fee waivers reflect expenses after reimbursement by the investment adviser but prior to reductions from brokerage service arrangements or other expense offset arrangements. Expenses net of all reductions represent the net expenses paid by the Fund.
G Amount does not include the portfolio activity of any underlying Fidelity Central Funds.
H Portfolio turnover rate excludes securities received or delivered in-kind.
See accompanying notes which are an integral part of the financial statements.
Notes to Financial Statements
For the period ended October 31, 2018
1. Organization.
Fidelity International Capital Appreciation Fund (the Fund) is a fund of Fidelity Investment Trust (the Trust) and is authorized to issue an unlimited number of shares. Share transactions on the Statement of Changes in Net Assets may contain exchanges between affiliated funds. The Trust is registered under the Investment Company Act of 1940, as amended (the 1940 Act), as an open-end management investment company organized as a Massachusetts business trust. The Fund's investments in emerging markets can be subject to social, economic, regulatory, and political uncertainties and can be extremely volatile.
2. Investments in Fidelity Central Funds.
The Fund invests in Fidelity Central Funds, which are open-end investment companies generally available only to other investment companies and accounts managed by the investment adviser and its affiliates. The Fund's Schedule of Investments lists each of the Fidelity Central Funds held as of period end, if any, as an investment of the Fund, but does not include the underlying holdings of each Fidelity Central Fund. As an Investing Fund, the Fund indirectly bears its proportionate share of the expenses of the underlying Fidelity Central Funds.
The Money Market Central Funds seek preservation of capital and current income and are managed by Fidelity Investments Money Management, Inc. (FIMM), an affiliate of the investment adviser. Annualized expenses of the Money Market Central Funds as of their most recent shareholder report date are less than .005%.
A complete unaudited list of holdings for each Fidelity Central Fund is available upon request or at the Securities and Exchange Commission (the SEC) website at www.sec.gov. In addition, the financial statements of the Fidelity Central Funds, which are not covered by the Fund's Report of Independent Registered Public Accounting Firm, are available on the SEC website or upon request.
3. Significant Accounting Policies.
The Fund is an investment company and applies the accounting and reporting guidance of the Financial Accounting Standards Board (FASB) Accounting Standards Codification Topic 946 Financial Services – Investments Companies. The financial statements have been prepared in conformity with accounting principles generally accepted in the United States of America (GAAP), which require management to make certain estimates and assumptions at the date of the financial statements. Actual results could differ from those estimates. Subsequent events, if any, through the date that the financial statements were issued have been evaluated in the preparation of the financial statements. The following summarizes the significant accounting policies of the Fund:
Investment Valuation. Investments are valued as of 4:00 p.m. Eastern time on the last calendar day of the period. The Board of Trustees (the Board) has delegated the day to day responsibility for the valuation of the Fund's investments to the Fair Value Committee (the Committee) established by the Fund's investment adviser. In accordance with valuation policies and procedures approved by the Board, the Fund attempts to obtain prices from one or more third party pricing vendors or brokers to value its investments. When current market prices, quotations or currency exchange rates are not readily available or reliable, investments will be fair valued in good faith by the Committee, in accordance with procedures adopted by the Board. Factors used in determining fair value vary by investment type and may include market or investment specific events. The frequency with which these procedures are used cannot be predicted and they may be utilized to a significant extent. The Committee oversees the Fund's valuation policies and procedures and reports to the Board on the Committee's activities and fair value determinations. The Board monitors the appropriateness of the procedures used in valuing the Fund's investments and ratifies the fair value determinations of the Committee.
The Fund categorizes the inputs to valuation techniques used to value its investments into a disclosure hierarchy consisting of three levels as shown below:
- Level 1 – quoted prices in active markets for identical investments
- Level 2 – other significant observable inputs (including quoted prices for similar investments, interest rates, prepayment speeds, etc.)
- Level 3 – unobservable inputs (including the Fund's own assumptions based on the best information available)
Valuation techniques used to value the Fund's investments by major category are as follows:
Equity securities, including restricted securities, for which market quotations are readily available, are valued at the last reported sale price or official closing price as reported by a third party pricing vendor on the primary market or exchange on which they are traded and are categorized as Level 1 in the hierarchy. In the event there were no sales during the day or closing prices are not available, securities are valued at the last quoted bid price or may be valued using the last available price and are generally categorized as Level 2 in the hierarchy. For foreign equity securities, when market or security specific events arise, comparisons to the valuation of American Depositary Receipts (ADRs), futures contracts, Exchange-Traded Funds (ETFs) and certain indexes as well as quoted prices for similar securities may be used and would be categorized as Level 2 in the hierarchy. Utilizing these techniques may result in transfers between Level 1 and Level 2. For equity securities, including restricted securities, where observable inputs are limited, assumptions about market activity and risk are used and these securities may be categorized as Level 3 in the hierarchy.
Investments in open-end mutual funds, including the Fidelity Central Funds, are valued at their closing net asset value (NAV) each business day and are categorized as Level 1 in the hierarchy.
Changes in valuation techniques may result in transfers in or out of an assigned level within the disclosure hierarchy. The aggregate value of investments by input level as of October 31, 2018, including information on transfers between Levels 1 and 2 is included at the end of the Fund's Schedule of Investments.
Foreign Currency. The Fund may use foreign currency contracts to facilitate transactions in foreign-denominated securities. Gains and losses from these transactions may arise from changes in the value of the foreign currency or if the counterparties do not perform under the contracts' terms.
Foreign-denominated assets, including investment securities, and liabilities are translated into U.S. dollars at the exchange rates at period end. Purchases and sales of investment securities, income and dividends received and expenses denominated in foreign currencies are translated into U.S. dollars at the exchange rate in effect on the transaction date.
The effects of exchange rate fluctuations on investments are included with the net realized and unrealized gain (loss) on investment securities. Other foreign currency transactions resulting in realized and unrealized gain (loss) are disclosed separately.
Investment Transactions and Income. For financial reporting purposes, the Fund's investment holdings and NAV include trades executed through the end of the last business day of the period. The NAV per share for processing shareholder transactions is calculated as of the close of business of the New York Stock Exchange (NYSE), normally 4:00 p.m. Eastern time and includes trades executed through the end of the prior business day. Gains and losses on securities sold are determined on the basis of identified cost and include proceeds received from litigation. Dividend income is recorded on the ex-dividend date, except for certain dividends from foreign securities where the ex-dividend date may have passed, which are recorded as soon as the Fund is informed of the ex-dividend date. Non-cash dividends included in dividend income, if any, are recorded at the fair market value of the securities received. Income and capital gain distributions from Fidelity Central Funds, if any, are recorded on the ex-dividend date. Certain distributions received by the Fund represent a return of capital or capital gain. The Fund determines the components of these distributions subsequent to the ex-dividend date, based upon receipt of tax filings or other correspondence relating to the underlying investment. These distributions are recorded as a reduction of cost of investments and/or as a realized gain. Investment income is recorded net of foreign taxes withheld where recovery of such taxes is uncertain.
Expenses. Expenses directly attributable to a fund are charged to that fund. Expenses attributable to more than one fund are allocated among the respective funds on the basis of relative net assets or other appropriate methods. Expense estimates are accrued in the period to which they relate and adjustments are made when actual amounts are known.
Income Tax Information and Distributions to Shareholders. Each year, the Fund intends to qualify as a regulated investment company under Subchapter M of the Internal Revenue Code, including distributing substantially all of its taxable income and realized gains. As a result, no provision for U.S. Federal income taxes is required. As of October 31, 2018, the Fund did not have any unrecognized tax benefits in the financial statements; nor is the Fund aware of any tax positions for which it is reasonably possible that the total amounts of unrecognized tax benefits will significantly change in the next twelve months. The Fund files a U.S. federal tax return, in addition to state and local tax returns as required. The Fund's federal income tax returns are subject to examination by the Internal Revenue Service (IRS) for a period of three fiscal years after they are filed. State and local tax returns may be subject to examination for an additional fiscal year depending on the jurisdiction. Foreign taxes are provided for based on the Fund's understanding of the tax rules and rates that exist in the foreign markets in which it invests. The Fund is subject to a tax imposed on capital gains by certain countries in which it invests. The Fund is subject to a tax imposed on capital gains by certain countries in which it invests. An estimated deferred tax liability for net unrealized appreciation on the applicable securities is included in Other payables and accrued expenses on the Statement of Assets and Liabilities.
Distributions are declared and recorded on the ex-dividend date. Income and capital gain distributions are determined in accordance with income tax regulations, which may differ from GAAP. In addition, the Fund claimed a portion of the payment made to redeeming shareholders as a distribution for income tax purposes.
Capital accounts within the financial statements are adjusted for permanent book-tax differences. These adjustments have no impact on net assets or the results of operations. Capital accounts are not adjusted for temporary book-tax differences which will reverse in a subsequent period.
Book-tax differences are primarily due to foreign currency transactions, certain foreign taxes, passive foreign investment companies (PFIC), redemptions in kind, deferred trustees compensation and losses deferred due to wash sales.
As of period end, the cost and unrealized appreciation (depreciation) in securities, and derivatives if applicable, for federal income tax purposes were as follows:
| Gross unrealized appreciation | $296,180,674 |
| Gross unrealized depreciation | (114,492,324) |
| Net unrealized appreciation (depreciation) | $181,688,350 |
| Tax Cost | $1,990,846,929 |
The tax-based components of distributable earnings as of period end were as follows:
| Undistributed ordinary income | $9,487,232 |
| Undistributed long-term capital gain | $51,590,705 |
| Net unrealized appreciation (depreciation) on securities and other investments | $181,422,132 |
The tax character of distributions paid was as follows:
| | October 31, 2018 | October 31, 2017 |
| Ordinary Income | $7,081,356 | $ 11,269,814 |
| Long-term Capital Gains | 63,617,702 | – |
| Total | $70,699,058 | $ 11,269,814 |
Restricted Securities. The Fund may invest in securities that are subject to legal or contractual restrictions on resale. These securities generally may be resold in transactions exempt from registration or to the public if the securities are registered. Disposal of these securities may involve time-consuming negotiations and expense, and prompt sale at an acceptable price may be difficult. Information regarding restricted securities is included at the end of the Fund's Schedule of Investments.
New Rule Issuance. During August 2018, the U.S. Securities and Exchange Commission issued Final Rule Release No. 33-10532, Disclosure Update and Simplification. This Final Rule includes amendments specific to registered investment companies that are intended to eliminate overlap in disclosure requirements between Regulation S-X and GAAP. In accordance with these amendments, certain line-items in the Fund's financial statements have been combined or removed for the current period as outlined in the table below.
| Financial Statement | Current Line-Item Presentation | Prior Line-Item Presentation |
| Statement of Assets and Liabilities | Total distributable earnings (loss) | Undistributed/Distributions in excess of/Accumulated net investment income (loss)
Accumulated/Undistributed net realized gain (loss)
Net unrealized appreciation (depreciation) |
| Statement of Changes in Net Assets | N/A - removed | Undistributed/Distributions in excess of/Accumulated net investment income (loss) end of period |
| Statement of Changes in Net Assets | Distributions to shareholders | Distributions to shareholders from net investment income
Distributions to shareholders from net realized gain |
4. Purchases and Sales of Investments.
Purchases and sales of securities, other than short-term securities and in-kind transactions, aggregated $3,835,728,524 and $3,554,391,906, respectively.
Redemptions In-Kind. During the period, 1,386,625 shares of the Fund held by unaffiliated entities were redeemed in-kind for investments and cash with a value of $29,374,572. The net realized gain of $8,546,160 on investments delivered through the in-kind redemptions is included in the accompanying Statement of Operations. The amount of the redemptions is included in share transactions activity shown in the accompanying Statement of Changes in Net Assets. The Fund recognized no gain or loss for federal income tax purposes.
5. Fees and Other Transactions with Affiliates.
Management Fee. Fidelity Management & Research Company (the investment adviser) and its affiliates provide the Fund with investment management related services for which the Fund pays a monthly management fee. The management fee is the sum of an individual fund fee rate that is based on an annual rate of .45% of the Fund's average net assets and an annualized group fee rate that averaged .24% during the period. The group fee rate is based upon the average net assets of all the mutual funds advised by the investment adviser, including any mutual funds previously advised by the investment adviser that are currently advised by Fidelity SelectCo, LLC, an affiliate of the investment adviser. The group fee rate decreases as assets under management increase and increases as assets under management decrease. In addition, the management fee is subject to a performance adjustment (up to a maximum of +/- .20% of the Fund's average net assets over a 36 month performance period). The upward or downward adjustment to the management fee is based on the Fund's relative investment performance as compared to its benchmark index, the MSCI All Country World ex USA Index, over the same 36 month performance period. For the reporting period, the total annual management fee rate, including the performance adjustment, was .82% of the Fund's average net assets. The performance adjustment included in the management fee rate may be higher or lower than the maximum performance adjustment rate due to the difference between the average net assets for the reporting and performance periods.
Transfer Agent Fees. Fidelity Investments Institutional Operations Company, Inc. (FIIOC), an affiliate of the investment adviser, is the Fund's transfer, dividend disbursing and shareholder servicing agent. FIIOC receives account fees and asset-based fees that vary according to account size and type of account. FIIOC pays for typesetting, printing and mailing of shareholder reports, except proxy statements. For the period, the transfer agent fees were equivalent to an annual rate of .17% of average net assets.
Accounting and Security Lending Fees. Fidelity Service Company, Inc. (FSC), an affiliate of the investment adviser, maintains the Fund's accounting records. The accounting fee is based on the level of average net assets for each month. Under a separate contract, FSC administers the security lending program. The security lending fee is based on the number and duration of lending transactions. For the period, the fees were equivalent to an annual rate of .04%.
Brokerage Commissions. The Fund placed a portion of its portfolio transactions with brokerage firms which are affiliates of the investment adviser. Brokerage commissions are included in net realized gain (loss) and change in net unrealized appreciation (depreciation) in the Statement of Operations. The commissions paid to these affiliated firms were $17,384 for the period.
Interfund Lending Program. Pursuant to an Exemptive Order issued by the SEC, the Fund, along with other registered investment companies having management contracts with Fidelity Management & Research Company (FMR) or other affiliated entities of FMR, may participate in an interfund lending program. This program provides an alternative credit facility allowing the funds to borrow from, or lend money to, other participating affiliated funds. At period end, there were no interfund loans outstanding. The Fund's activity in this program during the period for which loans were outstanding was as follows:
| Borrower or Lender | Average Loan Balance | Weighted Average Interest Rate | Interest Expense |
| Borrower | $7,501,263 | 1.96% | $7,759 |
Interfund Trades. The Fund may purchase from or sell securities to other Fidelity Funds under procedures adopted by the Board. The procedures have been designed to ensure these interfund trades are executed in accordance with Rule 17a-7 of the 1940 Act. Interfund trades are included within the respective purchases and sales amounts shown in the Purchases and Sales of Investments note.
Prior Fiscal Year Redemptions In-Kind. During the prior period, 8,315,551 shares of the Fund held by an affiliated entity were redeemed in-kind for investments and cash with a value of $165,479,456. The net realized gain of $45,376,740 on investments delivered through in-kind redemptions. The amount of the in-kind redemptions is included in share transactions in the accompanying Statement of Changes in Net Assets. The Fund recognized no gain or loss for federal income tax purposes.
6. Committed Line of Credit.
The Fund participates with other funds managed by the investment adviser or an affiliate in a $4.25 billion credit facility (the "line of credit") to be utilized for temporary or emergency purposes to fund shareholder redemptions or for other short-term liquidity purposes. The Fund has agreed to pay commitment fees on its pro-rata portion of the line of credit, which amounted to $6,197 and is reflected in Miscellaneous expenses on the Statement of Operations. During the period, the Fund did not borrow on this line of credit.
7. Security Lending.
The Fund lends portfolio securities through a lending agent from time to time in order to earn additional income. For equity securities, a lending agent is used and may loan securities to certain qualified borrowers, including Fidelity Capital Markets (FCM), a broker-dealer affiliated with the Fund. On the settlement date of the loan, the Fund receives collateral (in the form of U.S. Treasury obligations, letters of credit and/or cash) against the loaned securities and maintains collateral in an amount not less than 100% of the market value of the loaned securities during the period of the loan. The market value of the loaned securities is determined at the close of business of the Fund and any additional required collateral is delivered to the Fund on the next business day. The Fund or borrower may terminate the loan at any time, and if the borrower defaults on its obligation to return the securities loaned because of insolvency or other reasons, the Fund may apply collateral received from the borrower against the obligation. The Fund may experience delays and costs in recovering the securities loaned. Any cash collateral received is invested in the Fidelity Securities Lending Cash Central Fund. The value of loaned securities and cash collateral at period end are disclosed on the Fund's Statement of Assets and Liabilities. The value of securities loaned to FCM at period end was $1,546,493. Security lending income represents the income earned on investing cash collateral, less rebates paid to borrowers and any lending agent fees associated with the loan, plus any premium payments received for lending certain types of securities. Security lending income is presented in the Statement of Operations as a component of income from Fidelity Central Funds. Total security lending income during the period amounted to $226,909, including $194 from securities loaned to FCM.
8. Expense Reductions.
Commissions paid to certain brokers with whom the investment adviser, or its affiliates, places trades on behalf of the Fund include an amount in addition to trade execution, which may be rebated back to the Fund to offset certain expenses. This amount totaled $1,287,876 for the period.
In addition, during the period the investment adviser reimbursed and/or waived a portion of operating expenses in the amount of $21,597.
9. Other.
The Fund's organizational documents provide former and current trustees and officers with a limited indemnification against liabilities arising in connection with the performance of their duties to the Fund. In the normal course of business, the Fund may also enter into contracts that provide general indemnifications. The Fund's maximum exposure under these arrangements is unknown as this would be dependent on future claims that may be made against the Fund. The risk of material loss from such claims is considered remote.
At the end of the period, Strategic Advisers Fidelity International Fund was the owner of record of approximately 27% of the total outstanding shares of the Fund. Mutual Funds managed by the investment adviser or its affiliates were the owners of record, in the aggregate, of approximately 29% of the total outstanding shares of the Fund.
Fidelity® Overseas Fund
Performance: The Bottom Line
Average annual total return reflects the change in the value of an investment, assuming reinvestment of distributions from dividend income and capital gains (the profits earned upon the sale of securities that have grown in value, if any) and assuming a constant rate of performance each year. The hypothetical investment and the average annual total returns do not reflect the deduction of taxes that a shareholder would pay on fund distributions or the redemption of fund shares. During periods of reimbursement by Fidelity, a fund’s total return will be greater than it would be had the reimbursement not occurred. How a fund did yesterday is no guarantee of how it will do tomorrow.
Average Annual Total Returns
| For the periods ended October 31, 2018 | Past 1 year | Past 5 years | Past 10 years |
| Fidelity® Overseas Fund | (7.23)% | 4.83% | 8.01% |
$10,000 Over 10 Years
Let's say hypothetically that $10,000 was invested in Fidelity® Overseas Fund, a class of the fund, on October 31, 2008.
The chart shows how the value of your investment would have changed, and also shows how the MSCI EAFE Index performed over the same period.
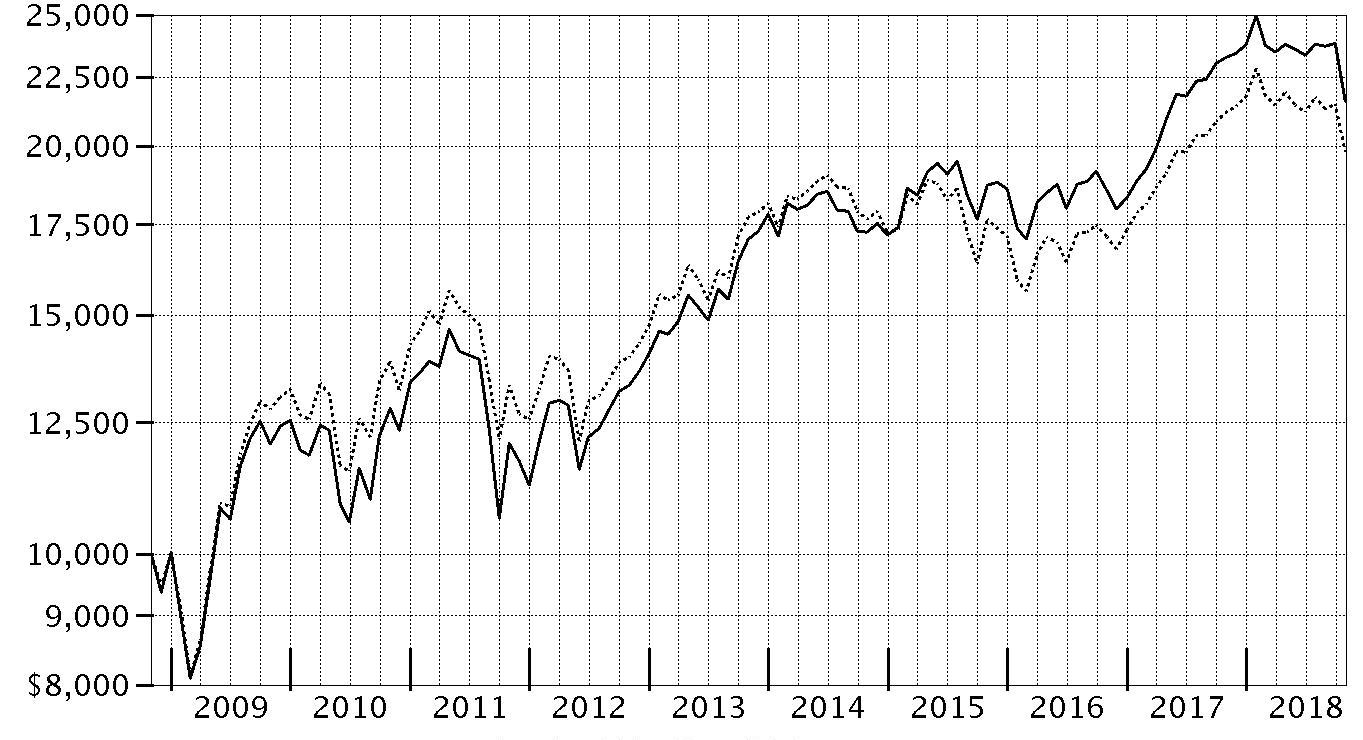
| Period Ending Values |
| $21,602 | Fidelity® Overseas Fund |
| $19,780 | MSCI EAFE Index |
Fidelity® Overseas Fund
Management's Discussion of Fund Performance
Market Recap: International equities returned -8.08% for the 12 months ending October 31, 2018, according to the MSCI ACWI (All Country World Index) ex USA Index. A modestly positive first half of the period gave way to a confluence of overwhelmingly negative factors – including escalating trade tensions, a surging U.S. dollar, tepid economic growth in Europe, global central bank tightening, concerns about Italy’s budget stalemate with the EU, and weakness in China’s stock market – that yielded a -11% second-half return. The index lost 8% in October alone, its largest monthly drop in more than six years. Among sectors, new-media-infused communications services (-15%) was hit the hardest, while economically sensitive consumer discretionary (-13%), information technology (-12%), financials (-10%), industrials (-9%) and materials (-7%) stocks also fared poorly. Even the more defensive real estate (-9%), utilities (-6%) and consumer staples (-5%) sectors weren’t spared this period. Conversely, elevated crude-oil prices fueled a positive return for energy (+7%), the top-performing sector, followed by the relatively stable-growing health care segment (+2%). Regionally, emerging markets (-12%) fared the worst, hampered by the impact of foreign exchange and concerns about economic weakness in China, India and South Korea. Sluggish growth also pressured shares in continental Europe (-9%). Stocks in Japan (-3%) and the U.K. (-4%) held up better, followed by Canada (-5%) and Asia-Pacific ex Japan (-6%).
Comments from Portfolio Manager Vincent Montemaggiore: For the fiscal year, the fund’s share classes returned roughly -7%, trailing the -6.65% return of the benchmark MSCI EAFE Index. Versus the benchmark, security selection within consumer staples was the biggest detractor, though picks in health care and a sizable underweighting in the strong-performing energy sector, also weighed on relative results. Geographically, our investment choices in the U.K. notably detracted. Among stocks, our sizable overweighting in enterprise software provider Micro Focus International was the largest relative detractor. A recent acquisition proved challenging, with revenue declining faster than anticipated amid heavy sales-force attrition. The fund’s out-of-benchmark stake in Conviviality, another U.K.-based holding and distributor of alcoholic beverages, also hurt, as did overweighting Germany-based drugmaker and chemical company Bayer. Conversely, stock selection in communication services, information technology, materials and industrials all bolstered relative performance. By region, non-benchmark exposure to the United States and stock selection in continental Europe added value. The top individual relative contributor was an out-of-benchmark position in Japan-based Nakanishi, a manufacturer of dental equipment. Non-benchmark exposure to LivaNova, a London-based maker of medical devices, as well as an overweighting in Edenred, a France-based company providing payment solutions, also aided results.
The views expressed above reflect those of the portfolio manager(s) only through the end of the period as stated on the cover of this report and do not necessarily represent the views of Fidelity or any other person in the Fidelity organization. Any such views are subject to change at any time based upon market or other conditions and Fidelity disclaims any responsibility to update such views. These views may not be relied on as investment advice and, because investment decisions for a Fidelity fund are based on numerous factors, may not be relied on as an indication of trading intent on behalf of any Fidelity fund.
Fidelity® Overseas Fund
Investment Summary (Unaudited)
Geographic Diversification (% of fund's net assets)
| As of October 31, 2018 |
| | United Kingdom | 21.7% |
| | Japan | 17.5% |
| | France | 9.7% |
| | Germany | 8.4% |
| | United States of America* | 8.3% |
| | Switzerland | 6.4% |
| | Netherlands | 3.3% |
| | Spain | 3.2% |
| | Ireland | 3.0% |
| | Other | 18.5% |

* Includes Short-Term investments and Net Other Assets (Liabilities).
Percentages are based on country or territory of incorporation and are adjusted for the effect of futures contracts, if applicable.
Asset Allocation as of October 31, 2018
| | % of fund's net assets |
| Stocks | 97.1 |
| Short-Term Investments and Net Other Assets (Liabilities) | 2.9 |
Top Ten Stocks as of October 31, 2018
| | % of fund's net assets |
| Roche Holding AG (participation certificate) (Switzerland, Pharmaceuticals) | 2.0 |
| SAP SE (Germany, Software) | 1.6 |
| Total SA (France, Oil, Gas & Consumable Fuels) | 1.6 |
| Hoya Corp. (Japan, Health Care Equipment & Supplies) | 1.3 |
| Diageo PLC (United Kingdom, Beverages) | 1.3 |
| AIA Group Ltd. (Hong Kong, Insurance) | 1.3 |
| Reckitt Benckiser Group PLC (United Kingdom, Household Products) | 1.3 |
| Sanofi SA (France, Pharmaceuticals) | 1.3 |
| LVMH Moet Hennessy - Louis Vuitton SA (France, Textiles, Apparel & Luxury Goods) | 1.3 |
| Equinor ASA (Norway, Oil, Gas & Consumable Fuels) | 1.2 |
| | 14.2 |
Top Market Sectors as of October 31, 2018
| | % of fund's net assets |
| Financials | 22.7 |
| Industrials | 16.5 |
| Health Care | 14.9 |
| Information Technology | 11.0 |
| Consumer Staples | 10.5 |
| Consumer Discretionary | 7.4 |
| Materials | 6.8 |
| Communication Services | 4.1 |
| Energy | 3.2 |
Fidelity® Overseas Fund
Schedule of Investments October 31, 2018
Showing Percentage of Net Assets
| Common Stocks - 96.2% | | | |
| | | Shares | Value |
| Australia - 0.8% | | | |
| Adelaide Brighton Ltd. | | 6,442,640 | $25,868,556 |
| Aub Group Ltd. | | 2,726,553 | 26,007,991 |
|
| TOTAL AUSTRALIA | | | 51,876,547 |
|
| Austria - 0.6% | | | |
| Erste Group Bank AG | | 978,300 | 39,890,574 |
| Bailiwick of Jersey - 1.0% | | | |
| Ferguson PLC | | 615,161 | 41,540,165 |
| Sanne Group PLC | | 3,785,354 | 27,095,261 |
|
| TOTAL BAILIWICK OF JERSEY | | | 68,635,426 |
|
| Belgium - 1.1% | | | |
| KBC Groep NV | | 1,077,554 | 74,327,935 |
| Bermuda - 2.1% | | | |
| Credicorp Ltd. (United States) | | 177,600 | 40,086,096 |
| Hiscox Ltd. | | 2,503,600 | 52,097,653 |
| IHS Markit Ltd. (a) | | 938,300 | 49,288,899 |
|
| TOTAL BERMUDA | | | 141,472,648 |
|
| Canada - 0.7% | | | |
| Constellation Software, Inc. | | 72,000 | 49,551,992 |
| Cayman Islands - 0.2% | | | |
| ZTO Express (Cayman), Inc. sponsored ADR | | 752,521 | 12,205,891 |
| Denmark - 1.4% | | | |
| DSV de Sammensluttede Vognmaend A/S | | 665,200 | 53,483,417 |
| Netcompany Group A/S | | 637,687 | 21,090,363 |
| NNIT A/S (b) | | 688,597 | 19,444,510 |
|
| TOTAL DENMARK | | | 94,018,290 |
|
| France - 9.7% | | | |
| ALTEN (c) | | 386,035 | 37,231,202 |
| Amundi SA (b) | | 572,606 | 34,101,400 |
| Capgemini SA | | 570,433 | 69,778,901 |
| Compagnie de St. Gobain | | 1,045,218 | 39,374,850 |
| Danone SA | | 998,900 | 70,735,495 |
| Edenred SA | | 1,696,600 | 64,433,058 |
| Elior SA | | 1,094,400 | 15,779,754 |
| Elis SA | | 6,716 | 135,631 |
| LVMH Moet Hennessy - Louis Vuitton SA | | 283,263 | 85,943,532 |
| Sanofi SA | | 981,181 | 87,678,895 |
| SR Teleperformance SA | | 311,100 | 51,304,696 |
| Total SA | | 1,822,360 | 106,927,746 |
|
| TOTAL FRANCE | | | 663,425,160 |
|
| Germany - 7.5% | | | |
| adidas AG | | 243,842 | 57,447,029 |
| Axel Springer Verlag AG | | 668,042 | 44,415,811 |
| Bayer AG | | 938,188 | 71,914,418 |
| Deutsche Post AG | | 1,889,247 | 59,653,485 |
| Fresenius Medical Care AG & Co. KGaA | | 513,236 | 40,297,498 |
| Fresenius SE & Co. KGaA | | 980,196 | 62,297,169 |
| Hannover Reuck SE | | 353,700 | 47,713,640 |
| SAP SE | | 999,345 | 107,003,360 |
| Scout24 AG (b) | | 482,800 | 20,047,280 |
|
| TOTAL GERMANY | | | 510,789,690 |
|
| Hong Kong - 1.3% | | | |
| AIA Group Ltd. | | 11,761,400 | 89,013,458 |
| India - 0.7% | | | |
| Axis Bank Ltd. (a) | | 3,318,035 | 26,127,955 |
| HDFC Bank Ltd. sponsored ADR | | 286,600 | 25,481,606 |
|
| TOTAL INDIA | | | 51,609,561 |
|
| Indonesia - 0.5% | | | |
| PT Bank Rakyat Indonesia Tbk | | 165,352,600 | 34,261,516 |
| Ireland - 3.0% | | | |
| CRH PLC | | 881,600 | 26,325,021 |
| DCC PLC (United Kingdom) | | 648,812 | 55,688,267 |
| Kerry Group PLC Class A | | 539,448 | 55,296,023 |
| Kingspan Group PLC (Ireland) | | 739,780 | 32,175,814 |
| United Drug PLC (United Kingdom) | | 4,165,303 | 33,648,251 |
|
| TOTAL IRELAND | | | 203,133,376 |
|
| Italy - 1.3% | | | |
| Banca Generali SpA | | 356,218 | 6,871,100 |
| FinecoBank SpA | | 1,981,500 | 20,751,223 |
| Prada SpA | | 7,066,000 | 24,959,124 |
| Recordati SpA | | 1,127,300 | 38,202,943 |
|
| TOTAL ITALY | | | 90,784,390 |
|
| Japan - 17.5% | | | |
| AEON Financial Service Co. Ltd. | | 1,642,500 | 32,257,544 |
| Daiichikosho Co. Ltd. | | 647,500 | 29,840,032 |
| Daikin Industries Ltd. | | 314,400 | 36,442,709 |
| Elecom Co. Ltd. | | 349,200 | 8,287,833 |
| Hoya Corp. | | 1,601,000 | 91,007,347 |
| Iriso Electronics Co. Ltd.�� | | 576,800 | 24,409,270 |
| Keyence Corp. | | 125,780 | 61,644,295 |
| KH Neochem Co. Ltd. | | 1,404,800 | 39,840,121 |
| Miroku Jyoho Service Co., Ltd. | | 1,016,800 | 19,194,257 |
| Misumi Group, Inc. | | 328,100 | 6,589,042 |
| Mitsubishi UFJ Financial Group, Inc. | | 12,071,400 | 73,062,062 |
| Morinaga & Co. Ltd. | | 492,700 | 19,802,318 |
| Nabtesco Corp. | | 771,100 | 17,002,675 |
| Nakanishi, Inc. | | 2,384,400 | 55,851,192 |
| Nissan Chemical Corp. | | 652,300 | 30,756,783 |
| Nitori Holdings Co. Ltd. | | 349,500 | 45,640,825 |
| NOF Corp. | | 940,200 | 26,705,730 |
| OBIC Co. Ltd. | | 547,000 | 49,835,246 |
| Olympus Corp. | | 1,330,900 | 44,361,290 |
| ORIX Corp. | | 5,117,400 | 83,494,779 |
| Otsuka Corp. | | 967,700 | 32,160,899 |
| PALTAC Corp. | | 489,100 | 24,967,572 |
| Recruit Holdings Co. Ltd. | | 2,291,600 | 61,505,609 |
| S Foods, Inc. | | 610,200 | 24,632,968 |
| SMC Corp. | | 141,400 | 45,301,635 |
| Sundrug Co. Ltd. | | 550,000 | 19,984,934 |
| Suzuki Motor Corp. | | 768,700 | 38,332,547 |
| Temp Holdings Co., Ltd. | | 1,682,900 | 32,036,772 |
| Tsuruha Holdings, Inc. | | 404,600 | 42,168,618 |
| USS Co. Ltd. | | 1,668,400 | 30,119,474 |
| Welcia Holdings Co. Ltd. | | 1,038,300 | 53,003,128 |
|
| TOTAL JAPAN | | | 1,200,239,506 |
|
| Kenya - 0.3% | | | |
| Safaricom Ltd. | | 97,623,300 | 22,230,575 |
| Korea (South) - 0.3% | | | |
| LG Chemical Ltd. | | 71,240 | 21,665,451 |
| Netherlands - 3.3% | | | |
| Adyen BV (b) | | 9,600 | 6,209,822 |
| Grandvision NV (b) | | 1,249,800 | 31,624,191 |
| Heineken NV (Bearer) | | 613,100 | 55,276,446 |
| IMCD Group BV | | 1,047,578 | 71,133,026 |
| Koninklijke Philips Electronics NV | | 1,692,645 | 63,128,647 |
|
| TOTAL NETHERLANDS | | | 227,372,132 |
|
| New Zealand - 0.8% | | | |
| EBOS Group Ltd. | | 2,276,701 | 30,961,180 |
| Trade Maine Group Ltd. | | 7,426,198 | 23,502,933 |
|
| TOTAL NEW ZEALAND | | | 54,464,113 |
|
| Norway - 1.9% | | | |
| Equinor ASA | | 3,211,459 | 83,545,631 |
| Schibsted ASA (A Shares) | | 1,379,800 | 47,811,286 |
|
| TOTAL NORWAY | | | 131,356,917 |
|
| Spain - 3.2% | | | |
| Amadeus IT Holding SA Class A | | 758,730 | 61,170,350 |
| CaixaBank SA (c) | | 14,075,816 | 56,960,761 |
| Grifols SA ADR | | 2,684,937 | 54,826,414 |
| Masmovil Ibercom SA (a) | | 114,890 | 14,912,916 |
| Prosegur Cash SA (b) | | 15,610,356 | 30,941,872 |
|
| TOTAL SPAIN | | | 218,812,313 |
|
| Sweden - 2.9% | | | |
| Addlife AB | | 839,841 | 19,272,617 |
| Alfa Laval AB | | 986,050 | 25,181,522 |
| HEXPOL AB (B Shares) | | 4,020,852 | 37,215,668 |
| Indutrade AB | | 1,920,923 | 46,096,358 |
| Swedbank AB (A Shares) | | 3,042,523 | 68,522,971 |
|
| TOTAL SWEDEN | | | 196,289,136 |
|
| Switzerland - 6.4% | | | |
| Credit Suisse Group AG | | 3,994,641 | 52,224,607 |
| Julius Baer Group Ltd. | | 843,159 | 38,452,084 |
| Kaba Holding AG (B Shares) (Reg.) (c) | | 50,195 | 36,232,701 |
| Lonza Group AG | | 206,492 | 64,931,754 |
| Roche Holding AG (participation certificate) | | 569,128 | 138,504,359 |
| Sika AG | | 391,927 | 50,277,484 |
| UBS Group AG | | 4,398,787 | 61,538,906 |
|
| TOTAL SWITZERLAND | | | 442,161,895 |
|
| Taiwan - 0.6% | | | |
| Taiwan Semiconductor Manufacturing Co. Ltd. | | 5,162,000 | 38,731,202 |
| United Kingdom - 21.7% | | | |
| Admiral Group PLC | | 1,870,200 | 48,120,556 |
| Ascential PLC | | 8,887,887 | 42,806,353 |
| Beazley PLC | | 5,153,400 | 34,746,825 |
| British American Tobacco PLC (United Kingdom) | | 1,832,460 | 79,437,633 |
| Cineworld Group PLC | | 14,248,039 | 53,652,091 |
| Compass Group PLC | | 3,239,794 | 63,773,012 |
| Conviviality PLC (d) | | 5,450,078 | 70 |
| Cranswick PLC | | 801,170 | 29,595,204 |
| Dechra Pharmaceuticals PLC | | 785,595 | 22,954,813 |
| Diageo PLC | | 2,579,000 | 89,159,932 |
| Diploma PLC | | 2,211,136 | 37,165,504 |
| Halma PLC | | 2,384,970 | 40,483,664 |
| Hastings Group Holdings PLC (b) | | 8,060,163 | 19,069,928 |
| Hilton Food Group PLC | | 2,135,189 | 25,163,211 |
| InterContinental Hotel Group PLC | | 943,400 | 49,560,594 |
| Intertek Group PLC | | 720,045 | 43,146,548 |
| James Fisher and Sons PLC | | 1,005,258 | 21,766,558 |
| John Wood Group PLC | | 2,834,592 | 25,876,719 |
| JTC PLC | | 2,888,200 | 12,367,186 |
| LivaNova PLC (a) | | 296,629 | 33,219,482 |
| London Stock Exchange Group PLC | | 1,233,130 | 68,012,459 |
| Melrose Industries PLC | | 3,500,863 | 7,546,755 |
| Micro Focus International PLC | | 1,627,923 | 25,236,415 |
| Mondi PLC | | 1,568,100 | 36,970,151 |
| Prudential PLC | | 3,890,071 | 77,893,321 |
| Reckitt Benckiser Group PLC | | 1,096,424 | 88,661,356 |
| Rentokil Initial PLC | | 9,621,600 | 38,887,317 |
| Rio Tinto PLC | | 1,178,154 | 57,200,287 |
| Rolls-Royce Holdings PLC | | 3,236,492 | 34,708,763 |
| Rotork PLC | | 8,734,106 | 33,469,475 |
| Schroders PLC | | 385,533 | 13,206,726 |
| Spectris PLC | | 1,434,344 | 39,307,635 |
| St. James's Place Capital PLC | | 3,946,863 | 51,129,862 |
| Standard Life PLC | | 8,566,461 | 29,618,804 |
| The Weir Group PLC | | 1,958,200 | 39,697,124 |
| Ultra Electronics Holdings PLC | | 1,340,794 | 24,644,486 |
| Victrex PLC | | 907,931 | 30,776,922 |
| Volution Group PLC | | 9,088,967 | 20,098,305 |
|
| TOTAL UNITED KINGDOM | | | 1,489,132,046 |
|
| United States of America - 5.4% | | | |
| Alphabet, Inc. Class C (a) | | 30,393 | 32,726,271 |
| Boston Scientific Corp. (a) | | 1,413,700 | 51,091,118 |
| International Flavors & Fragrances, Inc. | | 231,195 | 33,444,669 |
| International Flavors & Fragrances, Inc. (Israel) | | 95,117 | 13,733,710 |
| Marsh & McLennan Companies, Inc. | | 588,900 | 49,909,275 |
| Moody's Corp. | | 292,300 | 42,523,804 |
| S&P Global, Inc. | | 348,441 | 63,527,763 |
| Sherwin-Williams Co. | | 111,300 | 43,793,211 |
| Worldpay, Inc. (a) | | 456,600 | 41,934,144 |
|
| TOTAL UNITED STATES OF AMERICA | | | 372,683,965 |
|
| TOTAL COMMON STOCKS | | | |
| (Cost $5,843,867,778) | | | 6,590,135,705 |
|
| Nonconvertible Preferred Stocks - 0.9% | | | |
| Germany - 0.9% | | | |
| Henkel AG & Co. KGaA | | 554,944 | 60,706,066 |
| United Kingdom - 0.0% | | | |
| Rolls-Royce Holdings PLC Series C (a) | | 143,694,432 | 183,670 |
| TOTAL NONCONVERTIBLE PREFERRED STOCKS | | | |
| (Cost $56,093,831) | | | 60,889,736 |
|
| Money Market Funds - 4.7% | | | |
| Fidelity Cash Central Fund, 2.23% (e) | | 254,742,826 | 254,793,774 |
| Fidelity Securities Lending Cash Central Fund 2.23% (e)(f) | | 71,450,945 | 71,458,090 |
| TOTAL MONEY MARKET FUNDS | | | |
| (Cost $326,251,864) | | | 326,251,864 |
| TOTAL INVESTMENT IN SECURITIES - 101.8% | | | |
| (Cost $6,226,213,473) | | | 6,977,277,305 |
| NET OTHER ASSETS (LIABILITIES) - (1.8)% | | | (125,429,622) |
| NET ASSETS - 100% | | | $6,851,847,683 |
Categorizations in the Schedule of Investments are based on country or territory of incorporation.
Legend
(a) Non-income producing
(b) Security exempt from registration under Rule 144A of the Securities Act of 1933. These securities may be resold in transactions exempt from registration, normally to qualified institutional buyers. At the end of the period, the value of these securities amounted to $161,439,003 or 2.4% of net assets.
(c) Security or a portion of the security is on loan at period end.
(d) Level 3 security
(e) Affiliated fund that is generally available only to investment companies and other accounts managed by Fidelity Investments. The rate quoted is the annualized seven-day yield of the fund at period end. A complete unaudited listing of the fund's holdings as of its most recent quarter end is available upon request. In addition, each Fidelity Central Fund's financial statements, which are not covered by the Fund's Report of Independent Registered Public Accounting Firm, are available on the SEC's website or upon request.
(f) Investment made with cash collateral received from securities on loan.
Affiliated Central Funds
Information regarding fiscal year to date income earned by the Fund from investments in Fidelity Central Funds is as follows:
| Fund | Income earned |
| Fidelity Cash Central Fund | $1,167,490 |
| Fidelity Securities Lending Cash Central Fund | 2,365,560 |
| Total | $3,533,050 |
Amounts in the income column in the above table include any capital gain distributions from underlying funds, which are presented in the corresponding line-item in the Statement of Operations if applicable.
Investment Valuation
The following is a summary of the inputs used, as of October 31, 2018, involving the Fund's assets and liabilities carried at fair value. The inputs or methodology used for valuing securities may not be an indication of the risk associated with investing in those securities. For more information on valuation inputs, and their aggregation into the levels used below, please refer to the Investment Valuation section in the accompanying Notes to Financial Statements.
| | Valuation Inputs at Reporting Date: |
| Description | Total | Level 1 | Level 2 | Level 3 |
| Investments in Securities: | | | | |
| Equities: | | | | |
| Communication Services | $288,395,335 | $288,395,335 | $-- | $-- |
| Consumer Discretionary | 503,856,478 | 379,580,399 | 124,276,079 | -- |
| Consumer Staples | 713,623,402 | 385,628,916 | 327,994,416 | 70 |
| Energy | 216,350,096 | 109,422,350 | 106,927,746 | -- |
| Financials | 1,551,409,503 | 1,252,816,668 | 298,592,835 | -- |
| Health Care | 1,023,593,897 | 515,411,621 | 508,182,276 | -- |
| Industrials | 1,125,914,836 | 894,229,420 | 231,685,416 | -- |
| Information Technology | 753,308,130 | 582,337,153 | 170,970,977 | -- |
| Materials | 474,573,764 | 360,291,673 | 114,282,091 | -- |
| Money Market Funds | 326,251,864 | 326,251,864 | -- | -- |
| Total Investments in Securities: | $6,977,277,305 | $5,094,365,399 | $1,882,911,836 | $70 |
The following is a summary of transfers between Level 1 and Level 2 for the period ended October 31, 2018. Transfers are assumed to have occurred at the beginning of the period, and are primarily attributable to the valuation techniques used for foreign equity securities, as discussed in the accompanying Notes to Financial Statements:
| Transfers | Total |
| Level 1 to Level 2 | $345,754,342 |
| Level 2 to Level 1 | $916,928,196 |
See accompanying notes which are an integral part of the financial statements.
Fidelity® Overseas Fund
Financial Statements
Statement of Assets and Liabilities
| | | October 31, 2018 |
| Assets | | |
Investment in securities, at value (including securities loaned of $68,281,363) — See accompanying schedule:
Unaffiliated issuers (cost $5,899,961,609) | $6,651,025,441 | |
| Fidelity Central Funds (cost $326,251,864) | 326,251,864 | |
| Total Investment in Securities (cost $6,226,213,473) | | $6,977,277,305 |
| Receivable for investments sold | | 40,995,005 |
| Receivable for fund shares sold | | 86,401,010 |
| Dividends receivable | | 26,172,107 |
| Distributions receivable from Fidelity Central Funds | | 246,205 |
| Prepaid expenses | | 14,121 |
| Other receivables | | 600,350 |
| Total assets | | 7,131,706,103 |
| Liabilities | | |
| Payable to custodian bank | $61,386 | |
| Payable for investments purchased | 194,766,847 | |
| Payable for fund shares redeemed | 7,581,053 | |
| Accrued management fee | 4,159,311 | |
| Other affiliated payables | 1,005,784 | |
| Other payables and accrued expenses | 817,484 | |
| Collateral on securities loaned | 71,466,555 | |
| Total liabilities | | 279,858,420 |
| Net Assets | | $6,851,847,683 |
| Net Assets consist of: | | |
| Paid in capital | | $5,758,733,606 |
| Total distributable earnings (loss) | | 1,093,114,077 |
| Net Assets | | $6,851,847,683 |
| Net Asset Value and Maximum Offering Price | | |
| Overseas: | | |
| Net Asset Value, offering price and redemption price per share ($5,825,756,648 ÷ 126,526,889 shares) | | $46.04 |
| Class K: | | |
| Net Asset Value, offering price and redemption price per share ($1,026,091,035 ÷ 22,317,544 shares) | | $45.98 |
See accompanying notes which are an integral part of the financial statements.
Statement of Operations
| | | Year ended October 31, 2018 |
| Investment Income | | |
| Dividends | | $188,805,729 |
| Income from Fidelity Central Funds | | 3,533,050 |
| Income before foreign taxes withheld | | 192,338,779 |
| Less foreign taxes withheld | | (16,171,173) |
| Total income | | 176,167,606 |
| Expenses | | |
| Management fee | | |
| Basic fee | $50,790,352 | |
| Performance adjustment | 8,379,007 | |
| Transfer agent fees | 10,749,183 | |
| Accounting and security lending fees | 1,689,727 | |
| Custodian fees and expenses | 898,145 | |
| Independent trustees' fees and expenses | 38,286 | |
| Registration fees | 136,895 | |
| Audit | 86,557 | |
| Legal | 21,245 | |
| Interest | 23,248 | |
| Miscellaneous | 52,008 | |
| Total expenses before reductions | 72,864,653 | |
| Expense reductions | (833,020) | |
| Total expenses after reductions | | 72,031,633 |
| Net investment income (loss) | | 104,135,973 |
| Realized and Unrealized Gain (Loss) | | |
| Net realized gain (loss) on: | | |
| Investment securities: | | |
| Unaffiliated issuers | 255,186,200 | |
| Fidelity Central Funds | (17,834) | |
| Foreign currency transactions | (1,863,296) | |
| Total net realized gain (loss) | | 253,305,070 |
| Change in net unrealized appreciation (depreciation) on: | | |
| Investment securities: | | |
| Unaffiliated issuers | (873,587,045) | |
| Fidelity Central Funds | 11,865 | |
| Assets and liabilities in foreign currencies | (290,293) | |
| Total change in net unrealized appreciation (depreciation) | | (873,865,473) |
| Net gain (loss) | | (620,560,403) |
| Net increase (decrease) in net assets resulting from operations | | $(516,424,430) |
See accompanying notes which are an integral part of the financial statements.
Statement of Changes in Net Assets
| | Year ended October 31, 2018 | Year ended October 31, 2017 |
| Increase (Decrease) in Net Assets | | |
| Operations | | |
| Net investment income (loss) | $104,135,973 | $85,275,934 |
| Net realized gain (loss) | 253,305,070 | 136,914,624 |
| Change in net unrealized appreciation (depreciation) | (873,865,473) | 1,248,492,417 |
| Net increase (decrease) in net assets resulting from operations | (516,424,430) | 1,470,682,975 |
| Distributions to shareholders | (89,089,141) | – |
| Distributions to shareholders from net investment income | – | (95,770,528) |
| Distributions to shareholders from net realized gain | – | (6,822,064) |
| Total distributions | (89,089,141) | (102,592,592) |
| Share transactions - net increase (decrease) | (528,598,495) | 1,304,095,173 |
| Redemption fees | – | 11,066 |
| Total increase (decrease) in net assets | (1,134,112,066) | 2,672,196,622 |
| Net Assets | | |
| Beginning of period | 7,985,959,749 | 5,313,763,127 |
| End of period | $6,851,847,683 | $7,985,959,749 |
| Other Information | | |
| Undistributed net investment income end of period | | $82,288,871 |
See accompanying notes which are an integral part of the financial statements.
Financial Highlights
Fidelity Overseas Fund
| Years ended October 31, | 2018 | 2017 | 2016 | 2015 | 2014 |
| Selected Per–Share Data | | | | | |
| Net asset value, beginning of period | $50.18 | $40.73 | $41.56 | $39.02 | $39.22 |
| Income from Investment Operations | | | | | |
| Net investment income (loss)A | .68 | .58 | .75B | .52 | .77C |
| Net realized and unrealized gain (loss) | (4.27) | 9.65 | (1.15) | 2.69 | (.28) |
| Total from investment operations | (3.59) | 10.23 | (.40) | 3.21 | .49 |
| Distributions from net investment income | (.52) | (.72) | (.43) | (.67) | (.51) |
| Distributions from net realized gain | (.03) | (.05) | (.01) | – | (.18) |
| Total distributions | (.55) | (.78)D | (.43)E | (.67) | (.69) |
| Redemption fees added to paid in capitalA | – | –F | –F | –F | –F |
| Net asset value, end of period | $46.04 | $50.18 | $40.73 | $41.56 | $39.02 |
| Total ReturnG | (7.23)% | 25.63% | (.97)% | 8.34% | 1.27% |
| Ratios to Average Net AssetsH,I | | | | | |
| Expenses before reductions | .97% | 1.00% | 1.03% | 1.04% | 1.04% |
| Expenses net of fee waivers, if any | .97% | 1.00% | 1.03% | 1.04% | 1.04% |
| Expenses net of all reductions | .96% | 1.00% | 1.03% | 1.03% | 1.04% |
| Net investment income (loss) | 1.35% | 1.30% | 1.88%H | 1.28% | 1.93%J |
| Supplemental Data | | | | | |
| Net assets, end of period (000 omitted) | $5,825,757 | $6,828,078 | $4,569,084 | $3,844,290 | $2,738,667 |
| Portfolio turnover rateJ | 33% | 26%K | 33% | 28% | 41% |
A Calculated based on average shares outstanding during the period.
B Net investment income per share reflects a large, non-recurring dividend which amounted to $.18 per share. Excluding this non-recurring dividend, the ratio of net investment income (loss) to average net assets would have been 1.42%.
C Net investment income per share reflects a large, non-recurring dividend which amounted to $.24 per share. Excluding this non-recurring dividend, the ratio of net investment income (loss) to average net assets would have been 1.34%.
D Total distributions of $.78 per share is comprised of distributions from net investment income of $.723 and distributions from net realized gain of $.052 per share.
E Total distributions of $.43 per share is comprised of distributions from net investment income of $.428 and distributions from net realized gain of $.006 per share.
F Amount represents less than $.005 per share.
G Total returns would have been lower if certain expenses had not been reduced during the applicable periods shown.
H Fees and expenses of any underlying Fidelity Central Funds are not included in the Fund's expense ratio. The Fund indirectly bears its proportionate share of the expenses of any underlying Fidelity Central Funds.
I Expense ratios reflect operating expenses of the class. Expenses before reductions do not reflect amounts reimbursed by the investment adviser or reductions from brokerage service arrangements or reductions from other expense offset arrangements and do not represent the amount paid by the class during periods when reimbursements or reductions occur. Expenses net of fee waivers reflect expenses after reimbursement by the investment adviser but prior to reductions from brokerage service arrangements or other expense offset arrangements. Expenses net of all reductions represent the net expenses paid by the class.
J Amount does not include the portfolio activity of any underlying Fidelity Central Funds.
K Portfolio turnover rate excludes securities received or delivered in-kind.
See accompanying notes which are an integral part of the financial statements.
Fidelity Overseas Fund Class K
| Years ended October 31, | 2018 | 2017 | 2016 | 2015 | 2014 |
| Selected Per–Share Data | | | | | |
| Net asset value, beginning of period | $50.11 | $40.67 | $41.49 | $38.96 | $39.17 |
| Income from Investment Operations | | | | | |
| Net investment income (loss)A | .73 | .64 | .80B | .57 | .82C |
| Net realized and unrealized gain (loss) | (4.26) | 9.62 | (1.14) | 2.68 | (.28) |
| Total from investment operations | (3.53) | 10.26 | (.34) | 3.25 | .54 |
| Distributions from net investment income | (.57) | (.77) | (.47) | (.72) | (.58) |
| Distributions from net realized gain | (.03) | (.05) | (.01) | – | (.18) |
| Total distributions | (.60) | (.82) | (.48) | (.72) | (.75)D |
| Redemption fees added to paid in capitalA | – | –E | –E | –E | –E |
| Net asset value, end of period | $45.98 | $50.11 | $40.67 | $41.49 | $38.96 |
| Total ReturnF | (7.13)% | 25.80% | (.85)% | 8.47% | 1.41% |
| Ratios to Average Net AssetsG,H | | | | | |
| Expenses before reductions | .86% | .89% | .91% | .91% | .90% |
| Expenses net of fee waivers, if any | .86% | .89% | .91% | .91% | .90% |
| Expenses net of all reductions | .85% | .88% | .90% | .90% | .90% |
| Net investment income (loss) | 1.46% | 1.42% | 2.00%G | 1.40% | 2.06%I |
| Supplemental Data | | | | | |
| Net assets, end of period (000 omitted) | $1,026,091 | $1,157,882 | $744,679 | $691,585 | $626,817 |
| Portfolio turnover rateI | 33% | 26%J | 33% | 28% | 41% |
A Calculated based on average shares outstanding during the period.
B Net investment income per share reflects a large, non-recurring dividend which amounted to $.18 per share. Excluding this non-recurring dividend, the ratio of net investment income (loss) to average net assets would have been 1.55%.
C Net investment income per share reflects a large, non-recurring dividend which amounted to $.24 per share. Excluding this non-recurring dividend, the ratio of net investment income (loss) to average net assets would have been 1.47%.
D Total distributions of $.75 per share is comprised of distributions from net investment income of $.575 and distributions from net realized gain of $.177 per share.
E Amount represents less than $.005 per share.
F Total returns would have been lower if certain expenses had not been reduced during the applicable periods shown.
G Fees and expenses of any underlying Fidelity Central Funds are not included in the Fund's expense ratio. The Fund indirectly bears its proportionate share of the expenses of any underlying Fidelity Central Funds.
H Expense ratios reflect operating expenses of the class. Expenses before reductions do not reflect amounts reimbursed by the investment adviser or reductions from brokerage service arrangements or reductions from other expense offset arrangements and do not represent the amount paid by the class during periods when reimbursements or reductions occur. Expenses net of fee waivers reflect expenses after reimbursement by the investment adviser but prior to reductions from brokerage service arrangements or other expense offset arrangements. Expenses net of all reductions represent the net expenses paid by the class.
I Amount does not include the portfolio activity of any underlying Fidelity Central Funds.
J Portfolio turnover rate excludes securities received or delivered in-kind.
See accompanying notes which are an integral part of the financial statements.
Notes to Financial Statements
For the period ended October 31, 2018
1. Organization.
Fidelity Overseas Fund (the Fund) is a fund of Fidelity Investment Trust (the Trust) and is authorized to issue an unlimited number of shares. The Trust is registered under the Investment Company Act of 1940, as amended (the 1940 Act), as an open-end management investment company organized as a Massachusetts business trust. The Fund offers Overseas and Class K shares, each of which has equal rights as to assets and voting privileges. Each class has exclusive voting rights with respect to matters that affect that class.
2. Investments in Fidelity Central Funds.
The Fund invests in Fidelity Central Funds, which are open-end investment companies generally available only to other investment companies and accounts managed by the investment adviser and its affiliates. The Fund's Schedule of Investments lists each of the Fidelity Central Funds held as of period end, if any, as an investment of the Fund, but does not include the underlying holdings of each Fidelity Central Fund. As an Investing Fund, the Fund indirectly bears its proportionate share of the expenses of the underlying Fidelity Central Funds.
The Money Market Central Funds seek preservation of capital and current income and are managed by Fidelity Investments Money Management, Inc. (FIMM), an affiliate of the investment adviser. Annualized expenses of the Money Market Central Funds as of their most recent shareholder report date are less than .005%.
A complete unaudited list of holdings for each Fidelity Central Fund is available upon request or at the Securities and Exchange Commission (the SEC) website at www.sec.gov. In addition, the financial statements of the Fidelity Central Funds, which are not covered by the Fund's Report of Independent Registered Public Accounting Firm, are available on the SEC website or upon request.
3. Significant Accounting Policies.
The Fund is an investment company and applies the accounting and reporting guidance of the Financial Accounting Standards Board (FASB) Accounting Standards Codification Topic 946 Financial Services – Investments Companies. The financial statements have been prepared in conformity with accounting principles generally accepted in the United States of America (GAAP), which require management to make certain estimates and assumptions at the date of the financial statements. Actual results could differ from those estimates. Subsequent events, if any, through the date that the financial statements were issued have been evaluated in the preparation of the financial statements. The following summarizes the significant accounting policies of the Fund:
Investment Valuation. Investments are valued as of 4:00 p.m. Eastern time on the last calendar day of the period. The Board of Trustees (the Board) has delegated the day to day responsibility for the valuation of the Fund's investments to the Fair Value Committee (the Committee) established by the Fund's investment adviser. In accordance with valuation policies and procedures approved by the Board, the Fund attempts to obtain prices from one or more third party pricing vendors or brokers to value its investments. When current market prices, quotations or currency exchange rates are not readily available or reliable, investments will be fair valued in good faith by the Committee, in accordance with procedures adopted by the Board. Factors used in determining fair value vary by investment type and may include market or investment specific events. The frequency with which these procedures are used cannot be predicted and they may be utilized to a significant extent. The Committee oversees the Fund's valuation policies and procedures and reports to the Board on the Committee's activities and fair value determinations. The Board monitors the appropriateness of the procedures used in valuing the Fund's investments and ratifies the fair value determinations of the Committee.
The Fund categorizes the inputs to valuation techniques used to value its investments into a disclosure hierarchy consisting of three levels as shown below:
- Level 1 – quoted prices in active markets for identical investments
- Level 2 – other significant observable inputs (including quoted prices for similar investments, interest rates, prepayment speeds, etc.)
- Level 3 – unobservable inputs (including the Fund's own assumptions based on the best information available)
Valuation techniques used to value the Fund's investments by major category are as follows:
Equity securities, including restricted securities, for which market quotations are readily available, are valued at the last reported sale price or official closing price as reported by a third party pricing vendor on the primary market or exchange on which they are traded and are categorized as Level 1 in the hierarchy. In the event there were no sales during the day or closing prices are not available, securities are valued at the last quoted bid price or may be valued using the last available price and are generally categorized as Level 2 in the hierarchy. For foreign equity securities, when market or security specific events arise, comparisons to the valuation of American Depositary Receipts (ADRs), futures contracts, Exchange-Traded Funds (ETFs) and certain indexes as well as quoted prices for similar securities may be used and would be categorized as Level 2 in the hierarchy. Utilizing these techniques may result in transfers between Level 1 and Level 2. For equity securities, including restricted securities, where observable inputs are limited, assumptions about market activity and risk are used and these securities may be categorized as Level 3 in the hierarchy.
Investments in open-end mutual funds, including the Fidelity Central Funds, are valued at their closing net asset value (NAV) each business day and are categorized as Level 1 in the hierarchy.
Changes in valuation techniques may result in transfers in or out of an assigned level within the disclosure hierarchy. The aggregate value of investments by input level as of October 31, 2018, including information on transfers between Levels 1 and 2 is included at the end of the Fund's Schedule of Investments.
Foreign Currency. The Fund may use foreign currency contracts to facilitate transactions in foreign-denominated securities. Gains and losses from these transactions may arise from changes in the value of the foreign currency or if the counterparties do not perform under the contracts' terms.
Foreign-denominated assets, including investment securities, and liabilities are translated into U.S. dollars at the exchange rates at period end. Purchases and sales of investment securities, income and dividends received and expenses denominated in foreign currencies are translated into U.S. dollars at the exchange rate in effect on the transaction date.
The effects of exchange rate fluctuations on investments are included with the net realized and unrealized gain (loss) on investment securities. Other foreign currency transactions resulting in realized and unrealized gain (loss) are disclosed separately.
Investment Transactions and Income. For financial reporting purposes, the Fund's investment holdings and NAV include trades executed through the end of the last business day of the period. The NAV per share for processing shareholder transactions is calculated as of the close of business of the New York Stock Exchange (NYSE), normally 4:00 p.m. Eastern time and includes trades executed through the end of the prior business day. Gains and losses on securities sold are determined on the basis of identified cost and include proceeds received from litigation. Dividend income is recorded on the ex-dividend date, except for certain dividends from foreign securities where the ex-dividend date may have passed, which are recorded as soon as the Fund is informed of the ex-dividend date. Non-cash dividends included in dividend income, if any, are recorded at the fair market value of the securities received. Income and capital gain distributions from Fidelity Central Funds, if any, are recorded on the ex-dividend date. Certain distributions received by the Fund represent a return of capital or capital gain. The Fund determines the components of these distributions subsequent to the ex-dividend date, based upon receipt of tax filings or other correspondence relating to the underlying investment. These distributions are recorded as a reduction of cost of investments and/or as a realized gain. Investment income is recorded net of foreign taxes withheld where recovery of such taxes is uncertain.
Class Allocations and Expenses. Investment income, realized and unrealized capital gains and losses, common expenses of the Fund, and certain fund-level expense reductions, if any, are allocated daily on a pro-rata basis to each class based on the relative net assets of each class to the total net assets of the Fund. Each class differs with respect to transfer agent fees incurred. Certain expense reductions may also differ by class. For the reporting period, the allocated portion of income and expenses to each class as a percent of its average net assets may vary due to the timing of recording these transactions in relation to fluctuating net assets of the classes. Expenses directly attributable to a fund are charged to that fund. Expenses attributable to more than one fund are allocated among the respective funds on the basis of relative net assets or other appropriate methods. Expense estimates are accrued in the period to which they relate and adjustments are made when actual amounts are known.
Deferred Trustee Compensation. Under a Deferred Compensation Plan (the Plan) for the Fund, certain independent Trustees have elected to defer receipt of a portion of their annual compensation. Deferred amounts are invested in a cross-section of Fidelity funds, are marked-to-market and remain in the Fund until distributed in accordance with the Plan. The investment of deferred amounts and the offsetting payable to the Trustees of $392,074 are included in the accompanying Statement of Assets and Liabilities in other receivables and other payables and accrued expenses, respectively.
Income Tax Information and Distributions to Shareholders. Each year, the Fund intends to qualify as a regulated investment company under Subchapter M of the Internal Revenue Code, including distributing substantially all of its taxable income and realized gains. As a result, no provision for U.S. Federal income taxes is required. As of October 31, 2018, the Fund did not have any unrecognized tax benefits in the financial statements; nor is the Fund aware of any tax positions for which it is reasonably possible that the total amounts of unrecognized tax benefits will significantly change in the next twelve months. The Fund files a U.S. federal tax return, in addition to state and local tax returns as required. The Fund's federal income tax returns are subject to examination by the Internal Revenue Service (IRS) for a period of three fiscal years after they are filed. State and local tax returns may be subject to examination for an additional fiscal year depending on the jurisdiction. Foreign taxes are provided for based on the Fund's understanding of the tax rules and rates that exist in the foreign markets in which it invests.
Distributions are declared and recorded on the ex-dividend date. Income and capital gain distributions are declared separately for each class. Income and capital gain distributions are determined in accordance with income tax regulations, which may differ from GAAP.
Capital accounts within the financial statements are adjusted for permanent book-tax differences. These adjustments have no impact on net assets or the results of operations. Capital accounts are not adjusted for temporary book-tax differences which will reverse in a subsequent period.
Book-tax differences are primarily due to foreign currency transactions, passive foreign investment companies (PFIC), deferred trustees compensation and losses deferred due to wash sales.
As of period end, the cost and unrealized appreciation (depreciation) in securities, and derivatives if applicable, for federal income tax purposes were as follows:
| Gross unrealized appreciation | $1,126,112,493 |
| Gross unrealized depreciation | (386,461,335) |
| Net unrealized appreciation (depreciation) | $739,651,158 |
| Tax Cost | $6,237,626,147 |
The tax-based components of distributable earnings as of period end were as follows:
| Undistributed ordinary income | $97,422,444 |
| Undistributed long-term capital gain | $256,694,922 |
| Net unrealized appreciation (depreciation) on securities and other investments | $739,388,787 |
The tax character of distributions paid was as follows:
| | October 31, 2018 | October 31, 2017 |
| Ordinary Income | $89,089,141 | $ 102,592,592 |
Restricted Securities. The Fund may invest in securities that are subject to legal or contractual restrictions on resale. These securities generally may be resold in transactions exempt from registration or to the public if the securities are registered. Disposal of these securities may involve time-consuming negotiations and expense, and prompt sale at an acceptable price may be difficult. Information regarding restricted securities is included at the end of the Fund's Schedule of Investments.
New Rule Issuance. During August 2018, the U.S. Securities and Exchange Commission issued Final Rule Release No. 33-10532, Disclosure Update and Simplification. This Final Rule includes amendments specific to registered investment companies that are intended to eliminate overlap in disclosure requirements between Regulation S-X and GAAP. In accordance with these amendments, certain line-items in the Fund's financial statements have been combined or removed for the current period as outlined in the table below.
| Financial Statement | Current Line-Item Presentation | Prior Line-Item Presentation |
| Statement of Assets and Liabilities | Total distributable earnings (loss) | Undistributed/Distributions in excess of/Accumulated net investment income (loss)
Accumulated/Undistributed net realized gain (loss)
Net unrealized appreciation (depreciation) |
| Statement of Changes in Net Assets | N/A - removed | Undistributed/Distributions in excess of/Accumulated net investment income (loss) end of period |
| Statement of Changes in Net Assets | Distributions to shareholders | Distributions to shareholders from net investment income
Distributions to shareholders from net realized gain |
| Distributions to Shareholders Note to Financial Statements | Distributions to shareholders | Distributions to shareholders from net investment income
Distributions to shareholders from net realized gain |
4. Purchases and Sales of Investments.
Purchases and sales of securities, other than short-term securities, aggregated $2,468,136,118 and $3,058,005,551, respectively.
Prior Fiscal Year Exchanges In-Kind. During the prior period, investments and cash received in-kind through subscriptions totaled $257,590,200 in exchange for 5,518,213 shares of the Fund. The amount of in-kind exchanges is included in share transactions in the accompanying Statement of Changes in Net Assets as well as the Notes to Financial Statements. The Fund recognized no gain or loss for federal income tax purposes.
5. Fees and Other Transactions with Affiliates.
Management Fee. Fidelity Management & Research Company (the investment adviser) and its affiliates provide the Fund with investment management related services for which the Fund pays a monthly management fee. The management fee is the sum of an individual fund fee rate that is based on an annual rate of .424% of the Fund's average net assets and an annualized group fee rate that averaged .24% during the period. The group fee rate is based upon the average net assets of all the mutual funds advised by the investment adviser, including any mutual funds previously advised by the investment adviser that are currently advised by Fidelity SelectCo, LLC, an affiliate of the investment adviser. The group fee rate decreases as assets under management increase and increases as assets under management decrease. In addition, the management fee is subject to a performance adjustment (up to a maximum of +/- .20% of the Fund's average net assets over a 36 month performance period). The upward or downward adjustment to the management fee is based on the relative investment performance of Overseas as compared to its benchmark index, the MSCI EAFE Index, over the same 36 month performance period. For the reporting period, the total annual management fee rate, including the performance adjustment, was .77% of the Fund's average net assets. The performance adjustment included in the management fee rate may be higher or lower than the maximum performance adjustment rate due to the difference between the average net assets for the reporting and performance periods.
Transfer Agent Fees. Fidelity Investments Institutional Operations Company, Inc., (FIIOC), an affiliate of the investment adviser, is the transfer, dividend disbursing and shareholder servicing agent for each class of the Fund. FIIOC receives account fees and asset-based fees that vary according to the account size and type of account of the shareholders of Overseas. FIIOC receives an asset-based fee of Class K's average net assets. FIIOC pays for typesetting, printing and mailing of shareholder reports, except proxy statements.
For the period, transfer agent fees for each class were as follows:
| | Amount | % of Class-Level Average Net Assets |
| Overseas | $10,213,574 | .16 |
| Class K | 535,609 | .05 |
| | $10,749,183 | |
Accounting and Security Lending Fees. Fidelity Service Company, Inc. (FSC), an affiliate of the investment adviser, maintains the Fund's accounting records. The accounting fee is based on the level of average net assets for each month. Under a separate contract, FSC administers the security lending program. The security lending fee is based on the number and duration of lending transactions. For the period, the fees were equivalent to an annual rate of .02%.
Brokerage Commissions. The Fund placed a portion of its portfolio transactions with brokerage firms which are affiliates of the investment adviser. Brokerage commissions are included in net realized gain (loss) and change in net unrealized appreciation (depreciation) in the Statement of Operations. The commissions paid to these affiliated firms were $5,660 for the period.
Interfund Lending Program. Pursuant to an Exemptive Order issued by the SEC, the Fund, along with other registered investment companies having management contracts with Fidelity Management & Research Company (FMR) or other affiliated entities of FMR, may participate in an interfund lending program. This program provides an alternative credit facility allowing the funds to borrow from, or lend money to, other participating affiliated funds. At period end, there were no interfund loans outstanding. The Fund's activity in this program during the period for which loans were outstanding was as follows:
| Borrower or Lender | Average Loan Balance | Weighted Average Interest Rate | Interest Expense |
| Borrower | $18,373,800 | 1.79% | $22,792 |
Interfund Trades. The Fund may purchase from or sell securities to other Fidelity Funds under procedures adopted by the Board. The procedures have been designed to ensure these interfund trades are executed in accordance with Rule 17a-7 of the 1940 Act. Interfund trades are included within the respective purchases and sales amounts shown in the Purchases and Sales of Investments note.
6. Committed Line of Credit.
The Fund participates with other funds managed by the investment adviser or an affiliate in a $4.25 billion credit facility (the "line of credit") to be utilized for temporary or emergency purposes to fund shareholder redemptions or for other short-term liquidity purposes. The Fund has agreed to pay commitment fees on its pro-rata portion of the line of credit, which amounted to $21,142 and is reflected in Miscellaneous expenses on the Statement of Operations. Interest is charged to the Fund based on its borrowing at a rate equal to .75% plus the higher of the Federal Funds Rate or one-month LIBOR. The Fund's average daily loan balance during the period for which loans were outstanding amounted to $6,700,000. The weighted average interest rate and interest expense was 2.45% and $456, respectively. At period end, there were no borrowings outstanding.
7. Security Lending.
The Fund lends portfolio securities through a lending agent from time to time in order to earn additional income. For equity securities, a lending agent is used and may loan securities to certain qualified borrowers, including Fidelity Capital Markets (FCM), a broker-dealer affiliated with the Fund. On the settlement date of the loan, the Fund receives collateral (in the form of U.S. Treasury obligations, letters of credit and/or cash) against the loaned securities and maintains collateral in an amount not less than 100% of the market value of the loaned securities during the period of the loan. The market value of the loaned securities is determined at the close of business of the Fund and any additional required collateral is delivered to the Fund on the next business day. The Fund or borrower may terminate the loan at any time, and if the borrower defaults on its obligation to return the securities loaned because of insolvency or other reasons, the Fund may apply collateral received from the borrower against the obligation. The Fund may experience delays and costs in recovering the securities loaned. Any cash collateral received is invested in the Fidelity Securities Lending Cash Central Fund. The value of loaned securities and cash collateral at period end are disclosed on the Fund's Statement of Assets and Liabilities. Security lending income represents the income earned on investing cash collateral, less rebates paid to borrowers and any lending agent fees associated with the loan, plus any premium payments received for lending certain types of securities. Security lending income is presented in the Statement of Operations as a component of income from Fidelity Central Funds. Total security lending income during the period amounted to $2,365,560. During the period, there were no securities loaned to FCM.
8. Expense Reductions.
Commissions paid to certain brokers with whom the investment adviser, or its affiliates, places trades on behalf of the Fund include an amount in addition to trade execution, which may be rebated back to the Fund to offset certain expenses. This amount totaled $747,154 for the period. In addition, through arrangements with the Fund's custodian, credits realized as a result of certain uninvested cash balances were used to reduce the Fund's expenses. During the period, these credits reduced the Fund's custody expenses by $6,236.
In addition, during the period the investment adviser reimbursed and/or waived a portion of fund-level operating expenses in the amount of $79,630.
9. Distributions to Shareholders.
Distributions to shareholders of each class were as follows:
| | Year ended
October 31, 2018 | Year ended
October 31, 2017 |
| Distributions to shareholders | | |
| Overseas | $74,926,544 | $– |
| Class K | 14,162,597 | – |
| Total | $89,089,141 | $– |
| From net investment income | | |
| Overseas | $– | $81,032,285 |
| Class K | – | 14,738,243 |
| Total | $– | $95,770,528 |
| From net realized gain | | |
| Overseas | $– | $5,828,046 |
| Class K | – | 994,018 |
| Total | $– | $6,822,064 |
10. Share Transactions.
Share transactions for each class were as follows and may contain automatic conversions between classes or exchanges between affiliated funds:
| | Shares | Shares | Dollars | Dollars |
| | Year ended October 31, 2018 | Year ended October 31, 2017 | Year ended October 31, 2018 | Year ended October 31, 2017 |
| Overseas | | | | |
| Shares sold | 29,404,571 | 43,630,558(a) | $1,465,217,884 | $1,962,017,751(a) |
| Reinvestment of distributions | 1,397,531 | 2,111,926 | 69,429,338 | 82,914,195 |
| Shares redeemed | (40,342,442) | (21,850,358) | (2,020,744,759) | (954,218,064) |
| Net increase (decrease) | (9,540,340) | 23,892,126 | $(486,097,537) | $1,090,713,882 |
| Class K | | | | |
| Shares sold | 6,397,391 | 9,782,877 | $319,720,787 | $437,887,827 |
| Reinvestment of distributions | 285,767 | 401,743 | 14,162,597 | 15,732,261 |
| Shares redeemed | (7,474,394) | (5,385,134) | (376,384,342) | (240,238,797) |
| Net increase (decrease) | (791,236) | 4,799,486 | $(42,500,958) | $213,381,291 |
(a) Amount includes in-kind exchanges (see the Prior Fiscal Year Exchanges In-Kind note for additional details).
11. Other.
The Fund's organizational documents provide former and current trustees and officers with a limited indemnification against liabilities arising in connection with the performance of their duties to the Fund. In the normal course of business, the Fund may also enter into contracts that provide general indemnifications. The Fund's maximum exposure under these arrangements is unknown as this would be dependent on future claims that may be made against the Fund. The risk of material loss from such claims is considered remote.
At the end of the period, mutual funds managed by the investment adviser or its affiliates were the owners of record, in the aggregate, of approximately 28% of the total outstanding shares of the Fund.
Fidelity® Worldwide Fund
Performance: The Bottom Line
Average annual total return reflects the change in the value of an investment, assuming reinvestment of distributions from dividend income and capital gains (the profits earned upon the sale of securities that have grown in value, if any) and assuming a constant rate of performance each year. The hypothetical investment and the average annual total returns do not reflect the deduction of taxes that a shareholder would pay on fund distributions or the redemption of fund shares. During periods of reimbursement by Fidelity, a fund’s total return will be greater than it would be had the reimbursement not occurred. How a fund did yesterday is no guarantee of how it will do tomorrow.
Average Annual Total Returns
| For the periods ended October 31, 2018 | Past 1 year | Past 5 years | Past 10 years |
| Fidelity® Worldwide Fund | 4.23% | 7.52% | 11.04% |
$10,000 Over 10 Years
Let's say hypothetically that $10,000 was invested in Fidelity® Worldwide Fund, a class of the fund, on October 31, 2008.
The chart shows how the value of your investment would have changed, and also shows how the MSCI World Index performed over the same period.
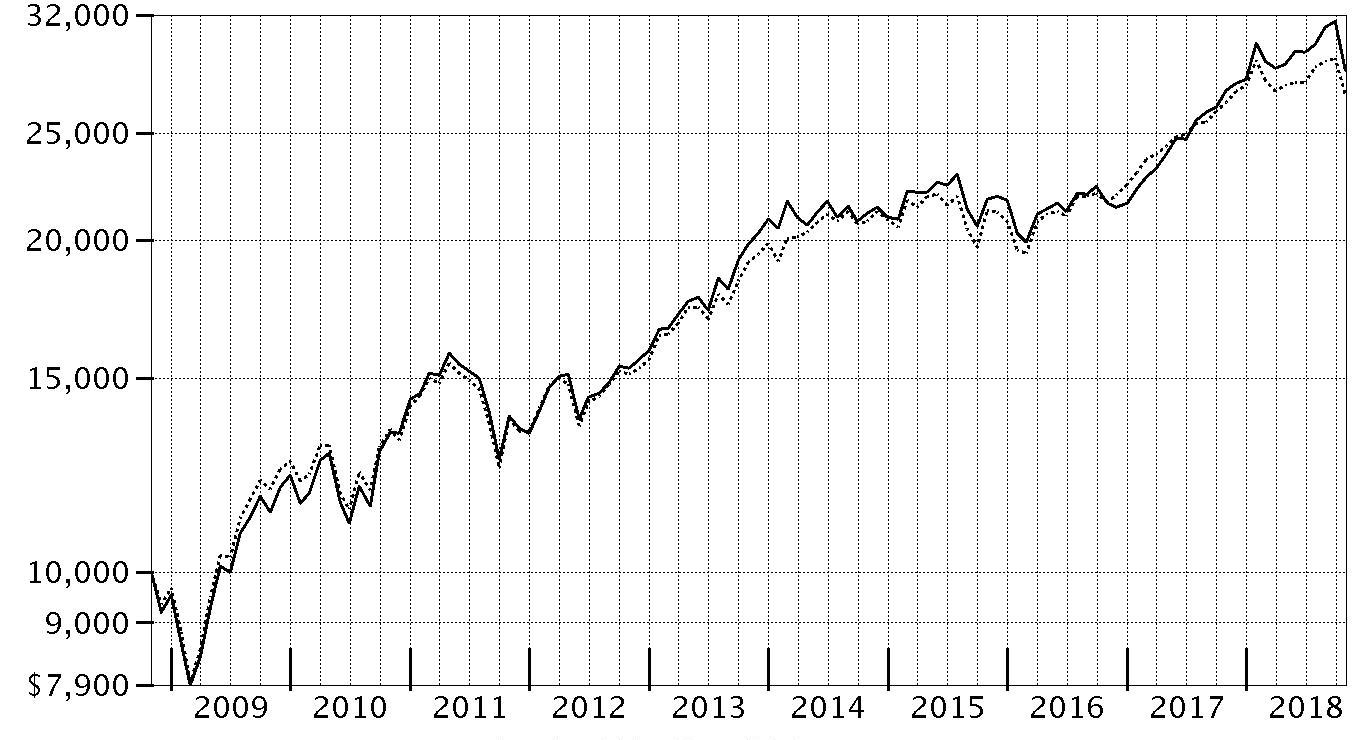
| Period Ending Values |
| $28,494 | Fidelity® Worldwide Fund |
| $27,101 | MSCI World Index |
Fidelity® Worldwide Fund
Management's Discussion of Fund Performance
Market Recap: Global equities returned -0.14% for the 12 months ending October 31, 2018, according to the MSCI ACWI (All Country World Index) Index. A modestly positive first half of the period gave way to a confluence of negative factors – including escalating trade tension, a surging U.S. dollar, tepid economic growth in Europe, global central bank tightening, concerns about Italy’s budget stalemate with the EU, and weakness in China’s stock market – that yielded a -4% second-half return. The index lost 7.5% in October alone, its largest monthly drop in more than six years. Among sectors, economically sensitive materials (-8%), financials (-6%) and industrials (-5%) stocks suffered from concerns about slowing growth in some key markets. Rising interest rates in the U.S. exerted pressure on real estate (-4%) and utilities (-2%). Conversely, information technology (+9%) benefited from better-than-expected earnings from some major index constituents. Stable profit growth helped health care (+8%) perform well, while elevated crude-oil prices supported energy (+5%). Regionally, emerging markets (-12%) fared the worst, hampered by the impact of foreign exchange and concerns about economic weakness in China, India and South Korea. Sluggish growth pressured shares in continental Europe (-9%). Stocks in Japan (-3%) and the U.K. (-4%) held up better, followed by Canada (-5%) and Asia-Pacific ex Japan (-6%). The U.S. (+7%) was the only region with a positive return, helped by steady economic and corporate profit growth.
Comments from William Kennedy, Lead Portfolio Manager and manager of the non-U.S. equity subportfolio, and Stephen DuFour, Co-Manager and manager of the U.S. equity subportfolio: For the fiscal year, the fund’s share classes (excluding sales charges, if applicable) gained about 4%, beating the 1.59% return of the benchmark MSCI World Index. Stock picks in the U.S. and the top-performing information technology sector gave the biggest boost by far to relative performance. Security selection in the financials and industrials sectors also helped. Individual standouts included U.S.-based software & services companies Square, which does payments processing; Adobe, which focuses on desktop publishing; and Intuit, known for its Quickbooks
® bookkeeping and TurboTax
® tax preparation products. Elsewhere, shares of U.S.-based health insurer Humana benefited from the company’s exposure to Medicare supplement plans. Cost controls and favorable pricing trends also helped. Adobe, Intuit and Humana were top holdings and overweightings at period end. By contrast, a non-benchmark stake in emerging markets, along with stock picks in consumer discretionary, consumer staples and communication services, hindered relative performance. Individual detractors included consumer technology leader Apple and discount retailing giant Walmart, largely because the fund was underexposed to each when the stock rallied most. The fund did not own Walmart at period end.
The views expressed above reflect those of the portfolio manager(s) only through the end of the period as stated on the cover of this report and do not necessarily represent the views of Fidelity or any other person in the Fidelity organization. Any such views are subject to change at any time based upon market or other conditions and Fidelity disclaims any responsibility to update such views. These views may not be relied on as investment advice and, because investment decisions for a Fidelity fund are based on numerous factors, may not be relied on as an indication of trading intent on behalf of any Fidelity fund.
Fidelity® Worldwide Fund
Investment Summary (Unaudited)
Geographic Diversification (% of fund's net assets)
| As of October 31, 2018 |
| | United States of America* | 62.9% |
| | Japan | 6.4% |
| | United Kingdom | 6.4% |
| | Germany | 4.0% |
| | Switzerland | 3.2% |
| | France | 3.0% |
| | Ireland | 2.2% |
| | Netherlands | 2.0% |
| | Spain | 1.4% |
| | Other | 8.5% |

* Includes Short-Term investments and Net Other Assets (Liabilities).
Percentages are based on country or territory of incorporation and are adjusted for the effect of futures contracts, if applicable.
Asset Allocation as of October 31, 2018
| | % of fund's net assets |
| Stocks and Equity Futures | 91.4 |
| Short-Term Investments and Net Other Assets (Liabilities) | 8.6 |
Top Ten Stocks as of October 31, 2018
| | % of fund's net assets |
| AstraZeneca PLC (United Kingdom, Pharmaceuticals) | 3.1 |
| Microsoft Corp. (United States of America, Software) | 3.0 |
| Humana, Inc. (United States of America, Health Care Providers & Services) | 3.0 |
| PayPal Holdings, Inc. (United States of America, IT Services) | 2.9 |
| Adobe, Inc. (United States of America, Software) | 2.9 |
| Intuit, Inc. (United States of America, Software) | 2.9 |
| Amazon.com, Inc. (United States of America, Internet & Direct Marketing Retail) | 2.9 |
| Apple, Inc. (United States of America, Technology Hardware, Storage & Peripherals) | 2.9 |
| MasterCard, Inc. Class A (United States of America, IT Services) | 2.6 |
| Visa, Inc. Class A (United States of America, IT Services) | 2.4 |
| | 28.6 |
Top Market Sectors as of October 31, 2018
| | % of fund's net assets |
| Information Technology | 28.0 |
| Health Care | 19.8 |
| Consumer Discretionary | 8.8 |
| Industrials | 7.7 |
| Financials | 7.6 |
| Consumer Staples | 5.3 |
| Energy | 4.7 |
| Real Estate | 2.8 |
| Communication Services | 2.7 |
| Materials | 1.6 |
Fidelity® Worldwide Fund
Schedule of Investments October 31, 2018
Showing Percentage of Net Assets
| Common Stocks - 90.4% | | | |
| | | Shares | Value |
| Australia - 0.4% | | | |
| Bapcor Ltd. (a) | | 831,321 | $4,020,821 |
| Blue Sky Alternative Investments Ltd.(b) | | 254,244 | 217,852 |
| Inghams Group Ltd. (a) | | 513,123 | 1,417,135 |
| Magellan Financial Group Ltd. | | 81,493 | 1,537,375 |
| National Storage (REIT) unit | | 1,830,453 | 2,210,081 |
| Rio Tinto Ltd. | | 263 | 14,229 |
|
| TOTAL AUSTRALIA | | | 9,417,493 |
|
| Austria - 0.6% | | | |
| Erste Group Bank AG | | 167,900 | 6,846,190 |
| Wienerberger AG | | 252,200 | 5,804,496 |
|
| TOTAL AUSTRIA | | | 12,650,686 |
|
| Bailiwick of Jersey - 0.1% | | | |
| Glencore Xstrata PLC | | 405,468 | 1,652,501 |
| Belgium - 0.4% | | | |
| KBC Groep NV | | 125,664 | 8,668,100 |
| Bermuda - 0.2% | | | |
| Hiscox Ltd. | | 258,027 | 5,369,309 |
| Canada - 1.1% | | | |
| Alimentation Couche-Tard, Inc. Class B (sub. vtg.) | | 95,000 | 4,536,936 |
| Cenovus Energy, Inc. (Canada) | | 228,100 | 1,930,217 |
| Constellation Software, Inc. | | 6,200 | 4,266,977 |
| Shopify, Inc. (a)(b) | | 48,000 | 6,631,200 |
| Suncor Energy, Inc. | | 209,700 | 7,034,336 |
|
| TOTAL CANADA | | | 24,399,666 |
|
| Cayman Islands - 0.4% | | | |
| Alibaba Group Holding Ltd. sponsored ADR (b) | | 27,400 | 3,898,472 |
| ENN Energy Holdings Ltd. | | 301,500 | 2,562,497 |
| Meituan Dianping Class B | | 369,166 | 2,148,068 |
|
| TOTAL CAYMAN ISLANDS | | | 8,609,037 |
|
| China - 0.1% | | | |
| Qingdao Port International Co. Ltd. (b)(c) | | 876,000 | 513,852 |
| Shanghai International Airport Co. Ltd. (A Shares) | | 212,329 | 1,508,232 |
|
| TOTAL CHINA | | | 2,022,084 |
|
| Denmark - 0.5% | | | |
| Netcompany Group A/S | | 83,500 | 2,761,614 |
| NNIT A/S (c) | | 150,414 | 4,247,370 |
| Novo Nordisk A/S Series B | | 67,280 | 2,905,592 |
| Novozymes A/S Series B | | 25,100 | 1,240,348 |
|
| TOTAL DENMARK | | | 11,154,924 |
|
| Finland - 0.1% | | | |
| Sampo Oyj (A Shares) | | 72,300 | 3,329,672 |
| France - 3.0% | | | |
| ALTEN | | 29,500 | 2,845,132 |
| Capgemini SA | | 63,400 | 7,755,481 |
| Cegedim SA (b) | | 39,210 | 981,488 |
| Elis SA | | 152,000 | 3,069,663 |
| LVMH Moet Hennessy - Louis Vuitton SA | | 22,839 | 6,929,477 |
| Sartorius Stedim Biotech | | 25,200 | 3,128,289 |
| SMCP S.A.S. (c) | | 47,694 | 1,129,031 |
| Societe Generale Series A | | 131,500 | 4,820,494 |
| Thales SA | | 38,700 | 4,953,192 |
| Total SA (a) | | 362,209 | 21,252,767 |
| VINCI SA (a) | | 107,600 | 9,576,332 |
|
| TOTAL FRANCE | | | 66,441,346 |
|
| Germany - 4.0% | | | |
| adidas AG | | 41,769 | 9,840,409 |
| Akasol AG | | 27,300 | 1,260,045 |
| Allianz SE | | 36,000 | 7,499,519 |
| Aumann AG (c) | | 8,815 | 435,316 |
| Deutsche Borse AG | | 9,362 | 1,183,100 |
| Deutsche Post AG | | 210,575 | 6,648,963 |
| Fresenius SE & Co. KGaA | | 112,600 | 7,156,386 |
| Instone Real Estate Group BV (c) | | 74,900 | 1,756,943 |
| JOST Werke AG (c) | | 14,800 | 516,307 |
| Linde PLC | | 49,434 | 8,110,357 |
| MTU Aero Engines Holdings AG | | 35,800 | 7,615,078 |
| Muenchener Rueckversicherungs AG | | 16,500 | 3,549,923 |
| Nexus AG | | 46,000 | 1,255,656 |
| Rational AG | | 3,670 | 2,128,295 |
| Rheinmetall AG | | 25,100 | 2,175,995 |
| SAP SE | | 147,484 | 15,791,627 |
| Vonovia SE | | 90,900 | 4,161,558 |
| WashTec AG | | 65,318 | 5,038,204 |
| Wirecard AG | | 23,000 | 4,308,827 |
|
| TOTAL GERMANY | | | 90,432,508 |
|
| Greece - 0.0% | | | |
| Ff Group (b)(d) | | 59,300 | 257,918 |
| Hong Kong - 0.4% | | | |
| AIA Group Ltd. | | 1,060,200 | 8,023,881 |
| Techtronic Industries Co. Ltd. | | 231,000 | 1,081,070 |
|
| TOTAL HONG KONG | | | 9,104,951 |
|
| India - 1.2% | | | |
| Avenue Supermarts Ltd. (b)(c) | | 1,642 | 29,704 |
| HDFC Bank Ltd. | | 149,162 | 3,872,285 |
| HDFC Bank Ltd. sponsored ADR | | 79,793 | 7,094,396 |
| Housing Development Finance Corp. Ltd. | | 299,294 | 7,159,626 |
| Lupin Ltd. (b) | | 1,335 | 15,983 |
| Sunteck Realty Ltd. (b) | | 304,120 | 1,332,889 |
| TCNS Clothing Co. Ltd. (b) | | 208,823 | 1,744,897 |
| V-Mart Retail Ltd. (b) | | 153,431 | 5,007,771 |
|
| TOTAL INDIA | | | 26,257,551 |
|
| Indonesia - 0.0% | | | |
| PT Kino Indonesia Tbk | | 234,500 | 31,467 |
| Ireland - 2.2% | | | |
| Accenture PLC Class A | | 108,000 | 17,022,960 |
| Alkermes PLC (b) | | 43,100 | 1,759,773 |
| Cairn Homes PLC (b) | | 2,774,039 | 4,455,378 |
| CRH PLC | | 82,065 | 2,447,850 |
| Dalata Hotel Group PLC | | 476,400 | 2,951,582 |
| DCC PLC (United Kingdom) | | 16,000 | 1,373,298 |
| Glenveagh Properties PLC (c) | | 1,327,224 | 1,256,742 |
| Green REIT PLC | | 621,300 | 1,026,017 |
| Greencore Group PLC | | 372,815 | 901,599 |
| Kerry Group PLC Class A | | 42,100 | 4,315,453 |
| Perrigo Co. PLC | | 82,000 | 5,764,600 |
| Ryanair Holdings PLC sponsored ADR (b) | | 31,670 | 2,622,276 |
| United Drug PLC (United Kingdom) | | 330,700 | 2,671,469 |
|
| TOTAL IRELAND | | | 48,568,997 |
|
| Italy - 0.3% | | | |
| Prada SpA | | 387,500 | 1,368,760 |
| Recordati SpA | | 134,100 | 4,544,500 |
|
| TOTAL ITALY | | | 5,913,260 |
|
| Japan - 5.4% | | | |
| A/S One Corp. | | 87,200 | 6,197,935 |
| AEON Financial Service Co. Ltd. | | 142,200 | 2,792,708 |
| Ain Holdings, Inc. | | 51,100 | 4,003,403 |
| Daiichikosho Co. Ltd. | | 62,500 | 2,880,312 |
| Hoya Corp. | | 148,000 | 8,412,922 |
| Keyence Corp. | | 10,220 | 5,008,783 |
| Mercari, Inc. (a)(b) | | 16,300 | 412,574 |
| Minebea Mitsumi, Inc. | | 283,600 | 4,338,520 |
| Misumi Group, Inc. | | 64,700 | 1,299,333 |
| Mitsubishi UFJ Financial Group, Inc. | | 946,000 | 5,725,658 |
| Monex Group, Inc. (a) | | 297,500 | 1,173,284 |
| Morinaga & Co. Ltd. | | 37,000 | 1,487,083 |
| Murata Manufacturing Co. Ltd. | | 17,600 | 2,677,396 |
| Nidec Corp. | | 30,600 | 3,929,579 |
| Nitori Holdings Co. Ltd. | | 44,600 | 5,824,266 |
| ORIX Corp. | | 512,400 | 8,360,246 |
| PALTAC Corp. | | 43,700 | 2,230,797 |
| Panasonic Corp. | | 563,100 | 6,042,883 |
| Recruit Holdings Co. Ltd. | | 48,000 | 1,288,300 |
| Relo Group, Inc. | | 233,500 | 5,517,003 |
| Shiseido Co. Ltd. | | 20,900 | 1,318,696 |
| SMC Corp. | | 21,000 | 6,727,966 |
| SoftBank Corp. | | 75,200 | 5,951,239 |
| Sony Corp. | | 190,000 | 10,282,183 |
| Takeda Pharmaceutical Co. Ltd. | | 101,100 | 4,191,560 |
| Tsuruha Holdings, Inc. | | 43,200 | 4,502,433 |
| VT Holdings Co. Ltd. | | 31,200 | 129,960 |
| Welcia Holdings Co. Ltd. | | 149,000 | 7,606,151 |
| Zozo, Inc. | | 46,600 | 1,122,926 |
|
| TOTAL JAPAN | | | 121,436,099 |
|
| Kenya - 0.1% | | | |
| Safaricom Ltd. | | 6,251,600 | 1,423,601 |
| Korea (South) - 0.2% | | | |
| Cafe24 Corp. (b) | | 17,437 | 1,688,684 |
| Hyundai Fire & Marine Insurance Co. Ltd. | | 21,488 | 787,203 |
| KB Financial Group, Inc. | | 28,328 | 1,178,198 |
|
| TOTAL KOREA (SOUTH) | | | 3,654,085 |
|
| Netherlands - 2.0% | | | |
| Adyen BV (c) | | 10,328 | 6,680,733 |
| ASML Holding NV (Netherlands) | | 51,000 | 8,784,451 |
| Basic-Fit NV (b)(c) | | 37,100 | 1,069,442 |
| IMCD Group BV | | 69,800 | 4,739,585 |
| Koninklijke Philips Electronics NV | | 246,363 | 9,188,319 |
| Unilever NV (Certificaten Van Aandelen) (Bearer) | | 233,427 | 12,543,200 |
| uniQure B.V. (b) | | 63,330 | 1,629,481 |
| Van Lanschot NV (Bearer) | | 17,200 | 421,776 |
|
| TOTAL NETHERLANDS | | | 45,056,987 |
|
| New Zealand - 0.5% | | | |
| EBOS Group Ltd. | | 210,137 | 2,857,683 |
| Fisher & Paykel Healthcare Corp. | | 310,683 | 2,757,212 |
| Ryman Healthcare Group Ltd. | | 617,875 | 4,878,651 |
|
| TOTAL NEW ZEALAND | | | 10,493,546 |
|
| Norway - 0.9% | | | |
| Equinor ASA | | 813,780 | 21,170,366 |
| Philippines - 0.1% | | | |
| D&L Industries, Inc. | | 8,349,900 | 1,781,329 |
| Spain - 1.4% | | | |
| Aedas Homes SAU (c) | | 32,625 | 844,000 |
| Amadeus IT Holding SA Class A | | 50,600 | 4,079,475 |
| CaixaBank SA | | 2,857,984 | 11,565,436 |
| Grifols SA ADR | | 289,773 | 5,917,165 |
| Masmovil Ibercom SA (b) | | 48,541 | 6,300,704 |
| Neinor Homes SLU (b)(c) | | 66,100 | 1,063,128 |
| Prosegur Cash SA (c) | | 321,606 | 637,467 |
| Zardoya Otis SA | | 254,611 | 1,744,730 |
|
| TOTAL SPAIN | | | 32,152,105 |
|
| Sweden - 0.9% | | | |
| ASSA ABLOY AB (B Shares) | | 270,600 | 5,382,441 |
| HEXPOL AB (B Shares) | | 118,900 | 1,100,499 |
| Indutrade AB | | 183,500 | 4,403,447 |
| Saab AB (B Shares) | | 71,000 | 2,782,230 |
| Svenska Cellulosa AB (SCA) (B Shares) | | 345,500 | 3,270,322 |
| Telefonaktiebolaget LM Ericsson (B Shares) | | 389,700 | 3,393,024 |
|
| TOTAL SWEDEN | | | 20,331,963 |
|
| Switzerland - 3.2% | | | |
| Credit Suisse Group AG | | 202,397 | 2,646,071 |
| EDAG Engineering Group AG | | 77,800 | 1,543,865 |
| Forbo Holding AG (Reg.) | | 1,430 | 2,099,955 |
| Julius Baer Group Ltd. | | 80,910 | 3,689,883 |
| Kaba Holding AG (B Shares) (Reg.) | | 2,860 | 2,064,459 |
| Lonza Group AG | | 18,382 | 5,780,251 |
| Nestle SA (Reg. S) | | 252,910 | 21,351,448 |
| Partners Group Holding AG | | 9,582 | 6,826,277 |
| Roche Holding AG (participation certificate) | | 73,419 | 17,867,425 |
| Schindler Holding AG (participation certificate) | | 14,628 | 3,084,930 |
| UBS Group AG | | 333,980 | 4,672,371 |
|
| TOTAL SWITZERLAND | | | 71,626,935 |
|
| United Kingdom - 6.4% | | | |
| Anglo American PLC (United Kingdom) | | 93,759 | 2,007,606 |
| AstraZeneca PLC: | | | |
| (United Kingdom) | | 217,292 | 16,620,593 |
| sponsored ADR | | 1,349,000 | 52,314,220 |
| Beazley PLC | | 335,600 | 2,262,785 |
| BHP Billiton PLC | | 292,606 | 5,837,107 |
| Big Yellow Group PLC | | 199,900 | 2,203,793 |
| British American Tobacco PLC: | | | |
| (United Kingdom) | | 137,307 | 5,952,295 |
| sponsored ADR | | 27,000 | 1,171,800 |
| Bunzl PLC | | 238,676 | 7,050,299 |
| Compass Group PLC | | 240,242 | 4,728,991 |
| Conviviality PLC (d) | | 367,080 | 5 |
| Cranswick PLC | | 123,087 | 4,546,831 |
| Dechra Pharmaceuticals PLC | | 102,400 | 2,992,092 |
| Hilton Food Group PLC | | 374,800 | 4,417,020 |
| Hotel Chocolat Group Ltd. | | 603,300 | 2,101,351 |
| JTC PLC | | 342,900 | 1,468,288 |
| Keywords Studios PLC | | 49,300 | 863,309 |
| LivaNova PLC (b) | | 27,600 | 3,090,924 |
| London Stock Exchange Group PLC | | 87,381 | 4,819,441 |
| Melrose Industries PLC | | 612,285 | 1,319,893 |
| Micro Focus International PLC | | 257,130 | 3,986,085 |
| Moneysupermarket.com Group PLC | | 63 | 236 |
| NCC Group Ltd. | | 584,200 | 1,468,060 |
| Reckitt Benckiser Group PLC | | 24,576 | 1,987,316 |
| Rio Tinto PLC | | 82,090 | 3,985,533 |
| Senior Engineering Group PLC | | 499,600 | 1,743,347 |
| St. James's Place Capital PLC | | 156,533 | 2,027,816 |
| Standard Chartered PLC (United Kingdom) | | 4,920 | 34,557 |
| The Weir Group PLC | | 53,754 | 1,089,715 |
|
| TOTAL UNITED KINGDOM | | | 142,091,308 |
|
| United States of America - 54.3% | | | |
| Abbott Laboratories | | 209,000 | 14,408,460 |
| Activision Blizzard, Inc. | | 99,000 | 6,835,950 |
| Adobe, Inc. (b) | | 261,124 | 64,173,834 |
| Akcea Therapeutics, Inc. (b) | | 1,900 | 42,408 |
| Alliant Energy Corp. | | 42,000 | 1,805,160 |
| Alphabet, Inc. Class A (b) | | 30,500 | 33,262,690 |
| Amazon.com, Inc. (b) | | 40,000 | 63,920,400 |
| American Tower Corp. | | 72,000 | 11,218,320 |
| Anadarko Petroleum Corp. | | 48,000 | 2,553,600 |
| Apple, Inc. | | 291,000 | 63,688,260 |
| Bank of America Corp. | | 528,000 | 14,520,000 |
| Berry Petroleum Corp. | | 326,292 | 4,568,088 |
| bluebird bio, Inc. (b) | | 28,697 | 3,291,546 |
| Boston Scientific Corp. (b) | | 1,035,159 | 37,410,646 |
| Burlington Stores, Inc. (b) | | 95,000 | 16,291,550 |
| Cardlytics, Inc. (b) | | 50,000 | 1,058,000 |
| Centene Corp. (b) | | 44,000 | 5,734,080 |
| Charles Schwab Corp. | | 62,000 | 2,866,880 |
| ConocoPhillips Co. | | 390,600 | 27,302,940 |
| Crown Castle International Corp. | | 147,000 | 15,984,780 |
| CSX Corp. | | 226,000 | 15,562,360 |
| Domino's Pizza, Inc. | | 11,000 | 2,956,690 |
| Duke Energy Corp. | | 48,000 | 3,966,240 |
| Edison International | | 25,000 | 1,734,750 |
| Edwards Lifesciences Corp. (b) | | 11,000 | 1,623,600 |
| Eli Lilly & Co. | | 239,000 | 25,917,160 |
| EOG Resources, Inc. | | 88,000 | 9,269,920 |
| Estee Lauder Companies, Inc. Class A | | 102,000 | 14,018,880 |
| Etsy, Inc. (b) | | 16,000 | 680,320 |
| HCA Holdings, Inc. | | 119,000 | 15,890,070 |
| HealthSouth Corp. | | 2 | 135 |
| Henry Schein, Inc. (b) | | 25,000 | 2,075,000 |
| Humana, Inc. | | 209,000 | 66,965,690 |
| Intercept Pharmaceuticals, Inc. (b) | | 17,060 | 1,637,931 |
| International Flavors & Fragrances, Inc. (Israel) | | 15,856 | 2,289,409 |
| Intuit, Inc. | | 303,000 | 63,933,000 |
| Johnson & Johnson | | 157,000 | 21,978,430 |
| Lowe's Companies, Inc. | | 36,000 | 3,427,920 |
| Marsh & McLennan Companies, Inc. | | 46,200 | 3,915,450 |
| MasterCard, Inc. Class A | | 288,000 | 56,928,960 |
| Microsoft Corp. | | 637,000 | 68,037,963 |
| Moody's Corp. | | 47,000 | 6,837,560 |
| NextEra Energy, Inc. | | 30,000 | 5,175,000 |
| Norfolk Southern Corp. | | 165,000 | 27,691,950 |
| Northrop Grumman Corp. | | 11,000 | 2,881,450 |
| Oasis Petroleum, Inc. (b) | | 105,000 | 1,056,300 |
| OGE Energy Corp. | | 40,000 | 1,446,000 |
| OptiNose, Inc. (a) | | 49,900 | 527,942 |
| Parametric Technology Corp. (b) | | 503,000 | 41,452,230 |
| PayPal Holdings, Inc. (b) | | 764,000 | 64,321,160 |
| PPL Corp. | | 190,000 | 5,776,000 |
| Procter & Gamble Co. | | 135,000 | 11,971,800 |
| Prologis, Inc. | | 189,000 | 12,184,830 |
| S&P Global, Inc. | | 15,092 | 2,751,573 |
| Salesforce.com, Inc. (b) | | 230,000 | 31,565,200 |
| Sarepta Therapeutics, Inc. (b) | | 5,000 | 668,800 |
| Simon Property Group, Inc. | | 22,000 | 4,037,440 |
| Spirit Airlines, Inc. (b) | | 110,000 | 5,709,000 |
| Square, Inc. (b) | | 88,000 | 6,463,600 |
| SVB Financial Group (b) | | 14,000 | 3,321,220 |
| T-Mobile U.S., Inc. (b) | | 36,000 | 2,467,800 |
| The AES Corp. | | 80,000 | 1,166,400 |
| The Coca-Cola Co. | | 195,000 | 9,336,600 |
| TJX Companies, Inc. | | 103,000 | 11,317,640 |
| Ulta Beauty, Inc. (b) | | 22,000 | 6,039,440 |
| Union Pacific Corp. | | 167,000 | 24,418,740 |
| UnitedHealth Group, Inc. | | 203,000 | 53,054,050 |
| VF Corp. | | 119,000 | 9,862,720 |
| Visa, Inc. Class A | | 393,000 | 54,175,050 |
| WEC Energy Group, Inc. | | 44,000 | 3,009,600 |
| Wellcare Health Plans, Inc. (b) | | 19,000 | 5,243,810 |
| Whiting Petroleum Corp. (b) | | 324,000 | 12,085,200 |
| Xcel Energy, Inc. | | 55,000 | 2,695,550 |
| Zoetis, Inc. Class A | | 45,000 | 4,056,750 |
| Zuora, Inc. | | 195,000 | 3,981,900 |
|
| TOTAL UNITED STATES OF AMERICA | | | 1,212,497,775 |
|
| TOTAL COMMON STOCKS | | | |
| (Cost $1,748,100,603) | | | 2,017,997,569 |
| | | Principal Amount | Value |
|
| Government Obligations - 0.0% | | | |
| United States of America - 0.0% | | | |
| U.S. Treasury Bills, yield at date of purchase 1.99% to 2.3% 11/1/18 to 1/31/19(e) | | | |
| (Cost $866,748) | | 870,000 | 866,754 |
| | | Shares | Value |
|
| Money Market Funds - 10.0% | | | |
| Fidelity Cash Central Fund, 2.23% (f) | | 215,829,130 | 215,872,296 |
| Fidelity Securities Lending Cash Central Fund 2.23% (f)(g) | | 6,958,997 | 6,959,693 |
| TOTAL MONEY MARKET FUNDS | | | |
| (Cost $222,831,574) | | | 222,831,989 |
| TOTAL INVESTMENT IN SECURITIES - 100.4% | | | |
| (Cost $1,971,798,925) | | | 2,241,696,312 |
| NET OTHER ASSETS (LIABILITIES) - (0.4)% | | | (9,021,010) |
| NET ASSETS - 100% | | | $2,232,675,302 |
| Futures Contracts | | | | | |
| | Number of contracts | Expiration Date | Notional Amount | Value | Unrealized Appreciation/(Depreciation) |
| Purchased | | | | | |
| Equity Index Contracts | | | | | |
| TSE TOPIX Index Contracts (Japan) | 150 | Dec. 2018 | $21,815,040 | $(459,866) | $(459,866) |
The notional amount of futures purchased as a percentage of Net Assets is 1.0%
Categorizations in the Schedule of Investments are based on country or territory of incorporation.
Legend
(a) Security or a portion of the security is on loan at period end.
(b) Non-income producing
(c) Security exempt from registration under Rule 144A of the Securities Act of 1933. These securities may be resold in transactions exempt from registration, normally to qualified institutional buyers. At the end of the period, the value of these securities amounted to $20,180,035 or 0.9% of net assets.
(d) Level 3 security
(e) Security or a portion of the security was pledged to cover margin requirements for futures contracts. At period end, the value of securities pledged amounted to $866,754.
(f) Affiliated fund that is generally available only to investment companies and other accounts managed by Fidelity Investments. The rate quoted is the annualized seven-day yield of the fund at period end. A complete unaudited listing of the fund's holdings as of its most recent quarter end is available upon request. In addition, each Fidelity Central Fund's financial statements, which are not covered by the Fund's Report of Independent Registered Public Accounting Firm, are available on the SEC's website or upon request.
(g) Investment made with cash collateral received from securities on loan.
Affiliated Central Funds
Information regarding fiscal year to date income earned by the Fund from investments in Fidelity Central Funds is as follows:
| Fund | Income earned |
| Fidelity Cash Central Fund | $1,573,418 |
| Fidelity Securities Lending Cash Central Fund | 224,535 |
| Total | $1,797,953 |
Amounts in the income column in the above table include any capital gain distributions from underlying funds, which are presented in the corresponding line-item in the Statement of Operations if applicable.
Investment Valuation
The following is a summary of the inputs used, as of October 31, 2018, involving the Fund's assets and liabilities carried at fair value. The inputs or methodology used for valuing securities may not be an indication of the risk associated with investing in those securities. For more information on valuation inputs, and their aggregation into the levels used below, please refer to the Investment Valuation section in the accompanying Notes to Financial Statements.
| | Valuation Inputs at Reporting Date: |
| Description | Total | Level 1 | Level 2 | Level 3 |
| Investments in Securities: | | | | |
| Equities: | | | | |
| Communication Services | $59,122,296 | $53,171,057 | $5,951,239 | $-- |
| Consumer Discretionary | 197,687,596 | 172,027,067 | 25,402,611 | 257,918 |
| Consumer Staples | 119,518,902 | 76,365,942 | 43,152,955 | 5 |
| Energy | 108,223,734 | 86,970,967 | 21,252,767 | -- |
| Financials | 172,584,227 | 130,403,583 | 42,180,644 | -- |
| Health Care | 439,654,047 | 381,724,172 | 57,929,875 | -- |
| Industrials | 176,910,970 | 149,676,414 | 27,234,556 | -- |
| Information Technology | 619,792,975 | 587,837,788 | 31,955,187 | -- |
| Materials | 31,431,229 | 19,160,739 | 12,270,490 | -- |
| Real Estate | 63,734,396 | 63,734,396 | -- | -- |
| Utilities | 29,337,197 | 29,337,197 | -- | -- |
| Government Obligations | 866,754 | -- | 866,754 | -- |
| Money Market Funds | 222,831,989 | 222,831,989 | -- | -- |
| Total Investments in Securities: | $2,241,696,312 | $1,973,241,311 | $268,197,078 | $257,923 |
| Derivative Instruments: | | | | |
| Liabilities | | | | |
| Futures Contracts | $(459,866) | $(459,866) | $-- | $-- |
| Total Liabilities | $(459,866) | $(459,866) | $-- | $-- |
| Total Derivative Instruments: | $(459,866) | $(459,866) | $-- | $-- |
The following is a summary of transfers between Level 1 and Level 2 for the period ended October 31, 2018. Transfers are assumed to have occurred at the beginning of the period, and are primarily attributable to the valuation techniques used for foreign equity securities, as discussed in the accompanying Notes to Financial Statements:
| Transfers | Total |
| Level 1 to Level 2 | $28,844,041 |
| Level 2 to Level 1 | $68,027,571 |
Value of Derivative Instruments
The following table is a summary of the Fund's value of derivative instruments by primary risk exposure as of October 31, 2018. For additional information on derivative instruments, please refer to the Derivative Instruments section in the accompanying Notes to Financial Statements.
| Primary Risk Exposure / Derivative Type | Value |
| | Asset | Liability |
| Equity Risk | | |
| Futures Contracts(a) | $0 | $(459,866) |
| Total Equity Risk | 0 | (459,866) |
| Total Value of Derivatives | $0 | $(459,866) |
(a) Reflects gross cumulative appreciation (depreciation) on futures contracts as presented in the Schedule of Investments. In the Statement of Assets and Liabilities, the period end daily variation margin is included in receivable or payable for daily variation margin on futures contracts, and the net cumulative appreciation (depreciation) is included in net unrealized appreciation (depreciation).
See accompanying notes which are an integral part of the financial statements.
Fidelity® Worldwide Fund
Financial Statements
Statement of Assets and Liabilities
| | | October 31, 2018 |
| Assets | | |
Investment in securities, at value (including securities loaned of $6,843,918) — See accompanying schedule:
Unaffiliated issuers (cost $1,748,967,351) | $2,018,864,323 | |
| Fidelity Central Funds (cost $222,831,574) | 222,831,989 | |
| Total Investment in Securities (cost $1,971,798,925) | | $2,241,696,312 |
| Cash | | 730,281 |
| Foreign currency held at value (cost $830,284) | | 830,229 |
| Receivable for investments sold | | 21,215,778 |
| Receivable for fund shares sold | | 155,368,742 |
| Dividends receivable | | 2,285,924 |
| Distributions receivable from Fidelity Central Funds | | 365,574 |
| Receivable for daily variation margin on futures contracts | | 412,106 |
| Prepaid expenses | | 3,760 |
| Other receivables | | 88,111 |
| Total assets | | 2,422,996,817 |
| Liabilities | | |
| Payable for investments purchased | $178,882,900 | |
| Payable for fund shares redeemed | 2,632,233 | |
| Accrued management fee | 1,259,109 | |
| Distribution and service plan fees payable | 25,423 | |
| Other affiliated payables | 426,697 | |
| Other payables and accrued expenses | 134,085 | |
| Collateral on securities loaned | 6,961,068 | |
| Total liabilities | | 190,321,515 |
| Net Assets | | $2,232,675,302 |
| Net Assets consist of: | | |
| Paid in capital | | $1,778,635,445 |
| Total distributable earnings (loss) | | 454,039,857 |
| Net Assets | | $2,232,675,302 |
| Net Asset Value and Maximum Offering Price | | |
| Class A: | | |
| Net Asset Value and redemption price per share ($42,947,324 ÷ 1,616,663 shares) | | $26.57 |
| Maximum offering price per share (100/94.25 of $26.57) | | $28.19 |
| Class M: | | |
| Net Asset Value and redemption price per share ($12,745,920 ÷ 482,949 shares) | | $26.39 |
| Maximum offering price per share (100/96.50 of $26.39) | | $27.35 |
| Class C: | | |
| Net Asset Value and offering price per share ($12,744,228 ÷ 493,499 shares)(a) | | $25.82 |
| Worldwide: | | |
| Net Asset Value, offering price and redemption price per share ($2,112,987,719 ÷ 78,535,889 shares) | | $26.90 |
| Class I: | | |
| Net Asset Value, offering price and redemption price per share ($50,956,460 ÷ 1,903,294 shares) | | $26.77 |
| Class Z: | | |
| Net Asset Value, offering price and redemption price per share ($293,651 ÷ 10,966 shares) | | $26.78 |
(a) Redemption price per share is equal to net asset value less any applicable contingent deferred sales charge.
See accompanying notes which are an integral part of the financial statements.
Statement of Operations
| | | Year ended October 31, 2018 |
| Investment Income | | |
| Dividends | | $26,106,788 |
| Interest | | 8,153 |
| Income from Fidelity Central Funds | | 1,797,953 |
| Income before foreign taxes withheld | | 27,912,894 |
| Less foreign taxes withheld | | (1,526,321) |
| Total income | | 26,386,573 |
| Expenses | | |
| Management fee | | |
| Basic fee | $13,062,946 | |
| Performance adjustment | 940,052 | |
| Transfer agent fees | 3,598,353 | |
| Distribution and service plan fees | 268,610 | |
| Accounting and security lending fees | 600,318 | |
| Custodian fees and expenses | 182,519 | |
| Independent trustees' fees and expenses | 9,603 | |
| Registration fees | 144,714 | |
| Audit | 68,145 | |
| Legal | 15,481 | |
| Miscellaneous | 12,455 | |
| Total expenses before reductions | 18,903,196 | |
| Expense reductions | (222,036) | |
| Total expenses after reductions | | 18,681,160 |
| Net investment income (loss) | | 7,705,413 |
| Realized and Unrealized Gain (Loss) | | |
| Net realized gain (loss) on: | | |
| Investment securities: | | |
| Unaffiliated issuers | 203,225,468 | |
| Fidelity Central Funds | (191) | |
| Foreign currency transactions | 34,397 | |
| Futures contracts | (106,946) | |
| Total net realized gain (loss) | | 203,152,728 |
| Change in net unrealized appreciation (depreciation) on: | | |
| Investment securities: | | |
| Unaffiliated issuers (net of decrease in deferred foreign taxes of $79,392) | (147,849,880) | |
| Fidelity Central Funds | 12 | |
| Assets and liabilities in foreign currencies | (30,284) | |
| Futures contracts | (1,184,759) | |
| Total change in net unrealized appreciation (depreciation) | | (149,064,911) |
| Net gain (loss) | | 54,087,817 |
| Net increase (decrease) in net assets resulting from operations | | $61,793,230 |
See accompanying notes which are an integral part of the financial statements.
Statement of Changes in Net Assets
| | Year ended October 31, 2018 | Year ended October 31, 2017 |
| Increase (Decrease) in Net Assets | | |
| Operations | | |
| Net investment income (loss) | $7,705,413 | $11,957,628 |
| Net realized gain (loss) | 203,152,728 | 144,161,836 |
| Change in net unrealized appreciation (depreciation) | (149,064,911) | 210,799,339 |
| Net increase (decrease) in net assets resulting from operations | 61,793,230 | 366,918,803 |
| Distributions to shareholders | (114,348,791) | – |
| Distributions to shareholders from net investment income | – | (12,665,638) |
| Distributions to shareholders from net realized gain | – | (4,590,871) |
| Total distributions | (114,348,791) | (17,256,509) |
| Share transactions - net increase (decrease) | 553,625,621 | (100,984,602) |
| Redemption fees | – | 2,108 |
| Total increase (decrease) in net assets | 501,070,060 | 248,679,800 |
| Net Assets | | |
| Beginning of period | 1,731,605,242 | 1,482,925,442 |
| End of period | $2,232,675,302 | $1,731,605,242 |
| Other Information | | |
| Undistributed net investment income end of period | | $9,622,281 |
See accompanying notes which are an integral part of the financial statements.
Financial Highlights
Fidelity Worldwide Fund Class A
| Years ended October 31, | 2018 | 2017 | 2016 | 2015 | 2014 |
| Selected Per–Share Data | | | | | |
| Net asset value, beginning of period | $27.28 | $21.83 | $22.88 | $24.64 | $25.18 |
| Income from Investment Operations | | | | | |
| Net investment income (loss)A | .03 | .11 | .12 | .06 | .02 |
| Net realized and unrealized gain (loss) | 1.00 | 5.53 | (.35) | .58 | 1.46 |
| Total from investment operations | 1.03 | 5.64 | (.23) | .64 | 1.48 |
| Distributions from net investment income | (.09) | (.12) | (.07) | – | (.04) |
| Distributions from net realized gain | (1.65) | (.07) | (.75) | (2.40) | (1.98) |
| Total distributions | (1.74) | (.19) | (.82) | (2.40) | (2.02) |
| Redemption fees added to paid in capitalA | – | –B | –B | –B | –B |
| Net asset value, end of period | $26.57 | $27.28 | $21.83 | $22.88 | $24.64 |
| Total ReturnC,D | 3.96% | 26.06% | (1.09)% | 2.73% | 6.29% |
| Ratios to Average Net AssetsE,F | | | | | |
| Expenses before reductions | 1.23% | 1.12% | 1.22% | 1.27% | 1.31% |
| Expenses net of fee waivers, if any | 1.23% | 1.12% | 1.22% | 1.26% | 1.31% |
| Expenses net of all reductions | 1.22% | 1.11% | 1.22% | 1.26% | 1.31% |
| Net investment income (loss) | .12% | .47% | .55% | .27% | .10% |
| Supplemental Data | | | | | |
| Net assets, end of period (000 omitted) | $42,947 | $32,823 | $29,052 | $31,043 | $33,788 |
| Portfolio turnover rateG | 117% | 111% | 117% | 151% | 163% |
A Calculated based on average shares outstanding during the period.
B Amount represents less than $.005 per share.
C Total returns would have been lower if certain expenses had not been reduced during the applicable periods shown.
D Total returns do not include the effect of the sales charges.
E Fees and expenses of any underlying Fidelity Central Funds are not included in the Fund's expense ratio. The Fund indirectly bears its proportionate share of the expenses of any underlying Fidelity Central Funds.
F Expense ratios reflect operating expenses of the class. Expenses before reductions do not reflect amounts reimbursed by the investment adviser or reductions from brokerage service arrangements or reductions from other expense offset arrangements and do not represent the amount paid by the class during periods when reimbursements or reductions occur. Expenses net of fee waivers reflect expenses after reimbursement by the investment adviser but prior to reductions from brokerage service arrangements or other expense offset arrangements. Expenses net of all reductions represent the net expenses paid by the class.
G Amount does not include the portfolio activity of any underlying Fidelity Central Funds.
See accompanying notes which are an integral part of the financial statements.
Fidelity Worldwide Fund Class M
| Years ended October 31, | 2018 | 2017 | 2016 | 2015 | 2014 |
| Selected Per–Share Data | | | | | |
| Net asset value, beginning of period | $27.11 | $21.67 | $22.72 | $24.49 | $25.05 |
| Income from Investment Operations | | | | | |
| Net investment income (loss)A | (.05) | .04 | .05 | (.01) | (.04) |
| Net realized and unrealized gain (loss) | 1.00 | 5.50 | (.35) | .57 | 1.46 |
| Total from investment operations | .95 | 5.54 | (.30) | .56 | 1.42 |
| Distributions from net investment income | (.02) | (.03) | –B | – | – |
| Distributions from net realized gain | (1.65) | (.07) | (.75) | (2.33) | (1.98) |
| Total distributions | (1.67) | (.10) | (.75) | (2.33) | (1.98) |
| Redemption fees added to paid in capitalA | – | –B | –B | –B | –B |
| Net asset value, end of period | $26.39 | $27.11 | $21.67 | $22.72 | $24.49 |
| Total ReturnC,D | 3.65% | 25.68% | (1.38)% | 2.36% | 6.05% |
| Ratios to Average Net AssetsE,F | | | | | |
| Expenses before reductions | 1.52% | 1.42% | 1.53% | 1.57% | 1.58% |
| Expenses net of fee waivers, if any | 1.52% | 1.42% | 1.52% | 1.56% | 1.58% |
| Expenses net of all reductions | 1.51% | 1.41% | 1.52% | 1.56% | 1.58% |
| Net investment income (loss) | (.17)% | .17% | .25% | (.04)% | (.17)% |
| Supplemental Data | | | | | |
| Net assets, end of period (000 omitted) | $12,746 | $10,634 | $9,270 | $13,055 | $12,160 |
| Portfolio turnover rateG | 117% | 111% | 117% | 151% | 163% |
A Calculated based on average shares outstanding during the period.
B Amount represents less than $.005 per share.
C Total returns would have been lower if certain expenses had not been reduced during the applicable periods shown.
D Total returns do not include the effect of the sales charges.
E Fees and expenses of any underlying Fidelity Central Funds are not included in the Fund's expense ratio. The Fund indirectly bears its proportionate share of the expenses of any underlying Fidelity Central Funds.
F Expense ratios reflect operating expenses of the class. Expenses before reductions do not reflect amounts reimbursed by the investment adviser or reductions from brokerage service arrangements or reductions from other expense offset arrangements and do not represent the amount paid by the class during periods when reimbursements or reductions occur. Expenses net of fee waivers reflect expenses after reimbursement by the investment adviser but prior to reductions from brokerage service arrangements or other expense offset arrangements. Expenses net of all reductions represent the net expenses paid by the class.
G Amount does not include the portfolio activity of any underlying Fidelity Central Funds.
See accompanying notes which are an integral part of the financial statements.
Fidelity Worldwide Fund Class C
| Years ended October 31, | 2018 | 2017 | 2016 | 2015 | 2014 |
| Selected Per–Share Data | | | | | |
| Net asset value, beginning of period | $26.67 | $21.33 | $22.48 | $24.12 | $24.78 |
| Income from Investment Operations | | | | | |
| Net investment income (loss)A | (.18) | (.07) | (.05) | (.12) | (.15) |
| Net realized and unrealized gain (loss) | .98 | 5.42 | (.35) | .57 | 1.44 |
| Total from investment operations | .80 | 5.35 | (.40) | .45 | 1.29 |
| Distributions from net investment income | – | – | – | – | – |
| Distributions from net realized gain | (1.65) | (.01) | (.75) | (2.09) | (1.95) |
| Total distributions | (1.65) | (.01) | (.75) | (2.09) | (1.95) |
| Redemption fees added to paid in capitalA | – | –B | –B | –B | –B |
| Net asset value, end of period | $25.82 | $26.67 | $21.33 | $22.48 | $24.12 |
| Total ReturnC,D | 3.12% | 25.10% | (1.88)% | 1.90% | 5.55% |
| Ratios to Average Net AssetsE,F | | | | | |
| Expenses before reductions | 2.01% | 1.89% | 2.01% | 2.07% | 2.04% |
| Expenses net of fee waivers, if any | 2.01% | 1.89% | 2.01% | 2.07% | 2.04% |
| Expenses net of all reductions | 2.00% | 1.88% | 2.00% | 2.06% | 2.03% |
| Net investment income (loss) | (.66)% | (.30)% | (.24)% | (.54)% | (.63)% |
| Supplemental Data | | | | | |
| Net assets, end of period (000 omitted) | $12,744 | $10,264 | $10,315 | $11,231 | $9,229 |
| Portfolio turnover rateG | 117% | 111% | 117% | 151% | 163% |
A Calculated based on average shares outstanding during the period.
B Amount represents less than $.005 per share.
C Total returns would have been lower if certain expenses had not been reduced during the applicable periods shown.
D Total returns do not include the effect of the contingent deferred sales charge.
E Fees and expenses of any underlying Fidelity Central Funds are not included in the Fund's expense ratio. The Fund indirectly bears its proportionate share of the expenses of any underlying Fidelity Central Funds.
F Expense ratios reflect operating expenses of the class. Expenses before reductions do not reflect amounts reimbursed by the investment adviser or reductions from brokerage service arrangements or reductions from other expense offset arrangements and do not represent the amount paid by the class during periods when reimbursements or reductions occur. Expenses net of fee waivers reflect expenses after reimbursement by the investment adviser but prior to reductions from brokerage service arrangements or other expense offset arrangements. Expenses net of all reductions represent the net expenses paid by the class.
G Amount does not include the portfolio activity of any underlying Fidelity Central Funds.
See accompanying notes which are an integral part of the financial statements.
Fidelity Worldwide Fund
| Years ended October 31, | 2018 | 2017 | 2016 | 2015 | 2014 |
| Selected Per–Share Data | | | | | |
| Net asset value, beginning of period | $27.61 | $22.09 | $23.14 | $24.92 | $25.41 |
| Income from Investment Operations | | | | | |
| Net investment income (loss)A | .11 | .19 | .19 | .13 | .11 |
| Net realized and unrealized gain (loss) | 1.00 | 5.60 | (.35) | .58 | 1.47 |
| Total from investment operations | 1.11 | 5.79 | (.16) | .71 | 1.58 |
| Distributions from net investment income | (.17) | (.20) | (.14) | (.08) | (.09) |
| Distributions from net realized gain | (1.65) | (.07) | (.75) | (2.41) | (1.98) |
| Total distributions | (1.82) | (.27) | (.89) | (2.49) | (2.07) |
| Redemption fees added to paid in capitalA | – | –B | –B | –B | –B |
| Net asset value, end of period | $26.90 | $27.61 | $22.09 | $23.14 | $24.92 |
| Total ReturnC | 4.23% | 26.49% | (.78)% | 3.01% | 6.64% |
| Ratios to Average Net AssetsD,E | | | | | |
| Expenses before reductions | .94% | .81% | .91% | .96% | .98% |
| Expenses net of fee waivers, if any | .94% | .81% | .91% | .96% | .97% |
| Expenses net of all reductions | .93% | .80% | .90% | .95% | .97% |
| Net investment income (loss) | .41% | .79% | .87% | .57% | .44% |
| Supplemental Data | | | | | |
| Net assets, end of period (000 omitted) | $2,112,988 | $1,656,173 | $1,421,364 | $1,543,516 | $1,535,658 |
| Portfolio turnover rateF | 117% | 111% | 117% | 151% | 163% |
A Calculated based on average shares outstanding during the period.
B Amount represents less than $.005 per share.
C Total returns would have been lower if certain expenses had not been reduced during the applicable periods shown.
D Fees and expenses of any underlying Fidelity Central Funds are not included in the Fund's expense ratio. The Fund indirectly bears its proportionate share of the expenses of any underlying Fidelity Central Funds.
E Expense ratios reflect operating expenses of the class. Expenses before reductions do not reflect amounts reimbursed by the investment adviser or reductions from brokerage service arrangements or reductions from other expense offset arrangements and do not represent the amount paid by the class during periods when reimbursements or reductions occur. Expenses net of fee waivers reflect expenses after reimbursement by the investment adviser but prior to reductions from brokerage service arrangements or other expense offset arrangements. Expenses net of all reductions represent the net expenses paid by the class.
F Amount does not include the portfolio activity of any underlying Fidelity Central Funds.
See accompanying notes which are an integral part of the financial statements.
Fidelity Worldwide Fund Class I
| Years ended October 31, | 2018 | 2017 | 2016 | 2015 | 2014 |
| Selected Per–Share Data | | | | | |
| Net asset value, beginning of period | $27.49 | $21.99 | $23.03 | $24.81 | $25.31 |
| Income from Investment Operations | | | | | |
| Net investment income (loss)A | .11 | .19 | .17 | .13 | .10 |
| Net realized and unrealized gain (loss) | .99 | 5.56 | (.35) | .58 | 1.47 |
| Total from investment operations | 1.10 | 5.75 | (.18) | .71 | 1.57 |
| Distributions from net investment income | (.18) | (.18) | (.11) | (.07) | (.09) |
| Distributions from net realized gain | (1.65) | (.07) | (.75) | (2.41) | (1.98) |
| Total distributions | (1.82)B | (.25) | (.86) | (2.49)C | (2.07) |
| Redemption fees added to paid in capitalA | – | –D | –D | –D | –D |
| Net asset value, end of period | $26.77 | $27.49 | $21.99 | $23.03 | $24.81 |
| Total ReturnE | 4.22% | 26.45% | (.86)% | 3.00% | 6.63% |
| Ratios to Average Net AssetsF,G | | | | | |
| Expenses before reductions | .96% | .83% | .99% | .98% | 1.01% |
| Expenses net of fee waivers, if any | .95% | .83% | .99% | .98% | 1.01% |
| Expenses net of all reductions | .94% | .82% | .98% | .97% | 1.00% |
| Net investment income (loss) | .40% | .77% | .78% | .55% | .40% |
| Supplemental Data | | | | | |
| Net assets, end of period (000 omitted) | $50,956 | $21,711 | $12,924 | $25,173 | $19,107 |
| Portfolio turnover rateH | 117% | 111% | 117% | 151% | 163% |
A Calculated based on average shares outstanding during the period.
B Total distributions of $1.82 per share is comprised of distributions from net investment income of $.176 and distributions from net realized gain of $1.648 per share.
C Total distributions of $2.49 per share is comprised of distributions from net investment income of $.074 and distributions from net realized gain of $2.413 per share.
D Amount represents less than $.005 per share.
E Total returns would have been lower if certain expenses had not been reduced during the applicable periods shown.
F Fees and expenses of any underlying Fidelity Central Funds are not included in the Fund's expense ratio. The Fund indirectly bears its proportionate share of the expenses of any underlying Fidelity Central Funds.
G Expense ratios reflect operating expenses of the class. Expenses before reductions do not reflect amounts reimbursed by the investment adviser or reductions from brokerage service arrangements or reductions from other expense offset arrangements and do not represent the amount paid by the class during periods when reimbursements or reductions occur. Expenses net of fee waivers reflect expenses after reimbursement by the investment adviser but prior to reductions from brokerage service arrangements or other expense offset arrangements. Expenses net of all reductions represent the net expenses paid by the class.
H Amount does not include the portfolio activity of any underlying Fidelity Central Funds.
See accompanying notes which are an integral part of the financial statements.
Fidelity Worldwide Fund Class Z
| Year ended October 31, | 2018 A |
| Selected Per–Share Data | |
| Net asset value, beginning of period | $29.54 |
| Income from Investment Operations | |
| Net investment income (loss)B | (.01) |
| Net realized and unrealized gain (loss) | (2.75) |
| Total from investment operations | (2.76) |
| Net asset value, end of period | $26.78 |
| Total ReturnC,D | (9.34)% |
| Ratios to Average Net AssetsE,F | |
| Expenses before reductions | .88%G |
| Expenses net of fee waivers, if any | .88%G |
| Expenses net of all reductions | .87%G |
| Net investment income (loss) | (.27)%G |
| Supplemental Data | |
| Net assets, end of period (000 omitted) | $294 |
| Portfolio turnover rateH | 117% |
A For the period October 2, 2018 (commencement of sale of shares) to October 31, 2018.
B Calculated based on average shares outstanding during the period.
C Total returns for periods of less than one year are not annualized.
D Total returns would have been lower if certain expenses had not been reduced during the applicable periods shown.
E Fees and expenses of any underlying Fidelity Central Funds are not included in the Fund's expense ratio. The Fund indirectly bears its proportionate share of the expenses of any underlying Fidelity Central Funds.
F Expense ratios reflect operating expenses of the class. Expenses before reductions do not reflect amounts reimbursed by the investment adviser or reductions from brokerage service arrangements or reductions from other expense offset arrangements and do not represent the amount paid by the class during periods when reimbursements or reductions occur. Expense ratios before reductions for start-up periods may not be representative of longer-term operating periods. Expenses net of fee waivers reflect expenses after reimbursement by the investment adviser but prior to reductions from brokerage service arrangements or other expense offset arrangements. Expenses net of all reductions represent the net expenses paid by the class.
G Annualized
H Amount does not include the portfolio activity of any underlying Fidelity Central Funds.
See accompanying notes which are an integral part of the financial statements.
Notes to Financial Statements
For the period ended October 31, 2018
1. Organization.
Fidelity Worldwide Fund (the Fund) is a fund of Fidelity Investment Trust (the Trust) and is authorized to issue an unlimited number of shares. The Trust is registered under the Investment Company Act of 1940, as amended (the 1940 Act), as an open-end management investment company organized as a Massachusetts business trust. The Fund commenced sale of Class Z shares on October 2, 2018. The Fund offers Class A, Class M, Class C, Worldwide, Class I and Class Z shares, each of which has equal rights as to assets and voting privileges. Each class has exclusive voting rights with respect to matters that affect that class.
2. Investments in Fidelity Central Funds.
The Fund invests in Fidelity Central Funds, which are open-end investment companies generally available only to other investment companies and accounts managed by the investment adviser and its affiliates. The Fund's Schedule of Investments lists each of the Fidelity Central Funds held as of period end, if any, as an investment of the Fund, but does not include the underlying holdings of each Fidelity Central Fund. As an Investing Fund, the Fund indirectly bears its proportionate share of the expenses of the underlying Fidelity Central Funds.
The Money Market Central Funds seek preservation of capital and current income and are managed by Fidelity Investments Money Management, Inc. (FIMM), an affiliate of the investment adviser. Annualized expenses of the Money Market Central Funds as of their most recent shareholder report date are less than .005%.
A complete unaudited list of holdings for each Fidelity Central Fund is available upon request or at the Securities and Exchange Commission (the SEC) website at www.sec.gov. In addition, the financial statements of the Fidelity Central Funds, which are not covered by the Fund's Report of Independent Registered Public Accounting Firm, are available on the SEC website or upon request.
3. Significant Accounting Policies.
The Fund is an investment company and applies the accounting and reporting guidance of the Financial Accounting Standards Board (FASB) Accounting Standards Codification Topic 946 Financial Services – Investments Companies. The financial statements have been prepared in conformity with accounting principles generally accepted in the United States of America (GAAP), which require management to make certain estimates and assumptions at the date of the financial statements. Actual results could differ from those estimates. Subsequent events, if any, through the date that the financial statements were issued have been evaluated in the preparation of the financial statements. The following summarizes the significant accounting policies of the Fund:
Investment Valuation. Investments are valued as of 4:00 p.m. Eastern time on the last calendar day of the period. The Board of Trustees (the Board) has delegated the day to day responsibility for the valuation of the Fund's investments to the Fair Value Committee (the Committee) established by the Fund's investment adviser. In accordance with valuation policies and procedures approved by the Board, the Fund attempts to obtain prices from one or more third party pricing vendors or brokers to value its investments. When current market prices, quotations or currency exchange rates are not readily available or reliable, investments will be fair valued in good faith by the Committee, in accordance with procedures adopted by the Board. Factors used in determining fair value vary by investment type and may include market or investment specific events, changes in interest rates and credit quality. The frequency with which these procedures are used cannot be predicted and they may be utilized to a significant extent. The Committee oversees the Fund's valuation policies and procedures and reports to the Board on the Committee's activities and fair value determinations. The Board monitors the appropriateness of the procedures used in valuing the Fund's investments and ratifies the fair value determinations of the Committee.
The Fund categorizes the inputs to valuation techniques used to value its investments into a disclosure hierarchy consisting of three levels as shown below:
- Level 1 – quoted prices in active markets for identical investments
- Level 2 – other significant observable inputs (including quoted prices for similar investments, interest rates, prepayment speeds, etc.)
- Level 3 – unobservable inputs (including the Fund's own assumptions based on the best information available)
Valuation techniques used to value the Fund's investments by major category are as follows:
Equity securities, including restricted securities, for which market quotations are readily available, are valued at the last reported sale price or official closing price as reported by a third party pricing vendor on the primary market or exchange on which they are traded and are categorized as Level 1 in the hierarchy. In the event there were no sales during the day or closing prices are not available, securities are valued at the last quoted bid price or may be valued using the last available price and are generally categorized as Level 2 in the hierarchy. For foreign equity securities, when market or security specific events arise, comparisons to the valuation of American Depositary Receipts (ADRs), futures contracts, Exchange-Traded Funds (ETFs) and certain indexes as well as quoted prices for similar securities may be used and would be categorized as Level 2 in the hierarchy. Utilizing these techniques may result in transfers between Level 1 and Level 2. For equity securities, including restricted securities, where observable inputs are limited, assumptions about market activity and risk are used and these securities may be categorized as Level 3 in the hierarchy.
Debt securities, including restricted securities, are valued based on evaluated prices received from third party pricing vendors or from brokers who make markets in such securities. U.S. government and government agency obligations are valued by pricing vendors who utilize matrix pricing which considers yield or price of bonds of comparable quality, coupon, maturity and type or by broker-supplied prices. When independent prices are unavailable or unreliable, debt securities may be valued utilizing pricing methodologies which consider similar factors that would be used by third party pricing vendors. Debt securities are generally categorized as Level 2 in the hierarchy but may be Level 3 depending on the circumstances.
Futures contracts are valued at the settlement price established each day by the board of trade or exchange on which they are traded and are categorized as Level 1 in the hierarchy. Investments in open-end mutual funds, including the Fidelity Central Funds, are valued at their closing net asset value (NAV) each business day and are categorized as Level 1 in the hierarchy.
Changes in valuation techniques may result in transfers in or out of an assigned level within the disclosure hierarchy. The aggregate value of investments by input level as of October 31, 2018, including information on transfers between Levels 1 and 2 is included at the end of the Fund's Schedule of Investments.
Foreign Currency. The Fund may use foreign currency contracts to facilitate transactions in foreign-denominated securities. Gains and losses from these transactions may arise from changes in the value of the foreign currency or if the counterparties do not perform under the contracts' terms.
Foreign-denominated assets, including investment securities, and liabilities are translated into U.S. dollars at the exchange rates at period end. Purchases and sales of investment securities, income and dividends received and expenses denominated in foreign currencies are translated into U.S. dollars at the exchange rate in effect on the transaction date.
The effects of exchange rate fluctuations on investments are included with the net realized and unrealized gain (loss) on investment securities. Other foreign currency transactions resulting in realized and unrealized gain (loss) are disclosed separately.
Investment Transactions and Income. For financial reporting purposes, the Fund's investment holdings and NAV include trades executed through the end of the last business day of the period. The NAV per share for processing shareholder transactions is calculated as of the close of business of the New York Stock Exchange (NYSE), normally 4:00 p.m. Eastern time and includes trades executed through the end of the prior business day. Gains and losses on securities sold are determined on the basis of identified cost and include proceeds received from litigation. Dividend income is recorded on the ex-dividend date, except for certain dividends from foreign securities where the ex-dividend date may have passed, which are recorded as soon as the Fund is informed of the ex-dividend date. Non-cash dividends included in dividend income, if any, are recorded at the fair market value of the securities received. Income and capital gain distributions from Fidelity Central Funds, if any, are recorded on the ex-dividend date. Certain distributions received by the Fund represent a return of capital or capital gain. The Fund determines the components of these distributions subsequent to the ex-dividend date, based upon receipt of tax filings or other correspondence relating to the underlying investment. These distributions are recorded as a reduction of cost of investments and/or as a realized gain. Interest income is accrued as earned and includes coupon interest and amortization of premium and accretion of discount on debt securities as applicable. Investment income is recorded net of foreign taxes withheld where recovery of such taxes is uncertain.
Class Allocations and Expenses. Investment income, realized and unrealized capital gains and losses, common expenses of the Fund, and certain fund-level expense reductions, if any, are allocated daily on a pro-rata basis to each class based on the relative net assets of each class to the total net assets of the Fund. Each class differs with respect to transfer agent and distribution and service plan fees incurred. Certain expense reductions may also differ by class. For the reporting period, the allocated portion of income and expenses to each class as a percent of its average net assets may vary due to the timing of recording these transactions in relation to fluctuating net assets of the classes. Expenses directly attributable to a fund are charged to that fund. Expenses attributable to more than one fund are allocated among the respective funds on the basis of relative net assets or other appropriate methods. Expense estimates are accrued in the period to which they relate and adjustments are made when actual amounts are known.
Income Tax Information and Distributions to Shareholders. Each year, the Fund intends to qualify as a regulated investment company under Subchapter M of the Internal Revenue Code, including distributing substantially all of its taxable income and realized gains. As a result, no provision for U.S. Federal income taxes is required. As of October 31, 2018, the Fund did not have any unrecognized tax benefits in the financial statements; nor is the Fund aware of any tax positions for which it is reasonably possible that the total amounts of unrecognized tax benefits will significantly change in the next twelve months. The Fund files a U.S. federal tax return, in addition to state and local tax returns as required. The Fund's federal income tax returns are subject to examination by the Internal Revenue Service (IRS) for a period of three fiscal years after they are filed. State and local tax returns may be subject to examination for an additional fiscal year depending on the jurisdiction. Foreign taxes are provided for based on the Fund's understanding of the tax rules and rates that exist in the foreign markets in which it invests. The Fund is subject to a tax imposed on capital gains by certain countries in which it invests. An estimated deferred tax liability for net unrealized appreciation on the applicable securities is included in Other payables and accrued expenses on the Statement of Assets & Liabilities.
Distributions are declared and recorded on the ex-dividend date. Income and capital gain distributions are declared separately for each class. Income and capital gain distributions are determined in accordance with income tax regulations, which may differ from GAAP. In addition, the Fund claimed a portion of the payment made to redeeming shareholders as a distribution for income tax purposes.
Capital accounts within the financial statements are adjusted for permanent book-tax differences. These adjustments have no impact on net assets or the results of operations. Capital accounts are not adjusted for temporary book-tax differences which will reverse in a subsequent period.
Book-tax differences are primarily due to foreign currency transactions, passive foreign investment companies (PFIC), market discount, partnerships, deferred trustees compensation and losses deferred due to wash sales.
As of period end, the cost and unrealized appreciation (depreciation) in securities, and derivatives if applicable, for federal income tax purposes were as follows:
| Gross unrealized appreciation | $338,922,735 |
| Gross unrealized depreciation | (73,945,366) |
| Net unrealized appreciation (depreciation) | $264,977,369 |
| Tax Cost | $1,976,259,077 |
The tax-based components of distributable earnings as of period end were as follows:
| Undistributed ordinary income | $4,538,868 |
| Undistributed long-term capital gain | $184,620,580 |
| Net unrealized appreciation (depreciation) on securities and other investments | $264,880,409 |
The tax character of distributions paid was as follows:
| | October 31, 2018 | October 31, 2017 |
| Ordinary Income | $10,719,882 | $ 17,256,509 |
| Long-term Capital Gains | 103,628,909 | – |
| Total | $114,348,791 | $ 17,256,509 |
Restricted Securities. The Fund may invest in securities that are subject to legal or contractual restrictions on resale. These securities generally may be resold in transactions exempt from registration or to the public if the securities are registered. Disposal of these securities may involve time-consuming negotiations and expense, and prompt sale at an acceptable price may be difficult. Information regarding restricted securities is included at the end of the Fund's Schedule of Investments.
New Rule Issuance. During August 2018, the U.S. Securities and Exchange Commission issued Final Rule Release No. 33-10532, Disclosure Update and Simplification. This Final Rule includes amendments specific to registered investment companies that are intended to eliminate overlap in disclosure requirements between Regulation S-X and GAAP. In accordance with these amendments, certain line-items in the Fund financial statements have been combined or removed for the current period as outlined in the table below.
| Financial Statement | Current Line-Item Presentation | Prior Line-Item Presentation |
| Statement of Assets and Liabilities | Total distributable earnings (loss) | Undistributed/Distributions in excess of/Accumulated net investment income (loss)
Accumulated/Undistributed net realized gain (loss)
Net unrealized appreciation (depreciation) |
| Statement of Changes in Net Assets | N/A - removed | Undistributed/Distributions in excess of/Accumulated net investment income (loss) end of period |
| Statement of Changes in Net Assets | Distributions to shareholders | Distributions to shareholders from net investment income
Distributions to shareholders from net realized gain |
| Distributions to Shareholders Note to Financial Statements | Distributions to shareholders | Distributions to shareholders from net investment income
Distributions to shareholders from net realized gain |
4. Derivative Instruments.
Risk Exposures and the Use of Derivative Instruments. The Fund's investment objective allows the Fund to enter into various types of derivative contracts, including futures contracts. Derivatives are investments whose value is primarily derived from underlying assets, indices or reference rates and may be transacted on an exchange or over-the-counter (OTC). Derivatives may involve a future commitment to buy or sell a specified asset based on specified terms, to exchange future cash flows at periodic intervals based on a notional principal amount, or for one party to make one or more payments upon the occurrence of specified events in exchange for periodic payments from the other party.
The Fund used derivatives to increase returns and to manage exposure to certain risks as defined below. The success of any strategy involving derivatives depends on analysis of numerous economic factors, and if the strategies for investment do not work as intended, the Fund may not achieve its objectives.
The Fund's use of derivatives increased or decreased its exposure to the following risk:
| Equity Risk | Equity risk relates to the fluctuations in the value of financial instruments as a result of changes in market prices (other than those arising from interest rate risk or foreign exchange risk), whether caused by factors specific to an individual investment, its issuer, or all factors affecting all instruments traded in a market or market segment.
|
The Fund is also exposed to additional risks from investing in derivatives, such as liquidity risk and counterparty credit risk. Liquidity risk is the risk that the Fund will be unable to close out the derivative in the open market in a timely manner. Counterparty credit risk is the risk that the counterparty will not be able to fulfill its obligation to the Fund. Counterparty credit risk related to exchange-traded futures contracts may be mitigated by the protection provided by the exchange on which they trade.
Investing in derivatives may involve greater risks than investing in the underlying assets directly and, to varying degrees, may involve risk of loss in excess of any initial investment and collateral received and amounts recognized in the Statement of Assets and Liabilities. In addition, there may be the risk that the change in value of the derivative contract does not correspond to the change in value of the underlying instrument.
Futures Contracts. A futures contract is an agreement between two parties to buy or sell a specified underlying instrument for a fixed price at a specified future date. The Fund used futures contracts to manage its exposure to the stock market.
Upon entering into a futures contract, a fund is required to deposit either cash or securities (initial margin) with a clearing broker in an amount equal to a certain percentage of the face value of the contract. Futures contracts are marked-to-market daily and subsequent daily payments (variation margin) are made or received by a fund depending on the daily fluctuations in the value of the futures contracts and are recorded as unrealized appreciation or (depreciation). This receivable and/or payable, if any, is included in daily variation margin on futures contracts in the Statement of Assets and Liabilities. Realized gain or (loss) is recorded upon the expiration or closing of a futures contract. The net realized gain (loss) and change in net unrealized appreciation (depreciation) on futures contracts during the period is presented in the Statement of Operations.
Any open futures contracts at period end are presented in the Schedule of Investments under the caption "Futures Contracts". The notional amount at value reflects each contract's exposure to the underlying instrument or index at period end and is representative of volume of activity during the period. Securities deposited to meet initial margin requirements are identified in the Schedule of Investments.
5. Purchases and Sales of Investments.
Purchases and sales of securities, other than short-term securities, aggregated $2,490,102,268 and $2,214,133,504, respectively.
6. Fees and Other Transactions with Affiliates.
Management Fee. Fidelity Management & Research Company (the investment adviser) and its affiliates provide the Fund with investment management related services for which the Fund pays a monthly management fee. The management fee is the sum of an individual fund fee rate that is based on an annual rate of .424% of the Fund's average net assets and an annualized group fee rate that averaged .24% during the period. The group fee rate is based upon the average net assets of all the mutual funds advised by the investment adviser, including any mutual funds previously advised by the investment adviser that are currently advised by Fidelity SelectCo, LLC, an affiliate of the investment adviser. The group fee rate decreases as assets under management increase and increases as assets under management decrease. In addition, the management fee is subject to a performance adjustment (up to a maximum of +/- .20% of the Fund's average net assets over a 36 month performance period). The upward or downward adjustment to the management fee is based on the relative investment performance of Worldwide as compared to its benchmark index, the MSCI World Index, over the same 36 month performance period. For the reporting period, the total annual management fee rate, including the performance adjustment, was .71% of the Fund's average net assets. The performance adjustment included in the management fee rate may be higher or lower than the maximum performance adjustment rate due to the difference between the average net assets for the reporting and performance periods.
Distribution and Service Plan Fees. In accordance with Rule 12b-1 of the 1940 Act, the Fund has adopted separate Distribution and Service Plans for each class of shares. Certain classes pay Fidelity Distributors Corporation (FDC), an affiliate of the investment adviser, separate Distribution and Service Fees, each of which is based on an annual percentage of each class' average net assets. In addition, FDC may pay financial intermediaries for selling shares of the Fund and providing shareholder support services. For the period, the Distribution and Service Fee rates, total fees and amounts retained by FDC were as follows:
| | Distribution Fee | Service Fee | Total Fees | Retained by FDC |
| Class A | -% | .25% | $94,438 | $4,058 |
| Class M | .25% | .25% | 57,884 | 659 |
| Class C | .75% | .25% | 116,288 | 13,470 |
| | | | $268,610 | $18,187 |
Sales Load. FDC may receive a front-end sales charge of up to 5.75% for selling Class A shares and 3.50% for selling Class M shares, some of which is paid to financial intermediaries for selling shares of the Fund. Depending on the holding period, FDC may receive contingent deferred sales charges levied on Class A, Class M and Class C redemptions. The deferred sales charges are 1.00% for Class C shares, 1.00% for certain purchases of Class A shares and .25% for certain purchases of Class M shares.
For the period, sales charge amounts retained by FDC were as follows:
| | Retained by FDC |
| Class A | $26,918 |
| Class M | 3,647 |
| Class C(a) | 1,487 |
| | $32,052 |
(a) When Class C shares are initially sold, FDC pays commissions from its own resources to financial intermediaries through which the sales are made.
Transfer Agent Fees. Fidelity Investments Institutional Operations Company, Inc., (FIIOC), an affiliate of the investment adviser, is the transfer, dividend disbursing and shareholder servicing agent for each class of the Fund. FIIOC receives account fees and asset-based fees that vary according to the account size and type of account of the shareholders of the respective classes of the Fund, except Class Z. FIIOC receives an asset-based fee of Class Z's average net assets. FIIOC pays for typesetting, printing and mailing of shareholder reports, except proxy statements.
For the period, transfer agent fees for each class were as follows:
| | Amount | % of Class-Level Average Net Assets |
| Class A | $83,738 | .22 |
| Class M | 29,929 | .26 |
| Class C | 28,683 | .25 |
| Worldwide | 3,395,306 | .18 |
| Class I | 60,692 | .19 |
| Class Z | 5 | .05(a) |
| | $3,598,353 | |
(a) Annualized.
Accounting and Security Lending Fees. Fidelity Service Company, Inc. (FSC), an affiliate of the investment adviser, maintains the Fund's accounting records. The accounting fee is based on the level of average net assets for each month. Under a separate contract, FSC administers the security lending program. The security lending fee is based on the number and duration of lending transactions. For the period, the fees were equivalent to an annual rate of .03%.
Brokerage Commissions. The Fund placed a portion of its portfolio transactions with brokerage firms which are affiliates of the investment adviser. Brokerage commissions are included in net realized gain (loss) and change in net unrealized appreciation (depreciation) in the Statement of Operations. The commissions paid to these affiliated firms were $35,764 for the period.
Interfund Trades. The Fund may purchase from or sell securities to other Fidelity Funds under procedures adopted by the Board. The procedures have been designed to ensure these interfund trades are executed in accordance with Rule 17a-7 of the 1940 Act. Interfund trades are included within the respective purchases and sales amounts shown in the Purchases and Sales of Investments note.
Other. During the period, the investment adviser reimbursed the Fund for certain losses in the amount of $11,831.
7. Committed Line of Credit.
The Fund participates with other funds managed by the investment adviser or an affiliate in a $4.25 billion credit facility (the "line of credit") to be utilized for temporary or emergency purposes to fund shareholder redemptions or for other short-term liquidity purposes. The Fund has agreed to pay commitment fees on its pro-rata portion of the line of credit, which amounted to $5,193 and is reflected in Miscellaneous expenses on the Statement of Operations. During the period, the Fund did not borrow on this line of credit.
8. Security Lending.
The Fund lends portfolio securities through a lending agent from time to time in order to earn additional income. For equity securities, a lending agent is used and may loan securities to certain qualified borrowers, including Fidelity Capital Markets (FCM), a broker-dealer affiliated with the Fund. On the settlement date of the loan, the Fund receives collateral (in the form of U.S. Treasury obligations, letters of credit and/or cash) against the loaned securities and maintains collateral in an amount not less than 100% of the market value of the loaned securities during the period of the loan. The market value of the loaned securities is determined at the close of business of the Fund and any additional required collateral is delivered to the Fund on the next business day. The Fund or borrower may terminate the loan at any time, and if the borrower defaults on its obligation to return the securities loaned because of insolvency or other reasons, the Fund may apply collateral received from the borrower against the obligation. The Fund may experience delays and costs in recovering the securities loaned. Any cash collateral received is invested in the Fidelity Securities Lending Cash Central Fund. The value of loaned securities and cash collateral at period end are disclosed on the Fund's Statement of Assets and Liabilities. At period end, there were no security loans outstanding with FCM. Security lending income represents the income earned on investing cash collateral, less rebates paid to borrowers and any lending agent fees associated with the loan, plus any premium payments received for lending certain types of securities. Security lending income is presented in the Statement of Operations as a component of income from Fidelity Central Funds. Total security lending income during the period amounted to $224,535, including $5,425 from securities loaned to FCM.
9. Expense Reductions.
Commissions paid to certain brokers with whom the investment adviser, or its affiliates, places trades on behalf of the Fund include an amount in addition to trade execution, which may be rebated back to the Fund to offset certain expenses. This amount totaled $202,401 for the period. In addition, through arrangements with the Fund's custodian, credits realized as a result of certain uninvested cash balances were used to reduce the Fund's expenses. During the period, these credits reduced the Fund's custody expenses by $2,095.
In addition, during the period the investment adviser reimbursed and/or waived a portion of fund-level operating expenses in the amount of $17,540.
10. Distributions to Shareholders.
Distributions to shareholders of each class were as follows:
| | Year ended
October 31, 2018 | Year ended
October 31, 2017 |
| Distributions to shareholders | | |
| Class A | $2,051,466 | $– |
| Class M | 654,014 | – |
| Class C | 633,808 | – |
| Worldwide | 109,503,017 | – |
| Class I | 1,506,486 | – |
| Total | $114,348,791 | $– |
| From net investment income | | |
| Class A | $– | $156,512 |
| Class M | – | 13,192 |
| Worldwide | – | 12,387,164 |
| Class I | – | 108,770 |
| Total | $– | $12,665,638 |
| From net realized gain | | |
| Class A | $– | $90,544 |
| Class M | – | 29,788 |
| Class C | – | 5,172 |
| Worldwide | – | 4,423,987 |
| Class I | – | 41,380 |
| Total | $– | $4,590,871 |
11. Share Transactions.
Share transactions for each class were as follows and may contain automatic conversions between classes or exchanges between affiliated funds:
| | Shares | Shares | Dollars | Dollars |
| | Year ended October 31, 2018(a) | Year ended October 31, 2017 | Year ended October 31, 2018(a) | Year ended October 31, 2017 |
| Class A | | | | |
| Shares sold | 609,144 | 252,685 | $17,061,872 | $6,107,897 |
| Reinvestment of distributions | 78,436 | 11,049 | 2,026,788 | 241,860 |
| Shares redeemed | (274,061) | (391,649) | (7,593,781) | (9,231,105) |
| Net increase (decrease) | 413,519 | (127,915) | $11,494,879 | $(2,881,348) |
| Class M | | | | |
| Shares sold | 168,412 | 59,279 | $4,717,242 | $1,423,926 |
| Reinvestment of distributions | 25,202 | 1,947 | 648,710 | 42,456 |
| Shares redeemed | (102,871) | (96,788) | (2,844,892) | (2,279,691) |
| Net increase (decrease) | 90,743 | (35,562) | $2,521,060 | $(813,309) |
| Class C | | | | |
| Shares sold | 162,206 | 50,318 | $4,408,829 | $1,172,168 |
| Reinvestment of distributions | 23,576 | 220 | 596,476 | 4,750 |
| Shares redeemed | (77,137) | (149,358) | (2,067,888) | (3,414,844) |
| Net increase (decrease) | 108,645 | (98,820) | $2,937,417 | $(2,237,926) |
| Worldwide | | | | |
| Shares sold | 25,541,865 | 6,214,435 | $707,560,818 | $152,123,337 |
| Reinvestment of distributions | 4,051,546 | 735,217 | 105,785,859 | 16,240,943 |
| Shares redeemed | (11,038,188) | (11,303,639) | (308,523,854) | (268,415,255) |
| Net increase (decrease) | 18,555,223 | (4,353,987) | $504,822,823 | $(100,050,975) |
| Class I | | | | |
| Shares sold | 1,332,978 | 418,936 | $37,665,029 | $10,241,482 |
| Reinvestment of distributions | 55,805 | 6,375 | 1,449,814 | 140,244 |
| Shares redeemed | (275,288) | (223,274) | (7,566,057) | (5,382,770) |
| Net increase (decrease) | 1,113,495 | 202,037 | $31,548,786 | $4,998,956 |
| Class Z | | | | |
| Shares sold | 10,966 | – | $300,656 | $– |
| Net increase (decrease) | 10,966 | – | $300,656 | $– |
(a) Share transactions for Class Z are for the period October 2, 2018 (commencement of sale of shares) to October 31, 2018
12. Other.
The Fund's organizational documents provide former and current trustees and officers with a limited indemnification against liabilities arising in connection with the performance of their duties to the Fund. In the normal course of business, the Fund may also enter into contracts that provide general indemnifications. The Fund's maximum exposure under these arrangements is unknown as this would be dependent on future claims that may be made against the Fund. The risk of material loss from such claims is considered remote.
Report of Independent Registered Public Accounting Firm
To the Trustees of Fidelity Investment Trust and Shareholders of Fidelity Diversified International Fund, Fidelity International Capital Appreciation Fund and Fidelity Worldwide Fund:
Opinion on the Financial Statements and Financial Highlights
We have audited the accompanying statements of assets and liabilities of Fidelity Diversified International Fund, Fidelity International Capital Appreciation Fund and Worldwide Fund (the "Funds"), each a fund of Fidelity Investment Trust, including the schedules of investments, as of October 31, 2018, and the related statements of operations for the year then ended, the statements of changes in net assets for each of the two years in the period then ended, the financial highlights for each of the five years in the period then ended, and the related notes. In our opinion, the financial statements and financial highlights present fairly, in all material respects, the financial position of each of the Funds as of October 31, 2018, and the results of their operations for the year then ended, the changes in their net assets for each of the two years in the period then ended, and the financial highlights for each of the five years in the period then ended, in conformity with accounting principles generally accepted in the United States of America.
Basis for Opinion
These financial statements and financial highlights are the responsibility of the Funds' management. Our responsibility is to express an opinion on the Funds' financial statements and financial highlights based on our audits. We are a public accounting firm registered with the Public Company Accounting Oversight Board (United States) (PCAOB) and are required to be independent with respect to the Funds in accordance with the U.S. federal securities laws and the applicable rules and regulations of the Securities and Exchange Commission and the PCAOB.
We conducted our audits in accordance with the standards of the PCAOB. Those standards require that we plan and perform the audit to obtain reasonable assurance about whether the financial statements and financial highlights are free of material misstatement, whether due to error or fraud. The Funds are not required to have, nor were we engaged to perform, an audit of their internal control over financial reporting. As part of our audits we are required to obtain an understanding of internal control over financial reporting but not for the purpose of expressing an opinion on the effectiveness of the Funds' internal control over financial reporting. Accordingly, we express no such opinion.
Our audits included performing procedures to assess the risks of material misstatement of the financial statements and financial highlights, whether due to error or fraud, and performing procedures that respond to those risks. Such procedures included examining, on a test basis, evidence regarding the amounts and disclosures in the financial statements and financial highlights. Our audits also included evaluating the accounting principles used and significant estimates made by management, as well as evaluating the overall presentation of the financial statements and financial highligts. Our procedures included confirmation of securities owned as of October 31, 2018 by correspondence with the custodians and brokers; when replies were not received from brokers, we performed other auditing procedures. We believe that our audits provide a reasonable basis for our opinion.
/s/ Deloitte & Touche LLP
Boston, Massachusetts
December 13, 2018
We have served as the auditor of one or more of the Fidelity investment companies since 1999.
Report of Independent Registered Public Accounting Firm
To the Board of Trustees of Fidelity Investment Trust and Shareholders of Fidelity Overseas Fund:
Opinion on the Financial Statements
We have audited the accompanying statement of assets and liabilities, including the schedule of investments, of Fidelity Overseas Fund (one of the funds constituting Fidelity Investment Trust, referred to hereafter as the "Fund") as of October 31, 2018, the related statement of operations for the year ended October 31, 2018, the statement of changes in net assets for each of the two years in the period ended October 31, 2018, including the related notes, and the financial highlights for each of the five years in the period ended October 31, 2018 (collectively referred to as the “financial statements”). In our opinion, the financial statements present fairly, in all material respects, the financial position of the Fund as of October 31, 2018, the results of its operations for the year then ended, the changes in its net assets for each of the two years in the period ended October 31, 2018 and the financial highlights for each of the five years in the period ended October 31, 2018 in conformity with accounting principles generally accepted in the United States of America.
Basis for Opinion
These financial statements are the responsibility of the Fund's management. Our responsibility is to express an opinion on the Fund's financial statements based on our audits. We are a public accounting firm registered with the Public Company Accounting Oversight Board (United States) (“PCAOB”) and are required to be independent with respect to the Fund in accordance with the U.S. federal securities laws and the applicable rules and regulations of the Securities and Exchange Commission and the PCAOB.
We conducted our audits of these financial statements in accordance with the standards of the PCAOB. Those standards require that we plan and perform the audit to obtain reasonable assurance about whether the financial statements are free of material misstatement, whether due to error or fraud.
Our audits included performing procedures to assess the risks of material misstatement of the financial statements, whether due to error or fraud, and performing procedures that respond to those risks. Such procedures included examining, on a test basis, evidence regarding the amounts and disclosures in the financial statements. Our audits also included evaluating the accounting principles used and significant estimates made by management, as well as evaluating the overall presentation of the financial statements. Our procedures included confirmation of securities owned as of October 31, 2018 by correspondence with the custodian, and brokers; when replies were not received from brokers, we performed other auditing procedures. We believe that our audits provide a reasonable basis for our opinion.
PricewaterhouseCoopers LLP
Boston, Massachusetts
December 13, 2018
We have served as the auditor of one or more investment companies in the Fidelity group of funds since 1932.
Trustees and Officers
The Trustees, Members of the Advisory Board (if any), and officers of the trust and funds, as applicable, are listed below. The Board of Trustees governs each fund and is responsible for protecting the interests of shareholders. The Trustees are experienced executives who meet periodically throughout the year to oversee each fund's activities, review contractual arrangements with companies that provide services to each fund, oversee management of the risks associated with such activities and contractual arrangements, and review each fund's performance. Except for Jonathan Chiel, each of the Trustees oversees 283 funds. Mr. Chiel oversees 154 funds.
The Trustees hold office without limit in time except that (a) any Trustee may resign; (b) any Trustee may be removed by written instrument, signed by at least two-thirds of the number of Trustees prior to such removal; (c) any Trustee who requests to be retired or who has become incapacitated by illness or injury may be retired by written instrument signed by a majority of the other Trustees; and (d) any Trustee may be removed at any special meeting of shareholders by a two-thirds vote of the outstanding voting securities of the trust. Each Trustee who is not an interested person (as defined in the 1940 Act) of the trust and the funds is referred to herein as an Independent Trustee. Each Independent Trustee shall retire not later than the last day of the calendar year in which his or her 75th birthday occurs. The Independent Trustees may waive this mandatory retirement age policy with respect to individual Trustees. Officers and Advisory Board Members hold office without limit in time, except that any officer or Advisory Board Member may resign or may be removed by a vote of a majority of the Trustees at any regular meeting or any special meeting of the Trustees. Except as indicated, each individual has held the office shown or other offices in the same company for the past five years.
Each fund’s Statement of Additional Information (SAI) includes more information about the Trustees. To request a free copy, call Fidelity at 1-800-544-8544.
Experience, Skills, Attributes, and Qualifications of the Trustees. The Governance and Nominating Committee has adopted a statement of policy that describes the experience, qualifications, attributes, and skills that are necessary and desirable for potential Independent Trustee candidates (Statement of Policy). The Board believes that each Trustee satisfied at the time he or she was initially elected or appointed a Trustee, and continues to satisfy, the standards contemplated by the Statement of Policy. The Governance and Nominating Committee also engages professional search firms to help identify potential Independent Trustee candidates who have the experience, qualifications, attributes, and skills consistent with the Statement of Policy. From time to time, additional criteria based on the composition and skills of the current Independent Trustees, as well as experience or skills that may be appropriate in light of future changes to board composition, business conditions, and regulatory or other developments, have also been considered by the professional search firms and the Governance and Nominating Committee. In addition, the Board takes into account the Trustees' commitment and participation in Board and committee meetings, as well as their leadership of standing and ad hoc committees throughout their tenure.
In determining that a particular Trustee was and continues to be qualified to serve as a Trustee, the Board has considered a variety of criteria, none of which, in isolation, was controlling. The Board believes that, collectively, the Trustees have balanced and diverse experience, qualifications, attributes, and skills, which allow the Board to operate effectively in governing each fund and protecting the interests of shareholders. Information about the specific experience, skills, attributes, and qualifications of each Trustee, which in each case led to the Board's conclusion that the Trustee should serve (or continue to serve) as a trustee of the funds, is provided below.
Board Structure and Oversight Function. James C. Curvey is an interested person and currently serves as Chairman. The Trustees have determined that an interested Chairman is appropriate and benefits shareholders because an interested Chairman has a personal and professional stake in the quality and continuity of services provided to the funds. Independent Trustees exercise their informed business judgment to appoint an individual of their choosing to serve as Chairman, regardless of whether the Trustee happens to be independent or a member of management. The Independent Trustees have determined that they can act independently and effectively without having an Independent Trustee serve as Chairman and that a key structural component for assuring that they are in a position to do so is for the Independent Trustees to constitute a substantial majority for the Board. The Independent Trustees also regularly meet in executive session. Ned C. Lautenbach serves as Chairman of the Independent Trustees and as such (i) acts as a liaison between the Independent Trustees and management with respect to matters important to the Independent Trustees and (ii) with management prepares agendas for Board meetings.
Fidelity® funds are overseen by different Boards of Trustees. The funds' Board oversees Fidelity's high income and certain equity funds, and other Boards oversee Fidelity's investment-grade bond, money market, asset allocation, and other equity funds. The asset allocation funds may invest in Fidelity® funds overseen by the funds' Board. The use of separate Boards, each with its own committee structure, allows the Trustees of each group of Fidelity® funds to focus on the unique issues of the funds they oversee, including common research, investment, and operational issues. On occasion, the separate Boards establish joint committees to address issues of overlapping consequences for the Fidelity® funds overseen by each Board.
The Trustees operate using a system of committees to facilitate the timely and efficient consideration of all matters of importance to the Trustees, each fund, and fund shareholders and to facilitate compliance with legal and regulatory requirements and oversight of the funds' activities and associated risks. The Board, acting through its committees, has charged FMR and its affiliates with (i) identifying events or circumstances the occurrence of which could have demonstrably adverse effects on the funds' business and/or reputation; (ii) implementing processes and controls to lessen the possibility that such events or circumstances occur or to mitigate the effects of such events or circumstances if they do occur; and (iii) creating and maintaining a system designed to evaluate continuously business and market conditions in order to facilitate the identification and implementation processes described in (i) and (ii) above. Because the day-to-day operations and activities of the funds are carried out by or through FMR, its affiliates, and other service providers, the funds' exposure to risks is mitigated but not eliminated by the processes overseen by the Trustees. While each of the Board's committees has responsibility for overseeing different aspects of the funds' activities, oversight is exercised primarily through the Operations, Audit, and Compliance Committees. In addition, the Independent Trustees have worked with Fidelity to enhance the Board's oversight of investment and financial risks, legal and regulatory risks, technology risks, and operational risks, including the development of additional risk reporting to the Board. Appropriate personnel, including but not limited to the funds' Chief Compliance Officer (CCO), FMR's internal auditor, the independent accountants, the funds' Treasurer and portfolio management personnel, make periodic reports to the Board's committees, as appropriate, including an annual review of Fidelity's risk management program for the Fidelity® funds. The responsibilities of each standing committee, including their oversight responsibilities, are described further under "Standing Committees of the Trustees."
Interested Trustees*:
Correspondence intended for a Trustee who is an interested person may be sent to Fidelity Investments, 245 Summer Street, Boston, Massachusetts 02210.
Name, Year of Birth; Principal Occupations and Other Relevant Experience+
Jonathan Chiel (1957)
Year of Election or Appointment: 2016
Trustee
Mr. Chiel also serves as Trustee of other Fidelity® funds. Mr. Chiel is Executive Vice President and General Counsel for FMR LLC (diversified financial services company, 2012-present). Previously, Mr. Chiel served as general counsel (2004-2012) and senior vice president and deputy general counsel (2000-2004) for John Hancock Financial Services; a partner with Choate, Hall & Stewart (1996-2000) (law firm); and an Assistant United States Attorney for the United States Attorney’s Office of the District of Massachusetts (1986-95), including Chief of the Criminal Division (1993-1995). Mr. Chiel is a director on the boards of the Boston Bar Foundation and the Maimonides School.
James C. Curvey (1935)
Year of Election or Appointment: 2007
Trustee
Chairman of the Board of Trustees
Mr. Curvey also serves as Trustee of other Fidelity® funds. Mr. Curvey is Vice Chairman (2007-present) and Director of FMR LLC (diversified financial services company). In addition, Mr. Curvey is an Overseer Emeritus for the Boston Symphony Orchestra, a Director of Artis-Naples, and a Trustee of Brewster Academy in Wolfeboro, New Hampshire. Previously, Mr. Curvey served as a Director of Fidelity Research & Analysis Co. (investment adviser firm, 2009-2018), Director of Fidelity Investments Money Management, Inc. (investment adviser firm, 2009-2014) and a Director of FMR and FMR Co., Inc. (investment adviser firms, 2007-2014).
Charles S. Morrison (1960)
Year of Election or Appointment: 2014
Trustee
Mr. Morrison also serves as Trustee of other funds. He serves as President of Fidelity SelectCo, LLC (investment adviser firm, 2017-present) and Fidelity Management & Research Company (FMR) (investment adviser firm, 2016-present), a Director of Fidelity Investments Money Management, Inc. (FIMM) (investment adviser firm, 2014-present), Director of Fidelity SelectCo, LLC (investment adviser firm, 2014-present), President, Asset Management (2014-present), and is an employee of Fidelity Investments. Previously, Mr. Morrison served as Vice President of Fidelity's Fixed Income and Asset Allocation Funds (2012-2014), President, Fixed Income (2011-2014), Vice President of Fidelity's Money Market Funds (2005-2009), President, Money Market Group Leader of FMR (investment adviser firm, 2009), and Senior Vice President, Money Market Group of FMR (2004-2009). Mr. Morrison also served as Vice President of Fidelity's Bond Funds (2002-2005), certain Balanced Funds (2002-2005), and certain Asset Allocation Funds (2002-2007), and as Senior Vice President (2002-2005) of Fidelity's Bond Division.
* Determined to be an “Interested Trustee” by virtue of, among other things, his or her affiliation with the trust or various entities under common control with FMR.
+ The information includes the Trustee's principal occupation during the last five years and other information relating to the experience, attributes, and skills relevant to the Trustee's qualifications to serve as a Trustee, which led to the conclusion that the Trustee should serve as a Trustee for each fund.
Independent Trustees:
Correspondence intended for an Independent Trustee may be sent to Fidelity Investments, P.O. Box 55235, Boston, Massachusetts 02205-5235.
Name, Year of Birth; Principal Occupations and Other Relevant Experience+
Dennis J. Dirks (1948)
Year of Election or Appointment: 2005
Trustee
Mr. Dirks also serves as Trustee of other Fidelity® funds. Prior to his retirement in May 2003, Mr. Dirks was Chief Operating Officer and a member of the Board of The Depository Trust & Clearing Corporation (DTCC). He also served as President, Chief Operating Officer, and Board member of The Depository Trust Company (DTC) and President and Board member of the National Securities Clearing Corporation (NSCC). In addition, Mr. Dirks served as Chief Executive Officer and Board member of the Government Securities Clearing Corporation, Chief Executive Officer and Board member of the Mortgage-Backed Securities Clearing Corporation, as a Trustee and a member of the Finance Committee of Manhattan College (2005-2008), as a Trustee and a member of the Finance Committee of AHRC of Nassau County (2006-2008), as a member of the Independent Directors Council (IDC) Governing Council (2010-2015), and as a member of the Board of Directors for The Brookville Center for Children’s Services, Inc. (2009-2017). Mr. Dirks is a member of the Finance Committee (2016-present), Board of Directors (2017-present) and Board of Trustees (2018-present) and is Treasurer (2018-present) of the Asolo Repertory Theatre.
Donald F. Donahue (1950)
Year of Election or Appointment: 2018
Trustee
Mr. Donahue also serves as a Trustee of other Fidelity® funds. Mr. Donahue is President and Chief Executive Officer of Miranda Partners, LLC (risk consulting for the financial services industry, 2012-present). Previously, Mr. Donahue served as a Member of the Advisory Board of certain Fidelity® funds (2015-2018) and Chief Executive Officer (2006-2012), Chief Operating Officer (2003-2006), and Managing Director, Customer Marketing and Development (1999-2003) of The Depository Trust & Clearing Corporation (financial markets infrastructure). Mr. Donahue serves as a Member (2007-present) and Co-Chairman (2016-present) of the Board of Directors of United Way of New York, Member of the Board of Directors of NYC Leadership Academy (2012-present) and Member of the Board of Advisors of Ripple Labs, Inc. (financial services, 2015-present). He also served as Chairman (2010-2012) and Member of the Board of Directors (2012-2013) of Omgeo, LLC (financial services), Treasurer of United Way of New York (2012-2016), and Member of the Board of Directors of XBRL US (financial services non-profit, 2009-2012) and the International Securities Services Association (2009-2012).
Alan J. Lacy (1953)
Year of Election or Appointment: 2008
Trustee
Mr. Lacy also serves as Trustee of other Fidelity® funds. Mr. Lacy serves as a Director of Bristol-Myers Squibb Company (global pharmaceuticals, 2008-present). He is a Trustee of the California Chapter of The Nature Conservancy (2015-present) and a Director of the Center for Advanced Study in the Behavioral Sciences at Stanford University (2015-present). In addition, Mr. Lacy served as Senior Adviser (2007-2014) of Oak Hill Capital Partners, L.P. (private equity) and also served as Chief Executive Officer (2005) and Vice Chairman (2005-2006) of Sears Holdings Corporation (retail) and Chief Executive Officer and Chairman of the Board of Sears, Roebuck and Co. (retail, 2000-2005). Previously, Mr. Lacy served as Chairman (2014-2017) and a member (2010-2017) of the Board of Directors of Dave & Buster’s Entertainment, Inc. (restaurant and entertainment complexes), as Chairman (2008-2011) and a member (2006-2015) of the Board of Trustees of the National Parks Conservation Association, and as a member of the Board of Directors for The Hillman Companies, Inc. (hardware wholesalers, 2010-2014), Earth Fare, Inc. (retail grocery, 2010-2014), and The Western Union Company (global money transfer, 2006-2011).
Ned C. Lautenbach (1944)
Year of Election or Appointment: 2000
Trustee
Chairman of the Independent Trustees
Mr. Lautenbach also serves as Trustee of other Fidelity® funds. Mr. Lautenbach currently serves as Vice Chair of the Board of Governors, State University System of Florida (2013-present) and is a member of the Council on Foreign Relations (1994-present). He is also a member and has most recently served as Chairman of the Board of Directors of Artis-Naples (2012-present). Previously, Mr. Lautenbach served as a member and then Lead Director of the Board of Directors of Eaton Corporation (diversified industrial, 1997-2016). He was also a Partner and Advisory Partner at Clayton, Dubilier & Rice, LLC (private equity investment, 1998-2010), as well as a Director of Sony Corporation (2006-2007). In addition, Mr. Lautenbach also had a 30-year career with IBM (technology company) during which time he served as Senior Vice President and a member of the Corporate Executive Committee (1968-1998).
Joseph Mauriello (1944)
Year of Election or Appointment: 2008
Trustee
Mr. Mauriello also serves as Trustee of other Fidelity® funds. Prior to his retirement in January 2006, Mr. Mauriello served in numerous senior management positions including Deputy Chairman and Chief Operating Officer (2004-2005), and Vice Chairman of Financial Services (2002-2004) of KPMG LLP US (professional services, 1965-2005). Mr. Mauriello currently serves as a member of the Independent Directors Council (IDC) Governing Council (2015-present). Previously, Mr. Mauriello served as a member of the Board of Directors of XL Group plc. (global insurance and re-insurance, 2006-2018).
Cornelia M. Small (1944)
Year of Election or Appointment: 2005
Trustee
Ms. Small also serves as Trustee of other Fidelity® funds. Ms. Small is a member of the Board of Directors (2009-present) and Chair of the Investment Committee (2010-present) of the Teagle Foundation. Ms. Small also serves on the Investment Committee of the Berkshire Taconic Community Foundation (2008-present). Previously, Ms. Small served as Chairperson (2002-2008) and a member of the Investment Committee and Chairperson (2008-2012) and a member of the Board of Trustees of Smith College. In addition, Ms. Small served as Chief Investment Officer, Director of Global Equity Investments, and a member of the Board of Directors of Scudder, Stevens & Clark and Scudder Kemper Investments.
Garnett A. Smith (1947)
Year of Election or Appointment: 2018
Trustee
Mr. Smith also serves as Trustee of other Fidelity® funds. Prior to Mr. Smith's retirement, he served as Chairman and Chief Executive Officer of Inbrand Corp. (manufacturer of personal absorbent products, 1990-1997). He also served as President (1986-1990) of Inbrand Corp. Prior to his employment with Inbrand Corp., he was employed by a retail fabric chain and North Carolina National Bank. In addition, Mr. Smith served as a Member of the Advisory Board of certain Fidelity® funds (2012-2013) and as a board member of the Jackson Hole Land Trust (2009-2012).
David M. Thomas (1949)
Year of Election or Appointment: 2008
Trustee
Mr. Thomas also serves as Trustee of other Fidelity® funds. Mr. Thomas serves as Non-Executive Chairman of the Board of Directors of Fortune Brands Home and Security (home and security products, 2011-present), as a member of the Board of Directors (2004-present) and Presiding Director (2013-present) of Interpublic Group of Companies, Inc. (marketing communication), and as a member of the Board of Trustees of the University of Florida (2013-present). Previously, Mr. Thomas served as Executive Chairman (2005-2006) and Chairman and Chief Executive Officer (2000-2005) of IMS Health, Inc. (pharmaceutical and healthcare information solutions), and a Director of Fortune Brands, Inc. (consumer products, 2000-2011).
+ The information includes the Trustee's principal occupation during the last five years and other information relating to the experience, attributes, and skills relevant to the Trustee's qualifications to serve as a Trustee, which led to the conclusion that the Trustee should serve as a Trustee for each fund.
Advisory Board Members and Officers:
Correspondence intended for a Member of the Advisory Board (if any) may be sent to Fidelity Investments, P.O. Box 55235, Boston, Massachusetts 02205-5235. Correspondence intended for an officer or Peter S. Lynch may be sent to Fidelity Investments, 245 Summer Street, Boston, Massachusetts 02210. Officers appear below in alphabetical order.
Name, Year of Birth; Principal Occupation
Vicki L. Fuller (1957)
Year of Election or Appointment: 2018
Member of the Advisory Board
Ms. Fuller also serves as Member of the Advisory Board of other Fidelity® funds. Ms. Fuller serves as a member of the Board of Directors, Audit Committee, and Nominating and Governance Committee of The Williams Companies, Inc. (natural gas infrastructure, 2018-present). Previously, Ms. Fuller served as the Chief Investment Officer of the New York State Common Retirement Fund (2012-2018) and held a variety of positions at AllianceBernstein L.P. (global asset management, 1985-2012), including Managing Director (2006-2012) and Senior Vice President and Senior Portfolio Manager (2001-2006).
Peter S. Lynch (1944)
Year of Election or Appointment: 2003
Member of the Advisory Board
Mr. Lynch also serves as Member of the Advisory Board of other Fidelity® funds. Mr. Lynch is Vice Chairman and a Director of FMR (investment adviser firm) and FMR Co., Inc. (investment adviser firm). In addition, Mr. Lynch serves as a Trustee of Boston College and as the Chairman of the Inner-City Scholarship Fund. Previously, Mr. Lynch served on the Special Olympics International Board of Directors (1997-2006).
William S. Stavropoulos (1939)
Year of Election or Appointment: 2018
Member of the Advisory Board
Mr. Stavropoulos also serves as Member of the Advisory Board of other Fidelity® funds. Mr. Stavropoulos serves as President and Founder of the Michigan Baseball Foundation, the Great Lakes Loons (2007-present). Mr. Stavropoulos is Chairman Emeritus of the Board of Directors of The Dow Chemical Company, where he previously served in numerous senior management positions, including President, CEO (1995-2000; 2002-2004), Chairman of the Executive Committee (2000-2006), and as a member of the Board of Directors (1990-2006). Currently, Mr. Stavropoulos is Chairman of the Board of Directors of Univar Inc. (global distributor of commodity and specialty chemicals), a Director of Teradata Corporation (data warehousing and technology solutions), and a member of the Advisory Board for Metalmark Capital LLC (private equity investment, 2005-present). Mr. Stavropoulos is an operating advisor to Clayton, Dubilier & Rice, LLC (private equity investment). In addition, Mr. Stavropoulos is a member of the University of Notre Dame Advisory Council for the College of Science, a Trustee of the Rollin L. Gerstacker Foundation, and a Director of Artis-Naples in Naples, Florida. Previously, Mr. Stavropoulos served as Trustee of certain Fidelity® funds (2001-2018) and as a Director of Chemical Financial Corporation (bank holding company, 1993-2012) and Tyco International, Ltd. (multinational manufacturing and services, 2007-2012).
Carol B. Tomé (1957)
Year of Election or Appointment: 2018
Member of the Advisory Board
Ms. Tomé also serves as Member of the Advisory Board of other Fidelity® funds. Ms. Tomé is Chief Financial Officer (2001-present) and Executive Vice President of Corporate Services (2007-present) of The Home Depot, Inc. (home improvement retailer) and a Director (2003-present) and Chair of the Audit Committee (2004-present) of United Parcel Service, Inc. (package delivery and supply chain management). Previously, Ms. Tomé served as Trustee of certain Fidelity® funds (2017), Senior Vice President of Finance and Accounting/Treasurer (2000-2007) and Vice President and Treasurer (1995-2000) of The Home Depot, Inc. and Chair of the Board (2010-2012), Vice Chair of the Board (2009 and 2013), and a Director (2008-2013) of the Federal Reserve Bank of Atlanta. Ms. Tomé is also a director or trustee of many community and professional organizations.
Michael E. Wiley (1950)
Year of Election or Appointment: 2018
Member of the Advisory Board
Mr. Wiley also serves as Trustee or Member of the Advisory Board of other Fidelity® funds. Mr. Wiley serves as a Director of High Point Resources (exploration and production, 2005-present). Previously, Mr. Wiley served as a Director of Andeavor Corporation (independent oil refiner and marketer, 2005-2018), a Director of Andeavor Logistics LP (natural resources logistics, 2015-2018), a Director of Post Oak Bank (privately-held bank, 2004-2018), a Director of Asia Pacific Exploration Consolidated (international oil and gas exploration and production, 2008-2013), a member of the Board of Trustees of the University of Tulsa (2000-2006; 2007-2010), a Senior Energy Advisor of Katzenbach Partners, LLC (consulting, 2006-2007), an Advisory Director of Riverstone Holdings (private investment), a Director of Spinnaker Exploration Company (exploration and production, 2001-2005) and Chairman, President, and CEO of Baker Hughes, Inc. (oilfield services, 2000-2004).
Elizabeth Paige Baumann (1968)
Year of Election or Appointment: 2017
Anti-Money Laundering (AML) Officer
Ms. Baumann also serves as AML Officer of other funds. She is Chief AML Officer (2012-present) and Senior Vice President (2014-present) of FMR LLC (diversified financial services company) and is an employee of Fidelity Investments. Previously, Ms. Baumann served as AML Officer of the funds (2012-2016), and Vice President (2007-2014) and Deputy Anti-Money Laundering Officer (2007-2012) of FMR LLC.
John J. Burke III (1964)
Year of Election or Appointment: 2018
Chief Financial Officer
Mr. Burke also serves as Chief Financial Officer of other funds. Mr. Burke serves as Head of Investment Operations for Fidelity Fund and Investment Operations (2018-present) and is an employee of Fidelity Investments (1998-present). Previously Mr. Burke served as head of Asset Management Investment Operations (2012-2018).
William C. Coffey (1969)
Year of Election or Appointment: 2018
Secretary and Chief Legal Officer (CLO)
Mr. Coffey also serves as Secretary and CLO of other funds. Mr. Coffey serves as CLO, Secretary, and Senior Vice President of Fidelity Management & Research Company and FMR Co., Inc. (investment adviser firms, 2018-present); Secretary of Fidelity SelectCo, LLC and Fidelity Investments Money Management, Inc. (investment adviser firms, 2018-present); and CLO of Fidelity Management & Research (Hong Kong) Limited, FMR Investment Management (UK) Limited, and Fidelity Management & Research (Japan) Limited (investment adviser firms, 2018-present). He is Senior Vice President and Deputy General Counsel of FMR LLC (diversified financial services company, 2010-present), and is an employee of Fidelity Investments. Previously, Mr. Coffey served as Assistant Secretary of certain funds (2009-2018) and as Vice President and Associate General Counsel of FMR LLC (2005-2009).
Timothy M. Cohen (1969)
Year of Election or Appointment: 2018
Vice President
Mr. Cohen also serves as Vice President of other funds. Mr. Cohen serves as Co-Head of Global Equity Research (2016-present), a Director of Fidelity Management & Research (Japan) Limited (investment adviser firm, 2016-present), and is an employee of Fidelity Investments. Previously, Mr. Cohen served as Chief Investment Officer - Equity and a Director of Fidelity Management & Research (U.K.) Inc. (investment adviser firm, 2013-2015) and as a Director of Fidelity Management & Research (Hong Kong) Limited (investment adviser firm, 2017).
Jonathan Davis (1968)
Year of Election or Appointment: 2010
Assistant Treasurer
Mr. Davis also serves as Assistant Treasurer of other funds. Mr. Davis serves as Assistant Treasurer of FMR Capital, Inc. (2017-present) and is an employee of Fidelity Investments. Previously, Mr. Davis served as Vice President and Associate General Counsel of FMR LLC (diversified financial services company, 2003-2010).
Adrien E. Deberghes (1967)
Year of Election or Appointment: 2016
Assistant Treasurer
Mr. Deberghes also serves as an officer of other funds. He serves as Assistant Treasurer of FMR Capital, Inc. (2017-present), Executive Vice President of Fidelity Investments Money Management, Inc. (FIMM) (investment adviser firm, 2016-present), and is an employee of Fidelity Investments (2008-present). Previously, Mr. Deberghes served as President and Treasurer of certain Fidelity® funds (2013-2018). Prior to joining Fidelity Investments, Mr. Deberghes was Senior Vice President of Mutual Fund Administration at State Street Corporation (2007-2008), Senior Director of Mutual Fund Administration at Investors Bank & Trust (2005-2007), and Director of Finance for Dunkin' Brands (2000-2005). Previously, Mr. Deberghes served in other fund officer roles.
Laura M. Del Prato (1964)
Year of Election or Appointment: 2018
Assistant Treasurer
Ms. Del Prato also serves as an officer of other funds. Ms. Del Prato is an employee of Fidelity Investments (2017-present). Prior to joining Fidelity Investments, Ms. Del Prato served as a Managing Director and Treasurer of the JPMorgan Mutual Funds (2014-2017). Prior to JPMorgan, Ms. Del Prato served as a partner at Cohen Fund Audit Services (accounting firm, 2012-2013) and KPMG LLP (accounting firm, 2004-2012).
Colm A. Hogan (1973)
Year of Election or Appointment: 2016
Deputy Treasurer
Mr. Hogan also serves as an officer of other funds. Mr. Hogan serves as Assistant Treasurer of FMR Capital, Inc. (2017-present) and is an employee of Fidelity Investments (2005-present). Previously, Mr. Hogan served as Assistant Treasurer of certain Fidelity® funds (2016-2018).
Pamela R. Holding (1964)
Year of Election or Appointment: 2018
Vice President
Ms. Holding also serves as Vice President of other funds. Ms. Holding serves as Co-Head of Global Equity Research (2018-present) and is an employee of Fidelity Investments (2013-present).
Chris Maher (1972)
Year of Election or Appointment: 2013
Assistant Treasurer
Mr. Maher serves as Assistant Treasurer of other funds. Mr. Maher is Vice President of Valuation Oversight, serves as Assistant Treasurer of FMR Capital, Inc. (2017-present), and is an employee of Fidelity Investments. Previously, Mr. Maher served as Vice President of Asset Management Compliance (2013), Vice President of the Program Management Group of FMR (investment adviser firm, 2010-2013), and Vice President of Valuation Oversight (2008-2010).
Rieco E. Mello (1969)
Year of Election or Appointment: 2017
Assistant Treasurer
Mr. Mello also serves as Assistant Treasurer of other funds. Mr. Mello serves as Assistant Treasurer of FMR Capital, Inc. (2017-present) and is an employee of Fidelity Investments (1995-present).
Kenneth B. Robins (1969)
Year of Election or Appointment: 2016
Chief Compliance Officer
Mr. Robins also serves as an officer of other funds. Mr. Robins serves as Compliance Officer of Fidelity Management & Research Company and FMR Co., Inc. (investment adviser firms, 2016-present) and is an employee of Fidelity Investments (2004-present). Previously, Mr. Robins served as Executive Vice President of Fidelity Investments Money Management, Inc. (investment adviser firm, 2013-2016) and served in other fund officer roles.
Stacie M. Smith (1974)
Year of Election or Appointment: 2016
President and Treasurer
Ms. Smith also serves as an officer of other funds. Ms. Smith serves as Assistant Treasurer of FMR Capital, Inc. (2017-present), is an employee of Fidelity Investments (2009-present), and has served in other fund officer roles. Prior to joining Fidelity Investments, Ms. Smith served as Senior Audit Manager of Ernst & Young LLP (accounting firm, 1996-2009). Previously, Ms. Smith served as Assistant Treasurer (2013-2018) and Deputy Treasurer (2013-2016) of certain Fidelity® funds.
Marc L. Spector (1972)
Year of Election or Appointment: 2016
Assistant Treasurer
Mr. Spector also serves as an officer of other funds. Mr. Spector serves as Assistant Treasurer of FMR Capital, Inc. (2017-present) and is an employee of Fidelity Investments (2016-present). Prior to joining Fidelity Investments, Mr. Spector served as Director at the Siegfried Group (accounting firm, 2013-2016), and prior to Siegfried Group as audit senior manager at Deloitte & Touche (accounting firm, 2005-2013).
Shareholder Expense Example
As a shareholder of a Fund, you incur two types of costs: (1) transaction costs, including sales charges (loads) on purchase payments or redemption proceeds, and (2) ongoing costs, including management fees, distribution and/or service (12b-1) fees and other Fund expenses. This Example is intended to help you understand your ongoing costs (in dollars) of investing in the Funds and to compare these costs with the ongoing costs of investing in other mutual funds.
The actual expense Example is based on an investment of $1,000 invested at the beginning of the period and held for the entire period (May 1, 2018 to October 31, 2018) for each Class, except Class Z, and for the period (October 2, 2018 to October 31, 2018) for Class Z. The hypothetical expense Example is based on an investment of $1,000 invested for the one-half year period (May 1, 2018 to October 31, 2018).
Actual Expenses
The first line of the accompanying table for each Class of each fund provides information about actual account values and actual expenses. You may use the information in this line, together with the amount you invested, to estimate the expenses that you paid over the period. Simply divide your account value by $1,000.00 (for example, an $8,600 account value divided by $1,000.00 = 8.6), then multiply the result by the number in the first line for a Class of the fund under the heading entitled "Expenses Paid During Period" to estimate the expenses you paid on your account during this period. A small balance maintenance fee of $12.00 that is charged once a year may apply for certain accounts with a value of less than $2,000. This fee, which was eliminated effective August 1, 2018, is not included in the table below. If it was, the estimate of expenses you paid during the period would be higher, and your ending account value lower, by this amount. In addition, each Fund, as a shareholder in the underlying Fidelity Central Funds, will indirectly bear its pro-rata share of the fees and expenses incurred by the underlying Fidelity Central Funds. These fees and expenses are not included in the Fund's annualized expense ratio used to calculate the expense estimate in the table below.
Hypothetical Example for Comparison Purposes
The second line of the accompanying table for each Class of each fund provides information about hypothetical account values and hypothetical expenses based on a Class' actual expense ratio and an assumed rate of return of 5% per year before expenses, which is not the Class' actual return. The hypothetical account values and expenses may not be used to estimate the actual ending account balance or expenses you paid for the period. You may use this information to compare the ongoing costs of investing in the Fund and other funds. To do so, compare this 5% hypothetical example with the 5% hypothetical examples that appear in the shareholder reports of the other funds. A small balance maintenance fee of $12.00 that is charged once a year may apply for certain accounts with a value of less than $2,000. This fee, which was eliminated effective August 1, 2018, is not included in the table below. If it was, the estimate of expenses you paid during the period would be higher, and your ending account value lower, by this amount. In addition, each Fund, as a shareholder in the underlying Fidelity Central Funds, will indirectly bear its pro-rata share of the fees and expenses incurred by the underlying Fidelity Central Funds. These fees and expenses are not included in the Fund's annualized expense ratio used to calculate the expense estimate in the table below.
Please note that the expenses shown in the table are meant to highlight your ongoing costs only and do not reflect any transaction costs. Therefore, the second line of the table is useful in comparing ongoing costs only, and will not help you determine the relative total costs of owning different funds. In addition, if these transactional costs were included, your costs would have been higher.
| | Annualized Expense Ratio-A | Beginning
Account Value | Ending
Account Value
October 31, 2018 | Expenses Paid
During Period |
| Diversified International | | | | |
| Diversified International | .77% | | | |
| Actual | | $1,000.00 | $901.30 | $3.69-B |
| Hypothetical-C | | $1,000.00 | $1,021.32 | $3.92-D |
| Class K | .64% | | | |
| Actual | | $1,000.00 | $901.90 | $3.07-B |
| Hypothetical-C | | $1,000.00 | $1,021.98 | $3.26-D |
| International Cap Appreciation | 1.05% | | | |
| Actual | | $1,000.00 | $899.40 | $5.03-B |
| Hypothetical-C | | $1,000.00 | $1,019.91 | $5.35-D |
| Overseas | | | | |
| Overseas | .95% | | | |
| Actual | | $1,000.00 | $908.60 | $4.57-B |
| Hypothetical-C | | $1,000.00 | $1,020.42 | $4.84-D |
| Class K | .83% | | | |
| Actual | | $1,000.00 | $909.20 | $3.99-B |
| Hypothetical-C | | $1,000.00 | $1,021.02 | $4.23-D |
| Worldwide | | | | |
| Class A | 1.24% | | | |
| Actual | | $1,000.00 | $986.60 | $6.21-B |
| Hypothetical-C | | $1,000.00 | $1,018.95 | $6.31-D |
| Class M | 1.52% | | | |
| Actual | | $1,000.00 | $985.10 | $7.61-B |
| Hypothetical-C | | $1,000.00 | $1,017.54 | $7.73-D |
| Class C | 2.01% | | | |
| Actual | | $1,000.00 | $982.50 | $10.04-B |
| Hypothetical-C | | $1,000.00 | $1,015.07 | $10.21-D |
| Worldwide | .96% | | | |
| Actual | | $1,000.00 | $987.90 | $4.81-B |
| Hypothetical-C | | $1,000.00 | $1,020.37 | $4.89-D |
| Class I | .96% | | | |
| Actual | | $1,000.00 | $987.80 | $4.81-B |
| Hypothetical-C | | $1,000.00 | $1,020.37 | $4.89-D |
| Class Z | .87% | | | |
| Actual | | $1,000.00 | $906.60 | $.68-E |
| Hypothetical-C | | $1,000.00 | $1,020.82 | $4.43-D |
A Annualized expense ratio reflects expenses net of applicable fee waivers.
B Actual expenses are equal to each Class' annualized expense ratio, multiplied by the average account value over the period, multiplied by 184/365 (to reflect the one-half year period).
C 5% return per year before expenses
D Hypothetical expenses are equal to each Class' annualized expense ratio, multiplied by the average account value over the period, multiplied by 184/365 (to reflect the one-half year period)
E Actual expenses are equal to the Class' annualized expense ratio, multiplied by the average account value over the period, multiplied by 30/365 (to reflect the period October 2, 2018 to October 31, 2018.
Distributions (Unaudited)
The Board of Trustees of each fund voted to pay to shareholders of record at the opening of business on record date, the following distributions per share derived from capital gains realized from sales of portfolio securities and dividends derived from net investment income:
| | Pay Date | Record Date | Dividends | Capital Gains |
| Fidelity Diversified International Fund | | | | |
| Diversified International | 12/10/18 | 12/07/18 | $0.428 | $1.890 |
| Class K | 12/10/18 | 12/07/18 | $0.473 | $1.890 |
| Fidelity International Capital Appreciation Fund | 12/10/18 | 12/07/18 | $0.083 | $0.451 |
| Fidelity Overseas Fund | | | | |
| Overseas | 12/10/18 | 12/07/18 | $0.678 | $1.744 |
| Class K | 12/10/18 | 12/07/18 | $0.733 | $1.744 |
| Fidelity Worldwide Fund | | | | |
| Class A | 12/10/18 | 12/07/18 | $0.015 | $2.140 |
| Class M | 12/10/18 | 12/07/18 | $0.000 | $2.140 |
| Class C | 12/10/18 | 12/07/18 | $0.000 | $2.140 |
| Worldwide | 12/10/18 | 12/07/18 | $0.085 | $2.140 |
| Class I | 12/10/18 | 12/07/18 | $0.093 | $2.140 |
| Class Z | 12/10/18 | 12/07/18 | $0.127 | $2.140 |
|
The funds hereby designate as capital gain dividend the amounts noted below for the taxable year ended October 31, 2018, or, if subsequently determined to be different, the net capital gain of such year.
| Fidelity Diversified International Fund | $870,816,242 |
| Fidelity International Capital Appreciation Fund | $64,510,649 |
| Fidelity Overseas Fund | $256,694,922 |
| Fidelity Worldwide Fund | $192,777,005 |
|
A percentage of the dividends distributed during the fiscal year for the following funds qualify for the dividends–received deduction for corporate shareholders:
| | Class A | Class M | Retail Class | Class I | Class K |
| Fidelity Diversified International Fund | | | | | |
| December, 2017 | – | – | 9% | – | 8% |
| Fidelity International Capital Appreciation Fund | | | | | |
| December, 2017 | – | – | 15% | – | – |
| September, 2018 | – | – | 100% | – | – |
| Fidelity Overseas Fund | | | | | |
| December, 2017 | – | – | 2% | – | 2% |
| Fidelity Worldwide Fund | | | | | |
| December, 2017 | 100% | 100% | 75% | 74% | – |
|
A percentage of the dividends distributed during the fiscal year for the following funds may be taken into account as a dividend for purposes of the maximum rate under section 1(h)(11) of the Internal Revenue Code.
| | Class A | Class M | Retail Class | Class I | Class K |
| Fidelity Diversified International Fund | | | | | |
| December, 2017 | – | – | 100% | – | 100% |
| Fidelity International Capital Appreciation Fund | | | | | |
| December, 2017 | – | – | 100% | – | – |
| September, 2018 | – | – | 100% | – | – |
| Fidelity Overseas Fund | | | | | |
| December, 2017 | – | – | 100% | – | 100% |
| Fidelity Worldwide Fund | | | | | |
| December, 2017 | 100% | 100% | 100% | 100% | – |
|
The amounts per share which represent income derived from sources within, and taxes paid to, foreign countries or possessions of the United States are as follows:
| | Pay Date | Income | Taxes |
| Fidelity Diversified International Fund | | | |
| Diversified International | 12/11/17 | $0.5088 | $0.0498 |
| Class K | 12/11/17 | $0.5558 | $0.0498 |
| Fidelity International Capital Appreciation Fund | 12/11/17 | $0.0910 | $0.0220 |
| Fidelity Overseas Fund | | | |
| Overseas | 12/11/17 | $0.6076 | $0.0566 |
| Class K | 12/11/17 | $0.6596 | $0.0566 |
|
The funds will notify shareholders in January 2019 of amounts for use in preparing 2018 income tax returns.
Board Approval of Investment Advisory Contracts
Broadly Diversified International Equity Funds
At its July 2018 meeting, the Board of Trustees, including the Independent Trustees (together, the Board), voted to continue the management contracts with Fidelity Management & Research Company (FMR) and the sub-advisory agreements (together, the Advisory Contracts) for the funds for six months through January 31, 2019, in connection with the reunification of the Fidelity Equity High Income Funds Board, which oversees the funds, and the Sector Portfolios Board.
The Board considered that the approval of the funds' Advisory Contracts will not result in any changes in (i) the investment process or strategies employed in the management of the funds' assets; (ii) the fees and expenses paid by shareholders; (iii) the nature, extent or quality of services provided under the funds' Advisory Contracts; or (iv) the day-to-day management of each fund or the persons primarily responsible for such management. The Board concluded that the funds' Advisory Contracts are fair and reasonable, and that the funds' Advisory Contracts should be renewed, without modification, through January 31, 2019, with the understanding that the Board will consider the annual renewal for a full one year period in January 2019.
In connection with its consideration of future renewals of the funds' Advisory Contracts, the Board will consider: (i) the nature, extent and quality of services provided to the funds, including shareholder and administrative services and investment performance; (ii) the competitiveness of the management fee and total expenses for each fund; (iii) the costs of the services and profitability, including the revenues earned and the expenses incurred in conducting the business of developing, marketing, distributing, managing, administering, and servicing each fund and its shareholders, to the extent applicable, as well as potential fall-out benefits from Fidelity's non-fund businesses; and (iv) whether there have been economies of scale in respect of the Fidelity funds, whether the Fidelity funds (including the funds) have appropriately benefited from any such economies of scale, and whether there is the potential for realization of any further economies.
Based on its evaluation of all of the conclusions noted above, and after considering all factors it believed relevant, the Board ultimately concluded that the funds' management fee structures are fair and reasonable, and that the continuation of the funds' Advisory Contracts should be approved.
Corporate Headquarters
245 Summer St.
Boston, MA 02210
www.fidelity.com
IBD-ANN-1218
1.754543.118
Item 2.
Code of Ethics
As of the end of the period, October 31, 2018, Fidelity Investment Trust (the trust) has adopted a code of ethics, as defined in Item 2 of Form N-CSR, that applies to its President and Treasurer and its Chief Financial Officer. A copy of the code of ethics is filed as an exhibit to this Form N-CSR.
Item 3.
Audit Committee Financial Expert
The Board of Trustees of the trust has determined that Joseph Mauriello is an audit committee financial expert, as defined in Item 3 of Form N-CSR. Mr. Mauriello is independent for purposes of Item 3 of Form N-CSR.
Item 4.
Principal Accountant Fees and Services
Fees and Services
The following table presents fees billed by Deloitte & Touche LLP, the member firms of Deloitte Touche Tohmatsu, and their respective affiliates (collectively, “Deloitte Entities”) in each of the last two fiscal years for services rendered to Fidelity Diversified International Fund, Fidelity International Capital Appreciation Fund and Fidelity Worldwide Fund (the “Funds”):
Services Billed by Deloitte Entities
October 31, 2018 FeesA
| | | | |
| Audit Fees | Audit-Related Fees | Tax Fees | All Other Fees |
Fidelity Diversified International Fund | $81,000 | $100 | $7,400 | $1,900 |
Fidelity International Capital Appreciation Fund | $54,000 | $100 | $7,100 | $1,600 |
Fidelity Worldwide Fund | $52,000 | $100 | $6,400 | $1,500 |
| | | | |
| Audit Fees | Audit-Related Fees | Tax Fees | All Other Fees |
Fidelity Diversified International Fund | $100,000 | $200 | $7,400 | $2,700 |
Fidelity International Capital Appreciation Fund | $56,000 | $100 | $7,200 | $1,600 |
Fidelity Worldwide Fund | $52,000 | $100 | $6,100 | $1,500 |
A Amounts may reflect rounding.
The following table presents fees billed by PricewaterhouseCoopers LLP (“PwC”) in each of the last two fiscal years for services rendered to Fidelity Overseas Fund (the “Fund”):
Services Billed by PwC
October 31, 2018 FeesA
| | | | |
| Audit Fees | Audit-Related Fees | Tax Fees | All Other Fees |
Fidelity Overseas Fund | $65,000 | $5,700 | $5,400 | $2,800 |
| | | | |
| Audit Fees | Audit-Related Fees | Tax Fees | All Other Fees |
Fidelity Overseas Fund | $65,000 | $6,200 | $5,700 | $3,000 |
A Amounts may reflect rounding.
The following table presents fees billed by PwC and Deloitte Entities that were required to be approved by the Audit Committee for services that relate directly to the operations and financial reporting of the Funds and that are rendered on behalf of Fidelity Management & Research Company (“FMR”) and entities controlling, controlled by, or under common control with FMR (not including any sub-adviser whose role is primarily portfolio management and is subcontracted with or overseen by another investment adviser) that provide ongoing services to the Funds (“Fund Service Providers”):
Services Billed by Deloitte Entities
| | |
| October 31, 2018A | October 31, 2017A |
Audit-Related Fees | $290,000 | $- |
Tax Fees | $5,000 | $25,000 |
All Other Fees | $- | $- |
A Amounts may reflect rounding.
Services Billed by PwC
| | |
| October 31, 2018A | October 31, 2017A |
Audit-Related Fees | $7,745,000 | $12,525,000 |
Tax Fees | $20,000 | $155,000 |
All Other Fees | $- | $- |
A Amounts may reflect rounding.
“Audit-Related Fees” represent fees billed for assurance and related services that are reasonably related to the performance of the fund audit or the review of the fund's financial statements and that are not reported under Audit Fees.
“Tax Fees” represent fees billed for tax compliance, tax advice or tax planning that relate directly to the operations and financial reporting of the fund.
“All Other Fees” represent fees billed for services provided to the fund or Fund Service Provider, a significant portion of which are assurance related, that relate directly to the operations and financial reporting of the fund, excluding those services that are reported under Audit Fees, Audit-Related Fees or Tax Fees.
Assurance services must be performed by an independent public accountant.
* * *
The aggregate non-audit fees billed by PwC and Deloitte Entities for services rendered to the Funds, FMR (not including any sub-adviser whose role is primarily portfolio management and is subcontracted with or overseen by another investment adviser), and any Fund Service Provider for each of the last two fiscal years of the Funds are as follows:
| | |
Billed By | October 31, 2018A | October 31, 2017A |
Deloitte Entities | $780,000 | $555,000 |
PwC | $10,775,000 | $15,280,000 |
A Amounts may reflect rounding.
The trust's Audit Committee has considered non-audit services that were not pre-approved that were provided by PwC and Deloitte Entities to Fund Service Providers to be compatible with maintaining the independence of PwC and Deloitte Entities in their audits of the Funds, taking into account representations from PwC and Deloitte Entities, in accordance with Public Company Accounting Oversight Board rules, regarding their independence from the Funds and their related entities and FMR’s review of the appropriateness and permissibility under applicable law of such non-audit services prior to their provision to the Fund Service Providers.
Audit Committee Pre-Approval Policies and Procedures
The trust’s Audit Committee must pre-approve all audit and non-audit services provided by a fund’s independent registered public accounting firm relating to the operations or financial reporting of the fund. Prior to the commencement of any audit or non-audit services to a fund, the Audit Committee reviews the services to determine whether they are appropriate and permissible under applicable law.
The Audit Committee has adopted policies and procedures to, among other purposes, provide a framework for the Committee’s consideration of non-audit services by the audit firms that audit the Fidelity funds. The policies and procedures require that any non-audit service provided by a fund audit firm to a Fidelity fund and any non-audit service provided by a fund auditor to a Fund Service Provider that relates directly to the operations and financial reporting of a Fidelity fund (“Covered Service”) are subject to approval by the Audit Committee before such service is provided.
All Covered Services must be approved in advance of provision of the service either: (i) by formal resolution of the Audit Committee, or (ii) by oral or written approval of the service by the Chair of the Audit Committee (or if the Chair is unavailable, such other member of the Audit Committee as may be designated by the Chair to act in the Chair’s absence). The approval contemplated by (ii) above is permitted where the Treasurer determines that action on such an engagement is necessary before the next meeting of the Audit Committee.
Non-audit services provided by a fund audit firm to a Fund Service Provider that do not relate directly to the operations and financial reporting of a Fidelity fund are reported to the Audit Committee periodically.
Non-Audit Services Approved Pursuant to Rule 2-01(c)(7)(i)(C) and (ii) of Regulation S-X (“De Minimis Exception”)
There were no non-audit services approved or required to be approved by the Audit Committee pursuant to the De Minimis Exception during the Funds’ last two fiscal years relating to services provided to (i) the Funds or (ii) any Fund Service Provider that relate directly to the operations and financial reporting of the Funds.
Item 5.
Audit Committee of Listed Registrants
Not applicable.
Item 6.
Investments
(a)
Not applicable.
(b)
Not applicable
Item 7.
Disclosure of Proxy Voting Policies and Procedures for Closed-End Management Investment Companies
Not applicable.
Item 8.
Portfolio Managers of Closed-End Management Investment Companies
Not applicable.
Item 9.
Purchase of Equity Securities by Closed-End Management Investment Company and Affiliated Purchasers
Not applicable.
Item 10.
Submission of Matters to a Vote of Security Holders
There were no material changes to the procedures by which shareholders may recommend nominees to the trust’s Board of Trustees.
Item 11.
Controls and Procedures
(a)(i) The President and Treasurer and the Chief Financial Officer have concluded that the trust’s disclosure controls and procedures (as defined in Rule 30a-3(c) under the Investment Company Act) provide reasonable assurances that material information relating to the trust is made known to them by the appropriate persons, based on their evaluation of these controls and procedures as of a date within 90 days of the filing date of this report.
(a)(ii) There was no change in the trust’s internal control over financial reporting (as defined in Rule 30a-3(d) under the Investment Company Act) that occurred during the period covered by this report that has materially affected, or is reasonably likely to materially affect, the trust’s internal control over financial reporting.
Item 12.
Disclosure of Securities Lending Activities for Closed-End Management
Investment Companies
Not applicable.
Item 13.
Exhibits
| | |
(a) | (1) | Code of Ethics pursuant to Item 2 of Form N-CSR is filed and attached hereto as EX-99.CODE ETH. |
(a) | (2) | Certification pursuant to Rule 30a-2(a) under the Investment Company Act of 1940 (17 CFR 270.30a-2(a)) is filed and attached hereto as Exhibit 99.CERT. |
(a) | (3) | Not applicable. |
(b) |
| Certification pursuant to Rule 30a-2(b) under the Investment Company Act of 1940 (17 CFR 270.30a-2(b)) is furnished and attached hereto as Exhibit 99.906CERT. |
SIGNATURES
Pursuant to the requirements of the Securities Exchange Act of 1934 and the Investment Company Act of 1940, the registrant has duly caused this report to be signed on its behalf by the undersigned, thereunto duly authorized.
Fidelity Investment Trust
| |
By: | /s/Stacie M. Smith |
| Stacie M. Smith |
| President and Treasurer |
|
|
Date: | December 26, 2018 |
Pursuant to the requirements of the Securities Exchange Act of 1934 and the Investment Company Act of 1940, this report has been signed below by the following persons on behalf of the registrant and in the capacities and on the dates indicated.
| |
By: | /s/Stacie M. Smith |
| Stacie M. Smith |
| President and Treasurer |
|
|
Date: | December 26, 2018 |
| |
By: | /s/John J. Burke III |
| John J. Burke III |
| Chief Financial Officer |
|
|
Date: | December 26, 2018 |