UNITED STATES
SECURITIES AND EXCHANGE COMMISSION
Washington, D.C. 20549
FORM N-CSR
CERTIFIED SHAREHOLDER REPORT OF REGISTERED
MANAGEMENT INVESTMENT COMPANIES
Investment Company Act file number 811-04008
Fidelity Investment Trust
(Exact name of registrant as specified in charter)
245 Summer St., Boston, Massachusetts 02210
(Address of principal executive offices) (Zip code)
Cynthia Lo Bessette, Secretary
245 Summer St.
Boston, Massachusetts 02210
(Name and address of agent for service)
Registrant's telephone number, including area code:
617-563-7000
| |
Date of fiscal year end: | October 31 |
|
|
Date of reporting period: | October 31, 2019 |
This report on Form N-CSR relates solely to the Registrant’s Fidelity Diversified International K6 Fund, Fidelity Emerging Europe, Middle East, Africa (EMEA) Fund, Fidelity Emerging Markets Discovery Fund, Fidelity Flex International Fund, Fidelity Global Commodity Stock Fund, Fidelity Global Equity Income Fund, Fidelity International Capital Appreciation K6 Fund, Fidelity International Discovery Fund, Fidelity International Discovery K6 Fund, Fidelity International Growth Fund, Fidelity International Small Cap Fund, Fidelity International Small Cap Opportunities Fund, Fidelity International Value Fund, Fidelity SAI International SMA Completion Fund, Fidelity Series Canada Fund, Fidelity Series Emerging Markets Fund, Fidelity Series Emerging Markets Opportunities Fund, Fidelity Series International Growth Fund, Fidelity Series International Small Cap Fund, Fidelity Series International Value Fund, Fidelity Series Overseas Fund, Fidelity Total Emerging Markets Fund and Fidelity Total International Equity Fund (each, a “Fund” and collectively, the “Funds”).
Item 1.
Reports to Stockholders
Fidelity® Diversified International K6 Fund
Annual Report
October 31, 2019

See the inside front cover for important information about access to your fund’s shareholder reports.

Beginning on January 1, 2021, as permitted by regulations adopted by the Securities and Exchange Commission, paper copies of a fund’s shareholder reports will no longer be sent by mail, unless you specifically request paper copies of the reports from the fund or from your financial intermediary, such as a financial advisor, broker-dealer or bank. Instead, the reports will be made available on a website, and you will be notified by mail each time a report is posted and provided with a website link to access the report.
If you already elected to receive shareholder reports electronically, you will not be affected by this change and you need not take any action. You may elect to receive shareholder reports and other communications from a fund electronically, by contacting your financial intermediary. For Fidelity customers, visit Fidelity's web site or call Fidelity using the contact information listed below.
You may elect to receive all future reports in paper free of charge. If you wish to continue receiving paper copies of your shareholder reports, you may contact your financial intermediary or, if you are a Fidelity customer, visit Fidelity’s website, or call Fidelity at the applicable toll-free number listed below. Your election to receive reports in paper will apply to all funds held with the fund complex/your financial intermediary.
| Account Type | Website | Phone Number |
| Brokerage, Mutual Fund, or Annuity Contracts: | fidelity.com/mailpreferences | 1-800-343-3548 |
| Employer Provided Retirement Accounts: | netbenefits.fidelity.com/preferences (choose 'no' under Required Disclosures to continue to print) | 1-800-343-0860 |
| Advisor Sold Accounts Serviced Through Your Financial Intermediary: | Contact Your Financial Intermediary | Your Financial Intermediary's phone number |
| Advisor Sold Accounts Serviced by Fidelity: | institutional.fidelity.com | 1-877-208-0098 |
Contents
To view a fund's proxy voting guidelines and proxy voting record for the 12-month period ended June 30, visit http://www.fidelity.com/proxyvotingresults or visit the Securities and Exchange Commission's (SEC) web site at http://www.sec.gov.
You may also call 1-800-835-5092 to request a free copy of the proxy voting guidelines.
Standard & Poor's, S&P and S&P 500 are registered service marks of The McGraw-Hill Companies, Inc. and have been licensed for use by Fidelity Distributors Corporation.
Other third-party marks appearing herein are the property of their respective owners.
All other marks appearing herein are registered or unregistered trademarks or service marks of FMR LLC or an affiliated company. © 2019 FMR LLC. All rights reserved.
This report and the financial statements contained herein are submitted for the general information of the shareholders of the Fund. This report is not authorized for distribution to prospective investors in the Fund unless preceded or accompanied by an effective prospectus.
A fund files its complete schedule of portfolio holdings with the SEC for the first and third quarters of each fiscal year on Form N-PORT. Forms N-PORT are available on the SEC’s web site at http://www.sec.gov. A fund's Forms N-PORT may be reviewed and copied at the SEC’s Public Reference Room in Washington, DC. Information regarding the operation of the SEC's Public Reference Room may be obtained by calling 1-800-SEC-0330.
For a complete list of a fund's portfolio holdings, view the most recent holdings listing, semiannual report, or annual report on Fidelity's web site at http://www.fidelity.com, http://www.institutional.fidelity.com, or http://www.401k.com, as applicable.
NOT FDIC INSURED •MAY LOSE VALUE •NO BANK GUARANTEE
Neither the Fund nor Fidelity Distributors Corporation is a bank.
Performance: The Bottom Line
Average annual total return reflects the change in the value of an investment, assuming reinvestment of distributions from dividend income and capital gains (the profits earned upon the sale of securities that have grown in value, if any) and assuming a constant rate of performance each year. The hypothetical investment and the average annual total returns do not reflect the deduction of taxes that a shareholder would pay on fund distributions or the redemption of fund shares. During periods of reimbursement by Fidelity, a fund’s total return will be greater than it would be had the reimbursement not occurred. How a fund did yesterday is no guarantee of how it will do tomorrow.
Average Annual Total Returns
| For the periods ended October 31, 2019 | Past 1 year | Life of fundA |
| Fidelity® Diversified International K6 Fund | 15.89% | 4.96% |
A From May 25, 2017
$10,000 Over Life of Fund
Let's say hypothetically that $10,000 was invested in Fidelity® Diversified International K6 Fund on May 25, 2017, when the fund started.
The chart shows how the value of your investment would have changed, and also shows how the MSCI EAFE Index performed over the same period.

| Period Ending Values |
| $11,252 | Fidelity® Diversified International K6 Fund |
| $11,094 | MSCI EAFE Index |
Management's Discussion of Fund Performance
Market Recap: The MSCI ACWI (All Country World Index) ex USA Index gained 11.47% for the 12 months ending October 31, 2019, as international stocks reflected a confluence of factors, including escalating trade tension, and moderating but still positive global economic growth. Currency fluctuations were largely modest and varied by region, muting the overall impact on international equity returns. In late December, the U.S. Federal Reserve shifted from raising interest rates to a more dovish policy in 2019, joining many foreign central banks. In June, international stocks rose 6.03%, as policy stimulus in China stabilized that country’s economic growth. The Fed cut its policy rate in July for the first time since 2008. However, the index returned -1.21% for the month, followed by -3.08% in August. In September, the Fed cut its policy rate another quarter point, citing concerns about slowing economic growth and muted inflation, and did the same in October, leading to monthly gains of 2.59% and 3.49%, respectively. For the full 12 months, the growth-oriented information technology sector (+22%) led the way, followed by utilities (+20%) and real estate (+18%), two high-dividend-yielding categories. Conversely, energy was roughly flat, while materials (+6%) and communication services (7%) also lagged. By region, Asia Pacific ex Japan (+16%), Europe ex U.K (+13%), Canada (+12%) and emerging markets (+12%) fared best. Meanwhile, the U.K. (+7%) and Japan (+10%) trailed the broader market.
Comments from Portfolio Manager Bill Bower: For the fiscal year, the fund’s share classes gained roughly 16%, handily outperforming the 11.30% result of benchmark MSCI EAFE Index. Favorable stock selection was the primary driver of the fund’s outperformance the past 12 months, as our picks in 10 of 11 equity sectors outperformed the index. By sector, the biggest contribution to the fund’s relative result came from security selection in the financials sector, followed by choices in information technology and industrials. Regionally, choices in emerging markets added the most value, with notable outperformance in China and India. Stock picking in the non-benchmark U.S. region, along with Japan, also contributed meaningfully. In terms of individual stocks, an overweighted stake in Japanese optical and glass products manufacturer Hoya (+58%) helped more than any other investment the past year. A large position in photolithography systems manufacturer ASML (+54%) also helped. Conversely, being underweighted in the higher-dividend-yielding and strong-performing utilities and real estate sectors held back the fund’s performance relative to the index. At the stock level, not owning Switzerland-based food and beverage manufacturer Nestle (+29%), an index constituent, weighed on the fund’s relative result. An overweighting in Norway-based oil & gas company Equinor (-26%) also hurt this period. Elsewhere, a cash position of roughly 4%, on average, also detracted in an uptrending market.
The views expressed above reflect those of the portfolio manager(s) only through the end of the period as stated on the cover of this report and do not necessarily represent the views of Fidelity or any other person in the Fidelity organization. Any such views are subject to change at any time based upon market or other conditions and Fidelity disclaims any responsibility to update such views. These views may not be relied on as investment advice and, because investment decisions for a Fidelity fund are based on numerous factors, may not be relied on as an indication of trading intent on behalf of any Fidelity fund.
Investment Summary (Unaudited)
Geographic Diversification (% of fund's net assets)
| As of October 31, 2019 |
| | Japan | 16.9% |
| | Germany | 11.1% |
| | United Kingdom | 10.8% |
| | United States of America* | 9.7% |
| | France | 7.7% |
| | Netherlands | 6.9% |
| | Switzerland | 6.2% |
| | India | 4.2% |
| | Canada | 3.0% |
| | Other | 23.5% |

* Includes Short-Term investments and Net Other Assets (Liabilities).
Percentages are based on country or territory of incorporation and are adjusted for the effect of futures contracts, if applicable.
Asset Allocation as of October 31, 2019
| | % of fund's net assets |
| Stocks | 96.2 |
| Short-Term Investments and Net Other Assets (Liabilities) | 3.8 |
Top Ten Stocks as of October 31, 2019
| | % of fund's net assets |
| SAP SE (Germany, Software) | 2.4 |
| Roche Holding AG (participation certificate) (Switzerland, Pharmaceuticals) | 2.2 |
| ASML Holding NV (Netherlands, Semiconductors & Semiconductor Equipment) | 1.9 |
| AIA Group Ltd. (Hong Kong, Insurance) | 1.7 |
| AstraZeneca PLC (United Kingdom) (United Kingdom, Pharmaceuticals) | 1.7 |
| Hoya Corp. (Japan, Health Care Equipment & Supplies) | 1.7 |
| Unilever NV (Netherlands, Personal Products) | 1.5 |
| Keyence Corp. (Japan, Electronic Equipment & Components) | 1.4 |
| LVMH Moet Hennessy Louis Vuitton SE (France, Textiles, Apparel & Luxury Goods) | 1.3 |
| HDFC Bank Ltd. (India, Banks) | 1.2 |
| | 17.0 |
Top Market Sectors as of October 31, 2019
| | % of fund's net assets |
| Financials | 18.9 |
| Information Technology | 15.8 |
| Industrials | 15.5 |
| Health Care | 14.1 |
| Consumer Discretionary | 8.7 |
| Consumer Staples | 8.6 |
| Materials | 5.5 |
| Communication Services | 3.7 |
| Energy | 2.7 |
| Utilities | 2.0 |
Schedule of Investments October 31, 2019
Showing Percentage of Net Assets
| Common Stocks - 96.2% | | | |
| | | Shares | Value |
| Australia - 1.1% | | | |
| CSL Ltd. | | 116,641 | $20,570,377 |
| Magellan Financial Group Ltd. | | 349,417 | 11,589,444 |
|
| TOTAL AUSTRALIA | | | 32,159,821 |
|
| Bailiwick of Jersey - 0.8% | | | |
| Experian PLC | | 515,867 | 16,224,583 |
| Ferguson PLC | | 93,832 | 8,012,627 |
|
| TOTAL BAILIWICK OF JERSEY | | | 24,237,210 |
|
| Belgium - 0.9% | | | |
| KBC Groep NV | | 387,475 | 27,173,647 |
| Bermuda - 1.8% | | | |
| China Gas Holdings Ltd. | | 1,058,457 | 4,508,964 |
| Credicorp Ltd. (United States) | | 53,993 | 11,556,662 |
| Hiscox Ltd. | | 556,523 | 10,734,083 |
| IHS Markit Ltd. (a) | | 212,477 | 14,877,640 |
| Marvell Technology Group Ltd. | | 431,577 | 10,526,163 |
|
| TOTAL BERMUDA | | | 52,203,512 |
|
| Brazil - 0.7% | | | |
| BM&F BOVESPA SA | | 676,232 | 8,157,612 |
| Notre Dame Intermedica Participacoes SA | | 379,620 | 5,679,392 |
| Rumo SA (a) | | 1,417,294 | 8,057,425 |
|
| TOTAL BRAZIL | | | 21,894,429 |
|
| Canada - 3.0% | | | |
| Alimentation Couche-Tard, Inc. Class B (sub. vtg.) | | 1,087,202 | 32,605,329 |
| Cenovus Energy, Inc. (Canada) | | 798,046 | 6,798,327 |
| Constellation Software, Inc. | | 13,519 | 13,352,001 |
| Fairfax India Holdings Corp. (a)(b) | | 547,019 | 6,181,315 |
| Franco-Nevada Corp. | | 85,845 | 8,329,657 |
| Kirkland Lake Gold Ltd. | | 171,066 | 8,033,127 |
| Waste Connection, Inc. (Canada) | | 62,103 | 5,736,429 |
| Wheaton Precious Metals Corp. | | 282,977 | 7,932,208 |
|
| TOTAL CANADA | | | 88,968,393 |
|
| Cayman Islands - 1.8% | | | |
| Alibaba Group Holding Ltd. sponsored ADR (a) | | 133,805 | 23,639,329 |
| Anta Sports Products Ltd. | | 1,183,890 | 11,580,956 |
| Tencent Holdings Ltd. | | 391,959 | 15,899,001 |
| Zai Lab Ltd. ADR (a) | | 91,628 | 3,096,110 |
|
| TOTAL CAYMAN ISLANDS | | | 54,215,396 |
|
| China - 0.9% | | | |
| Kweichow Moutai Co. Ltd. (A Shares) | | 83,909 | 14,043,816 |
| Ping An Insurance Group Co. of China Ltd. (H Shares) | | 1,079,428 | 12,458,532 |
| Yantai Jereh Oilfield Services (A Shares) | | 361,500 | 1,572,289 |
|
| TOTAL CHINA | | | 28,074,637 |
|
| Denmark - 1.5% | | | |
| DSV A/S | | 214,324 | 20,796,352 |
| Netcompany Group A/S (a)(b) | | 112,600 | 4,793,921 |
| ORSTED A/S (b) | | 209,829 | 18,405,613 |
|
| TOTAL DENMARK | | | 43,995,886 |
|
| France - 7.7% | | | |
| Amundi SA (b) | | 212,378 | 15,159,372 |
| Capgemini SA | | 200,265 | 22,547,743 |
| Danone SA | | 233,447 | 19,339,054 |
| Dassault Systemes SA | | 46,610 | 7,072,441 |
| Edenred SA | | 92,209 | 4,854,081 |
| Essilor International SA | | 32,608 | 4,975,102 |
| Kering SA | | 16,730 | 9,519,806 |
| Legrand SA | | 151,894 | 11,855,128 |
| LVMH Moet Hennessy Louis Vuitton SE | | 90,793 | 38,773,698 |
| Pernod Ricard SA | | 48,146 | 8,886,892 |
| Sanofi SA | | 318,810 | 29,390,187 |
| SR Teleperformance SA | | 119,001 | 26,969,073 |
| VINCI SA | | 258,986 | 29,058,017 |
|
| TOTAL FRANCE | | | 228,400,594 |
|
| Germany - 11.1% | | | |
| adidas AG | | 102,078 | 31,518,706 |
| Allianz SE | | 123,420 | 30,141,967 |
| Bayer AG | | 257,606 | 19,984,094 |
| Deutsche Borse AG | | 165,252 | 25,590,875 |
| Deutsche Post AG | | 509,560 | 18,043,915 |
| Hannover Reuck SE | | 108,559 | 19,226,845 |
| Linde PLC | | 171,661 | 33,935,135 |
| Morphosys AG (a) | | 24,900 | 2,711,835 |
| Morphosys AG sponsored ADR (a) | | 152,000 | 4,137,440 |
| MTU Aero Engines Holdings AG | | 16,260 | 4,341,466 |
| RWE AG | | 771,794 | 23,525,168 |
| SAP SE | | 533,522 | 70,692,454 |
| Scout24 AG (b) | | 193,116 | 11,942,947 |
| Symrise AG | | 171,646 | 16,517,166 |
| Vonovia SE | | 326,498 | 17,373,273 |
|
| TOTAL GERMANY | | | 329,683,286 |
|
| Hong Kong - 1.9% | | | |
| AIA Group Ltd. | | 5,133,139 | 51,116,952 |
| Techtronic Industries Co. Ltd. | | 807,205 | 6,308,319 |
|
| TOTAL HONG KONG | | | 57,425,271 |
|
| India - 4.2% | | | |
| Axis Bank Ltd. | | 1,268,979 | 13,138,594 |
| HDFC Bank Ltd. | | 2,038,346 | 35,291,479 |
| Housing Development Finance Corp. Ltd. | | 965,304 | 28,949,853 |
| Kotak Mahindra Bank Ltd. | | 542,703 | 12,028,295 |
| Reliance Industries Ltd. | | 1,528,179 | 31,475,021 |
| Tech Mahindra Ltd. | | 284,196 | 2,957,110 |
|
| TOTAL INDIA | | | 123,840,352 |
|
| Indonesia - 1.1% | | | |
| PT Bank Central Asia Tbk | | 7,230,189 | 16,183,532 |
| PT Bank Rakyat Indonesia Tbk | | 52,425,763 | 15,708,608 |
|
| TOTAL INDONESIA | | | 31,892,140 |
|
| Ireland - 2.6% | | | |
| CRH PLC | | 464,360 | 16,927,437 |
| DCC PLC (United Kingdom) | | 46,926 | 4,398,446 |
| Kerry Group PLC Class A | | 167,282 | 20,224,146 |
| Kingspan Group PLC (Ireland) | | 354,215 | 18,354,301 |
| Ryanair Holdings PLC sponsored ADR (a) | | 241,534 | 18,028,098 |
|
| TOTAL IRELAND | | | 77,932,428 |
|
| Italy - 1.3% | | | |
| Enel SpA | | 1,962,186 | 15,207,656 |
| FinecoBank SpA | | 665,490 | 7,496,432 |
| Moncler SpA | | 143,027 | 5,509,752 |
| Recordati SpA | | 274,743 | 11,542,874 |
|
| TOTAL ITALY | | | 39,756,714 |
|
| Japan - 16.9% | | | |
| Astellas Pharma, Inc. | | 185,978 | 3,191,884 |
| Bandai Namco Holdings, Inc. | | 131,526 | 8,087,427 |
| Daikin Industries Ltd. | | 148,165 | 20,737,120 |
| Hoya Corp. | | 560,403 | 49,526,865 |
| Iriso Electronics Co. Ltd. | | 41,326 | 2,043,258 |
| Itochu Corp. | | 771,989 | 16,140,656 |
| Kao Corp. | | 286,661 | 23,047,168 |
| Keyence Corp. | | 67,824 | 42,884,872 |
| KH Neochem Co. Ltd. | | 138,596 | 3,375,083 |
| Minebea Mitsumi, Inc. | | 1,694,832 | 32,187,486 |
| Misumi Group, Inc. | | 358,434 | 9,010,587 |
| Nabtesco Corp. | | 125,555 | 3,997,019 |
| Nidec Corp. | | 41,252 | 6,073,358 |
| Nitori Holdings Co. Ltd. | | 141,819 | 21,586,430 |
| Oracle Corp. Japan | | 46,029 | 4,045,773 |
| ORIX Corp. | | 1,536,216 | 24,141,472 |
| PALTAC Corp. | | 85,876 | 4,141,414 |
| Persol Holdings Co., Ltd. | | 556,332 | 10,686,037 |
| Recruit Holdings Co. Ltd. | | 868,231 | 28,854,827 |
| Renesas Electronics Corp. (a) | | 1,973,226 | 13,358,104 |
| ROHM Co. Ltd. | | 36,980 | 2,929,882 |
| Shin-Etsu Chemical Co. Ltd. | | 236,861 | 26,410,293 |
| Shiseido Co. Ltd. | | 248,100 | 20,455,336 |
| SMC Corp. | | 58,265 | 25,172,881 |
| SoftBank Corp. | | 210,993 | 8,116,144 |
| Sony Corp. | | 323,043 | 19,663,353 |
| Suzuki Motor Corp. | | 255,368 | 12,056,974 |
| Tokyo Electron Ltd. | | 84,554 | 17,130,520 |
| Tsuruha Holdings, Inc. | | 203,657 | 22,909,083 |
| Welcia Holdings Co. Ltd. | | 228,391 | 13,123,412 |
| Yahoo! Japan Corp. | | 2,863,203 | 8,814,995 |
|
| TOTAL JAPAN | | | 503,899,713 |
|
| Korea (South) - 0.7% | | | |
| LG Chemical Ltd. | | 20,362 | 5,350,225 |
| SK Hynix, Inc. | | 209,275 | 14,663,502 |
|
| TOTAL KOREA (SOUTH) | | | 20,013,727 |
|
| Luxembourg - 0.7% | | | |
| B&M European Value Retail SA | | 3,512,824 | 16,849,896 |
| Globant SA (a) | | 29,951 | 2,793,230 |
|
| TOTAL LUXEMBOURG | | | 19,643,126 |
|
| Mexico - 0.1% | | | |
| Grupo Financiero Banorte S.A.B. de CV Series O | | 492,471 | 2,688,091 |
| Netherlands - 6.9% | | | |
| Adyen BV (a)(b) | | 3,470 | 2,435,835 |
| ASML Holding NV | | 216,611 | 56,745,584 |
| Ferrari NV | | 37,294 | 5,966,659 |
| Heineken NV (Bearer) | | 139,570 | 14,236,885 |
| InterXion Holding NV (a) | | 100,403 | 8,857,553 |
| Koninklijke Philips Electronics NV | | 527,834 | 23,158,251 |
| NXP Semiconductors NV | | 214,119 | 24,341,048 |
| Unilever NV | | 750,258 | 44,306,588 |
| Wolters Kluwer NV | | 355,487 | 26,175,257 |
|
| TOTAL NETHERLANDS | | | 206,223,660 |
|
| New Zealand - 0.3% | | | |
| Ryman Healthcare Group Ltd. | | 1,201,863 | 9,933,339 |
| Norway - 1.4% | | | |
| Adevinta ASA: | | | |
| rights 11/12/19 (a) | | 604,758 | 92,461 |
| Class B | | 946,195 | 10,803,486 |
| Equinor ASA | | 766,480 | 14,177,482 |
| Schibsted ASA (A Shares) | | 522,862 | 15,351,287 |
|
| TOTAL NORWAY | | | 40,424,716 |
|
| South Africa - 0.1% | | | |
| Capitec Bank Holdings Ltd. | | 47,555 | 4,320,973 |
| Spain - 0.7% | | | |
| Amadeus IT Holding SA Class A | | 51,843 | 3,835,812 |
| Cellnex Telecom SA (b) | | 271,030 | 11,686,136 |
| Cellnex Telecom SA (a) | | 78,678 | 3,392,399 |
| Masmovil Ibercom SA (a) | | 38,245 | 883,804 |
|
| TOTAL SPAIN | | | 19,798,151 |
|
| Sweden - 2.2% | | | |
| ASSA ABLOY AB (B Shares) | | 902,900 | 21,442,412 |
| Coor Service Management Holding AB (b) | | 194,702 | 1,663,568 |
| EQT AB (a) | | 181,800 | 1,744,250 |
| Ericsson (B Shares) | | 1,732,460 | 15,139,605 |
| Hexagon AB (B Shares) | | 226,258 | 11,549,921 |
| Indutrade AB | | 255,905 | 7,876,691 |
| Svenska Handelsbanken AB (A Shares) | | 670,613 | 6,730,146 |
|
| TOTAL SWEDEN | | | 66,146,593 |
|
| Switzerland - 6.2% | | | |
| Alcon, Inc. (Switzerland) (a) | | 363,427 | 21,463,008 |
| Julius Baer Group Ltd. | | 273,439 | 12,108,872 |
| Lonza Group AG | | 45,667 | 16,433,639 |
| Medacta Group SA (b) | | 36,852 | 3,010,919 |
| Roche Holding AG (participation certificate) | | 214,157 | 64,451,830 |
| Sika AG | | 198,721 | 34,144,156 |
| Sonova Holding AG Class B | | 46,420 | 10,634,486 |
| Swiss Re Ltd. | | 170,272 | 17,829,800 |
| Temenos Group AG | | 40,499 | 5,778,241 |
|
| TOTAL SWITZERLAND | | | 185,854,951 |
|
| Taiwan - 0.9% | | | |
| Taiwan Semiconductor Manufacturing Co. Ltd. sponsored ADR | | 531,382 | 27,435,253 |
| United Kingdom - 10.8% | | | |
| Aon PLC | | 73,837 | 14,262,355 |
| Ascential PLC (b) | | 1,075,598 | 4,865,319 |
| AstraZeneca PLC (United Kingdom) | | 521,612 | 50,866,177 |
| Beazley PLC | | 1,008,214 | 7,659,631 |
| Big Yellow Group PLC | | 315,787 | 4,671,405 |
| BP PLC sponsored ADR | | 674,790 | 25,581,289 |
| Coca-Cola European Partners PLC | | 216,791 | 11,600,486 |
| Compass Group PLC | | 851,872 | 22,680,316 |
| InterContinental Hotel Group PLC | | 155,496 | 9,409,801 |
| Lloyds Banking Group PLC | | 20,088,416 | 14,777,194 |
| London Stock Exchange Group PLC | | 354,895 | 31,982,723 |
| M&G PLC (a) | | 1,854,490 | 5,135,933 |
| Network International Holdings PLC (b) | | 1,032,446 | 7,235,220 |
| Ocado Group PLC (a) | | 212,460 | 3,657,542 |
| Prudential PLC | | 1,854,490 | 32,392,075 |
| RELX PLC (Euronext N.V.) | | 1,137,467 | 27,351,381 |
| Rentokil Initial PLC | | 2,536,109 | 14,931,001 |
| Smith & Nephew PLC | | 863,073 | 18,527,081 |
| Standard Chartered PLC (United Kingdom) | | 1,433,035 | 13,012,536 |
|
| TOTAL UNITED KINGDOM | | | 320,599,465 |
|
| United States of America - 5.9% | | | |
| 10X Genomics, Inc. (a) | | 4,600 | 266,800 |
| Alphabet, Inc. Class C (a) | | 12,801 | 16,130,668 |
| Amgen, Inc. | | 48,173 | 10,272,892 |
| Becton, Dickinson & Co. | | 50,234 | 12,859,904 |
| Boston Scientific Corp. (a) | | 350,636 | 14,621,521 |
| Coty, Inc. Class A | | 736,586 | 8,610,690 |
| IQVIA Holdings, Inc. (a) | | 98,461 | 14,219,738 |
| Marsh & McLennan Companies, Inc. | | 141,755 | 14,688,653 |
| MasterCard, Inc. Class A | | 107,244 | 29,686,212 |
| Microsoft Corp. | | 124,125 | 17,795,801 |
| The Booking Holdings, Inc. (a) | | 2,804 | 5,744,751 |
| Visa, Inc. Class A | | 165,307 | 29,566,810 |
|
| TOTAL UNITED STATES OF AMERICA | | | 174,464,440 |
|
| TOTAL COMMON STOCKS | | | |
| (Cost $2,506,341,000) | | | 2,863,299,914 |
|
| Money Market Funds - 3.7% | | | |
| Fidelity Cash Central Fund 1.83% (c) | | | |
| (Cost $111,588,661) | | 111,566,970 | 111,589,283 |
| TOTAL INVESTMENT IN SECURITIES - 99.9% | | | |
| (Cost $2,617,929,661) | | | 2,974,889,197 |
| NET OTHER ASSETS (LIABILITIES) - 0.1% | | | 2,498,957 |
| NET ASSETS - 100% | | | $2,977,388,154 |
Categorizations in the Schedule of Investments are based on country or territory of incorporation.
Legend
(a) Non-income producing
(b) Security exempt from registration under Rule 144A of the Securities Act of 1933. These securities may be resold in transactions exempt from registration, normally to qualified institutional buyers. At the end of the period, the value of these securities amounted to $87,380,165 or 2.9% of net assets.
(c) Affiliated fund that is generally available only to investment companies and other accounts managed by Fidelity Investments. The rate quoted is the annualized seven-day yield of the fund at period end. A complete unaudited listing of the fund's holdings as of its most recent quarter end is available upon request. In addition, each Fidelity Central Fund's financial statements, which are not covered by the Fund's Report of Independent Registered Public Accounting Firm, are available on the SEC's website or upon request.
Affiliated Central Funds
Information regarding fiscal year to date income earned by the Fund from investments in Fidelity Central Funds is as follows:
| Fund | Income earned |
| Fidelity Cash Central Fund | $2,374,585 |
| Fidelity Securities Lending Cash Central Fund | 208,904 |
| Total | $2,583,489 |
Amounts in the income column in the above table include any capital gain distributions from underlying funds, which are presented in the corresponding line-item in the Statement of Operations, if applicable. Amount for Fidelity Securities Lending Cash Central Fund represents the income earned on investing cash collateral, less rebates paid to borrowers and any lending agent fees associated with the loan, plus any premium payments received for lending certain types of securities.
Investment Valuation
The following is a summary of the inputs used, as of October 31, 2019, involving the Fund's assets and liabilities carried at fair value. The inputs or methodology used for valuing securities may not be an indication of the risk associated with investing in those securities. For more information on valuation inputs, and their aggregation into the levels used below, please refer to the Investment Valuation section in the accompanying Notes to Financial Statements.
| | Valuation Inputs at Reporting Date: |
| Description | Total | Level 1 | Level 2 | Level 3 |
| Investments in Securities: | | | | |
| Equities: | | | | |
| Communication Services | $107,978,647 | $75,148,507 | $32,830,140 | $-- |
| Consumer Discretionary | 255,361,912 | 107,381,543 | 147,980,369 | -- |
| Consumer Staples | 253,388,885 | 140,471,016 | 112,917,869 | -- |
| Energy | 79,604,408 | 46,557,098 | 33,047,310 | -- |
| Financials | 561,358,803 | 187,028,190 | 374,330,613 | -- |
| Health Care | 420,550,643 | 130,950,558 | 289,600,085 | -- |
| Industrials | 468,216,181 | 279,592,852 | 188,623,329 | -- |
| Information Technology | 472,193,869 | 301,012,291 | 171,181,578 | -- |
| Materials | 160,954,487 | 114,241,674 | 46,712,813 | -- |
| Real Estate | 22,044,678 | 22,044,678 | -- | -- |
| Utilities | 61,647,401 | 41,930,781 | 19,716,620 | -- |
| Money Market Funds | 111,589,283 | 111,589,283 | -- | -- |
| Total Investments in Securities: | $2,974,889,197 | $1,557,948,471 | $1,416,940,726 | $-- |
See accompanying notes which are an integral part of the financial statements.
Financial Statements
Statement of Assets and Liabilities
| | | October 31, 2019 |
| Assets | | |
Investment in securities, at value — See accompanying schedule:
Unaffiliated issuers (cost $2,506,341,000) | $2,863,299,914 | |
| Fidelity Central Funds (cost $111,588,661) | 111,589,283 | |
| Total Investment in Securities (cost $2,617,929,661) | | $2,974,889,197 |
| Foreign currency held at value (cost $136) | | 140 |
| Receivable for investments sold | | 5,602,074 |
| Receivable for fund shares sold | | 1,268,242 |
| Dividends receivable | | 4,991,470 |
| Distributions receivable from Fidelity Central Funds | | 154,102 |
| Other receivables | | 82,657 |
| Total assets | | 2,986,987,882 |
| Liabilities | | |
| Payable for investments purchased | $4,368,770 | |
| Payable for fund shares redeemed | 1,470,805 | |
| Accrued management fee | 1,441,670 | |
| Other payables and accrued expenses | 2,318,483 | |
| Total liabilities | | 9,599,728 |
| Net Assets | | $2,977,388,154 |
| Net Assets consist of: | | |
| Paid in capital | | $2,851,681,928 |
| Total accumulated earnings (loss) | | 125,706,226 |
| Net Assets, for 268,622,566 shares outstanding | | $2,977,388,154 |
| Net Asset Value, offering price and redemption price per share ($2,977,388,154 ÷ 268,622,566 shares) | | $11.08 |
See accompanying notes which are an integral part of the financial statements.
Statement of Operations
| | | Year ended October 31, 2019 |
| Investment Income | | |
| Dividends | | $50,183,023 |
| Non-Cash dividends | | 4,466,669 |
| Income from Fidelity Central Funds (including $208,904 from security lending) | | 2,583,489 |
| Total income | | 57,233,181 |
| Expenses | | |
| Management fee | $15,712,246 | |
| Independent trustees' fees and expenses | 14,314 | |
| Commitment fees | 6,769 | |
| Total expenses before reductions | 15,733,329 | |
| Expense reductions | (202,032) | |
| Total expenses after reductions | | 15,531,297 |
| Net investment income (loss) | | 41,701,884 |
| Realized and Unrealized Gain (Loss) | | |
| Net realized gain (loss) on: | | |
| Investment securities: | | |
| Unaffiliated issuers | (181,428,148) | |
| Fidelity Central Funds | (662) | |
| Foreign currency transactions | (148,526) | |
| Total net realized gain (loss) | | (181,577,336) |
| Change in net unrealized appreciation (depreciation) on: | | |
| Investment securities: | | |
| Unaffiliated issuers (net of increase in deferred foreign taxes of $2,318,329) | 544,417,750 | |
| Fidelity Central Funds | 622 | |
| Assets and liabilities in foreign currencies | 39,759 | |
| Total change in net unrealized appreciation (depreciation) | | 544,458,131 |
| Net gain (loss) | | 362,880,795 |
| Net increase (decrease) in net assets resulting from operations | | $404,582,679 |
See accompanying notes which are an integral part of the financial statements.
Statement of Changes in Net Assets
| | Year ended October 31, 2019 | Year ended October 31, 2018 |
| Increase (Decrease) in Net Assets | | |
| Operations | | |
| Net investment income (loss) | $41,701,884 | $29,005,340 |
| Net realized gain (loss) | (181,577,336) | (76,202,056) |
| Change in net unrealized appreciation (depreciation) | 544,458,131 | (195,652,805) |
| Net increase (decrease) in net assets resulting from operations | 404,582,679 | (242,849,521) |
| Distributions to shareholders | (29,912,287) | (1,421,142) |
| Share transactions | | |
| Proceeds from sales of shares | 1,058,110,530 | 2,562,853,883 |
| Reinvestment of distributions | 29,912,287 | 1,421,142 |
| Cost of shares redeemed | (692,659,826) | (408,795,237) |
| Net increase (decrease) in net assets resulting from share transactions | 395,362,991 | 2,155,479,788 |
| Total increase (decrease) in net assets | 770,033,383 | 1,911,209,125 |
| Net Assets | | |
| Beginning of period | 2,207,354,771 | 296,145,646 |
| End of period | $2,977,388,154 | $2,207,354,771 |
| Other Information | | |
| Shares | | |
| Sold | 106,470,262 | 238,286,615 |
| Issued in reinvestment of distributions | 3,226,784 | 133,315 |
| Redeemed | (68,929,558) | (38,373,698) |
| Net increase (decrease) | 40,767,488 | 200,046,232 |
See accompanying notes which are an integral part of the financial statements.
Financial Highlights
Fidelity Diversified International K6 Fund
| | | | |
| Years ended October 31, | 2019 | 2018 | 2017 A |
| Selected Per–Share Data | | | |
| Net asset value, beginning of period | $9.69 | $10.65 | $10.00 |
| Income from Investment Operations | | | |
| Net investment income (loss)B | .16 | .18 | .03C |
| Net realized and unrealized gain (loss) | 1.36 | (1.12) | .62 |
| Total from investment operations | 1.52 | (.94) | .65 |
| Distributions from net investment income | (.13) | (.02) | – |
| Distributions from net realized gain | – | (.01) | – |
| Total distributions | (.13) | (.02)D | – |
| Net asset value, end of period | $11.08 | $9.69 | $10.65 |
| Total ReturnE,F | 15.89% | (8.83)% | 6.50% |
| Ratios to Average Net AssetsG,H | | | |
| Expenses before reductions | .60% | .60% | .60%I |
| Expenses net of fee waivers, if any | .60% | .60% | .60%I |
| Expenses net of all reductions | .59% | .58% | .60%I |
| Net investment income (loss) | 1.59% | 1.67% | .64%C,I |
| Supplemental Data | | | |
| Net assets, end of period (000 omitted) | $2,977,388 | $2,207,355 | $296,146 |
| Portfolio turnover rateJ,K | 48% | 48% | 27%L |
A For the period May 25, 2017 (commencement of operations) to October 31, 2017.
B Calculated based on average shares outstanding during the period.
C Net investment income per share reflects a large, non-recurring dividend which amounted to $.01 per share. Excluding this non-recurring dividend, the ratio of net investment income (loss) to average net assets would have been .58%.
D Total distributions of $.02 per share is comprised of distributions from net investment income of $.016 and distributions from net realized gain of $.005 per share.
E Total returns for periods of less than one year are not annualized.
F Total returns would have been lower if certain expenses had not been reduced during the applicable periods shown.
G Fees and expenses of any underlying Fidelity Central Funds are not included in the Fund's expense ratio. The Fund indirectly bears its proportionate share of the expenses of any underlying Fidelity Central Funds.
H Expense ratios reflect operating expenses of the Fund. Expenses before reductions do not reflect amounts reimbursed by the investment adviser or reductions from brokerage service arrangements or reductions from other expense offset arrangements and do not represent the amount paid by the Fund during periods when reimbursements or reductions occur. Expense ratios before reductions for start-up periods may not be representative of longer term operating periods. Expenses net of fee waivers reflect expenses after reimbursement by the investment adviser but prior to reductions from brokerage service arrangements or other expense offset arrangements. Expenses net of all reductions represent the net expenses paid by the Fund.
I Annualized
J Amount does not include the portfolio activity of any underlying Fidelity Central Funds.
K Portfolio turnover rate excludes securities received or delivered in-kind.
L Amount not annualized.
See accompanying notes which are an integral part of the financial statements.
Notes to Financial Statements
For the period ended October 31, 2019
1. Organization.
Fidelity Diversified International K6 Fund (the Fund) is a fund of Fidelity Investment Trust (the Trust) and is authorized to issue an unlimited number of shares. Share transactions on the Statement of Changes in Net Assets may contain exchanges between affiliated funds. The Trust is registered under the Investment Company Act of 1940, as amended (the 1940 Act), as an open-end management investment company organized as a Massachusetts business trust. Shares generally are available only to employer-sponsored retirement plans that are recordkept by Fidelity, or to certain employer-sponsored retirement plans that are not recordkept by Fidelity. The Fund's investments in emerging markets can be subject to social, economic, regulatory, and political uncertainties and can be extremely volatile.
2. Investments in Fidelity Central Funds.
The Fund invests in Fidelity Central Funds, which are open-end investment companies generally available only to other investment companies and accounts managed by the investment adviser and its affiliates. The Fund's Schedule of Investments lists each of the Fidelity Central Funds held as of period end, if any, as an investment of the Fund, but does not include the underlying holdings of each Fidelity Central Fund. As an Investing Fund, the Fund indirectly bears its proportionate share of the expenses of the underlying Fidelity Central Funds.
The Money Market Central Funds seek preservation of capital and current income and are managed by Fidelity Investments Money Management, Inc. (FIMM), an affiliate of the investment adviser. Annualized expenses of the Money Market Central Funds as of their most recent shareholder report date ranged from less than .005% to .01%.
A complete unaudited list of holdings for each Fidelity Central Fund is available upon request or at the Securities and Exchange Commission (the SEC) website at www.sec.gov. In addition, the financial statements of the Fidelity Central Funds, which are not covered by the Fund's Report of Independent Registered Public Accounting Firm, are available on the SEC website or upon request.
3. Significant Accounting Policies.
The Fund is an investment company and applies the accounting and reporting guidance of the Financial Accounting Standards Board (FASB) Accounting Standards Codification Topic 946 Financial Services – Investments Companies. The financial statements have been prepared in conformity with accounting principles generally accepted in the United States of America (GAAP), which require management to make certain estimates and assumptions at the date of the financial statements. Actual results could differ from those estimates. Subsequent events, if any, through the date that the financial statements were issued have been evaluated in the preparation of the financial statements. The following summarizes the significant accounting policies of the Fund:
Investment Valuation. Investments are valued as of 4:00 p.m. Eastern time on the last calendar day of the period. The Board of Trustees (the Board) has delegated the day to day responsibility for the valuation of the Fund's investments to the Fair Value Committee (the Committee) established by the Fund's investment adviser. In accordance with valuation policies and procedures approved by the Board, the Fund attempts to obtain prices from one or more third party pricing vendors or brokers to value its investments. When current market prices, quotations or currency exchange rates are not readily available or reliable, investments will be fair valued in good faith by the Committee, in accordance with procedures adopted by the Board. Factors used in determining fair value vary by investment type and may include market or investment specific events. The frequency with which these procedures are used cannot be predicted and they may be utilized to a significant extent. The Committee oversees the Fund's valuation policies and procedures and reports to the Board on the Committee's activities and fair value determinations. The Board monitors the appropriateness of the procedures used in valuing the Fund's investments and ratifies the fair value determinations of the Committee.
The Fund categorizes the inputs to valuation techniques used to value its investments into a disclosure hierarchy consisting of three levels as shown below:
- Level 1 – quoted prices in active markets for identical investments
- Level 2 – other significant observable inputs (including quoted prices for similar investments, interest rates, prepayment speeds, etc.)
- Level 3 – unobservable inputs (including the Fund's own assumptions based on the best information available)
Valuation techniques used to value the Fund's investments by major category are as follows:
Equity securities, including restricted securities, for which market quotations are readily available, are valued at the last reported sale price or official closing price as reported by a third party pricing vendor on the primary market or exchange on which they are traded and are categorized as Level 1 in the hierarchy. In the event there were no sales during the day or closing prices are not available, securities are valued at the last quoted bid price or may be valued using the last available price and are generally categorized as Level 2 in the hierarchy. For foreign equity securities, when market or security specific events arise, comparisons to the valuation of American Depositary Receipts (ADRs), futures contracts, Exchange-Traded Funds (ETFs) and certain indexes as well as quoted prices for similar securities may be used and would be categorized as Level 2 in the hierarchy. For equity securities, including restricted securities, where observable inputs are limited, assumptions about market activity and risk are used and these securities may be categorized as Level 3 in the hierarchy.
Investments in open-end mutual funds, including the Fidelity Central Funds, are valued at their closing net asset value (NAV) each business day and are categorized as Level 1 in the hierarchy.
Changes in valuation techniques may result in transfers in or out of an assigned level within the disclosure hierarchy. The aggregate value of investments by input level as of October 31, 2019 is included at the end of the Fund's Schedule of Investments.
Foreign Currency. The Fund may use foreign currency contracts to facilitate transactions in foreign-denominated securities. Gains and losses from these transactions may arise from changes in the value of the foreign currency or if the counterparties do not perform under the contracts' terms.
Foreign-denominated assets, including investment securities, and liabilities are translated into U.S. dollars at the exchange rates at period end. Purchases and sales of investment securities, income and dividends received and expenses denominated in foreign currencies are translated into U.S. dollars at the exchange rate in effect on the transaction date.
The effects of exchange rate fluctuations on investments are included with the net realized and unrealized gain (loss) on investment securities. Other foreign currency transactions resulting in realized and unrealized gain (loss) are disclosed separately.
Investment Transactions and Income. For financial reporting purposes, the Fund's investment holdings and NAV include trades executed through the end of the last business day of the period. The NAV per share for processing shareholder transactions is calculated as of the close of business of the New York Stock Exchange (NYSE), normally 4:00 p.m. Eastern time and includes trades executed through the end of the prior business day. Gains and losses on securities sold are determined on the basis of identified cost. Dividend income is recorded on the ex-dividend date, except for certain dividends from foreign securities where the ex-dividend date may have passed, which are recorded as soon as the Fund is informed of the ex-dividend date. Non-cash dividends included in dividend income, if any, are recorded at the fair market value of the securities received. Income and capital gain distributions from Fidelity Central Funds, if any, are recorded on the ex-dividend date. Certain distributions received by the Fund represent a return of capital or capital gain. The Fund determines the components of these distributions subsequent to the ex-dividend date, based upon receipt of tax filings or other correspondence relating to the underlying investment. These distributions are recorded as a reduction of cost of investments and/or as a realized gain. Large, non-recurring dividends recognized by the Fund are presented separately on the Statement of Operations as "Non-cash dividends". Investment income is recorded net of foreign taxes withheld where recovery of such taxes is uncertain.
Expenses. Expenses directly attributable to a fund are charged to that fund. Expenses attributable to more than one fund are allocated among the respective funds on the basis of relative net assets or other appropriate methods. Expense estimates are accrued in the period to which they relate and adjustments are made when actual amounts are known.
Income Tax Information and Distributions to Shareholders. Each year, the Fund intends to qualify as a regulated investment company under Subchapter M of the Internal Revenue Code, including distributing substantially all of its taxable income and realized gains. As a result, no provision for U.S. Federal income taxes is required. As of October 31, 2019, the Fund did not have any unrecognized tax benefits in the financial statements; nor is the Fund aware of any tax positions for which it is reasonably possible that the total amounts of unrecognized tax benefits will significantly change in the next twelve months. The Fund files a U.S. federal tax return, in addition to state and local tax returns as required. The Fund's federal income tax returns are subject to examination by the Internal Revenue Service (IRS) for a period of three fiscal years after they are filed. State and local tax returns may be subject to examination for an additional fiscal year depending on the jurisdiction. Foreign taxes are provided for based on the Fund's understanding of the tax rules and rates that exist in the foreign markets in which it invests. The Fund is subject to a tax imposed on capital gains by certain countries in which it invests. An estimated deferred tax liability for net unrealized appreciation on the applicable securities is included in Other payables and accrued expenses on the Statement of Assets & Liabilities.
Distributions are declared and recorded on the ex-dividend date. Income and capital gain distributions are determined in accordance with income tax regulations, which may differ from GAAP.
Capital accounts within the financial statements are adjusted for permanent book-tax differences. These adjustments have no impact on net assets or the results of operations. Capital accounts are not adjusted for temporary book-tax differences which will reverse in a subsequent period.
Book-tax differences are primarily due to foreign currency transactions, certain foreign taxes, passive foreign investment companies (PFIC), redemptions in kind, capital loss carryforwards, certain deemed distribution and losses deferred due to wash sales.
As of period end, the cost and unrealized appreciation (depreciation) in securities, and derivatives if applicable, for federal income tax purposes were as follows:
| Gross unrealized appreciation | $417,406,569 |
| Gross unrealized depreciation | (65,630,714) |
| Net unrealized appreciation (depreciation) | $351,775,855 |
| Tax Cost | $2,623,113,342 |
The tax-based components of distributable earnings as of period end were as follows:
| Undistributed ordinary income | $47,602,698 |
| Capital loss carryforward | $(271,331,222) |
| Net unrealized appreciation (depreciation) on securities and other investments | $351,753,079 |
Capital loss carryforwards are only available to offset future capital gains of the Fund to the extent provided by regulations and may be limited. Under the Regulated Investment Company Modernization Act of 2010 (the Act), the Fund is permitted to carry forward capital losses incurred in taxable years beginning after December 22, 2010 for an unlimited period and such capital losses are required to be used prior to any losses that expire. The capital loss carryforward information presented below, including any applicable limitation, is estimated as of fiscal period end and is subject to adjustment.
| No expiration | |
| Short-term | $(198,784,082) |
| Long-term | (72,547,140) |
| Total capital loss carryforward | $(271,331,222) |
The tax character of distributions paid was as follows:
| | October 31, 2019 | October 31, 2018 |
| Ordinary Income | $29,912,287 | $ 1,421,142 |
Restricted Securities. The Fund may invest in securities that are subject to legal or contractual restrictions on resale. These securities generally may be resold in transactions exempt from registration or to the public if the securities are registered. Disposal of these securities may involve time-consuming negotiations and expense, and prompt sale at an acceptable price may be difficult. Information regarding restricted securities is included at the end of the Fund's Schedule of Investments.
4. Purchases and Sales of Investments.
Purchases and sales of securities, other than short-term securities and in-kind transactions, aggregated $1,293,739,835 and $1,182,346,220, respectively.
Unaffiliated Redemptions In-Kind. During the period, 4,284,142 shares of the Fund were redeemed in-kind for investments and cash with a value of $45,883,165. The net realized gain of $10,175,810 on investments delivered through in-kind redemptions is included in the accompanying Statement of Operations. The amount of the in-kind redemptions is included in share transactions in the accompanying Statement of Changes in Net Assets. The Fund recognized no gain or loss for federal income tax purposes.
Unaffiliated Exchanges In-Kind. During the period, the Fund received investments and cash valued at $399,785,189 in exchange for 41,129,995 shares of the Fund. The amount of in-kind exchanges is included in share transactions in the accompanying Statement of Changes in Net Assets.
Prior Fiscal Year Unaffiliated Exchanges In-Kind. During the prior period, the Fund received investments and cash valued at $1,914,771,242 in exchange for 177,875,328 shares of the Fund. The amount of in-kind exchanges is included in share transactions in the accompanying Statement of Changes in Net Assets.
5. Fees and Other Transactions with Affiliates.
Management Fee. Fidelity Management & Research Company (the investment adviser) and its affiliates provide the Fund with investment management related services for which the Fund pays a monthly management fee that is based on an annual rate of .60% of average net assets. Under the management contract, the investment adviser or an affiliate pays all other expenses of the Fund, excluding fees and expenses of the independent Trustees, and certain miscellaneous expenses such as proxy and shareholder meeting expenses.
Brokerage Commissions. The Fund placed a portion of its portfolio transactions with brokerage firms which are affiliates of the investment adviser. Brokerage commissions are included in net realized gain (loss) and change in net unrealized appreciation (depreciation) in the Statement of Operations. The commissions paid to these affiliated firms were $3,673 for the period.
Interfund Trades. The Fund may purchase from or sell securities to other Fidelity Funds under procedures adopted by the Board. The procedures have been designed to ensure these interfund trades are executed in accordance with Rule 17a-7 of the 1940 Act. Interfund trades are included within the respective purchases and sales amounts shown in the Purchases and Sales of Investments note.
6. Committed Line of Credit.
The Fund participates with other funds managed by the investment adviser or an affiliate in a $4.25 billion credit facility (the "line of credit") to be utilized for temporary or emergency purposes to fund shareholder redemptions or for other short-term liquidity purposes. The Fund has agreed to pay commitment fees on its pro-rata portion of the line of credit, which amounted to $6,769 and is reflected in Commitment fees on the Statement of Operations. During the period, the Fund did not borrow on this line of credit.
7. Security Lending.
The Fund lends portfolio securities from time to time in order to earn additional income. For equity securities, lending agents are used, including National Financial Services (NFS), an affiliate of the Fund. Pursuant to a securities lending agreement, NFS will receive a fee, which is capped at 9.9% of daily lending revenue, for its services as lending agent. The Fund may lend securities to certain qualified borrowers, including NFS. On the settlement date of the loan, the Fund receives collateral (in the form of U.S. Treasury obligations, letters of credit and/or cash) against the loaned securities and maintains collateral in an amount not less than 100% of the market value of the loaned securities during the period of the loan. The market value of the loaned securities is determined at the close of business of the Fund and any additional required collateral is delivered to the Fund on the next business day. The Fund or borrower may terminate the loan at any time, and if the borrower defaults on its obligation to return the securities loaned because of insolvency or other reasons, the Fund may apply collateral received from the borrower against the obligation. The Fund may experience delays and costs in recovering the securities loaned. Any cash collateral received is invested in the Fidelity Securities Lending Cash Central Fund. At period end, there were no security loans outstanding. Total fees paid by the Fund to NFS, as lending agent, amounted to $81. Security lending income represents the income earned on investing cash collateral, less rebates paid to borrowers and any lending agent fees associated with the loan, plus any premium payments received for lending certain types of securities. Security lending income is presented in the Statement of Operations as a component of income from Fidelity Central Funds. During the period, there were no securities loaned to NFS.
8. Expense Reductions.
Commissions paid to certain brokers with whom the investment adviser, or its affiliates, places trades on behalf of the Fund include an amount in addition to trade execution, which may be rebated back to the Fund to offset certain expenses. This amount totaled $201,670 for the period. In addition, through arrangements with the Fund's custodian, credits realized as a result of certain uninvested cash balances were used to reduce the Fund's expenses by $362.
9. Other.
The Fund's organizational documents provide former and current trustees and officers with a limited indemnification against liabilities arising in connection with the performance of their duties to the Fund. In the normal course of business, the Fund may also enter into contracts that provide general indemnifications. The Fund's maximum exposure under these arrangements is unknown as this would be dependent on future claims that may be made against the Fund. The risk of material loss from such claims is considered remote.
Report of Independent Registered Public Accounting Firm
To the Trustees of Fidelity Investment Trust and Shareholders of Fidelity Diversified International K6 Fund:
Opinion on the Financial Statements and Financial Highlights
We have audited the accompanying statement of assets and liabilities of Fidelity Diversified International K6 Fund (the “Fund”), a fund of Fidelity Investment Trust, including the schedule of investments, as of October 31, 2019, the related statement of operations for the year then ended, the statement of changes in net assets for each of the two years in the period then ended, the financial highlights for each of the two years in the period then ended and for the period from May 25, 2017 (commencement of operations) to October 31 2017, and the related notes. In our opinion, the financial statements and financial highlights present fairly, in all material respects, the financial position of the Fund as of October 31, 2019 and the results of its operations for the year then ended, the changes in its net assets for each of the two years in the period then ended, and the financial highlights for each of the two years in the period then ended and for the period from May 25, 2017 (commencement of operations) to October 31 2017 in conformity with accounting principles generally accepted in the United States of America.
Basis for Opinion
These financial statements and financial highlights are the responsibility of the Fund's management. Our responsibility is to express an opinion on the Fund's financial statements and financial highlights based on our audits. We are a public accounting firm registered with the Public Company Accounting Oversight Board (United States) (PCAOB) and are required to be independent with respect to the Fund in accordance with the U.S. federal securities laws and the applicable rules and regulations of the Securities and Exchange Commission and the PCAOB.
We conducted our audits in accordance with the standards of the PCAOB. Those standards require that we plan and perform the audit to obtain reasonable assurance about whether the financial statements and financial highlights are free of material misstatement, whether due to error or fraud. The Fund is not required to have, nor were we engaged to perform, an audit of its internal control over financial reporting. As part of our audits we are required to obtain an understanding of internal control over financial reporting but not for the purpose of expressing an opinion on the effectiveness of the Fund’s internal control over financial reporting. Accordingly, we express no such opinion.
Our audits included performing procedures to assess the risks of material misstatement of the financial statements and financial highlights, whether due to error or fraud, and performing procedures that respond to those risks. Such procedures included examining, on a test basis, evidence regarding the amounts and disclosures in the financial statements and financial highlights. Our audits also included evaluating the accounting principles used and significant estimates made by management, as well as evaluating the overall presentation of the financial statements and financial highlights. Our procedures included confirmation of securities owned as of October 31, 2019, by correspondence with the custodians and brokers; when replies were not received from brokers, we performed other auditing procedures. We believe that our audits provide a reasonable basis for our opinion.
/s/ Deloitte & Touche LLP
Boston, Massachusetts
December 13, 2019
We have served as the auditor of one or more of the Fidelity investment companies since 1999.
Trustees and Officers
The Trustees, Members of the Advisory Board (if any), and officers of the trust and fund, as applicable, are listed below. The Board of Trustees governs the fund and is responsible for protecting the interests of shareholders. The Trustees are experienced executives who meet periodically throughout the year to oversee the fund's activities, review contractual arrangements with companies that provide services to the fund, oversee management of the risks associated with such activities and contractual arrangements, and review the fund's performance. Except for Jonathan Chiel, each of the Trustees oversees 298 funds. Mr. Chiel oversees 171 funds.
The Trustees hold office without limit in time except that (a) any Trustee may resign; (b) any Trustee may be removed by written instrument, signed by at least two-thirds of the number of Trustees prior to such removal; (c) any Trustee who requests to be retired or who has become incapacitated by illness or injury may be retired by written instrument signed by a majority of the other Trustees; and (d) any Trustee may be removed at any special meeting of shareholders by a two-thirds vote of the outstanding voting securities of the trust. Each Trustee who is not an interested person (as defined in the 1940 Act) of the trust and the fund is referred to herein as an Independent Trustee. Each Independent Trustee shall retire not later than the last day of the calendar year in which his or her 75th birthday occurs. The Independent Trustees may waive this mandatory retirement age policy with respect to individual Trustees. Officers and Advisory Board Members hold office without limit in time, except that any officer or Advisory Board Member may resign or may be removed by a vote of a majority of the Trustees at any regular meeting or any special meeting of the Trustees. Except as indicated, each individual has held the office shown or other offices in the same company for the past five years.
The fund’s Statement of Additional Information (SAI) includes more information about the Trustees. To request a free copy, call Fidelity at 1-800-835-5092.
Experience, Skills, Attributes, and Qualifications of the Trustees. The Governance and Nominating Committee has adopted a statement of policy that describes the experience, qualifications, attributes, and skills that are necessary and desirable for potential Independent Trustee candidates (Statement of Policy). The Board believes that each Trustee satisfied at the time he or she was initially elected or appointed a Trustee, and continues to satisfy, the standards contemplated by the Statement of Policy. The Governance and Nominating Committee also engages professional search firms to help identify potential Independent Trustee candidates who have the experience, qualifications, attributes, and skills consistent with the Statement of Policy. From time to time, additional criteria based on the composition and skills of the current Independent Trustees, as well as experience or skills that may be appropriate in light of future changes to board composition, business conditions, and regulatory or other developments, have also been considered by the professional search firms and the Governance and Nominating Committee. In addition, the Board takes into account the Trustees' commitment and participation in Board and committee meetings, as well as their leadership of standing and ad hoc committees throughout their tenure.
In determining that a particular Trustee was and continues to be qualified to serve as a Trustee, the Board has considered a variety of criteria, none of which, in isolation, was controlling. The Board believes that, collectively, the Trustees have balanced and diverse experience, qualifications, attributes, and skills, which allow the Board to operate effectively in governing the fund and protecting the interests of shareholders. Information about the specific experience, skills, attributes, and qualifications of each Trustee, which in each case led to the Board's conclusion that the Trustee should serve (or continue to serve) as a trustee of the fund, is provided below.
Board Structure and Oversight Function. James C. Curvey is an interested person and currently serves as Chairman. The Trustees have determined that an interested Chairman is appropriate and benefits shareholders because an interested Chairman has a personal and professional stake in the quality and continuity of services provided to the fund. Independent Trustees exercise their informed business judgment to appoint an individual of their choosing to serve as Chairman, regardless of whether the Trustee happens to be independent or a member of management. The Independent Trustees have determined that they can act independently and effectively without having an Independent Trustee serve as Chairman and that a key structural component for assuring that they are in a position to do so is for the Independent Trustees to constitute a substantial majority for the Board. The Independent Trustees also regularly meet in executive session. Ned C. Lautenbach serves as Chairman of the Independent Trustees and as such (i) acts as a liaison between the Independent Trustees and management with respect to matters important to the Independent Trustees and (ii) with management prepares agendas for Board meetings.
Fidelity® funds are overseen by different Boards of Trustees. The fund's Board oversees Fidelity's high income and certain equity funds, and other Boards oversee Fidelity's investment-grade bond, money market, asset allocation, and other equity funds. The asset allocation funds may invest in Fidelity® funds overseen by the fund's Board. The use of separate Boards, each with its own committee structure, allows the Trustees of each group of Fidelity® funds to focus on the unique issues of the funds they oversee, including common research, investment, and operational issues. On occasion, the separate Boards establish joint committees to address issues of overlapping consequences for the Fidelity® funds overseen by each Board.
The Trustees operate using a system of committees to facilitate the timely and efficient consideration of all matters of importance to the Trustees, the fund, and fund shareholders and to facilitate compliance with legal and regulatory requirements and oversight of the fund's activities and associated risks. The Board, acting through its committees, has charged FMR and its affiliates with (i) identifying events or circumstances the occurrence of which could have demonstrably adverse effects on the fund's business and/or reputation; (ii) implementing processes and controls to lessen the possibility that such events or circumstances occur or to mitigate the effects of such events or circumstances if they do occur; and (iii) creating and maintaining a system designed to evaluate continuously business and market conditions in order to facilitate the identification and implementation processes described in (i) and (ii) above. Because the day-to-day operations and activities of the fund are carried out by or through FMR, its affiliates, and other service providers, the fund's exposure to risks is mitigated but not eliminated by the processes overseen by the Trustees. While each of the Board's committees has responsibility for overseeing different aspects of the fund's activities, oversight is exercised primarily through the Operations, Audit, and Compliance Committees. Appropriate personnel, including but not limited to the fund's Chief Compliance Officer (CCO), FMR's internal auditor, the independent accountants, the fund's Treasurer and portfolio management personnel, make periodic reports to the Board's committees, as appropriate, including an annual review of Fidelity's risk management program for the Fidelity® funds. The responsibilities of each standing committee, including their oversight responsibilities, are described further under "Standing Committees of the Trustees."
Interested Trustees*:
Correspondence intended for a Trustee who is an interested person may be sent to Fidelity Investments, 245 Summer Street, Boston, Massachusetts 02210.
Name, Year of Birth; Principal Occupations and Other Relevant Experience+
Jonathan Chiel (1957)
Year of Election or Appointment: 2016
Trustee
Mr. Chiel also serves as Trustee of other Fidelity® funds. Mr. Chiel is Executive Vice President and General Counsel for FMR LLC (diversified financial services company, 2012-present). Previously, Mr. Chiel served as general counsel (2004-2012) and senior vice president and deputy general counsel (2000-2004) for John Hancock Financial Services; a partner with Choate, Hall & Stewart (1996-2000) (law firm); and an Assistant United States Attorney for the United States Attorney’s Office of the District of Massachusetts (1986-95), including Chief of the Criminal Division (1993-1995). Mr. Chiel is a director on the boards of the Boston Bar Foundation and the Maimonides School.
James C. Curvey (1935)
Year of Election or Appointment: 2007
Trustee
Chairman of the Board of Trustees
Mr. Curvey also serves as Trustee of other Fidelity® funds. Mr. Curvey is Vice Chairman (2007-present) and Director of FMR LLC (diversified financial services company). In addition, Mr. Curvey is an Overseer Emeritus for the Boston Symphony Orchestra, a Director of Artis-Naples, and a Trustee of Brewster Academy in Wolfeboro, New Hampshire. Previously, Mr. Curvey served as a Director of Fidelity Research & Analysis Co. (investment adviser firm, 2009-2018), Director of Fidelity Investments Money Management, Inc. (investment adviser firm, 2009-2014) and a Director of FMR and FMR Co., Inc. (investment adviser firms, 2007-2014).
* Determined to be an “Interested Trustee” by virtue of, among other things, his or her affiliation with the trust or various entities under common control with FMR.
+ The information includes the Trustee's principal occupation during the last five years and other information relating to the experience, attributes, and skills relevant to the Trustee's qualifications to serve as a Trustee, which led to the conclusion that the Trustee should serve as a Trustee for the fund.
Independent Trustees:
Correspondence intended for an Independent Trustee may be sent to Fidelity Investments, P.O. Box 55235, Boston, Massachusetts 02205-5235.
Name, Year of Birth; Principal Occupations and Other Relevant Experience+
Dennis J. Dirks (1948)
Year of Election or Appointment: 2005
Trustee
Mr. Dirks also serves as Trustee of other Fidelity® funds. Prior to his retirement in May 2003, Mr. Dirks was Chief Operating Officer and a member of the Board of The Depository Trust & Clearing Corporation (DTCC). He also served as President, Chief Operating Officer, and Board member of The Depository Trust Company (DTC) and President and Board member of the National Securities Clearing Corporation (NSCC). In addition, Mr. Dirks served as Chief Executive Officer and Board member of the Government Securities Clearing Corporation, Chief Executive Officer and Board member of the Mortgage-Backed Securities Clearing Corporation, as a Trustee and a member of the Finance Committee of Manhattan College (2005-2008), as a Trustee and a member of the Finance Committee of AHRC of Nassau County (2006-2008), as a member of the Independent Directors Council (IDC) Governing Council (2010-2015), and as a member of the Board of Directors for The Brookville Center for Children’s Services, Inc. (2009-2017). Mr. Dirks is a member of the Finance Committee (2016-present) and Board of Directors (2017-present) and is Treasurer (2018-present) of the Asolo Repertory Theatre.
Donald F. Donahue (1950)
Year of Election or Appointment: 2018
Trustee
Mr. Donahue also serves as a Trustee of other Fidelity® funds. Mr. Donahue is President and Chief Executive Officer of Miranda Partners, LLC (risk consulting for the financial services industry, 2012-present). Previously, Mr. Donahue served as a Member of the Advisory Board of certain Fidelity® funds (2015-2018) and Chief Executive Officer (2006-2012), Chief Operating Officer (2003-2006), and Managing Director, Customer Marketing and Development (1999-2003) of The Depository Trust & Clearing Corporation (financial markets infrastructure). Mr. Donahue serves as a Member (2007-present) and Co-Chairman (2016-present) of the Board of Directors of United Way of New York, Member of the Board of Directors of NYC Leadership Academy (2012-present) and Member of the Board of Advisors of Ripple Labs, Inc. (financial services, 2015-present). He also served as Chairman (2010-2012) and Member of the Board of Directors (2012-2013) of Omgeo, LLC (financial services), Treasurer of United Way of New York (2012-2016), and Member of the Board of Directors of XBRL US (financial services non-profit, 2009-2012) and the International Securities Services Association (2009-2012).
Alan J. Lacy (1953)
Year of Election or Appointment: 2008
Trustee
Mr. Lacy also serves as Trustee of other Fidelity® funds. Mr. Lacy serves as a Director of Bristol-Myers Squibb Company (global pharmaceuticals, 2008-present). He is a Trustee of the California Chapter of The Nature Conservancy (2015-present) and a Director of the Center for Advanced Study in the Behavioral Sciences at Stanford University (2015-present). In addition, Mr. Lacy served as Senior Adviser (2007-2014) of Oak Hill Capital Partners, L.P. (private equity) and also served as Chief Executive Officer (2005) and Vice Chairman (2005-2006) of Sears Holdings Corporation (retail) and Chief Executive Officer and Chairman of the Board of Sears, Roebuck and Co. (retail, 2000-2005). Previously, Mr. Lacy served as Chairman (2014-2017) and a member (2010-2017) of the Board of Directors of Dave & Buster’s Entertainment, Inc. (restaurant and entertainment complexes), as Chairman (2008-2011) and a member (2006-2015) of the Board of Trustees of the National Parks Conservation Association, and as a member of the Board of Directors for The Hillman Companies, Inc. (hardware wholesalers, 2010-2014), Earth Fare, Inc. (retail grocery, 2010-2014), and The Western Union Company (global money transfer, 2006-2011).
Ned C. Lautenbach (1944)
Year of Election or Appointment: 2000
Trustee
Chairman of the Independent Trustees
Mr. Lautenbach also serves as Trustee of other Fidelity® funds. Mr. Lautenbach currently serves as Chair (2018-present) and Member (2013-present) of the Board of Governors, State University System of Florida and is a member of the Council on Foreign Relations (1994-present). He is also a member and has most recently served as Chairman of the Board of Directors of Artis-Naples (2012-present). Previously, Mr. Lautenbach served as a member and then Lead Director of the Board of Directors of Eaton Corporation (diversified industrial, 1997-2016). He was also a Partner and Advisory Partner at Clayton, Dubilier & Rice, LLC (private equity investment, 1998-2010), as well as a Director of Sony Corporation (2006-2007). In addition, Mr. Lautenbach also had a 30-year career with IBM (technology company) during which time he served as Senior Vice President and a member of the Corporate Executive Committee (1968-1998).
Joseph Mauriello (1944)
Year of Election or Appointment: 2008
Trustee
Mr. Mauriello also serves as Trustee of other Fidelity® funds. Prior to his retirement in January 2006, Mr. Mauriello served in numerous senior management positions including Deputy Chairman and Chief Operating Officer (2004-2005), and Vice Chairman of Financial Services (2002-2004) of KPMG LLP US (professional services, 1965-2005). Mr. Mauriello currently serves as a member of the Independent Directors Council (IDC) Governing Council (2015-present). Previously, Mr. Mauriello served as a member of the Board of Directors of XL Group plc. (global insurance and re-insurance, 2006-2018).
Cornelia M. Small (1944)
Year of Election or Appointment: 2005
Trustee
Ms. Small also serves as Trustee of other Fidelity® funds. Ms. Small is a member of the Board of Directors (2009-present) and Chair of the Investment Committee (2010-present) of the Teagle Foundation. Ms. Small also serves on the Investment Committee of the Berkshire Taconic Community Foundation (2008-present). Previously, Ms. Small served as Chairperson (2002-2008) and a member of the Investment Committee and Chairperson (2008-2012) and a member of the Board of Trustees of Smith College. In addition, Ms. Small served as Chief Investment Officer, Director of Global Equity Investments, and a member of the Board of Directors of Scudder, Stevens & Clark and Scudder Kemper Investments.
Garnett A. Smith (1947)
Year of Election or Appointment: 2018
Trustee
Mr. Smith also serves as Trustee of other Fidelity® funds. Prior to Mr. Smith's retirement, he served as Chairman and Chief Executive Officer of Inbrand Corp. (manufacturer of personal absorbent products, 1990-1997). He also served as President (1986-1990) of Inbrand Corp. Prior to his employment with Inbrand Corp., he was employed by a retail fabric chain and North Carolina National Bank. In addition, Mr. Smith served as a Member of the Advisory Board of certain Fidelity® funds (2012-2013) and as a board member of the Jackson Hole Land Trust (2009-2012).
David M. Thomas (1949)
Year of Election or Appointment: 2008
Trustee
Mr. Thomas also serves as Trustee of other Fidelity® funds. Mr. Thomas serves as Non-Executive Chairman of the Board of Directors of Fortune Brands Home and Security (home and security products, 2011-present) and as a member of the Board of Directors (2004-present) and Presiding Director (2013-present) of Interpublic Group of Companies, Inc. (marketing communication). Previously, Mr. Thomas served as Executive Chairman (2005-2006) and Chairman and Chief Executive Officer (2000-2005) of IMS Health, Inc. (pharmaceutical and healthcare information solutions), a Director of Fortune Brands, Inc. (consumer products, 2000-2011), and a member of the Board of Trustees of the University of Florida (2013-2018).
+ The information includes the Trustee's principal occupation during the last five years and other information relating to the experience, attributes, and skills relevant to the Trustee's qualifications to serve as a Trustee, which led to the conclusion that the Trustee should serve as a Trustee for the fund.
Advisory Board Members and Officers:
Correspondence intended for a Member of the Advisory Board (if any) may be sent to Fidelity Investments, P.O. Box 55235, Boston, Massachusetts 02205-5235. Correspondence intended for an officer or Peter S. Lynch may be sent to Fidelity Investments, 245 Summer Street, Boston, Massachusetts 02210. Officers appear below in alphabetical order.
Name, Year of Birth; Principal Occupation
Vicki L. Fuller (1957)
Year of Election or Appointment: 2018
Member of the Advisory Board
Ms. Fuller also serves as Member of the Advisory Board of other Fidelity® funds. Ms. Fuller serves as a member of the Board of Directors, Audit Committee, and Nominating and Governance Committee of The Williams Companies, Inc. (natural gas infrastructure, 2018-present). Previously, Ms. Fuller served as the Chief Investment Officer of the New York State Common Retirement Fund (2012-2018) and held a variety of positions at AllianceBernstein L.P. (global asset management, 1985-2012), including Managing Director (2006-2012) and Senior Vice President and Senior Portfolio Manager (2001-2006).
Peter S. Lynch (1944)
Year of Election or Appointment: 2003
Member of the Advisory Board
Mr. Lynch also serves as Member of the Advisory Board of other Fidelity® funds. Mr. Lynch is Vice Chairman and a Director of FMR (investment adviser firm) and FMR Co., Inc. (investment adviser firm). In addition, Mr. Lynch serves as a Trustee of Boston College and as the Chairman of the Inner-City Scholarship Fund. Previously, Mr. Lynch served on the Special Olympics International Board of Directors (1997-2006).
Michael E. Wiley (1950)
Year of Election or Appointment: 2018
Member of the Advisory Board
Mr. Wiley also serves as Trustee or Member of the Advisory Board of other Fidelity® funds. Mr. Wiley serves as a Director of High Point Resources (exploration and production, 2005-present). Previously, Mr. Wiley served as a Director of Andeavor Corporation (independent oil refiner and marketer, 2005-2018), a Director of Andeavor Logistics LP (natural resources logistics, 2015-2018), a Director of Post Oak Bank (privately-held bank, 2004-2018), a Director of Asia Pacific Exploration Consolidated (international oil and gas exploration and production, 2008-2013), a member of the Board of Trustees of the University of Tulsa (2000-2006; 2007-2010), a Senior Energy Advisor of Katzenbach Partners, LLC (consulting, 2006-2007), an Advisory Director of Riverstone Holdings (private investment), a Director of Spinnaker Exploration Company (exploration and production, 2001-2005) and Chairman, President, and CEO of Baker Hughes, Inc. (oilfield services, 2000-2004).
Elizabeth Paige Baumann (1968)
Year of Election or Appointment: 2017
Anti-Money Laundering (AML) Officer
Ms. Baumann also serves as AML Officer of other funds. She is Chief AML Officer (2012-present) and Senior Vice President (2014-present) of FMR LLC (diversified financial services company) and is an employee of Fidelity Investments. Previously, Ms. Baumann served as AML Officer of the funds (2012-2016), and Vice President (2007-2014) and Deputy Anti-Money Laundering Officer (2007-2012) of FMR LLC.
Craig S. Brown (1977)
Year of Election or Appointment: 2019
Assistant Treasurer
Mr. Brown also serves as Assistant Treasurer of other funds. Mr. Brown is an employee of Fidelity Investments (2013-present).
John J. Burke III (1964)
Year of Election or Appointment: 2018
Chief Financial Officer
Mr. Burke also serves as Chief Financial Officer of other funds. Mr. Burke serves as Head of Investment Operations for Fidelity Fund and Investment Operations (2018-present) and is an employee of Fidelity Investments (1998-present). Previously Mr. Burke served as head of Asset Management Investment Operations (2012-2018).
William C. Coffey (1969)
Year of Election or Appointment: 2019
Assistant Secretary
Mr. Coffey also serves as Assistant Secretary of other funds. He is Senior Vice President and Deputy General Counsel of FMR LLC (diversified financial services company, 2010-present), and is an employee of Fidelity Investments. Previously, Mr. Coffey served as Secretary and CLO of certain funds (2018-2019); CLO, Secretary, and Senior Vice President of Fidelity Management & Research Company and FMR Co., Inc. (investment adviser firms, 2018-2019); Secretary of Fidelity SelectCo, LLC and Fidelity Investments Money Management, Inc. (investment adviser firms, 2018-2019); CLO of Fidelity Management & Research (Hong Kong) Limited, FMR Investment Management (UK) Limited, and Fidelity Management & Research (Japan) Limited (investment adviser firms, 2018-2019); and Assistant Secretary of certain funds (2009-2018).
Timothy M. Cohen (1969)
Year of Election or Appointment: 2018
Vice President
Mr. Cohen also serves as Vice President of other funds. Mr. Cohen serves as Executive Vice President of Fidelity SelectCo, LLC (2019-present), Co-Head of Equity (2018-present), a Director of Fidelity Management & Research (Japan) Limited (investment adviser firm, 2016-present), and is an employee of Fidelity Investments. Previously, Mr. Cohen served as Head of Global Equity Research (2016-2018), Chief Investment Officer - Equity and a Director of Fidelity Management & Research (U.K.) Inc. (investment adviser firm, 2013-2015) and as a Director of Fidelity Management & Research (Hong Kong) Limited (investment adviser firm, 2017).
Jonathan Davis (1968)
Year of Election or Appointment: 2010
Assistant Treasurer
Mr. Davis also serves as Assistant Treasurer of other funds. Mr. Davis serves as Assistant Treasurer of FMR Capital, Inc. (2017-present) and is an employee of Fidelity Investments. Previously, Mr. Davis served as Vice President and Associate General Counsel of FMR LLC (diversified financial services company, 2003-2010).
Adrien E. Deberghes (1967)
Year of Election or Appointment: 2016
Assistant Treasurer
Mr. Deberghes also serves as an officer of other funds. He serves as Assistant Treasurer of FMR Capital, Inc. (2017-present), Executive Vice President of Fidelity Investments Money Management, Inc. (FIMM) (investment adviser firm, 2016-present), and is an employee of Fidelity Investments (2008-present). Previously, Mr. Deberghes served as President and Treasurer of certain Fidelity® funds (2013-2018). Prior to joining Fidelity Investments, Mr. Deberghes was Senior Vice President of Mutual Fund Administration at State Street Corporation (2007-2008), Senior Director of Mutual Fund Administration at Investors Bank & Trust (2005-2007), and Director of Finance for Dunkin' Brands (2000-2005). Previously, Mr. Deberghes served in other fund officer roles.
Laura M. Del Prato (1964)
Year of Election or Appointment: 2018
Assistant Treasurer
Ms. Del Prato also serves as an officer of other funds. Ms. Del Prato is an employee of Fidelity Investments (2017-present). Prior to joining Fidelity Investments, Ms. Del Prato served as a Managing Director and Treasurer of the JPMorgan Mutual Funds (2014-2017). Prior to JPMorgan, Ms. Del Prato served as a partner at Cohen Fund Audit Services (accounting firm, 2012-2013) and KPMG LLP (accounting firm, 2004-2012).
Colm A. Hogan (1973)
Year of Election or Appointment: 2016
Deputy Treasurer
Mr. Hogan also serves as an officer of other funds. Mr. Hogan serves as Assistant Treasurer of FMR Capital, Inc. (2017-present) and is an employee of Fidelity Investments (2005-present). Previously, Mr. Hogan served as Assistant Treasurer of certain Fidelity® funds (2016-2018).
Pamela R. Holding (1964)
Year of Election or Appointment: 2018
Vice President
Ms. Holding also serves as Vice President of other funds. Ms. Holding serves as Executive Vice President of Fidelity SelectCo, LLC (2019-present), Co-Head of Equity (2018-present) and is an employee of Fidelity Investments (2013-present). Previously, Ms. Holding served as Chief Investment Officer of Fidelity Institutional Asset Management (2013-2018).
Cynthia Lo Bessette (1969)
Year of Election or Appointment: 2019
Secretary and Chief Legal Officer (CLO)
Ms. Lo Bessette also serves as Secretary and CLO of other funds. Ms. Lo Bessette serves as CLO, Secretary, and Senior Vice President of Fidelity Management & Research Company and FMR Co., Inc. (investment adviser firms, 2019-present); Secretary of Fidelity SelectCo, LLC and Fidelity Investments Money Management, Inc. (investment adviser firms, 2019-present); and CLO of Fidelity Management & Research (Hong Kong) Limited, FMR Investment Management (UK) Limited, and Fidelity Management & Research (Japan) Limited (investment adviser firms, 2019-present). She is a Senior Vice President and Deputy General Counsel of FMR LLC (diversified financial services company, 2019-present), and is an employee of Fidelity Investments. Previously, Ms. Lo Bessette served as Executive Vice President, General Counsel (2016-2019) and Senior Vice President, Deputy General Counsel (2015-2016) of OppenheimerFunds (investment management company) and Deputy Chief Legal Officer (2013-2015) of Jennison Associates LLC (investment adviser firm).
Chris Maher (1972)
Year of Election or Appointment: 2013
Assistant Treasurer
Mr. Maher serves as Assistant Treasurer of other funds. Mr. Maher is Vice President of Valuation Oversight, serves as Assistant Treasurer of FMR Capital, Inc. (2017-present), and is an employee of Fidelity Investments. Previously, Mr. Maher served as Vice President of Asset Management Compliance (2013), Vice President of the Program Management Group of FMR (investment adviser firm, 2010-2013), and Vice President of Valuation Oversight (2008-2010).
Kenneth B. Robins (1969)
Year of Election or Appointment: 2016
Chief Compliance Officer
Mr. Robins also serves as an officer of other funds. Mr. Robins serves as Compliance Officer of Fidelity Management & Research Company and FMR Co., Inc. (investment adviser firms, 2016-present) and is an employee of Fidelity Investments (2004-present). Previously, Mr. Robins served as Executive Vice President of Fidelity Investments Money Management, Inc. (investment adviser firm, 2013-2016) and served in other fund officer roles.
Stacie M. Smith (1974)
Year of Election or Appointment: 2016
President and Treasurer
Ms. Smith also serves as an officer of other funds. Ms. Smith serves as Assistant Treasurer of FMR Capital, Inc. (2017-present), is an employee of Fidelity Investments (2009-present), and has served in other fund officer roles. Prior to joining Fidelity Investments, Ms. Smith served as Senior Audit Manager of Ernst & Young LLP (accounting firm, 1996-2009). Previously, Ms. Smith served as Assistant Treasurer (2013-2018) and Deputy Treasurer (2013-2016) of certain Fidelity® funds.
Marc L. Spector (1972)
Year of Election or Appointment: 2016
Assistant Treasurer
Mr. Spector also serves as an officer of other funds. Mr. Spector serves as Assistant Treasurer of FMR Capital, Inc. (2017-present) and is an employee of Fidelity Investments (2016-present). Prior to joining Fidelity Investments, Mr. Spector served as Director at the Siegfried Group (accounting firm, 2013-2016), and prior to Siegfried Group as audit senior manager at Deloitte & Touche (accounting firm, 2005-2013).
Jim Wegmann (1979)
Year of Election or Appointment: 2019
Assistant Treasurer
Mr. Wegmann also serves as Assistant Treasurer of other funds. Mr. Wegmann is an employee of Fidelity Investments (2011-present).
Shareholder Expense Example
As a shareholder of the Fund, you incur two types of costs: (1) transaction costs and (2) ongoing costs, including management fees and other Fund expenses. This Example is intended to help you understand your ongoing costs (in dollars) of investing in the Fund and to compare these costs with the ongoing costs of investing in other mutual funds.
The Example is based on an investment of $1,000 invested at the beginning of the period and held for the entire period (May 1, 2019 to October 31, 2019).
Actual Expenses
The first line of the accompanying table provides information about actual account values and actual expenses. You may use the information in this line, together with the amount you invested, to estimate the expenses that you paid over the period. Simply divide your account value by $1,000.00 (for example, an $8,600 account value divided by $1,000.00 = 8.6), then multiply the result by the number in the first line under the heading entitled "Expenses Paid During Period" to estimate the expenses you paid on your account during this period. In addition, the Fund, as a shareholder in the underlying Fidelity Central Funds, will indirectly bear its pro-rata share of the fees and expenses incurred by the underlying Fidelity Central Funds. These fees and expenses are not included in the Fund's annualized expense ratio used to calculate the expense estimate in the table below.
Hypothetical Example for Comparison Purposes
The second line of the accompanying table provides information about hypothetical account values and hypothetical expenses based on the Fund's actual expense ratio and an assumed rate of return of 5% per year before expenses, which is not the Fund's actual return. The hypothetical account values and expenses may not be used to estimate the actual ending account balance or expenses you paid for the period. You may use this information to compare the ongoing costs of investing in the Fund and other funds. To do so, compare this 5% hypothetical example with the 5% hypothetical examples that appear in the shareholder reports of the other funds. In addition, the Fund, as a shareholder in the underlying Fidelity Central Funds, will indirectly bear its pro-rata share of the fees and expenses incurred by the underlying Fidelity Central Funds. These fees and expenses are not included in the Fund's annualized expense ratio used to calculate the expense estimate in the table below.
Please note that the expenses shown in the table are meant to highlight your ongoing costs only and do not reflect any transaction costs. Therefore, the second line of the table is useful in comparing ongoing costs only, and will not help you determine the relative total costs of owning different funds.
| | Annualized Expense Ratio-A | Beginning
Account Value
May 1, 2019 | Ending
Account Value
October 31, 2019 | Expenses Paid
During Period-B
May 1, 2019
to October 31, 2019 |
| Actual | .60% | $1,000.00 | $1,059.30 | $3.11 |
| Hypothetical-C | | $1,000.00 | $1,022.18 | $3.06 |
A Annualized expense ratio reflects expenses net of applicable fee waivers.
B Expenses are equal to the Fund's annualized expense ratio, multiplied by the average account value over the period, multiplied by 184/365 (to reflect the one-half year period).
C 5% return per year before expenses
Distributions (Unaudited)
The Board of Trustees of Fidelity Diversified International K6 Fund voted to pay on December 9, 2019, to shareholders of record at the opening of business on December 6, 2019, a distribution of $0.031 per share derived from capital gains realized from sales of portfolio securities and a dividend of $0.151 per share from net investment income.
The fund designates 4% of the dividend distributed during the fiscal year as qualifying for the dividends–received deduction for corporate shareholders.
The fund designates 100% of the dividend distributed during the fiscal year as amounts which may be taken into account as a dividend for the purposes of the maximum rate under section 1(h)(11) of the Internal Revenue Code.
The amounts per share which represent income derived from sources within, and taxes paid to, foreign countries or possessions of the United States are $0.1370 and $0.0120 for the dividend paid December 10, 2018.
The fund will notify shareholders in January 2020 of amounts for use in preparing 2019 income tax returns.

DIFK6-ANN-1219
1.9883987.102
Fidelity® Emerging Markets Discovery Fund
Fidelity® Total Emerging Markets Fund
Annual Report
October 31, 2019
Includes Fidelity and Fidelity Advisor share classes
See the inside front cover for important information about access to your fund’s shareholder reports.
Beginning on January 1, 2021, as permitted by regulations adopted by the Securities and Exchange Commission, paper copies of a fund’s shareholder reports will no longer be sent by mail, unless you specifically request paper copies of the reports from the fund or from your financial intermediary, such as a financial advisor, broker-dealer or bank. Instead, the reports will be made available on a website, and you will be notified by mail each time a report is posted and provided with a website link to access the report.
If you already elected to receive shareholder reports electronically, you will not be affected by this change and you need not take any action. You may elect to receive shareholder reports and other communications from a fund electronically, by contacting your financial intermediary. For Fidelity customers, visit Fidelity's web site or call Fidelity using the contact information listed below.
You may elect to receive all future reports in paper free of charge. If you wish to continue receiving paper copies of your shareholder reports, you may contact your financial intermediary or, if you are a Fidelity customer, visit Fidelity’s website, or call Fidelity at the applicable toll-free number listed below. Your election to receive reports in paper will apply to all funds held with the fund complex/your financial intermediary.
| Account Type | Website | Phone Number |
| Brokerage, Mutual Fund, or Annuity Contracts: | fidelity.com/mailpreferences | 1-800-343-3548 |
| Employer Provided Retirement Accounts: | netbenefits.fidelity.com/preferences (choose 'no' under Required Disclosures to continue to print) | 1-800-343-0860 |
| Advisor Sold Accounts Serviced Through Your Financial Intermediary: | Contact Your Financial Intermediary | Your Financial Intermediary's phone number |
| Advisor Sold Accounts Serviced by Fidelity: | institutional.fidelity.com | 1-877-208-0098 |
Contents
To view a fund's proxy voting guidelines and proxy voting record for the 12-month period ended June 30, visit http://www.fidelity.com/proxyvotingresults or visit the Securities and Exchange Commission's (SEC) web site at http://www.sec.gov.
You may also call 1-800-544-8544 if you’re an individual investing directly with Fidelity, call 1-800-835-5092 if you’re a plan sponsor or participant with Fidelity as your recordkeeper or call 1-877-208-0098 on institutional accounts or if you’re an advisor or invest through one to request a free copy of the proxy voting guidelines.
Standard & Poor's, S&P and S&P 500 are registered service marks of The McGraw-Hill Companies, Inc. and have been licensed for use by Fidelity Distributors Corporation.
Other third-party marks appearing herein are the property of their respective owners.
All other marks appearing herein are registered or unregistered trademarks or service marks of FMR LLC or an affiliated company. © 2019 FMR LLC. All rights reserved.
This report and the financial statements contained herein are submitted for the general information of the shareholders of the Funds. This report is not authorized for distribution to prospective investors in the Funds unless preceded or accompanied by an effective prospectus.
A fund files its complete schedule of portfolio holdings with the SEC for the first and third quarters of each fiscal year on Form N-PORT. Forms N-PORT are available on the SEC’s web site at http://www.sec.gov. A fund's Forms N-PORT may be reviewed and copied at the SEC’s Public Reference Room in Washington, DC. Information regarding the operation of the SEC's Public Reference Room may be obtained by calling 1-800-SEC-0330.
For a complete list of a fund's portfolio holdings, view the most recent holdings listing, semiannual report, or annual report on Fidelity's web site at http://www.fidelity.com, http://www.institutional.fidelity.com, or http://www.401k.com, as applicable.
NOT FDIC INSURED •MAY LOSE VALUE •NO BANK GUARANTEE
Neither the Funds nor Fidelity Distributors Corporation is a bank.
Fidelity® Emerging Markets Discovery Fund
Performance: The Bottom Line
Average annual total return reflects the change in the value of an investment, assuming reinvestment of distributions from dividend income and capital gains (the profits earned upon the sale of securities that have grown in value, if any) and assuming a constant rate of performance each year. The hypothetical investment and the average annual total returns do not reflect the deduction of taxes that a shareholder would pay on fund distributions or the redemption of fund shares. During periods of reimbursement by Fidelity, a fund’s total return will be greater than it would be had the reimbursement not occurred. How a fund did yesterday is no guarantee of how it will do tomorrow.
Average Annual Total Returns
| For the periods ended October 31, 2019 | Past 1 year | Past 5 years | Life of fundA |
| Class A (incl. 5.75% sales charge) | 8.85% | 2.20% | 4.54% |
| Class M (incl. 3.50% sales charge) | 11.04% | 2.41% | 4.57% |
| Class C (incl. contingent deferred sales charge) | 13.54% | 2.64% | 4.53% |
| Fidelity® Emerging Markets Discovery Fund | 15.78% | 3.71% | 5.60% |
| Class I | 15.78% | 3.71% | 5.61% |
| Class Z | 15.97% | 3.75% | 5.64% |
A From November 1, 2011
Class C shares' contingent deferred sales charges included in the past one year, past five years, and life of fund total return figures are 1%, 0%, and 0%, respectively.
The initial offering of Class Z shares took place on October 2, 2018. Returns prior to October 2, 2018, are those of Class I.
$10,000 Over Life of Fund
Let's say hypothetically that $10,000 was invested in Fidelity® Emerging Markets Discovery Fund, a class of the fund, on November 1, 2011, when the fund started.
The chart shows how the value of your investment would have changed, and also shows how the MSCI Emerging Markets SMID Cap Index performed over the same period.
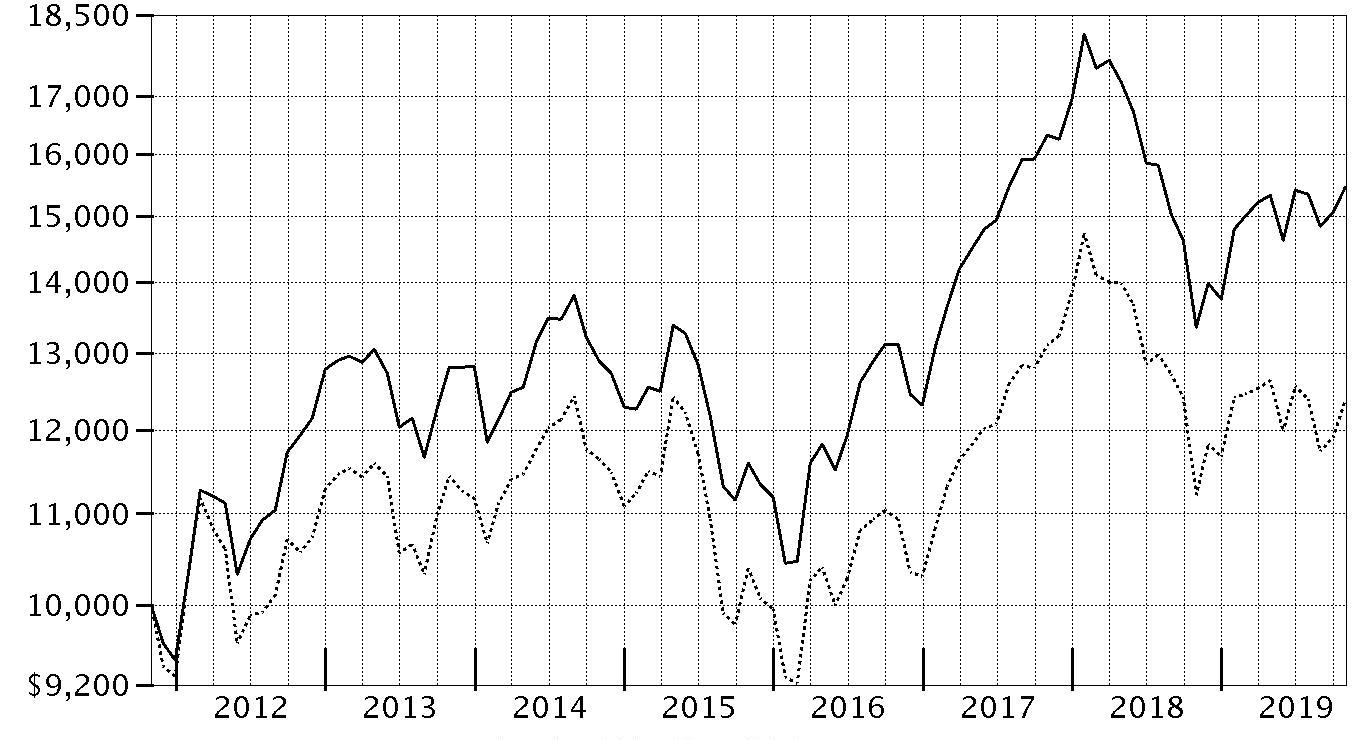
| Period Ending Values |
| $15,466 | Fidelity® Emerging Markets Discovery Fund |
| $12,379 | MSCI Emerging Markets SMID Cap Index |
Fidelity® Emerging Markets Discovery Fund
Management's Discussion of Fund Performance
Market Recap: The MSCI ACWI (All Country World Index) ex USA Index gained 11.47% for the 12 months ending October 31, 2019, as international stocks reflected a confluence of factors, including escalating trade tension, and moderating but still positive global economic growth. Currency fluctuations were largely modest and varied by region, muting the overall impact on international equity returns. In late December, the U.S. Federal Reserve shifted from raising interest rates to a more dovish policy in 2019, joining many foreign central banks. In June, international stocks rose 6.03%, as policy stimulus in China stabilized that country’s economic growth. The Fed cut its policy rate in July for the first time since 2008. However, the index returned -1.21% for the month, followed by -3.08% in August. In September, the Fed cut its policy rate another quarter point, citing concerns about slowing economic growth and muted inflation, and did the same in October, leading to monthly gains of 2.59% and 3.49%, respectively. For the full 12 months, the growth-oriented information technology sector (+22%) led the way, followed by utilities (+20%) and real estate (+18%), two high-dividend-yielding categories. Conversely, energy was roughly flat, while materials (+6%) and communication services (7%) also lagged. By region, Asia Pacific ex Japan (+16%), Europe ex U.K (+13%), Canada (+12%) and emerging markets (+12%) fared best. Meanwhile, the U.K. (+7%) and Japan (+10%) trailed the broader market.
Comments from Co-Portfolio Manager Jane Wu: For the fiscal year, the fund’s share classes (excluding sales charges, if applicable) gained about 15% to 16%, ahead of the 10.44% result of the benchmark MSCI Emerging Markets SMID Index. Security selection drove the fund’s outperformance of the benchmark the past 12 months, particularly within the health care, financials, materials and consumer staples sectors. Conversely, choices within consumer discretionary detracted most. Among individual stocks, an overweighting in Impala Platinum Holdings contributed most. Shares of the leading South African platinum group metals miner gained 264% for the fund, lifted by the strong price of palladium. The fund’s position in Notre Dame Intermedica (+132%), a Brazil-based health insurer, also added notable value. This stock benefited from the company’s strong earnings growth. Turning to the negative, a non-benchmark stake in Shangri-La Asia (-23%) detracted most, partly due to disruption related to Hong Kong protests. It also hurt to own Com7, a Thailand-based electronics retailer. This stock fell on concern profit might not keep up with revenue growth, as well as macro uncertainty in Thailand. We sold our stake in Com7 by period end.
The views expressed above reflect those of the portfolio manager(s) only through the end of the period as stated on the cover of this report and do not necessarily represent the views of Fidelity or any other person in the Fidelity organization. Any such views are subject to change at any time based upon market or other conditions and Fidelity disclaims any responsibility to update such views. These views may not be relied on as investment advice and, because investment decisions for a Fidelity fund are based on numerous factors, may not be relied on as an indication of trading intent on behalf of any Fidelity fund.
Note to shareholders: On December 1, 2018, Xiaoting Zhao assumed portfolio management responsibilities for the fund's telecommunication services subportfolio, succeeding James Hayes.
Fidelity® Emerging Markets Discovery Fund
Investment Summary (Unaudited)
Top Five Stocks as of October 31, 2019
| | % of fund's net assets |
| PagSeguro Digital Ltd. (Cayman Islands, IT Services) | 1.7 |
| Fourlis Holdings SA (Greece, Specialty Retail) | 1.7 |
| Unimicron Technology Corp. (Taiwan, Electronic Equipment & Components) | 1.6 |
| Notre Dame Intermedica Participacoes SA (Brazil, Health Care Providers & Services) | 1.5 |
| Nanya Technology Corp. (Taiwan, Semiconductors & Semiconductor Equipment) | 1.5 |
| | 8.0 |
Top Five Market Sectors as of October 31, 2019
| | % of fund's net assets |
| Consumer Discretionary | 15.5 |
| Industrials | 14.0 |
| Financials | 12.3 |
| Materials | 11.7 |
| Information Technology | 11.2 |
Top Five Countries as of October 31, 2019
| (excluding cash equivalents) | % of fund's net assets |
| Cayman Islands | 15.3 |
| Brazil | 13.0 |
| Taiwan | 7.8 |
| India | 7.3 |
| China | 6.8 |
Percentages are adjusted for the effect of futures contracts, if applicable.
Asset Allocation (% of fund's net assets)
| As of October 31, 2019 |
| | Stocks and Equity Futures | 97.3% |
| | Short-Term Investments and Net Other Assets (Liabilities) | 2.7% |

Fidelity® Emerging Markets Discovery Fund
Schedule of Investments October 31, 2019
Showing Percentage of Net Assets
| Common Stocks - 93.7% | | | |
| | | Shares | Value |
| Austria - 0.3% | | | |
| Addiko Bank AG | | 44,099 | $772,183 |
| Bangladesh - 0.2% | | | |
| BRAC Bank Ltd. | | 1,218,990 | 727,626 |
| Belgium - 1.0% | | | |
| Titan Cement International Trading SA (a) | | 139,600 | 2,914,627 |
| Bermuda - 2.2% | | | |
| AGTech Holdings Ltd. (a) | | 12,640,000 | 602,247 |
| Alibaba Pictures Group Ltd. (a) | | 3,070,000 | 503,532 |
| China Gas Holdings Ltd. | | 124,800 | 531,641 |
| Pacific Basin Shipping Ltd. | | 7,618,000 | 1,763,852 |
| Shangri-La Asia Ltd. | | 3,292,000 | 3,378,950 |
|
| TOTAL BERMUDA | | | 6,780,222 |
|
| Brazil - 10.9% | | | |
| Atacadao Distribuicao Comercio e Industria Ltda | | 488,600 | 2,328,175 |
| Azul SA sponsored ADR (a) | | 71,800 | 2,798,764 |
| BTG Pactual Participations Ltd. unit | | 100,900 | 1,634,326 |
| Centrais Eletricas Brasileiras SA (Electrobras) (a) | | 99,100 | 977,533 |
| Companhia de Saneamento de Minas Gerais | | 83,920 | 1,412,233 |
| Direcional Engenharia SA | | 380,700 | 1,134,364 |
| Estacio Participacoes SA | | 220,200 | 2,155,055 |
| Localiza Rent A Car SA | | 251,085 | 2,703,366 |
| LOG Commercial Properties e Participacoes SA | | 116,200 | 733,041 |
| LPS Brasil Consultoria de Imoveis SA (a) | | 448,200 | 830,352 |
| Natura Cosmeticos SA | | 400,000 | 3,107,842 |
| Notre Dame Intermedica Participacoes SA | | 300,517 | 4,495,953 |
| QGEP Participacoes SA | | 582,900 | 1,912,720 |
| Rumo SA (a) | | 625,500 | 3,556,015 |
| Suzano Papel e Celulose SA | | 162,100 | 1,319,273 |
| Tegma Gestao Logistica SA | | 288,800 | 2,338,196 |
|
| TOTAL BRAZIL | | | 33,437,208 |
|
| British Virgin Islands - 0.3% | | | |
| Dolphin Capital Investors Ltd. (a) | | 7,611,857 | 409,191 |
| Mail.Ru Group Ltd. GDR (Reg. S) (a) | | 28,700 | 609,588 |
|
| TOTAL BRITISH VIRGIN ISLANDS | | | 1,018,779 |
|
| Canada - 0.5% | | | |
| Pan American Silver Corp. | | 93,400 | 1,592,470 |
| Cayman Islands - 15.3% | | | |
| Airtac International Group | | 133,000 | 1,820,693 |
| Bilibili, Inc. ADR (a) | | 63,700 | 1,005,823 |
| China State Construction International Holdings Ltd. | | 1,614,000 | 1,486,419 |
| CStone Pharmaceuticals Co. Ltd. (a)(b) | | 1,170,961 | 1,561,046 |
| Fu Shou Yuan International Group Ltd. | | 3,576,000 | 3,156,177 |
| GDS Holdings Ltd. ADR (a) | | 21,600 | 900,288 |
| Greentree Hospitality Group Ltd. ADR | | 52,108 | 532,023 |
| Haitian International Holdings Ltd. | | 1,030,000 | 2,430,504 |
| Hutchison China Meditech Ltd. sponsored ADR (a) | | 96,298 | 1,820,032 |
| Impro Precision Industries Ltd. (b) | | 4,878,200 | 1,954,482 |
| Kingdee International Software Group Co. Ltd. | | 1,142,000 | 1,251,347 |
| Kingsoft Corp. Ltd. (a)(c) | | 941,090 | 2,165,863 |
| Koolearn Technology Holding Ltd. (a)(b) | | 295,000 | 692,529 |
| LexinFintech Holdings Ltd. ADR (a) | | 70,400 | 798,336 |
| Li Ning Co. Ltd. | | 1,138,500 | 3,860,451 |
| Longfor Properties Co. Ltd. (b) | | 181,000 | 751,178 |
| Maoyan Entertainment (a)(b)(c) | | 1,000,850 | 1,439,415 |
| NetEase, Inc. ADR | | 1,600 | 457,376 |
| PagSeguro Digital Ltd. (a)(c) | | 142,500 | 5,283,899 |
| Parade Technologies Ltd. | | 60,000 | 1,158,765 |
| Shimao Property Holdings Ltd. | | 506,000 | 1,695,143 |
| Silergy Corp. | | 87,170 | 2,452,353 |
| Sunny Optical Technology Group Co. Ltd. | | 66,400 | 1,067,306 |
| TAL Education Group ADR (a) | | 22,270 | 953,379 |
| Uni-President China Holdings Ltd. | | 2,180,000 | 2,251,791 |
| Wise Talent Information Technology Co. Ltd. (a) | | 257,505 | 641,544 |
| Yuzhou Properties Co. | | 2,483,600 | 1,049,127 |
| YY, Inc. ADR (a) | | 11,300 | 642,292 |
| Zai Lab Ltd. ADR (a) | | 45,700 | 1,544,203 |
|
| TOTAL CAYMAN ISLANDS | | | 46,823,784 |
|
| China - 6.8% | | | |
| C&S Paper Co. Ltd. (A Shares) | | 578,400 | 1,022,778 |
| China Communications Services Corp. Ltd. (H Shares) | | 304,000 | 187,728 |
| China Longyuan Power Grid Corp. Ltd. (H Shares) | | 2,159,200 | 1,166,475 |
| China Machinery Engineering Co. (H Shares) | | 3,178,000 | 1,252,061 |
| China Suntien Green Energy Corp. Ltd. (H Shares) | | 1,231,000 | 357,042 |
| Haier Smart Home Co. Ltd. (A Shares) | | 1,736,196 | 3,943,360 |
| Hangzhou Tigermed Consulting Co. Ltd. (A Shares) | | 340,250 | 3,299,190 |
| Hualan Biological Engineer, Inc. (A Shares) | | 446,323 | 2,283,276 |
| Shandong Weigao Medical Polymer Co. Ltd. (H Shares) | | 2,263,289 | 2,598,348 |
| Shenzhen YUTO Packaging Technology Co. Ltd. (A Shares) | | 444,600 | 1,460,385 |
| Sinopec Engineering Group Co. Ltd. (H Shares) | | 2,525,500 | 1,442,709 |
| Tsingtao Brewery Co. Ltd. (H Shares) | | 228,000 | 1,321,264 |
| Zhuzhou CRRC Times Electric Co. Ltd. (H Shares) | | 121,000 | 448,979 |
|
| TOTAL CHINA | | | 20,783,595 |
|
| Colombia - 0.7% | | | |
| Bancolombia SA sponsored ADR | | 42,800 | 2,220,464 |
| Curacao - 0.6% | | | |
| Emirates NBD ELS (Merrill Lynch International & Co. Bank Warrant Program) warrants 1/3/22 (a)(b) | | 529,300 | 1,729,387 |
| Cyprus - 1.1% | | | |
| Etalon Group PLC GDR (Reg. S) | | 456,700 | 812,926 |
| Globaltrans Investment PLC GDR (Reg. S) | | 234,300 | 2,003,265 |
| TCS Group Holding PLC GDR | | 29,300 | 557,286 |
|
| TOTAL CYPRUS | | | 3,373,477 |
|
| Egypt - 1.3% | | | |
| Credit Agricole Egypt | | 388,274 | 1,056,086 |
| Egyptian Kuwaiti Holding | | 1,091,700 | 1,509,821 |
| Six of October Development & Investment Co. | | 1,301,600 | 1,258,052 |
|
| TOTAL EGYPT | | | 3,823,959 |
|
| Greece - 2.5% | | | |
| Alpha Bank AE (a) | | 845,000 | 1,800,981 |
| Fourlis Holdings SA | | 861,000 | 5,185,476 |
| Mytilineos SA | | 64,900 | 710,077 |
|
| TOTAL GREECE | | | 7,696,534 |
|
| Hong Kong - 1.2% | | | |
| China Resources Beer Holdings Co. Ltd. | | 508,000 | 2,604,529 |
| Far East Horizon Ltd. | | 1,261,584 | 1,194,396 |
|
| TOTAL HONG KONG | | | 3,798,925 |
|
| Hungary - 0.2% | | | |
| OTP Bank PLC | | 15,500 | 713,951 |
| India - 7.3% | | | |
| Adani Ports & Special Economic Zone Ltd. (a) | | 469,745 | 2,615,727 |
| CESC Ltd. GDR | | 81,946 | 920,798 |
| Deccan Cements Ltd. (a) | | 222,346 | 1,093,346 |
| Iifl Finance Ltd. (a) | | 408,747 | 655,524 |
| IndusInd Bank Ltd. | | 39,900 | 737,513 |
| JK Cement Ltd. | | 115,971 | 1,823,151 |
| JM Financial Ltd. | | 580,100 | 636,753 |
| LIC Housing Finance Ltd. | | 249,864 | 1,450,263 |
| Mahanagar Gas Ltd. (a) | | 76,600 | 1,098,958 |
| Manappuram General Finance & Leasing Ltd. | | 643,388 | 1,532,879 |
| Oberoi Realty Ltd. (a) | | 141,238 | 1,007,426 |
| Power Grid Corp. of India Ltd. | | 324,468 | 906,690 |
| Shriram Transport Finance Co. Ltd. | | 121,800 | 1,950,982 |
| Solar Industries India Ltd. (a) | | 96,845 | 1,446,321 |
| The Ramco Cements Ltd. (a) | | 229,011 | 2,530,527 |
| Torrent Pharmaceuticals Ltd. | | 73,211 | 1,830,713 |
|
| TOTAL INDIA | | | 22,237,571 |
|
| Indonesia - 1.9% | | | |
| PT ACE Hardware Indonesia Tbk | | 22,251,900 | 2,678,083 |
| PT Ciputra Development Tbk | | 11,818,500 | 933,724 |
| PT Lippo Karawaci Tbk (a) | | 59,190,610 | 994,924 |
| PT Pakuwon Jati Tbk | | 16,353,300 | 727,771 |
| PT Perusahaan Gas Negara Tbk Series B | | 4,092,900 | 614,218 |
|
| TOTAL INDONESIA | | | 5,948,720 |
|
| Japan - 0.3% | | | |
| Iriso Electronics Co. Ltd. | | 19,730 | 975,499 |
| Kenya - 0.4% | | | |
| Equity Group Holdings Ltd. | | 2,755,100 | 1,240,195 |
| Korea (South) - 6.3% | | | |
| AMOREPACIFIC Group, Inc. | | 27,324 | 1,975,246 |
| Daou Technology, Inc. | | 21,331 | 329,911 |
| Hanon Systems | | 208,960 | 2,071,227 |
| Hyundai Fire & Marine Insurance Co. Ltd. | | 51,242 | 1,105,590 |
| Hyundai Wia Corp. | | 34,918 | 1,527,657 |
| Kakao Corp. | | 16,570 | 2,003,482 |
| KB Financial Group, Inc. | | 22,750 | 814,200 |
| Korean Reinsurance Co. | | 147,286 | 999,283 |
| LG Corp. | | 32,030 | 1,899,428 |
| NCSOFT Corp. | | 1,899 | 837,300 |
| Pearl Abyss Corp. (a) | | 4,200 | 777,346 |
| Samsung SDI Co. Ltd. | | 14,335 | 2,786,670 |
| Yuhan Corp. | | 11,606 | 2,226,411 |
|
| TOTAL KOREA (SOUTH) | | | 19,353,751 |
|
| Kuwait - 0.3% | | | |
| National Bank of Kuwait | | 286,360 | 888,150 |
| Malaysia - 0.2% | | | |
| British American Tobacco (Malaysia) Bhd | | 133,900 | 602,813 |
| Mexico - 3.0% | | | |
| CEMEX S.A.B. de CV sponsored ADR | | 395,200 | 1,489,904 |
| Credito Real S.A.B. de CV | | 520,000 | 637,954 |
| Fibra Uno Administracion SA de CV | | 1,496,260 | 2,272,800 |
| Grupo Aeroportuario del Pacifico S.A.B. de CV Series B | | 213,500 | 2,238,384 |
| Grupo Aeroportuario Norte S.A.B. de CV | | 20,800 | 144,210 |
| Grupo Comercial Chedraui S.A.B. de CV | | 640,000 | 887,313 |
| Macquarie Mexican (REIT) (b) | | 1,021,200 | 1,439,708 |
|
| TOTAL MEXICO | | | 9,110,273 |
|
| Netherlands - 0.8% | | | |
| VEON Ltd. sponsored ADR | | 198,400 | 476,160 |
| X5 Retail Group NV GDR (Reg. S) | | 41,200 | 1,378,552 |
| Yandex NV Series A (a) | | 20,500 | 684,495 |
|
| TOTAL NETHERLANDS | | | 2,539,207 |
|
| Pakistan - 0.2% | | | |
| Hub Power Co. Ltd. | | 1,282,000 | 596,536 |
| Panama - 0.7% | | | |
| Copa Holdings SA Class A | | 22,400 | 2,278,976 |
| Peru - 1.1% | | | |
| Compania de Minas Buenaventura SA sponsored ADR | | 219,300 | 3,364,062 |
| Philippines - 1.7% | | | |
| Altus San Nicolas Corp. (d) | | 53,806 | 5,490 |
| Bank of the Philippine Islands (BPI) | | 574,000 | 1,095,861 |
| Metro Pacific Investments Corp. | | 12,852,500 | 1,213,463 |
| Philippine Seven Corp. | | 577,500 | 1,687,738 |
| Robinsons Land Corp. | | 2,323,608 | 1,163,740 |
|
| TOTAL PHILIPPINES | | | 5,166,292 |
|
| Poland - 2.0% | | | |
| CD Projekt RED SA | | 19,100 | 1,260,286 |
| Dino Polska SA (a)(b) | | 69,200 | 2,698,703 |
| Grupa Lotos SA | | 84,000 | 2,097,444 |
|
| TOTAL POLAND | | | 6,056,433 |
|
| Russia - 1.2% | | | |
| Bank St. Petersburg PJSC (a) | | 814,547 | 647,852 |
| LSR Group OJSC | | 90,264 | 999,172 |
| RusHydro PJSC | | 91,193,000 | 725,022 |
| Unipro PJSC | | 29,903,000 | 1,231,142 |
|
| TOTAL RUSSIA | | | 3,603,188 |
|
| Singapore - 0.6% | | | |
| First Resources Ltd. | | 1,658,900 | 1,862,791 |
| South Africa - 5.3% | | | |
| AngloGold Ashanti Ltd. | | 132,200 | 2,924,040 |
| Bidvest Group Ltd. | | 177,500 | 2,420,545 |
| Cashbuild Ltd. | | 92,700 | 1,349,658 |
| Impala Platinum Holdings Ltd. (a) | | 531,600 | 3,653,530 |
| Motus Holdings Ltd. | | 320,500 | 1,520,363 |
| Mr Price Group Ltd. | | 144,500 | 1,528,149 |
| Nampak Ltd. (a) | | 1,353,138 | 719,083 |
| Pick 'n Pay Stores Ltd. | | 477,500 | 2,088,796 |
|
| TOTAL SOUTH AFRICA | | | 16,204,164 |
|
| Sri Lanka - 0.2% | | | |
| Hatton National Bank PLC | | 629,651 | 633,812 |
| Taiwan - 7.8% | | | |
| Cleanaway Co. Ltd. | | 312,000 | 1,616,368 |
| CTCI Corp. | | 1,327,000 | 1,779,602 |
| Largan Precision Co. Ltd. | | 4,020 | 589,199 |
| Nanya Technology Corp. | | 1,925,220 | 4,418,827 |
| PChome Online, Inc. (a) | | 715,000 | 3,094,629 |
| Taiwan Fertilizer Co. Ltd. | | 1,542,000 | 2,452,194 |
| Unimicron Technology Corp. | | 3,214,820 | 4,970,121 |
| Vanguard International Semiconductor Corp. | | 910,640 | 1,946,807 |
| Win Semiconductors Corp. | | 292,600 | 3,050,915 |
|
| TOTAL TAIWAN | | | 23,918,662 |
|
| Thailand - 3.5% | | | |
| Kasikornbank PCL (For. Reg.) | | 297,600 | 1,374,548 |
| PTT Global Chemical PCL (For. Reg.) | | 393,900 | 665,475 |
| Siam Cement PCL (For. Reg.) | | 209,600 | 2,549,281 |
| Siam Global House PCL | | 6,107,155 | 3,075,594 |
| Star Petroleum Refining PCL | | 7,908,500 | 2,331,116 |
| Supalai PCL (For. Reg.) | | 1,426,300 | 765,500 |
|
| TOTAL THAILAND | | | 10,761,514 |
|
| Turkey - 2.0% | | | |
| Celebi Hava Servisi A/S | | 46,440 | 794,002 |
| Mavi Jeans Class B (a)(b) | | 488,800 | 3,946,479 |
| Tupras Turkiye Petrol Rafinerileri A/S | | 57,528 | 1,252,741 |
|
| TOTAL TURKEY | | | 5,993,222 |
|
| United Arab Emirates - 0.6% | | | |
| Aldar Properties PJSC (a) | | 2,100,010 | 1,343,686 |
| Emaar Properties PJSC | | 494,667 | 575,108 |
|
| TOTAL UNITED ARAB EMIRATES | | | 1,918,794 |
|
| United Kingdom - 0.8% | | | |
| Bank of Georgia Group PLC | | 49,740 | 836,955 |
| Georgia Capital PLC (a) | | 48,500 | 611,282 |
| Mondi PLC | | 51,264 | 1,060,190 |
|
| TOTAL UNITED KINGDOM | | | 2,508,427 |
|
| United States of America - 0.2% | | | |
| DouYu International Holdings Ltd. ADR | | 92,600 | 719,502 |
| Vietnam - 0.2% | | | |
| FTP Corp. | | 194,915 | 485,209 |
| TOTAL COMMON STOCKS | | | |
| (Cost $264,453,524) | | | 287,174,954 |
|
| Nonconvertible Preferred Stocks - 2.6% | | | |
| Brazil - 2.1% | | | |
| Banco ABC Brasil SA | | 520,220 | 2,340,050 |
| Banco do Estado Rio Grande do Sul SA | | 226,400 | 1,262,263 |
| Companhia Paranaense de Energia-Copel (PN-B) sponsored ADR | | 126,160 | 1,739,746 |
| Metalurgica Gerdau SA (PN) | | 731,500 | 1,147,272 |
|
| TOTAL BRAZIL | | | 6,489,331 |
|
| Russia - 0.5% | | | |
| Sberbank of Russia | | 474,900 | 1,574,174 |
| TOTAL NONCONVERTIBLE PREFERRED STOCKS | | | |
| (Cost $6,972,083) | | | 8,063,505 |
| | | Principal Amount | Value |
|
| Government Obligations - 0.1% | | | |
| United States of America - 0.1% | | | |
| U.S. Treasury Bills, yield at date of purchase 1.87% to 1.96% 11/7/19 to 12/26/19(e) | | | |
| (Cost $289,562) | | 290,000 | 289,655 |
| | | Shares | Value |
|
| Money Market Funds - 3.6% | | | |
| Fidelity Cash Central Fund 1.83% (f) | | 9,287,276 | 9,289,133 |
| Fidelity Securities Lending Cash Central Fund 1.84% (f)(g) | | 1,874,338 | 1,874,525 |
| TOTAL MONEY MARKET FUNDS | | | |
| (Cost $11,163,011) | | | 11,163,658 |
| TOTAL INVESTMENT IN SECURITIES - 100.0% | | | |
| (Cost $282,878,180) | | | 306,691,772 |
| NET OTHER ASSETS (LIABILITIES) - 0.0% | | | (29,302) |
| NET ASSETS - 100% | | | $306,662,470 |
| Futures Contracts | | | | | |
| | Number of contracts | Expiration Date | Notional Amount | Value | Unrealized Appreciation/(Depreciation) |
| Purchased | | | | | |
| Equity Index Contracts | | | | | |
| ICE E-mini MSCI Emerging Markets Index Contracts (United States) | 56 | Dec. 2019 | $2,915,920 | $(8,327) | $(8,327) |
The notional amount of futures purchased as a percentage of Net Assets is 1%
Security Type Abbreviations
ELS – Equity-Linked Security
Categorizations in the Schedule of Investments are based on country or territory of incorporation.
Legend
(a) Non-income producing
(b) Security exempt from registration under Rule 144A of the Securities Act of 1933. These securities may be resold in transactions exempt from registration, normally to qualified institutional buyers. At the end of the period, the value of these securities amounted to $16,212,927 or 5.3% of net assets.
(c) Security or a portion of the security is on loan at period end.
(d) Level 3 security
(e) Security or a portion of the security was pledged to cover margin requirements for futures contracts. At period end, the value of securities pledged amounted to $163,820.
(f) Affiliated fund that is generally available only to investment companies and other accounts managed by Fidelity Investments. The rate quoted is the annualized seven-day yield of the fund at period end. A complete unaudited listing of the fund's holdings as of its most recent quarter end is available upon request. In addition, each Fidelity Central Fund's financial statements, which are not covered by the Fund's Report of Independent Registered Public Accounting Firm, are available on the SEC's website or upon request.
(g) Investment made with cash collateral received from securities on loan.
Affiliated Central Funds
Information regarding fiscal year to date income earned by the Fund from investments in Fidelity Central Funds is as follows:
| Fund | Income earned |
| Fidelity Cash Central Fund | $249,398 |
| Fidelity Securities Lending Cash Central Fund | 29,188 |
| Total | $278,586 |
Amounts in the income column in the above table include any capital gain distributions from underlying funds, which are presented in the corresponding line-item in the Statement of Operations, if applicable. Amount for Fidelity Securities Lending Cash Central Fund represents the income earned on investing cash collateral, less rebates paid to borrowers and any lending agent fees associated with the loan, plus any premium payments received for lending certain types of securities.
Investment Valuation
The following is a summary of the inputs used, as of October 31, 2019, involving the Fund's assets and liabilities carried at fair value. The inputs or methodology used for valuing securities may not be an indication of the risk associated with investing in those securities. For more information on valuation inputs, and their aggregation into the levels used below, please refer to the Investment Valuation section in the accompanying Notes to Financial Statements.
| | Valuation Inputs at Reporting Date: |
| Description | Total | Level 1 | Level 2 | Level 3 |
| Investments in Securities: | | | | |
| Equities: | | | | |
| Communication Services | $10,618,726 | $9,473,650 | $1,145,076 | $-- |
| Consumer Discretionary | 47,223,018 | 24,998,459 | 22,224,559 | -- |
| Consumer Staples | 25,818,331 | 14,464,627 | 11,353,704 | -- |
| Energy | 7,951,063 | 5,262,905 | 2,688,158 | -- |
| Financials | 37,774,479 | 23,388,710 | 14,385,769 | -- |
| Health Care | 21,659,172 | 10,086,599 | 11,572,573 | -- |
| Industrials | 42,684,352 | 29,101,891 | 13,582,461 | -- |
| Information Technology | 34,105,315 | 27,557,844 | 6,547,471 | -- |
| Materials | 35,714,952 | 21,222,426 | 14,492,526 | -- |
| Real Estate | 19,768,059 | 10,674,036 | 9,088,533 | 5,490 |
| Utilities | 11,920,992 | 6,682,212 | 5,238,780 | -- |
| Government Obligations | 289,655 | -- | 289,655 | -- |
| Money Market Funds | 11,163,658 | 11,163,658 | -- | -- |
| Total Investments in Securities: | $306,691,772 | $194,077,017 | $112,609,265 | $5,490 |
| Derivative Instruments: | | | | |
| Liabilities | | | | |
| Futures Contracts | $(8,327) | $(8,327) | $-- | $-- |
| Total Liabilities | $(8,327) | $(8,327) | $-- | $-- |
| Total Derivative Instruments: | $(8,327) | $(8,327) | $-- | $-- |
Value of Derivative Instruments
The following table is a summary of the Fund's value of derivative instruments by primary risk exposure as of October 31, 2019. For additional information on derivative instruments, please refer to the Derivative Instruments section in the accompanying Notes to Financial Statements.
| Primary Risk Exposure / Derivative Type | Value |
| | Asset | Liability |
| Equity Risk | | |
| Futures Contracts(a) | $0 | $(8,327) |
| Total Equity Risk | 0 | (8,327) |
| Total Value of Derivatives | $0 | $(8,327) |
(a) Reflects gross cumulative appreciation (depreciation) on futures contracts as presented in the Schedule of Investments. In the Statement of Assets and Liabilities, the period end daily variation margin is included in receivable or payable for daily variation margin on futures contracts, and the net cumulative appreciation (depreciation) is included in Total accumulated earnings (loss).
See accompanying notes which are an integral part of the financial statements.
Fidelity® Emerging Markets Discovery Fund
Financial Statements
Statement of Assets and Liabilities
| | | October 31, 2019 |
| Assets | | |
Investment in securities, at value (including securities loaned of $1,778,106) — See accompanying schedule:
Unaffiliated issuers (cost $271,715,169) | $295,528,114 | |
| Fidelity Central Funds (cost $11,163,011) | 11,163,658 | |
| Total Investment in Securities (cost $282,878,180) | | $306,691,772 |
| Foreign currency held at value (cost $149,074) | | 149,043 |
| Receivable for investments sold | | 3,054,969 |
| Receivable for fund shares sold | | 167,102 |
| Dividends receivable | | 94,084 |
| Distributions receivable from Fidelity Central Funds | | 21,893 |
| Prepaid expenses | | 580 |
| Other receivables | | 134,382 |
| Total assets | | 310,313,825 |
| Liabilities | | |
| Payable to custodian bank | $459,476 | |
| Payable for investments purchased | $666,941 | |
| Payable for fund shares redeemed | 108,877 | |
| Accrued management fee | 210,114 | |
| Distribution and service plan fees payable | 11,827 | |
| Payable for daily variation margin on futures contracts | 22,120 | |
| Other affiliated payables | 61,304 | |
| Other payables and accrued expenses | 236,167 | |
| Collateral on securities loaned | 1,874,529 | |
| Total liabilities | | 3,651,355 |
| Net Assets | | $306,662,470 |
| Net Assets consist of: | | |
| Paid in capital | | $305,014,698 |
| Total accumulated earnings (loss) | | 1,647,772 |
| Net Assets | | $306,662,470 |
| Net Asset Value and Maximum Offering Price | | |
| Class A: | | |
| Net Asset Value and redemption price per share ($15,322,592 ÷ 1,121,859 shares)(a) | | $13.66 |
| Maximum offering price per share (100/94.25 of $13.66) | | $14.49 |
| Class M: | | |
| Net Asset Value and redemption price per share ($5,773,288 ÷ 423,922 shares)(a) | | $13.62 |
| Maximum offering price per share (100/96.50 of $13.62) | | $14.11 |
| Class C: | | |
| Net Asset Value and offering price per share ($7,562,030 ÷ 569,127 shares)(a) | | $13.29 |
| Emerging Markets Discovery: | | |
| Net Asset Value, offering price and redemption price per share ($208,656,696 ÷ 15,176,589 shares) | | $13.75 |
| Class I: | | |
| Net Asset Value, offering price and redemption price per share ($51,081,120 ÷ 3,705,317 shares) | | $13.79 |
| Class Z: | | |
| Net Asset Value, offering price and redemption price per share ($18,266,744 ÷ 1,326,752 shares) | | $13.77 |
(a) Redemption price per share is equal to net asset value less any applicable contingent deferred sales charge.
See accompanying notes which are an integral part of the financial statements.
Statement of Operations
| | | Year ended October 31, 2019 |
| Investment Income | | |
| Dividends | | $8,089,534 |
| Interest | | 12,197 |
| Income from Fidelity Central Funds (including $29,188 from security lending) | | 278,586 |
| Income before foreign taxes withheld | | 8,380,317 |
| Less foreign taxes withheld | | (772,784) |
| Total income | | 7,607,533 |
| Expenses | | |
| Management fee | $2,547,677 | |
| Transfer agent fees | 602,961 | |
| Distribution and service plan fees | 162,013 | |
| Accounting and security lending fees | 157,883 | |
| Custodian fees and expenses | 289,562 | |
| Independent trustees' fees and expenses | 1,718 | |
| Registration fees | 119,431 | |
| Audit | 102,892 | |
| Legal | 637 | |
| Miscellaneous | 2,283 | |
| Total expenses before reductions | 3,987,057 | |
| Expense reductions | (18,837) | |
| Total expenses after reductions | | 3,968,220 |
| Net investment income (loss) | | 3,639,313 |
| Realized and Unrealized Gain (Loss) | | |
| Net realized gain (loss) on: | | |
| Investment securities: | | |
| Unaffiliated issuers | (18,663,681) | |
| Fidelity Central Funds | (455) | |
| Foreign currency transactions | (59,382) | |
| Futures contracts | 1,061,326 | |
| Total net realized gain (loss) | | (17,662,192) |
| Change in net unrealized appreciation (depreciation) on: | | |
| Investment securities: | | |
| Unaffiliated issuers (net of decrease in deferred foreign taxes of $21,700) | 55,849,921 | |
| Fidelity Central Funds | 487 | |
| Assets and liabilities in foreign currencies | 14,381 | |
| Futures contracts | 8,580 | |
| Total change in net unrealized appreciation (depreciation) | | 55,873,369 |
| Net gain (loss) | | 38,211,177 |
| Net increase (decrease) in net assets resulting from operations | | $41,850,490 |
See accompanying notes which are an integral part of the financial statements.
Statement of Changes in Net Assets
| | Year ended October 31, 2019 | Year ended October 31, 2018 |
| Increase (Decrease) in Net Assets | | |
| Operations | | |
| Net investment income (loss) | $3,639,313 | $6,119,071 |
| Net realized gain (loss) | (17,662,192) | (3,781,351) |
| Change in net unrealized appreciation (depreciation) | 55,873,369 | (74,753,811) |
| Net increase (decrease) in net assets resulting from operations | 41,850,490 | (72,416,091) |
| Distributions to shareholders | (4,896,604) | (9,625,215) |
| Share transactions - net increase (decrease) | (9,023,067) | (24,209,703) |
| Redemption fees | – | 66,640 |
| Total increase (decrease) in net assets | 27,930,819 | (106,184,369) |
| Net Assets | | |
| Beginning of period | 278,731,651 | 384,916,020 |
| End of period | $306,662,470 | $278,731,651 |
See accompanying notes which are an integral part of the financial statements.
Financial Highlights
Fidelity Emerging Markets Discovery Fund Class A
| Years ended October 31, | 2019 | 2018 | 2017 | 2016 | 2015 |
| Selected Per–Share Data | | | | | |
| Net asset value, beginning of period | $12.01 | $15.03 | $12.27 | $10.92 | $12.17 |
| Income from Investment Operations | | | | | |
| Net investment income (loss)A | .13 | .18 | .14 | .09 | .09B |
| Net realized and unrealized gain (loss) | 1.71 | (2.89) | 2.74 | 1.30 | (1.34) |
| Total from investment operations | 1.84 | (2.71) | 2.88 | 1.39 | (1.25) |
| Distributions from net investment income | (.18) | (.08) | (.07) | (.05) | – |
| Distributions from net realized gain | (.01) | (.23) | (.06) | – | – |
| Total distributions | (.19) | (.31) | (.13) | (.05) | – |
| Redemption fees added to paid in capitalA | – | –C | .01 | .01 | –C |
| Net asset value, end of period | $13.66 | $12.01 | $15.03 | $12.27 | $10.92 |
| Total ReturnD,E | 15.50% | (18.39)% | 23.89% | 12.93% | (10.27)% |
| Ratios to Average Net AssetsF,G | | | | | |
| Expenses before reductions | 1.55% | 1.52% | 1.63% | 1.89% | 1.88% |
| Expenses net of fee waivers, if any | 1.54% | 1.52% | 1.63% | 1.70% | 1.70% |
| Expenses net of all reductions | 1.54% | 1.48% | 1.62% | 1.70% | 1.69% |
| Net investment income (loss) | .96% | 1.22% | 1.03% | .85% | .76%B |
| Supplemental Data | | | | | |
| Net assets, end of period (000 omitted) | $15,323 | $14,472 | $16,062 | $5,252 | $4,660 |
| Portfolio turnover rateH | 80% | 98% | 58% | 60% | 103% |
A Calculated based on average shares outstanding during the period.
B Net investment income per share reflects a large, non-recurring dividend which amounted to $.06 per share. Excluding this non-recurring dividend, the ratio of net investment income (loss) to average net assets would have been .22%.
C Amount represents less than $.005 per share.
D Total returns would have been lower if certain expenses had not been reduced during the applicable periods shown.
E Total returns do not include the effect of the sales charges.
F Fees and expenses of any underlying Fidelity Central Funds are not included in the Fund's expense ratio. The Fund indirectly bears its proportionate share of the expenses of any underlying Fidelity Central Funds.
G Expense ratios reflect operating expenses of the class. Expenses before reductions do not reflect amounts reimbursed by the investment adviser or reductions from brokerage service arrangements or reductions from other expense offset arrangements and do not represent the amount paid by the class during periods when reimbursements or reductions occur. Expenses net of fee waivers reflect expenses after reimbursement by the investment adviser but prior to reductions from brokerage service arrangements or other expense offset arrangements. Expenses net of all reductions represent the net expenses paid by the class.
H Amount does not include the portfolio activity of any underlying Fidelity Central Funds.
See accompanying notes which are an integral part of the financial statements.
Fidelity Emerging Markets Discovery Fund Class M
| Years ended October 31, | 2019 | 2018 | 2017 | 2016 | 2015 |
| Selected Per–Share Data | | | | | |
| Net asset value, beginning of period | $11.94 | $14.94 | $12.20 | $10.86 | $12.13 |
| Income from Investment Operations | | | | | |
| Net investment income (loss)A | .08 | .14 | .10 | .07 | .06B |
| Net realized and unrealized gain (loss) | 1.71 | (2.87) | 2.74 | 1.28 | (1.33) |
| Total from investment operations | 1.79 | (2.73) | 2.84 | 1.35 | (1.27) |
| Distributions from net investment income | (.10) | (.04) | (.04) | (.02) | – |
| Distributions from net realized gain | (.01) | (.23) | (.06) | – | – |
| Total distributions | (.11) | (.27) | (.11)C | (.02) | – |
| Redemption fees added to paid in capitalA | – | –D | .01 | .01 | –D |
| Net asset value, end of period | $13.62 | $11.94 | $14.94 | $12.20 | $10.86 |
| Total ReturnE,F | 15.06% | (18.58)% | 23.63% | 12.58% | (10.47)% |
| Ratios to Average Net AssetsG,H | | | | | |
| Expenses before reductions | 1.86% | 1.79% | 1.92% | 2.17% | 2.16% |
| Expenses net of fee waivers, if any | 1.86% | 1.79% | 1.92% | 1.95% | 1.95% |
| Expenses net of all reductions | 1.86% | 1.75% | 1.90% | 1.94% | 1.94% |
| Net investment income (loss) | .64% | .94% | .74% | .60% | .51%B |
| Supplemental Data | | | | | |
| Net assets, end of period (000 omitted) | $5,773 | $5,374 | $9,393 | $2,868 | $2,015 |
| Portfolio turnover rateI | 80% | 98% | 58% | 60% | 103% |
A Calculated based on average shares outstanding during the period.
B Net investment income per share reflects a large, non-recurring dividend which amounted to $.06 per share. Excluding this non-recurring dividend, the ratio of net investment income (loss) to average net assets would have been (.03)%.
C Total distributions of $.11 per share is comprised of distributions from net investment income of $.044 and distributions from net realized gain of $.064 per share.
D Amount represents less than $.005 per share.
E Total returns would have been lower if certain expenses had not been reduced during the applicable periods shown.
F Total returns do not include the effect of the sales charges.
G Fees and expenses of any underlying Fidelity Central Funds are not included in the Fund's expense ratio. The Fund indirectly bears its proportionate share of the expenses of any underlying Fidelity Central Funds.
H Expense ratios reflect operating expenses of the class. Expenses before reductions do not reflect amounts reimbursed by the investment adviser or reductions from brokerage service arrangements or reductions from other expense offset arrangements and do not represent the amount paid by the class during periods when reimbursements or reductions occur. Expenses net of fee waivers reflect expenses after reimbursement by the investment adviser but prior to reductions from brokerage service arrangements or other expense offset arrangements. Expenses net of all reductions represent the net expenses paid by the class.
I Amount does not include the portfolio activity of any underlying Fidelity Central Funds.
See accompanying notes which are an integral part of the financial statements.
Fidelity Emerging Markets Discovery Fund Class C
| Years ended October 31, | 2019 | 2018 | 2017 | 2016 | 2015 |
| Selected Per–Share Data | | | | | |
| Net asset value, beginning of period | $11.66 | $14.64 | $11.97 | $10.69 | $12.00 |
| Income from Investment Operations | | | | | |
| Net investment income (loss)A | .02 | .06 | .04 | .01 | –B,C |
| Net realized and unrealized gain (loss) | 1.67 | (2.79) | 2.69 | 1.26 | (1.31) |
| Total from investment operations | 1.69 | (2.73) | 2.73 | 1.27 | (1.31) |
| Distributions from net investment income | (.05) | (.02) | (.01) | – | – |
| Distributions from net realized gain | (.01) | (.23) | (.06) | – | – |
| Total distributions | (.06) | (.25) | (.07) | – | – |
| Redemption fees added to paid in capitalA | – | –C | .01 | .01 | –C |
| Net asset value, end of period | $13.29 | $11.66 | $14.64 | $11.97 | $10.69 |
| Total ReturnD,E | 14.54% | (18.97)% | 23.02% | 11.97% | (10.92)% |
| Ratios to Average Net AssetsF,G | | | | | |
| Expenses before reductions | 2.36% | 2.28% | 2.38% | 2.63% | 2.64% |
| Expenses net of fee waivers, if any | 2.35% | 2.28% | 2.38% | 2.45% | 2.45% |
| Expenses net of all reductions | 2.35% | 2.24% | 2.37% | 2.44% | 2.44% |
| Net investment income (loss) | .14% | .45% | .28% | .10% | .01%B |
| Supplemental Data | | | | | |
| Net assets, end of period (000 omitted) | $7,562 | $11,278 | $14,168 | $2,203 | $1,675 |
| Portfolio turnover rateH | 80% | 98% | 58% | 60% | 103% |
A Calculated based on average shares outstanding during the period.
B Net investment income per share reflects a large, non-recurring dividend which amounted to $.06 per share. Excluding this non-recurring dividend, the ratio of net investment income (loss) to average net assets would have been (.52)%.
C Amount represents less than $.005 per share.
D Total returns would have been lower if certain expenses had not been reduced during the applicable periods shown.
E Total returns do not include the effect of the contingent deferred sales charge.
F Fees and expenses of any underlying Fidelity Central Funds are not included in the Fund's expense ratio. The Fund indirectly bears its proportionate share of the expenses of any underlying Fidelity Central Funds.
G Expense ratios reflect operating expenses of the class. Expenses before reductions do not reflect amounts reimbursed by the investment adviser or reductions from brokerage service arrangements or reductions from other expense offset arrangements and do not represent the amount paid by the class during periods when reimbursements or reductions occur. Expenses net of fee waivers reflect expenses after reimbursement by the investment adviser but prior to reductions from brokerage service arrangements or other expense offset arrangements. Expenses net of all reductions represent the net expenses paid by the class.
H Amount does not include the portfolio activity of any underlying Fidelity Central Funds.
See accompanying notes which are an integral part of the financial statements.
Fidelity Emerging Markets Discovery Fund
| Years ended October 31, | 2019 | 2018 | 2017 | 2016 | 2015 |
| Selected Per–Share Data | | | | | |
| Net asset value, beginning of period | $12.10 | $15.12 | $12.33 | $10.98 | $12.21 |
| Income from Investment Operations | | | | | |
| Net investment income (loss)A | .16 | .23 | .18 | .12 | .12B |
| Net realized and unrealized gain (loss) | 1.72 | (2.91) | 2.76 | 1.31 | (1.35) |
| Total from investment operations | 1.88 | (2.68) | 2.94 | 1.43 | (1.23) |
| Distributions from net investment income | (.22) | (.11) | (.09) | (.09) | – |
| Distributions from net realized gain | (.01) | (.23) | (.06) | – | – |
| Total distributions | (.23) | (.34) | (.16)C | (.09) | – |
| Redemption fees added to paid in capitalA | – | –D | .01 | .01 | –D |
| Net asset value, end of period | $13.75 | $12.10 | $15.12 | $12.33 | $10.98 |
| Total ReturnE | 15.78% | (18.11)% | 24.30% | 13.19% | (10.07)% |
| Ratios to Average Net AssetsF,G | | | | | |
| Expenses before reductions | 1.25% | 1.22% | 1.35% | 1.55% | 1.56% |
| Expenses net of fee waivers, if any | 1.25% | 1.22% | 1.35% | 1.45% | 1.45% |
| Expenses net of all reductions | 1.25% | 1.18% | 1.34% | 1.44% | 1.44% |
| Net investment income (loss) | 1.25% | 1.51% | 1.31% | 1.10% | 1.01%B |
| Supplemental Data | | | | | |
| Net assets, end of period (000 omitted) | $208,657 | $188,690 | $248,124 | $67,178 | $61,601 |
| Portfolio turnover rateH | 80% | 98% | 58% | 60% | 103% |
A Calculated based on average shares outstanding during the period.
B Net investment income per share reflects a large, non-recurring dividend which amounted to $.06 per share. Excluding this non-recurring dividend, the ratio of net investment income (loss) to average net assets would have been .48%.
C Total distributions of $.16 per share is comprised of distributions from net investment income of $.091 and distributions from net realized gain of $.064 per share.
D Amount represents less than $.005 per share.
E Total returns would have been lower if certain expenses had not been reduced during the applicable periods shown.
F Fees and expenses of any underlying Fidelity Central Funds are not included in the Fund's expense ratio. The Fund indirectly bears its proportionate share of the expenses of any underlying Fidelity Central Funds.
G Expense ratios reflect operating expenses of the class. Expenses before reductions do not reflect amounts reimbursed by the investment adviser or reductions from brokerage service arrangements or reductions from other expense offset arrangements and do not represent the amount paid by the class during periods when reimbursements or reductions occur. Expenses net of fee waivers reflect expenses after reimbursement by the investment adviser but prior to reductions from brokerage service arrangements or other expense offset arrangements. Expenses net of all reductions represent the net expenses paid by the class.
H Amount does not include the portfolio activity of any underlying Fidelity Central Funds.
See accompanying notes which are an integral part of the financial statements.
Fidelity Emerging Markets Discovery Fund Class I
| Years ended October 31, | 2019 | 2018 | 2017 | 2016 | 2015 |
| Selected Per–Share Data | | | | | |
| Net asset value, beginning of period | $12.13 | $15.15 | $12.37 | $11.02 | $12.25 |
| Income from Investment Operations | | | | | |
| Net investment income (loss)A | .17 | .23 | .19 | .13 | .12B |
| Net realized and unrealized gain (loss) | 1.72 | (2.90) | 2.75 | 1.30 | (1.35) |
| Total from investment operations | 1.89 | (2.67) | 2.94 | 1.43 | (1.23) |
| Distributions from net investment income | (.22) | (.12) | (.10) | (.09) | – |
| Distributions from net realized gain | (.01) | (.23) | (.06) | – | – |
| Total distributions | (.23) | (.35) | (.17)C | (.09) | – |
| Redemption fees added to paid in capitalA | – | –D | .01 | .01 | –D |
| Net asset value, end of period | $13.79 | $12.13 | $15.15 | $12.37 | $11.02 |
| Total ReturnE | 15.78% | (18.06)% | 24.25% | 13.16% | (10.04)% |
| Ratios to Average Net AssetsF,G | | | | | |
| Expenses before reductions | 1.25% | 1.22% | 1.32% | 1.59% | 1.54% |
| Expenses net of fee waivers, if any | 1.24% | 1.22% | 1.32% | 1.45% | 1.45% |
| Expenses net of all reductions | 1.24% | 1.18% | 1.30% | 1.44% | 1.43% |
| Net investment income (loss) | 1.26% | 1.51% | 1.34% | 1.10% | 1.01%B |
| Supplemental Data | | | | | |
| Net assets, end of period (000 omitted) | $51,081 | $57,506 | $97,170 | $8,337 | $1,410 |
| Portfolio turnover rateH | 80% | 98% | 58% | 60% | 103% |
A Calculated based on average shares outstanding during the period.
B Net investment income per share reflects a large, non-recurring dividend which amounted to $.06 per share. Excluding this non-recurring dividend, the ratio of net investment income (loss) to average net assets would have been .48%.
C Total distributions of $.17 per share is comprised of distributions from net investment income of $.101 and distributions from net realized gain of $.064 per share.
D Amount represents less than $.005 per share.
E Total returns would have been lower if certain expenses had not been reduced during the applicable periods shown.
F Fees and expenses of any underlying Fidelity Central Funds are not included in the Fund's expense ratio. The Fund indirectly bears its proportionate share of the expenses of any underlying Fidelity Central Funds.
G Expense ratios reflect operating expenses of the class. Expenses before reductions do not reflect amounts reimbursed by the investment adviser or reductions from brokerage service arrangements or reductions from other expense offset arrangements and do not represent the amount paid by the class during periods when reimbursements or reductions occur. Expenses net of fee waivers reflect expenses after reimbursement by the investment adviser but prior to reductions from brokerage service arrangements or other expense offset arrangements. Expenses net of all reductions represent the net expenses paid by the class.
H Amount does not include the portfolio activity of any underlying Fidelity Central Funds.
See accompanying notes which are an integral part of the financial statements.
Fidelity Emerging Markets Discovery Fund Class Z
| Years ended October 31, | 2019 | 2018 A |
| Selected Per–Share Data | | |
| Net asset value, beginning of period | $12.13 | $13.19 |
| Income from Investment Operations | | |
| Net investment income (loss)B | .18 | –C |
| Net realized and unrealized gain (loss) | 1.72 | (1.06) |
| Total from investment operations | 1.90 | (1.06) |
| Distributions from net investment income | (.26) | – |
| Distributions from net realized gain | (.01) | – |
| Total distributions | (.26)D | – |
| Net asset value, end of period | $13.77 | $12.13 |
| Total ReturnE,F | 15.97% | (8.04)% |
| Ratios to Average Net AssetsG,H | | |
| Expenses before reductions | 1.10% | 1.17%I |
| Expenses net of fee waivers, if any | 1.10% | 1.02%I |
| Expenses net of all reductions | 1.10% | .98%I |
| Net investment income (loss) | 1.40% | (.12)%I |
| Supplemental Data | | |
| Net assets, end of period (000 omitted) | $18,267 | $1,412 |
| Portfolio turnover rateJ | 80% | 98% |
A For the period October 2, 2018 (commencement of sale of shares) to October 31, 2018.
B Calculated based on average shares outstanding during the period.
C Amount represents less than $.005 per share.
D Total distributions of $.26 per share is comprised of distributions from net investment income of $.256 and distributions from net realized gain of $.008 per share.
E Total returns for periods of less than one year are not annualized.
F Total returns would have been lower if certain expenses had not been reduced during the applicable periods shown.
G Fees and expenses of any underlying Fidelity Central Funds are not included in the Fund's expense ratio. The Fund indirectly bears its proportionate share of the expenses of any underlying Fidelity Central Funds.
H Expense ratios reflect operating expenses of the class. Expenses before reductions do not reflect amounts reimbursed by the investment adviser or reductions from brokerage service arrangements or reductions from other expense offset arrangements and do not represent the amount paid by the class during periods when reimbursements or reductions occur. Expense ratios before reductions for start-up periods may not be representative of longer-term operating periods. Expenses net of fee waivers reflect expenses after reimbursement by the investment adviser but prior to reductions from brokerage service arrangements or other expense offset arrangements. Expenses net of all reductions represent the net expenses paid by the class.
I Annualized
J Amount does not include the portfolio activity of any underlying Fidelity Central Funds.
See accompanying notes which are an integral part of the financial statements.
Notes to Financial Statements
For the period ended October 31, 2019
1. Organization.
Fidelity Emerging Markets Discovery Fund (the Fund) is a fund of Fidelity Investment Trust (the Trust) and is authorized to issue an unlimited number of shares. The Trust is registered under the Investment Company Act of 1940, as amended (the 1940 Act), as an open-end management investment company organized as a Massachusetts business trust. The Fund offers Class A, Class M, Class C, Emerging Markets Discovery, Class I and Class Z shares, each of which has equal rights as to assets and voting privileges. Each class has exclusive voting rights with respect to matters that affect that class. Effective March 1, 2019, Class C shares will automatically convert to Class A shares after a holding period of ten years from the initial date of purchase, with certain exceptions. The Fund's investments in emerging markets can be subject to social, economic, regulatory, and political uncertainties and can be extremely volatile.
2. Investments in Fidelity Central Funds.
The Fund invests in Fidelity Central Funds, which are open-end investment companies generally available only to other investment companies and accounts managed by the investment adviser and its affiliates. The Fund's Schedule of Investments lists each of the Fidelity Central Funds held as of period end, if any, as an investment of the Fund, but does not include the underlying holdings of each Fidelity Central Fund. As an Investing Fund, the Fund indirectly bears its proportionate share of the expenses of the underlying Fidelity Central Funds.
The Money Market Central Funds seek preservation of capital and current income and are managed by Fidelity Investments Money Management, Inc. (FIMM), an affiliate of the investment adviser. Annualized expenses of the Money Market Central Funds as of their most recent shareholder report date ranged from less than .005% to .01%.
A complete unaudited list of holdings for each Fidelity Central Fund is available upon request or at the Securities and Exchange Commission (the SEC) website at www.sec.gov. In addition, the financial statements of the Fidelity Central Funds, which are not covered by the Fund's Report of Independent Registered Public Accounting Firm, are available on the SEC website or upon request.
3. Significant Accounting Policies.
The Fund is an investment company and applies the accounting and reporting guidance of the Financial Accounting Standards Board (FASB) Accounting Standards Codification Topic 946 Financial Services – Investments Companies. The financial statements have been prepared in conformity with accounting principles generally accepted in the United States of America (GAAP), which require management to make certain estimates and assumptions at the date of the financial statements. Actual results could differ from those estimates. Subsequent events, if any, through the date that the financial statements were issued have been evaluated in the preparation of the financial statements. The following summarizes the significant accounting policies of the Fund:
Investment Valuation. Investments are valued as of 4:00 p.m. Eastern time on the last calendar day of the period. The Board of Trustees (the Board) has delegated the day to day responsibility for the valuation of the Fund's investments to the Fair Value Committee (the Committee) established by the Fund's investment adviser. In accordance with valuation policies and procedures approved by the Board, the Fund attempts to obtain prices from one or more third party pricing vendors or brokers to value its investments. When current market prices, quotations or currency exchange rates are not readily available or reliable, investments will be fair valued in good faith by the Committee, in accordance with procedures adopted by the Board. Factors used in determining fair value vary by investment type and may include market or investment specific events, changes in interest rates and credit quality. The frequency with which these procedures are used cannot be predicted and they may be utilized to a significant extent. The Committee oversees the Fund's valuation policies and procedures and reports to the Board on the Committee's activities and fair value determinations. The Board monitors the appropriateness of the procedures used in valuing the Fund's investments and ratifies the fair value determinations of the Committee.
The Fund categorizes the inputs to valuation techniques used to value its investments into a disclosure hierarchy consisting of three levels as shown below:
- Level 1 – quoted prices in active markets for identical investments
- Level 2 – other significant observable inputs (including quoted prices for similar investments, interest rates, prepayment speeds, etc.)
- Level 3 – unobservable inputs (including the Fund's own assumptions based on the best information available)
Valuation techniques used to value the Fund's investments by major category are as follows:
Equity securities, including restricted securities, for which market quotations are readily available, are valued at the last reported sale price or official closing price as reported by a third party pricing vendor on the primary market or exchange on which they are traded and are categorized as Level 1 in the hierarchy. In the event there were no sales during the day or closing prices are not available, securities are valued at the last quoted bid price or may be valued using the last available price and are generally categorized as Level 2 in the hierarchy. For foreign equity securities, when market or security specific events arise, comparisons to the valuation of American Depositary Receipts (ADRs), futures contracts, Exchange-Traded Funds (ETFs) and certain indexes as well as quoted prices for similar securities may be used and would be categorized as Level 2 in the hierarchy. For equity securities, including restricted securities, where observable inputs are limited, assumptions about market activity and risk are used and these securities may be categorized as Level 3 in the hierarchy.
Debt securities, including restricted securities, are valued based on evaluated prices received from third party pricing vendors or from brokers who make markets in such securities. U.S. government and government agency obligations are valued by pricing vendors who utilize matrix pricing which considers yield or price of bonds of comparable quality, coupon, maturity and type or by broker-supplied prices. When independent prices are unavailable or unreliable, debt securities may be valued utilizing pricing methodologies which consider similar factors that would be used by third party pricing vendors. Debt securities are generally categorized as Level 2 in the hierarchy but may be Level 3 depending on the circumstances.
Futures contracts are valued at the settlement price established each day by the board of trade or exchange on which they are traded and are categorized as Level 1 in the hierarchy. Investments in open-end mutual funds, including the Fidelity Central Funds, are valued at their closing net asset value (NAV) each business day and are categorized as Level 1 in the hierarchy.
Changes in valuation techniques may result in transfers in or out of an assigned level within the disclosure hierarchy. The aggregate value of investments by input level as of October 31, 2019 is included at the end of the Fund's Schedule of Investments.
Foreign Currency. The Fund may use foreign currency contracts to facilitate transactions in foreign-denominated securities. Gains and losses from these transactions may arise from changes in the value of the foreign currency or if the counterparties do not perform under the contracts' terms.
Foreign-denominated assets, including investment securities, and liabilities are translated into U.S. dollars at the exchange rates at period end. Purchases and sales of investment securities, income and dividends received and expenses denominated in foreign currencies are translated into U.S. dollars at the exchange rate in effect on the transaction date.
The effects of exchange rate fluctuations on investments are included with the net realized and unrealized gain (loss) on investment securities. Other foreign currency transactions resulting in realized and unrealized gain (loss) are disclosed separately.
Investment Transactions and Income. For financial reporting purposes, the Fund's investment holdings and NAV include trades executed through the end of the last business day of the period. The NAV per share for processing shareholder transactions is calculated as of the close of business of the New York Stock Exchange (NYSE), normally 4:00 p.m. Eastern time and includes trades executed through the end of the prior business day. Gains and losses on securities sold are determined on the basis of identified cost and include proceeds received from litigation. Dividend income is recorded on the ex-dividend date, except for certain dividends from foreign securities where the ex-dividend date may have passed, which are recorded as soon as the Fund is informed of the ex-dividend date. Non-cash dividends included in dividend income, if any, are recorded at the fair market value of the securities received. Income and capital gain distributions from Fidelity Central Funds, if any, are recorded on the ex-dividend date. Certain distributions received by the Fund represent a return of capital or capital gain. The Fund determines the components of these distributions subsequent to the ex-dividend date, based upon receipt of tax filings or other correspondence relating to the underlying investment. These distributions are recorded as a reduction of cost of investments and/or as a realized gain. Interest income is accrued as earned and includes coupon interest and amortization of premium and accretion of discount on debt securities as applicable. Investment income is recorded net of foreign taxes withheld where recovery of such taxes is uncertain.
Class Allocations and Expenses. Investment income, realized and unrealized capital gains and losses, common expenses of the Fund, and certain fund-level expense reductions, if any, are allocated daily on a pro-rata basis to each class based on the relative net assets of each class to the total net assets of the Fund. Each class differs with respect to transfer agent and distribution and service plan fees incurred. Certain expense reductions may also differ by class. For the reporting period, the allocated portion of income and expenses to each class as a percent of its average net assets may vary due to the timing of recording these transactions in relation to fluctuating net assets of the classes. Expenses directly attributable to a fund are charged to that fund. Expenses attributable to more than one fund are allocated among the respective funds on the basis of relative net assets or other appropriate methods. Expense estimates are accrued in the period to which they relate and adjustments are made when actual amounts are known.
Income Tax Information and Distributions to Shareholders. Each year, the Fund intends to qualify as a regulated investment company under Subchapter M of the Internal Revenue Code, including distributing substantially all of its taxable income and realized gains. As a result, no provision for U.S. Federal income taxes is required. As of October 31, 2019, the Fund did not have any unrecognized tax benefits in the financial statements; nor is the Fund aware of any tax positions for which it is reasonably possible that the total amounts of unrecognized tax benefits will significantly change in the next twelve months. The Fund files a U.S. federal tax return, in addition to state and local tax returns as required. The Fund's federal income tax returns are subject to examination by the Internal Revenue Service (IRS) for a period of three fiscal years after they are filed. State and local tax returns may be subject to examination for an additional fiscal year depending on the jurisdiction. Foreign taxes are provided for based on the Fund's understanding of the tax rules and rates that exist in the foreign markets in which it invests. The Fund is subject to a tax imposed on capital gains by certain countries in which it invests. An estimated deferred tax liability for net unrealized appreciation on the applicable securities is included in Other payables and accrued expenses on the Statement of Assets & Liabilities.
Distributions are declared and recorded on the ex-dividend date. Income and capital gain distributions are declared separately for each class. Income and capital gain distributions are determined in accordance with income tax regulations, which may differ from GAAP. In addition, the Fund claimed a portion of the payment made to redeeming shareholders as a distribution for income tax purposes.
Capital accounts within the financial statements are adjusted for permanent book-tax differences. These adjustments have no impact on net assets or the results of operations. Capital accounts are not adjusted for temporary book-tax differences which will reverse in a subsequent period.
Book-tax differences are primarily due to futures contracts, foreign currency transactions, certain foreign taxes, passive foreign investment companies (PFIC), market discount, capital loss carryforwards and losses deferred due to wash sales.
As of period end, the cost and unrealized appreciation (depreciation) in securities, and derivatives if applicable, for federal income tax purposes were as follows:
| Gross unrealized appreciation | $44,349,744 |
| Gross unrealized depreciation | (22,776,586) |
| Net unrealized appreciation (depreciation) | $21,573,158 |
| Tax Cost | $285,118,614 |
The tax-based components of distributable earnings as of period end were as follows:
| Undistributed ordinary income | $3,132,027 |
| Capital loss carryforward | $(23,016,648) |
| Net unrealized appreciation (depreciation) on securities and other investments | $21,566,040 |
Capital loss carryforwards are only available to offset future capital gains of the Fund to the extent provided by regulations and may be limited. Under the Regulated Investment Company Modernization Act of 2010 (the Act), the Fund is permitted to carry forward capital losses incurred in taxable years beginning after December 22, 2010 for an unlimited period and such capital losses are required to be used prior to any losses that expire. The capital loss carryforward information presented below, including any applicable limitation, is estimated as of fiscal period end and is subject to adjustment.
| No expiration | |
| Short-term | $(13,499,639) |
| Long-term | (9,517,009) |
| Total capital loss carryforward | $(23,016,648) |
The tax character of distributions paid was as follows:
| | October 31, 2019 | October 31, 2018 |
| Ordinary Income | $4,896,604 | $ 7,036,307 |
| Long-term Capital Gains | – | 2,588,908 |
| Total | $4,896,604 | $ 9,625,215 |
Restricted Securities. The Fund may invest in securities that are subject to legal or contractual restrictions on resale. These securities generally may be resold in transactions exempt from registration or to the public if the securities are registered. Disposal of these securities may involve time-consuming negotiations and expense, and prompt sale at an acceptable price may be difficult. Information regarding restricted securities is included at the end of the Fund's Schedule of Investments.
4. Derivative Instruments.
Risk Exposures and the Use of Derivative Instruments. The Fund's investment objective allows the Fund to enter into various types of derivative contracts, including futures contracts. Derivatives are investments whose value is primarily derived from underlying assets, indices or reference rates and may be transacted on an exchange or over-the-counter (OTC). Derivatives may involve a future commitment to buy or sell a specified asset based on specified terms, to exchange future cash flows at periodic intervals based on a notional principal amount, or for one party to make one or more payments upon the occurrence of specified events in exchange for periodic payments from the other party.
The Fund used derivatives to increase returns and to manage exposure to certain risks as defined below. The success of any strategy involving derivatives depends on analysis of numerous economic factors, and if the strategies for investment do not work as intended, the Fund may not achieve its objectives.
The Fund's use of derivatives increased or decreased its exposure to the following risk:
| Equity Risk | Equity risk relates to the fluctuations in the value of financial instruments as a result of changes in market prices (other than those arising from interest rate risk or foreign exchange risk), whether caused by factors specific to an individual investment, its issuer, or all factors affecting all instruments traded in a market or market segment.
|
The Fund is also exposed to additional risks from investing in derivatives, such as liquidity risk and counterparty credit risk. Liquidity risk is the risk that the Fund will be unable to close out the derivative in the open market in a timely manner. Counterparty credit risk is the risk that the counterparty will not be able to fulfill its obligation to the Fund. Counterparty credit risk related to exchange-traded futures contracts may be mitigated by the protection provided by the exchange on which they trade.
Investing in derivatives may involve greater risks than investing in the underlying assets directly and, to varying degrees, may involve risk of loss in excess of any initial investment and collateral received and amounts recognized in the Statement of Assets and Liabilities. In addition, there may be the risk that the change in value of the derivative contract does not correspond to the change in value of the underlying instrument.
Futures Contracts. A futures contract is an agreement between two parties to buy or sell a specified underlying instrument for a fixed price at a specified future date. The Fund used futures contracts to manage its exposure to the stock market.
Upon entering into a futures contract, a fund is required to deposit either cash or securities (initial margin) with a clearing broker in an amount equal to a certain percentage of the face value of the contract. Futures contracts are marked-to-market daily and subsequent daily payments (variation margin) are made or received by a fund depending on the daily fluctuations in the value of the futures contracts and are recorded as unrealized appreciation or (depreciation). This receivable and/or payable, if any, is included in daily variation margin on futures contracts in the Statement of Assets and Liabilities. Realized gain or (loss) is recorded upon the expiration or closing of a futures contract. The net realized gain (loss) and change in net unrealized appreciation (depreciation) on futures contracts during the period is presented in the Statement of Operations.
Any open futures contracts at period end are presented in the Schedule of Investments under the caption "Futures Contracts". The notional amount at value reflects each contract's exposure to the underlying instrument or index at period end and is representative of volume of activity during the period. Securities deposited to meet initial margin requirements are identified in the Schedule of Investments.
5. Purchases and Sales of Investments.
Purchases and sales of securities, other than short-term securities, aggregated $231,994,993 and $232,348,094, respectively.
6. Fees and Other Transactions with Affiliates.
Management Fee. Fidelity Management & Research Company (the investment adviser) and its affiliates provide the Fund with investment management related services for which the Fund pays a monthly management fee. The management fee is the sum of an individual fund fee rate that is based on an annual rate of .60% of the Fund's average net assets and an annualized group fee rate that averaged .24% during the period. The group fee rate is based upon the average net assets of all the mutual funds advised by the investment adviser, including any mutual funds previously advised by the investment adviser that are currently advised by Fidelity SelectCo, LLC, an affiliate of the investment adviser. The group fee rate decreases as assets under management increase and increases as assets under management decrease. For the reporting period, the total annual management fee rate was .84% of the Fund's average net assets.
Distribution and Service Plan Fees. In accordance with Rule 12b-1 of the 1940 Act, the Fund has adopted separate Distribution and Service Plans for each class of shares. Certain classes pay Fidelity Distributors Corporation (FDC), an affiliate of the investment adviser, separate Distribution and Service Fees, each of which is based on an annual percentage of each class' average net assets. In addition, FDC may pay financial intermediaries for selling shares of the Fund and providing shareholder support services. For the period, the Distribution and Service Fee rates, total fees and amounts retained by FDC were as follows:
| | Distribution Fee | Service Fee | Total Fees | Retained by FDC |
| Class A | -% | .25% | $38,585 | $925 |
| Class M | .25% | .25% | 28,740 | 50 |
| Class C | .75% | .25% | 94,688 | 13,988 |
| | | | $162,013 | $14,963 |
Sales Load. FDC may receive a front-end sales charge of up to 5.75% for selling Class A shares and 3.50% for selling Class M shares, some of which is paid to financial intermediaries for selling shares of the Fund. Depending on the holding period, FDC may receive contingent deferred sales charges levied on Class A, Class M and Class C redemptions. The deferred sales charges are 1.00% for Class C shares, 1.00% for certain purchases of Class A shares and .25% for certain purchases of Class M shares.
For the period, sales charge amounts retained by FDC were as follows:
| | Retained by FDC |
| Class A | $3,710 |
| Class M | 936 |
| Class C(a) | 1,487 |
| | $6,133 |
(a) When Class C shares are initially sold, FDC pays commissions from its own resources to financial intermediaries through which the sales are made.
Transfer Agent Fees. Fidelity Investments Institutional Operations Company, Inc., (FIIOC), an affiliate of the investment adviser, is the transfer, dividend disbursing and shareholder servicing agent for each class of the Fund. FIIOC receives account fees and asset-based fees that vary according to the account size and type of account of the shareholders of the respective classes of the Fund, except for Class Z. FIIOC receives an asset-based fee of Class Z's average net assets. FIIOC pays for typesetting, printing and mailing of shareholder reports, except proxy statements.
For the period, transfer agent fees for each class were as follows:
| | Amount | % of Class-Level Average Net Assets |
| Class A | $36,687 | .24 |
| Class M | 17,555 | .31 |
| Class C | 28,096 | .30 |
| Emerging Markets Discovery | 415,611 | .20 |
| Class I | 101,431 | .19 |
| Class Z | 3,581 | .05 |
| | $602,961 | |
Accounting and Security Lending Fees. Fidelity Service Company, Inc. (FSC), an affiliate of the investment adviser, maintains the Fund's accounting records. The accounting fee is based on the level of average net assets for each month. Prior to April 1, 2019, FSC had a separate agreement with the Fund for administration of the security lending program, based on the number and duration of lending transactions. For the period, the total fees paid for accounting and administration of securities lending were equivalent to an annual rate of .05%.
Brokerage Commissions. The Fund placed a portion of its portfolio transactions with brokerage firms which are affiliates of the investment adviser. Brokerage commissions are included in net realized gain (loss) and change in net unrealized appreciation (depreciation) in the Statement of Operations. The commissions paid to these affiliated firms were $1,435 for the period.
Interfund Trades. The Fund may purchase from or sell securities to other Fidelity Funds under procedures adopted by the Board. The procedures have been designed to ensure these interfund trades are executed in accordance with Rule 17a-7 of the 1940 Act. Interfund trades are included within the respective purchases and sales amounts shown in the Purchases and Sales of Investments note.
7. Committed Line of Credit.
The Fund participates with other funds managed by the investment adviser or an affiliate in a $4.25 billion credit facility (the "line of credit") to be utilized for temporary or emergency purposes to fund shareholder redemptions or for other short-term liquidity purposes. The Fund has agreed to pay commitment fees on its pro-rata portion of the line of credit, which amounted to $803 and is reflected in Miscellaneous expenses on the Statement of Operations. During the period, the Fund did not borrow on this line of credit.
8. Security Lending.
The Fund lends portfolio securities from time to time in order to earn additional income. For equity securities, lending agents are used, including National Financial Services (NFS), an affiliate of the Fund. Pursuant to a securities lending agreement, NFS will receive a fee, which is capped at 9.9% of daily lending revenue, for its services as lending agent. The Fund may lend securities to certain qualified borrowers, including NFS. On the settlement date of the loan, the Fund receives collateral (in the form of U.S. Treasury obligations, letters of credit and/or cash) against the loaned securities and maintains collateral in an amount not less than 100% of the market value of the loaned securities during the period of the loan. The market value of the loaned securities is determined at the close of business of the Fund and any additional required collateral is delivered to the Fund on the next business day. The Fund or borrower may terminate the loan at any time, and if the borrower defaults on its obligation to return the securities loaned because of insolvency or other reasons, the Fund may apply collateral received from the borrower against the obligation. The Fund may experience delays and costs in recovering the securities loaned. Any cash collateral received is invested in the Fidelity Securities Lending Cash Central Fund. The value of loaned securities and cash collateral at period end are disclosed on the Fund's Statement of Assets and Liabilities. Total fees paid by the Fund to NFS, as lending agent, amounted to $456. Security lending income represents the income earned on investing cash collateral, less rebates paid to borrowers and any lending agent fees associated with the loan, plus any premium payments received for lending certain types of securities. Security lending income is presented in the Statement of Operations as a component of income from Fidelity Central Funds. During the period, there were no securities loaned to NFS.
9. Expense Reductions.
Commissions paid to certain brokers with whom the investment adviser, or its affiliates, places trades on behalf of the Fund include an amount in addition to trade execution, which may be rebated back to the Fund to offset certain expenses. This amount totaled $638 for the period.
In addition, during the period the investment adviser reimbursed and/or waived a portion of fund-level operating expenses in the amount of $2,200 and a portion of class-level operating expenses as follows:
| | Amount |
| Class A | $849 |
| Class M | 319 |
| Class C | 573 |
| Emerging Markets Discovery | 11,030 |
| Class I | 2,952 |
| Class Z | 276 |
| | $15,999 |
10. Distributions to Shareholders.
Distributions to shareholders of each class were as follows:
| | Year ended
October 31, 2019 | Year ended
October 31, 2018 |
| Distributions to shareholders | | |
| Class A | $223,445 | $352,909 |
| Class M | 47,798 | 173,255 |
| Class C | 53,825 | 250,963 |
| Emerging Markets Discovery | 3,515,165 | 6,626,159 |
| Class I | 985,108 | 2,221,929 |
| Class Z | 71,263 | – |
| Total | $4,896,604 | $9,625,215 |
11. Share Transactions.
Share transactions for each class were as follows and may contain automatic conversions between classes or exchanges between affiliated funds:
| | Shares | Shares | Dollars | Dollars |
| | Year ended October 31, 2019 | Year ended October 31, 2018(a) | Year ended October 31, 2019 | Year ended October 31, 2018(a) |
| Class A | | | | |
| Shares sold | 168,686 | 777,539 | $2,185,595 | $11,772,607 |
| Reinvestment of distributions | 18,309 | 23,808 | 222,825 | 349,501 |
| Shares redeemed | (269,605) | (665,814) | (3,507,713) | (9,435,862) |
| Net increase (decrease) | (82,610) | 135,533 | $(1,099,293) | $2,686,246 |
| Class M | | | | |
| Shares sold | 70,918 | 210,943 | $922,527 | $3,284,695 |
| Reinvestment of distributions | 3,931 | 11,842 | 47,798 | 173,256 |
| Shares redeemed | (101,078) | (401,523) | (1,330,432) | (5,504,533) |
| Net increase (decrease) | (26,229) | (178,738) | $(360,107) | $(2,046,582) |
| Class C | | | | |
| Shares sold | 76,141 | 347,529 | $953,265 | $5,193,330 |
| Reinvestment of distributions | 4,495 | 17,450 | 53,580 | 250,411 |
| Shares redeemed | (478,619) | (365,570) | (6,094,438) | (5,076,684) |
| Net increase (decrease) | (397,983) | (591) | $(5,087,593) | $367,057 |
| Emerging Markets Discovery | | | | |
| Shares sold | 6,459,351 | 10,973,034 | $84,534,133 | $167,396,079 |
| Reinvestment of distributions | 267,714 | 427,369 | 3,268,785 | 6,303,689 |
| Shares redeemed | (7,145,375) | (12,217,890) | (92,623,842) | (179,945,966) |
| Net increase (decrease) | (418,310) | (817,487) | $(4,820,924) | $(6,246,198) |
| Class I | | | | |
| Shares sold | 1,400,912 | 3,126,297 | $18,473,846 | $46,808,802 |
| Reinvestment of distributions | 79,303 | 148,725 | 971,460 | 2,198,156 |
| Shares redeemed | (2,517,006) | (4,945,734) | (32,749,170) | (69,393,677) |
| Net increase (decrease) | (1,036,791) | (1,670,712) | $(13,303,864) | $(20,386,719) |
| Class Z | | | | |
| Shares sold | 1,476,128 | 117,308 | $19,208,206 | $1,426,892 |
| Reinvestment of distributions | 5,593 | – | 68,346 | – |
| Shares redeemed | (271,402) | (875) | (3,627,838) | (10,399) |
| Net increase (decrease) | 1,210,319 | 116,433 | $15,648,714 | $1,416,493 |
(a) Share transactions for Class Z are for the period October 2, 2018 (commencement of sale of shares) to October 31, 2018.
12. Other.
The Fund's organizational documents provide former and current trustees and officers with a limited indemnification against liabilities arising in connection with the performance of their duties to the Fund. In the normal course of business, the Fund may also enter into contracts that provide general indemnifications. The Fund's maximum exposure under these arrangements is unknown as this would be dependent on future claims that may be made against the Fund. The risk of material loss from such claims is considered remote.
Fidelity® Total Emerging Markets Fund
Performance: The Bottom Line
Average annual total return reflects the change in the value of an investment, assuming reinvestment of distributions from dividend income and capital gains (the profits earned upon the sale of securities that have grown in value, if any) and assuming a constant rate of performance each year. The hypothetical investment and the average annual total returns do not reflect the deduction of taxes that a shareholder would pay on fund distributions or the redemption of fund shares. During periods of reimbursement by Fidelity, a fund’s total return will be greater than it would be had the reimbursement not occurred. How a fund did yesterday is no guarantee of how it will do tomorrow.
Average Annual Total Returns
| For the periods ended October 31, 2019 | Past 1 year | Past 5 years | Life of fundA |
| Class A (incl. 5.75% sales charge) | 6.86% | 2.89% | 4.08% |
| Class M (incl. 3.50% sales charge) | 9.10% | 3.08% | 4.10% |
| Class C (incl. contingent deferred sales charge) | 11.54% | 3.34% | 4.06% |
| Fidelity® Total Emerging Markets Fund | 13.80% | 4.38% | 5.12% |
| Class I | 13.77% | 4.41% | 5.13% |
| Class Z | 13.85% | 4.42% | 5.14% |
A From November 1, 2011
Class C shares' contingent deferred sales charges included in the past one year, past five years, and life of fund total return figures are 1%, 0%, and 0%, respectively.
The initial offering of Class Z shares took place on October 2, 2018. Returns prior to October 2, 2018, are those of Class I.
$10,000 Over Life of Fund
Let's say hypothetically that $10,000 was invested in Fidelity® Total Emerging Markets Fund, a class of the fund, on November 1, 2011, when the fund started.
The chart shows how the value of your investment would have changed, and also shows how the MSCI Emerging Markets Index performed over the same period.

| Period Ending Values |
| $14,910 | Fidelity® Total Emerging Markets Fund |
| $13,114 | MSCI Emerging Markets Index |
Fidelity® Total Emerging Markets Fund
Management's Discussion of Fund Performance
Market Recap: For the 12 months ending October 31, 2019, the Fidelity Total Emerging Markets Composite Index℠ – consisting of 60% equities and 40% debt – gained 12.86%. Separately, emerging-markets debt rose 13.69%, as measured by the J.P. Morgan Emerging Markets Bond Index Global, while emerging-markets equities advanced 11.89%, according to the MSCI Emerging Markets Index. Both the debt and equity asset classes overcame several headwinds, including early-period concern about global interest rates, as well as ongoing trade tension and fears of a global economic slowdown. Much of the Composite index’s gain came in January 2019, when emerging-markets assets reacted favorably to the U.S. Federal Reserve’s shift away from its monetary tightening bias, as well as signs of economic stabilization in China and optimism for a resolution to U.S.–China trade tension. Within the emerging-markets debt index, Ukraine (+24%) and Turkey (+16%) led the way, whereas Venezuela (-65%) and Argentina (-42%) were notable laggards. On July 31, JPMorgan Chase began the process of phasing out bonds issued by Venezuela and state-run oil company Petroleos de Venezuela from the debt index. This is expected to be completed on November 30, 2019. Looking at equities, Russia gained 36%, benefiting from oil-price gains early in the period, attractive dividend yields and the absence of fresh sanctions. Taiwan (+23%) also outperformed, rising on the strength of its technology sector.
Comments from Lead Portfolio Manager James Hayes: For the fiscal year, the fund’s share classes (excluding sales charges, if applicable) returned about 13% to 14%, with most ahead of the Composite index. Security selection among emerging-markets equities drove the fund’s outperformance of the Composite the past 12 months. Within equities, choices in the consumer discretionary, financials and materials sectors added value. Among individual stock holdings, an outsized stake in Meituan Dianping (+86%) contributed most. Shares of this food-delivery service in China benefited from strong revenue growth and a boost in active users for the trailing 12 months. Avoiding Composite index component and Chinese tech giant Baidu (-46%) also helped our relative result. Turning to the fund’s debt sleeve, an overweighting and disappointing picks in Argentina stood out to the downside. An overweighting in Venezuela also detracted on a relative basis, as did the fund’s overall asset allocation.
The views expressed above reflect those of the portfolio manager(s) only through the end of the period as stated on the cover of this report and do not necessarily represent the views of Fidelity or any other person in the Fidelity organization. Any such views are subject to change at any time based upon market or other conditions and Fidelity disclaims any responsibility to update such views. These views may not be relied on as investment advice and, because investment decisions for a Fidelity fund are based on numerous factors, may not be relied on as an indication of trading intent on behalf of any Fidelity fund.
Notes to shareholders: On August 1, 2019, Jim Hayes assumed lead management responsibilities, succeeding John Carlson, who assumed co-management responsibilities until the end of 2019, when he will retire from Fidelity. On June 29, 2019, Jonathan Kelly assumed co-management responsibilities for the fund. On December 1, 2018, Xiaoting Zhao assumed portfolio management responsibilities for the fund's telecommunication services subportfolio, succeeding James Hayes.
Fidelity® Total Emerging Markets Fund
Investment Summary (Unaudited)
Top Five Stocks as of October 31, 2019
| | % of fund's net assets |
| Tencent Holdings Ltd. (Cayman Islands, Interactive Media & Services) | 3.8 |
| Samsung Electronics Co. Ltd. (Korea (South), Technology Hardware, Storage & Peripherals) | 3.5 |
| Taiwan Semiconductor Manufacturing Co. Ltd. (Taiwan, Semiconductors & Semiconductor Equipment) | 3.5 |
| Alibaba Group Holding Ltd. sponsored ADR (Cayman Islands, Internet & Direct Marketing Retail) | 2.8 |
| Meituan Dianping Class B (Cayman Islands, Internet & Direct Marketing Retail) | 1.7 |
| | 15.3 |
Top Five Market Sectors as of October 31, 2019
| | % of fund's net assets |
| Financials | 18.0 |
| Consumer Discretionary | 11.9 |
| Information Technology | 10.9 |
| Energy | 9.0 |
| Communication Services | 6.6 |
Top Five Countries as of October 31, 2019
| (excluding cash equivalents) | % of fund's net assets |
| Cayman Islands | 15.9 |
| Korea (South) | 9.9 |
| China | 6.9 |
| India | 6.9 |
| Brazil | 6.9 |
Percentages are adjusted for the effect of futures contracts, if applicable.
Asset Allocation (% of fund's net assets)
| As of October 31, 2019 |
| | Stocks and Equity Futures | 71.3% |
| | Bonds | 22.4% |
| | Other Investments | 0.1% |
| | Short-Term Investments and Net Other Assets (Liabilities) | 6.2% |

Fidelity® Total Emerging Markets Fund
Schedule of Investments October 31, 2019
Showing Percentage of Net Assets
| Common Stocks - 67.1% | | | |
| | | Shares | Value |
| Australia - 0.0% | | | |
| Frontier Digital Ventures Ltd. (a) | | 59,038 | $33,239 |
| Belgium - 0.3% | | | |
| Titan Cement International Trading SA (a) | | 119,600 | 2,497,059 |
| Bermuda - 1.0% | | | |
| AGTech Holdings Ltd. (a) | | 1,668,000 | 79,474 |
| China Gas Holdings Ltd. | | 317,844 | 1,353,996 |
| Credicorp Ltd. (United States) | | 10,268 | 2,197,763 |
| GP Investments Ltd. Class A (depositary receipt) (a) | | 22,922 | 36,979 |
| Kunlun Energy Co. Ltd. | | 312,440 | 290,799 |
| Marvell Technology Group Ltd. | | 21,100 | 514,629 |
| Pacific Basin Shipping Ltd. | | 2,629,000 | 608,712 |
| Shangri-La Asia Ltd. | | 1,708,000 | 1,753,112 |
|
| TOTAL BERMUDA | | | 6,835,464 |
|
| Brazil - 4.2% | | | |
| Atacadao Distribuicao Comercio e Industria Ltda | | 330,400 | 1,574,353 |
| Azul SA sponsored ADR (a) | | 38,300 | 1,492,934 |
| Banco do Brasil SA | | 517,884 | 6,217,707 |
| BTG Pactual Participations Ltd. unit | | 117,500 | 1,903,204 |
| Centrais Eletricas Brasileiras SA (Electrobras) (a) | | 96,030 | 947,250 |
| Companhia de Saneamento de Minas Gerais | | 83,796 | 1,410,146 |
| Direcional Engenharia SA | | 314,800 | 938,003 |
| Localiza Rent A Car SA | | 149,085 | 1,605,159 |
| Natura Cosmeticos SA | | 571,000 | 4,436,444 |
| Notre Dame Intermedica Participacoes SA | | 114,622 | 1,714,829 |
| Petrobras Distribuidora SA | | 233,900 | 1,649,343 |
| Rumo SA (a) | | 311,500 | 1,770,901 |
| Suzano Papel e Celulose SA | | 176,200 | 1,434,028 |
| Totvs SA | | 31,200 | 484,512 |
| Vale SA sponsored ADR (a) | | 194,468 | 2,283,054 |
|
| TOTAL BRAZIL | | | 29,861,867 |
|
| British Virgin Islands - 0.1% | | | |
| Mail.Ru Group Ltd. GDR (Reg. S) (a) | | 29,800 | 632,952 |
| Canada - 0.1% | | | |
| Pan American Silver Corp. | | 59,600 | 1,016,180 |
| Cayman Islands - 15.9% | | | |
| 51job, Inc. sponsored ADR (a) | | 11,300 | 890,101 |
| Airtac International Group | | 79,000 | 1,081,464 |
| Alibaba Group Holding Ltd. sponsored ADR (a) | | 114,700 | 20,264,049 |
| Ant International Co. Ltd. Class C (a)(b)(c) | | 288,435 | 1,897,902 |
| Bilibili, Inc. ADR (a) | | 82,000 | 1,294,780 |
| Chailease Holding Co. Ltd. | | 229,490 | 1,034,654 |
| China Resources Land Ltd. | | 484,730 | 2,061,498 |
| China State Construction International Holdings Ltd. | | 1,058,000 | 974,369 |
| CStone Pharmaceuticals Co. Ltd. (a)(d) | | 412,343 | 549,708 |
| Haitian International Holdings Ltd. | | 452,000 | 1,066,590 |
| Hansoh Pharmaceutical Group Co. Ltd. (d) | | 377,225 | 1,146,032 |
| Hutchison China Meditech Ltd. sponsored ADR (a) | | 27,154 | 513,211 |
| iQIYI, Inc. ADR (a) | | 35,600 | 620,508 |
| JD.com, Inc. sponsored ADR (a) | | 162,700 | 5,068,105 |
| Kingdee International Software Group Co. Ltd. | | 472,000 | 517,194 |
| Kingsoft Corp. Ltd. (a) | | 1,648,000 | 3,792,774 |
| Koolearn Technology Holding Ltd. (a)(d) | | 362,000 | 849,815 |
| LexinFintech Holdings Ltd. ADR (a) | | 21,200 | 240,408 |
| Li Ning Co. Ltd. | | 788,614 | 2,674,050 |
| Meituan Dianping Class B (a) | | 1,034,400 | 12,338,471 |
| Momo, Inc. ADR | | 4,080 | 136,762 |
| NetEase, Inc. ADR | | 6,300 | 1,800,918 |
| New Oriental Education & Technology Group, Inc. sponsored ADR (a) | | 27,900 | 3,405,474 |
| PagSeguro Digital Ltd. (a) | | 113,600 | 4,212,288 |
| Pinduoduo, Inc. ADR (a) | | 153,600 | 6,279,168 |
| PPDAI Group, Inc. ADR | | 36,400 | 101,920 |
| Qutoutiao, Inc. ADR (a)(e) | | 81,600 | 339,456 |
| Shenzhou International Group Holdings Ltd. | | 266,500 | 3,682,671 |
| Shimao Property Holdings Ltd. | | 369,860 | 1,239,063 |
| Sunny Optical Technology Group Co. Ltd. | | 109,100 | 1,753,661 |
| Tencent Holdings Ltd. | | 666,650 | 27,041,261 |
| Tencent Music Entertainment Group ADR (a) | | 21,400 | 296,176 |
| Uni-President China Holdings Ltd. | | 2,140,600 | 2,211,093 |
| Weidai Ltd. ADR | | 10,100 | 64,236 |
| Wise Talent Information Technology Co. Ltd. (a) | | 208,068 | 518,378 |
| Wuxi Biologics (Cayman), Inc. (a)(d) | | 114,546 | 1,346,083 |
| YY, Inc. ADR (a) | | 4,000 | 227,360 |
| Zai Lab Ltd. ADR (a) | | 22,400 | 756,896 |
|
| TOTAL CAYMAN ISLANDS | | | 114,288,547 |
|
| Chile - 0.1% | | | |
| Vina Concha y Toro SA | | 567,835 | 1,045,166 |
| China - 6.9% | | | |
| BBMG Corp. (H Shares) | | 3,201,000 | 916,101 |
| Beijing Sinnet Technology Co. Ltd. (A Shares) | | 98,314 | 243,431 |
| China Communications Construction Co. Ltd. (H Shares) | | 784,000 | 596,814 |
| China Communications Services Corp. Ltd. (H Shares) | | 510,000 | 314,939 |
| China Life Insurance Co. Ltd. (H Shares) | | 2,635,934 | 6,778,809 |
| China Longyuan Power Grid Corp. Ltd. (H Shares) | | 2,249,460 | 1,215,237 |
| China Pacific Insurance (Group) Co. Ltd. (H Shares) | | 206,706 | 749,989 |
| China Petroleum & Chemical Corp. (H Shares) | | 5,332,000 | 3,032,709 |
| China Tower Corp. Ltd. (H Shares) (d) | | 3,838,000 | 844,716 |
| CRRC Corp. Ltd. (H Shares) | | 544,000 | 363,846 |
| Daqin Railway Co. Ltd. (A Shares) | | 1,229,500 | 1,331,776 |
| Glodon Co. Ltd. (A Shares) | | 68,297 | 309,451 |
| Haier Smart Home Co. Ltd. (A Shares) | | 2,198,611 | 4,993,626 |
| Hangzhou Tigermed Consulting Co. Ltd. (A Shares) | | 113,463 | 1,100,179 |
| Industrial & Commercial Bank of China Ltd. (H Shares) | | 14,121,660 | 10,116,663 |
| PICC Property & Casualty Co. Ltd. (H Shares) | | 1,375,870 | 1,741,190 |
| Ping An Bank Co. Ltd. (A Shares) | | 957,963 | 2,210,565 |
| Ping An Insurance Group Co. of China Ltd. (H Shares) | | 649,100 | 7,491,776 |
| Shenzhen Mindray Bio-Medical Electronics Co. Ltd. (A Shares) | | 43,663 | 1,102,467 |
| Sinopec Engineering Group Co. Ltd. (H Shares) | | 753,000 | 430,156 |
| Tsingtao Brewery Co. Ltd. (H Shares) | | 348,000 | 2,016,666 |
| WuXi AppTec Co. Ltd. (H Shares) (d) | | 73,000 | 880,141 |
| Zhuzhou CRRC Times Electric Co. Ltd. (H Shares) | | 204,800 | 759,924 |
|
| TOTAL CHINA | | | 49,541,171 |
|
| Egypt - 0.0% | | | |
| Six of October Development & Investment Co. | | 274,095 | 264,925 |
| Hong Kong - 2.2% | | | |
| AIA Group Ltd. | | 45,560 | 453,697 |
| China Everbright International Ltd. | | 723,000 | 546,448 |
| China Overseas Land and Investment Ltd. | | 933,040 | 2,944,201 |
| China Resources Beer Holdings Co. Ltd. | | 672,666 | 3,448,776 |
| China Resources Power Holdings Co. Ltd. | | 186,429 | 234,292 |
| China Unicom Ltd. | | 820,300 | 807,585 |
| China Unicom Ltd. sponsored ADR | | 32,220 | 314,145 |
| CNOOC Ltd. | | 2,715,000 | 4,040,601 |
| CSPC Pharmaceutical Group Ltd. | | 728,836 | 1,866,637 |
| Far East Horizon Ltd. | | 1,135,780 | 1,075,292 |
|
| TOTAL HONG KONG | | | 15,731,674 |
|
| Hungary - 0.3% | | | |
| OTP Bank PLC | | 41,640 | 1,917,996 |
| India - 6.9% | | | |
| Adani Ports & Special Economic Zone Ltd. (a) | | 283,066 | 1,576,224 |
| Axis Bank Ltd. | | 433,879 | 4,492,241 |
| Federal Bank Ltd. (a) | | 779,006 | 918,384 |
| ICICI Bank Ltd. | | 185,192 | 1,207,310 |
| ICICI Bank Ltd. sponsored ADR | | 610,340 | 7,952,730 |
| IndoStar Capital Finance Ltd. (d) | | 72,237 | 191,274 |
| Indraprastha Gas Ltd. (a) | | 313,693 | 1,728,578 |
| ITC Ltd. | | 885,513 | 3,211,376 |
| JK Cement Ltd. | | 91,674 | 1,441,184 |
| JM Financial Ltd. | | 345,449 | 379,186 |
| Larsen & Toubro Ltd. | | 113,069 | 2,344,268 |
| LIC Housing Finance Ltd. | | 231,790 | 1,345,358 |
| Manappuram General Finance & Leasing Ltd. | | 721,140 | 1,718,124 |
| NTPC Ltd. | | 454,964 | 783,998 |
| Oberoi Realty Ltd. (a) | | 112,793 | 804,533 |
| Petronet LNG Ltd. | | 272,906 | 1,100,432 |
| Phoenix Mills Ltd. (a) | | 84,152 | 851,904 |
| Power Grid Corp. of India Ltd. | | 434,942 | 1,215,397 |
| Reliance Industries Ltd. | | 368,713 | 7,594,169 |
| Shree Cement Ltd. | | 6,300 | 1,764,813 |
| Shriram Transport Finance Co. Ltd. | | 120,900 | 1,936,566 |
| State Bank of India (a) | | 1,103,775 | 4,850,769 |
|
| TOTAL INDIA | | | 49,408,818 |
|
| Indonesia - 0.9% | | | |
| PT Bank Mandiri (Persero) Tbk | | 5,847,500 | 2,922,986 |
| PT Bank Rakyat Indonesia Tbk | | 11,514,800 | 3,450,240 |
|
| TOTAL INDONESIA | | | 6,373,226 |
|
| Japan - 0.4% | | | |
| Keyence Corp. | | 1,000 | 632,296 |
| Money Forward, Inc. (a) | | 11,700 | 417,765 |
| Murata Manufacturing Co. Ltd. | | 7,100 | 386,582 |
| Nintendo Co. Ltd. | | 2,400 | 880,290 |
| Square Enix Holdings Co. Ltd. | | 11,500 | 547,265 |
|
| TOTAL JAPAN | | | 2,864,198 |
|
| Kazakhstan - 0.1% | | | |
| JSC Halyk Bank of Kazakhstan GDR | | 28,600 | 381,810 |
| Korea (South) - 9.0% | | | |
| AMOREPACIFIC Group, Inc. | | 33,849 | 2,446,937 |
| BS Financial Group, Inc. | | 55,622 | 330,322 |
| Daou Technology, Inc. | | 55,094 | 852,098 |
| Hyundai Fire & Marine Insurance Co. Ltd. | | 61,135 | 1,319,040 |
| Hyundai Mobis | | 32,175 | 6,543,378 |
| Kakao Corp. | | 9,450 | 1,142,601 |
| KB Financial Group, Inc. | | 119,138 | 4,263,832 |
| Korea Electric Power Corp. (a) | | 34,807 | 756,456 |
| Korea Electric Power Corp. sponsored ADR (a) | | 8,120 | 88,346 |
| LG Chemical Ltd. | | 5,293 | 1,390,764 |
| LG Corp. | | 28,012 | 1,661,155 |
| NAVER Corp. | | 10,818 | 1,515,993 |
| NCSOFT Corp. | | 3,250 | 1,432,978 |
| Netmarble Corp. (a)(d) | | 3,950 | 303,433 |
| POSCO | | 15,262 | 2,753,039 |
| S-Oil Corp. | | 16,480 | 1,403,973 |
| Samsung Biologics Co. Ltd. (a)(d) | | 1,638 | 557,762 |
| Samsung Electronics Co. Ltd. | | 583,698 | 25,137,683 |
| Samsung SDI Co. Ltd. | | 9,487 | 1,844,237 |
| Shinhan Financial Group Co. Ltd. | | 75,823 | 2,746,471 |
| SK Hynix, Inc. | | 88,342 | 6,189,956 |
|
| TOTAL KOREA (SOUTH) | | | 64,680,454 |
|
| Malaysia - 0.3% | | | |
| British American Tobacco (Malaysia) Bhd | | 121,400 | 546,538 |
| IHH Healthcare Bhd | | 642,500 | 875,655 |
| Tenaga Nasional Bhd | | 288,600 | 955,771 |
|
| TOTAL MALAYSIA | | | 2,377,964 |
|
| Mexico - 1.5% | | | |
| America Movil S.A.B. de CV Series L sponsored ADR | | 79,500 | 1,256,895 |
| Fibra Uno Administracion SA de CV | | 843,200 | 1,280,810 |
| Grupo Aeroportuario del Pacifico S.A.B. de CV Series B | | 110,800 | 1,161,653 |
| Grupo Aeroportuario Norte S.A.B. de CV | | 35,107 | 243,403 |
| Grupo Financiero Banorte S.A.B. de CV Series O | | 389,729 | 2,127,286 |
| Macquarie Mexican (REIT) (d) | | 1,107,170 | 1,560,910 |
| Wal-Mart de Mexico SA de CV Series V | | 967,400 | 2,903,231 |
|
| TOTAL MEXICO | | | 10,534,188 |
|
| Multi-National - 0.1% | | | |
| HKT Trust/HKT Ltd. unit | | 673,000 | 1,046,959 |
| Netherlands - 0.2% | | | |
| ASML Holding NV (Netherlands) | | 1,900 | 498,018 |
| NXP Semiconductors NV | | 5,700 | 647,976 |
| Yandex NV Series A (a) | | 17,639 | 588,966 |
|
| TOTAL NETHERLANDS | | | 1,734,960 |
|
| Nigeria - 0.3% | | | |
| Guaranty Trust Bank PLC | | 6,508,483 | 447,374 |
| Guaranty Trust Bank PLC GDR (Reg. S) | | 105,540 | 474,930 |
| Zenith Bank PLC | | 19,380,836 | 909,522 |
|
| TOTAL NIGERIA | | | 1,831,826 |
|
| Pakistan - 0.1% | | | |
| Habib Bank Ltd. | | 685,700 | 564,033 |
| Panama - 0.2% | | | |
| Copa Holdings SA Class A | | 14,549 | 1,480,215 |
| Peru - 0.5% | | | |
| Compania de Minas Buenaventura SA sponsored ADR | | 232,600 | 3,568,084 |
| Philippines - 0.6% | | | |
| Altus San Nicolas Corp. (b) | | 44,850 | 4,576 |
| Ayala Land, Inc. | | 790,900 | 755,285 |
| Metropolitan Bank & Trust Co. | | 1,941,477 | 2,582,735 |
| Robinsons Land Corp. | | 1,833,160 | 918,107 |
|
| TOTAL PHILIPPINES | | | 4,260,703 |
|
| Poland - 0.1% | | | |
| Dino Polska SA (a)(d) | | 27,400 | 1,068,562 |
| Russia - 4.0% | | | |
| Lukoil PJSC sponsored ADR | | 65,400 | 6,014,184 |
| MMC Norilsk Nickel PJSC sponsored ADR | | 148,700 | 4,118,990 |
| NOVATEK OAO GDR (Reg. S) | | 16,500 | 3,531,000 |
| Sberbank of Russia | | 1,423,600 | 5,217,367 |
| Sberbank of Russia sponsored ADR | | 458,584 | 6,741,185 |
| Tatneft PAO | | 167,500 | 1,954,439 |
| Unipro PJSC | | 24,535,700 | 1,010,164 |
|
| TOTAL RUSSIA | | | 28,587,329 |
|
| Singapore - 0.2% | | | |
| First Resources Ltd. | | 1,056,100 | 1,185,902 |
| South Africa - 2.8% | | | |
| AngloGold Ashanti Ltd. | | 136,300 | 3,014,725 |
| Barclays Africa Group Ltd. | | 371,850 | 3,811,398 |
| Bidvest Group Ltd. | | 87,356 | 1,191,263 |
| Impala Platinum Holdings Ltd. (a) | | 649,800 | 4,465,883 |
| Motus Holdings Ltd. | | 94,800 | 449,705 |
| Mr Price Group Ltd. | | 124,700 | 1,318,756 |
| Naspers Ltd. Class N | | 32,000 | 4,528,276 |
| Pick 'n Pay Stores Ltd. | | 300,500 | 1,314,520 |
|
| TOTAL SOUTH AFRICA | | | 20,094,526 |
|
| Taiwan - 4.5% | | | |
| Formosa Plastics Corp. | | 553,000 | 1,773,343 |
| Largan Precision Co. Ltd. | | 5,403 | 791,901 |
| MediaTek, Inc. | | 112,000 | 1,498,328 |
| Taiwan Semiconductor Manufacturing Co. Ltd. | | 2,544,000 | 24,883,697 |
| Unified-President Enterprises Corp. | | 1,318,000 | 3,249,839 |
|
| TOTAL TAIWAN | | | 32,197,108 |
|
| Thailand - 1.0% | | | |
| Kasikornbank PCL (For. Reg.) | | 527,700 | 2,437,329 |
| PTT Global Chemical PCL (For. Reg.) | | 1,008,700 | 1,704,150 |
| Siam Cement PCL (For. Reg.) | | 233,600 | 2,841,184 |
|
| TOTAL THAILAND | | | 6,982,663 |
|
| Turkey - 0.2% | | | |
| Enerjisa Enerji A/S (d) | | 253,600 | 274,570 |
| Tupras Turkiye Petrol Rafinerileri A/S | | 66,300 | 1,443,762 |
|
| TOTAL TURKEY | | | 1,718,332 |
|
| United Arab Emirates - 0.4% | | | |
| Emaar Properties PJSC | | 1,193,764 | 1,387,890 |
| National Bank of Abu Dhabi PJSC | | 353,745 | 1,465,931 |
|
| TOTAL UNITED ARAB EMIRATES | | | 2,853,821 |
|
| United Kingdom - 0.3% | | | |
| AstraZeneca PLC sponsored ADR | | 24,424 | 1,197,509 |
| Mondi PLC | | 43,327 | 896,045 |
|
| TOTAL UNITED KINGDOM | | | 2,093,554 |
|
| United States of America - 1.3% | | | |
| Activision Blizzard, Inc. | | 32,000 | 1,792,960 |
| Arco Platform Ltd. Class A (a) | | 11,400 | 473,100 |
| DouYu International Holdings Ltd. ADR | | 285,700 | 2,219,889 |
| MercadoLibre, Inc. (a) | | 7,300 | 3,807,096 |
| Micron Technology, Inc. (a) | | 24,800 | 1,179,240 |
|
| TOTAL UNITED STATES OF AMERICA | | | 9,472,285 |
|
| Vietnam - 0.1% | | | |
| Vietnam Technological & Commercial Joint Stock Bank (a) | | 500,000 | 509,564 |
| TOTAL COMMON STOCKS | | | |
| (Cost $411,740,707) | | | 481,537,324 |
|
| Nonconvertible Preferred Stocks - 3.6% | | | |
| Brazil - 2.7% | | | |
| Ambev SA sponsored ADR | | 468,700 | 2,020,097 |
| Banco do Estado Rio Grande do Sul SA | | 128,320 | 715,431 |
| Companhia Paranaense de Energia-Copel: | | | |
| (PN-B) | | 2,515 | 34,911 |
| (PN-B) sponsored ADR | | 121,212 | 1,671,513 |
| Itau Unibanco Holding SA sponsored ADR | | 806,786 | 7,285,278 |
| Metalurgica Gerdau SA (PN) | | 865,370 | 1,357,232 |
| Petroleo Brasileiro SA - Petrobras (PN) sponsored ADR (non-vtg.) | | 349,406 | 5,272,537 |
| Telefonica Brasil SA | | 64,663 | 855,831 |
|
| TOTAL BRAZIL | | | 19,212,830 |
|
| Korea (South) - 0.9% | | | |
| Hyundai Motor Co. Series 2 | | 60,017 | 4,066,811 |
| Samsung Electronics Co. Ltd. | | 74,628 | 2,617,710 |
|
| TOTAL KOREA (SOUTH) | | | 6,684,521 |
|
| TOTAL NONCONVERTIBLE PREFERRED STOCKS | | | |
| (Cost $21,692,482) | | | 25,897,351 |
| | | Principal Amount(f) | Value |
|
| Nonconvertible Bonds - 6.2% | | | |
| Azerbaijan - 0.8% | | | |
| Southern Gas Corridor CJSC 6.875% 3/24/26 (d) | | 1,650,000 | 1,922,250 |
| State Oil Co. of Azerbaijan Republic: | | | |
| 4.75% 3/13/23 (Reg. S) | | 500,000 | 520,469 |
| 6.95% 3/18/30 (Reg. S) | | 2,625,000 | 3,149,180 |
|
| TOTAL AZERBAIJAN | | | 5,591,899 |
|
| Bahrain - 0.4% | | | |
| The Oil and Gas Holding Co. 7.5% 10/25/27 (d) | | 2,405,000 | 2,686,836 |
| British Virgin Islands - 0.3% | | | |
| 1MDB Global Investments Ltd. 4.4% 3/9/23 | | 2,000,000 | 1,922,750 |
| Georgia - 0.9% | | | |
| Georgian Oil & Gas Corp. 6.75% 4/26/21 (d) | | 3,125,000 | 3,234,375 |
| JSC Georgian Railway 7.75% 7/11/22 (d) | | 3,150,000 | 3,449,250 |
|
| TOTAL GEORGIA | | | 6,683,625 |
|
| Mexico - 1.1% | | | |
| Pemex Project Funding Master Trust 6.625% 6/15/35 | | 1,675,000 | 1,707,093 |
| Petroleos Mexicanos: | | | |
| 6.49% 1/23/27 (d) | | 890,000 | 948,295 |
| 6.5% 6/2/41 | | 1,575,000 | 1,559,250 |
| 7.69% 1/23/50 (d) | | 3,464,000 | 3,757,747 |
|
| TOTAL MEXICO | | | 7,972,385 |
|
| Mongolia - 0.1% | | | |
| Trade and Development Bank of Mongolia LLC 9.375% 5/19/20 (d) | | 450,000 | 461,531 |
| Netherlands - 0.5% | | | |
| Petrobras Global Finance BV: | | | |
| 5.093% 1/15/30 (d) | | 756,000 | 799,848 |
| 6.9% 3/19/49 | | 2,500,000 | 2,897,156 |
|
| TOTAL NETHERLANDS | | | 3,697,004 |
|
| Saudi Arabia - 0.6% | | | |
| Saudi Arabian Oil Co.: | | | |
| 4.25% 4/16/39 (d) | | 3,355,000 | 3,592,433 |
| 4.375% 4/16/49 (d) | | 700,000 | 761,250 |
|
| TOTAL SAUDI ARABIA | | | 4,353,683 |
|
| South Africa - 0.8% | | | |
| Eskom Holdings SOC Ltd.: | | | |
| 6.75% 8/6/23 (d) | | 2,325,000 | 2,397,656 |
| 8.45% 8/10/28 (d) | | 3,350,000 | 3,668,250 |
|
| TOTAL SOUTH AFRICA | | | 6,065,906 |
|
| Tunisia - 0.1% | | | |
| Banque Centrale de Tunisie 5.75% 1/30/25 (d) | | 900,000 | 823,219 |
| Turkey - 0.1% | | | |
| Export Credit Bank of Turkey 6.125% 5/3/24 (d) | | 455,000 | 450,023 |
| T.C. Ziraat Bankasi A/S 5.125% 5/3/22 (d) | | 500,000 | 487,500 |
|
| TOTAL TURKEY | | | 937,523 |
|
| United Kingdom - 0.4% | | | |
| Biz Finance PLC 9.625% 4/27/22 (d) | | 2,500,000 | 2,599,997 |
| Venezuela - 0.1% | | | |
| Petroleos de Venezuela SA: | | | |
| 6% 5/16/24 (d)(g) | | 5,700,000 | 349,125 |
| 6% 11/15/26 (Reg. S) (g) | | 6,800,000 | 416,500 |
|
| TOTAL VENEZUELA | | | 765,625 |
|
| TOTAL NONCONVERTIBLE BONDS | | | |
| (Cost $45,324,728) | | | 44,561,983 |
|
| Government Obligations - 16.2% | | | |
| Angola - 0.1% | | | |
| Angola Republic 9.375% 5/8/48 (d) | | 725,000 | 766,688 |
| Argentina - 1.4% | | | |
| Argentine Republic: | | | |
| 5.875% 1/11/28 | | 5,230,000 | 2,000,475 |
| 6.875% 1/26/27 | | 2,200,000 | 868,313 |
| 6.875% 1/11/48 | | 4,250,000 | 1,673,438 |
| 7.125% 7/6/36 | | 2,550,000 | 996,891 |
| 7.5% 4/22/26 | | 10,510,000 | 4,420,769 |
| 7.82% 12/31/33 | EUR | 688,052 | 367,385 |
|
| TOTAL ARGENTINA | | | 10,327,271 |
|
| Azerbaijan - 0.0% | | | |
| Azerbaijan Republic 4.75% 3/18/24 (d) | | 400,000 | 423,500 |
| Bahrain - 0.1% | | | |
| Bahrain Kingdom 7% 10/12/28 (d) | | 425,000 | 490,078 |
| Benin - 0.1% | | | |
| Republic of Benin 5.75% 3/26/26 (d) | EUR | 1,000,000 | 1,148,759 |
| Cameroon - 0.6% | | | |
| Cameroon Republic 9.5% 11/19/25 (d) | | 3,750,000 | 4,129,688 |
| Costa Rica - 0.1% | | | |
| Costa Rican Republic 9.2% 2/21/24 (d) | | 665,000 | 744,683 |
| Dominican Republic - 0.3% | | | |
| Dominican Republic: | | | |
| 5.95% 1/25/27 (d) | | 500,000 | 550,000 |
| 6.4% 6/5/49 (d) | | 500,000 | 541,094 |
| 6.85% 1/27/45 (d) | | 350,000 | 395,063 |
| 7.45% 4/30/44 (d) | | 425,000 | 510,133 |
|
| TOTAL DOMINICAN REPUBLIC | | | 1,996,290 |
|
| Ecuador - 0.5% | | | |
| Ecuador Republic: | | | |
| 7.875% 3/27/25 (d) | | 900,000 | 846,000 |
| 7.875% 1/23/28 (d) | | 550,000 | 494,141 |
| 8.875% 10/23/27 (d) | | 210,000 | 196,941 |
| 9.65% 12/13/26 (d) | | 1,970,000 | 1,941,681 |
|
| TOTAL ECUADOR | | | 3,478,763 |
|
| Egypt - 1.7% | | | |
| Arab Republic of Egypt: | | | |
| yield at date of purchase 15.5493% to 17.8821% 11/5/19 to 12/24/19 | EGP | 62,950,000 | 3,870,011 |
| 7.5% 1/31/27(d) | | 3,050,000 | 3,305,438 |
| 7.6003% 3/1/29 (d) | | 500,000 | 530,000 |
| 7.903% 2/21/48 (d) | | 2,125,000 | 2,130,313 |
| 8.5% 1/31/47 (d) | | 1,875,000 | 1,969,336 |
| 8.7002% 3/1/49 (d) | | 720,000 | 771,075 |
|
| TOTAL EGYPT | | | 12,576,173 |
|
| El Salvador - 1.5% | | | |
| El Salvador Republic: | | | |
| 6.375% 1/18/27 (d) | | 1,550,000 | 1,625,563 |
| 7.1246% 1/20/50 (d) | | 520,000 | 532,350 |
| 7.625% 2/1/41 (d) | | 1,850,000 | 2,009,563 |
| 7.65% 6/15/35 (Reg. S) | | 2,400,000 | 2,618,250 |
| 8.625% 2/28/29 (d) | | 3,210,000 | 3,813,881 |
|
| TOTAL EL SALVADOR | | | 10,599,607 |
|
| Gabon - 0.5% | | | |
| Gabonese Republic 6.375% 12/12/24 (d) | | 3,960,000 | 3,938,963 |
| Ghana - 1.0% | | | |
| Ghana Republic: | | | |
| 7.875% 3/26/27 (d) | | 1,575,000 | 1,638,000 |
| 8.125% 1/18/26 (d) | | 2,025,000 | 2,142,703 |
| 8.95% 3/26/51 (d) | | 2,085,000 | 2,112,366 |
| 10.75% 10/14/30 (d) | | 825,000 | 1,043,625 |
|
| TOTAL GHANA | | | 6,936,694 |
|
| Guatemala - 0.1% | | | |
| Guatemalan Republic 4.375% 6/5/27 (d) | | 475,000 | 490,883 |
| Iraq - 0.3% | | | |
| Republic of Iraq 5.8% 1/15/28 (Reg. S) | | 2,000,000 | 1,917,500 |
| Ivory Coast - 0.6% | | | |
| Ivory Coast: | | | |
| 5.875% 10/17/31 (d) | EUR | 810,000 | 920,474 |
| 6.125% 6/15/33 (d) | | 1,000,000 | 981,563 |
| 6.375% 3/3/28 (d) | | 2,255,000 | 2,328,288 |
|
| TOTAL IVORY COAST | | | 4,230,325 |
|
| Jordan - 0.6% | | | |
| Jordanian Kingdom 7.375% 10/10/47 (d) | | 4,010,000 | 4,231,803 |
| Kenya - 0.2% | | | |
| Republic of Kenya: | | | |
| 7.25% 2/28/28 (d) | | 900,000 | 947,250 |
| 8.25% 2/28/48 (d) | | 300,000 | 314,906 |
|
| TOTAL KENYA | | | 1,262,156 |
|
| Lebanon - 1.3% | | | |
| Lebanese Republic: | | | |
| 6.375% 3/9/20 | | 7,150,000 | 5,863,000 |
| 6.65% 11/3/28(Reg. S) | | 2,000,000 | 1,115,000 |
| 6.65% 2/26/30 (Reg. S) | | 800,000 | 446,000 |
| 6.85% 3/23/27 | | 725,000 | 402,375 |
| 7.25% 3/23/37(Reg. S) | | 2,500,000 | 1,412,500 |
|
| TOTAL LEBANON | | | 9,238,875 |
|
| Nigeria - 0.9% | | | |
| Republic of Nigeria: | | | |
| yield at date of purchase 13.7104% 11/28/19 | NGN | 275,000,000 | 753,344 |
| 7.143% 2/23/30 (d) | | 500,000 | 501,719 |
| 7.875% 2/16/32 (d) | | 1,625,000 | 1,675,781 |
| 9.248% 1/21/49 (d) | | 3,060,000 | 3,390,863 |
|
| TOTAL NIGERIA | | | 6,321,707 |
|
| Oman - 0.9% | | | |
| Sultanate of Oman: | | | |
| 6.5% 3/8/47 (d) | | 2,055,000 | 1,900,875 |
| 6.75% 1/17/48 (d) | | 5,250,000 | 4,918,594 |
|
| TOTAL OMAN | | | 6,819,469 |
|
| Paraguay - 0.1% | | | |
| Republic of Paraguay 4.7% 3/27/27 (d) | | 400,000 | 437,875 |
| Russia - 0.3% | | | |
| Ministry of Finance of the Russian Federation: | | | |
| 4.25% 6/23/27(Reg. S) | | 400,000 | 429,200 |
| 5.1% 3/28/35 (d) | | 1,000,000 | 1,154,000 |
| 5.25% 6/23/47(Reg. S) | | 800,000 | 956,000 |
|
| TOTAL RUSSIA | | | 2,539,200 |
|
| Rwanda - 0.5% | | | |
| Rwanda Republic 6.625% 5/2/23 (d) | | 3,575,000 | 3,807,375 |
| Senegal - 0.1% | | | |
| Republic of Senegal: | | | |
| 6.25% 5/23/33 (d) | | 300,000 | 306,656 |
| 6.75% 3/13/48 (d) | | 300,000 | 294,563 |
|
| TOTAL SENEGAL | | | 601,219 |
|
| Sri Lanka - 0.2% | | | |
| Democratic Socialist Republic of Sri Lanka: | | | |
| 6.125% 6/3/25 (d) | | 400,000 | 394,500 |
| 6.2% 5/11/27 (d) | | 850,000 | 814,672 |
|
| TOTAL SRI LANKA | | | 1,209,172 |
|
| Turkey - 0.7% | | | |
| Turkish Republic: | | | |
| 4.875% 4/16/43 | | 250,000 | 199,141 |
| 5.75% 5/11/47 | | 4,275,000 | 3,672,492 |
| 6.875% 3/17/36 | | 975,000 | 959,461 |
|
| TOTAL TURKEY | | | 4,831,094 |
|
| Ukraine - 1.3% | | | |
| Ukraine Government: | | | |
| 7.375% 9/25/32 (d) | | 2,900,000 | 3,032,313 |
| 7.75% 9/1/21 (d) | | 930,000 | 972,315 |
| 7.75% 9/1/24 (d) | | 2,250,000 | 2,409,750 |
| 7.75% 9/1/25 (d) | | 550,000 | 589,600 |
| 7.75% 9/1/26 (d) | | 925,000 | 995,763 |
| 7.75% 9/1/27 (d) | | 1,350,000 | 1,453,275 |
|
| TOTAL UKRAINE | | | 9,453,016 |
|
| United Arab Emirates - 0.1% | | | |
| Emirate of Abu Dhabi 3.125% 9/30/49 (d) | | 500,000 | 481,875 |
| United States of America - 0.0% | | | |
| U.S. Treasury Bills, yield at date of purchase 1.88% to 2% 11/7/19 to 11/14/19 (h) | | 340,000 | 339,877 |
| Venezuela - 0.1% | | | |
| Venezuelan Republic 9.25% 9/15/27 (g) | | 6,200,000 | 589,000 |
| TOTAL GOVERNMENT OBLIGATIONS | | | |
| (Cost $126,468,102) | | | 116,359,578 |
|
| Preferred Securities - 0.1% | | | |
| Georgia - 0.1% | | | |
| Georgia Bank Joint Stock Co. 11.125% (Reg. S)(i)(j) | | | |
| (Cost $760,155) | | 700,000 | 769,925 |
| | | Shares | Value |
|
| Money Market Funds - 7.0% | | | |
| Fidelity Cash Central Fund 1.83% (k) | | 49,786,015 | 49,795,972 |
| Fidelity Securities Lending Cash Central Fund 1.84% (k)(l) | | 360,478 | 360,514 |
| TOTAL MONEY MARKET FUNDS | | | |
| (Cost $50,155,845) | | | 50,156,486 |
| TOTAL INVESTMENT IN SECURITIES - 100.2% | | | |
| (Cost $656,142,019) | | | 719,282,647 |
| NET OTHER ASSETS (LIABILITIES) - (0.2)% | | | (1,768,656) |
| NET ASSETS - 100% | | | $717,513,991 |
| Futures Contracts | | | | | |
| | Number of contracts | Expiration Date | Notional Amount | Value | Unrealized Appreciation/(Depreciation) |
| Purchased | | | | | |
| Equity Index Contracts | | | | | |
| ICE E-mini MSCI Emerging Markets Index Contracts (United States) | 85 | Dec. 2019 | $4,425,950 | $78,617 | $78,617 |
The notional amount of futures purchased as a percentage of Net Assets is 0.6%
Currency Abbreviations
EGP – Egyptian pound
EUR – European Monetary Unit
NGN – Nigerian naira
Categorizations in the Schedule of Investments are based on country or territory of incorporation.
Legend
(a) Non-income producing
(b) Level 3 security
(c) Restricted securities - Investment in securities not registered under the Securities Act of 1933 (excluding 144A issues). At the end of the period, the value of restricted securities (excluding 144A issues) amounted to $1,897,902 or 0.3% of net assets.
(d) Security exempt from registration under Rule 144A of the Securities Act of 1933. These securities may be resold in transactions exempt from registration, normally to qualified institutional buyers. At the end of the period, the value of these securities amounted to $122,451,747 or 17.1% of net assets.
(e) Security or a portion of the security is on loan at period end.
(f) Amount is stated in United States dollars unless otherwise noted.
(g) Non-income producing - Security is in default.
(h) Security or a portion of the security was pledged to cover margin requirements for futures contracts. At period end, the value of securities pledged amounted to $237,904.
(i) Security is perpetual in nature with no stated maturity date.
(j) Coupon rates for floating and adjustable rate securities reflect the rates in effect at period end.
(k) Affiliated fund that is generally available only to investment companies and other accounts managed by Fidelity Investments. The rate quoted is the annualized seven-day yield of the fund at period end. A complete unaudited listing of the fund's holdings as of its most recent quarter end is available upon request. In addition, each Fidelity Central Fund's financial statements, which are not covered by the Fund's Report of Independent Registered Public Accounting Firm, are available on the SEC's website or upon request.
(l) Investment made with cash collateral received from securities on loan.
Additional information on each restricted holding is as follows:
| Security | Acquisition Date | Acquisition Cost |
| Ant International Co. Ltd. Class C | 5/16/18 | $1,618,120 |
Affiliated Central Funds
Information regarding fiscal year to date income earned by the Fund from investments in Fidelity Central Funds is as follows:
| Fund | Income earned |
| Fidelity Cash Central Fund | $838,406 |
| Fidelity Securities Lending Cash Central Fund | 42,189 |
| Total | $880,595 |
Amounts in the income column in the above table include any capital gain distributions from underlying funds, which are presented in the corresponding line-item in the Statement of Operations, if applicable. Amount for Fidelity Securities Lending Cash Central Fund represents the income earned on investing cash collateral, less rebates paid to borrowers and any lending agent fees associated with the loan, plus any premium payments received for lending certain types of securities.
Investment Valuation
The following is a summary of the inputs used, as of October 31, 2019, involving the Fund's assets and liabilities carried at fair value. The inputs or methodology used for valuing securities may not be an indication of the risk associated with investing in those securities. For more information on valuation inputs, and their aggregation into the levels used below, please refer to the Investment Valuation section in the accompanying Notes to Financial Statements.
| | Valuation Inputs at Reporting Date: |
| Description | Total | Level 1 | Level 2 | Level 3 |
| Investments in Securities: | | | | |
| Equities: | | | | |
| Communication Services | $48,492,296 | $16,772,603 | $31,719,693 | $-- |
| Consumer Discretionary | 85,083,009 | 54,262,988 | 30,820,021 | -- |
| Consumer Staples | 32,679,500 | 20,059,149 | 12,620,351 | -- |
| Energy | 35,387,806 | 19,619,895 | 15,767,911 | -- |
| Financials | 120,880,952 | 49,093,235 | 71,787,717 | -- |
| Health Care | 13,607,109 | 4,740,207 | 8,866,902 | -- |
| Industrials | 23,492,314 | 12,578,248 | 10,914,066 | -- |
| Information Technology | 78,632,803 | 45,118,460 | 33,514,343 | -- |
| Materials | 39,235,858 | 24,800,662 | 14,435,196 | -- |
| Real Estate | 15,971,604 | 4,494,535 | 9,574,591 | 1,902,478 |
| Utilities | 13,971,424 | 5,436,900 | 8,534,524 | -- |
| Corporate Bonds | 44,561,983 | -- | 44,561,983 | -- |
| Government Obligations | 116,359,578 | -- | 116,359,578 | -- |
| Preferred Securities | 769,925 | -- | 769,925 | -- |
| Money Market Funds | 50,156,486 | 50,156,486 | -- | -- |
| Total Investments in Securities: | $719,282,647 | $307,133,368 | $410,246,801 | $1,902,478 |
| Derivative Instruments: | | | | |
| Assets | | | | |
| Futures Contracts | $78,617 | $78,617 | $-- | $-- |
| Total Assets | $78,617 | $78,617 | $-- | $-- |
| Total Derivative Instruments: | $78,617 | $78,617 | $-- | $-- |
Value of Derivative Instruments
The following table is a summary of the Fund's value of derivative instruments by primary risk exposure as of October 31, 2019. For additional information on derivative instruments, please refer to the Derivative Instruments section in the accompanying Notes to Financial Statements.
| Primary Risk Exposure / Derivative Type | Value |
| | Asset | Liability |
| Equity Risk | | |
| Futures Contracts(a) | $78,617 | $0 |
| Total Equity Risk | 78,617 | 0 |
| Total Value of Derivatives | $78,617 | $0 |
(a) Reflects gross cumulative appreciation (depreciation) on futures contracts as presented in the Schedule of Investments. In the Statement of Assets and Liabilities, the period end daily variation margin is included in receivable or payable for daily variation margin on futures contracts, and the net cumulative appreciation (depreciation) is included in Total accumulated earnings (loss).
Other Information
The composition of credit quality ratings as a percentage of Total Net Assets is as follows (Unaudited):
| AAA,AA,A | 0.7% |
| BBB | 1.1% |
| BB | 3.8% |
| B | 10.7% |
| CCC,CC,C | 2.8% |
| Not Rated | 3.4% |
| Equities | 70.7% |
| Short-Term Investments and Net Other Assets | 6.8% |
| | 100% |
We have used ratings from Moody's Investors Service, Inc. Where Moody's® ratings are not available, we have used S&P® ratings. All ratings are as of the date indicated and do not reflect subsequent changes.
See accompanying notes which are an integral part of the financial statements.
Fidelity® Total Emerging Markets Fund
Financial Statements
Statement of Assets and Liabilities
| | | October 31, 2019 |
| Assets | | |
Investment in securities, at value (including securities loaned of $333,258) — See accompanying schedule:
Unaffiliated issuers (cost $605,986,174) | $669,126,161 | |
| Fidelity Central Funds (cost $50,155,845) | 50,156,486 | |
| Total Investment in Securities (cost $656,142,019) | | $719,282,647 |
| Cash | | 133,143 |
| Foreign currency held at value (cost $37,494) | | 37,507 |
| Receivable for investments sold | | 4,462,488 |
| Receivable for fund shares sold | | 605,237 |
| Dividends receivable | | 482,954 |
| Interest receivable | | 2,630,642 |
| Distributions receivable from Fidelity Central Funds | | 66,832 |
| Prepaid expenses | | 1,301 |
| Other receivables | | 123,954 |
| Total assets | | 727,826,705 |
| Liabilities | | |
| Payable for investments purchased | $7,607,045 | |
| Payable for fund shares redeemed | 1,380,192 | |
| Accrued management fee | 461,733 | |
| Distribution and service plan fees payable | 41,206 | |
| Payable for daily variation margin on futures contracts | 33,575 | |
| Other affiliated payables | 137,453 | |
| Other payables and accrued expenses | 291,015 | |
| Collateral on securities loaned | 360,495 | |
| Total liabilities | | 10,312,714 |
| Net Assets | | $717,513,991 |
| Net Assets consist of: | | |
| Paid in capital | | $688,861,495 |
| Total accumulated earnings (loss) | | 28,652,496 |
| Net Assets | | $717,513,991 |
| Net Asset Value and Maximum Offering Price | | |
| Class A: | | |
| Net Asset Value and redemption price per share ($39,958,177 ÷ 3,121,165 shares)(a) | | $12.80 |
| Maximum offering price per share (100/94.25 of $12.80) | | $13.58 |
| Class M: | | |
| Net Asset Value and redemption price per share ($8,841,401 ÷ 692,014 shares)(a) | | $12.78 |
| Maximum offering price per share (100/96.50 of $12.78) | | $13.24 |
| Class C: | | |
| Net Asset Value and offering price per share ($35,545,407 ÷ 2,806,745 shares)(a) | | $12.66 |
| Total Emerging Markets: | | |
| Net Asset Value, offering price and redemption price per share ($199,708,042 ÷ 15,559,111 shares) | | $12.84 |
| Class I: | | |
| Net Asset Value, offering price and redemption price per share ($372,285,965 ÷ 29,041,254 shares) | | $12.82 |
| Class Z: | | |
| Net Asset Value, offering price and redemption price per share ($61,174,999 ÷ 4,779,524 shares) | | $12.80 |
(a) Redemption price per share is equal to net asset value less any applicable contingent deferred sales charge.
See accompanying notes which are an integral part of the financial statements.
Statement of Operations
| | | Year ended October 31, 2019 |
| Investment Income | | |
| Dividends | | $12,152,114 |
| Non-Cash dividends | | 4,440,936 |
| Interest | | 14,026,581 |
| Income from Fidelity Central Funds (including $42,189 from security lending) | | 880,595 |
| Income before foreign taxes withheld | | 31,500,226 |
| Less foreign taxes withheld | | (1,370,186) |
| Total income | | 30,130,040 |
| Expenses | | |
| Management fee | $5,377,473 | |
| Transfer agent fees | 1,273,470 | |
| Distribution and service plan fees | 512,951 | |
| Accounting and security lending fees | 334,922 | |
| Custodian fees and expenses | 373,684 | |
| Independent trustees' fees and expenses | 3,826 | |
| Registration fees | 154,721 | |
| Audit | 116,334 | |
| Legal | 2,799 | |
| Miscellaneous | 5,134 | |
| Total expenses before reductions | 8,155,314 | |
| Expense reductions | (42,673) | |
| Total expenses after reductions | | 8,112,641 |
| Net investment income (loss) | | 22,017,399 |
| Realized and Unrealized Gain (Loss) | | |
| Net realized gain (loss) on: | | |
| Investment securities: | | |
| Unaffiliated issuers | (20,455,885) | |
| Fidelity Central Funds | (388) | |
| Foreign currency transactions | (202,218) | |
| Futures contracts | 418,947 | |
| Total net realized gain (loss) | | (20,239,544) |
| Change in net unrealized appreciation (depreciation) on: | | |
| Investment securities: | | |
| Unaffiliated issuers | 79,541,285 | |
| Fidelity Central Funds | 426 | |
| Assets and liabilities in foreign currencies | 10,712 | |
| Futures contracts | 78,617 | |
| Total change in net unrealized appreciation (depreciation) | | 79,631,040 |
| Net gain (loss) | | 59,391,496 |
| Net increase (decrease) in net assets resulting from operations | | $81,408,895 |
See accompanying notes which are an integral part of the financial statements.
Statement of Changes in Net Assets
| | Year ended October 31, 2019 | Year ended October 31, 2018 |
| Increase (Decrease) in Net Assets | | |
| Operations | | |
| Net investment income (loss) | $22,017,399 | $17,099,153 |
| Net realized gain (loss) | (20,239,544) | (28,676,433) |
| Change in net unrealized appreciation (depreciation) | 79,631,040 | (97,197,474) |
| Net increase (decrease) in net assets resulting from operations | 81,408,895 | (108,774,754) |
| Distributions to shareholders | (14,178,054) | (20,273,542) |
| Share transactions - net increase (decrease) | 36,607,938 | 13,246,904 |
| Redemption fees | – | 23,374 |
| Total increase (decrease) in net assets | 103,838,779 | (115,778,018) |
| Net Assets | | |
| Beginning of period | 613,675,212 | 729,453,230 |
| End of period | $717,513,991 | $613,675,212 |
See accompanying notes which are an integral part of the financial statements.
Financial Highlights
Fidelity Total Emerging Markets Fund Class A
| Years ended October 31, | 2019 | 2018 | 2017 | 2016 | 2015 |
| Selected Per–Share Data | | | | | |
| Net asset value, beginning of period | $11.53 | $13.56 | $11.33 | $10.35 | $11.56 |
| Income from Investment Operations | | | | | |
| Net investment income (loss)A | .37B | .25 | .24 | .26 | .28 |
| Net realized and unrealized gain (loss) | 1.14 | (1.94) | 2.11 | .96 | (1.30) |
| Total from investment operations | 1.51 | (1.69) | 2.35 | 1.22 | (1.02) |
| Distributions from net investment income | (.24) | (.16) | (.12) | (.24) | (.17) |
| Distributions from net realized gain | – | (.19) | (.01) | – | (.02) |
| Total distributions | (.24) | (.34)C | (.13) | (.24) | (.19) |
| Redemption fees added to paid in capitalA | – | –D | .01 | –D | –D |
| Net asset value, end of period | $12.80 | $11.53 | $13.56 | $11.33 | $10.35 |
| Total ReturnE,F | 13.38% | (12.77)% | 21.13% | 12.13% | (8.92)% |
| Ratios to Average Net AssetsG,H | | | | | |
| Expenses before reductions | 1.39% | 1.40% | 1.47% | 1.87% | 1.93% |
| Expenses net of fee waivers, if any | 1.39% | 1.40% | 1.47% | 1.65% | 1.65% |
| Expenses net of all reductions | 1.39% | 1.37% | 1.46% | 1.64% | 1.64% |
| Net investment income (loss) | 3.02%B | 1.92% | 1.97% | 2.47% | 2.58% |
| Supplemental Data | | | | | |
| Net assets, end of period (000 omitted) | $39,958 | $34,617 | $42,213 | $15,206 | $10,164 |
| Portfolio turnover rateI | 75% | 94% | 59% | 57% | 80% |
A Calculated based on average shares outstanding during the period.
B Net investment income per share reflects a large, non-recurring dividend which amounted to $.08 per share. Excluding this non-recurring dividend, the ratio of net investment income (loss) to average net assets would have been 2.37%.
C Total distributions of $.34 per share is comprised of distributions from net investment income of $.157 and distributions from net realized gain of $.185 per share.
D Amount represents less than $.005 per share.
E Total returns would have been lower if certain expenses had not been reduced during the applicable periods shown.
F Total returns do not include the effect of the sales charges.
G Fees and expenses of any underlying Fidelity Central Funds are not included in the Fund's expense ratio. The Fund indirectly bears its proportionate share of the expenses of any underlying Fidelity Central Funds.
H Expense ratios reflect operating expenses of the class. Expenses before reductions do not reflect amounts reimbursed by the investment adviser or reductions from brokerage service arrangements or reductions from other expense offset arrangements and do not represent the amount paid by the class during periods when reimbursements or reductions occur. Expenses net of fee waivers reflect expenses after reimbursement by the investment adviser but prior to reductions from brokerage service arrangements or other expense offset arrangements. Expenses net of all reductions represent the net expenses paid by the class.
I Amount does not include the portfolio activity of any underlying Fidelity Central Funds.
See accompanying notes which are an integral part of the financial statements.
Fidelity Total Emerging Markets Fund Class M
| Years ended October 31, | 2019 | 2018 | 2017 | 2016 | 2015 |
| Selected Per–Share Data | | | | | |
| Net asset value, beginning of period | $11.51 | $13.55 | $11.33 | $10.33 | $11.54 |
| Income from Investment Operations | | | | | |
| Net investment income (loss)A | .33B | .21 | .20 | .23 | .25 |
| Net realized and unrealized gain (loss) | 1.15 | (1.93) | 2.11 | .97 | (1.30) |
| Total from investment operations | 1.48 | (1.72) | 2.31 | 1.20 | (1.05) |
| Distributions from net investment income | (.21) | (.13) | (.09) | (.20) | (.14) |
| Distributions from net realized gain | – | (.19) | (.01) | – | (.02) |
| Total distributions | (.21) | (.32) | (.10) | (.20) | (.16) |
| Redemption fees added to paid in capitalA | – | –C | .01 | –C | –C |
| Net asset value, end of period | $12.78 | $11.51 | $13.55 | $11.33 | $10.33 |
| Total ReturnD,E | 13.05% | (13.03)% | 20.66% | 11.92% | (9.18)% |
| Ratios to Average Net AssetsF,G | | | | | |
| Expenses before reductions | 1.72% | 1.74% | 1.82% | 2.22% | 2.27% |
| Expenses net of fee waivers, if any | 1.71% | 1.74% | 1.82% | 1.90% | 1.90% |
| Expenses net of all reductions | 1.71% | 1.71% | 1.81% | 1.90% | 1.89% |
| Net investment income (loss) | 2.69%B | 1.58% | 1.62% | 2.22% | 2.33% |
| Supplemental Data | | | | | |
| Net assets, end of period (000 omitted) | $8,841 | $8,519 | $8,751 | $3,019 | $3,331 |
| Portfolio turnover rateH | 75% | 94% | 59% | 57% | 80% |
A Calculated based on average shares outstanding during the period.
B Net investment income per share reflects a large, non-recurring dividend which amounted to $.08 per share. Excluding this non-recurring dividend, the ratio of net investment income (loss) to average net assets would have been 2.04%.
C Amount represents less than $.005 per share.
D Total returns would have been lower if certain expenses had not been reduced during the applicable periods shown.
E Total returns do not include the effect of the sales charges.
F Fees and expenses of any underlying Fidelity Central Funds are not included in the Fund's expense ratio. The Fund indirectly bears its proportionate share of the expenses of any underlying Fidelity Central Funds.
G Expense ratios reflect operating expenses of the class. Expenses before reductions do not reflect amounts reimbursed by the investment adviser or reductions from brokerage service arrangements or reductions from other expense offset arrangements and do not represent the amount paid by the class during periods when reimbursements or reductions occur. Expenses net of fee waivers reflect expenses after reimbursement by the investment adviser but prior to reductions from brokerage service arrangements or other expense offset arrangements. Expenses net of all reductions represent the net expenses paid by the class.
H Amount does not include the portfolio activity of any underlying Fidelity Central Funds.
See accompanying notes which are an integral part of the financial statements.
Fidelity Total Emerging Markets Fund Class C
| Years ended October 31, | 2019 | 2018 | 2017 | 2016 | 2015 |
| Selected Per–Share Data | | | | | |
| Net asset value, beginning of period | $11.40 | $13.45 | $11.25 | $10.25 | $11.47 |
| Income from Investment Operations | | | | | |
| Net investment income (loss)A | .28B | .15 | .15 | .18 | .20 |
| Net realized and unrealized gain (loss) | 1.13 | (1.92) | 2.11 | .97 | (1.30) |
| Total from investment operations | 1.41 | (1.77) | 2.26 | 1.15 | (1.10) |
| Distributions from net investment income | (.15) | (.09) | (.06) | (.15) | (.10) |
| Distributions from net realized gain | – | (.19) | (.01) | – | (.02) |
| Total distributions | (.15) | (.28) | (.07) | (.15) | (.12) |
| Redemption fees added to paid in capitalA | – | –C | .01 | –C | –C |
| Net asset value, end of period | $12.66 | $11.40 | $13.45 | $11.25 | $10.25 |
| Total ReturnD,E | 12.54% | (13.45)% | 20.29% | 11.36% | (9.68)% |
| Ratios to Average Net AssetsF,G | | | | | |
| Expenses before reductions | 2.14% | 2.14% | 2.21% | 2.62% | 2.68% |
| Expenses net of fee waivers, if any | 2.14% | 2.14% | 2.21% | 2.40% | 2.40% |
| Expenses net of all reductions | 2.13% | 2.12% | 2.20% | 2.39% | 2.39% |
| Net investment income (loss) | 2.27%B | 1.18% | 1.23% | 1.72% | 1.83% |
| Supplemental Data | | | | | |
| Net assets, end of period (000 omitted) | $35,545 | $37,191 | $34,869 | $10,710 | $7,736 |
| Portfolio turnover rateH | 75% | 94% | 59% | 57% | 80% |
A Calculated based on average shares outstanding during the period.
B Net investment income per share reflects a large, non-recurring dividend which amounted to $.08 per share. Excluding this non-recurring dividend, the ratio of net investment income (loss) to average net assets would have been 1.62%.
C Amount represents less than $.005 per share.
D Total returns would have been lower if certain expenses had not been reduced during the applicable periods shown.
E Total returns do not include the effect of the contingent deferred sales charge.
F Fees and expenses of any underlying Fidelity Central Funds are not included in the Fund's expense ratio. The Fund indirectly bears its proportionate share of the expenses of any underlying Fidelity Central Funds.
G Expense ratios reflect operating expenses of the class. Expenses before reductions do not reflect amounts reimbursed by the investment adviser or reductions from brokerage service arrangements or reductions from other expense offset arrangements and do not represent the amount paid by the class during periods when reimbursements or reductions occur. Expenses net of fee waivers reflect expenses after reimbursement by the investment adviser but prior to reductions from brokerage service arrangements or other expense offset arrangements. Expenses net of all reductions represent the net expenses paid by the class.
H Amount does not include the portfolio activity of any underlying Fidelity Central Funds.
See accompanying notes which are an integral part of the financial statements.
Fidelity Total Emerging Markets Fund
| Years ended October 31, | 2019 | 2018 | 2017 | 2016 | 2015 |
| Selected Per–Share Data | | | | | |
| Net asset value, beginning of period | $11.56 | $13.58 | $11.34 | $10.38 | $11.60 |
| Income from Investment Operations | | | | | |
| Net investment income (loss)A | .40B | .29 | .27 | .28 | .31 |
| Net realized and unrealized gain (loss) | 1.16 | (1.95) | 2.10 | .97 | (1.31) |
| Total from investment operations | 1.56 | (1.66) | 2.37 | 1.25 | (1.00) |
| Distributions from net investment income | (.28) | (.17) | (.14) | (.29) | (.20) |
| Distributions from net realized gain | – | (.19) | (.01) | – | (.02) |
| Total distributions | (.28) | (.36) | (.14)C | (.29) | (.22) |
| Redemption fees added to paid in capitalA | – | –D | .01 | –D | –D |
| Net asset value, end of period | $12.84 | $11.56 | $13.58 | $11.34 | $10.38 |
| Total ReturnE | 13.80% | (12.56)% | 21.37% | 12.44% | (8.74)% |
| Ratios to Average Net AssetsF,G | | | | | |
| Expenses before reductions | 1.14% | 1.13% | 1.26% | 1.62% | 1.72% |
| Expenses net of fee waivers, if any | 1.14% | 1.13% | 1.26% | 1.40% | 1.40% |
| Expenses net of all reductions | 1.14% | 1.11% | 1.24% | 1.39% | 1.39% |
| Net investment income (loss) | 3.27%B | 2.19% | 2.18% | 2.72% | 2.83% |
| Supplemental Data | | | | | |
| Net assets, end of period (000 omitted) | $199,708 | $190,025 | $272,002 | $104,332 | $37,918 |
| Portfolio turnover rateH | 75% | 94% | 59% | 57% | 80% |
A Calculated based on average shares outstanding during the period.
B Net investment income per share reflects a large, non-recurring dividend which amounted to $.08 per share. Excluding this non-recurring dividend, the ratio of net investment income (loss) to average net assets would have been 2.62%.
C Total distributions of $.14 per share is comprised of distributions from net investment income of $.135 and distributions from net realized gain of $.009 per share.
D Amount represents less than $.005 per share.
E Total returns would have been lower if certain expenses had not been reduced during the applicable periods shown.
F Fees and expenses of any underlying Fidelity Central Funds are not included in the Fund's expense ratio. The Fund indirectly bears its proportionate share of the expenses of any underlying Fidelity Central Funds.
G Expense ratios reflect operating expenses of the class. Expenses before reductions do not reflect amounts reimbursed by the investment adviser or reductions from brokerage service arrangements or reductions from other expense offset arrangements and do not represent the amount paid by the class during periods when reimbursements or reductions occur. Expenses net of fee waivers reflect expenses after reimbursement by the investment adviser but prior to reductions from brokerage service arrangements or other expense offset arrangements. Expenses net of all reductions represent the net expenses paid by the class.
H Amount does not include the portfolio activity of any underlying Fidelity Central Funds.
See accompanying notes which are an integral part of the financial statements.
Fidelity Total Emerging Markets Fund Class I
| Years ended October 31, | 2019 | 2018 | 2017 | 2016 | 2015 |
| Selected Per–Share Data | | | | | |
| Net asset value, beginning of period | $11.55 | $13.58 | $11.33 | $10.37 | $11.59 |
| Income from Investment Operations | | | | | |
| Net investment income (loss)A | .41B | .29 | .28 | .29 | .31 |
| Net realized and unrealized gain (loss) | 1.14 | (1.95) | 2.11 | .96 | (1.31) |
| Total from investment operations | 1.55 | (1.66) | 2.39 | 1.25 | (1.00) |
| Distributions from net investment income | (.28) | (.19) | (.14) | (.29) | (.20) |
| Distributions from net realized gain | – | (.19) | (.01) | – | (.02) |
| Total distributions | (.28) | (.37)C | (.15) | (.29) | (.22) |
| Redemption fees added to paid in capitalA | – | –D | .01 | –D | –D |
| Net asset value, end of period | $12.82 | $11.55 | $13.58 | $11.33 | $10.37 |
| Total ReturnE | 13.77% | (12.56)% | 21.51% | 12.48% | (8.74)% |
| Ratios to Average Net AssetsF,G | | | | | |
| Expenses before reductions | 1.11% | 1.12% | 1.19% | 1.54% | 1.58% |
| Expenses net of fee waivers, if any | 1.10% | 1.12% | 1.19% | 1.40% | 1.40% |
| Expenses net of all reductions | 1.10% | 1.10% | 1.17% | 1.39% | 1.39% |
| Net investment income (loss) | 3.30%B | 2.20% | 2.25% | 2.72% | 2.83% |
| Supplemental Data | | | | | |
| Net assets, end of period (000 omitted) | $372,286 | $341,720 | $371,617 | $21,099 | $6,343 |
| Portfolio turnover rateH | 75% | 94% | 59% | 57% | 80% |
A Calculated based on average shares outstanding during the period.
B Net investment income per share reflects a large, non-recurring dividend which amounted to $.08 per share. Excluding this non-recurring dividend, the ratio of net investment income (loss) to average net assets would have been 2.65%.
C Total distributions of $.37 per share is comprised of distributions from net investment income of $.185 and distributions from net realized gain of $.185 per share.
D Amount represents less than $.005 per share.
E Total returns would have been lower if certain expenses had not been reduced during the applicable periods shown.
F Fees and expenses of any underlying Fidelity Central Funds are not included in the Fund's expense ratio. The Fund indirectly bears its proportionate share of the expenses of any underlying Fidelity Central Funds.
G Expense ratios reflect operating expenses of the class. Expenses before reductions do not reflect amounts reimbursed by the investment adviser or reductions from brokerage service arrangements or reductions from other expense offset arrangements and do not represent the amount paid by the class during periods when reimbursements or reductions occur. Expenses net of fee waivers reflect expenses after reimbursement by the investment adviser but prior to reductions from brokerage service arrangements or other expense offset arrangements. Expenses net of all reductions represent the net expenses paid by the class.
H Amount does not include the portfolio activity of any underlying Fidelity Central Funds.
See accompanying notes which are an integral part of the financial statements.
Fidelity Total Emerging Markets Fund Class Z
| Years ended October 31, | 2019 | 2018 A |
| Selected Per–Share Data | | |
| Net asset value, beginning of period | $11.55 | $12.17 |
| Income from Investment Operations | | |
| Net investment income (loss)B | .43C | .01 |
| Net realized and unrealized gain (loss) | 1.13 | (.63) |
| Total from investment operations | 1.56 | (.62) |
| Distributions from net investment income | (.31) | – |
| Distributions from net realized gain | – | – |
| Total distributions | (.31) | – |
| Net asset value, end of period | $12.80 | $11.55 |
| Total ReturnD,E | 13.85% | (5.09)% |
| Ratios to Average Net AssetsF,G | | |
| Expenses before reductions | .98% | 1.07%H |
| Expenses net of fee waivers, if any | .97% | 1.04%H |
| Expenses net of all reductions | .97% | 1.02%H |
| Net investment income (loss) | 3.43%C | 1.51%H |
| Supplemental Data | | |
| Net assets, end of period (000 omitted) | $61,175 | $1,603 |
| Portfolio turnover rateI | 75% | 94% |
A For the period October 2, 2018 (commencement of sale of shares) to October 31, 2018.
B Calculated based on average shares outstanding during the period.
C Net investment income per share reflects a large, non-recurring dividend which amounted to $.08 per share. Excluding this non-recurring dividend, the ratio of net investment income (loss) to average net assets would have been 2.79%.
D Total returns for periods of less than one year are not annualized.
E Total returns would have been lower if certain expenses had not been reduced during the applicable periods shown.
F Fees and expenses of any underlying Fidelity Central Funds are not included in the Fund's expense ratio. The Fund indirectly bears its proportionate share of the expenses of any underlying Fidelity Central Funds.
G Expense ratios reflect operating expenses of the class. Expenses before reductions do not reflect amounts reimbursed by the investment adviser or reductions from brokerage service arrangements or reductions from other expense offset arrangements and do not represent the amount paid by the class during periods when reimbursements or reductions occur. Expense ratios before reductions for start-up periods may not be representative of longer-term operating periods. Expenses net of fee waivers reflect expenses after reimbursement by the investment adviser but prior to reductions from brokerage service arrangements or other expense offset arrangements. Expenses net of all reductions represent the net expenses paid by the class.
H Annualized
I Amount does not include the portfolio activity of any underlying Fidelity Central Funds.
See accompanying notes which are an integral part of the financial statements.
Notes to Financial Statements
For the period ended October 31, 2019
1. Organization.
Fidelity Total Emerging Markets Fund (the Fund) is a fund of Fidelity Investment Trust (the Trust) and is authorized to issue an unlimited number of shares. The Trust is registered under the Investment Company Act of 1940, as amended (the 1940 Act), as an open-end management investment company organized as a Massachusetts business trust. The Fund offers Class A, Class M, Class C, Total Emerging Markets, Class I and Class Z shares, each of which has equal rights as to assets and voting privileges. Each class has exclusive voting rights with respect to matters that affect that class. Effective March 1, 2019, Class C shares will automatically convert to Class A shares after a holding period of ten years from the initial date of purchase, with certain exceptions. The Fund's investments in emerging markets can be subject to social, economic, regulatory, and political uncertainties and can be extremely volatile.
2. Investments in Fidelity Central Funds.
The Fund invests in Fidelity Central Funds, which are open-end investment companies generally available only to other investment companies and accounts managed by the investment adviser and its affiliates. The Fund's Schedule of Investments lists each of the Fidelity Central Funds held as of period end, if any, as an investment of the Fund, but does not include the underlying holdings of each Fidelity Central Fund. As an Investing Fund, the Fund indirectly bears its proportionate share of the expenses of the underlying Fidelity Central Funds.
The Money Market Central Funds seek preservation of capital and current income and are managed by Fidelity Investments Money Management, Inc. (FIMM), an affiliate of the investment adviser. Annualized expenses of the Money Market Central Funds as of their most recent shareholder report date ranged from less than .005% to .01%.
A complete unaudited list of holdings for each Fidelity Central Fund is available upon request or at the Securities and Exchange Commission (the SEC) website at www.sec.gov. In addition, the financial statements of the Fidelity Central Funds, which are not covered by the Fund's Report of Independent Registered Public Accounting Firm, are available on the SEC website or upon request.
3. Significant Accounting Policies.
The Fund is an investment company and applies the accounting and reporting guidance of the Financial Accounting Standards Board (FASB) Accounting Standards Codification Topic 946 Financial Services – Investments Companies. The financial statements have been prepared in conformity with accounting principles generally accepted in the United States of America (GAAP), which require management to make certain estimates and assumptions at the date of the financial statements. Actual results could differ from those estimates. Subsequent events, if any, through the date that the financial statements were issued have been evaluated in the preparation of the financial statements. The following summarizes the significant accounting policies of the Fund:
Investment Valuation. Investments are valued as of 4:00 p.m. Eastern time on the last calendar day of the period. The Board of Trustees (the Board) has delegated the day to day responsibility for the valuation of the Fund's investments to the Fair Value Committee (the Committee) established by the Fund's investment adviser. In accordance with valuation policies and procedures approved by the Board, the Fund attempts to obtain prices from one or more third party pricing vendors or brokers to value its investments. When current market prices, quotations or currency exchange rates are not readily available or reliable, investments will be fair valued in good faith by the Committee, in accordance with procedures adopted by the Board. Factors used in determining fair value vary by investment type and may include market or investment specific events, changes in interest rates and credit quality. The frequency with which these procedures are used cannot be predicted and they may be utilized to a significant extent. The Committee oversees the Fund's valuation policies and procedures and reports to the Board on the Committee's activities and fair value determinations. The Board monitors the appropriateness of the procedures used in valuing the Fund's investments and ratifies the fair value determinations of the Committee.
The Fund categorizes the inputs to valuation techniques used to value its investments into a disclosure hierarchy consisting of three levels as shown below:
- Level 1 – quoted prices in active markets for identical investments
- Level 2 – other significant observable inputs (including quoted prices for similar investments, interest rates, prepayment speeds, etc.)
- Level 3 – unobservable inputs (including the Fund's own assumptions based on the best information available)
Valuation techniques used to value the Fund's investments by major category are as follows:
Equity securities, including restricted securities, for which market quotations are readily available, are valued at the last reported sale price or official closing price as reported by a third party pricing vendor on the primary market or exchange on which they are traded and are categorized as Level 1 in the hierarchy. In the event there were no sales during the day or closing prices are not available, securities are valued at the last quoted bid price or may be valued using the last available price and are generally categorized as Level 2 in the hierarchy. For foreign equity securities, when market or security specific events arise, comparisons to the valuation of American Depositary Receipts (ADRs), futures contracts, Exchange-Traded Funds (ETFs) and certain indexes as well as quoted prices for similar securities may be used and would be categorized as Level 2 in the hierarchy. For equity securities, including restricted securities, where observable inputs are limited, assumptions about market activity and risk are used and these securities may be categorized as Level 3 in the hierarchy.
Debt securities, including restricted securities, are valued based on evaluated prices received from third party pricing vendors or from brokers who make markets in such securities. Corporate bonds, foreign government and government agency obligations and U.S. government and government agency obligations are valued by pricing vendors who utilize matrix pricing which considers yield or price of bonds of comparable quality, coupon, maturity and type or by broker-supplied prices. When independent prices are unavailable or unreliable, debt securities may be valued utilizing pricing methodologies which consider similar factors that would be used by third party pricing vendors. Debt securities are generally categorized as Level 2 in the hierarchy but may be Level 3 depending on the circumstances.
Futures contracts are valued at the settlement price established each day by the board of trade or exchange on which they are traded and are categorized as Level 1 in the hierarchy. Investments in open-end mutual funds, including the Fidelity Central Funds, are valued at their closing net asset value (NAV) each business day and are categorized as Level 1 in the hierarchy.
Changes in valuation techniques may result in transfers in or out of an assigned level within the disclosure hierarchy. The aggregate value of investments by input level as of October 31, 2019 is included at the end of the Fund's Schedule of Investments.
Foreign Currency. The Fund may use foreign currency contracts to facilitate transactions in foreign-denominated securities. Gains and losses from these transactions may arise from changes in the value of the foreign currency or if the counterparties do not perform under the contracts' terms.
Foreign-denominated assets, including investment securities, and liabilities are translated into U.S. dollars at the exchange rates at period end. Purchases and sales of investment securities, income and dividends received and expenses denominated in foreign currencies are translated into U.S. dollars at the exchange rate in effect on the transaction date.
The effects of exchange rate fluctuations on investments are included with the net realized and unrealized gain (loss) on investment securities. Other foreign currency transactions resulting in realized and unrealized gain (loss) are disclosed separately.
Investment Transactions and Income. For financial reporting purposes, the Fund's investment holdings and NAV include trades executed through the end of the last business day of the period. The NAV per share for processing shareholder transactions is calculated as of the close of business of the New York Stock Exchange (NYSE), normally 4:00 p.m. Eastern time and includes trades executed through the end of the prior business day. Gains and losses on securities sold are determined on the basis of identified cost and include proceeds received from litigation. Dividend income is recorded on the ex-dividend date, except for certain dividends from foreign securities where the ex-dividend date may have passed, which are recorded as soon as the Fund is informed of the ex-dividend date. Non-cash dividends included in dividend income, if any, are recorded at the fair market value of the securities received. Income and capital gain distributions from Fidelity Central Funds, if any, are recorded on the ex-dividend date. Certain distributions received by the Fund represent a return of capital or capital gain. The Fund determines the components of these distributions subsequent to the ex-dividend date, based upon receipt of tax filings or other correspondence relating to the underlying investment. These distributions are recorded as a reduction of cost of investments and/or as a realized gain. Large, non-recurring dividends recognized by the Fund are presented separately on the Statement of Operations as "Non-cash dividends" and the impact of these dividends is presented in the Financial Highlights. Interest income is accrued as earned and includes coupon interest and amortization of premium and accretion of discount on debt securities as applicable. Investment income is recorded net of foreign taxes withheld where recovery of such taxes is uncertain. Debt obligations may be placed on non-accrual status and related interest income may be reduced by ceasing current accruals and writing off interest receivables when the collection of all or a portion of interest has become doubtful based on consistently applied procedures. A debt obligation is removed from non-accrual status when the issuer resumes interest payments or when collectability of interest is reasonably assured.
Class Allocations and Expenses. Investment income, realized and unrealized capital gains and losses, common expenses of the Fund, and certain fund-level expense reductions, if any, are allocated daily on a pro-rata basis to each class based on the relative net assets of each class to the total net assets of the Fund. Each class differs with respect to transfer agent and distribution and service plan fees incurred. Certain expense reductions may also differ by class. For the reporting period, the allocated portion of income and expenses to each class as a percent of its average net assets may vary due to the timing of recording these transactions in relation to fluctuating net assets of the classes. Expenses directly attributable to a fund are charged to that fund. Expenses attributable to more than one fund are allocated among the respective funds on the basis of relative net assets or other appropriate methods. Expense estimates are accrued in the period to which they relate and adjustments are made when actual amounts are known.
Income Tax Information and Distributions to Shareholders. Each year, the Fund intends to qualify as a regulated investment company under Subchapter M of the Internal Revenue Code, including distributing substantially all of its taxable income and realized gains. As a result, no provision for U.S. Federal income taxes is required. As of October 31, 2019, the Fund did not have any unrecognized tax benefits in the financial statements; nor is the Fund aware of any tax positions for which it is reasonably possible that the total amounts of unrecognized tax benefits will significantly change in the next twelve months. The Fund files a U.S. federal tax return, in addition to state and local tax returns as required. The Fund's federal income tax returns are subject to examination by the Internal Revenue Service (IRS) for a period of three fiscal years after they are filed. State and local tax returns may be subject to examination for an additional fiscal year depending on the jurisdiction. Foreign taxes are provided for based on the Fund's understanding of the tax rules and rates that exist in the foreign markets in which it invests.
Distributions are declared and recorded on the ex-dividend date. Income and capital gain distributions are declared separately for each class. Income and capital gain distributions are determined in accordance with income tax regulations, which may differ from GAAP. In addition, the Fund claimed a portion of the payment made to redeeming shareholders as a distribution for income tax purposes.
Capital accounts within the financial statements are adjusted for permanent book-tax differences. These adjustments have no impact on net assets or the results of operations. Capital accounts are not adjusted for temporary book-tax differences which will reverse in a subsequent period.
Book-tax differences are primarily due to futures contracts, foreign currency transactions, market discount, passive foreign investment companies (PFIC), capital loss carryforwards and losses deferred due to wash sales.
As of period end, the cost and unrealized appreciation (depreciation) in securities, and derivatives if applicable, for federal income tax purposes were as follows:
| Gross unrealized appreciation | $101,287,320 |
| Gross unrealized depreciation | (42,836,958) |
| Net unrealized appreciation (depreciation) | $58,450,362 |
| Tax Cost | $660,832,285 |
The tax-based components of distributable earnings as of period end were as follows:
| Undistributed ordinary income | $16,979,752 |
| Capital loss carryforward | $(46,760,427) |
| Net unrealized appreciation (depreciation) on securities and other investments | $58,433,172 |
Capital loss carryforwards are only available to offset future capital gains of the Fund to the extent provided by regulations and may be limited. Under the Regulated Investment Company Modernization Act of 2010 (the Act), the Fund is permitted to carry forward capital losses incurred in taxable years beginning after December 22, 2010 for an unlimited period and such capital losses are required to be used prior to any losses that expire. The capital loss carryforward information presented below, including any applicable limitation, is estimated as of fiscal period end and is subject to adjustment.
| No expiration | |
| Short-term | $(34,614,684) |
| Long-term | (12,145,743) |
| Total capital loss carryforward | $(46,760,427) |
The tax character of distributions paid was as follows:
| | October 31, 2019 | October 31, 2018 |
| Ordinary Income | $14,178,054 | $ 16,040,300 |
| Long-term Capital Gains | – | 4,233,242 |
| Total | $14,178,054 | $ 20,273,542 |
Restricted Securities. The Fund may invest in securities that are subject to legal or contractual restrictions on resale. These securities generally may be resold in transactions exempt from registration or to the public if the securities are registered. Disposal of these securities may involve time-consuming negotiations and expense, and prompt sale at an acceptable price may be difficult. Information regarding restricted securities is included at the end of the Fund's Schedule of Investments.
4. Derivative Instruments.
Risk Exposures and the Use of Derivative Instruments. The Fund's investment objective allows the Fund to enter into various types of derivative contracts, including futures contracts. Derivatives are investments whose value is primarily derived from underlying assets, indices or reference rates and may be transacted on an exchange or over-the-counter (OTC). Derivatives may involve a future commitment to buy or sell a specified asset based on specified terms, to exchange future cash flows at periodic intervals based on a notional principal amount, or for one party to make one or more payments upon the occurrence of specified events in exchange for periodic payments from the other party.
The Fund used derivatives to increase returns and to manage exposure to certain risks as defined below. The success of any strategy involving derivatives depends on analysis of numerous economic factors, and if the strategies for investment do not work as intended, the Fund may not achieve its objectives.
The Fund's use of derivatives increased or decreased its exposure to the following risk:
| Equity Risk | Equity risk relates to the fluctuations in the value of financial instruments as a result of changes in market prices (other than those arising from interest rate risk or foreign exchange risk), whether caused by factors specific to an individual investment, its issuer, or all factors affecting all instruments traded in a market or market segment.
|
The Fund is also exposed to additional risks from investing in derivatives, such as liquidity risk and counterparty credit risk. Liquidity risk is the risk that the Fund will be unable to close out the derivative in the open market in a timely manner. Counterparty credit risk is the risk that the counterparty will not be able to fulfill its obligation to the Fund. Counterparty credit risk related to exchange-traded futures contracts may be mitigated by the protection provided by the exchange on which they trade.
Investing in derivatives may involve greater risks than investing in the underlying assets directly and, to varying degrees, may involve risk of loss in excess of any initial investment and collateral received and amounts recognized in the Statement of Assets and Liabilities. In addition, there may be the risk that the change in value of the derivative contract does not correspond to the change in value of the underlying instrument.
Futures Contracts. A futures contract is an agreement between two parties to buy or sell a specified underlying instrument for a fixed price at a specified future date. The Fund used futures contracts to manage its exposure to the stock market.
Upon entering into a futures contract, a fund is required to deposit either cash or securities (initial margin) with a clearing broker in an amount equal to a certain percentage of the face value of the contract. Futures contracts are marked-to-market daily and subsequent daily payments (variation margin) are made or received by a fund depending on the daily fluctuations in the value of the futures contracts and are recorded as unrealized appreciation or (depreciation). This receivable and/or payable, if any, is included in daily variation margin on futures contracts in the Statement of Assets and Liabilities. Realized gain or (loss) is recorded upon the expiration or closing of a futures contract. The net realized gain (loss) and change in net unrealized appreciation (depreciation) on futures contracts during the period is presented in the Statement of Operations.
Any open futures contracts at period end are presented in the Schedule of Investments under the caption "Futures Contracts". The notional amount at value reflects each contract's exposure to the underlying instrument or index at period end and is representative of volume of activity during the period. Securities deposited to meet initial margin requirements are identified in the Schedule of Investments.
5. Purchases and Sales of Investments.
Purchases and sales of securities, other than short-term securities and U.S. government securities, aggregated $496,166,894 and $461,432,171, respectively.
6. Fees and Other Transactions with Affiliates.
Management Fee. Fidelity Management & Research Company (the investment adviser) and its affiliates provide the Fund with investment management related services for which the Fund pays a monthly management fee. The management fee is the sum of an individual fund fee rate that is based on an annual rate of .55% of the Fund's average net assets and an annualized group fee rate that averaged .24% during the period. The group fee rate is based upon the average net assets of all the mutual funds advised by the investment adviser, including any mutual funds previously advised by the investment adviser that are currently advised by Fidelity SelectCo, LLC, an affiliate of the investment adviser. The group fee rate decreases as assets under management increase and increases as assets under management decrease. For the reporting period, the total annual management fee rate was .79% of the Fund's average net assets.
Distribution and Service Plan Fees. In accordance with Rule 12b-1 of the 1940 Act, the Fund has adopted separate Distribution and Service Plans for each class of shares. Certain classes pay Fidelity Distributors Corporation (FDC), an affiliate of the investment adviser, separate Distribution and Service Fees, each of which is based on an annual percentage of each class' average net assets. In addition, FDC may pay financial intermediaries for selling shares of the Fund and providing shareholder support services. For the period, the Distribution and Service Fee rates, total fees and amounts retained by FDC were as follows:
| | Distribution Fee | Service Fee | Total Fees | Retained by FDC |
| Class A | -% | .25% | $95,154 | $3,262 |
| Class M | .25% | .25% | 43,692 | 153 |
| Class C | .75% | .25% | 374,105 | 65,099 |
| | | | $512,951 | $68,514 |
Sales Load. FDC may receive a front-end sales charge of up to 5.75% for selling Class A shares and 3.50% for selling Class M shares, some of which is paid to financial intermediaries for selling shares of the Fund. Depending on the holding period, FDC may receive contingent deferred sales charges levied on Class A, Class M and Class C redemptions. The deferred sales charges are 1.00% for Class C shares, 1.00% for certain purchases of Class A shares and .25% for certain purchases of Class M shares.
For the period, sales charge amounts retained by FDC were as follows:
| | Retained by FDC |
| Class A | $15,801 |
| Class M | 1,648 |
| Class C(a) | 3,934 |
| | $21,383 |
(a) When Class C shares are initially sold, FDC pays commissions from its own resources to financial intermediaries through which the sales are made.
Transfer Agent Fees. Fidelity Investments Institutional Operations Company, Inc., (FIIOC), an affiliate of the investment adviser, is the transfer, dividend disbursing and shareholder servicing agent for each class of the Fund. FIIOC receives account fees and asset-based fees that vary according to the account size and type of account of the shareholders of the respective classes of the Fund, except for Class Z. FIIOC receives an asset-based fee of Class Z's average net assets. FIIOC pays for typesetting, printing and mailing of shareholder reports, except proxy statements.
For the period, transfer agent fees for each class were as follows:
| | Amount | % of Class-Level Average Net Assets |
| Class A | $81,188 | .21 |
| Class M | 25,091 | .29 |
| Class C | 77,725 | .21 |
| Total Emerging Markets | 427,991 | .21 |
| Class I | 647,363 | .18 |
| Class Z | 14,112 | .05 |
| | $1,273,470 | |
Accounting and Security Lending Fees. Fidelity Service Company, Inc. (FSC), an affiliate of the investment adviser, maintains the Fund's accounting records. The accounting fee is based on the level of average net assets for each month. Prior to April 1, 2019, FSC had a separate agreement with the Fund for administration of the security lending program, based on the number and duration of lending transactions. For the period, the total fees paid for accounting and administration of securities lending were equivalent to an annual rate of .05%.
Brokerage Commissions. The Fund placed a portion of its portfolio transactions with brokerage firms which are affiliates of the investment adviser. Brokerage commissions are included in net realized gain (loss) and change in net unrealized appreciation (depreciation) in the Statement of Operations. The commissions paid to these affiliated firms were $3,127 for the period.
Interfund Trades. The Fund may purchase from or sell securities to other Fidelity Funds under procedures adopted by the Board. The procedures have been designed to ensure these interfund trades are executed in accordance with Rule 17a-7 of the 1940 Act. Interfund trades are included within the respective purchases and sales amounts shown in the Purchases and Sales of Investments note.
Other. During the period, the investment adviser reimbursed the Fund for certain losses in the amount of $3,952.
7. Committed Line of Credit.
The Fund participates with other funds managed by the investment adviser or an affiliate in a $4.25 billion credit facility (the "line of credit") to be utilized for temporary or emergency purposes to fund shareholder redemptions or for other short-term liquidity purposes. The Fund has agreed to pay commitment fees on its pro-rata portion of the line of credit, which amounted to $1,794 and is reflected in Miscellaneous expenses on the Statement of Operations. During the period, the Fund did not borrow on this line of credit.
8. Security Lending.
The Fund lends portfolio securities from time to time in order to earn additional income. For equity securities, lending agents are used, including National Financial Services (NFS), an affiliate of the Fund. Pursuant to a securities lending agreement, NFS will receive a fee, which is capped at 9.9% of daily lending revenue, for its services as lending agent. The Fund may lend securities to certain qualified borrowers, including NFS. On the settlement date of the loan, the Fund receives collateral (in the form of U.S. Treasury obligations, letters of credit and/or cash) against the loaned securities and maintains collateral in an amount not less than 100% of the market value of the loaned securities during the period of the loan. The market value of the loaned securities is determined at the close of business of the Fund and any additional required collateral is delivered to the Fund on the next business day. The Fund or borrower may terminate the loan at any time, and if the borrower defaults on its obligation to return the securities loaned because of insolvency or other reasons, the Fund may apply collateral received from the borrower against the obligation. The Fund may experience delays and costs in recovering the securities loaned. Any cash collateral received is invested in the Fidelity Securities Lending Cash Central Fund. The value of loaned securities and cash collateral at period end are disclosed on the Fund's Statement of Assets and Liabilities. Total fees paid by the Fund to NFS, as lending agent, amounted to $2,409. Security lending income represents the income earned on investing cash collateral, less rebates paid to borrowers and any lending agent fees associated with the loan, plus any premium payments received for lending certain types of securities. Security lending income is presented in the Statement of Operations as a component of income from Fidelity Central Funds. During the period, there were no securities loaned to NFS.
9. Expense Reductions.
Commissions paid to certain brokers with whom the investment adviser, or its affiliates, places trades on behalf of the Fund include an amount in addition to trade execution, which may be rebated back to the Fund to offset certain expenses. This amount totaled $22,232 for the period.
In addition, during the period the investment adviser reimbursed and/or waived a portion of fund-level operating expenses in the amount of $4,441 and a portion of class-level operating expenses as follows:
| | Amount |
| Class A | $870 |
| Class M | 203 |
| Class C | 919 |
| Total Emerging Markets | 4,770 |
| Class I | 8,600 |
| Class Z | 638 |
| | $16,000 |
10. Distributions to Shareholders.
Distributions to shareholders of each class were as follows:
| | Year ended
October 31, 2019 | Year ended
October 31, 2018 |
| Distributions to shareholders | | |
| Class A | $714,243 | $1,173,252 |
| Class M | 150,122 | 134,477 |
| Class C | 488,821 | 782,198 |
| Total Emerging Markets | 4,522,488 | 7,266,702 |
| Class I | 8,203,674 | 10,916,913 |
| Class Z | 98,706 | – |
| Total | $14,178,054 | $20,273,542 |
11. Share Transactions.
Share transactions for each class were as follows and may contain automatic conversions between classes or exchanges between affiliated funds:
| | Shares | Shares | Dollars | Dollars |
| | Year ended October 31, 2019 | Year ended October 31, 2018(a) | Year ended October 31, 2019 | Year ended October 31, 2018(a) |
| Class A | | | | |
| Shares sold | 870,630 | 1,859,563 | $10,684,591 | $25,085,167 |
| Reinvestment of distributions | 62,554 | 88,408 | 711,236 | 1,166,980 |
| Shares redeemed | (814,970) | (2,058,546) | (9,912,774) | (26,793,915) |
| Net increase (decrease) | 118,214 | (110,575) | $1,483,053 | $(541,768) |
| Class M | | | | |
| Shares sold | 115,630 | 275,701 | $1,417,602 | $3,701,993 |
| Reinvestment of distributions | 13,182 | 15,634 | 150,011 | 206,523 |
| Shares redeemed | (177,172) | (196,678) | (2,146,741) | (2,571,520) |
| Net increase (decrease) | (48,360) | 94,657 | $(579,128) | $1,336,996 |
| Class C | | | | |
| Shares sold | 408,329 | 1,470,832 | $4,955,307 | $19,647,127 |
| Reinvestment of distributions | 43,111 | 59,490 | 488,019 | 781,699 |
| Shares redeemed | (907,103) | (861,075) | (11,027,167) | (10,881,951) |
| Net increase (decrease) | (455,663) | 669,247 | $(5,583,841) | $9,546,875 |
| Total Emerging Markets | | | | |
| Shares sold | 5,906,657 | 8,907,832 | $73,141,302 | $120,823,803 |
| Reinvestment of distributions | 380,480 | 522,036 | 4,329,863 | 6,896,099 |
| Shares redeemed | (7,159,495) | (13,024,202) | (87,489,558) | (167,212,962) |
| Net increase (decrease) | (872,358) | (3,594,334) | $(10,018,393) | $(39,493,060) |
| Class I | | | | |
| Shares sold | 14,032,906 | 17,527,189 | $171,476,090 | $232,099,188 |
| Reinvestment of distributions | 691,717 | 792,863 | 7,857,900 | 10,457,863 |
| Shares redeemed | (15,271,905) | (16,103,644) | (184,876,207) | (201,759,709) |
| Net increase (decrease) | (547,282) | 2,216,408 | $(5,542,217) | $40,797,342 |
| Class Z | | | | |
| Shares sold | 5,339,852 | 139,605 | $65,470,267 | $1,609,269 |
| Reinvestment of distributions | 7,811 | – | 88,498 | – |
| Shares redeemed | (706,986) | (758) | (8,710,301) | (8,750) |
| Net increase (decrease) | 4,640,677 | 138,847 | $56,848,464 | $1,600,519 |
(a) Share transactions for Class Z are for the period October 2, 2018 (commencement of sale of shares) to October 31, 2019
12. Other.
The Fund's organizational documents provide former and current trustees and officers with a limited indemnification against liabilities arising in connection with the performance of their duties to the Fund. In the normal course of business, the Fund may also enter into contracts that provide general indemnifications. The Fund's maximum exposure under these arrangements is unknown as this would be dependent on future claims that may be made against the Fund. The risk of material loss from such claims is considered remote.
Report of Independent Registered Public Accounting Firm
To the Board of Trustees of Fidelity Investment Trust and the Shareholders of Fidelity Emerging Markets Discovery Fund and Fidelity Total Emerging Markets Fund:
Opinions on the Financial Statements
We have audited the accompanying statements of assets and liabilities, including the schedules of investments, of Fidelity Emerging Markets Discovery Fund and Fidelity Total Emerging Markets Fund (two of the funds constituting Fidelity Investment Trust, hereafter collectively referred to as the “Funds”) as of October 31, 2019, the related statements of operations for the year ended October 31, 2019, the statements of changes in net assets for each of the two years in the period ended October 31, 2019, including the related notes, and the financial highlights for each of the periods indicated therein (collectively referred to as the “financial statements”). In our opinion, the financial statements present fairly, in all material respects, the financial position of each of the Funds as of October 31, 2019, the results of each of their operations for the year then ended, the changes in each of their net assets for each of the two years in the period ended October 31, 2019 and each of the financial highlights for each of the periods indicated therein in conformity with accounting principles generally accepted in the United States of America.
Basis for Opinions
These financial statements are the responsibility of the Funds' management. Our responsibility is to express an opinion on the Funds' financial statements based on our audits. We are a public accounting firm registered with the Public Company Accounting Oversight Board (United States) (PCAOB) and are required to be independent with respect to the Funds in accordance with the U.S. federal securities laws and the applicable rules and regulations of the Securities and Exchange Commission and the PCAOB.
We conducted our audits of these financial statements in accordance with the standards of the PCAOB. Those standards require that we plan and perform the audit to obtain reasonable assurance about whether the financial statements are free of material misstatement, whether due to error or fraud.
Our audits included performing procedures to assess the risks of material misstatement of the financial statements, whether due to error or fraud, and performing procedures that respond to those risks. Such procedures included examining, on a test basis, evidence regarding the amounts and disclosures in the financial statements. Our audits also included evaluating the accounting principles used and significant estimates made by management, as well as evaluating the overall presentation of the financial statements. Our procedures included confirmation of securities owned as of October 31, 2019 by correspondence with the custodian, issuers of privately offered securities and brokers; when replies were not received from brokers, we performed other auditing procedures. We believe that our audits provide a reasonable basis for our opinions.
PricewaterhouseCoopers LLP
Boston, Massachusetts
December 13, 2019
We have served as the auditor of one or more investment companies in the Fidelity group of funds since 1932.
Trustees and Officers
The Trustees, Members of the Advisory Board (if any), and officers of the trust and funds, as applicable, are listed below. The Board of Trustees governs each fund and is responsible for protecting the interests of shareholders. The Trustees are experienced executives who meet periodically throughout the year to oversee each fund's activities, review contractual arrangements with companies that provide services to each fund, oversee management of the risks associated with such activities and contractual arrangements, and review each fund's performance. Except for Jonathan Chiel, each of the Trustees oversees 298 funds. Mr. Chiel oversees 171 funds.
The Trustees hold office without limit in time except that (a) any Trustee may resign; (b) any Trustee may be removed by written instrument, signed by at least two-thirds of the number of Trustees prior to such removal; (c) any Trustee who requests to be retired or who has become incapacitated by illness or injury may be retired by written instrument signed by a majority of the other Trustees; and (d) any Trustee may be removed at any special meeting of shareholders by a two-thirds vote of the outstanding voting securities of the trust. Each Trustee who is not an interested person (as defined in the 1940 Act) of the trust and the funds is referred to herein as an Independent Trustee. Each Independent Trustee shall retire not later than the last day of the calendar year in which his or her 75th birthday occurs. The Independent Trustees may waive this mandatory retirement age policy with respect to individual Trustees. Officers and Advisory Board Members hold office without limit in time, except that any officer or Advisory Board Member may resign or may be removed by a vote of a majority of the Trustees at any regular meeting or any special meeting of the Trustees. Except as indicated, each individual has held the office shown or other offices in the same company for the past five years.
Each fund's Statement of Additional Information (SAI) includes more information about the Trustees. To request a free copy, call Fidelity at 1-800-544-8544 if you’re an individual investing directly with Fidelity, call 1-800-835-5092 if you’re a plan sponsor or participant with Fidelity as your recordkeeper or call 1-877-208-0098 on institutional accounts or if you’re an advisor or invest through one.
Experience, Skills, Attributes, and Qualifications of the Trustees. The Governance and Nominating Committee has adopted a statement of policy that describes the experience, qualifications, attributes, and skills that are necessary and desirable for potential Independent Trustee candidates (Statement of Policy). The Board believes that each Trustee satisfied at the time he or she was initially elected or appointed a Trustee, and continues to satisfy, the standards contemplated by the Statement of Policy. The Governance and Nominating Committee also engages professional search firms to help identify potential Independent Trustee candidates who have the experience, qualifications, attributes, and skills consistent with the Statement of Policy. From time to time, additional criteria based on the composition and skills of the current Independent Trustees, as well as experience or skills that may be appropriate in light of future changes to board composition, business conditions, and regulatory or other developments, have also been considered by the professional search firms and the Governance and Nominating Committee. In addition, the Board takes into account the Trustees' commitment and participation in Board and committee meetings, as well as their leadership of standing and ad hoc committees throughout their tenure.
In determining that a particular Trustee was and continues to be qualified to serve as a Trustee, the Board has considered a variety of criteria, none of which, in isolation, was controlling. The Board believes that, collectively, the Trustees have balanced and diverse experience, qualifications, attributes, and skills, which allow the Board to operate effectively in governing each fund and protecting the interests of shareholders. Information about the specific experience, skills, attributes, and qualifications of each Trustee, which in each case led to the Board's conclusion that the Trustee should serve (or continue to serve) as a trustee of the funds, is provided below.
Board Structure and Oversight Function. James C. Curvey is an interested person and currently serves as Chairman. The Trustees have determined that an interested Chairman is appropriate and benefits shareholders because an interested Chairman has a personal and professional stake in the quality and continuity of services provided to the funds. Independent Trustees exercise their informed business judgment to appoint an individual of their choosing to serve as Chairman, regardless of whether the Trustee happens to be independent or a member of management. The Independent Trustees have determined that they can act independently and effectively without having an Independent Trustee serve as Chairman and that a key structural component for assuring that they are in a position to do so is for the Independent Trustees to constitute a substantial majority for the Board. The Independent Trustees also regularly meet in executive session. Ned C. Lautenbach serves as Chairman of the Independent Trustees and as such (i) acts as a liaison between the Independent Trustees and management with respect to matters important to the Independent Trustees and (ii) with management prepares agendas for Board meetings.
Fidelity® funds are overseen by different Boards of Trustees. The funds' Board oversees Fidelity's high income and certain equity funds, and other Boards oversee Fidelity's investment-grade bond, money market, asset allocation, and other equity funds. The asset allocation funds may invest in Fidelity® funds overseen by the funds' Board. The use of separate Boards, each with its own committee structure, allows the Trustees of each group of Fidelity® funds to focus on the unique issues of the funds they oversee, including common research, investment, and operational issues. On occasion, the separate Boards establish joint committees to address issues of overlapping consequences for the Fidelity® funds overseen by each Board.
The Trustees operate using a system of committees to facilitate the timely and efficient consideration of all matters of importance to the Trustees, each fund, and fund shareholders and to facilitate compliance with legal and regulatory requirements and oversight of the funds' activities and associated risks. The Board, acting through its committees, has charged FMR and its affiliates with (i) identifying events or circumstances the occurrence of which could have demonstrably adverse effects on the funds' business and/or reputation; (ii) implementing processes and controls to lessen the possibility that such events or circumstances occur or to mitigate the effects of such events or circumstances if they do occur; and (iii) creating and maintaining a system designed to evaluate continuously business and market conditions in order to facilitate the identification and implementation processes described in (i) and (ii) above. Because the day-to-day operations and activities of the funds are carried out by or through FMR, its affiliates, and other service providers, the funds' exposure to risks is mitigated but not eliminated by the processes overseen by the Trustees. While each of the Board's committees has responsibility for overseeing different aspects of the funds' activities, oversight is exercised primarily through the Operations, Audit, and Compliance Committees. Appropriate personnel, including but not limited to the funds' Chief Compliance Officer (CCO), FMR's internal auditor, the independent accountants, the funds' Treasurer and portfolio management personnel, make periodic reports to the Board's committees, as appropriate, including an annual review of Fidelity's risk management program for the Fidelity® funds. The responsibilities of each standing committee, including their oversight responsibilities, are described further under "Standing Committees of the Trustees."
Interested Trustees*:
Correspondence intended for a Trustee who is an interested person may be sent to Fidelity Investments, 245 Summer Street, Boston, Massachusetts 02210.
Name, Year of Birth; Principal Occupations and Other Relevant Experience+
Jonathan Chiel (1957)
Year of Election or Appointment: 2016
Trustee
Mr. Chiel also serves as Trustee of other Fidelity® funds. Mr. Chiel is Executive Vice President and General Counsel for FMR LLC (diversified financial services company, 2012-present). Previously, Mr. Chiel served as general counsel (2004-2012) and senior vice president and deputy general counsel (2000-2004) for John Hancock Financial Services; a partner with Choate, Hall & Stewart (1996-2000) (law firm); and an Assistant United States Attorney for the United States Attorney’s Office of the District of Massachusetts (1986-95), including Chief of the Criminal Division (1993-1995). Mr. Chiel is a director on the boards of the Boston Bar Foundation and the Maimonides School.
James C. Curvey (1935)
Year of Election or Appointment: 2007
Trustee
Chairman of the Board of Trustees
Mr. Curvey also serves as Trustee of other Fidelity® funds. Mr. Curvey is Vice Chairman (2007-present) and Director of FMR LLC (diversified financial services company). In addition, Mr. Curvey is an Overseer Emeritus for the Boston Symphony Orchestra, a Director of Artis-Naples, and a Trustee of Brewster Academy in Wolfeboro, New Hampshire. Previously, Mr. Curvey served as a Director of Fidelity Research & Analysis Co. (investment adviser firm, 2009-2018), Director of Fidelity Investments Money Management, Inc. (investment adviser firm, 2009-2014) and a Director of FMR and FMR Co., Inc. (investment adviser firms, 2007-2014).
* Determined to be an “Interested Trustee” by virtue of, among other things, his or her affiliation with the trust or various entities under common control with FMR.
+ The information includes the Trustee's principal occupation during the last five years and other information relating to the experience, attributes, and skills relevant to the Trustee's qualifications to serve as a Trustee, which led to the conclusion that the Trustee should serve as a Trustee for each fund.
Independent Trustees:
Correspondence intended for an Independent Trustee may be sent to Fidelity Investments, P.O. Box 55235, Boston, Massachusetts 02205-5235.
Name, Year of Birth; Principal Occupations and Other Relevant Experience+
Dennis J. Dirks (1948)
Year of Election or Appointment: 2005
Trustee
Mr. Dirks also serves as Trustee of other Fidelity® funds. Prior to his retirement in May 2003, Mr. Dirks was Chief Operating Officer and a member of the Board of The Depository Trust & Clearing Corporation (DTCC). He also served as President, Chief Operating Officer, and Board member of The Depository Trust Company (DTC) and President and Board member of the National Securities Clearing Corporation (NSCC). In addition, Mr. Dirks served as Chief Executive Officer and Board member of the Government Securities Clearing Corporation, Chief Executive Officer and Board member of the Mortgage-Backed Securities Clearing Corporation, as a Trustee and a member of the Finance Committee of Manhattan College (2005-2008), as a Trustee and a member of the Finance Committee of AHRC of Nassau County (2006-2008), as a member of the Independent Directors Council (IDC) Governing Council (2010-2015), and as a member of the Board of Directors for The Brookville Center for Children’s Services, Inc. (2009-2017). Mr. Dirks is a member of the Finance Committee (2016-present) and Board of Directors (2017-present) and is Treasurer (2018-present) of the Asolo Repertory Theatre.
Donald F. Donahue (1950)
Year of Election or Appointment: 2018
Trustee
Mr. Donahue also serves as a Trustee of other Fidelity® funds. Mr. Donahue is President and Chief Executive Officer of Miranda Partners, LLC (risk consulting for the financial services industry, 2012-present). Previously, Mr. Donahue served as a Member of the Advisory Board of certain Fidelity® funds (2015-2018) and Chief Executive Officer (2006-2012), Chief Operating Officer (2003-2006), and Managing Director, Customer Marketing and Development (1999-2003) of The Depository Trust & Clearing Corporation (financial markets infrastructure). Mr. Donahue serves as a Member (2007-present) and Co-Chairman (2016-present) of the Board of Directors of United Way of New York, Member of the Board of Directors of NYC Leadership Academy (2012-present) and Member of the Board of Advisors of Ripple Labs, Inc. (financial services, 2015-present). He also served as Chairman (2010-2012) and Member of the Board of Directors (2012-2013) of Omgeo, LLC (financial services), Treasurer of United Way of New York (2012-2016), and Member of the Board of Directors of XBRL US (financial services non-profit, 2009-2012) and the International Securities Services Association (2009-2012).
Alan J. Lacy (1953)
Year of Election or Appointment: 2008
Trustee
Mr. Lacy also serves as Trustee of other Fidelity® funds. Mr. Lacy serves as a Director of Bristol-Myers Squibb Company (global pharmaceuticals, 2008-present). He is a Trustee of the California Chapter of The Nature Conservancy (2015-present) and a Director of the Center for Advanced Study in the Behavioral Sciences at Stanford University (2015-present). In addition, Mr. Lacy served as Senior Adviser (2007-2014) of Oak Hill Capital Partners, L.P. (private equity) and also served as Chief Executive Officer (2005) and Vice Chairman (2005-2006) of Sears Holdings Corporation (retail) and Chief Executive Officer and Chairman of the Board of Sears, Roebuck and Co. (retail, 2000-2005). Previously, Mr. Lacy served as Chairman (2014-2017) and a member (2010-2017) of the Board of Directors of Dave & Buster’s Entertainment, Inc. (restaurant and entertainment complexes), as Chairman (2008-2011) and a member (2006-2015) of the Board of Trustees of the National Parks Conservation Association, and as a member of the Board of Directors for The Hillman Companies, Inc. (hardware wholesalers, 2010-2014), Earth Fare, Inc. (retail grocery, 2010-2014), and The Western Union Company (global money transfer, 2006-2011).
Ned C. Lautenbach (1944)
Year of Election or Appointment: 2000
Trustee
Chairman of the Independent Trustees
Mr. Lautenbach also serves as Trustee of other Fidelity® funds. Mr. Lautenbach currently serves as Chair (2018-present) and Member (2013-present) of the Board of Governors, State University System of Florida and is a member of the Council on Foreign Relations (1994-present). He is also a member and has most recently served as Chairman of the Board of Directors of Artis-Naples (2012-present). Previously, Mr. Lautenbach served as a member and then Lead Director of the Board of Directors of Eaton Corporation (diversified industrial, 1997-2016). He was also a Partner and Advisory Partner at Clayton, Dubilier & Rice, LLC (private equity investment, 1998-2010), as well as a Director of Sony Corporation (2006-2007). In addition, Mr. Lautenbach also had a 30-year career with IBM (technology company) during which time he served as Senior Vice President and a member of the Corporate Executive Committee (1968-1998).
Joseph Mauriello (1944)
Year of Election or Appointment: 2008
Trustee
Mr. Mauriello also serves as Trustee of other Fidelity® funds. Prior to his retirement in January 2006, Mr. Mauriello served in numerous senior management positions including Deputy Chairman and Chief Operating Officer (2004-2005), and Vice Chairman of Financial Services (2002-2004) of KPMG LLP US (professional services, 1965-2005). Mr. Mauriello currently serves as a member of the Independent Directors Council (IDC) Governing Council (2015-present). Previously, Mr. Mauriello served as a member of the Board of Directors of XL Group plc. (global insurance and re-insurance, 2006-2018).
Cornelia M. Small (1944)
Year of Election or Appointment: 2005
Trustee
Ms. Small also serves as Trustee of other Fidelity® funds. Ms. Small is a member of the Board of Directors (2009-present) and Chair of the Investment Committee (2010-present) of the Teagle Foundation. Ms. Small also serves on the Investment Committee of the Berkshire Taconic Community Foundation (2008-present). Previously, Ms. Small served as Chairperson (2002-2008) and a member of the Investment Committee and Chairperson (2008-2012) and a member of the Board of Trustees of Smith College. In addition, Ms. Small served as Chief Investment Officer, Director of Global Equity Investments, and a member of the Board of Directors of Scudder, Stevens & Clark and Scudder Kemper Investments.
Garnett A. Smith (1947)
Year of Election or Appointment: 2018
Trustee
Mr. Smith also serves as Trustee of other Fidelity® funds. Prior to Mr. Smith's retirement, he served as Chairman and Chief Executive Officer of Inbrand Corp. (manufacturer of personal absorbent products, 1990-1997). He also served as President (1986-1990) of Inbrand Corp. Prior to his employment with Inbrand Corp., he was employed by a retail fabric chain and North Carolina National Bank. In addition, Mr. Smith served as a Member of the Advisory Board of certain Fidelity® funds (2012-2013) and as a board member of the Jackson Hole Land Trust (2009-2012).
David M. Thomas (1949)
Year of Election or Appointment: 2008
Trustee
Mr. Thomas also serves as Trustee of other Fidelity® funds. Mr. Thomas serves as Non-Executive Chairman of the Board of Directors of Fortune Brands Home and Security (home and security products, 2011-present) and as a member of the Board of Directors (2004-present) and Presiding Director (2013-present) of Interpublic Group of Companies, Inc. (marketing communication). Previously, Mr. Thomas served as Executive Chairman (2005-2006) and Chairman and Chief Executive Officer (2000-2005) of IMS Health, Inc. (pharmaceutical and healthcare information solutions), a Director of Fortune Brands, Inc. (consumer products, 2000-2011), and a member of the Board of Trustees of the University of Florida (2013-2018).
+ The information includes the Trustee's principal occupation during the last five years and other information relating to the experience, attributes, and skills relevant to the Trustee's qualifications to serve as a Trustee, which led to the conclusion that the Trustee should serve as a Trustee for each fund.
Advisory Board Members and Officers:
Correspondence intended for a Member of the Advisory Board (if any) may be sent to Fidelity Investments, P.O. Box 55235, Boston, Massachusetts 02205-5235. Correspondence intended for an officer or Peter S. Lynch may be sent to Fidelity Investments, 245 Summer Street, Boston, Massachusetts 02210. Officers appear below in alphabetical order.
Name, Year of Birth; Principal Occupation
Vicki L. Fuller (1957)
Year of Election or Appointment: 2018
Member of the Advisory Board
Ms. Fuller also serves as Member of the Advisory Board of other Fidelity® funds. Ms. Fuller serves as a member of the Board of Directors, Audit Committee, and Nominating and Governance Committee of The Williams Companies, Inc. (natural gas infrastructure, 2018-present). Previously, Ms. Fuller served as the Chief Investment Officer of the New York State Common Retirement Fund (2012-2018) and held a variety of positions at AllianceBernstein L.P. (global asset management, 1985-2012), including Managing Director (2006-2012) and Senior Vice President and Senior Portfolio Manager (2001-2006).
Peter S. Lynch (1944)
Year of Election or Appointment: 2003
Member of the Advisory Board
Mr. Lynch also serves as Member of the Advisory Board of other Fidelity® funds. Mr. Lynch is Vice Chairman and a Director of FMR (investment adviser firm) and FMR Co., Inc. (investment adviser firm). In addition, Mr. Lynch serves as a Trustee of Boston College and as the Chairman of the Inner-City Scholarship Fund. Previously, Mr. Lynch served on the Special Olympics International Board of Directors (1997-2006).
Michael E. Wiley (1950)
Year of Election or Appointment: 2018
Member of the Advisory Board
Mr. Wiley also serves as Trustee or Member of the Advisory Board of other Fidelity® funds. Mr. Wiley serves as a Director of High Point Resources (exploration and production, 2005-present). Previously, Mr. Wiley served as a Director of Andeavor Corporation (independent oil refiner and marketer, 2005-2018), a Director of Andeavor Logistics LP (natural resources logistics, 2015-2018), a Director of Post Oak Bank (privately-held bank, 2004-2018), a Director of Asia Pacific Exploration Consolidated (international oil and gas exploration and production, 2008-2013), a member of the Board of Trustees of the University of Tulsa (2000-2006; 2007-2010), a Senior Energy Advisor of Katzenbach Partners, LLC (consulting, 2006-2007), an Advisory Director of Riverstone Holdings (private investment), a Director of Spinnaker Exploration Company (exploration and production, 2001-2005) and Chairman, President, and CEO of Baker Hughes, Inc. (oilfield services, 2000-2004).
Elizabeth Paige Baumann (1968)
Year of Election or Appointment: 2017
Anti-Money Laundering (AML) Officer
Ms. Baumann also serves as AML Officer of other funds. She is Chief AML Officer (2012-present) and Senior Vice President (2014-present) of FMR LLC (diversified financial services company) and is an employee of Fidelity Investments. Previously, Ms. Baumann served as AML Officer of the funds (2012-2016), and Vice President (2007-2014) and Deputy Anti-Money Laundering Officer (2007-2012) of FMR LLC.
Craig S. Brown (1977)
Year of Election or Appointment: 2019
Assistant Treasurer
Mr. Brown also serves as Assistant Treasurer of other funds. Mr. Brown is an employee of Fidelity Investments (2013-present).
John J. Burke III (1964)
Year of Election or Appointment: 2018
Chief Financial Officer
Mr. Burke also serves as Chief Financial Officer of other funds. Mr. Burke serves as Head of Investment Operations for Fidelity Fund and Investment Operations (2018-present) and is an employee of Fidelity Investments (1998-present). Previously Mr. Burke served as head of Asset Management Investment Operations (2012-2018).
William C. Coffey (1969)
Year of Election or Appointment: 2019
Assistant Secretary
Mr. Coffey also serves as Assistant Secretary of other funds. He is Senior Vice President and Deputy General Counsel of FMR LLC (diversified financial services company, 2010-present), and is an employee of Fidelity Investments. Previously, Mr. Coffey served as Secretary and CLO of certain funds (2018-2019); CLO, Secretary, and Senior Vice President of Fidelity Management & Research Company and FMR Co., Inc. (investment adviser firms, 2018-2019); Secretary of Fidelity SelectCo, LLC and Fidelity Investments Money Management, Inc. (investment adviser firms, 2018-2019); CLO of Fidelity Management & Research (Hong Kong) Limited, FMR Investment Management (UK) Limited, and Fidelity Management & Research (Japan) Limited (investment adviser firms, 2018-2019); and Assistant Secretary of certain funds (2009-2018).
Timothy M. Cohen (1969)
Year of Election or Appointment: 2018
Vice President
Mr. Cohen also serves as Vice President of other funds. Mr. Cohen serves as Executive Vice President of Fidelity SelectCo, LLC (2019-present), Co-Head of Equity (2018-present), a Director of Fidelity Management & Research (Japan) Limited (investment adviser firm, 2016-present), and is an employee of Fidelity Investments. Previously, Mr. Cohen served as Head of Global Equity Research (2016-2018), Chief Investment Officer - Equity and a Director of Fidelity Management & Research (U.K.) Inc. (investment adviser firm, 2013-2015) and as a Director of Fidelity Management & Research (Hong Kong) Limited (investment adviser firm, 2017).
Jonathan Davis (1968)
Year of Election or Appointment: 2010
Assistant Treasurer
Mr. Davis also serves as Assistant Treasurer of other funds. Mr. Davis serves as Assistant Treasurer of FMR Capital, Inc. (2017-present) and is an employee of Fidelity Investments. Previously, Mr. Davis served as Vice President and Associate General Counsel of FMR LLC (diversified financial services company, 2003-2010).
Adrien E. Deberghes (1967)
Year of Election or Appointment: 2016
Assistant Treasurer
Mr. Deberghes also serves as an officer of other funds. He serves as Assistant Treasurer of FMR Capital, Inc. (2017-present), Executive Vice President of Fidelity Investments Money Management, Inc. (FIMM) (investment adviser firm, 2016-present), and is an employee of Fidelity Investments (2008-present). Previously, Mr. Deberghes served as President and Treasurer of certain Fidelity® funds (2013-2018). Prior to joining Fidelity Investments, Mr. Deberghes was Senior Vice President of Mutual Fund Administration at State Street Corporation (2007-2008), Senior Director of Mutual Fund Administration at Investors Bank & Trust (2005-2007), and Director of Finance for Dunkin' Brands (2000-2005). Previously, Mr. Deberghes served in other fund officer roles.
Laura M. Del Prato (1964)
Year of Election or Appointment: 2018
Assistant Treasurer
Ms. Del Prato also serves as an officer of other funds. Ms. Del Prato is an employee of Fidelity Investments (2017-present). Prior to joining Fidelity Investments, Ms. Del Prato served as a Managing Director and Treasurer of the JPMorgan Mutual Funds (2014-2017). Prior to JPMorgan, Ms. Del Prato served as a partner at Cohen Fund Audit Services (accounting firm, 2012-2013) and KPMG LLP (accounting firm, 2004-2012).
Colm A. Hogan (1973)
Year of Election or Appointment: 2016
Deputy Treasurer
Mr. Hogan also serves as an officer of other funds. Mr. Hogan serves as Assistant Treasurer of FMR Capital, Inc. (2017-present) and is an employee of Fidelity Investments (2005-present). Previously, Mr. Hogan served as Assistant Treasurer of certain Fidelity® funds (2016-2018).
Pamela R. Holding (1964)
Year of Election or Appointment: 2018
Vice President
Ms. Holding also serves as Vice President of other funds. Ms. Holding serves as Executive Vice President of Fidelity SelectCo, LLC (2019-present), Co-Head of Equity (2018-present) and is an employee of Fidelity Investments (2013-present). Previously, Ms. Holding served as Chief Investment Officer of Fidelity Institutional Asset Management (2013-2018).
Cynthia Lo Bessette (1969)
Year of Election or Appointment: 2019
Secretary and Chief Legal Officer (CLO)
Ms. Lo Bessette also serves as Secretary and CLO of other funds. Ms. Lo Bessette serves as CLO, Secretary, and Senior Vice President of Fidelity Management & Research Company and FMR Co., Inc. (investment adviser firms, 2019-present); Secretary of Fidelity SelectCo, LLC and Fidelity Investments Money Management, Inc. (investment adviser firms, 2019-present); and CLO of Fidelity Management & Research (Hong Kong) Limited, FMR Investment Management (UK) Limited, and Fidelity Management & Research (Japan) Limited (investment adviser firms, 2019-present). She is a Senior Vice President and Deputy General Counsel of FMR LLC (diversified financial services company, 2019-present), and is an employee of Fidelity Investments. Previously, Ms. Lo Bessette served as Executive Vice President, General Counsel (2016-2019) and Senior Vice President, Deputy General Counsel (2015-2016) of OppenheimerFunds (investment management company) and Deputy Chief Legal Officer (2013-2015) of Jennison Associates LLC (investment adviser firm).
Chris Maher (1972)
Year of Election or Appointment: 2013
Assistant Treasurer
Mr. Maher serves as Assistant Treasurer of other funds. Mr. Maher is Vice President of Valuation Oversight, serves as Assistant Treasurer of FMR Capital, Inc. (2017-present), and is an employee of Fidelity Investments. Previously, Mr. Maher served as Vice President of Asset Management Compliance (2013), Vice President of the Program Management Group of FMR (investment adviser firm, 2010-2013), and Vice President of Valuation Oversight (2008-2010).
Kenneth B. Robins (1969)
Year of Election or Appointment: 2016
Chief Compliance Officer
Mr. Robins also serves as an officer of other funds. Mr. Robins serves as Compliance Officer of Fidelity Management & Research Company and FMR Co., Inc. (investment adviser firms, 2016-present) and is an employee of Fidelity Investments (2004-present). Previously, Mr. Robins served as Executive Vice President of Fidelity Investments Money Management, Inc. (investment adviser firm, 2013-2016) and served in other fund officer roles.
Stacie M. Smith (1974)
Year of Election or Appointment: 2016
President and Treasurer
Ms. Smith also serves as an officer of other funds. Ms. Smith serves as Assistant Treasurer of FMR Capital, Inc. (2017-present), is an employee of Fidelity Investments (2009-present), and has served in other fund officer roles. Prior to joining Fidelity Investments, Ms. Smith served as Senior Audit Manager of Ernst & Young LLP (accounting firm, 1996-2009). Previously, Ms. Smith served as Assistant Treasurer (2013-2018) and Deputy Treasurer (2013-2016) of certain Fidelity® funds.
Marc L. Spector (1972)
Year of Election or Appointment: 2016
Assistant Treasurer
Mr. Spector also serves as an officer of other funds. Mr. Spector serves as Assistant Treasurer of FMR Capital, Inc. (2017-present) and is an employee of Fidelity Investments (2016-present). Prior to joining Fidelity Investments, Mr. Spector served as Director at the Siegfried Group (accounting firm, 2013-2016), and prior to Siegfried Group as audit senior manager at Deloitte & Touche (accounting firm, 2005-2013).
Jim Wegmann (1979)
Year of Election or Appointment: 2019
Assistant Treasurer
Mr. Wegmann also serves as Assistant Treasurer of other funds. Mr. Wegmann is an employee of Fidelity Investments (2011-present).
Shareholder Expense Example
As a shareholder of a Fund, you incur two types of costs: (1) transaction costs, including sales charges (loads) on purchase payments or redemption proceeds, and (2) ongoing costs, including management fees, distribution and/or service (12b-1) fees and other Fund expenses. This Example is intended to help you understand your ongoing costs (in dollars) of investing in the Funds and to compare these costs with the ongoing costs of investing in other mutual funds.
The Example is based on an investment of $1,000 invested at the beginning of the period and held for the entire period (May 1, 2019 to October 31, 2019).
Actual Expenses
The first line of the accompanying table for each Class of each fund provides information about actual account values and actual expenses. You may use the information in this line, together with the amount you invested, to estimate the expenses that you paid over the period. Simply divide your account value by $1,000.00 (for example, an $8,600 account value divided by $1,000.00 = 8.6), then multiply the result by the number in the first line for a Class of the fund under the heading entitled "Expenses Paid During Period" to estimate the expenses you paid on your account during this period. In addition, each Fund, as a shareholder in the underlying Fidelity Central Funds, will indirectly bear its pro-rata share of the fees and expenses incurred by the underlying Fidelity Central Funds. These fees and expenses are not included in the Fund's annualized expense ratio used to calculate the expense estimate in the table below.
Hypothetical Example for Comparison Purposes
The second line of the accompanying table for each Class of each fund provides information about hypothetical account values and hypothetical expenses based on a Class' actual expense ratio and an assumed rate of return of 5% per year before expenses, which is not the Class' actual return. The hypothetical account values and expenses may not be used to estimate the actual ending account balance or expenses you paid for the period. You may use this information to compare the ongoing costs of investing in the Fund and other funds. To do so, compare this 5% hypothetical example with the 5% hypothetical examples that appear in the shareholder reports of the other funds. In addition, each Fund, as a shareholder in the underlying Fidelity Central Funds, will indirectly bear its pro-rata share of the fees and expenses incurred by the underlying Fidelity Central Funds. These fees and expenses are not included in the Fund's annualized expense ratio used to calculate the expense estimate in the table below.
Please note that the expenses shown in the table are meant to highlight your ongoing costs only and do not reflect any transaction costs. Therefore, the second line of the table is useful in comparing ongoing costs only, and will not help you determine the relative total costs of owning different funds. In addition, if these transactional costs were included, your costs would have been higher.
| | Annualized Expense Ratio-A | Beginning
Account Value
May 1, 2019 | Ending
Account Value
October 31, 2019 | Expenses Paid
During Period-B
May 1, 2019
to October 31, 2019 |
| Fidelity Emerging Markets Discovery Fund | | | | |
| Class A | 1.52% | | | |
| Actual | | $1,000.00 | $1,007.40 | $7.69 |
| Hypothetical-C | | $1,000.00 | $1,017.54 | $7.73 |
| Class M | 1.83% | | | |
| Actual | | $1,000.00 | $1,005.90 | $9.25 |
| Hypothetical-C | | $1,000.00 | $1,015.98 | $9.30 |
| Class C | 2.30% | | | |
| Actual | | $1,000.00 | $1,003.80 | $11.62 |
| Hypothetical-C | | $1,000.00 | $1,013.61 | $11.67 |
| Emerging Markets Discovery | 1.22% | | | |
| Actual | | $1,000.00 | $1,008.80 | $6.18 |
| Hypothetical-C | | $1,000.00 | $1,019.06 | $6.21 |
| Class I | 1.21% | | | |
| Actual | | $1,000.00 | $1,009.50 | $6.13 |
| Hypothetical-C | | $1,000.00 | $1,019.11 | $6.16 |
| Class Z | 1.11% | | | |
| Actual | | $1,000.00 | $1,010.30 | $5.62 |
| Hypothetical-C | | $1,000.00 | $1,019.61 | $5.65 |
| Fidelity Total Emerging Markets Fund | | | | |
| Class A | 1.38% | | | |
| Actual | | $1,000.00 | $1,004.70 | $6.97 |
| Hypothetical-C | | $1,000.00 | $1,018.25 | $7.02 |
| Class M | 1.70% | | | |
| Actual | | $1,000.00 | $1,003.10 | $8.58 |
| Hypothetical-C | | $1,000.00 | $1,016.64 | $8.64 |
| Class C | 2.12% | | | |
| Actual | | $1,000.00 | $1,000.80 | $10.69 |
| Hypothetical-C | | $1,000.00 | $1,014.52 | $10.76 |
| Total Emerging Markets | 1.14% | | | |
| Actual | | $1,000.00 | $1,006.30 | $5.76 |
| Hypothetical-C | | $1,000.00 | $1,019.46 | $5.80 |
| Class I | 1.10% | | | |
| Actual | | $1,000.00 | $1,006.30 | $5.56 |
| Hypothetical-C | | $1,000.00 | $1,019.66 | $5.60 |
| Class Z | .99% | | | |
| Actual | | $1,000.00 | $1,007.10 | $5.01 |
| Hypothetical-C | | $1,000.00 | $1,020.21 | $5.04 |
A Annualized expense ratio reflects expenses net of applicable fee waivers.
B Expenses are equal to each Class' annualized expense ratio, multiplied by the average account value over the period, multiplied by 184/ 365 (to reflect the one-half year period).
C 5% return per year before expenses
Distributions (Unaudited)
A percentage of the dividends distributed during the fiscal year for the following funds may be taken into account as a dividend for purposes of the maximum rate under section 1(h)(11) of the Internal Revenue Code.
| | Class A | Class M | Class C | Retail Class | Class I | Class Z |
| Fidelity Emerging Markets Discovery Fund | | | | | | |
| December 14, 2018 | 100% | 100% | 100% | 100% | 100% | 100% |
| Fidelity Total Emerging Markets Fund | | | | | | |
| December 14, 2018 | 69% | 80% | 100% | 61% | 60% | 55% |
The amounts per share which represent income derived from sources within, and taxes paid to, foreign countries or possessions of the United States are as follows:
| | Pay Date | Income | Taxes |
| Fidelity Emerging Markets Discovery Fund | | | |
| Class A | 12/17/18 | $0.2361 | $0.0481 |
| Class M | 12/17/18 | $0.1541 | $0.0481 |
| Class C | 12/17/18 | $0.1071 | $0.0481 |
| Emerging Markets Discovery | 12/17/18 | $0.2781 | $0.0481 |
| Class I | 12/17/18 | $0.2741 | $0.0481 |
| Class Z | 12/17/18 | $0.3121 | $0.0481 |
| Fidelity Total Emerging Markets Fund | | | |
| Class A | 12/17/18 | $0.2697 | $0.0277 |
| Class M | 12/17/18 | $0.2347 | $0.0277 |
| Class C | 12/17/18 | $0.1797 | $0.0277 |
| Total Emerging Markets | 12/17/18 | $0.3067 | $0.0277 |
| Class I | 12/17/18 | $0.3117 | $0.0277 |
| Class Z | 12/17/18 | $0.3377 | $0.0277 |
The funds will notify shareholders in January 2020 of amounts for use in preparing 2019 income tax returns.
EMD-TEK-ANN-1219
1.931237.107
Fidelity® Emerging Europe, Middle East, Africa (EMEA) Fund
Annual Report
October 31, 2019
Includes Fidelity and Fidelity Advisor share classes
See the inside front cover for important information about access to your fund’s shareholder reports.
Beginning on January 1, 2021, as permitted by regulations adopted by the Securities and Exchange Commission, paper copies of a fund’s shareholder reports will no longer be sent by mail, unless you specifically request paper copies of the reports from the fund or from your financial intermediary, such as a financial advisor, broker-dealer or bank. Instead, the reports will be made available on a website, and you will be notified by mail each time a report is posted and provided with a website link to access the report.
If you already elected to receive shareholder reports electronically, you will not be affected by this change and you need not take any action. You may elect to receive shareholder reports and other communications from a fund electronically, by contacting your financial intermediary. For Fidelity customers, visit Fidelity's web site or call Fidelity using the contact information listed below.
You may elect to receive all future reports in paper free of charge. If you wish to continue receiving paper copies of your shareholder reports, you may contact your financial intermediary or, if you are a Fidelity customer, visit Fidelity’s website, or call Fidelity at the applicable toll-free number listed below. Your election to receive reports in paper will apply to all funds held with the fund complex/your financial intermediary.
| Account Type | Website | Phone Number |
| Brokerage, Mutual Fund, or Annuity Contracts: | fidelity.com/mailpreferences | 1-800-343-3548 |
| Employer Provided Retirement Accounts: | netbenefits.fidelity.com/preferences (choose 'no' under Required Disclosures to continue to print) | 1-800-343-0860 |
| Advisor Sold Accounts Serviced Through Your Financial Intermediary: | Contact Your Financial Intermediary | Your Financial Intermediary's phone number |
| Advisor Sold Accounts Serviced by Fidelity: | institutional.fidelity.com | 1-877-208-0098 |
Contents
To view a fund's proxy voting guidelines and proxy voting record for the 12-month period ended June 30, visit http://www.fidelity.com/proxyvotingresults or visit the Securities and Exchange Commission's (SEC) web site at http://www.sec.gov.
You may also call 1-800-544-8544 if you’re an individual investing directly with Fidelity, call 1-800-835-5092 if you’re a plan sponsor or participant with Fidelity as your recordkeeper or call 1-877-208-0098 on institutional accounts or if you’re an advisor or invest through one to request a free copy of the proxy voting guidelines.
Standard & Poor's, S&P and S&P 500 are registered service marks of The McGraw-Hill Companies, Inc. and have been licensed for use by Fidelity Distributors Corporation.
Other third-party marks appearing herein are the property of their respective owners.
All other marks appearing herein are registered or unregistered trademarks or service marks of FMR LLC or an affiliated company. © 2019 FMR LLC. All rights reserved.
This report and the financial statements contained herein are submitted for the general information of the shareholders of the Fund. This report is not authorized for distribution to prospective investors in the Fund unless preceded or accompanied by an effective prospectus.
A fund files its complete schedule of portfolio holdings with the SEC for the first and third quarters of each fiscal year on Form N-PORT. Forms N-PORT are available on the SEC’s web site at http://www.sec.gov. A fund's Forms N-PORT may be reviewed and copied at the SEC’s Public Reference Room in Washington, DC. Information regarding the operation of the SEC's Public Reference Room may be obtained by calling 1-800-SEC-0330.
For a complete list of a fund's portfolio holdings, view the most recent holdings listing, semiannual report, or annual report on Fidelity's web site at http://www.fidelity.com, http://www.institutional.fidelity.com, or http://www.401k.com, as applicable.
NOT FDIC INSURED •MAY LOSE VALUE •NO BANK GUARANTEE
Neither the Fund nor Fidelity Distributors Corporation is a bank.
Performance: The Bottom Line
Average annual total return reflects the change in the value of an investment, assuming reinvestment of distributions from dividend income and capital gains (the profits earned upon the sale of securities that have grown in value, if any) and assuming a constant rate of performance each year. The hypothetical investment and the average annual total returns do not reflect the deduction of taxes that a shareholder would pay on fund distributions or the redemption of fund shares. During periods of reimbursement by Fidelity, a fund’s total return will be greater than it would be had the reimbursement not occurred. How a fund did yesterday is no guarantee of how it will do tomorrow.
Average Annual Total Returns
| For the periods ended October 31, 2019 | Past 1 year | Past 5 years | Past 10 years |
| Class A (incl. 5.75% sales charge) | 8.59% | 2.51% | 4.28% |
| Class M (incl. 3.50% sales charge) | 10.98% | 2.70% | 4.24% |
| Class C (incl. contingent deferred sales charge) | 13.37% | 2.94% | 4.09% |
| Fidelity® Emerging Europe, Middle East, Africa (EMEA) Fund | 15.68% | 4.00% | 5.16% |
| Class I | 15.45% | 4.05% | 5.23% |
Class C shares' contingent deferred sales charges included in the past one year, past five years and past ten years total return figures are 1%, 0% and 0%, respectively.
$10,000 Over 10 Years
Let's say hypothetically that $10,000 was invested in Fidelity® Emerging Europe, Middle East, Africa (EMEA) Fund, a class of the fund, on October 31, 2009.
The chart shows how the value of your investment would have changed, and also shows how the MSCI EM (Emerging Markets) Europe, Middle East and Africa Index performed over the same period.
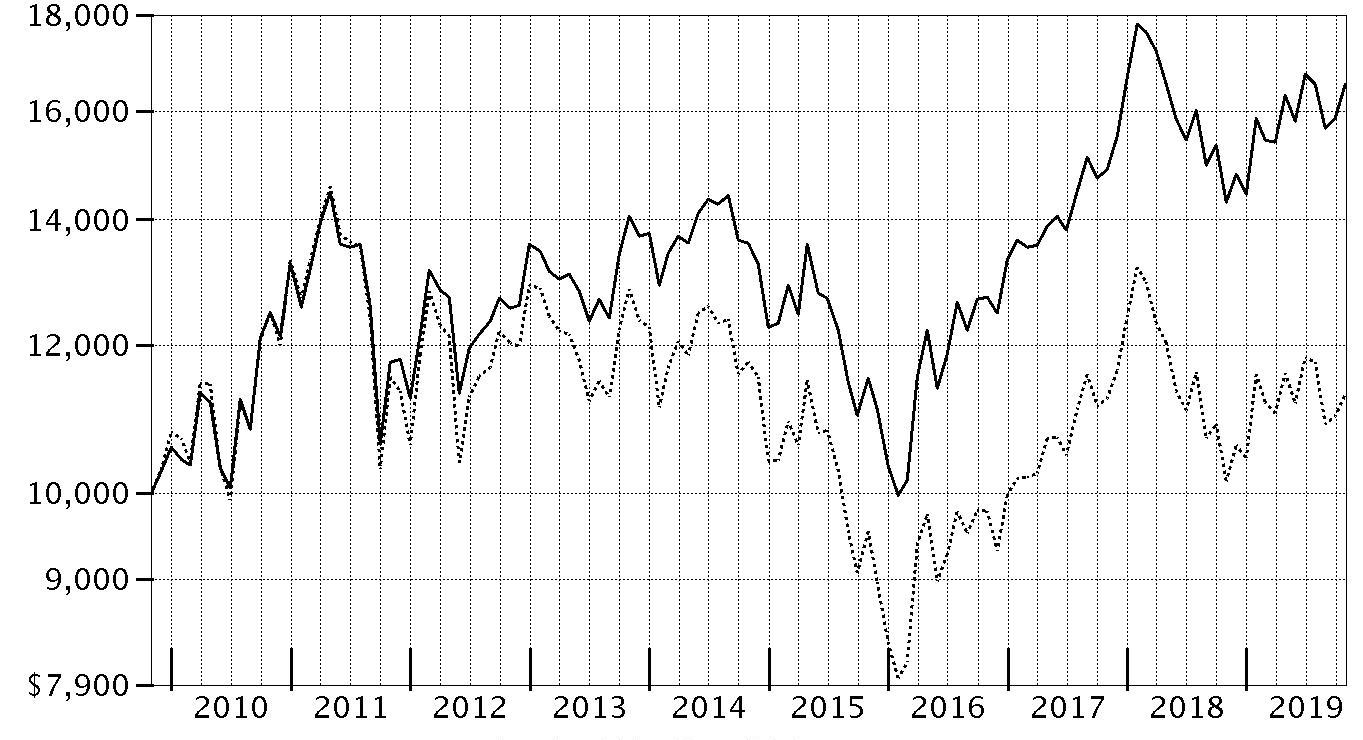
| Period Ending Values |
| $16,539 | Fidelity® Emerging Europe, Middle East, Africa (EMEA) Fund |
| $11,295 | MSCI EM (Emerging Markets) Europe, Middle East and Africa Index |
Management's Discussion of Fund Performance
Market Recap: The MSCI ACWI (All Country World Index) ex USA Index gained 11.47% for the 12 months ending October 31, 2019, as international stocks reflected a confluence of factors, including escalating trade tension, moderating but still positive global economic growth and uncertainty about the U.K.’s planned “Brexit” from the European Union. In late December, the U.S. Federal Reserve shifted from raising interest rates to a more dovish policy in 2019, joining many foreign central banks that had cut policy rates. In June, international stocks rose 6.03%, as policy stimulus in China stabilized that country’s economic growth. The Fed cut its policy rate in July for the first time since 2008. However, the index returned -1.21% for the month, followed by -3.08% in August. In September, the Fed cut its policy rate another quarter point, citing concerns about slowing economic growth and muted inflation, and did the same in October, leading to monthly gains of 2.59% and 3.49%, respectively. For the full 12 months, the growth-oriented information technology sector (+22%) led the way, followed by utilities (+20%) and real estate (+18%), two high-dividend-yielding categories. Consumer discretionary gained 16%. Conversely, energy was roughly flat, while materials (+6%) and communication services (7%) also lagged. By region, Asia Pacific ex Japan (+16%), Europe ex U.K (+13%), Canada (+12%) and emerging markets (+12%) fared best. Meanwhile, the U.K. (+7%) and Japan (+10%) trailed the broader market.
Comments from Portfolio Manager Adam Kutas: For the fiscal year, the fund's share classes (excluding sales charges, if applicable) gained roughly 14% to 16%, handily outpacing the 11.25% result of the benchmark MSCI EM (Emerging Markets) Europe, Middle East and Africa Index. Versus the benchmark, stock picking in the financials, energy and materials sectors notably contributed. In energy, an overweighting in natural gas company Gazprom, based in Russia, gained about 81% and was the top individual contributor. The stock was buoyed by Gazprom's announcement of an increase in its dividend, as well as greater company transparency and its adoption of globally accepted International Financial Reporting Standards. In materials, shares of South African companies DRDGOLD (+104%) and Anglo American Platinum (+132%) lifted the fund's relative result. DRDGOLD was a non-benchmark holding. In financials, avoiding benchmark component Qatar National Bank helped relative performance. Conversely, stock selection in the retailing segment of the consumer discretionary sector hurt most versus the benchmark. Underweighting strong-performing South African multinational internet and media firm Naspers was the biggest individual detractor. Lastly, it hurt to own a non-benchmark stake in Nampak (-47%), a maker of cans for beverages.
The views expressed above reflect those of the portfolio manager(s) only through the end of the period as stated on the cover of this report and do not necessarily represent the views of Fidelity or any other person in the Fidelity organization. Any such views are subject to change at any time based upon market or other conditions and Fidelity disclaims any responsibility to update such views. These views may not be relied on as investment advice and, because investment decisions for a Fidelity fund are based on numerous factors, may not be relied on as an indication of trading intent on behalf of any Fidelity fund.
Investment Summary (Unaudited)
Geographic Diversification (% of fund's net assets)
| As of October 31, 2019 |
| | South Africa | 33.2% |
| | Russia | 31.1% |
| | Saudi Arabia | 11.7% |
| | United Arab Emirates | 5.4% |
| | Greece | 3.4% |
| | Romania | 2.3% |
| | Egypt | 2.1% |
| | Hungary | 2.0% |
| | Poland | 1.5% |
| | Other* | 7.3% |

* Includes Short-Term investments and Net Other Assets (Liabilities).
Percentages are based on country or territory of incorporation and are adjusted for the effect of futures contracts, if applicable.
Asset Allocation as of October 31, 2019
| | % of fund's net assets |
| Stocks | 99.6 |
| Short-Term Investments and Net Other Assets (Liabilities) | 0.4 |
Top Ten Stocks as of October 31, 2019
| | % of fund's net assets |
| Gazprom OAO (Russia, Oil, Gas & Consumable Fuels) | 7.1 |
| Lukoil PJSC sponsored ADR (Russia, Oil, Gas & Consumable Fuels) | 6.0 |
| Sberbank of Russia (Russia, Banks) | 5.8 |
| NOVATEK OAO (Russia, Oil, Gas & Consumable Fuels) | 4.0 |
| Standard Bank Group Ltd. (South Africa, Banks) | 3.8 |
| Tatneft PAO (Russia, Oil, Gas & Consumable Fuels) | 3.7 |
| Al Rajhi Bank (Saudi Arabia, Banks) | 3.5 |
| MMC Norilsk Nickel PJSC (Russia, Metals & Mining) | 3.1 |
| Naspers Ltd. Class N (South Africa, Internet & Direct Marketing Retail) | 2.6 |
| PSG Group Ltd. (South Africa, Diversified Financial Services) | 2.4 |
| | 42.0 |
Top Market Sectors as of October 31, 2019
| | % of fund's net assets |
| Financials | 35.8 |
| Energy | 21.3 |
| Materials | 14.6 |
| Consumer Staples | 10.2 |
| Consumer Discretionary | 10.2 |
| Industrials | 2.7 |
| Real Estate | 2.1 |
| Communication Services | 1.8 |
| Health Care | 0.9 |
Market Sectors may include more than one industry category.
The Fund may invest up to 35% of its total assets in any industry that represents more than 20% of the emerging Europe, Middle East and Africa market. As of October 31, 2019, 26.2% of the Fund's total assets were invested in the Banks industry, which accounts for more than 20% of the emerging Europe, Middle East and Africa market.
Schedule of Investments October 31, 2019
Showing Percentage of Net Assets
| Common Stocks - 97.5% | | | |
| | | Shares | Value |
| Bermuda - 0.4% | | | |
| Central European Media Enterprises Ltd. Class A (a) | | 104,000 | $466,440 |
| Canada - 0.4% | | | |
| SEMAFO, Inc. (a) | | 130,000 | 419,482 |
| Egypt - 2.1% | | | |
| Commercial International Bank SAE | | 279,800 | 1,404,201 |
| EFG-Hermes Holding SAE | | 711,000 | 836,989 |
|
| TOTAL EGYPT | | | 2,241,190 |
|
| Finland - 0.1% | | | |
| Olvi PLC (A Shares) | | 3,476 | 147,512 |
| Greece - 3.4% | | | |
| EFG Eurobank Ergasias SA (a) | | 1,764,200 | 1,786,592 |
| Fourlis Holdings SA | | 132,900 | 800,406 |
| Jumbo SA | | 26,536 | 517,923 |
| Sarantis SA | | 55,600 | 491,125 |
|
| TOTAL GREECE | | | 3,596,046 |
|
| Hungary - 2.0% | | | |
| OTP Bank PLC | | 47,800 | 2,201,734 |
| Kazakhstan - 0.5% | | | |
| JSC Halyk Bank of Kazakhstan GDR | | 44,400 | 592,740 |
| Kenya - 1.2% | | | |
| Equity Group Holdings Ltd. | | 500,000 | 225,073 |
| KCB Group Ltd. | | 650,000 | 325,629 |
| Safaricom Ltd. | | 2,717,744 | 782,700 |
|
| TOTAL KENYA | | | 1,333,402 |
|
| Kuwait - 0.7% | | | |
| Mobile Telecommunication Co. | | 401,100 | 746,940 |
| Netherlands - 1.3% | | | |
| X5 Retail Group NV GDR (Reg. S) | | 41,300 | 1,381,898 |
| Nigeria - 1.3% | | | |
| Dangote Cement PLC | | 1,188,263 | 490,066 |
| Guaranty Trust Bank PLC | | 5,263,598 | 361,804 |
| Nigerian Breweries PLC | | 4,039,322 | 557,532 |
|
| TOTAL NIGERIA | | | 1,409,402 |
|
| Poland - 1.5% | | | |
| Globe Trade Centre SA | | 229,100 | 567,256 |
| LPP SA | | 471 | 1,005,328 |
|
| TOTAL POLAND | | | 1,572,584 |
|
| Qatar - 0.5% | | | |
| Qatar Gas Transport Co. Ltd. (Nakilat) (a) | | 720,200 | 488,573 |
| Romania - 2.3% | | | |
| Banca Transilvania SA | | 1,635,830 | 913,754 |
| BRD-Groupe Societe Generale | | 453,735 | 1,512,184 |
|
| TOTAL ROMANIA | | | 2,425,938 |
|
| Russia - 29.0% | | | |
| Alrosa Co. Ltd. | | 777,700 | 903,683 |
| Gazprom OAO | | 1,883,413 | 7,640,360 |
| Lukoil PJSC | | 20,900 | 1,930,800 |
| Lukoil PJSC sponsored ADR | | 49,395 | 4,542,364 |
| MMC Norilsk Nickel PJSC | | 11,800 | 3,291,799 |
| NOVATEK OAO | | 203,300 | 4,311,872 |
| Polyus PJSC | | 4,300 | 500,865 |
| Sberbank of Russia | | 1,701,850 | 6,237,129 |
| Tatneft PAO | | 148,000 | 1,726,907 |
|
| TOTAL RUSSIA | | | 31,085,779 |
|
| Saudi Arabia - 11.7% | | | |
| Abdullah Al Othaim Markets Co. | | 46,000 | 848,785 |
| Al Rajhi Bank | | 234,430 | 3,775,584 |
| Bupa Arabia for Cooperative Insurance Co. | | 31,700 | 907,815 |
| Mouwasat Medical Services Co. | | 42,200 | 922,700 |
| National Commercial Bank | | 203,100 | 2,355,772 |
| SABIC | | 91,500 | 2,139,709 |
| Saudi Co. for Hardware CJSC | | 52,550 | 802,900 |
| United International Transportation Co. | | 83,584 | 768,911 |
|
| TOTAL SAUDI ARABIA | | | 12,522,176 |
|
| South Africa - 33.2% | | | |
| Anglo American Platinum Ltd. | | 13,900 | 1,037,342 |
| AngloGold Ashanti Ltd. | | 111,600 | 2,468,403 |
| AVI Ltd. | | 170,300 | 976,234 |
| Barloworld Ltd. | | 85,200 | 680,111 |
| Cashbuild Ltd. | | 53,700 | 781,840 |
| City Lodge Hotels Ltd. | | 113,200 | 598,644 |
| Clicks Group Ltd. | | 126,583 | 2,058,937 |
| Distell Group Holdings Ltd. | | 59,000 | 523,837 |
| DRDGOLD Ltd. | | 3,652,614 | 1,863,219 |
| FirstRand Ltd. | | 549,600 | 2,375,095 |
| Imperial Holdings Ltd. | | 201,300 | 755,350 |
| KAP Industrial Holdings Ltd. | | 2,325,800 | 715,725 |
| Massmart Holdings Ltd. | | 195,000 | 553,622 |
| Motus Holdings Ltd. | | 140,800 | 667,916 |
| Mr Price Group Ltd. | | 154,100 | 1,629,673 |
| Nampak Ltd. (a) | | 1,172,200 | 622,929 |
| Naspers Ltd. Class N | | 19,503 | 2,759,843 |
| Pretoria Portland Cement Co. Ltd. (a) | | 1,492,249 | 380,210 |
| PSG Group Ltd. | | 167,100 | 2,611,473 |
| Sanlam Ltd. | | 452,400 | 2,382,282 |
| Sasol Ltd. | | 69,800 | 1,265,382 |
| Shoprite Holdings Ltd. | | 196,700 | 1,762,691 |
| Spar Group Ltd. | | 117,100 | 1,573,397 |
| Standard Bank Group Ltd. | | 350,886 | 4,028,205 |
| Steinhoff Africa Retail Ltd. (b) | | 422,300 | 462,530 |
|
| TOTAL SOUTH AFRICA | | | 35,534,890 |
|
| United Arab Emirates - 5.4% | | | |
| Abu Dhabi National Oil Co. for Distribution PJSC | | 1,146,531 | 817,892 |
| Aldar Properties PJSC (a) | | 2,627,968 | 1,681,499 |
| Dubai Financial Market PJSC (a) | | 3,226,102 | 779,131 |
| National Bank of Abu Dhabi PJSC | | 598,240 | 2,479,127 |
|
| TOTAL UNITED ARAB EMIRATES | | | 5,757,649 |
|
| United Kingdom - 0.5% | | | |
| Georgia Capital PLC (a) | | 40,000 | 504,150 |
| TOTAL COMMON STOCKS | | | |
| (Cost $84,040,284) | | | 104,428,525 |
|
| Nonconvertible Preferred Stocks - 2.1% | | | |
| Russia - 2.1% | | | |
| Tatneft PAO | | | |
| (Cost $691,633) | | 219,400 | 2,254,819 |
|
| Money Market Funds - 0.5% | | | |
| Fidelity Cash Central Fund 1.83% (c) | | | |
| (Cost $589,015) | | 588,897 | 589,015 |
| TOTAL INVESTMENT IN SECURITIES - 100.1% | | | |
| (Cost $85,320,932) | | | 107,272,359 |
| NET OTHER ASSETS (LIABILITIES) - (0.1)% | | | (141,887) |
| NET ASSETS - 100% | | | $107,130,472 |
Categorizations in the Schedule of Investments are based on country or territory of incorporation.
Legend
(a) Non-income producing
(b) Security exempt from registration under Rule 144A of the Securities Act of 1933. These securities may be resold in transactions exempt from registration, normally to qualified institutional buyers. At the end of the period, the value of these securities amounted to $462,530 or 0.4% of net assets.
(c) Affiliated fund that is generally available only to investment companies and other accounts managed by Fidelity Investments. The rate quoted is the annualized seven-day yield of the fund at period end. A complete unaudited listing of the fund's holdings as of its most recent quarter end is available upon request. In addition, each Fidelity Central Fund's financial statements, which are not covered by the Fund's Report of Independent Registered Public Accounting Firm, are available on the SEC's website or upon request.
Affiliated Central Funds
Information regarding fiscal year to date income earned by the Fund from investments in Fidelity Central Funds is as follows:
| Fund | Income earned |
| Fidelity Cash Central Fund | $24,156 |
| Total | $24,156 |
Amounts in the income column in the above table include any capital gain distributions from underlying funds, which are presented in the corresponding line-item in the Statement of Operations, if applicable.
Investment Valuation
The following is a summary of the inputs used, as of October 31, 2019, involving the Fund's assets and liabilities carried at fair value. The inputs or methodology used for valuing securities may not be an indication of the risk associated with investing in those securities. For more information on valuation inputs, and their aggregation into the levels used below, please refer to the Investment Valuation section in the accompanying Notes to Financial Statements.
| | Valuation Inputs at Reporting Date: |
| Description | Total | Level 1 | Level 2 | Level 3 |
| Investments in Securities: | | | | |
| Equities: | | | | |
| Communication Services | $1,996,080 | $1,996,080 | $-- | $-- |
| Consumer Discretionary | 10,844,895 | 8,085,052 | 2,759,843 | -- |
| Consumer Staples | 10,875,570 | 10,875,570 | -- | -- |
| Energy | 22,895,695 | 13,324,535 | 9,571,160 | -- |
| Financials | 38,596,463 | 32,359,334 | 6,237,129 | -- |
| Health Care | 922,700 | 922,700�� | -- | -- |
| Industrials | 2,920,097 | 2,920,097 | -- | -- |
| Materials | 15,383,089 | 9,786,085 | 5,597,004 | -- |
| Real Estate | 2,248,755 | 2,248,755 | -- | -- |
| Money Market Funds | 589,015 | 589,015 | -- | -- |
| Total Investments in Securities: | $107,272,359 | $83,107,223 | $24,165,136 | $-- |
See accompanying notes which are an integral part of the financial statements.
Financial Statements
Statement of Assets and Liabilities
| | | October 31, 2019 |
| Assets | | |
Investment in securities, at value — See accompanying schedule:
Unaffiliated issuers (cost $84,731,917) | $106,683,344 | |
| Fidelity Central Funds (cost $589,015) | 589,015 | |
| Total Investment in Securities (cost $85,320,932) | | $107,272,359 |
| Foreign currency held at value (cost $460,906) | | 461,553 |
| Receivable for investments sold | | 910,787 |
| Receivable for fund shares sold | | 21,178 |
| Dividends receivable | | 91,794 |
| Interest receivable | | 927 |
| Distributions receivable from Fidelity Central Funds | | 1,260 |
| Prepaid expenses | | 196 |
| Other receivables | | 2,254 |
| Total assets | | 108,762,308 |
| Liabilities | | |
| Payable to custodian bank | $412,458 | |
| Payable for investments purchased | 935,502 | |
| Payable for fund shares redeemed | 86,329 | |
| Accrued management fee | 68,993 | |
| Distribution and service plan fees payable | 4,049 | |
| Other affiliated payables | 25,929 | |
| Other payables and accrued expenses | 98,576 | |
| Total liabilities | | 1,631,836 |
| Net Assets | | $107,130,472 |
| Net Assets consist of: | | |
| Paid in capital | | $93,616,813 |
| Total accumulated earnings (loss) | | 13,513,659 |
| Net Assets | | $107,130,472 |
| Net Asset Value and Maximum Offering Price | | |
| Class A: | | |
| Net Asset Value and redemption price per share ($5,497,177 ÷ 549,026 shares)(a) | | $10.01 |
| Maximum offering price per share (100/94.25 of $10.01) | | $10.62 |
| Class M: | | |
| Net Asset Value and redemption price per share ($2,272,369 ÷ 228,240 shares)(a) | | $9.96 |
| Maximum offering price per share (100/96.50 of $9.96) | | $10.32 |
| Class C: | | |
| Net Asset Value and offering price per share ($2,424,219 ÷ 243,484 shares)(a) | | $9.96 |
| Emerging Europe, Middle East, Africa (EMEA): | | |
| Net Asset Value, offering price and redemption price per share ($74,521,961 ÷ 7,432,804 shares) | | $10.03 |
| Class I: | | |
| Net Asset Value, offering price and redemption price per share ($22,414,746 ÷ 2,240,506 shares) | | $10.00 |
(a) Redemption price per share is equal to net asset value less any applicable contingent deferred sales charge.
See accompanying notes which are an integral part of the financial statements.
Statement of Operations
| | | Year ended October 31, 2019 |
| Investment Income | | |
| Dividends | | $5,069,721 |
| Non-Cash dividends | | 2,192,562 |
| Income from Fidelity Central Funds | | 24,156 |
| Income before foreign taxes withheld | | 7,286,439 |
| Less foreign taxes withheld | | (688,854) |
| Total income | | 6,597,585 |
| Expenses | | |
| Management fee | $851,430 | |
| Transfer agent fees | 273,187 | |
| Distribution and service plan fees | 50,864 | |
| Accounting fees and expenses | 56,002 | |
| Custodian fees and expenses | 102,150 | |
| Independent trustees' fees and expenses | 605 | |
| Registration fees | 76,900 | |
| Audit | 68,017 | |
| Legal | 227 | |
| Miscellaneous | 621 | |
| Total expenses before reductions | 1,480,003 | |
| Expense reductions | (16,677) | |
| Total expenses after reductions | | 1,463,326 |
| Net investment income (loss) | | 5,134,259 |
| Realized and Unrealized Gain (Loss) | | |
| Net realized gain (loss) on: | | |
| Investment securities: | | |
| Unaffiliated issuers | 3,216,438 | |
| Foreign currency transactions | (59,637) | |
| Total net realized gain (loss) | | 3,156,801 |
| Change in net unrealized appreciation (depreciation) on: | | |
| Investment securities: | | |
| Unaffiliated issuers | 6,952,051 | |
| Assets and liabilities in foreign currencies | 10,290 | |
| Total change in net unrealized appreciation (depreciation) | | 6,962,341 |
| Net gain (loss) | | 10,119,142 |
| Net increase (decrease) in net assets resulting from operations | | $15,253,401 |
See accompanying notes which are an integral part of the financial statements.
Statement of Changes in Net Assets
| | Year ended October 31, 2019 | Year ended October 31, 2018 |
| Increase (Decrease) in Net Assets | | |
| Operations | | |
| Net investment income (loss) | $5,134,259 | $2,935,717 |
| Net realized gain (loss) | 3,156,801 | 2,339,332 |
| Change in net unrealized appreciation (depreciation) | 6,962,341 | (10,853,464) |
| Net increase (decrease) in net assets resulting from operations | 15,253,401 | (5,578,415) |
| Distributions to shareholders | (2,353,924) | (1,645,681) |
| Share transactions - net increase (decrease) | (3,268,959) | 5,076,428 |
| Redemption fees | – | 823 |
| Total increase (decrease) in net assets | 9,630,518 | (2,146,845) |
| Net Assets | | |
| Beginning of period | 97,499,954 | 99,646,799 |
| End of period | $107,130,472 | $97,499,954 |
See accompanying notes which are an integral part of the financial statements.
Financial Highlights
Fidelity Emerging Europe, Middle East, Africa (EMEA) Fund Class A
| Years ended October 31, | 2019 | 2018 | 2017 | 2016 | 2015 |
| Selected Per–Share Data | | | | | |
| Net asset value, beginning of period | $8.87 | $9.39 | $8.13 | $7.49 | $9.04 |
| Income from Investment Operations | | | | | |
| Net investment income (loss)A | .43B | .25 | .12 | .14 | .12 |
| Net realized and unrealized gain (loss) | .90 | (.63) | 1.22 | .61 | (1.50) |
| Total from investment operations | 1.33 | (.38) | 1.34 | .75 | (1.38) |
| Distributions from net investment income | (.18) | (.13) | (.09) | (.11) | (.14) |
| Distributions from net realized gain | –C | (.01) | – | – | (.04) |
| Total distributions | (.19)D | (.14) | (.09) | (.11) | (.17)E |
| Redemption fees added to paid in capitalA | – | –C | .01 | –C | –C |
| Net asset value, end of period | $10.01 | $8.87 | $9.39 | $8.13 | $7.49 |
| Total ReturnF,G | 15.21% | (4.17)% | 16.69% | 10.22% | (15.42)% |
| Ratios to Average Net AssetsH,I | | | | | |
| Expenses before reductions | 1.57% | 1.59% | 1.63% | 1.69% | 1.61% |
| Expenses net of fee waivers, if any | 1.57% | 1.59% | 1.62% | 1.65% | 1.61% |
| Expenses net of all reductions | 1.56% | 1.57% | 1.61% | 1.64% | 1.60% |
| Net investment income (loss) | 4.54%B | 2.49% | 1.41% | 1.90% | 1.51% |
| Supplemental Data | | | | | |
| Net assets, end of period (000 omitted) | $5,497 | $5,034 | $5,538 | $7,867 | $5,788 |
| Portfolio turnover rateJ | 49% | 39% | 47% | 54% | 50% |
A Calculated based on average shares outstanding during the period.
B Net investment income per share reflects a large, non-recurring dividend which amounted to $.19 per share. Excluding this non-recurring dividend, the ratio of net investment income (loss) to average net assets would have been 2.51%.
C Amount represents less than $.005 per share.
D Total distributions of $.19 per share is comprised of distributions from net investment income of $.184 and distributions from net realized gain of $.003 per share.
E Total distributions of $.17 per share is comprised of distributions from net investment income of $.135 and distributions from net realized gain of $.039 per share.
F Total returns would have been lower if certain expenses had not been reduced during the applicable periods shown.
G Total returns do not include the effect of the sales charges.
H Fees and expenses of any underlying Fidelity Central Funds are not included in the Fund's expense ratio. The Fund indirectly bears its proportionate share of the expenses of any underlying Fidelity Central Funds.
I Expense ratios reflect operating expenses of the class. Expenses before reductions do not reflect amounts reimbursed by the investment adviser or reductions from brokerage service arrangements or reductions from other expense offset arrangements and do not represent the amount paid by the class during periods when reimbursements or reductions occur. Expenses net of fee waivers reflect expenses after reimbursement by the investment adviser but prior to reductions from brokerage service arrangements or other expense offset arrangements. Expenses net of all reductions represent the net expenses paid by the class.
J Amount does not include the portfolio activity of any underlying Fidelity Central Funds.
See accompanying notes which are an integral part of the financial statements.
Fidelity Emerging Europe, Middle East, Africa (EMEA) Fund Class M
| Years ended October 31, | 2019 | 2018 | 2017 | 2016 | 2015 |
| Selected Per–Share Data | | | | | |
| Net asset value, beginning of period | $8.82 | $9.35 | $8.10 | $7.44 | $9.01 |
| Income from Investment Operations | | | | | |
| Net investment income (loss)A | .40B | .22 | .10 | .12 | .10 |
| Net realized and unrealized gain (loss) | .90 | (.63) | 1.21 | .61 | (1.51) |
| Total from investment operations | 1.30 | (.41) | 1.31 | .73 | (1.41) |
| Distributions from net investment income | (.16) | (.11) | (.07) | (.07) | (.13) |
| Distributions from net realized gain | –C | (.01) | – | – | (.04) |
| Total distributions | (.16) | (.12) | (.07) | (.07) | (.16)D |
| Redemption fees added to paid in capitalA | – | –C | .01 | –C | –C |
| Net asset value, end of period | $9.96 | $8.82 | $9.35 | $8.10 | $7.44 |
| Total ReturnE,F | 15.00% | (4.51)% | 16.40% | 9.98% | (15.80)% |
| Ratios to Average Net AssetsG,H | | | | | |
| Expenses before reductions | 1.89% | 1.92% | 1.95% | 2.00% | 1.92% |
| Expenses net of fee waivers, if any | 1.88% | 1.90% | 1.90% | 1.90% | 1.90% |
| Expenses net of all reductions | 1.87% | 1.88% | 1.88% | 1.89% | 1.89% |
| Net investment income (loss) | 4.23%B | 2.18% | 1.14% | 1.65% | 1.22% |
| Supplemental Data | | | | | |
| Net assets, end of period (000 omitted) | $2,272 | $2,153 | $2,490 | $2,580 | $2,003 |
| Portfolio turnover rateI | 49% | 39% | 47% | 54% | 50% |
A Calculated based on average shares outstanding during the period.
B Net investment income per share reflects a large, non-recurring dividend which amounted to $.19 per share. Excluding this non-recurring dividend, the ratio of net investment income (loss) to average net assets would have been 2.20%.
C Amount represents less than $.005 per share.
D Total distributions of $.16 per share is comprised of distributions from net investment income of $.125 and distributions from net realized gain of $.039 per share.
E Total returns would have been lower if certain expenses had not been reduced during the applicable periods shown.
F Total returns do not include the effect of the sales charges.
G Fees and expenses of any underlying Fidelity Central Funds are not included in the Fund's expense ratio. The Fund indirectly bears its proportionate share of the expenses of any underlying Fidelity Central Funds.
H Expense ratios reflect operating expenses of the class. Expenses before reductions do not reflect amounts reimbursed by the investment adviser or reductions from brokerage service arrangements or reductions from other expense offset arrangements and do not represent the amount paid by the class during periods when reimbursements or reductions occur. Expenses net of fee waivers reflect expenses after reimbursement by the investment adviser but prior to reductions from brokerage service arrangements or other expense offset arrangements. Expenses net of all reductions represent the net expenses paid by the class.
I Amount does not include the portfolio activity of any underlying Fidelity Central Funds.
See accompanying notes which are an integral part of the financial statements.
Fidelity Emerging Europe, Middle East, Africa (EMEA) Fund Class C
| Years ended October 31, | 2019 | 2018 | 2017 | 2016 | 2015 |
| Selected Per–Share Data | | | | | |
| Net asset value, beginning of period | $8.80 | $9.30 | $8.06 | $7.39 | $8.93 |
| Income from Investment Operations | | | | | |
| Net investment income (loss)A | .36B | .17 | .06 | .09 | .06 |
| Net realized and unrealized gain (loss) | .89 | (.62) | 1.20 | .60 | (1.48) |
| Total from investment operations | 1.25 | (.45) | 1.26 | .69 | (1.42) |
| Distributions from net investment income | (.09) | (.04) | (.03) | (.02) | (.08) |
| Distributions from net realized gain | –C | (.01) | – | – | (.04) |
| Total distributions | (.09) | (.05) | (.03) | (.02) | (.12) |
| Redemption fees added to paid in capitalA | – | –C | .01 | –C | –C |
| Net asset value, end of period | $9.96 | $8.80 | $9.30 | $8.06 | $7.39 |
| Total ReturnD,E | 14.37% | (4.92)% | 15.85% | 9.33% | (16.08)% |
| Ratios to Average Net AssetsF,G | | | | | |
| Expenses before reductions | 2.37% | 2.38% | 2.42% | 2.47% | 2.41% |
| Expenses net of fee waivers, if any | 2.37% | 2.38% | 2.39% | 2.40% | 2.40% |
| Expenses net of all reductions | 2.35% | 2.37% | 2.37% | 2.39% | 2.39% |
| Net investment income (loss) | 3.75%B | 1.69% | .65% | 1.15% | .72% |
| Supplemental Data | | | | | |
| Net assets, end of period (000 omitted) | $2,424 | $2,845 | $4,336 | $6,269 | $4,104 |
| Portfolio turnover rateH | 49% | 39% | 47% | 54% | 50% |
A Calculated based on average shares outstanding during the period.
B Net investment income per share reflects a large, non-recurring dividend which amounted to $.19 per share. Excluding this non-recurring dividend, the ratio of net investment income (loss) to average net assets would have been 1.72%.
C Amount represents less than $.005 per share.
D Total returns would have been lower if certain expenses had not been reduced during the applicable periods shown.
E Total returns do not include the effect of the contingent deferred sales charge.
F Fees and expenses of any underlying Fidelity Central Funds are not included in the Fund's expense ratio. The Fund indirectly bears its proportionate share of the expenses of any underlying Fidelity Central Funds.
G Expense ratios reflect operating expenses of the class. Expenses before reductions do not reflect amounts reimbursed by the investment adviser or reductions from brokerage service arrangements or reductions from other expense offset arrangements and do not represent the amount paid by the class during periods when reimbursements or reductions occur. Expenses net of fee waivers reflect expenses after reimbursement by the investment adviser but prior to reductions from brokerage service arrangements or other expense offset arrangements. Expenses net of all reductions represent the net expenses paid by the class.
H Amount does not include the portfolio activity of any underlying Fidelity Central Funds.
See accompanying notes which are an integral part of the financial statements.
Fidelity Emerging Europe, Middle East, Africa (EMEA) Fund
| Years ended October 31, | 2019 | 2018 | 2017 | 2016 | 2015 |
| Selected Per–Share Data | | | | | |
| Net asset value, beginning of period | $8.88 | $9.41 | $8.14 | $7.50 | $9.08 |
| Income from Investment Operations | | | | | |
| Net investment income (loss)A | .46B | .27 | .15 | .16 | .14 |
| Net realized and unrealized gain (loss) | .91 | (.63) | 1.21 | .61 | (1.51) |
| Total from investment operations | 1.37 | (.36) | 1.36 | .77 | (1.37) |
| Distributions from net investment income | (.21) | (.16) | (.10) | (.13) | (.17) |
| Distributions from net realized gain | –C | (.01) | – | – | (.04) |
| Total distributions | (.22)D | (.17) | (.10) | (.13) | (.21) |
| Redemption fees added to paid in capitalA | – | –C | .01 | –C | –C |
| Net asset value, end of period | $10.03 | $8.88 | $9.41 | $8.14 | $7.50 |
| Total ReturnE | 15.68% | (4.00)% | 17.04% | 10.54% | (15.33)% |
| Ratios to Average Net AssetsF,G | | | | | |
| Expenses before reductions | 1.31% | 1.34% | 1.38% | 1.46% | 1.39% |
| Expenses net of fee waivers, if any | 1.31% | 1.34% | 1.38% | 1.40% | 1.38% |
| Expenses net of all reductions | 1.30% | 1.32% | 1.37% | 1.39% | 1.38% |
| Net investment income (loss) | 4.80%B | 2.74% | 1.66% | 2.15% | 1.74% |
| Supplemental Data | | | | | |
| Net assets, end of period (000 omitted) | $74,522 | $82,387 | $80,392 | $76,193 | $67,521 |
| Portfolio turnover rateH | 49% | 39% | 47% | 54% | 50% |
A Calculated based on average shares outstanding during the period.
B Net investment income per share reflects a large, non-recurring dividend which amounted to $.19 per share. Excluding this non-recurring dividend, the ratio of net investment income (loss) to average net assets would have been 2.77%.
C Amount represents less than $.005 per share.
D Total distributions of $.22 per share is comprised of distributions from net investment income of $.213 and distributions from net realized gain of $.003 per share.
E Total returns would have been lower if certain expenses had not been reduced during the applicable periods shown.
F Fees and expenses of any underlying Fidelity Central Funds are not included in the Fund's expense ratio. The Fund indirectly bears its proportionate share of the expenses of any underlying Fidelity Central Funds.
G Expense ratios reflect operating expenses of the class. Expenses before reductions do not reflect amounts reimbursed by the investment adviser or reductions from brokerage service arrangements or reductions from other expense offset arrangements and do not represent the amount paid by the class during periods when reimbursements or reductions occur. Expenses net of fee waivers reflect expenses after reimbursement by the investment adviser but prior to reductions from brokerage service arrangements or other expense offset arrangements. Expenses net of all reductions represent the net expenses paid by the class.
H Amount does not include the portfolio activity of any underlying Fidelity Central Funds.
See accompanying notes which are an integral part of the financial statements.
Fidelity Emerging Europe, Middle East, Africa (EMEA) Fund Class I
| Years ended October 31, | 2019 | 2018 | 2017 | 2016 | 2015 |
| Selected Per–Share Data | | | | | |
| Net asset value, beginning of period | $8.88 | $9.40 | $8.14 | $7.50 | $9.08 |
| Income from Investment Operations | | | | | |
| Net investment income (loss)A | .45B | .28 | .16 | .17 | .15 |
| Net realized and unrealized gain (loss) | .90 | (.62) | 1.20 | .61 | (1.51) |
| Total from investment operations | 1.35 | (.34) | 1.36 | .78 | (1.36) |
| Distributions from net investment income | (.22) | (.17) | (.11) | (.14) | (.18) |
| Distributions from net realized gain | –C | (.01) | – | – | (.04) |
| Total distributions | (.23)D | (.18) | (.11) | (.14) | (.22) |
| Redemption fees added to paid in capitalA | – | –C | .01 | –C | –C |
| Net asset value, end of period | $10.00 | $8.88 | $9.40 | $8.14 | $7.50 |
| Total ReturnE | 15.45% | (3.80)% | 17.01% | 10.69% | (15.23)% |
| Ratios to Average Net AssetsF,G | | | | | |
| Expenses before reductions | 1.36% | 1.24% | 1.27% | 1.31% | 1.25% |
| Expenses net of fee waivers, if any | 1.36% | 1.24% | 1.27% | 1.31% | 1.25% |
| Expenses net of all reductions | 1.34% | 1.23% | 1.26% | 1.30% | 1.24% |
| Net investment income (loss) | 4.76%B | 2.83% | 1.77% | 2.24% | 1.88% |
| Supplemental Data | | | | | |
| Net assets, end of period (000 omitted) | $22,415 | $5,080 | $6,891 | $5,807 | $3,478 |
| Portfolio turnover rateH | 49% | 39% | 47% | 54% | 50% |
A Calculated based on average shares outstanding during the period.
B Net investment income per share reflects a large, non-recurring dividend which amounted to $.19 per share. Excluding this non-recurring dividend, the ratio of net investment income (loss) to average net assets would have been 2.73%.
C Amount represents less than $.005 per share.
D Total distributions of $.23 per share is comprised of distributions from net investment income of $.222 and distributions from net realized gain of $.003 per share.
E Total returns would have been lower if certain expenses had not been reduced during the applicable periods shown.
F Fees and expenses of any underlying Fidelity Central Funds are not included in the Fund's expense ratio. The Fund indirectly bears its proportionate share of the expenses of any underlying Fidelity Central Funds.
G Expense ratios reflect operating expenses of the class. Expenses before reductions do not reflect amounts reimbursed by the investment adviser or reductions from brokerage service arrangements or reductions from other expense offset arrangements and do not represent the amount paid by the class during periods when reimbursements or reductions occur. Expenses net of fee waivers reflect expenses after reimbursement by the investment adviser but prior to reductions from brokerage service arrangements or other expense offset arrangements. Expenses net of all reductions represent the net expenses paid by the class.
H Amount does not include the portfolio activity of any underlying Fidelity Central Funds.
See accompanying notes which are an integral part of the financial statements.
Notes to Financial Statements
For the period ended October 31, 2019
1. Organization.
Fidelity Emerging Europe, Middle East, Africa (EMEA) Fund (the Fund) is a non-diversified fund of Fidelity Investment Trust (the Trust) and is authorized to issue an unlimited number of shares. The Trust is registered under the Investment Company Act of 1940, as amended (the 1940 Act), as an open-end management investment company organized as a Massachusetts business trust. The Fund offers Class A, Class M, Class C, Emerging Europe, Middle East, Africa (EMEA), and Class I shares, each of which has equal rights as to assets and voting privileges. Each class has exclusive voting rights with respect to matters that affect that class. Effective March 1, 2019, Class C shares will automatically convert to Class A shares after a holding period of ten years from the initial date of purchase, with certain exceptions. The Fund's investments in emerging markets can be subject to social, economic, regulatory, and political uncertainties and can be extremely volatile.
2. Investments in Fidelity Central Funds.
The Fund invests in Fidelity Central Funds, which are open-end investment companies generally available only to other investment companies and accounts managed by the investment adviser and its affiliates. The Fund's Schedule of Investments lists each of the Fidelity Central Funds held as of period end, if any, as an investment of the Fund, but does not include the underlying holdings of each Fidelity Central Fund. As an Investing Fund, the Fund indirectly bears its proportionate share of the expenses of the underlying Fidelity Central Funds.
The Money Market Central Funds seek preservation of capital and current income and are managed by Fidelity Investments Money Management, Inc. (FIMM), an affiliate of the investment adviser. Annualized expenses of the Money Market Central Funds as of their most recent shareholder report date ranged from less than .005% to .01%.
A complete unaudited list of holdings for each Fidelity Central Fund is available upon request or at the Securities and Exchange Commission (the SEC) website at www.sec.gov. In addition, the financial statements of the Fidelity Central Funds, which are not covered by the Fund's Report of Independent Registered Public Accounting Firm, are available on the SEC website or upon request.
3. Significant Accounting Policies.
The Fund is an investment company and applies the accounting and reporting guidance of the Financial Accounting Standards Board (FASB) Accounting Standards Codification Topic 946 Financial Services – Investments Companies. The financial statements have been prepared in conformity with accounting principles generally accepted in the United States of America (GAAP), which require management to make certain estimates and assumptions at the date of the financial statements. Actual results could differ from those estimates. Subsequent events, if any, through the date that the financial statements were issued have been evaluated in the preparation of the financial statements. The following summarizes the significant accounting policies of the Fund:
Investment Valuation. Investments are valued as of 4:00 p.m. Eastern time on the last calendar day of the period. The Board of Trustees (the Board) has delegated the day to day responsibility for the valuation of the Fund's investments to the Fair Value Committee (the Committee) established by the Fund's investment adviser. In accordance with valuation policies and procedures approved by the Board, the Fund attempts to obtain prices from one or more third party pricing vendors or brokers to value its investments. When current market prices, quotations or currency exchange rates are not readily available or reliable, investments will be fair valued in good faith by the Committee, in accordance with procedures adopted by the Board. Factors used in determining fair value vary by investment type and may include market or investment specific events. The frequency with which these procedures are used cannot be predicted and they may be utilized to a significant extent. The Committee oversees the Fund's valuation policies and procedures and reports to the Board on the Committee's activities and fair value determinations. The Board monitors the appropriateness of the procedures used in valuing the Fund's investments and ratifies the fair value determinations of the Committee.
The Fund categorizes the inputs to valuation techniques used to value its investments into a disclosure hierarchy consisting of three levels as shown below:
- Level 1 – quoted prices in active markets for identical investments
- Level 2 – other significant observable inputs (including quoted prices for similar investments, interest rates, prepayment speeds, etc.)
- Level 3 – unobservable inputs (including the Fund's own assumptions based on the best information available)
Valuation techniques used to value the Fund's investments by major category are as follows:
Equity securities, including restricted securities, for which market quotations are readily available, are valued at the last reported sale price or official closing price as reported by a third party pricing vendor on the primary market or exchange on which they are traded and are categorized as Level 1 in the hierarchy. In the event there were no sales during the day or closing prices are not available, securities are valued at the last quoted bid price or may be valued using the last available price and are generally categorized as Level 2 in the hierarchy. For foreign equity securities, when market or security specific events arise, comparisons to the valuation of American Depositary Receipts (ADRs), futures contracts, Exchange-Traded Funds (ETFs) and certain indexes as well as quoted prices for similar securities may be used and would be categorized as Level 2 in the hierarchy. For equity securities, including restricted securities, where observable inputs are limited, assumptions about market activity and risk are used and these securities may be categorized as Level 3 in the hierarchy.
Investments in open-end mutual funds, including the Fidelity Central Funds, are valued at their closing net asset value (NAV) each business day and are categorized as Level 1 in the hierarchy.
Changes in valuation techniques may result in transfers in or out of an assigned level within the disclosure hierarchy. The aggregate value of investments by input level as of October 31, 2019 is included at the end of the Fund's Schedule of Investments.
Foreign Currency. The Fund may use foreign currency contracts to facilitate transactions in foreign-denominated securities. Gains and losses from these transactions may arise from changes in the value of the foreign currency or if the counterparties do not perform under the contracts' terms.
Foreign-denominated assets, including investment securities, and liabilities are translated into U.S. dollars at the exchange rates at period end. Purchases and sales of investment securities, income and dividends received and expenses denominated in foreign currencies are translated into U.S. dollars at the exchange rate in effect on the transaction date.
The effects of exchange rate fluctuations on investments are included with the net realized and unrealized gain (loss) on investment securities. Other foreign currency transactions resulting in realized and unrealized gain (loss) are disclosed separately.
Investment Transactions and Income. For financial reporting purposes, the Fund's investment holdings and NAV include trades executed through the end of the last business day of the period. The NAV per share for processing shareholder transactions is calculated as of the close of business of the New York Stock Exchange (NYSE), normally 4:00 p.m. Eastern time and includes trades executed through the end of the prior business day. Gains and losses on securities sold are determined on the basis of identified cost. Dividend income is recorded on the ex-dividend date, except for certain dividends from foreign securities where the ex-dividend date may have passed, which are recorded as soon as the Fund is informed of the ex-dividend date. Non-cash dividends included in dividend income, if any, are recorded at the fair market value of the securities received. Income and capital gain distributions from Fidelity Central Funds, if any, are recorded on the ex-dividend date. Large, non-recurring dividends recognized by the Fund are presented separately on the Statement of Operations as "Non-cash dividends" and the impact of these dividends is presented in the Financial Highlights. Investment income is recorded net of foreign taxes withheld where recovery of such taxes is uncertain.
Class Allocations and Expenses. Investment income, realized and unrealized capital gains and losses, common expenses of the Fund, and certain fund-level expense reductions, if any, are allocated daily on a pro-rata basis to each class based on the relative net assets of each class to the total net assets of the Fund. Each class differs with respect to transfer agent and distribution and service plan fees incurred. Certain expense reductions may also differ by class. For the reporting period, the allocated portion of income and expenses to each class as a percent of its average net assets may vary due to the timing of recording these transactions in relation to fluctuating net assets of the classes. Expenses directly attributable to a fund are charged to that fund. Expenses attributable to more than one fund are allocated among the respective funds on the basis of relative net assets or other appropriate methods. Expense estimates are accrued in the period to which they relate and adjustments are made when actual amounts are known.
Income Tax Information and Distributions to Shareholders. Each year, the Fund intends to qualify as a regulated investment company under Subchapter M of the Internal Revenue Code, including distributing substantially all of its taxable income and realized gains. As a result, no provision for U.S. Federal income taxes is required. As of October 31, 2019, the Fund did not have any unrecognized tax benefits in the financial statements; nor is the Fund aware of any tax positions for which it is reasonably possible that the total amounts of unrecognized tax benefits will significantly change in the next twelve months. The Fund files a U.S. federal tax return, in addition to state and local tax returns as required. The Fund's federal income tax returns are subject to examination by the Internal Revenue Service (IRS) for a period of three fiscal years after they are filed. State and local tax returns may be subject to examination for an additional fiscal year depending on the jurisdiction. Foreign taxes are provided for based on the Fund's understanding of the tax rules and rates that exist in the foreign markets in which it invests.
Distributions are declared and recorded on the ex-dividend date. Income and capital gain distributions are declared separately for each class. Income and capital gain distributions are determined in accordance with income tax regulations, which may differ from GAAP. In addition, the Fund claimed a portion of the payment made to redeeming shareholders as a distribution for income tax purposes.
Capital accounts within the financial statements are adjusted for permanent book-tax differences. These adjustments have no impact on net assets or the results of operations. Capital accounts are not adjusted for temporary book-tax differences which will reverse in a subsequent period.
Book-tax differences are primarily due to foreign currency transactions, passive foreign investment companies (PFIC), certain foreign taxes, capital loss carryforwards and losses deferred due to wash sales.
As of period end, the cost and unrealized appreciation (depreciation) in securities, and derivatives if applicable, for federal income tax purposes were as follows:
| Gross unrealized appreciation | $30,825,448 |
| Gross unrealized depreciation | (9,039,930) |
| Net unrealized appreciation (depreciation) | $21,785,518 |
| Tax Cost | $85,486,841 |
The tax-based components of distributable earnings as of period end were as follows:
| Undistributed ordinary income | $4,512,853 |
| Capital loss carryforward | $(12,606,406) |
| Net unrealized appreciation (depreciation) on securities and other investments | $21,793,562 |
Capital loss carryforwards are only available to offset future capital gains of the Fund to the extent provided by regulations and may be limited. Under the Regulated Investment Company Modernization Act of 2010 (the Act), the Fund is permitted to carry forward capital losses incurred in taxable years beginning after December 22, 2010 for an unlimited period and such capital losses are required to be used prior to any losses that expire. The capital loss carryforward information presented below, including any applicable limitation, is estimated as of fiscal period end and is subject to adjustment.
| No expiration | |
| Short-term | $(4,552,185) |
| Long-term | (8,054,221) |
| Total no expiration | $(12,606,406) |
The tax character of distributions paid was as follows:
| | October 31, 2019 | October 31, 2018 |
| Ordinary Income | $2,353,924 | $ 1,645,681 |
Restricted Securities. The Fund may invest in securities that are subject to legal or contractual restrictions on resale. These securities generally may be resold in transactions exempt from registration or to the public if the securities are registered. Disposal of these securities may involve time-consuming negotiations and expense, and prompt sale at an acceptable price may be difficult. Information regarding restricted securities is included at the end of the Fund's Schedule of Investments.
4. Purchases and Sales of Investments.
Purchases and sales of securities, other than short-term securities, aggregated $52,078,895 and $51,709,822, respectively.
5. Fees and Other Transactions with Affiliates.
Management Fee. Fidelity Management & Research Company (the investment adviser) and its affiliates provide the Fund with investment management related services for which the Fund pays a monthly management fee. The management fee is the sum of an individual fund fee rate that is based on an annual rate of .55% of the Fund's average net assets and an annualized group fee rate that averaged .24% during the period. The group fee rate is based upon the average net assets of all the mutual funds advised by the investment adviser, including any mutual funds previously advised by the investment adviser that are currently advised by Fidelity SelectCo, LLC, an affiliate of the investment adviser. The group fee rate decreases as assets under management increase and increases as assets under management decrease. For the reporting period, the total annual management fee rate was .79% of the Fund's average net assets.
Distribution and Service Plan Fees. In accordance with Rule 12b-1 of the 1940 Act, the Fund has adopted separate Distribution and Service Plans for each class of shares. Certain classes pay Fidelity Distributors Corporation (FDC), an affiliate of the investment adviser, separate Distribution and Service Fees, each of which is based on an annual percentage of each class' average net assets. In addition, FDC may pay financial intermediaries for selling shares of the Fund and providing shareholder support services. For the period, the Distribution and Service Fee rates, total fees and amounts retained by FDC were as follows:
| | Distribution Fee | Service Fee | Total Fees | Retained by FDC |
| Class A | -% | .25% | $13,193 | $146 |
| Class M | .25% | .25% | 11,166 | 228 |
| Class C | .75% | .25% | 26,505 | 1,914 |
| | | | $50,864 | $2,288 |
Sales Load. FDC may receive a front-end sales charge of up to 5.75% for selling Class A shares and 3.50% for selling Class M shares, some of which is paid to financial intermediaries for selling shares of the Fund. Depending on the holding period, FDC may receive contingent deferred sales charges levied on Class A, Class M and Class C redemptions. The deferred sales charges are 1.00% for Class C shares, 1.00% for certain purchases of Class A shares and .25% for certain purchases of Class M shares.
For the period, sales charge amounts retained by FDC were as follows:
| | Retained by FDC |
| Class A | $1,913 |
| Class M | 523 |
| Class C(a) | 41 |
| | $2,477 |
(a) When Class C shares are initially sold, FDC pays commissions from its own resources to financial intermediaries through which the sales are made.
Transfer Agent Fees. Fidelity Investments Institutional Operations Company, Inc., (FIIOC), an affiliate of the investment adviser, is the transfer, dividend disbursing and shareholder servicing agent for each class of the Fund. FIIOC receives account fees and asset-based fees that vary according to the account size and type of account of the shareholders of the respective classes of the Fund. FIIOC pays for typesetting, printing and mailing of shareholder reports, except proxy statements.
For the period, transfer agent fees for each class were as follows:
| | Amount | % of Class-Level Average Net Assets |
| Class A | $13,503 | .26 |
| Class M | 7,059 | .32 |
| Class C | 7,903 | .30 |
| Emerging Europe, Middle East, Africa (EMEA) | 209,749 | .24 |
| Class I | 34,973 | .29 |
| | $273,187 | |
Accounting Fees. Fidelity Service Company, Inc. (FSC), an affiliate of the investment adviser, maintains the Fund's accounting records. The fee is based on the level of average net assets for each month. For the period, the fees were equivalent to an annual rate of .05%.
Brokerage Commissions. The Fund placed a portion of its portfolio transactions with brokerage firms which are affiliates of the investment adviser. Brokerage commissions are included in net realized gain (loss) and change in net unrealized appreciation (depreciation) in the Statement of Operations. The commissions paid to these affiliated firms were $74 for the period.
Interfund Trades. The Fund may purchase from or sell securities to other Fidelity Funds under procedures adopted by the Board. The procedures have been designed to ensure these interfund trades are executed in accordance with Rule 17a-7 of the 1940 Act. Interfund trades are included within the respective purchases and sales amounts shown in the Purchases and Sales of Investments note.
6. Committed Line of Credit.
The Fund participates with other funds managed by the investment adviser or an affiliate in a $4.25 billion credit facility (the "line of credit") to be utilized for temporary or emergency purposes to fund shareholder redemptions or for other short-term liquidity purposes. The Fund has agreed to pay commitment fees on its pro-rata portion of the line of credit, which amounted to $286 and is reflected in Miscellaneous expenses on the Statement of Operations. During the period, the Fund did not borrow on this line of credit.
7. Expense Reductions.
Commissions paid to certain brokers with whom the investment adviser, or its affiliates, places trades on behalf of the Fund include an amount in addition to trade execution, which may be rebated back to the Fund to offset certain expenses. This amount totaled $15,873 for the period.
In addition, during the period the investment adviser reimbursed and/or waived a portion of fund-level operating expenses in the amount of $804.
8. Distributions to Shareholders.
Distributions to shareholders of each class were as follows:
| | Year ended
October 31, 2019 | Year ended
October 31, 2018 |
| Distributions to shareholders | | |
| Class A | $99,906 | $80,590 |
| Class M | 40,149 | 31,578 |
| Class C | 29,829 | 21,185 |
| Emerging Europe, Middle East, Africa (EMEA) | 1,999,708 | 1,390,507 |
| Class I | 184,332 | 121,821 |
| Total | $2,353,924 | $1,645,681 |
9. Share Transactions.
Share transactions for each class were as follows and may contain automatic conversions between classes or exchanges between affiliated funds:
| | Shares | Shares | Dollars | Dollars |
| | Year ended October 31, 2019 | Year ended October 31, 2018 | Year ended October 31, 2019 | Year ended October 31, 2018 |
| Class A | | | | |
| Shares sold | 83,951 | 177,927 | $792,142 | $1,897,467 |
| Reinvestment of distributions | 11,024 | 8,201 | 98,665 | 78,321 |
| Shares redeemed | (113,793) | (208,116) | (1,083,165) | (2,037,720) |
| Net increase (decrease) | (18,818) | (21,988) | $(192,358) | $(61,932) |
| Class M | | | | |
| Shares sold | 18,323 | 44,576 | $172,236 | $452,127 |
| Reinvestment of distributions | 4,497 | 3,314 | 40,115 | 31,578 |
| Shares redeemed | (38,654) | (70,074) | (363,904) | (697,760) |
| Net increase (decrease) | (15,834) | (22,184) | $(151,553) | $(214,055) |
| Class C | | | | |
| Shares sold | 16,370 | 63,115 | $153,563 | $657,000 |
| Reinvestment of distributions | 2,996 | 2,063 | 26,845 | 19,680 |
| Shares redeemed | (99,392) | (207,873) | (928,396) | (2,030,610) |
| Net increase (decrease) | (80,026) | (142,695) | $(747,988) | $(1,353,930) |
| Emerging Europe, Middle East, Africa (EMEA) | | | | |
| Shares sold | 2,923,695 | 5,006,638 | $27,670,486 | $50,740,861 |
| Reinvestment of distributions | 208,558 | 134,990 | 1,864,507 | 1,287,802 |
| Shares redeemed | (4,975,055) | (4,409,321) | (47,144,605) | (43,865,965) |
| Net increase (decrease) | (1,842,802) | 732,307 | $(17,609,612) | $8,162,698 |
| Class I | | | | |
| Shares sold | 2,259,653 | 579,144 | $21,094,519 | $6,006,521 |
| Reinvestment of distributions | 16,413 | 11,175 | 146,566 | 106,495 |
| Shares redeemed | (607,935) | (750,732) | (5,808,533) | (7,569,369) |
| Net increase (decrease) | 1,668,131 | (160,413) | $15,432,552 | $(1,456,353) |
10. Other.
The Fund's organizational documents provide former and current trustees and officers with a limited indemnification against liabilities arising in connection with the performance of their duties to the Fund. In the normal course of business, the Fund may also enter into contracts that provide general indemnifications. The Fund's maximum exposure under these arrangements is unknown as this would be dependent on future claims that may be made against the Fund. The risk of material loss from such claims is considered remote.
Report of Independent Registered Public Accounting Firm
To the Trustees of Fidelity Investment Trust and Shareholders of Fidelity Emerging Europe, Middle East, Africa (EMEA) Fund:
Opinion on the Financial Statements and Financial Highlights
We have audited the accompanying statement of assets and liabilities of Fidelity Emerging Europe, Middle East, Africa (EMEA) Fund (the “Fund”), a fund of Fidelity Investment Trust, including the schedule of investments, as of October 31, 2019, and the related statement of operations for the year then ended, the statement of changes in net assets for each of the two years in the period then ended, the financial highlights for each of the five years in the period then ended, and the related notes. In our opinion, the financial statements and financial highlights present fairly, in all material respects, the financial position of the Fund as of October 31, 2019, and the results of its operations for the year then ended, the changes in its net assets for each of the two years in the period then ended, and the financial highlights for each of the five years in the period then ended, in conformity with accounting principles generally accepted in the United States of America.
Basis for Opinion
These financial statements and financial highlights are the responsibility of the Fund's management. Our responsibility is to express an opinion on the Fund's financial statements and financial highlights based on our audits. We are a public accounting firm registered with the Public Company Accounting Oversight Board (United States) (PCAOB) and are required to be independent with respect to the Fund in accordance with the U.S. federal securities laws and the applicable rules and regulations of the Securities and Exchange Commission and the PCAOB.
We conducted our audits in accordance with the standards of the PCAOB. Those standards require that we plan and perform the audit to obtain reasonable assurance about whether the financial statements and financial highlights are free of material misstatement, whether due to error or fraud. The Fund is not required to have, nor were we engaged to perform, an audit of its internal control over financial reporting. As part of our audits we are required to obtain an understanding of internal control over financial reporting but not for the purpose of expressing an opinion on the effectiveness of the Fund’s internal control over financial reporting. Accordingly, we express no such opinion.
Our audits included performing procedures to assess the risks of material misstatement of the financial statements and financial highlights, whether due to error or fraud, and performing procedures that respond to those risks. Such procedures included examining, on a test basis, evidence regarding the amounts and disclosures in the financial statements and financial highlights. Our audits also included evaluating the accounting principles used and significant estimates made by management, as well as evaluating the overall presentation of the financial statements and financial highlights. Our procedures included confirmation of securities owned as of October 31, 2019, by correspondence with the custodians and brokers; when replies were not received from brokers, we performed other auditing procedures. We believe that our audits provide a reasonable basis for our opinion.
/s/ Deloitte & Touche LLP
Boston, Massachusetts
December 12, 2019
We have served as the auditor of one or more of the Fidelity investment companies since 1999.
Trustees and Officers
The Trustees, Members of the Advisory Board (if any), and officers of the trust and fund, as applicable, are listed below. The Board of Trustees governs the fund and is responsible for protecting the interests of shareholders. The Trustees are experienced executives who meet periodically throughout the year to oversee the fund's activities, review contractual arrangements with companies that provide services to the fund, oversee management of the risks associated with such activities and contractual arrangements, and review the fund's performance. Except for Jonathan Chiel, each of the Trustees oversees 298 funds. Mr. Chiel oversees 171 funds.
The Trustees hold office without limit in time except that (a) any Trustee may resign; (b) any Trustee may be removed by written instrument, signed by at least two-thirds of the number of Trustees prior to such removal; (c) any Trustee who requests to be retired or who has become incapacitated by illness or injury may be retired by written instrument signed by a majority of the other Trustees; and (d) any Trustee may be removed at any special meeting of shareholders by a two-thirds vote of the outstanding voting securities of the trust. Each Trustee who is not an interested person (as defined in the 1940 Act) of the trust and the fund is referred to herein as an Independent Trustee. Each Independent Trustee shall retire not later than the last day of the calendar year in which his or her 75th birthday occurs. The Independent Trustees may waive this mandatory retirement age policy with respect to individual Trustees. Officers and Advisory Board Members hold office without limit in time, except that any officer or Advisory Board Member may resign or may be removed by a vote of a majority of the Trustees at any regular meeting or any special meeting of the Trustees. Except as indicated, each individual has held the office shown or other offices in the same company for the past five years.
The fund's Statement of Additional Information (SAI) includes more information about the Trustees. To request a free copy, call Fidelity at 1-800-544-8544 if you’re an individual investing directly with Fidelity, call 1-800-835-5092 if you’re a plan sponsor or participant with Fidelity as your recordkeeper or call 1-877-208-0098 on institutional accounts or if you’re an advisor or invest through one.
Experience, Skills, Attributes, and Qualifications of the Trustees. The Governance and Nominating Committee has adopted a statement of policy that describes the experience, qualifications, attributes, and skills that are necessary and desirable for potential Independent Trustee candidates (Statement of Policy). The Board believes that each Trustee satisfied at the time he or she was initially elected or appointed a Trustee, and continues to satisfy, the standards contemplated by the Statement of Policy. The Governance and Nominating Committee also engages professional search firms to help identify potential Independent Trustee candidates who have the experience, qualifications, attributes, and skills consistent with the Statement of Policy. From time to time, additional criteria based on the composition and skills of the current Independent Trustees, as well as experience or skills that may be appropriate in light of future changes to board composition, business conditions, and regulatory or other developments, have also been considered by the professional search firms and the Governance and Nominating Committee. In addition, the Board takes into account the Trustees' commitment and participation in Board and committee meetings, as well as their leadership of standing and ad hoc committees throughout their tenure.
In determining that a particular Trustee was and continues to be qualified to serve as a Trustee, the Board has considered a variety of criteria, none of which, in isolation, was controlling. The Board believes that, collectively, the Trustees have balanced and diverse experience, qualifications, attributes, and skills, which allow the Board to operate effectively in governing the fund and protecting the interests of shareholders. Information about the specific experience, skills, attributes, and qualifications of each Trustee, which in each case led to the Board's conclusion that the Trustee should serve (or continue to serve) as a trustee of the fund, is provided below.
Board Structure and Oversight Function. James C. Curvey is an interested person and currently serves as Chairman. The Trustees have determined that an interested Chairman is appropriate and benefits shareholders because an interested Chairman has a personal and professional stake in the quality and continuity of services provided to the fund. Independent Trustees exercise their informed business judgment to appoint an individual of their choosing to serve as Chairman, regardless of whether the Trustee happens to be independent or a member of management. The Independent Trustees have determined that they can act independently and effectively without having an Independent Trustee serve as Chairman and that a key structural component for assuring that they are in a position to do so is for the Independent Trustees to constitute a substantial majority for the Board. The Independent Trustees also regularly meet in executive session. Ned C. Lautenbach serves as Chairman of the Independent Trustees and as such (i) acts as a liaison between the Independent Trustees and management with respect to matters important to the Independent Trustees and (ii) with management prepares agendas for Board meetings.
Fidelity® funds are overseen by different Boards of Trustees. The fund's Board oversees Fidelity's high income and certain equity funds, and other Boards oversee Fidelity's investment-grade bond, money market, asset allocation, and other equity funds. The asset allocation funds may invest in Fidelity® funds overseen by the fund's Board. The use of separate Boards, each with its own committee structure, allows the Trustees of each group of Fidelity® funds to focus on the unique issues of the funds they oversee, including common research, investment, and operational issues. On occasion, the separate Boards establish joint committees to address issues of overlapping consequences for the Fidelity® funds overseen by each Board.
The Trustees operate using a system of committees to facilitate the timely and efficient consideration of all matters of importance to the Trustees, the fund, and fund shareholders and to facilitate compliance with legal and regulatory requirements and oversight of the fund's activities and associated risks. The Board, acting through its committees, has charged FMR and its affiliates with (i) identifying events or circumstances the occurrence of which could have demonstrably adverse effects on the fund's business and/or reputation; (ii) implementing processes and controls to lessen the possibility that such events or circumstances occur or to mitigate the effects of such events or circumstances if they do occur; and (iii) creating and maintaining a system designed to evaluate continuously business and market conditions in order to facilitate the identification and implementation processes described in (i) and (ii) above. Because the day-to-day operations and activities of the fund are carried out by or through FMR, its affiliates, and other service providers, the fund's exposure to risks is mitigated but not eliminated by the processes overseen by the Trustees. While each of the Board's committees has responsibility for overseeing different aspects of the fund's activities, oversight is exercised primarily through the Operations, Audit, and Compliance Committees. Appropriate personnel, including but not limited to the fund's Chief Compliance Officer (CCO), FMR's internal auditor, the independent accountants, the fund's Treasurer and portfolio management personnel, make periodic reports to the Board's committees, as appropriate, including an annual review of Fidelity's risk management program for the Fidelity® funds. The responsibilities of each standing committee, including their oversight responsibilities, are described further under "Standing Committees of the Trustees."
Interested Trustees*:
Correspondence intended for a Trustee who is an interested person may be sent to Fidelity Investments, 245 Summer Street, Boston, Massachusetts 02210.
Name, Year of Birth; Principal Occupations and Other Relevant Experience+
Jonathan Chiel (1957)
Year of Election or Appointment: 2016
Trustee
Mr. Chiel also serves as Trustee of other Fidelity® funds. Mr. Chiel is Executive Vice President and General Counsel for FMR LLC (diversified financial services company, 2012-present). Previously, Mr. Chiel served as general counsel (2004-2012) and senior vice president and deputy general counsel (2000-2004) for John Hancock Financial Services; a partner with Choate, Hall & Stewart (1996-2000) (law firm); and an Assistant United States Attorney for the United States Attorney’s Office of the District of Massachusetts (1986-95), including Chief of the Criminal Division (1993-1995). Mr. Chiel is a director on the boards of the Boston Bar Foundation and the Maimonides School.
James C. Curvey (1935)
Year of Election or Appointment: 2007
Trustee
Chairman of the Board of Trustees
Mr. Curvey also serves as Trustee of other Fidelity® funds. Mr. Curvey is Vice Chairman (2007-present) and Director of FMR LLC (diversified financial services company). In addition, Mr. Curvey is an Overseer Emeritus for the Boston Symphony Orchestra, a Director of Artis-Naples, and a Trustee of Brewster Academy in Wolfeboro, New Hampshire. Previously, Mr. Curvey served as a Director of Fidelity Research & Analysis Co. (investment adviser firm, 2009-2018), Director of Fidelity Investments Money Management, Inc. (investment adviser firm, 2009-2014) and a Director of FMR and FMR Co., Inc. (investment adviser firms, 2007-2014).
* Determined to be an “Interested Trustee” by virtue of, among other things, his or her affiliation with the trust or various entities under common control with FMR.
+ The information includes the Trustee's principal occupation during the last five years and other information relating to the experience, attributes, and skills relevant to the Trustee's qualifications to serve as a Trustee, which led to the conclusion that the Trustee should serve as a Trustee for the fund.
Independent Trustees:
Correspondence intended for an Independent Trustee may be sent to Fidelity Investments, P.O. Box 55235, Boston, Massachusetts 02205-5235.
Name, Year of Birth; Principal Occupations and Other Relevant Experience+
Dennis J. Dirks (1948)
Year of Election or Appointment: 2005
Trustee
Mr. Dirks also serves as Trustee of other Fidelity® funds. Prior to his retirement in May 2003, Mr. Dirks was Chief Operating Officer and a member of the Board of The Depository Trust & Clearing Corporation (DTCC). He also served as President, Chief Operating Officer, and Board member of The Depository Trust Company (DTC) and President and Board member of the National Securities Clearing Corporation (NSCC). In addition, Mr. Dirks served as Chief Executive Officer and Board member of the Government Securities Clearing Corporation, Chief Executive Officer and Board member of the Mortgage-Backed Securities Clearing Corporation, as a Trustee and a member of the Finance Committee of Manhattan College (2005-2008), as a Trustee and a member of the Finance Committee of AHRC of Nassau County (2006-2008), as a member of the Independent Directors Council (IDC) Governing Council (2010-2015), and as a member of the Board of Directors for The Brookville Center for Children’s Services, Inc. (2009-2017). Mr. Dirks is a member of the Finance Committee (2016-present) and Board of Directors (2017-present) and is Treasurer (2018-present) of the Asolo Repertory Theatre.
Donald F. Donahue (1950)
Year of Election or Appointment: 2018
Trustee
Mr. Donahue also serves as a Trustee of other Fidelity® funds. Mr. Donahue is President and Chief Executive Officer of Miranda Partners, LLC (risk consulting for the financial services industry, 2012-present). Previously, Mr. Donahue served as a Member of the Advisory Board of certain Fidelity® funds (2015-2018) and Chief Executive Officer (2006-2012), Chief Operating Officer (2003-2006), and Managing Director, Customer Marketing and Development (1999-2003) of The Depository Trust & Clearing Corporation (financial markets infrastructure). Mr. Donahue serves as a Member (2007-present) and Co-Chairman (2016-present) of the Board of Directors of United Way of New York, Member of the Board of Directors of NYC Leadership Academy (2012-present) and Member of the Board of Advisors of Ripple Labs, Inc. (financial services, 2015-present). He also served as Chairman (2010-2012) and Member of the Board of Directors (2012-2013) of Omgeo, LLC (financial services), Treasurer of United Way of New York (2012-2016), and Member of the Board of Directors of XBRL US (financial services non-profit, 2009-2012) and the International Securities Services Association (2009-2012).
Alan J. Lacy (1953)
Year of Election or Appointment: 2008
Trustee
Mr. Lacy also serves as Trustee of other Fidelity® funds. Mr. Lacy serves as a Director of Bristol-Myers Squibb Company (global pharmaceuticals, 2008-present). He is a Trustee of the California Chapter of The Nature Conservancy (2015-present) and a Director of the Center for Advanced Study in the Behavioral Sciences at Stanford University (2015-present). In addition, Mr. Lacy served as Senior Adviser (2007-2014) of Oak Hill Capital Partners, L.P. (private equity) and also served as Chief Executive Officer (2005) and Vice Chairman (2005-2006) of Sears Holdings Corporation (retail) and Chief Executive Officer and Chairman of the Board of Sears, Roebuck and Co. (retail, 2000-2005). Previously, Mr. Lacy served as Chairman (2014-2017) and a member (2010-2017) of the Board of Directors of Dave & Buster’s Entertainment, Inc. (restaurant and entertainment complexes), as Chairman (2008-2011) and a member (2006-2015) of the Board of Trustees of the National Parks Conservation Association, and as a member of the Board of Directors for The Hillman Companies, Inc. (hardware wholesalers, 2010-2014), Earth Fare, Inc. (retail grocery, 2010-2014), and The Western Union Company (global money transfer, 2006-2011).
Ned C. Lautenbach (1944)
Year of Election or Appointment: 2000
Trustee
Chairman of the Independent Trustees
Mr. Lautenbach also serves as Trustee of other Fidelity® funds. Mr. Lautenbach currently serves as Chair (2018-present) and Member (2013-present) of the Board of Governors, State University System of Florida and is a member of the Council on Foreign Relations (1994-present). He is also a member and has most recently served as Chairman of the Board of Directors of Artis-Naples (2012-present). Previously, Mr. Lautenbach served as a member and then Lead Director of the Board of Directors of Eaton Corporation (diversified industrial, 1997-2016). He was also a Partner and Advisory Partner at Clayton, Dubilier & Rice, LLC (private equity investment, 1998-2010), as well as a Director of Sony Corporation (2006-2007). In addition, Mr. Lautenbach also had a 30-year career with IBM (technology company) during which time he served as Senior Vice President and a member of the Corporate Executive Committee (1968-1998).
Joseph Mauriello (1944)
Year of Election or Appointment: 2008
Trustee
Mr. Mauriello also serves as Trustee of other Fidelity® funds. Prior to his retirement in January 2006, Mr. Mauriello served in numerous senior management positions including Deputy Chairman and Chief Operating Officer (2004-2005), and Vice Chairman of Financial Services (2002-2004) of KPMG LLP US (professional services, 1965-2005). Mr. Mauriello currently serves as a member of the Independent Directors Council (IDC) Governing Council (2015-present). Previously, Mr. Mauriello served as a member of the Board of Directors of XL Group plc. (global insurance and re-insurance, 2006-2018).
Cornelia M. Small (1944)
Year of Election or Appointment: 2005
Trustee
Ms. Small also serves as Trustee of other Fidelity® funds. Ms. Small is a member of the Board of Directors (2009-present) and Chair of the Investment Committee (2010-present) of the Teagle Foundation. Ms. Small also serves on the Investment Committee of the Berkshire Taconic Community Foundation (2008-present). Previously, Ms. Small served as Chairperson (2002-2008) and a member of the Investment Committee and Chairperson (2008-2012) and a member of the Board of Trustees of Smith College. In addition, Ms. Small served as Chief Investment Officer, Director of Global Equity Investments, and a member of the Board of Directors of Scudder, Stevens & Clark and Scudder Kemper Investments.
Garnett A. Smith (1947)
Year of Election or Appointment: 2018
Trustee
Mr. Smith also serves as Trustee of other Fidelity® funds. Prior to Mr. Smith's retirement, he served as Chairman and Chief Executive Officer of Inbrand Corp. (manufacturer of personal absorbent products, 1990-1997). He also served as President (1986-1990) of Inbrand Corp. Prior to his employment with Inbrand Corp., he was employed by a retail fabric chain and North Carolina National Bank. In addition, Mr. Smith served as a Member of the Advisory Board of certain Fidelity® funds (2012-2013) and as a board member of the Jackson Hole Land Trust (2009-2012).
David M. Thomas (1949)
Year of Election or Appointment: 2008
Trustee
Mr. Thomas also serves as Trustee of other Fidelity® funds. Mr. Thomas serves as Non-Executive Chairman of the Board of Directors of Fortune Brands Home and Security (home and security products, 2011-present) and as a member of the Board of Directors (2004-present) and Presiding Director (2013-present) of Interpublic Group of Companies, Inc. (marketing communication). Previously, Mr. Thomas served as Executive Chairman (2005-2006) and Chairman and Chief Executive Officer (2000-2005) of IMS Health, Inc. (pharmaceutical and healthcare information solutions), a Director of Fortune Brands, Inc. (consumer products, 2000-2011), and a member of the Board of Trustees of the University of Florida (2013-2018).
+ The information includes the Trustee's principal occupation during the last five years and other information relating to the experience, attributes, and skills relevant to the Trustee's qualifications to serve as a Trustee, which led to the conclusion that the Trustee should serve as a Trustee for the fund.
Advisory Board Members and Officers:
Correspondence intended for a Member of the Advisory Board (if any) may be sent to Fidelity Investments, P.O. Box 55235, Boston, Massachusetts 02205-5235. Correspondence intended for an officer or Peter S. Lynch may be sent to Fidelity Investments, 245 Summer Street, Boston, Massachusetts 02210. Officers appear below in alphabetical order.
Name, Year of Birth; Principal Occupation
Vicki L. Fuller (1957)
Year of Election or Appointment: 2018
Member of the Advisory Board
Ms. Fuller also serves as Member of the Advisory Board of other Fidelity® funds. Ms. Fuller serves as a member of the Board of Directors, Audit Committee, and Nominating and Governance Committee of The Williams Companies, Inc. (natural gas infrastructure, 2018-present). Previously, Ms. Fuller served as the Chief Investment Officer of the New York State Common Retirement Fund (2012-2018) and held a variety of positions at AllianceBernstein L.P. (global asset management, 1985-2012), including Managing Director (2006-2012) and Senior Vice President and Senior Portfolio Manager (2001-2006).
Peter S. Lynch (1944)
Year of Election or Appointment: 2003
Member of the Advisory Board
Mr. Lynch also serves as Member of the Advisory Board of other Fidelity® funds. Mr. Lynch is Vice Chairman and a Director of FMR (investment adviser firm) and FMR Co., Inc. (investment adviser firm). In addition, Mr. Lynch serves as a Trustee of Boston College and as the Chairman of the Inner-City Scholarship Fund. Previously, Mr. Lynch served on the Special Olympics International Board of Directors (1997-2006).
Michael E. Wiley (1950)
Year of Election or Appointment: 2018
Member of the Advisory Board
Mr. Wiley also serves as Trustee or Member of the Advisory Board of other Fidelity® funds. Mr. Wiley serves as a Director of High Point Resources (exploration and production, 2005-present). Previously, Mr. Wiley served as a Director of Andeavor Corporation (independent oil refiner and marketer, 2005-2018), a Director of Andeavor Logistics LP (natural resources logistics, 2015-2018), a Director of Post Oak Bank (privately-held bank, 2004-2018), a Director of Asia Pacific Exploration Consolidated (international oil and gas exploration and production, 2008-2013), a member of the Board of Trustees of the University of Tulsa (2000-2006; 2007-2010), a Senior Energy Advisor of Katzenbach Partners, LLC (consulting, 2006-2007), an Advisory Director of Riverstone Holdings (private investment), a Director of Spinnaker Exploration Company (exploration and production, 2001-2005) and Chairman, President, and CEO of Baker Hughes, Inc. (oilfield services, 2000-2004).
Elizabeth Paige Baumann (1968)
Year of Election or Appointment: 2017
Anti-Money Laundering (AML) Officer
Ms. Baumann also serves as AML Officer of other funds. She is Chief AML Officer (2012-present) and Senior Vice President (2014-present) of FMR LLC (diversified financial services company) and is an employee of Fidelity Investments. Previously, Ms. Baumann served as AML Officer of the funds (2012-2016), and Vice President (2007-2014) and Deputy Anti-Money Laundering Officer (2007-2012) of FMR LLC.
Craig S. Brown (1977)
Year of Election or Appointment: 2019
Assistant Treasurer
Mr. Brown also serves as Assistant Treasurer of other funds. Mr. Brown is an employee of Fidelity Investments (2013-present).
John J. Burke III (1964)
Year of Election or Appointment: 2018
Chief Financial Officer
Mr. Burke also serves as Chief Financial Officer of other funds. Mr. Burke serves as Head of Investment Operations for Fidelity Fund and Investment Operations (2018-present) and is an employee of Fidelity Investments (1998-present). Previously Mr. Burke served as head of Asset Management Investment Operations (2012-2018).
William C. Coffey (1969)
Year of Election or Appointment: 2019
Assistant Secretary
Mr. Coffey also serves as Assistant Secretary of other funds. He is Senior Vice President and Deputy General Counsel of FMR LLC (diversified financial services company, 2010-present), and is an employee of Fidelity Investments. Previously, Mr. Coffey served as Secretary and CLO of certain funds (2018-2019); CLO, Secretary, and Senior Vice President of Fidelity Management & Research Company and FMR Co., Inc. (investment adviser firms, 2018-2019); Secretary of Fidelity SelectCo, LLC and Fidelity Investments Money Management, Inc. (investment adviser firms, 2018-2019); CLO of Fidelity Management & Research (Hong Kong) Limited, FMR Investment Management (UK) Limited, and Fidelity Management & Research (Japan) Limited (investment adviser firms, 2018-2019); and Assistant Secretary of certain funds (2009-2018).
Timothy M. Cohen (1969)
Year of Election or Appointment: 2018
Vice President
Mr. Cohen also serves as Vice President of other funds. Mr. Cohen serves as Executive Vice President of Fidelity SelectCo, LLC (2019-present), Co-Head of Equity (2018-present), a Director of Fidelity Management & Research (Japan) Limited (investment adviser firm, 2016-present), and is an employee of Fidelity Investments. Previously, Mr. Cohen served as Head of Global Equity Research (2016-2018), Chief Investment Officer - Equity and a Director of Fidelity Management & Research (U.K.) Inc. (investment adviser firm, 2013-2015) and as a Director of Fidelity Management & Research (Hong Kong) Limited (investment adviser firm, 2017).
Jonathan Davis (1968)
Year of Election or Appointment: 2010
Assistant Treasurer
Mr. Davis also serves as Assistant Treasurer of other funds. Mr. Davis serves as Assistant Treasurer of FMR Capital, Inc. (2017-present) and is an employee of Fidelity Investments. Previously, Mr. Davis served as Vice President and Associate General Counsel of FMR LLC (diversified financial services company, 2003-2010).
Adrien E. Deberghes (1967)
Year of Election or Appointment: 2016
Assistant Treasurer
Mr. Deberghes also serves as an officer of other funds. He serves as Assistant Treasurer of FMR Capital, Inc. (2017-present), Executive Vice President of Fidelity Investments Money Management, Inc. (FIMM) (investment adviser firm, 2016-present), and is an employee of Fidelity Investments (2008-present). Previously, Mr. Deberghes served as President and Treasurer of certain Fidelity® funds (2013-2018). Prior to joining Fidelity Investments, Mr. Deberghes was Senior Vice President of Mutual Fund Administration at State Street Corporation (2007-2008), Senior Director of Mutual Fund Administration at Investors Bank & Trust (2005-2007), and Director of Finance for Dunkin' Brands (2000-2005). Previously, Mr. Deberghes served in other fund officer roles.
Laura M. Del Prato (1964)
Year of Election or Appointment: 2018
Assistant Treasurer
Ms. Del Prato also serves as an officer of other funds. Ms. Del Prato is an employee of Fidelity Investments (2017-present). Prior to joining Fidelity Investments, Ms. Del Prato served as a Managing Director and Treasurer of the JPMorgan Mutual Funds (2014-2017). Prior to JPMorgan, Ms. Del Prato served as a partner at Cohen Fund Audit Services (accounting firm, 2012-2013) and KPMG LLP (accounting firm, 2004-2012).
Colm A. Hogan (1973)
Year of Election or Appointment: 2016
Deputy Treasurer
Mr. Hogan also serves as an officer of other funds. Mr. Hogan serves as Assistant Treasurer of FMR Capital, Inc. (2017-present) and is an employee of Fidelity Investments (2005-present). Previously, Mr. Hogan served as Assistant Treasurer of certain Fidelity® funds (2016-2018).
Pamela R. Holding (1964)
Year of Election or Appointment: 2018
Vice President
Ms. Holding also serves as Vice President of other funds. Ms. Holding serves as Executive Vice President of Fidelity SelectCo, LLC (2019-present), Co-Head of Equity (2018-present) and is an employee of Fidelity Investments (2013-present). Previously, Ms. Holding served as Chief Investment Officer of Fidelity Institutional Asset Management (2013-2018).
Cynthia Lo Bessette (1969)
Year of Election or Appointment: 2019
Secretary and Chief Legal Officer (CLO)
Ms. Lo Bessette also serves as Secretary and CLO of other funds. Ms. Lo Bessette serves as CLO, Secretary, and Senior Vice President of Fidelity Management & Research Company and FMR Co., Inc. (investment adviser firms, 2019-present); Secretary of Fidelity SelectCo, LLC and Fidelity Investments Money Management, Inc. (investment adviser firms, 2019-present); and CLO of Fidelity Management & Research (Hong Kong) Limited, FMR Investment Management (UK) Limited, and Fidelity Management & Research (Japan) Limited (investment adviser firms, 2019-present). She is a Senior Vice President and Deputy General Counsel of FMR LLC (diversified financial services company, 2019-present), and is an employee of Fidelity Investments. Previously, Ms. Lo Bessette served as Executive Vice President, General Counsel (2016-2019) and Senior Vice President, Deputy General Counsel (2015-2016) of OppenheimerFunds (investment management company) and Deputy Chief Legal Officer (2013-2015) of Jennison Associates LLC (investment adviser firm).
Chris Maher (1972)
Year of Election or Appointment: 2013
Assistant Treasurer
Mr. Maher serves as Assistant Treasurer of other funds. Mr. Maher is Vice President of Valuation Oversight, serves as Assistant Treasurer of FMR Capital, Inc. (2017-present), and is an employee of Fidelity Investments. Previously, Mr. Maher served as Vice President of Asset Management Compliance (2013), Vice President of the Program Management Group of FMR (investment adviser firm, 2010-2013), and Vice President of Valuation Oversight (2008-2010).
Kenneth B. Robins (1969)
Year of Election or Appointment: 2016
Chief Compliance Officer
Mr. Robins also serves as an officer of other funds. Mr. Robins serves as Compliance Officer of Fidelity Management & Research Company and FMR Co., Inc. (investment adviser firms, 2016-present) and is an employee of Fidelity Investments (2004-present). Previously, Mr. Robins served as Executive Vice President of Fidelity Investments Money Management, Inc. (investment adviser firm, 2013-2016) and served in other fund officer roles.
Stacie M. Smith (1974)
Year of Election or Appointment: 2016
President and Treasurer
Ms. Smith also serves as an officer of other funds. Ms. Smith serves as Assistant Treasurer of FMR Capital, Inc. (2017-present), is an employee of Fidelity Investments (2009-present), and has served in other fund officer roles. Prior to joining Fidelity Investments, Ms. Smith served as Senior Audit Manager of Ernst & Young LLP (accounting firm, 1996-2009). Previously, Ms. Smith served as Assistant Treasurer (2013-2018) and Deputy Treasurer (2013-2016) of certain Fidelity® funds.
Marc L. Spector (1972)
Year of Election or Appointment: 2016
Assistant Treasurer
Mr. Spector also serves as an officer of other funds. Mr. Spector serves as Assistant Treasurer of FMR Capital, Inc. (2017-present) and is an employee of Fidelity Investments (2016-present). Prior to joining Fidelity Investments, Mr. Spector served as Director at the Siegfried Group (accounting firm, 2013-2016), and prior to Siegfried Group as audit senior manager at Deloitte & Touche (accounting firm, 2005-2013).
Jim Wegmann (1979)
Year of Election or Appointment: 2019
Assistant Treasurer
Mr. Wegmann also serves as Assistant Treasurer of other funds. Mr. Wegmann is an employee of Fidelity Investments (2011-present).
Shareholder Expense Example
As a shareholder of the Fund, you incur two types of costs: (1) transaction costs, including sales charges (loads) on purchase payments or redemption proceeds, and (2) ongoing costs, including management fees, distribution and/or service (12b-1) fees and other Fund expenses. This Example is intended to help you understand your ongoing costs (in dollars) of investing in the Fund and to compare these costs with the ongoing costs of investing in other mutual funds.
The Example is based on an investment of $1,000 invested at the beginning of the period and held for the entire period (May 1, 2019 to October 31, 2019).
Actual Expenses
The first line of the accompanying table for each class of the Fund provides information about actual account values and actual expenses. You may use the information in this line, together with the amount you invested, to estimate the expenses that you paid over the period. Simply divide your account value by $1,000.00 (for example, an $8,600 account value divided by $1,000.00 = 8.6), then multiply the result by the number in the first line for a class of the Fund under the heading entitled "Expenses Paid During Period" to estimate the expenses you paid on your account during this period. In addition, the Fund, as a shareholder in the underlying Fidelity Central Funds, will indirectly bear its pro-rata share of the fees and expenses incurred by the underlying Fidelity Central Funds. These fees and expenses are not included in the Fund's annualized expense ratio used to calculate the expense estimate in the table below.
Hypothetical Example for Comparison Purposes
The second line of the accompanying table for each class of the Fund provides information about hypothetical account values and hypothetical expenses based on a Class' actual expense ratio and an assumed rate of return of 5% per year before expenses, which is not the Class' actual return. The hypothetical account values and expenses may not be used to estimate the actual ending account balance or expenses you paid for the period. You may use this information to compare the ongoing costs of investing in the Fund and other funds. To do so, compare this 5% hypothetical example with the 5% hypothetical examples that appear in the shareholder reports of the other funds. In addition, the Fund, as a shareholder in the underlying Fidelity Central Funds, will indirectly bear its pro-rata share of the fees and expenses incurred by the underlying Fidelity Central Funds. These fees and expenses are not included in the Fund's annualized expense ratio used to calculate the expense estimate in the table below.
Please note that the expenses shown in the table are meant to highlight your ongoing costs only and do not reflect any transaction costs. Therefore, the second line of the table is useful in comparing ongoing costs only, and will not help you determine the relative total costs of owning different funds. In addition, if these transactional costs were included, your costs would have been higher.
| | Annualized Expense Ratio-A | Beginning
Account Value
May 1, 2019 | Ending
Account Value
October 31, 2019 | Expenses Paid
During Period-B
May 1, 2019
to October 31, 2019 |
| Class A | 1.50% | | | |
| Actual | | $1,000.00 | $1,012.10 | $7.61 |
| Hypothetical-C | | $1,000.00 | $1,017.64 | $7.63 |
| Class M | 1.87% | | | |
| Actual | | $1,000.00 | $1,011.20 | $9.48 |
| Hypothetical-C | | $1,000.00 | $1,015.78 | $9.50 |
| Class C | 2.32% | | | |
| Actual | | $1,000.00 | $1,009.10 | $11.75 |
| Hypothetical-C | | $1,000.00 | $1,013.51 | $11.77 |
| Emerging Europe, Middle East, Africa (EMEA) | 1.21% | | | |
| Actual | | $1,000.00 | $1,014.20 | $6.14 |
| Hypothetical-C | | $1,000.00 | $1,019.11 | $6.16 |
| Class I | 1.35% | | | |
| Actual | | $1,000.00 | $1,013.20 | $6.85 |
| Hypothetical-C | | $1,000.00 | $1,018.40 | $6.87 |
A Annualized expense ratio reflects expenses net of applicable fee waivers.
B Expenses are equal to each Class' annualized expense ratio, multiplied by the average account value over the period, multiplied by 184/365 (to reflect the one-half year period).
C 5% return per year before expenses
Distributions (Unaudited)
Class A, Class M, Class C, Emerging Europe, Middle East Africa (EMEA), and Class I designate 100% of the dividend distributed during the fiscal year as amounts which may be taken into account as a dividend for purposes of the maximum rate under section 1(h)(11) of the Internal Revenue Code.
The amounts per share which represent income derived from sources within, and taxes paid to, foreign countries or possessions of the United States are as follows:
| | Pay Date | Income | Taxes |
| Fidelity Emerging Europe, Middle East, Africa (EMEA) Fund | | | |
| Class A | 12/10/18 | $0.2326 | $0.0456 |
| Class M | 12/10/18 | $0.2096 | $0.0456 |
| Class C | 12/10/18 | $0.1396 | $0.0456 |
| Emerging Europe, Middle East, Africa (EMEA) | 12/10/18 | $0.2616 | $0.0456 |
| Class I | 12/10/18 | $0.2706 | $0.0456 |
|
The fund will notify shareholders in January 2020 of amounts for use in preparing 2019 income tax returns.
EME-ANN-1219
1.861972.111
Fidelity® International Value Fund
Annual Report
October 31, 2019
Includes Fidelity and Fidelity Advisor share classes
See the inside front cover for important information about access to your fund’s shareholder reports.
Beginning on January 1, 2021, as permitted by regulations adopted by the Securities and Exchange Commission, paper copies of a fund’s shareholder reports will no longer be sent by mail, unless you specifically request paper copies of the reports from the fund or from your financial intermediary, such as a financial advisor, broker-dealer or bank. Instead, the reports will be made available on a website, and you will be notified by mail each time a report is posted and provided with a website link to access the report.
If you already elected to receive shareholder reports electronically, you will not be affected by this change and you need not take any action. You may elect to receive shareholder reports and other communications from a fund electronically, by contacting your financial intermediary. For Fidelity customers, visit Fidelity's web site or call Fidelity using the contact information listed below.
You may elect to receive all future reports in paper free of charge. If you wish to continue receiving paper copies of your shareholder reports, you may contact your financial intermediary or, if you are a Fidelity customer, visit Fidelity’s website, or call Fidelity at the applicable toll-free number listed below. Your election to receive reports in paper will apply to all funds held with the fund complex/your financial intermediary.
| Account Type | Website | Phone Number |
| Brokerage, Mutual Fund, or Annuity Contracts: | fidelity.com/mailpreferences | 1-800-343-3548 |
| Employer Provided Retirement Accounts: | netbenefits.fidelity.com/preferences (choose 'no' under Required Disclosures to continue to print) | 1-800-343-0860 |
| Advisor Sold Accounts Serviced Through Your Financial Intermediary: | Contact Your Financial Intermediary | Your Financial Intermediary's phone number |
| Advisor Sold Accounts Serviced by Fidelity: | institutional.fidelity.com | 1-877-208-0098 |
Contents
To view a fund's proxy voting guidelines and proxy voting record for the 12-month period ended June 30, visit http://www.fidelity.com/proxyvotingresults or visit the Securities and Exchange Commission's (SEC) web site at http://www.sec.gov.
You may also call 1-800-544-8544 if you’re an individual investing directly with Fidelity, call 1-800-835-5092 if you’re a plan sponsor or participant with Fidelity as your recordkeeper or call 1-877-208-0098 on institutional accounts or if you’re an advisor or invest through one to request a free copy of the proxy voting guidelines.
Standard & Poor's, S&P and S&P 500 are registered service marks of The McGraw-Hill Companies, Inc. and have been licensed for use by Fidelity Distributors Corporation.
Other third-party marks appearing herein are the property of their respective owners.
All other marks appearing herein are registered or unregistered trademarks or service marks of FMR LLC or an affiliated company. © 2019 FMR LLC. All rights reserved.
This report and the financial statements contained herein are submitted for the general information of the shareholders of the Fund. This report is not authorized for distribution to prospective investors in the Fund unless preceded or accompanied by an effective prospectus.
A fund files its complete schedule of portfolio holdings with the SEC for the first and third quarters of each fiscal year on Form N-PORT. Forms N-PORT are available on the SEC’s web site at http://www.sec.gov. A fund's Forms N-PORT may be reviewed and copied at the SEC’s Public Reference Room in Washington, DC. Information regarding the operation of the SEC's Public Reference Room may be obtained by calling 1-800-SEC-0330.
For a complete list of a fund's portfolio holdings, view the most recent holdings listing, semiannual report, or annual report on Fidelity's web site at http://www.fidelity.com, http://www.institutional.fidelity.com, or http://www.401k.com, as applicable.
NOT FDIC INSURED •MAY LOSE VALUE •NO BANK GUARANTEE
Neither the Fund nor Fidelity Distributors Corporation is a bank.
Performance: The Bottom Line
Average annual total return reflects the change in the value of an investment, assuming reinvestment of distributions from dividend income and capital gains (the profits earned upon the sale of securities that have grown in value, if any) and assuming a constant rate of performance each year. The hypothetical investment and the average annual total returns do not reflect the deduction of taxes that a shareholder would pay on fund distributions or the redemption of fund shares. During periods of reimbursement by Fidelity, a fund’s total return will be greater than it would be had the reimbursement not occurred. How a fund did yesterday is no guarantee of how it will do tomorrow.
Average Annual Total Returns
| For the periods ended October 31, 2019 | Past 1 year | Past 5 years | Past 10 years |
| Class A (incl. 5.75% sales charge) | (1.62)% | 0.09% | 2.42% |
| Class M (incl. 3.50% sales charge) | 0.47% | 0.27% | 2.39% |
| Class C (incl. contingent deferred sales charge) | 2.53% | 0.48% | 2.25% |
| Fidelity® International Value Fund | 4.65% | 1.62% | 3.38% |
| Class I | 4.57% | 1.51% | 3.34% |
| Class Z | 4.84% | 1.54% | 3.36% |
Class C shares' contingent deferred sales charges included in the past one year, past five years and past ten years total return figures are 1%, 0% and 0%, respectively.
The initial offering of Class Z shares took place on October 2, 2018. Returns prior to October 2, 2018, are those of Class I.
$10,000 Over 10 Years
Let's say hypothetically that $10,000 was invested in Fidelity® International Value Fund, a class of the fund, on October 31, 2009.
The chart shows how the value of your investment would have changed, and also shows how the MSCI EAFE Value Index performed over the same period.

| Period Ending Values |
| $13,492 | Fidelity® International Value Fund |
| $14,857 | MSCI EAFE Value Index |
Management's Discussion of Fund Performance
Market Recap: The MSCI ACWI (All Country World Index) ex USA Index gained 11.47% for the 12 months ending October 31, 2019, as international stocks reflected a confluence of factors, including escalating trade tension, moderating but still positive global economic growth and uncertainty about the U.K.’s planned “Brexit” from the European Union. In late December, the U.S. Federal Reserve shifted from raising interest rates to a more dovish policy in 2019, joining many foreign central banks that had cut policy rates. In June, international stocks rose 6.03%, as policy stimulus in China stabilized that country’s economic growth. The Fed cut its policy rate in July for the first time since 2008. However, the index returned -1.21% for the month, followed by -3.08% in August. In September, the Fed cut its policy rate another quarter point, citing concerns about slowing economic growth and muted inflation, and did the same in October, leading to monthly gains of 2.59% and 3.49%, respectively. For the full 12 months, the growth-oriented information technology sector (+22%) led the way, followed by utilities (+20%) and real estate (+18%), two high-dividend-yielding categories. Consumer discretionary gained 16%. Conversely, energy was roughly flat, while materials (+6%) and communication services (7%) also lagged. By region, Asia Pacific ex Japan (+16%), Europe ex U.K (+13%), Canada (+12%) and emerging markets (+12%) fared best. Meanwhile, the U.K. (+7%) and Japan (+10%) trailed the broader market.
Comments from Portfolio Manager Alexander Zavratsky: For the fiscal year, the fund’s share classes gained between about 4% and 5% (excluding sales charges, if applicable), trailing the 5.80% advance of the MSCI EAFE Value Index. From a sector standpoint, the portfolio’s positioning among consumer discretionary and energy stocks hurt the most. Underweighting the top-performing utilities and real estate sectors also detracted. These negatives overshadowed the positive impact of investment choices in materials and information technology. Geographically, the fund’s exposure to Europe – security selection in Spain especially – along with picks in the U.K., weighed on relative performance, while choices in Japan were the most helpful. Among individual stocks, not owning benchmark component Iberdrola hurt more than any other stock. Shares of the Spanish renewable energy firm gained about 52% during the past 12 months, boosted by strong earnings on the back of growth in international markets. Another relative detractor was the portfolio’s overweight stake in Nordic-Baltic bank Swedbank (-31%), which fell sharply in February amid reports that the bank was involved in a massive money-laundering scandal. Swedbank subsequently fired its CEO in March however the stock dropped considerably again, and trailed for the remainder of the reporting period. Conversely, Japanese multinational Hoya (+58%), a supplier of electronics products to the semiconductor industry, executed well the past 12 months and benefitted from the ongoing structural-growth in extreme ultraviolet lithography (EUV) technology, further propelling the fund’s relative result. Shin-Etsu Chemical (+37%), the largest chemical firm in Japan and another out-of-benchmark holding, also contributed.
The views expressed above reflect those of the portfolio manager(s) only through the end of the period as stated on the cover of this report and do not necessarily represent the views of Fidelity or any other person in the Fidelity organization. Any such views are subject to change at any time based upon market or other conditions and Fidelity disclaims any responsibility to update such views. These views may not be relied on as investment advice and, because investment decisions for a Fidelity fund are based on numerous factors, may not be relied on as an indication of trading intent on behalf of any Fidelity fund.
Investment Summary (Unaudited)
Geographic Diversification (% of fund's net assets)
| As of October 31, 2019 |
| | Japan | 25.5% |
| | United Kingdom | 17.1% |
| | France | 14.5% |
| | Germany | 12.5% |
| | Italy | 4.4% |
| | Switzerland | 3.9% |
| | Spain | 3.2% |
| | Sweden | 2.9% |
| | Australia | 2.8% |
| | Other* | 13.2% |
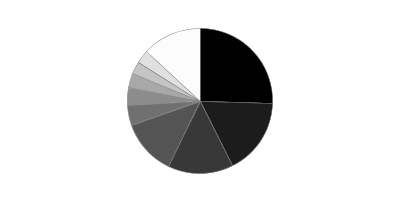
* Includes Short-Term investments and Net Other Assets (Liabilities).
Percentages are based on country or territory of incorporation and are adjusted for the effect of futures contracts, if applicable.
Asset Allocation as of October 31, 2019
| | % of fund's net assets |
| Stocks | 99.0 |
| Short-Term Investments and Net Other Assets (Liabilities) | 1.0 |
Top Ten Stocks as of October 31, 2019
| | % of fund's net assets |
| BP PLC (United Kingdom, Oil, Gas & Consumable Fuels) | 3.3 |
| Toyota Motor Corp. (Japan, Automobiles) | 3.1 |
| Total SA (France, Oil, Gas & Consumable Fuels) | 3.1 |
| BHP Billiton PLC (United Kingdom, Metals & Mining) | 3.0 |
| Enel SpA (Italy, Electric Utilities) | 2.1 |
| Banco Santander SA (Spain) (Spain, Banks) | 2.1 |
| Zurich Insurance Group Ltd. (Switzerland, Insurance) | 2.0 |
| AXA SA (France, Insurance) | 1.9 |
| VINCI SA (France, Construction & Engineering) | 1.9 |
| Sanofi SA (France, Pharmaceuticals) | 1.9 |
| | 24.4 |
Top Market Sectors as of October 31, 2019
| | % of fund's net assets |
| Financials | 37.1 |
| Industrials | 9.7 |
| Energy | 9.5 |
| Materials | 9.1 |
| Health Care | 7.7 |
| Consumer Discretionary | 7.8 |
| Information Technology | 7.0 |
| Communication Services | 3.6 |
| Utilities | 3.1 |
| Real Estate | 2.3 |
Schedule of Investments October 31, 2019
Showing Percentage of Net Assets
| Common Stocks - 97.7% | | | |
| | | Shares | Value |
| Australia - 2.8% | | | |
| Commonwealth Bank of Australia | | 108,513 | $5,883,587 |
| Insurance Australia Group Ltd. | | 603,866 | 3,308,625 |
| Macquarie Group Ltd. | | 44,042 | 4,066,725 |
|
| TOTAL AUSTRALIA | | | 13,258,937 |
|
| Austria - 0.7% | | | |
| Erste Group Bank AG | | 88,600 | 3,129,489 |
| Bailiwick of Jersey - 1.3% | | | |
| Glencore Xstrata PLC | | 1,248,700 | 3,769,052 |
| WPP PLC | | 182,500 | 2,277,519 |
|
| TOTAL BAILIWICK OF JERSEY | | | 6,046,571 |
|
| Belgium - 1.2% | | | |
| KBC Groep NV | | 82,225 | 5,766,445 |
| Canada - 0.5% | | | |
| Nutrien Ltd. | | 45,680 | 2,185,329 |
| China - 0.6% | | | |
| Ping An Insurance Group Co. of China Ltd. (H Shares) | | 244,000 | 2,816,197 |
| Denmark - 0.8% | | | |
| A.P. Moller - Maersk A/S Series B | | 1,726 | 2,201,690 |
| ORSTED A/S (a) | | 17,400 | 1,526,279 |
|
| TOTAL DENMARK | | | 3,727,969 |
|
| Finland - 0.6% | | | |
| Sampo Oyj (A Shares) | | 67,034 | 2,747,043 |
| France - 14.5% | | | |
| ALTEN | | 9,100 | 999,192 |
| Atos Origin SA | | 30,382 | 2,357,846 |
| AXA SA | | 344,021 | 9,106,660 |
| Bouygues SA | | 69,205 | 2,933,005 |
| Capgemini SA | | 27,393 | 3,084,165 |
| Natixis SA | | 457,600 | 2,098,095 |
| Sanofi SA | | 94,279 | 8,691,313 |
| Societe Generale Series A | | 129,864 | 3,693,193 |
| SR Teleperformance SA | | 16,800 | 3,807,367 |
| Thales SA | | 24,600 | 2,404,524 |
| Total SA | | 274,490 | 14,511,805 |
| VINCI SA | | 77,500 | 8,695,436 |
| Vivendi SA | | 143,992 | 4,008,433 |
| Worldline SA (a)(b) | | 26,388 | 1,602,493 |
|
| TOTAL FRANCE | | | 67,993,527 |
|
| Germany - 11.2% | | | |
| Bayer AG | | 97,900 | 7,594,710 |
| Continental AG | | 23,100 | 3,094,034 |
| Daimler AG (Germany) | | 62,200 | 3,635,769 |
| Hannover Reuck SE | | 34,000 | 6,021,728 |
| HeidelbergCement Finance AG | | 67,200 | 4,993,046 |
| Linde PLC | | 29,614 | 5,854,301 |
| MTU Aero Engines Holdings AG | | 7,800 | 2,082,622 |
| Muenchener Rueckversicherungs-Gesellschaft AG in Muenchen | | 17,000 | 4,721,065 |
| Rheinmetall AG | | 24,700 | 2,971,042 |
| RWE AG | | 114,129 | 3,478,783 |
| SAP SE | | 20,560 | 2,724,230 |
| Vonovia SE | | 98,467 | 5,239,524 |
|
| TOTAL GERMANY | | | 52,410,854 |
|
| Indonesia - 0.4% | | | |
| PT Bank Rakyat Indonesia Tbk | | 6,770,500 | 2,028,681 |
| Ireland - 1.1% | | | |
| CRH PLC | | 146,002 | 5,315,901 |
| Italy - 4.4% | | | |
| Assicurazioni Generali SpA | | 209,100 | 4,238,578 |
| Enel SpA | | 1,257,200 | 9,743,758 |
| Intesa Sanpaolo SpA | | 1,421,700 | 3,562,533 |
| Mediobanca SpA | | 270,725 | 3,215,657 |
|
| TOTAL ITALY | | | 20,760,526 |
|
| Japan - 25.5% | | | |
| DENSO Corp. | | 95,600 | 4,438,700 |
| Fanuc Corp. | | 19,400 | 3,826,636 |
| Hitachi High-Technologies Corp. | | 48,400 | 3,011,244 |
| Hoya Corp. | | 59,700 | 5,276,121 |
| Ibiden Co. Ltd. | | 57,200 | 1,320,791 |
| Idemitsu Kosan Co. Ltd. | | 101,900 | 2,995,379 |
| Itochu Corp. | | 291,500 | 6,094,648 |
| Kao Corp. | | 44,000 | 3,537,542 |
| Minebea Mitsumi, Inc. | | 227,200 | 4,314,880 |
| Mitsubishi Estate Co. Ltd. | | 130,600 | 2,535,649 |
| Mitsubishi UFJ Financial Group, Inc. | | 1,379,200 | 7,150,170 |
| Mitsui Fudosan Co. Ltd. | | 129,000 | 3,300,186 |
| Nintendo Co. Ltd. | | 4,800 | 1,760,580 |
| OBIC Co. Ltd. | | 30,893 | 3,867,965 |
| Oracle Corp. Japan | | 35,500 | 3,120,314 |
| ORIX Corp. | | 353,400 | 5,553,644 |
| Recruit Holdings Co. Ltd. | | 63,600 | 2,113,685 |
| Shin-Etsu Chemical Co. Ltd. | | 52,600 | 5,864,965 |
| Shinsei Bank Ltd. | | 233,200 | 3,635,530 |
| SoftBank Corp. | | 24,600 | 946,274 |
| Sony Corp. | | 35,800 | 2,179,116 |
| Sony Financial Holdings, Inc. | | 192,800 | 4,147,793 |
| Sumitomo Mitsui Financial Group, Inc. | | 202,300 | 7,182,297 |
| Suzuki Motor Corp. | | 40,000 | 1,888,565 |
| Takeda Pharmaceutical Co. Ltd. | | 144,451 | 5,219,459 |
| Tokio Marine Holdings, Inc. | | 133,900 | 7,239,386 |
| Tokyo Electron Ltd. | | 12,100 | 2,451,443 |
| Toyota Motor Corp. | | 210,100 | 14,576,923 |
|
| TOTAL JAPAN | | | 119,549,885 |
|
| Korea (South) - 0.6% | | | |
| Samsung Electronics Co. Ltd. | | 65,340 | 2,813,949 |
| Netherlands - 2.5% | | | |
| AerCap Holdings NV (b) | | 57,000 | 3,299,160 |
| ING Groep NV (Certificaten Van Aandelen) | | 435,590 | 4,932,401 |
| Koninklijke Philips Electronics NV | | 82,634 | 3,625,494 |
|
| TOTAL NETHERLANDS | | | 11,857,055 |
|
| Portugal - 0.5% | | | |
| Galp Energia SGPS SA Class B | | 162,685 | 2,602,112 |
| Singapore - 1.0% | | | |
| United Overseas Bank Ltd. | | 238,800 | 4,701,362 |
| Spain - 3.2% | | | |
| Banco Santander SA (Spain) | | 2,393,250 | 9,593,075 |
| Cellnex Telecom SA (a) | | 55,700 | 2,401,645 |
| Masmovil Ibercom SA (b) | | 88,472 | 2,044,501 |
| Unicaja Banco SA (a) | | 1,031,900 | 933,938 |
|
| TOTAL SPAIN | | | 14,973,159 |
|
| Sweden - 2.9% | | | |
| Ericsson (B Shares) | | 557,400 | 4,871,002 |
| Investor AB (B Shares) (c) | | 126,960 | 6,502,037 |
| Swedbank AB (A Shares) | | 147,342 | 2,060,807 |
|
| TOTAL SWEDEN | | | 13,433,846 |
|
| Switzerland - 3.9% | | | |
| Swiss Life Holding AG | | 8,236 | 4,117,583 |
| UBS Group AG | | 398,458 | 4,689,851 |
| Zurich Insurance Group Ltd. | | 23,961 | 9,363,371 |
|
| TOTAL SWITZERLAND | | | 18,170,805 |
|
| United Kingdom - 17.1% | | | |
| AstraZeneca PLC (United Kingdom) | | 60,012 | 5,852,206 |
| Aviva PLC | | 785,026 | 4,231,325 |
| Beazley PLC | | 236,800 | 1,799,024 |
| BHP Billiton PLC | | 670,168 | 14,214,625 |
| BP PLC | | 2,423,569 | 15,368,733 |
| British American Tobacco PLC (United Kingdom) | | 91,304 | 3,193,438 |
| Imperial Brands PLC | | 120,288 | 2,637,014 |
| Informa PLC | | 310,381 | 3,115,903 |
| Lloyds Banking Group PLC | | 10,293,706 | 7,572,130 |
| Micro Focus International PLC | | 75,805 | 1,040,440 |
| Royal Dutch Shell PLC Class B sponsored ADR | | 131,200 | 7,647,648 |
| RSA Insurance Group PLC | | 496,410 | 3,358,360 |
| Standard Chartered PLC (United Kingdom) | | 613,511 | 5,570,927 |
| Standard Life PLC | | 912,596 | 3,587,768 |
| The Weir Group PLC | | 51,152 | 892,187 |
|
| TOTAL UNITED KINGDOM | | | 80,081,728 |
|
| United States of America - 0.4% | | | |
| ConocoPhillips Co. | | 36,200 | 1,998,240 |
| TOTAL COMMON STOCKS | | | |
| (Cost $474,359,521) | | | 458,369,610 |
|
| Nonconvertible Preferred Stocks - 1.3% | | | |
| Germany - 1.3% | | | |
| Porsche Automobil Holding SE (Germany) | | | |
| (Cost $6,058,929) | | 81,200 | 5,978,808 |
|
| Money Market Funds - 2.1% | | | |
| Fidelity Cash Central Fund 1.83% (d) | | 3,145,039 | 3,145,668 |
| Fidelity Securities Lending Cash Central Fund 1.84% (d)(e) | | 6,858,259 | 6,858,945 |
| TOTAL MONEY MARKET FUNDS | | | |
| (Cost $10,004,613) | | | 10,004,613 |
| TOTAL INVESTMENT IN SECURITIES - 101.1% | | | |
| (Cost $490,423,063) | | | 474,353,031 |
| NET OTHER ASSETS (LIABILITIES) - (1.1)% | | | (5,392,044) |
| NET ASSETS - 100% | | | $468,960,987 |
Categorizations in the Schedule of Investments are based on country or territory of incorporation.
Legend
(a) Security exempt from registration under Rule 144A of the Securities Act of 1933. These securities may be resold in transactions exempt from registration, normally to qualified institutional buyers. At the end of the period, the value of these securities amounted to $6,464,355 or 1.4% of net assets.
(b) Non-income producing
(c) Security or a portion of the security is on loan at period end.
(d) Affiliated fund that is generally available only to investment companies and other accounts managed by Fidelity Investments. The rate quoted is the annualized seven-day yield of the fund at period end. A complete unaudited listing of the fund's holdings as of its most recent quarter end is available upon request. In addition, each Fidelity Central Fund's financial statements, which are not covered by the Fund's Report of Independent Registered Public Accounting Firm, are available on the SEC's website or upon request.
(e) Investment made with cash collateral received from securities on loan.
Affiliated Central Funds
Information regarding fiscal year to date income earned by the Fund from investments in Fidelity Central Funds is as follows:
| Fund | Income earned |
| Fidelity Cash Central Fund | $84,935 |
| Fidelity Securities Lending Cash Central Fund | 232,084 |
| Total | $317,019 |
Amounts in the income column in the above table include any capital gain distributions from underlying funds, which are presented in the corresponding line-item in the Statement of Operations, if applicable. Amount for Fidelity Securities Lending Cash Central Fund represents the income earned on investing cash collateral, less rebates paid to borrowers and any lending agent fees associated with the loan, plus any premium payments received for lending certain types of securities.
Investment Valuation
The following is a summary of the inputs used, as of October 31, 2019, involving the Fund's assets and liabilities carried at fair value. The inputs or methodology used for valuing securities may not be an indication of the risk associated with investing in those securities. For more information on valuation inputs, and their aggregation into the levels used below, please refer to the Investment Valuation section in the accompanying Notes to Financial Statements.
| | Valuation Inputs at Reporting Date: |
| Description | Total | Level 1 | Level 2 | Level 3 |
| Investments in Securities: | | | | |
| Equities: | | | | |
| Communication Services | $16,554,855 | $11,570,482 | $4,984,373 | $-- |
| Consumer Discretionary | 35,791,915 | 3,635,769 | 32,156,146 | -- |
| Consumer Staples | 9,367,994 | 2,637,014 | 6,730,980 | -- |
| Energy | 45,123,917 | 9,645,888 | 35,478,029 | -- |
| Financials | 174,327,080 | 77,409,438 | 96,917,642 | -- |
| Health Care | 36,259,303 | -- | 36,259,303 | -- |
| Industrials | 45,636,882 | 27,085,343 | 18,551,539 | -- |
| Information Technology | 33,265,074 | 8,499,799 | 24,765,275 | -- |
| Materials | 42,197,219 | 13,032,676 | 29,164,543 | -- |
| Real Estate | 11,075,359 | 5,239,524 | 5,835,835 | -- |
| Utilities | 14,748,820 | 5,005,062 | 9,743,758 | -- |
| Money Market Funds | 10,004,613 | 10,004,613 | -- | -- |
| Total Investments in Securities: | $474,353,031 | $173,765,608 | $300,587,423 | $-- |
See accompanying notes which are an integral part of the financial statements.
Financial Statements
Statement of Assets and Liabilities
| | | October 31, 2019 |
| Assets | | |
Investment in securities, at value (including securities loaned of $6,513,400) — See accompanying schedule:
Unaffiliated issuers (cost $480,418,450) | $464,348,418 | |
| Fidelity Central Funds (cost $10,004,613) | 10,004,613 | |
| Total Investment in Securities (cost $490,423,063) | | $474,353,031 |
| Receivable for fund shares sold | | 43,441 |
| Dividends receivable | | 2,606,700 |
| Distributions receivable from Fidelity Central Funds | | 1,895 |
| Prepaid expenses | | 838 |
| Other receivables | | 17,378 |
| Total assets | | 477,023,283 |
| Liabilities | | |
| Payable for investments purchased | $712,190 | |
| Payable for fund shares redeemed | 95,883 | |
| Accrued management fee | 213,828 | |
| Distribution and service plan fees payable | 6,216 | |
| Other affiliated payables | 82,709 | |
| Other payables and accrued expenses | 92,525 | |
| Collateral on securities loaned | 6,858,945 | |
| Total liabilities | | 8,062,296 |
| Net Assets | | $468,960,987 |
| Net Assets consist of: | | |
| Paid in capital | | $491,155,256 |
| Total accumulated earnings (loss) | | (22,194,269) |
| Net Assets | | $468,960,987 |
| Net Asset Value and Maximum Offering Price | | |
| Class A: | | |
| Net Asset Value and redemption price per share ($7,805,976 ÷ 946,353 shares)(a) | | $8.25 |
| Maximum offering price per share (100/94.25 of $8.25) | | $8.75 |
| Class M: | | |
| Net Asset Value and redemption price per share ($3,756,028 ÷ 456,070 shares)(a) | | $8.24 |
| Maximum offering price per share (100/96.50 of $8.24) | | $8.54 |
| Class C: | | |
| Net Asset Value and offering price per share ($3,838,761 ÷ 467,012 shares)(a) | | $8.22 |
| International Value: | | |
| Net Asset Value, offering price and redemption price per share ($442,815,865 ÷ 53,669,407 shares) | | $8.25 |
| Class I: | | |
| Net Asset Value, offering price and redemption price per share ($8,495,416 ÷ 1,028,394 shares) | | $8.26 |
| Class Z: | | |
| Net Asset Value, offering price and redemption price per share ($2,248,941 ÷ 272,442 shares) | | $8.25 |
(a) Redemption price per share is equal to net asset value less any applicable contingent deferred sales charge.
See accompanying notes which are an integral part of the financial statements.
Statement of Operations
| | | Year ended October 31, 2019 |
| Investment Income | | |
| Dividends | | $20,894,002 |
| Income from Fidelity Central Funds (including $232,084 from security lending) | | 317,019 |
| Income before foreign taxes withheld | | 21,211,021 |
| Less foreign taxes withheld | | (1,592,534) |
| Total income | | 19,618,487 |
| Expenses | | |
| Management fee | | |
| Basic fee | $3,122,135 | |
| Performance adjustment | (781,657) | |
| Transfer agent fees | 769,627 | |
| Distribution and service plan fees | 78,220 | |
| Accounting and security lending fees | 236,523 | |
| Custodian fees and expenses | 71,022 | |
| Independent trustees' fees and expenses | 2,569 | |
| Registration fees | 111,385 | |
| Audit | 67,093 | |
| Legal | 1,795 | |
| Miscellaneous | 2,922 | |
| Total expenses before reductions | 3,681,634 | |
| Expense reductions | (54,976) | |
| Total expenses after reductions | | 3,626,658 |
| Net investment income (loss) | | 15,991,829 |
| Realized and Unrealized Gain (Loss) | | |
| Net realized gain (loss) on: | | |
| Investment securities: | | |
| Unaffiliated issuers | (19,621,221) | |
| Fidelity Central Funds | (512) | |
| Foreign currency transactions | (5,593) | |
| Total net realized gain (loss) | | (19,627,326) |
| Change in net unrealized appreciation (depreciation) on: | | |
| Investment securities: | | |
| Unaffiliated issuers | 24,513,704 | |
| Fidelity Central Funds | 474 | |
| Assets and liabilities in foreign currencies | 29,818 | |
| Total change in net unrealized appreciation (depreciation) | | 24,543,996 |
| Net gain (loss) | | 4,916,670 |
| Net increase (decrease) in net assets resulting from operations | | $20,908,499 |
See accompanying notes which are an integral part of the financial statements.
Statement of Changes in Net Assets
| | Year ended October 31, 2019 | Year ended October 31, 2018 |
| Increase (Decrease) in Net Assets | | |
| Operations | | |
| Net investment income (loss) | $15,991,829 | $13,690,019 |
| Net realized gain (loss) | (19,627,326) | 17,670,754 |
| Change in net unrealized appreciation (depreciation) | 24,543,996 | (75,956,079) |
| Net increase (decrease) in net assets resulting from operations | 20,908,499 | (44,595,306) |
| Distributions to shareholders | (13,674,095) | (8,990,094) |
| Share transactions - net increase (decrease) | 4,693,076 | 127,811,807 |
| Redemption fees | – | 12,452 |
| Total increase (decrease) in net assets | 11,927,480 | 74,238,859 |
| Net Assets | | |
| Beginning of period | 457,033,507 | 382,794,648 |
| End of period | $468,960,987 | $457,033,507 |
See accompanying notes which are an integral part of the financial statements.
Financial Highlights
Fidelity International Value Fund Class A
| Years ended October 31, | 2019 | 2018 | 2017 | 2016 | 2015 |
| Selected Per–Share Data | | | | | |
| Net asset value, beginning of period | $8.13 | $9.08 | $7.78 | $8.27 | $8.62 |
| Income from Investment Operations | | | | | |
| Net investment income (loss)A | .25 | .21 | .17 | .17 | .13 |
| Net realized and unrealized gain (loss) | .08 | (1.04) | 1.31 | (.57) | (.20) |
| Total from investment operations | .33 | (.83) | 1.48 | (.40) | (.07) |
| Distributions from net investment income | (.21) | (.10) | (.17) | (.09) | (.28) |
| Distributions from net realized gain | – | (.01) | (.01) | – | – |
| Total distributions | (.21) | (.12)B | (.18) | (.09) | (.28) |
| Redemption fees added to paid in capitalA | – | –C | –C | –C | –C |
| Net asset value, end of period | $8.25 | $8.13 | $9.08 | $7.78 | $8.27 |
| Total ReturnD,E | 4.38% | (9.30)% | 19.36% | (4.91)% | (.81)% |
| Ratios to Average Net AssetsF,G | | | | | |
| Expenses before reductions | 1.14% | 1.23% | 1.33% | 1.40% | 1.37% |
| Expenses net of fee waivers, if any | 1.13% | 1.23% | 1.33% | 1.40% | 1.37% |
| Expenses net of all reductions | 1.12% | 1.21% | 1.32% | 1.39% | 1.36% |
| Net investment income (loss) | 3.19% | 2.36% | 2.01% | 2.19% | 1.58% |
| Supplemental Data | | | | | |
| Net assets, end of period (000 omitted) | $7,806 | $7,887 | $8,151 | $7,717 | $8,956 |
| Portfolio turnover rateH | 47% | 55% | 50% | 47% | 44% |
A Calculated based on average shares outstanding during the period.
B Total distributions of $.12 per share is comprised of distributions from net investment income of $.102 and distributions from net realized gain of $.014 per share.
C Amount represents less than $.005 per share.
D Total returns would have been lower if certain expenses had not been reduced during the applicable periods shown.
E Total returns do not include the effect of the sales charges.
F Fees and expenses of any underlying Fidelity Central Funds are not included in the Fund's expense ratio. The Fund indirectly bears its proportionate share of the expenses of any underlying Fidelity Central Funds.
G Expense ratios reflect operating expenses of the class. Expenses before reductions do not reflect amounts reimbursed by the investment adviser or reductions from brokerage service arrangements or reductions from other expense offset arrangements and do not represent the amount paid by the class during periods when reimbursements or reductions occur. Expenses net of fee waivers reflect expenses after reimbursement by the investment adviser but prior to reductions from brokerage service arrangements or other expense offset arrangements. Expenses net of all reductions represent the net expenses paid by the class.
H Amount does not include the portfolio activity of any underlying Fidelity Central Funds.
See accompanying notes which are an integral part of the financial statements.
Fidelity International Value Fund Class M
| Years ended October 31, | 2019 | 2018 | 2017 | 2016 | 2015 |
| Selected Per–Share Data | | | | | |
| Net asset value, beginning of period | $8.11 | $9.06 | $7.76 | $8.25 | $8.60 |
| Income from Investment Operations | | | | | |
| Net investment income (loss)A | .23 | .18 | .14 | .15 | .11 |
| Net realized and unrealized gain (loss) | .08 | (1.04) | 1.31 | (.58) | (.20) |
| Total from investment operations | .31 | (.86) | 1.45 | (.43) | (.09) |
| Distributions from net investment income | (.18) | (.08) | (.14) | (.06) | (.26) |
| Distributions from net realized gain | – | (.01) | (.01) | – | – |
| Total distributions | (.18) | (.09) | (.15) | (.06) | (.26) |
| Redemption fees added to paid in capitalA | – | –B | –B | –B | –B |
| Net asset value, end of period | $8.24 | $8.11 | $9.06 | $7.76 | $8.25 |
| Total ReturnC,D | 4.11% | (9.59)% | 19.04% | (5.24)% | (1.09)% |
| Ratios to Average Net AssetsE,F | | | | | |
| Expenses before reductions | 1.44% | 1.56% | 1.64% | 1.70% | 1.66% |
| Expenses net of fee waivers, if any | 1.43% | 1.55% | 1.64% | 1.70% | 1.66% |
| Expenses net of all reductions | 1.42% | 1.54% | 1.63% | 1.69% | 1.65% |
| Net investment income (loss) | 2.89% | 2.04% | 1.70% | 1.89% | 1.29% |
| Supplemental Data | | | | | |
| Net assets, end of period (000 omitted) | $3,756 | $3,920 | $4,181 | $3,703 | $4,086 |
| Portfolio turnover rateG | 47% | 55% | 50% | 47% | 44% |
A Calculated based on average shares outstanding during the period.
B Amount represents less than $.005 per share.
C Total returns would have been lower if certain expenses had not been reduced during the applicable periods shown.
D Total returns do not include the effect of the sales charges.
E Fees and expenses of any underlying Fidelity Central Funds are not included in the Fund's expense ratio. The Fund indirectly bears its proportionate share of the expenses of any underlying Fidelity Central Funds.
F Expense ratios reflect operating expenses of the class. Expenses before reductions do not reflect amounts reimbursed by the investment adviser or reductions from brokerage service arrangements or reductions from other expense offset arrangements and do not represent the amount paid by the class during periods when reimbursements or reductions occur. Expenses net of fee waivers reflect expenses after reimbursement by the investment adviser but prior to reductions from brokerage service arrangements or other expense offset arrangements. Expenses net of all reductions represent the net expenses paid by the class.
G Amount does not include the portfolio activity of any underlying Fidelity Central Funds.
See accompanying notes which are an integral part of the financial statements.
Fidelity International Value Fund Class C
| Years ended October 31, | 2019 | 2018 | 2017 | 2016 | 2015 |
| Selected Per–Share Data | | | | | |
| Net asset value, beginning of period | $8.08 | $9.04 | $7.75 | $8.23 | $8.59 |
| Income from Investment Operations | | | | | |
| Net investment income (loss)A | .19 | .14 | .10 | .11 | .07 |
| Net realized and unrealized gain (loss) | .08 | (1.04) | 1.31 | (.57) | (.20) |
| Total from investment operations | .27 | (.90) | 1.41 | (.46) | (.13) |
| Distributions from net investment income | (.13) | (.04) | (.11) | (.02) | (.23) |
| Distributions from net realized gain | – | (.01) | (.01) | – | – |
| Total distributions | (.13) | (.06)B | (.12) | (.02) | (.23) |
| Redemption fees added to paid in capitalA | – | –C | –C | –C | –C |
| Net asset value, end of period | $8.22 | $8.08 | $9.04 | $7.75 | $8.23 |
| Total ReturnD,E | 3.53% | (10.06)% | 18.41% | (5.61)% | (1.58)% |
| Ratios to Average Net AssetsF,G | | | | | |
| Expenses before reductions | 1.93% | 2.04% | 2.12% | 2.17% | 2.15% |
| Expenses net of fee waivers, if any | 1.92% | 2.04% | 2.12% | 2.17% | 2.14% |
| Expenses net of all reductions | 1.91% | 2.02% | 2.11% | 2.17% | 2.14% |
| Net investment income (loss) | 2.40% | 1.55% | 1.22% | 1.42% | .81% |
| Supplemental Data | | | | | |
| Net assets, end of period (000 omitted) | $3,839 | $5,339 | $5,171 | $4,168 | $4,502 |
| Portfolio turnover rateH | 47% | 55% | 50% | 47% | 44% |
A Calculated based on average shares outstanding during the period.
B Total distributions of $.06 per share is comprised of distributions from net investment income of $.042 and distributions from net realized gain of $.014 per share.
C Amount represents less than $.005 per share.
D Total returns would have been lower if certain expenses had not been reduced during the applicable periods shown.
E Total returns do not include the effect of the contingent deferred sales charge.
F Fees and expenses of any underlying Fidelity Central Funds are not included in the Fund's expense ratio. The Fund indirectly bears its proportionate share of the expenses of any underlying Fidelity Central Funds.
G Expense ratios reflect operating expenses of the class. Expenses before reductions do not reflect amounts reimbursed by the investment adviser or reductions from brokerage service arrangements or reductions from other expense offset arrangements and do not represent the amount paid by the class during periods when reimbursements or reductions occur. Expenses net of fee waivers reflect expenses after reimbursement by the investment adviser but prior to reductions from brokerage service arrangements or other expense offset arrangements. Expenses net of all reductions represent the net expenses paid by the class.
H Amount does not include the portfolio activity of any underlying Fidelity Central Funds.
See accompanying notes which are an integral part of the financial statements.
Fidelity International Value Fund
| Years ended October 31, | 2019 | 2018 | 2017 | 2016 | 2015 |
| Selected Per–Share Data | | | | | |
| Net asset value, beginning of period | $8.14 | $9.09 | $7.79 | $8.29 | $8.64 |
| Income from Investment Operations | | | | | |
| Net investment income (loss)A | .28 | .24 | .20 | .20 | .16 |
| Net realized and unrealized gain (loss) | .07 | (1.04) | 1.31 | (.58) | (.19) |
| Total from investment operations | .35 | (.80) | 1.51 | (.38) | (.03) |
| Distributions from net investment income | (.24) | (.14) | (.20) | (.12) | (.32) |
| Distributions from net realized gain | – | (.01) | (.01) | – | – |
| Total distributions | (.24) | (.15) | (.21) | (.12) | (.32) |
| Redemption fees added to paid in capitalA | – | –B | –B | –B | –B |
| Net asset value, end of period | $8.25 | $8.14 | $9.09 | $7.79 | $8.29 |
| Total ReturnC | 4.65% | (8.95)% | 19.83% | (4.69)% | (.41)% |
| Ratios to Average Net AssetsD,E | | | | | |
| Expenses before reductions | .79% | .89% | .97% | 1.03% | 1.02% |
| Expenses net of fee waivers, if any | .78% | .89% | .97% | 1.03% | 1.02% |
| Expenses net of all reductions | .78% | .87% | .96% | 1.03% | 1.01% |
| Net investment income (loss) | 3.54% | 2.70% | 2.36% | 2.56% | 1.93% |
| Supplemental Data | | | | | |
| Net assets, end of period (000 omitted) | $442,816 | $433,015 | $359,770 | $309,199 | $267,567 |
| Portfolio turnover rateF | 47% | 55% | 50% | 47% | 44% |
A Calculated based on average shares outstanding during the period.
B Amount represents less than $.005 per share.
C Total returns would have been lower if certain expenses had not been reduced during the applicable periods shown.
D Fees and expenses of any underlying Fidelity Central Funds are not included in the Fund's expense ratio. The Fund indirectly bears its proportionate share of the expenses of any underlying Fidelity Central Funds.
E Expense ratios reflect operating expenses of the class. Expenses before reductions do not reflect amounts reimbursed by the investment adviser or reductions from brokerage service arrangements or reductions from other expense offset arrangements and do not represent the amount paid by the class during periods when reimbursements or reductions occur. Expenses net of fee waivers reflect expenses after reimbursement by the investment adviser but prior to reductions from brokerage service arrangements or other expense offset arrangements. Expenses net of all reductions represent the net expenses paid by the class.
F Amount does not include the portfolio activity of any underlying Fidelity Central Funds.
See accompanying notes which are an integral part of the financial statements.
Fidelity International Value Fund Class I
| Years ended October 31, | 2019 | 2018 | 2017 | 2016 | 2015 |
| Selected Per–Share Data | | | | | |
| Net asset value, beginning of period | $8.15 | $9.10 | $7.80 | $8.29 | $8.65 |
| Income from Investment Operations | | | | | |
| Net investment income (loss)A | .27 | .23 | .19 | .19 | .15 |
| Net realized and unrealized gain (loss) | .08 | (1.04) | 1.31 | (.58) | (.19) |
| Total from investment operations | .35 | (.81) | 1.50 | (.39) | (.04) |
| Distributions from net investment income | (.24) | (.13) | (.19) | (.10) | (.32) |
| Distributions from net realized gain | – | (.01) | (.01) | – | – |
| Total distributions | (.24) | (.14) | (.20) | (.10) | (.32) |
| Redemption fees added to paid in capitalA | – | –B | –B | –B | –B |
| Net asset value, end of period | $8.26 | $8.15 | $9.10 | $7.80 | $8.29 |
| Total ReturnC | 4.57% | (9.04)% | 19.68% | (4.81)% | (.53)% |
| Ratios to Average Net AssetsD,E | | | | | |
| Expenses before reductions | .86% | .97% | 1.10% | 1.17% | 1.14% |
| Expenses net of fee waivers, if any | .85% | .97% | 1.10% | 1.17% | 1.14% |
| Expenses net of all reductions | .85% | .95% | 1.09% | 1.16% | 1.13% |
| Net investment income (loss) | 3.47% | 2.62% | 2.23% | 2.42% | 1.81% |
| Supplemental Data | | | | | |
| Net assets, end of period (000 omitted) | $8,495 | $6,779 | $5,523 | $1,955 | $1,969 |
| Portfolio turnover rateF | 47% | 55% | 50% | 47% | 44% |
A Calculated based on average shares outstanding during the period.
B Amount represents less than $.005 per share.
C Total returns would have been lower if certain expenses had not been reduced during the applicable periods shown.
D Fees and expenses of any underlying Fidelity Central Funds are not included in the Fund's expense ratio. The Fund indirectly bears its proportionate share of the expenses of any underlying Fidelity Central Funds.
E Expense ratios reflect operating expenses of the class. Expenses before reductions do not reflect amounts reimbursed by the investment adviser or reductions from brokerage service arrangements or reductions from other expense offset arrangements and do not represent the amount paid by the class during periods when reimbursements or reductions occur. Expenses net of fee waivers reflect expenses after reimbursement by the investment adviser but prior to reductions from brokerage service arrangements or other expense offset arrangements. Expenses net of all reductions represent the net expenses paid by the class.
F Amount does not include the portfolio activity of any underlying Fidelity Central Funds.
See accompanying notes which are an integral part of the financial statements.
Fidelity International Value Fund Class Z
| Years ended October 31, | 2019 | 2018 A |
| Selected Per–Share Data | | |
| Net asset value, beginning of period | $8.14 | $8.81 |
| Income from Investment Operations | | |
| Net investment income (loss)B | .29 | .01 |
| Net realized and unrealized gain (loss) | .08 | (.68) |
| Total from investment operations | .37 | (.67) |
| Distributions from net investment income | (.26) | – |
| Redemption fees added to paid in capitalB | – | –C |
| Net asset value, end of period | $8.25 | $8.14 |
| Total ReturnD,E | 4.84% | (7.60)% |
| Ratios to Average Net AssetsF,G | | |
| Expenses before reductions | .67% | .84%H |
| Expenses net of fee waivers, if any | .67% | .84%H |
| Expenses net of all reductions | .66% | .82%H |
| Net investment income (loss) | 3.66% | 1.58%H |
| Supplemental Data | | |
| Net assets, end of period (000 omitted) | $2,249 | $92 |
| Portfolio turnover rateI | 47% | 55% |
A For the period October 2, 2018 (commencement of sale of shares) to October 31, 2018.
B Calculated based on average shares outstanding during the period.
C Amount represents less than $.005 per share.
D Total returns for periods of less than one year are not annualized.
E Total returns would have been lower if certain expenses had not been reduced during the applicable periods shown.
F Fees and expenses of any underlying Fidelity Central Funds are not included in the Fund's expense ratio. The Fund indirectly bears its proportionate share of the expenses of any underlying Fidelity Central Funds.
G Expense ratios reflect operating expenses of the class. Expenses before reductions do not reflect amounts reimbursed by the investment adviser or reductions from brokerage service arrangements or reductions from other expense offset arrangements and do not represent the amount paid by the class during periods when reimbursements or reductions occur. Expense ratios before reductions for start-up periods may not be representative of longer-term operating periods. Expenses net of fee waivers reflect expenses after reimbursement by the investment adviser but prior to reductions from brokerage service arrangements or other expense offset arrangements. Expenses net of all reductions represent the net expenses paid by the class.
H Annualized
I Amount does not include the portfolio activity of any underlying Fidelity Central Funds.
See accompanying notes which are an integral part of the financial statements.
Notes to Financial Statements
For the period ended October 31, 2019
1. Organization.
Fidelity International Value Fund (the Fund) is a fund of Fidelity Investment Trust (the Trust) and is authorized to issue an unlimited number of shares. The Trust is registered under the Investment Company Act of 1940, as amended (the 1940 Act), as an open-end management investment company organized as a Massachusetts business trust. The Fund offers Class A, Class M, Class C, International Value, Class I and Class Z shares, each of which has equal rights as to assets and voting privileges. Each class has exclusive voting rights with respect to matters that affect that class. Effective March 1, 2019, Class C shares will automatically convert to Class A shares after a holding period of ten years from the initial date of purchase, with certain exceptions.
2. Investments in Fidelity Central Funds.
The Fund invests in Fidelity Central Funds, which are open-end investment companies generally available only to other investment companies and accounts managed by the investment adviser and its affiliates. The Fund's Schedule of Investments lists each of the Fidelity Central Funds held as of period end, if any, as an investment of the Fund, but does not include the underlying holdings of each Fidelity Central Fund. As an Investing Fund, the Fund indirectly bears its proportionate share of the expenses of the underlying Fidelity Central Funds.
The Money Market Central Funds seek preservation of capital and current income and are managed by Fidelity Investments Money Management, Inc. (FIMM), an affiliate of the investment adviser. Annualized expenses of the Money Market Central Funds as of their most recent shareholder report date ranged from less than .005% to .01%.
A complete unaudited list of holdings for each Fidelity Central Fund is available upon request or at the Securities and Exchange Commission (the SEC) website at www.sec.gov. In addition, the financial statements of the Fidelity Central Funds, which are not covered by the Fund's Report of Independent Registered Public Accounting Firm, are available on the SEC website or upon request.
3. Significant Accounting Policies.
The Fund is an investment company and applies the accounting and reporting guidance of the Financial Accounting Standards Board (FASB) Accounting Standards Codification Topic 946 Financial Services – Investments Companies. The financial statements have been prepared in conformity with accounting principles generally accepted in the United States of America (GAAP), which require management to make certain estimates and assumptions at the date of the financial statements. Actual results could differ from those estimates. Subsequent events, if any, through the date that the financial statements were issued have been evaluated in the preparation of the financial statements. The following summarizes the significant accounting policies of the Fund:
Investment Valuation. Investments are valued as of 4:00 p.m. Eastern time on the last calendar day of the period. The Board of Trustees (the Board) has delegated the day to day responsibility for the valuation of the Fund's investments to the Fair Value Committee (the Committee) established by the Fund's investment adviser. In accordance with valuation policies and procedures approved by the Board, the Fund attempts to obtain prices from one or more third party pricing vendors or brokers to value its investments. When current market prices, quotations or currency exchange rates are not readily available or reliable, investments will be fair valued in good faith by the Committee, in accordance with procedures adopted by the Board. Factors used in determining fair value vary by investment type and may include market or investment specific events. The frequency with which these procedures are used cannot be predicted and they may be utilized to a significant extent. The Committee oversees the Fund's valuation policies and procedures and reports to the Board on the Committee's activities and fair value determinations. The Board monitors the appropriateness of the procedures used in valuing the Fund's investments and ratifies the fair value determinations of the Committee.
The Fund categorizes the inputs to valuation techniques used to value its investments into a disclosure hierarchy consisting of three levels as shown below:
- Level 1 – quoted prices in active markets for identical investments
- Level 2 – other significant observable inputs (including quoted prices for similar investments, interest rates, prepayment speeds, etc.)
- Level 3 – unobservable inputs (including the Fund's own assumptions based on the best information available)
Valuation techniques used to value the Fund's investments by major category are as follows:
Equity securities, including restricted securities, for which market quotations are readily available, are valued at the last reported sale price or official closing price as reported by a third party pricing vendor on the primary market or exchange on which they are traded and are categorized as Level 1 in the hierarchy. In the event there were no sales during the day or closing prices are not available, securities are valued at the last quoted bid price or may be valued using the last available price and are generally categorized as Level 2 in the hierarchy. For foreign equity securities, when market or security specific events arise, comparisons to the valuation of American Depositary Receipts (ADRs), futures contracts, Exchange-Traded Funds (ETFs) and certain indexes as well as quoted prices for similar securities may be used and would be categorized as Level 2 in the hierarchy. For equity securities, including restricted securities, where observable inputs are limited, assumptions about market activity and risk are used and these securities may be categorized as Level 3 in the hierarchy.
Investments in open-end mutual funds, including the Fidelity Central Funds, are valued at their closing net asset value (NAV) each business day and are categorized as Level 1 in the hierarchy.
Changes in valuation techniques may result in transfers in or out of an assigned level within the disclosure hierarchy. The aggregate value of investments by input level as of October 31, 2019 is included at the end of the Fund's Schedule of Investments.
Foreign Currency. The Fund may use foreign currency contracts to facilitate transactions in foreign-denominated securities. Gains and losses from these transactions may arise from changes in the value of the foreign currency or if the counterparties do not perform under the contracts' terms.
Foreign-denominated assets, including investment securities, and liabilities are translated into U.S. dollars at the exchange rates at period end. Purchases and sales of investment securities, income and dividends received and expenses denominated in foreign currencies are translated into U.S. dollars at the exchange rate in effect on the transaction date.
The effects of exchange rate fluctuations on investments are included with the net realized and unrealized gain (loss) on investment securities. Other foreign currency transactions resulting in realized and unrealized gain (loss) are disclosed separately.
Investment Transactions and Income. For financial reporting purposes, the Fund's investment holdings and NAV include trades executed through the end of the last business day of the period. The NAV per share for processing shareholder transactions is calculated as of the close of business of the New York Stock Exchange (NYSE), normally 4:00 p.m. Eastern time and includes trades executed through the end of the prior business day. Gains and losses on securities sold are determined on the basis of identified cost and include proceeds received from litigation. Dividend income is recorded on the ex-dividend date, except for certain dividends from foreign securities where the ex-dividend date may have passed, which are recorded as soon as the Fund is informed of the ex-dividend date. Non-cash dividends included in dividend income, if any, are recorded at the fair market value of the securities received. Income and capital gain distributions from Fidelity Central Funds, if any, are recorded on the ex-dividend date. Certain distributions received by the Fund represent a return of capital or capital gain. The Fund determines the components of these distributions subsequent to the ex-dividend date, based upon receipt of tax filings or other correspondence relating to the underlying investment. These distributions are recorded as a reduction of cost of investments and/or as a realized gain. Investment income is recorded net of foreign taxes withheld where recovery of such taxes is uncertain.
Class Allocations and Expenses. Investment income, realized and unrealized capital gains and losses, common expenses of the Fund, and certain fund-level expense reductions, if any, are allocated daily on a pro-rata basis to each class based on the relative net assets of each class to the total net assets of the Fund. Each class differs with respect to transfer agent and distribution and service plan fees incurred. Certain expense reductions may also differ by class. For the reporting period, the allocated portion of income and expenses to each class as a percent of its average net assets may vary due to the timing of recording these transactions in relation to fluctuating net assets of the classes. Expenses directly attributable to a fund are charged to that fund. Expenses attributable to more than one fund are allocated among the respective funds on the basis of relative net assets or other appropriate methods. Expense estimates are accrued in the period to which they relate and adjustments are made when actual amounts are known.
Income Tax Information and Distributions to Shareholders. Each year, the Fund intends to qualify as a regulated investment company under Subchapter M of the Internal Revenue Code, including distributing substantially all of its taxable income and realized gains. As a result, no provision for U.S. Federal income taxes is required. As of October 31, 2019, the Fund did not have any unrecognized tax benefits in the financial statements; nor is the Fund aware of any tax positions for which it is reasonably possible that the total amounts of unrecognized tax benefits will significantly change in the next twelve months. The Fund files a U.S. federal tax return, in addition to state and local tax returns as required. The Fund's federal income tax returns are subject to examination by the Internal Revenue Service (IRS) for a period of three fiscal years after they are filed. State and local tax returns may be subject to examination for an additional fiscal year depending on the jurisdiction. Foreign taxes are provided for based on the Fund's understanding of the tax rules and rates that exist in the foreign markets in which it invests.
Distributions are declared and recorded on the ex-dividend date. Income and capital gain distributions are declared separately for each class. Income and capital gain distributions are determined in accordance with income tax regulations, which may differ from GAAP.
Capital accounts within the financial statements are adjusted for permanent book-tax differences. These adjustments have no impact on net assets or the results of operations. Capital accounts are not adjusted for temporary book-tax differences which will reverse in a subsequent period.
Book-tax differences are primarily due to foreign currency transactions, passive foreign investment companies (PFIC), capital loss carryforwards, expiring capital loss carryforwards, certain deemed distributions and losses deferred due to wash sales.
As of period end, the cost and unrealized appreciation (depreciation) in securities, and derivatives if applicable, for federal income tax purposes were as follows:
| Gross unrealized appreciation | $37,621,877 |
| Gross unrealized depreciation | (57,138,479) |
| Net unrealized appreciation (depreciation) | $(19,516,602) |
| Tax Cost | $493,869,633 |
The tax-based components of distributable earnings as of period end were as follows:
| Undistributed ordinary income | $16,518,949 |
| Capital loss carryforward | $(19,187,581) |
| Net unrealized appreciation (depreciation) on securities and other investments | $19,525,638 |
Capital loss carryforwards are only available to offset future capital gains of the Fund to the extent provided by regulations and may be limited. Under the Regulated Investment Company Modernization Act of 2010 (the Act), the Fund is permitted to carry forward capital losses incurred in taxable years beginning after December 22, 2010 for an unlimited period and such capital losses are required to be used prior to any losses that expire. The capital loss carryforward information presented below, including any applicable limitation, is estimated as of fiscal period end and is subject to adjustment.
| No expiration | |
| Short-term | $(6,494,194) |
| Long-term | (12,693,387) |
| Total capital loss carryforward | $(19,187,581) |
The tax character of distributions paid was as follows:
| | October 31, 2019 | October 31, 2018 |
| Ordinary Income | $13,674,095 | $ 8,990,094 |
Restricted Securities. The Fund may invest in securities that are subject to legal or contractual restrictions on resale. These securities generally may be resold in transactions exempt from registration or to the public if the securities are registered. Disposal of these securities may involve time-consuming negotiations and expense, and prompt sale at an acceptable price may be difficult. Information regarding restricted securities is included at the end of the Fund's Schedule of Investments.
4. Purchases and Sales of Investments.
Purchases and sales of securities, other than short-term securities, aggregated $218,568,374 and $209,913,642, respectively.
5. Fees and Other Transactions with Affiliates.
Management Fee. Fidelity Management & Research Company (the investment adviser) and its affiliates provide the Fund with investment management related services for which the Fund pays a monthly management fee. The management fee is the sum of an individual fund fee rate that is based on an annual rate of .45% of the Fund's average net assets and an annualized group fee rate that averaged .24% during the period. The group fee rate is based upon the average net assets of all the mutual funds advised by the investment adviser, including any mutual funds previously advised by the investment adviser that are currently advised by Fidelity SelectCo, LLC, an affiliate of the investment adviser. The group fee rate decreases as assets under management increase and increases as assets under management decrease. In addition, the management fee is subject to a performance adjustment (up to a maximum of +/- .20% of the Fund's average net assets over a 36 month performance period). The upward or downward adjustment to the management fee is based on the relative investment performance of International Value as compared to its benchmark index, the MSCI EAFE Value Index, over the same 36 month performance period. For the reporting period, the total annual management fee rate, including the performance adjustment, was .52% of the Fund's average net assets. The performance adjustment included in the management fee rate may be higher or lower than the maximum performance adjustment rate due to the difference between the average net assets for the reporting and performance periods.
Distribution and Service Plan Fees. In accordance with Rule 12b-1 of the 1940 Act, the Fund has adopted separate Distribution and Service Plans for each class of shares. Certain classes pay Fidelity Distributors Corporation (FDC), an affiliate of the investment adviser, separate Distribution and Service Fees, each of which is based on an annual percentage of each class' average net assets. In addition, FDC may pay financial intermediaries for selling shares of the Fund and providing shareholder support services. For the period, the Distribution and Service Fee rates, total fees and amounts retained by FDC were as follows:
| | Distribution Fee | Service Fee | Total Fees | Retained by FDC |
| Class A | -% | .25% | $18,893 | $878 |
| Class M | .25% | .25% | 18,468 | 140 |
| Class C | .75% | .25% | 40,859 | 4,498 |
| | | | $78,220 | $5,516 |
Sales Load. FDC may receive a front-end sales charge of up to 5.75% for selling Class A shares and 3.50% for selling Class M shares, some of which is paid to financial intermediaries for selling shares of the Fund. Depending on the holding period, FDC may receive contingent deferred sales charges levied on Class A, Class M and Class C redemptions. The deferred sales charges are 1.00% for Class C shares, 1.00% for certain purchases of Class A shares and .25% for certain purchases of Class M shares.
For the period, sales charge amounts retained by FDC were as follows:
| | Retained by FDC |
| Class A | $3,532 |
| Class M | 725 |
| Class C(a) | 686 |
| | $4,943 |
(a) When Class C shares are initially sold, FDC pays commissions from its own resources to financial intermediaries through which the sales are made.
Transfer Agent Fees. Fidelity Investments Institutional Operations Company, Inc., (FIIOC), an affiliate of the investment adviser, is the transfer, dividend disbursing and shareholder servicing agent for each class of the Fund. FIIOC receives account fees and asset-based fees that vary according to the account size and type of account of the shareholders of the respective classes of the Fund, except for Class Z. FIIOC receives an asset-based fee of Class Z's average net assets. FIIOC pays for typesetting, printing and mailing of shareholder reports, except proxy statements.
For the period, transfer agent fees for each class were as follows:
| | Amount | % of Class-Level Average Net Assets |
| Class A | $19,841 | .26 |
| Class M | 11,561 | .31 |
| Class C | 12,194 | .30 |
| International Value | 706,564 | .16 |
| Class I | 19,210 | .24 |
| Class Z | 257 | .04 |
| | $769,627 | |
Accounting and Security Lending Fees. Fidelity Service Company, Inc. (FSC), an affiliate of the investment adviser, maintains the Fund's accounting records. The accounting fee is based on the level of average net assets for each month. Prior to April 1, 2019, FSC had a separate agreement with the Fund for administration of the security lending program, based on the number and duration of lending transactions. For the period, the total fees paid for accounting and administration of securities lending were equivalent to an annual rate of .05%.
Brokerage Commissions. The Fund placed a portion of its portfolio transactions with brokerage firms which are affiliates of the investment adviser. Brokerage commissions are included in net realized gain (loss) and change in net unrealized appreciation (depreciation) in the Statement of Operations. The commissions paid to these affiliated firms were $100 for the period.
Interfund Trades. The Fund may purchase from or sell securities to other Fidelity Funds under procedures adopted by the Board. The procedures have been designed to ensure these interfund trades are executed in accordance with Rule 17a-7 of the 1940 Act. Interfund trades are included within the respective purchases and sales amounts shown in the Purchases and Sales of Investments note.
6. Committed Line of Credit.
The Fund participates with other funds managed by the investment adviser or an affiliate in a $4.25 billion credit facility (the "line of credit") to be utilized for temporary or emergency purposes to fund shareholder redemptions or for other short-term liquidity purposes. The Fund has agreed to pay commitment fees on its pro-rata portion of the line of credit, which amounted to $1,207 and is reflected in Miscellaneous expenses on the Statement of Operations. During the period, the Fund did not borrow on this line of credit.
7. Security Lending.
The Fund lends portfolio securities from time to time in order to earn additional income. For equity securities, lending agents are used, including National Financial Services (NFS), an affiliate of the Fund. Pursuant to a securities lending agreement, NFS will receive a fee, which is capped at 9.9% of daily lending revenue, for its services as lending agent. The Fund may lend securities to certain qualified borrowers, including NFS. On the settlement date of the loan, the Fund receives collateral (in the form of U.S. Treasury obligations, letters of credit and/or cash) against the loaned securities and maintains collateral in an amount not less than 100% of the market value of the loaned securities during the period of the loan. The market value of the loaned securities is determined at the close of business of the Fund and any additional required collateral is delivered to the Fund on the next business day. The Fund or borrower may terminate the loan at any time, and if the borrower defaults on its obligation to return the securities loaned because of insolvency or other reasons, the Fund may apply collateral received from the borrower against the obligation. The Fund may experience delays and costs in recovering the securities loaned. Any cash collateral received is invested in the Fidelity Securities Lending Cash Central Fund. The value of loaned securities and cash collateral at period end are disclosed on the Fund's Statement of Assets and Liabilities. Security lending income represents the income earned on investing cash collateral, less rebates paid to borrowers and any lending agent fees associated with the loan, plus any premium payments received for lending certain types of securities. Security lending income is presented in the Statement of Operations as a component of income from Fidelity Central Funds. During the period, there were no securities loaned to NFS.
8. Expense Reductions.
Commissions paid to certain brokers with whom the investment adviser, or its affiliates, places trades on behalf of the Fund include an amount in addition to trade execution, which may be rebated back to the Fund to offset certain expenses. This amount totaled $35,575 for the period.
In addition, during the period the investment adviser reimbursed and/or waived a portion of fund-level operating expenses in the amount of $3,401 and a portion of class-level operating expenses as follows:
| | Amount |
| Class A | $260 |
| Class M | 131 |
| Class C | 158 |
| International Value | 15,161 |
| Class I | 285 |
| Class Z | 5 |
| | $16,000 |
9. Distributions to Shareholders.
Distributions to shareholders of each class were as follows:
| | Year ended
October 31, 2019 | Year ended
October 31, 2018 |
| Distributions to shareholders | | |
| Class A | $203,466 | $103,389 |
| Class M | 86,532 | 41,092 |
| Class C | 78,779 | 32,748 |
| International Value | 13,098,896 | 8,724,460 |
| Class I | 198,775 | 88,405 |
| Class Z | 7,647 | – |
| Total | $13,674,095 | $8,990,094 |
10. Share Transactions.
Share transactions for each class were as follows and may contain automatic conversions between classes or exchanges between affiliated funds:
| | Shares | Shares | Dollars | Dollars |
| | Year ended October 31, 2019 | Year ended October 31, 2018(a) | Year ended October 31, 2019 | Year ended October 31, 2018(a) |
| Class A | | | | |
| Shares sold | 218,117 | 286,375 | $1,710,090 | $2,567,358 |
| Reinvestment of distributions | 26,837 | 11,240 | 199,932 | 100,489 |
| Shares redeemed | (268,764) | (224,999) | (2,109,659) | (2,007,679) |
| Net increase (decrease) | (23,810) | 72,616 | $(199,637) | $660,168 |
| Class M | | | | |
| Shares sold | 80,208 | 84,749 | $628,608 | $765,119 |
| Reinvestment of distributions | 11,597 | 4,596 | 86,515 | 41,092 |
| Shares redeemed | (119,055) | (67,389) | (939,737) | (604,451) |
| Net increase (decrease) | (27,250) | 21,956 | $(224,614) | $201,760 |
| Class C | | | | |
| Shares sold | 71,027 | 224,225 | $560,721 | $2,034,976 |
| Reinvestment of distributions | 10,495 | 3,587 | 78,501 | 32,067 |
| Shares redeemed | (275,427) | (139,088) | (2,176,151) | (1,223,224) |
| Net increase (decrease) | (193,905) | 88,724 | $(1,536,929) | $843,819 |
| International Value | | | | |
| Shares sold | 7,795,183 | 22,242,584 | $61,080,526 | $201,187,963 |
| Reinvestment of distributions | 901,853 | 477,419 | 6,700,770 | 4,258,580 |
| Shares redeemed | (8,255,695) | (9,065,603) | (64,565,958) | (81,505,210) |
| Net increase (decrease) | 441,341 | 13,654,400 | $3,215,338 | $123,941,333 |
| Class I | | | | |
| Shares sold | 632,568 | 519,858 | $4,879,197 | $4,669,763 |
| Reinvestment of distributions | 24,905 | 9,287 | 185,542 | 82,930 |
| Shares redeemed | (461,351) | (303,812) | (3,618,354) | (2,687,966) |
| Net increase (decrease) | 196,122 | 225,333 | $1,446,385 | $2,064,727 |
| Class Z | | | | |
| Shares sold | 292,569 | 11,351 | $2,235,643 | $100,000 |
| Reinvestment of distributions | 1,029 | – | 7,647 | – |
| Shares redeemed | (32,507) | – | (250,757) | – |
| Net increase (decrease) | 261,091 | 11,351 | $1,992,533 | $100,000 |
(a) Share transactions for Class Z are for the period October 2, 2018 (commencement of sale of shares) to October 31, 2018.
11. Other.
The Fund's organizational documents provide former and current trustees and officers with a limited indemnification against liabilities arising in connection with the performance of their duties to the Fund. In the normal course of business, the Fund may also enter into contracts that provide general indemnifications. The Fund's maximum exposure under these arrangements is unknown as this would be dependent on future claims that may be made against the Fund. The risk of material loss from such claims is considered remote.
At the end of the period, VIP FundsManager 50% Portfolio, VIP FundsManager 60% Portfolio and Strategic Advisers Fidelity International Fund, were the owners of record of approximately 10%, 13% and 45%, respectively, of the total outstanding shares of the Fund. Mutual funds managed by the investment adviser or its affiliates were the owners of record, in the aggregate, of approximately 76% of the total outstanding shares of the Fund.
Report of Independent Registered Public Accounting Firm
To the Trustees of Fidelity Investment Trust and Shareholders of Fidelity International Value Fund:
Opinion on the Financial Statements and Financial Highlights
We have audited the accompanying statement of assets and liabilities of Fidelity International Value Fund (the "Fund"), a fund of Fidelity Investment Trust, including the schedule of investments, as of October 31, 2019, the related statement of operations for the year then ended, the statement of changes in net assets for each of the two years in the period then ended, the financial highlights for each of the five years in the period then ended, and the related notes. In our opinion, the financial statements and financial highlights present fairly, in all material respects, the financial position of the Fund as of October 31, 2019, and the results of its operations for the year then ended, the changes in its net assets for each of the two years in the period then ended, and the financial highlights for each of the five years in the period then ended in conformity with accounting principles generally accepted in the United States of America.
Basis for Opinion
We have audited the accompanying statement of assets and liabilities of Fidelity International Value Fund (the "Fund"), a fund of Fidelity Investment Trust, including the schedule of investments, as of October 31, 2019, the related statement of operations for the year then ended, the statement of changes in net assets for each of the two years in the period then ended, the financial highlights for each of the five years in the period then ended, and the related notes. In our opinion, the financial statements and financial highlights present fairly, in all material respects, the financial position of the Fund as of October 31, 2019, and the results of its operations for the year then ended, the changes in its net assets for each of the two years in the period then ended, and the financial highlights for each of the five years in the period then ended in conformity with accounting principles generally accepted in the United States of America.
We conducted our audits in accordance with the standards of the PCAOB. Those standards require that we plan and perform the audit to obtain reasonable assurance about whether the financial statements and financial highlights are free of material misstatement, whether due to error or fraud. The Fund is not required to have, nor were we engaged to perform, an audit of its internal control over financial reporting. As part of our audits we are required to obtain an understanding of internal control over financial reporting but not for the purpose of expressing an opinion on the effectiveness of the Fund’s internal control over financial reporting. Accordingly, we express no such opinion.
Our audits included performing procedures to assess the risks of material misstatement of the financial statements and financial highlights, whether due to error or fraud, and performing procedures that respond to those risks. Such procedures included examining, on a test basis, evidence regarding the amounts and disclosures in the financial statements and financial highlights. Our audits also included evaluating the accounting principles used and significant estimates made by management, as well as evaluating the overall presentation of the financial statements and financial highlights. Our procedures included confirmation of securities owned as of October 31, 2019, by correspondence with the custodians and brokers; when replies were not received from brokers, we performed other auditing procedures. We believe that our audits provide a reasonable basis for our opinion.
/s/ Deloitte & Touche LLP
Boston, Massachusetts
December 11, 2019
We have served as the auditor of one or more of the Fidelity investment companies since 1999.
Trustees and Officers
The Trustees, Members of the Advisory Board (if any), and officers of the trust and fund, as applicable, are listed below. The Board of Trustees governs the fund and is responsible for protecting the interests of shareholders. The Trustees are experienced executives who meet periodically throughout the year to oversee the fund's activities, review contractual arrangements with companies that provide services to the fund, oversee management of the risks associated with such activities and contractual arrangements, and review the fund's performance. Except for Jonathan Chiel, each of the Trustees oversees 298 funds. Mr. Chiel oversees 171 funds.
The Trustees hold office without limit in time except that (a) any Trustee may resign; (b) any Trustee may be removed by written instrument, signed by at least two-thirds of the number of Trustees prior to such removal; (c) any Trustee who requests to be retired or who has become incapacitated by illness or injury may be retired by written instrument signed by a majority of the other Trustees; and (d) any Trustee may be removed at any special meeting of shareholders by a two-thirds vote of the outstanding voting securities of the trust. Each Trustee who is not an interested person (as defined in the 1940 Act) of the trust and the fund is referred to herein as an Independent Trustee. Each Independent Trustee shall retire not later than the last day of the calendar year in which his or her 75th birthday occurs. The Independent Trustees may waive this mandatory retirement age policy with respect to individual Trustees. Officers and Advisory Board Members hold office without limit in time, except that any officer or Advisory Board Member may resign or may be removed by a vote of a majority of the Trustees at any regular meeting or any special meeting of the Trustees. Except as indicated, each individual has held the office shown or other offices in the same company for the past five years.
The fund's Statement of Additional Information (SAI) includes more information about the Trustees. To request a free copy, call Fidelity at 1-800-544-8544 if you’re an individual investing directly with Fidelity, call 1-800-835-5092 if you’re a plan sponsor or participant with Fidelity as your recordkeeper or call 1-877-208-0098 on institutional accounts or if you’re an advisor or invest through one.
Experience, Skills, Attributes, and Qualifications of the Trustees. The Governance and Nominating Committee has adopted a statement of policy that describes the experience, qualifications, attributes, and skills that are necessary and desirable for potential Independent Trustee candidates (Statement of Policy). The Board believes that each Trustee satisfied at the time he or she was initially elected or appointed a Trustee, and continues to satisfy, the standards contemplated by the Statement of Policy. The Governance and Nominating Committee also engages professional search firms to help identify potential Independent Trustee candidates who have the experience, qualifications, attributes, and skills consistent with the Statement of Policy. From time to time, additional criteria based on the composition and skills of the current Independent Trustees, as well as experience or skills that may be appropriate in light of future changes to board composition, business conditions, and regulatory or other developments, have also been considered by the professional search firms and the Governance and Nominating Committee. In addition, the Board takes into account the Trustees' commitment and participation in Board and committee meetings, as well as their leadership of standing and ad hoc committees throughout their tenure.
In determining that a particular Trustee was and continues to be qualified to serve as a Trustee, the Board has considered a variety of criteria, none of which, in isolation, was controlling. The Board believes that, collectively, the Trustees have balanced and diverse experience, qualifications, attributes, and skills, which allow the Board to operate effectively in governing the fund and protecting the interests of shareholders. Information about the specific experience, skills, attributes, and qualifications of each Trustee, which in each case led to the Board's conclusion that the Trustee should serve (or continue to serve) as a trustee of the fund, is provided below.
Board Structure and Oversight Function. James C. Curvey is an interested person and currently serves as Chairman. The Trustees have determined that an interested Chairman is appropriate and benefits shareholders because an interested Chairman has a personal and professional stake in the quality and continuity of services provided to the fund. Independent Trustees exercise their informed business judgment to appoint an individual of their choosing to serve as Chairman, regardless of whether the Trustee happens to be independent or a member of management. The Independent Trustees have determined that they can act independently and effectively without having an Independent Trustee serve as Chairman and that a key structural component for assuring that they are in a position to do so is for the Independent Trustees to constitute a substantial majority for the Board. The Independent Trustees also regularly meet in executive session. Ned C. Lautenbach serves as Chairman of the Independent Trustees and as such (i) acts as a liaison between the Independent Trustees and management with respect to matters important to the Independent Trustees and (ii) with management prepares agendas for Board meetings.
Fidelity® funds are overseen by different Boards of Trustees. The fund's Board oversees Fidelity's high income and certain equity funds, and other Boards oversee Fidelity's investment-grade bond, money market, asset allocation, and other equity funds. The asset allocation funds may invest in Fidelity® funds overseen by the fund's Board. The use of separate Boards, each with its own committee structure, allows the Trustees of each group of Fidelity® funds to focus on the unique issues of the funds they oversee, including common research, investment, and operational issues. On occasion, the separate Boards establish joint committees to address issues of overlapping consequences for the Fidelity® funds overseen by each Board.
The Trustees operate using a system of committees to facilitate the timely and efficient consideration of all matters of importance to the Trustees, the fund, and fund shareholders and to facilitate compliance with legal and regulatory requirements and oversight of the fund's activities and associated risks. The Board, acting through its committees, has charged FMR and its affiliates with (i) identifying events or circumstances the occurrence of which could have demonstrably adverse effects on the fund's business and/or reputation; (ii) implementing processes and controls to lessen the possibility that such events or circumstances occur or to mitigate the effects of such events or circumstances if they do occur; and (iii) creating and maintaining a system designed to evaluate continuously business and market conditions in order to facilitate the identification and implementation processes described in (i) and (ii) above. Because the day-to-day operations and activities of the fund are carried out by or through FMR, its affiliates, and other service providers, the fund's exposure to risks is mitigated but not eliminated by the processes overseen by the Trustees. While each of the Board's committees has responsibility for overseeing different aspects of the fund's activities, oversight is exercised primarily through the Operations, Audit, and Compliance Committees. Appropriate personnel, including but not limited to the fund's Chief Compliance Officer (CCO), FMR's internal auditor, the independent accountants, the fund's Treasurer and portfolio management personnel, make periodic reports to the Board's committees, as appropriate, including an annual review of Fidelity's risk management program for the Fidelity® funds. The responsibilities of each standing committee, including their oversight responsibilities, are described further under "Standing Committees of the Trustees."
Interested Trustees*:
Correspondence intended for a Trustee who is an interested person may be sent to Fidelity Investments, 245 Summer Street, Boston, Massachusetts 02210.
Name, Year of Birth; Principal Occupations and Other Relevant Experience+
Jonathan Chiel (1957)
Year of Election or Appointment: 2016
Trustee
Mr. Chiel also serves as Trustee of other Fidelity® funds. Mr. Chiel is Executive Vice President and General Counsel for FMR LLC (diversified financial services company, 2012-present). Previously, Mr. Chiel served as general counsel (2004-2012) and senior vice president and deputy general counsel (2000-2004) for John Hancock Financial Services; a partner with Choate, Hall & Stewart (1996-2000) (law firm); and an Assistant United States Attorney for the United States Attorney’s Office of the District of Massachusetts (1986-95), including Chief of the Criminal Division (1993-1995). Mr. Chiel is a director on the boards of the Boston Bar Foundation and the Maimonides School.
James C. Curvey (1935)
Year of Election or Appointment: 2007
Trustee
Chairman of the Board of Trustees
Mr. Curvey also serves as Trustee of other Fidelity® funds. Mr. Curvey is Vice Chairman (2007-present) and Director of FMR LLC (diversified financial services company). In addition, Mr. Curvey is an Overseer Emeritus for the Boston Symphony Orchestra, a Director of Artis-Naples, and a Trustee of Brewster Academy in Wolfeboro, New Hampshire. Previously, Mr. Curvey served as a Director of Fidelity Research & Analysis Co. (investment adviser firm, 2009-2018), Director of Fidelity Investments Money Management, Inc. (investment adviser firm, 2009-2014) and a Director of FMR and FMR Co., Inc. (investment adviser firms, 2007-2014).
* Determined to be an “Interested Trustee” by virtue of, among other things, his or her affiliation with the trust or various entities under common control with FMR.
+ The information includes the Trustee's principal occupation during the last five years and other information relating to the experience, attributes, and skills relevant to the Trustee's qualifications to serve as a Trustee, which led to the conclusion that the Trustee should serve as a Trustee for the fund.
Independent Trustees:
Correspondence intended for an Independent Trustee may be sent to Fidelity Investments, P.O. Box 55235, Boston, Massachusetts 02205-5235.
Name, Year of Birth; Principal Occupations and Other Relevant Experience+
Dennis J. Dirks (1948)
Year of Election or Appointment: 2005
Trustee
Mr. Dirks also serves as Trustee of other Fidelity® funds. Prior to his retirement in May 2003, Mr. Dirks was Chief Operating Officer and a member of the Board of The Depository Trust & Clearing Corporation (DTCC). He also served as President, Chief Operating Officer, and Board member of The Depository Trust Company (DTC) and President and Board member of the National Securities Clearing Corporation (NSCC). In addition, Mr. Dirks served as Chief Executive Officer and Board member of the Government Securities Clearing Corporation, Chief Executive Officer and Board member of the Mortgage-Backed Securities Clearing Corporation, as a Trustee and a member of the Finance Committee of Manhattan College (2005-2008), as a Trustee and a member of the Finance Committee of AHRC of Nassau County (2006-2008), as a member of the Independent Directors Council (IDC) Governing Council (2010-2015), and as a member of the Board of Directors for The Brookville Center for Children’s Services, Inc. (2009-2017). Mr. Dirks is a member of the Finance Committee (2016-present) and Board of Directors (2017-present) and is Treasurer (2018-present) of the Asolo Repertory Theatre.
Donald F. Donahue (1950)
Year of Election or Appointment: 2018
Trustee
Mr. Donahue also serves as a Trustee of other Fidelity® funds. Mr. Donahue is President and Chief Executive Officer of Miranda Partners, LLC (risk consulting for the financial services industry, 2012-present). Previously, Mr. Donahue served as a Member of the Advisory Board of certain Fidelity® funds (2015-2018) and Chief Executive Officer (2006-2012), Chief Operating Officer (2003-2006), and Managing Director, Customer Marketing and Development (1999-2003) of The Depository Trust & Clearing Corporation (financial markets infrastructure). Mr. Donahue serves as a Member (2007-present) and Co-Chairman (2016-present) of the Board of Directors of United Way of New York, Member of the Board of Directors of NYC Leadership Academy (2012-present) and Member of the Board of Advisors of Ripple Labs, Inc. (financial services, 2015-present). He also served as Chairman (2010-2012) and Member of the Board of Directors (2012-2013) of Omgeo, LLC (financial services), Treasurer of United Way of New York (2012-2016), and Member of the Board of Directors of XBRL US (financial services non-profit, 2009-2012) and the International Securities Services Association (2009-2012).
Alan J. Lacy (1953)
Year of Election or Appointment: 2008
Trustee
Mr. Lacy also serves as Trustee of other Fidelity® funds. Mr. Lacy serves as a Director of Bristol-Myers Squibb Company (global pharmaceuticals, 2008-present). He is a Trustee of the California Chapter of The Nature Conservancy (2015-present) and a Director of the Center for Advanced Study in the Behavioral Sciences at Stanford University (2015-present). In addition, Mr. Lacy served as Senior Adviser (2007-2014) of Oak Hill Capital Partners, L.P. (private equity) and also served as Chief Executive Officer (2005) and Vice Chairman (2005-2006) of Sears Holdings Corporation (retail) and Chief Executive Officer and Chairman of the Board of Sears, Roebuck and Co. (retail, 2000-2005). Previously, Mr. Lacy served as Chairman (2014-2017) and a member (2010-2017) of the Board of Directors of Dave & Buster’s Entertainment, Inc. (restaurant and entertainment complexes), as Chairman (2008-2011) and a member (2006-2015) of the Board of Trustees of the National Parks Conservation Association, and as a member of the Board of Directors for The Hillman Companies, Inc. (hardware wholesalers, 2010-2014), Earth Fare, Inc. (retail grocery, 2010-2014), and The Western Union Company (global money transfer, 2006-2011).
Ned C. Lautenbach (1944)
Year of Election or Appointment: 2000
Trustee
Chairman of the Independent Trustees
Mr. Lautenbach also serves as Trustee of other Fidelity® funds. Mr. Lautenbach currently serves as Chair (2018-present) and Member (2013-present) of the Board of Governors, State University System of Florida and is a member of the Council on Foreign Relations (1994-present). He is also a member and has most recently served as Chairman of the Board of Directors of Artis-Naples (2012-present). Previously, Mr. Lautenbach served as a member and then Lead Director of the Board of Directors of Eaton Corporation (diversified industrial, 1997-2016). He was also a Partner and Advisory Partner at Clayton, Dubilier & Rice, LLC (private equity investment, 1998-2010), as well as a Director of Sony Corporation (2006-2007). In addition, Mr. Lautenbach also had a 30-year career with IBM (technology company) during which time he served as Senior Vice President and a member of the Corporate Executive Committee (1968-1998).
Joseph Mauriello (1944)
Year of Election or Appointment: 2008
Trustee
Mr. Mauriello also serves as Trustee of other Fidelity® funds. Prior to his retirement in January 2006, Mr. Mauriello served in numerous senior management positions including Deputy Chairman and Chief Operating Officer (2004-2005), and Vice Chairman of Financial Services (2002-2004) of KPMG LLP US (professional services, 1965-2005). Mr. Mauriello currently serves as a member of the Independent Directors Council (IDC) Governing Council (2015-present). Previously, Mr. Mauriello served as a member of the Board of Directors of XL Group plc. (global insurance and re-insurance, 2006-2018).
Cornelia M. Small (1944)
Year of Election or Appointment: 2005
Trustee
Ms. Small also serves as Trustee of other Fidelity® funds. Ms. Small is a member of the Board of Directors (2009-present) and Chair of the Investment Committee (2010-present) of the Teagle Foundation. Ms. Small also serves on the Investment Committee of the Berkshire Taconic Community Foundation (2008-present). Previously, Ms. Small served as Chairperson (2002-2008) and a member of the Investment Committee and Chairperson (2008-2012) and a member of the Board of Trustees of Smith College. In addition, Ms. Small served as Chief Investment Officer, Director of Global Equity Investments, and a member of the Board of Directors of Scudder, Stevens & Clark and Scudder Kemper Investments.
Garnett A. Smith (1947)
Year of Election or Appointment: 2018
Trustee
Mr. Smith also serves as Trustee of other Fidelity® funds. Prior to Mr. Smith's retirement, he served as Chairman and Chief Executive Officer of Inbrand Corp. (manufacturer of personal absorbent products, 1990-1997). He also served as President (1986-1990) of Inbrand Corp. Prior to his employment with Inbrand Corp., he was employed by a retail fabric chain and North Carolina National Bank. In addition, Mr. Smith served as a Member of the Advisory Board of certain Fidelity® funds (2012-2013) and as a board member of the Jackson Hole Land Trust (2009-2012).
David M. Thomas (1949)
Year of Election or Appointment: 2008
Trustee
Mr. Thomas also serves as Trustee of other Fidelity® funds. Mr. Thomas serves as Non-Executive Chairman of the Board of Directors of Fortune Brands Home and Security (home and security products, 2011-present) and as a member of the Board of Directors (2004-present) and Presiding Director (2013-present) of Interpublic Group of Companies, Inc. (marketing communication). Previously, Mr. Thomas served as Executive Chairman (2005-2006) and Chairman and Chief Executive Officer (2000-2005) of IMS Health, Inc. (pharmaceutical and healthcare information solutions), a Director of Fortune Brands, Inc. (consumer products, 2000-2011), and a member of the Board of Trustees of the University of Florida (2013-2018).
+ The information includes the Trustee's principal occupation during the last five years and other information relating to the experience, attributes, and skills relevant to the Trustee's qualifications to serve as a Trustee, which led to the conclusion that the Trustee should serve as a Trustee for the fund.
Advisory Board Members and Officers:
Correspondence intended for a Member of the Advisory Board (if any) may be sent to Fidelity Investments, P.O. Box 55235, Boston, Massachusetts 02205-5235. Correspondence intended for an officer or Peter S. Lynch may be sent to Fidelity Investments, 245 Summer Street, Boston, Massachusetts 02210. Officers appear below in alphabetical order.
Name, Year of Birth; Principal Occupation
Vicki L. Fuller (1957)
Year of Election or Appointment: 2018
Member of the Advisory Board
Ms. Fuller also serves as Member of the Advisory Board of other Fidelity® funds. Ms. Fuller serves as a member of the Board of Directors, Audit Committee, and Nominating and Governance Committee of The Williams Companies, Inc. (natural gas infrastructure, 2018-present). Previously, Ms. Fuller served as the Chief Investment Officer of the New York State Common Retirement Fund (2012-2018) and held a variety of positions at AllianceBernstein L.P. (global asset management, 1985-2012), including Managing Director (2006-2012) and Senior Vice President and Senior Portfolio Manager (2001-2006).
Peter S. Lynch (1944)
Year of Election or Appointment: 2003
Member of the Advisory Board
Mr. Lynch also serves as Member of the Advisory Board of other Fidelity® funds. Mr. Lynch is Vice Chairman and a Director of FMR (investment adviser firm) and FMR Co., Inc. (investment adviser firm). In addition, Mr. Lynch serves as a Trustee of Boston College and as the Chairman of the Inner-City Scholarship Fund. Previously, Mr. Lynch served on the Special Olympics International Board of Directors (1997-2006).
Michael E. Wiley (1950)
Year of Election or Appointment: 2018
Member of the Advisory Board
Mr. Wiley also serves as Trustee or Member of the Advisory Board of other Fidelity® funds. Mr. Wiley serves as a Director of High Point Resources (exploration and production, 2005-present). Previously, Mr. Wiley served as a Director of Andeavor Corporation (independent oil refiner and marketer, 2005-2018), a Director of Andeavor Logistics LP (natural resources logistics, 2015-2018), a Director of Post Oak Bank (privately-held bank, 2004-2018), a Director of Asia Pacific Exploration Consolidated (international oil and gas exploration and production, 2008-2013), a member of the Board of Trustees of the University of Tulsa (2000-2006; 2007-2010), a Senior Energy Advisor of Katzenbach Partners, LLC (consulting, 2006-2007), an Advisory Director of Riverstone Holdings (private investment), a Director of Spinnaker Exploration Company (exploration and production, 2001-2005) and Chairman, President, and CEO of Baker Hughes, Inc. (oilfield services, 2000-2004).
Elizabeth Paige Baumann (1968)
Year of Election or Appointment: 2017
Anti-Money Laundering (AML) Officer
Ms. Baumann also serves as AML Officer of other funds. She is Chief AML Officer (2012-present) and Senior Vice President (2014-present) of FMR LLC (diversified financial services company) and is an employee of Fidelity Investments. Previously, Ms. Baumann served as AML Officer of the funds (2012-2016), and Vice President (2007-2014) and Deputy Anti-Money Laundering Officer (2007-2012) of FMR LLC.
Craig S. Brown (1977)
Year of Election or Appointment: 2019
Assistant Treasurer
Mr. Brown also serves as Assistant Treasurer of other funds. Mr. Brown is an employee of Fidelity Investments (2013-present).
John J. Burke III (1964)
Year of Election or Appointment: 2018
Chief Financial Officer
Mr. Burke also serves as Chief Financial Officer of other funds. Mr. Burke serves as Head of Investment Operations for Fidelity Fund and Investment Operations (2018-present) and is an employee of Fidelity Investments (1998-present). Previously Mr. Burke served as head of Asset Management Investment Operations (2012-2018).
William C. Coffey (1969)
Year of Election or Appointment: 2019
Assistant Secretary
Mr. Coffey also serves as Assistant Secretary of other funds. He is Senior Vice President and Deputy General Counsel of FMR LLC (diversified financial services company, 2010-present), and is an employee of Fidelity Investments. Previously, Mr. Coffey served as Secretary and CLO of certain funds (2018-2019); CLO, Secretary, and Senior Vice President of Fidelity Management & Research Company and FMR Co., Inc. (investment adviser firms, 2018-2019); Secretary of Fidelity SelectCo, LLC and Fidelity Investments Money Management, Inc. (investment adviser firms, 2018-2019); CLO of Fidelity Management & Research (Hong Kong) Limited, FMR Investment Management (UK) Limited, and Fidelity Management & Research (Japan) Limited (investment adviser firms, 2018-2019); and Assistant Secretary of certain funds (2009-2018).
Timothy M. Cohen (1969)
Year of Election or Appointment: 2018
Vice President
Mr. Cohen also serves as Vice President of other funds. Mr. Cohen serves as Executive Vice President of Fidelity SelectCo, LLC (2019-present), Co-Head of Equity (2018-present), a Director of Fidelity Management & Research (Japan) Limited (investment adviser firm, 2016-present), and is an employee of Fidelity Investments. Previously, Mr. Cohen served as Head of Global Equity Research (2016-2018), Chief Investment Officer - Equity and a Director of Fidelity Management & Research (U.K.) Inc. (investment adviser firm, 2013-2015) and as a Director of Fidelity Management & Research (Hong Kong) Limited (investment adviser firm, 2017).
Jonathan Davis (1968)
Year of Election or Appointment: 2010
Assistant Treasurer
Mr. Davis also serves as Assistant Treasurer of other funds. Mr. Davis serves as Assistant Treasurer of FMR Capital, Inc. (2017-present) and is an employee of Fidelity Investments. Previously, Mr. Davis served as Vice President and Associate General Counsel of FMR LLC (diversified financial services company, 2003-2010).
Adrien E. Deberghes (1967)
Year of Election or Appointment: 2016
Assistant Treasurer
Mr. Deberghes also serves as an officer of other funds. He serves as Assistant Treasurer of FMR Capital, Inc. (2017-present), Executive Vice President of Fidelity Investments Money Management, Inc. (FIMM) (investment adviser firm, 2016-present), and is an employee of Fidelity Investments (2008-present). Previously, Mr. Deberghes served as President and Treasurer of certain Fidelity® funds (2013-2018). Prior to joining Fidelity Investments, Mr. Deberghes was Senior Vice President of Mutual Fund Administration at State Street Corporation (2007-2008), Senior Director of Mutual Fund Administration at Investors Bank & Trust (2005-2007), and Director of Finance for Dunkin' Brands (2000-2005). Previously, Mr. Deberghes served in other fund officer roles.
Laura M. Del Prato (1964)
Year of Election or Appointment: 2018
Assistant Treasurer
Ms. Del Prato also serves as an officer of other funds. Ms. Del Prato is an employee of Fidelity Investments (2017-present). Prior to joining Fidelity Investments, Ms. Del Prato served as a Managing Director and Treasurer of the JPMorgan Mutual Funds (2014-2017). Prior to JPMorgan, Ms. Del Prato served as a partner at Cohen Fund Audit Services (accounting firm, 2012-2013) and KPMG LLP (accounting firm, 2004-2012).
Colm A. Hogan (1973)
Year of Election or Appointment: 2016
Deputy Treasurer
Mr. Hogan also serves as an officer of other funds. Mr. Hogan serves as Assistant Treasurer of FMR Capital, Inc. (2017-present) and is an employee of Fidelity Investments (2005-present). Previously, Mr. Hogan served as Assistant Treasurer of certain Fidelity® funds (2016-2018).
Pamela R. Holding (1964)
Year of Election or Appointment: 2018
Vice President
Ms. Holding also serves as Vice President of other funds. Ms. Holding serves as Executive Vice President of Fidelity SelectCo, LLC (2019-present), Co-Head of Equity (2018-present) and is an employee of Fidelity Investments (2013-present). Previously, Ms. Holding served as Chief Investment Officer of Fidelity Institutional Asset Management (2013-2018).
Cynthia Lo Bessette (1969)
Year of Election or Appointment: 2019
Secretary and Chief Legal Officer (CLO)
Ms. Lo Bessette also serves as Secretary and CLO of other funds. Ms. Lo Bessette serves as CLO, Secretary, and Senior Vice President of Fidelity Management & Research Company and FMR Co., Inc. (investment adviser firms, 2019-present); Secretary of Fidelity SelectCo, LLC and Fidelity Investments Money Management, Inc. (investment adviser firms, 2019-present); and CLO of Fidelity Management & Research (Hong Kong) Limited, FMR Investment Management (UK) Limited, and Fidelity Management & Research (Japan) Limited (investment adviser firms, 2019-present). She is a Senior Vice President and Deputy General Counsel of FMR LLC (diversified financial services company, 2019-present), and is an employee of Fidelity Investments. Previously, Ms. Lo Bessette served as Executive Vice President, General Counsel (2016-2019) and Senior Vice President, Deputy General Counsel (2015-2016) of OppenheimerFunds (investment management company) and Deputy Chief Legal Officer (2013-2015) of Jennison Associates LLC (investment adviser firm).
Chris Maher (1972)
Year of Election or Appointment: 2013
Assistant Treasurer
Mr. Maher serves as Assistant Treasurer of other funds. Mr. Maher is Vice President of Valuation Oversight, serves as Assistant Treasurer of FMR Capital, Inc. (2017-present), and is an employee of Fidelity Investments. Previously, Mr. Maher served as Vice President of Asset Management Compliance (2013), Vice President of the Program Management Group of FMR (investment adviser firm, 2010-2013), and Vice President of Valuation Oversight (2008-2010).
Kenneth B. Robins (1969)
Year of Election or Appointment: 2016
Chief Compliance Officer
Mr. Robins also serves as an officer of other funds. Mr. Robins serves as Compliance Officer of Fidelity Management & Research Company and FMR Co., Inc. (investment adviser firms, 2016-present) and is an employee of Fidelity Investments (2004-present). Previously, Mr. Robins served as Executive Vice President of Fidelity Investments Money Management, Inc. (investment adviser firm, 2013-2016) and served in other fund officer roles.
Stacie M. Smith (1974)
Year of Election or Appointment: 2016
President and Treasurer
Ms. Smith also serves as an officer of other funds. Ms. Smith serves as Assistant Treasurer of FMR Capital, Inc. (2017-present), is an employee of Fidelity Investments (2009-present), and has served in other fund officer roles. Prior to joining Fidelity Investments, Ms. Smith served as Senior Audit Manager of Ernst & Young LLP (accounting firm, 1996-2009). Previously, Ms. Smith served as Assistant Treasurer (2013-2018) and Deputy Treasurer (2013-2016) of certain Fidelity® funds.
Marc L. Spector (1972)
Year of Election or Appointment: 2016
Assistant Treasurer
Mr. Spector also serves as an officer of other funds. Mr. Spector serves as Assistant Treasurer of FMR Capital, Inc. (2017-present) and is an employee of Fidelity Investments (2016-present). Prior to joining Fidelity Investments, Mr. Spector served as Director at the Siegfried Group (accounting firm, 2013-2016), and prior to Siegfried Group as audit senior manager at Deloitte & Touche (accounting firm, 2005-2013).
Jim Wegmann (1979)
Year of Election or Appointment: 2019
Assistant Treasurer
Mr. Wegmann also serves as Assistant Treasurer of other funds. Mr. Wegmann is an employee of Fidelity Investments (2011-present).
Shareholder Expense Example
As a shareholder of the Fund, you incur two types of costs: (1) transaction costs, including sales charges (loads) on purchase payments or redemption proceeds, and (2) ongoing costs, including management fees, distribution and/or service (12b-1) fees and other Fund expenses. This Example is intended to help you understand your ongoing costs (in dollars) of investing in the Fund and to compare these costs with the ongoing costs of investing in other mutual funds.
The Example is based on an investment of $1,000 invested at the beginning of the period and held for the entire period (May 1, 2019 to October 31, 2019).
Actual Expenses
The first line of the accompanying table for each class of the Fund provides information about actual account values and actual expenses. You may use the information in this line, together with the amount you invested, to estimate the expenses that you paid over the period. Simply divide your account value by $1,000.00 (for example, an $8,600 account value divided by $1,000.00 = 8.6), then multiply the result by the number in the first line for a class of the Fund under the heading entitled "Expenses Paid During Period" to estimate the expenses you paid on your account during this period. In addition, the Fund, as a shareholder in the underlying Fidelity Central Funds, will indirectly bear its pro-rata share of the fees and expenses incurred by the underlying Fidelity Central Funds. These fees and expenses are not included in the Fund's annualized expense ratio used to calculate the expense estimate in the table below.
Hypothetical Example for Comparison Purposes
The second line of the accompanying table for each class of the Fund provides information about hypothetical account values and hypothetical expenses based on a Class' actual expense ratio and an assumed rate of return of 5% per year before expenses, which is not the Class' actual return. The hypothetical account values and expenses may not be used to estimate the actual ending account balance or expenses you paid for the period. You may use this information to compare the ongoing costs of investing in the Fund and other funds. To do so, compare this 5% hypothetical example with the 5% hypothetical examples that appear in the shareholder reports of the other funds. In addition, the Fund, as a shareholder in the underlying Fidelity Central Funds, will indirectly bear its pro-rata share of the fees and expenses incurred by the underlying Fidelity Central Funds. These fees and expenses are not included in the Fund's annualized expense ratio used to calculate the expense estimate in the table below.
Please note that the expenses shown in the table are meant to highlight your ongoing costs only and do not reflect any transaction costs. Therefore, the second line of the table is useful in comparing ongoing costs only, and will not help you determine the relative total costs of owning different funds. In addition, if these transactional costs were included, your costs would have been higher.
| | Annualized Expense Ratio-A | Beginning
Account Value
May 1, 2019 | Ending
Account Value
October 31, 2019 | Expenses Paid
During Period-B
May 1, 2019
to October 31, 2019 |
| Class A | 1.13% | | | |
| Actual | | $1,000.00 | $1,013.50 | $5.73 |
| Hypothetical-C | | $1,000.00 | $1,019.51 | $5.75 |
| Class M | 1.42% | | | |
| Actual | | $1,000.00 | $1,012.30 | $7.20 |
| Hypothetical-C | | $1,000.00 | $1,018.05 | $7.22 |
| Class C | 1.89% | | | |
| Actual | | $1,000.00 | $1,009.80 | $9.57 |
| Hypothetical-C | | $1,000.00 | $1,015.68 | $9.60 |
| International Value | .77% | | | |
| Actual | | $1,000.00 | $1,014.80 | $3.91 |
| Hypothetical-C | | $1,000.00 | $1,021.32 | $3.92 |
| Class I | .84% | | | |
| Actual | | $1,000.00 | $1,014.70 | $4.27 |
| Hypothetical-C | | $1,000.00 | $1,020.97 | $4.28 |
| Class Z | .68% | | | |
| Actual | | $1,000.00 | $1,014.80 | $3.45 |
| Hypothetical-C | | $1,000.00 | $1,021.78 | $3.47 |
A Annualized expense ratio reflects expenses net of applicable fee waivers.
B Expenses are equal to each Class' annualized expense ratio, multiplied by the average account value over the period, multiplied by 184/365 (to reflect the one-half year period).
C 5% return per year before expenses
Distributions (Unaudited)
The Board of Trustees of Fidelity International Value Fund voted to pay to shareholders of record at the opening of business on record date, the following distributions per share derived from capital gains realized from sales of portfolio securities, and dividends derived from net investment income:
| | Pay Date | Record Date | Dividends | Capital Gains |
| Fidelity International Value Fund | | | | |
| Class A | 12/09/2019 | 12/06/2019 | $0.237 | $0.029 |
| Class M | 12/09/2019 | 12/06/2019 | $0.212 | $0.029 |
| Class C | 12/09/2019 | 12/06/2019 | $0.167 | $0.029 |
| International Value Fund | 12/09/2019 | 12/06/2019 | $0.266 | $0.029 |
| Class I | 12/09/2019 | 12/06/2019 | $0.260 | $0.029 |
| Class Z | 12/09/2019 | 12/06/2019 | $0.278 | $0.029 |
Class A designates 1%, Class M designates 2%, Class C designates 2%, International Value designates 1%, and Class I designates 1%, Class Z designates 1% of the dividends distributed during the fiscal year as qualifying for the dividends–received deduction for corporate shareholders.
The fund designates 100% of the dividends distributed during the fiscal year as amounts which may be taken into account as a dividend for the purposes of the maximum rate under section 1(h)(11) of the Internal Revenue Code.
The amounts per share which represent income derived from sources within, and taxes paid to, foreign countries or possessions of the United States are as follows:
| | Pay Date | Income | Taxes |
| Class A | 12/10/2018 | $0.2312 | $0.0182 |
| Class M | 12/10/2018 | $0.2022 | $0.0182 |
| Class C | 12/10/2018 | $0.1502 | $0.0182 |
| International Value | 12/10/2018 | $0.2602 | $0.0182 |
| Class I | 12/10/2018 | $0.2552 | $0.0182 |
| Class Z | 12/10/2018 | $0.2742 | $0.0182 |
|
The fund will notify shareholders in January 2020 of amounts for use in preparing 2019 income tax returns.
FIV-ANN-1219
1.827482.113
Fidelity® Global Commodity Stock Fund
Annual Report
October 31, 2019
Includes Fidelity and Fidelity Advisor share classes
See the inside front cover for important information about access to your fund’s shareholder reports.
Beginning on January 1, 2021, as permitted by regulations adopted by the Securities and Exchange Commission, paper copies of a fund’s shareholder reports will no longer be sent by mail, unless you specifically request paper copies of the reports from the fund or from your financial intermediary, such as a financial advisor, broker-dealer or bank. Instead, the reports will be made available on a website, and you will be notified by mail each time a report is posted and provided with a website link to access the report.
If you already elected to receive shareholder reports electronically, you will not be affected by this change and you need not take any action. You may elect to receive shareholder reports and other communications from a fund electronically, by contacting your financial intermediary. For Fidelity customers, visit Fidelity's web site or call Fidelity using the contact information listed below.
You may elect to receive all future reports in paper free of charge. If you wish to continue receiving paper copies of your shareholder reports, you may contact your financial intermediary or, if you are a Fidelity customer, visit Fidelity’s website, or call Fidelity at the applicable toll-free number listed below. Your election to receive reports in paper will apply to all funds held with the fund complex/your financial intermediary.
| Account Type | Website | Phone Number |
| Brokerage, Mutual Fund, or Annuity Contracts: | fidelity.com/mailpreferences | 1-800-343-3548 |
| Employer Provided Retirement Accounts: | netbenefits.fidelity.com/preferences (choose 'no' under Required Disclosures to continue to print) | 1-800-343-0860 |
| Advisor Sold Accounts Serviced Through Your Financial Intermediary: | Contact Your Financial Intermediary | Your Financial Intermediary's phone number |
| Advisor Sold Accounts Serviced by Fidelity: | institutional.fidelity.com | 1-877-208-0098 |
Contents
To view a fund's proxy voting guidelines and proxy voting record for the 12-month period ended June 30, visit http://www.fidelity.com/proxyvotingresults or visit the Securities and Exchange Commission's (SEC) web site at http://www.sec.gov.
You may also call 1-800-544-8544 if you’re an individual investing directly with Fidelity, call 1-800-835-5092 if you’re a plan sponsor or participant with Fidelity as your recordkeeper or call 1-877-208-0098 on institutional accounts or if you’re an advisor or invest through one to request a free copy of the proxy voting guidelines.
Standard & Poor's, S&P and S&P 500 are registered service marks of The McGraw-Hill Companies, Inc. and have been licensed for use by Fidelity Distributors Corporation.
Other third-party marks appearing herein are the property of their respective owners.
All other marks appearing herein are registered or unregistered trademarks or service marks of FMR LLC or an affiliated company. © 2019 FMR LLC. All rights reserved.
This report and the financial statements contained herein are submitted for the general information of the shareholders of the Fund. This report is not authorized for distribution to prospective investors in the Fund unless preceded or accompanied by an effective prospectus.
A fund files its complete schedule of portfolio holdings with the SEC for the first and third quarters of each fiscal year on Form N-PORT. Forms N-PORT are available on the SEC’s web site at http://www.sec.gov. A fund's Forms N-PORT may be reviewed and copied at the SEC’s Public Reference Room in Washington, DC. Information regarding the operation of the SEC's Public Reference Room may be obtained by calling 1-800-SEC-0330.
For a complete list of a fund's portfolio holdings, view the most recent holdings listing, semiannual report, or annual report on Fidelity's web site at http://www.fidelity.com, http://www.institutional.fidelity.com, or http://www.401k.com, as applicable.
NOT FDIC INSURED •MAY LOSE VALUE •NO BANK GUARANTEE
Neither the Fund nor Fidelity Distributors Corporation is a bank.
Performance: The Bottom Line
Average annual total return reflects the change in the value of an investment, assuming reinvestment of distributions from dividend income and capital gains (the profits earned upon the sale of securities that have grown in value, if any) and assuming a constant rate of performance each year. The hypothetical investment and the average annual total returns do not reflect the deduction of taxes that a shareholder would pay on fund distributions or the redemption of fund shares. During periods of reimbursement by Fidelity, a fund’s total return will be greater than it would be had the reimbursement not occurred. How a fund did yesterday is no guarantee of how it will do tomorrow.
Average Annual Total Returns
| For the periods ended October 31, 2019 | Past 1 year | Past 5 years | Past 10 years |
| Class A (incl. 5.75% sales charge) | (6.16)% | (1.36)% | (0.29)% |
| Class M (incl. 3.50% sales charge) | (4.17)% | (1.17)% | (0.33)% |
| Class C (incl. contingent deferred sales charge) | (2.14)% | (0.92)% | (0.44)% |
| Fidelity® Global Commodity Stock Fund | (0.23)% | 0.04% | 0.54% |
| Class I | (0.06)% | 0.16% | 0.62% |
| Class Z | 0.03% | 0.19% | 0.64% |
Class C shares' contingent deferred sales charges included in the past one year, past five years, and past ten years total return figures are 1%, 0%, and 0%, respectively.
The initial offering of Class Z shares took place on October 2, 2018. Returns prior to October 2, 2018, are those of Class I.
$10,000 Over Life of Fund
Let's say hypothetically that $10,000 was invested in Fidelity® Global Commodity Stock Fund, a class of the fund, on October 31, 2009.
The chart shows how the value of your investment would have changed, and also shows how the MSCI ACWI (All Country World Index) Index performed over the same period.
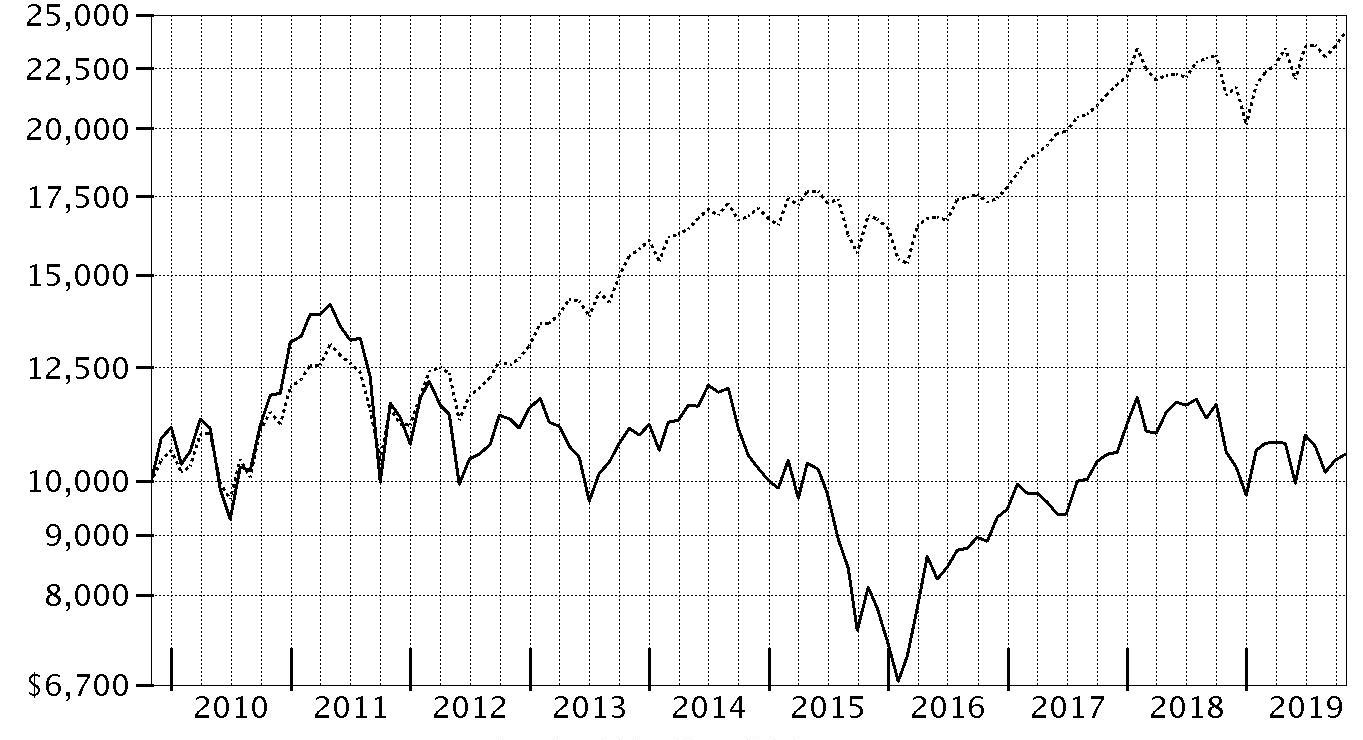
| Period Ending Values |
| $10,553 | Fidelity® Global Commodity Stock Fund - Fidelity® Global Commodity Stock Fund |
| $24,154 | MSCI ACWI (All Country World Index) Index |
Management's Discussion of Fund Performance
Market Recap: Global equities gained 13.06% for the 12 months ending October 31, 2019, according to the MSCI ACWI (All Country World Index) Index. Currency fluctuations were largely modest and varied by region, muting the overall impact on international equity returns. The period began amid a challenging fourth quarter of 2018, when concerns about slowing global economic growth resulted in a -12.67% return for the index. The tide shifted as the calendar turned, as the U.S. Federal Reserve moved from raising interest rates to a more dovish policy, joining many foreign central banks. The index rallied 12.29% in the first quarter of 2019. After a down month in May (-5.88%), due to U.S.–China trade tension, stocks reversed course in June (+6.58%) and finished the second quarter with a 3.73% gain. In July, the Fed cut its policy rate for the first time since 2008, but global stocks retreated in August. Low interest rates around the world and two additional rate cuts by the Fed lifted stocks through the end of October. By sector for the full period, falling U.S. interest rates sparked demand for two high-dividend-yielding sectors, real estate (+23%) and utilities (+22%). Investors favoring growth-oriented stocks boosted information technology (+22%) and consumer discretionary (+16%). Conversely, falling commodity prices hurt energy (-6%). By region, Asia-Pacific ex Japan (+16%), the U.S. (+14%) and Europe ex U.K. (+13%) fared best, while the U.K. (+7%) was held back by its inability to approve a plan to “Brexit” the European Union.
Comments from Portfolio Manager Jody Simes: For the year, the fund’s share classes (excluding sales charges, if applicable) returned about 0% to -1%, well ahead of the -3.31% result of the MSCI All Country World Commodity Producers Sector Capped Index. Versus the MSCI index, stock selection in metals & mining added the most value by far to the fund’s performance. Geographically, security choices in the United States contributed significantly, more than offsetting the negative impact of an overweighting there. At the stock level, the fund’s top relative contributor was our underweighting in weak-performing benchmark name Corteva (-8%), where I established a position in June. The agricultural company was spun off from DowDuPont that month. Also lifting the fund’s relative performance was an out-of-benchmark stake in Crown Holdings (+71%), a producer of aluminum beverage, food and aerosol containers, and a non-index position in Royal Gold (+26%). Conversely, stock choices in the food products industry detracted modestly. Regionally, underweighting the strong-performing Asia-Pacific ex-Japan area nicked us a bit. Among individual holdings, not owning Anglo Gold Ashanti (+128%) for most of the period worked against us, as did an out-of-index position in aluminum producer Alcoa (-45%), which I sold from the fund.
The views expressed above reflect those of the portfolio manager(s) only through the end of the period as stated on the cover of this report and do not necessarily represent the views of Fidelity or any other person in the Fidelity organization. Any such views are subject to change at any time based upon market or other conditions and Fidelity disclaims any responsibility to update such views. These views may not be relied on as investment advice and, because investment decisions for a Fidelity fund are based on numerous factors, may not be relied on as an indication of trading intent on behalf of any Fidelity fund.
Note to Shareholders: On March 30, 2019, Joe Wickwire retired from Fidelity, leaving Jody Simes as sole manager of the fund.
Investment Summary (Unaudited)
Top Ten Stocks as of October 31, 2019
| | % of fund's net assets |
| Nutrien Ltd. | 5.7 |
| Archer Daniels Midland Co. | 4.5 |
| Rio Tinto PLC | 4.5 |
| Chevron Corp. | 4.3 |
| Royal Dutch Shell PLC Class A (United Kingdom) | 4.2 |
| BHP Billiton Ltd. | 3.9 |
| Exxon Mobil Corp. | 3.8 |
| UPM-Kymmene Corp. | 3.4 |
| CF Industries Holdings, Inc. | 3.2 |
| Total SA | 2.9 |
| | 40.4 |
Top Sectors (% of fund's net assets)
| As of October 31, 2019 |
| | Metals | 36.7% |
| | Energy | 30.8% |
| | Agriculture | 29.4% |
| | Other | 2.2% |
| | Short-Term Investments and Net Other Assets | 0.9% |

Schedule of Investments October 31, 2019
Showing Percentage of Net Assets
| Common Stocks - 98.2% | | | |
| | | Shares | Value |
| Chemicals - 13.6% | | | |
| Fertilizers & Agricultural Chemicals - 13.6% | | | |
| CF Industries Holdings, Inc. | | 361,260 | $16,383,141 |
| Corteva, Inc. | | 91,700 | 2,419,046 |
| FMC Corp. | | 146,100 | 13,368,150 |
| Israel Chemicals Ltd. | | 809,100 | 3,592,735 |
| Nutrien Ltd. | | 597,183 | 28,569,205 |
| The Mosaic Co. | | 226,861 | 4,509,997 |
| | | | 68,842,274 |
| Construction Materials - 1.0% | | | |
| Construction Materials - 1.0% | | | |
| Summit Materials, Inc. (a) | | 213,400 | 4,893,262 |
| Containers & Packaging - 1.2% | | | |
| Metal & Glass Containers - 1.2% | | | |
| Crown Holdings, Inc. (a) | | 80,900 | 5,892,756 |
| Food Products - 7.3% | | | |
| Agricultural Products - 7.3% | | | |
| Archer Daniels Midland Co. | | 545,700 | 22,941,228 |
| Bunge Ltd. | | 170,700 | 9,217,800 |
| Darling International, Inc. (a) | | 264,500 | 5,104,850 |
| | | | 37,263,878 |
| Metals & Mining - 36.7% | | | |
| Aluminum - 0.8% | | | |
| Kaiser Aluminum Corp. | | 39,400 | 4,218,952 |
| Copper - 3.1% | | | |
| Antofagasta PLC | | 177,600 | 1,995,030 |
| First Quantum Minerals Ltd. | | 961,924 | 8,128,627 |
| Lundin Mining Corp. | | 1,054,100 | 5,322,121 |
| | | | 15,445,778 |
| Diversified Metals & Mining - 17.3% | | | |
| Anglo American PLC (United Kingdom) | | 343,312 | 8,812,357 |
| BHP Billiton Ltd. | | 810,308 | 19,862,641 |
| BHP Billiton PLC | | 512,896 | 10,878,801 |
| Boliden AB | | 80,700 | 2,170,092 |
| Compass Minerals International, Inc. (b) | | 50,000 | 2,824,000 |
| Grupo Mexico SA de CV Series B | | 742,620 | 1,956,102 |
| Ivanhoe Mines Ltd. (a) | | 767,900 | 1,906,486 |
| MMC Norilsk Nickel PJSC | | 38,400 | 10,712,296 |
| MMC Norilsk Nickel PJSC sponsored ADR | | 55,400 | 1,534,580 |
| Rio Tinto PLC | | 435,956 | 22,696,663 |
| South32 Ltd. | | 1,141,097 | 1,996,841 |
| Teck Resources Ltd. Class B (sub. vtg.) | | 132,300 | 2,091,326 |
| | | | 87,442,185 |
| Gold - 8.0% | | | |
| Agnico Eagle Mines Ltd. (Canada) | | 75,200 | 4,621,851 |
| Barrick Gold Corp. (Canada) | | 496,347 | 8,622,291 |
| Franco-Nevada Corp. | | 55,871 | 5,421,239 |
| Kirkland Lake Gold Ltd. | | 61,900 | 2,906,776 |
| Newcrest Mining Ltd. | | 173,142 | 3,779,401 |
| Newmont Goldcorp Corp. | | 255,900 | 10,166,907 |
| Royal Gold, Inc. | | 43,200 | 4,987,008 |
| | | | 40,505,473 |
| Silver - 1.6% | | | |
| Wheaton Precious Metals Corp. | | 295,300 | 8,277,637 |
| Steel - 5.9% | | | |
| Commercial Metals Co. | | 150,300 | 2,905,299 |
| Fortescue Metals Group Ltd. | | 550,930 | 3,372,037 |
| JFE Holdings, Inc. | | 188,000 | 2,351,437 |
| Nippon Steel & Sumitomo Metal Corp. | | 111,600 | 1,628,862 |
| Nucor Corp. | | 116,792 | 6,289,249 |
| POSCO | | 11,044 | 1,992,174 |
| Reliance Steel & Aluminum Co. | | 50,900 | 5,906,436 |
| Steel Dynamics, Inc. | | 137,600 | 4,177,536 |
| Thyssenkrupp AG (b) | | 93,500 | 1,334,270 |
| | | | 29,957,300 |
|
| TOTAL METALS & MINING | | | 185,847,325 |
|
| Oil, Gas & Consumable Fuels - 29.9% | | | |
| Integrated Oil & Gas - 22.7% | | | |
| BP PLC | | 2,111,901 | 13,392,335 |
| Chevron Corp. | | 189,200 | 21,973,688 |
| Equinor ASA | | 125,100 | 2,313,959 |
| Exxon Mobil Corp. | | 288,000 | 19,460,160 |
| Gazprom OAO | | 1,429,600 | 5,799,397 |
| Lukoil PJSC sponsored ADR | | 57,100 | 5,250,916 |
| Occidental Petroleum Corp. | | 109,400 | 4,430,700 |
| Royal Dutch Shell PLC: | | | |
| Class A (United Kingdom) | | 724,241 | 20,994,369 |
| Class B (United Kingdom) | | 60,359 | 1,738,326 |
| Suncor Energy, Inc. | | 171,632 | 5,102,960 |
| Total SA | | 278,181 | 14,706,941 |
| | | | 115,163,751 |
| Oil & Gas Exploration & Production - 6.7% | | | |
| Cabot Oil & Gas Corp. | | 96,600 | 1,800,624 |
| Canadian Natural Resources Ltd. | | 92,500 | 2,332,340 |
| ConocoPhillips Co. | | 162,800 | 8,986,560 |
| Devon Energy Corp. | | 43,500 | 882,180 |
| Diamondback Energy, Inc. | | 40,100 | 3,438,976 |
| Hess Corp. | | 20,400 | 1,341,300 |
| Lundin Petroleum AB | | 49,300 | 1,627,727 |
| Magnolia Oil & Gas Corp. Class A (a) | | 231,000 | 2,268,420 |
| Noble Energy, Inc. | | 88,600 | 1,706,436 |
| NOVATEK OAO GDR (Reg. S) | | 11,700 | 2,503,800 |
| Parsley Energy, Inc. Class A | | 139,300 | 2,202,333 |
| Pioneer Natural Resources Co. | | 38,910 | 4,786,708 |
| | | | 33,877,404 |
| Oil & Gas Refining & Marketing - 0.5% | | | |
| Neste Oyj | | 75,000 | 2,706,833 |
|
| TOTAL OIL, GAS & CONSUMABLE FUELS | | | 151,747,988 |
|
| Paper & Forest Products - 8.5% | | | |
| Forest Products - 0.3% | | | |
| Svenska Cellulosa AB (SCA) (B Shares) | | 163,500 | 1,665,533 |
| Paper Products - 8.2% | | | |
| Mondi PLC | | 281,191 | 5,818,746 |
| Nine Dragons Paper (Holdings) Ltd. | | 2,600,000 | 2,255,407 |
| Oji Holdings Corp. | | 406,000 | 2,099,118 |
| Sappi Ltd. | | 352,406 | 904,891 |
| Stora Enso Oyj (R Shares) | | 618,100 | 8,013,891 |
| Suzano Papel e Celulose SA | | 632,445 | 5,147,240 |
| UPM-Kymmene Corp. | | 528,200 | 17,166,417 |
| | | | 41,405,710 |
|
| TOTAL PAPER & FOREST PRODUCTS | | | 43,071,243 |
|
| TOTAL COMMON STOCKS | | | |
| (Cost $558,056,583) | | | 497,558,726 |
|
| Nonconvertible Preferred Stocks - 0.9% | | | |
| Oil, Gas & Consumable Fuels - 0.9% | | | |
| Integrated Oil & Gas - 0.9% | | | |
| Petroleo Brasileiro SA - Petrobras (PN) sponsored ADR (non-vtg.) | | | |
| (Cost $3,754,429) | | 299,800 | 4,523,982 |
|
| Money Market Funds - 0.5% | | | |
| Fidelity Securities Lending Cash Central Fund 1.84% (c)(d) | | | |
| (Cost $2,264,963) | | 2,264,659 | 2,264,885 |
| TOTAL INVESTMENT IN SECURITIES - 99.6% | | | |
| (Cost $564,075,975) | | | 504,347,593 |
| NET OTHER ASSETS (LIABILITIES) - 0.4% | | | 2,274,630 |
| NET ASSETS - 100% | | | $506,622,223 |
Legend
(a) Non-income producing
(b) Security or a portion of the security is on loan at period end.
(c) Affiliated fund that is generally available only to investment companies and other accounts managed by Fidelity Investments. The rate quoted is the annualized seven-day yield of the fund at period end. A complete unaudited listing of the fund's holdings as of its most recent quarter end is available upon request. In addition, each Fidelity Central Fund's financial statements, which are not covered by the Fund's Report of Independent Registered Public Accounting Firm, are available on the SEC's website or upon request.
(d) Investment made with cash collateral received from securities on loan.
Affiliated Central Funds
Information regarding fiscal year to date income earned by the Fund from investments in Fidelity Central Funds is as follows:
| Fund | Income earned |
| Fidelity Cash Central Fund | $202,025 |
| Fidelity Securities Lending Cash Central Fund | 157,189 |
| Total | $359,214 |
Amounts in the income column in the above table include any capital gain distributions from underlying funds, which are presented in the corresponding line-item in the Statement of Operations, if applicable. Amount for Fidelity Securities Lending Cash Central Fund represents the income earned on investing cash collateral, less rebates paid to borrowers and any lending agent fees associated with the loan, plus any premium payments received for lending certain types of securities.
Investment Valuation
The following is a summary of the inputs used, as of October 31, 2019, involving the Fund's assets and liabilities carried at fair value. The inputs or methodology used for valuing securities may not be an indication of the risk associated with investing in those securities. For more information on valuation inputs, and their aggregation into the levels used below, please refer to the Investment Valuation section in the accompanying Notes to Financial Statements.
| | Valuation Inputs at Reporting Date: |
| Description | Total | Level 1 | Level 2 | Level 3 |
| Investments in Securities: | | | | |
| Common Stocks | $497,558,726 | $368,013,976 | $129,544,750 | $-- |
| Nonconvertible Preferred Stocks | 4,523,982 | 4,523,982 | -- | -- |
| Money Market Funds | 2,264,885 | 2,264,885 | -- | -- |
| Total Investments in Securities: | $504,347,593 | $374,802,843 | $129,544,750 | $-- |
Other Information
Distribution of investments by country or territory of incorporation, as a percentage of Total Net Assets, is as follows (Unaudited):
| United States of America | 38.4% |
| United Kingdom | 17.1% |
| Canada | 16.6% |
| Australia | 5.7% |
| Finland | 5.5% |
| Russia | 5.1% |
| France | 2.9% |
| Bermuda | 2.2% |
| Brazil | 1.9% |
| Japan | 1.2% |
| Sweden | 1.0% |
| Others (Individually Less Than 1%) | 2.4% |
| | 100.0% |
See accompanying notes which are an integral part of the financial statements.
Financial Statements
Statement of Assets and Liabilities
| | | October 31, 2019 |
| Assets | | |
Investment in securities, at value (including securities loaned of $2,158,500) — See accompanying schedule:
Unaffiliated issuers (cost $561,811,012) | $502,082,708 | |
| Fidelity Central Funds (cost $2,264,963) | 2,264,885 | |
| Total Investment in Securities (cost $564,075,975) | | $504,347,593 |
| Foreign currency held at value (cost $347) | | 350 |
| Receivable for investments sold | | 11,734,308 |
| Receivable for fund shares sold | | 222,368 |
| Dividends receivable | | 451,569 |
| Distributions receivable from Fidelity Central Funds | | 5,831 |
| Prepaid expenses | | 951 |
| Other receivables | | 16,412 |
| Total assets | | 516,779,382 |
| Liabilities | | |
| Payable to custodian bank | $1,246,180 | |
| Payable for fund shares redeemed | 6,175,949 | |
| Accrued management fee | 291,536 | |
| Distribution and service plan fees payable | 16,832 | |
| Other affiliated payables | 96,414 | |
| Other payables and accrued expenses | 65,478 | |
| Collateral on securities loaned | 2,264,770 | |
| Total liabilities | | 10,157,159 |
| Net Assets | | $506,622,223 |
| Net Assets consist of: | | |
| Paid in capital | | $628,422,209 |
| Total accumulated earnings (loss) | | (121,799,986) |
| Net Assets | | $506,622,223 |
| Net Asset Value and Maximum Offering Price | | |
| Class A: | | |
| Net Asset Value and redemption price per share ($25,779,367 ÷ 2,122,687 shares)(a) | | $12.14 |
| Maximum offering price per share (100/94.25 of $12.14) | | $12.88 |
| Class M: | | |
| Net Asset Value and redemption price per share ($5,415,965 ÷ 446,976 shares)(a) | | $12.12 |
| Maximum offering price per share (100/96.50 of $12.12) | | $12.56 |
| Class C: | | |
| Net Asset Value and offering price per share ($11,294,123 ÷ 941,900 shares)(a) | | $11.99 |
| Global Commodity Stock: | | |
| Net Asset Value, offering price and redemption price per share ($257,011,470 ÷ 21,144,548 shares) | | $12.15 |
| Class I: | | |
| Net Asset Value, offering price and redemption price per share ($102,632,658 ÷ 8,437,598 shares) | | $12.16 |
| Class Z: | | |
| Net Asset Value, offering price and redemption price per share ($104,488,640 ÷ 8,592,831 shares) | | $12.16 |
(a) Redemption price per share is equal to net asset value less any applicable contingent deferred sales charge.
See accompanying notes which are an integral part of the financial statements.
Statement of Operations
| | | Year ended October 31, 2019 |
| Investment Income | | |
| Dividends | | $22,994,575 |
| Income from Fidelity Central Funds (including $157,189 from security lending) | | 359,214 |
| Income before foreign taxes withheld | | 23,353,789 |
| Less foreign taxes withheld | | (1,310,824) |
| Total income | | 22,042,965 |
| Expenses | | |
| Management fee | $3,662,280 | |
| Transfer agent fees | 1,263,558 | |
| Distribution and service plan fees | 246,773 | |
| Accounting and security lending fees | 273,675 | |
| Custodian fees and expenses | 32,296 | |
| Independent trustees' fees and expenses | 3,049 | |
| Registration fees | 122,303 | |
| Audit | 65,590 | |
| Legal | 2,074 | |
| Miscellaneous | 3,743 | |
| Total expenses before reductions | 5,675,341 | |
| Expense reductions | (31,004) | |
| Total expenses after reductions | | 5,644,337 |
| Net investment income (loss) | | 16,398,628 |
| Realized and Unrealized Gain (Loss) | | |
| Net realized gain (loss) on: | | |
| Investment securities: | | |
| Unaffiliated issuers | (47,517,835) | |
| Fidelity Central Funds | (393) | |
| Foreign currency transactions | 13,636 | |
| Total net realized gain (loss) | | (47,504,592) |
| Change in net unrealized appreciation (depreciation) on: | | |
| Investment securities: | | |
| Unaffiliated issuers | 29,427,781 | |
| Fidelity Central Funds | 198 | |
| Assets and liabilities in foreign currencies | 5,231 | |
| Total change in net unrealized appreciation (depreciation) | | 29,433,210 |
| Net gain (loss) | | (18,071,382) |
| Net increase (decrease) in net assets resulting from operations | | $(1,672,754) |
See accompanying notes which are an integral part of the financial statements.
Statement of Changes in Net Assets
| | Year ended October 31, 2019 | Year ended October 31, 2018 |
| Increase (Decrease) in Net Assets | | |
| Operations | | |
| Net investment income (loss) | $16,398,628 | $10,318,695 |
| Net realized gain (loss) | (47,504,592) | 33,085,884 |
| Change in net unrealized appreciation (depreciation) | 29,433,210 | (46,889,653) |
| Net increase (decrease) in net assets resulting from operations | (1,672,754) | (3,485,074) |
| Distributions to shareholders | (11,167,623) | (7,402,151) |
| Share transactions - net increase (decrease) | (28,451,076) | 129,504,630 |
| Redemption fees | – | 181 |
| Total increase (decrease) in net assets | (41,291,453) | 118,617,586 |
| Net Assets | | |
| Beginning of period | 547,913,676 | 429,296,090 |
| End of period | $506,622,223 | $547,913,676 |
See accompanying notes which are an integral part of the financial statements.
Financial Highlights
Fidelity Global Commodity Stock Fund Class A
| Years ended October 31, | 2019 | 2018 | 2017 | 2016 | 2015 |
| Selected Per–Share Data | | | | | |
| Net asset value, beginning of period | $12.42 | $12.56 | $10.73 | $10.05 | $13.25 |
| Income from Investment Operations | | | | | |
| Net investment income (loss)A | .35 | .21 | .12 | .11 | .22 |
| Net realized and unrealized gain (loss) | (.41) | (.22) | 1.86 | .79 | (3.25) |
| Total from investment operations | (.06) | (.01) | 1.98 | .90 | (3.03) |
| Distributions from net investment income | (.20) | (.09) | (.08) | (.21) | (.14) |
| Distributions from net realized gain | (.02) | (.05) | (.07) | (.01) | (.03) |
| Total distributions | (.22) | (.13)B | (.15) | (.22) | (.17) |
| Redemption fees added to paid in capitalA | – | –C | –C | –C | –C |
| Net asset value, end of period | $12.14 | $12.42 | $12.56 | $10.73 | $10.05 |
| Total ReturnD,E | (.44)% | (.05)% | 18.53% | 9.29% | (23.16)% |
| Ratios to Average Net AssetsF,G | | | | | |
| Expenses before reductions | 1.29% | 1.28% | 1.33% | 1.38% | 1.34% |
| Expenses net of fee waivers, if any | 1.28% | 1.28% | 1.33% | 1.38% | 1.34% |
| Expenses net of all reductions | 1.28% | 1.27% | 1.32% | 1.37% | 1.34% |
| Net investment income (loss) | 2.86% | 1.55% | 1.07% | 1.18% | 1.85% |
| Supplemental Data | | | | | |
| Net assets, end of period (000 omitted) | $25,779 | $27,258 | $29,920 | $34,791 | $31,391 |
| Portfolio turnover rateH | 55% | 70% | 81% | 85% | 77% |
A Calculated based on average shares outstanding during the period.
B Total distributions of $.13 per share is comprised of distributions from net investment income of $.086 and distributions from net realized gain of $.047 per share.
C Amount represents less than $.005 per share.
D Total returns would have been lower if certain expenses had not been reduced during the applicable periods shown.
E Total returns do not include the effect of the sales charges.
F Fees and expenses of any underlying Fidelity Central Funds are not included in the Fund's expense ratio. The Fund indirectly bears its proportionate share of the expenses of any underlying Fidelity Central Funds.
G Expense ratios reflect operating expenses of the class. Expenses before reductions do not reflect amounts reimbursed by the investment adviser or reductions from brokerage service arrangements or reductions from other expense offset arrangements and do not represent the amount paid by the class during periods when reimbursements or reductions occur. Expenses net of fee waivers reflect expenses after reimbursement by the investment adviser but prior to reductions from brokerage service arrangements or other expense offset arrangements. Expenses net of all reductions represent the net expenses paid by the class.
H Amount does not include the portfolio activity of any underlying Fidelity Central Funds.
See accompanying notes which are an integral part of the financial statements.
Fidelity Global Commodity Stock Fund Class M
| Years ended October 31, | 2019 | 2018 | 2017 | 2016 | 2015 |
| Selected Per–Share Data | | | | | |
| Net asset value, beginning of period | $12.39 | $12.53 | $10.72 | $10.02 | $13.21 |
| Income from Investment Operations | | | | | |
| Net investment income (loss)A | .31 | .16 | .09 | .09 | .19 |
| Net realized and unrealized gain (loss) | (.40) | (.20) | 1.84 | .79 | (3.25) |
| Total from investment operations | (.09) | (.04) | 1.93 | .88 | (3.06) |
| Distributions from net investment income | (.16) | (.06) | (.05) | (.17) | (.10) |
| Distributions from net realized gain | (.02) | (.05) | (.07) | (.01) | (.03) |
| Total distributions | (.18) | (.10)B | (.12) | (.18) | (.13) |
| Redemption fees added to paid in capitalA | – | –C | –C | –C | –C |
| Net asset value, end of period | $12.12 | $12.39 | $12.53 | $10.72 | $10.02 |
| Total ReturnD,E | (.70)% | (.30)% | 18.09% | 9.08% | (23.40)% |
| Ratios to Average Net AssetsF,G | | | | | |
| Expenses before reductions | 1.59% | 1.59% | 1.62% | 1.65% | 1.63% |
| Expenses net of fee waivers, if any | 1.59% | 1.59% | 1.62% | 1.65% | 1.63% |
| Expenses net of all reductions | 1.59% | 1.58% | 1.61% | 1.64% | 1.62% |
| Net investment income (loss) | 2.55% | 1.24% | .78% | .90% | 1.57% |
| Supplemental Data | | | | | |
| Net assets, end of period (000 omitted) | $5,416 | $7,200 | $6,876 | $6,068 | $6,335 |
| Portfolio turnover rateH | 55% | 70% | 81% | 85% | 77% |
A Calculated based on average shares outstanding during the period.
B Total distributions of $.10 per share is comprised of distributions from net investment income of $.055 and distributions from net realized gain of $.047 per share.
C Amount represents less than $.005 per share.
D Total returns would have been lower if certain expenses had not been reduced during the applicable periods shown.
E Total returns do not include the effect of the sales charges.
F Fees and expenses of any underlying Fidelity Central Funds are not included in the Fund's expense ratio. The Fund indirectly bears its proportionate share of the expenses of any underlying Fidelity Central Funds.
G Expense ratios reflect operating expenses of the class. Expenses before reductions do not reflect amounts reimbursed by the investment adviser or reductions from brokerage service arrangements or reductions from other expense offset arrangements and do not represent the amount paid by the class during periods when reimbursements or reductions occur. Expenses net of fee waivers reflect expenses after reimbursement by the investment adviser but prior to reductions from brokerage service arrangements or other expense offset arrangements. Expenses net of all reductions represent the net expenses paid by the class.
H Amount does not include the portfolio activity of any underlying Fidelity Central Funds.
See accompanying notes which are an integral part of the financial statements.
Fidelity Global Commodity Stock Fund Class C
| Years ended October 31, | 2019 | 2018 | 2017 | 2016 | 2015 |
| Selected Per–Share Data | | | | | |
| Net asset value, beginning of period | $12.26 | $12.39 | $10.61 | $9.92 | $13.06 |
| Income from Investment Operations | | | | | |
| Net investment income (loss)A | .26 | .11 | .04 | .04 | .13 |
| Net realized and unrealized gain (loss) | (.41) | (.19) | 1.82 | .78 | (3.22) |
| Total from investment operations | (.15) | (.08) | 1.86 | .82 | (3.09) |
| Distributions from net investment income | (.11) | – | (.01) | (.12) | (.03) |
| Distributions from net realized gain | (.02) | (.05) | (.07) | (.01) | (.03) |
| Total distributions | (.12)B | (.05) | (.08) | (.13) | (.05)C |
| Redemption fees added to paid in capitalA | – | –D | –D | –D | –D |
| Net asset value, end of period | $11.99 | $12.26 | $12.39 | $10.61 | $9.92 |
| Total ReturnE,F | (1.16)% | (.67)% | 17.59% | 8.46% | (23.74)% |
| Ratios to Average Net AssetsG,H | | | | | |
| Expenses before reductions | 2.02% | 2.00% | 2.07% | 2.13% | 2.12% |
| Expenses net of fee waivers, if any | 2.02% | 1.99% | 2.07% | 2.13% | 2.12% |
| Expenses net of all reductions | 2.01% | 1.98% | 2.06% | 2.12% | 2.11% |
| Net investment income (loss) | 2.13% | .84% | .33% | .43% | 1.08% |
| Supplemental Data | | | | | |
| Net assets, end of period (000 omitted) | $11,294 | $20,793 | $14,289 | $12,620 | $11,274 |
| Portfolio turnover rateI | 55% | 70% | 81% | 85% | 77% |
A Calculated based on average shares outstanding during the period.
B Total distributions of $.12 per share is comprised of distributions from net investment income of $.105 and distributions from net realized gain of $.018 per share.
C Total distributions of $.05 per share is comprised of distributions from net investment income of $.025 and distributions from net realized gain of $.026 per share.
D Amount represents less than $.005 per share.
E Total returns would have been lower if certain expenses had not been reduced during the applicable periods shown.
F Total returns do not include the effect of the contingent deferred sales charge.
G Fees and expenses of any underlying Fidelity Central Funds are not included in the Fund's expense ratio. The Fund indirectly bears its proportionate share of the expenses of any underlying Fidelity Central Funds.
H Expense ratios reflect operating expenses of the class. Expenses before reductions do not reflect amounts reimbursed by the investment adviser or reductions from brokerage service arrangements or reductions from other expense offset arrangements and do not represent the amount paid by the class during periods when reimbursements or reductions occur. Expenses net of fee waivers reflect expenses after reimbursement by the investment adviser but prior to reductions from brokerage service arrangements or other expense offset arrangements. Expenses net of all reductions represent the net expenses paid by the class.
I Amount does not include the portfolio activity of any underlying Fidelity Central Funds.
See accompanying notes which are an integral part of the financial statements.
Fidelity Global Commodity Stock Fund
| Years ended October 31, | 2019 | 2018 | 2017 | 2016 | 2015 |
| Selected Per–Share Data | | | | | |
| Net asset value, beginning of period | $12.44 | $12.59 | $10.77 | $10.09 | $13.31 |
| Income from Investment Operations | | | | | |
| Net investment income (loss)A | .37 | .23 | .15 | .14 | .25 |
| Net realized and unrealized gain (loss) | (.41) | (.20) | 1.84 | .79 | (3.27) |
| Total from investment operations | (.04) | .03 | 1.99 | .93 | (3.02) |
| Distributions from net investment income | (.23) | (.13) | (.11) | (.24) | (.18) |
| Distributions from net realized gain | (.02) | (.05) | (.07) | (.01) | (.03) |
| Total distributions | (.25) | (.18) | (.17)B | (.25) | (.20)C |
| Redemption fees added to paid in capitalA | – | –D | –D | –D | –D |
| Net asset value, end of period | $12.15 | $12.44 | $12.59 | $10.77 | $10.09 |
| Total ReturnE | (.23)% | .23% | 18.65% | 9.62% | (22.97)% |
| Ratios to Average Net AssetsF,G | | | | | |
| Expenses before reductions | 1.06% | 1.08% | 1.10% | 1.13% | 1.12% |
| Expenses net of fee waivers, if any | 1.06% | 1.08% | 1.10% | 1.13% | 1.12% |
| Expenses net of all reductions | 1.06% | 1.06% | 1.09% | 1.12% | 1.11% |
| Net investment income (loss) | 3.08% | 1.75% | 1.30% | 1.43% | 2.08% |
| Supplemental Data | | | | | |
| Net assets, end of period (000 omitted) | $257,011 | $369,563 | $264,557 | $228,982 | $156,320 |
| Portfolio turnover rateH | 55% | 70% | 81% | 85% | 77% |
A Calculated based on average shares outstanding during the period.
B Total distributions of $.17 per share is comprised of distributions from net investment income of $.105 and distributions from net realized gain of $.068 per share.
C Total distributions of $.20 per share is comprised of distributions from net investment income of $.178 and distributions from net realized gain of $.026 per share.
D Amount represents less than $.005 per share.
E Total returns would have been lower if certain expenses had not been reduced during the applicable periods shown.
F Fees and expenses of any underlying Fidelity Central Funds are not included in the Fund's expense ratio. The Fund indirectly bears its proportionate share of the expenses of any underlying Fidelity Central Funds.
G Expense ratios reflect operating expenses of the class. Expenses before reductions do not reflect amounts reimbursed by the investment adviser or reductions from brokerage service arrangements or reductions from other expense offset arrangements and do not represent the amount paid by the class during periods when reimbursements or reductions occur. Expenses net of fee waivers reflect expenses after reimbursement by the investment adviser but prior to reductions from brokerage service arrangements or other expense offset arrangements. Expenses net of all reductions represent the net expenses paid by the class.
H Amount does not include the portfolio activity of any underlying Fidelity Central Funds.
See accompanying notes which are an integral part of the financial statements.
Fidelity Global Commodity Stock Fund Class I
| Years ended October 31, | 2019 | 2018 | 2017 | 2016 | 2015 |
| Selected Per–Share Data | | | | | |
| Net asset value, beginning of period | $12.45 | $12.60 | $10.76 | $10.09 | $13.31 |
| Income from Investment Operations | | | | | |
| Net investment income (loss)A | .39 | .25 | .17 | .16 | .25 |
| Net realized and unrealized gain (loss) | (.41) | (.21) | 1.86 | .77 | (3.26) |
| Total from investment operations | (.02) | .04 | 2.03 | .93 | (3.01) |
| Distributions from net investment income | (.25) | (.14) | (.12) | (.25) | (.19) |
| Distributions from net realized gain | (.02) | (.05) | (.07) | (.01) | (.03) |
| Total distributions | (.27) | (.19) | (.19) | (.26) | (.21)B |
| Redemption fees added to paid in capitalA | – | –C | –C | –C | –C |
| Net asset value, end of period | $12.16 | $12.45 | $12.60 | $10.76 | $10.09 |
| Total ReturnD | (.06)% | .30% | 18.99% | 9.63% | (22.93)% |
| Ratios to Average Net AssetsE,F | | | | | |
| Expenses before reductions | .92% | .93% | .96% | 1.01% | 1.09% |
| Expenses net of fee waivers, if any | .92% | .93% | .95% | 1.01% | 1.08% |
| Expenses net of all reductions | .91% | .91% | .94% | 1.00% | 1.08% |
| Net investment income (loss) | 3.23% | 1.90% | 1.45% | 1.55% | 2.11% |
| Supplemental Data | | | | | |
| Net assets, end of period (000 omitted) | $102,633 | $117,981 | $113,655 | $70,068 | $24,841 |
| Portfolio turnover rateG | 55% | 70% | 81% | 85% | 77% |
A Calculated based on average shares outstanding during the period.
B Total distributions of $.21 per share is comprised of distributions from net investment income of $.186 and distributions from net realized gain of $.026 per share.
C Amount represents less than $.005 per share.
D Total returns would have been lower if certain expenses had not been reduced during the applicable periods shown.
E Fees and expenses of any underlying Fidelity Central Funds are not included in the Fund's expense ratio. The Fund indirectly bears its proportionate share of the expenses of any underlying Fidelity Central Funds.
F Expense ratios reflect operating expenses of the class. Expenses before reductions do not reflect amounts reimbursed by the investment adviser or reductions from brokerage service arrangements or reductions from other expense offset arrangements and do not represent the amount paid by the class during periods when reimbursements or reductions occur. Expenses net of fee waivers reflect expenses after reimbursement by the investment adviser but prior to reductions from brokerage service arrangements or other expense offset arrangements. Expenses net of all reductions represent the net expenses paid by the class.
G Amount does not include the portfolio activity of any underlying Fidelity Central Funds.
See accompanying notes which are an integral part of the financial statements.
Fidelity Global Commodity Stock Fund Class Z
| Years ended October 31, | 2019 | 2018 A |
| Selected Per–Share Data | | |
| Net asset value, beginning of period | $12.46 | $13.84 |
| Income from Investment Operations | | |
| Net investment income (loss)B | .39 | (.01) |
| Net realized and unrealized gain (loss) | (.40) | (1.37) |
| Total from investment operations | (.01) | (1.38) |
| Distributions from net investment income | (.27) | – |
| Distributions from net realized gain | (.02) | – |
| Total distributions | (.29) | – |
| Net asset value, end of period | $12.16 | $12.46 |
| Total ReturnC,D | .03% | (9.97)% |
| Ratios to Average Net AssetsE,F | | |
| Expenses before reductions | .83% | .89%G |
| Expenses net of fee waivers, if any | .83% | .89%G |
| Expenses net of all reductions | .82% | .87%G |
| Net investment income (loss) | 3.32% | (.70)%G |
| Supplemental Data | | |
| Net assets, end of period (000 omitted) | $104,489 | $5,118 |
| Portfolio turnover rateH | 55% | 70% |
A For the period October 2, 2018 (commencement of sale of shares) to October 31, 2018.
B Calculated based on average shares outstanding during the period.
C Total returns for periods of less than one year are not annualized.
D Total returns would have been lower if certain expenses had not been reduced during the applicable periods shown.
E Fees and expenses of any underlying Fidelity Central Funds are not included in the Fund's expense ratio. The Fund indirectly bears its proportionate share of the expenses of any underlying Fidelity Central Funds.
F Expense ratios reflect operating expenses of the class. Expenses before reductions do not reflect amounts reimbursed by the investment adviser or reductions from brokerage service arrangements or reductions from other expense offset arrangements and do not represent the amount paid by the class during periods when reimbursements or reductions occur. Expense ratios before reductions for start-up periods may not be representative of longer-term operating periods. Expenses net of fee waivers reflect expenses after reimbursement by the investment adviser but prior to reductions from brokerage service arrangements or other expense offset arrangements. Expenses net of all reductions represent the net expenses paid by the class.
G Annualized
H Amount does not include the portfolio activity of any underlying Fidelity Central Funds.
See accompanying notes which are an integral part of the financial statements.
Notes to Financial Statements
For the period ended October 31, 2019
1. Organization.
Fidelity Global Commodity Stock Fund (the Fund) is a non-diversified fund of Fidelity Investment Trust (the Trust) and is authorized to issue an unlimited number of shares. The Trust is registered under the Investment Company Act of 1940, as amended (the 1940 Act), as an open-end management investment company organized as a Massachusetts business trust. The Fund offers Class A, Class M, Class C, Global Commodity Stock, Class I and Class Z shares, each of which has equal rights as to assets and voting privileges. Each class has exclusive voting rights with respect to matters that affect that class. Effective March 1, 2019, Class C shares will automatically convert to Class A shares after a holding period of ten years from the initial date of purchase, with certain exceptions.
2. Investments in Fidelity Central Funds.
The Fund invests in Fidelity Central Funds, which are open-end investment companies generally available only to other investment companies and accounts managed by the investment adviser and its affiliates. The Fund's Schedule of Investments lists each of the Fidelity Central Funds held as of period end, if any, as an investment of the Fund, but does not include the underlying holdings of each Fidelity Central Fund. As an Investing Fund, the Fund indirectly bears its proportionate share of the expenses of the underlying Fidelity Central Funds.
The Money Market Central Funds seek preservation of capital and current income and are managed by Fidelity Investments Money Management, Inc. (FIMM), an affiliate of the investment adviser. Annualized expenses of the Money Market Central Funds as of their most recent shareholder report date ranged from less than .005% to .01%.
A complete unaudited list of holdings for each Fidelity Central Fund is available upon request or at the Securities and Exchange Commission (the SEC) website at www.sec.gov. In addition, the financial statements of the Fidelity Central Funds, which are not covered by the Fund's Report of Independent Registered Public Accounting Firm, are available on the SEC website or upon request.
3. Significant Accounting Policies.
The Fund is an investment company and applies the accounting and reporting guidance of the Financial Accounting Standards Board (FASB) Accounting Standards Codification Topic 946 Financial Services – Investments Companies. The financial statements have been prepared in conformity with accounting principles generally accepted in the United States of America (GAAP), which require management to make certain estimates and assumptions at the date of the financial statements. Actual results could differ from those estimates. Subsequent events, if any, through the date that the financial statements were issued have been evaluated in the preparation of the financial statements. The following summarizes the significant accounting policies of the Fund:
Investment Valuation. Investments are valued as of 4:00 p.m. Eastern time on the last calendar day of the period. The Board of Trustees (the Board) has delegated the day to day responsibility for the valuation of the Fund's investments to the Fair Value Committee (the Committee) established by the Fund's investment adviser. In accordance with valuation policies and procedures approved by the Board, the Fund attempts to obtain prices from one or more third party pricing vendors or brokers to value its investments. When current market prices, quotations or currency exchange rates are not readily available or reliable, investments will be fair valued in good faith by the Committee, in accordance with procedures adopted by the Board. Factors used in determining fair value vary by investment type and may include market or investment specific events. The frequency with which these procedures are used cannot be predicted and they may be utilized to a significant extent. The Committee oversees the Fund's valuation policies and procedures and reports to the Board on the Committee's activities and fair value determinations. The Board monitors the appropriateness of the procedures used in valuing the Fund's investments and ratifies the fair value determinations of the Committee.
The Fund categorizes the inputs to valuation techniques used to value its investments into a disclosure hierarchy consisting of three levels as shown below:
- Level 1 – quoted prices in active markets for identical investments
- Level 2 – other significant observable inputs (including quoted prices for similar investments, interest rates, prepayment speeds, etc.)
- Level 3 – unobservable inputs (including the Fund's own assumptions based on the best information available)
Valuation techniques used to value the Fund's investments by major category are as follows:
Equity securities, including restricted securities, for which market quotations are readily available, are valued at the last reported sale price or official closing price as reported by a third party pricing vendor on the primary market or exchange on which they are traded and are categorized as Level 1 in the hierarchy. In the event there were no sales during the day or closing prices are not available, securities are valued at the last quoted bid price or may be valued using the last available price and are generally categorized as Level 2 in the hierarchy. For foreign equity securities, when market or security specific events arise, comparisons to the valuation of American Depositary Receipts (ADRs), futures contracts, Exchange-Traded Funds (ETFs) and certain indexes as well as quoted prices for similar securities may be used and would be categorized as Level 2 in the hierarchy. For equity securities, including restricted securities, where observable inputs are limited, assumptions about market activity and risk are used and these securities may be categorized as Level 3 in the hierarchy.
Investments in open-end mutual funds, including the Fidelity Central Funds, are valued at their closing net asset value (NAV) each business day and are categorized as Level 1 in the hierarchy.
Changes in valuation techniques may result in transfers in or out of an assigned level within the disclosure hierarchy. The aggregate value of investments by input level as of October 31, 2019 is included at the end of the Fund's Schedule of Investments.
Foreign Currency. The Fund may use foreign currency contracts to facilitate transactions in foreign-denominated securities. Gains and losses from these transactions may arise from changes in the value of the foreign currency or if the counterparties do not perform under the contracts' terms.
Foreign-denominated assets, including investment securities, and liabilities are translated into U.S. dollars at the exchange rates at period end. Purchases and sales of investment securities, income and dividends received and expenses denominated in foreign currencies are translated into U.S. dollars at the exchange rate in effect on the transaction date.
The effects of exchange rate fluctuations on investments are included with the net realized and unrealized gain (loss) on investment securities. Other foreign currency transactions resulting in realized and unrealized gain (loss) are disclosed separately.
Investment Transactions and Income. For financial reporting purposes, the Fund's investment holdings and NAV include trades executed through the end of the last business day of the period. The NAV per share for processing shareholder transactions is calculated as of the close of business of the New York Stock Exchange (NYSE), normally 4:00 p.m. Eastern time and includes trades executed through the end of the prior business day. Gains and losses on securities sold are determined on the basis of identified cost and include proceeds received from litigation. Dividend income is recorded on the ex-dividend date, except for certain dividends from foreign securities where the ex-dividend date may have passed, which are recorded as soon as the Fund is informed of the ex-dividend date. Non-cash dividends included in dividend income, if any, are recorded at the fair market value of the securities received. Income and capital gain distributions from Fidelity Central Funds, if any, are recorded on the ex-dividend date. Certain distributions received by the Fund represent a return of capital or capital gain. The Fund determines the components of these distributions subsequent to the ex-dividend date, based upon receipt of tax filings or other correspondence relating to the underlying investment. These distributions are recorded as a reduction of cost of investments and/or as a realized gain. Investment income is recorded net of foreign taxes withheld where recovery of such taxes is uncertain.
Class Allocations and Expenses. Investment income, realized and unrealized capital gains and losses, common expenses of the Fund, and certain fund-level expense reductions, if any, are allocated daily on a pro-rata basis to each class based on the relative net assets of each class to the total net assets of the Fund. Each class differs with respect to transfer agent and distribution and service plan fees incurred. Certain expense reductions may also differ by class. For the reporting period, the allocated portion of income and expenses to each class as a percent of its average net assets may vary due to the timing of recording these transactions in relation to fluctuating net assets of the classes. Expenses directly attributable to a fund are charged to that fund. Expenses attributable to more than one fund are allocated among the respective funds on the basis of relative net assets or other appropriate methods. Expense estimates are accrued in the period to which they relate and adjustments are made when actual amounts are known.
Income Tax Information and Distributions to Shareholders. Each year, the Fund intends to qualify as a regulated investment company under Subchapter M of the Internal Revenue Code, including distributing substantially all of its taxable income and realized gains. As a result, no provision for U.S. Federal income taxes is required. As of October 31, 2019, the Fund did not have any unrecognized tax benefits in the financial statements; nor is the Fund aware of any tax positions for which it is reasonably possible that the total amounts of unrecognized tax benefits will significantly change in the next twelve months. The Fund files a U.S. federal tax return, in addition to state and local tax returns as required. The Fund's federal income tax returns are subject to examination by the Internal Revenue Service (IRS) for a period of three fiscal years after they are filed. State and local tax returns may be subject to examination for an additional fiscal year depending on the jurisdiction. Foreign taxes are provided for based on the Fund's understanding of the tax rules and rates that exist in the foreign markets in which it invests.
Distributions are declared and recorded on the ex-dividend date. Income and capital gain distributions are declared separately for each class. Income and capital gain distributions are determined in accordance with income tax regulations, which may differ from GAAP. In addition, the Fund claimed a portion of the payment made to redeeming shareholders as a distribution for income tax purposes.
Capital accounts within the financial statements are adjusted for permanent book-tax differences. These adjustments have no impact on net assets or the results of operations. Capital accounts are not adjusted for temporary book-tax differences which will reverse in a subsequent period.
Book-tax differences are primarily due to foreign currency transactions, passive foreign investment companies (PFIC), capital loss carryforwards, expiring capital loss carryforwards and losses deferred due to wash sales.
As of period end, the cost and unrealized appreciation (depreciation) in securities, and derivatives if applicable, for federal income tax purposes were as follows:
| Gross unrealized appreciation | $28,480,938 |
| Gross unrealized depreciation | (93,053,717) |
| Net unrealized appreciation (depreciation) | $(64,572,779) |
| Tax Cost | $568,920,372 |
The tax-based components of distributable earnings as of period end were as follows:
| Undistributed ordinary income | $12,499,395 |
| Capital loss carryforward | $(69,719,306) |
| Net unrealized appreciation (depreciation) on securities and other investments | $(64,580,074) |
Capital loss carryforwards are only available to offset future capital gains of the Fund to the extent provided by regulations and may be limited. Under the Regulated Investment Company Modernization Act of 2010 (the Act), the Fund is permitted to carry forward capital losses incurred in taxable years beginning after December 22, 2010 for an unlimited period and such capital losses are required to be used prior to any losses that expire. The capital loss carryforward information presented below, including any applicable limitation, is estimated as of fiscal period end and is subject to adjustment.
| No expiration | |
| Short-term | $(15,327,092) |
| Long-term | (54,392,214) |
| Total capital loss carryforward | $(69,719,306) |
The tax character of distributions paid was as follows:
| | October 31, 2019 | October 31, 2018 |
| Ordinary Income | $11,167,623 | $ 7,402,151 |
4. Purchases and Sales of Investments.
Purchases and sales of securities, other than short-term securities, aggregated $286,101,982 and $308,153,737, respectively.
5. Fees and Other Transactions with Affiliates.
Management Fee. Fidelity Management & Research Company (the investment adviser) and its affiliates provide the Fund with investment management related services for which the Fund pays a monthly management fee. The management fee is the sum of an individual fund fee rate that is based on an annual rate of .45% of the Fund's average net assets and an annualized group fee rate that averaged .24% during the period. The group fee rate is based upon the average net assets of all the mutual funds advised by the investment adviser, including any mutual funds previously advised by the investment adviser that are currently advised by Fidelity SelectCo, LLC, an affiliate of the investment adviser. The group fee rate decreases as assets under management increase and increases as assets under management decrease. For the reporting period, the total annual management fee rate was .69% of the Fund's average net assets.
Distribution and Service Plan Fees. In accordance with Rule 12b-1 of the 1940 Act, the Fund has adopted separate Distribution and Service Plans for each class of shares. Certain classes pay Fidelity Distributors Corporation (FDC), an affiliate of the investment adviser, separate Distribution and Service Fees, each of which is based on an annual percentage of each class' average net assets. In addition, FDC may pay financial intermediaries for selling shares of the Fund and providing shareholder support services. For the period, the Distribution and Service Fee rates, total fees and amounts retained by FDC were as follows:
| | Distribution Fee | Service Fee | Total Fees | Retained by FDC |
| Class A | -% | .25% | $66,593 | $871 |
| Class M | .25% | .25% | 31,241 | 143 |
| Class C | .75% | .25% | 148,939 | 14,540 |
| | | | $246,773 | $15,554 |
Sales Load. FDC may receive a front-end sales charge of up to 5.75% for selling Class A shares and 3.50% for selling Class M shares, some of which is paid to financial intermediaries for selling shares of the Fund. Depending on the holding period, FDC may receive contingent deferred sales charges levied on Class A, Class M and Class C redemptions. The deferred sales charges are 1.00% for Class C shares, 1.00% for certain purchases of Class A shares and .25% for certain purchases of Class M shares.
For the period, sales charge amounts retained by FDC were as follows:
| | Retained by FDC |
| Class A | $6,398 |
| Class M | 863 |
| Class C(a) | 1,095 |
| | $8,356 |
(a) When Class C shares are initially sold, FDC pays commissions from its own resources to financial intermediaries through which the sales are made.
Transfer Agent Fees. Fidelity Investments Institutional Operations Company, Inc., (FIIOC), an affiliate of the investment adviser, is the transfer, dividend disbursing and shareholder servicing agent for each class of the Fund. FIIOC receives account fees and asset-based fees that vary according to the account size and type of account of the shareholders of the respective classes of the Fund, except for Class Z. FIIOC receives an asset-based fee of Class Z's average net assets. FIIOC pays for typesetting, printing and mailing of shareholder reports, except proxy statements.
For the period, transfer agent fees for each class were as follows:
| | Amount | % of Class-Level Average Net Assets |
| Class A | $67,922 | .25 |
| Class M | 19,427 | .31 |
| Class C | 34,143 | .23 |
| Global Commodity Stock | 981,622 | .28 |
| Class I | 147,880 | .14 |
| Class Z | 12,564 | .04 |
| | $1,263,558 | |
Accounting and Security Lending Fees. Fidelity Service Company, Inc. (FSC), an affiliate of the investment adviser, maintains the Fund's accounting records. The accounting fee is based on the level of average net assets for each month. Prior to April 1, 2019, FSC had a separate agreement with the Fund for administration of the security lending program, based on the number and duration of lending transactions. For the period, the total fees paid for accounting and administration of securities lending were equivalent to an annual rate of .05%.
Brokerage Commissions. The Fund placed a portion of its portfolio transactions with brokerage firms which are affiliates of the investment adviser. Brokerage commissions are included in net realized gain (loss) and change in net unrealized appreciation (depreciation) in the Statement of Operations. The commissions paid to these affiliated firms were $3,586 for the period.
Interfund Trades. The Fund may purchase from or sell securities to other Fidelity Funds under procedures adopted by the Board. The procedures have been designed to ensure these interfund trades are executed in accordance with Rule 17a-7 of the 1940 Act. Interfund trades are included within the respective purchases and sales amounts shown in the Purchases and Sales of Investments note.
6. Committed Line of Credit.
The Fund participates with other funds managed by the investment adviser or an affiliate in a $4.25 billion credit facility (the "line of credit") to be utilized for temporary or emergency purposes to fund shareholder redemptions or for other short-term liquidity purposes. The Fund has agreed to pay commitment fees on its pro-rata portion of the line of credit, which amounted to $1,430 and is reflected in Miscellaneous expenses on the Statement of Operations. During the period, the Fund did not borrow on this line of credit.
7. Security Lending.
The Fund lends portfolio securities from time to time in order to earn additional income. For equity securities, lending agents are used, including National Financial Services (NFS), an affiliate of the Fund. Pursuant to a securities lending agreement, NFS will receive a fee, which is capped at 9.9% of daily lending revenue, for its services as lending agent. The Fund may lend securities to certain qualified borrowers, including NFS. On the settlement date of the loan, the Fund receives collateral (in the form of U.S. Treasury obligations, letters of credit and/or cash) against the loaned securities and maintains collateral in an amount not less than 100% of the market value of the loaned securities during the period of the loan. The market value of the loaned securities is determined at the close of business of the Fund and any additional required collateral is delivered to the Fund on the next business day. The Fund or borrower may terminate the loan at any time, and if the borrower defaults on its obligation to return the securities loaned because of insolvency or other reasons, the Fund may apply collateral received from the borrower against the obligation. The Fund may experience delays and costs in recovering the securities loaned. Any cash collateral received is invested in the Fidelity Securities Lending Cash Central Fund. The value of loaned securities and cash collateral at period end are disclosed on the Fund's Statement of Assets and Liabilities. At period end, there were no security loans outstanding with NFS, as affiliated borrower. Total fees paid by the Fund to NFS, as lending agent, amounted to $68. Security lending income represents the income earned on investing cash collateral, less rebates paid to borrowers and any lending agent fees associated with the loan, plus any premium payments received for lending certain types of securities. Security lending income is presented in the Statement of Operations as a component of income from Fidelity Central Funds, and includes $340 from securities loaned to NFS, as affiliated borrower.
8. Expense Reductions.
Commissions paid to certain brokers with whom the investment adviser, or its affiliates, places trades on behalf of the Fund include an amount in addition to trade execution, which may be rebated back to the Fund to offset certain expenses. This amount totaled $10,850 for the period.
In addition, during the period the investment adviser reimbursed and/or waived a portion of fund-level operating expenses in the amount of $4,153 and a portion of class-level operating expenses as follows:
| | Amount |
| Class A | $782 |
| Class M | 193 |
| Class C | 571 |
| Global Commodity Stock | 10,955 |
| Class I | 3,278 |
| Class Z | 222 |
| | $16,001 |
9. Distributions to Shareholders.
Distributions to shareholders of each class were as follows:
| | Year ended
October 31, 2019 | Year ended
October 31, 2018 |
| Distributions to shareholders | | |
| Class A | $483,346 | $309,556 |
| Class M | 100,322 | 55,615 |
| Class C | 200,915 | 53,428 |
| Global Commodity Stock | 7,706,193 | 5,313,895 |
| Class I | 2,518,989 | 1,669,657 |
| Class Z | 157,858 | – |
| Total | $11,167,623 | $7,402,151 |
10. Share Transactions.
Share transactions for each class were as follows and may contain automatic conversions between classes or exchanges between affiliated funds:
| | Shares | Shares | Dollars | Dollars |
| | Year ended October 31, 2019 | Year ended October 31, 2018(a) | Year ended October 31, 2019 | Year ended October 31, 2018(a) |
| Class A | | | | |
| Shares sold | 585,052 | 961,117 | $7,162,948 | $12,976,845 |
| Reinvestment of distributions | 41,258 | 24,771 | 479,423 | 306,172 |
| Shares redeemed | (698,260) | (1,173,857) | (8,497,822) | (15,724,822) |
| Net increase (decrease) | (71,950) | (187,969) | $(855,451) | $(2,441,805) |
| Class M | | | | |
| Shares sold | 62,259 | 228,243 | $747,221 | $3,056,866 |
| Reinvestment of distributions | 8,615 | 4,488 | 100,105 | 55,468 |
| Shares redeemed | (205,121) | (200,167) | (2,471,997) | (2,622,769) |
| Net increase (decrease) | (134,247) | 32,564 | $(1,624,671) | $489,565 |
| Class C | | | | |
| Shares sold | 211,795 | 880,029 | $2,546,657 | $11,853,888 |
| Reinvestment of distributions | 17,161 | 4,237 | 198,038 | 52,034 |
| Shares redeemed | (983,587) | (340,536) | (11,964,913) | (4,503,052) |
| Net increase (decrease) | (754,631) | 543,730 | $(9,220,218) | $7,402,870 |
| Global Commodity Stock | | | | |
| Shares sold | 7,295,499 | 17,721,753 | $88,639,134 | $231,763,153 |
| Reinvestment of distributions | 615,573 | 414,534 | 7,140,644 | 5,123,639 |
| Shares redeemed | (16,479,603) | (9,429,371) | (193,789,885) | (125,657,701) |
| Net increase (decrease) | (8,568,531) | 8,706,916 | $(98,010,107) | $111,229,091 |
| Class I | | | | |
| Shares sold | 1,953,699 | 3,453,489 | $23,249,341 | $46,712,238 |
| Reinvestment of distributions | 137,668 | 65,617 | 1,596,951 | 810,368 |
| Shares redeemed | (3,129,828) | (3,065,738) | (37,373,023) | (39,890,323) |
| Net increase (decrease) | (1,038,461) | 453,368 | $(12,526,731) | $7,632,283 |
| Class Z | | | | |
| Shares sold | 9,203,502 | 412,977 | $106,244,072 | $5,219,125 |
| Reinvestment of distributions | 5,496 | – | 63,640 | – |
| Shares redeemed | (1,027,006) | (2,138) | (12,521,610) | (26,499) |
| Net increase (decrease) | 8,181,992 | 410,839 | $93,786,102 | $5,192,626 |
(a) Share transactions for Class Z are for the period October 2, 2018 (commencement of sale of shares) to October 31, 2018.
11. Other.
The Fund's organizational documents provide former and current trustees and officers with a limited indemnification against liabilities arising in connection with the performance of their duties to the Fund. In the normal course of business, the Fund may also enter into contracts that provide general indemnifications. The Fund's maximum exposure under these arrangements is unknown as this would be dependent on future claims that may be made against the Fund. The risk of material loss from such claims is considered remote.
At the end of the period, VIP FundsManager 60% Portfolio was the owner of record of approximately 11% of the total outstanding shares of the Fund. Mutual funds managed by the investment adviser or its affiliates were the owners of record, in the aggregate, of approximately 23% of the total outstanding shares of the Fund.
Report of Independent Registered Public Accounting Firm
To the Board of Trustees of Fidelity Investment Trust and Shareholders of Fidelity Global Commodity Stock Fund:
Opinion on the Financial Statements
We have audited the accompanying statement of assets and liabilities, including the schedule of investments, of Fidelity Global Commodity Stock Fund (one of the funds constituting Fidelity Investment Trust, referred to hereafter as the “Fund”) as of October 31, 2019, the related statement of operations for the year ended October 31, 2019, the statement of changes in net assets for each of the two years in the period ended October 31, 2019, including the related notes, and the financial highlights for each of the periods indicated therein (collectively referred to as the “financial statements”). In our opinion, the financial statements present fairly, in all material respects, the financial position of the Fund as of October 31, 2019, the results of its operations for the year then ended, the changes in its net assets for each of the two years in the period ended October 31, 2019 and the financial highlights for each of the periods indicated therein in conformity with accounting principles generally accepted in the United States of America.
Basis for Opinion
These financial statements are the responsibility of the Fund’s management. Our responsibility is to express an opinion on the Fund’s financial statements based on our audits. We are a public accounting firm registered with the Public Company Accounting Oversight Board (United States) (PCAOB) and are required to be independent with respect to the Fund in accordance with the U.S. federal securities laws and the applicable rules and regulations of the Securities and Exchange Commission and the PCAOB.
We conducted our audits of these financial statements in accordance with the standards of the PCAOB. Those standards require that we plan and perform the audit to obtain reasonable assurance about whether the financial statements are free of material misstatement, whether due to error or fraud.
Our audits included performing procedures to assess the risks of material misstatement of the financial statements, whether due to error or fraud, and performing procedures that respond to those risks. Such procedures included examining, on a test basis, evidence regarding the amounts and disclosures in the financial statements. Our audits also included evaluating the accounting principles used and significant estimates made by management, as well as evaluating the overall presentation of the financial statements. Our procedures included confirmation of securities owned as of October 31, 2019 by correspondence with the custodian. We believe that our audits provide a reasonable basis for our opinion.
PricewaterhouseCoopers LLP
Boston, Massachusetts
December 11, 2019
We have served as the auditor of one or more investment companies in the Fidelity group of funds since 1932.
Trustees and Officers
The Trustees, Members of the Advisory Board (if any), and officers of the trust and fund, as applicable, are listed below. The Board of Trustees governs the fund and is responsible for protecting the interests of shareholders. The Trustees are experienced executives who meet periodically throughout the year to oversee the fund's activities, review contractual arrangements with companies that provide services to the fund, oversee management of the risks associated with such activities and contractual arrangements, and review the fund's performance. Except for Jonathan Chiel, each of the Trustees oversees 298 funds. Mr. Chiel oversees 171 funds.
The Trustees hold office without limit in time except that (a) any Trustee may resign; (b) any Trustee may be removed by written instrument, signed by at least two-thirds of the number of Trustees prior to such removal; (c) any Trustee who requests to be retired or who has become incapacitated by illness or injury may be retired by written instrument signed by a majority of the other Trustees; and (d) any Trustee may be removed at any special meeting of shareholders by a two-thirds vote of the outstanding voting securities of the trust. Each Trustee who is not an interested person (as defined in the 1940 Act) of the trust and the fund is referred to herein as an Independent Trustee. Each Independent Trustee shall retire not later than the last day of the calendar year in which his or her 75th birthday occurs. The Independent Trustees may waive this mandatory retirement age policy with respect to individual Trustees. Officers and Advisory Board Members hold office without limit in time, except that any officer or Advisory Board Member may resign or may be removed by a vote of a majority of the Trustees at any regular meeting or any special meeting of the Trustees. Except as indicated, each individual has held the office shown or other offices in the same company for the past five years.
The fund's Statement of Additional Information (SAI) includes more information about the Trustees. To request a free copy, call Fidelity at 1-800-544-8544 if you’re an individual investing directly with Fidelity, call 1-800-835-5092 if you’re a plan sponsor or participant with Fidelity as your recordkeeper or call 1-877-208-0098 on institutional accounts or if you’re an advisor or invest through one.
Experience, Skills, Attributes, and Qualifications of the Trustees. The Governance and Nominating Committee has adopted a statement of policy that describes the experience, qualifications, attributes, and skills that are necessary and desirable for potential Independent Trustee candidates (Statement of Policy). The Board believes that each Trustee satisfied at the time he or she was initially elected or appointed a Trustee, and continues to satisfy, the standards contemplated by the Statement of Policy. The Governance and Nominating Committee also engages professional search firms to help identify potential Independent Trustee candidates who have the experience, qualifications, attributes, and skills consistent with the Statement of Policy. From time to time, additional criteria based on the composition and skills of the current Independent Trustees, as well as experience or skills that may be appropriate in light of future changes to board composition, business conditions, and regulatory or other developments, have also been considered by the professional search firms and the Governance and Nominating Committee. In addition, the Board takes into account the Trustees' commitment and participation in Board and committee meetings, as well as their leadership of standing and ad hoc committees throughout their tenure.
In determining that a particular Trustee was and continues to be qualified to serve as a Trustee, the Board has considered a variety of criteria, none of which, in isolation, was controlling. The Board believes that, collectively, the Trustees have balanced and diverse experience, qualifications, attributes, and skills, which allow the Board to operate effectively in governing the fund and protecting the interests of shareholders. Information about the specific experience, skills, attributes, and qualifications of each Trustee, which in each case led to the Board's conclusion that the Trustee should serve (or continue to serve) as a trustee of the fund, is provided below.
Board Structure and Oversight Function. James C. Curvey is an interested person and currently serves as Chairman. The Trustees have determined that an interested Chairman is appropriate and benefits shareholders because an interested Chairman has a personal and professional stake in the quality and continuity of services provided to the fund. Independent Trustees exercise their informed business judgment to appoint an individual of their choosing to serve as Chairman, regardless of whether the Trustee happens to be independent or a member of management. The Independent Trustees have determined that they can act independently and effectively without having an Independent Trustee serve as Chairman and that a key structural component for assuring that they are in a position to do so is for the Independent Trustees to constitute a substantial majority for the Board. The Independent Trustees also regularly meet in executive session. Ned C. Lautenbach serves as Chairman of the Independent Trustees and as such (i) acts as a liaison between the Independent Trustees and management with respect to matters important to the Independent Trustees and (ii) with management prepares agendas for Board meetings.
Fidelity® funds are overseen by different Boards of Trustees. The fund's Board oversees Fidelity's high income and certain equity funds, and other Boards oversee Fidelity's investment-grade bond, money market, asset allocation, and other equity funds. The asset allocation funds may invest in Fidelity® funds overseen by the fund's Board. The use of separate Boards, each with its own committee structure, allows the Trustees of each group of Fidelity® funds to focus on the unique issues of the funds they oversee, including common research, investment, and operational issues. On occasion, the separate Boards establish joint committees to address issues of overlapping consequences for the Fidelity® funds overseen by each Board.
The Trustees operate using a system of committees to facilitate the timely and efficient consideration of all matters of importance to the Trustees, the fund, and fund shareholders and to facilitate compliance with legal and regulatory requirements and oversight of the fund's activities and associated risks. The Board, acting through its committees, has charged FMR and its affiliates with (i) identifying events or circumstances the occurrence of which could have demonstrably adverse effects on the fund's business and/or reputation; (ii) implementing processes and controls to lessen the possibility that such events or circumstances occur or to mitigate the effects of such events or circumstances if they do occur; and (iii) creating and maintaining a system designed to evaluate continuously business and market conditions in order to facilitate the identification and implementation processes described in (i) and (ii) above. Because the day-to-day operations and activities of the fund are carried out by or through FMR, its affiliates, and other service providers, the fund's exposure to risks is mitigated but not eliminated by the processes overseen by the Trustees. While each of the Board's committees has responsibility for overseeing different aspects of the fund's activities, oversight is exercised primarily through the Operations, Audit, and Compliance Committees. Appropriate personnel, including but not limited to the fund's Chief Compliance Officer (CCO), FMR's internal auditor, the independent accountants, the fund's Treasurer and portfolio management personnel, make periodic reports to the Board's committees, as appropriate, including an annual review of Fidelity's risk management program for the Fidelity® funds. The responsibilities of each standing committee, including their oversight responsibilities, are described further under "Standing Committees of the Trustees."
Interested Trustees*:
Correspondence intended for a Trustee who is an interested person may be sent to Fidelity Investments, 245 Summer Street, Boston, Massachusetts 02210.
Name, Year of Birth; Principal Occupations and Other Relevant Experience+
Jonathan Chiel (1957)
Year of Election or Appointment: 2016
Trustee
Mr. Chiel also serves as Trustee of other Fidelity® funds. Mr. Chiel is Executive Vice President and General Counsel for FMR LLC (diversified financial services company, 2012-present). Previously, Mr. Chiel served as general counsel (2004-2012) and senior vice president and deputy general counsel (2000-2004) for John Hancock Financial Services; a partner with Choate, Hall & Stewart (1996-2000) (law firm); and an Assistant United States Attorney for the United States Attorney’s Office of the District of Massachusetts (1986-95), including Chief of the Criminal Division (1993-1995). Mr. Chiel is a director on the boards of the Boston Bar Foundation and the Maimonides School.
James C. Curvey (1935)
Year of Election or Appointment: 2007
Trustee
Chairman of the Board of Trustees
Mr. Curvey also serves as Trustee of other Fidelity® funds. Mr. Curvey is Vice Chairman (2007-present) and Director of FMR LLC (diversified financial services company). In addition, Mr. Curvey is an Overseer Emeritus for the Boston Symphony Orchestra, a Director of Artis-Naples, and a Trustee of Brewster Academy in Wolfeboro, New Hampshire. Previously, Mr. Curvey served as a Director of Fidelity Research & Analysis Co. (investment adviser firm, 2009-2018), Director of Fidelity Investments Money Management, Inc. (investment adviser firm, 2009-2014) and a Director of FMR and FMR Co., Inc. (investment adviser firms, 2007-2014).
* Determined to be an “Interested Trustee” by virtue of, among other things, his or her affiliation with the trust or various entities under common control with FMR.
+ The information includes the Trustee's principal occupation during the last five years and other information relating to the experience, attributes, and skills relevant to the Trustee's qualifications to serve as a Trustee, which led to the conclusion that the Trustee should serve as a Trustee for the fund.
Independent Trustees:
Correspondence intended for an Independent Trustee may be sent to Fidelity Investments, P.O. Box 55235, Boston, Massachusetts 02205-5235.
Name, Year of Birth; Principal Occupations and Other Relevant Experience+
Dennis J. Dirks (1948)
Year of Election or Appointment: 2005
Trustee
Mr. Dirks also serves as Trustee of other Fidelity® funds. Prior to his retirement in May 2003, Mr. Dirks was Chief Operating Officer and a member of the Board of The Depository Trust & Clearing Corporation (DTCC). He also served as President, Chief Operating Officer, and Board member of The Depository Trust Company (DTC) and President and Board member of the National Securities Clearing Corporation (NSCC). In addition, Mr. Dirks served as Chief Executive Officer and Board member of the Government Securities Clearing Corporation, Chief Executive Officer and Board member of the Mortgage-Backed Securities Clearing Corporation, as a Trustee and a member of the Finance Committee of Manhattan College (2005-2008), as a Trustee and a member of the Finance Committee of AHRC of Nassau County (2006-2008), as a member of the Independent Directors Council (IDC) Governing Council (2010-2015), and as a member of the Board of Directors for The Brookville Center for Children’s Services, Inc. (2009-2017). Mr. Dirks is a member of the Finance Committee (2016-present) and Board of Directors (2017-present) and is Treasurer (2018-present) of the Asolo Repertory Theatre.
Donald F. Donahue (1950)
Year of Election or Appointment: 2018
Trustee
Mr. Donahue also serves as a Trustee of other Fidelity® funds. Mr. Donahue is President and Chief Executive Officer of Miranda Partners, LLC (risk consulting for the financial services industry, 2012-present). Previously, Mr. Donahue served as a Member of the Advisory Board of certain Fidelity® funds (2015-2018) and Chief Executive Officer (2006-2012), Chief Operating Officer (2003-2006), and Managing Director, Customer Marketing and Development (1999-2003) of The Depository Trust & Clearing Corporation (financial markets infrastructure). Mr. Donahue serves as a Member (2007-present) and Co-Chairman (2016-present) of the Board of Directors of United Way of New York, Member of the Board of Directors of NYC Leadership Academy (2012-present) and Member of the Board of Advisors of Ripple Labs, Inc. (financial services, 2015-present). He also served as Chairman (2010-2012) and Member of the Board of Directors (2012-2013) of Omgeo, LLC (financial services), Treasurer of United Way of New York (2012-2016), and Member of the Board of Directors of XBRL US (financial services non-profit, 2009-2012) and the International Securities Services Association (2009-2012).
Alan J. Lacy (1953)
Year of Election or Appointment: 2008
Trustee
Mr. Lacy also serves as Trustee of other Fidelity® funds. Mr. Lacy serves as a Director of Bristol-Myers Squibb Company (global pharmaceuticals, 2008-present). He is a Trustee of the California Chapter of The Nature Conservancy (2015-present) and a Director of the Center for Advanced Study in the Behavioral Sciences at Stanford University (2015-present). In addition, Mr. Lacy served as Senior Adviser (2007-2014) of Oak Hill Capital Partners, L.P. (private equity) and also served as Chief Executive Officer (2005) and Vice Chairman (2005-2006) of Sears Holdings Corporation (retail) and Chief Executive Officer and Chairman of the Board of Sears, Roebuck and Co. (retail, 2000-2005). Previously, Mr. Lacy served as Chairman (2014-2017) and a member (2010-2017) of the Board of Directors of Dave & Buster’s Entertainment, Inc. (restaurant and entertainment complexes), as Chairman (2008-2011) and a member (2006-2015) of the Board of Trustees of the National Parks Conservation Association, and as a member of the Board of Directors for The Hillman Companies, Inc. (hardware wholesalers, 2010-2014), Earth Fare, Inc. (retail grocery, 2010-2014), and The Western Union Company (global money transfer, 2006-2011).
Ned C. Lautenbach (1944)
Year of Election or Appointment: 2000
Trustee
Chairman of the Independent Trustees
Mr. Lautenbach also serves as Trustee of other Fidelity® funds. Mr. Lautenbach currently serves as Chair (2018-present) and Member (2013-present) of the Board of Governors, State University System of Florida and is a member of the Council on Foreign Relations (1994-present). He is also a member and has most recently served as Chairman of the Board of Directors of Artis-Naples (2012-present). Previously, Mr. Lautenbach served as a member and then Lead Director of the Board of Directors of Eaton Corporation (diversified industrial, 1997-2016). He was also a Partner and Advisory Partner at Clayton, Dubilier & Rice, LLC (private equity investment, 1998-2010), as well as a Director of Sony Corporation (2006-2007). In addition, Mr. Lautenbach also had a 30-year career with IBM (technology company) during which time he served as Senior Vice President and a member of the Corporate Executive Committee (1968-1998).
Joseph Mauriello (1944)
Year of Election or Appointment: 2008
Trustee
Mr. Mauriello also serves as Trustee of other Fidelity® funds. Prior to his retirement in January 2006, Mr. Mauriello served in numerous senior management positions including Deputy Chairman and Chief Operating Officer (2004-2005), and Vice Chairman of Financial Services (2002-2004) of KPMG LLP US (professional services, 1965-2005). Mr. Mauriello currently serves as a member of the Independent Directors Council (IDC) Governing Council (2015-present). Previously, Mr. Mauriello served as a member of the Board of Directors of XL Group plc. (global insurance and re-insurance, 2006-2018).
Cornelia M. Small (1944)
Year of Election or Appointment: 2005
Trustee
Ms. Small also serves as Trustee of other Fidelity® funds. Ms. Small is a member of the Board of Directors (2009-present) and Chair of the Investment Committee (2010-present) of the Teagle Foundation. Ms. Small also serves on the Investment Committee of the Berkshire Taconic Community Foundation (2008-present). Previously, Ms. Small served as Chairperson (2002-2008) and a member of the Investment Committee and Chairperson (2008-2012) and a member of the Board of Trustees of Smith College. In addition, Ms. Small served as Chief Investment Officer, Director of Global Equity Investments, and a member of the Board of Directors of Scudder, Stevens & Clark and Scudder Kemper Investments.
Garnett A. Smith (1947)
Year of Election or Appointment: 2018
Trustee
Mr. Smith also serves as Trustee of other Fidelity® funds. Prior to Mr. Smith's retirement, he served as Chairman and Chief Executive Officer of Inbrand Corp. (manufacturer of personal absorbent products, 1990-1997). He also served as President (1986-1990) of Inbrand Corp. Prior to his employment with Inbrand Corp., he was employed by a retail fabric chain and North Carolina National Bank. In addition, Mr. Smith served as a Member of the Advisory Board of certain Fidelity® funds (2012-2013) and as a board member of the Jackson Hole Land Trust (2009-2012).
David M. Thomas (1949)
Year of Election or Appointment: 2008
Trustee
Mr. Thomas also serves as Trustee of other Fidelity® funds. Mr. Thomas serves as Non-Executive Chairman of the Board of Directors of Fortune Brands Home and Security (home and security products, 2011-present) and as a member of the Board of Directors (2004-present) and Presiding Director (2013-present) of Interpublic Group of Companies, Inc. (marketing communication). Previously, Mr. Thomas served as Executive Chairman (2005-2006) and Chairman and Chief Executive Officer (2000-2005) of IMS Health, Inc. (pharmaceutical and healthcare information solutions), a Director of Fortune Brands, Inc. (consumer products, 2000-2011), and a member of the Board of Trustees of the University of Florida (2013-2018).
+ The information includes the Trustee's principal occupation during the last five years and other information relating to the experience, attributes, and skills relevant to the Trustee's qualifications to serve as a Trustee, which led to the conclusion that the Trustee should serve as a Trustee for the fund.
Advisory Board Members and Officers:
Correspondence intended for a Member of the Advisory Board (if any) may be sent to Fidelity Investments, P.O. Box 55235, Boston, Massachusetts 02205-5235. Correspondence intended for an officer or Peter S. Lynch may be sent to Fidelity Investments, 245 Summer Street, Boston, Massachusetts 02210. Officers appear below in alphabetical order.
Name, Year of Birth; Principal Occupation
Vicki L. Fuller (1957)
Year of Election or Appointment: 2018
Member of the Advisory Board
Ms. Fuller also serves as Member of the Advisory Board of other Fidelity® funds. Ms. Fuller serves as a member of the Board of Directors, Audit Committee, and Nominating and Governance Committee of The Williams Companies, Inc. (natural gas infrastructure, 2018-present). Previously, Ms. Fuller served as the Chief Investment Officer of the New York State Common Retirement Fund (2012-2018) and held a variety of positions at AllianceBernstein L.P. (global asset management, 1985-2012), including Managing Director (2006-2012) and Senior Vice President and Senior Portfolio Manager (2001-2006).
Peter S. Lynch (1944)
Year of Election or Appointment: 2003
Member of the Advisory Board
Mr. Lynch also serves as Member of the Advisory Board of other Fidelity® funds. Mr. Lynch is Vice Chairman and a Director of FMR (investment adviser firm) and FMR Co., Inc. (investment adviser firm). In addition, Mr. Lynch serves as a Trustee of Boston College and as the Chairman of the Inner-City Scholarship Fund. Previously, Mr. Lynch served on the Special Olympics International Board of Directors (1997-2006).
Michael E. Wiley (1950)
Year of Election or Appointment: 2018
Member of the Advisory Board
Mr. Wiley also serves as Trustee or Member of the Advisory Board of other Fidelity® funds. Mr. Wiley serves as a Director of High Point Resources (exploration and production, 2005-present). Previously, Mr. Wiley served as a Director of Andeavor Corporation (independent oil refiner and marketer, 2005-2018), a Director of Andeavor Logistics LP (natural resources logistics, 2015-2018), a Director of Post Oak Bank (privately-held bank, 2004-2018), a Director of Asia Pacific Exploration Consolidated (international oil and gas exploration and production, 2008-2013), a member of the Board of Trustees of the University of Tulsa (2000-2006; 2007-2010), a Senior Energy Advisor of Katzenbach Partners, LLC (consulting, 2006-2007), an Advisory Director of Riverstone Holdings (private investment), a Director of Spinnaker Exploration Company (exploration and production, 2001-2005) and Chairman, President, and CEO of Baker Hughes, Inc. (oilfield services, 2000-2004).
Elizabeth Paige Baumann (1968)
Year of Election or Appointment: 2017
Anti-Money Laundering (AML) Officer
Ms. Baumann also serves as AML Officer of other funds. She is Chief AML Officer (2012-present) and Senior Vice President (2014-present) of FMR LLC (diversified financial services company) and is an employee of Fidelity Investments. Previously, Ms. Baumann served as AML Officer of the funds (2012-2016), and Vice President (2007-2014) and Deputy Anti-Money Laundering Officer (2007-2012) of FMR LLC.
Craig S. Brown (1977)
Year of Election or Appointment: 2019
Assistant Treasurer
Mr. Brown also serves as Assistant Treasurer of other funds. Mr. Brown is an employee of Fidelity Investments (2013-present).
John J. Burke III (1964)
Year of Election or Appointment: 2018
Chief Financial Officer
Mr. Burke also serves as Chief Financial Officer of other funds. Mr. Burke serves as Head of Investment Operations for Fidelity Fund and Investment Operations (2018-present) and is an employee of Fidelity Investments (1998-present). Previously Mr. Burke served as head of Asset Management Investment Operations (2012-2018).
William C. Coffey (1969)
Year of Election or Appointment: 2019
Assistant Secretary
Mr. Coffey also serves as Assistant Secretary of other funds. He is Senior Vice President and Deputy General Counsel of FMR LLC (diversified financial services company, 2010-present), and is an employee of Fidelity Investments. Previously, Mr. Coffey served as Secretary and CLO of certain funds (2018-2019); CLO, Secretary, and Senior Vice President of Fidelity Management & Research Company and FMR Co., Inc. (investment adviser firms, 2018-2019); Secretary of Fidelity SelectCo, LLC and Fidelity Investments Money Management, Inc. (investment adviser firms, 2018-2019); CLO of Fidelity Management & Research (Hong Kong) Limited, FMR Investment Management (UK) Limited, and Fidelity Management & Research (Japan) Limited (investment adviser firms, 2018-2019); and Assistant Secretary of certain funds (2009-2018).
Timothy M. Cohen (1969)
Year of Election or Appointment: 2018
Vice President
Mr. Cohen also serves as Vice President of other funds. Mr. Cohen serves as Executive Vice President of Fidelity SelectCo, LLC (2019-present), Co-Head of Equity (2018-present), a Director of Fidelity Management & Research (Japan) Limited (investment adviser firm, 2016-present), and is an employee of Fidelity Investments. Previously, Mr. Cohen served as Head of Global Equity Research (2016-2018), Chief Investment Officer - Equity and a Director of Fidelity Management & Research (U.K.) Inc. (investment adviser firm, 2013-2015) and as a Director of Fidelity Management & Research (Hong Kong) Limited (investment adviser firm, 2017).
Jonathan Davis (1968)
Year of Election or Appointment: 2010
Assistant Treasurer
Mr. Davis also serves as Assistant Treasurer of other funds. Mr. Davis serves as Assistant Treasurer of FMR Capital, Inc. (2017-present) and is an employee of Fidelity Investments. Previously, Mr. Davis served as Vice President and Associate General Counsel of FMR LLC (diversified financial services company, 2003-2010).
Adrien E. Deberghes (1967)
Year of Election or Appointment: 2016
Assistant Treasurer
Mr. Deberghes also serves as an officer of other funds. He serves as Assistant Treasurer of FMR Capital, Inc. (2017-present), Executive Vice President of Fidelity Investments Money Management, Inc. (FIMM) (investment adviser firm, 2016-present), and is an employee of Fidelity Investments (2008-present). Previously, Mr. Deberghes served as President and Treasurer of certain Fidelity® funds (2013-2018). Prior to joining Fidelity Investments, Mr. Deberghes was Senior Vice President of Mutual Fund Administration at State Street Corporation (2007-2008), Senior Director of Mutual Fund Administration at Investors Bank & Trust (2005-2007), and Director of Finance for Dunkin' Brands (2000-2005). Previously, Mr. Deberghes served in other fund officer roles.
Laura M. Del Prato (1964)
Year of Election or Appointment: 2018
Assistant Treasurer
Ms. Del Prato also serves as an officer of other funds. Ms. Del Prato is an employee of Fidelity Investments (2017-present). Prior to joining Fidelity Investments, Ms. Del Prato served as a Managing Director and Treasurer of the JPMorgan Mutual Funds (2014-2017). Prior to JPMorgan, Ms. Del Prato served as a partner at Cohen Fund Audit Services (accounting firm, 2012-2013) and KPMG LLP (accounting firm, 2004-2012).
Colm A. Hogan (1973)
Year of Election or Appointment: 2016
Deputy Treasurer
Mr. Hogan also serves as an officer of other funds. Mr. Hogan serves as Assistant Treasurer of FMR Capital, Inc. (2017-present) and is an employee of Fidelity Investments (2005-present). Previously, Mr. Hogan served as Assistant Treasurer of certain Fidelity® funds (2016-2018).
Pamela R. Holding (1964)
Year of Election or Appointment: 2018
Vice President
Ms. Holding also serves as Vice President of other funds. Ms. Holding serves as Executive Vice President of Fidelity SelectCo, LLC (2019-present), Co-Head of Equity (2018-present) and is an employee of Fidelity Investments (2013-present). Previously, Ms. Holding served as Chief Investment Officer of Fidelity Institutional Asset Management (2013-2018).
Cynthia Lo Bessette (1969)
Year of Election or Appointment: 2019
Secretary and Chief Legal Officer (CLO)
Ms. Lo Bessette also serves as Secretary and CLO of other funds. Ms. Lo Bessette serves as CLO, Secretary, and Senior Vice President of Fidelity Management & Research Company and FMR Co., Inc. (investment adviser firms, 2019-present); Secretary of Fidelity SelectCo, LLC and Fidelity Investments Money Management, Inc. (investment adviser firms, 2019-present); and CLO of Fidelity Management & Research (Hong Kong) Limited, FMR Investment Management (UK) Limited, and Fidelity Management & Research (Japan) Limited (investment adviser firms, 2019-present). She is a Senior Vice President and Deputy General Counsel of FMR LLC (diversified financial services company, 2019-present), and is an employee of Fidelity Investments. Previously, Ms. Lo Bessette served as Executive Vice President, General Counsel (2016-2019) and Senior Vice President, Deputy General Counsel (2015-2016) of OppenheimerFunds (investment management company) and Deputy Chief Legal Officer (2013-2015) of Jennison Associates LLC (investment adviser firm).
Chris Maher (1972)
Year of Election or Appointment: 2013
Assistant Treasurer
Mr. Maher serves as Assistant Treasurer of other funds. Mr. Maher is Vice President of Valuation Oversight, serves as Assistant Treasurer of FMR Capital, Inc. (2017-present), and is an employee of Fidelity Investments. Previously, Mr. Maher served as Vice President of Asset Management Compliance (2013), Vice President of the Program Management Group of FMR (investment adviser firm, 2010-2013), and Vice President of Valuation Oversight (2008-2010).
Kenneth B. Robins (1969)
Year of Election or Appointment: 2016
Chief Compliance Officer
Mr. Robins also serves as an officer of other funds. Mr. Robins serves as Compliance Officer of Fidelity Management & Research Company and FMR Co., Inc. (investment adviser firms, 2016-present) and is an employee of Fidelity Investments (2004-present). Previously, Mr. Robins served as Executive Vice President of Fidelity Investments Money Management, Inc. (investment adviser firm, 2013-2016) and served in other fund officer roles.
Stacie M. Smith (1974)
Year of Election or Appointment: 2016
President and Treasurer
Ms. Smith also serves as an officer of other funds. Ms. Smith serves as Assistant Treasurer of FMR Capital, Inc. (2017-present), is an employee of Fidelity Investments (2009-present), and has served in other fund officer roles. Prior to joining Fidelity Investments, Ms. Smith served as Senior Audit Manager of Ernst & Young LLP (accounting firm, 1996-2009). Previously, Ms. Smith served as Assistant Treasurer (2013-2018) and Deputy Treasurer (2013-2016) of certain Fidelity® funds.
Marc L. Spector (1972)
Year of Election or Appointment: 2016
Assistant Treasurer
Mr. Spector also serves as an officer of other funds. Mr. Spector serves as Assistant Treasurer of FMR Capital, Inc. (2017-present) and is an employee of Fidelity Investments (2016-present). Prior to joining Fidelity Investments, Mr. Spector served as Director at the Siegfried Group (accounting firm, 2013-2016), and prior to Siegfried Group as audit senior manager at Deloitte & Touche (accounting firm, 2005-2013).
Jim Wegmann (1979)
Year of Election or Appointment: 2019
Assistant Treasurer
Mr. Wegmann also serves as Assistant Treasurer of other funds. Mr. Wegmann is an employee of Fidelity Investments (2011-present).
Shareholder Expense Example
As a shareholder of the Fund, you incur two types of costs: (1) transaction costs, including sales charges (loads) on purchase payments or redemption proceeds, and (2) ongoing costs, including management fees, distribution and/or service (12b-1) fees and other Fund expenses. This Example is intended to help you understand your ongoing costs (in dollars) of investing in the Fund and to compare these costs with the ongoing costs of investing in other mutual funds.
The Example is based on an investment of $1,000 invested at the beginning of the period and held for the entire period (May 1, 2019 to October 31, 2019).
Actual Expenses
The first line of the accompanying table for each class of the Fund provides information about actual account values and actual expenses. You may use the information in this line, together with the amount you invested, to estimate the expenses that you paid over the period. Simply divide your account value by $1,000.00 (for example, an $8,600 account value divided by $1,000.00 = 8.6), then multiply the result by the number in the first line for a class of the Fund under the heading entitled "Expenses Paid During Period" to estimate the expenses you paid on your account during this period. In addition, the Fund, as a shareholder in the underlying Fidelity Central Funds, will indirectly bear its pro-rata share of the fees and expenses incurred by the underlying Fidelity Central Funds. These fees and expenses are not included in the Fund's annualized expense ratio used to calculate the expense estimate in the table below.
Hypothetical Example for Comparison Purposes
The second line of the accompanying table for each class of the Fund provides information about hypothetical account values and hypothetical expenses based on a Class' actual expense ratio and an assumed rate of return of 5% per year before expenses, which is not the Class' actual return. The hypothetical account values and expenses may not be used to estimate the actual ending account balance or expenses you paid for the period. You may use this information to compare the ongoing costs of investing in the Fund and other funds. To do so, compare this 5% hypothetical example with the 5% hypothetical examples that appear in the shareholder reports of the other funds. In addition, the Fund, as a shareholder in the underlying Fidelity Central Funds, will indirectly bear its pro-rata share of the fees and expenses incurred by the underlying Fidelity Central Funds. These fees and expenses are not included in the Fund's annualized expense ratio used to calculate the expense estimate in the table below.
Please note that the expenses shown in the table are meant to highlight your ongoing costs only and do not reflect any transaction costs. Therefore, the second line of the table is useful in comparing ongoing costs only, and will not help you determine the relative total costs of owning different funds. In addition, if these transactional costs were included, your costs would have been higher.
| | Annualized Expense Ratio-A | Beginning
Account Value
May 1, 2019 | Ending
Account Value
October 31, 2019 | Expenses Paid
During Period-B
May 1, 2019
to October 31, 2019 |
| Class A | 1.27% | | | |
| Actual | | $1,000.00 | $978.20 | $6.33 |
| Hypothetical-C | | $1,000.00 | $1,018.80 | $6.46 |
| Class M | 1.57% | | | |
| Actual | | $1,000.00 | $977.40 | $7.83 |
| Hypothetical-C | | $1,000.00 | $1,017.29 | $7.98 |
| Class C | 1.97% | | | |
| Actual | | $1,000.00 | $974.80 | $9.81 |
| Hypothetical-C | | $1,000.00 | $1,015.27 | $10.01 |
| Global Commodity Stock | 1.02% | | | |
| Actual | | $1,000.00 | $979.00 | $5.09 |
| Hypothetical-C | | $1,000.00 | $1,020.06 | $5.19 |
| Class I | .90% | | | |
| Actual | | $1,000.00 | $979.90 | $4.49 |
| Hypothetical-C | | $1,000.00 | $1,020.67 | $4.58 |
| Class Z | .84% | | | |
| Actual | | $1,000.00 | $980.60 | $4.19 |
| Hypothetical-C | | $1,000.00 | $1,020.97 | $4.28 |
A Annualized expense ratio reflects expenses net of applicable fee waivers.
B Expenses are equal to each Class' annualized expense ratio, multiplied by the average account value over the period, multiplied by 184/365 (to reflect the one-half year period).
C 5% return per year before expenses
Distributions (Unaudited)
Class A designates 42%; Class M designates 51%; Class C designates 71%; Global Commodity Stock designates 36%; Class I designates 34%; and Class Z designates 32% of the dividends distributed during the fiscal year as qualifying for the dividends–received deduction for corporate shareholders.
Class A, Class M, Class C, Global Commodity Stock, Class I, and Class Z designate 100% of the dividends distributed during the fiscal year as amounts which may be taken into account as a dividend for purposes of the maximum rate under section 1(h)(11) of the Internal Revenue Code.
The amounts per share which represent income derived from sources within, and taxes paid to, foreign countries or possessions of the United States are as follows:
| | Pay Date | Income | Taxes |
| Fidelity Global Commodity Stock Fund | | | |
| Class A | 12/10/18 | $0.2271 | $0.0111 |
| Class M | 12/10/18 | $0.1871 | $0.0111 |
| Class C | 12/10/18 | $0.1341 | $0.0111 |
| Global Commodity Stock | 12/10/18 | $0.2601 | $0.0111 |
| Class I | 12/10/18 | $0.2811 | $0.0111 |
| Class Z | 12/10/18 | $0.3001 | $0.0111 |
|
The fund will notify shareholders in January 2020 of amounts for use in preparing 2019 income tax returns.
GCS-ANN-1219
1.879380.110
Fidelity® Global Equity Income Fund
Annual Report
October 31, 2019
See the inside front cover for important information about access to your fund’s shareholder reports.
Beginning on January 1, 2021, as permitted by regulations adopted by the Securities and Exchange Commission, paper copies of a fund’s shareholder reports will no longer be sent by mail, unless you specifically request paper copies of the reports from the fund or from your financial intermediary, such as a financial advisor, broker-dealer or bank. Instead, the reports will be made available on a website, and you will be notified by mail each time a report is posted and provided with a website link to access the report.
If you already elected to receive shareholder reports electronically, you will not be affected by this change and you need not take any action. You may elect to receive shareholder reports and other communications from a fund electronically, by contacting your financial intermediary. For Fidelity customers, visit Fidelity's web site or call Fidelity using the contact information listed below.
You may elect to receive all future reports in paper free of charge. If you wish to continue receiving paper copies of your shareholder reports, you may contact your financial intermediary or, if you are a Fidelity customer, visit Fidelity’s website, or call Fidelity at the applicable toll-free number listed below. Your election to receive reports in paper will apply to all funds held with the fund complex/your financial intermediary.
| Account Type | Website | Phone Number |
| Brokerage, Mutual Fund, or Annuity Contracts: | fidelity.com/mailpreferences | 1-800-343-3548 |
| Employer Provided Retirement Accounts: | netbenefits.fidelity.com/preferences (choose 'no' under Required Disclosures to continue to print) | 1-800-343-0860 |
| Advisor Sold Accounts Serviced Through Your Financial Intermediary: | Contact Your Financial Intermediary | Your Financial Intermediary's phone number |
| Advisor Sold Accounts Serviced by Fidelity: | institutional.fidelity.com | 1-877-208-0098 |
Contents
To view a fund's proxy voting guidelines and proxy voting record for the 12-month period ended June 30, visit http://www.fidelity.com/proxyvotingresults or visit the Securities and Exchange Commission's (SEC) web site at http://www.sec.gov.
You may also call 1-800-544-8544 to request a free copy of the proxy voting guidelines.
Standard & Poor's, S&P and S&P 500 are registered service marks of The McGraw-Hill Companies, Inc. and have been licensed for use by Fidelity Distributors Corporation.
Other third-party marks appearing herein are the property of their respective owners.
All other marks appearing herein are registered or unregistered trademarks or service marks of FMR LLC or an affiliated company. © 2019 FMR LLC. All rights reserved.
This report and the financial statements contained herein are submitted for the general information of the shareholders of the Fund. This report is not authorized for distribution to prospective investors in the Fund unless preceded or accompanied by an effective prospectus.
A fund files its complete schedule of portfolio holdings with the SEC for the first and third quarters of each fiscal year on Form N-PORT. Forms N-PORT are available on the SEC’s web site at http://www.sec.gov. A fund's Forms N-PORT may be reviewed and copied at the SEC’s Public Reference Room in Washington, DC. Information regarding the operation of the SEC's Public Reference Room may be obtained by calling 1-800-SEC-0330.
For a complete list of a fund's portfolio holdings, view the most recent holdings listing, semiannual report, or annual report on Fidelity's web site at http://www.fidelity.com, http://www.institutional.fidelity.com, or http://www.401k.com, as applicable.
NOT FDIC INSURED •MAY LOSE VALUE •NO BANK GUARANTEE
Neither the Fund nor Fidelity Distributors Corporation is a bank.
Performance: The Bottom Line
Average annual total return reflects the change in the value of an investment, assuming reinvestment of distributions from dividend income and capital gains (the profits earned upon the sale of securities that have grown in value, if any) and assuming a constant rate of performance each year. The hypothetical investment and the average annual total returns do not reflect the deduction of taxes that a shareholder would pay on fund distributions or the redemption of fund shares. During periods of reimbursement by Fidelity, a fund’s total return will be greater than it would be had the reimbursement not occurred. How a fund did yesterday is no guarantee of how it will do tomorrow.
Average Annual Total Returns
| For the periods ended October 31, 2019 | Past 1 year | Past 5 years | Life of fundA |
| Fidelity® Global Equity Income Fund | 14.60% | 7.12% | 9.30% |
A From May 2, 2012
$10,000 Over Life of Fund
Let's say hypothetically that $10,000 was invested in Fidelity® Global Equity Income Fund on May 2, 2012, when the fund started.
The chart shows how the value of your investment would have changed, and also shows how the MSCI ACWI (All Country World Index) Index performed over the same period.
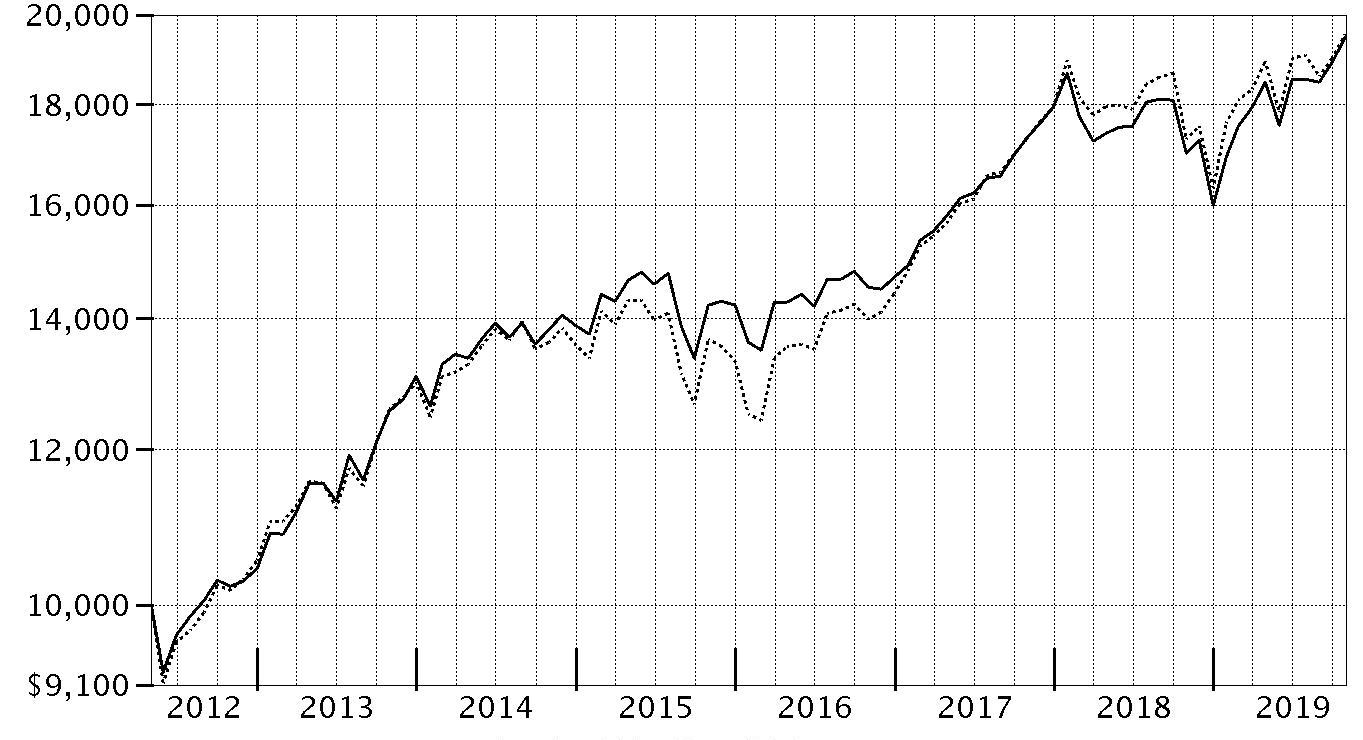
| Period Ending Values |
| $19,487 | Fidelity® Global Equity Income Fund |
| $19,542 | MSCI ACWI (All Country World Index) Index |
Management's Discussion of Fund Performance
Market Recap: Global equities gained 13.06% for the 12 months ending October 31, 2019, according to the MSCI ACWI (All Country World Index) Index. Currency fluctuations were largely modest and varied by region, muting the overall impact on international equity returns. The period began amid a challenging fourth quarter of 2018, when concerns about slowing global economic growth resulted in a -12.67% return for the index. The tide shifted as the calendar turned, as the U.S. Federal Reserve moved from raising interest rates to a more dovish policy, joining many foreign central banks. The index rallied 12.29% in the first quarter of 2019. After a down month in May (-5.88%), due to U.S.–China trade tension, stocks reversed course in June (+6.58%) and finished the second quarter with a 3.73% gain. In July, the Fed cut its policy rate for the first time since 2008, but global stocks retreated in August. Low interest rates around the world and two additional rate cuts by the Fed lifted stocks through the end of October. By sector for the full period, falling U.S. interest rates sparked demand for two high-dividend-yielding sectors, real estate (+23%) and utilities (+22%). Investors favoring growth-oriented stocks boosted information technology (+22%) and consumer discretionary (+16%). Conversely, falling commodity prices hurt energy (-6%). By region, Asia-Pacific ex Japan (+16%), the U.S. (+14%) and Europe ex U.K. (+13%) fared best, while the U.K. (+7%) was held back by its inability to approve a plan to “Brexit” the European Union.
Comments from Portfolio Manager Ramona Persaud: For the fiscal year, the fund gained 14.60%, topping the benchmark MSCI ACWI (All Country World Index) Index. Versus the benchmark, security selection contributed the past 12 months, led by the information technology, health care, industrials and financials sectors. Conversely, picks in consumer staples and positioning in consumer discretionary detracted from relative performance, as did the fund’s cash position of 5%, on average. By region, my choices in Japan, emerging markets and Asia Pacific ex Japan helped most, whereas an overweighting in the U.K. hurt. A sizable stake in Hoya was the top individual contributor, as shares of the Japanese manufacturer of optical products gained 58%, due in part to strong sales of its contact lenses. It also helped to overweight American Tower (+43%), a real estate investment trust (REIT) that rents towers used to build out current- and next-generation cellular service networks. Conversely, ConocoPhillips was the fund’s largest relative detractor this period. Our shares of the multinational energy giant returned -20%, falling along with the broader energy sector amid a decline in oil prices. An overweighting in tobacco firm Altria Group also detracted, returning about -27% for the fund.
The views expressed above reflect those of the portfolio manager(s) only through the end of the period as stated on the cover of this report and do not necessarily represent the views of Fidelity or any other person in the Fidelity organization. Any such views are subject to change at any time based upon market or other conditions and Fidelity disclaims any responsibility to update such views. These views may not be relied on as investment advice and, because investment decisions for a Fidelity fund are based on numerous factors, may not be relied on as an indication of trading intent on behalf of any Fidelity fund.
Investment Summary (Unaudited)
Geographic Diversification (% of fund's net assets)
| As of October 31, 2019 |
| | United States of America* | 55.5% |
| | Japan | 7.9% |
| | United Kingdom | 7.1% |
| | Switzerland | 4.7% |
| | Canada | 4.3% |
| | Netherlands | 2.3% |
| | France | 2.1% |
| | Germany | 1.8% |
| | Taiwan | 1.8% |
| | Other | 12.5% |

* Includes Short-Term investments and Net Other Assets (Liabilities).
Percentages are based on country or territory of incorporation and are adjusted for the effect of futures contracts, if applicable.
Asset Allocation as of October 31, 2019
| | % of fund's net assets |
| Stocks | 95.3 |
| Short-Term Investments and Net Other Assets (Liabilities) | 4.7 |
Top Ten Stocks as of October 31, 2019
| | % of fund's net assets |
| Microsoft Corp. (United States of America, Software) | 4.1 |
| Apple, Inc. (United States of America, Technology Hardware, Storage & Peripherals) | 4.0 |
| Hoya Corp. (Japan, Health Care Equipment & Supplies) | 2.4 |
| American Tower Corp. (United States of America, Equity Real Estate Investment Trusts (REITs)) | 2.1 |
| Constellation Software, Inc. (Canada, Software) | 2.0 |
| JPMorgan Chase & Co. (United States of America, Banks) | 2.0 |
| Amgen, Inc. (United States of America, Biotechnology) | 1.9 |
| Taiwan Semiconductor Manufacturing Co. Ltd. (Taiwan, Semiconductors & Semiconductor Equipment) | 1.8 |
| Roche Holding AG (participation certificate) (Switzerland, Pharmaceuticals) | 1.7 |
| Wells Fargo & Co. (United States of America, Banks) | 1.6 |
| | 23.6 |
Top Market Sectors as of October 31, 2019
| | % of fund's net assets |
| Financials | 18.2 |
| Information Technology | 15.6 |
| Health Care | 14.9 |
| Consumer Staples | 11.8 |
| Industrials | 9.5 |
| Communication Services | 7.3 |
| Energy | 6.8 |
| Consumer Discretionary | 5.2 |
| Utilities | 2.7 |
| Real Estate | 2.1 |
Schedule of Investments October 31, 2019
Showing Percentage of Net Assets
| Common Stocks - 94.9% | | | |
| | | Shares | Value |
| Bailiwick of Guernsey - 0.2% | | | |
| Amdocs Ltd. | | 2,292 | $149,438 |
| Bailiwick of Jersey - 0.3% | | | |
| WPP PLC | | 18,265 | 227,939 |
| Belgium - 0.8% | | | |
| KBC Groep NV | | 7,398 | 518,822 |
| Bermuda - 0.8% | | | |
| Dairy Farm International Holdings Ltd. | | 3,821 | 23,030 |
| Hiscox Ltd. | | 11,653 | 224,760 |
| IHS Markit Ltd. (a) | | 4,680 | 327,694 |
|
| TOTAL BERMUDA | | | 575,484 |
|
| Brazil - 0.6% | | | |
| Equatorial Energia SA | | 9,600 | 243,872 |
| Ultrapar Participacoes SA | | 38,400 | 180,678 |
|
| TOTAL BRAZIL | | | 424,550 |
|
| Canada - 4.3% | | | |
| Alimentation Couche-Tard, Inc. Class B (sub. vtg.) | | 15,856 | 475,524 |
| Constellation Software, Inc. | | 1,396 | 1,378,755 |
| Fairfax Financial Holdings Ltd. (sub. vtg.) | | 328 | 138,960 |
| Imperial Oil Ltd. | | 12,750 | 317,516 |
| Suncor Energy, Inc. | | 20,748 | 616,879 |
|
| TOTAL CANADA | | | 2,927,634 |
|
| Cayman Islands - 1.0% | | | |
| Best Pacific International Holdings Ltd. | | 131,816 | 44,513 |
| SITC International Holdings Co. Ltd. | | 532,994 | 586,879 |
| Value Partners Group Ltd. | | 50,625 | 26,650 |
|
| TOTAL CAYMAN ISLANDS | | | 658,042 |
|
| China - 0.5% | | | |
| Kweichow Moutai Co. Ltd. (A Shares) | | 2,200 | 368,213 |
| France - 2.1% | | | |
| Amundi SA (b) | | 999 | 71,308 |
| Elior SA (b) | | 14,117 | 182,481 |
| Sanofi SA | | 6,502 | 599,401 |
| SR Teleperformance SA | | 400 | 90,652 |
| VINCI SA | | 4,094 | 459,343 |
|
| TOTAL FRANCE | | | 1,403,185 |
|
| Germany - 1.8% | | | |
| Deutsche Post AG | | 6,475 | 229,285 |
| Hannover Reuck SE | | 1,910 | 338,279 |
| Linde PLC | | 1,801 | 356,034 |
| SAP SE | | 2,358 | 312,438 |
|
| TOTAL GERMANY | | | 1,236,036 |
|
| Hong Kong - 1.4% | | | |
| AIA Group Ltd. | | 55,706 | 554,733 |
| Techtronic Industries Co. Ltd. | | 49,670 | 388,172 |
|
| TOTAL HONG KONG | | | 942,905 |
|
| India - 1.3% | | | |
| HDFC Asset Management Co. Ltd. (b) | | 3,700 | 155,851 |
| HDFC Bank Ltd. sponsored ADR | | 3,438 | 210,027 |
| Housing Development Finance Corp. Ltd. | | 5,600 | 167,946 |
| Reliance Industries Ltd. | | 15,400 | 317,185 |
|
| TOTAL INDIA | | | 851,009 |
|
| Ireland - 1.2% | | | |
| Accenture PLC Class A | | 4,310 | 799,160 |
| Japan - 7.9% | | | |
| Aucnet, Inc. | | 1,940 | 26,645 |
| Daiichikosho Co. Ltd. | | 10,603 | 504,038 |
| Daiwa Industries Ltd. | | 15,000 | 168,273 |
| Hoya Corp. | | 18,722 | 1,654,599 |
| Inaba Denki Sangyo Co. Ltd. | | 7,164 | 329,105 |
| Japan Meat Co. Ltd. | | 26,650 | 545,120 |
| Minebea Mitsumi, Inc. | | 20,537 | 390,029 |
| Mitani Shoji Co. Ltd. | | 3,821 | 191,968 |
| Nippon Telegraph & Telephone Corp. | | 8,024 | 398,335 |
| Nitori Holdings Co. Ltd. | | 1,337 | 203,506 |
| Ryohin Keikaku Co. Ltd. | | 1,910 | 42,521 |
| Sony Corp. | | 8,024 | 488,414 |
| Tsuruha Holdings, Inc. | | 3,725 | 419,020 |
|
| TOTAL JAPAN | | | 5,361,573 |
|
| Kenya - 0.6% | | | |
| Safaricom Ltd. | | 1,452,500 | 418,314 |
| Liberia - 0.5% | | | |
| Royal Caribbean Cruises Ltd. | | 2,889 | 314,410 |
| Luxembourg - 1.3% | | | |
| B&M European Value Retail SA | | 189,658 | 909,729 |
| Multi-National - 0.8% | | | |
| HKT Trust/HKT Ltd. unit | | 335,843 | 522,458 |
| Netherlands - 2.3% | | | |
| NXP Semiconductors NV | | 5,964 | 677,988 |
| Unilever NV | | 14,551 | 859,311 |
|
| TOTAL NETHERLANDS | | | 1,537,299 |
|
| Nigeria - 0.1% | | | |
| Guaranty Trust Bank PLC | | 589,828 | 40,543 |
| Norway - 0.4% | | | |
| Equinor ASA | | 15,152 | 280,265 |
| Sweden - 0.3% | | | |
| Indutrade AB | | 5,636 | 173,475 |
| Switzerland - 4.7% | | | |
| Alcon, Inc. (a) | | 1,146 | 67,923 |
| Banque Cantonale Vaudoise | | 420 | 329,103 |
| Chubb Ltd. | | 4,173 | 636,049 |
| Nestle SA (Reg. S) | | 9,117 | 975,349 |
| Roche Holding AG (participation certificate) | | 3,821 | 1,149,953 |
|
| TOTAL SWITZERLAND | | | 3,158,377 |
|
| Taiwan - 1.8% | | | |
| Taiwan Semiconductor Manufacturing Co. Ltd. | | 124,000 | 1,212,885 |
| United Kingdom - 7.1% | | | |
| AstraZeneca PLC sponsored ADR | | 19,454 | 953,830 |
| BP PLC | | 82,498 | 523,150 |
| British American Tobacco PLC (United Kingdom) | | 8,795 | 307,613 |
| Cineworld Group PLC | | 49,284 | 142,172 |
| Cranswick PLC | | 2,006 | 80,657 |
| Diageo PLC | | 11,080 | 453,515 |
| Hilton Food Group PLC (c) | | 55,974 | 736,660 |
| Imperial Brands PLC | | 5,785 | 126,822 |
| London Stock Exchange Group PLC | | 1,900 | 171,226 |
| Micro Focus International PLC | | 17,314 | 237,638 |
| Moneysupermarket.com Group PLC | | 54,071 | 240,310 |
| Reckitt Benckiser Group PLC | | 5,158 | 399,134 |
| St. James's Place Capital PLC | | 11,208 | 151,135 |
| Standard Life PLC | | 38,160 | 150,022 |
| Victrex PLC | | 5,540 | 157,590 |
|
| TOTAL UNITED KINGDOM | | | 4,831,474 |
|
| United States of America - 50.8% | | | |
| Altria Group, Inc. | | 10,766 | 482,209 |
| Ameren Corp. | | 7,109 | 552,369 |
| American Tower Corp. | | 6,417 | 1,399,419 |
| AMETEK, Inc. | | 10,398 | 952,977 |
| Amgen, Inc. | | 6,147 | 1,310,848 |
| Apple, Inc. | | 10,819 | 2,691,334 |
| Bank of America Corp. | | 33,444 | 1,045,794 |
| Becton, Dickinson & Co. | | 3,543 | 907,008 |
| Berkshire Hathaway, Inc. Class B (a) | | 1,624 | 345,230 |
| Bristol-Myers Squibb Co. | | 11,319 | 649,371 |
| Capital One Financial Corp. | | 8,451 | 788,056 |
| Charter Communications, Inc. Class A (a) | | 878 | 410,781 |
| Chevron Corp. | | 7,698 | 894,046 |
| Cigna Corp. | | 1,242 | 221,647 |
| Citigroup, Inc. | | 4,932 | 354,414 |
| Comcast Corp. Class A | | 17,409 | 780,271 |
| ConocoPhillips Co. | | 10,544 | 582,029 |
| Corteva, Inc. | | 2,338 | 61,676 |
| Danaher Corp. | | 3,630 | 500,287 |
| Diamond Hill Investment Group, Inc. | | 955 | 134,521 |
| Dow, Inc. | | 3,293 | 166,264 |
| DowDuPont, Inc. | | 2,338 | 154,098 |
| Eli Lilly & Co. | | 3,694 | 420,931 |
| Equifax, Inc. | | 1,624 | 222,017 |
| Fortive Corp. | | 3,754 | 259,026 |
| General Dynamics Corp. | | 1,404 | 248,227 |
| General Electric Co. | | 45,020 | 449,300 |
| Huntington Bancshares, Inc. | | 5,922 | 83,678 |
| Interpublic Group of Companies, Inc. | | 9,563 | 207,995 |
| Johnson & Johnson | | 5,623 | 742,461 |
| JPMorgan Chase & Co. | | 10,894 | 1,360,878 |
| Kroger Co. | | 5,603 | 138,058 |
| Lowe's Companies, Inc. | | 8,117 | 905,938 |
| M&T Bank Corp. | | 1,051 | 164,513 |
| Marsh & McLennan Companies, Inc. | | 2,388 | 247,445 |
| McCormick & Co., Inc. (non-vtg.) | | 669 | 107,502 |
| MetLife, Inc. | | 5,158 | 241,343 |
| Microsoft Corp. | | 19,187 | 2,750,837 |
| MSCI, Inc. | | 1,642 | 385,148 |
| NextEra Energy, Inc. | | 1,433 | 341,541 |
| Northrop Grumman Corp. | | 860 | 303,133 |
| NRG Energy, Inc. | | 7,833 | 314,260 |
| PepsiCo, Inc. | | 6,240 | 855,941 |
| Philip Morris International, Inc. | | 2,675 | 217,852 |
| Phillips 66 Co. | | 3,343 | 390,529 |
| PVH Corp. | | 1,719 | 149,828 |
| Qualcomm, Inc. | | 4,076 | 327,873 |
| S&P Global, Inc. | | 1,595 | 411,494 |
| SunTrust Banks, Inc. | | 11,514 | 786,867 |
| T-Mobile U.S., Inc. (a) | | 1,337 | 110,516 |
| The J.M. Smucker Co. | | 3,128 | 330,567 |
| The Travelers Companies, Inc. | | 2,770 | 363,036 |
| The Walt Disney Co. | | 4,179 | 542,936 |
| U.S. Bancorp | | 8,110 | 462,432 |
| United Technologies Corp. | | 3,658 | 525,216 |
| UnitedHealth Group, Inc. | | 4,104 | 1,037,081 |
| Valero Energy Corp. | | 4,403 | 427,003 |
| Verizon Communications, Inc. | | 11,650 | 704,476 |
| Vistra Energy Corp. | | 6,877 | 185,885 |
| WEC Energy Group, Inc. | | 2,483 | 234,395 |
| Wells Fargo & Co. | | 21,038 | 1,086,192 |
|
| TOTAL UNITED STATES OF AMERICA | | | 34,428,999 |
|
| TOTAL COMMON STOCKS | | | |
| (Cost $46,646,024) | | | 64,272,218 |
|
| Nonconvertible Preferred Stocks - 0.4% | | | |
| Brazil - 0.4% | | | |
| Itau Unibanco Holding SA | | | |
| (Cost $291,976) | | 32,550 | 294,050 |
|
| Money Market Funds - 4.2% | | | |
| Fidelity Cash Central Fund 1.83% (d) | | 2,736,837 | 2,737,384 |
| Fidelity Securities Lending Cash Central Fund 1.84% (d)(e) | | 132,527 | 132,540 |
| TOTAL MONEY MARKET FUNDS | | | |
| (Cost $2,869,920) | | | 2,869,924 |
| TOTAL INVESTMENT IN SECURITIES - 99.5% | | | |
| (Cost $49,807,920) | | | 67,436,192 |
| NET OTHER ASSETS (LIABILITIES) - 0.5% | | | 327,938 |
| NET ASSETS - 100% | | | $67,764,130 |
Categorizations in the Schedule of Investments are based on country or territory of incorporation.
Legend
(a) Non-income producing
(b) Security exempt from registration under Rule 144A of the Securities Act of 1933. These securities may be resold in transactions exempt from registration, normally to qualified institutional buyers. At the end of the period, the value of these securities amounted to $409,640 or 0.6% of net assets.
(c) Security or a portion of the security is on loan at period end.
(d) Affiliated fund that is generally available only to investment companies and other accounts managed by Fidelity Investments. The rate quoted is the annualized seven-day yield of the fund at period end. A complete unaudited listing of the fund's holdings as of its most recent quarter end is available upon request. In addition, each Fidelity Central Fund's financial statements, which are not covered by the Fund's Report of Independent Registered Public Accounting Firm, are available on the SEC's website or upon request.
(e) Investment made with cash collateral received from securities on loan.
Affiliated Central Funds
Information regarding fiscal year to date income earned by the Fund from investments in Fidelity Central Funds is as follows:
| Fund | Income earned |
| Fidelity Cash Central Fund | $75,475 |
| Fidelity Securities Lending Cash Central Fund | 4,184 |
| Total | $79,659 |
Amounts in the income column in the above table include any capital gain distributions from underlying funds, which are presented in the corresponding line-item in the Statement of Operations, if applicable. Amount for Fidelity Securities Lending Cash Central Fund represents the income earned on investing cash collateral, less rebates paid to borrowers and any lending agent fees associated with the loan, plus any premium payments received for lending certain types of securities.
Investment Valuation
The following is a summary of the inputs used, as of October 31, 2019, involving the Fund's assets and liabilities carried at fair value. The inputs or methodology used for valuing securities may not be an indication of the risk associated with investing in those securities. For more information on valuation inputs, and their aggregation into the levels used below, please refer to the Investment Valuation section in the accompanying Notes to Financial Statements.
| | Valuation Inputs at Reporting Date: |
| Description | Total | Level 1 | Level 2 | Level 3 |
| Investments in Securities: | | | | |
| Equities: | | | | |
| Communication Services | $4,970,231 | $3,317,461 | $1,652,770 | $-- |
| Consumer Discretionary | 3,508,295 | 2,702,696 | 805,599 | -- |
| Consumer Staples | 7,902,097 | 4,411,103 | 3,490,994 | -- |
| Energy | 4,529,280 | 3,688,945 | 840,335 | -- |
| Financials | 12,440,505 | 11,364,099 | 1,076,406 | -- |
| Health Care | 10,215,340 | 6,811,387 | 3,403,953 | -- |
| Industrials | 6,294,771 | 4,240,345 | 2,054,426 | -- |
| Information Technology | 10,538,346 | 8,775,385 | 1,762,961 | -- |
| Materials | 895,662 | 895,662 | -- | -- |
| Real Estate | 1,399,419 | 1,399,419 | -- | -- |
| Utilities | 1,872,322 | 1,872,322 | -- | -- |
| Money Market Funds | 2,869,924 | 2,869,924 | -- | -- |
| Total Investments in Securities: | $67,436,192 | $52,348,748 | $15,087,444 | $-- |
See accompanying notes which are an integral part of the financial statements.
Financial Statements
Statement of Assets and Liabilities
| | | October 31, 2019 |
| Assets | | |
Investment in securities, at value (including securities loaned of $123,582) — See accompanying schedule:
Unaffiliated issuers (cost $46,938,000) | $64,566,268 | |
| Fidelity Central Funds (cost $2,869,920) | 2,869,924 | |
| Total Investment in Securities (cost $49,807,920) | | $67,436,192 |
| Foreign currency held at value (cost $9,351) | | 9,351 |
| Receivable for investments sold | | 423,222 |
| Receivable for fund shares sold | | 16,629 |
| Dividends receivable | | 159,687 |
| Distributions receivable from Fidelity Central Funds | | 4,200 |
| Prepaid expenses | | 125 |
| Other receivables | | 286 |
| Total assets | | 68,049,692 |
| Liabilities | | |
| Payable for fund shares redeemed | $30,511 | |
| Accrued management fee | 37,792 | |
| Other affiliated payables | 12,603 | |
| Other payables and accrued expenses | 72,116 | |
| Collateral on securities loaned | 132,540 | |
| Total liabilities | | 285,562 |
| Net Assets | | $67,764,130 |
| Net Assets consist of: | | |
| Paid in capital | | $50,126,620 |
| Total accumulated earnings (loss) | | 17,637,510 |
| Net Assets, for 4,627,845 shares outstanding | | $67,764,130 |
| Net Asset Value, offering price and redemption price per share ($67,764,130 ÷ 4,627,845 shares) | | $14.64 |
See accompanying notes which are an integral part of the financial statements.
Statement of Operations
| | | Year ended October 31, 2019 |
| Investment Income | | |
| Dividends | | $1,879,433 |
| Interest | | 152 |
| Income from Fidelity Central Funds (including $4,184 from security lending) | | 79,659 |
| Income before foreign taxes withheld | | 1,959,244 |
| Less foreign taxes withheld | | (71,764) |
| Total income | | 1,887,480 |
| Expenses | | |
| Management fee | $461,813 | |
| Transfer agent fees | 124,100 | |
| Accounting and security lending fees | 34,808 | |
| Custodian fees and expenses | 10,375 | |
| Independent trustees' fees and expenses | 383 | |
| Registration fees | 22,837 | |
| Audit | 74,365 | |
| Legal | 1,449 | |
| Miscellaneous | 415 | |
| Total expenses before reductions | 730,545 | |
| Expense reductions | (1,689) | |
| Total expenses after reductions | | 728,856 |
| Net investment income (loss) | | 1,158,624 |
| Realized and Unrealized Gain (Loss) | | |
| Net realized gain (loss) on: | | |
| Investment securities: | | |
| Unaffiliated issuers | 19,235 | |
| Redemptions in-kind with affiliated entities | 757,012 | |
| Fidelity Central Funds | (17) | |
| Foreign currency transactions | (1,187) | |
| Total net realized gain (loss) | | 775,043 |
| Change in net unrealized appreciation (depreciation) on: | | |
| Investment securities: | | |
| Unaffiliated issuers (net of increase in deferred foreign taxes of $22,024) | 7,034,268 | |
| Fidelity Central Funds | 4 | |
| Assets and liabilities in foreign currencies | 1,485 | |
| Total change in net unrealized appreciation (depreciation) | | 7,035,757 |
| Net gain (loss) | | 7,810,800 |
| Net increase (decrease) in net assets resulting from operations | | $8,969,424 |
See accompanying notes which are an integral part of the financial statements.
Statement of Changes in Net Assets
| | Year ended October 31, 2019 | Year ended October 31, 2018 |
| Increase (Decrease) in Net Assets | | |
| Operations | | |
| Net investment income (loss) | $1,158,624 | $1,363,605 |
| Net realized gain (loss) | 775,043 | 3,307,849 |
| Change in net unrealized appreciation (depreciation) | 7,035,757 | (5,807,416) |
| Net increase (decrease) in net assets resulting from operations | 8,969,424 | (1,135,962) |
| Distributions to shareholders | (3,744,013) | (2,362,860) |
| Share transactions | | |
| Proceeds from sales of shares | 9,211,621 | 13,947,450 |
| Reinvestment of distributions | 3,534,334 | 2,226,993 |
| Cost of shares redeemed | (18,738,835) | (25,151,825) |
| Net increase (decrease) in net assets resulting from share transactions | (5,992,880) | (8,977,382) |
| Redemption fees | – | 1,273 |
| Total increase (decrease) in net assets | (767,469) | (12,474,931) |
| Net Assets | | |
| Beginning of period | 68,531,599 | 81,006,530 |
| End of period | $67,764,130 | $68,531,599 |
| Other Information | | |
| Shares | | |
| Sold | 679,429 | 967,487 |
| Issued in reinvestment of distributions | 274,729 | 156,544 |
| Redeemed | (1,389,982) | (1,759,434) |
| Net increase (decrease) | (435,824) | (635,403) |
See accompanying notes which are an integral part of the financial statements.
Financial Highlights
Fidelity Global Equity Income Fund
| | | | | | |
| Years ended October 31, | 2019 | 2018 | 2017 | 2016 | 2015 |
| Selected Per–Share Data | | | | | |
| Net asset value, beginning of period | $13.53 | $14.21 | $12.06 | $12.12 | $12.87 |
| Income from Investment Operations | | | | | |
| Net investment income (loss)A | .23 | .25 | .17 | .15 | .16 |
| Net realized and unrealized gain (loss) | 1.63 | (.50) | 2.15 | .11 | .21 |
| Total from investment operations | 1.86 | (.25) | 2.32 | .26 | .37 |
| Distributions from net investment income | (.24) | (.25) | (.17) | (.15) | (.16) |
| Distributions from net realized gain | (.51) | (.18) | – | (.16) | (.95) |
| Total distributions | (.75) | (.43) | (.17) | (.32)B | (1.12)C |
| Redemption fees added to paid in capitalA | – | –D | –D | –D | –D |
| Net asset value, end of period | $14.64 | $13.53 | $14.21 | $12.06 | $12.12 |
| Total ReturnE | 14.60% | (1.88)% | 19.31% | 2.13% | 2.93% |
| Ratios to Average Net AssetsF,G | | | | | |
| Expenses before reductions | 1.09% | 1.06% | 1.13% | 1.18% | 1.15% |
| Expenses net of fee waivers, if any | 1.09% | 1.06% | 1.13% | 1.18% | 1.15% |
| Expenses net of all reductions | 1.08% | 1.05% | 1.13% | 1.18% | 1.14% |
| Net investment income (loss) | 1.72% | 1.75% | 1.29% | 1.24% | 1.27% |
| Supplemental Data | | | | | |
| Net assets, end of period (000 omitted) | $67,764 | $68,532 | $81,007 | $71,675 | $67,926 |
| Portfolio turnover rateH | 20%I | 34% | 37% | 40% | 64% |
A Calculated based on average shares outstanding during the period.
B Total distributions of $.32 per share is comprised of distributions from net investment income of $.153 and distributions from net realized gain of $.162 per share.
C Total distributions of $1.12 per share is comprised of distributions from net investment income of $.164 and distributions from net realized gain of $.954 per share.
D Amount represents less than $.005 per share.
E Total returns would have been lower if certain expenses had not been reduced during the applicable periods shown.
F Fees and expenses of any underlying Fidelity Central Funds are not included in the Fund's expense ratio. The Fund indirectly bears its proportionate share of the expenses of any underlying Fidelity Central Funds.
G Expense ratios reflect operating expenses of the Fund. Expenses before reductions do not reflect amounts reimbursed by the investment adviser or reductions from brokerage service arrangements or reductions from other expense offset arrangements and do not represent the amount paid by the Fund during periods when reimbursements or reductions occur. Expenses net of fee waivers reflect expenses after reimbursement by the investment adviser but prior to reductions from brokerage service arrangements or other expense offset arrangements. Expenses net of all reductions represent the net expenses paid by the Fund.
H Amount does not include the portfolio activity of any underlying Fidelity Central Funds.
I Portfolio turnover rate excludes securities received or delivered in-kind.
See accompanying notes which are an integral part of the financial statements.
Notes to Financial Statements
For the period ended October 31, 2019
1. Organization.
Fidelity Global Equity Income Fund (the Fund) is a fund of Fidelity Investment Trust (the Trust) and is authorized to issue an unlimited number of shares. Share transactions on the Statement of Changes in Net Assets may contain exchanges between affiliated funds. The Trust is registered under the Investment Company Act of 1940, as amended (the 1940 Act), as an open-end management investment company organized as a Massachusetts business trust.
2. Investments in Fidelity Central Funds.
The Fund invests in Fidelity Central Funds, which are open-end investment companies generally available only to other investment companies and accounts managed by the investment adviser and its affiliates. The Fund's Schedule of Investments lists each of the Fidelity Central Funds held as of period end, if any, as an investment of the Fund, but does not include the underlying holdings of each Fidelity Central Fund. As an Investing Fund, the Fund indirectly bears its proportionate share of the expenses of the underlying Fidelity Central Funds.
The Money Market Central Funds seek preservation of capital and current income and are managed by Fidelity Investments Money Management, Inc. (FIMM), an affiliate of the investment adviser. Annualized expenses of the Money Market Central Funds as of their most recent shareholder report date ranged from less than .005% to .01%.
A complete unaudited list of holdings for each Fidelity Central Fund is available upon request or at the Securities and Exchange Commission (the SEC) website at www.sec.gov. In addition, the financial statements of the Fidelity Central Funds, which are not covered by the Fund's Report of Independent Registered Public Accounting Firm, are available on the SEC website or upon request.
3. Significant Accounting Policies.
The Fund is an investment company and applies the accounting and reporting guidance of the Financial Accounting Standards Board (FASB) Accounting Standards Codification Topic 946 Financial Services – Investments Companies. The financial statements have been prepared in conformity with accounting principles generally accepted in the United States of America (GAAP), which require management to make certain estimates and assumptions at the date of the financial statements. Actual results could differ from those estimates. Subsequent events, if any, through the date that the financial statements were issued have been evaluated in the preparation of the financial statements. The following summarizes the significant accounting policies of the Fund:
Investment Valuation. Investments are valued as of 4:00 p.m. Eastern time on the last calendar day of the period. The Board of Trustees (the Board) has delegated the day to day responsibility for the valuation of the Fund's investments to the Fair Value Committee (the Committee) established by the Fund's investment adviser. In accordance with valuation policies and procedures approved by the Board, the Fund attempts to obtain prices from one or more third party pricing vendors or brokers to value its investments. When current market prices, quotations or currency exchange rates are not readily available or reliable, investments will be fair valued in good faith by the Committee, in accordance with procedures adopted by the Board. Factors used in determining fair value vary by investment type and may include market or investment specific events. The frequency with which these procedures are used cannot be predicted and they may be utilized to a significant extent. The Committee oversees the Fund's valuation policies and procedures and reports to the Board on the Committee's activities and fair value determinations. The Board monitors the appropriateness of the procedures used in valuing the Fund's investments and ratifies the fair value determinations of the Committee.
The Fund categorizes the inputs to valuation techniques used to value its investments into a disclosure hierarchy consisting of three levels as shown below:
- Level 1 – quoted prices in active markets for identical investments
- Level 2 – other significant observable inputs (including quoted prices for similar investments, interest rates, prepayment speeds, etc.)
- Level 3 – unobservable inputs (including the Fund's own assumptions based on the best information available)
Valuation techniques used to value the Fund's investments by major category are as follows:
Equity securities, including restricted securities, for which market quotations are readily available, are valued at the last reported sale price or official closing price as reported by a third party pricing vendor on the primary market or exchange on which they are traded and are categorized as Level 1 in the hierarchy. In the event there were no sales during the day or closing prices are not available, securities are valued at the last quoted bid price or may be valued using the last available price and are generally categorized as Level 2 in the hierarchy. For foreign equity securities, when market or security specific events arise, comparisons to the valuation of American Depositary Receipts (ADRs), futures contracts, Exchange-Traded Funds (ETFs) and certain indexes as well as quoted prices for similar securities may be used and would be categorized as Level 2 in the hierarchy. For equity securities, including restricted securities, where observable inputs are limited, assumptions about market activity and risk are used and these securities may be categorized as Level 3 in the hierarchy.
Investments in open-end mutual funds, including the Fidelity Central Funds, are valued at their closing net asset value (NAV) each business day and are categorized as Level 1 in the hierarchy.
Changes in valuation techniques may result in transfers in or out of an assigned level within the disclosure hierarchy. The aggregate value of investments by input level as of October 31, 2019 is included at the end of the Fund's Schedule of Investments.
Foreign Currency. The Fund may use foreign currency contracts to facilitate transactions in foreign-denominated securities. Gains and losses from these transactions may arise from changes in the value of the foreign currency or if the counterparties do not perform under the contracts' terms.
Foreign-denominated assets, including investment securities, and liabilities are translated into U.S. dollars at the exchange rates at period end. Purchases and sales of investment securities, income and dividends received and expenses denominated in foreign currencies are translated into U.S. dollars at the exchange rate in effect on the transaction date.
The effects of exchange rate fluctuations on investments are included with the net realized and unrealized gain (loss) on investment securities. Other foreign currency transactions resulting in realized and unrealized gain (loss) are disclosed separately.
Investment Transactions and Income. For financial reporting purposes, the Fund's investment holdings and NAV include trades executed through the end of the last business day of the period. The NAV per share for processing shareholder transactions is calculated as of the close of business of the New York Stock Exchange (NYSE), normally 4:00 p.m. Eastern time and includes trades executed through the end of the prior business day. Gains and losses on securities sold are determined on the basis of identified cost and include proceeds received from litigation. Dividend income is recorded on the ex-dividend date, except for certain dividends from foreign securities where the ex-dividend date may have passed, which are recorded as soon as the Fund is informed of the ex-dividend date. Non-cash dividends included in dividend income, if any, are recorded at the fair market value of the securities received. Income and capital gain distributions from Fidelity Central Funds, if any, are recorded on the ex-dividend date. Certain distributions received by the Fund represent a return of capital or capital gain. The Fund determines the components of these distributions subsequent to the ex-dividend date, based upon receipt of tax filings or other correspondence relating to the underlying investment. These distributions are recorded as a reduction of cost of investments and/or as a realized gain. Interest income is accrued as earned and includes coupon interest and amortization of premium and accretion of discount on debt securities as applicable. Investment income is recorded net of foreign taxes withheld where recovery of such taxes is uncertain.
Expenses. Expenses directly attributable to a fund are charged to that fund. Expenses attributable to more than one fund are allocated among the respective funds on the basis of relative net assets or other appropriate methods. Expense estimates are accrued in the period to which they relate and adjustments are made when actual amounts are known.
Income Tax Information and Distributions to Shareholders. Each year, the Fund intends to qualify as a regulated investment company under Subchapter M of the Internal Revenue Code, including distributing substantially all of its taxable income and realized gains. As a result, no provision for U.S. Federal income taxes is required. As of October 31, 2019, the Fund did not have any unrecognized tax benefits in the financial statements; nor is the Fund aware of any tax positions for which it is reasonably possible that the total amounts of unrecognized tax benefits will significantly change in the next twelve months. The Fund files a U.S. federal tax return, in addition to state and local tax returns as required. The Fund's federal income tax returns are subject to examination by the Internal Revenue Service (IRS) for a period of three fiscal years after they are filed. State and local tax returns may be subject to examination for an additional fiscal year depending on the jurisdiction. Foreign taxes are provided for based on the Fund's understanding of the tax rules and rates that exist in the foreign markets in which it invests. The Fund is subject to a tax imposed on capital gains by certain countries in which it invests. An estimated deferred tax liability for net unrealized appreciation on the applicable securities is included in Other payables and accrued expenses on the Statement of Assets & Liabilities.
Distributions are declared and recorded on the ex-dividend date. Income and capital gain distributions are determined in accordance with income tax regulations, which may differ from GAAP. In addition, the Fund claimed a portion of the payment made to redeeming shareholders as a distribution for income tax purposes.
Capital accounts within the financial statements are adjusted for permanent book-tax differences. These adjustments have no impact on net assets or the results of operations. Capital accounts are not adjusted for temporary book-tax differences which will reverse in a subsequent period.
Book-tax differences are primarily due to foreign currency transactions, passive foreign investment companies (PFIC), redemptions in kind, partnerships and losses deferred due to wash sales.
As of period end, the cost and unrealized appreciation (depreciation) in securities, and derivatives if applicable, for federal income tax purposes were as follows:
| Gross unrealized appreciation | $19,310,603 |
| Gross unrealized depreciation | (1,692,654) |
| Net unrealized appreciation (depreciation) | $17,617,949 |
| Tax Cost | $49,818,243 |
The tax-based components of distributable earnings as of period end were as follows:
| Undistributed ordinary income | $22,614 |
| Undistributed long-term capital gain | $19,736 |
| Net unrealized appreciation (depreciation) on securities and other investments | $17,617,183 |
The tax character of distributions paid was as follows:
| | October 31, 2019 | October 31, 2018 |
| Ordinary Income | $1,194,063 | $ 1,346,877 |
| Long-term Capital Gains | 2,549,950 | 1,015,983 |
| Total | $3,744,013 | $ 2,362,860 |
Restricted Securities. The Fund may invest in securities that are subject to legal or contractual restrictions on resale. These securities generally may be resold in transactions exempt from registration or to the public if the securities are registered. Disposal of these securities may involve time-consuming negotiations and expense, and prompt sale at an acceptable price may be difficult. Information regarding restricted securities is included at the end of the Fund's Schedule of Investments.
4. Purchases and Sales of Investments.
Purchases and sales of securities, other than short-term securities and in-kind transactions, aggregated $12,751,785 and $20,943,957, respectively.
5. Fees and Other Transactions with Affiliates.
Management Fee. Fidelity Management & Research Company (the investment adviser) and its affiliates provide the Fund with investment management related services for which the Fund pays a monthly management fee. The management fee is the sum of an individual fund fee rate that is based on an annual rate of .45% of the Fund's average net assets and an annualized group fee rate that averaged .24% during the period. The group fee rate is based upon the average net assets of all the mutual funds advised by the investment adviser, including any mutual funds previously advised by the investment adviser that are currently advised by Fidelity SelectCo, LLC, an affiliate of the investment adviser. The group fee rate decreases as assets under management increase and increases as assets under management decrease. For the reporting period, the total annual management fee rate was .69% of the Fund's average net assets.
Transfer Agent Fees. Fidelity Investments Institutional Operations Company, Inc. (FIIOC), an affiliate of the investment adviser, is the Fund's transfer, dividend disbursing and shareholder servicing agent. FIIOC receives account fees and asset-based fees that vary according to account size and type of account. FIIOC pays for typesetting, printing and mailing of shareholder reports, except proxy statements. For the period, the transfer agent fees were equivalent to an annual rate of .18% of average net assets.
Accounting and Security Lending Fees. Fidelity Service Company, Inc. (FSC), an affiliate of the investment adviser, maintains the Fund's accounting records. The accounting fee is based on the level of average net assets for each month. Prior to April 1, 2019, FSC had a separate agreement with the Fund for administration of the security lending program, based on the number and duration of lending transactions. For the period, the total fees paid for accounting and administration of securities lending were equivalent to an annual rate of .05%.
Brokerage Commissions. The Fund placed a portion of its portfolio transactions with brokerage firms which are affiliates of the investment adviser. Brokerage commissions are included in net realized gain (loss) and change in net unrealized appreciation (depreciation) in the Statement of Operations. The commissions paid to these affiliated firms were $208 for the period.
Interfund Trades. The Fund may purchase from or sell securities to other Fidelity Funds under procedures adopted by the Board. The procedures have been designed to ensure these interfund trades are executed in accordance with Rule 17a-7 of the 1940 Act. Interfund trades are included within the respective purchases and sales amounts shown in the Purchases and Sales of Investments note.
Affiliated Redemptions In-Kind. During the period, 209,612 shares of the Fund were redeemed in-kind for investments and cash with a value of $2,873,785. The net realized gain of $757,012 on investments delivered through in-kind redemptions is included in the accompanying Statement of Operations. The amount of the in-kind redemptions is included in share transactions in the accompanying Statement of Changes in Net Assets. The Fund recognized no gain or loss for federal income tax purposes.
6. Committed Line of Credit.
The Fund participates with other funds managed by the investment adviser or an affiliate in a $4.25 billion credit facility (the "line of credit") to be utilized for temporary or emergency purposes to fund shareholder redemptions or for other short-term liquidity purposes. The Fund has agreed to pay commitment fees on its pro-rata portion of the line of credit, which amounted to $179 and is reflected in Miscellaneous expenses on the Statement of Operations. During the period, the Fund did not borrow on this line of credit.
7. Security Lending.
The Fund lends portfolio securities from time to time in order to earn additional income. For equity securities, lending agents are used, including National Financial Services (NFS), an affiliate of the Fund. Pursuant to a securities lending agreement, NFS will receive a fee, which is capped at 9.9% of daily lending revenue, for its services as lending agent. The Fund may lend securities to certain qualified borrowers, including NFS. On the settlement date of the loan, the Fund receives collateral (in the form of U.S. Treasury obligations, letters of credit and/or cash) against the loaned securities and maintains collateral in an amount not less than 100% of the market value of the loaned securities during the period of the loan. The market value of the loaned securities is determined at the close of business of the Fund and any additional required collateral is delivered to the Fund on the next business day. The Fund or borrower may terminate the loan at any time, and if the borrower defaults on its obligation to return the securities loaned because of insolvency or other reasons, the Fund may apply collateral received from the borrower against the obligation. The Fund may experience delays and costs in recovering the securities loaned. Any cash collateral received is invested in the Fidelity Securities Lending Cash Central Fund. The value of loaned securities and cash collateral at period end are disclosed on the Fund's Statement of Assets and Liabilities. Security lending income represents the income earned on investing cash collateral, less rebates paid to borrowers and any lending agent fees associated with the loan, plus any premium payments received for lending certain types of securities. Security lending income is presented in the Statement of Operations as a component of income from Fidelity Central Funds. During the period, there were no securities loaned to NFS.
8. Expense Reductions.
Commissions paid to certain brokers with whom the investment adviser, or its affiliates, places trades on behalf of the Fund include an amount in addition to trade execution, which may be rebated back to the Fund to offset certain expenses. This amount totaled $863 for the period. Through arrangements with the Fund's custodian, credits realized as a result of certain uninvested cash balances were used to reduce the Fund's expenses by $309.
In addition, during the period the investment adviser reimbursed and/or waived a portion of operating expenses in the amount of $517.
9. Other.
The Fund's organizational documents provide former and current trustees and officers with a limited indemnification against liabilities arising in connection with the performance of their duties to the Fund. In the normal course of business, the Fund may also enter into contracts that provide general indemnifications. The Fund's maximum exposure under these arrangements is unknown as this would be dependent on future claims that may be made against the Fund. The risk of material loss from such claims is considered remote.
Report of Independent Registered Public Accounting Firm
To the Trustees of Fidelity Investment Trust and Shareholders of Fidelity Global Equity Income Fund:
Opinion on the Financial Statements and Financial Highlights
We have audited the accompanying statement of assets and liabilities of Fidelity Global Equity Income Fund (the “Fund”), a fund of Fidelity Investment Trust , including the schedule of investments, as of October 31, 2019, and the related statement of operations for the year then ended, the statement of changes in net assets for each of the two years in the period then ended, the financial highlights for each of the five years in the period then ended, and the related notes. In our opinion, the financial statements and financial highlights present fairly, in all material respects, the financial position of the Fund as of October 31, 2019, and the results of its operations for the year then ended, the changes in its net assets for each of the two years in the period then ended, and the financial highlights for each of the five years in the period then ended, in conformity with accounting principles generally accepted in the United States of America.
Basis for Opinion
These financial statements and financial highlights are the responsibility of the Fund's management. Our responsibility is to express an opinion on the Fund's financial statements and financial highlights based on our audits. We are a public accounting firm registered with the Public Company Accounting Oversight Board (United States) (PCAOB) and are required to be independent with respect to the Fund in accordance with the U.S. federal securities laws and the applicable rules and regulations of the Securities and Exchange Commission and the PCAOB.
We conducted our audits in accordance with the standards of the PCAOB. Those standards require that we plan and perform the audit to obtain reasonable assurance about whether the financial statements and financial highlights are free of material misstatement, whether due to error or fraud. The Fund is not required to have, nor were we engaged to perform, an audit of its internal control over financial reporting. As part of our audits we are required to obtain an understanding of internal control over financial reporting but not for the purpose of expressing an opinion on the effectiveness of the Fund’s internal control over financial reporting. Accordingly, we express no such opinion.
Our audits included performing procedures to assess the risks of material misstatement of the financial statements and financial highlights, whether due to error or fraud, and performing procedures that respond to those risks. Such procedures included examining, on a test basis, evidence regarding the amounts and disclosures in the financial statements and financial highlights. Our audits also included evaluating the accounting principles used and significant estimates made by management, as well as evaluating the overall presentation of the financial statements and financial highlights. Our procedures included confirmation of securities owned as of October 31, 2019, by correspondence with the custodians and brokers. We believe that our audits provide a reasonable basis for our opinion.
/s/ Deloitte & Touche LLP
Boston, Massachusetts
December 13, 2019
We have served as the auditor of one or more of the Fidelity investment companies since 1999.
Trustees and Officers
The Trustees, Members of the Advisory Board (if any), and officers of the trust and fund, as applicable, are listed below. The Board of Trustees governs the fund and is responsible for protecting the interests of shareholders. The Trustees are experienced executives who meet periodically throughout the year to oversee the fund's activities, review contractual arrangements with companies that provide services to the fund, oversee management of the risks associated with such activities and contractual arrangements, and review the fund's performance. Except for Jonathan Chiel, each of the Trustees oversees 298 funds. Mr. Chiel oversees 171 funds.
The Trustees hold office without limit in time except that (a) any Trustee may resign; (b) any Trustee may be removed by written instrument, signed by at least two-thirds of the number of Trustees prior to such removal; (c) any Trustee who requests to be retired or who has become incapacitated by illness or injury may be retired by written instrument signed by a majority of the other Trustees; and (d) any Trustee may be removed at any special meeting of shareholders by a two-thirds vote of the outstanding voting securities of the trust. Each Trustee who is not an interested person (as defined in the 1940 Act) of the trust and the fund is referred to herein as an Independent Trustee. Each Independent Trustee shall retire not later than the last day of the calendar year in which his or her 75th birthday occurs. The Independent Trustees may waive this mandatory retirement age policy with respect to individual Trustees. Officers and Advisory Board Members hold office without limit in time, except that any officer or Advisory Board Member may resign or may be removed by a vote of a majority of the Trustees at any regular meeting or any special meeting of the Trustees. Except as indicated, each individual has held the office shown or other offices in the same company for the past five years.
The fund’s Statement of Additional Information (SAI) includes more information about the Trustees. To request a free copy, call Fidelity at 1-800-544-8544.
Experience, Skills, Attributes, and Qualifications of the Trustees. The Governance and Nominating Committee has adopted a statement of policy that describes the experience, qualifications, attributes, and skills that are necessary and desirable for potential Independent Trustee candidates (Statement of Policy). The Board believes that each Trustee satisfied at the time he or she was initially elected or appointed a Trustee, and continues to satisfy, the standards contemplated by the Statement of Policy. The Governance and Nominating Committee also engages professional search firms to help identify potential Independent Trustee candidates who have the experience, qualifications, attributes, and skills consistent with the Statement of Policy. From time to time, additional criteria based on the composition and skills of the current Independent Trustees, as well as experience or skills that may be appropriate in light of future changes to board composition, business conditions, and regulatory or other developments, have also been considered by the professional search firms and the Governance and Nominating Committee. In addition, the Board takes into account the Trustees' commitment and participation in Board and committee meetings, as well as their leadership of standing and ad hoc committees throughout their tenure.
In determining that a particular Trustee was and continues to be qualified to serve as a Trustee, the Board has considered a variety of criteria, none of which, in isolation, was controlling. The Board believes that, collectively, the Trustees have balanced and diverse experience, qualifications, attributes, and skills, which allow the Board to operate effectively in governing the fund and protecting the interests of shareholders. Information about the specific experience, skills, attributes, and qualifications of each Trustee, which in each case led to the Board's conclusion that the Trustee should serve (or continue to serve) as a trustee of the fund, is provided below.
Board Structure and Oversight Function. James C. Curvey is an interested person and currently serves as Chairman. The Trustees have determined that an interested Chairman is appropriate and benefits shareholders because an interested Chairman has a personal and professional stake in the quality and continuity of services provided to the fund. Independent Trustees exercise their informed business judgment to appoint an individual of their choosing to serve as Chairman, regardless of whether the Trustee happens to be independent or a member of management. The Independent Trustees have determined that they can act independently and effectively without having an Independent Trustee serve as Chairman and that a key structural component for assuring that they are in a position to do so is for the Independent Trustees to constitute a substantial majority for the Board. The Independent Trustees also regularly meet in executive session. Ned C. Lautenbach serves as Chairman of the Independent Trustees and as such (i) acts as a liaison between the Independent Trustees and management with respect to matters important to the Independent Trustees and (ii) with management prepares agendas for Board meetings.
Fidelity® funds are overseen by different Boards of Trustees. The fund's Board oversees Fidelity's high income and certain equity funds, and other Boards oversee Fidelity's investment-grade bond, money market, asset allocation, and other equity funds. The asset allocation funds may invest in Fidelity® funds overseen by the fund's Board. The use of separate Boards, each with its own committee structure, allows the Trustees of each group of Fidelity® funds to focus on the unique issues of the funds they oversee, including common research, investment, and operational issues. On occasion, the separate Boards establish joint committees to address issues of overlapping consequences for the Fidelity® funds overseen by each Board.
The Trustees operate using a system of committees to facilitate the timely and efficient consideration of all matters of importance to the Trustees, the fund, and fund shareholders and to facilitate compliance with legal and regulatory requirements and oversight of the fund's activities and associated risks. The Board, acting through its committees, has charged FMR and its affiliates with (i) identifying events or circumstances the occurrence of which could have demonstrably adverse effects on the fund's business and/or reputation; (ii) implementing processes and controls to lessen the possibility that such events or circumstances occur or to mitigate the effects of such events or circumstances if they do occur; and (iii) creating and maintaining a system designed to evaluate continuously business and market conditions in order to facilitate the identification and implementation processes described in (i) and (ii) above. Because the day-to-day operations and activities of the fund are carried out by or through FMR, its affiliates, and other service providers, the fund's exposure to risks is mitigated but not eliminated by the processes overseen by the Trustees. While each of the Board's committees has responsibility for overseeing different aspects of the fund's activities, oversight is exercised primarily through the Operations, Audit, and Compliance Committees. Appropriate personnel, including but not limited to the fund's Chief Compliance Officer (CCO), FMR's internal auditor, the independent accountants, the fund's Treasurer and portfolio management personnel, make periodic reports to the Board's committees, as appropriate, including an annual review of Fidelity's risk management program for the Fidelity® funds. The responsibilities of each standing committee, including their oversight responsibilities, are described further under "Standing Committees of the Trustees."
Interested Trustees*:
Correspondence intended for a Trustee who is an interested person may be sent to Fidelity Investments, 245 Summer Street, Boston, Massachusetts 02210.
Name, Year of Birth; Principal Occupations and Other Relevant Experience+
Jonathan Chiel (1957)
Year of Election or Appointment: 2016
Trustee
Mr. Chiel also serves as Trustee of other Fidelity® funds. Mr. Chiel is Executive Vice President and General Counsel for FMR LLC (diversified financial services company, 2012-present). Previously, Mr. Chiel served as general counsel (2004-2012) and senior vice president and deputy general counsel (2000-2004) for John Hancock Financial Services; a partner with Choate, Hall & Stewart (1996-2000) (law firm); and an Assistant United States Attorney for the United States Attorney’s Office of the District of Massachusetts (1986-95), including Chief of the Criminal Division (1993-1995). Mr. Chiel is a director on the boards of the Boston Bar Foundation and the Maimonides School.
James C. Curvey (1935)
Year of Election or Appointment: 2007
Trustee
Chairman of the Board of Trustees
Mr. Curvey also serves as Trustee of other Fidelity® funds. Mr. Curvey is Vice Chairman (2007-present) and Director of FMR LLC (diversified financial services company). In addition, Mr. Curvey is an Overseer Emeritus for the Boston Symphony Orchestra, a Director of Artis-Naples, and a Trustee of Brewster Academy in Wolfeboro, New Hampshire. Previously, Mr. Curvey served as a Director of Fidelity Research & Analysis Co. (investment adviser firm, 2009-2018), Director of Fidelity Investments Money Management, Inc. (investment adviser firm, 2009-2014) and a Director of FMR and FMR Co., Inc. (investment adviser firms, 2007-2014).
* Determined to be an “Interested Trustee” by virtue of, among other things, his or her affiliation with the trust or various entities under common control with FMR.
+ The information includes the Trustee's principal occupation during the last five years and other information relating to the experience, attributes, and skills relevant to the Trustee's qualifications to serve as a Trustee, which led to the conclusion that the Trustee should serve as a Trustee for the fund.
Independent Trustees:
Correspondence intended for an Independent Trustee may be sent to Fidelity Investments, P.O. Box 55235, Boston, Massachusetts 02205-5235.
Name, Year of Birth; Principal Occupations and Other Relevant Experience+
Dennis J. Dirks (1948)
Year of Election or Appointment: 2005
Trustee
Mr. Dirks also serves as Trustee of other Fidelity® funds. Prior to his retirement in May 2003, Mr. Dirks was Chief Operating Officer and a member of the Board of The Depository Trust & Clearing Corporation (DTCC). He also served as President, Chief Operating Officer, and Board member of The Depository Trust Company (DTC) and President and Board member of the National Securities Clearing Corporation (NSCC). In addition, Mr. Dirks served as Chief Executive Officer and Board member of the Government Securities Clearing Corporation, Chief Executive Officer and Board member of the Mortgage-Backed Securities Clearing Corporation, as a Trustee and a member of the Finance Committee of Manhattan College (2005-2008), as a Trustee and a member of the Finance Committee of AHRC of Nassau County (2006-2008), as a member of the Independent Directors Council (IDC) Governing Council (2010-2015), and as a member of the Board of Directors for The Brookville Center for Children’s Services, Inc. (2009-2017). Mr. Dirks is a member of the Finance Committee (2016-present) and Board of Directors (2017-present) and is Treasurer (2018-present) of the Asolo Repertory Theatre.
Donald F. Donahue (1950)
Year of Election or Appointment: 2018
Trustee
Mr. Donahue also serves as a Trustee of other Fidelity® funds. Mr. Donahue is President and Chief Executive Officer of Miranda Partners, LLC (risk consulting for the financial services industry, 2012-present). Previously, Mr. Donahue served as a Member of the Advisory Board of certain Fidelity® funds (2015-2018) and Chief Executive Officer (2006-2012), Chief Operating Officer (2003-2006), and Managing Director, Customer Marketing and Development (1999-2003) of The Depository Trust & Clearing Corporation (financial markets infrastructure). Mr. Donahue serves as a Member (2007-present) and Co-Chairman (2016-present) of the Board of Directors of United Way of New York, Member of the Board of Directors of NYC Leadership Academy (2012-present) and Member of the Board of Advisors of Ripple Labs, Inc. (financial services, 2015-present). He also served as Chairman (2010-2012) and Member of the Board of Directors (2012-2013) of Omgeo, LLC (financial services), Treasurer of United Way of New York (2012-2016), and Member of the Board of Directors of XBRL US (financial services non-profit, 2009-2012) and the International Securities Services Association (2009-2012).
Alan J. Lacy (1953)
Year of Election or Appointment: 2008
Trustee
Mr. Lacy also serves as Trustee of other Fidelity® funds. Mr. Lacy serves as a Director of Bristol-Myers Squibb Company (global pharmaceuticals, 2008-present). He is a Trustee of the California Chapter of The Nature Conservancy (2015-present) and a Director of the Center for Advanced Study in the Behavioral Sciences at Stanford University (2015-present). In addition, Mr. Lacy served as Senior Adviser (2007-2014) of Oak Hill Capital Partners, L.P. (private equity) and also served as Chief Executive Officer (2005) and Vice Chairman (2005-2006) of Sears Holdings Corporation (retail) and Chief Executive Officer and Chairman of the Board of Sears, Roebuck and Co. (retail, 2000-2005). Previously, Mr. Lacy served as Chairman (2014-2017) and a member (2010-2017) of the Board of Directors of Dave & Buster’s Entertainment, Inc. (restaurant and entertainment complexes), as Chairman (2008-2011) and a member (2006-2015) of the Board of Trustees of the National Parks Conservation Association, and as a member of the Board of Directors for The Hillman Companies, Inc. (hardware wholesalers, 2010-2014), Earth Fare, Inc. (retail grocery, 2010-2014), and The Western Union Company (global money transfer, 2006-2011).
Ned C. Lautenbach (1944)
Year of Election or Appointment: 2000
Trustee
Chairman of the Independent Trustees
Mr. Lautenbach also serves as Trustee of other Fidelity® funds. Mr. Lautenbach currently serves as Chair (2018-present) and Member (2013-present) of the Board of Governors, State University System of Florida and is a member of the Council on Foreign Relations (1994-present). He is also a member and has most recently served as Chairman of the Board of Directors of Artis-Naples (2012-present). Previously, Mr. Lautenbach served as a member and then Lead Director of the Board of Directors of Eaton Corporation (diversified industrial, 1997-2016). He was also a Partner and Advisory Partner at Clayton, Dubilier & Rice, LLC (private equity investment, 1998-2010), as well as a Director of Sony Corporation (2006-2007). In addition, Mr. Lautenbach also had a 30-year career with IBM (technology company) during which time he served as Senior Vice President and a member of the Corporate Executive Committee (1968-1998).
Joseph Mauriello (1944)
Year of Election or Appointment: 2008
Trustee
Mr. Mauriello also serves as Trustee of other Fidelity® funds. Prior to his retirement in January 2006, Mr. Mauriello served in numerous senior management positions including Deputy Chairman and Chief Operating Officer (2004-2005), and Vice Chairman of Financial Services (2002-2004) of KPMG LLP US (professional services, 1965-2005). Mr. Mauriello currently serves as a member of the Independent Directors Council (IDC) Governing Council (2015-present). Previously, Mr. Mauriello served as a member of the Board of Directors of XL Group plc. (global insurance and re-insurance, 2006-2018).
Cornelia M. Small (1944)
Year of Election or Appointment: 2005
Trustee
Ms. Small also serves as Trustee of other Fidelity® funds. Ms. Small is a member of the Board of Directors (2009-present) and Chair of the Investment Committee (2010-present) of the Teagle Foundation. Ms. Small also serves on the Investment Committee of the Berkshire Taconic Community Foundation (2008-present). Previously, Ms. Small served as Chairperson (2002-2008) and a member of the Investment Committee and Chairperson (2008-2012) and a member of the Board of Trustees of Smith College. In addition, Ms. Small served as Chief Investment Officer, Director of Global Equity Investments, and a member of the Board of Directors of Scudder, Stevens & Clark and Scudder Kemper Investments.
Garnett A. Smith (1947)
Year of Election or Appointment: 2018
Trustee
Mr. Smith also serves as Trustee of other Fidelity® funds. Prior to Mr. Smith's retirement, he served as Chairman and Chief Executive Officer of Inbrand Corp. (manufacturer of personal absorbent products, 1990-1997). He also served as President (1986-1990) of Inbrand Corp. Prior to his employment with Inbrand Corp., he was employed by a retail fabric chain and North Carolina National Bank. In addition, Mr. Smith served as a Member of the Advisory Board of certain Fidelity® funds (2012-2013) and as a board member of the Jackson Hole Land Trust (2009-2012).
David M. Thomas (1949)
Year of Election or Appointment: 2008
Trustee
Mr. Thomas also serves as Trustee of other Fidelity® funds. Mr. Thomas serves as Non-Executive Chairman of the Board of Directors of Fortune Brands Home and Security (home and security products, 2011-present) and as a member of the Board of Directors (2004-present) and Presiding Director (2013-present) of Interpublic Group of Companies, Inc. (marketing communication). Previously, Mr. Thomas served as Executive Chairman (2005-2006) and Chairman and Chief Executive Officer (2000-2005) of IMS Health, Inc. (pharmaceutical and healthcare information solutions), a Director of Fortune Brands, Inc. (consumer products, 2000-2011), and a member of the Board of Trustees of the University of Florida (2013-2018).
+ The information includes the Trustee's principal occupation during the last five years and other information relating to the experience, attributes, and skills relevant to the Trustee's qualifications to serve as a Trustee, which led to the conclusion that the Trustee should serve as a Trustee for the fund.
Advisory Board Members and Officers:
Correspondence intended for a Member of the Advisory Board (if any) may be sent to Fidelity Investments, P.O. Box 55235, Boston, Massachusetts 02205-5235. Correspondence intended for an officer or Peter S. Lynch may be sent to Fidelity Investments, 245 Summer Street, Boston, Massachusetts 02210. Officers appear below in alphabetical order.
Name, Year of Birth; Principal Occupation
Vicki L. Fuller (1957)
Year of Election or Appointment: 2018
Member of the Advisory Board
Ms. Fuller also serves as Member of the Advisory Board of other Fidelity® funds. Ms. Fuller serves as a member of the Board of Directors, Audit Committee, and Nominating and Governance Committee of The Williams Companies, Inc. (natural gas infrastructure, 2018-present). Previously, Ms. Fuller served as the Chief Investment Officer of the New York State Common Retirement Fund (2012-2018) and held a variety of positions at AllianceBernstein L.P. (global asset management, 1985-2012), including Managing Director (2006-2012) and Senior Vice President and Senior Portfolio Manager (2001-2006).
Peter S. Lynch (1944)
Year of Election or Appointment: 2003
Member of the Advisory Board
Mr. Lynch also serves as Member of the Advisory Board of other Fidelity® funds. Mr. Lynch is Vice Chairman and a Director of FMR (investment adviser firm) and FMR Co., Inc. (investment adviser firm). In addition, Mr. Lynch serves as a Trustee of Boston College and as the Chairman of the Inner-City Scholarship Fund. Previously, Mr. Lynch served on the Special Olympics International Board of Directors (1997-2006).
Michael E. Wiley (1950)
Year of Election or Appointment: 2018
Member of the Advisory Board
Mr. Wiley also serves as Trustee or Member of the Advisory Board of other Fidelity® funds. Mr. Wiley serves as a Director of High Point Resources (exploration and production, 2005-present). Previously, Mr. Wiley served as a Director of Andeavor Corporation (independent oil refiner and marketer, 2005-2018), a Director of Andeavor Logistics LP (natural resources logistics, 2015-2018), a Director of Post Oak Bank (privately-held bank, 2004-2018), a Director of Asia Pacific Exploration Consolidated (international oil and gas exploration and production, 2008-2013), a member of the Board of Trustees of the University of Tulsa (2000-2006; 2007-2010), a Senior Energy Advisor of Katzenbach Partners, LLC (consulting, 2006-2007), an Advisory Director of Riverstone Holdings (private investment), a Director of Spinnaker Exploration Company (exploration and production, 2001-2005) and Chairman, President, and CEO of Baker Hughes, Inc. (oilfield services, 2000-2004).
Elizabeth Paige Baumann (1968)
Year of Election or Appointment: 2017
Anti-Money Laundering (AML) Officer
Ms. Baumann also serves as AML Officer of other funds. She is Chief AML Officer (2012-present) and Senior Vice President (2014-present) of FMR LLC (diversified financial services company) and is an employee of Fidelity Investments. Previously, Ms. Baumann served as AML Officer of the funds (2012-2016), and Vice President (2007-2014) and Deputy Anti-Money Laundering Officer (2007-2012) of FMR LLC.
Craig S. Brown (1977)
Year of Election or Appointment: 2019
Assistant Treasurer
Mr. Brown also serves as Assistant Treasurer of other funds. Mr. Brown is an employee of Fidelity Investments (2013-present).
John J. Burke III (1964)
Year of Election or Appointment: 2018
Chief Financial Officer
Mr. Burke also serves as Chief Financial Officer of other funds. Mr. Burke serves as Head of Investment Operations for Fidelity Fund and Investment Operations (2018-present) and is an employee of Fidelity Investments (1998-present). Previously Mr. Burke served as head of Asset Management Investment Operations (2012-2018).
William C. Coffey (1969)
Year of Election or Appointment: 2019
Assistant Secretary
Mr. Coffey also serves as Assistant Secretary of other funds. He is Senior Vice President and Deputy General Counsel of FMR LLC (diversified financial services company, 2010-present), and is an employee of Fidelity Investments. Previously, Mr. Coffey served as Secretary and CLO of certain funds (2018-2019); CLO, Secretary, and Senior Vice President of Fidelity Management & Research Company and FMR Co., Inc. (investment adviser firms, 2018-2019); Secretary of Fidelity SelectCo, LLC and Fidelity Investments Money Management, Inc. (investment adviser firms, 2018-2019); CLO of Fidelity Management & Research (Hong Kong) Limited, FMR Investment Management (UK) Limited, and Fidelity Management & Research (Japan) Limited (investment adviser firms, 2018-2019); and Assistant Secretary of certain funds (2009-2018).
Timothy M. Cohen (1969)
Year of Election or Appointment: 2018
Vice President
Mr. Cohen also serves as Vice President of other funds. Mr. Cohen serves as Executive Vice President of Fidelity SelectCo, LLC (2019-present), Co-Head of Equity (2018-present), a Director of Fidelity Management & Research (Japan) Limited (investment adviser firm, 2016-present), and is an employee of Fidelity Investments. Previously, Mr. Cohen served as Head of Global Equity Research (2016-2018), Chief Investment Officer - Equity and a Director of Fidelity Management & Research (U.K.) Inc. (investment adviser firm, 2013-2015) and as a Director of Fidelity Management & Research (Hong Kong) Limited (investment adviser firm, 2017).
Jonathan Davis (1968)
Year of Election or Appointment: 2010
Assistant Treasurer
Mr. Davis also serves as Assistant Treasurer of other funds. Mr. Davis serves as Assistant Treasurer of FMR Capital, Inc. (2017-present) and is an employee of Fidelity Investments. Previously, Mr. Davis served as Vice President and Associate General Counsel of FMR LLC (diversified financial services company, 2003-2010).
Adrien E. Deberghes (1967)
Year of Election or Appointment: 2016
Assistant Treasurer
Mr. Deberghes also serves as an officer of other funds. He serves as Assistant Treasurer of FMR Capital, Inc. (2017-present), Executive Vice President of Fidelity Investments Money Management, Inc. (FIMM) (investment adviser firm, 2016-present), and is an employee of Fidelity Investments (2008-present). Previously, Mr. Deberghes served as President and Treasurer of certain Fidelity® funds (2013-2018). Prior to joining Fidelity Investments, Mr. Deberghes was Senior Vice President of Mutual Fund Administration at State Street Corporation (2007-2008), Senior Director of Mutual Fund Administration at Investors Bank & Trust (2005-2007), and Director of Finance for Dunkin' Brands (2000-2005). Previously, Mr. Deberghes served in other fund officer roles.
Laura M. Del Prato (1964)
Year of Election or Appointment: 2018
Assistant Treasurer
Ms. Del Prato also serves as an officer of other funds. Ms. Del Prato is an employee of Fidelity Investments (2017-present). Prior to joining Fidelity Investments, Ms. Del Prato served as a Managing Director and Treasurer of the JPMorgan Mutual Funds (2014-2017). Prior to JPMorgan, Ms. Del Prato served as a partner at Cohen Fund Audit Services (accounting firm, 2012-2013) and KPMG LLP (accounting firm, 2004-2012).
Colm A. Hogan (1973)
Year of Election or Appointment: 2016
Deputy Treasurer
Mr. Hogan also serves as an officer of other funds. Mr. Hogan serves as Assistant Treasurer of FMR Capital, Inc. (2017-present) and is an employee of Fidelity Investments (2005-present). Previously, Mr. Hogan served as Assistant Treasurer of certain Fidelity® funds (2016-2018).
Pamela R. Holding (1964)
Year of Election or Appointment: 2018
Vice President
Ms. Holding also serves as Vice President of other funds. Ms. Holding serves as Executive Vice President of Fidelity SelectCo, LLC (2019-present), Co-Head of Equity (2018-present) and is an employee of Fidelity Investments (2013-present). Previously, Ms. Holding served as Chief Investment Officer of Fidelity Institutional Asset Management (2013-2018).
Cynthia Lo Bessette (1969)
Year of Election or Appointment: 2019
Secretary and Chief Legal Officer (CLO)
Ms. Lo Bessette also serves as Secretary and CLO of other funds. Ms. Lo Bessette serves as CLO, Secretary, and Senior Vice President of Fidelity Management & Research Company and FMR Co., Inc. (investment adviser firms, 2019-present); Secretary of Fidelity SelectCo, LLC and Fidelity Investments Money Management, Inc. (investment adviser firms, 2019-present); and CLO of Fidelity Management & Research (Hong Kong) Limited, FMR Investment Management (UK) Limited, and Fidelity Management & Research (Japan) Limited (investment adviser firms, 2019-present). She is a Senior Vice President and Deputy General Counsel of FMR LLC (diversified financial services company, 2019-present), and is an employee of Fidelity Investments. Previously, Ms. Lo Bessette served as Executive Vice President, General Counsel (2016-2019) and Senior Vice President, Deputy General Counsel (2015-2016) of OppenheimerFunds (investment management company) and Deputy Chief Legal Officer (2013-2015) of Jennison Associates LLC (investment adviser firm).
Chris Maher (1972)
Year of Election or Appointment: 2013
Assistant Treasurer
Mr. Maher serves as Assistant Treasurer of other funds. Mr. Maher is Vice President of Valuation Oversight, serves as Assistant Treasurer of FMR Capital, Inc. (2017-present), and is an employee of Fidelity Investments. Previously, Mr. Maher served as Vice President of Asset Management Compliance (2013), Vice President of the Program Management Group of FMR (investment adviser firm, 2010-2013), and Vice President of Valuation Oversight (2008-2010).
Kenneth B. Robins (1969)
Year of Election or Appointment: 2016
Chief Compliance Officer
Mr. Robins also serves as an officer of other funds. Mr. Robins serves as Compliance Officer of Fidelity Management & Research Company and FMR Co., Inc. (investment adviser firms, 2016-present) and is an employee of Fidelity Investments (2004-present). Previously, Mr. Robins served as Executive Vice President of Fidelity Investments Money Management, Inc. (investment adviser firm, 2013-2016) and served in other fund officer roles.
Stacie M. Smith (1974)
Year of Election or Appointment: 2016
President and Treasurer
Ms. Smith also serves as an officer of other funds. Ms. Smith serves as Assistant Treasurer of FMR Capital, Inc. (2017-present), is an employee of Fidelity Investments (2009-present), and has served in other fund officer roles. Prior to joining Fidelity Investments, Ms. Smith served as Senior Audit Manager of Ernst & Young LLP (accounting firm, 1996-2009). Previously, Ms. Smith served as Assistant Treasurer (2013-2018) and Deputy Treasurer (2013-2016) of certain Fidelity® funds.
Marc L. Spector (1972)
Year of Election or Appointment: 2016
Assistant Treasurer
Mr. Spector also serves as an officer of other funds. Mr. Spector serves as Assistant Treasurer of FMR Capital, Inc. (2017-present) and is an employee of Fidelity Investments (2016-present). Prior to joining Fidelity Investments, Mr. Spector served as Director at the Siegfried Group (accounting firm, 2013-2016), and prior to Siegfried Group as audit senior manager at Deloitte & Touche (accounting firm, 2005-2013).
Jim Wegmann (1979)
Year of Election or Appointment: 2019
Assistant Treasurer
Mr. Wegmann also serves as Assistant Treasurer of other funds. Mr. Wegmann is an employee of Fidelity Investments (2011-present).
Shareholder Expense Example
As a shareholder of the Fund, you incur two types of costs: (1) transaction costs and (2) ongoing costs, including management fees and other Fund expenses. This Example is intended to help you understand your ongoing costs (in dollars) of investing in the Fund and to compare these costs with the ongoing costs of investing in other mutual funds.
The Example is based on an investment of $1,000 invested at the beginning of the period and held for the entire period (May 1, 2019 to October 31, 2019).
Actual Expenses
The first line of the accompanying table provides information about actual account values and actual expenses. You may use the information in this line, together with the amount you invested, to estimate the expenses that you paid over the period. Simply divide your account value by $1,000.00 (for example, an $8,600 account value divided by $1,000.00 = 8.6), then multiply the result by the number in the first line under the heading entitled "Expenses Paid During Period" to estimate the expenses you paid on your account during this period. In addition, the Fund, as a shareholder in the underlying Fidelity Central Funds, will indirectly bear its pro-rata share of the fees and expenses incurred by the underlying Fidelity Central Funds. These fees and expenses are not included in the Fund's annualized expense ratio used to calculate the expense estimate in the table below.
Hypothetical Example for Comparison Purposes
The second line of the accompanying table provides information about hypothetical account values and hypothetical expenses based on the Fund's actual expense ratio and an assumed rate of return of 5% per year before expenses, which is not the Fund's actual return. The hypothetical account values and expenses may not be used to estimate the actual ending account balance or expenses you paid for the period. You may use this information to compare the ongoing costs of investing in the Fund and other funds. To do so, compare this 5% hypothetical example with the 5% hypothetical examples that appear in the shareholder reports of the other funds. In addition, the Fund, as a shareholder in the underlying Fidelity Central Funds, will indirectly bear its pro-rata share of the fees and expenses incurred by the underlying Fidelity Central Funds. These fees and expenses are not included in the Fund's annualized expense ratio used to calculate the expense estimate in the table below.
Please note that the expenses shown in the table are meant to highlight your ongoing costs only and do not reflect any transaction costs. Therefore, the second line of the table is useful in comparing ongoing costs only, and will not help you determine the relative total costs of owning different funds.
| | Annualized Expense Ratio-A | Beginning
Account Value
May 1, 2019 | Ending
Account Value
October 31, 2019 | Expenses Paid
During Period-B
May 1, 2019
to October 31, 2019 |
| Actual | 1.03% | $1,000.00 | $1,054.40 | $5.33 |
| Hypothetical-C | | $1,000.00 | $1,020.01 | $5.24 |
A Annualized expense ratio reflects expenses net of applicable fee waivers.
B Expenses are equal to the Fund's annualized expense ratio, multiplied by the average account value over the period, multiplied by 184/365 (to reflect the one-half year period).
C 5% return per year before expenses
Distributions (Unaudited)
The Board of Trustees of Fidelity Global Equity Income Fund voted to pay on December 16, 2019, to shareholders of record at the opening of business on December 13, 2019, a distribution of $0.006 per share derived from capital gains realized from sales of portfolio securities and a dividend of $0.029 per share from net investment income.
The fund hereby designates as a capital gain dividend with respect to the taxable year ended October 31, 2019, $47,250, or, if subsequently determined to be different, the net capital gain of such year.
A total of 1.03% of the dividends distributed during the fiscal year was derived from interest on U.S. Government securities which is generally exempt from state income tax.
The fund designates 71%, 68%, 68%, and 68% of the dividends distributed in December, April, July, and October, respectively during the fiscal year as qualifying for the dividends–received deduction for corporate shareholders.
The fund designates 100% of the dividends distributed during the fiscal year as amounts which may be taken into account as a dividend for the purposes of the maximum rate under section 1(h)(11) of the Internal Revenue Code.
The fund will notify shareholders in January 2020 of amounts for use in preparing 2019 income tax returns.
GED-ANN-1219
1.938162.107
Fidelity® Series Emerging Markets Fund
Fidelity® Series Emerging Markets Opportunities Fund
Fidelity® Series International Growth Fund
Fidelity® Series International Small Cap Fund
Fidelity® Series International Value Fund
Annual Report
October 31, 2019
See the inside front cover for important information about access to your fund’s shareholder reports.
Beginning on January 1, 2021, as permitted by regulations adopted by the Securities and Exchange Commission, paper copies of a fund’s shareholder reports will no longer be sent by mail, unless you specifically request paper copies of the reports from the fund or from your financial intermediary, such as a financial advisor, broker-dealer or bank. Instead, the reports will be made available on a website, and you will be notified by mail each time a report is posted and provided with a website link to access the report.
If you already elected to receive shareholder reports electronically, you will not be affected by this change and you need not take any action. You may elect to receive shareholder reports and other communications from a fund electronically, by contacting your financial intermediary. For Fidelity customers, visit Fidelity's web site or call Fidelity using the contact information listed below.
You may elect to receive all future reports in paper free of charge. If you wish to continue receiving paper copies of your shareholder reports, you may contact your financial intermediary or, if you are a Fidelity customer, visit Fidelity’s website, or call Fidelity at the applicable toll-free number listed below. Your election to receive reports in paper will apply to all funds held with the fund complex/your financial intermediary.
| Account Type | Website | Phone Number |
| Brokerage, Mutual Fund, or Annuity Contracts: | fidelity.com/mailpreferences | 1-800-343-3548 |
| Employer Provided Retirement Accounts: | netbenefits.fidelity.com/preferences (choose 'no' under Required Disclosures to continue to print) | 1-800-343-0860 |
| Advisor Sold Accounts Serviced Through Your Financial Intermediary: | Contact Your Financial Intermediary | Your Financial Intermediary's phone number |
| Advisor Sold Accounts Serviced by Fidelity: | institutional.fidelity.com | 1-877-208-0098 |
Contents
To view a fund's proxy voting guidelines and proxy voting record for the 12-month period ended June 30, visit http://www.fidelity.com/proxyvotingresults or visit the Securities and Exchange Commission's (SEC) web site at http://www.sec.gov.
You may also call 1-800-544-8544 to request a free copy of the proxy voting guidelines.
Standard & Poor's, S&P and S&P 500 are registered service marks of The McGraw-Hill Companies, Inc. and have been licensed for use by Fidelity Distributors Corporation.
Other third-party marks appearing herein are the property of their respective owners.
All other marks appearing herein are registered or unregistered trademarks or service marks of FMR LLC or an affiliated company. © 2019 FMR LLC. All rights reserved.
This report and the financial statements contained herein are submitted for the general information of the shareholders of the Funds. This report is not authorized for distribution to prospective investors in the Funds unless preceded or accompanied by an effective prospectus.
A fund files its complete schedule of portfolio holdings with the SEC for the first and third quarters of each fiscal year on Form N-PORT. Forms N-PORT are available on the SEC’s web site at http://www.sec.gov. A fund's Forms N-PORT may be reviewed and copied at the SEC’s Public Reference Room in Washington, DC. Information regarding the operation of the SEC's Public Reference Room may be obtained by calling 1-800-SEC-0330.
For a complete list of a fund's portfolio holdings, view the most recent holdings listing, semiannual report, or annual report on Fidelity's web site at http://www.fidelity.com, http://www.institutional.fidelity.com, or http://www.401k.com, as applicable.
NOT FDIC INSURED •MAY LOSE VALUE •NO BANK GUARANTEE
Neither the Funds nor Fidelity Distributors Corporation is a bank.
Fidelity® Series Emerging Markets Fund
Performance: The Bottom Line
Average annual total return reflects the change in the value of an investment, assuming reinvestment of distributions from dividend income and capital gains (the profits earned upon the sale of securities that have grown in value, if any) and assuming a constant rate of performance each year. The hypothetical investment and the average annual total returns do not reflect the deduction of taxes that a shareholder would pay on fund distributions or the redemption of fund shares. During periods of reimbursement by Fidelity, a fund’s total return will be greater than it would be had the reimbursement not occurred. How a fund did yesterday is no guarantee of how it will do tomorrow.
Average Annual Total Returns
| For the periods ended October 31, 2019 | Past 1 year | Life of fundA |
| Fidelity® Series Emerging Markets Fund | 7.33% | (4.11)% |
A From August 29, 2018
$10,000 Over Life of Fund
Let's say hypothetically that $10,000 was invested in Fidelity® Series Emerging Markets Fund on August 29, 2018, when the fund started.
The chart shows how the value of your investment would have changed, and also shows how the MSCI Emerging Markets Index performed over the same period.
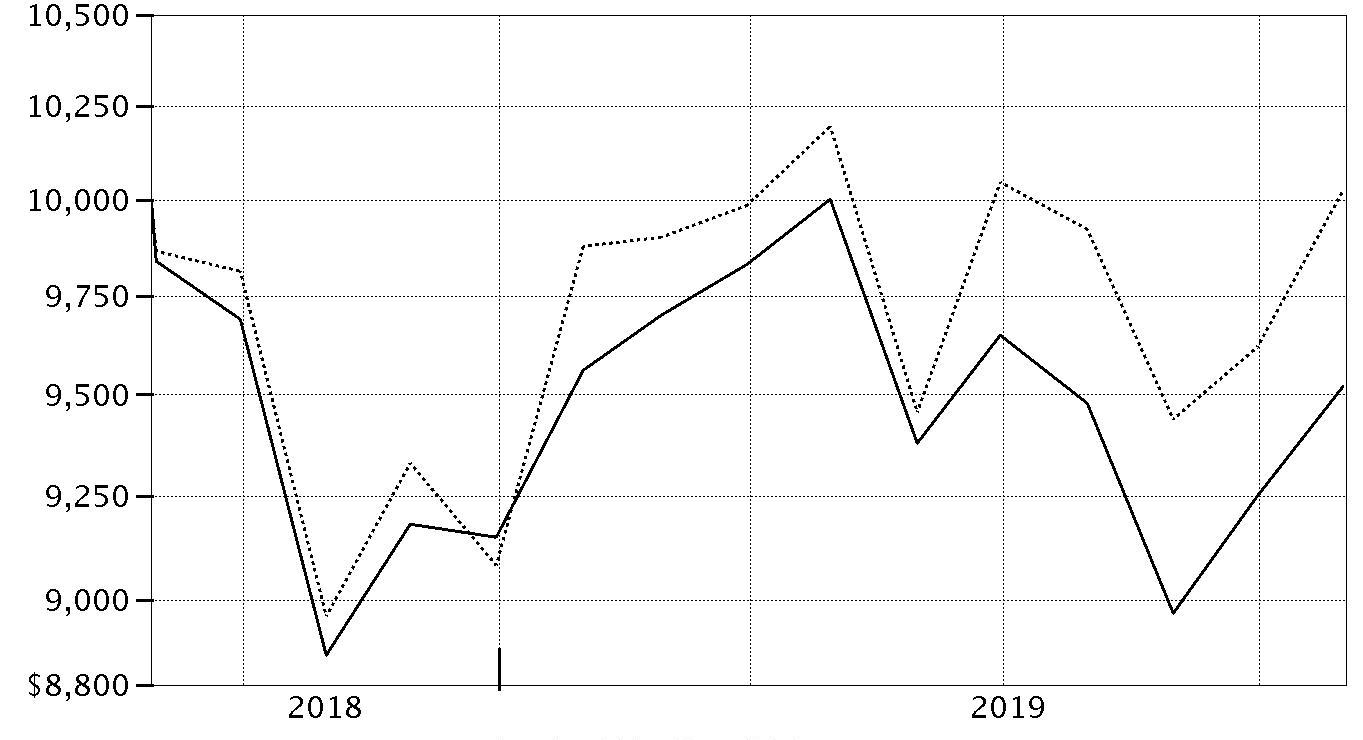
| Period Ending Values |
| $9,520 | Fidelity® Series Emerging Markets Fund |
| $10,026 | MSCI Emerging Markets Index |
Fidelity® Series Emerging Markets Fund
Management's Discussion of Fund Performance
Market Recap: The MSCI ACWI (All Country World Index) ex USA Index gained 11.47% for the 12 months ending October 31, 2019, as international stocks reflected a confluence of factors, including escalating trade tension, and moderating but still positive global economic growth. Currency fluctuations were largely modest and varied by region, muting the overall impact on international equity returns. In late December, the U.S. Federal Reserve shifted from raising interest rates to a more dovish policy in 2019, joining many foreign central banks. In June, international stocks rose 6.03%, as policy stimulus in China stabilized that country’s economic growth. The Fed cut its policy rate in July for the first time since 2008. However, the index returned -1.21% for the month, followed by -3.08% in August. In September, the Fed cut its policy rate another quarter point, citing concerns about slowing economic growth and muted inflation, and did the same in October, leading to monthly gains of 2.59% and 3.49%, respectively. For the full 12 months, the growth-oriented information technology sector (+22%) led the way, followed by utilities (+20%) and real estate (+18%), two high-dividend-yielding categories. Conversely, energy was roughly flat, while materials (+6%) and communication services (7%) also lagged. By region, Asia Pacific ex Japan (+16%), Europe ex U.K (+13%), Canada (+12%) and emerging markets (+12%) fared best. Meanwhile, the U.K. (+7%) and Japan (+10%) trailed the broader market.
Comments from Portfolio Manager Rahul Desai: For the year, the fund returned 7.33%, trailing the 11.89% return of the benchmark MSCI Emerging Markets Index. Versus the benchmark, stock selection in the consumer staples, energy, health care, information technology and financials sectors meaningfully detracted from fund performance, as did an underweighting in consumer discretionary and an overweighting in health care. Geographically, picks in the fund’s core emerging markets segment hurt the most, although non-benchmark exposure to the U.K. also weighed on the fund's relative return. A sizable overweighting in Hyundai Fire & Marine Insurance, based in South Korea, detracted more than any other individual fund position. Other noteworthy relative detractors included an overweighting in China Resources Pharmaceutical Group, and non-benchmark positions in London-based NMC Health and British American Tobacco. The latter two stocks were sold from the fund by period end. Conversely, stock picking in industrials and communication services added meaningful value, along with a large underweighting in the materials sector. By region, non-benchmark investments in Asia-Pacific ex-Japan worked in the fund's favor. A large non-benchmark stake in India-based HDFC Bank, the fund’s second-largest holding at period end, contributed notably, as did non-benchmark positions in SITC International Holdings – a niche shipping and logistics company based in Hong Kong – and Shanghai International Airport.
The views expressed above reflect those of the portfolio manager(s) only through the end of the period as stated on the cover of this report and do not necessarily represent the views of Fidelity or any other person in the Fidelity organization. Any such views are subject to change at any time based upon market or other conditions and Fidelity disclaims any responsibility to update such views. These views may not be relied on as investment advice and, because investment decisions for a Fidelity fund are based on numerous factors, may not be relied on as an indication of trading intent on behalf of any Fidelity fund.
Fidelity® Series Emerging Markets Fund
Investment Summary (Unaudited)
Geographic Diversification (% of fund's net assets)
| As of October 31, 2019 |
| | India | 18.2% |
| | Cayman Islands | 14.1% |
| | United States of America* | 11.5% |
| | Taiwan | 9.4% |
| | Korea (South) | 7.3% |
| | Hong Kong | 5.4% |
| | Brazil | 4.7% |
| | Philippines | 3.3% |
| | South Africa | 3.2% |
| | Other | 22.9% |

* Includes Short-Term investments and Net Other Assets (Liabilities).
Percentages are based on country or territory of incorporation and are adjusted for the effect of futures contracts, if applicable.
Asset Allocation as of October 31, 2019
| | % of fund's net assets |
| Stocks and Equity Futures | 91.5 |
| Short-Term Investments and Net Other Assets (Liabilities) | 8.5 |
Top Ten Stocks as of October 31, 2019
| | % of fund's net assets |
| Taiwan Semiconductor Manufacturing Co. Ltd. (Taiwan, Semiconductors & Semiconductor Equipment) | 4.5 |
| HDFC Bank Ltd. sponsored ADR (India, Banks) | 4.4 |
| Tencent Holdings Ltd. (Cayman Islands, Interactive Media & Services) | 4.2 |
| AMOREPACIFIC Group, Inc. (Korea (South), Personal Products) | 2.9 |
| SITC International Holdings Co. Ltd. (Cayman Islands, Marine) | 2.5 |
| Oil Search Ltd. ADR (Papua New Guinea, Oil, Gas & Consumable Fuels) | 2.5 |
| Tata Global Beverages Ltd. (India, Food Products) | 2.2 |
| Voltronic Power Technology Corp. (Taiwan, Electrical Equipment) | 2.2 |
| Samsung Electronics Co. Ltd. (Korea (South), Technology Hardware, Storage & Peripherals) | 2.0 |
| Safaricom Ltd. (Kenya, Wireless Telecommunication Services) | 1.9 |
| | 29.3 |
Top Market Sectors as of October 31, 2019
| | % of fund's net assets |
| Financials | 24.9 |
| Information Technology | 13.0 |
| Consumer Staples | 12.5 |
| Industrials | 9.6 |
| Communication Services | 9.2 |
| Energy | 6.0 |
| Consumer Discretionary | 5.5 |
| Health Care | 2.5 |
| Materials | 2.3 |
| Real Estate | 1.9 |
Fidelity® Series Emerging Markets Fund
Schedule of Investments October 31, 2019
Showing Percentage of Net Assets
| Common Stocks - 88.5% | | | |
| | | Shares | Value |
| Bermuda - 2.4% | | | |
| Credicorp Ltd. | | 138,855 | $29,735,798 |
| Dairy Farm International Holdings Ltd. | | 3,307,100 | 19,932,929 |
|
| TOTAL BERMUDA | | | 49,668,727 |
|
| Brazil - 4.7% | | | |
| Equatorial Energia SA | | 921,361 | 23,405,625 |
| IRB Brasil Resseguros SA | | 3,523,800 | 33,203,940 |
| Ultrapar Participacoes SA | | 8,550,500 | 40,231,376 |
|
| TOTAL BRAZIL | | | 96,840,941 |
|
| Cayman Islands - 14.1% | | | |
| ASM Pacific Technology Ltd. | | 1,789,700 | 24,989,282 |
| Best Pacific International Holdings Ltd. | | 44,882,500 | 15,156,338 |
| Greatview Aseptic Pack Co. Ltd. | | 50,950,000 | 25,676,413 |
| JD.com, Inc. sponsored ADR (a) | | 663,327 | 20,662,636 |
| Pico Far East Holdings Ltd. | | 29,891,200 | 10,195,077 |
| SITC International Holdings Co. Ltd. | | 47,593,000 | 52,404,591 |
| Tencent Holdings Ltd. | | 2,128,000 | 86,317,888 |
| TK Group Holdings Ltd. | | 38,776,000 | 18,251,918 |
| Vinda International Holdings Ltd. | | 20,133,000 | 37,948,697 |
|
| TOTAL CAYMAN ISLANDS | | | 291,602,840 |
|
| Chile - 2.7% | | | |
| Banco de Chile | | 295,245,700 | 38,020,448 |
| Compania Cervecerias Unidas SA | | 1,152,200 | 11,496,986 |
| Quinenco SA | | 2,879,181 | 6,302,285 |
|
| TOTAL CHILE | | | 55,819,719 |
|
| China - 1.0% | | | |
| Shenzhen Inovance Technology Co. Ltd. (A Shares) | | 5,592,665 | 19,786,623 |
| Hong Kong - 5.4% | | | |
| AIA Group Ltd. | | 4,016,400 | 39,996,214 |
| China Resources Pharmaceutical Group Ltd. (b) | | 37,841,649 | 34,947,060 |
| Far East Horizon Ltd. | | 38,405,779 | 36,360,412 |
|
| TOTAL HONG KONG | | | 111,303,686 |
|
| India - 18.2% | | | |
| Axis Bank Ltd. GDR (Reg. S) | | 622,668 | 32,316,469 |
| CCL Products (India) Ltd. (a) | | 1,654,094 | 4,804,563 |
| Cyient Ltd. | | 3,900,380 | 22,347,283 |
| HDFC Bank Ltd. sponsored ADR | | 1,475,235 | 90,122,106 |
| Hemisphere Properties India Ltd. (a)(c) | | 5,529,627 | 12,604,870 |
| Hindustan Oil Exploration Co. Ltd. (a) | | 264,331 | 371,740 |
| Lupin Ltd. (a) | | 1,618,467 | 16,986,465 |
| Maruti Suzuki India Ltd. | | 291,100 | 30,993,961 |
| Redington India Ltd. | | 7,353,727 | 12,286,394 |
| SH Kelkar & Co. Ltd. (a)(b)(d) | | 9,172,396 | 16,015,747 |
| Sunteck Realty Ltd. (a) | | 4,659,965 | 27,237,936 |
| Tata Communications Ltd. | | 6,539,641 | 32,403,545 |
| Tata Consultancy Services Ltd. | | 768,600 | 24,478,377 |
| Tata Global Beverages Ltd. | | 10,340,553 | 46,144,739 |
| Zensar Technologies Ltd. | | 2,753,105 | 6,909,349 |
|
| TOTAL INDIA | | | 376,023,544 |
|
| Indonesia - 0.8% | | | |
| PT Bank Central Asia Tbk | | 7,797,400 | 17,453,136 |
| Kenya - 1.9% | | | |
| Safaricom Ltd. | | 140,092,400 | 40,346,069 |
| Korea (South) - 7.3% | | | |
| AMOREPACIFIC Group, Inc. | | 819,174 | 59,217,904 |
| Hyundai Fire & Marine Insurance Co. Ltd. | | 762,001 | 16,440,818 |
| KB Financial Group, Inc. | | 866,601 | 31,014,799 |
| Leeno Industrial, Inc. | | 63,701 | 2,895,772 |
| Samsung Electronics Co. Ltd. | | 941,467 | 40,545,452 |
|
| TOTAL KOREA (SOUTH) | | | 150,114,745 |
|
| Malaysia - 0.2% | | | |
| Scientex Bhd | | 1,744,665 | 3,843,758 |
| Mexico - 2.1% | | | |
| Qualitas Controladora S.A.B. de CV | | 2,551,900 | 11,005,413 |
| Regional S.A.B. de CV | | 6,055,218 | 32,163,968 |
|
| TOTAL MEXICO | | | 43,169,381 |
|
| Nigeria - 1.5% | | | |
| Guaranty Trust Bank PLC | | 460,785,195 | 31,673,020 |
| Papua New Guinea - 2.5% | | | |
| Oil Search Ltd. ADR | | 10,411,697 | 51,384,738 |
| Philippines - 3.3% | | | |
| Ayala Corp. | | 2,135,565 | 36,132,864 |
| Pilipinas Shell Petroleum Corp. | | 46,727,610 | 31,161,555 |
|
| TOTAL PHILIPPINES | | | 67,294,419 |
|
| Singapore - 1.1% | | | |
| Delfi Ltd. | | 29,952,900 | 21,819,194 |
| South Africa - 3.2% | | | |
| Capitec Bank Holdings Ltd. | | 416,000 | 37,798,860 |
| City Lodge Hotels Ltd. (d) | | 2,887,874 | 15,272,162 |
| Distell Group Holdings Ltd. | | 1,275,121 | 11,321,282 |
| Pinnacle Technology Holdings Ltd. | | 1,923,338 | 1,839,266 |
|
| TOTAL SOUTH AFRICA | | | 66,231,570 |
|
| Spain - 0.9% | | | |
| Prosegur Cash SA (b) | | 12,567,171 | 19,622,632 |
| Taiwan - 9.4% | | | |
| King's Town Bank | | 8,994,000 | 9,333,730 |
| Poya International Co. Ltd. | | 2,349,000 | 32,233,474 |
| Taiwan Semiconductor Manufacturing Co. Ltd. | | 9,475,000 | 92,678,083 |
| Unified-President Enterprises Corp. | | 5,837,000 | 14,392,498 |
| Voltronic Power Technology Corp. | | 2,048,550 | 45,339,735 |
|
| TOTAL TAIWAN | | | 193,977,520 |
|
| Thailand - 1.5% | | | |
| Kasikornbank PCL (For. Reg.) | | 6,678,400 | 30,846,050 |
| United Kingdom - 2.9% | | | |
| ITE Group PLC | | 21,075,300 | 21,212,014 |
| Network International Holdings PLC (b) | | 5,503,460 | 38,567,386 |
|
| TOTAL UNITED KINGDOM | | | 59,779,400 |
|
| Vietnam - 1.4% | | | |
| Vietnam Dairy Products Corp. | | 5,314,600 | 29,731,566 |
| TOTAL COMMON STOCKS | | | |
| (Cost $1,838,478,040) | | | 1,828,333,278 |
|
| Investment Companies - 1.8% | | | |
| United States of America - 1.8% | | | |
| iShares MSCI India ETF | | | |
| (Cost $37,313,340) | | 1,068,000 | 37,006,200 |
| | | Principal Amount | Value |
|
| Government Obligations - 0.1% | | | |
| United States of America - 0.1% | | | |
| U.S. Treasury Bills, yield at date of purchase 1.91% 12/12/19(e) | | | |
| (Cost $2,185,249) | | 2,190,000 | 2,186,273 |
| | | Shares | Value |
|
| Money Market Funds - 5.0% | | | |
| Fidelity Cash Central Fund 1.83% (f) | | | |
| (Cost $102,822,136) | | 102,802,108 | 102,822,669 |
| TOTAL INVESTMENT IN SECURITIES - 95.4% | | | |
| (Cost $1,980,798,765) | | | 1,970,348,420 |
| NET OTHER ASSETS (LIABILITIES) - 4.6% | | | 94,816,799 |
| NET ASSETS - 100% | | | $2,065,165,219 |
| Futures Contracts | | | | | |
| | Number of contracts | Expiration Date | Notional Amount | Value | Unrealized Appreciation/(Depreciation) |
| Purchased | | | | | |
| Equity Index Contracts | | | | | |
| ICE E-mini MSCI Emerging Markets Index Contracts (United States) | 469 | Dec. 2019 | $24,420,830 | $124,461 | $124,461 |
The notional amount of futures purchased as a percentage of Net Assets is 1.2%
Security Type Abbreviations
ETF – Exchange-Traded Fund
Categorizations in the Schedule of Investments are based on country or territory of incorporation.
Legend
(a) Non-income producing
(b) Security exempt from registration under Rule 144A of the Securities Act of 1933. These securities may be resold in transactions exempt from registration, normally to qualified institutional buyers. At the end of the period, the value of these securities amounted to $109,152,825 or 5.3% of net assets.
(c) Level 3 security
(d) Affiliated company
(e) Security or a portion of the security was pledged to cover margin requirements for futures contracts. At period end, the value of securities pledged amounted to $1,241,883.
(f) Affiliated fund that is generally available only to investment companies and other accounts managed by Fidelity Investments. The rate quoted is the annualized seven-day yield of the fund at period end. A complete unaudited listing of the fund's holdings as of its most recent quarter end is available upon request. In addition, each Fidelity Central Fund's financial statements, which are not covered by the Fund's Report of Independent Registered Public Accounting Firm, are available on the SEC's website or upon request.
Affiliated Central Funds
Information regarding fiscal year to date income earned by the Fund from investments in Fidelity Central Funds is as follows:
| Fund | Income earned |
| Fidelity Cash Central Fund | $2,192,925 |
| Fidelity Securities Lending Cash Central Fund | 25,536 |
| Total | $2,218,461 |
Amounts in the income column in the above table include any capital gain distributions from underlying funds, which are presented in the corresponding line-item in the Statement of Operations, if applicable. Amount for Fidelity Securities Lending Cash Central Fund represents the income earned on investing cash collateral, less rebates paid to borrowers and any lending agent fees associated with the loan, plus any premium payments received for lending certain types of securities.
Other Affiliated Issuers
An affiliated company is a company in which the Fund has ownership of at least 5% of the voting securities. Fiscal year to date transactions with companies which are or were affiliates are as follows:
| Affiliate | Value, beginning of period | Purchases | Sales Proceeds | Dividend Income | Realized Gain (loss) | Change in Unrealized appreciation (depreciation) | Value, end of period |
| City Lodge Hotels Ltd. | $16,603,714 | $8,348,430 | $-- | $466,206 | $-- | $(9,679,982) | $15,272,162 |
| SH Kelkar & Co. Ltd. | -- | 20,630,437 | 738,239 | -- | 78,657 | (3,955,108) | 16,015,747 |
| Total | $16,603,714 | $28,978,867 | $738,239 | $466,206 | $78,657 | $(13,635,090) | $31,287,909 |
Investment Valuation
The following is a summary of the inputs used, as of October 31, 2019, involving the Fund's assets and liabilities carried at fair value. The inputs or methodology used for valuing securities may not be an indication of the risk associated with investing in those securities. For more information on valuation inputs, and their aggregation into the levels used below, please refer to the Investment Valuation section in the accompanying Notes to Financial Statements.
| | Valuation Inputs at Reporting Date: |
| Description | Total | Level 1 | Level 2 | Level 3 |
| Investments in Securities: | | | | |
| Equities: | | | | |
| Communication Services | $190,474,593 | $61,558,083 | $128,916,510 | $-- |
| Consumer Discretionary | 114,318,571 | 68,168,272 | 46,150,299 | -- |
| Consumer Staples | 256,810,358 | 96,428,670 | 160,381,688 | -- |
| Energy | 123,149,409 | 40,231,376 | 82,918,033 | -- |
| Financials | 517,485,181 | 361,814,570 | 155,670,611 | -- |
| Health Care | 51,933,525 | -- | 51,933,525 | -- |
| Industrials | 197,840,648 | 71,264,652 | 126,575,996 | -- |
| Information Technology | 267,536,644 | 83,847,876 | 183,688,768 | -- |
| Materials | 45,535,918 | -- | 45,535,918 | -- |
| Real Estate | 39,842,806 | -- | 27,237,936 | 12,604,870 |
| Utilities | 23,405,625 | 23,405,625 | -- | -- |
| Investment Companies | 37,006,200 | 37,006,200 | -- | -- |
| Government Obligations | 2,186,273 | -- | 2,186,273 | -- |
| Money Market Funds | 102,822,669 | 102,822,669 | -- | -- |
| Total Investments in Securities: | $1,970,348,420 | $946,547,993 | $1,011,195,557 | $12,604,870 |
| Derivative Instruments: | | | | |
| Assets | | | | |
| Futures Contracts | $124,461 | $124,461 | $-- | $-- |
| Total Assets | $124,461 | $124,461 | $-- | $-- |
| Total Derivative Instruments: | $124,461 | $124,461 | $-- | $-- |
Value of Derivative Instruments
The following table is a summary of the Fund's value of derivative instruments by primary risk exposure as of October 31, 2019. For additional information on derivative instruments, please refer to the Derivative Instruments section in the accompanying Notes to Financial Statements.
| Primary Risk Exposure / Derivative Type | Value |
| | Asset | Liability |
| Equity Risk | | |
| Futures Contracts(a) | $124,461 | $0 |
| Total Equity Risk | 124,461 | 0 |
| Total Value of Derivatives | $124,461 | $0 |
(a) Reflects gross cumulative appreciation (depreciation) on futures contracts as presented in the Schedule of Investments. In the Statement of Assets and Liabilities, the period end daily variation margin is included in receivable or payable for daily variation margin on futures contracts, and the net cumulative appreciation (depreciation) is included in Total accumulated earnings (loss).
See accompanying notes which are an integral part of the financial statements.
Fidelity® Series Emerging Markets Fund
Financial Statements
Statement of Assets and Liabilities
| | | October 31, 2019 |
| Assets | | |
Investment in securities, at value — See accompanying schedule:
Unaffiliated issuers (cost $1,832,341,317) | $1,836,237,842 | |
| Fidelity Central Funds (cost $102,822,136) | 102,822,669 | |
| Other affiliated issuers (cost $45,635,312) | 31,287,909 | |
| Total Investment in Securities (cost $1,980,798,765) | | $1,970,348,420 |
| Foreign currency held at value (cost $8,400,585) | | 8,400,410 |
| Receivable for investments sold | | 46,878 |
| Receivable for fund shares sold | | 99,450,857 |
| Dividends receivable | | 1,201,872 |
| Distributions receivable from Fidelity Central Funds | | 118,410 |
| Receivable from investment adviser for expense reductions | | 41,263 |
| Total assets | | 2,079,608,110 |
| Liabilities | | |
| Payable for investments purchased | $13,738,846 | |
| Payable for fund shares redeemed | 46,816 | |
| Payable for daily variation margin on futures contracts | 185,255 | |
| Other payables and accrued expenses | 471,974 | |
| Total liabilities | | 14,442,891 |
| Net Assets | | $2,065,165,219 |
| Net Assets consist of: | | |
| Paid in capital | | $2,042,420,390 |
| Total accumulated earnings (loss) | | 22,744,829 |
| Net Assets, for 217,759,918 shares outstanding | | $2,065,165,219 |
| Net Asset Value, offering price and redemption price per share ($2,065,165,219 ÷ 217,759,918 shares) | | $9.48 |
See accompanying notes which are an integral part of the financial statements.
Statement of Operations
| | | Year ended October 31, 2019 |
| Investment Income | | |
| Dividends (including $466,206 earned from other affiliated issuers) | | $44,285,864 |
| Non-Cash dividends | | 12,514,948 |
| Interest | | 13,464 |
| Income from Fidelity Central Funds (including $25,536 from security lending) | | 2,218,461 |
| Income before foreign taxes withheld | | 59,032,737 |
| Less foreign taxes withheld | | (4,353,971) |
| Total income | | 54,678,766 |
| Expenses | | |
| Custodian fees and expenses | $722,290 | |
| Independent trustees' fees and expenses | 8,805 | |
| Commitment fees | 2,436 | |
| Total expenses before reductions | 733,531 | |
| Expense reductions | (487,655) | |
| Total expenses after reductions | | 245,876 |
| Net investment income (loss) | | 54,432,890 |
| Realized and Unrealized Gain (Loss) | | |
| Net realized gain (loss) on: | | |
| Investment securities: | | |
| Unaffiliated issuers (net of foreign taxes of $3,813) | (3,428,231) | |
| Fidelity Central Funds | (1,946) | |
| Other affiliated issuers | 78,657 | |
| Foreign currency transactions | (900,848) | |
| Futures contracts | 732,420 | |
| Total net realized gain (loss) | | (3,519,948) |
| Change in net unrealized appreciation (depreciation) on: | | |
| Investment securities: | | |
| Unaffiliated issuers (net of decrease in deferred foreign taxes of $17,854) | 76,451,977 | |
| Fidelity Central Funds | 533 | |
| Other affiliated issuers | (13,635,090) | |
| Assets and liabilities in foreign currencies | 857 | |
| Futures contracts | 124,461 | |
| Total change in net unrealized appreciation (depreciation) | | 62,942,738 |
| Net gain (loss) | | 59,422,790 |
| Net increase (decrease) in net assets resulting from operations | | $113,855,680 |
See accompanying notes which are an integral part of the financial statements.
Statement of Changes in Net Assets
| | Year ended October 31, 2019 | For the period
August 29, 2018 (commencement of operations) to October 31, 2018 |
| Increase (Decrease) in Net Assets | | |
| Operations | | |
| Net investment income (loss) | $54,432,890 | $790,283 |
| Net realized gain (loss) | (3,519,948) | (12,242,242) |
| Change in net unrealized appreciation (depreciation) | 62,942,738 | (73,242,837) |
| Net increase (decrease) in net assets resulting from operations | 113,855,680 | (84,694,796) |
| Distributions to shareholders | (6,416,055) | – |
| Share transactions | | |
| Proceeds from sales of shares | 666,589,712 | 2,047,094,795 |
| Reinvestment of distributions | 6,416,055 | – |
| Cost of shares redeemed | (146,297,320) | (531,382,852) |
| Net increase (decrease) in net assets resulting from share transactions | 526,708,447 | 1,515,711,943 |
| Total increase (decrease) in net assets | 634,148,072 | 1,431,017,147 |
| Net Assets | | |
| Beginning of period | 1,431,017,147 | – |
| End of period | $2,065,165,219 | $1,431,017,147 |
| Other Information | | |
| Shares | | |
| Sold | 71,139,663 | 219,660,453 |
| Issued in reinvestment of distributions | 710,527 | – |
| Redeemed | (15,482,137) | (58,268,588) |
| Net increase (decrease) | 56,368,053 | 161,391,865 |
See accompanying notes which are an integral part of the financial statements.
Financial Highlights
Fidelity Series Emerging Markets Fund
| | | |
| Years ended October 31, | 2019 | 2018 A |
| Selected Per–Share Data | | |
| Net asset value, beginning of period | $8.87 | $10.00 |
| Income from Investment Operations | | |
| Net investment income (loss)B | .30C | .01 |
| Net realized and unrealized gain (loss) | .35 | (1.14) |
| Total from investment operations | .65 | (1.13) |
| Distributions from net investment income | (.04) | – |
| Total distributions | (.04) | – |
| Net asset value, end of period | $9.48 | $8.87 |
| Total ReturnD,E | 7.33% | (11.30)% |
| Ratios to Average Net AssetsF,G | | |
| Expenses before reductions | .04% | .04%H |
| Expenses net of fee waivers, if any | .01% | .01%H |
| Expenses net of all reductions | .01% | .01%H |
| Net investment income (loss) | 3.24%C | .65%H |
| Supplemental Data | | |
| Net assets, end of period (000 omitted) | $2,065,165 | $1,431,017 |
| Portfolio turnover rateI | 47% | 15%J,K |
A For the period August 29, 2018 (commencement of operations) to October 31, 2018.
B Calculated based on average shares outstanding during the period.
C Net investment income per share reflects a large, non-recurring dividend which amounted to $.07 per share. Excluding this non-recurring dividend, the ratio of net investment income (loss) to average net assets would have been 2.50%.
D Total returns for periods of less than one year are not annualized.
E Total returns would have been lower if certain expenses had not been reduced during the applicable periods shown.
F Fees and expenses of any underlying Fidelity Central Funds are not included in the Fund's expense ratio. The Fund indirectly bears its proportionate share of the expenses of any underlying Fidelity Central Funds.
G Expense ratios reflect operating expenses of the Fund. Expenses before reductions do not reflect amounts reimbursed by the investment adviser or reductions from expense offset arrangements and do not represent the amount paid by the Fund during periods when reimbursements or reductions occur. Expense ratios before reductions for start-up periods may not be representative of longer term operating periods. Expenses net of fee waivers reflect expenses after reimbursement by the investment adviser but prior to reductions from expense offset arrangements. Expenses net of all reductions represent the net expenses paid by the Fund.
H Annualized
I Amount does not include the portfolio activity of any underlying Fidelity Central Funds.
J Portfolio turnover rate excludes securities received or delivered in-kind.
K Amount not annualized.
See accompanying notes which are an integral part of the financial statements.
Fidelity® Series Emerging Markets Opportunities Fund
Performance: The Bottom Line
Average annual total return reflects the change in the value of an investment, assuming reinvestment of distributions from dividend income and capital gains (the profits earned upon the sale of securities that have grown in value, if any) and assuming a constant rate of performance each year. The hypothetical investment and the average annual total returns do not reflect the deduction of taxes that a shareholder would pay on fund distributions or the redemption of fund shares. During periods of reimbursement by Fidelity, a fund’s total return will be greater than it would be had the reimbursement not occurred. How a fund did yesterday is no guarantee of how it will do tomorrow.
Average Annual Total Returns
| For the periods ended October 31, 2019 | Past 1 year | Past 5 years | Past 10 years |
| Fidelity® Series Emerging Markets Opportunities Fund | 20.13% | 4.95% | 5.44% |
$10,000 Over 10 Years
Let's say hypothetically that $10,000 was invested in Fidelity® Series Emerging Markets Opportunities Fund on October 31, 2009.
The chart shows how the value of your investment would have changed, and also shows how the MSCI Emerging Markets Index performed over the same period.
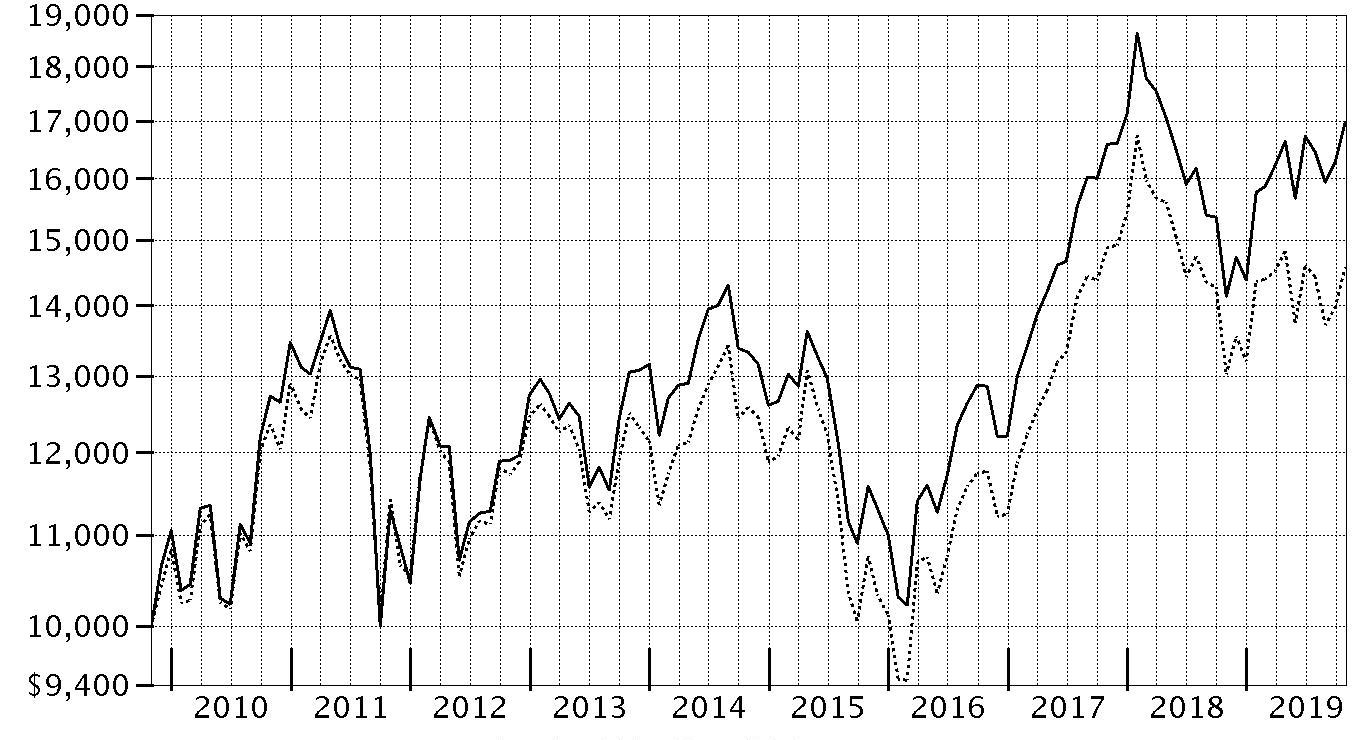
| Period Ending Values |
| $16,983 | Fidelity® Series Emerging Markets Opportunities Fund |
| $14,574 | MSCI Emerging Markets Index |
Fidelity® Series Emerging Markets Opportunities Fund
Management's Discussion of Fund Performance
Market Recap: The MSCI ACWI (All Country World Index) ex USA Index gained 11.47% for the 12 months ending October 31, 2019, as international stocks reflected a confluence of factors, including escalating trade tension, and moderating but still positive global economic growth. Currency fluctuations were largely modest and varied by region, muting the overall impact on international equity returns. In late December, the U.S. Federal Reserve shifted from raising interest rates to a more dovish policy in 2019, joining many foreign central banks. In June, international stocks rose 6.03%, as policy stimulus in China stabilized that country’s economic growth. The Fed cut its policy rate in July for the first time since 2008. However, the index returned -1.21% for the month, followed by -3.08% in August. In September, the Fed cut its policy rate another quarter point, citing concerns about slowing economic growth and muted inflation, and did the same in October, leading to monthly gains of 2.59% and 3.49%, respectively. For the full 12 months, the growth-oriented information technology sector (+22%) led the way, followed by utilities (+20%) and real estate (+18%), two high-dividend-yielding categories. Conversely, energy was roughly flat, while materials (+6%) and communication services (7%) also lagged. By region, Asia Pacific ex Japan (+16%), Europe ex U.K (+13%), Canada (+12%) and emerging markets (+12%) fared best. Meanwhile, the U.K. (+7%) and Japan (+10%) trailed the broader market.
Comments from Co-Portfolio Manager Jane Wu: For the fiscal year, the fund gained 20.13%, well ahead of the 11.89% result of the benchmark MSCI Emerging Markets Index. Security selection drove the fund’s outperformance of the benchmark the past 12 months, particularly in the consumer discretionary, financials, communication services and health care sectors. Among individual holdings, a large stake in Meituan Dianping (+100%) contributed more than any other individual fund position. Shares of this leading food-delivery service in China rose sharply in May after the firm reported a 70% year-over-year boost in first-quarter revenue and a jump in active users over the trailing 12 months. Avoiding index component and Chinese tech giant Baidu also helped relative performance. Conversely, it hurt to not own benchmark member and Russian integrated natural gas and crude-oil producer Gazprom. This stock gained 85%, benefiting from dividend increases and solid quarterly financial results. A non-benchmark position in Hong Kong-based luggage manufacturer and retailer Samsonite International also detracted notably. We sold our position in Samsonite by period end.
The views expressed above reflect those of the portfolio manager(s) only through the end of the period as stated on the cover of this report and do not necessarily represent the views of Fidelity or any other person in the Fidelity organization. Any such views are subject to change at any time based upon market or other conditions and Fidelity disclaims any responsibility to update such views. These views may not be relied on as investment advice and, because investment decisions for a Fidelity fund are based on numerous factors, may not be relied on as an indication of trading intent on behalf of any Fidelity fund.
Note to shareholders: On December 1, 2018, Xiaoting Zhao assumed portfolio management responsibilities for the fund's telecommunications services sleeve, succeeding James Hayes.
Fidelity® Series Emerging Markets Opportunities Fund
Investment Summary (Unaudited)
Geographic Diversification (% of fund's net assets)
| As of October 31, 2019 |
| | Cayman Islands | 20.4% |
| | Korea (South) | 13.1% |
| | China | 9.2% |
| | Brazil | 9.0% |
| | India | 9.0% |
| | United States of America* | 8.8% |
| | Taiwan | 5.9% |
| | Russia | 5.3% |
| | South Africa | 3.7% |
| | Other | 15.6% |
* Includes Short-Term investments and Net Other Assets (Liabilities).
Percentages are based on country or territory of incorporation and are adjusted for the effect of futures contracts, if applicable.
Asset Allocation as of October 31, 2019
| | % of fund's net assets |
| Stocks and Equity Futures | 96.4 |
| Short-Term Investments and Net Other Assets (Liabilities) | 3.6 |
Top Ten Stocks as of October 31, 2019
| | % of fund's net assets |
| Tencent Holdings Ltd. (Cayman Islands, Interactive Media & Services) | 4.9 |
| Taiwan Semiconductor Manufacturing Co. Ltd. (Taiwan, Semiconductors & Semiconductor Equipment) | 4.5 |
| Samsung Electronics Co. Ltd. (Korea (South), Technology Hardware, Storage & Peripherals) | 4.4 |
| Alibaba Group Holding Ltd. sponsored ADR (Cayman Islands, Internet & Direct Marketing Retail) | 3.6 |
| Sberbank of Russia (Russia, Banks) | 2.2 |
| Meituan Dianping Class B (Cayman Islands, Internet & Direct Marketing Retail) | 2.1 |
| Industrial & Commercial Bank of China Ltd. (H Shares) (China, Banks) | 1.9 |
| ICICI Bank Ltd. (India, Banks) | 1.7 |
| Ping An Insurance Group Co. of China Ltd. (H Shares) (China, Insurance) | 1.4 |
| Itau Unibanco Holding SA sponsored ADR (Brazil, Banks) | 1.4 |
| | 28.1 |
Top Market Sectors as of October 31, 2019
| | % of fund's net assets |
| Financials | 22.7 |
| Consumer Discretionary | 15.6 |
| Information Technology | 14.1 |
| Communication Services | 8.7 |
| Materials | 7.0 |
| Energy | 6.5 |
| Consumer Staples | 6.1 |
| Industrials | 4.4 |
| Utilities | 2.7 |
| Real Estate | 2.7 |
Fidelity® Series Emerging Markets Opportunities Fund
Schedule of Investments October 31, 2019
Showing Percentage of Net Assets
| Common Stocks - 87.8% | | | |
| | | Shares | Value |
| Australia - 0.0% | | | |
| Frontier Digital Ventures Ltd. (a) | | 5,028,441 | $2,831,042 |
| Belgium - 0.4% | | | |
| Titan Cement International Trading SA (a) | | 3,730,047 | 77,877,473 |
| Bermuda - 1.4% | | | |
| AGTech Holdings Ltd. (a) | | 53,216,000 | 2,535,536 |
| China Gas Holdings Ltd. | | 12,002,600 | 51,130,358 |
| Credicorp Ltd. (United States) | | 360,640 | 77,191,386 |
| GP Investments Ltd. Class A (depositary receipt) (a)(b) | | 7,634,637 | 12,316,694 |
| Kunlun Energy Co. Ltd. | | 11,766,000 | 10,951,051 |
| Marvell Technology Group Ltd. | | 641,000 | 15,633,990 |
| Pacific Basin Shipping Ltd. | | 88,765,087 | 20,552,443 |
| Shangri-La Asia Ltd. | | 62,542,000 | 64,193,882 |
|
| TOTAL BERMUDA | | | 254,505,340 |
|
| Brazil - 5.4% | | | |
| Atacadao Distribuicao Comercio e Industria Ltda | | 11,738,000 | 55,931,475 |
| Azul SA sponsored ADR (a) | | 1,314,637 | 51,244,550 |
| Banco do Brasil SA | | 18,150,500 | 217,914,618 |
| BTG Pactual Participations Ltd. unit | | 4,117,100 | 66,686,652 |
| Centrais Eletricas Brasileiras SA (Electrobras) (a) | | 3,628,320 | 35,790,136 |
| Companhia de Saneamento de Minas Gerais | | 3,160,820 | 53,191,308 |
| Direcional Engenharia SA (b) | | 10,944,360 | 32,610,672 |
| Localiza Rent A Car SA | | 5,120,570 | 55,131,832 |
| Natura Cosmeticos SA | | 16,234,800 | 126,137,980 |
| Notre Dame Intermedica Participacoes SA | | 3,957,400 | 59,205,585 |
| Petrobras Distribuidora SA | | 8,229,300 | 58,028,825 |
| Rumo SA (a) | | 10,700,200 | 60,831,457 |
| Suzano Papel e Celulose SA | | 6,003,700 | 48,861,929 |
| Totvs SA | | 1,053,300 | 16,356,944 |
| Vale SA sponsored ADR (a) | | 6,624,470 | 77,771,278 |
|
| TOTAL BRAZIL | | | 1,015,695,241 |
|
| British Virgin Islands - 0.1% | | | |
| Mail.Ru Group Ltd. GDR (Reg. S) (a) | | 1,013,100 | 21,518,244 |
| Canada - 0.2% | | | |
| Pan American Silver Corp. | | 1,871,800 | 31,914,190 |
| Cayman Islands - 20.4% | | | |
| 51job, Inc. sponsored ADR (a) | | 387,559 | 30,528,022 |
| Airtac International Group | | 2,657,000 | 36,372,795 |
| Alibaba Group Holding Ltd. sponsored ADR (a) | | 3,857,106 | 681,434,917 |
| Ant International Co. Ltd. Class C (a)(c)(d) | | 6,359,848 | 41,847,800 |
| Bilibili, Inc. ADR (a) | | 2,640,878 | 41,699,464 |
| Chailease Holding Co. Ltd. | | 8,060,650 | 36,341,379 |
| China Resources Land Ltd. | | 16,295,720 | 69,303,707 |
| China State Construction International Holdings Ltd. | | 35,758,096 | 32,931,542 |
| CStone Pharmaceuticals Co. Ltd. (a)(e) | | 14,238,500 | 18,981,808 |
| Haitian International Holdings Ltd. | | 15,250,306 | 35,986,337 |
| Hansoh Pharmaceutical Group Co. Ltd. (e) | | 13,062,000 | 39,683,126 |
| Hutchison China Meditech Ltd. sponsored ADR (a) | | 936,300 | 17,696,070 |
| iQIYI, Inc. ADR (a)(f) | | 1,208,500 | 21,064,155 |
| JD.com, Inc. sponsored ADR (a) | | 5,490,900 | 171,041,535 |
| Kingdee International Software Group Co. Ltd. | | 15,939,000 | 17,465,161 |
| Kingsoft Corp. Ltd. (a)(f) | | 56,189,100 | 129,315,886 |
| Koolearn Technology Holding Ltd. (a)(e)(f) | | 12,215,000 | 28,675,380 |
| LexinFintech Holdings Ltd. ADR (a)(f) | | 702,000 | 7,960,680 |
| Li Ning Co. Ltd. | | 27,261,500 | 92,438,902 |
| Meituan Dianping Class B (a) | | 32,137,598 | 383,341,849 |
| Momo, Inc. ADR | | 182,492 | 6,117,132 |
| NetEase, Inc. ADR | | 216,200 | 61,802,932 |
| New Oriental Education & Technology Group, Inc. sponsored ADR (a) | | 968,600 | 118,227,316 |
| PagSeguro Digital Ltd. (a)(f) | | 3,928,509 | 145,669,114 |
| Pinduoduo, Inc. ADR (a) | | 5,268,848 | 215,390,506 |
| PPDAI Group, Inc. ADR | | 1,206,700 | 3,378,760 |
| Qutoutiao, Inc. ADR (a)(f) | | 2,678,600 | 11,142,976 |
| Shenzhou International Group Holdings Ltd. | | 8,851,100 | 122,310,286 |
| Shimao Property Holdings Ltd. | | 12,406,000 | 41,561,162 |
| Sunny Optical Technology Group Co. Ltd. | | 3,721,900 | 59,825,391 |
| Tencent Holdings Ltd. | | 22,626,299 | 917,788,692 |
| Tencent Music Entertainment Group ADR (a)(f) | | 701,800 | 9,712,912 |
| Uni-President China Holdings Ltd. | | 67,395,000 | 69,614,418 |
| Weidai Ltd. ADR | | 354,060 | 2,251,822 |
| Wise Talent Information Technology Co. Ltd. (a) | | 7,072,203 | 17,619,591 |
| Wuxi Biologics (Cayman), Inc. (a)(e) | | 3,941,000 | 46,312,527 |
| YY, Inc. ADR (a) | | 134,100 | 7,622,244 |
| Zai Lab Ltd. ADR (a) | | 689,300 | 23,291,447 |
|
| TOTAL CAYMAN ISLANDS | | | 3,813,749,743 |
|
| Chile - 0.3% | | | |
| Vina Concha y Toro SA | | 34,096,719 | 62,758,929 |
| China - 9.2% | | | |
| BBMG Corp. (H Shares) | | 107,429,500 | 30,745,486 |
| Beijing Sinnet Technology Co. Ltd. (A Shares) | | 3,255,100 | 8,059,812 |
| China Communications Construction Co. Ltd. (H Shares) | | 26,481,485 | 20,158,835 |
| China Communications Services Corp. Ltd. (H Shares) | | 17,620,000 | 10,880,842 |
| China Life Insurance Co. Ltd. (H Shares) | | 92,415,400 | 237,663,902 |
| China Longyuan Power Grid Corp. Ltd. (H Shares) | | 84,956,690 | 45,896,561 |
| China Pacific Insurance (Group) Co. Ltd. (H Shares) | | 7,250,294 | 26,306,161 |
| China Petroleum & Chemical Corp. (H Shares) | | 178,216,000 | 101,364,842 |
| China Tower Corp. Ltd. (H Shares) (e) | | 130,456,000 | 28,712,437 |
| CRRC Corp. Ltd. (H Shares) | | 18,981,000 | 12,695,159 |
| Daqin Railway Co. Ltd. (A Shares) | | 41,516,150 | 44,969,663 |
| Glodon Co. Ltd. (A Shares) | | 2,262,500 | 10,251,312 |
| Haier Smart Home Co. Ltd. (A Shares) | | 80,465,779 | 182,759,030 |
| Hangzhou Tigermed Consulting Co. Ltd. (A Shares) | | 3,919,150 | 38,001,526 |
| Industrial & Commercial Bank of China Ltd. (H Shares) | | 494,932,400 | 354,566,268 |
| PICC Property & Casualty Co. Ltd. (H Shares) | | 48,363,750 | 61,205,254 |
| Ping An Bank Co. Ltd. (A Shares) | | 33,575,217 | 77,477,091 |
| Ping An Insurance Group Co. of China Ltd. (H Shares) | | 22,753,000 | 262,610,368 |
| Shenzhen Mindray Bio-Medical Electronics Co. Ltd. (A Shares) | | 1,506,600 | 38,040,840 |
| Sinopec Engineering Group Co. Ltd. (H Shares) | | 25,429,187 | 14,526,597 |
| Tsingtao Brewery Co. Ltd. (H Shares) | | 10,948,000 | 63,443,841 |
| WuXi AppTec Co. Ltd. (H Shares) (e)(f) | | 2,522,440 | 30,412,368 |
| Zhuzhou CRRC Times Electric Co. Ltd. (H Shares) | | 7,041,400 | 26,127,588 |
|
| TOTAL CHINA | | | 1,726,875,783 |
|
| Egypt - 0.1% | | | |
| Six of October Development & Investment Co. | | 9,122,884 | 8,817,657 |
| Hong Kong - 2.8% | | | |
| AIA Group Ltd. | | 1,599,800 | 15,931,168 |
| China Everbright International Ltd. | | 27,314,000 | 20,644,088 |
| China Overseas Land and Investment Ltd. | | 31,407,000 | 99,104,565 |
| China Resources Beer Holdings Co. Ltd. | | 20,750,666 | 106,389,203 |
| China Resources Power Holdings Co. Ltd. | | 7,076,397 | 8,893,153 |
| China Unicom Ltd. | | 31,067,000 | 30,585,433 |
| China Unicom Ltd. sponsored ADR | | 756,600 | 7,376,850 |
| CNOOC Ltd. | | 90,759,000 | 135,072,146 |
| CSPC Pharmaceutical Group Ltd. | | 25,198,000 | 64,535,126 |
| Far East Horizon Ltd. | | 39,797,750 | 37,678,252 |
|
| TOTAL HONG KONG | | | 526,209,984 |
|
| Hungary - 0.4% | | | |
| OTP Bank PLC | | 1,460,900 | 67,291,080 |
| India - 9.0% | | | |
| Adani Ports & Special Economic Zone Ltd. (a) | | 9,580,947 | 53,350,532 |
| Axis Bank Ltd. | | 14,656,664 | 151,750,312 |
| Axis Bank Ltd. GDR (Reg. S) | | 109,427 | 5,679,261 |
| Federal Bank Ltd. (a) | | 27,303,394 | 32,188,461 |
| ICICI Bank Ltd. | | 6,490,628 | 42,313,930 |
| ICICI Bank Ltd. sponsored ADR | | 21,391,470 | 278,730,854 |
| IndoStar Capital Finance Ltd. (e) | | 2,468,787 | 6,537,006 |
| Indraprastha Gas Ltd. (a) | | 10,485,194 | 57,777,733 |
| ITC Ltd. | | 25,156,054 | 91,230,219 |
| JK Cement Ltd. | | 3,076,431 | 48,363,805 |
| JM Financial Ltd. | | 10,258,942 | 11,260,838 |
| Larsen & Toubro Ltd. | | 3,818,644 | 79,172,224 |
| LIC Housing Finance Ltd. | | 7,248,431 | 42,071,415 |
| Manappuram General Finance & Leasing Ltd. | | 25,276,594 | 60,221,749 |
| NTPC Ltd. | | 17,181,107 | 29,606,618 |
| Oberoi Realty Ltd. (a) | | 3,800,741 | 27,110,018 |
| Petronet LNG Ltd. | | 9,121,780 | 36,781,538 |
| Phoenix Mills Ltd. (a) | | 2,835,638 | 28,706,286 |
| Power Grid Corp. of India Ltd. | | 16,429,046 | 45,909,146 |
| Reliance Industries Ltd. | | 12,322,892 | 253,807,498 |
| Shree Cement Ltd. | | 210,700 | 59,023,206 |
| Shriram Transport Finance Co. Ltd. | | 4,243,570 | 67,973,136 |
| SREI Infrastructure Finance Ltd. (b) | | 34,347,541 | 5,042,943 |
| State Bank of India (a) | | 38,685,944 | 170,013,424 |
|
| TOTAL INDIA | | | 1,684,622,152 |
|
| Indonesia - 1.2% | | | |
| PT Bank Mandiri (Persero) Tbk | | 204,931,500 | 102,438,978 |
| PT Bank Rakyat Indonesia Tbk | | 403,576,800 | 120,925,844 |
|
| TOTAL INDONESIA | | | 223,364,822 |
|
| Japan - 0.5% | | | |
| Keyence Corp. | | 33,600 | 21,245,160 |
| Money Forward, Inc. (a) | | 407,900 | 14,564,655 |
| Murata Manufacturing Co. Ltd. | | 235,800 | 12,838,882 |
| Nintendo Co. Ltd. | | 80,500 | 29,526,394 |
| Square Enix Holdings Co. Ltd. | | 389,500 | 18,535,620 |
|
| TOTAL JAPAN | | | 96,710,711 |
|
| Kazakhstan - 0.1% | | | |
| JSC Halyk Bank of Kazakhstan GDR | | 1,001,100 | 13,364,685 |
| Korea (South) - 11.7% | | | |
| AMOREPACIFIC Group, Inc. | | 1,200,769 | 86,803,320 |
| BS Financial Group, Inc. | | 1,989,950 | 11,817,714 |
| Daou Technology, Inc. | | 1,938,352 | 29,979,040 |
| Hyundai Fire & Marine Insurance Co. Ltd. | | 2,142,539 | 46,227,097 |
| Hyundai Mobis | | 1,071,590 | 217,927,539 |
| Kakao Corp. | | 322,370 | 38,977,822 |
| KB Financial Group, Inc. | | 4,176,755 | 149,481,961 |
| Korea Electric Power Corp. (a) | | 1,314,635 | 28,570,789 |
| Korea Electric Power Corp. sponsored ADR (a)(f) | | 298,600 | 3,248,768 |
| LG Chemical Ltd. | | 181,016 | 47,562,929 |
| LG Corp. | | 944,597 | 56,016,057 |
| NAVER Corp. | | 379,254 | 53,147,217 |
| NCSOFT Corp. | | 110,843 | 48,872,491 |
| Netmarble Corp. (a)(e) | | 132,040 | 10,143,124 |
| POSCO | | 511,206 | 92,213,996 |
| S-Oil Corp. | | 568,870 | 48,463,491 |
| Samsung Biologics Co. Ltd.(a)(e) | | 56,620 | 19,279,896 |
| Samsung Electronics Co. Ltd. | | 19,049,948 | 820,409,795 |
| Samsung SDI Co. Ltd. | | 322,674 | 62,726,619 |
| Shinhan Financial Group Co. Ltd. | | 2,657,555 | 96,262,303 |
| SK Hynix, Inc. | | 3,013,264 | 211,133,692 |
|
| TOTAL KOREA (SOUTH) | | | 2,179,265,660 |
|
| Malaysia - 0.4% | | | |
| British American Tobacco (Malaysia) Bhd | | 3,448,100 | 15,523,215 |
| IHH Healthcare Bhd | | 22,188,000 | 30,239,755 |
| Tenaga Nasional Bhd | | 10,898,500 | 36,093,088 |
|
| TOTAL MALAYSIA | | | 81,856,058 |
|
| Mexico - 2.0% | | | |
| America Movil S.A.B. de CV Series L sponsored ADR | | 2,720,700 | 43,014,267 |
| Fibra Uno Administracion SA de CV | | 28,061,900 | 42,625,671 |
| Grupo Aeroportuario del Pacifico S.A.B. de CV Series B | | 3,807,100 | 39,914,534 |
| Grupo Aeroportuario Norte S.A.B. de CV | | 1,229,974 | 8,527,624 |
| Grupo Financiero Banorte S.A.B. de CV Series O | | 13,663,318 | 74,579,492 |
| Macquarie Mexican (REIT) (e) | | 37,065,740 | 52,256,017 |
| Wal-Mart de Mexico SA de CV Series V | | 37,625,500 | 112,916,597 |
|
| TOTAL MEXICO | | | 373,834,202 |
|
| Multi-National - 0.2% | | | |
| HKT Trust/HKT Ltd. unit | | 22,889,000 | 35,607,502 |
| Netherlands - 0.3% | | | |
| ASML Holding NV (Netherlands) | | 65,200 | 17,089,872 |
| NXP Semiconductors NV | | 190,900 | 21,701,512 |
| Yandex NV Series A (a) | | 600,512 | 20,051,096 |
|
| TOTAL NETHERLANDS | | | 58,842,480 |
|
| Nigeria - 0.3% | | | |
| Guaranty Trust Bank PLC | | 237,784,961 | 16,344,639 |
| Guaranty Trust Bank PLC GDR (Reg. S) | | 3,205,904 | 14,426,568 |
| Transnational Corp. of Nigeria PLC | | 171,478,443 | 468,637 |
| Zenith Bank PLC | | 619,844,863 | 29,088,648 |
|
| TOTAL NIGERIA | | | 60,328,492 |
|
| Pakistan - 0.1% | | | |
| Habib Bank Ltd. | | 22,373,800 | 18,403,907 |
| Panama - 0.3% | | | |
| Copa Holdings SA Class A | | 499,628 | 50,832,153 |
| Peru - 0.7% | | | |
| Compania de Minas Buenaventura SA sponsored ADR | | 7,925,900 | 121,583,306 |
| Philippines - 0.8% | | | |
| Altus San Nicolas Corp. (c) | | 1,296,022 | 132,240 |
| Ayala Land, Inc. | | 26,638,400 | 25,438,857 |
| Metropolitan Bank & Trust Co. | | 68,022,013 | 90,489,257 |
| Robinsons Land Corp. | | 61,759,731 | 30,931,323 |
|
| TOTAL PHILIPPINES | | | 146,991,677 |
|
| Poland - 0.2% | | | |
| Dino Polska SA (a)(e) | | 950,100 | 37,052,570 |
| Russia - 5.3% | | | |
| Lukoil PJSC sponsored ADR | | 2,246,300 | 206,569,748 |
| MMC Norilsk Nickel PJSC sponsored ADR | | 5,064,600 | 140,289,420 |
| NOVATEK OAO GDR (Reg. S) | | 567,343 | 121,411,402 |
| Sberbank of Russia | | 49,911,150 | 182,919,929 |
| Sberbank of Russia sponsored ADR | | 16,077,694 | 236,342,102 |
| Tatneft PAO | | 5,818,900 | 67,896,619 |
| Unipro PJSC | | 920,599,152 | 37,902,168 |
|
| TOTAL RUSSIA | | | 993,331,388 |
|
| Singapore - 0.2% | | | |
| First Resources Ltd. | | 37,296,500 | 41,880,508 |
| South Africa - 3.7% | | | |
| AngloGold Ashanti Ltd. | | 4,643,500 | 102,706,363 |
| Barclays Africa Group Ltd. | | 13,031,053 | 133,566,029 |
| Bidvest Group Ltd. | | 2,949,277 | 40,218,922 |
| Impala Platinum Holdings Ltd. (a) | | 20,402,200 | 140,218,290 |
| Motus Holdings Ltd. | | 3,199,705 | 15,178,509 |
| Mr Price Group Ltd. | | 4,768,900 | 50,433,157 |
| Naspers Ltd. Class N | | 1,107,800 | 156,763,248 |
| Pick 'n Pay Stores Ltd. | | 10,809,100 | 47,283,777 |
|
| TOTAL SOUTH AFRICA | | | 686,368,295 |
|
| Taiwan - 5.9% | | | |
| Formosa Plastics Corp. | | 18,551,000 | 59,488,747 |
| Largan Precision Co. Ltd. | | 167,900 | 24,608,597 |
| MediaTek, Inc. | | 3,805,000 | 50,903,010 |
| Taiwan Semiconductor Manufacturing Co. Ltd. | | 86,369,284 | 844,806,264 |
| Unified-President Enterprises Corp. | | 48,641,000 | 119,935,838 |
|
| TOTAL TAIWAN | | | 1,099,742,456 |
|
| Thailand - 1.3% | | | |
| Kasikornbank PCL (For. Reg.) | | 18,502,100 | 85,457,101 |
| PTT Global Chemical PCL (For. Reg.) | | 33,851,700 | 57,190,798 |
| Siam Cement PCL (For. Reg.) | | 7,837,600 | 95,325,604 |
|
| TOTAL THAILAND | | | 237,973,503 |
|
| Turkey - 0.3% | | | |
| Enerjisa Enerji A/S (e) | | 9,595,566 | 10,389,008 |
| Tupras Turkiye Petrol Rafinerileri A/S | | 2,220,896 | 48,362,683 |
|
| TOTAL TURKEY | | | 58,751,691 |
|
| United Arab Emirates - 0.5% | | | |
| Emaar Properties PJSC | | 40,232,432 | 46,774,892 |
| National Bank of Abu Dhabi PJSC | | 12,398,788 | 51,380,996 |
|
| TOTAL UNITED ARAB EMIRATES | | | 98,155,888 |
|
| United Kingdom - 0.4% | | | |
| AstraZeneca PLC sponsored ADR | | 844,500 | 41,405,835 |
| Mondi PLC | | 1,352,463 | 27,970,265 |
|
| TOTAL UNITED KINGDOM | | | 69,376,100 |
|
| United States of America - 1.6% | | | |
| Activision Blizzard, Inc. | | 1,084,700 | 60,775,741 |
| Arco Platform Ltd. Class A (a) | | 377,900 | 15,682,850 |
| DouYu International Holdings Ltd. ADR | | 9,586,028 | 74,483,438 |
| MercadoLibre, Inc. (a) | | 222,400 | 115,986,048 |
| Micron Technology, Inc. (a) | | 847,300 | 40,289,115 |
|
| TOTAL UNITED STATES OF AMERICA | | | 307,217,192 |
|
| Vietnam - 0.1% | | | |
| Vietnam Technological & Commercial Joint Stock Bank (a) | | 16,417,800 | 16,731,843 |
| TOTAL COMMON STOCKS | | | |
| (Cost $13,103,605,637) | | | 16,402,233,947 |
|
| Nonconvertible Preferred Stocks - 5.0% | | | |
| Brazil - 3.6% | | | |
| Ambev SA sponsored ADR | | 17,881,400 | 77,068,834 |
| Banco do Estado Rio Grande do Sul SA | | 4,496,986 | 25,072,337 |
| Companhia Paranaense de Energia-Copel: | | | |
| (PN-B) | | 95,800 | 1,329,806 |
| (PN-B) sponsored ADR | | 4,549,382 | 62,735,978 |
| Itau Unibanco Holding SA sponsored ADR | | 28,275,916 | 255,331,521 |
| Metalurgica Gerdau SA (PN) | | 29,482,622 | 46,240,043 |
| Petroleo Brasileiro SA - Petrobras (PN) sponsored ADR (non-vtg.) | | 12,007,500 | 181,193,175 |
| Telefonica Brasil SA | | 2,199,400 | 29,109,625 |
|
| TOTAL BRAZIL | | | 678,081,319 |
|
| Korea (South) - 1.4% | | | |
| Hyundai Motor Co. Series 2 | | 2,334,528 | 158,189,911 |
| Samsung Electronics Co. Ltd. | | 2,664,522 | 93,462,841 |
|
| TOTAL KOREA (SOUTH) | | | 251,652,752 |
|
| TOTAL NONCONVERTIBLE PREFERRED STOCKS | | | |
| (Cost $679,878,085) | | | 929,734,071 |
| | | Principal Amount | Value |
|
| Government Obligations - 0.2% | | | |
| United States of America - 0.2% | | | |
| U.S. Treasury Bills, yield at date of purchase 1.53% to 1.79% 1/2/20 to 1/30/20(g) | | | |
| (Cost $35,021,440) | | 35,150,000 | 35,027,415 |
| | | Shares | Value |
|
| Money Market Funds - 5.8% | | | |
| Fidelity Cash Central Fund 1.83% (h) | | 984,367,448 | 984,564,322 |
| Fidelity Securities Lending Cash Central Fund 1.84% (h)(i) | | 106,220,616 | 106,231,239 |
| TOTAL MONEY MARKET FUNDS | | | |
| (Cost $1,090,764,977) | | | 1,090,795,561 |
| TOTAL INVESTMENT IN SECURITIES - 98.8% | | | |
| (Cost $14,909,270,139) | | | 18,457,790,994 |
| NET OTHER ASSETS (LIABILITIES) - 1.2% | | | 217,256,674 |
| NET ASSETS - 100% | | | $18,675,047,668 |
| Futures Contracts | | | | | |
| | Number of contracts | Expiration Date | Notional Amount | Value | Unrealized Appreciation/(Depreciation) |
| Purchased | | | | | |
| Equity Index Contracts | | | | | |
| ICE E-mini MSCI Emerging Markets Index Contracts (United States) | 12,746 | Dec. 2019 | $663,684,220 | $9,684,834 | $9,684,834 |
The notional amount of futures purchased as a percentage of Net Assets is 3.6%
Categorizations in the Schedule of Investments are based on country or territory of incorporation.
Legend
(a) Non-income producing
(b) Affiliated company
(c) Level 3 security
(d) Restricted securities - Investment in securities not registered under the Securities Act of 1933 (excluding 144A issues). At the end of the period, the value of restricted securities (excluding 144A issues) amounted to $41,847,800 or 0.2% of net assets.
(e) Security exempt from registration under Rule 144A of the Securities Act of 1933. These securities may be resold in transactions exempt from registration, normally to qualified institutional buyers. At the end of the period, the value of these securities amounted to $328,435,267 or 1.8% of net assets.
(f) Security or a portion of the security is on loan at period end.
(g) Security or a portion of the security was pledged to cover margin requirements for futures contracts. At period end, the value of securities pledged amounted to $35,027,415.
(h) Affiliated fund that is generally available only to investment companies and other accounts managed by Fidelity Investments. The rate quoted is the annualized seven-day yield of the fund at period end. A complete unaudited listing of the fund's holdings as of its most recent quarter end is available upon request. In addition, each Fidelity Central Fund's financial statements, which are not covered by the Fund's Report of Independent Registered Public Accounting Firm, are available on the SEC's website or upon request.
(i) Investment made with cash collateral received from securities on loan.
Additional information on each restricted holding is as follows:
| Security | Acquisition Date | Acquisition Cost |
| Ant International Co. Ltd. Class C | 5/16/18 | $35,678,747 |
Affiliated Central Funds
Information regarding fiscal year to date income earned by the Fund from investments in Fidelity Central Funds is as follows:
| Fund | Income earned |
| Fidelity Cash Central Fund | $9,780,664 |
| Fidelity Securities Lending Cash Central Fund | 2,233,716 |
| Total | $12,014,380 |
Amounts in the income column in the above table include any capital gain distributions from underlying funds, which are presented in the corresponding line-item in the Statement of Operations, if applicable. Amount for Fidelity Securities Lending Cash Central Fund represents the income earned on investing cash collateral, less rebates paid to borrowers and any lending agent fees associated with the loan, plus any premium payments received for lending certain types of securities.
Other Affiliated Issuers
An affiliated company is a company in which the Fund has ownership of at least 5% of the voting securities. Fiscal year to date transactions with companies which are or were affiliates are as follows:
| Affiliate | Value, beginning of period | Purchases | Sales Proceeds | Dividend Income | Realized Gain (loss) | Change in Unrealized appreciation (depreciation) | Value, end of period |
| Direcional Engenharia SA | $23,285,743 | $2,978,291 | $5,079,391 | $2,310,632 | $614,855 | $10,811,174 | $32,610,672 |
| Frontier Digital Ventures Ltd. | 6,186,874 | -- | 5,518,626 | -- | 1,022,793 | 1,140,001 | -- |
| GP Investments Ltd. Class A (depositary receipt) | 10,339,533 | -- | -- | -- | -- | 1,977,161 | 12,316,694 |
| HUYA, Inc. ADR | -- | 101,643,945 | 115,720,606 | -- | 14,076,661 | -- | -- |
| Kingsoft Corp. Ltd. | 102,004,017 | 6,393,773 | 40,987,389 | -- | (21,343,743) | 83,249,228 | -- |
| Macquarie Mexican (REIT) | 38,796,336 | 2,812,475 | 4,841,164 | 3,004,947 | (3,515,144) | 19,003,514 | -- |
| SREI Infrastructure Finance Ltd. | 15,352,257 | -- | 2,809 | 247,644 | (4,771) | (10,301,734) | 5,042,943 |
| Total | $195,964,760 | $113,828,484 | $172,149,985 | $5,563,223 | $(9,149,349) | $105,879,344 | $49,970,309 |
Investment Valuation
The following is a summary of the inputs used, as of October 31, 2019, involving the Fund's assets and liabilities carried at fair value. The inputs or methodology used for valuing securities may not be an indication of the risk associated with investing in those securities. For more information on valuation inputs, and their aggregation into the levels used below, please refer to the Investment Valuation section in the accompanying Notes to Financial Statements.
| | Valuation Inputs at Reporting Date: |
| Description | Total | Level 1 | Level 2 | Level 3 |
| Investments in Securities: | | | | |
| Equities: | | | | |
| Communication Services | $1,647,838,441 | $566,631,730 | $1,081,206,711 | $-- |
| Consumer Discretionary | 2,880,614,362 | 1,850,131,785 | 1,030,482,577 | -- |
| Consumer Staples | 1,113,970,724 | 725,889,320 | 388,081,404 | -- |
| Energy | 1,200,923,142 | 673,897,118 | 527,026,024 | -- |
| Financials | 4,239,186,855 | 1,731,667,961 | 2,507,518,894 | -- |
| Health Care | 467,085,909 | 160,878,833 | 306,207,076 | -- |
| Industrials | 801,613,796 | 429,617,946 | 371,995,850 | -- |
| Information Technology | 2,640,893,160 | 1,502,895,229 | 1,137,997,931 | -- |
| Materials | 1,305,347,128 | 819,777,870 | 485,569,258 | -- |
| Real Estate | 514,610,195 | 150,474,237 | 322,155,918 | 41,980,040 |
| Utilities | 519,884,306 | 205,055,809 | 314,828,497 | -- |
| Government Obligations | 35,027,415 | -- | 35,027,415 | -- |
| Money Market Funds | 1,090,795,561 | 1,090,795,561 | -- | -- |
| Total Investments in Securities: | $18,457,790,994 | $9,907,713,399 | $8,508,097,555 | $41,980,040 |
| Derivative Instruments: | | | | |
| Assets | | | | |
| Futures Contracts | $9,684,834 | $9,684,834 | $-- | $-- |
| Total Assets | $9,684,834 | $9,684,834 | $-- | $-- |
| Total Derivative Instruments: | $9,684,834 | $9,684,834 | $-- | $-- |
Value of Derivative Instruments
The following table is a summary of the Fund's value of derivative instruments by primary risk exposure as of October 31, 2019. For additional information on derivative instruments, please refer to the Derivative Instruments section in the accompanying Notes to Financial Statements.
| Primary Risk Exposure / Derivative Type | Value |
| | Asset | Liability |
| Equity Risk | | |
| Futures Contracts(a) | $9,684,834 | $0 |
| Total Equity Risk | 9,684,834 | 0 |
| Total Value of Derivatives | $9,684,834 | $0 |
(a) Reflects gross cumulative appreciation (depreciation) on futures contracts as presented in the Schedule of Investments. In the Statement of Assets and Liabilities, the period end daily variation margin is included in receivable or payable for daily variation margin on futures contracts, and the net cumulative appreciation (depreciation) is included in Total accumulated earnings (loss).
See accompanying notes which are an integral part of the financial statements.
Fidelity® Series Emerging Markets Opportunities Fund
Financial Statements
Statement of Assets and Liabilities
| | | October 31, 2019 |
| Assets | | |
Investment in securities, at value (including securities loaned of $101,113,211) — See accompanying schedule:
Unaffiliated issuers (cost $13,759,073,649) | $17,317,025,124 | |
| Fidelity Central Funds (cost $1,090,764,977) | 1,090,795,561 | |
| Other affiliated issuers (cost $59,431,513) | 49,970,309 | |
| Total Investment in Securities (cost $14,909,270,139) | | $18,457,790,994 |
| Foreign currency held at value (cost $1,183,524) | | 1,183,422 |
| Receivable for investments sold | | 127,681,127 |
| Receivable for fund shares sold | | 366,914,285 |
| Dividends receivable | | 16,110,728 |
| Distributions receivable from Fidelity Central Funds | | 1,472,229 |
| Receivable from investment adviser for expense reductions | | 629,493 |
| Other receivables | | 23,370,100 |
| Total assets | | 18,995,152,378 |
| Liabilities | | |
| Payable for investments purchased | $204,629,399 | |
| Payable for fund shares redeemed | 499,603 | |
| Payable for daily variation margin on futures contracts | 5,034,670 | |
| Other payables and accrued expenses | 3,712,205 | |
| Collateral on securities loaned | 106,228,833 | |
| Total liabilities | | 320,104,710 |
| Net Assets | | $18,675,047,668 |
| Net Assets consist of: | | |
| Paid in capital | | $15,047,213,243 |
| Total accumulated earnings (loss) | | 3,627,834,425 |
| Net Assets, for 963,258,987 shares outstanding | | $18,675,047,668 |
| Net Asset Value, offering price and redemption price per share ($18,675,047,668 ÷ 963,258,987 shares) | | $19.39 |
See accompanying notes which are an integral part of the financial statements.
Statement of Operations
| | | Year ended October 31, 2019 |
| Investment Income | | |
| Dividends (including $5,563,223 earned from other affiliated issuers) | | $386,245,338 |
| Non-Cash dividends | | 128,948,056 |
| Interest | | 286,353 |
| Income from Fidelity Central Funds (including $2,233,716 from security lending) | | 12,014,380 |
| Income before foreign taxes withheld | | 527,494,127 |
| Less foreign taxes withheld | | (43,147,071) |
| Total income | | 484,347,056 |
| Expenses | | |
| Custodian fees and expenses | $5,821,347 | |
| Independent trustees' fees and expenses | 84,379 | |
| Commitment fees | 39,829 | |
| Total expenses before reductions | 5,945,555 | |
| Expense reductions | (3,661,237) | |
| Total expenses after reductions | | 2,284,318 |
| Net investment income (loss) | | 482,062,738 |
| Realized and Unrealized Gain (Loss) | | |
| Net realized gain (loss) on: | | |
| Investment securities: | | |
| Unaffiliated issuers | (188,825,684) | |
| Fidelity Central Funds | (29,466) | |
| Other affiliated issuers | (9,149,349) | |
| Foreign currency transactions | (4,983,627) | |
| Futures contracts | (5,091,680) | |
| Total net realized gain (loss) | | (208,079,806) |
| Change in net unrealized appreciation (depreciation) on: | | |
| Investment securities: | | |
| Unaffiliated issuers | 2,393,668,258 | |
| Fidelity Central Funds | 30,584 | |
| Other affiliated issuers | 105,879,344 | |
| Assets and liabilities in foreign currencies | 124,689 | |
| Futures contracts | 14,946,427 | |
| Total change in net unrealized appreciation (depreciation) | | 2,514,649,302 |
| Net gain (loss) | | 2,306,569,496 |
| Net increase (decrease) in net assets resulting from operations | | $2,788,632,234 |
See accompanying notes which are an integral part of the financial statements.
Statement of Changes in Net Assets
| | Year ended October 31, 2019 | Year ended October 31, 2018 |
| Increase (Decrease) in Net Assets | | |
| Operations | | |
| Net investment income (loss) | $482,062,738 | $321,247,606 |
| Net realized gain (loss) | (208,079,806) | 827,680,253 |
| Change in net unrealized appreciation (depreciation) | 2,514,649,302 | (3,331,746,454) |
| Net increase (decrease) in net assets resulting from operations | 2,788,632,234 | (2,182,818,595) |
| Distributions to shareholders | (1,185,081,846) | (442,387,354) |
| Share transactions | | |
| Proceeds from sales of shares | 3,603,790,396 | 2,738,486,790 |
| Reinvestment of distributions | 1,185,081,846 | 442,387,354 |
| Cost of shares redeemed | (1,315,184,348) | (2,705,305,537) |
| Net increase (decrease) in net assets resulting from share transactions | 3,473,687,894 | 475,568,607 |
| Total increase (decrease) in net assets | 5,077,238,282 | (2,149,637,342) |
| Net Assets | | |
| Beginning of period | 13,597,809,386 | 15,747,446,728 |
| End of period | $18,675,047,668 | $13,597,809,386 |
| Other Information | | |
| Shares | | |
| Sold | 193,300,145 | 137,281,893 |
| Issued in reinvestment of distributions | 72,129,145 | 21,392,038 |
| Redeemed | (72,263,706) | (126,152,959) |
| Net increase (decrease) | 193,165,584 | 32,520,972 |
See accompanying notes which are an integral part of the financial statements.
Financial Highlights
Fidelity Series Emerging Markets Opportunities Fund
| | | | | | |
| Years ended October 31, | 2019 | 2018 | 2017 | 2016 | 2015 |
| Selected Per–Share Data | | | | | |
| Net asset value, beginning of period | $17.66 | $21.35 | $16.79 | $15.31 | $17.77 |
| Income from Investment Operations | | | | | |
| Net investment income (loss)A | .57B | .45 | .30 | .19 | .21C |
| Net realized and unrealized gain (loss) | 2.71 | (3.52) | 4.49 | 1.47 | (2.53) |
| Total from investment operations | 3.28 | (3.07) | 4.79 | 1.66 | (2.32) |
| Distributions from net investment income | (.41) | (.39) | (.19) | (.18) | (.14) |
| Distributions from net realized gain | (1.14) | (.23) | (.04) | – | – |
| Total distributions | (1.55) | (.62) | (.23) | (.18) | (.14) |
| Net asset value, end of period | $19.39 | $17.66 | $21.35 | $16.79 | $15.31 |
| Total ReturnD | 20.13% | (14.82)% | 29.04% | 11.02% | (13.14)% |
| Ratios to Average Net AssetsE,F | | | | | |
| Expenses before reductions | .04% | .05% | .59% | 1.03% | 1.04% |
| Expenses net of fee waivers, if any | .01% | .01% | .57% | 1.03% | 1.04% |
| Expenses net of all reductions | .01% | .01% | .56% | 1.03% | 1.03% |
| Net investment income (loss) | 3.12%B | 2.16% | 1.63% | 1.24% | 1.29%C |
| Supplemental Data | | | | | |
| Net assets, end of period (000 omitted) | $18,675,048 | $13,597,809 | $15,747,447 | $6,998,219 | $5,571,493 |
| Portfolio turnover rateG | 54% | 64% | 56% | 45% | 64% |
A Calculated based on average shares outstanding during the period.
B Net investment income per share reflects a large, non-recurring dividend which amounted to $.15 per share. Excluding this non-recurring dividend, the ratio of net investment income (loss) to average net assets would have been 2.29%.
C Net investment income per share reflects a large, non-recurring dividend which amounted to $.05 per share. Excluding this non-recurring dividend, the ratio of net investment income (loss) to average net assets would have been 1.00%.
D Total returns would have been lower if certain expenses had not been reduced during the applicable periods shown.
E Fees and expenses of any underlying Fidelity Central Funds are not included in the Fund's expense ratio. The Fund indirectly bears its proportionate share of the expenses of any underlying Fidelity Central Funds.
F Expense ratios reflect operating expenses of the Fund. Expenses before reductions do not reflect amounts reimbursed by the investment adviser or reductions from brokerage service arrangements or reductions from other expense offset arrangements and do not represent the amount paid by the Fund during periods when reimbursements or reductions occur. Expenses net of fee waivers reflect expenses after reimbursement by the investment adviser but prior to reductions from brokerage service arrangements or other expense offset arrangements. Expenses net of all reductions represent the net expenses paid by the Fund.
G Amount does not include the portfolio activity of any underlying Fidelity Central Funds.
See accompanying notes which are an integral part of the financial statements.
Fidelity® Series International Growth Fund
Performance: The Bottom Line
Average annual total return reflects the change in the value of an investment, assuming reinvestment of distributions from dividend income and capital gains (the profits earned upon the sale of securities that have grown in value, if any) and assuming a constant rate of performance each year. The hypothetical investment and the average annual total returns do not reflect the deduction of taxes that a shareholder would pay on fund distributions or the redemption of fund shares. During periods of reimbursement by Fidelity, a fund’s total return will be greater than it would be had the reimbursement not occurred. How a fund did yesterday is no guarantee of how it will do tomorrow.
Average Annual Total Returns
| For the periods ended October 31, 2019 | Past 1 year | Past 5 years | Life of fundA |
| Fidelity® Series International Growth Fund | 22.58% | 7.83% | 8.07% |
A From December 3, 2009
$10,000 Over Life of Fund
Let's say hypothetically that $10,000 was invested in Fidelity® Series International Growth Fund on December 3, 2009, when the fund started.
The chart shows how the value of your investment would have changed, and also shows how the MSCI EAFE Growth Index performed over the same period.
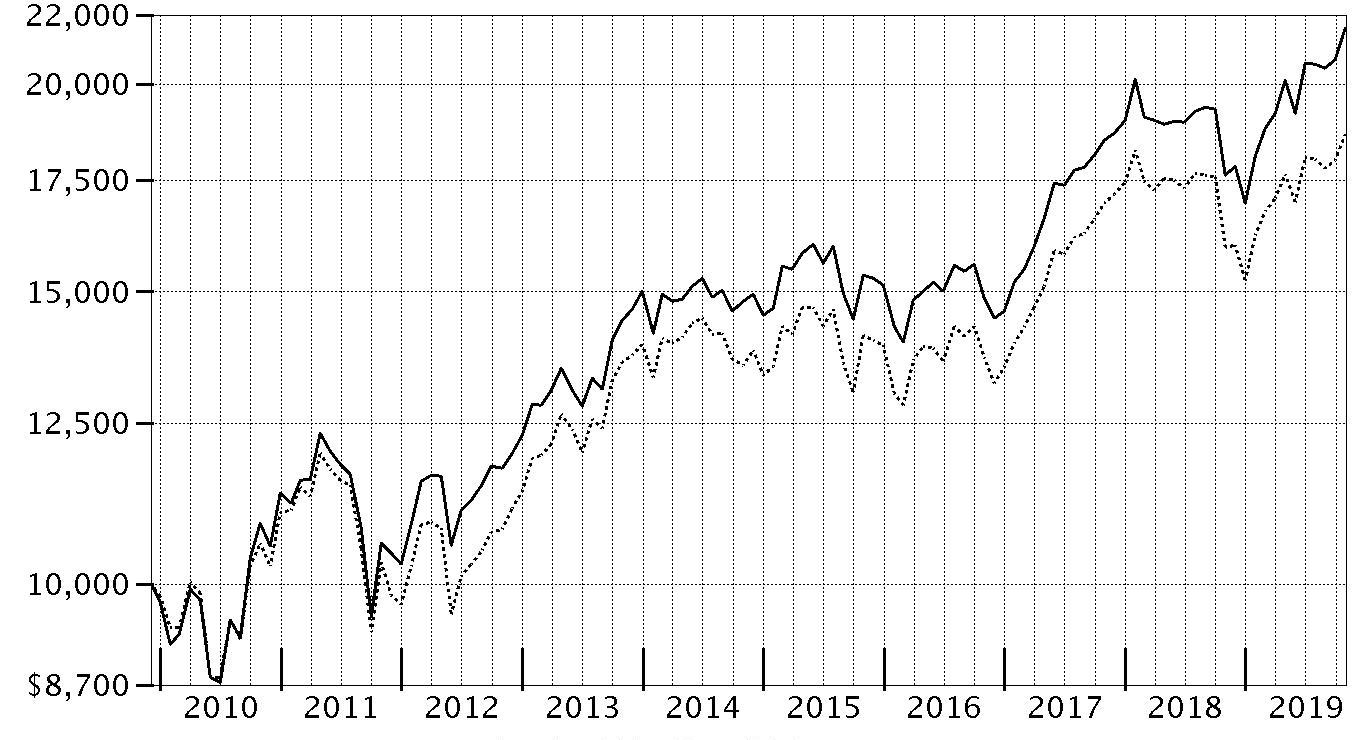
| Period Ending Values |
| $21,587 | Fidelity® Series International Growth Fund |
| $18,643 | MSCI EAFE Growth Index |
Fidelity® Series International Growth Fund
Management's Discussion of Fund Performance
Market Recap: The MSCI ACWI (All Country World Index) ex USA Index gained 11.47% for the 12 months ending October 31, 2019, as international stocks reflected a confluence of factors, including escalating trade tension, moderating but still positive global economic growth and uncertainty about the U.K.’s planned “Brexit” from the European Union. Currency fluctuations were largely modest and varied by region, muting the overall impact on international equity returns. In late December, the U.S. Federal Reserve shifted from raising interest rates to a more dovish policy in 2019, joining many foreign central banks that had cut policy rates. In June, international stocks rose 6.03%, as policy stimulus in China stabilized that country’s economic growth. The Fed cut its policy rate in July for the first time since 2008. However, the index returned -1.21% for the month, followed by -3.08% in August. In September, the Fed cut its policy rate another quarter point, citing concerns about slowing economic growth and muted inflation, and did the same in October, leading to monthly gains of 2.59% and 3.49%, respectively. For the full 12 months, the growth-oriented information technology sector (+22%) led the way, followed by utilities (+20%) and real estate (+18%), two high-dividend-yielding categories. Consumer discretionary gained 16%. Conversely, energy was roughly flat, while materials (+6%) and communication services (7%) also lagged. By region, Asia Pacific ex Japan (+16%), Europe ex U.K (+13%), Canada (+12%) and emerging markets (+12%) fared best. Meanwhile, the U.K. (+7%) and Japan (+10%) trailed the broader market.
Comments from Portfolio Manager Jed Weiss: For the fiscal year, the fund gained 22.58%, notably outpacing the 16.83% advance of the benchmark MSCI EAFE Growth Index. Versus the benchmark, the fund benefited most from sizable out-of-benchmark exposure to the U.S., as well as strong security selection in Japan, Germany, the Netherlands and Switzerland. Stock picking among emerging-markets equities, which are not held in the MSCI Index, also helped. By sector, positioning in information technology notably aided the portfolio’s relative result, as did investment choices within health care, financials and materials. In contrast, security selection in Spain and the U.K. detracted, along with picks in consumer discretionary. The biggest individual relative contributor was Netherlands-based chip-equipment firm ASML Holding (+55%), which continued to benefit from the build-out of 5G wireless networks and growth in its extreme ultraviolet lithography systems business. An out-of-benchmark stake in U.S.-based credit-card processor Mastercard (+41%) also added value, as the firm maintained considerable pricing power and significant market share. Non-index exposure to MSCI (+58%), the leading worldwide provider of benchmark indices and analytics, further contributed. Turning to detractors, an overweighted stake in Spanish airline-reservation software provider Amadeus IT Group (-7%) hurt most amid decelerating airline-traffic growth and increasingly aggressive competition. Untimely ownership of Austrian industrial conglomerate Andritz (-17%) detracted as well. We sold off our stake in Andritz during the period. Lastly, I'll note that the fund's stake in cash – representing about 2% of assets, on average – meaningfully weighed on the portfolio’s relative return amid the strong, uptrending market this period.
The views expressed above reflect those of the portfolio manager(s) only through the end of the period as stated on the cover of this report and do not necessarily represent the views of Fidelity or any other person in the Fidelity organization. Any such views are subject to change at any time based upon market or other conditions and Fidelity disclaims any responsibility to update such views. These views may not be relied on as investment advice and, because investment decisions for a Fidelity fund are based on numerous factors, may not be relied on as an indication of trading intent on behalf of any Fidelity fund.
Fidelity® Series International Growth Fund
Investment Summary (Unaudited)
Geographic Diversification (% of fund's net assets)
| As of October 31, 2019 |
| | United States of America* | 21.1% |
| | Japan | 13.2% |
| | Switzerland | 10.8% |
| | Germany | 9.3% |
| | France | 6.0% |
| | United Kingdom | 6.0% |
| | Sweden | 5.1% |
| | Hong Kong | 4.3% |
| | Netherlands | 4.2% |
| | Other | 20.0% |
* Includes Short-Term investments and Net Other Assets (Liabilities).
Percentages are based on country or territory of incorporation and are adjusted for the effect of futures contracts, if applicable.
Asset Allocation as of October 31, 2019
| | % of fund's net assets |
| Stocks | 98.1 |
| Short-Term Investments and Net Other Assets (Liabilities) | 1.9 |
Top Ten Stocks as of October 31, 2019
| | % of fund's net assets |
| Nestle SA (Reg. S) (Switzerland, Food Products) | 5.8 |
| ASML Holding NV (Netherlands) (Netherlands, Semiconductors & Semiconductor Equipment) | 3.8 |
| SAP SE (Germany, Software) | 3.8 |
| Roche Holding AG (participation certificate) (Switzerland, Pharmaceuticals) | 3.6 |
| AIA Group Ltd. (Hong Kong, Insurance) | 3.1 |
| Keyence Corp. (Japan, Electronic Equipment & Components) | 3.0 |
| CSL Ltd. (Australia, Biotechnology) | 2.7 |
| MasterCard, Inc. Class A (United States of America, IT Services) | 2.7 |
| Visa, Inc. Class A (United States of America, IT Services) | 2.6 |
| ASSA ABLOY AB (B Shares) (Sweden, Building Products) | 2.5 |
| | 33.6 |
Top Market Sectors as of October 31, 2019
| | % of fund's net assets |
| Information Technology | 22.6 |
| Industrials | 21.6 |
| Financials | 16.6 |
| Health Care | 9.4 |
| Consumer Discretionary | 8.8 |
| Consumer Staples | 7.6 |
| Materials | 7.2 |
| Communication Services | 3.2 |
| Real Estate | 0.9 |
| Energy | 0.2 |
Fidelity® Series International Growth Fund
Schedule of Investments October 31, 2019
Showing Percentage of Net Assets
| Common Stocks - 98.1% | | | |
| | | Shares | Value |
| Australia - 2.7% | | | |
| CSL Ltd. | | 2,512,138 | $443,031,400 |
| Bailiwick of Jersey - 1.2% | | | |
| Experian PLC | | 6,481,300 | 203,844,000 |
| Belgium - 0.5% | | | |
| KBC Groep NV | | 1,126,951 | 79,033,146 |
| Brazil - 0.8% | | | |
| BM&F BOVESPA SA | | 11,644,200 | 140,467,871 |
| Canada - 2.2% | | | |
| Alimentation Couche-Tard, Inc. Class B (sub. vtg.) | | 2,752,600 | 82,550,831 |
| Canadian National Railway Co. | | 690,900 | 61,793,349 |
| Canadian Pacific Railway Ltd. | | 391,500 | 89,027,534 |
| Franco-Nevada Corp. | | 877,800 | 85,174,125 |
| Pason Systems, Inc. | | 2,004,369 | 21,518,319 |
| PrairieSky Royalty Ltd. (a) | | 2,273,200 | 22,195,241 |
|
| TOTAL CANADA | | | 362,259,399 |
|
| Cayman Islands - 1.5% | | | |
| Alibaba Group Holding Ltd. sponsored ADR (b) | | 1,436,000 | 253,698,120 |
| Finland - 0.2% | | | |
| Tikkurila Oyj | | 1,797,108 | 28,661,698 |
| France - 6.0% | | | |
| Edenred SA | | 3,244,959 | 170,821,652 |
| Elis SA | | 2,069,752 | 39,542,796 |
| Legrand SA | | 1,846,700 | 144,132,524 |
| LVMH Moet Hennessy Louis Vuitton SE | | 802,900 | 342,883,285 |
| Safran SA | | 1,889,600 | 298,944,746 |
|
| TOTAL FRANCE | | | 996,325,003 |
|
| Germany - 9.3% | | | |
| Deutsche Borse AG | | 1,159,000 | 179,482,389 |
| Linde PLC | | 1,886,512 | 372,938,758 |
| MTU Aero Engines Holdings AG | | 776,400 | 207,300,990 |
| SAP SE | | 4,715,184 | 624,768,872 |
| Vonovia SE | | 2,769,400 | 147,362,442 |
|
| TOTAL GERMANY | | | 1,531,853,451 |
|
| Hong Kong - 4.3% | | | |
| AIA Group Ltd. | | 52,039,099 | 518,217,047 |
| Hong Kong Exchanges and Clearing Ltd. | | 6,290,600 | 195,977,587 |
|
| TOTAL HONG KONG | | | 714,194,634 |
|
| India - 1.3% | | | |
| Housing Development Finance Corp. Ltd. | | 7,057,966 | 211,671,221 |
| Ireland - 1.5% | | | |
| CRH PLC sponsored ADR | | 6,748,406 | 246,316,819 |
| Italy - 0.5% | | | |
| Interpump Group SpA | | 3,005,649 | 82,330,040 |
| Japan - 13.2% | | | |
| Azbil Corp. | | 4,293,000 | 119,462,152 |
| DENSO Corp. | | 1,452,300 | 67,430,175 |
| East Japan Railway Co. | | 1,396,700 | 126,793,865 |
| Fanuc Corp. | | 978,500 | 193,008,444 |
| Hoya Corp. | | 3,196,224 | 282,473,423 |
| Keyence Corp. | | 772,300 | 488,322,522 |
| Misumi Group, Inc. | | 7,998,000 | 201,059,823 |
| Nabtesco Corp. | | 2,598,800 | 82,732,285 |
| OSG Corp. | | 3,875,200 | 82,888,562 |
| Recruit Holdings Co. Ltd. | | 5,034,600 | 167,320,116 |
| SHO-BOND Holdings Co. Ltd. (c) | | 2,918,400 | 113,264,445 |
| USS Co. Ltd. | | 12,674,900 | 245,489,909 |
|
| TOTAL JAPAN | | | 2,170,245,721 |
|
| Kenya - 0.5% | | | |
| Safaricom Ltd. | | 264,324,800 | 76,124,519 |
| Korea (South) - 0.3% | | | |
| BGF Retail Co. Ltd. | | 323,987 | 49,278,116 |
| Netherlands - 4.2% | | | |
| ASML Holding NV (Netherlands) | | 2,411,700 | 632,141,800 |
| Prosus NV (b) | | 880,110 | 60,691,505 |
|
| TOTAL NETHERLANDS | | | 692,833,305 |
|
| New Zealand - 0.6% | | | |
| Auckland International Airport Ltd. | | 15,611,431 | 93,041,380 |
| Norway - 1.0% | | | |
| Adevinta ASA: | | | |
| rights 11/12/19 (b) | | 2,093,900 | 320,137 |
| Class B | | 7,022,895 | 80,186,162 |
| Schibsted ASA (B Shares) | | 3,027,094 | 84,530,781 |
|
| TOTAL NORWAY | | | 165,037,080 |
|
| South Africa - 1.3% | | | |
| Clicks Group Ltd. | | 7,283,219 | 118,465,277 |
| Naspers Ltd. Class N | | 713,910 | 101,024,418 |
|
| TOTAL SOUTH AFRICA | | | 219,489,695 |
|
| Spain - 2.4% | | | |
| Amadeus IT Holding SA Class A | | 4,584,300 | 339,187,783 |
| Prosegur Compania de Seguridad SA (Reg.) | | 15,583,989 | 60,485,264 |
|
| TOTAL SPAIN | | | 399,673,047 |
|
| Sweden - 5.1% | | | |
| ASSA ABLOY AB (B Shares) | | 17,286,617 | 410,529,138 |
| Atlas Copco AB (A Shares) (a) | | 7,011,800 | 247,700,838 |
| Epiroc AB Class A (a) | | 10,545,800 | 118,611,171 |
| Fagerhult AB | | 3,516,696 | 20,832,774 |
| Loomis AB (B Shares) | | 1,285,619 | 49,663,503 |
|
| TOTAL SWEDEN | | | 847,337,424 |
|
| Switzerland - 10.8% | | | |
| Nestle SA (Reg. S) | | 8,862,245 | 948,094,884 |
| Roche Holding AG (participation certificate) | | 1,970,481 | 593,028,045 |
| Schindler Holding AG: | | | |
| (participation certificate) | | 824,126 | 201,499,434 |
| (Reg.) | | 154,309 | 36,477,302 |
|
| TOTAL SWITZERLAND | | | 1,779,099,665 |
|
| Taiwan - 1.5% | | | |
| Taiwan Semiconductor Manufacturing Co. Ltd. | | 25,813,000 | 252,485,410 |
| United Kingdom - 6.0% | | | |
| BAE Systems PLC | | 8,712,800 | 65,082,152 |
| Elementis PLC | | 15,468,883 | 29,795,937 |
| Informa PLC | | 8,135,988 | 81,676,878 |
| InterContinental Hotel Group PLC ADR | | 4,413,502 | 267,414,086 |
| London Stock Exchange Group PLC | | 1,460,600 | 131,627,565 |
| M&G PLC (b) | | 11,775,538 | 32,611,861 |
| Prudential PLC | | 11,975,538 | 209,174,775 |
| Rightmove PLC | | 10,868,100 | 84,270,868 |
| Spectris PLC | | 2,939,894 | 91,091,945 |
|
| TOTAL UNITED KINGDOM | | | 992,746,067 |
|
| United States of America - 19.2% | | | |
| Alphabet, Inc. Class A (b) | | 92,994 | 117,060,847 |
| Autoliv, Inc. (a) | | 1,410,327 | 109,779,854 |
| Berkshire Hathaway, Inc. Class B (b) | | 819,750 | 174,262,455 |
| Black Knight, Inc. (b) | | 2,043,500 | 131,192,700 |
| Lam Research Corp. | | 358,200 | 97,086,528 |
| Marsh & McLennan Companies, Inc. | | 2,331,773 | 241,618,318 |
| Martin Marietta Materials, Inc. | | 653,166 | 171,070,707 |
| MasterCard, Inc. Class A | | 1,577,310 | 436,615,181 |
| Moody's Corp. | | 928,500 | 204,910,665 |
| MSCI, Inc. | | 900,600 | 211,244,736 |
| PayPal Holdings, Inc. (b) | | 1,008,300 | 104,964,030 |
| PriceSmart, Inc. | | 600,464 | 44,494,382 |
| ResMed, Inc. | | 1,599,200 | 236,553,664 |
| S&P Global, Inc. | | 791,471 | 204,191,603 |
| Sherwin-Williams Co. | | 430,600 | 246,440,992 |
| Visa, Inc. Class A | | 2,409,196 | 430,908,797 |
|
| TOTAL UNITED STATES OF AMERICA | | | 3,162,395,459 |
|
| TOTAL COMMON STOCKS | | | |
| (Cost $10,387,786,597) | | | 16,193,473,690 |
|
| Money Market Funds - 2.7% | | | |
| Fidelity Cash Central Fund 1.83% (d) | | 268,315,570 | 268,369,233 |
| Fidelity Securities Lending Cash Central Fund 1.84% (d)(e) | | 166,001,385 | 166,017,985 |
| TOTAL MONEY MARKET FUNDS | | | |
| (Cost $434,385,129) | | | 434,387,218 |
| TOTAL INVESTMENT IN SECURITIES - 100.8% | | | |
| (Cost $10,822,171,726) | | | 16,627,860,908 |
| NET OTHER ASSETS (LIABILITIES) - (0.8)% | | | (126,070,038) |
| NET ASSETS - 100% | | | $16,501,790,870 |
Categorizations in the Schedule of Investments are based on country or territory of incorporation.
Legend
(a) Security or a portion of the security is on loan at period end.
(b) Non-income producing
(c) Affiliated company
(d) Affiliated fund that is generally available only to investment companies and other accounts managed by Fidelity Investments. The rate quoted is the annualized seven-day yield of the fund at period end. A complete unaudited listing of the fund's holdings as of its most recent quarter end is available upon request. In addition, each Fidelity Central Fund's financial statements, which are not covered by the Fund's Report of Independent Registered Public Accounting Firm, are available on the SEC's website or upon request.
(e) Investment made with cash collateral received from securities on loan.
Affiliated Central Funds
Information regarding fiscal year to date income earned by the Fund from investments in Fidelity Central Funds is as follows:
| Fund | Income earned |
| Fidelity Cash Central Fund | $7,398,670 |
| Fidelity Securities Lending Cash Central Fund | 1,539,126 |
| Total | $8,937,796 |
Amounts in the income column in the above table include any capital gain distributions from underlying funds, which are presented in the corresponding line-item in the Statement of Operations, if applicable. Amount for Fidelity Securities Lending Cash Central Fund represents the income earned on investing cash collateral, less rebates paid to borrowers and any lending agent fees associated with the loan, plus any premium payments received for lending certain types of securities.
Other Affiliated Issuers
An affiliated company is a company in which the Fund has ownership of at least 5% of the voting securities. Fiscal year to date transactions with companies which are or were affiliates are as follows:
| Affiliate | Value, beginning of period | Purchases | Sales Proceeds | Dividend Income | Realized Gain (loss) | Change in Unrealized appreciation (depreciation) | Value, end of period |
| SHO-BOND Holdings Co. Ltd. | $103,974,547 | $-- | $-- | $1,631,880 | $-- | $9,289,898 | $113,264,445 |
| Total | $103,974,547 | $-- | $-- | $1,631,880 | $-- | $9,289,898 | $113,264,445 |
Investment Valuation
The following is a summary of the inputs used, as of October 31, 2019, involving the Fund's assets and liabilities carried at fair value. The inputs or methodology used for valuing securities may not be an indication of the risk associated with investing in those securities. For more information on valuation inputs, and their aggregation into the levels used below, please refer to the Investment Valuation section in the accompanying Notes to Financial Statements.
| | Valuation Inputs at Reporting Date: |
| Description | Total | Level 1 | Level 2 | Level 3 |
| Investments in Securities: | | | | |
| Equities: | | | | |
| Communication Services | $524,170,192 | $524,170,192 | $-- | $-- |
| Consumer Discretionary | 1,448,411,352 | 691,583,565 | 756,827,787 | -- |
| Consumer Staples | 1,242,883,490 | 294,788,606 | 948,094,884 | -- |
| Energy | 43,713,560 | 43,713,560 | -- | -- |
| Financials | 2,734,491,239 | 1,288,340,655 | 1,446,150,584 | -- |
| Health Care | 1,555,086,532 | 236,553,664 | 1,318,532,868 | -- |
| Industrials | 3,568,728,127 | 2,033,007,917 | 1,535,720,210 | -- |
| Information Technology | 3,748,227,720 | 1,631,046,964 | 2,117,180,756 | -- |
| Materials | 1,180,399,036 | 1,180,399,036 | -- | -- |
| Real Estate | 147,362,442 | 147,362,442 | -- | -- |
| Money Market Funds | 434,387,218 | 434,387,218 | -- | -- |
| Total Investments in Securities: | $16,627,860,908 | $8,505,353,819 | $8,122,507,089 | $-- |
See accompanying notes which are an integral part of the financial statements.
Fidelity® Series International Growth Fund
Financial Statements
Statement of Assets and Liabilities
| | | October 31, 2019 |
| Assets | | |
Investment in securities, at value (including securities loaned of $160,237,036) — See accompanying schedule:
Unaffiliated issuers (cost $10,345,451,557) | $16,080,209,245 | |
| Fidelity Central Funds (cost $434,385,129) | 434,387,218 | |
| Other affiliated issuers (cost $42,335,040) | 113,264,445 | |
| Total Investment in Securities (cost $10,822,171,726) | | $16,627,860,908 |
| Foreign currency held at value (cost $1,484,712) | | 1,484,609 |
| Receivable for investments sold | | 11,048,863 |
| Receivable for fund shares sold | | 49,142,731 |
| Dividends receivable | | 62,549,006 |
| Distributions receivable from Fidelity Central Funds | | 320,708 |
| Total assets | | 16,752,406,825 |
| Liabilities | | |
| Payable for investments purchased | $50,420,106 | |
| Payable for fund shares redeemed | 32,364,066 | |
| Other payables and accrued expenses | 1,837,119 | |
| Collateral on securities loaned | 165,994,664 | |
| Total liabilities | | 250,615,955 |
| Net Assets | | $16,501,790,870 |
| Net Assets consist of: | | |
| Paid in capital | | $10,113,307,818 |
| Total accumulated earnings (loss) | | 6,388,483,052 |
| Net Assets, for 966,469,761 shares outstanding | | $16,501,790,870 |
| Net Asset Value, offering price and redemption price per share ($16,501,790,870 ÷ 966,469,761 shares) | | $17.07 |
See accompanying notes which are an integral part of the financial statements.
Statement of Operations
| | | Year ended October 31, 2019 |
| Investment Income | | |
| Dividends (including $1,631,880 earned from other affiliated issuers) | | $275,121,028 |
| Non-Cash dividends | | 96,972,021 |
| Income from Fidelity Central Funds (including $1,539,126 from security lending) | | 8,937,796 |
| Income before foreign taxes withheld | | 381,030,845 |
| Less foreign taxes withheld | | (24,430,430) |
| Total income | | 356,600,415 |
| Expenses | | |
| Custodian fees and expenses | $926,269 | |
| Independent trustees' fees and expenses | 82,759 | |
| Commitment fees | 38,966 | |
| Total expenses before reductions | 1,047,994 | |
| Expense reductions | (2,106) | |
| Total expenses after reductions | | 1,045,888 |
| Net investment income (loss) | | 355,554,527 |
| Realized and Unrealized Gain (Loss) | | |
| Net realized gain (loss) on: | | |
| Investment securities: | | |
| Unaffiliated issuers | 285,425,517 | |
| Fidelity Central Funds | (8,638) | |
| Foreign currency transactions | (1,318,338) | |
| Total net realized gain (loss) | | 284,098,541 |
| Change in net unrealized appreciation (depreciation) on: | | |
| Investment securities: | | |
| Unaffiliated issuers (net of increase in deferred foreign taxes of $1,384,229) | 2,424,423,457 | |
| Fidelity Central Funds | 2,089 | |
| Other affiliated issuers | 9,289,898 | |
| Assets and liabilities in foreign currencies | 20,826 | |
| Total change in net unrealized appreciation (depreciation) | | 2,433,736,270 |
| Net gain (loss) | | 2,717,834,811 |
| Net increase (decrease) in net assets resulting from operations | | $3,073,389,338 |
See accompanying notes which are an integral part of the financial statements.
Statement of Changes in Net Assets
| | Year ended October 31, 2019 | Year ended October 31, 2018 |
| Increase (Decrease) in Net Assets | | |
| Operations | | |
| Net investment income (loss) | $355,554,527 | $271,551,901 |
| Net realized gain (loss) | 284,098,541 | 663,014,677 |
| Change in net unrealized appreciation (depreciation) | 2,433,736,270 | (1,606,402,204) |
| Net increase (decrease) in net assets resulting from operations | 3,073,389,338 | (671,835,626) |
| Distributions to shareholders | (924,506,492) | (460,665,652) |
| Share transactions | | |
| Proceeds from sales of shares | 1,218,860,154 | 2,006,174,828 |
| Reinvestment of distributions | 924,506,492 | 460,665,652 |
| Cost of shares redeemed | (1,904,058,640) | (2,005,553,650) |
| Net increase (decrease) in net assets resulting from share transactions | 239,308,006 | 461,286,830 |
| Total increase (decrease) in net assets | 2,388,190,852 | (671,214,448) |
| Net Assets | | |
| Beginning of period | 14,113,600,018 | 14,784,814,466 |
| End of period | $16,501,790,870 | $14,113,600,018 |
| Other Information | | |
| Shares | | |
| Sold | 79,419,141 | 126,128,565 |
| Issued in reinvestment of distributions | 68,583,568 | 29,082,428 |
| Redeemed | (125,219,315) | (122,800,370) |
| Net increase (decrease) | 22,783,394 | 32,410,623 |
See accompanying notes which are an integral part of the financial statements.
Financial Highlights
Fidelity Series International Growth Fund
| | | | | | |
| Years ended October 31, | 2019 | 2018 | 2017 | 2016 | 2015 |
| Selected Per–Share Data | | | | | |
| Net asset value, beginning of period | $14.96 | $16.22 | $13.37 | $14.28 | $14.17 |
| Income from Investment Operations | | | | | |
| Net investment income (loss)A | .37B | .30 | .21 | .17C | .15 |
| Net realized and unrealized gain (loss) | 2.74 | (1.05) | 2.97 | (.60) | .36 |
| Total from investment operations | 3.11 | (.75) | 3.18 | (.43) | .51 |
| Distributions from net investment income | (.28) | (.24) | (.16) | (.16) | (.19) |
| Distributions from net realized gain | (.72) | (.27) | (.17) | (.33) | (.21) |
| Total distributions | (1.00) | (.51) | (.33) | (.48)D | (.40) |
| Net asset value, end of period | $17.07 | $14.96 | $16.22 | $13.37 | $14.28 |
| Total ReturnE | 22.58% | (4.82)% | 24.42% | (3.10)% | 3.65% |
| Ratios to Average Net AssetsF,G | | | | | |
| Expenses before reductions | .01% | .01% | .51% | .94% | .92% |
| Expenses net of fee waivers, if any | .01% | .01% | .51% | .94% | .91% |
| Expenses net of all reductions | .01% | - %H | .51% | .94% | .91% |
| Net investment income (loss) | 2.38%B | 1.84% | 1.41% | 1.27%C | 1.06% |
| Supplemental Data | | | | | |
| Net assets, end of period (000 omitted) | $16,501,791 | $14,113,600 | $14,784,814 | $5,618,983 | $5,563,674 |
| Portfolio turnover rateI | 24% | 33% | 23% | 26% | 24% |
A Calculated based on average shares outstanding during the period.
B Net investment income per share reflects a large, non-recurring dividend which amounted to $.07 per share. Excluding this non-recurring dividend, the ratio of net investment income (loss) to average net assets would have been 1.92%.
C Net investment income per share reflects a large, non-recurring dividend which amounted to $.05 per share. Excluding this non-recurring dividend, the ratio of net investment income (loss) to average net assets would have been .93%.
D Total distributions of $.48 per share is comprised of distributions from net investment income of $.156 and distributions from net realized gain of $.326 per share.
E Total returns would have been lower if certain expenses had not been reduced during the applicable periods shown.
F Fees and expenses of any underlying Fidelity Central Funds are not included in the Fund's expense ratio. The Fund indirectly bears its proportionate share of the expenses of any underlying Fidelity Central Funds.
G Expense ratios reflect operating expenses of the Fund. Expenses before reductions do not reflect amounts reimbursed by the investment adviser or reductions from brokerage service arrangements or reductions from other expense offset arrangements and do not represent the amount paid by the Fund during periods when reimbursements or reductions occur. Expenses net of fee waivers reflect expenses after reimbursement by the investment adviser but prior to reductions from brokerage service arrangements or other expense offset arrangements. Expenses net of all reductions represent the net expenses paid by the Fund.
H Amount represents less than .005%.
I Amount does not include the portfolio activity of any underlying Fidelity Central Funds.
See accompanying notes which are an integral part of the financial statements.
Fidelity® Series International Small Cap Fund
Performance: The Bottom Line
Average annual total return reflects the change in the value of an investment, assuming reinvestment of distributions from dividend income and capital gains (the profits earned upon the sale of securities that have grown in value, if any) and assuming a constant rate of performance each year. The hypothetical investment and the average annual total returns do not reflect the deduction of taxes that a shareholder would pay on fund distributions or the redemption of fund shares. During periods of reimbursement by Fidelity, a fund’s total return will be greater than it would be had the reimbursement not occurred. How a fund did yesterday is no guarantee of how it will do tomorrow.
Average Annual Total Returns
| For the periods ended October 31, 2019 | Past 1 year | Past 5 years | Life of fundA |
| Fidelity® Series International Small Cap Fund | 12.77% | 8.17% | 9.32% |
A From December 3, 2009
$10,000 Over Life of Fund
Let's say hypothetically that $10,000 was invested in Fidelity® Series International Small Cap Fund on December 3, 2009, when the fund started.
The chart shows how the value of your investment would have changed, and also shows how the MSCI EAFE Small Cap Index performed over the same period.
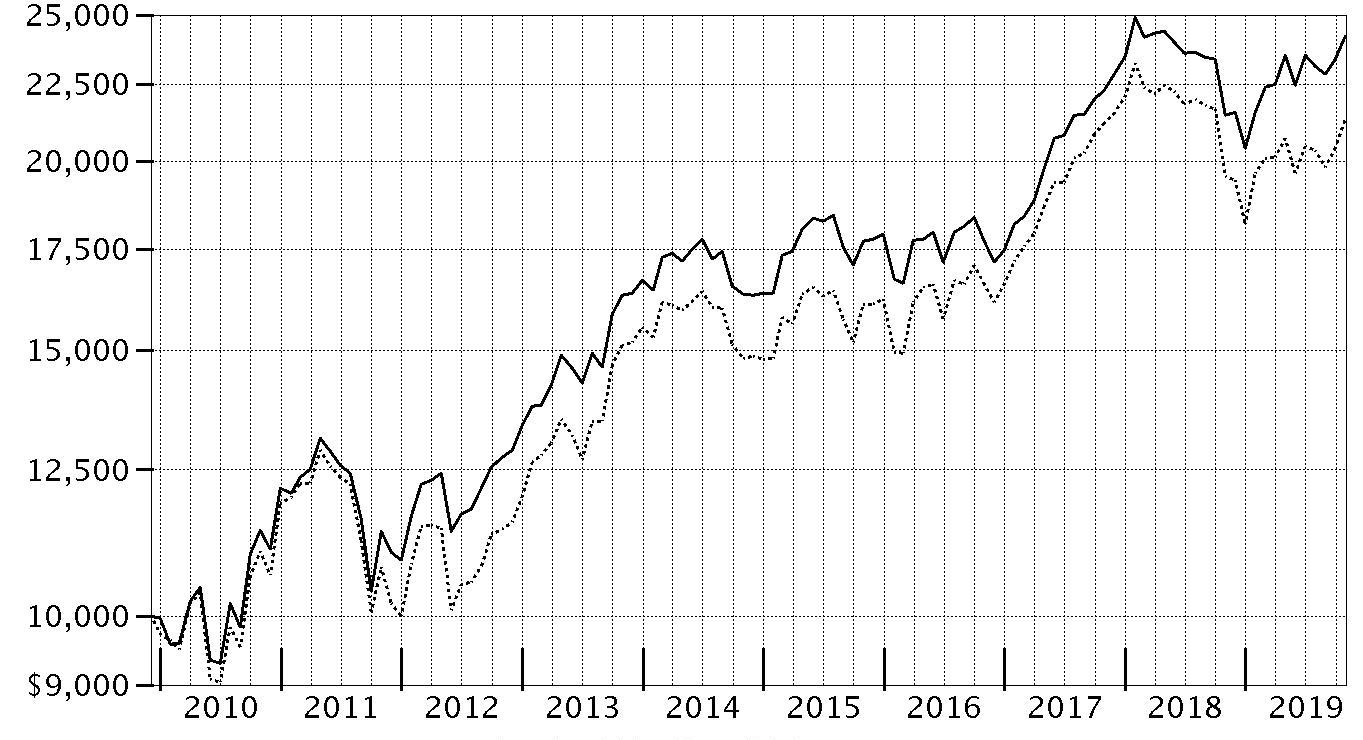
| Period Ending Values |
| $24,205 | Fidelity® Series International Small Cap Fund |
| $21,321 | MSCI EAFE Small Cap Index |
Fidelity® Series International Small Cap Fund
Management's Discussion of Fund Performance
Market Recap: The MSCI ACWI (All Country World Index) ex USA Index gained 11.47% for the 12 months ending October 31, 2019, as international stocks reflected a confluence of factors, including escalating trade tension, moderating but still positive global economic growth and uncertainty about the U.K.’s planned “Brexit” from the European Union. Currency fluctuations were largely modest and varied by region, muting the overall impact on international equity returns. In late December, the U.S. Federal Reserve shifted from raising interest rates to a more dovish policy in 2019, joining many foreign central banks that had cut policy rates. In June, international stocks rose 6.03%, as policy stimulus in China stabilized that country’s economic growth. The Fed cut its policy rate in July for the first time since 2008. However, the index returned -1.21% for the month, followed by -3.08% in August. In September, the Fed cut its policy rate another quarter point, citing concerns about slowing economic growth and muted inflation, and did the same in October, leading to monthly gains of 2.59% and 3.49%, respectively. For the full 12 months, the growth-oriented information technology sector (+22%) led the way, followed by utilities (+20%) and real estate (+18%), two high-dividend-yielding categories. Consumer discretionary gained 16%. Conversely, energy was roughly flat, while materials (+6%) and communication services (7%) also lagged. By region, Asia Pacific ex Japan (+16%), Europe ex U.K (+13%), Canada (+12%) and emerging markets (+12%) fared best. Meanwhile, the U.K. (+7%) and Japan (+10%) trailed the broader market.
Comments from Co-Portfolio Manager Jed Weiss: For the fiscal year, the fund gained 12.77%, outpacing the 9.00% advance of the benchmark MSCI EAFE Small Cap Index. Versus the benchmark, security selection within Japan was by far the biggest contributor, followed by picks in Germany, Denmark and the U.K. Investment choices among emerging markets also helped the portfolio’s relative result. From a sector standpoint, positioning in information technology notably aided performance, along with strong picks in health care, the consumer-oriented groups and industrials. Conversely, security selection in Canada, Israel and Spain hampered the fund's performance versus the benchmark, as did an underweighting in Australia and the market-leading real estate sector. A number of Japanese holdings helped the fund top the benchmark this period. This included an overweighting in Lasertec, a dominant supplier of semiconductor mask inspection equipment that gained roughly 157% the past 12 months. The company continued to be a beneficiary of the structural growth in extreme ultraviolet lithography. Further contributing were an overweighting in Japanese building automation firm Azbil (+53%) and a sizable out-of-benchmark stake in technology service management company OBIC (+40%). In addition, it helped to hold a non-index position in Workman (+126%), the leading workwear retailer in Japan. Conversely, the fund's biggest detractor was Spanish multinational private security company Prosegur Compania de Seguridad (-28%), which was hampered by the impact of depreciating Latin American currencies during the period. Other holdings that pressured the fund’s performance versus the benchmark included Israeli stolen vehicle recovery and tracking services firm Ituran Location and Control (-26%), as well as U.K.-headquartered specialty chemical company Elementis (-24%). Lastly, I'll note that the fund's stake in cash – representing about 7% of assets, on average – also weighed on the portfolio’s relative return amid the strong, uptrending market this period.
The views expressed above reflect those of the portfolio manager(s) only through the end of the period as stated on the cover of this report and do not necessarily represent the views of Fidelity or any other person in the Fidelity organization. Any such views are subject to change at any time based upon market or other conditions and Fidelity disclaims any responsibility to update such views. These views may not be relied on as investment advice and, because investment decisions for a Fidelity fund are based on numerous factors, may not be relied on as an indication of trading intent on behalf of any Fidelity fund.
Note to Shareholders: On November 1, 2018, Preeti Sayana assumed co-management responsibilities for the fund.
Fidelity® Series International Small Cap Fund
Investment Summary (Unaudited)
Geographic Diversification (% of fund's net assets)
| As of October 31, 2019 |
| | Japan | 36.2% |
| | United Kingdom | 15.8% |
| | United States of America* | 9.5% |
| | Germany | 5.5% |
| | Sweden | 4.5% |
| | Denmark | 2.6% |
| | Netherlands | 2.6% |
| | Canada | 2.5% |
| | Israel | 2.2% |
| | Other | 18.6% |
* Includes Short-Term investments and Net Other Assets (Liabilities).
Percentages are based on country or territory of incorporation and are adjusted for the effect of futures contracts, if applicable.
Asset Allocation as of October 31, 2019
| | % of fund's net assets |
| Stocks | 92.6 |
| Short-Term Investments and Net Other Assets (Liabilities) | 7.4 |
Top Ten Stocks as of October 31, 2019
| | % of fund's net assets |
| Azbil Corp. (Japan, Electronic Equipment & Components) | 2.6 |
| OBIC Co. Ltd. (Japan, IT Services) | 2.4 |
| Spirax-Sarco Engineering PLC (United Kingdom, Machinery) | 2.1 |
| Lasertec Corp. (Japan, Semiconductors & Semiconductor Equipment) | 2.0 |
| CompuGroup Medical AG (Germany, Health Care Technology) | 2.0 |
| Spectris PLC (United Kingdom, Electronic Equipment & Components) | 2.0 |
| USS Co. Ltd. (Japan, Specialty Retail) | 1.8 |
| SHO-BOND Holdings Co. Ltd. (Japan, Construction & Engineering) | 1.5 |
| Nihon Parkerizing Co. Ltd. (Japan, Chemicals) | 1.5 |
| OSG Corp. (Japan, Machinery) | 1.4 |
| | 19.3 |
Top Market Sectors as of October 31, 2019
| | % of fund's net assets |
| Industrials | 21.9 |
| Information Technology | 16.3 |
| Health Care | 13.1 |
| Consumer Discretionary | 10.2 |
| Consumer Staples | 8.0 |
| Financials | 6.0 |
| Materials | 5.7 |
| Communication Services | 5.3 |
| Real Estate | 3.8 |
| Energy | 2.2 |
Fidelity® Series International Small Cap Fund
Schedule of Investments October 31, 2019
Showing Percentage of Net Assets
| Common Stocks - 91.6% | | | |
| | | Shares | Value |
| Australia - 1.0% | | | |
| Bapcor Ltd. | | 1,135,954 | $5,599,692 |
| Beacon Lighting Group Ltd. | | 6,633,510 | 5,556,577 |
| Imdex Ltd. | | 14,779,970 | 16,184,064 |
| Nanosonics Ltd. (a) | | 528,844 | 2,474,296 |
| Reckon Ltd. (b) | | 5,931,484 | 3,095,110 |
| SomnoMed Ltd. (a) | | 305,402 | 594,428 |
|
| TOTAL AUSTRALIA | | | 33,504,167 |
|
| Austria - 0.5% | | | |
| EVN AG | | 228,100 | 4,167,071 |
| IMMOFINANZ Immobilien Anlagen AG | | 230,582 | 6,622,079 |
| Wienerberger AG | | 210,100 | 5,680,027 |
|
| TOTAL AUSTRIA | | | 16,469,177 |
|
| Bailiwick of Jersey - 0.6% | | | |
| Integrated Diagnostics Holdings PLC (c) | | 4,317,632 | 20,379,223 |
| Belgium - 2.0% | | | |
| Barco NV | | 177,600 | 38,625,070 |
| Econocom Group SA | | 2,969,647 | 7,743,567 |
| KBC Ancora | | 519,141 | 24,723,213 |
|
| TOTAL BELGIUM | | | 71,091,850 |
|
| Canada - 2.5% | | | |
| Computer Modelling Group Ltd. | | 1,550,000 | 8,249,563 |
| ECN Capital Corp. | | 3,248,700 | 10,729,516 |
| McCoy Global, Inc. (a) | | 1,107,650 | 504,586 |
| MTY Food Group, Inc. | | 109,600 | 4,378,674 |
| New Look Vision Group, Inc. | | 694,700 | 16,878,293 |
| Pason Systems, Inc. | | 1,171,000 | 12,571,513 |
| PrairieSky Royalty Ltd. (d) | | 948,900 | 9,264,941 |
| Richelieu Hardware Ltd. | | 714,500 | 14,668,651 |
| ShawCor Ltd. Class A | | 489,800 | 4,931,097 |
| Spin Master Corp. (a)(c) | | 178,200 | 5,041,175 |
| Total Energy Services, Inc. | | 355,700 | 1,517,754 |
|
| TOTAL CANADA | | | 88,735,763 |
|
| Cayman Islands - 0.4% | | | |
| SITC International Holdings Co. Ltd. | | 4,091,000 | 4,504,595 |
| Value Partners Group Ltd. | | 20,410,200 | 10,744,373 |
|
| TOTAL CAYMAN ISLANDS | | | 15,248,968 |
|
| China - 0.5% | | | |
| Zhejiang Sanhua Intelligent Controls Co. Ltd. (A Shares) | | 8,232,730 | 16,356,079 |
| Denmark - 2.6% | | | |
| Ambu A/S Series B (d) | | 898,100 | 14,104,037 |
| Jyske Bank A/S (Reg.) | | 285,719 | 9,498,660 |
| Netcompany Group A/S (a)(c) | | 487,021 | 20,734,817 |
| SimCorp A/S | | 281,400 | 25,141,503 |
| Spar Nord Bank A/S | | 2,294,386 | 22,399,959 |
|
| TOTAL DENMARK | | | 91,878,976 |
|
| Finland - 0.7% | | | |
| Olvi PLC (A Shares) | | 219,434 | 9,312,157 |
| Tikkurila Oyj | | 1,053,586 | 16,803,422 |
|
| TOTAL FINLAND | | | 26,115,579 |
|
| France - 2.2% | | | |
| Cegedim SA (a) | | 262,251 | 8,116,557 |
| Elis SA | | 1,547,721 | 29,569,348 |
| Laurent-Perrier Group SA | | 135,868 | 13,486,489 |
| Somfy SA | | 24,200 | 2,240,192 |
| STEF-TFE Group | | 42,038 | 4,083,682 |
| Vetoquinol SA | | 297,227 | 19,359,441 |
|
| TOTAL FRANCE | | | 76,855,709 |
|
| Germany - 4.7% | | | |
| CompuGroup Medical AG | | 1,072,695 | 68,672,025 |
| CTS Eventim AG | | 568,095 | 34,372,602 |
| DIC Asset AG | | 1,562,600 | 21,784,597 |
| JOST Werke AG (c) | | 109,555 | 3,079,105 |
| Nexus AG | | 618,016 | 21,918,889 |
| Takkt AG | | 390,800 | 4,646,260 |
| WashTec AG | | 210,242 | 10,575,179 |
|
| TOTAL GERMANY | | | 165,048,657 |
|
| Greece - 0.8% | | | |
| Fourlis Holdings SA | | 1,184,792 | 7,135,552 |
| Motor Oil (HELLAS) Corinth Refineries SA | | 586,000 | 14,469,947 |
| Mytilineos SA | | 432,600 | 4,733,117 |
|
| TOTAL GREECE | | | 26,338,616 |
|
| India - 0.7% | | | |
| Embassy Office Parks (REIT) | | 2,870,400 | 16,686,027 |
| Jyothy Laboratories Ltd. | | 2,762,490 | 6,806,428 |
|
| TOTAL INDIA | | | 23,492,455 |
|
| Ireland - 0.6% | | | |
| FBD Holdings PLC | | 1,318,227 | 13,026,137 |
| Mincon Group PLC | | 1,925,044 | 2,147,002 |
| Total Produce PLC | | 1,472,600 | 2,397,891 |
| United Drug PLC (United Kingdom) | | 191,000 | 1,912,494 |
|
| TOTAL IRELAND | | | 19,483,524 |
|
| Israel - 2.2% | | | |
| Azrieli Group | | 132,479 | 10,205,294 |
| Ituran Location & Control Ltd. | | 1,144,393 | 28,071,960 |
| Strauss Group Ltd. | | 1,080,355 | 32,706,913 |
| Tel Aviv Stock Exchange Ltd. | | 1,788,719 | 6,623,099 |
|
| TOTAL ISRAEL | | | 77,607,266 |
|
| Italy - 1.0% | | | |
| Interpump Group SpA | | 1,199,476 | 32,855,768 |
| MARR SpA | | 147,500 | 3,096,017 |
|
| TOTAL ITALY | | | 35,951,785 |
|
| Japan - 36.2% | | | |
| Ai Holdings Corp. | | 570,600 | 10,341,339 |
| Aoki Super Co. Ltd. | | 192,900 | 4,590,891 |
| Artnature, Inc. | | 1,250,960 | 8,309,664 |
| Asante, Inc. | | 381,000 | 7,358,939 |
| Aucnet, Inc. | | 577,160 | 7,926,945 |
| Azbil Corp. | | 3,317,600 | 92,319,502 |
| Bank of Kyoto Ltd. | | 154,907 | 6,131,304 |
| Broadleaf Co. Ltd. | | 3,647,500 | 20,492,785 |
| Central Automotive Products Ltd. | | 121,079 | 2,369,616 |
| Chugoku Marine Paints Ltd. | | 275,000 | 2,658,804 |
| CKD Corp. | | 195,000 | 2,737,609 |
| Coca-Cola West Co. Ltd. | | 476,150 | 10,810,545 |
| Daiichikosho Co. Ltd. | | 709,200 | 33,713,473 |
| Daikokutenbussan Co. Ltd. | | 438,700 | 13,687,166 |
| Funai Soken Holdings, Inc. | | 640,500 | 15,432,129 |
| GCA Savvian Group Corp. (d) | | 1,719,487 | 13,750,103 |
| Genky DrugStores Co. Ltd. (d) | | 176,600 | 3,952,421 |
| GMO Internet, Inc. | | 537,162 | 9,026,919 |
| Goldcrest Co. Ltd. | | 1,476,010 | 30,489,823 |
| Iwatsuka Confectionary Co. Ltd. | | 115,800 | 4,142,524 |
| Kamigumi Co. Ltd. | | 244,950 | 5,538,602 |
| Kobayashi Pharmaceutical Co. Ltd. | | 305,600 | 24,435,780 |
| Koshidaka Holdings Co. Ltd. | | 3,071,800 | 44,605,629 |
| Kusuri No Aoki Holdings Co. Ltd. | | 359,300 | 26,795,639 |
| Lasertec Corp. | | 965,400 | 69,398,784 |
| Medikit Co. Ltd. | | 261,400 | 16,564,587 |
| Mirait Holdings Corp. | | 389,600 | 6,255,811 |
| Miroku Jyoho Service Co., Ltd. | | 428,300 | 11,289,092 |
| Misumi Group, Inc. | | 1,264,500 | 31,787,965 |
| Mitsuboshi Belting Ltd. | | 425,500 | 8,006,201 |
| Nabtesco Corp. | | 850,100 | 27,062,766 |
| Nagaileben Co. Ltd. | | 1,591,800 | 37,945,739 |
| Nichias Corp. | | 205,700 | 4,339,477 |
| Nihon Parkerizing Co. Ltd. | | 4,549,300 | 53,340,443 |
| Nitto Kohki Co. Ltd. | | 204,900 | 4,419,665 |
| NOF Corp. | | 120,000 | 4,053,487 |
| NS Tool Co. Ltd. | | 518,100 | 10,101,364 |
| OBIC Co. Ltd. | | 663,200 | 83,036,103 |
| Okamoto Industries, Inc. | | 210,800 | 8,141,021 |
| OSG Corp. | | 2,343,500 | 50,126,276 |
| PALTAC Corp. | | 200,200 | 9,654,746 |
| Paramount Bed Holdings Co. Ltd. | | 908,710 | 34,746,358 |
| ProNexus, Inc. | | 1,008,300 | 11,831,282 |
| Raiznext Corp. | | 138,200 | 1,404,041 |
| S Foods, Inc. | | 177,100 | 4,771,511 |
| San-Ai Oil Co. Ltd. | | 2,420,800 | 25,343,960 |
| SCSK Corp. | | 110,400 | 5,619,843 |
| Sekisui Jushi Corp. | | 231,300 | 4,736,351 |
| Shinsei Bank Ltd. | | 608,631 | 9,488,406 |
| SHO-BOND Holdings Co. Ltd. | | 1,387,200 | 53,837,870 |
| Shoei Co. Ltd. (b) | | 948,200 | 41,274,923 |
| SK Kaken Co. Ltd. | | 47,500 | 20,283,850 |
| Software Service, Inc. | | 232,300 | 25,043,949 |
| Sushiro Global Holdings Ltd. | | 82,200 | 5,651,495 |
| Techno Medica Co. Ltd. | | 283,000 | 5,880,339 |
| The Monogatari Corp. | | 152,300 | 13,153,310 |
| TKC Corp. | | 411,900 | 17,351,693 |
| Tocalo Co. Ltd. | | 1,495,000 | 14,738,717 |
| Toshiba Plant Systems & Services Corp. | | 185,700 | 3,628,353 |
| Tsuruha Holdings, Inc. | | 48,270 | 5,429,823 |
| USS Co. Ltd. | | 3,304,200 | 63,996,383 |
| Welcia Holdings Co. Ltd. | | 427,385 | 24,557,664 |
| Workman Co. Ltd. (d) | | 328,000 | 23,215,627 |
| Yamato Kogyo Co. Ltd. | | 301,500 | 7,821,415 |
| Yuasa Trading Co. Ltd. | | 121,900 | 3,781,682 |
|
| TOTAL JAPAN | | | 1,264,730,523 |
|
| Korea (South) - 0.7% | | | |
| BGF Retail Co. Ltd. | | 115,410 | 17,553,752 |
| Leeno Industrial, Inc. | | 157,283 | 7,149,899 |
|
| TOTAL KOREA (SOUTH) | | | 24,703,651 |
|
| Luxembourg - 0.2% | | | |
| B&M European Value Retail SA | | 1,340,231 | 6,428,661 |
| Mexico - 0.1% | | | |
| Consorcio ARA S.A.B. de CV | | 21,222,120 | 3,993,662 |
| Genomma Lab Internacional SA de CV (a) | | 1,109,000 | 1,170,888 |
|
| TOTAL MEXICO | | | 5,164,550 |
|
| Netherlands - 2.6% | | | |
| Aalberts Industries NV | | 1,181,500 | 47,517,234 |
| Arcadis NV (d) | | 217,831 | 4,300,160 |
| Intertrust NV (c) | | 359,960 | 6,840,936 |
| PostNL NV | | 2,085,149 | 4,786,016 |
| RHI Magnesita NV | | 62,691 | 2,824,372 |
| RHI Magnesita NV | | 12,748 | 575,823 |
| Takeaway.com Holding BV (a)(c)(d) | | 168,878 | 13,749,523 |
| Van Lanschot NV (Bearer) | | 414,661 | 9,550,035 |
|
| TOTAL NETHERLANDS | | | 90,144,099 |
|
| New Zealand - 0.2% | | | |
| EBOS Group Ltd. | | 336,913 | 5,321,346 |
| Norway - 1.9% | | | |
| ABG Sundal Collier ASA | | 3,487,994 | 1,289,581 |
| Adevinta ASA: | | | |
| rights 11/12/19 (a) | | 128,966 | 19,718 |
| Class B | | 128,966 | 1,472,511 |
| Borregaard ASA | | 290,000 | 2,789,265 |
| Kongsberg Gruppen ASA | | 2,405,661 | 35,524,514 |
| Merkantildata ASA | | 600,000 | 7,581,434 |
| Schibsted ASA (A Shares) | | 79,266 | 2,327,259 |
| Skandiabanken ASA (c) | | 2,417,154 | 17,163,721 |
|
| TOTAL NORWAY | | | 68,168,003 |
|
| Philippines - 0.5% | | | |
| Jollibee Food Corp. | | 3,136,690 | 14,322,729 |
| Pilipinas Shell Petroleum Corp. | | 3,441,750 | 2,295,223 |
|
| TOTAL PHILIPPINES | | | 16,617,952 |
|
| Singapore - 0.1% | | | |
| Boustead Singapore Ltd. | | 8,135,700 | 4,658,398 |
| South Africa - 1.0% | | | |
| Clicks Group Ltd. | | 2,216,453 | 36,051,740 |
| Spain - 1.0% | | | |
| Fluidra SA (a) | | 119,800 | 1,496,465 |
| Prosegur Cash SA (c) | | 1,305,441 | 2,038,342 |
| Prosegur Compania de Seguridad SA (Reg.) | | 8,169,164 | 31,706,519 |
|
| TOTAL SPAIN | | | 35,241,326 |
|
| Sweden - 4.5% | | | |
| Addlife AB | | 962,156 | 21,523,628 |
| AddTech AB (B Shares) | | 1,465,310 | 40,746,475 |
| Fagerhult AB (d) | | 2,442,527 | 14,469,437 |
| Granges AB | | 215,000 | 2,088,611 |
| Lagercrantz Group AB (B Shares) | | 2,241,386 | 28,784,227 |
| Loomis AB (B Shares) | | 748,600 | 28,918,442 |
| MIPS AB | | 244,200 | 3,732,916 |
| Saab AB (B Shares) | | 524,350 | 16,166,513 |
|
| TOTAL SWEDEN | | | 156,430,249 |
|
| Switzerland - 1.3% | | | |
| EDAG Engineering Group AG (d) | | 53,141 | 657,877 |
| Tecan Group AG | | 145,663 | 34,433,463 |
| VZ Holding AG | | 33,825 | 9,429,169 |
|
| TOTAL SWITZERLAND | | | 44,520,509 |
|
| Taiwan - 0.4% | | | |
| Addcn Technology Co. Ltd. | | 1,655,570 | 13,516,851 |
| United Kingdom - 15.8% | | | |
| Alliance Pharma PLC | | 22,028,866 | 21,115,968 |
| Ascential PLC (c) | | 2,929,710 | 13,252,139 |
| Avon Rubber PLC | | 1,132,477 | 26,053,104 |
| Bodycote PLC | | 579,184 | 5,371,761 |
| Cineworld Group PLC | | 5,722,600 | 16,508,239 |
| Dechra Pharmaceuticals PLC | | 1,373,427 | 46,789,506 |
| DP Poland PLC (a)(b) | | 14,923,300 | 889,221 |
| Elementis PLC | | 15,677,268 | 30,197,325 |
| GetBusy PLC (a) | | 2,405,905 | 1,308,925 |
| Great Portland Estates PLC | | 2,474,288 | 25,243,123 |
| H&T Group PLC (b) | | 2,180,017 | 10,688,405 |
| Hill & Smith Holdings PLC | | 330,920 | 5,615,410 |
| Hilton Food Group PLC | | 1,028,638 | 13,537,654 |
| Howden Joinery Group PLC | | 1,950,100 | 14,585,482 |
| Informa PLC | | 1,810,738 | 18,177,931 |
| InterContinental Hotel Group PLC ADR | | 251,634 | 15,246,504 |
| ITE Group PLC | | 15,252,733 | 15,351,677 |
| LSL Property Services PLC | | 2,513,466 | 7,797,685 |
| Luxfer Holdings PLC sponsored | | 168,800 | 2,845,968 |
| Mears Group PLC | | 1,551,110 | 5,123,537 |
| Mitie Group PLC | | 1,594,262 | 3,271,162 |
| Naked Wines PLC (d) | | 705,510 | 2,344,108 |
| Network International Holdings PLC (c) | | 1,954,000 | 13,693,326 |
| Polypipe Group PLC | | 222,314 | 1,304,524 |
| Rightmove PLC | | 4,510,370 | 34,973,251 |
| Shaftesbury PLC | | 1,289,155 | 15,780,620 |
| Spectris PLC | | 2,215,461 | 68,645,554 |
| Spirax-Sarco Engineering PLC | | 703,928 | 72,262,776 |
| Ted Baker PLC | | 607,423 | 3,199,232 |
| Ten Entertainment Group PLC | | 818,000 | 2,717,864 |
| Topps Tiles PLC | | 9,714,845 | 9,475,846 |
| Tullett Prebon PLC | | 2,066,753 | 9,180,011 |
| Ultra Electronics Holdings PLC | | 828,300 | 20,922,299 |
|
| TOTAL UNITED KINGDOM | | | 553,470,137 |
|
| United States of America - 2.1% | | | |
| Autoliv, Inc. (d) | | 132,700 | 10,329,368 |
| Martin Marietta Materials, Inc. | | 54,580 | 14,295,048 |
| Morningstar, Inc. | | 83,500 | 13,513,640 |
| PriceSmart, Inc. | | 212,568 | 15,751,289 |
| ResMed, Inc. | | 135,400 | 20,028,368 |
|
| TOTAL UNITED STATES OF AMERICA | | | 73,917,713 |
|
| TOTAL COMMON STOCKS | | | |
| (Cost $2,260,137,469) | | | 3,203,643,502 |
|
| Nonconvertible Preferred Stocks - 1.0% | | | |
| Brazil - 0.2% | | | |
| Banco ABC Brasil SA | | 1,856,743 | 8,351,987 |
| Germany - 0.8% | | | |
| Sartorius AG (non-vtg.) | | 136,355 | 26,491,767 |
| TOTAL NONCONVERTIBLE PREFERRED STOCKS | | | |
| (Cost $11,118,099) | | | 34,843,754 |
|
| Money Market Funds - 8.0% | | | |
| Fidelity Cash Central Fund 1.83% (e) | | 235,983,335 | 236,030,531 |
| Fidelity Securities Lending Cash Central Fund 1.84% (e)(f) | | 45,282,361 | 45,286,889 |
| TOTAL MONEY MARKET FUNDS | | | |
| (Cost $281,316,460) | | | 281,317,420 |
| TOTAL INVESTMENT IN SECURITIES - 100.6% | | | |
| (Cost $2,552,572,028) | | | 3,519,804,676 |
| NET OTHER ASSETS (LIABILITIES) - (0.6)% | | | (21,740,494) |
| NET ASSETS - 100% | | | $3,498,064,182 |
Categorizations in the Schedule of Investments are based on country or territory of incorporation.
Legend
(a) Non-income producing
(b) Affiliated company
(c) Security exempt from registration under Rule 144A of the Securities Act of 1933. These securities may be resold in transactions exempt from registration, normally to qualified institutional buyers. At the end of the period, the value of these securities amounted to $115,972,307 or 3.3% of net assets.
(d) Security or a portion of the security is on loan at period end.
(e) Affiliated fund that is generally available only to investment companies and other accounts managed by Fidelity Investments. The rate quoted is the annualized seven-day yield of the fund at period end. A complete unaudited listing of the fund's holdings as of its most recent quarter end is available upon request. In addition, each Fidelity Central Fund's financial statements, which are not covered by the Fund's Report of Independent Registered Public Accounting Firm, are available on the SEC's website or upon request.
(f) Investment made with cash collateral received from securities on loan.
Affiliated Central Funds
Information regarding fiscal year to date income earned by the Fund from investments in Fidelity Central Funds is as follows:
| Fund | Income earned |
| Fidelity Cash Central Fund | $5,035,862 |
| Fidelity Securities Lending Cash Central Fund | 834,376 |
| Total | $5,870,238 |
Amounts in the income column in the above table include any capital gain distributions from underlying funds, which are presented in the corresponding line-item in the Statement of Operations, if applicable. Amount for Fidelity Securities Lending Cash Central Fund represents the income earned on investing cash collateral, less rebates paid to borrowers and any lending agent fees associated with the loan, plus any premium payments received for lending certain types of securities.
Other Affiliated Issuers
An affiliated company is a company in which the Fund has ownership of at least 5% of the voting securities. Fiscal year to date transactions with companies which are or were affiliates are as follows:
| Affiliate | Value, beginning of period | Purchases | Sales Proceeds | Dividend Income | Realized Gain (loss) | Change in Unrealized appreciation (depreciation) | Value, end of period |
| DP Poland PLC | $2,732,613 | $622,802 | $-- | $-- | $-- | $(2,466,194) | $889,221 |
| H&T Group PLC | 4,445,856 | 3,522,444 | -- | 279,968 | -- | 2,720,105 | 10,688,405 |
| Ituran Location & Control Ltd. | 42,223,022 | 5,049,914 | 8,488,001 | 839,444 | (417,139) | (10,295,836) | -- |
| Reckon Ltd. | 3,045,276 | -- | -- | 120,175 | -- | 49,834 | 3,095,110 |
| Shoei Co. Ltd. | 35,572,615 | 1,229,645 | -- | 781,982 | -- | 4,472,663 | 41,274,923 |
| Total | $88,019,382 | $10,424,805 | $8,488,001 | $2,021,569 | $(417,139) | $(5,519,428) | $55,947,659 |
Investment Valuation
The following is a summary of the inputs used, as of October 31, 2019, involving the Fund's assets and liabilities carried at fair value. The inputs or methodology used for valuing securities may not be an indication of the risk associated with investing in those securities. For more information on valuation inputs, and their aggregation into the levels used below, please refer to the Investment Valuation section in the accompanying Notes to Financial Statements.
| | Valuation Inputs at Reporting Date: |
| Description | Total | Level 1 | Level 2 | Level 3 |
| Investments in Securities: | | | | |
| Equities: | | | | |
| Communication Services | $183,685,651 | $149,972,178 | $33,713,473 | $-- |
| Consumer Discretionary | 353,187,239 | 108,500,628 | 244,686,611 | -- |
| Consumer Staples | 284,528,066 | 146,238,010 | 138,290,056 | -- |
| Energy | 80,552,625 | 51,509,401 | 29,043,224 | -- |
| Financials | 206,281,319 | 166,167,133 | 40,114,186 | -- |
| Health Care | 454,587,296 | 326,016,254 | 128,571,042 | -- |
| Industrials | 774,084,902 | 490,203,710 | 283,881,192 | -- |
| Information Technology | 569,451,452 | 247,480,282 | 321,971,170 | -- |
| Materials | 193,352,387 | 80,869,303 | 112,483,084 | -- |
| Real Estate | 134,609,248 | 87,433,398 | 47,175,850 | -- |
| Utilities | 4,167,071 | 4,167,071 | -- | -- |
| Money Market Funds | 281,317,420 | 281,317,420 | -- | -- |
| Total Investments in Securities: | $3,519,804,676 | $2,139,874,788 | $1,379,929,888 | $-- |
See accompanying notes which are an integral part of the financial statements.
Fidelity® Series International Small Cap Fund
Financial Statements
Statement of Assets and Liabilities
| | | October 31, 2019 |
| Assets | | |
Investment in securities, at value (including securities loaned of $43,613,924) — See accompanying schedule:
Unaffiliated issuers (cost $2,235,162,759) | $3,182,539,597 | |
| Fidelity Central Funds (cost $281,316,460) | 281,317,420 | |
| Other affiliated issuers (cost $36,092,809) | 55,947,659 | |
| Total Investment in Securities (cost $2,552,572,028) | | $3,519,804,676 |
| Foreign currency held at value (cost $112,214) | | 112,214 |
| Receivable for investments sold | | 4,930,852 |
| Receivable for fund shares sold | | 12,125,108 |
| Dividends receivable | | 13,414,213 |
| Distributions receivable from Fidelity Central Funds | | 399,996 |
| Other receivables | | 1,016 |
| Total assets | | 3,550,788,075 |
| Liabilities | | |
| Payable to custodian bank | $203,404 | |
| Payable for investments purchased | 5,676,011 | |
| Payable for fund shares redeemed | 398,932 | |
| Other payables and accrued expenses | 1,160,263 | |
| Collateral on securities loaned | 45,285,283 | |
| Total liabilities | | 52,723,893 |
| Net Assets | | $3,498,064,182 |
| Net Assets consist of: | | |
| Paid in capital | | $2,419,818,637 |
| Total accumulated earnings (loss) | | 1,078,245,545 |
| Net Assets, for 209,398,449 shares outstanding | | $3,498,064,182 |
| Net Asset Value, offering price and redemption price per share ($3,498,064,182 ÷ 209,398,449 shares) | | $16.71 |
See accompanying notes which are an integral part of the financial statements.
Statement of Operations
| | | Year ended October 31, 2019 |
| Investment Income | | |
| Dividends (including $2,021,569 earned from other affiliated issuers) | | $70,482,601 |
| Non-Cash dividends | | 7,314,165 |
| Income from Fidelity Central Funds (including $834,376 from security lending) | | 5,870,238 |
| Income before foreign taxes withheld | | 83,667,004 |
| Less foreign taxes withheld | | (6,900,796) |
| Total income | | 76,766,208 |
| Expenses | | |
| Custodian fees and expenses | $313,740 | |
| Independent trustees' fees and expenses | 18,849 | |
| Commitment fees | 8,867 | |
| Total expenses | | 341,456 |
| Net investment income (loss) | | 76,424,752 |
| Realized and Unrealized Gain (Loss) | | |
| Net realized gain (loss) on: | | |
| Investment securities: | | |
| Unaffiliated issuers | 86,223,842 | |
| Fidelity Central Funds | (731) | |
| Other affiliated issuers | (417,139) | |
| Foreign currency transactions | 185,178 | |
| Total net realized gain (loss) | | 85,991,150 |
| Change in net unrealized appreciation (depreciation) on: | | |
| Investment securities: | | |
| Unaffiliated issuers (net of increase in deferred foreign taxes of $472,393) | 255,711,950 | |
| Fidelity Central Funds | 960 | |
| Other affiliated issuers | (5,519,428) | |
| Assets and liabilities in foreign currencies | 53,547 | |
| Total change in net unrealized appreciation (depreciation) | | 250,247,029 |
| Net gain (loss) | | 336,238,179 |
| Net increase (decrease) in net assets resulting from operations | | $412,662,931 |
See accompanying notes which are an integral part of the financial statements.
Statement of Changes in Net Assets
| | Year ended October 31, 2019 | Year ended October 31, 2018 |
| Increase (Decrease) in Net Assets | | |
| Operations | | |
| Net investment income (loss) | $76,424,752 | $74,161,206 |
| Net realized gain (loss) | 85,991,150 | 257,652,301 |
| Change in net unrealized appreciation (depreciation) | 250,247,029 | (436,355,573) |
| Net increase (decrease) in net assets resulting from operations | 412,662,931 | (104,542,066) |
| Distributions to shareholders | (309,676,762) | (218,105,422) |
| Share transactions | | |
| Proceeds from sales of shares | 414,945,342 | 326,419,558 |
| Reinvestment of distributions | 309,676,761 | 218,105,422 |
| Cost of shares redeemed | (555,046,399) | (568,536,120) |
| Net increase (decrease) in net assets resulting from share transactions | 169,575,704 | (24,011,140) |
| Total increase (decrease) in net assets | 272,561,873 | (346,658,628) |
| Net Assets | | |
| Beginning of period | 3,225,502,309 | 3,572,160,937 |
| End of period | $3,498,064,182 | $3,225,502,309 |
| Other Information | | |
| Shares | | |
| Sold | 26,523,897 | 18,009,758 |
| Issued in reinvestment of distributions | 21,746,964 | 12,463,167 |
| Redeemed | (35,158,696) | (30,732,361) |
| Net increase (decrease) | 13,112,165 | (259,436) |
See accompanying notes which are an integral part of the financial statements.
Financial Highlights
Fidelity Series International Small Cap Fund
| | | | | | |
| Years ended October 31, | 2019 | 2018 | 2017 | 2016 | 2015 |
| Selected Per–Share Data | | | | | |
| Net asset value, beginning of period | $16.43 | $18.17 | $15.02 | $16.11 | $15.21 |
| Income from Investment Operations | | | | | |
| Net investment income (loss)A | .36 | .38 | .25 | .15 | .14 |
| Net realized and unrealized gain (loss) | 1.47 | (.99) | 3.47 | (.13) | 1.10 |
| Total from investment operations | 1.83 | (.61) | 3.72 | .02 | 1.24 |
| Distributions from net investment income | (.37) | (.29) | (.15) | (.15) | (.14) |
| Distributions from net realized gain | (1.18) | (.85) | (.42) | (.96) | (.20) |
| Total distributions | (1.55) | (1.13)B | (.57) | (1.11) | (.34) |
| Net asset value, end of period | $16.71 | $16.43 | $18.17 | $15.02 | $16.11 |
| Total ReturnC | 12.77% | (3.72)% | 25.87% | .02% | 8.36% |
| Ratios to Average Net AssetsD,E | | | | | |
| Expenses before reductions | .01% | .01% | .56% | 1.06% | 1.10% |
| Expenses net of fee waivers, if any | .01% | .01% | .56% | 1.06% | 1.10% |
| Expenses net of all reductions | .01% | .01% | .55% | 1.05% | 1.10% |
| Net investment income (loss) | 2.28% | 2.08% | 1.52% | 1.01% | .89% |
| Supplemental Data | | | | | |
| Net assets, end of period (000 omitted) | $3,498,064 | $3,225,502 | $3,572,161 | $1,303,650 | $1,276,570 |
| Portfolio turnover rateF | 23% | 14% | 21% | 21% | 16% |
A Calculated based on average shares outstanding during the period.
B Total distributions of $1.13 per share is comprised of distributions from net investment income of $.285 and distributions from net realized gain of $.848 per share.
C Total returns would have been lower if certain expenses had not been reduced during the applicable periods shown.
D Fees and expenses of any underlying Fidelity Central Funds are not included in the Fund's expense ratio. The Fund indirectly bears its proportionate share of the expenses of any underlying Fidelity Central Funds.
E Expense ratios reflect operating expenses of the Fund. Expenses before reductions do not reflect amounts reimbursed by the investment adviser or reductions from brokerage service arrangements or reductions from other expense offset arrangements and do not represent the amount paid by the Fund during periods when reimbursements or reductions occur. Expenses net of fee waivers reflect expenses after reimbursement by the investment adviser but prior to reductions from brokerage service arrangements or other expense offset arrangements. Expenses net of all reductions represent the net expenses paid by the Fund.
F Amount does not include the portfolio activity of any underlying Fidelity Central Funds.
See accompanying notes which are an integral part of the financial statements.
Fidelity® Series International Value Fund
Performance: The Bottom Line
Average annual total return reflects the change in the value of an investment, assuming reinvestment of distributions from dividend income and capital gains (the profits earned upon the sale of securities that have grown in value, if any) and assuming a constant rate of performance each year. The hypothetical investment and the average annual total returns do not reflect the deduction of taxes that a shareholder would pay on fund distributions or the redemption of fund shares. During periods of reimbursement by Fidelity, a fund’s total return will be greater than it would be had the reimbursement not occurred. How a fund did yesterday is no guarantee of how it will do tomorrow.
Average Annual Total Returns
| For the periods ended October 31, 2019 | Past 1 year | Past 5 years | Life of fundA |
| Fidelity® Series International Value Fund | 5.48% | 2.05% | 2.81% |
A From December 3, 2009
$10,000 Over Life of Fund
Let's say hypothetically that $10,000 was invested in Fidelity® Series International Value Fund on December 3, 2009, when the fund started.
The chart shows how the value of your investment would have changed, and also shows how the MSCI EAFE Value Index performed over the same period.
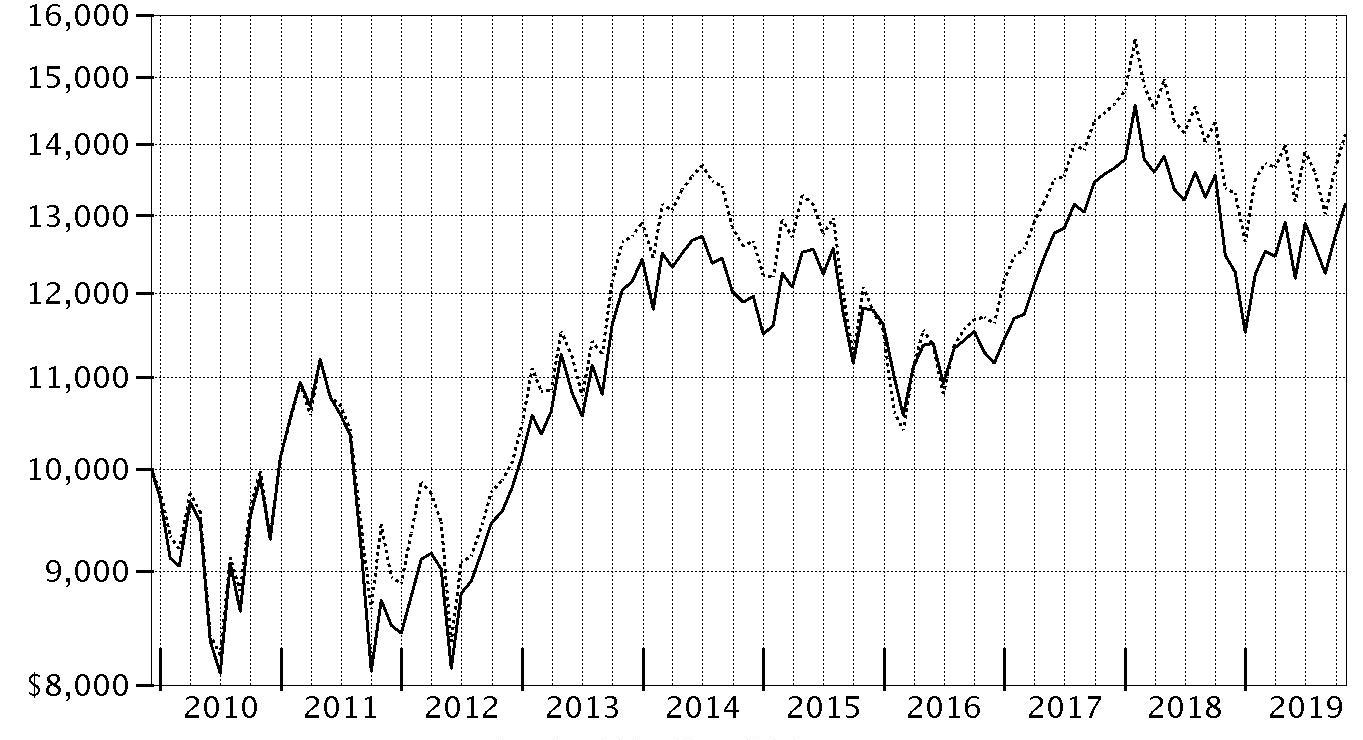
| Period Ending Values |
| $13,160 | Fidelity® Series International Value Fund |
| $14,150 | MSCI EAFE Value Index |
Fidelity® Series International Value Fund
Management's Discussion of Fund Performance
Market Recap: The MSCI ACWI (All Country World Index) ex USA Index gained 11.47% for the 12 months ending October 31, 2019, as international stocks reflected a confluence of factors, including escalating trade tension, and moderating but still positive global economic growth. Currency fluctuations were largely modest and varied by region, muting the overall impact on international equity returns. In late December, the U.S. Federal Reserve shifted from raising interest rates to a more dovish policy in 2019, joining many foreign central banks. In June, international stocks rose 6.03%, as policy stimulus in China stabilized that country’s economic growth. The Fed cut its policy rate in July for the first time since 2008. However, the index returned -1.21% for the month, followed by -3.08% in August. In September, the Fed cut its policy rate another quarter point, citing concerns about slowing economic growth and muted inflation, and did the same in October, leading to monthly gains of 2.59% and 3.49%, respectively. For the full 12 months, the growth-oriented information technology sector (+22%) led the way, followed by utilities (+20%) and real estate (+18%), two high-dividend-yielding categories. Conversely, energy was roughly flat, while materials (+6%) and communication services (7%) also lagged. By region, Asia Pacific ex Japan (+16%), Europe ex U.K (+13%), Canada (+12%) and emerging markets (+12%) fared best. Meanwhile, the U.K. (+7%) and Japan (+10%) trailed the broader market.
Comments from Portfolio Manager Alexander Zavratsky: For the year, the fund gained 5.48%, modestly trailing the 5.80% advance of the MSCI EAFE Value Index. From a sector standpoint, the portfolio’s positioning among consumer discretionary and energy stocks hurt the most. Underweighting the top-performing utilities and real estate sectors also detracted. These negatives overshadowed the positive impact of investment choices in information technology and materials. Geographically, the fund’s exposure to Europe, security selection in Spain especially, along with picks in the U.K., notably weighed on performance. In contrast, choices in Japan were the most helpful. Among individual stocks, not owning index component Iberdrola hurt more than any other stock choice. Shares of the Spanish renewable energy firm gained about 52% during the past 12 months, boosted by strong earnings on the back of growth in international markets. Another relative detractor was the portfolio’s overweight stake in Nordic-Baltic bank Swedbank (-31%), which fell sharply in February amid reports that the bank was involved in a massive money-laundering scandal. Swedbank subsequently fired its CEO in March, however the stock dropped considerably again, and trailed for the rest of the period. Conversely, throughout the period, Japanese multinational Hoya (+58%) – a supplier of electronics products to the semiconductor industry – executed well and benefitted from the ongoing structural-growth in extreme ultraviolet lithography (EUV) technology, further propelling the fund’s relative result. Shin-Etsu Chemical (+37%), the largest chemical firm in Japan and another out-of-benchmark holding, also contributed.
The views expressed above reflect those of the portfolio manager(s) only through the end of the period as stated on the cover of this report and do not necessarily represent the views of Fidelity or any other person in the Fidelity organization. Any such views are subject to change at any time based upon market or other conditions and Fidelity disclaims any responsibility to update such views. These views may not be relied on as investment advice and, because investment decisions for a Fidelity fund are based on numerous factors, may not be relied on as an indication of trading intent on behalf of any Fidelity fund.
Fidelity® Series International Value Fund
Investment Summary (Unaudited)
Geographic Diversification (% of fund's net assets)
| As of October 31, 2019 |
| | Japan | 25.5% |
| | United Kingdom | 17.1% |
| | France | 14.5% |
| | Germany | 12.5% |
| | Italy | 4.4% |
| | Switzerland | 3.9% |
| | Spain | 3.2% |
| | Sweden | 2.9% |
| | Australia | 2.8% |
| | Other* | 13.2% |

* Includes Short-Term investments and Net Other Assets (Liabilities).
Percentages are based on country or territory of incorporation and are adjusted for the effect of futures contracts, if applicable.
Asset Allocation as of October 31, 2019
| | % of fund's net assets |
| Stocks | 99.1 |
| Short-Term Investments and Net Other Assets (Liabilities) | 0.9 |
Top Ten Stocks as of October 31, 2019
| | % of fund's net assets |
| BP PLC (United Kingdom, Oil, Gas & Consumable Fuels) | 3.3 |
| Toyota Motor Corp. (Japan, Automobiles) | 3.1 |
| Total SA (France, Oil, Gas & Consumable Fuels) | 3.1 |
| BHP Billiton PLC (United Kingdom, Metals & Mining) | 3.0 |
| Enel SpA (Italy, Electric Utilities) | 2.1 |
| Banco Santander SA (Spain) (Spain, Banks) | 2.1 |
| Zurich Insurance Group Ltd. (Switzerland, Insurance) | 2.0 |
| AXA SA (France, Insurance) | 1.9 |
| VINCI SA (France, Construction & Engineering) | 1.9 |
| Sanofi SA (France, Pharmaceuticals) | 1.9 |
| | 24.4 |
Top Market Sectors as of October 31, 2019
| | % of fund's net assets |
| Financials | 37.1 |
| Industrials | 9.7 |
| Energy | 9.6 |
| Materials | 9.1 |
| Health Care | 7.7 |
| Consumer Discretionary | 7.7 |
| Information Technology | 7.1 |
| Communication Services | 3.6 |
| Utilities | 3.1 |
| Real Estate | 2.3 |
Fidelity® Series International Value Fund
Schedule of Investments October 31, 2019
Showing Percentage of Net Assets
| Common Stocks - 97.8% | | | |
| | | Shares | Value |
| Australia - 2.8% | | | |
| Commonwealth Bank of Australia | | 3,698,448 | $200,530,265 |
| Insurance Australia Group Ltd. | | 20,667,785 | 113,240,276 |
| Macquarie Group Ltd. | | 1,502,253 | 138,714,187 |
|
| TOTAL AUSTRALIA | | | 452,484,728 |
|
| Austria - 0.7% | | | |
| Erste Group Bank AG | | 3,018,700 | 106,625,166 |
| Bailiwick of Jersey - 1.3% | | | |
| Glencore Xstrata PLC | | 42,707,200 | 128,906,586 |
| WPP PLC | | 6,215,000 | 77,560,448 |
|
| TOTAL BAILIWICK OF JERSEY | | | 206,467,034 |
|
| Belgium - 1.2% | | | |
| KBC Groep NV | | 2,804,300 | 196,665,739 |
| Canada - 0.5% | | | |
| Nutrien Ltd. | | 1,556,980 | 74,485,848 |
| China - 0.6% | | | |
| Ping An Insurance Group Co. of China Ltd. (H Shares) | | 8,323,500 | 96,068,097 |
| Denmark - 0.8% | | | |
| A.P. Moller - Maersk A/S Series B | | 59,001 | 75,261,818 |
| ORSTED A/S (a) | | 590,000 | 51,753,150 |
|
| TOTAL DENMARK | | | 127,014,968 |
|
| Finland - 0.6% | | | |
| Sampo Oyj (A Shares) | | 2,291,713 | 93,914,057 |
| France - 14.5% | | | |
| ALTEN | | 309,700 | 34,005,458 |
| Atos Origin SA | | 1,037,984 | 80,554,497 |
| AXA SA | | 11,772,673 | 311,637,163 |
| Bouygues SA | | 2,367,798 | 100,350,595 |
| Capgemini SA | | 934,605 | 105,226,743 |
| Natixis SA | | 15,595,600 | 71,505,800 |
| Sanofi SA | | 3,225,490 | 297,348,749 |
| Societe Generale Series A | | 4,423,778 | 125,807,494 |
| SR Teleperformance SA | | 570,100 | 129,201,171 |
| Thales SA | | 839,300 | 82,037,288 |
| Total SA | | 9,386,173 | 496,230,500 |
| VINCI SA | | 2,654,037 | 297,780,776 |
| Vivendi SA | | 4,926,981 | 137,156,746 |
| Worldline SA (a)(b) | | 910,593 | 55,298,569 |
|
| TOTAL FRANCE | | | 2,324,141,549 |
|
| Germany - 11.2% | | | |
| Bayer AG | | 3,349,300 | 259,825,957 |
| Continental AG | | 789,300 | 105,719,513 |
| Daimler AG (Germany) | | 2,127,100 | 124,335,107 |
| Hannover Reuck SE | | 1,187,300 | 210,282,276 |
| HeidelbergCement Finance AG | | 2,289,000 | 170,075,644 |
| Linde PLC | | 1,008,500 | 199,367,265 |
| MTU Aero Engines Holdings AG | | 265,200 | 70,809,148 |
| Muenchener Rueckversicherungs-Gesellschaft AG in Muenchen | | 577,900 | 160,488,436 |
| Rheinmetall AG | | 845,900 | 101,749,171 |
| RWE AG | | 3,906,810 | 119,084,058 |
| SAP SE | | 709,911 | 94,064,260 |
| Vonovia SE | | 3,366,428 | 179,130,876 |
|
| TOTAL GERMANY | | | 1,794,931,711 |
|
| Indonesia - 0.4% | | | |
| PT Bank Rakyat Indonesia Tbk | | 228,975,300 | 68,609,076 |
| Ireland - 1.1% | | | |
| CRH PLC | | 4,954,970 | 180,409,391 |
| Italy - 4.4% | | | |
| Assicurazioni Generali SpA | | 7,122,900 | 144,385,297 |
| Enel SpA | | 43,026,700 | 333,472,597 |
| Intesa Sanpaolo SpA | | 48,431,900 | 121,361,927 |
| Mediobanca SpA | | 9,225,272 | 109,577,274 |
|
| TOTAL ITALY | | | 708,797,095 |
|
| Japan - 25.5% | | | |
| DENSO Corp. | | 3,268,400 | 151,751,554 |
| Fanuc Corp. | | 663,300 | 130,835,463 |
| Hitachi High-Technologies Corp. | | 1,652,400 | 102,805,346 |
| Hoya Corp. | | 2,042,900 | 180,545,843 |
| Ibiden Co. Ltd. | | 1,918,500 | 44,299,613 |
| Idemitsu Kosan Co. Ltd. | | 3,479,953 | 102,294,176 |
| Itochu Corp. | | 9,975,200 | 208,560,314 |
| Kao Corp. | | 1,494,000 | 120,115,639 |
| Minebea Mitsumi, Inc. | | 7,776,700 | 147,691,586 |
| Mitsubishi Estate Co. Ltd. | | 4,491,200 | 87,198,369 |
| Mitsubishi UFJ Financial Group, Inc. | | 47,122,300 | 244,295,588 |
| Mitsui Fudosan Co. Ltd. | | 4,380,500 | 112,065,624 |
| Nintendo Co. Ltd. | | 163,100 | 59,823,042 |
| OBIC Co. Ltd. | | 1,047,800 | 131,190,032 |
| Oracle Corp. Japan | | 1,201,500 | 105,607,256 |
| ORIX Corp. | | 12,094,900 | 190,070,077 |
| Recruit Holdings Co. Ltd. | | 2,194,100 | 72,918,815 |
| Shin-Etsu Chemical Co. Ltd. | | 1,798,100 | 200,490,365 |
| Shinsei Bank Ltd. | | 7,949,000 | 123,922,931 |
| SoftBank Corp. | | 841,400 | 32,365,642 |
| Sony Corp. | | 1,225,500 | 74,595,142 |
| Sony Financial Holdings, Inc. | | 6,650,085 | 143,066,258 |
| Sumitomo Mitsui Financial Group, Inc. | | 6,917,000 | 245,575,610 |
| Suzuki Motor Corp. | | 1,367,400 | 64,560,581 |
| Takeda Pharmaceutical Co. Ltd. | | 4,944,922 | 178,675,256 |
| Tokio Marine Holdings, Inc. | | 4,587,300 | 248,015,213 |
| Tokyo Electron Ltd. | | 417,000 | 84,483,608 |
| Toyota Motor Corp. | | 7,183,500 | 498,397,571 |
|
| TOTAL JAPAN | | | 4,086,216,514 |
|
| Korea (South) - 0.6% | | | |
| Samsung Electronics Co. Ltd. | | 2,234,480 | 96,230,671 |
| Netherlands - 2.5% | | | |
| AerCap Holdings NV (b) | | 1,935,800 | 112,044,104 |
| ING Groep NV (Certificaten Van Aandelen) | | 14,528,734 | 164,516,049 |
| Koninklijke Philips Electronics NV | | 2,805,093 | 123,070,982 |
|
| TOTAL NETHERLANDS | | | 399,631,135 |
|
| Portugal - 0.6% | | | |
| Galp Energia SGPS SA Class B | | 5,556,172 | 88,869,793 |
| Singapore - 1.0% | | | |
| United Overseas Bank Ltd. | | 8,142,200 | 160,299,103 |
| Spain - 3.2% | | | |
| Banco Santander SA (Spain) (c) | | 81,817,724 | 327,957,201 |
| Cellnex Telecom SA (a) | | 1,900,400 | 81,940,494 |
| Masmovil Ibercom SA (b) | | 3,025,160 | 69,908,471 |
| Unicaja Banco SA (a) | | 30,752,247 | 27,832,812 |
|
| TOTAL SPAIN | | | 507,638,978 |
|
| Sweden - 2.9% | | | |
| Ericsson (B Shares) | | 19,075,800 | 166,699,423 |
| Investor AB (B Shares) (c) | | 4,313,559 | 220,911,475 |
| Swedbank AB (A Shares) | | 4,945,900 | 69,176,113 |
|
| TOTAL SWEDEN | | | 456,787,011 |
|
| Switzerland - 3.9% | | | |
| Swiss Life Holding AG | | 280,571 | 140,271,279 |
| UBS Group AG | | 13,588,571 | 159,937,481 |
| Zurich Insurance Group Ltd. | | 819,315 | 320,168,203 |
|
| TOTAL SWITZERLAND | | | 620,376,963 |
|
| United Kingdom - 17.1% | | | |
| AstraZeneca PLC (United Kingdom) | | 2,053,580 | 200,259,512 |
| Aviva PLC | | 26,753,203 | 144,200,961 |
| Beazley PLC | | 8,038,100 | 61,067,276 |
| BHP Billiton PLC | | 22,910,029 | 485,934,068 |
| BP PLC | | 82,944,840 | 525,983,488 |
| British American Tobacco PLC (United Kingdom) | | 3,101,480 | 108,476,985 |
| Imperial Brands PLC | | 4,098,233 | 89,843,526 |
| Informa PLC | | 10,623,686 | 106,650,785 |
| Lloyds Banking Group PLC | | 350,794,860 | 258,047,416 |
| Micro Focus International PLC | | 2,574,293 | 35,332,725 |
| Royal Dutch Shell PLC Class B sponsored ADR | | 4,490,600 | 261,757,074 |
| RSA Insurance Group PLC | | 16,989,590 | 114,939,590 |
| Standard Chartered PLC (United Kingdom) | | 20,832,283 | 189,165,534 |
| Standard Life PLC | | 31,100,857 | 122,269,512 |
| The Weir Group PLC | | 1,706,507 | 29,764,703 |
|
| TOTAL UNITED KINGDOM | | | 2,733,693,155 |
|
| United States of America - 0.4% | | | |
| ConocoPhillips Co. | | 1,233,600 | 68,094,720 |
| TOTAL COMMON STOCKS | | | |
| (Cost $14,344,868,404) | | | 15,648,452,502 |
|
| Nonconvertible Preferred Stocks - 1.3% | | | |
| Germany - 1.3% | | | |
| Porsche Automobil Holding SE (Germany) | | | |
| (Cost $197,847,901) | | 2,775,924 | 204,393,059 |
|
| Money Market Funds - 1.8% | | | |
| Fidelity Cash Central Fund 1.83% (d) | | 62,032,864 | 62,045,271 |
| Fidelity Securities Lending Cash Central Fund 1.84% (d)(e) | | 229,323,287 | 229,346,219 |
| TOTAL MONEY MARKET FUNDS | | | |
| (Cost $291,391,490) | | | 291,391,490 |
| TOTAL INVESTMENT IN SECURITIES - 100.9% | | | |
| (Cost $14,834,107,795) | | | 16,144,237,051 |
| NET OTHER ASSETS (LIABILITIES) - (0.9)% | | | (151,840,578) |
| NET ASSETS - 100% | | | $15,992,396,473 |
Categorizations in the Schedule of Investments are based on country or territory of incorporation.
Legend
(a) Security exempt from registration under Rule 144A of the Securities Act of 1933. These securities may be resold in transactions exempt from registration, normally to qualified institutional buyers. At the end of the period, the value of these securities amounted to $216,825,025 or 1.4% of net assets.
(b) Non-income producing
(c) Security or a portion of the security is on loan at period end.
(d) Affiliated fund that is generally available only to investment companies and other accounts managed by Fidelity Investments. The rate quoted is the annualized seven-day yield of the fund at period end. A complete unaudited listing of the fund's holdings as of its most recent quarter end is available upon request. In addition, each Fidelity Central Fund's financial statements, which are not covered by the Fund's Report of Independent Registered Public Accounting Firm, are available on the SEC's website or upon request.
(e) Investment made with cash collateral received from securities on loan.
Affiliated Central Funds
Information regarding fiscal year to date income earned by the Fund from investments in Fidelity Central Funds is as follows:
| Fund | Income earned |
| Fidelity Cash Central Fund | $3,291,066 |
| Fidelity Securities Lending Cash Central Fund | 7,217,810 |
| Total | $10,508,876 |
Amounts in the income column in the above table include any capital gain distributions from underlying funds, which are presented in the corresponding line-item in the Statement of Operations, if applicable. Amount for Fidelity Securities Lending Cash Central Fund represents the income earned on investing cash collateral, less rebates paid to borrowers and any lending agent fees associated with the loan, plus any premium payments received for lending certain types of securities.
Investment Valuation
The following is a summary of the inputs used, as of October 31, 2019, involving the Fund's assets and liabilities carried at fair value. The inputs or methodology used for valuing securities may not be an indication of the risk associated with investing in those securities. For more information on valuation inputs, and their aggregation into the levels used below, please refer to the Investment Valuation section in the accompanying Notes to Financial Statements.
| | Valuation Inputs at Reporting Date: |
| Description | Total | Level 1 | Level 2 | Level 3 |
| Investments in Securities: | | | | |
| Equities: | | | | |
| Communication Services | $565,405,628 | $395,656,496 | $169,749,132 | $-- |
| Consumer Discretionary | 1,223,752,527 | 124,335,107 | 1,099,417,420 | -- |
| Consumer Staples | 318,436,150 | 89,843,526 | 228,592,624 | -- |
| Energy | 1,543,229,751 | 329,851,794 | 1,213,377,957 | -- |
| Financials | 5,945,118,212 | 2,638,286,874 | 3,306,831,338 | -- |
| Health Care | 1,239,726,299 | -- | 1,239,726,299 | -- |
| Industrials | 1,559,004,952 | 923,736,956 | 635,267,996 | -- |
| Information Technology | 1,135,798,201 | 290,761,441 | 845,036,760 | -- |
| Materials | 1,439,669,167 | 443,928,757 | 995,740,410 | -- |
| Real Estate | 378,394,869 | 179,130,876 | 199,263,993 | -- |
| Utilities | 504,309,805 | 170,837,208 | 333,472,597 | -- |
| Money Market Funds | 291,391,490 | 291,391,490 | -- | -- |
| Total Investments in Securities: | $16,144,237,051 | $5,877,760,525 | $10,266,476,526 | $-- |
See accompanying notes which are an integral part of the financial statements.
Fidelity® Series International Value Fund
Financial Statements
Statement of Assets and Liabilities
| | | October 31, 2019 |
| Assets | | |
Investment in securities, at value (including securities loaned of $217,100,122) — See accompanying schedule:
Unaffiliated issuers (cost $14,542,716,305) | $15,852,845,561 | |
| Fidelity Central Funds (cost $291,391,490) | 291,391,490 | |
| Total Investment in Securities (cost $14,834,107,795) | | $16,144,237,051 |
| Foreign currency held at value (cost $15,003) | | 15,010 |
| Receivable for fund shares sold | | 48,467,515 |
| Dividends receivable | | 85,713,853 |
| Distributions receivable from Fidelity Central Funds | | 121,128 |
| Total assets | | 16,278,554,557 |
| Liabilities | | |
| Payable for investments purchased | $24,749,122 | |
| Payable for fund shares redeemed | 31,688,797 | |
| Other payables and accrued expenses | 375,385 | |
| Collateral on securities loaned | 229,344,780 | |
| Total liabilities | | 286,158,084 |
| Net Assets | | $15,992,396,473 |
| Net Assets consist of: | | |
| Paid in capital | | $15,160,887,033 |
| Total accumulated earnings (loss) | | 831,509,440 |
| Net Assets, for 1,628,569,515 shares outstanding | | $15,992,396,473 |
| Net Asset Value, offering price and redemption price per share ($15,992,396,473 ÷ 1,628,569,515 shares) | | $9.82 |
See accompanying notes which are an integral part of the financial statements.
Statement of Operations
| | | Year ended October 31, 2019 |
| Investment Income | | |
| Dividends | | $649,047,300 |
| Income from Fidelity Central Funds (including $7,217,810 from security lending) | | 10,508,876 |
| Income before foreign taxes withheld | | 659,556,176 |
| Less foreign taxes withheld | | (50,783,573) |
| Total income | | 608,772,603 |
| Expenses | | |
| Custodian fees and expenses | $807,345 | |
| Independent trustees' fees and expenses | 80,118 | |
| Interest | 8,590 | |
| Commitment fees | 37,687 | |
| Total expenses before reductions | 933,740 | |
| Expense reductions | (1,275) | |
| Total expenses after reductions | | 932,465 |
| Net investment income (loss) | | 607,840,138 |
| Realized and Unrealized Gain (Loss) | | |
| Net realized gain (loss) on: | | |
| Investment securities: | | |
| Unaffiliated issuers | (614,524,753) | |
| Fidelity Central Funds | 43,191 | |
| Foreign currency transactions | (504,243) | |
| Total net realized gain (loss) | | (614,985,805) |
| Change in net unrealized appreciation (depreciation) on: | | |
| Investment securities: | | |
| Unaffiliated issuers | 847,345,270 | |
| Assets and liabilities in foreign currencies | 861,021 | |
| Total change in net unrealized appreciation (depreciation) | | 848,206,291 |
| Net gain (loss) | | 233,220,486 |
| Net increase (decrease) in net assets resulting from operations | | $841,060,624 |
See accompanying notes which are an integral part of the financial statements.
Statement of Changes in Net Assets
| | Year ended October 31, 2019 | Year ended October 31, 2018 |
| Increase (Decrease) in Net Assets | | |
| Operations | | |
| Net investment income (loss) | $607,840,138 | $531,754,980 |
| Net realized gain (loss) | (614,985,805) | 411,682,322 |
| Change in net unrealized appreciation (depreciation) | 848,206,291 | (2,130,990,429) |
| Net increase (decrease) in net assets resulting from operations | 841,060,624 | (1,187,553,127) |
| Distributions to shareholders | (506,747,337) | (460,693,678) |
| Share transactions | | |
| Proceeds from sales of shares | 2,440,637,033 | 1,724,408,564 |
| Reinvestment of distributions | 506,747,337 | 460,693,677 |
| Cost of shares redeemed | (1,319,977,575) | (1,299,313,186) |
| Net increase (decrease) in net assets resulting from share transactions | 1,627,406,795 | 885,789,055 |
| Total increase (decrease) in net assets | 1,961,720,082 | (762,457,750) |
| Net Assets | | |
| Beginning of period | 14,030,676,391 | 14,793,134,141 |
| End of period | $15,992,396,473 | $14,030,676,391 |
| Other Information | | |
| Shares | | |
| Sold | 262,484,972 | 165,958,157 |
| Issued in reinvestment of distributions | 57,913,981 | 43,750,587 |
| Redeemed | (141,800,099) | (121,273,736) |
| Net increase (decrease) | 178,598,854 | 88,435,008 |
See accompanying notes which are an integral part of the financial statements.
Financial Highlights
Fidelity Series International Value Fund
| | | | | | |
| Years ended October 31, | 2019 | 2018 | 2017 | 2016 | 2015 |
| Selected Per–Share Data | | | | | |
| Net asset value, beginning of period | $9.68 | $10.87 | $9.27 | $9.91 | $10.73 |
| Income from Investment Operations | | | | | |
| Net investment income (loss)A | .39 | .38 | .29 | .24 | .22 |
| Net realized and unrealized gain (loss) | .10 | (1.23) | 1.55 | (.68) | (.28) |
| Total from investment operations | .49 | (.85) | 1.84 | (.44) | (.06) |
| Distributions from net investment income | (.35) | (.31) | (.22) | (.20) | (.44) |
| Distributions from net realized gain | – | (.03) | (.02) | – | (.32) |
| Total distributions | (.35) | (.34) | (.24) | (.20) | (.76) |
| Net asset value, end of period | $9.82 | $9.68 | $10.87 | $9.27 | $9.91 |
| Total ReturnB | 5.48% | (8.11)% | 20.33% | (4.49)% | (.65)% |
| Ratios to Average Net AssetsC,D | | | | | |
| Expenses before reductions | .01% | .01% | .48% | .96% | .89% |
| Expenses net of fee waivers, if any | .01% | .01% | .47% | .96% | .89% |
| Expenses net of all reductions | .01% | - %E | .46% | .95% | .88% |
| Net investment income (loss) | 4.23% | 3.60% | 2.86% | 2.58% | 2.12% |
| Supplemental Data | | | | | |
| Net assets, end of period (000 omitted) | $15,992,396 | $14,030,676 | $14,793,134 | $5,774,976 | $5,556,957 |
| Portfolio turnover rateF | 41% | 43% | 51% | 45% | 44% |
A Calculated based on average shares outstanding during the period.
B Total returns would have been lower if certain expenses had not been reduced during the applicable periods shown.
C Fees and expenses of any underlying Fidelity Central Funds are not included in the Fund's expense ratio. The Fund indirectly bears its proportionate share of the expenses of any underlying Fidelity Central Funds.
D Expense ratios reflect operating expenses of the Fund. Expenses before reductions do not reflect amounts reimbursed by the investment adviser or reductions from brokerage service arrangements or reductions from other expense offset arrangements and do not represent the amount paid by the Fund during periods when reimbursements or reductions occur. Expenses net of fee waivers reflect expenses after reimbursement by the investment adviser but prior to reductions from brokerage service arrangements or other expense offset arrangements. Expenses net of all reductions represent the net expenses paid by the Fund.
E Amount represents less than .005%.
F Amount does not include the portfolio activity of any underlying Fidelity Central Funds.
See accompanying notes which are an integral part of the financial statements.
Notes to Financial Statements
For the period ended October 31, 2019
1. Organization.
Fidelity Series Emerging Markets Fund, Fidelity Series Emerging Markets Opportunities Fund, Fidelity Series International Growth Fund, Fidelity Series International Small Cap Fund, and Fidelity Series International Value Fund (the Funds) are funds of Fidelity Investment Trust (the Trust). The Trust is registered under the Investment Company Act of 1940, as amended (the 1940 Act), as an open-end management investment company organized as a Massachusetts business trust. Each Fund is authorized to issue an unlimited number of shares. Shares are offered only to certain other Fidelity funds and Fidelity managed 529 plans. Investments in emerging markets, if applicable, can be subject to social, economic, regulatory, and political uncertainties and can be extremely volatile.
2. Investments in Fidelity Central Funds.
The Funds invest in Fidelity Central Funds, which are open-end investment companies generally available only to other investment companies and accounts managed by the investment adviser and its affiliates. The Funds' Schedules of Investments list each of the Fidelity Central Funds held as of period end, if any, as an investment of each Fund, but do not include the underlying holdings of each Fidelity Central Fund. As an Investing Fund, each Fund indirectly bears its proportionate share of the expenses of the underlying Fidelity Central Funds.
The Money Market Central Funds seek preservation of capital and current income and are managed by Fidelity Investments Money Management, Inc. (FIMM), an affiliate of the investment adviser. Annualized expenses of the Money Market Central Funds as of their most recent shareholder report date ranged from less than .005% to .01%.
A complete unaudited list of holdings for each Fidelity Central Fund is available upon request or at the Securities and Exchange Commission (the SEC) website at www.sec.gov. In addition, the financial statements of the Fidelity Central Funds, which are not covered by the Funds' Report of Independent Registered Public Accounting Firm, are available on the SEC website or upon request.
3. Significant Accounting Policies.
Each Fund is an investment company and applies the accounting and reporting guidance of the Financial Accounting Standards Board (FASB) Accounting Standards Codification Topic 946 Financial Services – Investments Companies. The financial statements have been prepared in conformity with accounting principles generally accepted in the United States of America (GAAP), which require management to make certain estimates and assumptions at the date of the financial statements. Actual results could differ from those estimates. Subsequent events, if any, through the date that the financial statements were issued have been evaluated in the preparation of the financial statements. The following summarizes the significant accounting policies of the Funds:
Investment Valuation. Investments are valued as of 4:00 p.m. Eastern time on the last calendar day of the period. The Board of Trustees (the Board) has delegated the day to day responsibility for the valuation of each Fund's investments to the Fair Value Committee (the Committee) established by each Fund's investment adviser. In accordance with valuation policies and procedures approved by the Board, each Fund attempts to obtain prices from one or more third party pricing vendors or brokers to value its investments. When current market prices, quotations or currency exchange rates are not readily available or reliable, investments will be fair valued in good faith by the Committee, in accordance with procedures adopted by the Board. Factors used in determining fair value vary by investment type and may include market or investment specific events, changes in interest rates and credit quality. The frequency with which these procedures are used cannot be predicted and they may be utilized to a significant extent. The Committee oversees each Fund's valuation policies and procedures and reports to the Board on the Committee's activities and fair value determinations. The Board monitors the appropriateness of the procedures used in valuing each Fund's investments and ratifies the fair value determinations of the Committee.
Each Fund categorizes the inputs to valuation techniques used to value its investments into a disclosure hierarchy consisting of three levels as shown below:
- Level 1 – quoted prices in active markets for identical investments
- Level 2 – other significant observable inputs (including quoted prices for similar investments, interest rates, prepayment speeds, etc.)
- Level 3 – unobservable inputs (including the Fund's own assumptions based on the best information available)
Valuation techniques used to value each Fund's investments by major category are as follows:
Equity securities, including restricted securities, for which market quotations are readily available, are valued at the last reported sale price or official closing price as reported by a third party pricing vendor on the primary market or exchange on which they are traded and are categorized as Level 1 in the hierarchy. In the event there were no sales during the day or closing prices are not available, securities are valued at the last quoted bid price or may be valued using the last available price and are generally categorized as Level 2 in the hierarchy. For foreign equity securities, when market or security specific events arise, comparisons to the valuation of American Depositary Receipts (ADRs), futures contracts, Exchange-Traded Funds (ETFs) and certain indexes as well as quoted prices for similar securities may be used and would be categorized as Level 2 in the hierarchy. For equity securities, including restricted securities, where observable inputs are limited, assumptions about market activity and risk are used and these securities may be categorized as Level 3 in the hierarchy.
Debt securities, including restricted securities, are valued based on evaluated prices received from third party pricing vendors or from brokers who make markets in such securities. U.S. government and government agency obligations are valued by pricing vendors who utilize matrix pricing which considers yield or price of bonds of comparable quality, coupon, maturity and type or by broker-supplied prices. When independent prices are unavailable or unreliable, debt securities may be valued utilizing pricing methodologies which consider similar factors that would be used by third party pricing vendors. Debt securities are generally categorized as Level 2 in the hierarchy but may be Level 3 depending on the circumstances. ETFs are valued at their last sale price or official closing price as reported by a third party pricing vendor on the primary market or exchange on which they are traded and are categorized as Level 1 in the hierarchy. In the event there were no sales during the day but the exchange reports a closing bid level, ETFs are valued at the closing bid and would be categorized as Level 1 in the hierarchy. In the event there was no closing bid, ETFs may be valued by another method that the Board believes reflects fair value in accordance with the Board's fair value pricing policies and may be categorized as Level 2 in the hierarchy.
Futures contracts are valued at the settlement price established each day by the board of trade or exchange on which they are traded and are categorized as Level 1 in the hierarchy. Investments in open-end mutual funds, including the Fidelity Central Funds, are valued at their closing net asset value (NAV) each business day and are categorized as Level 1 in the hierarchy.
Changes in valuation techniques may result in transfers in or out of an assigned level within the disclosure hierarchy. The aggregate value of investments by input level as of October 31, 2019 is included at the end of each Fund's Schedule of Investments.
Foreign Currency. The Funds may use foreign currency contracts to facilitate transactions in foreign-denominated securities. Gains and losses from these transactions may arise from changes in the value of the foreign currency or if the counterparties do not perform under the contracts' terms.
Foreign-denominated assets, including investment securities, and liabilities are translated into U.S. dollars at the exchange rates at period end. Purchases and sales of investment securities, income and dividends received and expenses denominated in foreign currencies are translated into U.S. dollars at the exchange rate in effect on the transaction date.
The effects of exchange rate fluctuations on investments are included with the net realized and unrealized gain (loss) on investment securities. Other foreign currency transactions resulting in realized and unrealized gain (loss) are disclosed separately.
Investment Transactions and Income. For financial reporting purposes, the Funds' investment holdings and NAV include trades executed through the end of the last business day of the period. The NAV per share for processing shareholder transactions is calculated as of the close of business of the New York Stock Exchange (NYSE), normally 4:00 p.m. Eastern time and includes trades executed through the end of the prior business day. Gains and losses on securities sold are determined on the basis of identified cost and for certain Funds include proceeds received from litigation. Dividend income is recorded on the ex-dividend date, except for certain dividends from foreign securities where the ex-dividend date may have passed, which are recorded as soon as the Funds are informed of the ex-dividend date. Non-cash dividends included in dividend income, if any, are recorded at the fair market value of the securities received. Income and capital gain distributions from Fidelity Central Funds, if any, are recorded on the ex-dividend date. Certain distributions received by the Funds represent a return of capital or capital gain. The Funds determine the components of these distributions subsequent to the ex-dividend date, based upon receipt of tax filings or other correspondence relating to the underlying investment. These distributions are recorded as a reduction of cost of investments and/or as a realized gain. Large, non-recurring dividends recognized by the Funds are presented separately on the Statement of Operations as "Non-cash dividends" and the impact of these dividends is presented in the Financial Highlights. Interest income is accrued as earned and includes coupon interest and amortization of premium and accretion of discount on debt securities as applicable. Investment income is recorded net of foreign taxes withheld where recovery of such taxes is uncertain.
Expenses. Expenses directly attributable to a fund are charged to that fund. Expenses attributable to more than one fund are allocated among the respective funds on the basis of relative net assets or other appropriate methods. Expense estimates are accrued in the period to which they relate and adjustments are made when actual amounts are known.
Income Tax Information and Distributions to Shareholders. Each year, each Fund intends to qualify as a regulated investment company under Subchapter M of the Internal Revenue Code, including distributing substantially all of its taxable income and realized gains. As a result, no provision for U.S. Federal income taxes is required. As of October 31, 2019, each Fund did not have any unrecognized tax benefits in the financial statements; nor is each Fund aware of any tax positions for which it is reasonably possible that the total amounts of unrecognized tax benefits will significantly change in the next twelve months. Each Fund files a U.S. federal tax return, in addition to state and local tax returns as required. Each Fund's federal income tax returns are subject to examination by the Internal Revenue Service (IRS) for a period of three fiscal years after they are filed. State and local tax returns may be subject to examination for an additional fiscal year depending on the jurisdiction. Foreign taxes are provided for based on each Fund's understanding of the tax rules and rates that exist in the foreign markets in which it invests. Fidelity Series Emerging Markets Fund, Fidelity Series International Growth Fund and Fidelity Series International Small Cap Fund are subject to a tax imposed on capital gains by certain countries in which they invest. An estimated deferred tax liability for net unrealized appreciation on the applicable securities is included in Other payables and accrued expenses on each applicable Fund's Statement of Assets & Liabilities.
Distributions are declared and recorded on the ex-dividend date. Income and capital gain distributions are determined in accordance with income tax regulations, which may differ from GAAP.
Capital accounts within the financial statements are adjusted for permanent book-tax differences. These adjustments have no impact on net assets or the results of operations. Capital accounts are not adjusted for temporary book-tax differences which will reverse in a subsequent period.
Book-tax differences are primarily due to futures contracts, foreign currency transactions, certain foreign taxes, passive foreign investment companies (PFIC), market discount, capital loss carryforwards, certain deemed distributions and losses deferred due to wash sales.
As of period end, the cost and unrealized appreciation (depreciation) in securities, and derivatives if applicable, for federal income tax purposes were as follows for each Fund:
| | Tax cost | Gross unrealized appreciation | Gross unrealized depreciation | Net unrealized appreciation (depreciation) |
| Fidelity Series Emerging Markets Fund | $1,981,436,356 | $163,630,232 | $(174,718,168) | $(11,087,936) |
| Fidelity Series Emerging Markets Opportunities Fund | 15,034,837,189 | 4,161,753,314 | (738,799,509) | 3,422,953,805 |
| Fidelity Series International Growth Fund | 10,842,248,085 | 6,008,824,665 | (223,211,842) | 5,785,612,823 |
| Fidelity Series International Small Cap Fund | 2,592,198,669 | 1,137,302,516 | (209,696,509) | 927,606,007 |
| Fidelity Series International Value Fund | 15,017,527,992 | 2,117,450,879 | (990,741,820) | 1,126,709,059 |
The tax-based components of distributable earnings as of period end were as follows for each Fund:
| | Undistributed ordinary income | Undistributed long-term capital gain | Capital loss carryforward | Net unrealized appreciation (depreciation) on securities and other investments |
| Fidelity Series Emerging Markets Fund | $47,314,394 | $– | $(13,514,609) | $(11,058,773) |
| Fidelity Series Emerging Markets Opportunities Fund | 435,464,734 | – | (230,138,207) | 3,422,507,895 |
| Fidelity Series International Growth Fund | 342,914,684 | 261,318,474 | – | 5,785,634,121 |
| Fidelity Series International Small Cap Fund | 79,713,919 | 71,928,672 | – | 927,580,555 |
| Fidelity Series International Value Fund | 625,841,105 | – | (920,929,484) | 1,126,597,820 |
Capital loss carryforwards are only available to offset future capital gains of the Funds to the extent provided by regulations and may be limited. Under the Regulated Investment Company Modernization Act of 2010 (the Act), the Funds are permitted to carry forward capital losses incurred in taxable years beginning after December 22, 2010 for an unlimited period and such capital losses are required to be used prior to any losses that expire. The capital loss carryforward information presented below, including any applicable limitation, is estimated as of fiscal period end and is subject to adjustment.
| | No expiration | | |
| | Short-term | Long-term | Total capital loss carryforward |
| Fidelity Series Emerging Markets Fund | $(7,811,695) | $(5,702,914) | $(13,514,609) |
| Fidelity Series Emerging Markets Opportunities Fund | (159,803,498) | (70,334,709) | (230,138,207) |
| Fidelity Series International Value Fund | (678,176,887) | (242,752,597) | (920,929,484) |
The tax character of distributions paid was as follows:
| October 31, 2019 | | | |
| | Ordinary Income | Long-term Capital Gains | Total |
| Fidelity Series Emerging Markets Fund | $6,416,055 | $– | $6,416,055 |
| Fidelity Series Emerging Markets Opportunities Fund | 311,016,955 | 874,064,891 | 1,185,081,846 |
| Fidelity Series International Growth Fund | 265,068,295 | 659,438,197 | 924,506,492 |
| Fidelity Series International Small Cap Fund | 78,568,733 | 231,108,029 | 309,676,762 |
| Fidelity Series International Value Fund | 506,747,337 | – | 506,747,337 |
| October 31, 2018 | | | |
| | Ordinary Income | Long-term Capital Gains | Total |
| Fidelity Series Emerging Markets Opportunities Fund | $338,422,741 | $103,964,613 | $442,387,354 |
| Fidelity Series International Growth Fund | 236,238,796 | 224,426,856 | 460,665,652 |
| Fidelity Series International Small Cap Fund | 105,491,413 | 112,614,009 | 218,105,422 |
| Fidelity Series International Value Fund | 460,693,677 | – | 460,693,677 |
Restricted Securities. The Funds may invest in securities that are subject to legal or contractual restrictions on resale. These securities generally may be resold in transactions exempt from registration or to the public if the securities are registered. Disposal of these securities may involve time-consuming negotiations and expense, and prompt sale at an acceptable price may be difficult. Information regarding restricted securities is included at the end of each applicable Fund's Schedule of Investments.
4. Derivative Instruments.
Risk Exposures and the Use of Derivative Instruments. The Funds' investment objective allows the Funds to enter into various types of derivative contracts, including futures contracts. Derivatives are investments whose value is primarily derived from underlying assets, indices or reference rates and may be transacted on an exchange or over-the-counter (OTC). Derivatives may involve a future commitment to buy or sell a specified asset based on specified terms, to exchange future cash flows at periodic intervals based on a notional principal amount, or for one party to make one or more payments upon the occurrence of specified events in exchange for periodic payments from the other party.
The Funds used derivatives to increase returns and to manage exposure to certain risks as defined below. The success of any strategy involving derivatives depends on analysis of numerous economic factors, and if the strategies for investment do not work as intended, the Funds may not achieve their objectives.
The Funds' use of derivatives increased or decreased their exposure to the following risk:
| Equity Risk | Equity risk relates to the fluctuations in the value of financial instruments as a result of changes in market prices (other than those arising from interest rate risk or foreign exchange risk), whether caused by factors specific to an individual investment, its issuer, or all factors affecting all instruments traded in a market or market segment.
|
The Funds are also exposed to additional risks from investing in derivatives, such as liquidity risk and counterparty credit risk. Liquidity risk is the risk that the Funds will be unable to close out the derivative in the open market in a timely manner. Counterparty credit risk is the risk that the counterparty will not be able to fulfill its obligation to the Funds. Counterparty credit risk related to exchange-traded futures contracts may be mitigated by the protection provided by the exchange on which they trade.
Investing in derivatives may involve greater risks than investing in the underlying assets directly and, to varying degrees, may involve risk of loss in excess of any initial investment and collateral received and amounts recognized in the Statement of Assets and Liabilities. In addition, there may be the risk that the change in value of the derivative contract does not correspond to the change in value of the underlying instrument.
Futures Contracts. A futures contract is an agreement between two parties to buy or sell a specified underlying instrument for a fixed price at a specified future date. The Funds used futures contracts to manage their exposure to the stock market.
Upon entering into a futures contract, a fund is required to deposit either cash or securities (initial margin) with a clearing broker in an amount equal to a certain percentage of the face value of the contract. Futures contracts are marked-to-market daily and subsequent daily payments (variation margin) are made or received by a fund depending on the daily fluctuations in the value of the futures contracts and are recorded as unrealized appreciation or (depreciation). This receivable and/or payable, if any, is included in daily variation margin on futures contracts in the Statement of Assets and Liabilities. Realized gain or (loss) is recorded upon the expiration or closing of a futures contract. The net realized gain (loss) and change in net unrealized appreciation (depreciation) on futures contracts during the period is presented in the Statement of Operations.
Any open futures contracts at period end are presented in the Schedule of Investments under the caption "Futures Contracts". The notional amount at value reflects each contract's exposure to the underlying instrument or index at period end and is representative of volume of activity during the period. Securities deposited to meet initial margin requirements are identified in the Schedule of Investments.
5. Purchases and Sales of Investments.
Purchases and sales of securities, other than short-term securities, are noted in the table below.
| | Purchases ($) | Sales ($) |
| Fidelity Series Emerging Markets Fund | 1,302,337,224 | 733,863,631 |
| Fidelity Series Emerging Markets Opportunities Fund | 10,160,912,075 | 8,108,507,722 |
| Fidelity Series International Growth Fund | 3,441,733,457 | 3,441,883,699 |
| Fidelity Series International Small Cap Fund | 707,412,590 | 718,621,909 |
| Fidelity Series International Value Fund | 7,863,655,015 | 5,806,292,860 |
6. Fees and Other Transactions with Affiliates.
Management Fee. Fidelity Management & Research Company (the investment adviser) and its affiliates provide the Funds with investment management related services for which the Funds do not pay a management fee. Under the management contract, the investment adviser or an affiliate pays all ordinary operating expenses of the Funds, except custody fees, fees and expenses of the independent Trustees, and certain miscellaneous expenses such as proxy and shareholder meeting expenses.
Brokerage Commissions. Certain Funds placed a portion of their portfolio transactions with brokerage firms which are affiliates of the investment adviser. Brokerage commissions are included in net realized gain (loss) and change in net unrealized appreciation (depreciation) in the Statement of Operations. The commissions paid to these affiliated firms were as follows:
| | Amount |
| Fidelity Series Emerging Markets Fund | $3,858 |
| Fidelity Series Emerging Markets Opportunities Fund | 100,047 |
| Fidelity Series International Growth Fund | 9,613 |
| Fidelity Series International Small Cap Fund | 995 |
| Fidelity Series International Value Fund | 3,864 |
Interfund Lending Program. Pursuant to an Exemptive Order issued by the SEC, the Funds, along with other registered investment companies having management contracts with Fidelity Management & Research Company (FMR) or other affiliated entities of FMR, may participate in an interfund lending program. This program provides an alternative credit facility allowing the funds to borrow from, or lend money to, other participating affiliated funds. At period end, there were no interfund loans outstanding. Each applicable fund's activity in this program during the period for which loans were outstanding was as follows:
| | Borrower or Lender | Average Loan Balance | Weighted Average Interest Rate | Interest Expense |
| Fidelity Series International Value Fund | Borrower | $31,167,750 | 2.48% | $8,590 |
Interfund Trades. The Funds may purchase from or sell securities to other Fidelity Funds under procedures adopted by the Board. The procedures have been designed to ensure these interfund trades are executed in accordance with Rule 17a-7 of the 1940 Act. Interfund trades are included within the respective purchases and sales amounts shown in the Purchases and Sales of Investments note.
Prior Fiscal Year Affiliated Exchanges In-Kind. During the prior period, Fidelity Series Emerging Markets Fund received investments valued at $548,241,767 in exchange for 58,062,553 shares of Fidelity Series Emerging Markets Fund. The amount of in-kind exchanges is included in share transactions in the accompanying Statement of Changes in Net Assets. The Fidelity Series Emerging Markets Fund recognized no gain or loss for federal income tax purposes.
Other. During the period, the investment adviser reimbursed the Funds for certain losses as follows:
| | Amount |
| Fidelity Series Emerging Markets Opportunities Fund | $131,702 |
7. Committed Line of Credit.
Certain Funds participate with other funds managed by the investment adviser or an affiliate in a $4.25 billion credit facility (the "line of credit") to be utilized for temporary or emergency purposes to fund shareholder redemptions or for other short-term liquidity purposes. The participating funds have agreed to pay commitment fees on their pro-rata portion of the line of credit, which are reflected in Commitment fees on the Statement of Operations, and are as follows:
| Fidelity Series Emerging Markets Fund | $2,436 |
| Fidelity Series Emerging Markets Opportunities Fund | 39,829 |
| Fidelity Series International Growth Fund | 38,966 |
| Fidelity Series International Small Cap Fund | 8,867 |
| Fidelity Series International Value Fund | 37,687 |
During the period, the Funds did not borrow on this line of credit.
8. Security Lending.
Certain Funds lend portfolio securities from time to time in order to earn additional income. For equity securities, lending agents are used, including National Financial Services (NFS), an affiliate of the Funds. Pursuant to a securities lending agreement, NFS will receive a fee, which is capped at 9.9% of a Fund's daily lending revenue, for its services as lending agent. The Funds may lend securities to certain qualified borrowers, including NFS. On the settlement date of the loan, each applicable Fund receives collateral (in the form of U.S. Treasury obligations, letters of credit and/or cash) against the loaned securities and maintains collateral in an amount not less than 100% of the market value of the loaned securities during the period of the loan. The market value of the loaned securities is determined at the close of business of the Funds and any additional required collateral is delivered to the Funds on the next business day. The Funds or borrower may terminate the loan at any time, and if the borrower defaults on its obligation to return the securities loaned because of insolvency or other reasons, the Funds may apply collateral received from the borrower against the obligation. The Funds may experience delays and costs in recovering the securities loaned. Any cash collateral received is invested in the Fidelity Securities Lending Cash Central Fund. The value of loaned securities and cash collateral at period end are disclosed on each applicable Fund's Statement of Assets and Liabilities. Security lending income represents the income earned on investing cash collateral, less rebates paid to borrowers and any lending agent fees associated with the loan, plus any premium payments received for lending certain types of securities. Security lending income is presented on each applicable Fund's Statement of Operations as a component of income from Fidelity Central Funds. Affiliated security lending activity was as follows:
| | Total Security Lending Income Fees Paid to NFS | Security Lending Income From Securities Loaned to NFS | Value of Securities Loaned to NFS at Period End |
| Fidelity Series Emerging Markets Fund | $149 | $– | $– |
| Fidelity Series Emerging Markets Opportunities Fund | $81,414 | $8,508 | $– |
| Fidelity Series International Growth Fund | $20,129 | $826 | $– |
| Fidelity Series International Small Cap Fund | $290 | $– | $– |
9. Expense Reductions.
The investment adviser contractually agreed to reimburse each Fund to the extent annual operating expenses exceeded certain levels of average net assets as noted in the table below. This reimbursement will remain in place through February 28, 2023. Some expenses, for example the compensation of the independent Trustees, and certain miscellaneous expenses such as proxy and shareholder meeting expenses, are excluded from this reimbursement.
The following Funds were in reimbursement during the period:
| | Expense Limitations | Reimbursement |
| Fidelity Series Emerging Markets Fund | .014% | $487,499 |
| Fidelity Series Emerging Markets Opportunities Fund | .014% | $3,661,237 |
In addition, through arrangements with each applicable Fund's custodian, credits realized as a result of certain uninvested cash balances were used to reduce each applicable Fund's expenses. All of the applicable expense reductions are noted in the table below.
| | Custodian credits |
| Fidelity Series Emerging Markets Fund | $156 |
| Fidelity Series International Growth Fund | 2,106 |
| Fidelity Series International Value Fund | 1,275 |
10. Other.
The Funds' organizational documents provide former and current trustees and officers with a limited indemnification against liabilities arising in connection with the performance of their duties to the Funds. In the normal course of business, the Funds may also enter into contracts that provide general indemnifications. The Funds' maximum exposure under these arrangements is unknown as this would be dependent on future claims that may be made against the Funds. The risk of material loss from such claims is considered remote.
At the end of the period, mutual funds and accounts managed by the investment adviser or its affiliates were the owners of record of all of the outstanding shares of the Funds.
Report of Independent Registered Public Accounting Firm
To the Trustees of Fidelity Investment Trust and Shareholders of Fidelity Series Emerging Markets Fund, Fidelity Series Emerging Markets Opportunities Fund, Fidelity Series International Small Cap Fund and Fidelity Series International Value Fund:
Opinion on the Financial Statements and Financial Highlights
We have audited the accompanying statements of assets and liabilities of Fidelity Series Emerging Markets Fund, Fidelity Series Emerging Markets Opportunities Fund, Fidelity Series International Small Cap Fund and Fidelity Series International Value Fund (the "Funds"), each a fund of Fidelity Investment Trust, including the schedules of investments, as of October 31, 2019, the related statements of operations for the year then ended, the statements of changes in net assets for each of the two years in the period then ended, and the financial highlights for each of the five years in the period then ended, except for Fidelity Series Emerging Markets Fund; the related statement of operations for the year then ended, and the statement of changes in net assets and the financial highlights for the year then ended and for the period from August 29, 2018 (commencement of operations) to October 31, 2018, and the related notes. In our opinion, the financial statements and financial highlights present fairly, in all material respects, the financial position of each of the Funds as of October 31, 2019, the results of their operations for the year then ended, and the changes in their net assets for each of the two years in the period then ended, and the financial highlights for each of the five years in the period then ended, except for Fidelity Series Emerging Markets Fund; the results of its operations for the period then ended, and the changes in its net assets and the financial highlights for the year then ended and for the period from August 29, 2018 (commencement of operations) to October 31, 2018, in conformity with accounting principles generally accepted in the United States of America.
Basis for Opinion
These financial statements and financial highlights are the responsibility of the Funds’ management. Our responsibility is to express an opinion on the Funds’ financial statements and financial highlights based on our audits. We are a public accounting firm registered with the Public Company Accounting Oversight Board (United States) (PCAOB) and are required to be independent with respect to the Fund in accordance with the U.S. federal securities laws and the applicable rules and regulations of the Securities and Exchange Commission and the PCAOB.
We conducted our audits in accordance with the standards of the PCAOB. Those standards require that we plan and perform the audit to obtain reasonable assurance about whether the financial statements and financial highlights are free of material misstatement, whether due to error or fraud. The Funds are not required to have, nor were we engaged to perform, an audit of their internal control over financial reporting. As part of our audits we are required to obtain an understanding of internal control over financial reporting but not for the purpose of expressing an opinion on the effectiveness of the Funds’ internal control over financial reporting. Accordingly, we express no such opinion.
Our audits included performing procedures to assess the risks of material misstatement of the financial statements and financial highlights, whether due to error or fraud, and performing procedures that respond to those risks. Such procedures included examining, on a test basis, evidence regarding the amounts and disclosures in the financial statements and financial highlights. Our audits also included evaluating the accounting principles used and significant estimates made by management, as well as evaluating the overall presentation of the financial statements and financial highlights. Our procedures included confirmation of securities owned as of October 31, 2019, by correspondence with the custodians and brokers; when replies were not received from brokers, we performed other auditing procedures. We believe that our audits provide a reasonable basis for our opinion.
/s/ Deloitte & Touche LLP
Boston, Massachusetts
December 16, 2019
We have served as the auditor of one or more of the Fidelity investment companies since 1999.
Report of Independent Registered Public Accounting Firm
To the Board of Trustees of Fidelity Investment Trust and the Shareholders of Fidelity Series International Growth Fund:
Opinion on the Financial Statements
We have audited the accompanying statement of assets and liabilities, including the schedule of investments, of Fidelity Series International Growth Fund (one of the funds constituting Fidelity Investment Trust, referred to hereafter as the “Fund”) as of October 31, 2019, the related statement of operations for the year ended October 31, 2019, the statement of changes in net assets for each of the two years in the period ended October 31, 2019, including the related notes, and the financial highlights for each of the five years in the period ended October 31, 2019 (collectively referred to as the “financial statements”). In our opinion, the financial statements present fairly, in all material respects, the financial position of the Fund as of October 31, 2019, the results of its operations for the year then ended, the changes in its net assets for each of the two years in the period ended October 31, 2019 and the financial highlights for each of the five years in the period ended October 31, 2019 in conformity with accounting principles generally accepted in the United States of America.
Basis for Opinion
These financial statements are the responsibility of the Fund’s management. Our responsibility is to express an opinion on the Fund’s financial statements based on our audits. We are a public accounting firm registered with the Public Company Accounting Oversight Board (United States) (PCAOB) and are required to be independent with respect to the Fund in accordance with the U.S. federal securities laws and the applicable rules and regulations of the Securities and Exchange Commission and the PCAOB.
We conducted our audits of these financial statements in accordance with the standards of the PCAOB. Those standards require that we plan and perform the audit to obtain reasonable assurance about whether the financial statements are free of material misstatement, whether due to error or fraud.
Our audits included performing procedures to assess the risks of material misstatement of the financial statements, whether due to error or fraud, and performing procedures that respond to those risks. Such procedures included examining, on a test basis, evidence regarding the amounts and disclosures in the financial statements. Our audits also included evaluating the accounting principles used and significant estimates made by management, as well as evaluating the overall presentation of the financial statements. Our procedures included confirmation of securities owned as of October 31, 2019 by correspondence with the custodian and brokers; when replies were not received from brokers, we performed other auditing procedures. We believe that our audits provide a reasonable basis for our opinion.
PricewaterhouseCoopers LLP
Boston, Massachusetts
December 16, 2019
We have served as the auditor of one or more investment companies in the Fidelity group of funds since 1932.
Trustees and Officers
The Trustees, Members of the Advisory Board (if any), and officers of the trust and funds, as applicable, are listed below. The Board of Trustees governs each fund and is responsible for protecting the interests of shareholders. The Trustees are experienced executives who meet periodically throughout the year to oversee each fund's activities, review contractual arrangements with companies that provide services to each fund, oversee management of the risks associated with such activities and contractual arrangements, and review each fund's performance. Except for Jonathan Chiel, each of the Trustees oversees 298 funds. Mr. Chiel oversees 171 funds.
The Trustees hold office without limit in time except that (a) any Trustee may resign; (b) any Trustee may be removed by written instrument, signed by at least two-thirds of the number of Trustees prior to such removal; (c) any Trustee who requests to be retired or who has become incapacitated by illness or injury may be retired by written instrument signed by a majority of the other Trustees; and (d) any Trustee may be removed at any special meeting of shareholders by a two-thirds vote of the outstanding voting securities of the trust. Each Trustee who is not an interested person (as defined in the 1940 Act) of the trust and the funds is referred to herein as an Independent Trustee. Each Independent Trustee shall retire not later than the last day of the calendar year in which his or her 75th birthday occurs. The Independent Trustees may waive this mandatory retirement age policy with respect to individual Trustees. Officers and Advisory Board Members hold office without limit in time, except that any officer or Advisory Board Member may resign or may be removed by a vote of a majority of the Trustees at any regular meeting or any special meeting of the Trustees. Except as indicated, each individual has held the office shown or other offices in the same company for the past five years.
Each fund’s Statement of Additional Information (SAI) includes more information about the Trustees. To request a free copy, call Fidelity at 1-800-544-8544.
Experience, Skills, Attributes, and Qualifications of the Trustees. The Governance and Nominating Committee has adopted a statement of policy that describes the experience, qualifications, attributes, and skills that are necessary and desirable for potential Independent Trustee candidates (Statement of Policy). The Board believes that each Trustee satisfied at the time he or she was initially elected or appointed a Trustee, and continues to satisfy, the standards contemplated by the Statement of Policy. The Governance and Nominating Committee also engages professional search firms to help identify potential Independent Trustee candidates who have the experience, qualifications, attributes, and skills consistent with the Statement of Policy. From time to time, additional criteria based on the composition and skills of the current Independent Trustees, as well as experience or skills that may be appropriate in light of future changes to board composition, business conditions, and regulatory or other developments, have also been considered by the professional search firms and the Governance and Nominating Committee. In addition, the Board takes into account the Trustees' commitment and participation in Board and committee meetings, as well as their leadership of standing and ad hoc committees throughout their tenure.
In determining that a particular Trustee was and continues to be qualified to serve as a Trustee, the Board has considered a variety of criteria, none of which, in isolation, was controlling. The Board believes that, collectively, the Trustees have balanced and diverse experience, qualifications, attributes, and skills, which allow the Board to operate effectively in governing each fund and protecting the interests of shareholders. Information about the specific experience, skills, attributes, and qualifications of each Trustee, which in each case led to the Board's conclusion that the Trustee should serve (or continue to serve) as a trustee of the funds, is provided below.
Board Structure and Oversight Function. James C. Curvey is an interested person and currently serves as Chairman. The Trustees have determined that an interested Chairman is appropriate and benefits shareholders because an interested Chairman has a personal and professional stake in the quality and continuity of services provided to the funds. Independent Trustees exercise their informed business judgment to appoint an individual of their choosing to serve as Chairman, regardless of whether the Trustee happens to be independent or a member of management. The Independent Trustees have determined that they can act independently and effectively without having an Independent Trustee serve as Chairman and that a key structural component for assuring that they are in a position to do so is for the Independent Trustees to constitute a substantial majority for the Board. The Independent Trustees also regularly meet in executive session. Ned C. Lautenbach serves as Chairman of the Independent Trustees and as such (i) acts as a liaison between the Independent Trustees and management with respect to matters important to the Independent Trustees and (ii) with management prepares agendas for Board meetings.
Fidelity® funds are overseen by different Boards of Trustees. The funds' Board oversees Fidelity's high income and certain equity funds, and other Boards oversee Fidelity's investment-grade bond, money market, asset allocation, and other equity funds. The asset allocation funds may invest in Fidelity® funds overseen by the funds' Board. The use of separate Boards, each with its own committee structure, allows the Trustees of each group of Fidelity® funds to focus on the unique issues of the funds they oversee, including common research, investment, and operational issues. On occasion, the separate Boards establish joint committees to address issues of overlapping consequences for the Fidelity® funds overseen by each Board.
The Trustees operate using a system of committees to facilitate the timely and efficient consideration of all matters of importance to the Trustees, each fund, and fund shareholders and to facilitate compliance with legal and regulatory requirements and oversight of the funds' activities and associated risks. The Board, acting through its committees, has charged FMR and its affiliates with (i) identifying events or circumstances the occurrence of which could have demonstrably adverse effects on the funds' business and/or reputation; (ii) implementing processes and controls to lessen the possibility that such events or circumstances occur or to mitigate the effects of such events or circumstances if they do occur; and (iii) creating and maintaining a system designed to evaluate continuously business and market conditions in order to facilitate the identification and implementation processes described in (i) and (ii) above. Because the day-to-day operations and activities of the funds are carried out by or through FMR, its affiliates, and other service providers, the funds' exposure to risks is mitigated but not eliminated by the processes overseen by the Trustees. While each of the Board's committees has responsibility for overseeing different aspects of the funds' activities, oversight is exercised primarily through the Operations, Audit, and Compliance Committees. Appropriate personnel, including but not limited to the funds' Chief Compliance Officer (CCO), FMR's internal auditor, the independent accountants, the funds' Treasurer and portfolio management personnel, make periodic reports to the Board's committees, as appropriate, including an annual review of Fidelity's risk management program for the Fidelity® funds. The responsibilities of each standing committee, including their oversight responsibilities, are described further under "Standing Committees of the Trustees."
Interested Trustees*:
Correspondence intended for a Trustee who is an interested person may be sent to Fidelity Investments, 245 Summer Street, Boston, Massachusetts 02210.
Name, Year of Birth; Principal Occupations and Other Relevant Experience+
Jonathan Chiel (1957)
Year of Election or Appointment: 2016
Trustee
Mr. Chiel also serves as Trustee of other Fidelity® funds. Mr. Chiel is Executive Vice President and General Counsel for FMR LLC (diversified financial services company, 2012-present). Previously, Mr. Chiel served as general counsel (2004-2012) and senior vice president and deputy general counsel (2000-2004) for John Hancock Financial Services; a partner with Choate, Hall & Stewart (1996-2000) (law firm); and an Assistant United States Attorney for the United States Attorney’s Office of the District of Massachusetts (1986-95), including Chief of the Criminal Division (1993-1995). Mr. Chiel is a director on the boards of the Boston Bar Foundation and the Maimonides School.
James C. Curvey (1935)
Year of Election or Appointment: 2007
Trustee
Chairman of the Board of Trustees
Mr. Curvey also serves as Trustee of other Fidelity® funds. Mr. Curvey is Vice Chairman (2007-present) and Director of FMR LLC (diversified financial services company). In addition, Mr. Curvey is an Overseer Emeritus for the Boston Symphony Orchestra, a Director of Artis-Naples, and a Trustee of Brewster Academy in Wolfeboro, New Hampshire. Previously, Mr. Curvey served as a Director of Fidelity Research & Analysis Co. (investment adviser firm, 2009-2018), Director of Fidelity Investments Money Management, Inc. (investment adviser firm, 2009-2014) and a Director of FMR and FMR Co., Inc. (investment adviser firms, 2007-2014).
* Determined to be an “Interested Trustee” by virtue of, among other things, his or her affiliation with the trust or various entities under common control with FMR.
+ The information includes the Trustee's principal occupation during the last five years and other information relating to the experience, attributes, and skills relevant to the Trustee's qualifications to serve as a Trustee, which led to the conclusion that the Trustee should serve as a Trustee for each fund.
Independent Trustees:
Correspondence intended for an Independent Trustee may be sent to Fidelity Investments, P.O. Box 55235, Boston, Massachusetts 02205-5235.
Name, Year of Birth; Principal Occupations and Other Relevant Experience+
Dennis J. Dirks (1948)
Year of Election or Appointment: 2005
Trustee
Mr. Dirks also serves as Trustee of other Fidelity® funds. Prior to his retirement in May 2003, Mr. Dirks was Chief Operating Officer and a member of the Board of The Depository Trust & Clearing Corporation (DTCC). He also served as President, Chief Operating Officer, and Board member of The Depository Trust Company (DTC) and President and Board member of the National Securities Clearing Corporation (NSCC). In addition, Mr. Dirks served as Chief Executive Officer and Board member of the Government Securities Clearing Corporation, Chief Executive Officer and Board member of the Mortgage-Backed Securities Clearing Corporation, as a Trustee and a member of the Finance Committee of Manhattan College (2005-2008), as a Trustee and a member of the Finance Committee of AHRC of Nassau County (2006-2008), as a member of the Independent Directors Council (IDC) Governing Council (2010-2015), and as a member of the Board of Directors for The Brookville Center for Children’s Services, Inc. (2009-2017). Mr. Dirks is a member of the Finance Committee (2016-present) and Board of Directors (2017-present) and is Treasurer (2018-present) of the Asolo Repertory Theatre.
Donald F. Donahue (1950)
Year of Election or Appointment: 2018
Trustee
Mr. Donahue also serves as a Trustee of other Fidelity® funds. Mr. Donahue is President and Chief Executive Officer of Miranda Partners, LLC (risk consulting for the financial services industry, 2012-present). Previously, Mr. Donahue served as a Member of the Advisory Board of certain Fidelity® funds (2015-2018) and Chief Executive Officer (2006-2012), Chief Operating Officer (2003-2006), and Managing Director, Customer Marketing and Development (1999-2003) of The Depository Trust & Clearing Corporation (financial markets infrastructure). Mr. Donahue serves as a Member (2007-present) and Co-Chairman (2016-present) of the Board of Directors of United Way of New York, Member of the Board of Directors of NYC Leadership Academy (2012-present) and Member of the Board of Advisors of Ripple Labs, Inc. (financial services, 2015-present). He also served as Chairman (2010-2012) and Member of the Board of Directors (2012-2013) of Omgeo, LLC (financial services), Treasurer of United Way of New York (2012-2016), and Member of the Board of Directors of XBRL US (financial services non-profit, 2009-2012) and the International Securities Services Association (2009-2012).
Alan J. Lacy (1953)
Year of Election or Appointment: 2008
Trustee
Mr. Lacy also serves as Trustee of other Fidelity® funds. Mr. Lacy serves as a Director of Bristol-Myers Squibb Company (global pharmaceuticals, 2008-present). He is a Trustee of the California Chapter of The Nature Conservancy (2015-present) and a Director of the Center for Advanced Study in the Behavioral Sciences at Stanford University (2015-present). In addition, Mr. Lacy served as Senior Adviser (2007-2014) of Oak Hill Capital Partners, L.P. (private equity) and also served as Chief Executive Officer (2005) and Vice Chairman (2005-2006) of Sears Holdings Corporation (retail) and Chief Executive Officer and Chairman of the Board of Sears, Roebuck and Co. (retail, 2000-2005). Previously, Mr. Lacy served as Chairman (2014-2017) and a member (2010-2017) of the Board of Directors of Dave & Buster’s Entertainment, Inc. (restaurant and entertainment complexes), as Chairman (2008-2011) and a member (2006-2015) of the Board of Trustees of the National Parks Conservation Association, and as a member of the Board of Directors for The Hillman Companies, Inc. (hardware wholesalers, 2010-2014), Earth Fare, Inc. (retail grocery, 2010-2014), and The Western Union Company (global money transfer, 2006-2011).
Ned C. Lautenbach (1944)
Year of Election or Appointment: 2000
Trustee
Chairman of the Independent Trustees
Mr. Lautenbach also serves as Trustee of other Fidelity® funds. Mr. Lautenbach currently serves as Chair (2018-present) and Member (2013-present) of the Board of Governors, State University System of Florida and is a member of the Council on Foreign Relations (1994-present). He is also a member and has most recently served as Chairman of the Board of Directors of Artis-Naples (2012-present). Previously, Mr. Lautenbach served as a member and then Lead Director of the Board of Directors of Eaton Corporation (diversified industrial, 1997-2016). He was also a Partner and Advisory Partner at Clayton, Dubilier & Rice, LLC (private equity investment, 1998-2010), as well as a Director of Sony Corporation (2006-2007). In addition, Mr. Lautenbach also had a 30-year career with IBM (technology company) during which time he served as Senior Vice President and a member of the Corporate Executive Committee (1968-1998).
Joseph Mauriello (1944)
Year of Election or Appointment: 2008
Trustee
Mr. Mauriello also serves as Trustee of other Fidelity® funds. Prior to his retirement in January 2006, Mr. Mauriello served in numerous senior management positions including Deputy Chairman and Chief Operating Officer (2004-2005), and Vice Chairman of Financial Services (2002-2004) of KPMG LLP US (professional services, 1965-2005). Mr. Mauriello currently serves as a member of the Independent Directors Council (IDC) Governing Council (2015-present). Previously, Mr. Mauriello served as a member of the Board of Directors of XL Group plc. (global insurance and re-insurance, 2006-2018).
Cornelia M. Small (1944)
Year of Election or Appointment: 2005
Trustee
Ms. Small also serves as Trustee of other Fidelity® funds. Ms. Small is a member of the Board of Directors (2009-present) and Chair of the Investment Committee (2010-present) of the Teagle Foundation. Ms. Small also serves on the Investment Committee of the Berkshire Taconic Community Foundation (2008-present). Previously, Ms. Small served as Chairperson (2002-2008) and a member of the Investment Committee and Chairperson (2008-2012) and a member of the Board of Trustees of Smith College. In addition, Ms. Small served as Chief Investment Officer, Director of Global Equity Investments, and a member of the Board of Directors of Scudder, Stevens & Clark and Scudder Kemper Investments.
Garnett A. Smith (1947)
Year of Election or Appointment: 2018
Trustee
Mr. Smith also serves as Trustee of other Fidelity® funds. Prior to Mr. Smith's retirement, he served as Chairman and Chief Executive Officer of Inbrand Corp. (manufacturer of personal absorbent products, 1990-1997). He also served as President (1986-1990) of Inbrand Corp. Prior to his employment with Inbrand Corp., he was employed by a retail fabric chain and North Carolina National Bank. In addition, Mr. Smith served as a Member of the Advisory Board of certain Fidelity® funds (2012-2013) and as a board member of the Jackson Hole Land Trust (2009-2012).
David M. Thomas (1949)
Year of Election or Appointment: 2008
Trustee
Mr. Thomas also serves as Trustee of other Fidelity® funds. Mr. Thomas serves as Non-Executive Chairman of the Board of Directors of Fortune Brands Home and Security (home and security products, 2011-present) and as a member of the Board of Directors (2004-present) and Presiding Director (2013-present) of Interpublic Group of Companies, Inc. (marketing communication). Previously, Mr. Thomas served as Executive Chairman (2005-2006) and Chairman and Chief Executive Officer (2000-2005) of IMS Health, Inc. (pharmaceutical and healthcare information solutions), a Director of Fortune Brands, Inc. (consumer products, 2000-2011), and a member of the Board of Trustees of the University of Florida (2013-2018).
+ The information includes the Trustee's principal occupation during the last five years and other information relating to the experience, attributes, and skills relevant to the Trustee's qualifications to serve as a Trustee, which led to the conclusion that the Trustee should serve as a Trustee for each fund.
Advisory Board Members and Officers:
Correspondence intended for a Member of the Advisory Board (if any) may be sent to Fidelity Investments, P.O. Box 55235, Boston, Massachusetts 02205-5235. Correspondence intended for an officer or Peter S. Lynch may be sent to Fidelity Investments, 245 Summer Street, Boston, Massachusetts 02210. Officers appear below in alphabetical order.
Name, Year of Birth; Principal Occupation
Vicki L. Fuller (1957)
Year of Election or Appointment: 2018
Member of the Advisory Board
Ms. Fuller also serves as Member of the Advisory Board of other Fidelity® funds. Ms. Fuller serves as a member of the Board of Directors, Audit Committee, and Nominating and Governance Committee of The Williams Companies, Inc. (natural gas infrastructure, 2018-present). Previously, Ms. Fuller served as the Chief Investment Officer of the New York State Common Retirement Fund (2012-2018) and held a variety of positions at AllianceBernstein L.P. (global asset management, 1985-2012), including Managing Director (2006-2012) and Senior Vice President and Senior Portfolio Manager (2001-2006).
Peter S. Lynch (1944)
Year of Election or Appointment: 2003
Member of the Advisory Board
Mr. Lynch also serves as Member of the Advisory Board of other Fidelity® funds. Mr. Lynch is Vice Chairman and a Director of FMR (investment adviser firm) and FMR Co., Inc. (investment adviser firm). In addition, Mr. Lynch serves as a Trustee of Boston College and as the Chairman of the Inner-City Scholarship Fund. Previously, Mr. Lynch served on the Special Olympics International Board of Directors (1997-2006).
Michael E. Wiley (1950)
Year of Election or Appointment: 2018
Member of the Advisory Board
Mr. Wiley also serves as Trustee or Member of the Advisory Board of other Fidelity® funds. Mr. Wiley serves as a Director of High Point Resources (exploration and production, 2005-present). Previously, Mr. Wiley served as a Director of Andeavor Corporation (independent oil refiner and marketer, 2005-2018), a Director of Andeavor Logistics LP (natural resources logistics, 2015-2018), a Director of Post Oak Bank (privately-held bank, 2004-2018), a Director of Asia Pacific Exploration Consolidated (international oil and gas exploration and production, 2008-2013), a member of the Board of Trustees of the University of Tulsa (2000-2006; 2007-2010), a Senior Energy Advisor of Katzenbach Partners, LLC (consulting, 2006-2007), an Advisory Director of Riverstone Holdings (private investment), a Director of Spinnaker Exploration Company (exploration and production, 2001-2005) and Chairman, President, and CEO of Baker Hughes, Inc. (oilfield services, 2000-2004).
Elizabeth Paige Baumann (1968)
Year of Election or Appointment: 2017
Anti-Money Laundering (AML) Officer
Ms. Baumann also serves as AML Officer of other funds. She is Chief AML Officer (2012-present) and Senior Vice President (2014-present) of FMR LLC (diversified financial services company) and is an employee of Fidelity Investments. Previously, Ms. Baumann served as AML Officer of the funds (2012-2016), and Vice President (2007-2014) and Deputy Anti-Money Laundering Officer (2007-2012) of FMR LLC.
Craig S. Brown (1977)
Year of Election or Appointment: 2019
Assistant Treasurer
Mr. Brown also serves as Assistant Treasurer of other funds. Mr. Brown is an employee of Fidelity Investments (2013-present).
John J. Burke III (1964)
Year of Election or Appointment: 2018
Chief Financial Officer
Mr. Burke also serves as Chief Financial Officer of other funds. Mr. Burke serves as Head of Investment Operations for Fidelity Fund and Investment Operations (2018-present) and is an employee of Fidelity Investments (1998-present). Previously Mr. Burke served as head of Asset Management Investment Operations (2012-2018).
William C. Coffey (1969)
Year of Election or Appointment: 2019
Assistant Secretary
Mr. Coffey also serves as Assistant Secretary of other funds. He is Senior Vice President and Deputy General Counsel of FMR LLC (diversified financial services company, 2010-present), and is an employee of Fidelity Investments. Previously, Mr. Coffey served as Secretary and CLO of certain funds (2018-2019); CLO, Secretary, and Senior Vice President of Fidelity Management & Research Company and FMR Co., Inc. (investment adviser firms, 2018-2019); Secretary of Fidelity SelectCo, LLC and Fidelity Investments Money Management, Inc. (investment adviser firms, 2018-2019); CLO of Fidelity Management & Research (Hong Kong) Limited, FMR Investment Management (UK) Limited, and Fidelity Management & Research (Japan) Limited (investment adviser firms, 2018-2019); and Assistant Secretary of certain funds (2009-2018).
Timothy M. Cohen (1969)
Year of Election or Appointment: 2018
Vice President
Mr. Cohen also serves as Vice President of other funds. Mr. Cohen serves as Executive Vice President of Fidelity SelectCo, LLC (2019-present), Co-Head of Equity (2018-present), a Director of Fidelity Management & Research (Japan) Limited (investment adviser firm, 2016-present), and is an employee of Fidelity Investments. Previously, Mr. Cohen served as Head of Global Equity Research (2016-2018), Chief Investment Officer - Equity and a Director of Fidelity Management & Research (U.K.) Inc. (investment adviser firm, 2013-2015) and as a Director of Fidelity Management & Research (Hong Kong) Limited (investment adviser firm, 2017).
Jonathan Davis (1968)
Year of Election or Appointment: 2010
Assistant Treasurer
Mr. Davis also serves as Assistant Treasurer of other funds. Mr. Davis serves as Assistant Treasurer of FMR Capital, Inc. (2017-present) and is an employee of Fidelity Investments. Previously, Mr. Davis served as Vice President and Associate General Counsel of FMR LLC (diversified financial services company, 2003-2010).
Adrien E. Deberghes (1967)
Year of Election or Appointment: 2016
Assistant Treasurer
Mr. Deberghes also serves as an officer of other funds. He serves as Assistant Treasurer of FMR Capital, Inc. (2017-present), Executive Vice President of Fidelity Investments Money Management, Inc. (FIMM) (investment adviser firm, 2016-present), and is an employee of Fidelity Investments (2008-present). Previously, Mr. Deberghes served as President and Treasurer of certain Fidelity® funds (2013-2018). Prior to joining Fidelity Investments, Mr. Deberghes was Senior Vice President of Mutual Fund Administration at State Street Corporation (2007-2008), Senior Director of Mutual Fund Administration at Investors Bank & Trust (2005-2007), and Director of Finance for Dunkin' Brands (2000-2005). Previously, Mr. Deberghes served in other fund officer roles.
Laura M. Del Prato (1964)
Year of Election or Appointment: 2018
Assistant Treasurer
Ms. Del Prato also serves as an officer of other funds. Ms. Del Prato is an employee of Fidelity Investments (2017-present). Prior to joining Fidelity Investments, Ms. Del Prato served as a Managing Director and Treasurer of the JPMorgan Mutual Funds (2014-2017). Prior to JPMorgan, Ms. Del Prato served as a partner at Cohen Fund Audit Services (accounting firm, 2012-2013) and KPMG LLP (accounting firm, 2004-2012).
Colm A. Hogan (1973)
Year of Election or Appointment: 2016
Deputy Treasurer
Mr. Hogan also serves as an officer of other funds. Mr. Hogan serves as Assistant Treasurer of FMR Capital, Inc. (2017-present) and is an employee of Fidelity Investments (2005-present). Previously, Mr. Hogan served as Assistant Treasurer of certain Fidelity® funds (2016-2018).
Pamela R. Holding (1964)
Year of Election or Appointment: 2018
Vice President
Ms. Holding also serves as Vice President of other funds. Ms. Holding serves as Executive Vice President of Fidelity SelectCo, LLC (2019-present), Co-Head of Equity (2018-present) and is an employee of Fidelity Investments (2013-present). Previously, Ms. Holding served as Chief Investment Officer of Fidelity Institutional Asset Management (2013-2018).
Cynthia Lo Bessette (1969)
Year of Election or Appointment: 2019
Secretary and Chief Legal Officer (CLO)
Ms. Lo Bessette also serves as Secretary and CLO of other funds. Ms. Lo Bessette serves as CLO, Secretary, and Senior Vice President of Fidelity Management & Research Company and FMR Co., Inc. (investment adviser firms, 2019-present); Secretary of Fidelity SelectCo, LLC and Fidelity Investments Money Management, Inc. (investment adviser firms, 2019-present); and CLO of Fidelity Management & Research (Hong Kong) Limited, FMR Investment Management (UK) Limited, and Fidelity Management & Research (Japan) Limited (investment adviser firms, 2019-present). She is a Senior Vice President and Deputy General Counsel of FMR LLC (diversified financial services company, 2019-present), and is an employee of Fidelity Investments. Previously, Ms. Lo Bessette served as Executive Vice President, General Counsel (2016-2019) and Senior Vice President, Deputy General Counsel (2015-2016) of OppenheimerFunds (investment management company) and Deputy Chief Legal Officer (2013-2015) of Jennison Associates LLC (investment adviser firm).
Chris Maher (1972)
Year of Election or Appointment: 2013
Assistant Treasurer
Mr. Maher serves as Assistant Treasurer of other funds. Mr. Maher is Vice President of Valuation Oversight, serves as Assistant Treasurer of FMR Capital, Inc. (2017-present), and is an employee of Fidelity Investments. Previously, Mr. Maher served as Vice President of Asset Management Compliance (2013), Vice President of the Program Management Group of FMR (investment adviser firm, 2010-2013), and Vice President of Valuation Oversight (2008-2010).
Kenneth B. Robins (1969)
Year of Election or Appointment: 2016
Chief Compliance Officer
Mr. Robins also serves as an officer of other funds. Mr. Robins serves as Compliance Officer of Fidelity Management & Research Company and FMR Co., Inc. (investment adviser firms, 2016-present) and is an employee of Fidelity Investments (2004-present). Previously, Mr. Robins served as Executive Vice President of Fidelity Investments Money Management, Inc. (investment adviser firm, 2013-2016) and served in other fund officer roles.
Stacie M. Smith (1974)
Year of Election or Appointment: 2016
President and Treasurer
Ms. Smith also serves as an officer of other funds. Ms. Smith serves as Assistant Treasurer of FMR Capital, Inc. (2017-present), is an employee of Fidelity Investments (2009-present), and has served in other fund officer roles. Prior to joining Fidelity Investments, Ms. Smith served as Senior Audit Manager of Ernst & Young LLP (accounting firm, 1996-2009). Previously, Ms. Smith served as Assistant Treasurer (2013-2018) and Deputy Treasurer (2013-2016) of certain Fidelity® funds.
Marc L. Spector (1972)
Year of Election or Appointment: 2016
Assistant Treasurer
Mr. Spector also serves as an officer of other funds. Mr. Spector serves as Assistant Treasurer of FMR Capital, Inc. (2017-present) and is an employee of Fidelity Investments (2016-present). Prior to joining Fidelity Investments, Mr. Spector served as Director at the Siegfried Group (accounting firm, 2013-2016), and prior to Siegfried Group as audit senior manager at Deloitte & Touche (accounting firm, 2005-2013).
Jim Wegmann (1979)
Year of Election or Appointment: 2019
Assistant Treasurer
Mr. Wegmann also serves as Assistant Treasurer of other funds. Mr. Wegmann is an employee of Fidelity Investments (2011-present).
Shareholder Expense Example
As a shareholder of a Fund, you incur two types of costs: (1) transaction costs and (2) ongoing costs, including other Fund expenses. This Example is intended to help you understand your ongoing costs (in dollars) of investing in the Funds and to compare these costs with the ongoing costs of investing in other mutual funds.
The Example is based on an investment of $1,000 invested at the beginning of the period and held for the entire period (May 1, 2019 to October 31, 2019).
Actual Expenses
The first line of the accompanying table for each fund provides information about actual account values and actual expenses. You may use the information in this line, together with the amount you invested, to estimate the expenses that you paid over the period. Simply divide your account value by $1,000.00 (for example, an $8,600 account value divided by $1,000.00 = 8.6), then multiply the result by the number in the first line for a fund under the heading entitled "Expenses Paid During Period" to estimate the expenses you paid on your account during this period. In addition, each Fund, as a shareholder in the underlying Fidelity Central Funds, will indirectly bear its pro-rata share of the fees and expenses incurred by the underlying Fidelity Central Funds. These fees and expenses are not included in the Fund's annualized expense ratio used to calculate the expense estimate in the table below.
Hypothetical Example for Comparison Purposes
The second line of the accompanying table for each fund provides information about hypothetical account values and hypothetical expenses based on a fund's actual expense ratio and an assumed rate of return of 5% per year before expenses, which is not the Fund's actual return. The hypothetical account values and expenses may not be used to estimate the actual ending account balance or expenses you paid for the period. You may use this information to compare the ongoing costs of investing in the Fund and other funds. To do so, compare this 5% hypothetical example with the 5% hypothetical examples that appear in the shareholder reports of the other funds. In addition, each Fund, as a shareholder in the underlying Fidelity Central Funds, will indirectly bear its pro-rata share of the fees and expenses incurred by the underlying Fidelity Central Funds. These fees and expenses are not included in the Fund's annualized expense ratio used to calculate the expense estimate in the table below.
Please note that the expenses shown in the table are meant to highlight your ongoing costs only and do not reflect any transaction costs. Therefore, the second line of the table is useful in comparing ongoing costs only, and will not help you determine the relative total costs of owning different funds.
| | Annualized Expense Ratio-A | Beginning
Account Value
May 1, 2019 | Ending
Account Value
October 31, 2019 | Expenses Paid
During Period-B
May 1, 2019
to October 31, 2019 |
| Fidelity Series Emerging Markets Fund | .01% | | | |
| Actual | | $1,000.00 | $951.80 | $.05 |
| Hypothetical-C | | $1,000.00 | $1,025.16 | $.05 |
| Fidelity Series Emerging Markets Opportunities Fund | .01% | | | |
| Actual | | $1,000.00 | $1,021.10 | $.05 |
| Hypothetical-C | | $1,000.00 | $1,025.16 | $.05 |
| Fidelity Series International Growth Fund | -%-D | | | |
| Actual | | $1,000.00 | $1,073.60 | $--E |
| Hypothetical-C | | $1,000.00 | $1,025.21 | $--E |
| Fidelity Series International Small Cap Fund | .01% | | | |
| Actual | | $1,000.00 | $1,029.60 | $.05 |
| Hypothetical-C | | $1,000.00 | $1,025.16 | $.05 |
| Fidelity Series International Value Fund | -%-D | | | |
| Actual | | $1,000.00 | $1,018.70 | $--E |
| Hypothetical-C | | $1,000.00 | $1,025.21 | $--E |
A Annualized expense ratio reflects expenses net of applicable fee waivers.
B Expenses are equal to each Fund's annualized expense ratio, multiplied by the average account value over the period, multiplied by 184/ 365 (to reflect the one-half year period).
C 5% return per year before expenses
D Amount represents less than .005%.
E Amount represents less than $.005.
Distributions (Unaudited)
The Board of Trustees of each fund voted to pay to shareholders of record at the opening of business on record date, the following distributions per share derived from capital gains realized from sales of portfolio securities, and dividends derived from net investment income:
| | Pay Date | Record Date | Dividends | Capital Gains |
| Fidelity Series Emerging Markets Fund | 12/16/19 | 12/13/19 | $0.223 | $0.000 |
| Fidelity Series Emerging Markets Opportunities Fund | 12/16/19 | 12/13/19 | $0.497 | $0.015 |
| Fidelity Series International Growth Fund | 12/16/19 | 12/13/19 | $0.367 | $0.270 |
| Fidelity Series International Small Cap Fund | 12/16/19 | 12/13/19 | $0.361 | $0.379 |
| Fidelity Series International Value Fund | 12/16/19 | 12/13/19 | $0.364 | $0.037 |
The funds hereby designate as capital gain dividend the amounts noted below for the taxable year ended October 31, 2019, or, if subsequently determined to be different, the net capital gain of such year.
| Fidelity Series International Growth Fund | $261,712,279 |
| Fidelity Series International Small Cap Fund | $71,986,870 |
|
A percentage of the dividends distributed during the fiscal year for the following funds qualify for the dividends–received deduction for corporate shareholders:
| Fidelity Series Emerging Markets Fund | |
| December, 2018 | 11% |
| Fidelity Series International Growth Fund | |
| December, 2018 | 7% |
| Fidelity Series International Small Cap Fund | |
| December, 2018 | 1% |
| Fidelity Series International Value Fund | |
| December, 2018 | 1% |
A percentage of the dividends distributed during the fiscal year for the following funds may be taken into account as a dividend for purposes of the maximum rate under section 1(h)(11) of the Internal Revenue Code.
| Fidelity Series Emerging Markets Fund | |
| December, 2018 | 80% |
| Fidelity Series Emerging Markets Opportunities Fund | |
| December, 2018 | 72% |
| Fidelity Series International Growth Fund | |
| December, 2018 | 80% |
| Fidelity Series International Small Cap Fund | |
| December, 2018 | 73% |
| Fidelity Series International Value Fund | |
| December, 2018 | 77% |
The funds will notify shareholders in January 2020 of amounts for use in preparing 2019 income tax returns.
GSV-S-ANN-1219
1.907943.109
Fidelity® International Growth Fund
Annual Report
October 31, 2019
Includes Fidelity and Fidelity Advisor share classes
See the inside front cover for important information about access to your fund’s shareholder reports.
Beginning on January 1, 2021, as permitted by regulations adopted by the Securities and Exchange Commission, paper copies of a fund’s shareholder reports will no longer be sent by mail, unless you specifically request paper copies of the reports from the fund or from your financial intermediary, such as a financial advisor, broker-dealer or bank. Instead, the reports will be made available on a website, and you will be notified by mail each time a report is posted and provided with a website link to access the report.
If you already elected to receive shareholder reports electronically, you will not be affected by this change and you need not take any action. You may elect to receive shareholder reports and other communications from a fund electronically, by contacting your financial intermediary. For Fidelity customers, visit Fidelity's web site or call Fidelity using the contact information listed below.
You may elect to receive all future reports in paper free of charge. If you wish to continue receiving paper copies of your shareholder reports, you may contact your financial intermediary or, if you are a Fidelity customer, visit Fidelity’s website, or call Fidelity at the applicable toll-free number listed below. Your election to receive reports in paper will apply to all funds held with the fund complex/your financial intermediary.
| Account Type | Website | Phone Number |
| Brokerage, Mutual Fund, or Annuity Contracts: | fidelity.com/mailpreferences | 1-800-343-3548 |
| Employer Provided Retirement Accounts: | netbenefits.fidelity.com/preferences (choose 'no' under Required Disclosures to continue to print) | 1-800-343-0860 |
| Advisor Sold Accounts Serviced Through Your Financial Intermediary: | Contact Your Financial Intermediary | Your Financial Intermediary's phone number |
| Advisor Sold Accounts Serviced by Fidelity: | institutional.fidelity.com | 1-877-208-0098 |
Contents
To view a fund's proxy voting guidelines and proxy voting record for the 12-month period ended June 30, visit http://www.fidelity.com/proxyvotingresults or visit the Securities and Exchange Commission's (SEC) web site at http://www.sec.gov.
You may also call 1-800-544-8544 if you’re an individual investing directly with Fidelity, call 1-800-835-5092 if you’re a plan sponsor or participant with Fidelity as your recordkeeper or call 1-877-208-0098 on institutional accounts or if you’re an advisor or invest through one to request a free copy of the proxy voting guidelines.
Standard & Poor's, S&P and S&P 500 are registered service marks of The McGraw-Hill Companies, Inc. and have been licensed for use by Fidelity Distributors Corporation.
Other third-party marks appearing herein are the property of their respective owners.
All other marks appearing herein are registered or unregistered trademarks or service marks of FMR LLC or an affiliated company. © 2019 FMR LLC. All rights reserved.
This report and the financial statements contained herein are submitted for the general information of the shareholders of the Fund. This report is not authorized for distribution to prospective investors in the Fund unless preceded or accompanied by an effective prospectus.
A fund files its complete schedule of portfolio holdings with the SEC for the first and third quarters of each fiscal year on Form N-PORT. Forms N-PORT are available on the SEC’s web site at http://www.sec.gov. A fund's Forms N-PORT may be reviewed and copied at the SEC’s Public Reference Room in Washington, DC. Information regarding the operation of the SEC's Public Reference Room may be obtained by calling 1-800-SEC-0330.
For a complete list of a fund's portfolio holdings, view the most recent holdings listing, semiannual report, or annual report on Fidelity's web site at http://www.fidelity.com, http://www.institutional.fidelity.com, or http://www.401k.com, as applicable.
NOT FDIC INSURED •MAY LOSE VALUE •NO BANK GUARANTEE
Neither the Fund nor Fidelity Distributors Corporation is a bank.
Performance: The Bottom Line
Average annual total return reflects the change in the value of an investment, assuming reinvestment of distributions from dividend income and capital gains (the profits earned upon the sale of securities that have grown in value, if any) and assuming a constant rate of performance each year. The hypothetical investment and the average annual total returns do not reflect the deduction of taxes that a shareholder would pay on fund distributions or the redemption of fund shares. During periods of reimbursement by Fidelity, a fund’s total return will be greater than it would be had the reimbursement not occurred. How a fund did yesterday is no guarantee of how it will do tomorrow.
Average Annual Total Returns
| For the periods ended October 31, 2019 | Past 1 year | Past 5 years | Past 10 years |
| Class A (incl. 5.75% sales charge) | 14.28% | 5.81% | 8.04% |
| Class M (incl. 3.50% sales charge) | 16.68% | 5.99% | 7.99% |
| Class C (incl. contingent deferred sales charge) | 19.33% | 6.24% | 7.85% |
| Fidelity® International Growth Fund | 21.66% | 7.37% | 8.99% |
| Class I | 21.64% | 7.41% | 9.00% |
| Class Z | 21.85% | 7.54% | 9.09% |
Class C shares' contingent deferred sales charges included in the past one year, past five years and past ten years total return figures are 1%, 0% and 0%, respectively.
The initial offering of Class Z shares took place on August 13, 2013. Returns prior to August 13, 2013, are those of Class I.
$10,000 Over 10 Years
Let's say hypothetically that $10,000 was invested in Fidelity® International Growth Fund, a class of the fund, on October 31, 2009.
The chart shows how the value of your investment would have changed, and also shows how the MSCI EAFE Growth Index performed over the same period.

| Period Ending Values |
| $23,650 | Fidelity® International Growth Fund - Fidelity® International Growth Fund |
| $19,758 | MSCI EAFE Growth Index |
Management's Discussion of Fund Performance
Market Recap: The MSCI ACWI (All Country World Index) ex USA Index gained 11.47% for the 12 months ending October 31, 2019, as international stocks reflected a confluence of factors, including escalating trade tension, moderating but still positive global economic growth and uncertainty about the U.K.’s planned “Brexit” from the European Union. In late December, the U.S. Federal Reserve shifted from raising interest rates to a more dovish policy in 2019, joining many foreign central banks that had cut policy rates. In June, international stocks rose 6.03%, as policy stimulus in China stabilized that country’s economic growth. The Fed cut its policy rate in July for the first time since 2008. However, the index returned -1.21% for the month, followed by -3.08% in August. In September, the Fed cut its policy rate another quarter point, citing concerns about slowing economic growth and muted inflation, and did the same in October, leading to monthly gains of 2.59% and 3.49%, respectively. For the full 12 months, the growth-oriented information technology sector (+22%) led the way, followed by utilities (+20%) and real estate (+18%), two high-dividend-yielding categories. Consumer discretionary gained 16%. Conversely, energy was roughly flat, while materials (+6%) and communication services (7%) also lagged. By region, Asia Pacific ex Japan (+16%), Europe ex U.K (+13%), Canada (+12%) and emerging markets (+12%) fared best. Meanwhile, the U.K. (+7%) and Japan (+10%) trailed the broader market.
Comments from Portfolio Manager Jed Weiss: For the fiscal year, the fund’s share classes (excluding sales charges, if applicable) gained roughly 20% to 22%, outpacing the 16.83% advance of the benchmark MSCI EAFE Growth Index. Versus the benchmark, the fund benefited most from sizable out-of-benchmark exposure to the U.S., as well as strong security selection in Germany, Japan, the Netherlands and Switzerland. Non-index stock picking among emerging markets also helped. By sector, positioning in information technology notably aided the portfolio’s relative result, as did investment choices within health care, financials and materials. Conversely, security selection in Spain and the U.K. detracted, along with picks in consumer discretionary. The biggest individual relative contributor was Netherlands-based chip-equipment firm ASML Holding (+55%), which continued to benefit from the build-out of 5G wireless networks and growth in its extreme ultraviolet lithography systems business. An out-of-benchmark stake in U.S.-based credit-card processor Mastercard (+41%) also added value, as the firm maintained considerable pricing power and significant market share. Non-index exposure to MSCI (+58%), the leading worldwide provider of benchmark indices and analytics, further contributed. Turning to detractors, an overweighted stake in Spanish airline-reservation software provider Amadeus IT Group (-7%) hurt most amid decelerating airline-traffic growth and increasingly aggressive competition. Untimely ownership of Austrian industrial conglomerate Andritz (-17%), which was sold prior to the end of the period, detracted as well. Lastly, I'll note that the fund's stake in cash – representing about 4% of assets, on average – meaningfully weighed on the portfolio’s relative return amid the strong, uptrending market this period.
The views expressed above reflect those of the portfolio manager(s) only through the end of the period as stated on the cover of this report and do not necessarily represent the views of Fidelity or any other person in the Fidelity organization. Any such views are subject to change at any time based upon market or other conditions and Fidelity disclaims any responsibility to update such views. These views may not be relied on as investment advice and, because investment decisions for a Fidelity fund are based on numerous factors, may not be relied on as an indication of trading intent on behalf of any Fidelity fund.
Investment Summary (Unaudited)
Geographic Diversification (% of fund's net assets)
| As of October 31, 2019 |
| | United States of America* | 21.6% |
| | Japan | 12.7% |
| | Switzerland | 10.8% |
| | Germany | 9.3% |
| | France | 6.1% |
| | United Kingdom | 5.9% |
| | Sweden | 5.1% |
| | Hong Kong | 4.3% |
| | Netherlands | 4.2% |
| | Other | 20.0% |

* Includes Short-Term investments and Net Other Assets (Liabilities).
Percentages are based on country or territory of incorporation and are adjusted for the effect of futures contracts, if applicable.
Asset Allocation as of October 31, 2019
| | % of fund's net assets |
| Stocks | 97.7 |
| Short-Term Investments and Net Other Assets (Liabilities) | 2.3 |
Top Ten Stocks as of October 31, 2019
| | % of fund's net assets |
| Nestle SA (Reg. S) (Switzerland, Food Products) | 5.8 |
| ASML Holding NV (Netherlands) (Netherlands, Semiconductors & Semiconductor Equipment) | 3.8 |
| SAP SE (Germany, Software) | 3.8 |
| Roche Holding AG (participation certificate) (Switzerland, Pharmaceuticals) | 3.6 |
| AIA Group Ltd. (Hong Kong, Insurance) | 3.1 |
| Keyence Corp. (Japan, Electronic Equipment & Components) | 3.0 |
| CSL Ltd. (Australia, Biotechnology) | 2.7 |
| MasterCard, Inc. Class A (United States of America, IT Services) | 2.7 |
| Visa, Inc. Class A (United States of America, IT Services) | 2.6 |
| ASSA ABLOY AB (B Shares) (Sweden, Building Products) | 2.5 |
| | 33.6 |
Top Market Sectors as of October 31, 2019
| | % of fund's net assets |
| Information Technology | 22.8 |
| Industrials | 21.3 |
| Financials | 16.8 |
| Health Care | 9.5 |
| Consumer Discretionary | 8.5 |
| Consumer Staples | 7.6 |
| Materials | 6.9 |
| Communication Services | 3.2 |
| Real Estate | 0.9 |
| Energy | 0.2 |
Schedule of Investments October 31, 2019
Showing Percentage of Net Assets
| Common Stocks - 97.7% | | | |
| | | Shares | Value |
| Australia - 2.7% | | | |
| CSL Ltd. | | 508,801 | $89,730,269 |
| Bailiwick of Jersey - 1.2% | | | |
| Experian PLC | | 1,320,400 | 41,528,030 |
| Belgium - 0.5% | | | |
| KBC Groep NV | | 224,208 | 15,723,721 |
| Brazil - 0.9% | | | |
| BM&F BOVESPA SA | | 2,356,200 | 28,423,627 |
| Canada - 2.1% | | | |
| Alimentation Couche-Tard, Inc. Class B (sub. vtg.) | | 578,100 | 17,337,294 |
| Canadian National Railway Co. | | 136,100 | 12,172,637 |
| Canadian Pacific Railway Ltd. | | 80,200 | 18,237,569 |
| Franco-Nevada Corp. | | 161,600 | 15,680,267 |
| Pason Systems, Inc. | | 362,800 | 3,894,915 |
| PrairieSky Royalty Ltd. (a) | | 409,100 | 3,994,401 |
|
| TOTAL CANADA | | | 71,317,083 |
|
| Cayman Islands - 1.5% | | | |
| Alibaba Group Holding Ltd. sponsored ADR (b) | | 291,300 | 51,463,971 |
| Finland - 0.1% | | | |
| Tikkurila Oyj | | 294,104 | 4,690,603 |
| France - 6.1% | | | |
| Edenred SA | | 663,048 | 34,904,279 |
| Elis SA | | 425,436 | 8,127,993 |
| Legrand SA | | 375,000 | 29,268,260 |
| LVMH Moet Hennessy Louis Vuitton SE | | 162,800 | 69,524,721 |
| Safran SA | | 380,200 | 60,149,657 |
|
| TOTAL FRANCE | | | 201,974,910 |
|
| Germany - 9.3% | | | |
| Deutsche Borse AG | | 234,500 | 36,314,599 |
| Linde PLC | | 380,579 | 75,235,493 |
| MTU Aero Engines Holdings AG | | 158,700 | 42,373,348 |
| SAP SE | | 957,601 | 126,883,553 |
| Vonovia SE | | 556,900 | 29,633,185 |
|
| TOTAL GERMANY | | | 310,440,178 |
|
| Hong Kong - 4.3% | | | |
| AIA Group Ltd. | | 10,506,600 | 104,627,085 |
| Hong Kong Exchanges and Clearing Ltd. | | 1,269,700 | 39,556,281 |
|
| TOTAL HONG KONG | | | 144,183,366 |
|
| India - 1.3% | | | |
| Housing Development Finance Corp. Ltd. | | 1,456,978 | 43,695,352 |
| Ireland - 1.5% | | | |
| CRH PLC sponsored ADR | | 1,374,266 | 50,160,709 |
| Italy - 0.5% | | | |
| Interpump Group SpA | | 590,426 | 16,172,812 |
| Japan - 12.7% | | | |
| Azbil Corp. | | 857,470 | 23,860,986 |
| DENSO Corp. | | 298,000 | 13,836,117 |
| East Japan Railway Co. | | 262,800 | 23,857,255 |
| Fanuc Corp. | | 196,700 | 38,798,938 |
| Hoya Corp. | | 640,200 | 56,579,103 |
| Keyence Corp. | | 156,124 | 98,716,646 |
| Misumi Group, Inc. | | 1,612,100 | 40,526,199 |
| Nabtesco Corp. | | 517,400 | 16,471,327 |
| OSG Corp. | | 693,800 | 14,840,030 |
| Recruit Holdings Co. Ltd. | | 1,011,400 | 33,612,912 |
| SHO-BOND Holdings Co. Ltd. | | 474,800 | 18,427,206 |
| USS Co. Ltd. | | 2,169,400 | 42,017,358 |
|
| TOTAL JAPAN | | | 421,544,077 |
|
| Kenya - 0.5% | | | |
| Safaricom Ltd. | | 52,989,700 | 15,260,828 |
| Korea (South) - 0.3% | | | |
| BGF Retail Co. Ltd. | | 63,482 | 9,655,552 |
| Netherlands - 4.2% | | | |
| ASML Holding NV (Netherlands) | | 489,500 | 128,305,101 |
| Prosus NV (b) | | 177,600 | 12,247,118 |
|
| TOTAL NETHERLANDS | | | 140,552,219 |
|
| New Zealand - 0.6% | | | |
| Auckland International Airport Ltd. | | 3,094,340 | 18,441,722 |
| Norway - 1.0% | | | |
| Adevinta ASA: | | | |
| rights 11/12/19 (b) | | 412,400 | 63,052 |
| Class B | | 1,440,967 | 16,452,704 |
| Schibsted ASA (B Shares) | | 611,800 | 17,084,349 |
|
| TOTAL NORWAY | | | 33,600,105 |
|
| South Africa - 1.3% | | | |
| Clicks Group Ltd. | | 1,361,738 | 22,149,364 |
| Naspers Ltd. Class N | | 143,900 | 20,363,090 |
|
| TOTAL SOUTH AFRICA | | | 42,512,454 |
|
| Spain - 2.4% | | | |
| Amadeus IT Holding SA Class A | | 929,500 | 68,772,778 |
| Prosegur Compania de Seguridad SA (Reg.) | | 2,935,549 | 11,393,582 |
|
| TOTAL SPAIN | | | 80,166,360 |
|
| Sweden - 5.1% | | | |
| ASSA ABLOY AB (B Shares) | | 3,440,283 | 81,701,146 |
| Atlas Copco AB (A Shares) (a) | | 1,434,300 | 50,668,489 |
| Epiroc AB Class A (a) | | 2,162,100 | 24,317,663 |
| Fagerhult AB | | 618,001 | 3,661,014 |
| Loomis AB (B Shares) | | 234,727 | 9,067,512 |
|
| TOTAL SWEDEN | | | 169,415,824 |
|
| Switzerland - 10.8% | | | |
| Nestle SA (Reg. S) | | 1,793,049 | 191,822,791 |
| Roche Holding AG (participation certificate) | | 399,973 | 120,374,267 |
| Schindler Holding AG: | | | |
| (participation certificate) | | 179,658 | 43,926,518 |
| (Reg.) | | 18,350 | 4,337,780 |
|
| TOTAL SWITZERLAND | | | 360,461,356 |
|
| Taiwan - 1.6% | | | |
| Taiwan Semiconductor Manufacturing Co. Ltd. | | 5,275,000 | 51,596,503 |
| United Kingdom - 5.9% | | | |
| BAE Systems PLC | | 1,737,200 | 12,976,393 |
| Elementis PLC | | 2,617,462 | 5,041,717 |
| Informa PLC | | 1,524,466 | 15,304,057 |
| InterContinental Hotel Group PLC ADR | | 880,870 | 53,371,913 |
| London Stock Exchange Group PLC | | 296,800 | 26,747,269 |
| M&G PLC (b) | | 2,356,365 | 6,525,855 |
| Prudential PLC | | 2,406,365 | 42,031,586 |
| Rightmove PLC | | 2,178,200 | 16,889,687 |
| Spectris PLC | | 596,157 | 18,471,789 |
|
| TOTAL UNITED KINGDOM | | | 197,360,266 |
|
| United States of America - 19.3% | | | |
| Alphabet, Inc. Class A (b) | | 18,236 | 22,955,477 |
| Autoliv, Inc. | | 275,069 | 21,411,371 |
| Berkshire Hathaway, Inc. Class B (b) | | 164,584 | 34,987,267 |
| Black Knight, Inc. (b) | | 418,700 | 26,880,540 |
| Lam Research Corp. | | 72,600 | 19,677,504 |
| Marsh & McLennan Companies, Inc. | | 475,151 | 49,235,147 |
| Martin Marietta Materials, Inc. | | 132,500 | 34,703,075 |
| MasterCard, Inc. Class A | | 320,900 | 88,828,329 |
| Moody's Corp. | | 190,000 | 41,931,100 |
| MSCI, Inc. | | 182,300 | 42,760,288 |
| PayPal Holdings, Inc. (b) | | 203,100 | 21,142,710 |
| PriceSmart, Inc. | | 121,131 | 8,975,807 |
| ResMed, Inc. | | 331,000 | 48,961,520 |
| S&P Global, Inc. | | 160,100 | 41,304,199 |
| Sherwin-Williams Co. | | 87,800 | 50,249,696 |
| Visa, Inc. Class A | | 485,360 | 86,811,490 |
|
| TOTAL UNITED STATES OF AMERICA | | | 640,815,520 |
|
| TOTAL COMMON STOCKS | | | |
| (Cost $2,394,572,813) | | | 3,250,887,417 |
|
| Money Market Funds - 4.6% | | | |
| Fidelity Cash Central Fund 1.83% (c) | | 72,698,993 | 72,713,532 |
| Fidelity Securities Lending Cash Central Fund 1.84% (c)(d) | | 80,903,862 | 80,911,952 |
| TOTAL MONEY MARKET FUNDS | | | |
| (Cost $153,624,341) | | | 153,625,484 |
| TOTAL INVESTMENT IN SECURITIES - 102.3% | | | |
| (Cost $2,548,197,154) | | | 3,404,512,901 |
| NET OTHER ASSETS (LIABILITIES) - (2.3)% | | | (77,649,403) |
| NET ASSETS - 100% | | | $3,326,863,498 |
Categorizations in the Schedule of Investments are based on country or territory of incorporation.
Legend
(a) Security or a portion of the security is on loan at period end.
(b) Non-income producing
(c) Affiliated fund that is generally available only to investment companies and other accounts managed by Fidelity Investments. The rate quoted is the annualized seven-day yield of the fund at period end. A complete unaudited listing of the fund's holdings as of its most recent quarter end is available upon request. In addition, each Fidelity Central Fund's financial statements, which are not covered by the Fund's Report of Independent Registered Public Accounting Firm, are available on the SEC's website or upon request.
(d) Investment made with cash collateral received from securities on loan.
Affiliated Central Funds
Information regarding fiscal year to date income earned by the Fund from investments in Fidelity Central Funds is as follows:
| Fund | Income earned |
| Fidelity Cash Central Fund | $2,242,303 |
| Fidelity Securities Lending Cash Central Fund | 134,928 |
| Total | $2,377,231 |
Amounts in the income column in the above table include any capital gain distributions from underlying funds, which are presented in the corresponding line-item in the Statement of Operations, if applicable. Amount for Fidelity Securities Lending Cash Central Fund represents the income earned on investing cash collateral, less rebates paid to borrowers and any lending agent fees associated with the loan, plus any premium payments received for lending certain types of securities.
Investment Valuation
The following is a summary of the inputs used, as of October 31, 2019, involving the Fund's assets and liabilities carried at fair value. The inputs or methodology used for valuing securities may not be an indication of the risk associated with investing in those securities. For more information on valuation inputs, and their aggregation into the levels used below, please refer to the Investment Valuation section in the accompanying Notes to Financial Statements.
| | Valuation Inputs at Reporting Date: |
| Description | Total | Level 1 | Level 2 | Level 3 |
| Investments in Securities: | | | | |
| Equities: | | | | |
| Communication Services | $104,010,154 | $104,010,154 | $-- | $-- |
| Consumer Discretionary | 284,235,659 | 138,494,373 | 145,741,286 | -- |
| Consumer Staples | 249,940,808 | 58,118,017 | 191,822,791 | -- |
| Energy | 7,889,316 | 7,889,316 | -- | -- |
| Financials | 553,863,376 | 260,891,204 | 292,972,172 | -- |
| Health Care | 315,645,159 | 48,961,520 | 266,683,639 | -- |
| Industrials | 709,960,271 | 410,307,143 | 299,653,128 | -- |
| Information Technology | 759,947,929 | 330,585,140 | 429,362,789 | -- |
| Materials | 235,761,560 | 235,761,560 | -- | -- |
| Real Estate | 29,633,185 | 29,633,185 | -- | -- |
| Money Market Funds | 153,625,484 | 153,625,484 | -- | -- |
| Total Investments in Securities: | $3,404,512,901 | $1,778,277,096 | $1,626,235,805 | $-- |
See accompanying notes which are an integral part of the financial statements.
Financial Statements
Statement of Assets and Liabilities
| | | October 31, 2019 |
| Assets | | |
Investment in securities, at value (including securities loaned of $77,426,880) — See accompanying schedule:
Unaffiliated issuers (cost $2,394,572,813) | $3,250,887,417 | |
| Fidelity Central Funds (cost $153,624,341) | 153,625,484 | |
| Total Investment in Securities (cost $2,548,197,154) | | $3,404,512,901 |
| Foreign currency held at value (cost $43,450) | | 43,497 |
| Receivable for investments sold | | 2,249,726 |
| Receivable for fund shares sold | | 5,680,650 |
| Dividends receivable | | 10,280,087 |
| Distributions receivable from Fidelity Central Funds | | 118,775 |
| Prepaid expenses | | 5,202 |
| Other receivables | | 50,552 |
| Total assets | | 3,422,941,390 |
| Liabilities | | |
| Payable for investments purchased | $8,866,357 | |
| Payable for fund shares redeemed | 3,064,477 | |
| Accrued management fee | 2,084,883 | |
| Distribution and service plan fees payable | 91,107 | |
| Other affiliated payables | 471,923 | |
| Other payables and accrued expenses | 587,759 | |
| Collateral on securities loaned | 80,911,386 | |
| Total liabilities | | 96,077,892 |
| Net Assets | | $3,326,863,498 |
| Net Assets consist of: | | |
| Paid in capital | | $2,540,837,166 |
| Total accumulated earnings (loss) | | 786,026,332 |
| Net Assets | | $3,326,863,498 |
| Net Asset Value and Maximum Offering Price | | |
| Class A: | | |
| Net Asset Value and redemption price per share ($164,247,273 ÷ 10,924,461 shares)(a) | | $15.03 |
| Maximum offering price per share (100/94.25 of $15.03) | | $15.95 |
| Class M: | | |
| Net Asset Value and redemption price per share ($28,534,482 ÷ 1,904,127 shares)(a) | | $14.99 |
| Maximum offering price per share (100/96.50 of $14.99) | | $15.53 |
| Class C: | | |
| Net Asset Value and offering price per share ($57,291,006 ÷ 3,901,630 shares)(a) | | $14.68 |
| International Growth: | | |
| Net Asset Value, offering price and redemption price per share ($1,040,531,747 ÷ 68,645,880 shares) | | $15.16 |
| Class I: | | |
| Net Asset Value, offering price and redemption price per share ($953,359,949 ÷ 63,025,222 shares) | | $15.13 |
| Class Z: | | |
| Net Asset Value, offering price and redemption price per share ($1,082,899,041 ÷ 71,451,412 shares) | | $15.16 |
(a) Redemption price per share is equal to net asset value less any applicable contingent deferred sales charge.
See accompanying notes which are an integral part of the financial statements.
Statement of Operations
| | | Year ended October 31, 2019 |
| Investment Income | | |
| Dividends | | $49,174,852 |
| Non-Cash dividends | | 18,489,503 |
| Income from Fidelity Central Funds (including $134,928 from security lending) | | 2,377,231 |
| Income before foreign taxes withheld | | 70,041,586 |
| Less foreign taxes withheld | | (4,379,988) |
| Total income | | 65,661,598 |
| Expenses | | |
| Management fee | | |
| Basic fee | $18,652,747 | |
| Performance adjustment | 1,340,448 | |
| Transfer agent fees | 4,118,365 | |
| Distribution and service plan fees | 1,077,174 | |
| Accounting and security lending fees | 1,180,220 | |
| Custodian fees and expenses | 179,192 | |
| Independent trustees' fees and expenses | 14,735 | |
| Registration fees | 246,109 | |
| Audit | 78,145 | |
| Legal | 6,318 | |
| Miscellaneous | 17,029 | |
| Total expenses before reductions | 26,910,482 | |
| Expense reductions | (113,253) | |
| Total expenses after reductions | | 26,797,229 |
| Net investment income (loss) | | 38,864,369 |
| Realized and Unrealized Gain (Loss) | | |
| Net realized gain (loss) on: | | |
| Investment securities: | | |
| Unaffiliated issuers (net of foreign taxes of $4,604) | (16,750,977) | |
| Fidelity Central Funds | (605) | |
| Foreign currency transactions | (207,376) | |
| Total net realized gain (loss) | | (16,958,958) |
| Change in net unrealized appreciation (depreciation) on: | | |
| Investment securities: | | |
| Unaffiliated issuers (net of increase in deferred foreign taxes of $382,270) | 514,922,980 | |
| Fidelity Central Funds | 1,143 | |
| Assets and liabilities in foreign currencies | 144,276 | |
| Total change in net unrealized appreciation (depreciation) | | 515,068,399 |
| Net gain (loss) | | 498,109,441 |
| Net increase (decrease) in net assets resulting from operations | | $536,973,810 |
See accompanying notes which are an integral part of the financial statements.
Statement of Changes in Net Assets
| | Year ended October 31, 2019 | Year ended October 31, 2018 |
| Increase (Decrease) in Net Assets | | |
| Operations | | |
| Net investment income (loss) | $38,864,369 | $22,322,204 |
| Net realized gain (loss) | (16,958,958) | 5,803,153 |
| Change in net unrealized appreciation (depreciation) | 515,068,399 | (175,511,752) |
| Net increase (decrease) in net assets resulting from operations | 536,973,810 | (147,386,395) |
| Distributions to shareholders | (19,640,106) | (16,636,167) |
| Share transactions - net increase (decrease) | 555,139,771 | 95,038,479 |
| Total increase (decrease) in net assets | 1,072,473,475 | (68,984,084) |
| Net Assets | | |
| Beginning of period | 2,254,390,023 | 2,323,374,107 |
| End of period | $3,326,863,498 | $2,254,390,023 |
See accompanying notes which are an integral part of the financial statements.
Financial Highlights
Fidelity International Growth Fund Class A
| Years ended October 31, | 2019 | 2018 | 2017 | 2016 | 2015 |
| Selected Per–Share Data | | | | | |
| Net asset value, beginning of period | $12.47 | $13.34 | $10.88 | $11.30 | $11.01 |
| Income from Investment Operations | | | | | |
| Net investment income (loss)A | .15B | .09 | .07 | .12C | .07 |
| Net realized and unrealized gain (loss) | 2.48 | (.90) | 2.49 | (.48) | .28 |
| Total from investment operations | 2.63 | (.81) | 2.56 | (.36) | .35 |
| Distributions from net investment income | (.07) | (.04) | (.10) | (.05) | (.06) |
| Distributions from net realized gain | – | (.02) | – | (.01) | – |
| Total distributions | (.07) | (.06) | (.10) | (.06) | (.06) |
| Redemption fees added to paid in capitalA | – | – | –D | –D | –D |
| Net asset value, end of period | $15.03 | $12.47 | $13.34 | $10.88 | $11.30 |
| Total ReturnE,F | 21.25% | (6.12)% | 23.80% | (3.22)% | 3.20% |
| Ratios to Average Net AssetsG,H | | | | | |
| Expenses before reductions | 1.28% | 1.24% | 1.28% | 1.27% | 1.26% |
| Expenses net of fee waivers, if any | 1.28% | 1.23% | 1.28% | 1.27% | 1.26% |
| Expenses net of all reductions | 1.27% | 1.22% | 1.27% | 1.27% | 1.25% |
| Net investment income (loss) | 1.14%B | .64% | .62% | 1.05%C | .66% |
| Supplemental Data | | | | | |
| Net assets, end of period (000 omitted) | $164,247 | $138,802 | $156,988 | $221,861 | $184,878 |
| Portfolio turnover rateI | 21% | 34% | 22% | 29% | 26% |
A Calculated based on average shares outstanding during the period.
B Net investment income per share reflects a large, non-recurring dividend which amounted to $.07 per share. Excluding this non-recurring dividend, the ratio of net investment income (loss) to average net assets would have been .65%.
C Net investment income per share reflects a large, non-recurring dividend which amounted to $.04 per share. Excluding this non-recurring dividend, the ratio of net investment income (loss) to average net assets would have been .68%.
D Amount represents less than $.005 per share.
E Total returns would have been lower if certain expenses had not been reduced during the applicable periods shown.
F Total returns do not include the effect of the sales charges.
G Fees and expenses of any underlying Fidelity Central Funds are not included in the Fund's expense ratio. The Fund indirectly bears its proportionate share of the expenses of any underlying Fidelity Central Funds.
H Expense ratios reflect operating expenses of the class. Expenses before reductions do not reflect amounts reimbursed by the investment adviser or reductions from brokerage service arrangements or reductions from other expense offset arrangements and do not represent the amount paid by the class during periods when reimbursements or reductions occur. Expenses net of fee waivers reflect expenses after reimbursement by the investment adviser but prior to reductions from brokerage service arrangements or other expense offset arrangements. Expenses net of all reductions represent the net expenses paid by the class.
I Amount does not include the portfolio activity of any underlying Fidelity Central Funds.
See accompanying notes which are an integral part of the financial statements.
Fidelity International Growth Fund Class M
| Years ended October 31, | 2019 | 2018 | 2017 | 2016 | 2015 |
| Selected Per–Share Data | | | | | |
| Net asset value, beginning of period | $12.43 | $13.30 | $10.84 | $11.26 | $10.96 |
| Income from Investment Operations | | | | | |
| Net investment income (loss)A | .11B | .05 | .04 | .08C | .04 |
| Net realized and unrealized gain (loss) | 2.48 | (.90) | 2.49 | (.48) | .27 |
| Total from investment operations | 2.59 | (.85) | 2.53 | (.40) | .31 |
| Distributions from net investment income | (.03) | (.01) | (.07) | (.01) | (.01) |
| Distributions from net realized gain | – | (.02) | – | (.01) | – |
| Total distributions | (.03) | (.02)D | (.07) | (.02) | (.01) |
| Redemption fees added to paid in capitalA | – | – | –E | –E | –E |
| Net asset value, end of period | $14.99 | $12.43 | $13.30 | $10.84 | $11.26 |
| Total ReturnF,G | 20.92% | (6.40)% | 23.51% | (3.58)% | 2.85% |
| Ratios to Average Net AssetsH,I | | | | | |
| Expenses before reductions | 1.58% | 1.54% | 1.59% | 1.61% | 1.58% |
| Expenses net of fee waivers, if any | 1.58% | 1.53% | 1.59% | 1.61% | 1.58% |
| Expenses net of all reductions | 1.58% | 1.52% | 1.58% | 1.61% | 1.58% |
| Net investment income (loss) | .83%B | .34% | .31% | .71%C | .33% |
| Supplemental Data | | | | | |
| Net assets, end of period (000 omitted) | $28,534 | $26,479 | $33,597 | $27,966 | $28,833 |
| Portfolio turnover rateJ | 21% | 34% | 22% | 29% | 26% |
A Calculated based on average shares outstanding during the period.
B Net investment income per share reflects a large, non-recurring dividend which amounted to $.07 per share. Excluding this non-recurring dividend, the ratio of net investment income (loss) to average net assets would have been .34%.
C Net investment income per share reflects a large, non-recurring dividend which amounted to $.04 per share. Excluding this non-recurring dividend, the ratio of net investment income (loss) to average net assets would have been .34%.
D Total distributions of $.02 per share is comprised of distributions from net investment income of $.005 and distributions from net realized gain of $.015 per share.
E Amount represents less than $.005 per share.
F Total returns would have been lower if certain expenses had not been reduced during the applicable periods shown.
G Total returns do not include the effect of the sales charges.
H Fees and expenses of any underlying Fidelity Central Funds are not included in the Fund's expense ratio. The Fund indirectly bears its proportionate share of the expenses of any underlying Fidelity Central Funds.
I Expense ratios reflect operating expenses of the class. Expenses before reductions do not reflect amounts reimbursed by the investment adviser or reductions from brokerage service arrangements or reductions from other expense offset arrangements and do not represent the amount paid by the class during periods when reimbursements or reductions occur. Expenses net of fee waivers reflect expenses after reimbursement by the investment adviser but prior to reductions from brokerage service arrangements or other expense offset arrangements. Expenses net of all reductions represent the net expenses paid by the class.
J Amount does not include the portfolio activity of any underlying Fidelity Central Funds.
See accompanying notes which are an integral part of the financial statements.
Fidelity International Growth Fund Class C
| Years ended October 31, | 2019 | 2018 | 2017 | 2016 | 2015 |
| Selected Per–Share Data | | | | | |
| Net asset value, beginning of period | $12.20 | $13.10 | $10.67 | $11.12 | $10.87 |
| Income from Investment Operations | | | | | |
| Net investment income (loss)A | .05B | (.01) | (.02) | .03C | (.02) |
| Net realized and unrealized gain (loss) | 2.43 | (.89) | 2.47 | (.47) | .27 |
| Total from investment operations | 2.48 | (.90) | 2.45 | (.44) | .25 |
| Distributions from net investment income | – | – | (.02) | – | – |
| Distributions from net realized gain | – | – | – | (.01) | – |
| Total distributions | – | – | (.02) | (.01) | – |
| Redemption fees added to paid in capitalA | – | – | –D | –D | –D |
| Net asset value, end of period | $14.68 | $12.20 | $13.10 | $10.67 | $11.12 |
| Total ReturnE,F | 20.33% | (6.87)% | 22.96% | (3.98)% | 2.30% |
| Ratios to Average Net AssetsG,H | | | | | |
| Expenses before reductions | 2.04% | 1.99% | 2.04% | 2.07% | 2.06% |
| Expenses net of fee waivers, if any | 2.04% | 1.99% | 2.04% | 2.07% | 2.06% |
| Expenses net of all reductions | 2.03% | 1.98% | 2.04% | 2.06% | 2.05% |
| Net investment income (loss) | .38%B | (.11)% | (.15)% | .26%C | (.15)% |
| Supplemental Data | | | | | |
| Net assets, end of period (000 omitted) | $57,291 | $60,489 | $68,908 | $52,738 | $52,378 |
| Portfolio turnover rateI | 21% | 34% | 22% | 29% | 26% |
A Calculated based on average shares outstanding during the period.
B Net investment income per share reflects a large, non-recurring dividend which amounted to $.06 per share. Excluding this non-recurring dividend, the ratio of net investment income (loss) to average net assets would have been (.11) %.
C Net investment income per share reflects a large, non-recurring dividend which amounted to $.04 per share. Excluding this non-recurring dividend, the ratio of net investment income (loss) to average net assets would have been (.12) %.
D Amount represents less than $.005 per share.
E Total returns would have been lower if certain expenses had not been reduced during the applicable periods shown.
F Total returns do not include the effect of the contingent deferred sales charge.
G Fees and expenses of any underlying Fidelity Central Funds are not included in the Fund's expense ratio. The Fund indirectly bears its proportionate share of the expenses of any underlying Fidelity Central Funds.
H Expense ratios reflect operating expenses of the class. Expenses before reductions do not reflect amounts reimbursed by the investment adviser or reductions from brokerage service arrangements or reductions from other expense offset arrangements and do not represent the amount paid by the class during periods when reimbursements or reductions occur. Expenses net of fee waivers reflect expenses after reimbursement by the investment adviser but prior to reductions from brokerage service arrangements or other expense offset arrangements. Expenses net of all reductions represent the net expenses paid by the class.
I Amount does not include the portfolio activity of any underlying Fidelity Central Funds.
See accompanying notes which are an integral part of the financial statements.
Fidelity International Growth Fund
| Years ended October 31, | 2019 | 2018 | 2017 | 2016 | 2015 |
| Selected Per–Share Data | | | | | |
| Net asset value, beginning of period | $12.57 | $13.45 | $10.97 | $11.38 | $11.10 |
| Income from Investment Operations | | | | | |
| Net investment income (loss)A | .19B | .13 | .10 | .15C | .11 |
| Net realized and unrealized gain (loss) | 2.51 | (.92) | 2.51 | (.47) | .26 |
| Total from investment operations | 2.70 | (.79) | 2.61 | (.32) | .37 |
| Distributions from net investment income | (.11) | (.08) | (.13) | (.08) | (.09) |
| Distributions from net realized gain | – | (.02) | – | (.01) | – |
| Total distributions | (.11) | (.09)D | (.13) | (.09) | (.09) |
| Redemption fees added to paid in capitalA | – | – | –E | –E | –E |
| Net asset value, end of period | $15.16 | $12.57 | $13.45 | $10.97 | $11.38 |
| Total ReturnF | 21.66% | (5.89)% | 24.14% | (2.87)% | 3.36% |
| Ratios to Average Net AssetsG,H | | | | | |
| Expenses before reductions | .99% | .95% | 1.03% | .99% | .97% |
| Expenses net of fee waivers, if any | .99% | .95% | 1.03% | .99% | .97% |
| Expenses net of all reductions | .99% | .94% | 1.03% | .98% | .96% |
| Net investment income (loss) | 1.42%B | .93% | .87% | 1.34%C | .94% |
| Supplemental Data | | | | | |
| Net assets, end of period (000 omitted) | $1,040,532 | $811,101 | $961,775 | $1,038,771 | $938,348 |
| Portfolio turnover rateI | 21% | 34% | 22% | 29% | 26% |
A Calculated based on average shares outstanding during the period.
B Net investment income per share reflects a large, non-recurring dividend which amounted to $.07 per share. Excluding this non-recurring dividend, the ratio of net investment income (loss) to average net assets would have been .93%.
C Net investment income per share reflects a large, non-recurring dividend which amounted to $.04 per share. Excluding this non-recurring dividend, the ratio of net investment income (loss) to average net assets would have been .96%.
D Total distributions of $.09 per share is comprised of distributions from net investment income of $.079 and distributions from net realized gain of $.015 per share.
E Amount represents less than $.005 per share.
F Total returns would have been lower if certain expenses had not been reduced during the applicable periods shown.
G Fees and expenses of any underlying Fidelity Central Funds are not included in the Fund's expense ratio. The Fund indirectly bears its proportionate share of the expenses of any underlying Fidelity Central Funds.
H Expense ratios reflect operating expenses of the class. Expenses before reductions do not reflect amounts reimbursed by the investment adviser or reductions from brokerage service arrangements or reductions from other expense offset arrangements and do not represent the amount paid by the class during periods when reimbursements or reductions occur. Expenses net of fee waivers reflect expenses after reimbursement by the investment adviser but prior to reductions from brokerage service arrangements or other expense offset arrangements. Expenses net of all reductions represent the net expenses paid by the class.
I Amount does not include the portfolio activity of any underlying Fidelity Central Funds.
See accompanying notes which are an integral part of the financial statements.
Fidelity International Growth Fund Class I
| Years ended October 31, | 2019 | 2018 | 2017 | 2016 | 2015 |
| Selected Per–Share Data | | | | | |
| Net asset value, beginning of period | $12.55 | $13.43 | $10.95 | $11.36 | $11.08 |
| Income from Investment Operations | | | | | |
| Net investment income (loss)A | .20B | .13 | .11 | .15C | .11 |
| Net realized and unrealized gain (loss) | 2.49 | (.91) | 2.51 | (.47) | .27 |
| Total from investment operations | 2.69 | (.78) | 2.62 | (.32) | .38 |
| Distributions from net investment income | (.11) | (.09) | (.14) | (.08) | (.10) |
| Distributions from net realized gain | – | (.02) | – | (.01) | – |
| Total distributions | (.11) | (.10)D | (.14) | (.09) | (.10) |
| Redemption fees added to paid in capitalA | – | – | –E | –E | –E |
| Net asset value, end of period | $15.13 | $12.55 | $13.43 | $10.95 | $11.36 |
| Total ReturnF | 21.64% | (5.83)% | 24.23% | (2.87)% | 3.41% |
| Ratios to Average Net AssetsG,H | | | | | |
| Expenses before reductions | .97% | .93% | .98% | .98% | .98% |
| Expenses net of fee waivers, if any | .97% | .93% | .98% | .98% | .98% |
| Expenses net of all reductions | .97% | .92% | .97% | .98% | .97% |
| Net investment income (loss) | 1.44%B | .94% | .92% | 1.34%C | .94% |
| Supplemental Data | | | | | |
| Net assets, end of period (000 omitted) | $953,360 | $660,961 | $728,227 | $359,676 | $267,745 |
| Portfolio turnover rateI | 21% | 34% | 22% | 29% | 26% |
A Calculated based on average shares outstanding during the period.
B Net investment income per share reflects a large, non-recurring dividend which amounted to $.07 per share. Excluding this non-recurring dividend, the ratio of net investment income (loss) to average net assets would have been .96%.
C Net investment income per share reflects a large, non-recurring dividend which amounted to $.04 per share. Excluding this non-recurring dividend, the ratio of net investment income (loss) to average net assets would have been .97%.
D Total distributions of $.10 per share is comprised of distributions from net investment income of $.089 and distributions from net realized gain of $.015 per share.
E Amount represents less than $.005 per share.
F Total returns would have been lower if certain expenses had not been reduced during the applicable periods shown.
G Fees and expenses of any underlying Fidelity Central Funds are not included in the Fund's expense ratio. The Fund indirectly bears its proportionate share of the expenses of any underlying Fidelity Central Funds.
H Expense ratios reflect operating expenses of the class. Expenses before reductions do not reflect amounts reimbursed by the investment adviser or reductions from brokerage service arrangements or reductions from other expense offset arrangements and do not represent the amount paid by the class during periods when reimbursements or reductions occur. Expenses net of fee waivers reflect expenses after reimbursement by the investment adviser but prior to reductions from brokerage service arrangements or other expense offset arrangements. Expenses net of all reductions represent the net expenses paid by the class.
I Amount does not include the portfolio activity of any underlying Fidelity Central Funds.
See accompanying notes which are an integral part of the financial statements.
Fidelity International Growth Fund Class Z
| Years ended October 31, | 2019 | 2018 | 2017 | 2016 | 2015 |
| Selected Per–Share Data | | | | | |
| Net asset value, beginning of period | $12.57 | $13.45 | $10.97 | $11.38 | $11.10 |
| Income from Investment Operations | | | | | |
| Net investment income (loss)A | .22B | .15 | .13 | .16C | .12 |
| Net realized and unrealized gain (loss) | 2.50 | (.91) | 2.50 | (.47) | .27 |
| Total from investment operations | 2.72 | (.76) | 2.63 | (.31) | .39 |
| Distributions from net investment income | (.13) | (.10) | (.15) | (.09) | (.11) |
| Distributions from net realized gain | – | (.02) | – | (.01) | – |
| Total distributions | (.13) | (.12) | (.15) | (.10) | (.11) |
| Redemption fees added to paid in capitalA | – | – | –D | –D | –D |
| Net asset value, end of period | $15.16 | $12.57 | $13.45 | $10.97 | $11.38 |
| Total ReturnE | 21.85% | (5.71)% | 24.33% | (2.73)% | 3.52% |
| Ratios to Average Net AssetsF,G | | | | | |
| Expenses before reductions | .84% | .80% | .84% | .85% | .84% |
| Expenses net of fee waivers, if any | .84% | .80% | .84% | .85% | .84% |
| Expenses net of all reductions | .84% | .79% | .84% | .84% | .83% |
| Net investment income (loss) | 1.57%B | 1.08% | 1.05% | 1.48%C | 1.07% |
| Supplemental Data | | | | | |
| Net assets, end of period (000 omitted) | $1,082,899 | $556,558 | $373,878 | $16,977 | $897 |
| Portfolio turnover rateH | 21% | 34% | 22% | 29% | 26% |
A Calculated based on average shares outstanding during the period.
B Net investment income per share reflects a large, non-recurring dividend which amounted to $.07 per share. Excluding this non-recurring dividend, the ratio of net investment income (loss) to average net assets would have been 1.08%.
C Net investment income per share reflects a large, non-recurring dividend which amounted to $.04 per share. Excluding this non-recurring dividend, the ratio of net investment income (loss) to average net assets would have been 1.10%.
D Amount represents less than $.005 per share.
E Total returns would have been lower if certain expenses had not been reduced during the applicable periods shown.
F Fees and expenses of any underlying Fidelity Central Funds are not included in the Fund's expense ratio. The Fund indirectly bears its proportionate share of the expenses of any underlying Fidelity Central Funds.
G Expense ratios reflect operating expenses of the class. Expenses before reductions do not reflect amounts reimbursed by the investment adviser or reductions from brokerage service arrangements or reductions from other expense offset arrangements and do not represent the amount paid by the class during periods when reimbursements or reductions occur. Expenses net of fee waivers reflect expenses after reimbursement by the investment adviser but prior to reductions from brokerage service arrangements or other expense offset arrangements. Expenses net of all reductions represent the net expenses paid by the class.
H Amount does not include the portfolio activity of any underlying Fidelity Central Funds.
See accompanying notes which are an integral part of the financial statements.
Notes to Financial Statements
For the period ended October 31, 2019
1. Organization.
Fidelity International Growth Fund (the Fund) is a fund of Fidelity Investment Trust (the Trust) and is authorized to issue an unlimited number of shares. The Trust is registered under the Investment Company Act of 1940, as amended (the 1940 Act), as an open-end management investment company organized as a Massachusetts business trust. The Fund offers Class A, Class M, Class C, International Growth, Class I and Class Z shares, each of which has equal rights as to assets and voting privileges. Each class has exclusive voting rights with respect to matters that affect that class. Effective March 1, 2019, Class C shares will automatically convert to Class A shares after a holding period of ten years from the initial date of purchase, with certain exceptions.
2. Investments in Fidelity Central Funds.
The Fund invests in Fidelity Central Funds, which are open-end investment companies generally available only to other investment companies and accounts managed by the investment adviser and its affiliates. The Fund's Schedule of Investments lists each of the Fidelity Central Funds held as of period end, if any, as an investment of the Fund, but does not include the underlying holdings of each Fidelity Central Fund. As an Investing Fund, the Fund indirectly bears its proportionate share of the expenses of the underlying Fidelity Central Funds.
The Money Market Central Funds seek preservation of capital and current income and are managed by Fidelity Investments Money Management, Inc. (FIMM), an affiliate of the investment adviser. Annualized expenses of the Money Market Central Funds as of their most recent shareholder report date ranged from less than .005% to .01%.
A complete unaudited list of holdings for each Fidelity Central Fund is available upon request or at the Securities and Exchange Commission (the SEC) website at www.sec.gov. In addition, the financial statements of the Fidelity Central Funds, which are not covered by the Fund's Report of Independent Registered Public Accounting Firm, are available on the SEC website or upon request.
3. Significant Accounting Policies.
The Fund is an investment company and applies the accounting and reporting guidance of the Financial Accounting Standards Board (FASB) Accounting Standards Codification Topic 946 Financial Services – Investments Companies. The financial statements have been prepared in conformity with accounting principles generally accepted in the United States of America (GAAP), which require management to make certain estimates and assumptions at the date of the financial statements. Actual results could differ from those estimates. Subsequent events, if any, through the date that the financial statements were issued have been evaluated in the preparation of the financial statements. The following summarizes the significant accounting policies of the Fund:
Investment Valuation. Investments are valued as of 4:00 p.m. Eastern time on the last calendar day of the period. The Board of Trustees (the Board) has delegated the day to day responsibility for the valuation of the Fund's investments to the Fair Value Committee (the Committee) established by the Fund's investment adviser. In accordance with valuation policies and procedures approved by the Board, the Fund attempts to obtain prices from one or more third party pricing vendors or brokers to value its investments. When current market prices, quotations or currency exchange rates are not readily available or reliable, investments will be fair valued in good faith by the Committee, in accordance with procedures adopted by the Board. Factors used in determining fair value vary by investment type and may include market or investment specific events. The frequency with which these procedures are used cannot be predicted and they may be utilized to a significant extent. The Committee oversees the Fund's valuation policies and procedures and reports to the Board on the Committee's activities and fair value determinations. The Board monitors the appropriateness of the procedures used in valuing the Fund's investments and ratifies the fair value determinations of the Committee.
The Fund categorizes the inputs to valuation techniques used to value its investments into a disclosure hierarchy consisting of three levels as shown below:
- Level 1 – quoted prices in active markets for identical investments
- Level 2 – other significant observable inputs (including quoted prices for similar investments, interest rates, prepayment speeds, etc.)
- Level 3 – unobservable inputs (including the Fund's own assumptions based on the best information available)
Valuation techniques used to value the Fund's investments by major category are as follows:
Equity securities, including restricted securities, for which market quotations are readily available, are valued at the last reported sale price or official closing price as reported by a third party pricing vendor on the primary market or exchange on which they are traded and are categorized as Level 1 in the hierarchy. In the event there were no sales during the day or closing prices are not available, securities are valued at the last quoted bid price or may be valued using the last available price and are generally categorized as Level 2 in the hierarchy. For foreign equity securities, when market or security specific events arise, comparisons to the valuation of American Depositary Receipts (ADRs), futures contracts, Exchange-Traded Funds (ETFs) and certain indexes as well as quoted prices for similar securities may be used and would be categorized as Level 2 in the hierarchy. For equity securities, including restricted securities, where observable inputs are limited, assumptions about market activity and risk are used and these securities may be categorized as Level 3 in the hierarchy.
Investments in open-end mutual funds, including the Fidelity Central Funds, are valued at their closing net asset value (NAV) each business day and are categorized as Level 1 in the hierarchy.
Changes in valuation techniques may result in transfers in or out of an assigned level within the disclosure hierarchy. The aggregate value of investments by input level as of October 31, 2019 is included at the end of the Fund's Schedule of Investments.
Foreign Currency. The Fund may use foreign currency contracts to facilitate transactions in foreign-denominated securities. Gains and losses from these transactions may arise from changes in the value of the foreign currency or if the counterparties do not perform under the contracts' terms.
Foreign-denominated assets, including investment securities, and liabilities are translated into U.S. dollars at the exchange rates at period end. Purchases and sales of investment securities, income and dividends received and expenses denominated in foreign currencies are translated into U.S. dollars at the exchange rate in effect on the transaction date.
The effects of exchange rate fluctuations on investments are included with the net realized and unrealized gain (loss) on investment securities. Other foreign currency transactions resulting in realized and unrealized gain (loss) are disclosed separately.
Investment Transactions and Income. For financial reporting purposes, the Fund's investment holdings and NAV include trades executed through the end of the last business day of the period. The NAV per share for processing shareholder transactions is calculated as of the close of business of the New York Stock Exchange (NYSE), normally 4:00 p.m. Eastern time and includes trades executed through the end of the prior business day. Gains and losses on securities sold are determined on the basis of identified cost and include proceeds received from litigation. Dividend income is recorded on the ex-dividend date, except for certain dividends from foreign securities where the ex-dividend date may have passed, which are recorded as soon as the Fund is informed of the ex-dividend date. Non-cash dividends included in dividend income, if any, are recorded at the fair market value of the securities received. Income and capital gain distributions from Fidelity Central Funds, if any, are recorded on the ex-dividend date. Certain distributions received by the Fund represent a return of capital or capital gain. The Fund determines the components of these distributions subsequent to the ex-dividend date, based upon receipt of tax filings or other correspondence relating to the underlying investment. These distributions are recorded as a reduction of cost of investments and/or as a realized gain. Large, non-recurring dividends recognized by the Fund are presented separately on the Statement of Operations as "Non-cash dividends" and the impact of these dividends is presented in the Financial Highlights. Investment income is recorded net of foreign taxes withheld where recovery of such taxes is uncertain.
Class Allocations and Expenses. Investment income, realized and unrealized capital gains and losses, common expenses of the Fund, and certain fund-level expense reductions, if any, are allocated daily on a pro-rata basis to each class based on the relative net assets of each class to the total net assets of the Fund. Each class differs with respect to transfer agent and distribution and service plan fees incurred. Certain expense reductions may also differ by class. For the reporting period, the allocated portion of income and expenses to each class as a percent of its average net assets may vary due to the timing of recording these transactions in relation to fluctuating net assets of the classes. Expenses directly attributable to a fund are charged to that fund. Expenses attributable to more than one fund are allocated among the respective funds on the basis of relative net assets or other appropriate methods. Expense estimates are accrued in the period to which they relate and adjustments are made when actual amounts are known.
Income Tax Information and Distributions to Shareholders. Each year, the Fund intends to qualify as a regulated investment company under Subchapter M of the Internal Revenue Code, including distributing substantially all of its taxable income and realized gains. As a result, no provision for U.S. Federal income taxes is required. As of October 31, 2019, the Fund did not have any unrecognized tax benefits in the financial statements; nor is the Fund aware of any tax positions for which it is reasonably possible that the total amounts of unrecognized tax benefits will significantly change in the next twelve months. The Fund files a U.S. federal tax return, in addition to state and local tax returns as required. The Fund's federal income tax returns are subject to examination by the Internal Revenue Service (IRS) for a period of three fiscal years after they are filed. State and local tax returns may be subject to examination for an additional fiscal year depending on the jurisdiction. Foreign taxes are provided for based on the Fund's understanding of the tax rules and rates that exist in the foreign markets in which it invests. The Fund is subject to a tax imposed on capital gains by certain countries in which it invests. An estimated deferred tax liability for net unrealized appreciation on the applicable securities is included in Other payables and accrued expenses on the Statement of Assets & Liabilities.
Distributions are declared and recorded on the ex-dividend date. Income and capital gain distributions are declared separately for each class. Income and capital gain distributions are determined in accordance with income tax regulations, which may differ from GAAP. In addition, the Fund claimed a portion of the payment made to redeeming shareholders as a distribution for income tax purposes.
Capital accounts within the financial statements are adjusted for permanent book-tax differences. These adjustments have no impact on net assets or the results of operations. Capital accounts are not adjusted for temporary book-tax differences which will reverse in a subsequent period.
Book-tax differences are primarily due to foreign currency transactions, certain foreign taxes, capital loss carryforwards, passive foreign investment companies (PFIC) and losses deferred due to wash sales.
As of period end, the cost and unrealized appreciation (depreciation) in securities, and derivatives if applicable, for federal income tax purposes were as follows:
| Gross unrealized appreciation | $902,446,937 |
| Gross unrealized depreciation | (50,586,201) |
| Net unrealized appreciation (depreciation) | $851,860,736 |
| Tax Cost | $2,552,652,165 |
The tax-based components of distributable earnings as of period end were as follows:
| Undistributed ordinary income | $36,406,348 |
| Capital loss carryforward | $(101,854,822) |
| Net unrealized appreciation (depreciation) on securities and other investments | $851,857,076 |
Capital loss carryforwards are only available to offset future capital gains of the Fund to the extent provided by regulations and may be limited. Under the Regulated Investment Company Modernization Act of 2010 (the Act), the Fund is permitted to carry forward capital losses incurred in taxable years beginning after December 22, 2010 for an unlimited period and such capital losses are required to be used prior to any losses that expire. The capital loss carryforward information presented below, including any applicable limitation, is estimated as of fiscal period end and is subject to adjustment.
| No expiration | |
| Short-term | $(91,578,883) |
| Long-term | (10,275,939) |
| Total no expiration | $(101,854,822) |
The tax character of distributions paid was as follows:
| | October 31, 2019 | October 31, 2018 |
| Ordinary Income | $19,640,106 | $ 16,636,167 |
4. Purchases and Sales of Investments.
Purchases and sales of securities, other than short-term securities, aggregated $1,177,061,095 and $550,205,417, respectively.
5. Fees and Other Transactions with Affiliates.
Management Fee. Fidelity Management & Research Company (the investment adviser) and its affiliates provide the Fund with investment management related services for which the Fund pays a monthly management fee. The management fee is the sum of an individual fund fee rate that is based on an annual rate of .45% of the Fund's average net assets and an annualized group fee rate that averaged .24% during the period. The group fee rate is based upon the average net assets of all the mutual funds advised by the investment adviser, including any mutual funds previously advised by the investment adviser that are currently advised by Fidelity SelectCo, LLC, an affiliate of the investment adviser. The group fee rate decreases as assets under management increase and increases as assets under management decrease. In addition, the management fee is subject to a performance adjustment (up to a maximum of +/- .20% of the Fund's average net assets over a 36 month performance period). The upward or downward adjustment to the management fee is based on the relative investment performance of International Growth as compared to its benchmark index, the MSCI EAFE Growth Index, over the same 36 month performance period. For the reporting period, the total annual management fee rate, including the performance adjustment, was .73% of the Fund's average net assets. The performance adjustment included in the management fee rate may be higher or lower than the maximum performance adjustment rate due to the difference between the average net assets for the reporting and performance periods.
Distribution and Service Plan Fees. In accordance with Rule 12b-1 of the 1940 Act, the Fund has adopted separate Distribution and Service Plans for each class of shares. Certain classes pay Fidelity Distributors Corporation (FDC), an affiliate of the investment adviser, separate Distribution and Service Fees, each of which is based on an annual percentage of each class' average net assets. In addition, FDC may pay financial intermediaries for selling shares of the Fund and providing shareholder support services. For the period, the Distribution and Service Fee rates, total fees and amounts retained by FDC were as follows:
| | Distribution Fee | Service Fee | Total Fees | Retained by FDC |
| Class A | -% | .25% | $373,649 | $8,181 |
| Class M | .25% | .25% | 136,238 | 415 |
| Class C | .75% | .25% | 567,287 | 69,267 |
| | | | $1,077,174 | $77,863 |
Sales Load. FDC may receive a front-end sales charge of up to 5.75% for selling Class A shares and 3.50% for selling Class M shares, some of which is paid to financial intermediaries for selling shares of the Fund. Depending on the holding period, FDC may receive contingent deferred sales charges levied on Class A, Class M and Class C redemptions. The deferred sales charges are 1.00% for Class C shares, 1.00% for certain purchases of Class A shares and .25% for certain purchases of Class M shares.
For the period, sales charge amounts retained by FDC were as follows:
| | Retained by FDC |
| Class A | $51,894 |
| Class M | 3,986 |
| Class C(a) | 3,915 |
| | $59,795 |
(a) When Class C shares are initially sold, FDC pays commissions from its own resources to financial intermediaries through which the sales are made.
Transfer Agent Fees. Fidelity Investments Institutional Operations Company, Inc., (FIIOC), an affiliate of the investment adviser, is the transfer, dividend disbursing and shareholder servicing agent for each class of the Fund. FIIOC receives account fees and asset-based fees that vary according to the account size and type of account of the shareholders of the respective classes of the Fund, except for Class Z. FIIOC receives an asset-based fee of Class Z's average net assets. FIIOC pays for typesetting, printing and mailing of shareholder reports, except proxy statements.
For the period, transfer agent fees for each class were as follows:
| | Amount | % of Class-Level Average Net Assets |
| Class A | $344,044 | .23 |
| Class M | 77,832 | .29 |
| Class C | 136,866 | .24 |
| International Growth | 1,855,802 | .20 |
| Class I | 1,350,517 | .17 |
| Class Z | 353,304 | .05 |
| | $4,118,365 | |
Accounting and Security Lending Fees. Fidelity Service Company, Inc. (FSC), an affiliate of the investment adviser, maintains the Fund's accounting records. The accounting fee is based on the level of average net assets for each month. Prior to April 1, 2019, FSC had a separate agreement with the Fund for administration of the security lending program, based on the number and duration of lending transactions. For the period, the total fees paid for accounting and administration of securities lending were equivalent to an annual rate of .04%.
Brokerage Commissions. The Fund placed a portion of its portfolio transactions with brokerage firms which are affiliates of the investment adviser. Brokerage commissions are included in net realized gain (loss) and change in net unrealized appreciation (depreciation) in the Statement of Operations. The commissions paid to these affiliated firms were $1,838 for the period.
Interfund Trades. The Fund may purchase from or sell securities to other Fidelity Funds under procedures adopted by the Board. The procedures have been designed to ensure these interfund trades are executed in accordance with Rule 17a-7 of the 1940 Act. Interfund trades are included within the respective purchases and sales amounts shown in the Purchases and Sales of Investments note.
6. Committed Line of Credit.
The Fund participates with other funds managed by the investment adviser or an affiliate in a $4.25 billion credit facility (the "line of credit") to be utilized for temporary or emergency purposes to fund shareholder redemptions or for other short-term liquidity purposes. The Fund has agreed to pay commitment fees on its pro-rata portion of the line of credit, which amounted to $6,952 and is reflected in Miscellaneous expenses on the Statement of Operations. During the period, the Fund did not borrow on this line of credit.
7. Security Lending.
The Fund lends portfolio securities from time to time in order to earn additional income. For equity securities, lending agents are used, including National Financial Services (NFS), an affiliate of the Fund. Pursuant to a securities lending agreement, NFS will receive a fee, which is capped at 9.9% of daily lending revenue, for its services as lending agent. The Fund may lend securities to certain qualified borrowers, including NFS. On the settlement date of the loan, the Fund receives collateral (in the form of U.S. Treasury obligations, letters of credit and/or cash) against the loaned securities and maintains collateral in an amount not less than 100% of the market value of the loaned securities during the period of the loan. The market value of the loaned securities is determined at the close of business of the Fund and any additional required collateral is delivered to the Fund on the next business day. The Fund or borrower may terminate the loan at any time, and if the borrower defaults on its obligation to return the securities loaned because of insolvency or other reasons, the Fund may apply collateral received from the borrower against the obligation. The Fund may experience delays and costs in recovering the securities loaned. Any cash collateral received is invested in the Fidelity Securities Lending Cash Central Fund. The value of loaned securities and cash collateral at period end are disclosed on the Fund's Statement of Assets and Liabilities. Security lending income represents the income earned on investing cash collateral, less rebates paid to borrowers and any lending agent fees associated with the loan, plus any premium payments received for lending certain types of securities. Security lending income is presented in the Statement of Operations as a component of income from Fidelity Central Funds. During the period, there were no securities loaned to NFS.
8. Expense Reductions.
Commissions paid to certain brokers with whom the investment adviser, or its affiliates, places trades on behalf of the Fund include an amount in addition to trade execution, which may be rebated back to the Fund to offset certain expenses. This amount totaled $94,901 for the period. In addition, through arrangements with the Fund's custodian, credits realized as a result of certain uninvested cash balances were used to reduce the Fund's expenses. During the period, custodian credits reduced the Fund's expenses by $421.
In addition, during the period the investment adviser reimbursed and/or waived a portion of fund-level operating expenses in the amount of $17,931.
9. Distributions to Shareholders.
Distributions to shareholders of each class were as follows:
| | Year ended
October 31, 2019 | Year ended
October 31, 2018 |
| Distributions to shareholders | | |
| Class A | $799,140 | $667,281 |
| Class M | 67,406 | 48,590 |
| International Growth | 6,773,948 | 6,746,881 |
| Class I | 5,925,234 | 5,822,889 |
| Class Z | 6,074,378 | 3,350,526 |
| Total | $19,640,106 | $16,636,167 |
10. Share Transactions.
Share transactions for each class were as follows and may contain automatic conversions between classes or exchanges between affiliated funds:
| | Shares | Shares | Dollars | Dollars |
| | Year ended October 31, 2019 | Year ended October 31, 2018 | Year ended October 31, 2019 | Year ended October 31, 2018 |
| Class A | | | | |
| Shares sold | 2,189,906 | 2,575,636 | $29,617,042 | $35,129,838 |
| Reinvestment of distributions | 65,987 | 49,581 | 797,127 | 663,775 |
| Shares redeemed | (2,460,516) | (3,261,091) | (33,266,170) | (44,291,373) |
| Net increase (decrease) | (204,623) | (635,874) | $(2,852,001) | $(8,497,760) |
| Class M | | | | |
| Shares sold | 222,854 | 349,635 | $2,985,191 | $4,771,254 |
| Reinvestment of distributions | 5,584 | 3,624 | 67,395 | 48,527 |
| Shares redeemed | (454,872) | (748,765) | (6,157,629) | (10,142,042) |
| Net increase (decrease) | (226,434) | (395,506) | $(3,105,043) | $(5,322,261) |
| Class C | | | | |
| Shares sold | 508,793 | 1,082,980 | $6,676,253 | $14,574,249 |
| Shares redeemed | (1,564,780) | (1,386,849) | (20,317,328) | (18,440,770) |
| Net increase (decrease) | (1,055,987) | (303,869) | $(13,641,075) | $(3,866,521) |
| International Growth | | | | |
| Shares sold | 36,412,153 | 19,748,706 | $507,126,063 | $271,435,270 |
| Reinvestment of distributions | 517,780 | 469,327 | 6,291,030 | 6,314,733 |
| Shares redeemed | (32,793,153) | (27,217,331) | (452,090,577) | (371,174,329) |
| Net increase (decrease) | 4,136,780 | (6,999,298) | $61,326,516 | $(93,424,326) |
| Class I | | | | |
| Shares sold | 29,610,999 | 23,675,678 | $400,447,377 | $322,195,941 |
| Reinvestment of distributions | 473,993 | 352,717 | 5,744,799 | 4,735,014 |
| Shares redeemed | (19,735,978) | (25,574,189) | (262,889,780) | (351,174,190) |
| Net increase (decrease) | 10,349,014 | (1,545,794) | $143,302,396 | $(24,243,235) |
| Class Z | | | | |
| Shares sold | 50,657,565 | 27,518,013 | $674,068,605 | $376,275,009 |
| Reinvestment of distributions | 188,590 | 140,992 | 2,287,593 | 1,894,059 |
| Shares redeemed | (23,664,663) | (11,179,068) | (306,247,220) | (147,776,486) |
| Net increase (decrease) | 27,181,492 | 16,479,937 | $370,108,978 | $230,392,582 |
11. Other.
The Fund's organizational documents provide former and current trustees and officers with a limited indemnification against liabilities arising in connection with the performance of their duties to the Fund. In the normal course of business, the Fund may also enter into contracts that provide general indemnifications. The Fund's maximum exposure under these arrangements is unknown as this would be dependent on future claims that may be made against the Fund. The risk of material loss from such claims is considered remote.
Report of Independent Registered Public Accounting Firm
To the Board of Trustees of Fidelity Investment Trust and Shareholders of Fidelity International Growth Fund:
Opinion on the Financial Statements
We have audited the accompanying statement of assets and liabilities, including the schedule of investments, of Fidelity International Growth Fund (one of the funds constituting Fidelity Investment Trust, referred to hereafter as the “Fund”) as of October 31, 2019, the related statement of operations for the year ended October 31, 2019, the statement of changes in net assets for each of the two years in the period ended October 31, 2019, including the related notes, and the financial highlights for each of the five years in the period ended October 31, 2019 (collectively referred to as the “financial statements”). In our opinion, the financial statements present fairly, in all material respects, the financial position of the Fund as of October 31, 2019, the results of its operations for the year then ended, the changes in its net assets for each of the two years in the period ended October 31, 2019 and the financial highlights for each of the five years in the period ended October 31, 2019 in conformity with accounting principles generally accepted in the United States of America.
Basis for Opinion
These financial statements are the responsibility of the Fund’s management. Our responsibility is to express an opinion on the Fund’s financial statements based on our audits. We are a public accounting firm registered with the Public Company Accounting Oversight Board (United States) (PCAOB) and are required to be independent with respect to the Fund in accordance with the U.S. federal securities laws and the applicable rules and regulations of the Securities and Exchange Commission and the PCAOB.
We conducted our audits of these financial statements in accordance with the standards of the PCAOB. Those standards require that we plan and perform the audit to obtain reasonable assurance about whether the financial statements are free of material misstatement, whether due to error or fraud.
Our audits included performing procedures to assess the risks of material misstatement of the financial statements, whether due to error or fraud, and performing procedures that respond to those risks. Such procedures included examining, on a test basis, evidence regarding the amounts and disclosures in the financial statements. Our audits also included evaluating the accounting principles used and significant estimates made by management, as well as evaluating the overall presentation of the financial statements. Our procedures included confirmation of securities owned as of October 31, 2019 by correspondence with the custodian and brokers; when replies were not received from brokers, we performed other auditing procedures. We believe that our audits provide a reasonable basis for our opinion.
PricewaterhouseCoopers LLP
Boston, Massachusetts
December 11, 2019
We have served as the auditor of one or more investment companies in the Fidelity group of funds since 1932.
Trustees and Officers
The Trustees, Members of the Advisory Board (if any), and officers of the trust and fund, as applicable, are listed below. The Board of Trustees governs the fund and is responsible for protecting the interests of shareholders. The Trustees are experienced executives who meet periodically throughout the year to oversee the fund's activities, review contractual arrangements with companies that provide services to the fund, oversee management of the risks associated with such activities and contractual arrangements, and review the fund's performance. Except for Jonathan Chiel, each of the Trustees oversees 298 funds. Mr. Chiel oversees 171 funds.
The Trustees hold office without limit in time except that (a) any Trustee may resign; (b) any Trustee may be removed by written instrument, signed by at least two-thirds of the number of Trustees prior to such removal; (c) any Trustee who requests to be retired or who has become incapacitated by illness or injury may be retired by written instrument signed by a majority of the other Trustees; and (d) any Trustee may be removed at any special meeting of shareholders by a two-thirds vote of the outstanding voting securities of the trust. Each Trustee who is not an interested person (as defined in the 1940 Act) of the trust and the fund is referred to herein as an Independent Trustee. Each Independent Trustee shall retire not later than the last day of the calendar year in which his or her 75th birthday occurs. The Independent Trustees may waive this mandatory retirement age policy with respect to individual Trustees. Officers and Advisory Board Members hold office without limit in time, except that any officer or Advisory Board Member may resign or may be removed by a vote of a majority of the Trustees at any regular meeting or any special meeting of the Trustees. Except as indicated, each individual has held the office shown or other offices in the same company for the past five years.
The fund's Statement of Additional Information (SAI) includes more information about the Trustees. To request a free copy, call Fidelity at 1-800-544-8544 if you’re an individual investing directly with Fidelity, call 1-800-835-5092 if you’re a plan sponsor or participant with Fidelity as your recordkeeper or call 1-877-208-0098 on institutional accounts or if you’re an advisor or invest through one.
Experience, Skills, Attributes, and Qualifications of the Trustees. The Governance and Nominating Committee has adopted a statement of policy that describes the experience, qualifications, attributes, and skills that are necessary and desirable for potential Independent Trustee candidates (Statement of Policy). The Board believes that each Trustee satisfied at the time he or she was initially elected or appointed a Trustee, and continues to satisfy, the standards contemplated by the Statement of Policy. The Governance and Nominating Committee also engages professional search firms to help identify potential Independent Trustee candidates who have the experience, qualifications, attributes, and skills consistent with the Statement of Policy. From time to time, additional criteria based on the composition and skills of the current Independent Trustees, as well as experience or skills that may be appropriate in light of future changes to board composition, business conditions, and regulatory or other developments, have also been considered by the professional search firms and the Governance and Nominating Committee. In addition, the Board takes into account the Trustees' commitment and participation in Board and committee meetings, as well as their leadership of standing and ad hoc committees throughout their tenure.
In determining that a particular Trustee was and continues to be qualified to serve as a Trustee, the Board has considered a variety of criteria, none of which, in isolation, was controlling. The Board believes that, collectively, the Trustees have balanced and diverse experience, qualifications, attributes, and skills, which allow the Board to operate effectively in governing the fund and protecting the interests of shareholders. Information about the specific experience, skills, attributes, and qualifications of each Trustee, which in each case led to the Board's conclusion that the Trustee should serve (or continue to serve) as a trustee of the fund, is provided below.
Board Structure and Oversight Function. James C. Curvey is an interested person and currently serves as Chairman. The Trustees have determined that an interested Chairman is appropriate and benefits shareholders because an interested Chairman has a personal and professional stake in the quality and continuity of services provided to the fund. Independent Trustees exercise their informed business judgment to appoint an individual of their choosing to serve as Chairman, regardless of whether the Trustee happens to be independent or a member of management. The Independent Trustees have determined that they can act independently and effectively without having an Independent Trustee serve as Chairman and that a key structural component for assuring that they are in a position to do so is for the Independent Trustees to constitute a substantial majority for the Board. The Independent Trustees also regularly meet in executive session. Ned C. Lautenbach serves as Chairman of the Independent Trustees and as such (i) acts as a liaison between the Independent Trustees and management with respect to matters important to the Independent Trustees and (ii) with management prepares agendas for Board meetings.
Fidelity® funds are overseen by different Boards of Trustees. The fund's Board oversees Fidelity's high income and certain equity funds, and other Boards oversee Fidelity's investment-grade bond, money market, asset allocation, and other equity funds. The asset allocation funds may invest in Fidelity® funds overseen by the fund's Board. The use of separate Boards, each with its own committee structure, allows the Trustees of each group of Fidelity® funds to focus on the unique issues of the funds they oversee, including common research, investment, and operational issues. On occasion, the separate Boards establish joint committees to address issues of overlapping consequences for the Fidelity® funds overseen by each Board.
The Trustees operate using a system of committees to facilitate the timely and efficient consideration of all matters of importance to the Trustees, the fund, and fund shareholders and to facilitate compliance with legal and regulatory requirements and oversight of the fund's activities and associated risks. The Board, acting through its committees, has charged FMR and its affiliates with (i) identifying events or circumstances the occurrence of which could have demonstrably adverse effects on the fund's business and/or reputation; (ii) implementing processes and controls to lessen the possibility that such events or circumstances occur or to mitigate the effects of such events or circumstances if they do occur; and (iii) creating and maintaining a system designed to evaluate continuously business and market conditions in order to facilitate the identification and implementation processes described in (i) and (ii) above. Because the day-to-day operations and activities of the fund are carried out by or through FMR, its affiliates, and other service providers, the fund's exposure to risks is mitigated but not eliminated by the processes overseen by the Trustees. While each of the Board's committees has responsibility for overseeing different aspects of the fund's activities, oversight is exercised primarily through the Operations, Audit, and Compliance Committees. Appropriate personnel, including but not limited to the fund's Chief Compliance Officer (CCO), FMR's internal auditor, the independent accountants, the fund's Treasurer and portfolio management personnel, make periodic reports to the Board's committees, as appropriate, including an annual review of Fidelity's risk management program for the Fidelity® funds. The responsibilities of each standing committee, including their oversight responsibilities, are described further under "Standing Committees of the Trustees."
Interested Trustees*:
Correspondence intended for a Trustee who is an interested person may be sent to Fidelity Investments, 245 Summer Street, Boston, Massachusetts 02210.
Name, Year of Birth; Principal Occupations and Other Relevant Experience+
Jonathan Chiel (1957)
Year of Election or Appointment: 2016
Trustee
Mr. Chiel also serves as Trustee of other Fidelity® funds. Mr. Chiel is Executive Vice President and General Counsel for FMR LLC (diversified financial services company, 2012-present). Previously, Mr. Chiel served as general counsel (2004-2012) and senior vice president and deputy general counsel (2000-2004) for John Hancock Financial Services; a partner with Choate, Hall & Stewart (1996-2000) (law firm); and an Assistant United States Attorney for the United States Attorney’s Office of the District of Massachusetts (1986-95), including Chief of the Criminal Division (1993-1995). Mr. Chiel is a director on the boards of the Boston Bar Foundation and the Maimonides School.
James C. Curvey (1935)
Year of Election or Appointment: 2007
Trustee
Chairman of the Board of Trustees
Mr. Curvey also serves as Trustee of other Fidelity® funds. Mr. Curvey is Vice Chairman (2007-present) and Director of FMR LLC (diversified financial services company). In addition, Mr. Curvey is an Overseer Emeritus for the Boston Symphony Orchestra, a Director of Artis-Naples, and a Trustee of Brewster Academy in Wolfeboro, New Hampshire. Previously, Mr. Curvey served as a Director of Fidelity Research & Analysis Co. (investment adviser firm, 2009-2018), Director of Fidelity Investments Money Management, Inc. (investment adviser firm, 2009-2014) and a Director of FMR and FMR Co., Inc. (investment adviser firms, 2007-2014).
* Determined to be an “Interested Trustee” by virtue of, among other things, his or her affiliation with the trust or various entities under common control with FMR.
+ The information includes the Trustee's principal occupation during the last five years and other information relating to the experience, attributes, and skills relevant to the Trustee's qualifications to serve as a Trustee, which led to the conclusion that the Trustee should serve as a Trustee for the fund.
Independent Trustees:
Correspondence intended for an Independent Trustee may be sent to Fidelity Investments, P.O. Box 55235, Boston, Massachusetts 02205-5235.
Name, Year of Birth; Principal Occupations and Other Relevant Experience+
Dennis J. Dirks (1948)
Year of Election or Appointment: 2005
Trustee
Mr. Dirks also serves as Trustee of other Fidelity® funds. Prior to his retirement in May 2003, Mr. Dirks was Chief Operating Officer and a member of the Board of The Depository Trust & Clearing Corporation (DTCC). He also served as President, Chief Operating Officer, and Board member of The Depository Trust Company (DTC) and President and Board member of the National Securities Clearing Corporation (NSCC). In addition, Mr. Dirks served as Chief Executive Officer and Board member of the Government Securities Clearing Corporation, Chief Executive Officer and Board member of the Mortgage-Backed Securities Clearing Corporation, as a Trustee and a member of the Finance Committee of Manhattan College (2005-2008), as a Trustee and a member of the Finance Committee of AHRC of Nassau County (2006-2008), as a member of the Independent Directors Council (IDC) Governing Council (2010-2015), and as a member of the Board of Directors for The Brookville Center for Children’s Services, Inc. (2009-2017). Mr. Dirks is a member of the Finance Committee (2016-present) and Board of Directors (2017-present) and is Treasurer (2018-present) of the Asolo Repertory Theatre.
Donald F. Donahue (1950)
Year of Election or Appointment: 2018
Trustee
Mr. Donahue also serves as a Trustee of other Fidelity® funds. Mr. Donahue is President and Chief Executive Officer of Miranda Partners, LLC (risk consulting for the financial services industry, 2012-present). Previously, Mr. Donahue served as a Member of the Advisory Board of certain Fidelity® funds (2015-2018) and Chief Executive Officer (2006-2012), Chief Operating Officer (2003-2006), and Managing Director, Customer Marketing and Development (1999-2003) of The Depository Trust & Clearing Corporation (financial markets infrastructure). Mr. Donahue serves as a Member (2007-present) and Co-Chairman (2016-present) of the Board of Directors of United Way of New York, Member of the Board of Directors of NYC Leadership Academy (2012-present) and Member of the Board of Advisors of Ripple Labs, Inc. (financial services, 2015-present). He also served as Chairman (2010-2012) and Member of the Board of Directors (2012-2013) of Omgeo, LLC (financial services), Treasurer of United Way of New York (2012-2016), and Member of the Board of Directors of XBRL US (financial services non-profit, 2009-2012) and the International Securities Services Association (2009-2012).
Alan J. Lacy (1953)
Year of Election or Appointment: 2008
Trustee
Mr. Lacy also serves as Trustee of other Fidelity® funds. Mr. Lacy serves as a Director of Bristol-Myers Squibb Company (global pharmaceuticals, 2008-present). He is a Trustee of the California Chapter of The Nature Conservancy (2015-present) and a Director of the Center for Advanced Study in the Behavioral Sciences at Stanford University (2015-present). In addition, Mr. Lacy served as Senior Adviser (2007-2014) of Oak Hill Capital Partners, L.P. (private equity) and also served as Chief Executive Officer (2005) and Vice Chairman (2005-2006) of Sears Holdings Corporation (retail) and Chief Executive Officer and Chairman of the Board of Sears, Roebuck and Co. (retail, 2000-2005). Previously, Mr. Lacy served as Chairman (2014-2017) and a member (2010-2017) of the Board of Directors of Dave & Buster’s Entertainment, Inc. (restaurant and entertainment complexes), as Chairman (2008-2011) and a member (2006-2015) of the Board of Trustees of the National Parks Conservation Association, and as a member of the Board of Directors for The Hillman Companies, Inc. (hardware wholesalers, 2010-2014), Earth Fare, Inc. (retail grocery, 2010-2014), and The Western Union Company (global money transfer, 2006-2011).
Ned C. Lautenbach (1944)
Year of Election or Appointment: 2000
Trustee
Chairman of the Independent Trustees
Mr. Lautenbach also serves as Trustee of other Fidelity® funds. Mr. Lautenbach currently serves as Chair (2018-present) and Member (2013-present) of the Board of Governors, State University System of Florida and is a member of the Council on Foreign Relations (1994-present). He is also a member and has most recently served as Chairman of the Board of Directors of Artis-Naples (2012-present). Previously, Mr. Lautenbach served as a member and then Lead Director of the Board of Directors of Eaton Corporation (diversified industrial, 1997-2016). He was also a Partner and Advisory Partner at Clayton, Dubilier & Rice, LLC (private equity investment, 1998-2010), as well as a Director of Sony Corporation (2006-2007). In addition, Mr. Lautenbach also had a 30-year career with IBM (technology company) during which time he served as Senior Vice President and a member of the Corporate Executive Committee (1968-1998).
Joseph Mauriello (1944)
Year of Election or Appointment: 2008
Trustee
Mr. Mauriello also serves as Trustee of other Fidelity® funds. Prior to his retirement in January 2006, Mr. Mauriello served in numerous senior management positions including Deputy Chairman and Chief Operating Officer (2004-2005), and Vice Chairman of Financial Services (2002-2004) of KPMG LLP US (professional services, 1965-2005). Mr. Mauriello currently serves as a member of the Independent Directors Council (IDC) Governing Council (2015-present). Previously, Mr. Mauriello served as a member of the Board of Directors of XL Group plc. (global insurance and re-insurance, 2006-2018).
Cornelia M. Small (1944)
Year of Election or Appointment: 2005
Trustee
Ms. Small also serves as Trustee of other Fidelity® funds. Ms. Small is a member of the Board of Directors (2009-present) and Chair of the Investment Committee (2010-present) of the Teagle Foundation. Ms. Small also serves on the Investment Committee of the Berkshire Taconic Community Foundation (2008-present). Previously, Ms. Small served as Chairperson (2002-2008) and a member of the Investment Committee and Chairperson (2008-2012) and a member of the Board of Trustees of Smith College. In addition, Ms. Small served as Chief Investment Officer, Director of Global Equity Investments, and a member of the Board of Directors of Scudder, Stevens & Clark and Scudder Kemper Investments.
Garnett A. Smith (1947)
Year of Election or Appointment: 2018
Trustee
Mr. Smith also serves as Trustee of other Fidelity® funds. Prior to Mr. Smith's retirement, he served as Chairman and Chief Executive Officer of Inbrand Corp. (manufacturer of personal absorbent products, 1990-1997). He also served as President (1986-1990) of Inbrand Corp. Prior to his employment with Inbrand Corp., he was employed by a retail fabric chain and North Carolina National Bank. In addition, Mr. Smith served as a Member of the Advisory Board of certain Fidelity® funds (2012-2013) and as a board member of the Jackson Hole Land Trust (2009-2012).
David M. Thomas (1949)
Year of Election or Appointment: 2008
Trustee
Mr. Thomas also serves as Trustee of other Fidelity® funds. Mr. Thomas serves as Non-Executive Chairman of the Board of Directors of Fortune Brands Home and Security (home and security products, 2011-present) and as a member of the Board of Directors (2004-present) and Presiding Director (2013-present) of Interpublic Group of Companies, Inc. (marketing communication). Previously, Mr. Thomas served as Executive Chairman (2005-2006) and Chairman and Chief Executive Officer (2000-2005) of IMS Health, Inc. (pharmaceutical and healthcare information solutions), a Director of Fortune Brands, Inc. (consumer products, 2000-2011), and a member of the Board of Trustees of the University of Florida (2013-2018).
+ The information includes the Trustee's principal occupation during the last five years and other information relating to the experience, attributes, and skills relevant to the Trustee's qualifications to serve as a Trustee, which led to the conclusion that the Trustee should serve as a Trustee for the fund.
Advisory Board Members and Officers:
Correspondence intended for a Member of the Advisory Board (if any) may be sent to Fidelity Investments, P.O. Box 55235, Boston, Massachusetts 02205-5235. Correspondence intended for an officer or Peter S. Lynch may be sent to Fidelity Investments, 245 Summer Street, Boston, Massachusetts 02210. Officers appear below in alphabetical order.
Name, Year of Birth; Principal Occupation
Vicki L. Fuller (1957)
Year of Election or Appointment: 2018
Member of the Advisory Board
Ms. Fuller also serves as Member of the Advisory Board of other Fidelity® funds. Ms. Fuller serves as a member of the Board of Directors, Audit Committee, and Nominating and Governance Committee of The Williams Companies, Inc. (natural gas infrastructure, 2018-present). Previously, Ms. Fuller served as the Chief Investment Officer of the New York State Common Retirement Fund (2012-2018) and held a variety of positions at AllianceBernstein L.P. (global asset management, 1985-2012), including Managing Director (2006-2012) and Senior Vice President and Senior Portfolio Manager (2001-2006).
Peter S. Lynch (1944)
Year of Election or Appointment: 2003
Member of the Advisory Board
Mr. Lynch also serves as Member of the Advisory Board of other Fidelity® funds. Mr. Lynch is Vice Chairman and a Director of FMR (investment adviser firm) and FMR Co., Inc. (investment adviser firm). In addition, Mr. Lynch serves as a Trustee of Boston College and as the Chairman of the Inner-City Scholarship Fund. Previously, Mr. Lynch served on the Special Olympics International Board of Directors (1997-2006).
Michael E. Wiley (1950)
Year of Election or Appointment: 2018
Member of the Advisory Board
Mr. Wiley also serves as Trustee or Member of the Advisory Board of other Fidelity® funds. Mr. Wiley serves as a Director of High Point Resources (exploration and production, 2005-present). Previously, Mr. Wiley served as a Director of Andeavor Corporation (independent oil refiner and marketer, 2005-2018), a Director of Andeavor Logistics LP (natural resources logistics, 2015-2018), a Director of Post Oak Bank (privately-held bank, 2004-2018), a Director of Asia Pacific Exploration Consolidated (international oil and gas exploration and production, 2008-2013), a member of the Board of Trustees of the University of Tulsa (2000-2006; 2007-2010), a Senior Energy Advisor of Katzenbach Partners, LLC (consulting, 2006-2007), an Advisory Director of Riverstone Holdings (private investment), a Director of Spinnaker Exploration Company (exploration and production, 2001-2005) and Chairman, President, and CEO of Baker Hughes, Inc. (oilfield services, 2000-2004).
Elizabeth Paige Baumann (1968)
Year of Election or Appointment: 2017
Anti-Money Laundering (AML) Officer
Ms. Baumann also serves as AML Officer of other funds. She is Chief AML Officer (2012-present) and Senior Vice President (2014-present) of FMR LLC (diversified financial services company) and is an employee of Fidelity Investments. Previously, Ms. Baumann served as AML Officer of the funds (2012-2016), and Vice President (2007-2014) and Deputy Anti-Money Laundering Officer (2007-2012) of FMR LLC.
Craig S. Brown (1977)
Year of Election or Appointment: 2019
Assistant Treasurer
Mr. Brown also serves as Assistant Treasurer of other funds. Mr. Brown is an employee of Fidelity Investments (2013-present).
John J. Burke III (1964)
Year of Election or Appointment: 2018
Chief Financial Officer
Mr. Burke also serves as Chief Financial Officer of other funds. Mr. Burke serves as Head of Investment Operations for Fidelity Fund and Investment Operations (2018-present) and is an employee of Fidelity Investments (1998-present). Previously Mr. Burke served as head of Asset Management Investment Operations (2012-2018).
William C. Coffey (1969)
Year of Election or Appointment: 2019
Assistant Secretary
Mr. Coffey also serves as Assistant Secretary of other funds. He is Senior Vice President and Deputy General Counsel of FMR LLC (diversified financial services company, 2010-present), and is an employee of Fidelity Investments. Previously, Mr. Coffey served as Secretary and CLO of certain funds (2018-2019); CLO, Secretary, and Senior Vice President of Fidelity Management & Research Company and FMR Co., Inc. (investment adviser firms, 2018-2019); Secretary of Fidelity SelectCo, LLC and Fidelity Investments Money Management, Inc. (investment adviser firms, 2018-2019); CLO of Fidelity Management & Research (Hong Kong) Limited, FMR Investment Management (UK) Limited, and Fidelity Management & Research (Japan) Limited (investment adviser firms, 2018-2019); and Assistant Secretary of certain funds (2009-2018).
Timothy M. Cohen (1969)
Year of Election or Appointment: 2018
Vice President
Mr. Cohen also serves as Vice President of other funds. Mr. Cohen serves as Executive Vice President of Fidelity SelectCo, LLC (2019-present), Co-Head of Equity (2018-present), a Director of Fidelity Management & Research (Japan) Limited (investment adviser firm, 2016-present), and is an employee of Fidelity Investments. Previously, Mr. Cohen served as Head of Global Equity Research (2016-2018), Chief Investment Officer - Equity and a Director of Fidelity Management & Research (U.K.) Inc. (investment adviser firm, 2013-2015) and as a Director of Fidelity Management & Research (Hong Kong) Limited (investment adviser firm, 2017).
Jonathan Davis (1968)
Year of Election or Appointment: 2010
Assistant Treasurer
Mr. Davis also serves as Assistant Treasurer of other funds. Mr. Davis serves as Assistant Treasurer of FMR Capital, Inc. (2017-present) and is an employee of Fidelity Investments. Previously, Mr. Davis served as Vice President and Associate General Counsel of FMR LLC (diversified financial services company, 2003-2010).
Adrien E. Deberghes (1967)
Year of Election or Appointment: 2016
Assistant Treasurer
Mr. Deberghes also serves as an officer of other funds. He serves as Assistant Treasurer of FMR Capital, Inc. (2017-present), Executive Vice President of Fidelity Investments Money Management, Inc. (FIMM) (investment adviser firm, 2016-present), and is an employee of Fidelity Investments (2008-present). Previously, Mr. Deberghes served as President and Treasurer of certain Fidelity® funds (2013-2018). Prior to joining Fidelity Investments, Mr. Deberghes was Senior Vice President of Mutual Fund Administration at State Street Corporation (2007-2008), Senior Director of Mutual Fund Administration at Investors Bank & Trust (2005-2007), and Director of Finance for Dunkin' Brands (2000-2005). Previously, Mr. Deberghes served in other fund officer roles.
Laura M. Del Prato (1964)
Year of Election or Appointment: 2018
Assistant Treasurer
Ms. Del Prato also serves as an officer of other funds. Ms. Del Prato is an employee of Fidelity Investments (2017-present). Prior to joining Fidelity Investments, Ms. Del Prato served as a Managing Director and Treasurer of the JPMorgan Mutual Funds (2014-2017). Prior to JPMorgan, Ms. Del Prato served as a partner at Cohen Fund Audit Services (accounting firm, 2012-2013) and KPMG LLP (accounting firm, 2004-2012).
Colm A. Hogan (1973)
Year of Election or Appointment: 2016
Deputy Treasurer
Mr. Hogan also serves as an officer of other funds. Mr. Hogan serves as Assistant Treasurer of FMR Capital, Inc. (2017-present) and is an employee of Fidelity Investments (2005-present). Previously, Mr. Hogan served as Assistant Treasurer of certain Fidelity® funds (2016-2018).
Pamela R. Holding (1964)
Year of Election or Appointment: 2018
Vice President
Ms. Holding also serves as Vice President of other funds. Ms. Holding serves as Executive Vice President of Fidelity SelectCo, LLC (2019-present), Co-Head of Equity (2018-present) and is an employee of Fidelity Investments (2013-present). Previously, Ms. Holding served as Chief Investment Officer of Fidelity Institutional Asset Management (2013-2018).
Cynthia Lo Bessette (1969)
Year of Election or Appointment: 2019
Secretary and Chief Legal Officer (CLO)
Ms. Lo Bessette also serves as Secretary and CLO of other funds. Ms. Lo Bessette serves as CLO, Secretary, and Senior Vice President of Fidelity Management & Research Company and FMR Co., Inc. (investment adviser firms, 2019-present); Secretary of Fidelity SelectCo, LLC and Fidelity Investments Money Management, Inc. (investment adviser firms, 2019-present); and CLO of Fidelity Management & Research (Hong Kong) Limited, FMR Investment Management (UK) Limited, and Fidelity Management & Research (Japan) Limited (investment adviser firms, 2019-present). She is a Senior Vice President and Deputy General Counsel of FMR LLC (diversified financial services company, 2019-present), and is an employee of Fidelity Investments. Previously, Ms. Lo Bessette served as Executive Vice President, General Counsel (2016-2019) and Senior Vice President, Deputy General Counsel (2015-2016) of OppenheimerFunds (investment management company) and Deputy Chief Legal Officer (2013-2015) of Jennison Associates LLC (investment adviser firm).
Chris Maher (1972)
Year of Election or Appointment: 2013
Assistant Treasurer
Mr. Maher serves as Assistant Treasurer of other funds. Mr. Maher is Vice President of Valuation Oversight, serves as Assistant Treasurer of FMR Capital, Inc. (2017-present), and is an employee of Fidelity Investments. Previously, Mr. Maher served as Vice President of Asset Management Compliance (2013), Vice President of the Program Management Group of FMR (investment adviser firm, 2010-2013), and Vice President of Valuation Oversight (2008-2010).
Kenneth B. Robins (1969)
Year of Election or Appointment: 2016
Chief Compliance Officer
Mr. Robins also serves as an officer of other funds. Mr. Robins serves as Compliance Officer of Fidelity Management & Research Company and FMR Co., Inc. (investment adviser firms, 2016-present) and is an employee of Fidelity Investments (2004-present). Previously, Mr. Robins served as Executive Vice President of Fidelity Investments Money Management, Inc. (investment adviser firm, 2013-2016) and served in other fund officer roles.
Stacie M. Smith (1974)
Year of Election or Appointment: 2016
President and Treasurer
Ms. Smith also serves as an officer of other funds. Ms. Smith serves as Assistant Treasurer of FMR Capital, Inc. (2017-present), is an employee of Fidelity Investments (2009-present), and has served in other fund officer roles. Prior to joining Fidelity Investments, Ms. Smith served as Senior Audit Manager of Ernst & Young LLP (accounting firm, 1996-2009). Previously, Ms. Smith served as Assistant Treasurer (2013-2018) and Deputy Treasurer (2013-2016) of certain Fidelity® funds.
Marc L. Spector (1972)
Year of Election or Appointment: 2016
Assistant Treasurer
Mr. Spector also serves as an officer of other funds. Mr. Spector serves as Assistant Treasurer of FMR Capital, Inc. (2017-present) and is an employee of Fidelity Investments (2016-present). Prior to joining Fidelity Investments, Mr. Spector served as Director at the Siegfried Group (accounting firm, 2013-2016), and prior to Siegfried Group as audit senior manager at Deloitte & Touche (accounting firm, 2005-2013).
Jim Wegmann (1979)
Year of Election or Appointment: 2019
Assistant Treasurer
Mr. Wegmann also serves as Assistant Treasurer of other funds. Mr. Wegmann is an employee of Fidelity Investments (2011-present).
Shareholder Expense Example
As a shareholder of the Fund, you incur two types of costs: (1) transaction costs, including sales charges (loads) on purchase payments or redemption proceeds, and (2) ongoing costs, including management fees, distribution and/or service (12b-1) fees and other Fund expenses. This Example is intended to help you understand your ongoing costs (in dollars) of investing in the Fund and to compare these costs with the ongoing costs of investing in other mutual funds.
The Example is based on an investment of $1,000 invested at the beginning of the period and held for the entire period (May 1, 2019 to October 31, 2019).
Actual Expenses
The first line of the accompanying table for each class of the Fund provides information about actual account values and actual expenses. You may use the information in this line, together with the amount you invested, to estimate the expenses that you paid over the period. Simply divide your account value by $1,000.00 (for example, an $8,600 account value divided by $1,000.00 = 8.6), then multiply the result by the number in the first line for a class of the Fund under the heading entitled "Expenses Paid During Period" to estimate the expenses you paid on your account during this period. In addition, the Fund, as a shareholder in the underlying Fidelity Central Funds, will indirectly bear its pro-rata share of the fees and expenses incurred by the underlying Fidelity Central Funds. These fees and expenses are not included in the Fund's annualized expense ratio used to calculate the expense estimate in the table below.
Hypothetical Example for Comparison Purposes
The second line of the accompanying table for each class of the Fund provides information about hypothetical account values and hypothetical expenses based on a Class' actual expense ratio and an assumed rate of return of 5% per year before expenses, which is not the Class' actual return. The hypothetical account values and expenses may not be used to estimate the actual ending account balance or expenses you paid for the period. You may use this information to compare the ongoing costs of investing in the Fund and other funds. To do so, compare this 5% hypothetical example with the 5% hypothetical examples that appear in the shareholder reports of the other funds. In addition, the Fund, as a shareholder in the underlying Fidelity Central Funds, will indirectly bear its pro-rata share of the fees and expenses incurred by the underlying Fidelity Central Funds. These fees and expenses are not included in the Fund's annualized expense ratio used to calculate the expense estimate in the table below.
Please note that the expenses shown in the table are meant to highlight your ongoing costs only and do not reflect any transaction costs. Therefore, the second line of the table is useful in comparing ongoing costs only, and will not help you determine the relative total costs of owning different funds. In addition, if these transactional costs were included, your costs would have been higher.
| | Annualized Expense Ratio-A | Beginning
Account Value
May 1, 2019 | Ending
Account Value
October 31, 2019 | Expenses Paid
During Period-B
May 1, 2019
to October 31, 2019 |
| Class A | 1.28% | | | |
| Actual | | $1,000.00 | $1,067.50 | $6.67 |
| Hypothetical-C | | $1,000.00 | $1,018.75 | $6.51 |
| Class M | 1.58% | | | |
| Actual | | $1,000.00 | $1,066.10 | $8.23 |
| Hypothetical-C | | $1,000.00 | $1,017.24 | $8.03 |
| Class C | 2.04% | | | |
| Actual | | $1,000.00 | $1,063.00 | $10.61 |
| Hypothetical-C | | $1,000.00 | $1,014.92 | $10.36 |
| International Growth | 1.00% | | | |
| Actual | | $1,000.00 | $1,069.10 | $5.22 |
| Hypothetical-C | | $1,000.00 | $1,020.16 | $5.09 |
| Class I | .98% | | | |
| Actual | | $1,000.00 | $1,069.30 | $5.11 |
| Hypothetical-C | | $1,000.00 | $1,020.27 | $4.99 |
| Class Z | .85% | | | |
| Actual | | $1,000.00 | $1,069.90 | $4.43 |
| Hypothetical-C | | $1,000.00 | $1,020.92 | $4.33 |
A Annualized expense ratio reflects expenses net of applicable fee waivers.
B Expenses are equal to each Class' annualized expense ratio, multiplied by the average account value over the period, multiplied by 184/365 (to reflect the one-half year period).
C 5% return per year before expenses
Distributions (Unaudited)
Class A designates 23%; Class M designates 40%; International Growth designates 17%; Class I designates 16%; Class Z designates 15%; of the dividend distributed in December 2018 during the fiscal year as qualifying for the dividends–received deduction for corporate shareholders.
Class A, Class M, International Growth, Class I, and Class Z designate 100% of the dividend distributed during the fiscal year as amounts which may be taken into account as a dividend for purposes of the maximum rate under section 1(h)(11) of the Internal Revenue Code.
The amounts per share which represent income derived from sources within, and taxes paid to, foreign countries or possessions of the United States are as follows:
| | Pay Date | Income | Taxes |
| Fidelity International Growth Fund | | | |
| Class A | 12/10/18 | $0.0943 | $0.0223 |
| Class M | 12/10/18 | $0.0543 | $0.0223 |
| International Growth | 12/10/18 | $0.1283 | $0.0223 |
| Class I | 12/10/18 | $0.1313 | $0.0223 |
| Class Z | 12/10/18 | $0.1473 | $0.0223 |
|
The fund will notify shareholders in January 2020 of amounts for use in preparing 2019 income tax returns.
IGF-ANN-1219
1.912350.109
Fidelity® International Discovery Fund
Annual Report
October 31, 2019
Includes Fidelity and Fidelity Advisor share classes
See the inside front cover for important information about access to your fund’s shareholder reports.
Beginning on January 1, 2021, as permitted by regulations adopted by the Securities and Exchange Commission, paper copies of a fund’s shareholder reports will no longer be sent by mail, unless you specifically request paper copies of the reports from the fund or from your financial intermediary, such as a financial advisor, broker-dealer or bank. Instead, the reports will be made available on a website, and you will be notified by mail each time a report is posted and provided with a website link to access the report.
If you already elected to receive shareholder reports electronically, you will not be affected by this change and you need not take any action. You may elect to receive shareholder reports and other communications from a fund electronically, by contacting your financial intermediary. For Fidelity customers, visit Fidelity's web site or call Fidelity using the contact information listed below.
You may elect to receive all future reports in paper free of charge. If you wish to continue receiving paper copies of your shareholder reports, you may contact your financial intermediary or, if you are a Fidelity customer, visit Fidelity’s website, or call Fidelity at the applicable toll-free number listed below. Your election to receive reports in paper will apply to all funds held with the fund complex/your financial intermediary.
| Account Type | Website | Phone Number |
| Brokerage, Mutual Fund, or Annuity Contracts: | fidelity.com/mailpreferences | 1-800-343-3548 |
| Employer Provided Retirement Accounts: | netbenefits.fidelity.com/preferences (choose 'no' under Required Disclosures to continue to print) | 1-800-343-0860 |
| Advisor Sold Accounts Serviced Through Your Financial Intermediary: | Contact Your Financial Intermediary | Your Financial Intermediary's phone number |
| Advisor Sold Accounts Serviced by Fidelity: | institutional.fidelity.com | 1-877-208-0098 |
Contents
To view a fund's proxy voting guidelines and proxy voting record for the 12-month period ended June 30, visit http://www.fidelity.com/proxyvotingresults or visit the Securities and Exchange Commission's (SEC) web site at http://www.sec.gov.
You may also call 1-800-544-8544 if you’re an individual investing directly with Fidelity, call 1-800-835-5092 if you’re a plan sponsor or participant with Fidelity as your recordkeeper or call 1-877-208-0098 on institutional accounts or if you’re an advisor or invest through one to request a free copy of the proxy voting guidelines.
Standard & Poor's, S&P and S&P 500 are registered service marks of The McGraw-Hill Companies, Inc. and have been licensed for use by Fidelity Distributors Corporation.
Other third-party marks appearing herein are the property of their respective owners.
All other marks appearing herein are registered or unregistered trademarks or service marks of FMR LLC or an affiliated company. © 2019 FMR LLC. All rights reserved.
This report and the financial statements contained herein are submitted for the general information of the shareholders of the Fund. This report is not authorized for distribution to prospective investors in the Fund unless preceded or accompanied by an effective prospectus.
A fund files its complete schedule of portfolio holdings with the SEC for the first and third quarters of each fiscal year on Form N-PORT. Forms N-PORT are available on the SEC’s web site at http://www.sec.gov. A fund's Forms N-PORT may be reviewed and copied at the SEC’s Public Reference Room in Washington, DC. Information regarding the operation of the SEC's Public Reference Room may be obtained by calling 1-800-SEC-0330.
For a complete list of a fund's portfolio holdings, view the most recent holdings listing, semiannual report, or annual report on Fidelity's web site at http://www.fidelity.com, http://www.institutional.fidelity.com, or http://www.401k.com, as applicable.
NOT FDIC INSURED •MAY LOSE VALUE •NO BANK GUARANTEE
Neither the Fund nor Fidelity Distributors Corporation is a bank.
Performance: The Bottom Line
Average annual total return reflects the change in the value of an investment, assuming reinvestment of distributions from dividend income and capital gains (the profits earned upon the sale of securities that have grown in value, if any) and assuming a constant rate of performance each year. The hypothetical investment and the average annual total returns do not reflect the deduction of taxes that a shareholder would pay on fund distributions or the redemption of fund shares. During periods of reimbursement by Fidelity, a fund’s total return will be greater than it would be had the reimbursement not occurred. How a fund did yesterday is no guarantee of how it will do tomorrow.
Average Annual Total Returns
| For the periods ended October 31, 2019 | Past 1 year | Past 5 years | Past 10 years |
| Class A (incl. 5.75% sales charge) | 5.47% | 3.20% | 5.44% |
| Class M (incl. 3.50% sales charge) | 7.71% | 3.44% | 5.43% |
| Class C (incl. contingent deferred sales charge) | 10.02% | 3.63% | 5.26% |
| Fidelity® International Discovery Fund | 12.31% | 4.80% | 6.43% |
| Class K | 12.41% | 4.93% | 6.58% |
| Class I | 12.26% | 4.78% | 6.43% |
| Class Z | 12.42% | 4.93% | 6.52% |
Class C shares' contingent deferred sales charges included in the past one year, past five years and past ten years total return figures are 1%, 0% and 0%, respectively.
The initial offering of Class Z shares took place on August 13, 2013. Returns prior to August 13, 2013, are those of Class I.
$10,000 Over 10 Years
Let's say hypothetically that $10,000 was invested in Fidelity® International Discovery Fund, a class of the fund, on October 31, 2009.
The chart shows how the value of your investment would have changed, and also shows how the MSCI EAFE Index performed over the same period.

| Period Ending Values |
| $18,643 | Fidelity® International Discovery Fund - Fidelity® International Discovery Fund |
| $17,206 | MSCI EAFE Index |
Management's Discussion of Fund Performance
Market Recap: The MSCI ACWI (All Country World Index) ex USA Index gained 11.47% for the 12 months ending October 31, 2019, as international stocks reflected a confluence of factors, including escalating trade tension, and moderating but still positive global economic growth. Currency fluctuations were largely modest and varied by region, muting the overall impact on international equity returns. In late December, the U.S. Federal Reserve shifted from raising interest rates to a more dovish policy in 2019, joining many foreign central banks. In June, international stocks rose 6.03%, as policy stimulus in China stabilized that country’s economic growth. The Fed cut its policy rate in July for the first time since 2008. However, the index returned -1.21% for the month, followed by -3.08% in August. In September, the Fed cut its policy rate another quarter point, citing concerns about slowing economic growth and muted inflation, and did the same in October, leading to monthly gains of 2.59% and 3.49%, respectively. For the full 12 months, the growth-oriented information technology sector (+22%) led the way, followed by utilities (+20%) and real estate (+18%), two high-dividend-yielding categories. Conversely, energy was roughly flat, while materials (+6%) and communication services (7%) also lagged. By region, Asia Pacific ex Japan (+16%), Europe ex U.K (+13%), Canada (+12%) and emerging markets (+12%) fared best. Meanwhile, the U.K. (+7%) and Japan (+10%) trailed the broader market.
Comments from Portfolio Manager William Kennedy: For the fiscal year, the fund’s share classes (excluding sales charges, if applicable) gained about 11% to 12%, which was close to the 11.30% result of the benchmark MSCI EAFE Index. Security selection in the financials, health care and industrials sectors gave the biggest boost to the fund’s relative result. Geographically, investments in emerging markets, which are outside the benchmark, as well as in the U.K. and Asia Pacific Ex Japan, aided relative performance. The biggest individual contributor, however, was Japan-based health care equipment supplier Hoya, an overweighting and top-10 holding on October 31. Strong demand for the products it makes for use in semiconductor fabrication boosted the stock’s return. A non-benchmark position in Meituan Dianping, the largest food delivery company in China, also helped, as strong execution by management and less competition helped drive the company’s share price higher. Conversely, stock picks in energy detracted, with added pressure from security selection in consumer discretionary and communication services, as well as positioning in Europe Ex U.K. Notable individual detractors included Norway-based exploration and production company Equinor, which was hurt by low crude-oil prices, and Japan-headquartered multinational consumer electronics giant Sony, due to untimely positioning.
The views expressed above reflect those of the portfolio manager(s) only through the end of the period as stated on the cover of this report and do not necessarily represent the views of Fidelity or any other person in the Fidelity organization. Any such views are subject to change at any time based upon market or other conditions and Fidelity disclaims any responsibility to update such views. These views may not be relied on as investment advice and, because investment decisions for a Fidelity fund are based on numerous factors, may not be relied on as an indication of trading intent on behalf of any Fidelity fund.
Investment Summary (Unaudited)
Geographic Diversification (% of fund's net assets)
| As of October 31, 2019 |
| | Japan | 15.8% |
| | United Kingdom | 13.8% |
| | Germany | 10.6% |
| | Switzerland | 10.6% |
| | France | 6.4% |
| | India | 5.2% |
| | Netherlands | 4.4% |
| | United States of America* | 4.1% |
| | Sweden | 3.3% |
| | Other | 25.8% |
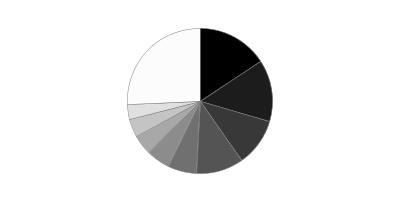
* Includes Short-Term investments and Net Other Assets (Liabilities).
Percentages are based on country or territory of incorporation and are adjusted for the effect of futures contracts, if applicable.
Asset Allocation as of October 31, 2019
| | % of fund's net assets |
| Stocks | 96.8 |
| Short-Term Investments and Net Other Assets (Liabilities) | 3.2 |
Top Ten Stocks as of October 31, 2019
| | % of fund's net assets |
| Nestle SA (Reg. S) (Switzerland, Food Products) | 3.0 |
| Roche Holding AG (participation certificate) (Switzerland, Pharmaceuticals) | 2.7 |
| BP PLC (United Kingdom, Oil, Gas & Consumable Fuels) | 2.3 |
| SAP SE (Germany, Software) | 2.2 |
| Hoya Corp. (Japan, Health Care Equipment & Supplies) | 1.9 |
| AstraZeneca PLC (United Kingdom) (United Kingdom, Pharmaceuticals) | 1.9 |
| Unilever NV (Netherlands, Personal Products) | 1.8 |
| AIA Group Ltd. (Hong Kong, Insurance) | 1.7 |
| Keyence Corp. (Japan, Electronic Equipment & Components) | 1.5 |
| ASML Holding NV (Netherlands) (Netherlands, Semiconductors & Semiconductor Equipment) | 1.5 |
| | 20.5 |
Top Market Sectors as of October 31, 2019
| | % of fund's net assets |
| Financials | 18.8 |
| Information Technology | 15.0 |
| Health Care | 14.4 |
| Industrials | 14.2 |
| Consumer Discretionary | 9.8 |
| Consumer Staples | 8.9 |
| Communication Services | 5.2 |
| Energy | 4.2 |
| Materials | 3.2 |
| Real Estate | 2.6 |
Schedule of Investments October 31, 2019
Showing Percentage of Net Assets
| Common Stocks - 96.3% | | | |
| | | Shares | Value (000s) |
| Australia - 1.9% | | | |
| Bapcor Ltd. | | 8,552,306 | $42,159 |
| CSL Ltd. | | 276,460 | 48,755 |
| Inghams Group Ltd. | | 10,040,006 | 21,495 |
| Magellan Financial Group Ltd. | | 747,709 | 24,800 |
| National Storage (REIT) unit | | 27,802,920 | 35,676 |
| Pro Medicus Ltd. (a) | | 56,923 | 1,045 |
| Rio Tinto Ltd. | | 4,304 | 269 |
|
| TOTAL AUSTRALIA | | | 174,199 |
|
| Austria - 0.9% | | | |
| Erste Group Bank AG | | 1,365,300 | 48,225 |
| Wienerberger AG | | 1,383,600 | 37,405 |
|
| TOTAL AUSTRIA | | | 85,630 |
|
| Bailiwick of Jersey - 0.6% | | | |
| Experian PLC | | 1,674,010 | 52,649 |
| Belgium - 1.1% | | | |
| KBC Groep NV | | 1,417,959 | 99,442 |
| Brazil - 0.4% | | | |
| BM&F BOVESPA SA | | 3,269,600 | 39,442 |
| Canada - 2.7% | | | |
| Alimentation Couche-Tard, Inc. Class B (sub. vtg.) | | 1,811,200 | 54,318 |
| Cenovus Energy, Inc. (Canada) | | 3,192,800 | 27,199 |
| Constellation Software, Inc. | | 88,400 | 87,308 |
| Dollarama, Inc. | | 731,100 | 24,596 |
| Suncor Energy, Inc. | | 1,692,000 | 50,307 |
|
| TOTAL CANADA | | | 243,728 |
|
| Cayman Islands - 3.0% | | | |
| Alibaba Group Holding Ltd. sponsored ADR (b) | | 256,800 | 45,369 |
| Hansoh Pharmaceutical Group Co. Ltd. (c) | | 10,762,000 | 32,696 |
| Meituan Dianping Class B (b) | | 4,209,244 | 50,208 |
| PagSeguro Digital Ltd. (b) | | 1,355,100 | 50,247 |
| Tencent Holdings Ltd. | | 2,196,300 | 89,088 |
|
| TOTAL CAYMAN ISLANDS | | | 267,608 |
|
| China - 0.8% | | | |
| AVIC Jonhon OptronicTechnology Co. Ltd. | | 4,283,720 | 24,525 |
| Centre Testing International Group Co. Ltd. (A Shares) | | 15,273,146 | 30,355 |
| Kweichow Moutai Co. Ltd. (A Shares) | | 105,800 | 17,708 |
|
| TOTAL CHINA | | | 72,588 |
|
| Denmark - 1.4% | | | |
| DSV A/S | | 419,000 | 40,657 |
| Netcompany Group A/S (b)(c) | | 1,068,134 | 45,476 |
| ORSTED A/S (c) | | 467,700 | 41,025 |
|
| TOTAL DENMARK | | | 127,158 |
|
| France - 6.4% | | | |
| BNP Paribas SA | | 1,380,389 | 72,139 |
| Capgemini SA | | 692,228 | 77,938 |
| Cegedim SA (b) | | 285,435 | 8,834 |
| LVMH Moet Hennessy Louis Vuitton SE | | 283,513 | 121,076 |
| Peugeot Citroen SA | | 1,641,300 | 41,553 |
| Societe Generale Series A | | 1,748,629 | 49,729 |
| SR Teleperformance SA | | 354,440 | 80,326 |
| VINCI SA | | 1,117,633 | 125,398 |
|
| TOTAL FRANCE | | | 576,993 |
|
| Germany - 10.1% | | | |
| adidas AG | | 264,218 | 81,583 |
| Akasol AG (a)(b)(c) | | 274,440 | 10,713 |
| Allianz SE | | 507,902 | 124,041 |
| Delivery Hero AG (b)(c) | | 217,224 | 10,183 |
| Deutsche Borse AG | | 153,400 | 23,755 |
| Deutsche Post AG | | 1,285,900 | 45,535 |
| Instone Real Estate Group BV (b)(c) | | 984,777 | 23,065 |
| Linde PLC | | 352,301 | 69,645 |
| Morphosys AG (b) | | 214,225 | 23,331 |
| MTU Aero Engines Holdings AG | | 233,776 | 62,419 |
| Nexus AG | | 586,656 | 20,807 |
| Rheinmetall AG | | 282,952 | 34,035 |
| SAP SE | | 1,502,889 | 199,135 |
| Scout24 AG (c) | | 837,177 | 51,774 |
| Siemens AG | | 592,100 | 68,328 |
| Vonovia SE | | 1,271,245 | 67,644 |
|
| TOTAL GERMANY | | | 915,993 |
|
| Hong Kong - 2.1% | | | |
| AIA Group Ltd. | | 15,092,800 | 150,297 |
| Techtronic Industries Co. Ltd. | | 5,023,000 | 39,255 |
|
| TOTAL HONG KONG | | | 189,552 |
|
| Hungary - 0.4% | | | |
| OTP Bank PLC | | 860,100 | 39,617 |
| India - 5.2% | | | |
| Avenue Supermarts Ltd. (b)(c) | | 428,548 | 12,025 |
| Axis Bank Ltd. | | 3,456,600 | 35,789 |
| HDFC Bank Ltd. | | 3,353,882 | 58,068 |
| HDFC Bank Ltd. sponsored ADR | | 1,761,068 | 107,584 |
| Housing Development Finance Corp. Ltd. | | 4,455,315 | 133,617 |
| Larsen & Toubro Ltd. | | 841,300 | 17,443 |
| Reliance Industries Ltd. | | 1,826,900 | 37,628 |
| Sunteck Realty Ltd. (b) | | 3,535,263 | 20,664 |
| TCNS Clothing Co. Ltd. (b)(c) | | 2,285,360 | 24,258 |
| Tech Mahindra Ltd. | | 2,207,200 | 22,966 |
|
| TOTAL INDIA | | | 470,042 |
|
| Indonesia - 0.4% | | | |
| PT Bank Central Asia Tbk | | 9,270,000 | 20,749 |
| PT Bank Rakyat Indonesia Tbk | | 64,498,000 | 19,326 |
|
| TOTAL INDONESIA | | | 40,075 |
|
| Ireland - 2.0% | | | |
| Cairn Homes PLC | | 22,781,863 | 29,525 |
| CRH PLC | | 1,163,700 | 42,370 |
| Dalata Hotel Group PLC | | 3,613,807 | 21,362 |
| DCC PLC (United Kingdom) | | 230,200 | 21,577 |
| Kerry Group PLC Class A | | 573,200 | 69,299 |
|
| TOTAL IRELAND | | | 184,133 |
|
| Italy - 0.9% | | | |
| Moncler SpA | | 643,200 | 24,778 |
| Recordati SpA | | 1,396,000 | 58,651 |
|
| TOTAL ITALY | | | 83,429 |
|
| Japan - 15.8% | | | |
| Astellas Pharma, Inc. | | 2,489,200 | 42,721 |
| Daiichi Sankyo Kabushiki Kaisha | | 594,100 | 39,064 |
| Fanuc Corp. | | 494,400 | 97,520 |
| GMO Payment Gateway, Inc. | | 237,000 | 17,467 |
| Hoya Corp. | | 2,001,800 | 176,914 |
| Kao Corp. | | 521,800 | 41,952 |
| Keyence Corp. | | 219,520 | 138,802 |
| Lasertec Corp. | | 1,078,400 | 77,522 |
| Minebea Mitsumi, Inc. | | 2,898,600 | 55,049 |
| Misumi Group, Inc. | | 1,062,000 | 26,697 |
| Mitsubishi UFJ Financial Group, Inc. | | 6,469,500 | 33,540 |
| MonotaRO Co. Ltd. | | 1,402,000 | 42,355 |
| Nintendo Co. Ltd. | | 121,400 | 44,528 |
| Olympus Corp. | | 3,318,200 | 45,149 |
| Oracle Corp. Japan | | 560,200 | 49,239 |
| ORIX Corp. | | 5,714,400 | 89,801 |
| Persol Holdings Co., Ltd. | | 1,614,400 | 31,009 |
| Recruit Holdings Co. Ltd. | | 1,338,300 | 44,477 |
| Relo Group, Inc. | | 2,753,900 | 67,397 |
| Shiseido Co. Ltd. | | 364,800 | 30,077 |
| SMC Corp. | | 82,100 | 35,471 |
| SMS Co., Ltd. | | 969,400 | 23,767 |
| SoftBank Corp. | | 1,249,100 | 48,048 |
| Sony Corp. | | 839,900 | 51,124 |
| Terumo Corp. | | 1,309,100 | 42,725 |
| Zozo, Inc. (a) | | 1,534,700 | 35,748 |
|
| TOTAL JAPAN | | | 1,428,163 |
|
| Korea (South) - 0.5% | | | |
| Samsung Electronics Co. Ltd. | | 1,081,690 | 46,584 |
| Malta - 0.1% | | | |
| Kambi Group PLC (b) | | 643,927 | 10,637 |
| Netherlands - 4.4% | | | |
| Adyen BV (b)(c) | | 18,941 | 13,296 |
| ASML Holding NV (Netherlands) | | 527,400 | 138,239 |
| Basic-Fit NV (b)(c) | | 841,900 | 25,728 |
| NXP Semiconductors NV | | 359,100 | 40,822 |
| Prosus NV (b) | | 267,900 | 18,474 |
| Unilever NV | | 2,816,332 | 166,319 |
|
| TOTAL NETHERLANDS | | | 402,878 |
|
| New Zealand - 1.6% | | | |
| EBOS Group Ltd. | | 3,377,971 | 53,353 |
| Fisher & Paykel Healthcare Corp. | | 3,203,788 | 39,295 |
| Ryman Healthcare Group Ltd. | | 6,384,456 | 52,767 |
|
| TOTAL NEW ZEALAND | | | 145,415 |
|
| Norway - 1.8% | | | |
| Adevinta ASA: | | | |
| rights 11/12/19 (b) | | 2,502,600 | 383 |
| Class B | | 3,095,700 | 35,346 |
| Equinor ASA | | 3,188,013 | 58,968 |
| Schibsted ASA (A Shares) | | 2,215,300 | 65,041 |
|
| TOTAL NORWAY | | | 159,738 |
|
| South Africa - 0.6% | | | |
| Clicks Group Ltd. | | 837,600 | 13,624 |
| Naspers Ltd. Class N | | 258,400 | 36,566 |
|
| TOTAL SOUTH AFRICA | | | 50,190 |
|
| Spain - 1.5% | | | |
| Cellnex Telecom SA (c) | | 1,176,100 | 50,710 |
| Cellnex Telecom SA (b) | | 357,408 | 15,411 |
| Masmovil Ibercom SA (b) | | 3,018,940 | 69,765 |
|
| TOTAL SPAIN | | | 135,886 |
|
| Sweden - 3.3% | | | |
| ASSA ABLOY AB (B Shares) | | 2,039,000 | 48,423 |
| EQT AB (b) | | 571,100 | 5,479 |
| Ericsson (B Shares) | | 10,200,600 | 89,141 |
| Indutrade AB | | 2,333,900 | 71,837 |
| Securitas AB (B Shares) | | 2,132,300 | 34,097 |
| Svenska Handelsbanken AB (A Shares) | | 4,911,500 | 49,291 |
|
| TOTAL SWEDEN | | | 298,268 |
|
| Switzerland - 10.6% | | | |
| Alcon, Inc. (Switzerland) (b) | | 872,520 | 51,529 |
| Kaba Holding AG (B Shares) (Reg.) | | 40,174 | 25,717 |
| Lonza Group AG | | 281,148 | 101,173 |
| Medacta Group SA (c) | | 96,400 | 7,876 |
| Nestle SA (Reg. S) | | 2,515,400 | 269,100 |
| Partners Group Holding AG | | 98,549 | 76,841 |
| Roche Holding AG (participation certificate) | | 817,268 | 245,962 |
| Schindler Holding AG (participation certificate) | | 158,247 | 38,692 |
| Sika AG | | 497,803 | 85,532 |
| Swiss Re Ltd. | | 532,050 | 55,713 |
|
| TOTAL SWITZERLAND | | | 958,135 |
|
| Taiwan - 1.1% | | | |
| Taiwan Semiconductor Manufacturing Co. Ltd. | | 9,973,000 | 97,549 |
| United Kingdom - 13.8% | | | |
| Anglo American PLC (United Kingdom) | | 2,149,970 | 55,187 |
| AstraZeneca PLC (United Kingdom) | | 1,798,591 | 175,394 |
| Aviva PLC | | 6,129,900 | 33,040 |
| Beazley PLC | | 6,340,600 | 48,171 |
| Big Yellow Group PLC | | 2,376,000 | 35,148 |
| BP PLC | | 33,191,116 | 210,477 |
| Compass Group PLC | | 2,262,665 | 60,241 |
| Cranswick PLC | | 521,253 | 20,958 |
| Dechra Pharmaceuticals PLC | | 1,260,876 | 42,955 |
| Diageo PLC | | 2,244,478 | 91,869 |
| HomeServe PLC | | 2,939,500 | 44,131 |
| John David Group PLC | | 4,237,700 | 42,180 |
| JTC PLC (c) | | 4,692,500 | 21,943 |
| Keywords Studios PLC | | 1,144,100 | 16,450 |
| Lloyds Banking Group PLC | | 74,267,500 | 54,632 |
| London Stock Exchange Group PLC | | 951,636 | 85,760 |
| M&G PLC (b) | | 5,637,393 | 15,613 |
| Network International Holdings PLC (c) | | 3,308,000 | 23,182 |
| Ocado Group PLC (b) | | 2,064,402 | 35,539 |
| Prudential PLC | | 3,354,393 | 58,591 |
| Rotork PLC | | 7,620,642 | 29,752 |
| Standard Life PLC | | 11,287,700 | 44,376 |
|
| TOTAL UNITED KINGDOM | | | 1,245,589 |
|
| United States of America - 0.9% | | | |
| MasterCard, Inc. Class A | | 153,500 | 42,490 |
| Visa, Inc. Class A | | 241,800 | 43,248 |
|
| TOTAL UNITED STATES OF AMERICA | | | 85,738 |
|
| TOTAL COMMON STOCKS | | | |
| (Cost $7,096,450) | | | 8,727,048 |
|
| Nonconvertible Preferred Stocks - 0.5% | | | |
| Germany - 0.5% | | | |
| Volkswagen AG | | | |
| (Cost $45,610) | | 236,900 | 45,101 |
|
| Money Market Funds - 3.5% | | | |
| Fidelity Cash Central Fund 1.83% (d) | | 282,463,674 | 282,520 |
| Fidelity Securities Lending Cash Central Fund 1.84% (d)(e) | | 33,918,394 | 33,922 |
| TOTAL MONEY MARKET FUNDS | | | |
| (Cost $316,442) | | | 316,442 |
| TOTAL INVESTMENT IN SECURITIES - 100.3% | | | |
| (Cost $7,458,502) | | | 9,088,591 |
| NET OTHER ASSETS (LIABILITIES) - (0.3)% | | | (31,368) |
| NET ASSETS - 100% | | | $9,057,223 |
Categorizations in the Schedule of Investments are based on country or territory of incorporation.
Legend
(a) Security or a portion of the security is on loan at period end.
(b) Non-income producing
(c) Security exempt from registration under Rule 144A of the Securities Act of 1933. These securities may be resold in transactions exempt from registration, normally to qualified institutional buyers. At the end of the period, the value of these securities amounted to $393,950,000 or 4.3% of net assets.
(d) Affiliated fund that is generally available only to investment companies and other accounts managed by Fidelity Investments. The rate quoted is the annualized seven-day yield of the fund at period end. A complete unaudited listing of the fund's holdings as of its most recent quarter end is available upon request. In addition, each Fidelity Central Fund's financial statements, which are not covered by the Fund's Report of Independent Registered Public Accounting Firm, are available on the SEC's website or upon request.
(e) Investment made with cash collateral received from securities on loan.
Affiliated Central Funds
Information regarding fiscal year to date income earned by the Fund from investments in Fidelity Central Funds is as follows:
| Fund | Income earned |
| | (Amounts in thousands) |
| Fidelity Cash Central Fund | $7,770 |
| Fidelity Securities Lending Cash Central Fund | 2,053 |
| Total | $9,823 |
Amounts in the income column in the above table include any capital gain distributions from underlying funds, which are presented in the corresponding line-item in the Statement of Operations, if applicable. Amount for Fidelity Securities Lending Cash Central Fund represents the income earned on investing cash collateral, less rebates paid to borrowers and any lending agent fees associated with the loan, plus any premium payments received for lending certain types of securities.
Investment Valuation
The following is a summary of the inputs used, as of October 31, 2019, involving the Fund's assets and liabilities carried at fair value. The inputs or methodology used for valuing securities may not be an indication of the risk associated with investing in those securities. For more information on valuation inputs, and their aggregation into the levels used below, please refer to the Investment Valuation section in the accompanying Notes to Financial Statements.
| | Valuation Inputs at Reporting Date: |
| Description | Total | Level 1 | Level 2 | Level 3 |
| (Amounts in thousands) | | | | |
| Investments in Securities: | | | | |
| Equities: | | | | |
| Communication Services | $470,094 | $288,430 | $181,664 | $-- |
| Consumer Discretionary | 877,988 | 456,608 | 421,380 | -- |
| Consumer Staples | 808,744 | 324,518 | 484,226 | -- |
| Energy | 384,579 | 136,474 | 248,105 | -- |
| Financials | 1,697,468 | 580,503 | 1,116,965 | -- |
| Health Care | 1,310,996 | 315,156 | 995,840 | -- |
| Industrials | 1,299,627 | 739,478 | 560,149 | -- |
| Information Technology | 1,341,626 | 487,041 | 854,585 | -- |
| Materials | 290,408 | 247,769 | 42,639 | -- |
| Real Estate | 249,594 | 125,857 | 123,737 | -- |
| Utilities | 41,025 | 41,025 | -- | -- |
| Money Market Funds | 316,442 | 316,442 | -- | -- |
| Total Investments in Securities: | $9,088,591 | $4,059,301 | $5,029,290 | $-- |
See accompanying notes which are an integral part of the financial statements.
Financial Statements
Statement of Assets and Liabilities
| Amounts in thousands (except per-share amounts) | | October 31, 2019 |
| Assets | | |
Investment in securities, at value (including securities loaned of $32,224) — See accompanying schedule:
Unaffiliated issuers (cost $7,142,060) | $8,772,149 | |
| Fidelity Central Funds (cost $316,442) | 316,442 | |
| Total Investment in Securities (cost $7,458,502) | | $9,088,591 |
| Foreign currency held at value (cost $11,248) | | 11,247 |
| Receivable for investments sold | | 16,256 |
| Receivable for fund shares sold | | 5,091 |
| Dividends receivable | | 28,146 |
| Distributions receivable from Fidelity Central Funds | | 148 |
| Prepaid expenses | | 17 |
| Other receivables | | 3,988 |
| Total assets | | 9,153,484 |
| Liabilities | | |
| Payable for investments purchased | $34,388 | |
| Payable for fund shares redeemed | 20,756 | |
| Accrued management fee | 4,860 | |
| Distribution and service plan fees payable | 58 | |
| Other affiliated payables | 1,156 | |
| Other payables and accrued expenses | 1,131 | |
| Collateral on securities loaned | 33,912 | |
| Total liabilities | | 96,261 |
| Net Assets | | $9,057,223 |
| Net Assets consist of: | | |
| Paid in capital | | $7,236,127 |
| Total accumulated earnings (loss) | | 1,821,096 |
| Net Assets | | $9,057,223 |
| Net Asset Value and Maximum Offering Price | | |
| Class A: | | |
| Net Asset Value and redemption price per share ($184,581 ÷ 4,261.62 shares)(a) | | $43.31 |
| Maximum offering price per share (100/94.25 of $43.31) | | $45.95 |
| Class M: | | |
| Net Asset Value and redemption price per share ($23,997 ÷ 557.88 shares)(a) | | $43.01 |
| Maximum offering price per share (100/96.50 of $43.01) | | $44.57 |
| Class C: | | |
| Net Asset Value and offering price per share ($12,374 ÷ 290.44 shares)(a) | | $42.60 |
| International Discovery: | | |
| Net Asset Value, offering price and redemption price per share ($6,726,054 ÷ 154,107.77 shares) | | $43.65 |
| Class K: | | |
| Net Asset Value, offering price and redemption price per share ($1,565,617 ÷ 35,947.57 shares) | | $43.55 |
| Class I: | | |
| Net Asset Value, offering price and redemption price per share ($462,938 ÷ 10,635.51 shares) | | $43.53 |
| Class Z: | | |
| Net Asset Value, offering price and redemption price per share ($81,662 ÷ 1,876.43 shares) | | $43.52 |
(a) Redemption price per share is equal to net asset value less any applicable contingent deferred sales charge.
See accompanying notes which are an integral part of the financial statements.
Statement of Operations
| Amounts in thousands | | Year ended October 31, 2019 |
| Investment Income | | |
| Dividends | | $203,694 |
| Non-Cash dividends | | 47,206 |
| Interest | | 120 |
| Income from Fidelity Central Funds (including $2,053 from security lending) | | 9,823 |
| Income before foreign taxes withheld | | 260,843 |
| Less foreign taxes withheld | | (18,104) |
| Total income | | 242,739 |
| Expenses | | |
| Management fee | | |
| Basic fee | $59,998 | |
| Performance adjustment | (7,149) | |
| Transfer agent fees | 12,567 | |
| Distribution and service plan fees | 746 | |
| Accounting and security lending fees | 1,744 | |
| Custodian fees and expenses | 986 | |
| Independent trustees' fees and expenses | 52 | |
| Registration fees | 147 | |
| Audit | 124 | |
| Legal | 43 | |
| Interest | 19 | |
| Miscellaneous | 63 | |
| Total expenses before reductions | 69,340 | |
| Expense reductions | (1,406) | |
| Total expenses after reductions | | 67,934 |
| Net investment income (loss) | | 174,805 |
| Realized and Unrealized Gain (Loss) | | |
| Net realized gain (loss) on: | | |
| Investment securities: | | |
| Unaffiliated issuers | 102,572 | |
| Redemptions in-kind with affiliated entities | 12,062 | |
| Fidelity Central Funds | 7 | |
| Foreign currency transactions | 1,438 | |
| Futures contracts | (11,901) | |
| Total net realized gain (loss) | | 104,178 |
| Change in net unrealized appreciation (depreciation) on: | | |
| Investment securities: | | |
| Unaffiliated issuers | 761,755 | |
| Assets and liabilities in foreign currencies | 536 | |
| Futures contracts | 7,547 | |
| Total change in net unrealized appreciation (depreciation) | | 769,838 |
| Net gain (loss) | | 874,016 |
| Net increase (decrease) in net assets resulting from operations | | $1,048,821 |
See accompanying notes which are an integral part of the financial statements.
Statement of Changes in Net Assets
| Amounts in thousands | Year ended October 31, 2019 | Year ended October 31, 2018 |
| Increase (Decrease) in Net Assets | | |
| Operations | | |
| Net investment income (loss) | $174,805 | $126,802 |
| Net realized gain (loss) | 104,178 | 277,712 |
| Change in net unrealized appreciation (depreciation) | 769,838 | (1,430,353) |
| Net increase (decrease) in net assets resulting from operations | 1,048,821 | (1,025,839) |
| Distributions to shareholders | (328,610) | (535,941) |
| Share transactions - net increase (decrease) | (1,178,397) | 427,927 |
| Total increase (decrease) in net assets | (458,186) | (1,133,853) |
| Net Assets | | |
| Beginning of period | 9,515,409 | 10,649,262 |
| End of period | $9,057,223 | $9,515,409 |
See accompanying notes which are an integral part of the financial statements.
Financial Highlights
Fidelity International Discovery Fund Class A
| Years ended October 31, | 2019 | 2018 | 2017 | 2016 | 2015 |
| Selected Per–Share Data | | | | | |
| Net asset value, beginning of period | $39.99 | $46.66 | $37.60 | $39.78 | $38.70 |
| Income from Investment Operations | | | | | |
| Net investment income (loss)A | .63B | .37 | .36 | .47C | .40D |
| Net realized and unrealized gain (loss) | 3.93 | (4.87) | 9.22 | (2.38) | .79 |
| Total from investment operations | 4.56 | (4.50) | 9.58 | (1.91) | 1.19 |
| Distributions from net investment income | (.33) | (.34) | (.47) | (.27) | (.11) |
| Distributions from net realized gain | (.91) | (1.83) | (.05) | (.01) | – |
| Total distributions | (1.24) | (2.17) | (.52) | (.27)E | (.11) |
| Redemption fees added to paid in capitalA | – | – | –F | –F | –F |
| Net asset value, end of period | $43.31 | $39.99 | $46.66 | $37.60 | $39.78 |
| Total ReturnG,H | 11.90% | (10.11)% | 25.87% | (4.83)% | 3.09% |
| Ratios to Average Net AssetsI,J | | | | | |
| Expenses before reductions | 1.12% | 1.22% | 1.29% | 1.35% | 1.33% |
| Expenses net of fee waivers, if any | 1.12% | 1.22% | 1.29% | 1.35% | 1.33% |
| Expenses net of all reductions | 1.11% | 1.21% | 1.27% | 1.34% | 1.32% |
| Net investment income (loss) | 1.57%B | .83% | .88% | 1.26%C | 1.00%D |
| Supplemental Data | | | | | |
| Net assets, end of period (in millions) | $185 | $191 | $248 | $236 | $283 |
| Portfolio turnover rateK | 70%L | 45%L | 42% | 50%L | 60%L |
A Calculated based on average shares outstanding during the period.
B Net investment income per share reflects large non-recurring dividends which amounted to $.21 per share. Excluding these non-recurring dividends, the ratio of net investment income (loss) to average net assets would have been 1.05%.
C Net investment income per share reflects a large, non-recurring dividend which amounted to $.14 per share. Excluding this non-recurring dividend, the ratio of net investment income (loss) to average net assets would have been .88%.
D Net investment income per share reflects a large, non-recurring dividend which amounted to $.12 per share. Excluding this non-recurring dividend, the ratio of net investment income (loss) to average net assets would have been .69%.
E Total distributions of $.27 per share is comprised of distributions from net investment income of $.269 and distributions from net realized gain of $.005 per share.
F Amount represents less than $.005 per share.
G Total returns would have been lower if certain expenses had not been reduced during the applicable periods shown.
H Total returns do not include the effect of the sales charges.
I Fees and expenses of any underlying Fidelity Central Funds are not included in the Fund's expense ratio. The Fund indirectly bears its proportionate share of the expenses of any underlying Fidelity Central Funds.
J Expense ratios reflect operating expenses of the class. Expenses before reductions do not reflect amounts reimbursed by the investment adviser or reductions from brokerage service arrangements or reductions from other expense offset arrangements and do not represent the amount paid by the class during periods when reimbursements or reductions occur. Expenses net of fee waivers reflect expenses after reimbursement by the investment adviser but prior to reductions from brokerage service arrangements or other expense offset arrangements. Expenses net of all reductions represent the net expenses paid by the class.
K Amount does not include the portfolio activity of any underlying Fidelity Central Funds.
L Portfolio turnover rate excludes securities received or delivered in-kind.
See accompanying notes which are an integral part of the financial statements.
Fidelity International Discovery Fund Class M
| Years ended October 31, | 2019 | 2018 | 2017 | 2016 | 2015 |
| Selected Per–Share Data | | | | | |
| Net asset value, beginning of period | $39.71 | $46.35 | $37.34 | $39.51 | $38.43 |
| Income from Investment Operations | | | | | |
| Net investment income (loss)A | .53B | .27 | .26 | .38C | .30D |
| Net realized and unrealized gain (loss) | 3.91 | (4.84) | 9.17 | (2.37) | .80 |
| Total from investment operations | 4.44 | (4.57) | 9.43 | (1.99) | 1.10 |
| Distributions from net investment income | (.22) | (.24) | (.37) | (.17) | (.02) |
| Distributions from net realized gain | (.91) | (1.83) | (.05) | (.01) | – |
| Total distributions | (1.14)E | (2.07) | (.42) | (.18) | (.02) |
| Redemption fees added to paid in capitalA | – | – | –F | –F | –F |
| Net asset value, end of period | $43.01 | $39.71 | $46.35 | $37.34 | $39.51 |
| Total ReturnG,H | 11.62% | (10.31)% | 25.57% | (5.07)% | 2.86% |
| Ratios to Average Net AssetsI,J | | | | | |
| Expenses before reductions | 1.37% | 1.46% | 1.53% | 1.58% | 1.57% |
| Expenses net of fee waivers, if any | 1.37% | 1.46% | 1.52% | 1.58% | 1.57% |
| Expenses net of all reductions | 1.35% | 1.45% | 1.51% | 1.57% | 1.56% |
| Net investment income (loss) | 1.32%B | .59% | .64% | 1.02%C | .76%D |
| Supplemental Data | | | | | |
| Net assets, end of period (in millions) | $24 | $28 | $35 | $35 | $43 |
| Portfolio turnover rateK | 70%L | 45%L | 42% | 50%L | 60%L |
A Calculated based on average shares outstanding during the period.
B Net investment income per share reflects large non-recurring dividends which amounted to $.21 per share. Excluding these non-recurring dividends, the ratio of net investment income (loss) to average net assets would have been .80%.
C Net investment income per share reflects a large, non-recurring dividend which amounted to $.14 per share. Excluding this non-recurring dividend, the ratio of net investment income (loss) to average net assets would have been .64%.
D Net investment income per share reflects a large, non-recurring dividend which amounted to $.12 per share. Excluding this non-recurring dividend, the ratio of net investment income (loss) to average net assets would have been .45%.
E Total distributions of $1.14 per share is comprised of distributions from net investment income of $.222 and distributions from net realized gain of $.913 per share.
F Amount represents less than $.005 per share.
G Total returns would have been lower if certain expenses had not been reduced during the applicable periods shown.
H Total returns do not include the effect of the sales charges.
I Fees and expenses of any underlying Fidelity Central Funds are not included in the Fund's expense ratio. The Fund indirectly bears its proportionate share of the expenses of any underlying Fidelity Central Funds.
J Expense ratios reflect operating expenses of the class. Expenses before reductions do not reflect amounts reimbursed by the investment adviser or reductions from brokerage service arrangements or reductions from other expense offset arrangements and do not represent the amount paid by the class during periods when reimbursements or reductions occur. Expenses net of fee waivers reflect expenses after reimbursement by the investment adviser but prior to reductions from brokerage service arrangements or other expense offset arrangements. Expenses net of all reductions represent the net expenses paid by the class.
K Amount does not include the portfolio activity of any underlying Fidelity Central Funds.
L Portfolio turnover rate excludes securities received or delivered in-kind.
See accompanying notes which are an integral part of the financial statements.
Fidelity International Discovery Fund Class C
| Years ended October 31, | 2019 | 2018 | 2017 | 2016 | 2015 |
| Selected Per–Share Data | | | | | |
| Net asset value, beginning of period | $39.32 | $45.94 | $36.96 | $39.14 | $38.25 |
| Income from Investment Operations | | | | | |
| Net investment income (loss)A | .31B | .02 | .04 | .19C | .10D |
| Net realized and unrealized gain (loss) | 3.88 | (4.79) | 9.12 | (2.37) | .79 |
| Total from investment operations | 4.19 | (4.77) | 9.16 | (2.18) | .89 |
| Distributions from net investment income | – | (.02) | (.13) | – | – |
| Distributions from net realized gain | (.91) | (1.83) | (.05) | – | – |
| Total distributions | (.91) | (1.85) | (.18) | – | – |
| Redemption fees added to paid in capitalA | – | – | –E | –E | –E |
| Net asset value, end of period | $42.60 | $39.32 | $45.94 | $36.96 | $39.14 |
| Total ReturnF,G | 11.02% | (10.80)% | 24.93% | (5.57)% | 2.33% |
| Ratios to Average Net AssetsH,I | | | | | |
| Expenses before reductions | 1.91% | 2.00% | 2.05% | 2.10% | 2.09% |
| Expenses net of fee waivers, if any | 1.91% | 2.00% | 2.05% | 2.10% | 2.09% |
| Expenses net of all reductions | 1.90% | 1.99% | 2.04% | 2.09% | 2.08% |
| Net investment income (loss) | .78%B | .05% | .11% | .50%C | .24%D |
| Supplemental Data | | | | | |
| Net assets, end of period (in millions) | $12 | $22 | $28 | $26 | $32 |
| Portfolio turnover rateJ | 70%K | 45%K | 42% | 50%K | 60%K |
A Calculated based on average shares outstanding during the period.
B Net investment income per share reflects large non-recurring dividends which amounted to $.21 per share. Excluding these non-recurring dividends, the ratio of net investment income (loss) to average net assets would have been .26%.
C Net investment income per share reflects a large, non-recurring dividend which amounted to $.14 per share. Excluding this non-recurring dividend, the ratio of net investment income (loss) to average net assets would have been .13%.
D Net investment income per share reflects a large, non-recurring dividend which amounted to $.12 per share. Excluding this non-recurring dividend, the ratio of net investment income (loss) to average net assets would have been (.06) %.
E Amount represents less than $.005 per share.
F Total returns would have been lower if certain expenses had not been reduced during the applicable periods shown.
G Total returns do not include the effect of the contingent deferred sales charge.
H Fees and expenses of any underlying Fidelity Central Funds are not included in the Fund's expense ratio. The Fund indirectly bears its proportionate share of the expenses of any underlying Fidelity Central Funds.
I Expense ratios reflect operating expenses of the class. Expenses before reductions do not reflect amounts reimbursed by the investment adviser or reductions from brokerage service arrangements or reductions from other expense offset arrangements and do not represent the amount paid by the class during periods when reimbursements or reductions occur. Expenses net of fee waivers reflect expenses after reimbursement by the investment adviser but prior to reductions from brokerage service arrangements or other expense offset arrangements. Expenses net of all reductions represent the net expenses paid by the class.
J Amount does not include the portfolio activity of any underlying Fidelity Central Funds.
K Portfolio turnover rate excludes securities received or delivered in-kind.
See accompanying notes which are an integral part of the financial statements.
Fidelity International Discovery Fund
| Years ended October 31, | 2019 | 2018 | 2017 | 2016 | 2015 |
| Selected Per–Share Data | | | | | |
| Net asset value, beginning of period | $40.32 | $47.04 | $37.91 | $40.12 | $39.03 |
| Income from Investment Operations | | | | | |
| Net investment income (loss)A | .78B | .53 | .50 | .61C | .54D |
| Net realized and unrealized gain (loss) | 3.95 | (4.92) | 9.29 | (2.41) | .81 |
| Total from investment operations | 4.73 | (4.39) | 9.79 | (1.80) | 1.35 |
| Distributions from net investment income | (.49) | (.50) | (.61) | (.41) | (.26) |
| Distributions from net realized gain | (.91) | (1.83) | (.05) | (.01) | – |
| Total distributions | (1.40) | (2.33) | (.66) | (.41)E | (.26) |
| Redemption fees added to paid in capitalA | – | – | –F | –F | –F |
| Net asset value, end of period | $43.65 | $40.32 | $47.04 | $37.91 | $40.12 |
| Total ReturnG | 12.31% | (9.81)% | 26.33% | (4.53)% | 3.47% |
| Ratios to Average Net AssetsH,I | | | | | |
| Expenses before reductions | .78% | .88% | .94% | 1.00% | .99% |
| Expenses net of fee waivers, if any | .78% | .88% | .94% | 1.00% | .99% |
| Expenses net of all reductions | .76% | .87% | .92% | .99% | .98% |
| Net investment income (loss) | 1.92%B | 1.17% | 1.22% | 1.61%C | 1.34%D |
| Supplemental Data | | | | | |
| Net assets, end of period (in millions) | $6,726 | $6,515 | $7,351 | $6,421 | $7,209 |
| Portfolio turnover rateJ | 70%K | 45%K | 42% | 50%K | 60%K |
A Calculated based on average shares outstanding during the period.
B Net investment income per share reflects large non-recurring dividends which amounted to $.21 per share. Excluding these non-recurring dividends, the ratio of net investment income (loss) to average net assets would have been 1.40%.
C Net investment income per share reflects a large, non-recurring dividend which amounted to $.14 per share. Excluding this non-recurring dividend, the ratio of net investment income (loss) to average net assets would have been 1.23%.
D Net investment income per share reflects a large, non-recurring dividend which amounted to $.12 per share. Excluding this non-recurring dividend, the ratio of net investment income (loss) to average net assets would have been 1.03%.
E Total distributions of $.41 per share is comprised of distributions from net investment income of $.409 and distributions from net realized gain of $.005 per share.
F Amount represents less than $.005 per share.
G Total returns would have been lower if certain expenses had not been reduced during the applicable periods shown.
H Fees and expenses of any underlying Fidelity Central Funds are not included in the Fund's expense ratio. The Fund indirectly bears its proportionate share of the expenses of any underlying Fidelity Central Funds.
I Expense ratios reflect operating expenses of the class. Expenses before reductions do not reflect amounts reimbursed by the investment adviser or reductions from brokerage service arrangements or reductions from other expense offset arrangements and do not represent the amount paid by the class during periods when reimbursements or reductions occur. Expenses net of fee waivers reflect expenses after reimbursement by the investment adviser but prior to reductions from brokerage service arrangements or other expense offset arrangements. Expenses net of all reductions represent the net expenses paid by the class.
J Amount does not include the portfolio activity of any underlying Fidelity Central Funds.
K Portfolio turnover rate excludes securities received or delivered in-kind.
See accompanying notes which are an integral part of the financial statements.
Fidelity International Discovery Fund Class K
| Years ended October 31, | 2019 | 2018 | 2017 | 2016 | 2015 |
| Selected Per–Share Data | | | | | |
| Net asset value, beginning of period | $40.25 | $46.96 | $37.86 | $40.06 | $38.97 |
| Income from Investment Operations | | | | | |
| Net investment income (loss)A | .82B | .58 | .55 | .66C | .59D |
| Net realized and unrealized gain (loss) | 3.93 | (4.90) | 9.26 | (2.39) | .81 |
| Total from investment operations | 4.75 | (4.32) | 9.81 | (1.73) | 1.40 |
| Distributions from net investment income | (.54) | (.55) | (.66) | (.46) | (.31) |
| Distributions from net realized gain | (.91) | (1.83) | (.05) | (.01) | – |
| Total distributions | (1.45) | (2.39)E | (.71) | (.47) | (.31) |
| Redemption fees added to paid in capitalA | – | – | –F | –F | –F |
| Net asset value, end of period | $43.55 | $40.25 | $46.96 | $37.86 | $40.06 |
| Total ReturnG | 12.41% | (9.70)% | 26.47% | (4.38)% | 3.61% |
| Ratios to Average Net AssetsH,I | | | | | |
| Expenses before reductions | .66% | .77% | .82% | .86% | .86% |
| Expenses net of fee waivers, if any | .66% | .77% | .82% | .86% | .86% |
| Expenses net of all reductions | .65% | .76% | .80% | .85% | .85% |
| Net investment income (loss) | 2.03%B | 1.29% | 1.35% | 1.74%C | 1.47%D |
| Supplemental Data | | | | | |
| Net assets, end of period (in millions) | $1,566 | $2,064 | $2,228 | $1,880 | $2,308 |
| Portfolio turnover rateJ | 70%K | 45%K | 42% | 50%K | 60%K |
A Calculated based on average shares outstanding during the period.
B Net investment income per share reflects large non-recurring dividends which amounted to $.21 per share. Excluding these non-recurring dividends, the ratio of net investment income (loss) to average net assets would have been 1.51%.
C Net investment income per share reflects a large, non-recurring dividend which amounted to $.14 per share. Excluding this non-recurring dividend, the ratio of net investment income (loss) to average net assets would have been 1.36%.
D Net investment income per share reflects a large, non-recurring dividend which amounted to $.12 per share. Excluding this non-recurring dividend, the ratio of net investment income (loss) to average net assets would have been 1.16%.
E Total distributions of $2.39 per share is comprised of distributions from net investment income of $.554 and distributions from net realized gain of $1.832 per share.
F Amount represents less than $.005 per share.
G Total returns would have been lower if certain expenses had not been reduced during the applicable periods shown.
H Fees and expenses of any underlying Fidelity Central Funds are not included in the Fund's expense ratio. The Fund indirectly bears its proportionate share of the expenses of any underlying Fidelity Central Funds.
I Expense ratios reflect operating expenses of the class. Expenses before reductions do not reflect amounts reimbursed by the investment adviser or reductions from brokerage service arrangements or reductions from other expense offset arrangements and do not represent the amount paid by the class during periods when reimbursements or reductions occur. Expenses net of fee waivers reflect expenses after reimbursement by the investment adviser but prior to reductions from brokerage service arrangements or other expense offset arrangements. Expenses net of all reductions represent the net expenses paid by the class.
J Amount does not include the portfolio activity of any underlying Fidelity Central Funds.
K Portfolio turnover rate excludes securities received or delivered in-kind.
See accompanying notes which are an integral part of the financial statements.
Fidelity International Discovery Fund Class I
| Years ended October 31, | 2019 | 2018 | 2017 | 2016 | 2015 |
| Selected Per–Share Data | | | | | |
| Net asset value, beginning of period | $40.22 | $46.92 | $37.82 | $40.03 | $38.96 |
| Income from Investment Operations | | | | | |
| Net investment income (loss)A | .77B | .52 | .49 | .61C | .53D |
| Net realized and unrealized gain (loss) | 3.93 | (4.90) | 9.27 | (2.40) | .80 |
| Total from investment operations | 4.70 | (4.38) | 9.76 | (1.79) | 1.33 |
| Distributions from net investment income | (.48) | (.49) | (.61) | (.42) | (.26) |
| Distributions from net realized gain | (.91) | (1.83) | (.05) | (.01) | – |
| Total distributions | (1.39) | (2.32) | (.66) | (.42)E | (.26) |
| Redemption fees added to paid in capitalA | – | – | –F | –F | –F |
| Net asset value, end of period | $43.53 | $40.22 | $46.92 | $37.82 | $40.03 |
| Total ReturnG | 12.26% | (9.81)% | 26.29% | (4.52)% | 3.44% |
| Ratios to Average Net AssetsH,I | | | | | |
| Expenses before reductions | .80% | .91% | .96% | 1.00% | 1.00% |
| Expenses net of fee waivers, if any | .80% | .91% | .96% | 1.00% | .99% |
| Expenses net of all reductions | .79% | .90% | .94% | .99% | .98% |
| Net investment income (loss) | 1.89%B | 1.15% | 1.21% | 1.60%C | 1.33%D |
| Supplemental Data | | | | | |
| Net assets, end of period (in millions) | $463 | $579 | $658 | $745 | $1,061 |
| Portfolio turnover rateJ | 70%K | 45%K | 42% | 50%K | 60%K |
A Calculated based on average shares outstanding during the period.
B Net investment income per share reflects large non-recurring dividends which amounted to $.21 per share. Excluding these non-recurring dividends, the ratio of net investment income (loss) to average net assets would have been 1.37%.
C Net investment income per share reflects a large, non-recurring dividend which amounted to $.14 per share. Excluding this non-recurring dividend, the ratio of net investment income (loss) to average net assets would have been 1.22%.
D Net investment income per share reflects a large, non-recurring dividend which amounted to $.12 per share. Excluding this non-recurring dividend, the ratio of net investment income (loss) to average net assets would have been 1.03%.
E Total distributions of $.42 per share is comprised of distributions from net investment income of $.418 and distributions from net realized gain of $.005 per share.
F Amount represents less than $.005 per share.
G Total returns would have been lower if certain expenses had not been reduced during the applicable periods shown.
H Fees and expenses of any underlying Fidelity Central Funds are not included in the Fund's expense ratio. The Fund indirectly bears its proportionate share of the expenses of any underlying Fidelity Central Funds.
I Expense ratios reflect operating expenses of the class. Expenses before reductions do not reflect amounts reimbursed by the investment adviser or reductions from brokerage service arrangements or reductions from other expense offset arrangements and do not represent the amount paid by the class during periods when reimbursements or reductions occur. Expenses net of fee waivers reflect expenses after reimbursement by the investment adviser but prior to reductions from brokerage service arrangements or other expense offset arrangements. Expenses net of all reductions represent the net expenses paid by the class.
J Amount does not include the portfolio activity of any underlying Fidelity Central Funds.
K Portfolio turnover rate excludes securities received or delivered in-kind.
See accompanying notes which are an integral part of the financial statements.
Fidelity International Discovery Fund Class Z
| Years ended October 31, | 2019 | 2018 | 2017 | 2016 | 2015 |
| Selected Per–Share Data | | | | | |
| Net asset value, beginning of period | $40.22 | $46.92 | $37.84 | $40.03 | $38.96 |
| Income from Investment Operations | | | | | |
| Net investment income (loss)A | .82B | .58 | .56 | .66C | .59D |
| Net realized and unrealized gain (loss) | 3.94 | (4.89) | 9.24 | (2.38) | .80 |
| Total from investment operations | 4.76 | (4.31) | 9.80 | (1.72) | 1.39 |
| Distributions from net investment income | (.54) | (.56) | (.67) | (.46) | (.32) |
| Distributions from net realized gain | (.91) | (1.83) | (.05) | (.01) | – |
| Total distributions | (1.46)E | (2.39) | (.72) | (.47) | (.32) |
| Redemption fees added to paid in capitalA | – | – | –F | –F | –F |
| Net asset value, end of period | $43.52 | $40.22 | $46.92 | $37.84 | $40.03 |
| Total ReturnG | 12.42% | (9.68)% | 26.44% | (4.36)% | 3.58% |
| Ratios to Average Net AssetsH,I | | | | | |
| Expenses before reductions | .66% | .77% | .82% | .86% | .86% |
| Expenses net of fee waivers, if any | .66% | .77% | .82% | .86% | .86% |
| Expenses net of all reductions | .65% | .76% | .80% | .85% | .85% |
| Net investment income (loss) | 2.03%B | 1.29% | 1.35% | 1.74%C | 1.47%D |
| Supplemental Data | | | | | |
| Net assets, end of period (in millions) | $82 | $118 | $101 | $38 | $30 |
| Portfolio turnover rateJ | 70%K | 45%K | 42% | 50%K | 60%K |
A Calculated based on average shares outstanding during the period.
B Net investment income per share reflects large non-recurring dividends which amounted to $.21 per share. Excluding these non-recurring dividends, the ratio of net investment income (loss) to average net assets would have been 1.51%.
C Net investment income per share reflects a large, non-recurring dividend which amounted to $.14 per share. Excluding this non-recurring dividend, the ratio of net investment income (loss) to average net assets would have been 1.36%.
D Net investment income per share reflects a large, non-recurring dividend which amounted to $.12 per share. Excluding this non-recurring dividend, the ratio of net investment income (loss) to average net assets would have been 1.16%.
E Total distributions of $1.46 per share is comprised of distributions from net investment income of $.542 and distributions from net realized gain of $.913 per share.
F Amount represents less than $.005 per share.
G Total returns would have been lower if certain expenses had not been reduced during the applicable periods shown.
H Fees and expenses of any underlying Fidelity Central Funds are not included in the Fund's expense ratio. The Fund indirectly bears its proportionate share of the expenses of any underlying Fidelity Central Funds.
I Expense ratios reflect operating expenses of the class. Expenses before reductions do not reflect amounts reimbursed by the investment adviser or reductions from brokerage service arrangements or reductions from other expense offset arrangements and do not represent the amount paid by the class during periods when reimbursements or reductions occur. Expenses net of fee waivers reflect expenses after reimbursement by the investment adviser but prior to reductions from brokerage service arrangements or other expense offset arrangements. Expenses net of all reductions represent the net expenses paid by the class.
J Amount does not include the portfolio activity of any underlying Fidelity Central Funds.
K Portfolio turnover rate excludes securities received or delivered in-kind.
See accompanying notes which are an integral part of the financial statements.
Notes to Financial Statements
For the period ended October 31, 2019
(Amounts in thousands except percentages)
1. Organization.
Fidelity International Discovery Fund (the Fund) is a fund of Fidelity Investment Trust (the Trust) and is authorized to issue an unlimited number of shares. The Trust is registered under the Investment Company Act of 1940, as amended (the 1940 Act), as an open-end management investment company organized as a Massachusetts business trust. The Fund offers Class A, Class M, Class C, International Discovery, Class K, Class I and Class Z shares, each of which has equal rights as to assets and voting privileges. Each class has exclusive voting rights with respect to matters that affect that class. Effective March 1, 2019, Class C shares will automatically convert to Class A shares after a holding period of ten years from the initial date of purchase, with certain exceptions.
2. Investments in Fidelity Central Funds.
The Fund invests in Fidelity Central Funds, which are open-end investment companies generally available only to other investment companies and accounts managed by the investment adviser and its affiliates. The Fund's Schedule of Investments lists each of the Fidelity Central Funds held as of period end, if any, as an investment of the Fund, but does not include the underlying holdings of each Fidelity Central Fund. As an Investing Fund, the Fund indirectly bears its proportionate share of the expenses of the underlying Fidelity Central Funds.
The Money Market Central Funds seek preservation of capital and current income and are managed by Fidelity Investments Money Management, Inc. (FIMM), an affiliate of the investment adviser. Annualized expenses of the Money Market Central Funds as of their most recent shareholder report date ranged from less than .005% to .01%.
A complete unaudited list of holdings for each Fidelity Central Fund is available upon request or at the Securities and Exchange Commission (the SEC) website at www.sec.gov. In addition, the financial statements of the Fidelity Central Funds, which are not covered by the Fund's Report of Independent Registered Public Accounting Firm, are available on the SEC website or upon request.
3. Significant Accounting Policies.
The Fund is an investment company and applies the accounting and reporting guidance of the Financial Accounting Standards Board (FASB) Accounting Standards Codification Topic 946 Financial Services – Investments Companies. The financial statements have been prepared in conformity with accounting principles generally accepted in the United States of America (GAAP), which require management to make certain estimates and assumptions at the date of the financial statements. Actual results could differ from those estimates. Subsequent events, if any, through the date that the financial statements were issued have been evaluated in the preparation of the financial statements. The following summarizes the significant accounting policies of the Fund:
Investment Valuation. Investments are valued as of 4:00 p.m. Eastern time on the last calendar day of the period. The Board of Trustees (the Board) has delegated the day to day responsibility for the valuation of the Fund's investments to the Fair Value Committee (the Committee) established by the Fund's investment adviser. In accordance with valuation policies and procedures approved by the Board, the Fund attempts to obtain prices from one or more third party pricing vendors or brokers to value its investments. When current market prices, quotations or currency exchange rates are not readily available or reliable, investments will be fair valued in good faith by the Committee, in accordance with procedures adopted by the Board. Factors used in determining fair value vary by investment type and may include market or investment specific events. The frequency with which these procedures are used cannot be predicted and they may be utilized to a significant extent. The Committee oversees the Fund's valuation policies and procedures and reports to the Board on the Committee's activities and fair value determinations. The Board monitors the appropriateness of the procedures used in valuing the Fund's investments and ratifies the fair value determinations of the Committee.
The Fund categorizes the inputs to valuation techniques used to value its investments into a disclosure hierarchy consisting of three levels as shown below:
- Level 1 – quoted prices in active markets for identical investments
- Level 2 – other significant observable inputs (including quoted prices for similar investments, interest rates, prepayment speeds, etc.)
- Level 3 – unobservable inputs (including the Fund's own assumptions based on the best information available)
Valuation techniques used to value the Fund's investments by major category are as follows:
Equity securities, including restricted securities, for which market quotations are readily available, are valued at the last reported sale price or official closing price as reported by a third party pricing vendor on the primary market or exchange on which they are traded and are categorized as Level 1 in the hierarchy. In the event there were no sales during the day or closing prices are not available, securities are valued at the last quoted bid price or may be valued using the last available price and are generally categorized as Level 2 in the hierarchy. For foreign equity securities, when market or security specific events arise, comparisons to the valuation of American Depositary Receipts (ADRs), futures contracts, Exchange-Traded Funds (ETFs) and certain indexes as well as quoted prices for similar securities may be used and would be categorized as Level 2 in the hierarchy. For equity securities, including restricted securities, where observable inputs are limited, assumptions about market activity and risk are used and these securities may be categorized as Level 3 in the hierarchy.
Investments in open-end mutual funds, including the Fidelity Central Funds, are valued at their closing net asset value (NAV) each business day and are categorized as Level 1 in the hierarchy.
Changes in valuation techniques may result in transfers in or out of an assigned level within the disclosure hierarchy. The aggregate value of investments by input level as of October 31, 2019 is included at the end of the Fund's Schedule of Investments.
Foreign Currency. The Fund may use foreign currency contracts to facilitate transactions in foreign-denominated securities. Gains and losses from these transactions may arise from changes in the value of the foreign currency or if the counterparties do not perform under the contracts' terms.
Foreign-denominated assets, including investment securities, and liabilities are translated into U.S. dollars at the exchange rates at period end. Purchases and sales of investment securities, income and dividends received and expenses denominated in foreign currencies are translated into U.S. dollars at the exchange rate in effect on the transaction date.
The effects of exchange rate fluctuations on investments are included with the net realized and unrealized gain (loss) on investment securities. Other foreign currency transactions resulting in realized and unrealized gain (loss) are disclosed separately.
Investment Transactions and Income. For financial reporting purposes, the Fund's investment holdings and NAV include trades executed through the end of the last business day of the period. The NAV per share for processing shareholder transactions is calculated as of the close of business of the New York Stock Exchange (NYSE), normally 4:00 p.m. Eastern time and includes trades executed through the end of the prior business day. Gains and losses on securities sold are determined on the basis of identified cost and include proceeds received from litigation. Dividend income is recorded on the ex-dividend date, except for certain dividends from foreign securities where the ex-dividend date may have passed, which are recorded as soon as the Fund is informed of the ex-dividend date. Non-cash dividends included in dividend income, if any, are recorded at the fair market value of the securities received. Income and capital gain distributions from Fidelity Central Funds, if any, are recorded on the ex-dividend date. Large, non-recurring dividends recognized by the Fund are presented separately on the Statement of Operations as "Non-cash dividends" and the impact of these dividends is presented in the Financial Highlights. Certain distributions received by the Fund represent a return of capital or capital gain. The Fund determines the components of these distributions subsequent to the ex-dividend date, based upon receipt of tax filings or other correspondence relating to the underlying investment. These distributions are recorded as a reduction of cost of investments and/or as a realized gain. Interest income is accrued as earned and includes coupon interest and amortization of premium and accretion of discount on debt securities as applicable. Investment income is recorded net of foreign taxes withheld where recovery of such taxes is uncertain.
Class Allocations and Expenses. Investment income, realized and unrealized capital gains and losses, common expenses of the Fund, and certain fund-level expense reductions, if any, are allocated daily on a pro-rata basis to each class based on the relative net assets of each class to the total net assets of the Fund. Each class differs with respect to transfer agent and distribution and service plan fees incurred. Certain expense reductions may also differ by class. For the reporting period, the allocated portion of income and expenses to each class as a percent of its average net assets may vary due to the timing of recording these transactions in relation to fluctuating net assets of the classes. Expenses directly attributable to a fund are charged to that fund. Expenses attributable to more than one fund are allocated among the respective funds on the basis of relative net assets or other appropriate methods. Expense estimates are accrued in the period to which they relate and adjustments are made when actual amounts are known.
Deferred Trustee Compensation. Under a Deferred Compensation Plan (the Plan) for the Fund, certain independent Trustees have elected to defer receipt of a portion of their annual compensation. Deferred amounts are invested in a cross-section of Fidelity funds, are marked-to-market and remain in the Fund until distributed in accordance with the Plan. The investment of deferred amounts and the offsetting payable to the Trustees of $459 are included in the accompanying Statement of Assets and Liabilities in other receivables and other payables and accrued expenses, respectively.
Income Tax Information and Distributions to Shareholders. Each year, the Fund intends to qualify as a regulated investment company under Subchapter M of the Internal Revenue Code, including distributing substantially all of its taxable income and realized gains. As a result, no provision for U.S. Federal income taxes is required. As of October 31, 2019, the Fund did not have any unrecognized tax benefits in the financial statements; nor is the Fund aware of any tax positions for which it is reasonably possible that the total amounts of unrecognized tax benefits will significantly change in the next twelve months. The Fund files a U.S. federal tax return, in addition to state and local tax returns as required. The Fund's federal income tax returns are subject to examination by the Internal Revenue Service (IRS) for a period of three fiscal years after they are filed. State and local tax returns may be subject to examination for an additional fiscal year depending on the jurisdiction. Foreign taxes are provided for based on the Fund's understanding of the tax rules and rates that exist in the foreign markets in which it invests.
Distributions are declared and recorded on the ex-dividend date. Income and capital gain distributions are declared separately for each class. Income and capital gain distributions are determined in accordance with income tax regulations, which may differ from GAAP. In addition, the Fund claimed a portion of the payment made to redeeming shareholders as a distribution for income tax purposes.
Capital accounts within the financial statements are adjusted for permanent book-tax differences. These adjustments have no impact on net assets or the results of operations. Capital accounts are not adjusted for temporary book-tax differences which will reverse in a subsequent period.
Book-tax differences are primarily due to foreign currency transactions, passive foreign investment companies (PFIC), market discount, redemptions in kind, deferred trustees compensation and losses deferred due to wash sales.
As of period end, the cost and unrealized appreciation (depreciation) in securities, and derivatives if applicable, for federal income tax purposes were as follows:
| Gross unrealized appreciation | $1,840,453 |
| Gross unrealized depreciation | (232,950) |
| Net unrealized appreciation (depreciation) | $1,607,503 |
| Tax Cost | $7,481,088 |
The tax-based components of distributable earnings as of period end were as follows:
| Undistributed ordinary income | $158,644 |
| Undistributed long-term capital gain | $57,328 |
| Net unrealized appreciation (depreciation) on securities and other investments | $1,605,583 |
The tax character of distributions paid was as follows:
| | October 31, 2019 | October 31, 2018 |
| Ordinary Income | $115,761 | $ 123,038 |
| Long-term Capital Gains | 212,849 | 412,903 |
| Total | $328,610 | $ 535,941 |
Restricted Securities. The Fund may invest in securities that are subject to legal or contractual restrictions on resale. These securities generally may be resold in transactions exempt from registration or to the public if the securities are registered. Disposal of these securities may involve time-consuming negotiations and expense, and prompt sale at an acceptable price may be difficult. Information regarding restricted securities is included at the end of the Fund's Schedule of Investments.
4. Derivative Instruments.
Risk Exposures and the Use of Derivative Instruments. The Fund's investment objective allows the Fund to enter into various types of derivative contracts, including futures contracts. Derivatives are investments whose value is primarily derived from underlying assets, indices or reference rates and may be transacted on an exchange or over-the-counter (OTC). Derivatives may involve a future commitment to buy or sell a specified asset based on specified terms, to exchange future cash flows at periodic intervals based on a notional principal amount, or for one party to make one or more payments upon the occurrence of specified events in exchange for periodic payments from the other party.
The Fund used derivatives to increase returns and to manage exposure to certain risks as defined below. The success of any strategy involving derivatives depends on analysis of numerous economic factors, and if the strategies for investment do not work as intended, the Fund may not achieve its objectives.
The Fund's use of derivatives increased or decreased its exposure to the following risk:
| Equity Risk | Equity risk relates to the fluctuations in the value of financial instruments as a result of changes in market prices (other than those arising from interest rate risk or foreign exchange risk), whether caused by factors specific to an individual investment, its issuer, or all factors affecting all instruments traded in a market or market segment.
|
The Fund is also exposed to additional risks from investing in derivatives, such as liquidity risk and counterparty credit risk. Liquidity risk is the risk that the Fund will be unable to close out the derivative in the open market in a timely manner. Counterparty credit risk is the risk that the counterparty will not be able to fulfill its obligation to the Fund. Counterparty credit risk related to exchange-traded futures contracts may be mitigated by the protection provided by the exchange on which they trade.
Investing in derivatives may involve greater risks than investing in the underlying assets directly and, to varying degrees, may involve risk of loss in excess of any initial investment and collateral received and amounts recognized in the Statement of Assets and Liabilities. In addition, there may be the risk that the change in value of the derivative contract does not correspond to the change in value of the underlying instrument.
Futures Contracts. A futures contract is an agreement between two parties to buy or sell a specified underlying instrument for a fixed price at a specified future date. The Fund used futures contracts to manage its exposure to the stock market.
Upon entering into a futures contract, a fund is required to deposit either cash or securities (initial margin) with a clearing broker in an amount equal to a certain percentage of the face value of the contract. Futures contracts are marked-to-market daily and subsequent daily payments (variation margin) are made or received by a fund depending on the daily fluctuations in the value of the futures contracts and are recorded as unrealized appreciation or (depreciation). This receivable and/or payable, if any, is included in daily variation margin on futures contracts in the Statement of Assets and Liabilities. Realized gain or (loss) is recorded upon the expiration or closing of a futures contract. The net realized gain (loss) and change in net unrealized appreciation (depreciation) on futures contracts during the period is presented in the Statement of Operations.
Any open futures contracts at period end are presented in the Schedule of Investments under the caption "Futures Contracts". The notional amount at value reflects each contract's exposure to the underlying instrument or index at period end and is representative of volume of activity during the period.
5. Purchases and Sales of Investments.
Purchases and sales of securities, other than short-term securities and in-kind transactions, aggregated $6,017,923 and $6,239,798, respectively.
Unaffiliated Redemptions In-Kind. During the period, 2,812 shares of the Fund were redeemed in-kind for investments and cash with a value of $119,262. The net realized gain of $30,907 on investments delivered through in-kind redemptions is included in the accompanying Statement of Operations. The amount of the in-kind redemptions is included in share transactions in the accompanying Statement of Changes in Net Assets as well as the Notes to Financial Statements. The Fund recognized no gain or loss for federal income tax purposes.
Prior Fiscal Year Unaffiliated Redemptions In-Kind. During the prior period, 2,145 shares of the Fund were redeemed in-kind for investments and cash with a value of $96,039. The Fund had a net realized gain of $24,574 on investments delivered through in-kind redemptions. The amount of the in-kind redemptions is included in share transactions in the accompanying Statement of Changes in Net Assets as well as the Notes to Financial Statements. The Fund recognized no gain or loss for federal income tax purposes.
6. Fees and Other Transactions with Affiliates.
Management Fee. Fidelity Management & Research Company (the investment adviser) and its affiliates provide the Fund with investment management related services for which the Fund pays a monthly management fee. The management fee is the sum of an individual fund fee rate that is based on an annual rate of .424% of the Fund's average net assets and an annualized group fee rate that averaged .24% during the period. The group fee rate is based upon the average net assets of all the mutual funds advised by the investment adviser, including any mutual funds previously advised by the investment adviser that are currently advised by Fidelity SelectCo, LLC, an affiliate of the investment adviser. The group fee rate decreases as assets under management increase and increases as assets under management decrease. In addition, the management fee is subject to a performance adjustment (up to a maximum of +/- .20% of the Fund's average net assets over a 36 month performance period). The upward or downward adjustment to the management fee is based on the relative investment performance of International Discovery as compared to its benchmark index, the MSCI EAFE Index, over the same 36 month performance period. For the reporting period, the total annual management fee rate, including the performance adjustment, was .58% of the Fund's average net assets. The performance adjustment included in the management fee rate may be higher or lower than the maximum performance adjustment rate due to the difference between the average net assets for the reporting and performance periods.
Distribution and Service Plan Fees. In accordance with Rule 12b-1 of the 1940 Act, the Fund has adopted separate Distribution and Service Plans for each class of shares. Certain classes pay Fidelity Distributors Corporation (FDC), an affiliate of the investment adviser, separate Distribution and Service Fees, each of which is based on an annual percentage of each class' average net assets. In addition, FDC may pay financial intermediaries for selling shares of the Fund and providing shareholder support services. For the period, the Distribution and Service Fee rates, total fees and amounts retained by FDC were as follows:
| | Distribution Fee | Service Fee | Total Fees | Retained by FDC |
| Class A | -% | .25% | $462 | $3 |
| Class M | .25% | .25% | 126 | 1 |
| Class C | .75% | .25% | 158 | 12 |
| | | | $746 | $16 |
Sales Load. FDC may receive a front-end sales charge of up to 5.75% for selling Class A shares and 3.50% for selling Class M shares, some of which is paid to financial intermediaries for selling shares of the Fund. Depending on the holding period, FDC may receive contingent deferred sales charges levied on Class A, Class M and Class C redemptions. The deferred sales charges are 1.00% for Class C shares, 1.00% for certain purchases of Class A shares and .25% for certain purchases of Class M shares.
For the period, sales charge amounts retained by FDC were as follows:
| | Retained by FDC |
| Class A | $18 |
| Class M | 2 |
| Class C(a) | 1 |
| | $21 |
(a) When Class C shares are initially sold, FDC pays commissions from its own resources to financial intermediaries through which the sales are made.
Transfer Agent Fees. Fidelity Investments Institutional Operations Company, Inc., (FIIOC), an affiliate of the investment adviser, is the transfer, dividend disbursing and shareholder servicing agent for each class of the Fund. FIIOC receives account fees and asset-based fees that vary according to the account size and type of account of the shareholders of the respective classes of the Fund, except for Class K and Class Z. FIIOC receives an asset-based fee of Class K's and Class Z's average net assets. FIIOC pays for typesetting, printing and mailing of shareholder reports, except proxy statements.
For the period, transfer agent fees for each applicable class were as follows:
| | Amount | % of Class-Level Average Net Assets |
| Class A | $474 | .26 |
| Class M | 64 | .25 |
| Class C | 45 | .29 |
| International Discovery | 10,183 | .16 |
| Class K | 826 | .05 |
| Class I | 931 | .18 |
| Class Z | 44 | .05 |
| | $12,567 | |
Accounting and Security Lending Fees. Fidelity Service Company, Inc. (FSC), an affiliate of the investment adviser, maintains the Fund's accounting records. The accounting fee is based on the level of average net assets for each month. Prior to April 1, 2019, FSC had a separate agreement with the Fund for administration of the security lending program, based on the number and duration of lending transactions. For the period, the total fees paid for accounting and administration of securities lending were equivalent to an annual rate of .02%.
Brokerage Commissions. The Fund placed a portion of its portfolio transactions with brokerage firms which are affiliates of the investment adviser. Brokerage commissions are included in net realized gain (loss) and change in net unrealized appreciation (depreciation) in the Statement of Operations. The commissions paid to these affiliated firms were $7 for the period.
Interfund Lending Program. Pursuant to an Exemptive Order issued by the SEC, the Fund, along with other registered investment companies having management contracts with Fidelity Management & Research Company (FMR) or other affiliated entities of FMR, may participate in an interfund lending program. This program provides an alternative credit facility allowing the funds to borrow from, or lend money to, other participating affiliated funds. At period end, there were no interfund loans outstanding. The Fund's activity in this program during the period for which loans were outstanding was as follows:
| Borrower or Lender | Average Loan Balance | Weighted Average Interest Rate | Interest Expense |
| Borrower | $25,694 | 2.62% | $19 |
Interfund Trades. The Funds may purchase from or sell securities to other Fidelity Funds under procedures adopted by the Board. The procedures have been designed to ensure these interfund trades are executed in accordance with Rule 17a-7 of the 1940 Act. Interfund trades are included within the respective purchases and sales amounts shown in the Purchases and Sales of Investments note.
Affiliated Redemptions In-Kind. During the period, 1,243 shares of the Fund were redeemed in-kind for investments cash with a value of $50,887. The net realized gain of $12,062 on investments delivered through in-kind redemptions is included in the accompanying Statement of Operations. The amount of the in-kind redemptions is included in share transactions in the accompanying Statement of Changes in Net Assets as well as the Notes to Financial Statements. The Fund recognized no gain or loss for federal income tax purposes.
7. Committed Line of Credit.
The Fund participates with other funds managed by the investment adviser or an affiliate in a $4.25 billion credit facility (the "line of credit") to be utilized for temporary or emergency purposes to fund shareholder redemptions or for other short-term liquidity purposes. The Fund has agreed to pay commitment fees on its pro-rata portion of the line of credit, which amounted to $24 and is reflected in Miscellaneous expenses on the Statement of Operations. During the period, the Fund did not borrow on this line of credit.
8. Security Lending.
The Fund lends portfolio securities from time to time in order to earn additional income. For equity securities, lending agents are used, including National Financial Services (NFS), an affiliate of the Fund. Pursuant to a securities lending agreement, NFS will receive a fee, which is capped at 9.9% of daily lending revenue, for its services as lending agent. The Fund may lend securities to certain qualified borrowers, including NFS. On the settlement date of the loan, the Fund receives collateral (in the form of U.S. Treasury obligations, letters of credit and/or cash) against the loaned securities and maintains collateral in an amount not less than 100% of the market value of the loaned securities during the period of the loan. The market value of the loaned securities is determined at the close of business of the Fund and any additional required collateral is delivered to the Fund on the next business day. The Fund or borrower may terminate the loan at any time, and if the borrower defaults on its obligation to return the securities loaned because of insolvency or other reasons, the Fund may apply collateral received from the borrower against the obligation. The Fund may experience delays and costs in recovering the securities loaned. Any cash collateral received is invested in the Fidelity Securities Lending Cash Central Fund. The value of loaned securities and cash collateral at period end are disclosed on the Fund's Statement of Assets and Liabilities. At period end, there were no security loans outstanding with NFS, as affiliated borrower. Total fees paid by the Fund to NFS, as lending agent, amounted to less than five hundred dollars. Security lending income represents the income earned on investing cash collateral, less rebates paid to borrowers and any lending agent fees associated with the loan, plus any premium payments received for lending certain types of securities. Security lending income is presented in the Statement of Operations as a component of income from Fidelity Central Funds, and includes less than five hundered dollars from securities loaned to NFS, as affiliated borrower.
9. Expense Reductions.
Commissions paid to certain brokers with whom the investment adviser, or its affiliates, places trades on behalf of the Fund include an amount in addition to trade execution, which may be rebated back to the Fund to offset certain expenses. This amount totaled $1,335 for the period.
In addition, during the period the investment adviser reimbursed and/or waived a portion of fund-level operating expenses in the amount of $71.
10. Distributions to Shareholders.
Distributions to shareholders of each class were as follows:
| | Year ended
October 31, 2019 | Year ended
October 31, 2018 |
| Distributions to shareholders | | |
| Class A | $5,794 | $11,257 |
| Class M | 790 | 1,557 |
| Class C | 484 | 1,132 |
| International Discovery | 224,704 | 368,791 |
| Class K | 72,802 | 115,669 |
| Class I | 19,867 | 32,390 |
| Class Z | 4,169 | 5,145 |
| Total | $328,610 | $535,941 |
11. Share Transactions.
Share transactions for each class were as follows and may contain automatic conversions between classes or exchanges between affiliated funds:
| | Shares | Shares | Dollars | Dollars |
| | Year ended October 31, 2019 | Year ended October 31, 2018 | Year ended October 31, 2019 | Year ended October 31, 2018 |
| Class A | | | | |
| Shares sold | 522 | 601 | $20,985 | $27,288 |
| Reinvestment of distributions | 154 | 252 | 5,740 | 11,177 |
| Shares redeemed | (1,183) | (1,390) | (47,771) | (62,507) |
| Net increase (decrease) | (507) | (537) | $(21,046) | $(24,042) |
| Class M | | | | |
| Shares sold | 64 | 91 | $2,568 | $4,077 |
| Reinvestment of distributions | 21 | 35 | 785 | 1,549 |
| Shares redeemed | (228) | (177) | (9,095) | (7,916) |
| Net increase (decrease) | (143) | (51) | $(5,742) | $(2,290) |
| Class C | | | | |
| Shares sold | 28 | 57 | $1,131 | $2,552 |
| Reinvestment of distributions | 13 | 25 | 478 | 1,083 |
| Shares redeemed | (299) | (152) | (11,875) | (6,753) |
| Net increase (decrease) | (258) | (70) | $(10,266) | $(3,118) |
| International Discovery | | | | |
| Shares sold | 14,442 | 18,511 | $585,326 | $834,070 |
| Reinvestment of distributions | 4,741 | 7,869 | 177,779 | 351,491 |
| Shares redeemed | (26,635) | (21,100) | (1,075,827) | (952,137) |
| Net increase (decrease) | (7,452) | 5,280 | $(312,722) | $233,424 |
| Class K | | | | |
| Shares sold | 7,723 | 15,085 | $309,132 | $683,626 |
| Reinvestment of distributions | 1,948 | 2,597 | 72,802 | 115,669 |
| Shares redeemed | (24,994)(a),(b) | (13,867)(c) | (1,014,241)(a),(b) | (624,849)(c) |
| Net increase (decrease) | (15,323) | 3,815 | $(632,307) | $174,446 |
| Class I | | | | |
| Shares sold | 3,057 | 3,244 | $119,482 | $143,374 |
| Reinvestment of distributions | 164 | 224 | 6,118 | 9,992 |
| Shares redeemed | (6,985) | (3,099) | (278,018) | (138,824) |
| Net increase (decrease) | (3,764) | 369 | $(152,418) | $14,542 |
| Class Z | | | | |
| Shares sold | 656 | 1,231 | $25,184 | $55,218 |
| Reinvestment of distributions | 60 | 67 | 2,239 | 2,993 |
| Shares redeemed | (1,776) | (517) | (71,319) | (23,246) |
| Net increase (decrease) | (1,060) | 781 | $(43,896) | $34,965 |
(a) Amount includes in-kind redemptions (see the Unaffiliated Redemptions In-Kind note for additional details).
(b) Amount includes in-kind redemptions (see the Affiliated Redemptions In-Kind note for additional details).
(c) Amount includes in-kind redemptions (see the Prior Fiscal Year Redemptions In-Kind note for additional details).
12. Other.
The Fund's organizational documents provide former and current trustees and officers with a limited indemnification against liabilities arising in connection with the performance of their duties to the Fund. In the normal course of business, the Fund may also enter into contracts that provide general indemnifications. The Fund's maximum exposure under these arrangements is unknown as this would be dependent on future claims that may be made against the Fund. The risk of material loss from such claims is considered remote.
At the end of the period, Strategic Advisers International Fund and Strategic Advisers Fidelity International Fund were the owners of record of approximately 12% and 14%, respectively, of the total outstanding shares of the Fund. Mutual funds managed by the investment adviser or its affiliates were the owners of record, in the aggregate, of approximately 26% of the total outstanding shares of the Fund.
Report of Independent Registered Public Accounting Firm
To the Board of Trustees of Fidelity Investment Trust and Shareholders of Fidelity International Discovery Fund:
Opinion on the Financial Statements
We have audited the accompanying statement of assets and liabilities, including the schedule of investments, of Fidelity International Discovery Fund (one of the funds constituting Fidelity Investment Trust, referred to hereafter as the “Fund”) as of October 31, 2019, the related statement of operations for the year ended October 31, 2019, the statement of changes in net assets for each of the two years in the period ended October 31, 2019, including the related notes, and the financial highlights for each of the five years in the period ended October 31, 2019 (collectively referred to as the “financial statements”). In our opinion, the financial statements present fairly, in all material respects, the financial position of the Fund as of October 31, 2019, the results of its operations for the year then ended, the changes in its net assets for each of the two years in the period ended October 31, 2019 and the financial highlights for each of the five years in the period ended October 31, 2019 in conformity with accounting principles generally accepted in the United States of America.
Basis for Opinion
These financial statements are the responsibility of the Fund’s management. Our responsibility is to express an opinion on the Fund’s financial statements based on our audits. We are a public accounting firm registered with the Public Company Accounting Oversight Board (United States) (PCAOB) and are required to be independent with respect to the Fund in accordance with the U.S. federal securities laws and the applicable rules and regulations of the Securities and Exchange Commission and the PCAOB.
We conducted our audits of these financial statements in accordance with the standards of the PCAOB. Those standards require that we plan and perform the audit to obtain reasonable assurance about whether the financial statements are free of material misstatement, whether due to error or fraud.
Our audits included performing procedures to assess the risks of material misstatement of the financial statements, whether due to error or fraud, and performing procedures that respond to those risks. Such procedures included examining, on a test basis, evidence regarding the amounts and disclosures in the financial statements. Our audits also included evaluating the accounting principles used and significant estimates made by management, as well as evaluating the overall presentation of the financial statements. Our procedures included confirmation of securities owned as of October 31, 2019 by correspondence with the custodian and brokers; when replies were not received from brokers, we performed other auditing procedures. We believe that our audits provide a reasonable basis for our opinion.
PricewaterhouseCoopers LLP
Boston, Massachusetts
December 11, 2019
We have served as the auditor of one or more investment companies in the Fidelity group of funds since 1932.
Trustees and Officers
The Trustees, Members of the Advisory Board (if any), and officers of the trust and fund, as applicable, are listed below. The Board of Trustees governs the fund and is responsible for protecting the interests of shareholders. The Trustees are experienced executives who meet periodically throughout the year to oversee the fund's activities, review contractual arrangements with companies that provide services to the fund, oversee management of the risks associated with such activities and contractual arrangements, and review the fund's performance. Except for Jonathan Chiel, each of the Trustees oversees 298 funds. Mr. Chiel oversees 171 funds.
The Trustees hold office without limit in time except that (a) any Trustee may resign; (b) any Trustee may be removed by written instrument, signed by at least two-thirds of the number of Trustees prior to such removal; (c) any Trustee who requests to be retired or who has become incapacitated by illness or injury may be retired by written instrument signed by a majority of the other Trustees; and (d) any Trustee may be removed at any special meeting of shareholders by a two-thirds vote of the outstanding voting securities of the trust. Each Trustee who is not an interested person (as defined in the 1940 Act) of the trust and the fund is referred to herein as an Independent Trustee. Each Independent Trustee shall retire not later than the last day of the calendar year in which his or her 75th birthday occurs. The Independent Trustees may waive this mandatory retirement age policy with respect to individual Trustees. Officers and Advisory Board Members hold office without limit in time, except that any officer or Advisory Board Member may resign or may be removed by a vote of a majority of the Trustees at any regular meeting or any special meeting of the Trustees. Except as indicated, each individual has held the office shown or other offices in the same company for the past five years.
The fund's Statement of Additional Information (SAI) includes more information about the Trustees. To request a free copy, call Fidelity at 1-800-544-8544 if you’re an individual investing directly with Fidelity, call 1-800-835-5092 if you’re a plan sponsor or participant with Fidelity as your recordkeeper or call 1-877-208-0098 on institutional accounts or if you’re an advisor or invest through one.
Experience, Skills, Attributes, and Qualifications of the Trustees. The Governance and Nominating Committee has adopted a statement of policy that describes the experience, qualifications, attributes, and skills that are necessary and desirable for potential Independent Trustee candidates (Statement of Policy). The Board believes that each Trustee satisfied at the time he or she was initially elected or appointed a Trustee, and continues to satisfy, the standards contemplated by the Statement of Policy. The Governance and Nominating Committee also engages professional search firms to help identify potential Independent Trustee candidates who have the experience, qualifications, attributes, and skills consistent with the Statement of Policy. From time to time, additional criteria based on the composition and skills of the current Independent Trustees, as well as experience or skills that may be appropriate in light of future changes to board composition, business conditions, and regulatory or other developments, have also been considered by the professional search firms and the Governance and Nominating Committee. In addition, the Board takes into account the Trustees' commitment and participation in Board and committee meetings, as well as their leadership of standing and ad hoc committees throughout their tenure.
In determining that a particular Trustee was and continues to be qualified to serve as a Trustee, the Board has considered a variety of criteria, none of which, in isolation, was controlling. The Board believes that, collectively, the Trustees have balanced and diverse experience, qualifications, attributes, and skills, which allow the Board to operate effectively in governing the fund and protecting the interests of shareholders. Information about the specific experience, skills, attributes, and qualifications of each Trustee, which in each case led to the Board's conclusion that the Trustee should serve (or continue to serve) as a trustee of the fund, is provided below.
Board Structure and Oversight Function. James C. Curvey is an interested person and currently serves as Chairman. The Trustees have determined that an interested Chairman is appropriate and benefits shareholders because an interested Chairman has a personal and professional stake in the quality and continuity of services provided to the fund. Independent Trustees exercise their informed business judgment to appoint an individual of their choosing to serve as Chairman, regardless of whether the Trustee happens to be independent or a member of management. The Independent Trustees have determined that they can act independently and effectively without having an Independent Trustee serve as Chairman and that a key structural component for assuring that they are in a position to do so is for the Independent Trustees to constitute a substantial majority for the Board. The Independent Trustees also regularly meet in executive session. Ned C. Lautenbach serves as Chairman of the Independent Trustees and as such (i) acts as a liaison between the Independent Trustees and management with respect to matters important to the Independent Trustees and (ii) with management prepares agendas for Board meetings.
Fidelity® funds are overseen by different Boards of Trustees. The fund's Board oversees Fidelity's high income and certain equity funds, and other Boards oversee Fidelity's investment-grade bond, money market, asset allocation, and other equity funds. The asset allocation funds may invest in Fidelity® funds overseen by the fund's Board. The use of separate Boards, each with its own committee structure, allows the Trustees of each group of Fidelity® funds to focus on the unique issues of the funds they oversee, including common research, investment, and operational issues. On occasion, the separate Boards establish joint committees to address issues of overlapping consequences for the Fidelity® funds overseen by each Board.
The Trustees operate using a system of committees to facilitate the timely and efficient consideration of all matters of importance to the Trustees, the fund, and fund shareholders and to facilitate compliance with legal and regulatory requirements and oversight of the fund's activities and associated risks. The Board, acting through its committees, has charged FMR and its affiliates with (i) identifying events or circumstances the occurrence of which could have demonstrably adverse effects on the fund's business and/or reputation; (ii) implementing processes and controls to lessen the possibility that such events or circumstances occur or to mitigate the effects of such events or circumstances if they do occur; and (iii) creating and maintaining a system designed to evaluate continuously business and market conditions in order to facilitate the identification and implementation processes described in (i) and (ii) above. Because the day-to-day operations and activities of the fund are carried out by or through FMR, its affiliates, and other service providers, the fund's exposure to risks is mitigated but not eliminated by the processes overseen by the Trustees. While each of the Board's committees has responsibility for overseeing different aspects of the fund's activities, oversight is exercised primarily through the Operations, Audit, and Compliance Committees. Appropriate personnel, including but not limited to the fund's Chief Compliance Officer (CCO), FMR's internal auditor, the independent accountants, the fund's Treasurer and portfolio management personnel, make periodic reports to the Board's committees, as appropriate, including an annual review of Fidelity's risk management program for the Fidelity® funds. The responsibilities of each standing committee, including their oversight responsibilities, are described further under "Standing Committees of the Trustees."
Interested Trustees*:
Correspondence intended for a Trustee who is an interested person may be sent to Fidelity Investments, 245 Summer Street, Boston, Massachusetts 02210.
Name, Year of Birth; Principal Occupations and Other Relevant Experience+
Jonathan Chiel (1957)
Year of Election or Appointment: 2016
Trustee
Mr. Chiel also serves as Trustee of other Fidelity® funds. Mr. Chiel is Executive Vice President and General Counsel for FMR LLC (diversified financial services company, 2012-present). Previously, Mr. Chiel served as general counsel (2004-2012) and senior vice president and deputy general counsel (2000-2004) for John Hancock Financial Services; a partner with Choate, Hall & Stewart (1996-2000) (law firm); and an Assistant United States Attorney for the United States Attorney’s Office of the District of Massachusetts (1986-95), including Chief of the Criminal Division (1993-1995). Mr. Chiel is a director on the boards of the Boston Bar Foundation and the Maimonides School.
James C. Curvey (1935)
Year of Election or Appointment: 2007
Trustee
Chairman of the Board of Trustees
Mr. Curvey also serves as Trustee of other Fidelity® funds. Mr. Curvey is Vice Chairman (2007-present) and Director of FMR LLC (diversified financial services company). In addition, Mr. Curvey is an Overseer Emeritus for the Boston Symphony Orchestra, a Director of Artis-Naples, and a Trustee of Brewster Academy in Wolfeboro, New Hampshire. Previously, Mr. Curvey served as a Director of Fidelity Research & Analysis Co. (investment adviser firm, 2009-2018), Director of Fidelity Investments Money Management, Inc. (investment adviser firm, 2009-2014) and a Director of FMR and FMR Co., Inc. (investment adviser firms, 2007-2014).
* Determined to be an “Interested Trustee” by virtue of, among other things, his or her affiliation with the trust or various entities under common control with FMR.
+ The information includes the Trustee's principal occupation during the last five years and other information relating to the experience, attributes, and skills relevant to the Trustee's qualifications to serve as a Trustee, which led to the conclusion that the Trustee should serve as a Trustee for the fund.
Independent Trustees:
Correspondence intended for an Independent Trustee may be sent to Fidelity Investments, P.O. Box 55235, Boston, Massachusetts 02205-5235.
Name, Year of Birth; Principal Occupations and Other Relevant Experience+
Dennis J. Dirks (1948)
Year of Election or Appointment: 2005
Trustee
Mr. Dirks also serves as Trustee of other Fidelity® funds. Prior to his retirement in May 2003, Mr. Dirks was Chief Operating Officer and a member of the Board of The Depository Trust & Clearing Corporation (DTCC). He also served as President, Chief Operating Officer, and Board member of The Depository Trust Company (DTC) and President and Board member of the National Securities Clearing Corporation (NSCC). In addition, Mr. Dirks served as Chief Executive Officer and Board member of the Government Securities Clearing Corporation, Chief Executive Officer and Board member of the Mortgage-Backed Securities Clearing Corporation, as a Trustee and a member of the Finance Committee of Manhattan College (2005-2008), as a Trustee and a member of the Finance Committee of AHRC of Nassau County (2006-2008), as a member of the Independent Directors Council (IDC) Governing Council (2010-2015), and as a member of the Board of Directors for The Brookville Center for Children’s Services, Inc. (2009-2017). Mr. Dirks is a member of the Finance Committee (2016-present) and Board of Directors (2017-present) and is Treasurer (2018-present) of the Asolo Repertory Theatre.
Donald F. Donahue (1950)
Year of Election or Appointment: 2018
Trustee
Mr. Donahue also serves as a Trustee of other Fidelity® funds. Mr. Donahue is President and Chief Executive Officer of Miranda Partners, LLC (risk consulting for the financial services industry, 2012-present). Previously, Mr. Donahue served as a Member of the Advisory Board of certain Fidelity® funds (2015-2018) and Chief Executive Officer (2006-2012), Chief Operating Officer (2003-2006), and Managing Director, Customer Marketing and Development (1999-2003) of The Depository Trust & Clearing Corporation (financial markets infrastructure). Mr. Donahue serves as a Member (2007-present) and Co-Chairman (2016-present) of the Board of Directors of United Way of New York, Member of the Board of Directors of NYC Leadership Academy (2012-present) and Member of the Board of Advisors of Ripple Labs, Inc. (financial services, 2015-present). He also served as Chairman (2010-2012) and Member of the Board of Directors (2012-2013) of Omgeo, LLC (financial services), Treasurer of United Way of New York (2012-2016), and Member of the Board of Directors of XBRL US (financial services non-profit, 2009-2012) and the International Securities Services Association (2009-2012).
Alan J. Lacy (1953)
Year of Election or Appointment: 2008
Trustee
Mr. Lacy also serves as Trustee of other Fidelity® funds. Mr. Lacy serves as a Director of Bristol-Myers Squibb Company (global pharmaceuticals, 2008-present). He is a Trustee of the California Chapter of The Nature Conservancy (2015-present) and a Director of the Center for Advanced Study in the Behavioral Sciences at Stanford University (2015-present). In addition, Mr. Lacy served as Senior Adviser (2007-2014) of Oak Hill Capital Partners, L.P. (private equity) and also served as Chief Executive Officer (2005) and Vice Chairman (2005-2006) of Sears Holdings Corporation (retail) and Chief Executive Officer and Chairman of the Board of Sears, Roebuck and Co. (retail, 2000-2005). Previously, Mr. Lacy served as Chairman (2014-2017) and a member (2010-2017) of the Board of Directors of Dave & Buster’s Entertainment, Inc. (restaurant and entertainment complexes), as Chairman (2008-2011) and a member (2006-2015) of the Board of Trustees of the National Parks Conservation Association, and as a member of the Board of Directors for The Hillman Companies, Inc. (hardware wholesalers, 2010-2014), Earth Fare, Inc. (retail grocery, 2010-2014), and The Western Union Company (global money transfer, 2006-2011).
Ned C. Lautenbach (1944)
Year of Election or Appointment: 2000
Trustee
Chairman of the Independent Trustees
Mr. Lautenbach also serves as Trustee of other Fidelity® funds. Mr. Lautenbach currently serves as Chair (2018-present) and Member (2013-present) of the Board of Governors, State University System of Florida and is a member of the Council on Foreign Relations (1994-present). He is also a member and has most recently served as Chairman of the Board of Directors of Artis-Naples (2012-present). Previously, Mr. Lautenbach served as a member and then Lead Director of the Board of Directors of Eaton Corporation (diversified industrial, 1997-2016). He was also a Partner and Advisory Partner at Clayton, Dubilier & Rice, LLC (private equity investment, 1998-2010), as well as a Director of Sony Corporation (2006-2007). In addition, Mr. Lautenbach also had a 30-year career with IBM (technology company) during which time he served as Senior Vice President and a member of the Corporate Executive Committee (1968-1998).
Joseph Mauriello (1944)
Year of Election or Appointment: 2008
Trustee
Mr. Mauriello also serves as Trustee of other Fidelity® funds. Prior to his retirement in January 2006, Mr. Mauriello served in numerous senior management positions including Deputy Chairman and Chief Operating Officer (2004-2005), and Vice Chairman of Financial Services (2002-2004) of KPMG LLP US (professional services, 1965-2005). Mr. Mauriello currently serves as a member of the Independent Directors Council (IDC) Governing Council (2015-present). Previously, Mr. Mauriello served as a member of the Board of Directors of XL Group plc. (global insurance and re-insurance, 2006-2018).
Cornelia M. Small (1944)
Year of Election or Appointment: 2005
Trustee
Ms. Small also serves as Trustee of other Fidelity® funds. Ms. Small is a member of the Board of Directors (2009-present) and Chair of the Investment Committee (2010-present) of the Teagle Foundation. Ms. Small also serves on the Investment Committee of the Berkshire Taconic Community Foundation (2008-present). Previously, Ms. Small served as Chairperson (2002-2008) and a member of the Investment Committee and Chairperson (2008-2012) and a member of the Board of Trustees of Smith College. In addition, Ms. Small served as Chief Investment Officer, Director of Global Equity Investments, and a member of the Board of Directors of Scudder, Stevens & Clark and Scudder Kemper Investments.
Garnett A. Smith (1947)
Year of Election or Appointment: 2018
Trustee
Mr. Smith also serves as Trustee of other Fidelity® funds. Prior to Mr. Smith's retirement, he served as Chairman and Chief Executive Officer of Inbrand Corp. (manufacturer of personal absorbent products, 1990-1997). He also served as President (1986-1990) of Inbrand Corp. Prior to his employment with Inbrand Corp., he was employed by a retail fabric chain and North Carolina National Bank. In addition, Mr. Smith served as a Member of the Advisory Board of certain Fidelity® funds (2012-2013) and as a board member of the Jackson Hole Land Trust (2009-2012).
David M. Thomas (1949)
Year of Election or Appointment: 2008
Trustee
Mr. Thomas also serves as Trustee of other Fidelity® funds. Mr. Thomas serves as Non-Executive Chairman of the Board of Directors of Fortune Brands Home and Security (home and security products, 2011-present) and as a member of the Board of Directors (2004-present) and Presiding Director (2013-present) of Interpublic Group of Companies, Inc. (marketing communication). Previously, Mr. Thomas served as Executive Chairman (2005-2006) and Chairman and Chief Executive Officer (2000-2005) of IMS Health, Inc. (pharmaceutical and healthcare information solutions), a Director of Fortune Brands, Inc. (consumer products, 2000-2011), and a member of the Board of Trustees of the University of Florida (2013-2018).
+ The information includes the Trustee's principal occupation during the last five years and other information relating to the experience, attributes, and skills relevant to the Trustee's qualifications to serve as a Trustee, which led to the conclusion that the Trustee should serve as a Trustee for the fund.
Advisory Board Members and Officers:
Correspondence intended for a Member of the Advisory Board (if any) may be sent to Fidelity Investments, P.O. Box 55235, Boston, Massachusetts 02205-5235. Correspondence intended for an officer or Peter S. Lynch may be sent to Fidelity Investments, 245 Summer Street, Boston, Massachusetts 02210. Officers appear below in alphabetical order.
Name, Year of Birth; Principal Occupation
Vicki L. Fuller (1957)
Year of Election or Appointment: 2018
Member of the Advisory Board
Ms. Fuller also serves as Member of the Advisory Board of other Fidelity® funds. Ms. Fuller serves as a member of the Board of Directors, Audit Committee, and Nominating and Governance Committee of The Williams Companies, Inc. (natural gas infrastructure, 2018-present). Previously, Ms. Fuller served as the Chief Investment Officer of the New York State Common Retirement Fund (2012-2018) and held a variety of positions at AllianceBernstein L.P. (global asset management, 1985-2012), including Managing Director (2006-2012) and Senior Vice President and Senior Portfolio Manager (2001-2006).
Peter S. Lynch (1944)
Year of Election or Appointment: 2003
Member of the Advisory Board
Mr. Lynch also serves as Member of the Advisory Board of other Fidelity® funds. Mr. Lynch is Vice Chairman and a Director of FMR (investment adviser firm) and FMR Co., Inc. (investment adviser firm). In addition, Mr. Lynch serves as a Trustee of Boston College and as the Chairman of the Inner-City Scholarship Fund. Previously, Mr. Lynch served on the Special Olympics International Board of Directors (1997-2006).
Michael E. Wiley (1950)
Year of Election or Appointment: 2018
Member of the Advisory Board
Mr. Wiley also serves as Trustee or Member of the Advisory Board of other Fidelity® funds. Mr. Wiley serves as a Director of High Point Resources (exploration and production, 2005-present). Previously, Mr. Wiley served as a Director of Andeavor Corporation (independent oil refiner and marketer, 2005-2018), a Director of Andeavor Logistics LP (natural resources logistics, 2015-2018), a Director of Post Oak Bank (privately-held bank, 2004-2018), a Director of Asia Pacific Exploration Consolidated (international oil and gas exploration and production, 2008-2013), a member of the Board of Trustees of the University of Tulsa (2000-2006; 2007-2010), a Senior Energy Advisor of Katzenbach Partners, LLC (consulting, 2006-2007), an Advisory Director of Riverstone Holdings (private investment), a Director of Spinnaker Exploration Company (exploration and production, 2001-2005) and Chairman, President, and CEO of Baker Hughes, Inc. (oilfield services, 2000-2004).
Elizabeth Paige Baumann (1968)
Year of Election or Appointment: 2017
Anti-Money Laundering (AML) Officer
Ms. Baumann also serves as AML Officer of other funds. She is Chief AML Officer (2012-present) and Senior Vice President (2014-present) of FMR LLC (diversified financial services company) and is an employee of Fidelity Investments. Previously, Ms. Baumann served as AML Officer of the funds (2012-2016), and Vice President (2007-2014) and Deputy Anti-Money Laundering Officer (2007-2012) of FMR LLC.
Craig S. Brown (1977)
Year of Election or Appointment: 2019
Assistant Treasurer
Mr. Brown also serves as Assistant Treasurer of other funds. Mr. Brown is an employee of Fidelity Investments (2013-present).
John J. Burke III (1964)
Year of Election or Appointment: 2018
Chief Financial Officer
Mr. Burke also serves as Chief Financial Officer of other funds. Mr. Burke serves as Head of Investment Operations for Fidelity Fund and Investment Operations (2018-present) and is an employee of Fidelity Investments (1998-present). Previously Mr. Burke served as head of Asset Management Investment Operations (2012-2018).
William C. Coffey (1969)
Year of Election or Appointment: 2019
Assistant Secretary
Mr. Coffey also serves as Assistant Secretary of other funds. He is Senior Vice President and Deputy General Counsel of FMR LLC (diversified financial services company, 2010-present), and is an employee of Fidelity Investments. Previously, Mr. Coffey served as Secretary and CLO of certain funds (2018-2019); CLO, Secretary, and Senior Vice President of Fidelity Management & Research Company and FMR Co., Inc. (investment adviser firms, 2018-2019); Secretary of Fidelity SelectCo, LLC and Fidelity Investments Money Management, Inc. (investment adviser firms, 2018-2019); CLO of Fidelity Management & Research (Hong Kong) Limited, FMR Investment Management (UK) Limited, and Fidelity Management & Research (Japan) Limited (investment adviser firms, 2018-2019); and Assistant Secretary of certain funds (2009-2018).
Timothy M. Cohen (1969)
Year of Election or Appointment: 2018
Vice President
Mr. Cohen also serves as Vice President of other funds. Mr. Cohen serves as Executive Vice President of Fidelity SelectCo, LLC (2019-present), Co-Head of Equity (2018-present), a Director of Fidelity Management & Research (Japan) Limited (investment adviser firm, 2016-present), and is an employee of Fidelity Investments. Previously, Mr. Cohen served as Head of Global Equity Research (2016-2018), Chief Investment Officer - Equity and a Director of Fidelity Management & Research (U.K.) Inc. (investment adviser firm, 2013-2015) and as a Director of Fidelity Management & Research (Hong Kong) Limited (investment adviser firm, 2017).
Jonathan Davis (1968)
Year of Election or Appointment: 2010
Assistant Treasurer
Mr. Davis also serves as Assistant Treasurer of other funds. Mr. Davis serves as Assistant Treasurer of FMR Capital, Inc. (2017-present) and is an employee of Fidelity Investments. Previously, Mr. Davis served as Vice President and Associate General Counsel of FMR LLC (diversified financial services company, 2003-2010).
Adrien E. Deberghes (1967)
Year of Election or Appointment: 2016
Assistant Treasurer
Mr. Deberghes also serves as an officer of other funds. He serves as Assistant Treasurer of FMR Capital, Inc. (2017-present), Executive Vice President of Fidelity Investments Money Management, Inc. (FIMM) (investment adviser firm, 2016-present), and is an employee of Fidelity Investments (2008-present). Previously, Mr. Deberghes served as President and Treasurer of certain Fidelity® funds (2013-2018). Prior to joining Fidelity Investments, Mr. Deberghes was Senior Vice President of Mutual Fund Administration at State Street Corporation (2007-2008), Senior Director of Mutual Fund Administration at Investors Bank & Trust (2005-2007), and Director of Finance for Dunkin' Brands (2000-2005). Previously, Mr. Deberghes served in other fund officer roles.
Laura M. Del Prato (1964)
Year of Election or Appointment: 2018
Assistant Treasurer
Ms. Del Prato also serves as an officer of other funds. Ms. Del Prato is an employee of Fidelity Investments (2017-present). Prior to joining Fidelity Investments, Ms. Del Prato served as a Managing Director and Treasurer of the JPMorgan Mutual Funds (2014-2017). Prior to JPMorgan, Ms. Del Prato served as a partner at Cohen Fund Audit Services (accounting firm, 2012-2013) and KPMG LLP (accounting firm, 2004-2012).
Colm A. Hogan (1973)
Year of Election or Appointment: 2016
Deputy Treasurer
Mr. Hogan also serves as an officer of other funds. Mr. Hogan serves as Assistant Treasurer of FMR Capital, Inc. (2017-present) and is an employee of Fidelity Investments (2005-present). Previously, Mr. Hogan served as Assistant Treasurer of certain Fidelity® funds (2016-2018).
Pamela R. Holding (1964)
Year of Election or Appointment: 2018
Vice President
Ms. Holding also serves as Vice President of other funds. Ms. Holding serves as Executive Vice President of Fidelity SelectCo, LLC (2019-present), Co-Head of Equity (2018-present) and is an employee of Fidelity Investments (2013-present). Previously, Ms. Holding served as Chief Investment Officer of Fidelity Institutional Asset Management (2013-2018).
Cynthia Lo Bessette (1969)
Year of Election or Appointment: 2019
Secretary and Chief Legal Officer (CLO)
Ms. Lo Bessette also serves as Secretary and CLO of other funds. Ms. Lo Bessette serves as CLO, Secretary, and Senior Vice President of Fidelity Management & Research Company and FMR Co., Inc. (investment adviser firms, 2019-present); Secretary of Fidelity SelectCo, LLC and Fidelity Investments Money Management, Inc. (investment adviser firms, 2019-present); and CLO of Fidelity Management & Research (Hong Kong) Limited, FMR Investment Management (UK) Limited, and Fidelity Management & Research (Japan) Limited (investment adviser firms, 2019-present). She is a Senior Vice President and Deputy General Counsel of FMR LLC (diversified financial services company, 2019-present), and is an employee of Fidelity Investments. Previously, Ms. Lo Bessette served as Executive Vice President, General Counsel (2016-2019) and Senior Vice President, Deputy General Counsel (2015-2016) of OppenheimerFunds (investment management company) and Deputy Chief Legal Officer (2013-2015) of Jennison Associates LLC (investment adviser firm).
Chris Maher (1972)
Year of Election or Appointment: 2013
Assistant Treasurer
Mr. Maher serves as Assistant Treasurer of other funds. Mr. Maher is Vice President of Valuation Oversight, serves as Assistant Treasurer of FMR Capital, Inc. (2017-present), and is an employee of Fidelity Investments. Previously, Mr. Maher served as Vice President of Asset Management Compliance (2013), Vice President of the Program Management Group of FMR (investment adviser firm, 2010-2013), and Vice President of Valuation Oversight (2008-2010).
Kenneth B. Robins (1969)
Year of Election or Appointment: 2016
Chief Compliance Officer
Mr. Robins also serves as an officer of other funds. Mr. Robins serves as Compliance Officer of Fidelity Management & Research Company and FMR Co., Inc. (investment adviser firms, 2016-present) and is an employee of Fidelity Investments (2004-present). Previously, Mr. Robins served as Executive Vice President of Fidelity Investments Money Management, Inc. (investment adviser firm, 2013-2016) and served in other fund officer roles.
Stacie M. Smith (1974)
Year of Election or Appointment: 2016
President and Treasurer
Ms. Smith also serves as an officer of other funds. Ms. Smith serves as Assistant Treasurer of FMR Capital, Inc. (2017-present), is an employee of Fidelity Investments (2009-present), and has served in other fund officer roles. Prior to joining Fidelity Investments, Ms. Smith served as Senior Audit Manager of Ernst & Young LLP (accounting firm, 1996-2009). Previously, Ms. Smith served as Assistant Treasurer (2013-2018) and Deputy Treasurer (2013-2016) of certain Fidelity® funds.
Marc L. Spector (1972)
Year of Election or Appointment: 2016
Assistant Treasurer
Mr. Spector also serves as an officer of other funds. Mr. Spector serves as Assistant Treasurer of FMR Capital, Inc. (2017-present) and is an employee of Fidelity Investments (2016-present). Prior to joining Fidelity Investments, Mr. Spector served as Director at the Siegfried Group (accounting firm, 2013-2016), and prior to Siegfried Group as audit senior manager at Deloitte & Touche (accounting firm, 2005-2013).
Jim Wegmann (1979)
Year of Election or Appointment: 2019
Assistant Treasurer
Mr. Wegmann also serves as Assistant Treasurer of other funds. Mr. Wegmann is an employee of Fidelity Investments (2011-present).
Shareholder Expense Example
As a shareholder of the Fund, you incur two types of costs: (1) transaction costs, including sales charges (loads) on purchase payments or redemption proceeds, and (2) ongoing costs, including management fees, distribution and/or service (12b-1) fees and other Fund expenses. This Example is intended to help you understand your ongoing costs (in dollars) of investing in the Fund and to compare these costs with the ongoing costs of investing in other mutual funds.
The Example is based on an investment of $1,000 invested at the beginning of the period and held for the entire period (May 1, 2019 to October 31, 2019).
Actual Expenses
The first line of the accompanying table for each class of the Fund provides information about actual account values and actual expenses. You may use the information in this line, together with the amount you invested, to estimate the expenses that you paid over the period. Simply divide your account value by $1,000.00 (for example, an $8,600 account value divided by $1,000.00 = 8.6), then multiply the result by the number in the first line for a class of the Fund under the heading entitled "Expenses Paid During Period" to estimate the expenses you paid on your account during this period. In addition, the Fund, as a shareholder in the underlying Fidelity Central Funds, will indirectly bear its pro-rata share of the fees and expenses incurred by the underlying Fidelity Central Funds. These fees and expenses are not included in the Fund's annualized expense ratio used to calculate the expense estimate in the table below.
Hypothetical Example for Comparison Purposes
The second line of the accompanying table for each class of the Fund provides information about hypothetical account values and hypothetical expenses based on a Class' actual expense ratio and an assumed rate of return of 5% per year before expenses, which is not the Class' actual return. The hypothetical account values and expenses may not be used to estimate the actual ending account balance or expenses you paid for the period. You may use this information to compare the ongoing costs of investing in the Fund and other funds. To do so, compare this 5% hypothetical example with the 5% hypothetical examples that appear in the shareholder reports of the other funds. In addition, the Fund, as a shareholder in the underlying Fidelity Central Funds, will indirectly bear its pro-rata share of the fees and expenses incurred by the underlying Fidelity Central Funds. These fees and expenses are not included in the Fund's annualized expense ratio used to calculate the expense estimate in the table below.
Please note that the expenses shown in the table are meant to highlight your ongoing costs only and do not reflect any transaction costs. Therefore, the second line of the table is useful in comparing ongoing costs only, and will not help you determine the relative total costs of owning different funds. In addition, if these transactional costs were included, your costs would have been higher.
| | Annualized Expense Ratio-A | Beginning
Account Value
May 1, 2019 | Ending
Account Value
October 31, 2019 | Expenses Paid
During Period-B
May 1, 2019
to October 31, 2019 |
| Class A | 1.17% | | | |
| Actual | | $1,000.00 | $1,039.60 | $6.01 |
| Hypothetical-C | | $1,000.00 | $1,019.31 | $5.96 |
| Class M | 1.42% | | | |
| Actual | | $1,000.00 | $1,038.10 | $7.29 |
| Hypothetical-C | | $1,000.00 | $1,018.05 | $7.22 |
| Class C | 1.96% | | | |
| Actual | | $1,000.00 | $1,035.50 | $10.06 |
| Hypothetical-C | | $1,000.00 | $1,015.32 | $9.96 |
| International Discovery | .82% | | | |
| Actual | | $1,000.00 | $1,041.50 | $4.22 |
| Hypothetical-C | | $1,000.00 | $1,021.07 | $4.18 |
| Class K | .71% | | | |
| Actual | | $1,000.00 | $1,041.90 | $3.65 |
| Hypothetical-C | | $1,000.00 | $1,021.63 | $3.62 |
| Class I | .84% | | | |
| Actual | | $1,000.00 | $1,041.40 | $4.32 |
| Hypothetical-C | | $1,000.00 | $1,020.97 | $4.28 |
| Class Z | .72% | | | |
| Actual | | $1,000.00 | $1,041.90 | $3.71 |
| Hypothetical-C | | $1,000.00 | $1,021.58 | $3.67 |
A Annualized expense ratio reflects expenses net of applicable fee waivers.
B Expenses are equal to each Class' annualized expense ratio, multiplied by the average account value over the period, multiplied by 184/365 (to reflect the one-half year period).
C 5% return per year before expenses
Distributions (Unaudited)
The Board of Trustees of Fidelity International Discovery fund voted to pay to shareholders of record at the opening of business on record date, the following distributions per share derived from capital gains realized from sales of portfolio securities, and dividends derived from net investment income:
| | Pay Date | Record Date | Dividends | Capital Gains |
| Fidelity International Discovery Fund | | | | |
| Class A | 12/09/19 | 12/06/19 | $0.6220000 | $0.2780000 |
| Class M | 12/09/19 | 12/06/19 | $0.5060000 | $0.2780000 |
| Class C | 12/09/19 | 12/06/19 | $0.1850000 | $0.2780000 |
| International Discovery | 12/09/19 | 12/06/19 | $0.7790000 | $0.2780000 |
| Class K | 12/09/19 | 12/06/19 | $0.8240000 | $0.2780000 |
| Class I | 12/09/19 | 12/06/19 | $0.7610000 | $0.2780000 |
| Class Z | 12/09/19 | 12/06/19 | $0.8230000 | $0.2780000 |
|
The fund hereby designates as a capital gain dividend with respect to the taxable year ended October 31, 2019, $59,213,579, or, if subsequently determined to be different, the net capital gain of such year.
Class A designates 1% and Class M designates 1% of the dividends distributed during the fiscal year as qualifying for the dividends–received deduction for corporate shareholders.
Class A, Class M, International Discovery, Class K, Class I and Class Z designate 100% of the dividends distributed during the fiscal year as amounts which may be taken into account as a dividend for purposes of the maximum rate under section 1(h)(11) of the Internal Revenue Code.
The amounts per share which represent income derived from sources within, and taxes paid to, foreign countries or possessions of the United States are as follows:
| | Pay Date | Income | Taxes |
| Fidelity International Discovery Fund | | | |
| Class A | 12/10/2018 | 0.3913 | 0.0643 |
| Class M | 12/10/2018 | 0.2863 | 0.0643 |
| Class C | 12/10/2018 | – | – |
| International Discovery Fund | 12/10/2018 | 0.5553 | 0.0643 |
| Class K | 12/10/2018 | 0.6053 | 0.0643 |
| Class I | 12/10/2018 | 0.5453 | 0.0643 |
| Class Z | 12/10/2018 | 0.6063 | 0.0643 |
|
The fund will notify shareholders in January 2020 of amounts for use in preparing 2019 income tax returns.
IGI-ANN-1219
1.807258.115
Fidelity® International Discovery K6 Fund
Annual Report
October 31, 2019
See the inside front cover for important information about access to your fund’s shareholder reports.
Beginning on January 1, 2021, as permitted by regulations adopted by the Securities and Exchange Commission, paper copies of a fund’s shareholder reports will no longer be sent by mail, unless you specifically request paper copies of the reports from the fund or from your financial intermediary, such as a financial advisor, broker-dealer or bank. Instead, the reports will be made available on a website, and you will be notified by mail each time a report is posted and provided with a website link to access the report.
If you already elected to receive shareholder reports electronically, you will not be affected by this change and you need not take any action. You may elect to receive shareholder reports and other communications from a fund electronically, by contacting your financial intermediary. For Fidelity customers, visit Fidelity's web site or call Fidelity using the contact information listed below.
You may elect to receive all future reports in paper free of charge. If you wish to continue receiving paper copies of your shareholder reports, you may contact your financial intermediary or, if you are a Fidelity customer, visit Fidelity’s website, or call Fidelity at the applicable toll-free number listed below. Your election to receive reports in paper will apply to all funds held with the fund complex/your financial intermediary.
| Account Type | Website | Phone Number |
| Brokerage, Mutual Fund, or Annuity Contracts: | fidelity.com/mailpreferences | 1-800-343-3548 |
| Employer Provided Retirement Accounts: | netbenefits.fidelity.com/preferences (choose 'no' under Required Disclosures to continue to print) | 1-800-343-0860 |
| Advisor Sold Accounts Serviced Through Your Financial Intermediary: | Contact Your Financial Intermediary | Your Financial Intermediary's phone number |
| Advisor Sold Accounts Serviced by Fidelity: | institutional.fidelity.com | 1-877-208-0098 |
Contents
To view a fund's proxy voting guidelines and proxy voting record for the 12-month period ended June 30, visit http://www.fidelity.com/proxyvotingresults or visit the Securities and Exchange Commission's (SEC) web site at http://www.sec.gov.
You may also call 1-800-835-5092 to request a free copy of the proxy voting guidelines.
Standard & Poor's, S&P and S&P 500 are registered service marks of The McGraw-Hill Companies, Inc. and have been licensed for use by Fidelity Distributors Corporation.
Other third-party marks appearing herein are the property of their respective owners.
All other marks appearing herein are registered or unregistered trademarks or service marks of FMR LLC or an affiliated company. © 2019 FMR LLC. All rights reserved.
This report and the financial statements contained herein are submitted for the general information of the shareholders of the Fund. This report is not authorized for distribution to prospective investors in the Fund unless preceded or accompanied by an effective prospectus.
A fund files its complete schedule of portfolio holdings with the SEC for the first and third quarters of each fiscal year on Form N-PORT. Forms N-PORT are available on the SEC’s web site at http://www.sec.gov. A fund's Forms N-PORT may be reviewed and copied at the SEC’s Public Reference Room in Washington, DC. Information regarding the operation of the SEC's Public Reference Room may be obtained by calling 1-800-SEC-0330.
For a complete list of a fund's portfolio holdings, view the most recent holdings listing, semiannual report, or annual report on Fidelity's web site at http://www.fidelity.com, http://www.institutional.fidelity.com, or http://www.401k.com, as applicable.
NOT FDIC INSURED •MAY LOSE VALUE •NO BANK GUARANTEE
Neither the Fund nor Fidelity Distributors Corporation is a bank.
Investment Summary (Unaudited)
Geographic Diversification (% of fund's net assets)
| As of October 31, 2019 |
| | Japan | 15.7% |
| | United Kingdom | 13.8% |
| | Germany | 10.7% |
| | Switzerland | 10.6% |
| | United States of America* | 7.5% |
| | France | 6.3% |
| | Netherlands | 4.5% |
| | Sweden | 3.3% |
| | Cayman Islands | 2.9% |
| | Other | 24.7% |
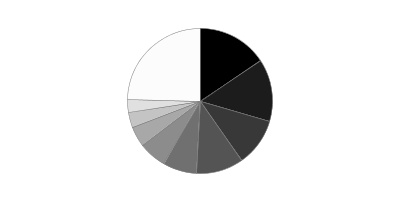
* Includes Short-Term investments and Net Other Assets (Liabilities).
Percentages are based on country or territory of incorporation and are adjusted for the effect of futures contracts, if applicable.
Asset Allocation as of October 31, 2019
| | % of fund's net assets |
| Stocks and Investment Companies | 96.9 |
| Short-Term Investments and Net Other Assets (Liabilities) | 3.1 |
Top Ten Stocks as of October 31, 2019
| | % of fund's net assets |
| iShares MSCI India ETF (United States of America, Investment Companies) | 3.5 |
| Nestle SA (Reg. S) (Switzerland, Food Products) | 3.0 |
| Roche Holding AG (participation certificate) (Switzerland, Pharmaceuticals) | 2.7 |
| BP PLC (United Kingdom, Oil, Gas & Consumable Fuels) | 2.3 |
| SAP SE (Germany, Software) | 2.2 |
| Hoya Corp. (Japan, Health Care Equipment & Supplies) | 2.0 |
| AstraZeneca PLC (United Kingdom) (United Kingdom, Pharmaceuticals) | 1.9 |
| HDFC Bank Ltd. sponsored ADR (India, Banks) | 1.8 |
| Unilever NV (Netherlands, Personal Products) | 1.8 |
| AIA Group Ltd. (Hong Kong, Insurance) | 1.7 |
| | 22.9 |
Top Market Sectors as of October 31, 2019
| | % of fund's net assets |
| Financials | 17.0 |
| Information Technology | 14.6 |
| Health Care | 14.3 |
| Industrials | 14.0 |
| Consumer Discretionary | 9.5 |
| Consumer Staples | 8.7 |
| Communication Services | 5.1 |
| Energy | 3.8 |
| Materials | 3.3 |
| Real Estate | 2.6 |
Schedule of Investments October 31, 2019
Showing Percentage of Net Assets
| Common Stocks - 92.9% | | | |
| | | Shares | Value |
| Australia - 1.9% | | | |
| Bapcor Ltd. | | 56,479 | $278,414 |
| CSL Ltd. | | 1,826 | 322,027 |
| Inghams Group Ltd. | | 70,070 | 150,014 |
| Magellan Financial Group Ltd. | | 5,144 | 170,616 |
| National Storage (REIT) unit | | 183,609 | 235,603 |
| Rio Tinto Ltd. | | 28 | 1,751 |
|
| TOTAL AUSTRALIA | | | 1,158,425 |
|
| Austria - 1.0% | | | |
| Erste Group Bank AG | | 9,503 | 335,661 |
| Wienerberger AG | | 9,453 | 255,561 |
|
| TOTAL AUSTRIA | | | 591,222 |
|
| Bailiwick of Jersey - 0.6% | | | |
| Experian PLC | | 11,494 | 361,499 |
| Belgium - 1.1% | | | |
| KBC Groep NV | | 9,688 | 679,420 |
| Brazil - 0.4% | | | |
| BM&F BOVESPA SA | | 22,416 | 270,412 |
| Canada - 2.7% | | | |
| Alimentation Couche-Tard, Inc. Class B (sub. vtg.) | | 12,285 | 368,429 |
| Cenovus Energy, Inc. (Canada) | | 21,900 | 186,560 |
| Constellation Software, Inc. | | 600 | 592,588 |
| Dollarama, Inc. | | 4,805 | 161,650 |
| Suncor Energy, Inc. | | 11,477 | 341,234 |
|
| TOTAL CANADA | | | 1,650,461 |
|
| Cayman Islands - 2.9% | | | |
| Alibaba Group Holding Ltd. sponsored ADR (a) | | 1,742 | 307,759 |
| Hansoh Pharmaceutical Group Co. Ltd. (b) | | 72,682 | 220,812 |
| Meituan Dianping Class B (a) | | 28,941 | 345,212 |
| PagSeguro Digital Ltd. (a) | | 9,259 | 343,324 |
| Tencent Holdings Ltd. | | 14,482 | 587,432 |
|
| TOTAL CAYMAN ISLANDS | | | 1,804,539 |
|
| China - 0.8% | | | |
| AVIC Jonhon OptronicTechnology Co. Ltd. | | 29,200 | 167,177 |
| Centre Testing International Group Co. Ltd. (A Shares) | | 99,896 | 198,544 |
| Kweichow Moutai Co. Ltd. (A Shares) | | 700 | 117,159 |
|
| TOTAL CHINA | | | 482,880 |
|
| Denmark - 1.4% | | | |
| DSV A/S | | 2,842 | 275,766 |
| Netcompany Group A/S (a)(b) | | 7,428 | 316,246 |
| ORSTED A/S (b) | | 3,172 | 278,239 |
|
| TOTAL DENMARK | | | 870,251 |
|
| France - 6.3% | | | |
| BNP Paribas SA | | 9,431 | 492,860 |
| Capgemini SA | | 4,695 | 528,608 |
| LVMH Moet Hennessy Louis Vuitton SE | | 1,923 | 821,229 |
| Peugeot Citroen SA | | 11,214 | 283,908 |
| Societe Generale Series A | | 11,947 | 339,760 |
| SR Teleperformance SA | | 2,404 | 544,816 |
| VINCI SA | | 7,581 | 850,582 |
|
| TOTAL FRANCE | | | 3,861,763 |
|
| Germany - 10.2% | | | |
| adidas AG | | 1,792 | 553,317 |
| Akasol AG (a)(b) | | 1,916 | 74,792 |
| Allianz SE | | 3,470 | 847,453 |
| Delivery Hero AG (a)(b) | | 1,516 | 71,064 |
| Deutsche Borse AG | | 1,014 | 157,028 |
| Deutsche Post AG | | 8,786 | 311,119 |
| Instone Real Estate Group BV (a)(b) | | 6,755 | 158,211 |
| Linde PLC | | 2,390 | 472,472 |
| Morphosys AG (a) | | 1,359 | 148,007 |
| MTU Aero Engines Holdings AG | | 1,617 | 431,744 |
| Nexus AG | | 4,029 | 142,895 |
| Rheinmetall AG | | 2,012 | 242,014 |
| SAP SE | | 10,194 | 1,350,720 |
| Scout24 AG (b) | | 5,720 | 353,744 |
| Siemens AG | | 4,046 | 466,909 |
| Vonovia SE | | 8,623 | 458,838 |
|
| TOTAL GERMANY | | | 6,240,327 |
|
| Hong Kong - 2.1% | | | |
| AIA Group Ltd. | | 103,400 | 1,029,680 |
| Techtronic Industries Co. Ltd. | | 32,994 | 257,849 |
|
| TOTAL HONG KONG | | | 1,287,529 |
|
| Hungary - 0.4% | | | |
| OTP Bank PLC | | 5,681 | 261,675 |
| India - 1.8% | | | |
| HDFC Bank Ltd. sponsored ADR | | 18,546 | 1,132,975 |
| Indonesia - 0.4% | | | |
| PT Bank Central Asia Tbk | | 58,800 | 131,614 |
| PT Bank Rakyat Indonesia Tbk | | 409,300 | 122,641 |
|
| TOTAL INDONESIA | | | 254,255 |
|
| Ireland - 2.0% | | | |
| Cairn Homes PLC | | 162,002 | 209,951 |
| CRH PLC | | 7,951 | 289,494 |
| Dalata Hotel Group PLC | | 22,954 | 135,683 |
| DCC PLC (United Kingdom) | | 1,527 | 143,128 |
| Kerry Group PLC Class A | | 3,941 | 476,461 |
|
| TOTAL IRELAND | | | 1,254,717 |
|
| Italy - 0.9% | | | |
| Moncler SpA | | 4,263 | 164,221 |
| Recordati SpA | | 9,469 | 397,824 |
|
| TOTAL ITALY | | | 562,045 |
|
| Japan - 15.7% | | | |
| Astellas Pharma, Inc. | | 19,161 | 328,854 |
| Daiichi Sankyo Kabushiki Kaisha | | 3,968 | 260,911 |
| Fanuc Corp. | | 3,252 | 641,455 |
| GMO Payment Gateway, Inc. | | 1,486 | 109,517 |
| Hoya Corp. | | 13,706 | 1,211,298 |
| Kao Corp. | | 3,434 | 276,089 |
| Keyence Corp. | | 1,503 | 950,342 |
| Lasertec Corp. | | 7,272 | 522,755 |
| Minebea Mitsumi, Inc. | | 19,847 | 376,925 |
| Misumi Group, Inc. | | 6,978 | 175,418 |
| Mitsubishi UFJ Financial Group, Inc. | | 43,260 | 224,272 |
| MonotaRO Co. Ltd. | | 9,220 | 278,542 |
| Nintendo Co. Ltd. | | 829 | 304,067 |
| Olympus Corp. | | 22,628 | 307,885 |
| Oracle Corp. Japan | | 3,685 | 323,897 |
| ORIX Corp. | | 39,279 | 617,265 |
| Persol Holdings Co., Ltd. | | 10,696 | 205,449 |
| Recruit Holdings Co. Ltd. | | 8,837 | 293,689 |
| Relo Group, Inc. | | 18,856 | 461,471 |
| Shiseido Co. Ltd. | | 2,391 | 197,133 |
| SMC Corp. | | 559 | 241,511 |
| SMS Co., Ltd. | | 6,395 | 156,785 |
| SoftBank Corp. | | 8,189 | 315,001 |
| Sony Corp. | | 5,470 | 332,954 |
| Terumo Corp. | | 8,663 | 282,732 |
| Zozo, Inc. | | 9,788 | 227,991 |
|
| TOTAL JAPAN | | | 9,624,208 |
|
| Korea (South) - 0.5% | | | |
| Samsung Electronics Co. Ltd. | | 7,364 | 317,140 |
| Malta - 0.1% | | | |
| Kambi Group PLC (a) | | 4,402 | 72,715 |
| Netherlands - 4.5% | | | |
| Adyen BV (a)(b) | | 133 | 93,362 |
| ASML Holding NV (Netherlands) | | 3,577 | 937,584 |
| Basic-Fit NV (a)(b) | | 5,987 | 182,958 |
| NXP Semiconductors NV | | 2,454 | 278,971 |
| Prosus NV (a) | | 1,863 | 128,471 |
| Unilever NV | | 19,103 | 1,128,130 |
|
| TOTAL NETHERLANDS | | | 2,749,476 |
|
| New Zealand - 1.6% | | | |
| EBOS Group Ltd. | | 22,638 | 357,554 |
| Fisher & Paykel Healthcare Corp. | | 21,111 | 258,931 |
| Ryman Healthcare Group Ltd. | | 43,458 | 359,178 |
|
| TOTAL NEW ZEALAND | | | 975,663 |
|
| Norway - 1.8% | | | |
| Adevinta ASA: | | | |
| rights 11/12/19 (a) | | 15,841 | 2,422 |
| Class B | | 22,014 | 251,352 |
| Equinor ASA | | 21,624 | 399,976 |
| Schibsted ASA (A Shares) | | 15,026 | 441,165 |
|
| TOTAL NORWAY | | | 1,094,915 |
|
| South Africa - 0.6% | | | |
| Clicks Group Ltd. | | 5,154 | 83,832 |
| Naspers Ltd. Class N | | 1,837 | 259,951 |
|
| TOTAL SOUTH AFRICA | | | 343,783 |
|
| Spain - 1.5% | | | |
| Cellnex Telecom SA (b) | | 7,977 | 343,948 |
| Cellnex Telecom SA (a) | | 2,250 | 97,014 |
| Masmovil Ibercom SA (a) | | 20,477 | 473,203 |
|
| TOTAL SPAIN | | | 914,165 |
|
| Sweden - 3.3% | | | |
| ASSA ABLOY AB (B Shares) | | 13,830 | 328,440 |
| EQT AB (a) | | 5,772 | 55,378 |
| Ericsson (B Shares) | | 69,190 | 604,637 |
| Indutrade AB | | 15,831 | 487,274 |
| Securitas AB (B Shares) | | 15,163 | 242,465 |
| Svenska Handelsbanken AB (A Shares) | | 33,558 | 336,782 |
|
| TOTAL SWEDEN | | | 2,054,976 |
|
| Switzerland - 10.6% | | | |
| Alcon, Inc. (Switzerland) (a) | | 5,918 | 349,501 |
| Kaba Holding AG (B Shares) (Reg.) | | 281 | 179,880 |
| Lonza Group AG | | 1,930 | 694,526 |
| Medacta Group SA (b) | | 712 | 58,173 |
| Nestle SA (Reg. S) | | 17,062 | 1,825,316 |
| Partners Group Holding AG | | 668 | 520,857 |
| Roche Holding AG (participation certificate) | | 5,544 | 1,668,500 |
| Schindler Holding AG (participation certificate) | | 1,073 | 262,349 |
| Sika AG | | 3,474 | 596,901 |
| Swiss Re Ltd. | | 3,609 | 377,912 |
|
| TOTAL SWITZERLAND | | | 6,533,915 |
|
| Taiwan - 1.1% | | | |
| Taiwan Semiconductor Manufacturing Co. Ltd. | | 68,125 | 666,353 |
| United Kingdom - 13.8% | | | |
| Anglo American PLC (United Kingdom) | | 14,690 | 377,073 |
| AstraZeneca PLC (United Kingdom) | | 12,200 | 1,189,711 |
| Aviva PLC | | 41,883 | 225,751 |
| Beazley PLC | | 43,008 | 326,742 |
| Big Yellow Group PLC | | 16,895 | 249,926 |
| BP PLC | | 225,134 | 1,427,657 |
| Compass Group PLC | | 15,348 | 408,627 |
| Cranswick PLC | | 3,359 | 135,058 |
| Dechra Pharmaceuticals PLC | | 8,966 | 305,451 |
| Diageo PLC | | 14,443 | 591,166 |
| HomeServe PLC | | 19,939 | 299,346 |
| John David Group PLC | | 28,744 | 286,103 |
| JTC PLC (b) | | 29,779 | 139,253 |
| Keywords Studios PLC | | 7,302 | 104,991 |
| Lloyds Banking Group PLC | | 507,432 | 373,271 |
| London Stock Exchange Group PLC | | 6,502 | 585,953 |
| M&G PLC (a) | | 36,306 | 100,548 |
| Network International Holdings PLC (b) | | 21,867 | 153,241 |
| Ocado Group PLC (a) | | 14,680 | 252,719 |
| Prudential PLC | | 22,919 | 400,322 |
| Rotork PLC | | 54,190 | 211,568 |
| Standard Life PLC | | 77,123 | 303,200 |
|
| TOTAL UNITED KINGDOM | | | 8,447,677 |
|
| United States of America - 0.9% | | | |
| MasterCard, Inc. Class A | | 1,045 | 289,266 |
| Visa, Inc. Class A | | 1,533 | 274,192 |
|
| TOTAL UNITED STATES OF AMERICA | | | 563,458 |
|
| TOTAL COMMON STOCKS | | | |
| (Cost $54,004,761) | | | 57,082,839 |
|
| Nonconvertible Preferred Stocks - 0.5% | | | |
| Germany - 0.5% | | | |
| Volkswagen AG | | | |
| (Cost $311,899) | | 1,619 | 308,228 |
|
| Investment Companies - 3.5% | | | |
| United States of America - 3.5% | | | |
| iShares MSCI India ETF | | | |
| (Cost $2,054,309) | | 61,254 | 2,122,450 |
|
| Money Market Funds - 3.4% | | | |
| Fidelity Cash Central Fund 1.83% (c) | | | |
| (Cost $2,072,769) | | 2,072,354 | 2,072,769 |
| TOTAL INVESTMENT IN SECURITIES - 100.3% | | | |
| (Cost $58,443,738) | | | 61,586,286 |
| NET OTHER ASSETS (LIABILITIES) - (0.3)% | | | (165,576) |
| NET ASSETS - 100% | | | $61,420,710 |
Security Type Abbreviations
ETF – Exchange-Traded Fund
Categorizations in the Schedule of Investments are based on country or territory of incorporation.
Legend
(a) Non-income producing
(b) Security exempt from registration under Rule 144A of the Securities Act of 1933. These securities may be resold in transactions exempt from registration, normally to qualified institutional buyers. At the end of the period, the value of these securities amounted to $2,444,043 or 4.0% of net assets.
(c) Affiliated fund that is generally available only to investment companies and other accounts managed by Fidelity Investments. The rate quoted is the annualized seven-day yield of the fund at period end. A complete unaudited listing of the fund's holdings as of its most recent quarter end is available upon request. In addition, each Fidelity Central Fund's financial statements, which are not covered by the Fund's Report of Independent Registered Public Accounting Firm, are available on the SEC's website or upon request.
Affiliated Central Funds
Information regarding fiscal year to date income earned by the Fund from investments in Fidelity Central Funds is as follows:
| Fund | Income earned |
| Fidelity Cash Central Fund | $3,842 |
| Total | $3,842 |
Amounts in the income column in the above table include any capital gain distributions from underlying funds, which are presented in the corresponding line-item in the Statement of Operations, if applicable.
Investment Valuation
The following is a summary of the inputs used, as of October 31, 2019, involving the Fund's assets and liabilities carried at fair value. The inputs or methodology used for valuing securities may not be an indication of the risk associated with investing in those securities. For more information on valuation inputs, and their aggregation into the levels used below, please refer to the Investment Valuation section in the accompanying Notes to Financial Statements.
| | Valuation Inputs at Reporting Date: |
| Description | Total | Level 1 | Level 2 | Level 3 |
| Investments in Securities: | | | | |
| Equities: | | | | |
| Communication Services | $3,169,348 | $1,962,848 | $1,206,500 | $-- |
| Consumer Discretionary | 5,793,125 | 3,118,747 | 2,674,378 | -- |
| Consumer Staples | 5,348,787 | 2,191,910 | 3,156,877 | -- |
| Energy | 2,355,427 | 927,770 | 1,427,657 | -- |
| Financials | 10,420,048 | 4,364,780 | 6,055,268 | -- |
| Health Care | 8,864,770 | 2,096,377 | 6,768,393 | -- |
| Industrials | 8,679,111 | 5,057,595 | 3,621,516 | -- |
| Information Technology | 8,924,911 | 3,291,929 | 5,632,982 | -- |
| Materials | 1,993,252 | 1,702,007 | 291,245 | -- |
| Real Estate | 1,564,049 | 866,975 | 697,074 | -- |
| Utilities | 278,239 | 278,239 | -- | -- |
| Investment Companies | 2,122,450 | 2,122,450 | -- | -- |
| Money Market Funds | 2,072,769 | 2,072,769 | -- | -- |
| Total Investments in Securities: | $61,586,286 | $30,054,396 | $31,531,890 | $-- |
See accompanying notes which are an integral part of the financial statements.
Financial Statements
Statement of Assets and Liabilities
| | | October 31, 2019 |
| Assets | | |
Investment in securities, at value — See accompanying schedule:
Unaffiliated issuers (cost $56,370,969) | $59,513,517 | |
| Fidelity Central Funds (cost $2,072,769) | 2,072,769 | |
| Total Investment in Securities (cost $58,443,738) | | $61,586,286 |
| Foreign currency held at value (cost $50,567) | | 50,567 |
| Receivable for investments sold | | 15,997 |
| Receivable for fund shares sold | | 54 |
| Dividends receivable | | 56,584 |
| Distributions receivable from Fidelity Central Funds | | 1,273 |
| Other receivables | | 23 |
| Total assets | | 61,710,784 |
| Liabilities | | |
| Payable for investments purchased | $261,137 | |
| Payable for fund shares redeemed | 645 | |
| Accrued management fee | 28,292 | |
| Total liabilities | | 290,074 |
| Net Assets | | $61,420,710 |
| Net Assets consist of: | | |
| Paid in capital | | $57,922,888 |
| Total accumulated earnings (loss) | | 3,497,822 |
| Net Assets, for 5,853,194 shares outstanding | | $61,420,710 |
| Net Asset Value, offering price and redemption price per share ($61,420,710 ÷ 5,853,194 shares) | | $10.49 |
See accompanying notes which are an integral part of the financial statements.
Statement of Operations
| | | For the period
June 13, 2019 (commencement of operations) to
October 31, 2019 |
| Investment Income | | |
| Dividends | | $112,137 |
| Non-Cash dividends | | 139,153 |
| Income from Fidelity Central Funds | | 3,842 |
| Total income | | 255,132 |
| Expenses | | |
| Management fee | $67,067 | |
| Independent trustees' fees and expenses | 30 | |
| Total expenses before reductions | 67,097 | |
| Expense reductions | (7) | |
| Total expenses after reductions | | 67,090 |
| Net investment income (loss) | | 188,042 |
| Realized and Unrealized Gain (Loss) | | |
| Net realized gain (loss) on: | | |
| Investment securities: | | |
| Unaffiliated issuers | 165,329 | |
| Foreign currency transactions | 1,313 | |
| Total net realized gain (loss) | | 166,642 |
| Change in net unrealized appreciation (depreciation) on: | | |
| Investment securities: | | |
| Unaffiliated issuers | 3,142,548 | |
| Assets and liabilities in foreign currencies | 591 | |
| Total change in net unrealized appreciation (depreciation) | | 3,143,139 |
| Net gain (loss) | | 3,309,781 |
| Net increase (decrease) in net assets resulting from operations | | $3,497,823 |
See accompanying notes which are an integral part of the financial statements.
Statement of Changes in Net Assets
| | For the period
June 13, 2019 (commencement of operations) to
October 31, 2019 |
| Increase (Decrease) in Net Assets | |
| Operations | |
| Net investment income (loss) | $188,042 |
| Net realized gain (loss) | 166,642 |
| Change in net unrealized appreciation (depreciation) | 3,143,139 |
| Net increase (decrease) in net assets resulting from operations | 3,497,823 |
| Share transactions | |
| Proceeds from sales of shares | 60,677,270 |
| Cost of shares redeemed | (2,754,383) |
| Net increase (decrease) in net assets resulting from share transactions | 57,922,887 |
| Total increase (decrease) in net assets | 61,420,710 |
| Net Assets | |
| Beginning of period | – |
| End of period | $61,420,710 |
| Other Information | |
| Shares | |
| Sold | 6,124,649 |
| Redeemed | (271,455) |
| Net increase (decrease) | 5,853,194 |
See accompanying notes which are an integral part of the financial statements.
Financial Highlights
Fidelity International Discovery K6 Fund
| | |
| Year ended October 31, | 2019 A |
| Selected Per–Share Data | |
| Net asset value, beginning of period | $10.00 |
| Income from Investment Operations | |
| Net investment income (loss)B | .06C |
| Net realized and unrealized gain (loss) | .43 |
| Total from investment operations | .49 |
| Net asset value, end of period | $10.49 |
| Total ReturnD,E | 4.90% |
| Ratios to Average Net AssetsF,G | |
| Expenses before reductions | .60%H |
| Expenses net of fee waivers, if any | .60%H |
| Expenses net of all reductions | .60%H |
| Net investment income (loss) | 1.67%C,H |
| Supplemental Data | |
| Net assets, end of period (000 omitted) | $61,421 |
| Portfolio turnover rateI | 59%J,K |
A For the period June 13, 2019 (commencement of operations) to October 31, 2019.
B Calculated based on average shares outstanding during the period.
C Net investment income per share reflects a large, non-recurring dividend which amounted to $.05 per share. This dividend is not annualized in the ratio of net investment income (loss) to average net assets. Excluding this non-recurring dividend the ratio of net investment income (loss) to average net assets would have been .43%.
D Total returns for periods of less than one year are not annualized.
E Total returns would have been lower if certain expenses had not been reduced during the applicable periods shown.
F Fees and expenses of any underlying Fidelity Central Funds are not included in the Fund's expense ratio. The Fund indirectly bears its proportionate share of the expenses of any underlying Fidelity Central Funds.
G Expense ratios reflect operating expenses of the Fund. Expenses before reductions do not reflect amounts reimbursed by the investment adviser or reductions from brokerage service arrangements or reductions from other expense offset arrangements and do not represent the amount paid by the Fund during periods when reimbursements or reductions occur. Expenses net of fee waivers reflect expenses after reimbursement by the investment adviser but prior to reductions from brokerage service arrangements or other expense offset arrangements. Expenses net of all reductions represent the net expenses paid by the Fund.
H Annualized
I Amount does not include the portfolio activity of any underlying Fidelity Central Funds.
J Portfolio turnover rate excludes securities received or delivered in-kind.
K Amount not annualized.
See accompanying notes which are an integral part of the financial statements.
Notes to Financial Statements
For the period ended October 31, 2019
1. Organization.
Fidelity International Discovery K6 Fund (the Fund) is a fund of Fidelity Investment Trust (the Trust) and is authorized to issue an unlimited number of shares. Share transactions on the Statement of Changes in Net Assets may contain exchanges between affiliated funds. The Trust is registered under the Investment Company Act of 1940, as amended (the 1940 Act), as an open-end management investment company organized as a Massachusetts business trust. Shares generally are available only to employer-sponsored retirement plans that are recordkept by Fidelity, or to certain employer-sponsored retirement plans that are not recordkept by Fidelity.
2. Investments in Fidelity Central Funds.
The Fund invests in Fidelity Central Funds, which are open-end investment companies generally available only to other investment companies and accounts managed by the investment adviser and its affiliates. The Fund's Schedule of Investments lists each of the Fidelity Central Funds held as of period end, as an investment of the Fund, but does not include the underlying holdings of each Fidelity Central Fund. As an Investing Fund, the Fund indirectly bears its proportionate share of the expenses of the underlying Fidelity Central Funds.
The Money Market Central Funds seek preservation of capital and current income and are managed by Fidelity Investments Money Management, Inc. (FIMM), an affiliate of the investment adviser. Annualized expenses of the Money Market Central Funds as of their most recent shareholder report date ranged from less than .005% to .01%.
A complete unaudited list of holdings for each Fidelity Central Fund is available upon request or at the Securities and Exchange Commission (the SEC) website at www.sec.gov. In addition, the financial statements of the Fidelity Central Funds, which are not covered by the Fund's Report of Independent Registered Public Accounting Firm, are available on the SEC website or upon request.
3. Significant Accounting Policies.
The Fund is an investment company and applies the accounting and reporting guidance of the Financial Accounting Standards Board (FASB) Accounting Standards Codification Topic 946 Financial Services – Investments Companies. The financial statements have been prepared in conformity with accounting principles generally accepted in the United States of America (GAAP), which require management to make certain estimates and assumptions at the date of the financial statements. Actual results could differ from those estimates. Subsequent events, if any, through the date that the financial statements were issued have been evaluated in the preparation of the financial statements. The following summarizes the significant accounting policies of the Fund:
Investment Valuation. Investments are valued as of 4:00 p.m. Eastern time on the last calendar day of the period. The Board of Trustees (the Board) has delegated the day to day responsibility for the valuation of the Fund's investments to the Fair Value Committee (the Committee) established by the Fund's investment adviser. In accordance with valuation policies and procedures approved by the Board, the Fund attempts to obtain prices from one or more third party pricing vendors or brokers to value its investments. When current market prices, quotations or currency exchange rates are not readily available or reliable, investments will be fair valued in good faith by the Committee, in accordance with procedures adopted by the Board. Factors used in determining fair value vary by investment type and may include market or investment specific events. The frequency with which these procedures are used cannot be predicted and they may be utilized to a significant extent. The Committee oversees the Fund's valuation policies and procedures and reports to the Board on the Committee's activities and fair value determinations. The Board monitors the appropriateness of the procedures used in valuing the Fund's investments and ratifies the fair value determinations of the Committee.
The Fund categorizes the inputs to valuation techniques used to value its investments into a disclosure hierarchy consisting of three levels as shown below:
- Level 1 – quoted prices in active markets for identical investments
- Level 2 – other significant observable inputs (including quoted prices for similar investments, interest rates, prepayment speeds, etc.)
- Level 3 – unobservable inputs (including the Fund's own assumptions based on the best information available)
Valuation techniques used to value the Fund's investments by major category are as follows:
Equity securities, including restricted securities, for which market quotations are readily available, are valued at the last reported sale price or official closing price as reported by a third party pricing vendor on the primary market or exchange on which they are traded and are categorized as Level 1 in the hierarchy. In the event there were no sales during the day or closing prices are not available, securities are valued at the last quoted bid price or may be valued using the last available price and are generally categorized as Level 2 in the hierarchy. For foreign equity securities, when market or security specific events arise, comparisons to the valuation of American Depositary Receipts (ADRs), futures contracts, Exchange-Traded Funds (ETFs) and certain indexes as well as quoted prices for similar securities may be used and would be categorized as Level 2 in the hierarchy. For equity securities, including restricted securities, where observable inputs are limited, assumptions about market activity and risk are used and these securities may be categorized as Level 3 in the hierarchy.
ETFs are valued at their last sale price or official closing price as reported by a third party pricing vendor on the primary market or exchange on which they are traded and are categorized as Level 1 in the hierarchy. In the event there were no sales during the day but the exchange reports a closing bid level, ETFs are valued at the closing bid and would be categorized as Level 1 in the hierarchy. In the event there was no closing bid, ETFs may be valued by another method that the Board believes reflects fair value in accordance with the Board's fair value pricing policies and may be categorized as Level 2 in the hierarchy.
Investments in open-end mutual funds, including the Fidelity Central Funds, are valued at their closing net asset value (NAV) each business day and are categorized as Level 1 in the hierarchy.
Changes in valuation techniques may result in transfers in or out of an assigned level within the disclosure hierarchy. The aggregate value of investments by input level as of October 31, 2019 is included at the end of the Fund's Schedule of Investments.
Foreign Currency. The Fund may use foreign currency contracts to facilitate transactions in foreign-denominated securities. Gains and losses from these transactions may arise from changes in the value of the foreign currency or if the counterparties do not perform under the contracts' terms.
Foreign-denominated assets, including investment securities, and liabilities are translated into U.S. dollars at the exchange rates at period end. Purchases and sales of investment securities, income and dividends received and expenses denominated in foreign currencies are translated into U.S. dollars at the exchange rate in effect on the transaction date.
The effects of exchange rate fluctuations on investments are included with the net realized and unrealized gain (loss) on investment securities. Other foreign currency transactions resulting in realized and unrealized gain (loss) are disclosed separately.
Investment Transactions and Income. For financial reporting purposes, the Fund's investment holdings and NAV include trades executed through the end of the last business day of the period. The NAV per share for processing shareholder transactions is calculated as of the close of business of the New York Stock Exchange (NYSE), normally 4:00 p.m. Eastern time and includes trades executed through the end of the prior business day. Gains and losses on securities sold are determined on the basis of identified cost. Dividend income is recorded on the ex-dividend date, except for certain dividends from foreign securities where the ex-dividend date may have passed, which are recorded as soon as the Fund is informed of the ex-dividend date. Non-cash dividends included in dividend income, if any, are recorded at the fair market value of the securities received. Income and capital gain distributions from Fidelity Central Funds, if any, are recorded on the ex-dividend date. Large, non-recurring dividends recognized by the Fund are presented separately on the Statement of Operations as "Non-cash Dividends" and the impact of these dividends is presented in the Financial Highlights. Investment income is recorded net of foreign taxes withheld where recovery of such taxes is uncertain.
Expenses. Expenses directly attributable to a fund are charged to that fund. Expenses attributable to more than one fund are allocated among the respective funds on the basis of relative net assets or other appropriate methods. Expense estimates are accrued in the period to which they relate and adjustments are made when actual amounts are known.
Income Tax Information and Distributions to Shareholders. Each year, the Fund intends to qualify as a regulated investment company under Subchapter M of the Internal Revenue Code, including distributing substantially all of its taxable income and realized gains. As a result, no provision for U.S. Federal income taxes is required. As of October 31, 2019, the Fund did not have any unrecognized tax benefits in the financial statements; nor is the Fund aware of any tax positions for which it is reasonably possible that the total amounts of unrecognized tax benefits will significantly change in the next twelve months. The Fund files a U.S. federal tax return, in addition to state and local tax returns as required. The Fund's federal income tax returns are subject to examination by the Internal Revenue Service (IRS) for a period of three fiscal years after they are filed. State and local tax returns may be subject to examination for an additional fiscal year depending on the jurisdiction. Foreign taxes are provided for based on the Fund's understanding of the tax rules and rates that exist in the foreign markets in which it invests.
Distributions are declared and recorded on the ex-dividend date. Income and capital gain distributions are determined in accordance with income tax regulations, which may differ from GAAP.
Capital accounts within the financial statements are adjusted for permanent book-tax differences. These adjustments have no impact on net assets or the results of operations. Capital accounts are not adjusted for temporary book-tax differences which will reverse in a subsequent period.
Book-tax differences are primarily due to foreign currency transactions, passive foreign investment companies (PFIC) and losses deferred due to wash sales.
As of period end, the cost and unrealized appreciation (depreciation) in securities, and derivatives if applicable, for federal income tax purposes were as follows:
| Gross unrealized appreciation | $3,841,799 |
| Gross unrealized depreciation | (796,784) |
| Net unrealized appreciation (depreciation) | $3,045,015 |
| Tax Cost | $58,541,271 |
The tax-based components of distributable earnings as of period end were as follows:
| Undistributed ordinary income | $452,799 |
| Net unrealized appreciation (depreciation) on securities and other investments | $3,045,023 |
Restricted Securities. The Fund may invest in securities that are subject to legal or contractual restrictions on resale. These securities generally may be resold in transactions exempt from registration or to the public if the securities are registered. Disposal of these securities may involve time-consuming negotiations and expense, and prompt sale at an acceptable price may be difficult. Information regarding restricted securities is included at the end of the Fund's Schedule of Investments.
4. Purchases and Sales of Investments.
Purchases and sales of securities, other than short-term securities and in-kind transactions, aggregated $15,197,295 and $12,934,573, respectively.
Unaffiliated Exchanges In-Kind. During the period, the Fund received investments and cash valued at $4,739,220 in exchange for 471,564 shares of the Fund. The amount of in-kind exchanges is included in share transactions in the accompanying Statement of Changes in Net Assets.
5. Fees and Other Transactions with Affiliates.
Management Fee. Fidelity Management & Research Company (the investment adviser) and its affiliates provide the Fund with investment management related services for which the Fund pays a monthly management fee that is based on an annual rate of .60% of average net assets. Under the management contract, the investment adviser or an affiliate pays all other expenses of the Fund, excluding fees and expenses of the independent Trustees, and certain miscellaneous expenses such as proxy and shareholder meeting expenses.
Brokerage Commissions. The Fund placed a portion of its portfolio transactions with brokerage firms which are affiliates of the investment adviser. Brokerage commissions are included in net realized gain (loss) and change in net unrealized appreciation (depreciation) in the Statement of Operations. The commissions paid to these affiliated firms were $12 for the period.
Interfund Trades. The Fund may purchase from or sell securities to other Fidelity Funds under procedures adopted by the Board. The procedures have been designed to ensure these interfund trades are executed in accordance with Rule 17a-7 of the 1940 Act. Interfund trades are included within the respective purchases and sales amounts shown in the Purchases and Sales of Investments note.
Affiliated Exchanges In-Kind. During the period, the Fund received investments and cash valued at $50,887,151 in exchange for 5,160,969 shares of the Fund. The amount of in-kind exchanges is included in share transactions in the accompanying Statement of Changes in Net Assets.
6. Expense Reductions.
Commissions paid to certain brokers with whom the investment adviser, or its affiliates, places trades on behalf of the Fund include an amount in addition to trade execution, which may be rebated back to the Fund to offset certain expenses. This amount totaled $7 for the period.
7. Other.
The Fund's organizational documents provide former and current trustees and officers with a limited indemnification against liabilities arising in connection with the performance of their duties to the Fund. In the normal course of business, the Fund may also enter into contracts that provide general indemnifications. The Fund's maximum exposure under these arrangements is unknown as this would be dependent on future claims that may be made against the Fund. The risk of material loss from such claims is considered remote.
Report of Independent Registered Public Accounting Firm
To the Trustees of Fidelity Investment Trust and Shareholders of Fidelity International Discovery K6 Fund:
Opinion on the Financial Statements and Financial Highlights
We have audited the accompanying statement of assets and liabilities of Fidelity International Discovery K6 Fund, including the schedule of investments, as of October 31, 2019, the related statement of operations, the statement of changes in net assets and the financial highlights for the period from June 13, 2019 (commencement of operations) to October 31, 2019 and the related notes. In our opinion, the financial statements and financial highlights present fairly, in all material respects, the financial position of the Fund as of October 31, 2019, and the results of its operations, the changes in its net assets and the financial highlights for the period from June 13, 2019 (commencement of operations) to October 31, 2019 in conformity with accounting principles generally accepted in the United States of America.
Basis for Opinion
These financial statements and financial highlights are the responsibility of the Fund's management. Our responsibility is to express an opinion on the Fund's financial statements and financial highlights based on our audit. We are a public accounting firm registered with the Public Company Accounting Oversight Board (United States) (PCAOB) and are required to be independent with respect to the Fund in accordance with the U.S. federal securities laws and the applicable rules and regulations of the Securities and Exchange Commission and the PCAOB.
We conducted our audit in accordance with the standards of the PCAOB. Those standards require that we plan and perform the audit to obtain reasonable assurance about whether the financial statements and financial highlights are free of material misstatement, whether due to error or fraud. The Fund is not required to have, nor were we engaged to perform, an audit of its internal control over financial reporting. As part of our audit we are required to obtain an understanding of internal control over financial reporting but not for the purpose of expressing an opinion on the effectiveness of the Fund’s internal control over financial reporting. Accordingly, we express no such opinion.
Our audit included performing procedures to assess the risks of material misstatement of the financial statements and financial highlights, whether due to error or fraud, and performing procedures that respond to those risks. Such procedures included examining, on a test basis, evidence regarding the amounts and disclosures in the financial statements and financial highlights. Our audit also included evaluating the accounting principles used and significant estimates made by management, as well as evaluating the overall presentation of the financial statements and financial highlights. Our procedures included confirmation of securities owned as of October 31, 2019, by correspondence with the custodians and brokers; when replies were not received from brokers, we performed other auditing procedures. We believe that our audit provides a reasonable basis for our opinion.
/s/ Deloitte & Touche LLP
Boston, Massachusetts
December 13, 2019
We have served as the auditor of one or more of the Fidelity investment companies since 1999.
Trustees and Officers
The Trustees, Members of the Advisory Board (if any), and officers of the trust and fund, as applicable, are listed below. The Board of Trustees governs the fund and is responsible for protecting the interests of shareholders. The Trustees are experienced executives who meet periodically throughout the year to oversee the fund's activities, review contractual arrangements with companies that provide services to the fund, oversee management of the risks associated with such activities and contractual arrangements, and review the fund's performance. Except for Jonathan Chiel, each of the Trustees oversees 298 funds. Mr. Chiel oversees 171 funds.
The Trustees hold office without limit in time except that (a) any Trustee may resign; (b) any Trustee may be removed by written instrument, signed by at least two-thirds of the number of Trustees prior to such removal; (c) any Trustee who requests to be retired or who has become incapacitated by illness or injury may be retired by written instrument signed by a majority of the other Trustees; and (d) any Trustee may be removed at any special meeting of shareholders by a two-thirds vote of the outstanding voting securities of the trust. Each Trustee who is not an interested person (as defined in the 1940 Act) of the trust and the fund is referred to herein as an Independent Trustee. Each Independent Trustee shall retire not later than the last day of the calendar year in which his or her 75th birthday occurs. The Independent Trustees may waive this mandatory retirement age policy with respect to individual Trustees. Officers and Advisory Board Members hold office without limit in time, except that any officer or Advisory Board Member may resign or may be removed by a vote of a majority of the Trustees at any regular meeting or any special meeting of the Trustees. Except as indicated, each individual has held the office shown or other offices in the same company for the past five years.
The fund’s Statement of Additional Information (SAI) includes more information about the Trustees. To request a free copy, call Fidelity at 1-800-835-5092.
Experience, Skills, Attributes, and Qualifications of the Trustees. The Governance and Nominating Committee has adopted a statement of policy that describes the experience, qualifications, attributes, and skills that are necessary and desirable for potential Independent Trustee candidates (Statement of Policy). The Board believes that each Trustee satisfied at the time he or she was initially elected or appointed a Trustee, and continues to satisfy, the standards contemplated by the Statement of Policy. The Governance and Nominating Committee also engages professional search firms to help identify potential Independent Trustee candidates who have the experience, qualifications, attributes, and skills consistent with the Statement of Policy. From time to time, additional criteria based on the composition and skills of the current Independent Trustees, as well as experience or skills that may be appropriate in light of future changes to board composition, business conditions, and regulatory or other developments, have also been considered by the professional search firms and the Governance and Nominating Committee. In addition, the Board takes into account the Trustees' commitment and participation in Board and committee meetings, as well as their leadership of standing and ad hoc committees throughout their tenure.
In determining that a particular Trustee was and continues to be qualified to serve as a Trustee, the Board has considered a variety of criteria, none of which, in isolation, was controlling. The Board believes that, collectively, the Trustees have balanced and diverse experience, qualifications, attributes, and skills, which allow the Board to operate effectively in governing the fund and protecting the interests of shareholders. Information about the specific experience, skills, attributes, and qualifications of each Trustee, which in each case led to the Board's conclusion that the Trustee should serve (or continue to serve) as a trustee of the fund, is provided below.
Board Structure and Oversight Function. James C. Curvey is an interested person and currently serves as Chairman. The Trustees have determined that an interested Chairman is appropriate and benefits shareholders because an interested Chairman has a personal and professional stake in the quality and continuity of services provided to the fund. Independent Trustees exercise their informed business judgment to appoint an individual of their choosing to serve as Chairman, regardless of whether the Trustee happens to be independent or a member of management. The Independent Trustees have determined that they can act independently and effectively without having an Independent Trustee serve as Chairman and that a key structural component for assuring that they are in a position to do so is for the Independent Trustees to constitute a substantial majority for the Board. The Independent Trustees also regularly meet in executive session. Ned C. Lautenbach serves as Chairman of the Independent Trustees and as such (i) acts as a liaison between the Independent Trustees and management with respect to matters important to the Independent Trustees and (ii) with management prepares agendas for Board meetings.
Fidelity® funds are overseen by different Boards of Trustees. The fund's Board oversees Fidelity's high income and certain equity funds, and other Boards oversee Fidelity's investment-grade bond, money market, asset allocation, and other equity funds. The asset allocation funds may invest in Fidelity® funds overseen by the fund's Board. The use of separate Boards, each with its own committee structure, allows the Trustees of each group of Fidelity® funds to focus on the unique issues of the funds they oversee, including common research, investment, and operational issues. On occasion, the separate Boards establish joint committees to address issues of overlapping consequences for the Fidelity® funds overseen by each Board.
The Trustees operate using a system of committees to facilitate the timely and efficient consideration of all matters of importance to the Trustees, the fund, and fund shareholders and to facilitate compliance with legal and regulatory requirements and oversight of the fund's activities and associated risks. The Board, acting through its committees, has charged FMR and its affiliates with (i) identifying events or circumstances the occurrence of which could have demonstrably adverse effects on the fund's business and/or reputation; (ii) implementing processes and controls to lessen the possibility that such events or circumstances occur or to mitigate the effects of such events or circumstances if they do occur; and (iii) creating and maintaining a system designed to evaluate continuously business and market conditions in order to facilitate the identification and implementation processes described in (i) and (ii) above. Because the day-to-day operations and activities of the fund are carried out by or through FMR, its affiliates, and other service providers, the fund's exposure to risks is mitigated but not eliminated by the processes overseen by the Trustees. While each of the Board's committees has responsibility for overseeing different aspects of the fund's activities, oversight is exercised primarily through the Operations, Audit, and Compliance Committees. Appropriate personnel, including but not limited to the fund's Chief Compliance Officer (CCO), FMR's internal auditor, the independent accountants, the fund's Treasurer and portfolio management personnel, make periodic reports to the Board's committees, as appropriate, including an annual review of Fidelity's risk management program for the Fidelity® funds. The responsibilities of each standing committee, including their oversight responsibilities, are described further under "Standing Committees of the Trustees."
Interested Trustees*:
Correspondence intended for a Trustee who is an interested person may be sent to Fidelity Investments, 245 Summer Street, Boston, Massachusetts 02210.
Name, Year of Birth; Principal Occupations and Other Relevant Experience+
Jonathan Chiel (1957)
Year of Election or Appointment: 2016
Trustee
Mr. Chiel also serves as Trustee of other Fidelity® funds. Mr. Chiel is Executive Vice President and General Counsel for FMR LLC (diversified financial services company, 2012-present). Previously, Mr. Chiel served as general counsel (2004-2012) and senior vice president and deputy general counsel (2000-2004) for John Hancock Financial Services; a partner with Choate, Hall & Stewart (1996-2000) (law firm); and an Assistant United States Attorney for the United States Attorney’s Office of the District of Massachusetts (1986-95), including Chief of the Criminal Division (1993-1995). Mr. Chiel is a director on the boards of the Boston Bar Foundation and the Maimonides School.
James C. Curvey (1935)
Year of Election or Appointment: 2007
Trustee
Chairman of the Board of Trustees
Mr. Curvey also serves as Trustee of other Fidelity® funds. Mr. Curvey is Vice Chairman (2007-present) and Director of FMR LLC (diversified financial services company). In addition, Mr. Curvey is an Overseer Emeritus for the Boston Symphony Orchestra, a Director of Artis-Naples, and a Trustee of Brewster Academy in Wolfeboro, New Hampshire. Previously, Mr. Curvey served as a Director of Fidelity Research & Analysis Co. (investment adviser firm, 2009-2018), Director of Fidelity Investments Money Management, Inc. (investment adviser firm, 2009-2014) and a Director of FMR and FMR Co., Inc. (investment adviser firms, 2007-2014).
* Determined to be an “Interested Trustee” by virtue of, among other things, his or her affiliation with the trust or various entities under common control with FMR.
+ The information includes the Trustee's principal occupation during the last five years and other information relating to the experience, attributes, and skills relevant to the Trustee's qualifications to serve as a Trustee, which led to the conclusion that the Trustee should serve as a Trustee for the fund.
Independent Trustees:
Correspondence intended for an Independent Trustee may be sent to Fidelity Investments, P.O. Box 55235, Boston, Massachusetts 02205-5235.
Name, Year of Birth; Principal Occupations and Other Relevant Experience+
Dennis J. Dirks (1948)
Year of Election or Appointment: 2005
Trustee
Mr. Dirks also serves as Trustee of other Fidelity® funds. Prior to his retirement in May 2003, Mr. Dirks was Chief Operating Officer and a member of the Board of The Depository Trust & Clearing Corporation (DTCC). He also served as President, Chief Operating Officer, and Board member of The Depository Trust Company (DTC) and President and Board member of the National Securities Clearing Corporation (NSCC). In addition, Mr. Dirks served as Chief Executive Officer and Board member of the Government Securities Clearing Corporation, Chief Executive Officer and Board member of the Mortgage-Backed Securities Clearing Corporation, as a Trustee and a member of the Finance Committee of Manhattan College (2005-2008), as a Trustee and a member of the Finance Committee of AHRC of Nassau County (2006-2008), as a member of the Independent Directors Council (IDC) Governing Council (2010-2015), and as a member of the Board of Directors for The Brookville Center for Children’s Services, Inc. (2009-2017). Mr. Dirks is a member of the Finance Committee (2016-present) and Board of Directors (2017-present) and is Treasurer (2018-present) of the Asolo Repertory Theatre.
Donald F. Donahue (1950)
Year of Election or Appointment: 2018
Trustee
Mr. Donahue also serves as a Trustee of other Fidelity® funds. Mr. Donahue is President and Chief Executive Officer of Miranda Partners, LLC (risk consulting for the financial services industry, 2012-present). Previously, Mr. Donahue served as a Member of the Advisory Board of certain Fidelity® funds (2015-2018) and Chief Executive Officer (2006-2012), Chief Operating Officer (2003-2006), and Managing Director, Customer Marketing and Development (1999-2003) of The Depository Trust & Clearing Corporation (financial markets infrastructure). Mr. Donahue serves as a Member (2007-present) and Co-Chairman (2016-present) of the Board of Directors of United Way of New York, Member of the Board of Directors of NYC Leadership Academy (2012-present) and Member of the Board of Advisors of Ripple Labs, Inc. (financial services, 2015-present). He also served as Chairman (2010-2012) and Member of the Board of Directors (2012-2013) of Omgeo, LLC (financial services), Treasurer of United Way of New York (2012-2016), and Member of the Board of Directors of XBRL US (financial services non-profit, 2009-2012) and the International Securities Services Association (2009-2012).
Alan J. Lacy (1953)
Year of Election or Appointment: 2008
Trustee
Mr. Lacy also serves as Trustee of other Fidelity® funds. Mr. Lacy serves as a Director of Bristol-Myers Squibb Company (global pharmaceuticals, 2008-present). He is a Trustee of the California Chapter of The Nature Conservancy (2015-present) and a Director of the Center for Advanced Study in the Behavioral Sciences at Stanford University (2015-present). In addition, Mr. Lacy served as Senior Adviser (2007-2014) of Oak Hill Capital Partners, L.P. (private equity) and also served as Chief Executive Officer (2005) and Vice Chairman (2005-2006) of Sears Holdings Corporation (retail) and Chief Executive Officer and Chairman of the Board of Sears, Roebuck and Co. (retail, 2000-2005). Previously, Mr. Lacy served as Chairman (2014-2017) and a member (2010-2017) of the Board of Directors of Dave & Buster’s Entertainment, Inc. (restaurant and entertainment complexes), as Chairman (2008-2011) and a member (2006-2015) of the Board of Trustees of the National Parks Conservation Association, and as a member of the Board of Directors for The Hillman Companies, Inc. (hardware wholesalers, 2010-2014), Earth Fare, Inc. (retail grocery, 2010-2014), and The Western Union Company (global money transfer, 2006-2011).
Ned C. Lautenbach (1944)
Year of Election or Appointment: 2000
Trustee
Chairman of the Independent Trustees
Mr. Lautenbach also serves as Trustee of other Fidelity® funds. Mr. Lautenbach currently serves as Chair (2018-present) and Member (2013-present) of the Board of Governors, State University System of Florida and is a member of the Council on Foreign Relations (1994-present). He is also a member and has most recently served as Chairman of the Board of Directors of Artis-Naples (2012-present). Previously, Mr. Lautenbach served as a member and then Lead Director of the Board of Directors of Eaton Corporation (diversified industrial, 1997-2016). He was also a Partner and Advisory Partner at Clayton, Dubilier & Rice, LLC (private equity investment, 1998-2010), as well as a Director of Sony Corporation (2006-2007). In addition, Mr. Lautenbach also had a 30-year career with IBM (technology company) during which time he served as Senior Vice President and a member of the Corporate Executive Committee (1968-1998).
Joseph Mauriello (1944)
Year of Election or Appointment: 2008
Trustee
Mr. Mauriello also serves as Trustee of other Fidelity® funds. Prior to his retirement in January 2006, Mr. Mauriello served in numerous senior management positions including Deputy Chairman and Chief Operating Officer (2004-2005), and Vice Chairman of Financial Services (2002-2004) of KPMG LLP US (professional services, 1965-2005). Mr. Mauriello currently serves as a member of the Independent Directors Council (IDC) Governing Council (2015-present). Previously, Mr. Mauriello served as a member of the Board of Directors of XL Group plc. (global insurance and re-insurance, 2006-2018).
Cornelia M. Small (1944)
Year of Election or Appointment: 2005
Trustee
Ms. Small also serves as Trustee of other Fidelity® funds. Ms. Small is a member of the Board of Directors (2009-present) and Chair of the Investment Committee (2010-present) of the Teagle Foundation. Ms. Small also serves on the Investment Committee of the Berkshire Taconic Community Foundation (2008-present). Previously, Ms. Small served as Chairperson (2002-2008) and a member of the Investment Committee and Chairperson (2008-2012) and a member of the Board of Trustees of Smith College. In addition, Ms. Small served as Chief Investment Officer, Director of Global Equity Investments, and a member of the Board of Directors of Scudder, Stevens & Clark and Scudder Kemper Investments.
Garnett A. Smith (1947)
Year of Election or Appointment: 2018
Trustee
Mr. Smith also serves as Trustee of other Fidelity® funds. Prior to Mr. Smith's retirement, he served as Chairman and Chief Executive Officer of Inbrand Corp. (manufacturer of personal absorbent products, 1990-1997). He also served as President (1986-1990) of Inbrand Corp. Prior to his employment with Inbrand Corp., he was employed by a retail fabric chain and North Carolina National Bank. In addition, Mr. Smith served as a Member of the Advisory Board of certain Fidelity® funds (2012-2013) and as a board member of the Jackson Hole Land Trust (2009-2012).
David M. Thomas (1949)
Year of Election or Appointment: 2008
Trustee
Mr. Thomas also serves as Trustee of other Fidelity® funds. Mr. Thomas serves as Non-Executive Chairman of the Board of Directors of Fortune Brands Home and Security (home and security products, 2011-present) and as a member of the Board of Directors (2004-present) and Presiding Director (2013-present) of Interpublic Group of Companies, Inc. (marketing communication). Previously, Mr. Thomas served as Executive Chairman (2005-2006) and Chairman and Chief Executive Officer (2000-2005) of IMS Health, Inc. (pharmaceutical and healthcare information solutions), a Director of Fortune Brands, Inc. (consumer products, 2000-2011), and a member of the Board of Trustees of the University of Florida (2013-2018).
+ The information includes the Trustee's principal occupation during the last five years and other information relating to the experience, attributes, and skills relevant to the Trustee's qualifications to serve as a Trustee, which led to the conclusion that the Trustee should serve as a Trustee for the fund.
Advisory Board Members and Officers:
Correspondence intended for a Member of the Advisory Board (if any) may be sent to Fidelity Investments, P.O. Box 55235, Boston, Massachusetts 02205-5235. Correspondence intended for an officer or Peter S. Lynch may be sent to Fidelity Investments, 245 Summer Street, Boston, Massachusetts 02210. Officers appear below in alphabetical order.
Name, Year of Birth; Principal Occupation
Vicki L. Fuller (1957)
Year of Election or Appointment: 2018
Member of the Advisory Board
Ms. Fuller also serves as Member of the Advisory Board of other Fidelity® funds. Ms. Fuller serves as a member of the Board of Directors, Audit Committee, and Nominating and Governance Committee of The Williams Companies, Inc. (natural gas infrastructure, 2018-present). Previously, Ms. Fuller served as the Chief Investment Officer of the New York State Common Retirement Fund (2012-2018) and held a variety of positions at AllianceBernstein L.P. (global asset management, 1985-2012), including Managing Director (2006-2012) and Senior Vice President and Senior Portfolio Manager (2001-2006).
Peter S. Lynch (1944)
Year of Election or Appointment: 2003
Member of the Advisory Board
Mr. Lynch also serves as Member of the Advisory Board of other Fidelity® funds. Mr. Lynch is Vice Chairman and a Director of FMR (investment adviser firm) and FMR Co., Inc. (investment adviser firm). In addition, Mr. Lynch serves as a Trustee of Boston College and as the Chairman of the Inner-City Scholarship Fund. Previously, Mr. Lynch served on the Special Olympics International Board of Directors (1997-2006).
Michael E. Wiley (1950)
Year of Election or Appointment: 2018
Member of the Advisory Board
Mr. Wiley also serves as Trustee or Member of the Advisory Board of other Fidelity® funds. Mr. Wiley serves as a Director of High Point Resources (exploration and production, 2005-present). Previously, Mr. Wiley served as a Director of Andeavor Corporation (independent oil refiner and marketer, 2005-2018), a Director of Andeavor Logistics LP (natural resources logistics, 2015-2018), a Director of Post Oak Bank (privately-held bank, 2004-2018), a Director of Asia Pacific Exploration Consolidated (international oil and gas exploration and production, 2008-2013), a member of the Board of Trustees of the University of Tulsa (2000-2006; 2007-2010), a Senior Energy Advisor of Katzenbach Partners, LLC (consulting, 2006-2007), an Advisory Director of Riverstone Holdings (private investment), a Director of Spinnaker Exploration Company (exploration and production, 2001-2005) and Chairman, President, and CEO of Baker Hughes, Inc. (oilfield services, 2000-2004).
Elizabeth Paige Baumann (1968)
Year of Election or Appointment: 2017
Anti-Money Laundering (AML) Officer
Ms. Baumann also serves as AML Officer of other funds. She is Chief AML Officer (2012-present) and Senior Vice President (2014-present) of FMR LLC (diversified financial services company) and is an employee of Fidelity Investments. Previously, Ms. Baumann served as AML Officer of the funds (2012-2016), and Vice President (2007-2014) and Deputy Anti-Money Laundering Officer (2007-2012) of FMR LLC.
Craig S. Brown (1977)
Year of Election or Appointment: 2019
Assistant Treasurer
Mr. Brown also serves as Assistant Treasurer of other funds. Mr. Brown is an employee of Fidelity Investments (2013-present).
John J. Burke III (1964)
Year of Election or Appointment: 2018
Chief Financial Officer
Mr. Burke also serves as Chief Financial Officer of other funds. Mr. Burke serves as Head of Investment Operations for Fidelity Fund and Investment Operations (2018-present) and is an employee of Fidelity Investments (1998-present). Previously Mr. Burke served as head of Asset Management Investment Operations (2012-2018).
William C. Coffey (1969)
Year of Election or Appointment: 2019
Assistant Secretary
Mr. Coffey also serves as Assistant Secretary of other funds. He is Senior Vice President and Deputy General Counsel of FMR LLC (diversified financial services company, 2010-present), and is an employee of Fidelity Investments. Previously, Mr. Coffey served as Secretary and CLO of certain funds (2018-2019); CLO, Secretary, and Senior Vice President of Fidelity Management & Research Company and FMR Co., Inc. (investment adviser firms, 2018-2019); Secretary of Fidelity SelectCo, LLC and Fidelity Investments Money Management, Inc. (investment adviser firms, 2018-2019); CLO of Fidelity Management & Research (Hong Kong) Limited, FMR Investment Management (UK) Limited, and Fidelity Management & Research (Japan) Limited (investment adviser firms, 2018-2019); and Assistant Secretary of certain funds (2009-2018).
Timothy M. Cohen (1969)
Year of Election or Appointment: 2018
Vice President
Mr. Cohen also serves as Vice President of other funds. Mr. Cohen serves as Executive Vice President of Fidelity SelectCo, LLC (2019-present), Co-Head of Equity (2018-present), a Director of Fidelity Management & Research (Japan) Limited (investment adviser firm, 2016-present), and is an employee of Fidelity Investments. Previously, Mr. Cohen served as Head of Global Equity Research (2016-2018), Chief Investment Officer - Equity and a Director of Fidelity Management & Research (U.K.) Inc. (investment adviser firm, 2013-2015) and as a Director of Fidelity Management & Research (Hong Kong) Limited (investment adviser firm, 2017).
Jonathan Davis (1968)
Year of Election or Appointment: 2010
Assistant Treasurer
Mr. Davis also serves as Assistant Treasurer of other funds. Mr. Davis serves as Assistant Treasurer of FMR Capital, Inc. (2017-present) and is an employee of Fidelity Investments. Previously, Mr. Davis served as Vice President and Associate General Counsel of FMR LLC (diversified financial services company, 2003-2010).
Adrien E. Deberghes (1967)
Year of Election or Appointment: 2016
Assistant Treasurer
Mr. Deberghes also serves as an officer of other funds. He serves as Assistant Treasurer of FMR Capital, Inc. (2017-present), Executive Vice President of Fidelity Investments Money Management, Inc. (FIMM) (investment adviser firm, 2016-present), and is an employee of Fidelity Investments (2008-present). Previously, Mr. Deberghes served as President and Treasurer of certain Fidelity® funds (2013-2018). Prior to joining Fidelity Investments, Mr. Deberghes was Senior Vice President of Mutual Fund Administration at State Street Corporation (2007-2008), Senior Director of Mutual Fund Administration at Investors Bank & Trust (2005-2007), and Director of Finance for Dunkin' Brands (2000-2005). Previously, Mr. Deberghes served in other fund officer roles.
Laura M. Del Prato (1964)
Year of Election or Appointment: 2018
Assistant Treasurer
Ms. Del Prato also serves as an officer of other funds. Ms. Del Prato is an employee of Fidelity Investments (2017-present). Prior to joining Fidelity Investments, Ms. Del Prato served as a Managing Director and Treasurer of the JPMorgan Mutual Funds (2014-2017). Prior to JPMorgan, Ms. Del Prato served as a partner at Cohen Fund Audit Services (accounting firm, 2012-2013) and KPMG LLP (accounting firm, 2004-2012).
Colm A. Hogan (1973)
Year of Election or Appointment: 2016
Deputy Treasurer
Mr. Hogan also serves as an officer of other funds. Mr. Hogan serves as Assistant Treasurer of FMR Capital, Inc. (2017-present) and is an employee of Fidelity Investments (2005-present). Previously, Mr. Hogan served as Assistant Treasurer of certain Fidelity® funds (2016-2018).
Pamela R. Holding (1964)
Year of Election or Appointment: 2018
Vice President
Ms. Holding also serves as Vice President of other funds. Ms. Holding serves as Executive Vice President of Fidelity SelectCo, LLC (2019-present), Co-Head of Equity (2018-present) and is an employee of Fidelity Investments (2013-present). Previously, Ms. Holding served as Chief Investment Officer of Fidelity Institutional Asset Management (2013-2018).
Cynthia Lo Bessette (1969)
Year of Election or Appointment: 2019
Secretary and Chief Legal Officer (CLO)
Ms. Lo Bessette also serves as Secretary and CLO of other funds. Ms. Lo Bessette serves as CLO, Secretary, and Senior Vice President of Fidelity Management & Research Company and FMR Co., Inc. (investment adviser firms, 2019-present); Secretary of Fidelity SelectCo, LLC and Fidelity Investments Money Management, Inc. (investment adviser firms, 2019-present); and CLO of Fidelity Management & Research (Hong Kong) Limited, FMR Investment Management (UK) Limited, and Fidelity Management & Research (Japan) Limited (investment adviser firms, 2019-present). She is a Senior Vice President and Deputy General Counsel of FMR LLC (diversified financial services company, 2019-present), and is an employee of Fidelity Investments. Previously, Ms. Lo Bessette served as Executive Vice President, General Counsel (2016-2019) and Senior Vice President, Deputy General Counsel (2015-2016) of OppenheimerFunds (investment management company) and Deputy Chief Legal Officer (2013-2015) of Jennison Associates LLC (investment adviser firm).
Chris Maher (1972)
Year of Election or Appointment: 2013
Assistant Treasurer
Mr. Maher serves as Assistant Treasurer of other funds. Mr. Maher is Vice President of Valuation Oversight, serves as Assistant Treasurer of FMR Capital, Inc. (2017-present), and is an employee of Fidelity Investments. Previously, Mr. Maher served as Vice President of Asset Management Compliance (2013), Vice President of the Program Management Group of FMR (investment adviser firm, 2010-2013), and Vice President of Valuation Oversight (2008-2010).
Kenneth B. Robins (1969)
Year of Election or Appointment: 2016
Chief Compliance Officer
Mr. Robins also serves as an officer of other funds. Mr. Robins serves as Compliance Officer of Fidelity Management & Research Company and FMR Co., Inc. (investment adviser firms, 2016-present) and is an employee of Fidelity Investments (2004-present). Previously, Mr. Robins served as Executive Vice President of Fidelity Investments Money Management, Inc. (investment adviser firm, 2013-2016) and served in other fund officer roles.
Stacie M. Smith (1974)
Year of Election or Appointment: 2016
President and Treasurer
Ms. Smith also serves as an officer of other funds. Ms. Smith serves as Assistant Treasurer of FMR Capital, Inc. (2017-present), is an employee of Fidelity Investments (2009-present), and has served in other fund officer roles. Prior to joining Fidelity Investments, Ms. Smith served as Senior Audit Manager of Ernst & Young LLP (accounting firm, 1996-2009). Previously, Ms. Smith served as Assistant Treasurer (2013-2018) and Deputy Treasurer (2013-2016) of certain Fidelity® funds.
Marc L. Spector (1972)
Year of Election or Appointment: 2016
Assistant Treasurer
Mr. Spector also serves as an officer of other funds. Mr. Spector serves as Assistant Treasurer of FMR Capital, Inc. (2017-present) and is an employee of Fidelity Investments (2016-present). Prior to joining Fidelity Investments, Mr. Spector served as Director at the Siegfried Group (accounting firm, 2013-2016), and prior to Siegfried Group as audit senior manager at Deloitte & Touche (accounting firm, 2005-2013).
Jim Wegmann (1979)
Year of Election or Appointment: 2019
Assistant Treasurer
Mr. Wegmann also serves as Assistant Treasurer of other funds. Mr. Wegmann is an employee of Fidelity Investments (2011-present).
Shareholder Expense Example
As a shareholder of the Fund, you incur two types of costs: (1) transaction costs and (2) ongoing costs, including management fees and other Fund expenses. This Example is intended to help you understand your ongoing costs (in dollars) of investing in the Fund and to compare these costs with the ongoing costs of investing in other mutual funds.
The actual expense Example is based on an investment of $1,000 invested at the beginning of the period and held for the entire period (June 13, 2019 to October 31, 2019). The hypothetical expense Example is based on an investment of $1,000 invested for the one-half year period (May 1, 2019 to October 31, 2019).
Actual Expenses
The first line of the accompanying table provides information about actual account values and actual expenses. You may use the information in this line, together with the amount you invested, to estimate the expenses that you paid over the period. Simply divide your account value by $1,000.00 (for example, an $8,600 account value divided by $1,000.00 = 8.6), then multiply the result by the number in the first line under the heading entitled "Expenses Paid During Period" to estimate the expenses you paid on your account during this period. In addition, the Fund, as a shareholder in the underlying Fidelity Central Funds, will indirectly bear its pro-rata share of the fees and expenses incurred by the underlying Fidelity Central Funds. These fees and expenses are not included in the Fund's annualized expense ratio used to calculate the expense estimate in the table below.
Hypothetical Example for Comparison Purposes
The second line of the accompanying table provides information about hypothetical account values and hypothetical expenses based on the Fund's actual expense ratio and an assumed rate of return of 5% per year before expenses, which is not the Fund's actual return. The hypothetical account values and expenses may not be used to estimate the actual ending account balance or expenses you paid for the period. You may use this information to compare the ongoing costs of investing in the Fund and other funds. To do so, compare this 5% hypothetical example with the 5% hypothetical examples that appear in the shareholder reports of the other funds. In addition, the Fund, as a shareholder in the underlying Fidelity Central Funds, will indirectly bear its pro-rata share of the fees and expenses incurred by the underlying Fidelity Central Funds. These fees and expenses are not included in the Fund's annualized expense ratio used to calculate the expense estimate in the table below.
Please note that the expenses shown in the table are meant to highlight your ongoing costs only and do not reflect any transaction costs. Therefore, the second line of the table is useful in comparing ongoing costs only, and will not help you determine the relative total costs of owning different funds.
| | Annualized Expense Ratio-A | Beginning
Account Value
| Ending
Account Value
October 31, 2019 | Expenses Paid
During Period
|
| Actual | .60% | $1,000.00 | $1,049.00 | $2.37-B |
| Hypothetical-C | | $1,000.00 | $1,022.18 | $3.06-D |
A Annualized expense ratio reflects expenses net of applicable fee waivers.
B Actual expenses are equal to the Fund's annualized expense ratio, multiplied by the average account value over the period, multiplied by 141/365 (to reflect the period June 13, 2019 to October 31, 2019).
C 5% return per year before expenses
D Hypothetical expenses are equal to the Fund's annualized expense ratio, multiplied by the average account value over the period, multiplied by 184/365 (to reflect the one-half year period).
Distributions (Unaudited)
The Board of Trustees of Fidelity International Discovery K6 Fund voted to pay on December 16, 2019, to shareholders of record at the opening of business on December 13, 2019, a distribution of $0.046 per share derived from capital gains realized from sales of portfolio securities and a dividend of $0.043 per share from net investment income.
The fund will notify shareholders in January 2020 of amounts for use in preparing 2019 income tax returns.
Board Approval of Investment Advisory Contracts and Management Fees
Fidelity International Discovery K6 Fund
On March 6, 2019, the Board of Trustees, including the Independent Trustees (together, the Board), voted to approve the management contract with Fidelity Management & Research Company (FMR) and the sub-advisory agreements with affiliates of FMR (together, the Advisory Contracts) for the fund. FMR and the sub-advisers are collectively referred to herein as the Investment Advisers. The Board, assisted by the advice of fund counsel and Independent Trustees' counsel, considered a broad range of information.
Nature, Extent, and Quality of Services Provided. The Board considered Fidelity's staffing as it relates to the fund, including the backgrounds of investment personnel of Fidelity, and also considered the fund's investment objective, strategies, and related investment philosophy. The Board considered the structure of the investment personnel compensation program and whether this structure provides appropriate incentives to act in the best interests of the fund.
Resources Dedicated to Investment Management and Support Services. The Board and the Fund Oversight and Research Committees reviewed the general qualifications and capabilities of Fidelity's investment staff, including its size, education, experience, and resources, as well as Fidelity's approach to recruiting, training, managing, and compensating investment personnel. The Board noted that Fidelity has continued to increase the resources devoted to non-U.S. offices, including expansion of Fidelity's global investment organization. The Board also noted that Fidelity's analysts have extensive resources, tools and capabilities that allow them to conduct sophisticated quantitative and fundamental analysis, as well as credit analysis of issuers, counterparties and guarantors. Further, the Board considered that Fidelity's investment professionals have sufficient access to global information and data so as to provide competitive investment results over time, and that those professionals also have access to sophisticated tools that permit them to assess portfolio construction and risk and performance attribution characteristics continuously, as well as to transmit new information and research conclusions rapidly around the world. Additionally, in its deliberations, the Board considered Fidelity's trading, risk management, compliance, and technology and operations capabilities and resources, which are integral parts of the investment management process.
Shareholder and Administrative Services. The Board considered the nature, extent, quality, and cost of advisory, administrative, and shareholder services to be performed by the Investment Advisers and their affiliates under the Advisory Contracts and under separate agreements covering transfer agency, pricing and bookkeeping, and securities lending services for the fund. The Board also considered the nature and extent of the supervision of third party service providers, principally custodians, subcustodians, and pricing vendors.
The Board noted that the growth of fund assets over time across the complex allows Fidelity to reinvest in the development of services designed to enhance the value and convenience of the Fidelity funds as investment vehicles. These services include 24-hour access to account information and market information through telephone representatives and over the Internet, investor education materials and asset allocation tools, and the expanded availability of Fidelity Investor Centers.
Investment Performance. The fund is a new fund and therefore had no historical performance for the Board to review at the time it approved the fund's Advisory Contracts. The Board considered the Investment Advisers' strength in fundamental, research-driven security selection, which the Board is familiar with through its supervision of other Fidelity funds.
Based on its review, the Board concluded that the nature, extent, and quality of services to be provided to the fund under the Advisory Contracts should benefit the shareholders of the fund.
Competitiveness of Management Fee and Total Expense Ratio ..In reviewing the Advisory Contracts, the Board considered the fund's proposed management fee rate out of which FMR will pay all operating expenses, with certain limited exceptions, and the projected total expense ratio of the fund. The Board noted that the fund's proposed management fee rate is lower than the median fee rate of funds with similar Lipper investment objective categories and comparable investment mandates, regardless of whether their management fee structures are comparable. The Board also considered that the projected total expense ratio of the fund is below the median of those funds and classes used by the Board for management fee comparisons that have a similar sales load structure.
Based on its review, the Board concluded that the fund's management fee and projected total expense ratio were reasonable in light of the services that the fund and its shareholders will receive and the other factors considered.
Costs of the Services and Profitability. The fund is a new fund and therefore no revenue, cost, or profitability data was available for the Board to review in respect of the fund at the time it approved the Advisory Contracts. In connection with its future renewal of the fund's Advisory Contracts, the Board will consider the revenues earned and the expenses incurred by Fidelity in conducting the business of developing, marketing, distributing, managing, administering and servicing the fund and servicing the fund's shareholders.
Economies of Scale. The Board will consider economies of scale when there is operating experience to permit assessment thereof. It noted that, notwithstanding the entrepreneurial risk associated with a new fund, the management fee was at a level normally associated, by comparison with competitors, with very high fund net assets, and Fidelity asserted to the Board that the level of the fee anticipated economies of scale at lower asset levels even before, if ever, economies of scale are achieved. The Board also noted that the fund and its shareholders would have access to the very considerable number and variety of services available through Fidelity and its affiliates.
IGI-K6-ANN-1219
1.9893917.100
Fidelity® International Small Cap Opportunities Fund
Annual Report
October 31, 2019
Includes Fidelity and Fidelity Advisor share classes
See the inside front cover for important information about access to your fund’s shareholder reports.
Beginning on January 1, 2021, as permitted by regulations adopted by the Securities and Exchange Commission, paper copies of a fund’s shareholder reports will no longer be sent by mail, unless you specifically request paper copies of the reports from the fund or from your financial intermediary, such as a financial advisor, broker-dealer or bank. Instead, the reports will be made available on a website, and you will be notified by mail each time a report is posted and provided with a website link to access the report.
If you already elected to receive shareholder reports electronically, you will not be affected by this change and you need not take any action. You may elect to receive shareholder reports and other communications from a fund electronically, by contacting your financial intermediary. For Fidelity customers, visit Fidelity's web site or call Fidelity using the contact information listed below.
You may elect to receive all future reports in paper free of charge. If you wish to continue receiving paper copies of your shareholder reports, you may contact your financial intermediary or, if you are a Fidelity customer, visit Fidelity’s website, or call Fidelity at the applicable toll-free number listed below. Your election to receive reports in paper will apply to all funds held with the fund complex/your financial intermediary.
| Account Type | Website | Phone Number |
| Brokerage, Mutual Fund, or Annuity Contracts: | fidelity.com/mailpreferences | 1-800-343-3548 |
| Employer Provided Retirement Accounts: | netbenefits.fidelity.com/preferences (choose 'no' under Required Disclosures to continue to print) | 1-800-343-0860 |
| Advisor Sold Accounts Serviced Through Your Financial Intermediary: | Contact Your Financial Intermediary | Your Financial Intermediary's phone number |
| Advisor Sold Accounts Serviced by Fidelity: | institutional.fidelity.com | 1-877-208-0098 |
Contents
To view a fund's proxy voting guidelines and proxy voting record for the 12-month period ended June 30, visit http://www.fidelity.com/proxyvotingresults or visit the Securities and Exchange Commission's (SEC) web site at http://www.sec.gov.
You may also call 1-800-544-8544 if you’re an individual investing directly with Fidelity, call 1-800-835-5092 if you’re a plan sponsor or participant with Fidelity as your recordkeeper or call 1-877-208-0098 on institutional accounts or if you’re an advisor or invest through one to request a free copy of the proxy voting guidelines.
Standard & Poor's, S&P and S&P 500 are registered service marks of The McGraw-Hill Companies, Inc. and have been licensed for use by Fidelity Distributors Corporation.
Other third-party marks appearing herein are the property of their respective owners.
All other marks appearing herein are registered or unregistered trademarks or service marks of FMR LLC or an affiliated company. © 2019 FMR LLC. All rights reserved.
This report and the financial statements contained herein are submitted for the general information of the shareholders of the Fund. This report is not authorized for distribution to prospective investors in the Fund unless preceded or accompanied by an effective prospectus.
A fund files its complete schedule of portfolio holdings with the SEC for the first and third quarters of each fiscal year on Form N-PORT. Forms N-PORT are available on the SEC’s web site at http://www.sec.gov. A fund's Forms N-PORT may be reviewed and copied at the SEC’s Public Reference Room in Washington, DC. Information regarding the operation of the SEC's Public Reference Room may be obtained by calling 1-800-SEC-0330.
For a complete list of a fund's portfolio holdings, view the most recent holdings listing, semiannual report, or annual report on Fidelity's web site at http://www.fidelity.com, http://www.institutional.fidelity.com, or http://www.401k.com, as applicable.
NOT FDIC INSURED •MAY LOSE VALUE •NO BANK GUARANTEE
Neither the Fund nor Fidelity Distributors Corporation is a bank.
Performance: The Bottom Line
Average annual total return reflects the change in the value of an investment, assuming reinvestment of distributions from dividend income and capital gains (the profits earned upon the sale of securities that have grown in value, if any) and assuming a constant rate of performance each year. The hypothetical investment and the average annual total returns do not reflect the deduction of taxes that a shareholder would pay on fund distributions or the redemption of fund shares. During periods of reimbursement by Fidelity, a fund’s total return will be greater than it would be had the reimbursement not occurred. How a fund did yesterday is no guarantee of how it will do tomorrow.
Average Annual Total Returns
| For the periods ended October 31, 2019 | Past 1 year | Past 5 years | Past 10 years |
| Class A (incl. 5.75% sales charge) | 6.14% | 7.05% | 9.76% |
| Class M (incl. 3.50% sales charge) | 8.36% | 7.22% | 9.71% |
| Class C (incl. contingent deferred sales charge) | 10.74% | 7.47% | 9.56% |
| Fidelity® International Small Cap Opportunities Fund | 12.97% | 8.63% | 10.72% |
| Class I | 12.93% | 8.63% | 10.71% |
| Class Z | 13.10% | 8.66% | 10.73% |
Class C shares' contingent deferred sales charges included in the past one year, past five years and past ten years total return figures are 1%, 0% and 0%, respectively.
The initial offering of Class Z shares took place on October 2, 2018. Returns prior to October 2, 2018, are those of Class I.
$10,000 Over 10 Years
Let's say hypothetically that $10,000 was invested in Fidelity® International Small Cap Opportunities Fund, a class of the fund, on October 31, 2009.
The chart shows how the value of your investment would have changed, and also shows how the MSCI EAFE Small Cap Index performed over the same period.
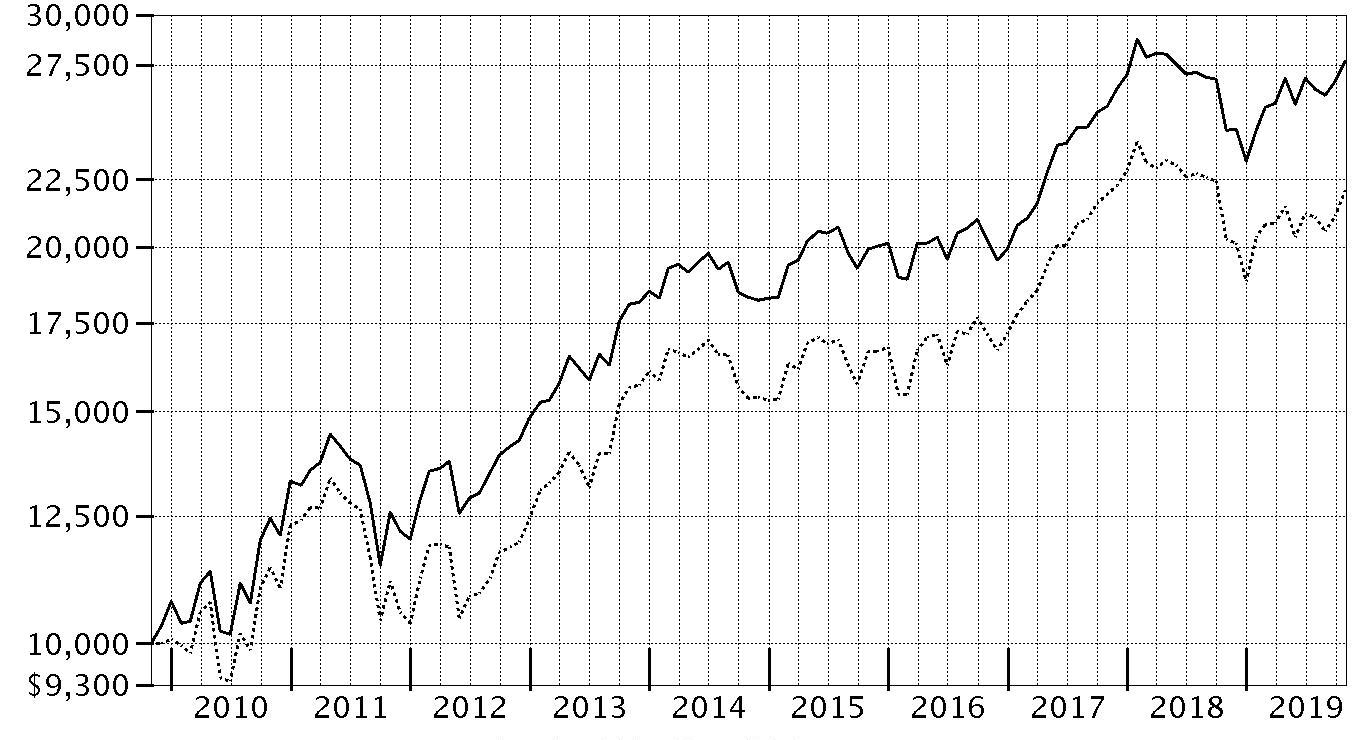
| Period Ending Values |
| $27,683 | Fidelity® International Small Cap Opportunities Fund - Fidelity® International Small Cap Opportunities Fund |
| $22,081 | MSCI EAFE Small Cap Index |
Management's Discussion of Fund Performance
Market Recap: The MSCI ACWI (All Country World Index) ex USA Index gained 11.47% for the 12 months ending October 31, 2019, as international stocks reflected a confluence of factors, including escalating trade tension, moderating but still positive global economic growth and uncertainty about the U.K.’s planned “Brexit” from the European Union. In late December, the U.S. Federal Reserve shifted from raising interest rates to a more dovish policy in 2019, joining many foreign central banks that had cut policy rates. In June, international stocks rose 6.03%, as policy stimulus in China stabilized that country’s economic growth. The Fed cut its policy rate in July for the first time since 2008. However, the index returned -1.21% for the month, followed by -3.08% in August. In September, the Fed cut its policy rate another quarter point, citing concerns about slowing economic growth and muted inflation, and did the same in October, leading to monthly gains of 2.59% and 3.49%, respectively. For the full 12 months, the growth-oriented information technology sector (+22%) led the way, followed by utilities (+20%) and real estate (+18%), two high-dividend-yielding categories. Consumer discretionary gained 16%. Conversely, energy was roughly flat, while materials (+6%) and communication services (7%) also lagged. By region, Asia Pacific ex Japan (+16%), Europe ex U.K (+13%), Canada (+12%) and emerging markets (+12%) fared best. Meanwhile, the U.K. (+7%) and Japan (+10%) trailed the broader market.
Comments from Portfolio Manager Jed Weiss: For the fiscal year, the fund’s share classes (excluding sales charges, if applicable) gained roughly 12% to 13%, outpacing the 9.00% advance of the benchmark MSCI EAFE Small Cap Index. Versus the benchmark, security selection within Japan was by far the biggest contributor, followed by picks in the U.K., Germany and Denmark. Investment choices among emerging markets also helped the portfolio’s relative result. From a sector standpoint, positioning in information technology notably aided performance, along with strong picks in the consumer-oriented groups and in health care. Conversely, security selection in Israel, Canada and Spain hampered the fund's performance versus the benchmark, as did an underweighting in Australia and the market-leading real estate sector. A number of Japanese holdings helped the fund top the benchmark this period. This included an overweighting in Lasertec, a dominant supplier of semiconductor mask inspection equipment that gained roughly 157% the past 12 months. The company continued to be a beneficiary of the structural growth in extreme ultraviolet lithography. Further contributing were an overweighting in Japanese building automation firm Azbil (+53%) and a sizable out-of-benchmark stake in technology service management company OBIC (+40%). In addition, it helped to hold a non-index position in Workman (+126%), the leading workwear retailer in Japan. Conversely, the fund's biggest detractor was Spanish multinational private security company Prosegur Compania de Seguridad (-28%), which was hampered by the impact of depreciating Latin American currencies during the period. Other holdings that pressured the fund’s performance versus the benchmark included Israeli stolen vehicle recovery and tracking services firm Ituran Location and Control (-26%), as well as U.K.-headquartered specialty chemical company Elementis (-23%). Lastly, I'll note that the fund's stake in cash – representing about 6% of assets, on average – also weighed on the portfolio’s relative return amid the strong uptrending market this period.
The views expressed above reflect those of the portfolio manager(s) only through the end of the period as stated on the cover of this report and do not necessarily represent the views of Fidelity or any other person in the Fidelity organization. Any such views are subject to change at any time based upon market or other conditions and Fidelity disclaims any responsibility to update such views. These views may not be relied on as investment advice and, because investment decisions for a Fidelity fund are based on numerous factors, may not be relied on as an indication of trading intent on behalf of any Fidelity fund.
Investment Summary (Unaudited)
Geographic Diversification (% of fund's net assets)
| As of October 31, 2019 |
| | Japan | 37.8% |
| | United Kingdom | 15.3% |
| | United States of America* | 13.2% |
| | Germany | 5.3% |
| | Sweden | 5.2% |
| | Denmark | 2.8% |
| | Israel | 2.6% |
| | Netherlands | 2.0% |
| | Belgium | 1.9% |
| | Other | 13.9% |

* Includes Short-Term investments and Net Other Assets (Liabilities).
Percentages are based on country or territory of incorporation and are adjusted for the effect of futures contracts, if applicable.
Asset Allocation as of October 31, 2019
| | % of fund's net assets |
| Stocks and Investment Companies | 93.6 |
| Short-Term Investments and Net Other Assets (Liabilities) | 6.4 |
Top Ten Stocks as of October 31, 2019
| | % of fund's net assets |
| iShares MSCI EAFE Small-Cap ETF (United States of America, Investment Companies) | 4.6 |
| Azbil Corp. (Japan, Electronic Equipment & Components) | 3.1 |
| OBIC Co. Ltd. (Japan, IT Services) | 2.8 |
| Lasertec Corp. (Japan, Semiconductors & Semiconductor Equipment) | 2.4 |
| Spirax-Sarco Engineering PLC (United Kingdom, Machinery) | 2.4 |
| Spectris PLC (United Kingdom, Electronic Equipment & Components) | 2.2 |
| USS Co. Ltd. (Japan, Specialty Retail) | 2.0 |
| CompuGroup Medical AG (Germany, Health Care Technology) | 2.0 |
| SHO-BOND Holdings Co. Ltd. (Japan, Construction & Engineering) | 1.8 |
| OSG Corp. (Japan, Machinery) | 1.7 |
| | 25.0 |
Top Market Sectors as of October 31, 2019
| | % of fund's net assets |
| Industrials | 22.5 |
| Information Technology | 17.8 |
| Health Care | 13.2 |
| Consumer Discretionary | 9.3 |
| Consumer Staples | 7.8 |
| Communication Services | 5.7 |
| Materials | 4.7 |
| Real Estate | 3.4 |
| Financials | 3.0 |
| Energy | 1.6 |
Schedule of Investments October 31, 2019
Showing Percentage of Net Assets
| Common Stocks - 88.1% | | | |
| | | Shares | Value |
| Australia - 0.5% | | | |
| Beacon Lighting Group Ltd. (a) | | 2,785,250 | $2,333,059 |
| Imdex Ltd. | | 3,357,352 | 3,676,300 |
|
| TOTAL AUSTRALIA | | | 6,009,359 |
|
| Bailiwick of Jersey - 0.5% | | | |
| Integrated Diagnostics Holdings PLC (b) | | 1,483,779 | 7,003,437 |
| Belgium - 1.9% | | | |
| Barco NV | | 63,400 | 13,788,454 |
| KBC Ancora | | 239,456 | 11,403,687 |
|
| TOTAL BELGIUM | | | 25,192,141 |
|
| Canada - 1.4% | | | |
| McCoy Global, Inc. (c) | | 630,715 | 287,320 |
| New Look Vision Group, Inc. | | 227,200 | 5,520,006 |
| Pason Systems, Inc. | | 328,800 | 3,529,901 |
| PrairieSky Royalty Ltd. (a) | | 202,700 | 1,979,138 |
| Richelieu Hardware Ltd. | | 249,400 | 5,120,170 |
| ShawCor Ltd. Class A | | 164,900 | 1,660,143 |
|
| TOTAL CANADA | | | 18,096,678 |
|
| China - 0.6% | | | |
| Zhejiang Sanhua Intelligent Controls Co. Ltd. (A Shares) | | 3,700,332 | 7,351,501 |
| Denmark - 2.8% | | | |
| Ambu A/S Series B | | 320,000 | 5,025,378 |
| Jyske Bank A/S (Reg.) | | 131,227 | 4,362,610 |
| Netcompany Group A/S (b)(c) | | 217,750 | 9,270,660 |
| SimCorp A/S | | 129,400 | 11,561,160 |
| Spar Nord Bank A/S | | 700,300 | 6,836,989 |
|
| TOTAL DENMARK | | | 37,056,797 |
|
| Finland - 0.5% | | | |
| Tikkurila Oyj | | 379,826 | 6,057,765 |
| France - 1.8% | | | |
| Elis SA | | 584,442 | 11,165,816 |
| Laurent-Perrier Group SA | | 51,163 | 5,078,526 |
| Vetoquinol SA | | 116,884 | 7,613,066 |
|
| TOTAL FRANCE | | | 23,857,408 |
|
| Germany - 4.4% | | | |
| CompuGroup Medical AG | | 407,110 | 26,062,458 |
| CTS Eventim AG | | 213,893 | 12,941,601 |
| DIC Asset AG | | 325,300 | 4,535,089 |
| Nexus AG | | 291,358 | 10,333,460 |
| WashTec AG | | 93,694 | 4,712,811 |
|
| TOTAL GERMANY | | | 58,585,419 |
|
| Greece - 0.2% | | | |
| Motor Oil (HELLAS) Corinth Refineries SA | | 131,300 | 3,242,157 |
| India - 0.8% | | | |
| Embassy Office Parks (REIT) | | 1,320,000 | 7,673,340 |
| Jyothy Laboratories Ltd. | | 1,271,776 | 3,133,496 |
|
| TOTAL INDIA | | | 10,806,836 |
|
| Ireland - 0.2% | | | |
| FBD Holdings PLC | | 243,128 | 2,402,483 |
| Israel - 2.6% | | | |
| Azrieli Group | | 54,105 | 4,167,886 |
| Ituran Location & Control Ltd. | | 506,477 | 12,423,881 |
| Strauss Group Ltd. | | 483,344 | 14,632,866 |
| Tel Aviv Stock Exchange Ltd. | | 684,943 | 2,536,142 |
|
| TOTAL ISRAEL | | | 33,760,775 |
|
| Italy - 1.1% | | | |
| Interpump Group SpA | | 539,843 | 14,787,254 |
| Japan - 37.8% | | | |
| Ai Holdings Corp. | | 202,400 | 3,668,221 |
| Aoki Super Co. Ltd. | | 175,000 | 4,164,883 |
| Artnature, Inc. | | 486,800 | 3,233,632 |
| Aucnet, Inc. | | 248,800 | 3,417,118 |
| Azbil Corp. | | 1,485,700 | 41,342,865 |
| Broadleaf Co. Ltd. | | 1,697,298 | 9,535,946 |
| Central Automotive Products Ltd. | | 135,400 | 2,649,890 |
| Century21 Real Estate Japan Ltd. | | 66,500 | 744,087 |
| Coca-Cola West Co. Ltd. | | 209,375 | 4,753,665 |
| Daiichikosho Co. Ltd. | | 328,000 | 15,592,244 |
| Daikokutenbussan Co. Ltd. | | 184,500 | 5,756,285 |
| Funai Soken Holdings, Inc. | | 285,150 | 6,870,370 |
| GCA Savvian Group Corp. | | 496,961 | 3,974,014 |
| Goldcrest Co. Ltd. | | 661,630 | 13,667,239 |
| Iwatsuka Confectionary Co. Ltd. | | 18,900 | 676,111 |
| Kobayashi Pharmaceutical Co. Ltd. | | 129,500 | 10,354,822 |
| Koshidaka Holdings Co. Ltd. | | 1,420,200 | 20,622,734 |
| Kusuri No Aoki Holdings Co. Ltd. | | 134,800 | 10,053,026 |
| Lasertec Corp. | | 450,572 | 32,389,837 |
| Medikit Co. Ltd. | | 111,100 | 7,040,267 |
| Miroku Jyoho Service Co., Ltd. (a) | | 203,500 | 5,363,834 |
| Misumi Group, Inc. | | 464,650 | 11,680,726 |
| Mitsuboshi Belting Ltd. | | 194,000 | 3,650,301 |
| Nabtesco Corp. | | 389,900 | 12,412,390 |
| Nagaileben Co. Ltd. | | 662,727 | 15,798,257 |
| Nihon Parkerizing Co. Ltd. | | 1,798,400 | 21,086,201 |
| NS Tool Co. Ltd. | | 255,800 | 4,987,317 |
| OBIC Co. Ltd. | | 297,300 | 37,223,513 |
| OSG Corp. | | 1,059,800 | 22,668,584 |
| Paramount Bed Holdings Co. Ltd. | | 355,400 | 13,589,435 |
| ProNexus, Inc. | | 457,800 | 5,371,775 |
| San-Ai Oil Co. Ltd. | | 1,082,400 | 11,331,916 |
| SHO-BOND Holdings Co. Ltd. | | 605,600 | 23,503,614 |
| Shoei Co. Ltd. (a) | | 420,926 | 18,322,810 |
| SK Kaken Co. Ltd. | | 21,500 | 9,181,111 |
| Software Service, Inc. | | 100,700 | 10,856,331 |
| Techno Medica Co. Ltd. | | 80,791 | 1,678,722 |
| The Monogatari Corp. | | 56,600 | 4,888,229 |
| TKC Corp. | | 176,100 | 7,418,386 |
| Tocalo Co. Ltd. | | 615,636 | 6,069,355 |
| USS Co. Ltd. | | 1,361,500 | 26,369,795 |
| Welcia Holdings Co. Ltd. | | 141,000 | 8,101,900 |
| Workman Co. Ltd. (a) | | 151,700 | 10,737,227 |
| Yamada Consulting Group Co. Ltd. | | 260,500 | 4,696,337 |
| Yamato Kogyo Co. Ltd. | | 137,700 | 3,572,169 |
|
| TOTAL JAPAN | | | 501,067,491 |
|
| Korea (South) - 0.8% | | | |
| BGF Retail Co. Ltd. | | 51,126 | 7,776,216 |
| Leeno Industrial, Inc. | | 72,328 | 3,287,945 |
|
| TOTAL KOREA (SOUTH) | | | 11,064,161 |
|
| Mexico - 0.1% | | | |
| Consorcio ARA S.A.B. de CV | | 8,394,378 | 1,579,687 |
| Netherlands - 2.0% | | | |
| Aalberts Industries NV | | 506,701 | 20,378,358 |
| Takeaway.com Holding BV (b)(c) | | 79,287 | 6,455,302 |
|
| TOTAL NETHERLANDS | | | 26,833,660 |
|
| Norway - 1.3% | | | |
| Kongsberg Gruppen ASA | | 892,559 | 13,180,463 |
| Skandiabanken ASA (b) | | 646,460 | 4,590,382 |
|
| TOTAL NORWAY | | | 17,770,845 |
|
| Philippines - 0.5% | | | |
| Jollibee Food Corp. | | 1,417,440 | 6,472,303 |
| South Africa - 1.2% | | | |
| Clicks Group Ltd. | | 1,015,129 | 16,511,592 |
| Spain - 1.0% | | | |
| Prosegur Compania de Seguridad SA (Reg.) | | 3,299,090 | 12,804,573 |
| Sweden - 5.2% | | | |
| Addlife AB | | 439,314 | 9,827,545 |
| AddTech AB (B Shares) | | 686,043 | 19,077,078 |
| Fagerhult AB (a) | | 1,016,593 | 6,022,258 |
| Lagercrantz Group AB (B Shares) | | 1,050,375 | 13,489,079 |
| Loomis AB (B Shares) | | 334,600 | 12,925,609 |
| Saab AB (B Shares) | | 233,125 | 7,187,600 |
|
| TOTAL SWEDEN | | | 68,529,169 |
|
| Switzerland - 1.0% | | | |
| Tecan Group AG | | 55,920 | 13,219,001 |
| Taiwan - 0.4% | | | |
| Addcn Technology Co. Ltd. | | 638,435 | 5,212,483 |
| United Kingdom - 15.3% | | | |
| Alliance Pharma PLC | | 7,514,341 | 7,202,939 |
| Ascential PLC (b) | | 1,387,686 | 6,277,006 |
| Avon Rubber PLC | | 534,900 | 12,305,597 |
| Bodycote PLC | | 220,365 | 2,043,821 |
| Cineworld Group PLC | | 1,446,400 | 4,172,494 |
| Dechra Pharmaceuticals PLC | | 566,695 | 19,305,998 |
| DP Poland PLC (c) | | 9,954,100 | 593,126 |
| Elementis PLC | | 5,452,137 | 10,501,827 |
| Great Portland Estates PLC | | 716,042 | 7,305,187 |
| Hilton Food Group PLC | | 318,426 | 4,190,727 |
| Howden Joinery Group PLC | | 922,400 | 6,898,953 |
| Informa PLC | | 879,056 | 8,824,810 |
| InterContinental Hotel Group PLC ADR | | 87,585 | 5,306,775 |
| ITE Group PLC | | 6,686,293 | 6,729,667 |
| Network International Holdings PLC (b) | | 895,200 | 6,273,421 |
| Rightmove PLC | | 1,934,170 | 14,997,487 |
| Shaftesbury PLC | | 581,473 | 7,117,844 |
| Spectris PLC | | 954,778 | 29,583,578 |
| Spirax-Sarco Engineering PLC | | 309,691 | 31,791,790 |
| Topps Tiles PLC | | 3,398,115 | 3,314,516 |
| Ultra Electronics Holdings PLC | | 312,658 | 7,897,530 |
|
| TOTAL UNITED KINGDOM | | | 202,635,093 |
|
| United States of America - 2.2% | | | |
| Autoliv, Inc. | | 39,300 | 3,059,112 |
| Martin Marietta Materials, Inc. | | 25,320 | 6,631,561 |
| Morningstar, Inc. | | 26,100 | 4,224,024 |
| PriceSmart, Inc. (a) | | 94,360 | 6,992,076 |
| ResMed, Inc. | | 57,495 | 8,504,660 |
|
| TOTAL UNITED STATES OF AMERICA | | | 29,411,433 |
|
| TOTAL COMMON STOCKS | | | |
| (Cost $865,955,325) | | | 1,167,321,501 |
|
| Nonconvertible Preferred Stocks - 0.9% | | | |
| Germany - 0.9% | | | |
| Sartorius AG (non-vtg.) | | | |
| (Cost $1,774,352) | | 64,280 | 12,488,657 |
|
| Investment Companies - 4.6% | | | |
| United States of America - 4.6% | | | |
| iShares MSCI EAFE Small-Cap ETF (a) | | | |
| (Cost $62,474,622) | | 1,020,000 | 60,771,604 |
|
| Money Market Funds - 7.6% | | | |
| Fidelity Cash Central Fund 1.83% (d) | | 76,847,604 | 76,862,974 |
| Fidelity Securities Lending Cash Central Fund 1.84% (d)(e) | | 23,631,338 | 23,633,701 |
| TOTAL MONEY MARKET FUNDS | | | |
| (Cost $100,496,646) | | | 100,496,675 |
| TOTAL INVESTMENT IN SECURITIES - 101.2% | | | |
| (Cost $1,030,700,945) | | | 1,341,078,437 |
| NET OTHER ASSETS (LIABILITIES) - (1.2)% | | | (15,731,451) |
| NET ASSETS - 100% | | | $1,325,346,986 |
Security Type Abbreviations
ETF – Exchange-Traded Fund
Categorizations in the Schedule of Investments are based on country or territory of incorporation.
Legend
(a) Security or a portion of the security is on loan at period end.
(b) Security exempt from registration under Rule 144A of the Securities Act of 1933. These securities may be resold in transactions exempt from registration, normally to qualified institutional buyers. At the end of the period, the value of these securities amounted to $39,870,208 or 3.0% of net assets.
(c) Non-income producing
(d) Affiliated fund that is generally available only to investment companies and other accounts managed by Fidelity Investments. The rate quoted is the annualized seven-day yield of the fund at period end. A complete unaudited listing of the fund's holdings as of its most recent quarter end is available upon request. In addition, each Fidelity Central Fund's financial statements, which are not covered by the Fund's Report of Independent Registered Public Accounting Firm, are available on the SEC's website or upon request.
(e) Investment made with cash collateral received from securities on loan.
Affiliated Central Funds
Information regarding fiscal year to date income earned by the Fund from investments in Fidelity Central Funds is as follows:
| Fund | Income earned |
| Fidelity Cash Central Fund | $1,819,943 |
| Fidelity Securities Lending Cash Central Fund | 245,475 |
| Total | $2,065,418 |
Amounts in the income column in the above table include any capital gain distributions from underlying funds, which are presented in the corresponding line-item in the Statement of Operations, if applicable. Amount for Fidelity Securities Lending Cash Central Fund represents the income earned on investing cash collateral, less rebates paid to borrowers and any lending agent fees associated with the loan, plus any premium payments received for lending certain types of securities.
Investment Valuation
The following is a summary of the inputs used, as of October 31, 2019, involving the Fund's assets and liabilities carried at fair value. The inputs or methodology used for valuing securities may not be an indication of the risk associated with investing in those securities. For more information on valuation inputs, and their aggregation into the levels used below, please refer to the Investment Valuation section in the accompanying Notes to Financial Statements.
| | Valuation Inputs at Reporting Date: |
| Description | Total | Level 1 | Level 2 | Level 3 |
| Investments in Securities: | | | | |
| Equities: | | | | |
| Communication Services | $74,747,792 | $59,155,548 | $15,592,244 | $-- |
| Consumer Discretionary | 121,641,689 | 25,828,524 | 95,813,165 | -- |
| Consumer Staples | 105,409,823 | 55,182,003 | 50,227,820 | -- |
| Energy | 22,030,575 | 10,698,659 | 11,331,916 | -- |
| Financials | 40,330,331 | 36,356,317 | 3,974,014 | -- |
| Health Care | 175,549,611 | 126,586,599 | 48,963,012 | -- |
| Industrials | 297,561,951 | 188,299,681 | 109,262,270 | -- |
| Information Technology | 236,620,780 | 99,678,178 | 136,942,602 | -- |
| Materials | 60,706,934 | 23,191,153 | 37,515,781 | -- |
| Real Estate | 45,210,672 | 23,126,006 | 22,084,666 | -- |
| Investment Companies | 60,771,604 | 60,771,604 | -- | -- |
| Money Market Funds | 100,496,675 | 100,496,675 | -- | -- |
| Total Investments in Securities: | $1,341,078,437 | $809,370,947 | $531,707,490 | $-- |
See accompanying notes which are an integral part of the financial statements.
Financial Statements
Statement of Assets and Liabilities
| | | October 31, 2019 |
| Assets | | |
Investment in securities, at value (including securities loaned of $22,605,604) — See accompanying schedule:
Unaffiliated issuers (cost $930,204,299) | $1,240,581,762 | |
| Fidelity Central Funds (cost $100,496,646) | 100,496,675 | |
| Total Investment in Securities (cost $1,030,700,945) | | $1,341,078,437 |
| Foreign currency held at value (cost $10,186) | | 10,188 |
| Receivable for investments sold | | 1,974,531 |
| Receivable for fund shares sold | | 5,812,338 |
| Dividends receivable | | 5,090,296 |
| Distributions receivable from Fidelity Central Funds | | 143,348 |
| Prepaid expenses | | 2,320 |
| Other receivables | | 16,893 |
| Total assets | | 1,354,128,351 |
| Liabilities | | |
| Payable for investments purchased | $2,398,375 | |
| Payable for fund shares redeemed | 942,756 | |
| Accrued management fee | 1,075,279 | |
| Distribution and service plan fees payable | 21,894 | |
| Other affiliated payables | 228,201 | |
| Other payables and accrued expenses | 477,285 | |
| Collateral on securities loaned | 23,637,575 | |
| Total liabilities | | 28,781,365 |
| Net Assets | | $1,325,346,986 |
| Net Assets consist of: | | |
| Paid in capital | | $1,017,257,568 |
| Total accumulated earnings (loss) | | 308,089,418 |
| Net Assets | | $1,325,346,986 |
| Net Asset Value and Maximum Offering Price | | |
| Class A: | | |
| Net Asset Value and redemption price per share ($41,678,792 ÷ 2,191,151 shares)(a) | | $19.02 |
| Maximum offering price per share (100/94.25 of $19.02) | | $20.18 |
| Class M: | | |
| Net Asset Value and redemption price per share ($13,874,688 ÷ 735,946 shares)(a) | | $18.85 |
| Maximum offering price per share (100/96.50 of $18.85) | | $19.53 |
| Class C: | | |
| Net Asset Value and offering price per share ($9,424,163 ÷ 514,601 shares)(a) | | $18.31 |
| International Small Cap Opportunities: | | |
| Net Asset Value, offering price and redemption price per share ($1,040,988,523 ÷ 54,094,864 shares) | | $19.24 |
| Class I: | | |
| Net Asset Value, offering price and redemption price per share ($142,853,703 ÷ 7,431,143 shares) | | $19.22 |
| Class Z: | | |
| Net Asset Value, offering price and redemption price per share ($76,527,117 ÷ 3,985,436 shares) | | $19.20 |
(a) Redemption price per share is equal to net asset value less any applicable contingent deferred sales charge.
See accompanying notes which are an integral part of the financial statements.
Statement of Operations
| | | Year ended October 31, 2019 |
| Investment Income | | |
| Dividends | | $24,909,209 |
| Non-Cash dividends | | 1,883,300 |
| Income from Fidelity Central Funds (including $245,475 from security lending) | | 2,065,418 |
| Income before foreign taxes withheld | | 28,857,927 |
| Less foreign taxes withheld | | (2,275,428) |
| Total income | | 26,582,499 |
| Expenses | | |
| Management fee | | |
| Basic fee | $10,448,629 | |
| Performance adjustment | 1,159,989 | |
| Transfer agent fees | 2,326,363 | |
| Distribution and service plan fees | 284,955 | |
| Accounting and security lending fees | 571,227 | |
| Custodian fees and expenses | 143,909 | |
| Independent trustees' fees and expenses | 7,007 | |
| Registration fees | 133,405 | |
| Audit | 76,156 | |
| Legal | 2,768 | |
| Miscellaneous | 8,589 | |
| Total expenses before reductions | 15,162,997 | |
| Expense reductions | (42,063) | |
| Total expenses after reductions | | 15,120,934 |
| Net investment income (loss) | | 11,461,565 |
| Realized and Unrealized Gain (Loss) | | |
| Net realized gain (loss) on: | | |
| Investment securities: | | |
| Unaffiliated issuers | 352,774 | |
| Fidelity Central Funds | (2,670) | |
| Foreign currency transactions | 71,439 | |
| Total net realized gain (loss) | | 421,543 |
| Change in net unrealized appreciation (depreciation) on: | | |
| Investment securities: | | |
| Unaffiliated issuers (net of increase in deferred foreign taxes of $135,808) | 142,341,973 | |
| Fidelity Central Funds | 29 | |
| Assets and liabilities in foreign currencies | 23,420 | |
| Total change in net unrealized appreciation (depreciation) | | 142,365,422 |
| Net gain (loss) | | 142,786,965 |
| Net increase (decrease) in net assets resulting from operations | | $154,248,530 |
See accompanying notes which are an integral part of the financial statements.
Statement of Changes in Net Assets
| | Year ended October 31, 2019 | Year ended October 31, 2018 |
| Increase (Decrease) in Net Assets | | |
| Operations | | |
| Net investment income (loss) | $11,461,565 | $11,392,924 |
| Net realized gain (loss) | 421,543 | 25,470,687 |
| Change in net unrealized appreciation (depreciation) | 142,365,422 | (105,507,125) |
| Net increase (decrease) in net assets resulting from operations | 154,248,530 | (68,643,514) |
| Distributions to shareholders | (32,407,290) | (23,288,503) |
| Share transactions - net increase (decrease) | 4,567,294 | 138,801,633 |
| Redemption fees | – | 14,959 |
| Total increase (decrease) in net assets | 126,408,534 | 46,884,575 |
| Net Assets | | |
| Beginning of period | 1,198,938,452 | 1,152,053,877 |
| End of period | $1,325,346,986 | $1,198,938,452 |
See accompanying notes which are an integral part of the financial statements.
Financial Highlights
Fidelity International Small Cap Opportunities Fund Class A
| Years ended October 31, | 2019 | 2018 | 2017 | 2016 | 2015 |
| Selected Per–Share Data | | | | | |
| Net asset value, beginning of period | $17.33 | $18.47 | $14.82 | $14.75 | $13.65 |
| Income from Investment Operations | | | | | |
| Net investment income (loss)A | .11 | .12 | .10 | .09 | .06 |
| Net realized and unrealized gain (loss) | 2.01 | (.92) | 3.71 | .10 | 1.11 |
| Total from investment operations | 2.12 | (.80) | 3.81 | .19 | 1.17 |
| Distributions from net investment income | (.11) | (.09) | (.12) | (.05) | (.05) |
| Distributions from net realized gain | (.31) | (.24) | (.04) | (.07) | (.02) |
| Total distributions | (.43)B | (.34)C | (.16) | (.12) | (.07) |
| Redemption fees added to paid in capitalA | – | –D | –D | –D | –D |
| Net asset value, end of period | $19.02 | $17.33 | $18.47 | $14.82 | $14.75 |
| Total ReturnE,F | 12.61% | (4.48)% | 26.00% | 1.30% | 8.62% |
| Ratios to Average Net AssetsG,H | | | | | |
| Expenses before reductions | 1.49% | 1.38% | 1.43% | 1.45% | 1.52% |
| Expenses net of fee waivers, if any | 1.49% | 1.38% | 1.43% | 1.45% | 1.52% |
| Expenses net of all reductions | 1.48% | 1.37% | 1.43% | 1.45% | 1.51% |
| Net investment income (loss) | .64% | .65% | .61% | .62% | .38% |
| Supplemental Data | | | | | |
| Net assets, end of period (000 omitted) | $41,679 | $41,164 | $41,324 | $45,151 | $42,289 |
| Portfolio turnover rateI | 17% | 19% | 11% | 24% | 21% |
A Calculated based on average shares outstanding during the period.
B Total distributions of $.43 per share is comprised of distributions from net investment income of $.113 and distributions from net realized gain of $.313 per share.
C Total distributions of $.34 per share is comprised of distributions from net investment income of $.093 and distributions from net realized gain of $.243 per share.
D Amount represents less than $.005 per share.
E Total returns would have been lower if certain expenses had not been reduced during the applicable periods shown.
F Total returns do not include the effect of the sales charges.
G Fees and expenses of any underlying Fidelity Central Funds are not included in the Fund's expense ratio. The Fund indirectly bears its proportionate share of the expenses of any underlying Fidelity Central Funds.
H Expense ratios reflect operating expenses of the class. Expenses before reductions do not reflect amounts reimbursed by the investment adviser or reductions from brokerage service arrangements or reductions from other expense offset arrangements and do not represent the amount paid by the class during periods when reimbursements or reductions occur. Expenses net of fee waivers reflect expenses after reimbursement by the investment adviser but prior to reductions from brokerage service arrangements or other expense offset arrangements. Expenses net of all reductions represent the net expenses paid by the class.
I Amount does not include the portfolio activity of any underlying Fidelity Central Funds.
See accompanying notes which are an integral part of the financial statements.
Fidelity International Small Cap Opportunities Fund Class M
| Years ended October 31, | 2019 | 2018 | 2017 | 2016 | 2015 |
| Selected Per–Share Data | | | | | |
| Net asset value, beginning of period | $17.17 | $18.32 | $14.68 | $14.62 | $13.53 |
| Income from Investment Operations | | | | | |
| Net investment income (loss)A | .06 | .07 | .05 | .04 | .01 |
| Net realized and unrealized gain (loss) | 1.99 | (.92) | 3.69 | .10 | 1.11 |
| Total from investment operations | 2.05 | (.85) | 3.74 | .14 | 1.12 |
| Distributions from net investment income | (.06) | (.06) | (.06) | (.01) | (.01) |
| Distributions from net realized gain | (.31) | (.24) | (.04) | (.07) | (.02) |
| Total distributions | (.37) | (.30) | (.10) | (.08) | (.03) |
| Redemption fees added to paid in capitalA | – | –B | –B | –B | –B |
| Net asset value, end of period | $18.85 | $17.17 | $18.32 | $14.68 | $14.62 |
| Total ReturnC,D | 12.29% | (4.74)% | 25.63% | .95% | 8.27% |
| Ratios to Average Net AssetsE,F | | | | | |
| Expenses before reductions | 1.77% | 1.67% | 1.73% | 1.77% | 1.80% |
| Expenses net of fee waivers, if any | 1.77% | 1.67% | 1.73% | 1.77% | 1.80% |
| Expenses net of all reductions | 1.77% | 1.66% | 1.73% | 1.77% | 1.80% |
| Net investment income (loss) | .36% | .36% | .31% | .30% | .10% |
| Supplemental Data | | | | | |
| Net assets, end of period (000 omitted) | $13,875 | $13,245 | $14,422 | $12,308 | $13,296 |
| Portfolio turnover rateG | 17% | 19% | 11% | 24% | 21% |
A Calculated based on average shares outstanding during the period.
B Amount represents less than $.005 per share.
C Total returns would have been lower if certain expenses had not been reduced during the applicable periods shown.
D Total returns do not include the effect of the sales charges.
E Fees and expenses of any underlying Fidelity Central Funds are not included in the Fund's expense ratio. The Fund indirectly bears its proportionate share of the expenses of any underlying Fidelity Central Funds.
F Expense ratios reflect operating expenses of the class. Expenses before reductions do not reflect amounts reimbursed by the investment adviser or reductions from brokerage service arrangements or reductions from other expense offset arrangements and do not represent the amount paid by the class during periods when reimbursements or reductions occur. Expenses net of fee waivers reflect expenses after reimbursement by the investment adviser but prior to reductions from brokerage service arrangements or other expense offset arrangements. Expenses net of all reductions represent the net expenses paid by the class.
G Amount does not include the portfolio activity of any underlying Fidelity Central Funds.
See accompanying notes which are an integral part of the financial statements.
Fidelity International Small Cap Opportunities Fund Class C
| Years ended October 31, | 2019 | 2018 | 2017 | 2016 | 2015 |
| Selected Per–Share Data | | | | | |
| Net asset value, beginning of period | $16.69 | $17.84 | $14.27 | $14.26 | $13.23 |
| Income from Investment Operations | | | | | |
| Net investment income (loss)A | (.02) | (.02) | (.03) | (.03) | (.05) |
| Net realized and unrealized gain (loss) | 1.93 | (.89) | 3.60 | .09 | 1.08 |
| Total from investment operations | 1.91 | (.91) | 3.57 | .06 | 1.03 |
| Distributions from net investment income | – | – | – | – | – |
| Distributions from net realized gain | (.29) | (.24) | – | (.05) | – |
| Total distributions | (.29) | (.24) | – | (.05) | – |
| Redemption fees added to paid in capitalA | – | –B | –B | –B | –B |
| Net asset value, end of period | $18.31 | $16.69 | $17.84 | $14.27 | $14.26 |
| Total ReturnC,D | 11.74% | (5.19)% | 25.02% | .44% | 7.79% |
| Ratios to Average Net AssetsE,F | | | | | |
| Expenses before reductions | 2.27% | 2.15% | 2.22% | 2.26% | 2.27% |
| Expenses net of fee waivers, if any | 2.26% | 2.15% | 2.22% | 2.26% | 2.27% |
| Expenses net of all reductions | 2.26% | 2.14% | 2.21% | 2.25% | 2.26% |
| Net investment income (loss) | (.13)% | (.12)% | (.17)% | (.19)% | (.36)% |
| Supplemental Data | | | | | |
| Net assets, end of period (000 omitted) | $9,424 | $14,461 | $14,547 | $12,625 | $17,370 |
| Portfolio turnover rateG | 17% | 19% | 11% | 24% | 21% |
A Calculated based on average shares outstanding during the period.
B Amount represents less than $.005 per share.
C Total returns would have been lower if certain expenses had not been reduced during the applicable periods shown.
D Total returns do not include the effect of the contingent deferred sales charge.
E Fees and expenses of any underlying Fidelity Central Funds are not included in the Fund's expense ratio. The Fund indirectly bears its proportionate share of the expenses of any underlying Fidelity Central Funds.
F Expense ratios reflect operating expenses of the class. Expenses before reductions do not reflect amounts reimbursed by the investment adviser or reductions from brokerage service arrangements or reductions from other expense offset arrangements and do not represent the amount paid by the class during periods when reimbursements or reductions occur. Expenses net of fee waivers reflect expenses after reimbursement by the investment adviser but prior to reductions from brokerage service arrangements or other expense offset arrangements. Expenses net of all reductions represent the net expenses paid by the class.
G Amount does not include the portfolio activity of any underlying Fidelity Central Funds.
See accompanying notes which are an integral part of the financial statements.
Fidelity International Small Cap Opportunities Fund
| Years ended October 31, | 2019 | 2018 | 2017 | 2016 | 2015 |
| Selected Per–Share Data | | | | | |
| Net asset value, beginning of period | $17.53 | $18.69 | $15.00 | $14.91 | $13.80 |
| Income from Investment Operations | | | | | |
| Net investment income (loss)A | .17 | .18 | .15 | .13 | .10 |
| Net realized and unrealized gain (loss) | 2.02 | (.95) | 3.75 | .11 | 1.12 |
| Total from investment operations | 2.19 | (.77) | 3.90 | .24 | 1.22 |
| Distributions from net investment income | (.17) | (.15) | (.17) | (.08) | (.09) |
| Distributions from net realized gain | (.31) | (.24) | (.04) | (.07) | (.02) |
| Total distributions | (.48) | (.39) | (.21) | (.15) | (.11) |
| Redemption fees added to paid in capitalA | – | –B | –B | –B | –B |
| Net asset value, end of period | $19.24 | $17.53 | $18.69 | $15.00 | $14.91 |
| Total ReturnC | 12.97% | (4.25)% | 26.39% | 1.58% | 8.92% |
| Ratios to Average Net AssetsD,E | | | | | |
| Expenses before reductions | 1.19% | 1.10% | 1.13% | 1.17% | 1.23% |
| Expenses net of fee waivers, if any | 1.19% | 1.10% | 1.13% | 1.17% | 1.22% |
| Expenses net of all reductions | 1.19% | 1.09% | 1.13% | 1.16% | 1.22% |
| Net investment income (loss) | .94% | .93% | .91% | .90% | .68% |
| Supplemental Data | | | | | |
| Net assets, end of period (000 omitted) | $1,040,989 | $965,482 | $916,882 | $809,952 | $762,563 |
| Portfolio turnover rateF | 17% | 19% | 11% | 24% | 21% |
A Calculated based on average shares outstanding during the period.
B Amount represents less than $.005 per share.
C Total returns would have been lower if certain expenses had not been reduced during the applicable periods shown.
D Fees and expenses of any underlying Fidelity Central Funds are not included in the Fund's expense ratio. The Fund indirectly bears its proportionate share of the expenses of any underlying Fidelity Central Funds.
E Expense ratios reflect operating expenses of the class. Expenses before reductions do not reflect amounts reimbursed by the investment adviser or reductions from brokerage service arrangements or reductions from other expense offset arrangements and do not represent the amount paid by the class during periods when reimbursements or reductions occur. Expenses net of fee waivers reflect expenses after reimbursement by the investment adviser but prior to reductions from brokerage service arrangements or other expense offset arrangements. Expenses net of all reductions represent the net expenses paid by the class.
F Amount does not include the portfolio activity of any underlying Fidelity Central Funds.
See accompanying notes which are an integral part of the financial statements.
Fidelity International Small Cap Opportunities Fund Class I
| Years ended October 31, | 2019 | 2018 | 2017 | 2016 | 2015 |
| Selected Per–Share Data | | | | | |
| Net asset value, beginning of period | $17.51 | $18.66 | $14.99 | $14.91 | $13.81 |
| Income from Investment Operations | | | | | |
| Net investment income (loss)A | .17 | .18 | .15 | .13 | .10 |
| Net realized and unrealized gain (loss) | 2.02 | (.94) | 3.74 | .10 | 1.13 |
| Total from investment operations | 2.19 | (.76) | 3.89 | .23 | 1.23 |
| Distributions from net investment income | (.16) | (.15) | (.18) | (.08) | (.11) |
| Distributions from net realized gain | (.31) | (.24) | (.04) | (.07) | (.02) |
| Total distributions | (.48)B | (.39) | (.22) | (.15) | (.13) |
| Redemption fees added to paid in capitalA | – | –C | –C | –C | –C |
| Net asset value, end of period | $19.22 | $17.51 | $18.66 | $14.99 | $14.91 |
| Total ReturnD | 12.93% | (4.21)% | 26.34% | 1.56% | 8.98% |
| Ratios to Average Net AssetsE,F | | | | | |
| Expenses before reductions | 1.20% | 1.12% | 1.14% | 1.16% | 1.19% |
| Expenses net of fee waivers, if any | 1.19% | 1.12% | 1.14% | 1.16% | 1.19% |
| Expenses net of all reductions | 1.19% | 1.11% | 1.14% | 1.16% | 1.18% |
| Net investment income (loss) | .93% | .91% | .90% | .91% | .71% |
| Supplemental Data | | | | | |
| Net assets, end of period (000 omitted) | $142,854 | $159,968 | $164,878 | $155,551 | $120,723 |
| Portfolio turnover rateG | 17% | 19% | 11% | 24% | 21% |
A Calculated based on average shares outstanding during the period.
B Total distributions of $.48 per share is comprised of distributions from net investment income of $.162 and distributions from net realized gain of $.313 per share.
C Amount represents less than $.005 per share.
D Total returns would have been lower if certain expenses had not been reduced during the applicable periods shown.
E Fees and expenses of any underlying Fidelity Central Funds are not included in the Fund's expense ratio. The Fund indirectly bears its proportionate share of the expenses of any underlying Fidelity Central Funds.
F Expense ratios reflect operating expenses of the class. Expenses before reductions do not reflect amounts reimbursed by the investment adviser or reductions from brokerage service arrangements or reductions from other expense offset arrangements and do not represent the amount paid by the class during periods when reimbursements or reductions occur. Expenses net of fee waivers reflect expenses after reimbursement by the investment adviser but prior to reductions from brokerage service arrangements or other expense offset arrangements. Expenses net of all reductions represent the net expenses paid by the class.
G Amount does not include the portfolio activity of any underlying Fidelity Central Funds.
See accompanying notes which are an integral part of the financial statements.
Fidelity International Small Cap Opportunities Fund Class Z
| Years ended October 31, | 2019 | 2018 A |
| Selected Per–Share Data | | |
| Net asset value, beginning of period | $17.51 | $19.11 |
| Income from Investment Operations | | |
| Net investment income (loss)B | .19 | –C |
| Net realized and unrealized gain (loss) | 2.02 | (1.60) |
| Total from investment operations | 2.21 | (1.60) |
| Distributions from net investment income | (.20) | – |
| Distributions from net realized gain | (.31) | – |
| Total distributions | (.52)D | – |
| Net asset value, end of period | $19.20 | $17.51 |
| Total ReturnE,F | 13.10% | (8.37)% |
| Ratios to Average Net AssetsG,H | | |
| Expenses before reductions | 1.05% | 1.03%I |
| Expenses net of fee waivers, if any | 1.05% | 1.03%I |
| Expenses net of all reductions | 1.05% | 1.02%I |
| Net investment income (loss) | 1.08% | .16%I |
| Supplemental Data | | |
| Net assets, end of period (000 omitted) | $76,527 | $4,617 |
| Portfolio turnover rateJ | 17% | 19% |
A For the period October 2, 2018 (commencement of sale of shares) to October 31, 2018.
B Calculated based on average shares outstanding during the period.
C Amount represents less than $.005 per share.
D Total distributions of $.52 per share is comprised of distributions from net investment income of $.204 and distributions from net realized gain of $.313 per share.
E Total returns for periods of less than one year are not annualized.
F Total returns would have been lower if certain expenses had not been reduced during the applicable periods shown.
G Fees and expenses of any underlying Fidelity Central Funds are not included in the Fund's expense ratio. The Fund indirectly bears its proportionate share of the expenses of any underlying Fidelity Central Funds.
H Expense ratios reflect operating expenses of the class. Expenses before reductions do not reflect amounts reimbursed by the investment adviser or reductions from brokerage service arrangements or reductions from other expense offset arrangements and do not represent the amount paid by the class during periods when reimbursements or reductions occur. Expense ratios before reductions for start-up periods may not be representative of longer-term operating periods. Expenses net of fee waivers reflect expenses after reimbursement by the investment adviser but prior to reductions from brokerage service arrangements or other expense offset arrangements. Expenses net of all reductions represent the net expenses paid by the class.
I Annualized
J Amount does not include the portfolio activity of any underlying Fidelity Central Funds.
See accompanying notes which are an integral part of the financial statements.
Notes to Financial Statements
For the period ended October 31, 2019
1. Organization.
Fidelity International Small Cap Opportunities Fund (the Fund) is a fund of Fidelity Investment Trust (the Trust) and is authorized to issue an unlimited number of shares. The Trust is registered under the Investment Company Act of 1940, as amended (the 1940 Act), as an open-end management investment company organized as a Massachusetts business trust. The Fund offers Class A, Class M, Class C, International Small Cap Opportunities, Class I and Class Z shares, each of which has equal rights as to assets and voting privileges. Effective after the close of business on May 31, 2019, the Fund was closed to new accounts with certain exceptions. Each class has exclusive voting rights with respect to matters that affect that class. Effective March 1, 2019, Class C shares will automatically convert to Class A shares after a holding period of ten years from the initial date of purchase, with certain exceptions.
2. Investments in Fidelity Central Funds.
The Fund invests in Fidelity Central Funds, which are open-end investment companies generally available only to other investment companies and accounts managed by the investment adviser and its affiliates. The Fund's Schedule of Investments lists each of the Fidelity Central Funds held as of period end, if any, as an investment of the Fund, but does not include the underlying holdings of each Fidelity Central Fund. As an Investing Fund, the Fund indirectly bears its proportionate share of the expenses of the underlying Fidelity Central Funds.
The Money Market Central Funds seek preservation of capital and current income and are managed by Fidelity Investments Money Management, Inc. (FIMM), an affiliate of the investment adviser. Annualized expenses of the Money Market Central Funds as of their most recent shareholder report date ranged from less than .005% to .01%.
A complete unaudited list of holdings for each Fidelity Central Fund is available upon request or at the Securities and Exchange Commission (the SEC) website at www.sec.gov. In addition, the financial statements of the Fidelity Central Funds, which are not covered by the Fund's Report of Independent Registered Public Accounting Firm, are available on the SEC website or upon request.
3. Significant Accounting Policies.
The Fund is an investment company and applies the accounting and reporting guidance of the Financial Accounting Standards Board (FASB) Accounting Standards Codification Topic 946 Financial Services – Investments Companies. The financial statements have been prepared in conformity with accounting principles generally accepted in the United States of America (GAAP), which require management to make certain estimates and assumptions at the date of the financial statements. Actual results could differ from those estimates. Subsequent events, if any, through the date that the financial statements were issued have been evaluated in the preparation of the financial statements. The following summarizes the significant accounting policies of the Fund:
Investment Valuation. Investments are valued as of 4:00 p.m. Eastern time on the last calendar day of the period. The Board of Trustees (the Board) has delegated the day to day responsibility for the valuation of the Fund's investments to the Fair Value Committee (the Committee) established by the Fund's investment adviser. In accordance with valuation policies and procedures approved by the Board, the Fund attempts to obtain prices from one or more third party pricing vendors or brokers to value its investments. When current market prices, quotations or currency exchange rates are not readily available or reliable, investments will be fair valued in good faith by the Committee, in accordance with procedures adopted by the Board. Factors used in determining fair value vary by investment type and may include market or investment specific events. The frequency with which these procedures are used cannot be predicted and they may be utilized to a significant extent. The Committee oversees the Fund's valuation policies and procedures and reports to the Board on the Committee's activities and fair value determinations. The Board monitors the appropriateness of the procedures used in valuing the Fund's investments and ratifies the fair value determinations of the Committee.
The Fund categorizes the inputs to valuation techniques used to value its investments into a disclosure hierarchy consisting of three levels as shown below:
- Level 1 – quoted prices in active markets for identical investments
- Level 2 – other significant observable inputs (including quoted prices for similar investments, interest rates, prepayment speeds, etc.)
- Level 3 – unobservable inputs (including the Fund's own assumptions based on the best information available)
Valuation techniques used to value the Fund's investments by major category are as follows:
Equity securities, including restricted securities, for which market quotations are readily available, are valued at the last reported sale price or official closing price as reported by a third party pricing vendor on the primary market or exchange on which they are traded and are categorized as Level 1 in the hierarchy. In the event there were no sales during the day or closing prices are not available, securities are valued at the last quoted bid price or may be valued using the last available price and are generally categorized as Level 2 in the hierarchy. For foreign equity securities, when market or security specific events arise, comparisons to the valuation of American Depositary Receipts (ADRs), futures contracts, Exchange-Traded Funds (ETFs) and certain indexes as well as quoted prices for similar securities may be used and would be categorized as Level 2 in the hierarchy. For equity securities, including restricted securities, where observable inputs are limited, assumptions about market activity and risk are used and these securities may be categorized as Level 3 in the hierarchy.
ETFs are valued at their last sale price or official closing price as reported by a third party pricing vendor on the primary market or exchange on which they are traded and are categorized as Level 1 in the hierarchy. In the event there were no sales during the day but the exchange reports a closing bid level, ETFs are valued at the closing bid and would be categorized as Level 1 in the hierarchy. In the event there was no closing bid, ETFs may be valued by another method that the Board believes reflects fair value in accordance with the Board's fair value pricing policies and may be categorized as Level 2 in the hierarchy.
Investments in open-end mutual funds, including the Fidelity Central Funds, are valued at their closing net asset value (NAV) each business day and are categorized as Level 1 in the hierarchy.
Changes in valuation techniques may result in transfers in or out of an assigned level within the disclosure hierarchy. The aggregate value of investments by input level as of October 31, 2019 is included at the end of the Fund's Schedule of Investments.
Foreign Currency. The Fund may use foreign currency contracts to facilitate transactions in foreign-denominated securities. Gains and losses from these transactions may arise from changes in the value of the foreign currency or if the counterparties do not perform under the contracts' terms.
Foreign-denominated assets, including investment securities, and liabilities are translated into U.S. dollars at the exchange rates at period end. Purchases and sales of investment securities, income and dividends received and expenses denominated in foreign currencies are translated into U.S. dollars at the exchange rate in effect on the transaction date.
The effects of exchange rate fluctuations on investments are included with the net realized and unrealized gain (loss) on investment securities. Other foreign currency transactions resulting in realized and unrealized gain (loss) are disclosed separately.
Investment Transactions and Income. For financial reporting purposes, the Fund's investment holdings and NAV include trades executed through the end of the last business day of the period. The NAV per share for processing shareholder transactions is calculated as of the close of business of the New York Stock Exchange (NYSE), normally 4:00 p.m. Eastern time and includes trades executed through the end of the prior business day. Gains and losses on securities sold are determined on the basis of identified cost. Dividend income is recorded on the ex-dividend date, except for certain dividends from foreign securities where the ex-dividend date may have passed, which are recorded as soon as the Fund is informed of the ex-dividend date. Non-cash dividends included in dividend income, if any, are recorded at the fair market value of the securities received. Income and capital gain distributions from Fidelity Central Funds, if any, are recorded on the ex-dividend date. Certain distributions received by the Fund represent a return of capital or capital gain. The Fund determines the components of these distributions subsequent to the ex-dividend date, based upon receipt of tax filings or other correspondence relating to the underlying investment. These distributions are recorded as a reduction of cost of investments and/or as a realized gain. Investment income is recorded net of foreign taxes withheld where recovery of such taxes is uncertain.
Class Allocations and Expenses. Investment income, realized and unrealized capital gains and losses, common expenses of the Fund, and certain fund-level expense reductions, if any, are allocated daily on a pro-rata basis to each class based on the relative net assets of each class to the total net assets of the Fund. Each class differs with respect to transfer agent and distribution and service plan fees incurred. Certain expense reductions may also differ by class. For the reporting period, the allocated portion of income and expenses to each class as a percent of its average net assets may vary due to the timing of recording these transactions in relation to fluctuating net assets of the classes. Expenses directly attributable to a fund are charged to that fund. Expenses attributable to more than one fund are allocated among the respective funds on the basis of relative net assets or other appropriate methods. Expense estimates are accrued in the period to which they relate and adjustments are made when actual amounts are known.
Income Tax Information and Distributions to Shareholders. Each year, the Fund intends to qualify as a regulated investment company under Subchapter M of the Internal Revenue Code, including distributing substantially all of its taxable income and realized gains. As a result, no provision for U.S. Federal income taxes is required. As of October 31, 2019, the Fund did not have any unrecognized tax benefits in the financial statements; nor is the Fund aware of any tax positions for which it is reasonably possible that the total amounts of unrecognized tax benefits will significantly change in the next twelve months. The Fund files a U.S. federal tax return, in addition to state and local tax returns as required. The Fund's federal income tax returns are subject to examination by the Internal Revenue Service (IRS) for a period of three fiscal years after they are filed. State and local tax returns may be subject to examination for an additional fiscal year depending on the jurisdiction. Foreign taxes are provided for based on the Fund's understanding of the tax rules and rates that exist in the foreign markets in which it invests. The Fund is subject to a tax imposed on capital gains by certain countries in which it invests. An estimated deferred tax liability for net unrealized appreciation on the applicable securities is included in Other payables and accrued expenses on the Statement of Assets & Liabilities.
Distributions are declared and recorded on the ex-dividend date. Income and capital gain distributions are declared separately for each class. Income and capital gain distributions are determined in accordance with income tax regulations, which may differ from GAAP.
Capital accounts within the financial statements are adjusted for permanent book-tax differences. These adjustments have no impact on net assets or the results of operations. Capital accounts are not adjusted for temporary book-tax differences which will reverse in a subsequent period.
Book-tax differences are primarily due to foreign currency transactions, passive foreign investments companies (PFIC), capital loss carryforwards, and losses deferred due to wash sales.
As of period end, the cost and unrealized appreciation (depreciation) in securities, and derivatives if applicable, for federal income tax purposes were as follows:
| Gross unrealized appreciation | $374,943,045 |
| Gross unrealized depreciation | (77,467,568) |
| Net unrealized appreciation (depreciation) | $297,475,477 |
| Tax Cost | $1,043,602,960 |
The tax-based components of distributable earnings as of period end were as follows:
| Undistributed ordinary income | $14,575,432 |
| Capital loss carryforward | $(3,597,906) |
| Net unrealized appreciation (depreciation) on securities and other investments | $297,453,132 |
Capital loss carryforwards are only available to offset future capital gains of the Fund to the extent provided by regulations and may be limited. Under the Regulated Investment Company Modernization Act of 2010 (the Act), the Fund is permitted to carry forward capital losses incurred in taxable years beginning after December 22, 2010 for an unlimited period and such capital losses are required to be used prior to any losses that expire. The capital loss carryforward information presented below, including any applicable limitation, is estimated as of fiscal period end and is subject to adjustment.
| No expiration | |
| Short-term | $(3,597,906) |
| Total no expiration | $(3,597,906) |
The tax character of distributions paid was as follows:
| | October 31, 2019 | October 31, 2018 |
| Ordinary Income | $12,482,676 | $ 23,288,503 |
| Long-term Capital Gains | 19,924,614 | – |
| Total | $32,407,290 | $ 23,288,503 |
Restricted Securities. The Fund may invest in securities that are subject to legal or contractual restrictions on resale. These securities generally may be resold in transactions exempt from registration or to the public if the securities are registered. Disposal of these securities may involve time-consuming negotiations and expense, and prompt sale at an acceptable price may be difficult. Information regarding restricted securities is included at the end of the Fund's Schedule of Investments.
4. Purchases and Sales of Investments.
Purchases and sales of securities, other than short-term securities, aggregated $203,469,765 and $215,243,475, respectively.
5. Fees and Other Transactions with Affiliates.
Management Fee. Fidelity Management & Research Company (the investment adviser) and its affiliates provide the Fund with investment management related services for which the Fund pays a monthly management fee. The management fee is the sum of an individual fund fee rate that is based on an annual rate of .60% of the Fund's average net assets and an annualized group fee rate that averaged .24% during the period. The group fee rate is based upon the average net assets of all the mutual funds advised by the investment adviser, including any mutual funds previously advised by the investment adviser that are currently advised by Fidelity SelectCo, LLC, an affiliate of the investment adviser. The group fee rate decreases as assets under management increase and increases as assets under management decrease. In addition, the management fee is subject to a performance adjustment (up to a maximum of +/-.20% of the Fund's average net assets over a 36 month performance period). The upward or downward adjustment to the management fee is based on the relative investment performance of International Small Cap Opportunities as compared to its benchmark index, the MSCI EAFE Small Cap Index, over the same 36 month performance period. For the reporting period, the total annual management fee rate, including the performance adjustment, was .93% of the Fund's average net assets. The performance adjustment included in the management fee rate may be higher or lower than the maximum performance adjustment rate due to the difference between the average net assets for the reporting and performance periods.
Distribution and Service Plan Fees. In accordance with Rule 12b-1 of the 1940 Act, the Fund has adopted separate Distribution and Service Plans for each class of shares. Certain classes pay Fidelity Distributors Corporation (FDC), an affiliate of the investment adviser, separate Distribution and Service Fees, each of which is based on an annual percentage of each class' average net assets. In addition, FDC may pay financial intermediaries for selling shares of the Fund and providing shareholder support services. For the period, the Distribution and Service Fee rates, total fees and amounts retained by FDC were as follows:
| | Distribution Fee | Service Fee | Total Fees | Retained by FDC |
| Class A | -% | .25% | $103,524 | $2,077 |
| Class M | .25% | .25% | 66,462 | 351 |
| Class C | .75% | .25% | 114,969 | 10,536 |
| | | | $284,955 | $12,964 |
Sales Load. FDC may receive a front-end sales charge of up to 5.75% for selling Class A shares and 3.50% for selling Class M shares, some of which is paid to financial intermediaries for selling shares of the Fund. Depending on the holding period, FDC may receive contingent deferred sales charges levied on Class A, Class M and Class C redemptions. The deferred sales charges are 1.00% for Class C shares, 1.00% for certain purchases of Class A shares and .25% for certain purchases of Class M shares.
For the period, sales charge amounts retained by FDC were as follows:
| | Retained by FDC |
| Class A | $3,452 |
| Class M | 1,659 |
| | $5,111 |
Transfer Agent Fees. Fidelity Investments Institutional Operations Company, Inc., (FIIOC), an affiliate of the investment adviser, is the transfer, dividend disbursing and shareholder servicing agent for each class of the Fund. FIIOC receives account fees and asset-based fees that vary according to the account size and type of account of the shareholders of the respective classes of the Fund, except for Class Z. FIIOC receives an asset-based fee of Class Z's average net assets. FIIOC pays for typesetting, printing and mailing of shareholder reports, except proxy statements.
For the period, transfer agent fees for each class were as follows:
| | Amount | % of Class-Level Average Net Assets |
| Class A | $96,872 | .23 |
| Class M | 35,630 | .27 |
| Class C | 29,258 | .26 |
| International Small Cap Opportunities | 1,830,889 | .19 |
| Class I | 318,169 | .19 |
| Class Z | 15,545 | .04 |
| | $2,326,363 | |
Accounting and Security Lending Fees. Fidelity Service Company, Inc. (FSC), an affiliate of the investment adviser, maintains the Fund's accounting records. The accounting fee is based on the level of average net assets for each month. Prior to April 1, 2019, FSC had a separate agreement with the Fund for administration of the security lending program, based on the number and duration of lending transactions. For the period, the total fees paid for accounting and administration of securities lending were equivalent to an annual rate of .05%.
Brokerage Commissions. The Fund placed a portion of its portfolio transactions with brokerage firms which are affiliates of the investment adviser. Brokerage commissions are included in net realized gain (loss) and change in net unrealized appreciation (depreciation) in the Statement of Operations. The commissions paid to these affiliated firms were $559 for the period.
Interfund Trades. The Fund may purchase from or sell securities to other Fidelity Funds under procedures adopted by the Board. The procedures have been designed to ensure these interfund trades are executed in accordance with Rule 17a-7 of the 1940 Act. Interfund trades are included within the respective purchases and sales amounts shown in the Purchases and Sales of Investments note.
6. Committed Line of Credit.
The Fund participates with other funds managed by the investment adviser or an affiliate in a $4.25 billion credit facility (the "line of credit") to be utilized for temporary or emergency purposes to fund shareholder redemptions or for other short-term liquidity purposes. The Fund has agreed to pay commitment fees on its pro-rata portion of the line of credit, which amounted to $3,293 and is reflected in Miscellaneous expenses on the Statement of Operations. During the period, the Fund did not borrow on this line of credit.
7. Security Lending.
The Fund lends portfolio securities from time to time in order to earn additional income. For equity securities, lending agents are used, including National Financial Services (NFS), an affiliate of the Fund. Pursuant to a securities lending agreement, NFS will receive a fee, which is capped at 9.9% of daily lending revenue, for its services as lending agent. The Fund may lend securities to certain qualified borrowers, including NFS. On the settlement date of the loan, the Fund receives collateral (in the form of U.S. Treasury obligations, letters of credit and/or cash) against the loaned securities and maintains collateral in an amount not less than 100% of the market value of the loaned securities during the period of the loan. The market value of the loaned securities is determined at the close of business of the Fund and any additional required collateral is delivered to the Fund on the next business day. The Fund or borrower may terminate the loan at any time, and if the borrower defaults on its obligation to return the securities loaned because of insolvency or other reasons, the Fund may apply collateral received from the borrower against the obligation. The Fund may experience delays and costs in recovering the securities loaned. Any cash collateral received is invested in the Fidelity Securities Lending Cash Central Fund. The value of loaned securities and cash collateral at period end are disclosed on the Fund's Statement of Assets and Liabilities. At period end, there were no security loans outstanding with NFS, as affiliated borrower. Total fees paid by the Fund to NFS, as lending agent, amounted to $137. Security lending income represents the income earned on investing cash collateral, less rebates paid to borrowers and any lending agent fees associated with the loan, plus any premium payments received for lending certain types of securities. Security lending income is presented in the Statement of Operations as a component of income from Fidelity Central Funds. During the period, there were no securities loaned to NFS.
8. Expense Reductions.
Commissions paid to certain brokers with whom the investment adviser, or its affiliates, places trades on behalf of the Fund include an amount in addition to trade execution, which may be rebated back to the Fund to offset certain expenses. This amount totaled $16,953 for the period. Through arrangements with the Fund's custodian, credits realized as a result of certain uninvested cash balances were used to reduce the Fund's expenses. During the period, custodian credits reduced the Fund's expenses by $83.
In addition, during the period the investment adviser reimbursed and/or waived a portion of fund-level operating expenses in the amount of $9,027 and a portion of class-level operating expenses as follows:
| | Amount |
| Class A | $506 |
| Class M | 167 |
| Class C | 180 |
| International Small Cap Opportunities | 12,450 |
| Class I | 2,374 |
| Class Z | 323 |
| | $16,000 |
9. Distributions to Shareholders.
Distributions to shareholders of each class were as follows:
| | Year ended
October 31, 2019 | Year ended
October 31, 2018 |
| Distributions to shareholders | | |
| Class A | $994,541 | $756,833 |
| Class M | 282,415 | 237,606 |
| Class C | 249,469 | 199,761 |
| International Small Cap Opportunities | 26,356,595 | 18,505,353 |
| Class I | 4,287,454 | 3,588,950 |
| Class Z | 236,816 | – |
| Total | $32,407,290 | $23,288,503 |
10. Share Transactions.
Share transactions for each class were as follows and may contain automatic conversions between classes or exchanges between affiliated funds:
| | Shares | Shares | Dollars | Dollars |
| | Year ended October 31, 2019 | Year ended October 31, 2018(a) | Year ended October 31, 2019 | Year ended October 31, 2018(a) |
| Class A | | | | |
| Shares sold | 423,049 | 659,827 | $7,405,618 | $12,815,405 |
| Reinvestment of distributions | 59,448 | 39,412 | 971,383 | 734,649 |
| Shares redeemed | (667,182) | (560,866) | (11,683,968) | (10,795,406) |
| Net increase (decrease) | (184,685) | 138,373 | $(3,306,967) | $2,754,648 |
| Class M | | | | |
| Shares sold | 79,729 | 195,023 | $1,409,014 | $3,737,868 |
| Reinvestment of distributions | 17,248 | 12,748 | 280,108 | 235,975 |
| Shares redeemed | (132,596) | (223,377) | (2,312,809) | (4,246,469) |
| Net increase (decrease) | (35,619) | (15,606) | $(623,687) | $(272,626) |
| Class C | | | | |
| Shares sold | 52,441 | 289,466 | $867,877 | $5,517,711 |
| Reinvestment of distributions | 15,575 | 10,900 | 246,701 | 196,970 |
| Shares redeemed | (420,073) | (248,989) | (7,170,818) | (4,607,733) |
| Net increase (decrease) | (352,057) | 51,377 | $(6,056,240) | $1,106,948 |
| International Small Cap Opportunities | | | | |
| Shares sold | 9,303,310 | 18,665,452 | $164,068,281 | $367,097,669 |
| Reinvestment of distributions | 1,247,133 | 814,355 | 20,565,227 | 15,335,912 |
| Shares redeemed | (11,525,534) | (13,474,898) | (203,368,630) | (259,980,891) |
| Net increase (decrease) | (975,091) | 6,004,909 | $(18,735,122) | $122,452,690 |
| Class I | | | | |
| Shares sold | 4,794,543 | 5,599,350 | $83,925,837 | $109,721,452 |
| Reinvestment of distributions | 211,847 | 153,156 | 3,489,125 | 2,881,165 |
| Shares redeemed | (6,712,845) | (5,449,347) | (120,051,412) | (104,456,236) |
| Net increase (decrease) | (1,706,455) | 303,159 | $(32,636,450) | $8,146,381 |
| Class Z | | | | |
| Shares sold | 4,282,903 | 265,126 | $75,981,672 | $4,637,404 |
| Reinvestment of distributions | 12,712 | – | 208,865 | – |
| Shares redeemed | (573,920) | (1,385) | (10,264,777) | (23,812) |
| Net increase (decrease) | 3,721,695 | 263,741 | $65,925,760 | $4,613,592 |
(a) Share transactions for Class Z are for the period October 2, 2018 (commencement of sale of shares) to October 31, 2018
11. Other.
The Fund's organizational documents provide former and current trustees and officers with a limited indemnification against liabilities arising in connection with the performance of their duties to the Fund. In the normal course of business, the Fund may also enter into contracts that provide general indemnifications. The Fund's maximum exposure under these arrangements is unknown as this would be dependent on future claims that may be made against the Fund. The risk of material loss from such claims is considered remote.
Report of Independent Registered Public Accounting Firm
To the Trustees of Fidelity Investment Trust and Shareholders of Fidelity International Small Cap Opportunities Fund:
Opinion on the Financial Statements and Financial Highlights
We have audited the accompanying statement of assets and liabilities of Fidelity International Small Cap Opportunities Fund (the "Fund"), a fund of Fidelity Investment Trust, including the schedule of investments, as of October 31, 2019, the related statement of operations for the year then ended, the statement of changes in net assets for each of the two years in the period then ended, the financial highlights for each of the five years in the period then ended, and the related notes. In our opinion, the financial statements and financial highlights present fairly, in all material respects, the financial position of the Fund as of October 31, 2019, and the results of its operations for the year then ended, the changes in its net assets for each of the two years in the period then ended, and the financial highlights for each of the five years in the period then ended in conformity with accounting principles generally accepted in the United States of America.
Basis for Opinion
These financial statements and financial highlights are the responsibility of the Fund's management. Our responsibility is to express an opinion on the Fund's financial statements and financial highlights based on our audits. We are a public accounting firm registered with the Public Company Accounting Oversight Board (United States) (PCAOB) and are required to be independent with respect to the Fund in accordance with the U.S. federal securities laws and the applicable rules and regulations of the Securities and Exchange Commission and the PCAOB.
We conducted our audits in accordance with the standards of the PCAOB. Those standards require that we plan and perform the audit to obtain reasonable assurance about whether the financial statements and financial highlights are free of material misstatement, whether due to error or fraud. The Fund is not required to have, nor were we engaged to perform, an audit of its internal control over financial reporting. As part of our audits we are required to obtain an understanding of internal control over financial reporting but not for the purpose of expressing an opinion on the effectiveness of the Fund’s internal control over financial reporting. Accordingly, we express no such opinion.
Our audits included performing procedures to assess the risks of material misstatement of the financial statements and financial highlights, whether due to error or fraud, and performing procedures that respond to those risks. Such procedures included examining, on a test basis, evidence regarding the amounts and disclosures in the financial statements and financial highlights. Our audits also included evaluating the accounting principles used and significant estimates made by management, as well as evaluating the overall presentation of the financial statements and financial highlights. Our procedures included confirmation of securities owned as of October 31, 2019, by correspondence with the custodians and brokers; when replies were not received from brokers, we performed other auditing procedures. We believe that our audits provide a reasonable basis for our opinion.
/s/ Deloitte & Touche LLP
Boston, Massachusetts
December 11, 2019
We have served as the auditor of one or more of the Fidelity investment companies since 1999.
Trustees and Officers
The Trustees, Members of the Advisory Board (if any), and officers of the trust and fund, as applicable, are listed below. The Board of Trustees governs the fund and is responsible for protecting the interests of shareholders. The Trustees are experienced executives who meet periodically throughout the year to oversee the fund's activities, review contractual arrangements with companies that provide services to the fund, oversee management of the risks associated with such activities and contractual arrangements, and review the fund's performance. Except for Jonathan Chiel, each of the Trustees oversees 298 funds. Mr. Chiel oversees 171 funds.
The Trustees hold office without limit in time except that (a) any Trustee may resign; (b) any Trustee may be removed by written instrument, signed by at least two-thirds of the number of Trustees prior to such removal; (c) any Trustee who requests to be retired or who has become incapacitated by illness or injury may be retired by written instrument signed by a majority of the other Trustees; and (d) any Trustee may be removed at any special meeting of shareholders by a two-thirds vote of the outstanding voting securities of the trust. Each Trustee who is not an interested person (as defined in the 1940 Act) of the trust and the fund is referred to herein as an Independent Trustee. Each Independent Trustee shall retire not later than the last day of the calendar year in which his or her 75th birthday occurs. The Independent Trustees may waive this mandatory retirement age policy with respect to individual Trustees. Officers and Advisory Board Members hold office without limit in time, except that any officer or Advisory Board Member may resign or may be removed by a vote of a majority of the Trustees at any regular meeting or any special meeting of the Trustees. Except as indicated, each individual has held the office shown or other offices in the same company for the past five years.
The fund's Statement of Additional Information (SAI) includes more information about the Trustees. To request a free copy, call Fidelity at 1-800-544-8544 if you’re an individual investing directly with Fidelity, call 1-800-835-5092 if you’re a plan sponsor or participant with Fidelity as your recordkeeper or call 1-877-208-0098 on institutional accounts or if you’re an advisor or invest through one.
Experience, Skills, Attributes, and Qualifications of the Trustees. The Governance and Nominating Committee has adopted a statement of policy that describes the experience, qualifications, attributes, and skills that are necessary and desirable for potential Independent Trustee candidates (Statement of Policy). The Board believes that each Trustee satisfied at the time he or she was initially elected or appointed a Trustee, and continues to satisfy, the standards contemplated by the Statement of Policy. The Governance and Nominating Committee also engages professional search firms to help identify potential Independent Trustee candidates who have the experience, qualifications, attributes, and skills consistent with the Statement of Policy. From time to time, additional criteria based on the composition and skills of the current Independent Trustees, as well as experience or skills that may be appropriate in light of future changes to board composition, business conditions, and regulatory or other developments, have also been considered by the professional search firms and the Governance and Nominating Committee. In addition, the Board takes into account the Trustees' commitment and participation in Board and committee meetings, as well as their leadership of standing and ad hoc committees throughout their tenure.
In determining that a particular Trustee was and continues to be qualified to serve as a Trustee, the Board has considered a variety of criteria, none of which, in isolation, was controlling. The Board believes that, collectively, the Trustees have balanced and diverse experience, qualifications, attributes, and skills, which allow the Board to operate effectively in governing the fund and protecting the interests of shareholders. Information about the specific experience, skills, attributes, and qualifications of each Trustee, which in each case led to the Board's conclusion that the Trustee should serve (or continue to serve) as a trustee of the fund, is provided below.
Board Structure and Oversight Function. James C. Curvey is an interested person and currently serves as Chairman. The Trustees have determined that an interested Chairman is appropriate and benefits shareholders because an interested Chairman has a personal and professional stake in the quality and continuity of services provided to the fund. Independent Trustees exercise their informed business judgment to appoint an individual of their choosing to serve as Chairman, regardless of whether the Trustee happens to be independent or a member of management. The Independent Trustees have determined that they can act independently and effectively without having an Independent Trustee serve as Chairman and that a key structural component for assuring that they are in a position to do so is for the Independent Trustees to constitute a substantial majority for the Board. The Independent Trustees also regularly meet in executive session. Ned C. Lautenbach serves as Chairman of the Independent Trustees and as such (i) acts as a liaison between the Independent Trustees and management with respect to matters important to the Independent Trustees and (ii) with management prepares agendas for Board meetings.
Fidelity® funds are overseen by different Boards of Trustees. The fund's Board oversees Fidelity's high income and certain equity funds, and other Boards oversee Fidelity's investment-grade bond, money market, asset allocation, and other equity funds. The asset allocation funds may invest in Fidelity® funds overseen by the fund's Board. The use of separate Boards, each with its own committee structure, allows the Trustees of each group of Fidelity® funds to focus on the unique issues of the funds they oversee, including common research, investment, and operational issues. On occasion, the separate Boards establish joint committees to address issues of overlapping consequences for the Fidelity® funds overseen by each Board.
The Trustees operate using a system of committees to facilitate the timely and efficient consideration of all matters of importance to the Trustees, the fund, and fund shareholders and to facilitate compliance with legal and regulatory requirements and oversight of the fund's activities and associated risks. The Board, acting through its committees, has charged FMR and its affiliates with (i) identifying events or circumstances the occurrence of which could have demonstrably adverse effects on the fund's business and/or reputation; (ii) implementing processes and controls to lessen the possibility that such events or circumstances occur or to mitigate the effects of such events or circumstances if they do occur; and (iii) creating and maintaining a system designed to evaluate continuously business and market conditions in order to facilitate the identification and implementation processes described in (i) and (ii) above. Because the day-to-day operations and activities of the fund are carried out by or through FMR, its affiliates, and other service providers, the fund's exposure to risks is mitigated but not eliminated by the processes overseen by the Trustees. While each of the Board's committees has responsibility for overseeing different aspects of the fund's activities, oversight is exercised primarily through the Operations, Audit, and Compliance Committees. Appropriate personnel, including but not limited to the fund's Chief Compliance Officer (CCO), FMR's internal auditor, the independent accountants, the fund's Treasurer and portfolio management personnel, make periodic reports to the Board's committees, as appropriate, including an annual review of Fidelity's risk management program for the Fidelity® funds. The responsibilities of each standing committee, including their oversight responsibilities, are described further under "Standing Committees of the Trustees."
Interested Trustees*:
Correspondence intended for a Trustee who is an interested person may be sent to Fidelity Investments, 245 Summer Street, Boston, Massachusetts 02210.
Name, Year of Birth; Principal Occupations and Other Relevant Experience+
Jonathan Chiel (1957)
Year of Election or Appointment: 2016
Trustee
Mr. Chiel also serves as Trustee of other Fidelity® funds. Mr. Chiel is Executive Vice President and General Counsel for FMR LLC (diversified financial services company, 2012-present). Previously, Mr. Chiel served as general counsel (2004-2012) and senior vice president and deputy general counsel (2000-2004) for John Hancock Financial Services; a partner with Choate, Hall & Stewart (1996-2000) (law firm); and an Assistant United States Attorney for the United States Attorney’s Office of the District of Massachusetts (1986-95), including Chief of the Criminal Division (1993-1995). Mr. Chiel is a director on the boards of the Boston Bar Foundation and the Maimonides School.
James C. Curvey (1935)
Year of Election or Appointment: 2007
Trustee
Chairman of the Board of Trustees
Mr. Curvey also serves as Trustee of other Fidelity® funds. Mr. Curvey is Vice Chairman (2007-present) and Director of FMR LLC (diversified financial services company). In addition, Mr. Curvey is an Overseer Emeritus for the Boston Symphony Orchestra, a Director of Artis-Naples, and a Trustee of Brewster Academy in Wolfeboro, New Hampshire. Previously, Mr. Curvey served as a Director of Fidelity Research & Analysis Co. (investment adviser firm, 2009-2018), Director of Fidelity Investments Money Management, Inc. (investment adviser firm, 2009-2014) and a Director of FMR and FMR Co., Inc. (investment adviser firms, 2007-2014).
* Determined to be an “Interested Trustee” by virtue of, among other things, his or her affiliation with the trust or various entities under common control with FMR.
+ The information includes the Trustee's principal occupation during the last five years and other information relating to the experience, attributes, and skills relevant to the Trustee's qualifications to serve as a Trustee, which led to the conclusion that the Trustee should serve as a Trustee for the fund.
Independent Trustees:
Correspondence intended for an Independent Trustee may be sent to Fidelity Investments, P.O. Box 55235, Boston, Massachusetts 02205-5235.
Name, Year of Birth; Principal Occupations and Other Relevant Experience+
Dennis J. Dirks (1948)
Year of Election or Appointment: 2005
Trustee
Mr. Dirks also serves as Trustee of other Fidelity® funds. Prior to his retirement in May 2003, Mr. Dirks was Chief Operating Officer and a member of the Board of The Depository Trust & Clearing Corporation (DTCC). He also served as President, Chief Operating Officer, and Board member of The Depository Trust Company (DTC) and President and Board member of the National Securities Clearing Corporation (NSCC). In addition, Mr. Dirks served as Chief Executive Officer and Board member of the Government Securities Clearing Corporation, Chief Executive Officer and Board member of the Mortgage-Backed Securities Clearing Corporation, as a Trustee and a member of the Finance Committee of Manhattan College (2005-2008), as a Trustee and a member of the Finance Committee of AHRC of Nassau County (2006-2008), as a member of the Independent Directors Council (IDC) Governing Council (2010-2015), and as a member of the Board of Directors for The Brookville Center for Children’s Services, Inc. (2009-2017). Mr. Dirks is a member of the Finance Committee (2016-present) and Board of Directors (2017-present) and is Treasurer (2018-present) of the Asolo Repertory Theatre.
Donald F. Donahue (1950)
Year of Election or Appointment: 2018
Trustee
Mr. Donahue also serves as a Trustee of other Fidelity® funds. Mr. Donahue is President and Chief Executive Officer of Miranda Partners, LLC (risk consulting for the financial services industry, 2012-present). Previously, Mr. Donahue served as a Member of the Advisory Board of certain Fidelity® funds (2015-2018) and Chief Executive Officer (2006-2012), Chief Operating Officer (2003-2006), and Managing Director, Customer Marketing and Development (1999-2003) of The Depository Trust & Clearing Corporation (financial markets infrastructure). Mr. Donahue serves as a Member (2007-present) and Co-Chairman (2016-present) of the Board of Directors of United Way of New York, Member of the Board of Directors of NYC Leadership Academy (2012-present) and Member of the Board of Advisors of Ripple Labs, Inc. (financial services, 2015-present). He also served as Chairman (2010-2012) and Member of the Board of Directors (2012-2013) of Omgeo, LLC (financial services), Treasurer of United Way of New York (2012-2016), and Member of the Board of Directors of XBRL US (financial services non-profit, 2009-2012) and the International Securities Services Association (2009-2012).
Alan J. Lacy (1953)
Year of Election or Appointment: 2008
Trustee
Mr. Lacy also serves as Trustee of other Fidelity® funds. Mr. Lacy serves as a Director of Bristol-Myers Squibb Company (global pharmaceuticals, 2008-present). He is a Trustee of the California Chapter of The Nature Conservancy (2015-present) and a Director of the Center for Advanced Study in the Behavioral Sciences at Stanford University (2015-present). In addition, Mr. Lacy served as Senior Adviser (2007-2014) of Oak Hill Capital Partners, L.P. (private equity) and also served as Chief Executive Officer (2005) and Vice Chairman (2005-2006) of Sears Holdings Corporation (retail) and Chief Executive Officer and Chairman of the Board of Sears, Roebuck and Co. (retail, 2000-2005). Previously, Mr. Lacy served as Chairman (2014-2017) and a member (2010-2017) of the Board of Directors of Dave & Buster’s Entertainment, Inc. (restaurant and entertainment complexes), as Chairman (2008-2011) and a member (2006-2015) of the Board of Trustees of the National Parks Conservation Association, and as a member of the Board of Directors for The Hillman Companies, Inc. (hardware wholesalers, 2010-2014), Earth Fare, Inc. (retail grocery, 2010-2014), and The Western Union Company (global money transfer, 2006-2011).
Ned C. Lautenbach (1944)
Year of Election or Appointment: 2000
Trustee
Chairman of the Independent Trustees
Mr. Lautenbach also serves as Trustee of other Fidelity® funds. Mr. Lautenbach currently serves as Chair (2018-present) and Member (2013-present) of the Board of Governors, State University System of Florida and is a member of the Council on Foreign Relations (1994-present). He is also a member and has most recently served as Chairman of the Board of Directors of Artis-Naples (2012-present). Previously, Mr. Lautenbach served as a member and then Lead Director of the Board of Directors of Eaton Corporation (diversified industrial, 1997-2016). He was also a Partner and Advisory Partner at Clayton, Dubilier & Rice, LLC (private equity investment, 1998-2010), as well as a Director of Sony Corporation (2006-2007). In addition, Mr. Lautenbach also had a 30-year career with IBM (technology company) during which time he served as Senior Vice President and a member of the Corporate Executive Committee (1968-1998).
Joseph Mauriello (1944)
Year of Election or Appointment: 2008
Trustee
Mr. Mauriello also serves as Trustee of other Fidelity® funds. Prior to his retirement in January 2006, Mr. Mauriello served in numerous senior management positions including Deputy Chairman and Chief Operating Officer (2004-2005), and Vice Chairman of Financial Services (2002-2004) of KPMG LLP US (professional services, 1965-2005). Mr. Mauriello currently serves as a member of the Independent Directors Council (IDC) Governing Council (2015-present). Previously, Mr. Mauriello served as a member of the Board of Directors of XL Group plc. (global insurance and re-insurance, 2006-2018).
Cornelia M. Small (1944)
Year of Election or Appointment: 2005
Trustee
Ms. Small also serves as Trustee of other Fidelity® funds. Ms. Small is a member of the Board of Directors (2009-present) and Chair of the Investment Committee (2010-present) of the Teagle Foundation. Ms. Small also serves on the Investment Committee of the Berkshire Taconic Community Foundation (2008-present). Previously, Ms. Small served as Chairperson (2002-2008) and a member of the Investment Committee and Chairperson (2008-2012) and a member of the Board of Trustees of Smith College. In addition, Ms. Small served as Chief Investment Officer, Director of Global Equity Investments, and a member of the Board of Directors of Scudder, Stevens & Clark and Scudder Kemper Investments.
Garnett A. Smith (1947)
Year of Election or Appointment: 2018
Trustee
Mr. Smith also serves as Trustee of other Fidelity® funds. Prior to Mr. Smith's retirement, he served as Chairman and Chief Executive Officer of Inbrand Corp. (manufacturer of personal absorbent products, 1990-1997). He also served as President (1986-1990) of Inbrand Corp. Prior to his employment with Inbrand Corp., he was employed by a retail fabric chain and North Carolina National Bank. In addition, Mr. Smith served as a Member of the Advisory Board of certain Fidelity® funds (2012-2013) and as a board member of the Jackson Hole Land Trust (2009-2012).
David M. Thomas (1949)
Year of Election or Appointment: 2008
Trustee
Mr. Thomas also serves as Trustee of other Fidelity® funds. Mr. Thomas serves as Non-Executive Chairman of the Board of Directors of Fortune Brands Home and Security (home and security products, 2011-present) and as a member of the Board of Directors (2004-present) and Presiding Director (2013-present) of Interpublic Group of Companies, Inc. (marketing communication). Previously, Mr. Thomas served as Executive Chairman (2005-2006) and Chairman and Chief Executive Officer (2000-2005) of IMS Health, Inc. (pharmaceutical and healthcare information solutions), a Director of Fortune Brands, Inc. (consumer products, 2000-2011), and a member of the Board of Trustees of the University of Florida (2013-2018).
+ The information includes the Trustee's principal occupation during the last five years and other information relating to the experience, attributes, and skills relevant to the Trustee's qualifications to serve as a Trustee, which led to the conclusion that the Trustee should serve as a Trustee for the fund.
Advisory Board Members and Officers:
Correspondence intended for a Member of the Advisory Board (if any) may be sent to Fidelity Investments, P.O. Box 55235, Boston, Massachusetts 02205-5235. Correspondence intended for an officer or Peter S. Lynch may be sent to Fidelity Investments, 245 Summer Street, Boston, Massachusetts 02210. Officers appear below in alphabetical order.
Name, Year of Birth; Principal Occupation
Vicki L. Fuller (1957)
Year of Election or Appointment: 2018
Member of the Advisory Board
Ms. Fuller also serves as Member of the Advisory Board of other Fidelity® funds. Ms. Fuller serves as a member of the Board of Directors, Audit Committee, and Nominating and Governance Committee of The Williams Companies, Inc. (natural gas infrastructure, 2018-present). Previously, Ms. Fuller served as the Chief Investment Officer of the New York State Common Retirement Fund (2012-2018) and held a variety of positions at AllianceBernstein L.P. (global asset management, 1985-2012), including Managing Director (2006-2012) and Senior Vice President and Senior Portfolio Manager (2001-2006).
Peter S. Lynch (1944)
Year of Election or Appointment: 2003
Member of the Advisory Board
Mr. Lynch also serves as Member of the Advisory Board of other Fidelity® funds. Mr. Lynch is Vice Chairman and a Director of FMR (investment adviser firm) and FMR Co., Inc. (investment adviser firm). In addition, Mr. Lynch serves as a Trustee of Boston College and as the Chairman of the Inner-City Scholarship Fund. Previously, Mr. Lynch served on the Special Olympics International Board of Directors (1997-2006).
Michael E. Wiley (1950)
Year of Election or Appointment: 2018
Member of the Advisory Board
Mr. Wiley also serves as Trustee or Member of the Advisory Board of other Fidelity® funds. Mr. Wiley serves as a Director of High Point Resources (exploration and production, 2005-present). Previously, Mr. Wiley served as a Director of Andeavor Corporation (independent oil refiner and marketer, 2005-2018), a Director of Andeavor Logistics LP (natural resources logistics, 2015-2018), a Director of Post Oak Bank (privately-held bank, 2004-2018), a Director of Asia Pacific Exploration Consolidated (international oil and gas exploration and production, 2008-2013), a member of the Board of Trustees of the University of Tulsa (2000-2006; 2007-2010), a Senior Energy Advisor of Katzenbach Partners, LLC (consulting, 2006-2007), an Advisory Director of Riverstone Holdings (private investment), a Director of Spinnaker Exploration Company (exploration and production, 2001-2005) and Chairman, President, and CEO of Baker Hughes, Inc. (oilfield services, 2000-2004).
Elizabeth Paige Baumann (1968)
Year of Election or Appointment: 2017
Anti-Money Laundering (AML) Officer
Ms. Baumann also serves as AML Officer of other funds. She is Chief AML Officer (2012-present) and Senior Vice President (2014-present) of FMR LLC (diversified financial services company) and is an employee of Fidelity Investments. Previously, Ms. Baumann served as AML Officer of the funds (2012-2016), and Vice President (2007-2014) and Deputy Anti-Money Laundering Officer (2007-2012) of FMR LLC.
Craig S. Brown (1977)
Year of Election or Appointment: 2019
Assistant Treasurer
Mr. Brown also serves as Assistant Treasurer of other funds. Mr. Brown is an employee of Fidelity Investments (2013-present).
John J. Burke III (1964)
Year of Election or Appointment: 2018
Chief Financial Officer
Mr. Burke also serves as Chief Financial Officer of other funds. Mr. Burke serves as Head of Investment Operations for Fidelity Fund and Investment Operations (2018-present) and is an employee of Fidelity Investments (1998-present). Previously Mr. Burke served as head of Asset Management Investment Operations (2012-2018).
William C. Coffey (1969)
Year of Election or Appointment: 2019
Assistant Secretary
Mr. Coffey also serves as Assistant Secretary of other funds. He is Senior Vice President and Deputy General Counsel of FMR LLC (diversified financial services company, 2010-present), and is an employee of Fidelity Investments. Previously, Mr. Coffey served as Secretary and CLO of certain funds (2018-2019); CLO, Secretary, and Senior Vice President of Fidelity Management & Research Company and FMR Co., Inc. (investment adviser firms, 2018-2019); Secretary of Fidelity SelectCo, LLC and Fidelity Investments Money Management, Inc. (investment adviser firms, 2018-2019); CLO of Fidelity Management & Research (Hong Kong) Limited, FMR Investment Management (UK) Limited, and Fidelity Management & Research (Japan) Limited (investment adviser firms, 2018-2019); and Assistant Secretary of certain funds (2009-2018).
Timothy M. Cohen (1969)
Year of Election or Appointment: 2018
Vice President
Mr. Cohen also serves as Vice President of other funds. Mr. Cohen serves as Executive Vice President of Fidelity SelectCo, LLC (2019-present), Co-Head of Equity (2018-present), a Director of Fidelity Management & Research (Japan) Limited (investment adviser firm, 2016-present), and is an employee of Fidelity Investments. Previously, Mr. Cohen served as Head of Global Equity Research (2016-2018), Chief Investment Officer - Equity and a Director of Fidelity Management & Research (U.K.) Inc. (investment adviser firm, 2013-2015) and as a Director of Fidelity Management & Research (Hong Kong) Limited (investment adviser firm, 2017).
Jonathan Davis (1968)
Year of Election or Appointment: 2010
Assistant Treasurer
Mr. Davis also serves as Assistant Treasurer of other funds. Mr. Davis serves as Assistant Treasurer of FMR Capital, Inc. (2017-present) and is an employee of Fidelity Investments. Previously, Mr. Davis served as Vice President and Associate General Counsel of FMR LLC (diversified financial services company, 2003-2010).
Adrien E. Deberghes (1967)
Year of Election or Appointment: 2016
Assistant Treasurer
Mr. Deberghes also serves as an officer of other funds. He serves as Assistant Treasurer of FMR Capital, Inc. (2017-present), Executive Vice President of Fidelity Investments Money Management, Inc. (FIMM) (investment adviser firm, 2016-present), and is an employee of Fidelity Investments (2008-present). Previously, Mr. Deberghes served as President and Treasurer of certain Fidelity® funds (2013-2018). Prior to joining Fidelity Investments, Mr. Deberghes was Senior Vice President of Mutual Fund Administration at State Street Corporation (2007-2008), Senior Director of Mutual Fund Administration at Investors Bank & Trust (2005-2007), and Director of Finance for Dunkin' Brands (2000-2005). Previously, Mr. Deberghes served in other fund officer roles.
Laura M. Del Prato (1964)
Year of Election or Appointment: 2018
Assistant Treasurer
Ms. Del Prato also serves as an officer of other funds. Ms. Del Prato is an employee of Fidelity Investments (2017-present). Prior to joining Fidelity Investments, Ms. Del Prato served as a Managing Director and Treasurer of the JPMorgan Mutual Funds (2014-2017). Prior to JPMorgan, Ms. Del Prato served as a partner at Cohen Fund Audit Services (accounting firm, 2012-2013) and KPMG LLP (accounting firm, 2004-2012).
Colm A. Hogan (1973)
Year of Election or Appointment: 2016
Deputy Treasurer
Mr. Hogan also serves as an officer of other funds. Mr. Hogan serves as Assistant Treasurer of FMR Capital, Inc. (2017-present) and is an employee of Fidelity Investments (2005-present). Previously, Mr. Hogan served as Assistant Treasurer of certain Fidelity® funds (2016-2018).
Pamela R. Holding (1964)
Year of Election or Appointment: 2018
Vice President
Ms. Holding also serves as Vice President of other funds. Ms. Holding serves as Executive Vice President of Fidelity SelectCo, LLC (2019-present), Co-Head of Equity (2018-present) and is an employee of Fidelity Investments (2013-present). Previously, Ms. Holding served as Chief Investment Officer of Fidelity Institutional Asset Management (2013-2018).
Cynthia Lo Bessette (1969)
Year of Election or Appointment: 2019
Secretary and Chief Legal Officer (CLO)
Ms. Lo Bessette also serves as Secretary and CLO of other funds. Ms. Lo Bessette serves as CLO, Secretary, and Senior Vice President of Fidelity Management & Research Company and FMR Co., Inc. (investment adviser firms, 2019-present); Secretary of Fidelity SelectCo, LLC and Fidelity Investments Money Management, Inc. (investment adviser firms, 2019-present); and CLO of Fidelity Management & Research (Hong Kong) Limited, FMR Investment Management (UK) Limited, and Fidelity Management & Research (Japan) Limited (investment adviser firms, 2019-present). She is a Senior Vice President and Deputy General Counsel of FMR LLC (diversified financial services company, 2019-present), and is an employee of Fidelity Investments. Previously, Ms. Lo Bessette served as Executive Vice President, General Counsel (2016-2019) and Senior Vice President, Deputy General Counsel (2015-2016) of OppenheimerFunds (investment management company) and Deputy Chief Legal Officer (2013-2015) of Jennison Associates LLC (investment adviser firm).
Chris Maher (1972)
Year of Election or Appointment: 2013
Assistant Treasurer
Mr. Maher serves as Assistant Treasurer of other funds. Mr. Maher is Vice President of Valuation Oversight, serves as Assistant Treasurer of FMR Capital, Inc. (2017-present), and is an employee of Fidelity Investments. Previously, Mr. Maher served as Vice President of Asset Management Compliance (2013), Vice President of the Program Management Group of FMR (investment adviser firm, 2010-2013), and Vice President of Valuation Oversight (2008-2010).
Kenneth B. Robins (1969)
Year of Election or Appointment: 2016
Chief Compliance Officer
Mr. Robins also serves as an officer of other funds. Mr. Robins serves as Compliance Officer of Fidelity Management & Research Company and FMR Co., Inc. (investment adviser firms, 2016-present) and is an employee of Fidelity Investments (2004-present). Previously, Mr. Robins served as Executive Vice President of Fidelity Investments Money Management, Inc. (investment adviser firm, 2013-2016) and served in other fund officer roles.
Stacie M. Smith (1974)
Year of Election or Appointment: 2016
President and Treasurer
Ms. Smith also serves as an officer of other funds. Ms. Smith serves as Assistant Treasurer of FMR Capital, Inc. (2017-present), is an employee of Fidelity Investments (2009-present), and has served in other fund officer roles. Prior to joining Fidelity Investments, Ms. Smith served as Senior Audit Manager of Ernst & Young LLP (accounting firm, 1996-2009). Previously, Ms. Smith served as Assistant Treasurer (2013-2018) and Deputy Treasurer (2013-2016) of certain Fidelity® funds.
Marc L. Spector (1972)
Year of Election or Appointment: 2016
Assistant Treasurer
Mr. Spector also serves as an officer of other funds. Mr. Spector serves as Assistant Treasurer of FMR Capital, Inc. (2017-present) and is an employee of Fidelity Investments (2016-present). Prior to joining Fidelity Investments, Mr. Spector served as Director at the Siegfried Group (accounting firm, 2013-2016), and prior to Siegfried Group as audit senior manager at Deloitte & Touche (accounting firm, 2005-2013).
Jim Wegmann (1979)
Year of Election or Appointment: 2019
Assistant Treasurer
Mr. Wegmann also serves as Assistant Treasurer of other funds. Mr. Wegmann is an employee of Fidelity Investments (2011-present).
Shareholder Expense Example
As a shareholder of the Fund, you incur two types of costs: (1) transaction costs, including sales charges (loads) on purchase payments and (2) ongoing costs, including management fees, distribution and/or service (12b-1) fees and other Fund expenses. This Example is intended to help you understand your ongoing costs (in dollars) of investing in the Fund and to compare these costs with the ongoing costs of investing in other mutual funds.
The Example is based on an investment of $1,000 invested at the beginning of the period and held for the entire period (May 1, 2019 to October 31, 2019).
Actual Expenses
The first line of the accompanying table for each class of the Fund provides information about actual account values and actual expenses. You may use the information in this line, together with the amount you invested, to estimate the expenses that you paid over the period. Simply divide your account value by $1,000.00 (for example, an $8,600 account value divided by $1,000.00 = 8.6), then multiply the result by the number in the first line for a class of the Fund under the heading entitled "Expenses Paid During Period" to estimate the expenses you paid on your account during this period. In addition, the Fund, as a shareholder in the underlying Fidelity Central Funds, will indirectly bear its pro-rata share of the fees and expenses incurred by the underlying Fidelity Central Funds. These fees and expenses are not included in the Fund's annualized expense ratio used to calculate the expense estimate in the table below.
Hypothetical Example for Comparison Purposes
The second line of the accompanying table for each class of the Fund provides information about hypothetical account values and hypothetical expenses based on a Class' actual expense ratio and an assumed rate of return of 5% per year before expenses, which is not the Class' actual return. The hypothetical account values and expenses may not be used to estimate the actual ending account balance or expenses you paid for the period. You may use this information to compare the ongoing costs of investing in the Fund and other funds. To do so, compare this 5% hypothetical example with the 5% hypothetical examples that appear in the shareholder reports of the other funds. In addition, the Fund, as a shareholder in the underlying Fidelity Central Funds, will indirectly bear its pro-rata share of the fees and expenses incurred by the underlying Fidelity Central Funds. These fees and expenses are not included in the Fund's annualized expense ratio used to calculate the expense estimate in the table below.
Please note that the expenses shown in the table are meant to highlight your ongoing costs only and do not reflect any transaction costs. Therefore, the second line of the table is useful in comparing ongoing costs only, and will not help you determine the relative total costs of owning different funds. In addition, if these transactional costs were included, your costs would have been higher.
| | Annualized Expense Ratio-A | Beginning
Account Value
May 1, 2019 | Ending
Account Value
October 31, 2019 | Expenses Paid
During Period-B
May 1, 2019
to October 31, 2019 |
| Class A | 1.53% | | | |
| Actual | | $1,000.00 | $1,028.10 | $7.82 |
| Hypothetical-C | | $1,000.00 | $1,017.49 | $7.78 |
| Class M | 1.81% | | | |
| Actual | | $1,000.00 | $1,026.70 | $9.25 |
| Hypothetical-C | | $1,000.00 | $1,016.08 | $9.20 |
| Class C | 2.30% | | | |
| Actual | | $1,000.00 | $1,024.00 | $11.73 |
| Hypothetical-C | | $1,000.00 | $1,013.61 | $11.67 |
| International Small Cap Opportunities | 1.22% | | | |
| Actual | | $1,000.00 | $1,030.00 | $6.24 |
| Hypothetical-C | | $1,000.00 | $1,019.06 | $6.21 |
| Class I | 1.24% | | | |
| Actual | | $1,000.00 | $1,029.50 | $6.34 |
| Hypothetical-C | | $1,000.00 | $1,018.95 | $6.31 |
| Class Z | 1.08% | | | |
| Actual | | $1,000.00 | $1,030.60 | $5.53 |
| Hypothetical-C | | $1,000.00 | $1,019.76 | $5.50 |
A Annualized expense ratio reflects expenses net of applicable fee waivers.
B Expenses are equal to each Class' annualized expense ratio, multiplied by the average account value over the period, multiplied by 184/365 (to reflect the one-half year period).
C 5% return per year before expenses
Distributions (Unaudited)
The Board of Trustees of Fidelity International Small Cap Opportunities Fund voted to pay to shareholders of record at the opening of business on record date, the following distributions per share derived from capital gains realized from sales of portfolio securities, and dividends derived from net investment income:
| | Pay Date | Record Date | Dividends | Capital Gains |
| Fidelity International Small Cap Opportunities Fund | | | | |
| Class A | 12/09/2019 | 12/06/2019 | $0.110 | $0.051 |
| Class M | 12/09/2019 | 12/06/2019 | $0.060 | $0.051 |
| Class C | 12/09/2019 | 12/06/2019 | $0.000 | $0.000 |
| International Small Cap Opportunities | 12/09/2019 | 12/06/2019 | $0.170 | $0.051 |
| Class I | 12/09/2019 | 12/06/2019 | $0.160 | $0.051 |
| Class Z | 12/09/2019 | 12/06/2019 | $0.199 | $0.051 |
|
Class A designates 13%; Class M designates 19%; International Small Cap Opportunities designates 9%; Class I designates 10%; and Class Z designates 8%; of the dividends distributed during the fiscal year as qualifying for the dividends–received deduction for corporate shareholders.
Class A, Class M, International Small Cap Opportunities, Class I, and Class Z designate 100% of the dividends distributed during the fiscal year as amounts which may be taken into account as a dividend for purposes of the maximum rate under section 1(h)(11) of the Internal Revenue Code.
The amounts per share which represent income derived from sources within, and taxes paid to, foreign countries or possessions of the United States are as follows:
| | Pay Date | Income | Taxes |
| Fidelity International Small Cap Opportunities Fund | | | |
| Class A | 12/10/2018 | $0.1681 | $0.0351 |
| Class M | 12/10/2018 | $0.1121 | $0.0351 |
| Class C | 12/10/2018 | $0.0000 | $0.0000 |
| International Small Cap Opportunities | 12/10/2018 | $0.2251 | $0.0351 |
| Class I | 12/10/2018 | $0.2171 | $0.0351 |
| Class Z | 12/10/2018 | $0.2591 | $0.0351 |
|
The fund will notify shareholders in January 2020 of amounts for use in preparing 2019 income tax returns.
ILS-ANN-1219
1.815075.115
Fidelity® International Small Cap Fund
Annual Report
October 31, 2019
Includes Fidelity and Fidelity Advisor share classes
See the inside front cover for important information about access to your fund’s shareholder reports.
Beginning on January 1, 2021, as permitted by regulations adopted by the Securities and Exchange Commission, paper copies of a fund’s shareholder reports will no longer be sent by mail, unless you specifically request paper copies of the reports from the fund or from your financial intermediary, such as a financial advisor, broker-dealer or bank. Instead, the reports will be made available on a website, and you will be notified by mail each time a report is posted and provided with a website link to access the report.
If you already elected to receive shareholder reports electronically, you will not be affected by this change and you need not take any action. You may elect to receive shareholder reports and other communications from a fund electronically, by contacting your financial intermediary. For Fidelity customers, visit Fidelity's web site or call Fidelity using the contact information listed below.
You may elect to receive all future reports in paper free of charge. If you wish to continue receiving paper copies of your shareholder reports, you may contact your financial intermediary or, if you are a Fidelity customer, visit Fidelity’s website, or call Fidelity at the applicable toll-free number listed below. Your election to receive reports in paper will apply to all funds held with the fund complex/your financial intermediary.
| Account Type | Website | Phone Number |
| Brokerage, Mutual Fund, or Annuity Contracts: | fidelity.com/mailpreferences | 1-800-343-3548 |
| Employer Provided Retirement Accounts: | netbenefits.fidelity.com/preferences (choose 'no' under Required Disclosures to continue to print) | 1-800-343-0860 |
| Advisor Sold Accounts Serviced Through Your Financial Intermediary: | Contact Your Financial Intermediary | Your Financial Intermediary's phone number |
| Advisor Sold Accounts Serviced by Fidelity: | institutional.fidelity.com | 1-877-208-0098 |
Contents
To view a fund's proxy voting guidelines and proxy voting record for the 12-month period ended June 30, visit http://www.fidelity.com/proxyvotingresults or visit the Securities and Exchange Commission's (SEC) web site at http://www.sec.gov.
You may also call 1-800-544-8544 if you’re an individual investing directly with Fidelity, call 1-800-835-5092 if you’re a plan sponsor or participant with Fidelity as your recordkeeper or call 1-877-208-0098 on institutional accounts or if you’re an advisor or invest through one to request a free copy of the proxy voting guidelines.
Standard & Poor's, S&P and S&P 500 are registered service marks of The McGraw-Hill Companies, Inc. and have been licensed for use by Fidelity Distributors Corporation.
Other third-party marks appearing herein are the property of their respective owners.
All other marks appearing herein are registered or unregistered trademarks or service marks of FMR LLC or an affiliated company. © 2019 FMR LLC. All rights reserved.
This report and the financial statements contained herein are submitted for the general information of the shareholders of the Fund. This report is not authorized for distribution to prospective investors in the Fund unless preceded or accompanied by an effective prospectus.
A fund files its complete schedule of portfolio holdings with the SEC for the first and third quarters of each fiscal year on Form N-PORT. Forms N-PORT are available on the SEC’s web site at http://www.sec.gov. A fund's Forms N-PORT may be reviewed and copied at the SEC’s Public Reference Room in Washington, DC. Information regarding the operation of the SEC's Public Reference Room may be obtained by calling 1-800-SEC-0330.
For a complete list of a fund's portfolio holdings, view the most recent holdings listing, semiannual report, or annual report on Fidelity's web site at http://www.fidelity.com, http://www.institutional.fidelity.com, or http://www.401k.com, as applicable.
NOT FDIC INSURED •MAY LOSE VALUE •NO BANK GUARANTEE
Neither the Fund nor Fidelity Distributors Corporation is a bank.
Performance: The Bottom Line
Average annual total return reflects the change in the value of an investment, assuming reinvestment of distributions from dividend income and capital gains (the profits earned upon the sale of securities that have grown in value, if any) and assuming a constant rate of performance each year. The hypothetical investment and the average annual total returns do not reflect the deduction of taxes that a shareholder would pay on fund distributions or the redemption of fund shares. During periods of reimbursement by Fidelity, a fund’s total return will be greater than it would be had the reimbursement not occurred. How a fund did yesterday is no guarantee of how it will do tomorrow.
Average Annual Total Returns
| For the periods ended October 31, 2019 | Past 1 year | Past 5 years | Past 10 years |
| Class A (incl. 5.75% sales charge) | 1.79% | 6.24% | 8.25% |
| Class M (incl. 3.50% sales charge) | 3.88% | 6.42% | 8.20% |
| Class C (incl. contingent deferred sales charge) | 6.17% | 6.67% | 8.07% |
| Fidelity® International Small Cap Fund | 8.27% | 7.80% | 9.19% |
| Class I | 8.28% | 7.82% | 9.25% |
| Class Z | 8.44% | 7.86% | 9.27% |
Prior to April 1, 2014, the fund compared its performance to a different benchmark. The fund's historical performance may not represent its current investment policies.
Class C shares' contingent deferred sales charges included in the past one year, past five years and past ten years total return figures are 1%, 0% and 0%, respectively.
The initial offering of Class Z shares took place on October 2, 2018. Returns prior to October 2, 2018, are those of Class I.
$10,000 Over 10 Years
Let's say hypothetically that $10,000 was invested in Fidelity® International Small Cap Fund, a class of the fund, on October 31, 2009.
The chart shows how the value of your investment would have changed, and also shows how the MSCI ACWI (All Country World Index) ex USA Small Cap Index performed over the same period.
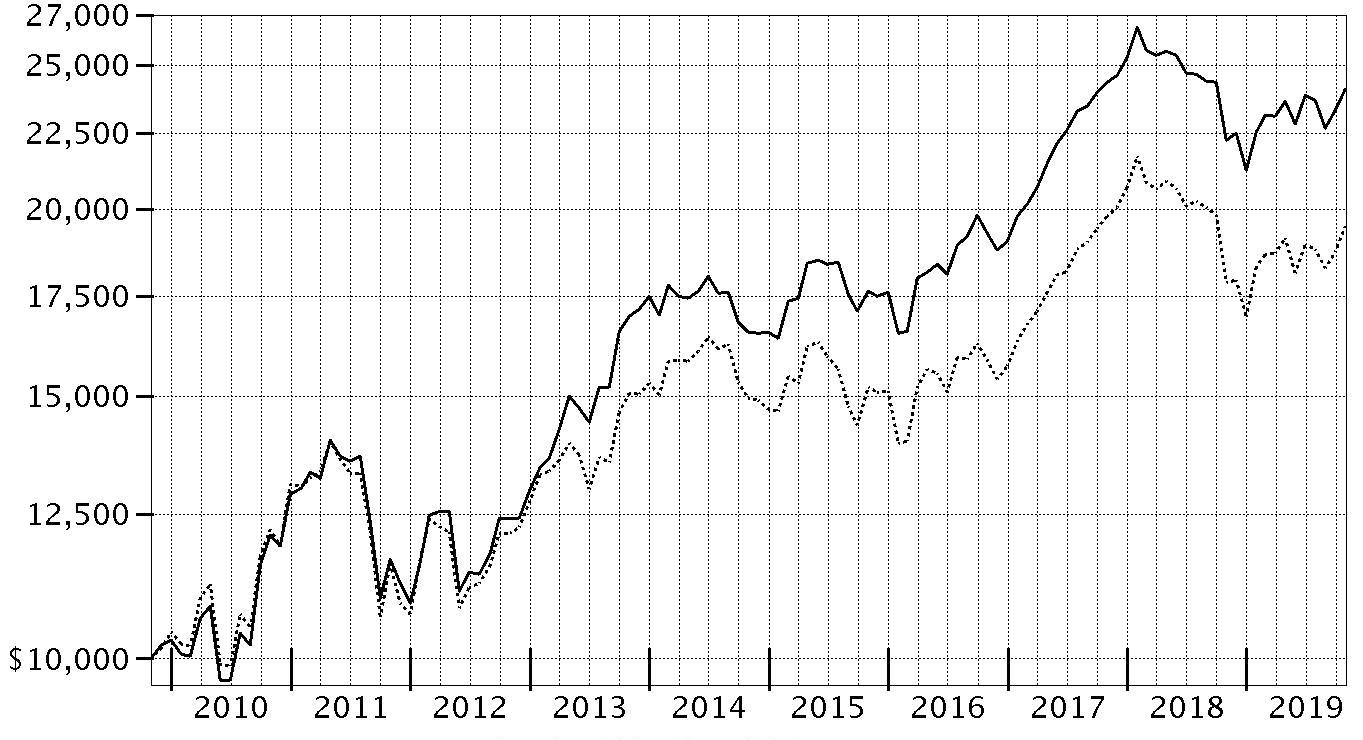
| Period Ending Values |
| $24,087 | Fidelity® International Small Cap Fund |
| $19,479 | MSCI ACWI (All Country World Index) ex USA Small Cap Index |
Management's Discussion of Fund Performance
Market Recap: The MSCI ACWI (All Country World Index) ex USA Index gained 11.47% for the 12 months ending October 31, 2019, as international stocks reflected a confluence of factors, including escalating trade tension, and moderating but still positive global economic growth. Currency fluctuations were largely modest and varied by region, muting the overall impact on international equity returns. In late December, the U.S. Federal Reserve shifted from raising interest rates to a more dovish policy in 2019, joining many foreign central banks. In June, international stocks rose 6.03%, as policy stimulus in China stabilized that country’s economic growth. The Fed cut its policy rate in July for the first time since 2008. However, the index returned -1.21% for the month, followed by -3.08% in August. In September, the Fed cut its policy rate another quarter point, citing concerns about slowing economic growth and muted inflation, and did the same in October, leading to monthly gains of 2.59% and 3.49%, respectively. For the full 12 months, the growth-oriented information technology sector (+22%) led the way, followed by utilities (+20%) and real estate (+18%), two high-dividend-yielding categories. Conversely, energy was roughly flat, while materials (+6%) and communication services (7%) also lagged. By region, Asia Pacific ex Japan (+16%), Europe ex U.K (+13%), Canada (+12%) and emerging markets (+12%) fared best. Meanwhile, the U.K. (+7%) and Japan (+10%) trailed the broader market.
Comments from Portfolio Manager Samuel Chamovitz: For the year, the fund’s share classes (excluding sales charges, if applicable) gained roughly 7% to 8%, trailing the 8.92% advance of the benchmark MSCI ACWI (All Country World Index) ex USA Small Cap Index. Versus the benchmark, sector and industry positioning weighed on relative performance the most. More specifically, underweighting real estate, utilities and information technology stocks detracted, as did overweighting the consumer staples sector. A cash position of about 5%, on average, also hurt. Geographically, picks in Canada and the U.K., as well as non-benchmark exposure to the United States, notably hampered performance. On a stock-specific basis, the fund's out-of-benchmark position in U.K.-based energy services provider John Wood Group was the largest relative detractor by a wide margin. An overweighting in S Foods, a provider of meat products in Japan, along with a non-benchmark stake in U.K.-based McColl’s Retail Group, further weighed on relative performance the past 12 months. Conversely, investment choices among industrials stocks solidly contributed, as did picks within financials and health care to a lesser extent. Geographically, emerging markets – China and Brazil especially – along with Continental Europe, added the most value. The fund’s top relative contributor was a non-benchmark position in SUL America, a Brazil-based health insurance provider. A sizable overweight stake in SITC International Holdings, a niche shipping and logistics company based in Hong Kong, also helped.
The views expressed above reflect those of the portfolio manager(s) only through the end of the period as stated on the cover of this report and do not necessarily represent the views of Fidelity or any other person in the Fidelity organization. Any such views are subject to change at any time based upon market or other conditions and Fidelity disclaims any responsibility to update such views. These views may not be relied on as investment advice and, because investment decisions for a Fidelity fund are based on numerous factors, may not be relied on as an indication of trading intent on behalf of any Fidelity fund.
Investment Summary (Unaudited)
Geographic Diversification (% of fund's net assets)
| As of October 31, 2019 |
| | Japan | 25.9% |
| | United Kingdom | 12.5% |
| | United States of America* | 6.0% |
| | Canada | 5.8% |
| | Australia | 5.5% |
| | Cayman Islands | 4.5% |
| | France | 3.1% |
| | Netherlands | 3.0% |
| | Taiwan | 3.0% |
| | Other | 30.7% |

* Includes Short-Term investments and Net Other Assets (Liabilities).
Percentages are based on country or territory of incorporation and are adjusted for the effect of futures contracts, if applicable.
Asset Allocation as of October 31, 2019
| | % of fund's net assets |
| Stocks | 94.0 |
| Investment Companies | 1.5 |
| Short-Term Investments and Net Other Assets (Liabilities) | 4.5 |
Top Ten Stocks as of October 31, 2019
| | % of fund's net assets |
| iShares MSCI EAFE Small-Cap ETF (United States of America, Investment Companies) | 1.5 |
| JSR Corp. (Japan, Chemicals) | 1.3 |
| John Wood Group PLC (United Kingdom, Energy Equipment & Services) | 1.1 |
| SITC International Holdings Co. Ltd. (Cayman Islands, Marine) | 1.0 |
| Arata Corp. (Japan, Distributors) | 0.9 |
| GUD Holdings Ltd. (Australia, Auto Components) | 0.9 |
| Isuzu Motors Ltd. (Japan, Automobiles) | 0.9 |
| Star Petroleum Refining PCL (Thailand, Oil, Gas & Consumable Fuels) | 0.9 |
| Cineworld Group PLC (United Kingdom, Entertainment) | 0.9 |
| Aeon Delight Co. Ltd. (Japan, Commercial Services & Supplies) | 0.9 |
| | 10.3 |
Top Market Sectors as of October 31, 2019
| | % of fund's net assets |
| Industrials | 21.3 |
| Consumer Discretionary | 13.0 |
| Financials | 12.5 |
| Consumer Staples | 9.7 |
| Materials | 9.5 |
| Real Estate | 8.2 |
| Information Technology | 7.5 |
| Health Care | 6.3 |
| Energy | 3.2 |
| Communication Services | 2.4 |
Schedule of Investments October 31, 2019
Showing Percentage of Net Assets
| Common Stocks - 93.7% | | | |
| | | Shares | Value |
| Australia - 5.5% | | | |
| Aub Group Ltd. | | 1,063,538 | $9,018,184 |
| Challenger Ltd. | | 2,091,899 | 11,473,466 |
| GUD Holdings Ltd. | | 3,013,475 | 22,472,787 |
| Hansen Technologies Ltd. | | 5,053,027 | 11,824,213 |
| Imdex Ltd. | | 11,185,320 | 12,247,923 |
| Inghams Group Ltd. (a) | | 7,920,719 | 16,957,594 |
| Nanosonics Ltd. (b) | | 1,887,880 | 8,832,803 |
| National Storage (REIT) unit | | 9,613,688 | 12,336,070 |
| Pact Group Holdings Ltd. | | 3,624,827 | 6,051,589 |
| Reckon Ltd. | | 5,193,683 | 2,710,118 |
| Servcorp Ltd. (c) | | 4,998,615 | 15,135,173 |
| SomnoMed Ltd. (a)(b)(c) | | 3,608,165 | 7,022,858 |
|
| TOTAL AUSTRALIA | | | 136,082,778 |
|
| Austria - 2.2% | | | |
| IMMOFINANZ Immobilien Anlagen AG | | 624,674 | 17,939,997 |
| Mayr-Melnhof Karton AG | | 123,000 | 15,117,445 |
| Wienerberger AG | | 771,000 | 20,843,886 |
|
| TOTAL AUSTRIA | | | 53,901,328 |
|
| Bermuda - 0.9% | | | |
| China Resource Gas Group Ltd. | | 1,706,000 | 10,285,999 |
| Hiscox Ltd. | | 589,552 | 11,371,138 |
|
| TOTAL BERMUDA | | | 21,657,137 |
|
| Brazil - 1.0% | | | |
| Estacio Participacoes SA | | 1,648,800 | 16,136,492 |
| Sul America SA unit | | 639,300 | 7,697,743 |
|
| TOTAL BRAZIL | | | 23,834,235 |
|
| Canada - 5.8% | | | |
| Computer Modelling Group Ltd. | | 1,039,400 | 5,531,998 |
| ECN Capital Corp. | | 2,667,281 | 8,809,257 |
| Genesis Land Development Corp. (b)(c) | | 2,612,922 | 4,820,743 |
| Lassonde Industries, Inc. Class A (sub. vtg.) | | 155,869 | 20,682,731 |
| McCoy Global, Inc. (b) | | 1,328,570 | 605,225 |
| North West Co., Inc. | | 871,600 | 18,648,309 |
| Open Text Corp. | | 429,796 | 17,366,747 |
| Richelieu Hardware Ltd. (a) | | 700,800 | 14,387,390 |
| Spin Master Corp. (b)(d) | | 458,100 | 12,959,385 |
| Total Energy Services, Inc. | | 615,900 | 2,628,015 |
| TransForce, Inc. | | 470,600 | 14,995,886 |
| Western Forest Products, Inc. | | 13,923,375 | 13,742,607 |
| Whitecap Resources, Inc. (a) | | 2,982,553 | 8,310,659 |
|
| TOTAL CANADA | | | 143,488,952 |
|
| Cayman Islands - 4.5% | | | |
| AMVIG Holdings Ltd. | | 33,578,000 | 8,595,354 |
| Best Pacific International Holdings Ltd. | | 17,964,000 | 6,066,250 |
| China Metal Recycling (Holdings) Ltd. (b)(e) | | 436,800 | 1 |
| Haitian International Holdings Ltd. | | 6,879,000 | 16,232,462 |
| Impro Precision Industries Ltd. (d) | | 13,687,300 | 5,483,905 |
| Pico Far East Holdings Ltd. | | 31,469,000 | 10,733,222 |
| Precision Tsugami China Corp. Ltd. | | 11,218,000 | 10,775,120 |
| SITC International Holdings Co. Ltd. | | 22,265,000 | 24,515,963 |
| Value Partners Group Ltd. | | 21,698,000 | 11,422,299 |
| Xingda International Holdings Ltd. | | 55,143,591 | 15,368,040 |
|
| TOTAL CAYMAN ISLANDS | | | 109,192,616 |
|
| China - 1.0% | | | |
| Qingdao Port International Co. Ltd. (H Shares) (d) | | 23,959,000 | 13,740,055 |
| Weifu High-Technology Group Co. Ltd. (B Shares) | | 6,411,002 | 10,127,131 |
|
| TOTAL CHINA | | | 23,867,186 |
|
| Denmark - 1.6% | | | |
| Jyske Bank A/S (Reg.) | | 338,403 | 11,250,127 |
| Scandinavian Tobacco Group A/S (d) | | 1,052,628 | 12,437,378 |
| Spar Nord Bank A/S | | 1,603,626 | 15,656,109 |
|
| TOTAL DENMARK | | | 39,343,614 |
|
| Finland - 2.8% | | | |
| Ahlstrom-Munksjo OYJ | | 924,698 | 13,860,883 |
| Asiakastieto Group Oyj (a)(d) | | 527,523 | 17,120,880 |
| Cramo Oyj (B Shares) | | 739,310 | 7,833,248 |
| Kojamo OYJ | | 932,500 | 15,704,261 |
| Olvi PLC (A Shares) | | 315,638 | 13,394,782 |
|
| TOTAL FINLAND | | | 67,914,054 |
|
| France - 3.1% | | | |
| Altarea SCA | | 78,324 | 17,208,887 |
| Maisons du Monde SA (d) | | 582,407 | 8,048,030 |
| Rexel SA | | 1,218,900 | 15,089,775 |
| The Vicat Group | | 306,456 | 12,988,034 |
| Thermador Groupe SA | | 177,066 | 10,940,487 |
| Wendel SA | | 84,635 | 11,987,964 |
|
| TOTAL FRANCE | | | 76,263,177 |
|
| Germany - 2.3% | | | |
| DIC Asset AG | | 722,382 | 10,070,908 |
| JOST Werke AG (d) | | 454,072 | 12,761,948 |
| Takkt AG | | 1,132,400 | 13,463,215 |
| Talanx AG | | 427,100 | 19,673,033 |
|
| TOTAL GERMANY | | | 55,969,104 |
|
| Greece - 0.8% | | | |
| Mytilineos SA | | 1,765,716 | 19,318,863 |
| Hong Kong - 1.6% | | | |
| Dah Sing Banking Group Ltd. | | 10,236,400 | 13,233,577 |
| Far East Horizon Ltd. | | 6,335,000 | 5,997,619 |
| Magnificent Hotel Investment Ltd. | | 316,412,000 | 6,861,994 |
| Sino Land Ltd. | | 8,689,193 | 12,989,190 |
|
| TOTAL HONG KONG | | | 39,082,380 |
|
| India - 0.7% | | | |
| Cyient Ltd. | | 383,988 | 2,200,065 |
| Embassy Office Parks (REIT) | | 1,368,400 | 7,954,696 |
| Torrent Pharmaceuticals Ltd. | | 276,058 | 6,903,101 |
|
| TOTAL INDIA | | | 17,057,862 |
|
| Indonesia - 0.7% | | | |
| PT ACE Hardware Indonesia Tbk | | 61,050,100 | 7,347,564 |
| PT Media Nusantara Citra Tbk | | 109,704,600 | 10,272,199 |
|
| TOTAL INDONESIA | | | 17,619,763 |
|
| Ireland - 1.4% | | | |
| Irish Residential Properties REIT PLC | | 9,986,400 | 19,558,033 |
| Mincon Group PLC | | 9,124,844 | 10,176,939 |
| Origin Enterprises PLC | | 920,300 | 4,824,130 |
|
| TOTAL IRELAND | | | 34,559,102 |
|
| Italy - 1.4% | | | |
| Banca Generali SpA | | 382,900 | 12,486,894 |
| Banco di Desio e della Brianza SpA | | 2,376,445 | 5,380,412 |
| Recordati SpA | | 397,800 | 16,712,911 |
|
| TOTAL ITALY | | | 34,580,217 |
|
| Japan - 25.9% | | | |
| A/S One Corp. | | 139,500 | 11,664,751 |
| Aeon Delight Co. Ltd. | | 626,000 | 21,800,681 |
| Arata Corp. | | 603,500 | 22,624,821 |
| Arc Land Sakamoto Co. Ltd. | | 1,317,400 | 15,540,332 |
| Aucnet, Inc. | | 803,600 | 11,036,962 |
| Broadleaf Co. Ltd. | | 648,100 | 3,641,227 |
| Central Automotive Products Ltd. | | 339,100 | 6,636,468 |
| DaikyoNishikawa Corp. | | 2,026,200 | 15,566,445 |
| Daiwa Industries Ltd. | | 1,286,200 | 14,428,853 |
| Dexerials Corp. | | 1,734,800 | 15,313,771 |
| GMO Internet, Inc. | | 1,005,300 | 16,893,902 |
| Hitachi High-Technologies Corp. | | 166,400 | 10,352,705 |
| Iida Group Holdings Co. Ltd. | | 739,451 | 12,317,118 |
| Inaba Denki Sangyo Co. Ltd. | | 285,100 | 13,097,131 |
| Isuzu Motors Ltd. | | 1,931,700 | 22,446,179 |
| Japan Meat Co. Ltd. | | 708,000 | 14,481,974 |
| JSR Corp. | | 1,705,600 | 32,020,489 |
| Kenedix, Inc. | | 2,671,500 | 14,541,384 |
| Kirindo Holdings Co. Ltd. (c) | | 647,909 | 12,969,727 |
| Meitec Corp. | | 228,600 | 11,916,990 |
| Mitani Shoji Co. Ltd. | | 302,100 | 15,177,558 |
| Morinaga & Co. Ltd. | | 318,700 | 15,743,620 |
| Nihon Parkerizing Co. Ltd. | | 1,838,700 | 21,558,717 |
| Nishimoto Co. Ltd. | | 477,100 | 15,382,693 |
| NSD Co. Ltd. | | 363,900 | 11,217,079 |
| Otsuka Corp. | | 298,200 | 12,022,816 |
| PALTAC Corp. | | 289,000 | 13,937,171 |
| Paramount Bed Holdings Co. Ltd. | | 427,700 | 16,353,971 |
| Persol Holdings Co., Ltd. | | 814,900 | 15,652,617 |
| Renesas Electronics Corp. (b) | | 3,130,700 | 21,193,829 |
| Ricoh Leasing Co. Ltd. | | 337,500 | 11,373,245 |
| S Foods, Inc. | | 686,300 | 18,490,614 |
| San-Ai Oil Co. Ltd. | | 1,480,700 | 15,501,818 |
| Santen Pharmaceutical Co. Ltd. | | 709,700 | 12,571,157 |
| Shinsei Bank Ltd. | | 1,369,000 | 21,342,369 |
| Ship Healthcare Holdings, Inc. | | 319,400 | 13,613,388 |
| Taiheiyo Cement Corp. | | 460,400 | 13,024,252 |
| THK Co. Ltd. | | 518,000 | 14,895,245 |
| TKC Corp. | | 277,200 | 11,677,323 |
| Toshiba Plant Systems & Services Corp. | | 675,700 | 13,202,359 |
| Tsuruha Holdings, Inc. | | 187,700 | 21,114,103 |
| Yamada Consulting Group Co. Ltd. | | 561,380 | 10,120,652 |
|
| TOTAL JAPAN | | | 634,458,506 |
|
| Korea (South) - 1.1% | | | |
| Hyundai Fire & Marine Insurance Co. Ltd. | | 915,726 | 19,757,566 |
| NS Shopping Co. Ltd. | | 755,079 | 6,277,862 |
|
| TOTAL KOREA (SOUTH) | | | 26,035,428 |
|
| Luxembourg - 0.7% | | | |
| Shurgard Self Storage Europe SARL | | 153,877 | 5,208,637 |
| Stabilus SA | | 215,000 | 12,097,380 |
|
| TOTAL LUXEMBOURG | | | 17,306,017 |
|
| Mexico - 1.4% | | | |
| Credito Real S.A.B. de CV | | 6,947,800 | 8,523,800 |
| Genomma Lab Internacional SA de CV (b) | | 13,846,500 | 14,619,209 |
| Gruma S.A.B. de CV Series B | | 1,143,800 | 12,001,977 |
|
| TOTAL MEXICO | | | 35,144,986 |
|
| Netherlands - 3.0% | | | |
| Amsterdam Commodities NV | | 666,999 | 14,372,225 |
| Arcadis NV | | 631,158 | 12,459,570 |
| Basic-Fit NV (b)(d) | | 296,300 | 9,054,697 |
| Intertrust NV (d) | | 863,000 | 16,401,067 |
| RHI Magnesita NV | | 82,200 | 3,703,297 |
| RHI Magnesita NV | | 329,699 | 14,892,388 |
| Van Lanschot NV (Bearer) | | 159,542 | 3,674,403 |
|
| TOTAL NETHERLANDS | | | 74,557,647 |
|
| New Zealand - 1.1% | | | |
| Air New Zealand Ltd. | | 6,641,871 | 12,024,140 |
| EBOS Group Ltd. | | 1,016,731 | 16,058,677 |
|
| TOTAL NEW ZEALAND | | | 28,082,817 |
|
| Norway - 0.4% | | | |
| ABG Sundal Collier ASA | | 9,702,926 | 3,587,365 |
| Skandiabanken ASA (d) | | 736,574 | 5,230,263 |
|
| TOTAL NORWAY | | | 8,817,628 |
|
| Philippines - 0.9% | | | |
| Altus San Nicolas Corp. (e) | | 433,681 | 44,251 |
| Century Pacific Food, Inc. | | 31,400,900 | 9,261,138 |
| Robinsons Land Corp. | | 27,200,600 | 13,622,963 |
|
| TOTAL PHILIPPINES | | | 22,928,352 |
|
| Romania - 0.6% | | | |
| Banca Transilvania SA | | 25,613,036 | 14,307,112 |
| Singapore - 1.9% | | | |
| Boustead Singapore Ltd. | | 12,196,612 | 6,983,625 |
| Hour Glass Ltd. | | 11,576,380 | 6,811,549 |
| Mapletree Industrial (REIT) | | 9,980,216 | 18,694,614 |
| Wing Tai Holdings Ltd. | | 9,901,000 | 14,766,072 |
|
| TOTAL SINGAPORE | | | 47,255,860 |
|
| South Africa - 0.4% | | | |
| Clicks Group Ltd. | | 572,218 | 9,307,418 |
| Spain - 0.5% | | | |
| Laboratorios Farmaceuticos ROVI SA | | 480,300 | 11,838,497 |
| Sweden - 1.7% | | | |
| AddTech AB (B Shares) | | 199,019 | 5,534,203 |
| Dustin Group AB (d) | | 1,948,279 | 15,516,499 |
| Granges AB | | 1,210,021 | 11,754,712 |
| John Mattson Fastighetsforetag (b) | | 592,400 | 7,754,939 |
|
| TOTAL SWEDEN | | | 40,560,353 |
|
| Switzerland - 0.1% | | | |
| VZ Holding AG | | 5,783 | 1,612,088 |
| Taiwan - 3.0% | | | |
| King's Town Bank | | 10,796,000 | 11,203,797 |
| Lumax International Corp. Ltd. | | 4,511,600 | 11,864,067 |
| Sporton International, Inc. | | 1,579,740 | 9,841,649 |
| Test Research, Inc. | | 7,325,000 | 12,249,164 |
| Tripod Technology Corp. | | 3,379,000 | 13,073,710 |
| United Microelectronics Corp. | | 21,045,000 | 9,673,378 |
| Yung Chi Paint & Varnish Manufacturing Co. Ltd. | | 2,333,000 | 5,477,172 |
|
| TOTAL TAIWAN | | | 73,382,937 |
|
| Thailand - 1.2% | | | |
| Star Petroleum Refining PCL | | 74,608,100 | 21,991,544 |
| TISCO Financial Group PCL | | 2,683,700 | 8,665,063 |
|
| TOTAL THAILAND | | | 30,656,607 |
|
| United Kingdom - 12.5% | | | |
| Alliance Pharma PLC | | 17,111,215 | 16,402,109 |
| Bond International Software PLC (b)(e) | | 899,666 | 12 |
| Cineworld Group PLC | | 7,601,880 | 21,929,481 |
| Diploma PLC | | 445,451 | 9,226,469 |
| Elementis PLC | | 6,775,646 | 13,051,151 |
| ITE Group PLC | | 18,221,330 | 18,339,531 |
| John Wood Group PLC | | 6,123,100 | 26,832,459 |
| Knights Group Holdings PLC (a) | | 2,105,701 | 8,810,212 |
| Luxfer Holdings PLC sponsored | | 1,078,459 | 18,182,819 |
| McColl's Retail Group PLC (c) | | 9,602,129 | 5,671,782 |
| Mears Group PLC (a) | | 4,598,940 | 15,190,954 |
| Melrose Industries PLC | | 4,381,403 | 12,094,385 |
| Moneysupermarket.com Group PLC | | 3,127,393 | 13,899,216 |
| PayPoint PLC | | 523,111 | 6,193,372 |
| Sabre Insurance Group PLC (d) | | 2,852,122 | 10,898,764 |
| Spectris PLC | | 416,525 | 12,905,932 |
| Ten Entertainment Group PLC (c) | | 4,393,219 | 14,596,790 |
| The Weir Group PLC | | 668,738 | 11,664,053 |
| Topps Tiles PLC | | 6,514,537 | 6,354,270 |
| Tullett Prebon PLC | | 4,485,843 | 19,925,016 |
| Ultra Electronics Holdings PLC | | 566,281 | 14,303,876 |
| Victrex PLC | | 498,500 | 14,180,274 |
| Volution Group PLC | | 5,952,601 | 15,382,850 |
|
| TOTAL UNITED KINGDOM | | | 306,035,777 |
|
| TOTAL COMMON STOCKS | | | |
| (Cost $2,196,546,174) | | | 2,296,020,398 |
|
| Nonconvertible Preferred Stocks - 0.3% | | | |
| Brazil - 0.3% | | | |
| Banco ABC Brasil SA | | | |
| (Cost $5,555,755) | | 1,564,326 | 7,036,639 |
|
| Investment Companies - 1.5% | | | |
| United States of America - 1.5% | | | |
| iShares MSCI EAFE Small-Cap ETF | | | |
| (Cost $34,167,870) | | 603,900 | 35,980,356 |
|
| Money Market Funds - 4.4% | | | |
| Fidelity Cash Central Fund 1.83% (f) | | 98,969,464 | 98,989,258 |
| Fidelity Securities Lending Cash Central Fund 1.84% (f)(g) | | 10,169,051 | 10,170,068 |
| TOTAL MONEY MARKET FUNDS | | | |
| (Cost $109,150,428) | | | 109,159,326 |
| TOTAL INVESTMENT IN SECURITIES - 99.9% | | | |
| (Cost $2,345,420,227) | | | 2,448,196,719 |
| NET OTHER ASSETS (LIABILITIES) - 0.1% | | | 2,974,460 |
| NET ASSETS - 100% | | | $2,451,171,179 |
Security Type Abbreviations
ETF – Exchange-Traded Fund
Categorizations in the Schedule of Investments are based on country or territory of incorporation.
Legend
(a) Security or a portion of the security is on loan at period end.
(b) Non-income producing
(c) Affiliated company
(d) Security exempt from registration under Rule 144A of the Securities Act of 1933. These securities may be resold in transactions exempt from registration, normally to qualified institutional buyers. At the end of the period, the value of these securities amounted to $139,652,871 or 5.7% of net assets.
(e) Level 3 security
(f) Affiliated fund that is generally available only to investment companies and other accounts managed by Fidelity Investments. The rate quoted is the annualized seven-day yield of the fund at period end. A complete unaudited listing of the fund's holdings as of its most recent quarter end is available upon request. In addition, each Fidelity Central Fund's financial statements, which are not covered by the Fund's Report of Independent Registered Public Accounting Firm, are available on the SEC's website or upon request.
(g) Investment made with cash collateral received from securities on loan.
Affiliated Central Funds
Information regarding fiscal year to date income earned by the Fund from investments in Fidelity Central Funds is as follows:
| Fund | Income earned |
| Fidelity Cash Central Fund | $2,242,897 |
| Fidelity Securities Lending Cash Central Fund | 251,962 |
| Total | $2,494,859 |
Amounts in the income column in the above table include any capital gain distributions from underlying funds, which are presented in the corresponding line-item in the Statement of Operations, if applicable. Amount for Fidelity Securities Lending Cash Central Fund represents the income earned on investing cash collateral, less rebates paid to borrowers and any lending agent fees associated with the loan, plus any premium payments received for lending certain types of securities.
Other Affiliated Issuers
An affiliated company is a company in which the Fund has ownership of at least 5% of the voting securities. Fiscal year to date transactions with companies which are or were affiliates are as follows:
| Affiliate | Value, beginning of period | Purchases | Sales Proceeds | Dividend Income | Realized Gain (loss) | Change in Unrealized appreciation (depreciation) | Value, end of period |
| Genesis Land Development Corp. | $5,698,551 | $708,727 | $-- | $-- | $-- | $(1,586,535) | $4,820,743 |
| Kirindo Holdings Co. Ltd. | 9,066,764 | -- | -- | 190,816 | -- | 3,902,963 | 12,969,727 |
| Knights Group Holdings PLC | 9,077,384 | 26,190 | 6,267,393 | 57,235 | 2,900,822 | 3,073,209 | -- |
| McColl's Retail Group PLC | 11,518,286 | 2,062,257 | -- | 222,252 | -- | (7,908,761) | 5,671,782 |
| Servcorp Ltd. | 8,399,066 | 3,313,084 | -- | 670,700 | -- | 3,423,023 | 15,135,173 |
| SHW Group | 6,787,336 | 1,325,267 | 7,192,981 | 12,556 | (3,774,086) | 2,854,464 | -- |
| SomnoMed Ltd. | 3,006,793 | 2,391,129 | 1,265,676 | -- | (1,485,240) | 4,375,852 | 7,022,858 |
| Ten Entertainment Group PLC | 11,133,306 | 1,655,014 | -- | 576,524 | -- | 1,808,470 | 14,596,790 |
| Total | $64,687,486 | $11,481,668 | $14,726,050 | $1,730,083 | $(2,358,504) | $9,942,685 | $60,217,073 |
Investment Valuation
The following is a summary of the inputs used, as of October 31, 2019, involving the Fund's assets and liabilities carried at fair value. The inputs or methodology used for valuing securities may not be an indication of the risk associated with investing in those securities. For more information on valuation inputs, and their aggregation into the levels used below, please refer to the Investment Valuation section in the accompanying Notes to Financial Statements.
| | Valuation Inputs at Reporting Date: |
| Description | Total | Level 1 | Level 2 | Level 3 |
| Investments in Securities: | | | | |
| Equities: | | | | |
| Communication Services | $61,274,433 | $40,269,012 | $21,005,421 | $-- |
| Consumer Discretionary | 311,467,267 | 116,306,456 | 195,160,811 | -- |
| Consumer Staples | 235,742,195 | 111,340,732 | 124,401,463 | -- |
| Energy | 81,401,718 | 43,908,356 | 37,493,362 | -- |
| Financials | 302,595,312 | 210,069,490 | 92,525,822 | -- |
| Health Care | 152,593,432 | 59,572,726 | 93,020,706 | -- |
| Industrials | 521,919,698 | 301,872,342 | 220,047,356 | -- |
| Information Technology | 184,315,991 | 55,595,553 | 128,720,426 | 12 |
| Materials | 233,110,174 | 139,611,849 | 93,498,324 | 1 |
| Real Estate | 208,350,818 | 98,266,405 | 110,040,162 | 44,251 |
| Utilities | 10,285,999 | -- | 10,285,999 | -- |
| Investment Companies | 35,980,356 | 35,980,356 | -- | -- |
| Money Market Funds | 109,159,326 | 109,159,326 | -- | -- |
| Total Investments in Securities: | $2,448,196,719 | $1,321,952,603 | $1,126,199,852 | $44,264 |
See accompanying notes which are an integral part of the financial statements.
Financial Statements
Statement of Assets and Liabilities
| | | October 31, 2019 |
| Assets | | |
Investment in securities, at value (including securities loaned of $9,649,880) — See accompanying schedule:
Unaffiliated issuers (cost $2,170,467,476) | $2,278,820,320 | |
| Fidelity Central Funds (cost $109,150,428) | 109,159,326 | |
| Other affiliated issuers (cost $65,802,323) | 60,217,073 | |
| Total Investment in Securities (cost $2,345,420,227) | | $2,448,196,719 |
| Cash | | 23,638 |
| Foreign currency held at value (cost $600,860) | | 600,377 |
| Receivable for investments sold | | 11,361,458 |
| Receivable for fund shares sold | | 9,106,672 |
| Dividends receivable | | 7,434,581 |
| Distributions receivable from Fidelity Central Funds | | 182,456 |
| Prepaid expenses | | 4,038 |
| Other receivables | | 68,420 |
| Total assets | | 2,476,978,359 |
| Liabilities | | |
| Payable for investments purchased | $10,983,465 | |
| Payable for fund shares redeemed | 1,988,297 | |
| Accrued management fee | 1,717,054 | |
| Distribution and service plan fees payable | 47,819 | |
| Other affiliated payables | 413,995 | |
| Other payables and accrued expenses | 486,073 | |
| Collateral on securities loaned | 10,170,477 | |
| Total liabilities | | 25,807,180 |
| Net Assets | | $2,451,171,179 |
| Net Assets consist of: | | |
| Paid in capital | | $2,323,701,838 |
| Total accumulated earnings (loss) | | 127,469,341 |
| Net Assets | | $2,451,171,179 |
| Net Asset Value and Maximum Offering Price | | |
| Class A: | | |
| Net Asset Value and redemption price per share ($105,786,097 ÷ 4,019,676 shares)(a) | | $26.32 |
| Maximum offering price per share (100/94.25 of $26.32) | | $27.93 |
| Class M: | | |
| Net Asset Value and redemption price per share ($16,013,028 ÷ 611,620 shares)(a) | | $26.18 |
| Maximum offering price per share (100/96.50 of $26.18) | | $27.13 |
| Class C: | | |
| Net Asset Value and offering price per share ($23,937,050 ÷ 947,429 shares)(a) | | $25.27 |
| International Small Cap: | | |
| Net Asset Value, offering price and redemption price per share ($1,282,411,741 ÷ 47,738,476 shares) | | $26.86 |
| Class I: | | |
| Net Asset Value, offering price and redemption price per share ($777,771,442 ÷ 28,772,148 shares) | | $27.03 |
| Class Z: | | |
| Net Asset Value, offering price and redemption price per share ($245,251,821 ÷ 9,074,375 shares) | | $27.03 |
(a) Redemption price per share is equal to net asset value less any applicable contingent deferred sales charge.
See accompanying notes which are an integral part of the financial statements.
Statement of Operations
| | | Year ended October 31, 2019 |
| Investment Income | | |
| Dividends (including $1,730,083 earned from other affiliated issuers) | | $76,503,985 |
| Income from Fidelity Central Funds (including $251,962 from security lending) | | 2,494,859 |
| Income before foreign taxes withheld | | 78,998,844 |
| Less foreign taxes withheld | | (6,105,280) |
| Total income | | 72,893,564 |
| Expenses | | |
| Management fee | | |
| Basic fee | $17,925,594 | |
| Performance adjustment | 1,929,394 | |
| Transfer agent fees | 3,854,969 | |
| Distribution and service plan fees | 641,338 | |
| Accounting and security lending fees | 941,552 | |
| Custodian fees and expenses | 409,809 | |
| Independent trustees' fees and expenses | 11,890 | |
| Registration fees | 212,694 | |
| Audit | 102,805 | |
| Legal | 4,297 | |
| Miscellaneous | 14,594 | |
| Total expenses before reductions | 26,048,936 | |
| Expense reductions | (144,201) | |
| Total expenses after reductions | | 25,904,735 |
| Net investment income (loss) | | 46,988,829 |
| Realized and Unrealized Gain (Loss) | | |
| Net realized gain (loss) on: | | |
| Investment securities: | | |
| Unaffiliated issuers | 15,361,230 | |
| Fidelity Central Funds | 1,747 | |
| Other affiliated issuers | (2,358,504) | |
| Foreign currency transactions | (264,800) | |
| Total net realized gain (loss) | | 12,739,673 |
| Change in net unrealized appreciation (depreciation) on: | | |
| Investment securities: | | |
| Unaffiliated issuers (net of increase in deferred foreign taxes of $136,054) | 107,425,491 | |
| Fidelity Central Funds | 91 | |
| Other affiliated issuers | 9,942,685 | |
| Assets and liabilities in foreign currencies | 103,448 | |
| Total change in net unrealized appreciation (depreciation) | | 117,471,715 |
| Net gain (loss) | | 130,211,388 |
| Net increase (decrease) in net assets resulting from operations | | $177,200,217 |
See accompanying notes which are an integral part of the financial statements.
Statement of Changes in Net Assets
| | Year ended October 31, 2019 | Year ended October 31, 2018 |
| Increase (Decrease) in Net Assets | | |
| Operations | | |
| Net investment income (loss) | $46,988,829 | $33,373,258 |
| Net realized gain (loss) | 12,739,673 | 76,767,034 |
| Change in net unrealized appreciation (depreciation) | 117,471,715 | (322,624,797) |
| Net increase (decrease) in net assets resulting from operations | 177,200,217 | (212,484,505) |
| Distributions to shareholders | (106,530,925) | (61,553,254) |
| Share transactions - net increase (decrease) | 413,223,659 | 477,734,571 |
| Redemption fees | – | 48,167 |
| Total increase (decrease) in net assets | 483,892,951 | 203,744,979 |
| Net Assets | | |
| Beginning of period | 1,967,278,228 | 1,763,533,249 |
| End of period | $2,451,171,179 | $1,967,278,228 |
See accompanying notes which are an integral part of the financial statements.
Financial Highlights
Fidelity International Small Cap Fund Class A
| Years ended October 31, | 2019 | 2018 | 2017 | 2016 | 2015 |
| Selected Per–Share Data | | | | | |
| Net asset value, beginning of period | $25.78 | $29.24 | $23.81 | $22.69 | $24.98 |
| Income from Investment Operations | | | | | |
| Net investment income (loss)A | .49 | .38 | .29 | .34 | .27 |
| Net realized and unrealized gain (loss) | 1.43 | (2.87) | 5.70 | 1.64 | 1.05 |
| Total from investment operations | 1.92 | (2.49) | 5.99 | 1.98 | 1.32 |
| Distributions from net investment income | (.38) | (.23) | (.28) | (.25) | (.16) |
| Distributions from net realized gain | (1.00) | (.74) | (.29) | (.62) | (3.45) |
| Total distributions | (1.38) | (.97) | (.57) | (.87) | (3.61) |
| Redemption fees added to paid in capitalA | – | –B | .01 | .01 | –B |
| Net asset value, end of period | $26.32 | $25.78 | $29.24 | $23.81 | $22.69 |
| Total ReturnC,D | 8.00% | (8.83)% | 25.83% | 9.11% | 6.21% |
| Ratios to Average Net AssetsE,F | | | | | |
| Expenses before reductions | 1.47% | 1.49% | 1.55% | 1.61% | 1.59% |
| Expenses net of fee waivers, if any | 1.47% | 1.49% | 1.55% | 1.61% | 1.58% |
| Expenses net of all reductions | 1.46% | 1.48% | 1.55% | 1.61% | 1.58% |
| Net investment income (loss) | 1.94% | 1.33% | 1.11% | 1.50% | 1.18% |
| Supplemental Data | | | | | |
| Net assets, end of period (000 omitted) | $105,786 | $80,395 | $63,459 | $36,480 | $28,238 |
| Portfolio turnover rateG | 28% | 25% | 22% | 29% | 36% |
A Calculated based on average shares outstanding during the period.
B Amount represents less than $.005 per share.
C Total returns would have been lower if certain expenses had not been reduced during the applicable periods shown.
D Total returns do not include the effect of the sales charges.
E Fees and expenses of any underlying Fidelity Central Funds are not included in the Fund's expense ratio. The Fund indirectly bears its proportionate share of the expenses of any underlying Fidelity Central Funds.
F Expense ratios reflect operating expenses of the class. Expenses before reductions do not reflect amounts reimbursed by the investment adviser or reductions from brokerage service arrangements or reductions from other expense offset arrangements and do not represent the amount paid by the class during periods when reimbursements or reductions occur. Expenses net of fee waivers reflect expenses after reimbursement by the investment adviser but prior to reductions from brokerage service arrangements or other expense offset arrangements. Expenses net of all reductions represent the net expenses paid by the class.
G Amount does not include the portfolio activity of any underlying Fidelity Central Funds.
See accompanying notes which are an integral part of the financial statements.
Fidelity International Small Cap Fund Class M
| Years ended October 31, | 2019 | 2018 | 2017 | 2016 | 2015 |
| Selected Per–Share Data | | | | | |
| Net asset value, beginning of period | $25.62 | $29.07 | $23.65 | $22.55 | $24.81 |
| Income from Investment Operations | | | | | |
| Net investment income (loss)A | .41 | .30 | .21 | .27 | .21 |
| Net realized and unrealized gain (loss) | 1.43 | (2.86) | 5.69 | 1.63 | 1.04 |
| Total from investment operations | 1.84 | (2.56) | 5.90 | 1.90 | 1.25 |
| Distributions from net investment income | (.27) | (.15) | (.19) | (.19) | (.06) |
| Distributions from net realized gain | (1.00) | (.74) | (.29) | (.62) | (3.45) |
| Total distributions | (1.28)B | (.89) | (.48) | (.81) | (3.51) |
| Redemption fees added to paid in capitalA | – | –C | –C | .01 | –C |
| Net asset value, end of period | $26.18 | $25.62 | $29.07 | $23.65 | $22.55 |
| Total ReturnD,E | 7.65% | (9.10)% | 25.47% | 8.79% | 5.90% |
| Ratios to Average Net AssetsF,G | | | | | |
| Expenses before reductions | 1.78% | 1.77% | 1.84% | 1.90% | 1.87% |
| Expenses net of fee waivers, if any | 1.78% | 1.77% | 1.84% | 1.90% | 1.86% |
| Expenses net of all reductions | 1.77% | 1.76% | 1.84% | 1.90% | 1.86% |
| Net investment income (loss) | 1.62% | 1.05% | .82% | 1.21% | .90% |
| Supplemental Data | | | | | |
| Net assets, end of period (000 omitted) | $16,013 | $16,362 | $18,148 | $13,331 | $12,400 |
| Portfolio turnover rateH | 28% | 25% | 22% | 29% | 36% |
A Calculated based on average shares outstanding during the period.
B Total distributions of $1.28 per share is comprised of distributions from net investment income of $.274 and distributions from net realized gain of $1.002 per share.
C Amount represents less than $.005 per share.
D Total returns would have been lower if certain expenses had not been reduced during the applicable periods shown.
E Total returns do not include the effect of the sales charges.
F Fees and expenses of any underlying Fidelity Central Funds are not included in the Fund's expense ratio. The Fund indirectly bears its proportionate share of the expenses of any underlying Fidelity Central Funds.
G Expense ratios reflect operating expenses of the class. Expenses before reductions do not reflect amounts reimbursed by the investment adviser or reductions from brokerage service arrangements or reductions from other expense offset arrangements and do not represent the amount paid by the class during periods when reimbursements or reductions occur. Expenses net of fee waivers reflect expenses after reimbursement by the investment adviser but prior to reductions from brokerage service arrangements or other expense offset arrangements. Expenses net of all reductions represent the net expenses paid by the class.
H Amount does not include the portfolio activity of any underlying Fidelity Central Funds.
See accompanying notes which are an integral part of the financial statements.
Fidelity International Small Cap Fund Class C
| Years ended October 31, | 2019 | 2018 | 2017 | 2016 | 2015 |
| Selected Per–Share Data | | | | | |
| Net asset value, beginning of period | $24.77 | $28.21 | $22.97 | $21.96 | $24.27 |
| Income from Investment Operations | | | | | |
| Net investment income (loss)A | .28 | .16 | .08 | .16 | .09 |
| Net realized and unrealized gain (loss) | 1.39 | (2.76) | 5.53 | 1.59 | 1.02 |
| Total from investment operations | 1.67 | (2.60) | 5.61 | 1.75 | 1.11 |
| Distributions from net investment income | (.17) | (.10) | (.08) | (.13) | – |
| Distributions from net realized gain | (1.00) | (.74) | (.29) | (.62) | (3.42) |
| Total distributions | (1.17) | (.84) | (.37) | (.75) | (3.42) |
| Redemption fees added to paid in capitalA | – | –B | –B | .01 | –B |
| Net asset value, end of period | $25.27 | $24.77 | $28.21 | $22.97 | $21.96 |
| Total ReturnC,D | 7.17% | (9.51)% | 24.85% | 8.26% | 5.37% |
| Ratios to Average Net AssetsE,F | | | | | |
| Expenses before reductions | 2.24% | 2.24% | 2.33% | 2.40% | 2.36% |
| Expenses net of fee waivers, if any | 2.24% | 2.24% | 2.33% | 2.40% | 2.35% |
| Expenses net of all reductions | 2.23% | 2.23% | 2.32% | 2.39% | 2.35% |
| Net investment income (loss) | 1.16% | .58% | .33% | .71% | .41% |
| Supplemental Data | | | | | |
| Net assets, end of period (000 omitted) | $23,937 | $41,918 | $26,005 | $12,187 | $11,359 |
| Portfolio turnover rateG | 28% | 25% | 22% | 29% | 36% |
A Calculated based on average shares outstanding during the period.
B Amount represents less than $.005 per share.
C Total returns would have been lower if certain expenses had not been reduced during the applicable periods shown.
D Total returns do not include the effect of the contingent deferred sales charge.
E Fees and expenses of any underlying Fidelity Central Funds are not included in the Fund's expense ratio. The Fund indirectly bears its proportionate share of the expenses of any underlying Fidelity Central Funds.
F Expense ratios reflect operating expenses of the class. Expenses before reductions do not reflect amounts reimbursed by the investment adviser or reductions from brokerage service arrangements or reductions from other expense offset arrangements and do not represent the amount paid by the class during periods when reimbursements or reductions occur. Expenses net of fee waivers reflect expenses after reimbursement by the investment adviser but prior to reductions from brokerage service arrangements or other expense offset arrangements. Expenses net of all reductions represent the net expenses paid by the class.
G Amount does not include the portfolio activity of any underlying Fidelity Central Funds.
See accompanying notes which are an integral part of the financial statements.
Fidelity International Small Cap Fund
| Years ended October 31, | 2019 | 2018 | 2017 | 2016 | 2015 |
| Selected Per–Share Data | | | | | |
| Net asset value, beginning of period | $26.29 | $29.77 | $24.23 | $23.06 | $25.34 |
| Income from Investment Operations | | | | | |
| Net investment income (loss)A | .57 | .48 | .37 | .40 | .34 |
| Net realized and unrealized gain (loss) | 1.45 | (2.93) | 5.79 | 1.67 | 1.07 |
| Total from investment operations | 2.02 | (2.45) | 6.16 | 2.07 | 1.41 |
| Distributions from net investment income | (.45) | (.29) | (.34) | (.29) | (.24) |
| Distributions from net realized gain | (1.00) | (.74) | (.29) | (.62) | (3.45) |
| Total distributions | (1.45) | (1.03) | (.63) | (.91) | (3.69) |
| Redemption fees added to paid in capitalA | – | –B | .01 | .01 | –B |
| Net asset value, end of period | $26.86 | $26.29 | $29.77 | $24.23 | $23.06 |
| Total ReturnC | 8.27% | (8.54)% | 26.18% | 9.39% | 6.53% |
| Ratios to Average Net AssetsD,E | | | | | |
| Expenses before reductions | 1.19% | 1.20% | 1.25% | 1.34% | 1.31% |
| Expenses net of fee waivers, if any | 1.19% | 1.20% | 1.25% | 1.34% | 1.31% |
| Expenses net of all reductions | 1.18% | 1.19% | 1.24% | 1.33% | 1.31% |
| Net investment income (loss) | 2.22% | 1.62% | 1.41% | 1.77% | 1.45% |
| Supplemental Data | | | | | |
| Net assets, end of period (000 omitted) | $1,282,412 | $1,256,193 | $1,418,452 | $906,420 | $811,534 |
| Portfolio turnover rateF | 28% | 25% | 22% | 29% | 36% |
A Calculated based on average shares outstanding during the period.
B Amount represents less than $.005 per share.
C Total returns would have been lower if certain expenses had not been reduced during the applicable periods shown.
D Fees and expenses of any underlying Fidelity Central Funds are not included in the Fund's expense ratio. The Fund indirectly bears its proportionate share of the expenses of any underlying Fidelity Central Funds.
E Expense ratios reflect operating expenses of the class. Expenses before reductions do not reflect amounts reimbursed by the investment adviser or reductions from brokerage service arrangements or reductions from other expense offset arrangements and do not represent the amount paid by the class during periods when reimbursements or reductions occur. Expenses net of fee waivers reflect expenses after reimbursement by the investment adviser but prior to reductions from brokerage service arrangements or other expense offset arrangements. Expenses net of all reductions represent the net expenses paid by the class.
F Amount does not include the portfolio activity of any underlying Fidelity Central Funds.
See accompanying notes which are an integral part of the financial statements.
Fidelity International Small Cap Fund Class I
| Years ended October 31, | 2019 | 2018 | 2017 | 2016 | 2015 |
| Selected Per–Share Data | | | | | |
| Net asset value, beginning of period | $26.45 | $29.97 | $24.42 | $23.24 | $25.34 |
| Income from Investment Operations | | | | | |
| Net investment income (loss)A | .58 | .47 | .38 | .41 | .36 |
| Net realized and unrealized gain (loss) | 1.46 | (2.95) | 5.82 | 1.69 | 1.07 |
| Total from investment operations | 2.04 | (2.48) | 6.20 | 2.10 | 1.43 |
| Distributions from net investment income | (.46) | (.30) | (.37) | (.31) | (.08) |
| Distributions from net realized gain | (1.00) | (.74) | (.29) | (.62) | (3.45) |
| Total distributions | (1.46) | (1.04) | (.66) | (.93) | (3.53) |
| Redemption fees added to paid in capitalA | – | –B | .01 | .01 | –B |
| Net asset value, end of period | $27.03 | $26.45 | $29.97 | $24.42 | $23.24 |
| Total ReturnC | 8.28% | (8.58)% | 26.17% | 9.43% | 6.60% |
| Ratios to Average Net AssetsD,E | | | | | |
| Expenses before reductions | 1.19% | 1.21% | 1.28% | 1.31% | 1.24% |
| Expenses net of fee waivers, if any | 1.18% | 1.21% | 1.28% | 1.31% | 1.23% |
| Expenses net of all reductions | 1.18% | 1.20% | 1.27% | 1.31% | 1.23% |
| Net investment income (loss) | 2.22% | 1.61% | 1.39% | 1.80% | 1.53% |
| Supplemental Data | | | | | |
| Net assets, end of period (000 omitted) | $777,771 | $564,988 | $237,469 | $22,727 | $10,070 |
| Portfolio turnover rateF | 28% | 25% | 22% | 29% | 36% |
A Calculated based on average shares outstanding during the period.
B Amount represents less than $.005 per share.
C Total returns would have been lower if certain expenses had not been reduced during the applicable periods shown.
D Fees and expenses of any underlying Fidelity Central Funds are not included in the Fund's expense ratio. The Fund indirectly bears its proportionate share of the expenses of any underlying Fidelity Central Funds.
E Expense ratios reflect operating expenses of the class. Expenses before reductions do not reflect amounts reimbursed by the investment adviser or reductions from brokerage service arrangements or reductions from other expense offset arrangements and do not represent the amount paid by the class during periods when reimbursements or reductions occur. Expenses net of fee waivers reflect expenses after reimbursement by the investment adviser but prior to reductions from brokerage service arrangements or other expense offset arrangements. Expenses net of all reductions represent the net expenses paid by the class.
F Amount does not include the portfolio activity of any underlying Fidelity Central Funds.
See accompanying notes which are an integral part of the financial statements.
Fidelity International Small Cap Fund Class Z
| Years ended October 31, | 2019 | 2018 A |
| Selected Per–Share Data | | |
| Net asset value, beginning of period | $26.46 | $28.78 |
| Income from Investment Operations | | |
| Net investment income (loss)B | .61 | .03 |
| Net realized and unrealized gain (loss) | 1.47 | (2.35) |
| Total from investment operations | 2.08 | (2.32) |
| Distributions from net investment income | (.50) | – |
| Distributions from net realized gain | (1.00) | – |
| Total distributions | (1.51)C | – |
| Net asset value, end of period | $27.03 | $26.46 |
| Total ReturnD,E | 8.44% | (8.06)% |
| Ratios to Average Net AssetsF,G | | |
| Expenses before reductions | 1.05% | 1.15%H |
| Expenses net of fee waivers, if any | 1.05% | 1.15%H |
| Expenses net of all reductions | 1.04% | 1.14%H |
| Net investment income (loss) | 2.35% | 2.01%H |
| Supplemental Data | | |
| Net assets, end of period (000 omitted) | $245,252 | $7,421 |
| Portfolio turnover rateI | 28% | 25% |
A For the period October 2, 2018 (commencement of sale of shares) to October 31, 2018.
B Calculated based on average shares outstanding during the period.
C Total distributions of $1.51 per share is comprised of distributions from net investment income of $.504 and distributions from net realized gain of $1.002 per share.
D Total returns for periods of less than one year are not annualized.
E Total returns would have been lower if certain expenses had not been reduced during the applicable periods shown.
F Fees and expenses of any underlying Fidelity Central Funds are not included in the Fund's expense ratio. The Fund indirectly bears its proportionate share of the expenses of any underlying Fidelity Central Funds.
G Expense ratios reflect operating expenses of the class. Expenses before reductions do not reflect amounts reimbursed by the investment adviser or reductions from brokerage service arrangements or reductions from other expense offset arrangements and do not represent the amount paid by the class during periods when reimbursements or reductions occur. Expense ratios before reductions for start-up periods may not be representative of longer-term operating periods. Expenses net of fee waivers reflect expenses after reimbursement by the investment adviser but prior to reductions from brokerage service arrangements or other expense offset arrangements. Expenses net of all reductions represent the net expenses paid by the class.
H Annualized
I Amount does not include the portfolio activity of any underlying Fidelity Central Funds.
See accompanying notes which are an integral part of the financial statements.
Notes to Financial Statements
For the period ended October 31, 2019
1. Organization.
Fidelity International Small Cap Fund (the Fund) is a fund of Fidelity Investment Trust (the Trust) and is authorized to issue an unlimited number of shares. The Trust is registered under the Investment Company Act of 1940, as amended (the 1940 Act), as an open-end management investment company organized as a Massachusetts business trust. The Fund offers Class A, Class M, Class C, International Small Cap, Class I and Class Z shares, each of which has equal rights as to assets and voting privileges. Each class has exclusive voting rights with respect to matters that affect that class. Effective March 1, 2019, Class C shares will automatically convert to Class A shares after a holding period of ten years from the initial date of purchase, with certain exceptions. The Fund's investments in emerging markets can be subject to social, economic, regulatory, and political uncertainties and can be extremely volatile.
2. Investments in Fidelity Central Funds.
The Fund invests in Fidelity Central Funds, which are open-end investment companies generally available only to other investment companies and accounts managed by the investment adviser and its affiliates. The Fund's Schedule of Investments lists each of the Fidelity Central Funds held as of period end, if any, as an investment of the Fund, but does not include the underlying holdings of each Fidelity Central Fund. As an Investing Fund, the Fund indirectly bears its proportionate share of the expenses of the underlying Fidelity Central Funds.
The Money Market Central Funds seek preservation of capital and current income and are managed by Fidelity Investments Money Management, Inc. (FIMM), an affiliate of the investment adviser. Annualized expenses of the Money Market Central Funds as of their most recent shareholder report date ranged from less than .005% to .01%.
A complete unaudited list of holdings for each Fidelity Central Fund is available upon request or at the Securities and Exchange Commission (the SEC) website at www.sec.gov. In addition, the financial statements of the Fidelity Central Funds, which are not covered by the Fund's Report of Independent Registered Public Accounting Firm, are available on the SEC website or upon request.
3. Significant Accounting Policies.
The Fund is an investment company and applies the accounting and reporting guidance of the Financial Accounting Standards Board (FASB) Accounting Standards Codification Topic 946 Financial Services – Investments Companies. The financial statements have been prepared in conformity with accounting principles generally accepted in the United States of America (GAAP), which require management to make certain estimates and assumptions at the date of the financial statements. Actual results could differ from those estimates. Subsequent events, if any, through the date that the financial statements were issued have been evaluated in the preparation of the financial statements. The following summarizes the significant accounting policies of the Fund:
Investment Valuation. Investments are valued as of 4:00 p.m. Eastern time on the last calendar day of the period. The Board of Trustees (the Board) has delegated the day to day responsibility for the valuation of the Fund's investments to the Fair Value Committee (the Committee) established by the Fund's investment adviser. In accordance with valuation policies and procedures approved by the Board, the Fund attempts to obtain prices from one or more third party pricing vendors or brokers to value its investments. When current market prices, quotations or currency exchange rates are not readily available or reliable, investments will be fair valued in good faith by the Committee, in accordance with procedures adopted by the Board. Factors used in determining fair value vary by investment type and may include market or investment specific events. The frequency with which these procedures are used cannot be predicted and they may be utilized to a significant extent. The Committee oversees the Fund's valuation policies and procedures and reports to the Board on the Committee's activities and fair value determinations. The Board monitors the appropriateness of the procedures used in valuing the Fund's investments and ratifies the fair value determinations of the Committee.
The Fund categorizes the inputs to valuation techniques used to value its investments into a disclosure hierarchy consisting of three levels as shown below:
- Level 1 – quoted prices in active markets for identical investments
- Level 2 – other significant observable inputs (including quoted prices for similar investments, interest rates, prepayment speeds, etc.)
- Level 3 – unobservable inputs (including the Fund's own assumptions based on the best information available)
Valuation techniques used to value the Fund's investments by major category are as follows:
Equity securities, including restricted securities, for which market quotations are readily available, are valued at the last reported sale price or official closing price as reported by a third party pricing vendor on the primary market or exchange on which they are traded and are categorized as Level 1 in the hierarchy. In the event there were no sales during the day or closing prices are not available, securities are valued at the last quoted bid price or may be valued using the last available price and are generally categorized as Level 2 in the hierarchy. For foreign equity securities, when market or security specific events arise, comparisons to the valuation of American Depositary Receipts (ADRs), futures contracts, Exchange-Traded Funds (ETFs) and certain indexes as well as quoted prices for similar securities may be used and would be categorized as Level 2 in the hierarchy. For equity securities, including restricted securities, where observable inputs are limited, assumptions about market activity and risk are used and these securities may be categorized as Level 3 in the hierarchy.
Investments in open-end mutual funds, including the Fidelity Central Funds, are valued at their closing net asset value (NAV) each business day and are categorized as Level 1 in the hierarchy.
Changes in valuation techniques may result in transfers in or out of an assigned level within the disclosure hierarchy. The aggregate value of investments by input level as of October 31, 2019 is included at the end of the Fund's Schedule of Investments.
Foreign Currency. The Fund may use foreign currency contracts to facilitate transactions in foreign-denominated securities. Gains and losses from these transactions may arise from changes in the value of the foreign currency or if the counterparties do not perform under the contracts' terms.
Foreign-denominated assets, including investment securities, and liabilities are translated into U.S. dollars at the exchange rates at period end. Purchases and sales of investment securities, income and dividends received and expenses denominated in foreign currencies are translated into U.S. dollars at the exchange rate in effect on the transaction date.
The effects of exchange rate fluctuations on investments are included with the net realized and unrealized gain (loss) on investment securities. Other foreign currency transactions resulting in realized and unrealized gain (loss) are disclosed separately.
Investment Transactions and Income. For financial reporting purposes, the Fund's investment holdings and NAV include trades executed through the end of the last business day of the period. The NAV per share for processing shareholder transactions is calculated as of the close of business of the New York Stock Exchange (NYSE), normally 4:00 p.m. Eastern time and includes trades executed through the end of the prior business day. Gains and losses on securities sold are determined on the basis of identified cost and include proceeds received from litigation. Dividend income is recorded on the ex-dividend date, except for certain dividends from foreign securities where the ex-dividend date may have passed, which are recorded as soon as the Fund is informed of the ex-dividend date. Non-cash dividends included in dividend income, if any, are recorded at the fair market value of the securities received. Income and capital gain distributions from Fidelity Central Funds, if any, are recorded on the ex-dividend date. Certain distributions received by the Fund represent a return of capital or capital gain. The Fund determines the components of these distributions subsequent to the ex-dividend date, based upon receipt of tax filings or other correspondence relating to the underlying investment. These distributions are recorded as a reduction of cost of investments and/or as a realized gain. Investment income is recorded net of foreign taxes withheld where recovery of such taxes is uncertain.
Class Allocations and Expenses. Investment income, realized and unrealized capital gains and losses, common expenses of the Fund, and certain fund-level expense reductions, if any, are allocated daily on a pro-rata basis to each class based on the relative net assets of each class to the total net assets of the Fund. Each class differs with respect to transfer agent and distribution and service plan fees incurred. Certain expense reductions may also differ by class. For the reporting period, the allocated portion of income and expenses to each class as a percent of its average net assets may vary due to the timing of recording these transactions in relation to fluctuating net assets of the classes. Expenses directly attributable to a fund are charged to that fund. Expenses attributable to more than one fund are allocated among the respective funds on the basis of relative net assets or other appropriate methods. Expense estimates are accrued in the period to which they relate and adjustments are made when actual amounts are known.
Income Tax Information and Distributions to Shareholders. Each year, the Fund intends to qualify as a regulated investment company under Subchapter M of the Internal Revenue Code, including distributing substantially all of its taxable income and realized gains. As a result, no provision for U.S. Federal income taxes is required. As of October 31, 2019, the Fund did not have any unrecognized tax benefits in the financial statements; nor is the Fund aware of any tax positions for which it is reasonably possible that the total amounts of unrecognized tax benefits will significantly change in the next twelve months. The Fund files a U.S. federal tax return, in addition to state and local tax returns as required. The Fund's federal income tax returns are subject to examination by the Internal Revenue Service (IRS) for a period of three fiscal years after they are filed. State and local tax returns may be subject to examination for an additional fiscal year depending on the jurisdiction. Foreign taxes are provided for based on the Fund's understanding of the tax rules and rates that exist in the foreign markets in which it invests. The Fund is subject to a tax imposed on capital gains by certain countries in which it invests. An estimated deferred tax liability for net unrealized appreciation on the applicable securities is included in Other payables and accrued expenses on the Statement of Assets & Liabilities.
Distributions are declared and recorded on the ex-dividend date. Income and capital gain distributions are declared separately for each class. Income and capital gain distributions are determined in accordance with income tax regulations, which may differ from GAAP. In addition, the Fund claimed a portion of the payment made to redeeming shareholders as a distribution for income tax purposes.
Capital accounts within the financial statements are adjusted for permanent book-tax differences. These adjustments have no impact on net assets or the results of operations. Capital accounts are not adjusted for temporary book-tax differences which will reverse in a subsequent period.
Book-tax differences are primarily due to foreign currency transactions, certain foreign taxes, passive foreign investment companies (PFIC) and losses deferred due to wash sales.
As of period end, the cost and unrealized appreciation (depreciation) in securities, and derivatives if applicable, for federal income tax purposes were as follows:
| Gross unrealized appreciation | $348,758,646 |
| Gross unrealized depreciation | (276,421,271) |
| Net unrealized appreciation (depreciation) | $72,337,375 |
| Tax Cost | $2,375,859,344 |
The tax-based components of distributable earnings as of period end were as follows:
| Undistributed ordinary income | $51,270,872 |
| Undistributed long-term capital gain | $4,048,751 |
| Net unrealized appreciation (depreciation) on securities and other investments | $72,323,268 |
The tax character of distributions paid was as follows:
| | October 31, 2019 | October 31, 2018 |
| Ordinary Income | $32,698,873 | $ 36,178,814 |
| Long-term Capital Gains | 73,832,052 | 25,374,442 |
| Total | $106,530,925 | $ 61,553,256 |
Restricted Securities. The Fund may invest in securities that are subject to legal or contractual restrictions on resale. These securities generally may be resold in transactions exempt from registration or to the public if the securities are registered. Disposal of these securities may involve time-consuming negotiations and expense, and prompt sale at an acceptable price may be difficult. Information regarding restricted securities is included at the end of the Fund's Schedule of Investments.
4. Purchases and Sales of Investments.
Purchases and sales of securities, other than short-term securities, aggregated $892,320,154 and $574,327,468, respectively.
5. Fees and Other Transactions with Affiliates.
Management Fee. Fidelity Management & Research Company (the investment adviser) and its affiliates provide the Fund with investment management related services for which the Fund pays a monthly management fee. The management fee is the sum of an individual fund fee rate that is based on an annual rate of .60% of the Fund's average net assets and an annualized group fee rate that averaged .24% during the period. The group fee rate is based upon the average net assets of all the mutual funds advised by the investment adviser, including any mutual funds previously advised by the investment adviser that are currently advised by Fidelity SelectCo, LLC, an affiliate of the investment adviser. The group fee rate decreases as assets under management increase and increases as assets under management decrease. In addition, the management fee is subject to a performance adjustment (up to a maximum of +/- .20% of the Fund's average net assets over a 36 month performance period). The upward or downward adjustment to the management fee is based on the relative investment performance of International Small Cap as compared to its benchmark index, the MSCI ACWI (All Country World Index) ex USA Small Cap Index, over the same 36 month performance period. For the reporting period, the total annual management fee rate, including the performance adjustment, was .93% of the Fund's average net assets. The performance adjustment included in the management fee rate may be higher or lower than the maximum performance adjustment rate due to the difference between the average net assets for the reporting and performance periods.
Distribution and Service Plan Fees. In accordance with Rule 12b-1 of the 1940 Act, the Fund has adopted separate Distribution and Service Plans for each class of shares. Certain classes pay Fidelity Distributors Corporation (FDC), an affiliate of the investment adviser, separate Distribution and Service Fees, each of which is based on an annual percentage of each class' average net assets. In addition, FDC may pay financial intermediaries for selling shares of the Fund and providing shareholder support services. For the period, the Distribution and Service Fee rates, total fees and amounts retained by FDC were as follows:
| | Distribution Fee | Service Fee | Total Fees | Retained by FDC |
| Class A | -% | .25% | $251,268 | $6,523 |
| Class M | .25% | .25% | 79,337 | 147 |
| Class C | .75% | .25% | 310,733 | 75,615 |
| | | | $641,338 | $82,285 |
Sales Load. FDC may receive a front-end sales charge of up to 5.75% for selling Class A shares and 3.50% for selling Class M shares, some of which is paid to financial intermediaries for selling shares of the Fund. Depending on the holding period, FDC may receive contingent deferred sales charges levied on Class A, Class M and Class C redemptions. The deferred sales charges are 1.00% for Class C shares, 1.00% for certain purchases of Class A shares and .25% for certain purchases of Class M shares.
For the period, sales charge amounts retained by FDC were as follows:
| | Retained by FDC |
| Class A | $26,800 |
| Class M | 2,934 |
| Class C(a) | 8,015 |
| | $37,749 |
(a) When Class C shares are initially sold, FDC pays commissions from its own resources to financial intermediaries through which the sales are made.
Transfer Agent Fees. Fidelity Investments Institutional Operations Company, Inc., (FIIOC), an affiliate of the investment adviser, is the transfer, dividend disbursing and shareholder servicing agent for each class of the Fund. FIIOC receives account fees and asset-based fees that vary according to the account size and type of account of the shareholders of the respective classes of the Fund, except for Class Z. FIIOC receives an asset-based fee of Class Z's average net assets. FIIOC pays for typesetting, printing and mailing of shareholder reports, except proxy statements.
For the period, transfer agent fees for each class were as follows:
| | Amount | % of Class-Level Average Net Assets |
| Class A | $214,598 | .21 |
| Class M | 43,686 | .28 |
| Class C | 71,230 | .23 |
| International Small Cap | 2,282,954 | .18 |
| Class I | 1,202,671 | .18 |
| Class Z | 39,830 | .04 |
| | $3,854,969 | |
Accounting and Security Lending Fees. Fidelity Service Company, Inc. (FSC), an affiliate of the investment adviser, maintains the Fund's accounting records. The accounting fee is based on the level of average net assets for each month. Prior to April 1, 2019, FSC had a separate agreement with the Fund for administration of the security lending program, based on the number and duration of lending transactions. For the period, the total fees paid for accounting and administration of securities lending were equivalent to an annual rate of .04%.
Brokerage Commissions. The Fund placed a portion of its portfolio transactions with brokerage firms which are affiliates of the investment adviser. Brokerage commissions are included in net realized gain (loss) and change in net unrealized appreciation (depreciation) in the Statement of Operations. The commissions paid to these affiliated firms were $1,854 for the period.
Interfund Trades. The Fund may purchase from or sell securities to other Fidelity Funds under procedures adopted by the Board. The procedures have been designed to ensure these interfund trades are executed in accordance with Rule 17a-7 of the 1940 Act. Interfund trades are included within the respective purchases and sales amounts shown in the Purchases and Sales of Investments note.
6. Committed Line of Credit.
The Fund participates with other funds managed by the investment adviser or an affiliate in a $4.25 billion credit facility (the "line of credit") to be utilized for temporary or emergency purposes to fund shareholder redemptions or for other short-term liquidity purposes. The Fund has agreed to pay commitment fees on its pro-rata portion of the line of credit, which amounted to $5,592 and is reflected in Miscellaneous expenses on the Statement of Operations. During the period, the Fund did not borrow on this line of credit.
7. Security Lending.
The Fund lends portfolio securities from time to time in order to earn additional income. For equity securities, lending agents are used, including National Financial Services (NFS), an affiliate of the Fund. Pursuant to a securities lending agreement, NFS will receive a fee, which is capped at 9.9% of daily lending revenue, for its services as lending agent. The Fund may lend securities to certain qualified borrowers, including NFS. On the settlement date of the loan, the Fund receives collateral (in the form of U.S. Treasury obligations, letters of credit and/or cash) against the loaned securities and maintains collateral in an amount not less than 100% of the market value of the loaned securities during the period of the loan. The market value of the loaned securities is determined at the close of business of the Fund and any additional required collateral is delivered to the Fund on the next business day. The Fund or borrower may terminate the loan at any time, and if the borrower defaults on its obligation to return the securities loaned because of insolvency or other reasons, the Fund may apply collateral received from the borrower against the obligation. The Fund may experience delays and costs in recovering the securities loaned. Any cash collateral received is invested in the Fidelity Securities Lending Cash Central Fund. The value of loaned securities and cash collateral at period end are disclosed on the Fund's Statement of Assets and Liabilities. Security lending income represents the income earned on investing cash collateral, less rebates paid to borrowers and any lending agent fees associated with the loan, plus any premium payments received for lending certain types of securities. Security lending income is presented in the Statement of Operations as a component of income from Fidelity Central Funds. During the period, there were no securities loaned to NFS.
8. Expense Reductions.
Commissions paid to certain brokers with whom the investment adviser, or its affiliates, places trades on behalf of the Fund include an amount in addition to trade execution, which may be rebated back to the Fund to offset certain expenses. This amount totaled $111,128 for the period. In addition, through arrangements with the Fund's custodian, credits realized as a result of certain uninvested cash balances were used to reduce the Fund's expenses. During the period, custodian credits reduced the Fund's expenses by $1,974.
In addition, during the period the investment adviser reimbursed and/or waived a portion of fund-level operating expenses in the amount of $15,098 and a portion of class-level operating expenses as follows:
| | Amount |
| Class A | $778 |
| Class M | 122 |
| Class C | 297 |
| International Small Cap | 9,783 |
| Class I | 4,713 |
| Class Z | 308 |
| | $16,001 |
9. Distributions to Shareholders.
Distributions to shareholders of each class were as follows:
| | Year ended
October 31, 2019 | Year ended
October 31, 2018(a) |
| Distributions to shareholders | | |
| Class A | $4,227,273 | $2,150,704 |
| Class M | 800,268 | 588,707 |
| Class C | 1,885,280 | 853,838 |
| International Small Cap | 68,518,204 | 49,080,231 |
| Class I | 29,933,675 | 8,879,774 |
| Class Z | 1,166,225 | – |
| Total | $106,530,925 | $61,553,254 |
(a) Distributions for Class Z are for the period October 2, 2018 (commencement of sale of shares) to October 31, 2018.
10. Share Transactions.
Share transactions for each class were as follows and may contain automatic conversions between classes or exchanges between affiliated funds:
| | Shares | Shares | Dollars | Dollars |
| | Year ended October 31, 2019 | Year ended October 31, 2018(a) | Year ended October 31, 2019 | Year ended October 31, 2018(a) |
| Class A | | | | |
| Shares sold | 2,237,245 | 1,993,812 | $54,946,164 | $57,935,672 |
| Reinvestment of distributions | 171,183 | 72,621 | 4,094,693 | 2,060,979 |
| Shares redeemed | (1,507,211) | (1,118,217) | (37,924,113) | (32,145,224) |
| Net increase (decrease) | 901,217 | 948,216 | $21,116,744 | $27,851,427 |
| Class M | | | | |
| Shares sold | 98,480 | 265,293 | $2,472,682 | $7,711,211 |
| Reinvestment of distributions | 33,142 | 20,707 | 790,760 | 585,586 |
| Shares redeemed | (158,670) | (271,709) | (3,947,659) | (7,811,190) |
| Net increase (decrease) | (27,048) | 14,291 | $(684,217) | $485,607 |
| Class C | | | | |
| Shares sold | 177,459 | 1,115,556 | $4,292,617 | $31,833,791 |
| Reinvestment of distributions | 81,103 | 30,679 | 1,875,111 | 842,145 |
| Shares redeemed | (1,003,566) | (375,660) | (24,351,495) | (10,374,137) |
| Net increase (decrease) | (745,004) | 770,575 | $(18,183,767) | $22,301,799 |
| International Small Cap | | | | |
| Shares sold | 14,687,346 | 16,219,665 | $373,563,417 | $484,453,648 |
| Reinvestment of distributions | 2,618,248 | 1,616,727 | 63,754,337 | 46,674,910 |
| Shares redeemed | (17,355,424) | (17,690,156) | (442,220,464) | (519,774,089) |
| Net increase (decrease) | (49,830) | 146,236 | $(4,902,710) | $11,354,469 |
| Class I | | | | |
| Shares sold | 22,250,461 | 19,548,705 | $571,039,816 | $583,254,206 |
| Reinvestment of distributions | 1,167,331 | 286,614 | 28,611,283 | 8,326,151 |
| Shares redeemed | (16,004,841) | (6,400,003) | (410,930,116) | (183,131,200) |
| Net increase (decrease) | 7,412,951 | 13,435,316 | $188,720,983 | $408,449,157 |
| Class Z | | | | |
| Shares sold | 9,825,331 | 280,979 | $254,217,793 | $7,304,519 |
| Reinvestment of distributions | 39,558 | – | 967,979 | – |
| Shares redeemed | (1,071,017) | (476) | (28,029,146) | (12,407) |
| Net increase (decrease) | 8,793,872 | 280,503 | $227,156,626 | $7,292,112 |
(a) Share transactions for Class Z are for the period October 2, 2018 (commencement of sale of shares) to October 31, 2018.
11. Other.
The Fund's organizational documents provide former and current trustees and officers with a limited indemnification against liabilities arising in connection with the performance of their duties to the Fund. In the normal course of business, the Fund may also enter into contracts that provide general indemnifications. The Fund's maximum exposure under these arrangements is unknown as this would be dependent on future claims that may be made against the Fund. The risk of material loss from such claims is considered remote.
Report of Independent Registered Public Accounting Firm
To the Trustees of Fidelity Investment Trust and Shareholders of Fidelity International Small Cap Fund:
Opinion on the Financial Statements and Financial Highlights
We have audited the accompanying statement of assets and liabilities of Fidelity International Small Cap Fund (the “Fund”), a fund of Fidelity Investment Trust, including the schedule of investments, as of October 31, 2019, and the related statement of operations for the year then ended, the statement of changes in net assets for each of the two years in the period then ended, the financial highlights for each of the five years in the period then ended, and the related notes. In our opinion, the financial statements and financial highlights present fairly, in all material respects, the financial position of the Fund as of October 31, 2019, and the results of its operations for the year then ended, the changes in its net assets for each of the two years in the period then ended, and the financial highlights for each of the five years in the period then ended, in conformity with accounting principles generally accepted in the United States of America.
Basis for Opinion
These financial statements and financial highlights are the responsibility of the Fund's management. Our responsibility is to express an opinion on the Fund's financial statements and financial highlights based on our audits. We are a public accounting firm registered with the Public Company Accounting Oversight Board (United States) (PCAOB) and are required to be independent with respect to the Fund in accordance with the U.S. federal securities laws and the applicable rules and regulations of the Securities and Exchange Commission and the PCAOB.
We conducted our audits in accordance with the standards of the PCAOB. Those standards require that we plan and perform the audit to obtain reasonable assurance about whether the financial statements and financial highlights are free of material misstatement, whether due to error or fraud. The Fund is not required to have, nor were we engaged to perform, an audit of its internal control over financial reporting. As part of our audits we are required to obtain an understanding of internal control over financial reporting but not for the purpose of expressing an opinion on the effectiveness of the Fund’s internal control over financial reporting. Accordingly, we express no such opinion.
Our audits included performing procedures to assess the risks of material misstatement of the financial statements and financial highlights, whether due to error or fraud, and performing procedures that respond to those risks. Such procedures included examining, on a test basis, evidence regarding the amounts and disclosures in the financial statements and financial highlights. Our audits also included evaluating the accounting principles used and significant estimates made by management, as well as evaluating the overall presentation of the financial statements and financial highlights. Our procedures included confirmation of securities owned as of October 31, 2019, by correspondence with the custodians and brokers; when replies were not received from brokers, we performed other auditing procedures. We believe that our audits provide a reasonable basis for our opinion.
/s/ Deloitte & Touche LLP
Boston, Massachusetts
December 12, 2019
We have served as the auditor of one or more of the Fidelity investment companies since 1999.
Trustees and Officers
The Trustees, Members of the Advisory Board (if any), and officers of the trust and fund, as applicable, are listed below. The Board of Trustees governs the fund and is responsible for protecting the interests of shareholders. The Trustees are experienced executives who meet periodically throughout the year to oversee the fund's activities, review contractual arrangements with companies that provide services to the fund, oversee management of the risks associated with such activities and contractual arrangements, and review the fund's performance. Except for Jonathan Chiel, each of the Trustees oversees 298 funds. Mr. Chiel oversees 171 funds.
The Trustees hold office without limit in time except that (a) any Trustee may resign; (b) any Trustee may be removed by written instrument, signed by at least two-thirds of the number of Trustees prior to such removal; (c) any Trustee who requests to be retired or who has become incapacitated by illness or injury may be retired by written instrument signed by a majority of the other Trustees; and (d) any Trustee may be removed at any special meeting of shareholders by a two-thirds vote of the outstanding voting securities of the trust. Each Trustee who is not an interested person (as defined in the 1940 Act) of the trust and the fund is referred to herein as an Independent Trustee. Each Independent Trustee shall retire not later than the last day of the calendar year in which his or her 75th birthday occurs. The Independent Trustees may waive this mandatory retirement age policy with respect to individual Trustees. Officers and Advisory Board Members hold office without limit in time, except that any officer or Advisory Board Member may resign or may be removed by a vote of a majority of the Trustees at any regular meeting or any special meeting of the Trustees. Except as indicated, each individual has held the office shown or other offices in the same company for the past five years.
The fund's Statement of Additional Information (SAI) includes more information about the Trustees. To request a free copy, call Fidelity at 1-800-544-8544 if you’re an individual investing directly with Fidelity, call 1-800-835-5092 if you’re a plan sponsor or participant with Fidelity as your recordkeeper or call 1-877-208-0098 on institutional accounts or if you’re an advisor or invest through one.
Experience, Skills, Attributes, and Qualifications of the Trustees. The Governance and Nominating Committee has adopted a statement of policy that describes the experience, qualifications, attributes, and skills that are necessary and desirable for potential Independent Trustee candidates (Statement of Policy). The Board believes that each Trustee satisfied at the time he or she was initially elected or appointed a Trustee, and continues to satisfy, the standards contemplated by the Statement of Policy. The Governance and Nominating Committee also engages professional search firms to help identify potential Independent Trustee candidates who have the experience, qualifications, attributes, and skills consistent with the Statement of Policy. From time to time, additional criteria based on the composition and skills of the current Independent Trustees, as well as experience or skills that may be appropriate in light of future changes to board composition, business conditions, and regulatory or other developments, have also been considered by the professional search firms and the Governance and Nominating Committee. In addition, the Board takes into account the Trustees' commitment and participation in Board and committee meetings, as well as their leadership of standing and ad hoc committees throughout their tenure.
In determining that a particular Trustee was and continues to be qualified to serve as a Trustee, the Board has considered a variety of criteria, none of which, in isolation, was controlling. The Board believes that, collectively, the Trustees have balanced and diverse experience, qualifications, attributes, and skills, which allow the Board to operate effectively in governing the fund and protecting the interests of shareholders. Information about the specific experience, skills, attributes, and qualifications of each Trustee, which in each case led to the Board's conclusion that the Trustee should serve (or continue to serve) as a trustee of the fund, is provided below.
Board Structure and Oversight Function. James C. Curvey is an interested person and currently serves as Chairman. The Trustees have determined that an interested Chairman is appropriate and benefits shareholders because an interested Chairman has a personal and professional stake in the quality and continuity of services provided to the fund. Independent Trustees exercise their informed business judgment to appoint an individual of their choosing to serve as Chairman, regardless of whether the Trustee happens to be independent or a member of management. The Independent Trustees have determined that they can act independently and effectively without having an Independent Trustee serve as Chairman and that a key structural component for assuring that they are in a position to do so is for the Independent Trustees to constitute a substantial majority for the Board. The Independent Trustees also regularly meet in executive session. Ned C. Lautenbach serves as Chairman of the Independent Trustees and as such (i) acts as a liaison between the Independent Trustees and management with respect to matters important to the Independent Trustees and (ii) with management prepares agendas for Board meetings.
Fidelity® funds are overseen by different Boards of Trustees. The fund's Board oversees Fidelity's high income and certain equity funds, and other Boards oversee Fidelity's investment-grade bond, money market, asset allocation, and other equity funds. The asset allocation funds may invest in Fidelity® funds overseen by the fund's Board. The use of separate Boards, each with its own committee structure, allows the Trustees of each group of Fidelity® funds to focus on the unique issues of the funds they oversee, including common research, investment, and operational issues. On occasion, the separate Boards establish joint committees to address issues of overlapping consequences for the Fidelity® funds overseen by each Board.
The Trustees operate using a system of committees to facilitate the timely and efficient consideration of all matters of importance to the Trustees, the fund, and fund shareholders and to facilitate compliance with legal and regulatory requirements and oversight of the fund's activities and associated risks. The Board, acting through its committees, has charged FMR and its affiliates with (i) identifying events or circumstances the occurrence of which could have demonstrably adverse effects on the fund's business and/or reputation; (ii) implementing processes and controls to lessen the possibility that such events or circumstances occur or to mitigate the effects of such events or circumstances if they do occur; and (iii) creating and maintaining a system designed to evaluate continuously business and market conditions in order to facilitate the identification and implementation processes described in (i) and (ii) above. Because the day-to-day operations and activities of the fund are carried out by or through FMR, its affiliates, and other service providers, the fund's exposure to risks is mitigated but not eliminated by the processes overseen by the Trustees. While each of the Board's committees has responsibility for overseeing different aspects of the fund's activities, oversight is exercised primarily through the Operations, Audit, and Compliance Committees. Appropriate personnel, including but not limited to the fund's Chief Compliance Officer (CCO), FMR's internal auditor, the independent accountants, the fund's Treasurer and portfolio management personnel, make periodic reports to the Board's committees, as appropriate, including an annual review of Fidelity's risk management program for the Fidelity® funds. The responsibilities of each standing committee, including their oversight responsibilities, are described further under "Standing Committees of the Trustees."
Interested Trustees*:
Correspondence intended for a Trustee who is an interested person may be sent to Fidelity Investments, 245 Summer Street, Boston, Massachusetts 02210.
Name, Year of Birth; Principal Occupations and Other Relevant Experience+
Jonathan Chiel (1957)
Year of Election or Appointment: 2016
Trustee
Mr. Chiel also serves as Trustee of other Fidelity® funds. Mr. Chiel is Executive Vice President and General Counsel for FMR LLC (diversified financial services company, 2012-present). Previously, Mr. Chiel served as general counsel (2004-2012) and senior vice president and deputy general counsel (2000-2004) for John Hancock Financial Services; a partner with Choate, Hall & Stewart (1996-2000) (law firm); and an Assistant United States Attorney for the United States Attorney’s Office of the District of Massachusetts (1986-95), including Chief of the Criminal Division (1993-1995). Mr. Chiel is a director on the boards of the Boston Bar Foundation and the Maimonides School.
James C. Curvey (1935)
Year of Election or Appointment: 2007
Trustee
Chairman of the Board of Trustees
Mr. Curvey also serves as Trustee of other Fidelity® funds. Mr. Curvey is Vice Chairman (2007-present) and Director of FMR LLC (diversified financial services company). In addition, Mr. Curvey is an Overseer Emeritus for the Boston Symphony Orchestra, a Director of Artis-Naples, and a Trustee of Brewster Academy in Wolfeboro, New Hampshire. Previously, Mr. Curvey served as a Director of Fidelity Research & Analysis Co. (investment adviser firm, 2009-2018), Director of Fidelity Investments Money Management, Inc. (investment adviser firm, 2009-2014) and a Director of FMR and FMR Co., Inc. (investment adviser firms, 2007-2014).
* Determined to be an “Interested Trustee” by virtue of, among other things, his or her affiliation with the trust or various entities under common control with FMR.
+ The information includes the Trustee's principal occupation during the last five years and other information relating to the experience, attributes, and skills relevant to the Trustee's qualifications to serve as a Trustee, which led to the conclusion that the Trustee should serve as a Trustee for the fund.
Independent Trustees:
Correspondence intended for an Independent Trustee may be sent to Fidelity Investments, P.O. Box 55235, Boston, Massachusetts 02205-5235.
Name, Year of Birth; Principal Occupations and Other Relevant Experience+
Dennis J. Dirks (1948)
Year of Election or Appointment: 2005
Trustee
Mr. Dirks also serves as Trustee of other Fidelity® funds. Prior to his retirement in May 2003, Mr. Dirks was Chief Operating Officer and a member of the Board of The Depository Trust & Clearing Corporation (DTCC). He also served as President, Chief Operating Officer, and Board member of The Depository Trust Company (DTC) and President and Board member of the National Securities Clearing Corporation (NSCC). In addition, Mr. Dirks served as Chief Executive Officer and Board member of the Government Securities Clearing Corporation, Chief Executive Officer and Board member of the Mortgage-Backed Securities Clearing Corporation, as a Trustee and a member of the Finance Committee of Manhattan College (2005-2008), as a Trustee and a member of the Finance Committee of AHRC of Nassau County (2006-2008), as a member of the Independent Directors Council (IDC) Governing Council (2010-2015), and as a member of the Board of Directors for The Brookville Center for Children’s Services, Inc. (2009-2017). Mr. Dirks is a member of the Finance Committee (2016-present) and Board of Directors (2017-present) and is Treasurer (2018-present) of the Asolo Repertory Theatre.
Donald F. Donahue (1950)
Year of Election or Appointment: 2018
Trustee
Mr. Donahue also serves as a Trustee of other Fidelity® funds. Mr. Donahue is President and Chief Executive Officer of Miranda Partners, LLC (risk consulting for the financial services industry, 2012-present). Previously, Mr. Donahue served as a Member of the Advisory Board of certain Fidelity® funds (2015-2018) and Chief Executive Officer (2006-2012), Chief Operating Officer (2003-2006), and Managing Director, Customer Marketing and Development (1999-2003) of The Depository Trust & Clearing Corporation (financial markets infrastructure). Mr. Donahue serves as a Member (2007-present) and Co-Chairman (2016-present) of the Board of Directors of United Way of New York, Member of the Board of Directors of NYC Leadership Academy (2012-present) and Member of the Board of Advisors of Ripple Labs, Inc. (financial services, 2015-present). He also served as Chairman (2010-2012) and Member of the Board of Directors (2012-2013) of Omgeo, LLC (financial services), Treasurer of United Way of New York (2012-2016), and Member of the Board of Directors of XBRL US (financial services non-profit, 2009-2012) and the International Securities Services Association (2009-2012).
Alan J. Lacy (1953)
Year of Election or Appointment: 2008
Trustee
Mr. Lacy also serves as Trustee of other Fidelity® funds. Mr. Lacy serves as a Director of Bristol-Myers Squibb Company (global pharmaceuticals, 2008-present). He is a Trustee of the California Chapter of The Nature Conservancy (2015-present) and a Director of the Center for Advanced Study in the Behavioral Sciences at Stanford University (2015-present). In addition, Mr. Lacy served as Senior Adviser (2007-2014) of Oak Hill Capital Partners, L.P. (private equity) and also served as Chief Executive Officer (2005) and Vice Chairman (2005-2006) of Sears Holdings Corporation (retail) and Chief Executive Officer and Chairman of the Board of Sears, Roebuck and Co. (retail, 2000-2005). Previously, Mr. Lacy served as Chairman (2014-2017) and a member (2010-2017) of the Board of Directors of Dave & Buster’s Entertainment, Inc. (restaurant and entertainment complexes), as Chairman (2008-2011) and a member (2006-2015) of the Board of Trustees of the National Parks Conservation Association, and as a member of the Board of Directors for The Hillman Companies, Inc. (hardware wholesalers, 2010-2014), Earth Fare, Inc. (retail grocery, 2010-2014), and The Western Union Company (global money transfer, 2006-2011).
Ned C. Lautenbach (1944)
Year of Election or Appointment: 2000
Trustee
Chairman of the Independent Trustees
Mr. Lautenbach also serves as Trustee of other Fidelity® funds. Mr. Lautenbach currently serves as Chair (2018-present) and Member (2013-present) of the Board of Governors, State University System of Florida and is a member of the Council on Foreign Relations (1994-present). He is also a member and has most recently served as Chairman of the Board of Directors of Artis-Naples (2012-present). Previously, Mr. Lautenbach served as a member and then Lead Director of the Board of Directors of Eaton Corporation (diversified industrial, 1997-2016). He was also a Partner and Advisory Partner at Clayton, Dubilier & Rice, LLC (private equity investment, 1998-2010), as well as a Director of Sony Corporation (2006-2007). In addition, Mr. Lautenbach also had a 30-year career with IBM (technology company) during which time he served as Senior Vice President and a member of the Corporate Executive Committee (1968-1998).
Joseph Mauriello (1944)
Year of Election or Appointment: 2008
Trustee
Mr. Mauriello also serves as Trustee of other Fidelity® funds. Prior to his retirement in January 2006, Mr. Mauriello served in numerous senior management positions including Deputy Chairman and Chief Operating Officer (2004-2005), and Vice Chairman of Financial Services (2002-2004) of KPMG LLP US (professional services, 1965-2005). Mr. Mauriello currently serves as a member of the Independent Directors Council (IDC) Governing Council (2015-present). Previously, Mr. Mauriello served as a member of the Board of Directors of XL Group plc. (global insurance and re-insurance, 2006-2018).
Cornelia M. Small (1944)
Year of Election or Appointment: 2005
Trustee
Ms. Small also serves as Trustee of other Fidelity® funds. Ms. Small is a member of the Board of Directors (2009-present) and Chair of the Investment Committee (2010-present) of the Teagle Foundation. Ms. Small also serves on the Investment Committee of the Berkshire Taconic Community Foundation (2008-present). Previously, Ms. Small served as Chairperson (2002-2008) and a member of the Investment Committee and Chairperson (2008-2012) and a member of the Board of Trustees of Smith College. In addition, Ms. Small served as Chief Investment Officer, Director of Global Equity Investments, and a member of the Board of Directors of Scudder, Stevens & Clark and Scudder Kemper Investments.
Garnett A. Smith (1947)
Year of Election or Appointment: 2018
Trustee
Mr. Smith also serves as Trustee of other Fidelity® funds. Prior to Mr. Smith's retirement, he served as Chairman and Chief Executive Officer of Inbrand Corp. (manufacturer of personal absorbent products, 1990-1997). He also served as President (1986-1990) of Inbrand Corp. Prior to his employment with Inbrand Corp., he was employed by a retail fabric chain and North Carolina National Bank. In addition, Mr. Smith served as a Member of the Advisory Board of certain Fidelity® funds (2012-2013) and as a board member of the Jackson Hole Land Trust (2009-2012).
David M. Thomas (1949)
Year of Election or Appointment: 2008
Trustee
Mr. Thomas also serves as Trustee of other Fidelity® funds. Mr. Thomas serves as Non-Executive Chairman of the Board of Directors of Fortune Brands Home and Security (home and security products, 2011-present) and as a member of the Board of Directors (2004-present) and Presiding Director (2013-present) of Interpublic Group of Companies, Inc. (marketing communication). Previously, Mr. Thomas served as Executive Chairman (2005-2006) and Chairman and Chief Executive Officer (2000-2005) of IMS Health, Inc. (pharmaceutical and healthcare information solutions), a Director of Fortune Brands, Inc. (consumer products, 2000-2011), and a member of the Board of Trustees of the University of Florida (2013-2018).
+ The information includes the Trustee's principal occupation during the last five years and other information relating to the experience, attributes, and skills relevant to the Trustee's qualifications to serve as a Trustee, which led to the conclusion that the Trustee should serve as a Trustee for the fund.
Advisory Board Members and Officers:
Correspondence intended for a Member of the Advisory Board (if any) may be sent to Fidelity Investments, P.O. Box 55235, Boston, Massachusetts 02205-5235. Correspondence intended for an officer or Peter S. Lynch may be sent to Fidelity Investments, 245 Summer Street, Boston, Massachusetts 02210. Officers appear below in alphabetical order.
Name, Year of Birth; Principal Occupation
Vicki L. Fuller (1957)
Year of Election or Appointment: 2018
Member of the Advisory Board
Ms. Fuller also serves as Member of the Advisory Board of other Fidelity® funds. Ms. Fuller serves as a member of the Board of Directors, Audit Committee, and Nominating and Governance Committee of The Williams Companies, Inc. (natural gas infrastructure, 2018-present). Previously, Ms. Fuller served as the Chief Investment Officer of the New York State Common Retirement Fund (2012-2018) and held a variety of positions at AllianceBernstein L.P. (global asset management, 1985-2012), including Managing Director (2006-2012) and Senior Vice President and Senior Portfolio Manager (2001-2006).
Peter S. Lynch (1944)
Year of Election or Appointment: 2003
Member of the Advisory Board
Mr. Lynch also serves as Member of the Advisory Board of other Fidelity® funds. Mr. Lynch is Vice Chairman and a Director of FMR (investment adviser firm) and FMR Co., Inc. (investment adviser firm). In addition, Mr. Lynch serves as a Trustee of Boston College and as the Chairman of the Inner-City Scholarship Fund. Previously, Mr. Lynch served on the Special Olympics International Board of Directors (1997-2006).
Michael E. Wiley (1950)
Year of Election or Appointment: 2018
Member of the Advisory Board
Mr. Wiley also serves as Trustee or Member of the Advisory Board of other Fidelity® funds. Mr. Wiley serves as a Director of High Point Resources (exploration and production, 2005-present). Previously, Mr. Wiley served as a Director of Andeavor Corporation (independent oil refiner and marketer, 2005-2018), a Director of Andeavor Logistics LP (natural resources logistics, 2015-2018), a Director of Post Oak Bank (privately-held bank, 2004-2018), a Director of Asia Pacific Exploration Consolidated (international oil and gas exploration and production, 2008-2013), a member of the Board of Trustees of the University of Tulsa (2000-2006; 2007-2010), a Senior Energy Advisor of Katzenbach Partners, LLC (consulting, 2006-2007), an Advisory Director of Riverstone Holdings (private investment), a Director of Spinnaker Exploration Company (exploration and production, 2001-2005) and Chairman, President, and CEO of Baker Hughes, Inc. (oilfield services, 2000-2004).
Elizabeth Paige Baumann (1968)
Year of Election or Appointment: 2017
Anti-Money Laundering (AML) Officer
Ms. Baumann also serves as AML Officer of other funds. She is Chief AML Officer (2012-present) and Senior Vice President (2014-present) of FMR LLC (diversified financial services company) and is an employee of Fidelity Investments. Previously, Ms. Baumann served as AML Officer of the funds (2012-2016), and Vice President (2007-2014) and Deputy Anti-Money Laundering Officer (2007-2012) of FMR LLC.
Craig S. Brown (1977)
Year of Election or Appointment: 2019
Assistant Treasurer
Mr. Brown also serves as Assistant Treasurer of other funds. Mr. Brown is an employee of Fidelity Investments (2013-present).
John J. Burke III (1964)
Year of Election or Appointment: 2018
Chief Financial Officer
Mr. Burke also serves as Chief Financial Officer of other funds. Mr. Burke serves as Head of Investment Operations for Fidelity Fund and Investment Operations (2018-present) and is an employee of Fidelity Investments (1998-present). Previously Mr. Burke served as head of Asset Management Investment Operations (2012-2018).
William C. Coffey (1969)
Year of Election or Appointment: 2019
Assistant Secretary
Mr. Coffey also serves as Assistant Secretary of other funds. He is Senior Vice President and Deputy General Counsel of FMR LLC (diversified financial services company, 2010-present), and is an employee of Fidelity Investments. Previously, Mr. Coffey served as Secretary and CLO of certain funds (2018-2019); CLO, Secretary, and Senior Vice President of Fidelity Management & Research Company and FMR Co., Inc. (investment adviser firms, 2018-2019); Secretary of Fidelity SelectCo, LLC and Fidelity Investments Money Management, Inc. (investment adviser firms, 2018-2019); CLO of Fidelity Management & Research (Hong Kong) Limited, FMR Investment Management (UK) Limited, and Fidelity Management & Research (Japan) Limited (investment adviser firms, 2018-2019); and Assistant Secretary of certain funds (2009-2018).
Timothy M. Cohen (1969)
Year of Election or Appointment: 2018
Vice President
Mr. Cohen also serves as Vice President of other funds. Mr. Cohen serves as Executive Vice President of Fidelity SelectCo, LLC (2019-present), Co-Head of Equity (2018-present), a Director of Fidelity Management & Research (Japan) Limited (investment adviser firm, 2016-present), and is an employee of Fidelity Investments. Previously, Mr. Cohen served as Head of Global Equity Research (2016-2018), Chief Investment Officer - Equity and a Director of Fidelity Management & Research (U.K.) Inc. (investment adviser firm, 2013-2015) and as a Director of Fidelity Management & Research (Hong Kong) Limited (investment adviser firm, 2017).
Jonathan Davis (1968)
Year of Election or Appointment: 2010
Assistant Treasurer
Mr. Davis also serves as Assistant Treasurer of other funds. Mr. Davis serves as Assistant Treasurer of FMR Capital, Inc. (2017-present) and is an employee of Fidelity Investments. Previously, Mr. Davis served as Vice President and Associate General Counsel of FMR LLC (diversified financial services company, 2003-2010).
Adrien E. Deberghes (1967)
Year of Election or Appointment: 2016
Assistant Treasurer
Mr. Deberghes also serves as an officer of other funds. He serves as Assistant Treasurer of FMR Capital, Inc. (2017-present), Executive Vice President of Fidelity Investments Money Management, Inc. (FIMM) (investment adviser firm, 2016-present), and is an employee of Fidelity Investments (2008-present). Previously, Mr. Deberghes served as President and Treasurer of certain Fidelity® funds (2013-2018). Prior to joining Fidelity Investments, Mr. Deberghes was Senior Vice President of Mutual Fund Administration at State Street Corporation (2007-2008), Senior Director of Mutual Fund Administration at Investors Bank & Trust (2005-2007), and Director of Finance for Dunkin' Brands (2000-2005). Previously, Mr. Deberghes served in other fund officer roles.
Laura M. Del Prato (1964)
Year of Election or Appointment: 2018
Assistant Treasurer
Ms. Del Prato also serves as an officer of other funds. Ms. Del Prato is an employee of Fidelity Investments (2017-present). Prior to joining Fidelity Investments, Ms. Del Prato served as a Managing Director and Treasurer of the JPMorgan Mutual Funds (2014-2017). Prior to JPMorgan, Ms. Del Prato served as a partner at Cohen Fund Audit Services (accounting firm, 2012-2013) and KPMG LLP (accounting firm, 2004-2012).
Colm A. Hogan (1973)
Year of Election or Appointment: 2016
Deputy Treasurer
Mr. Hogan also serves as an officer of other funds. Mr. Hogan serves as Assistant Treasurer of FMR Capital, Inc. (2017-present) and is an employee of Fidelity Investments (2005-present). Previously, Mr. Hogan served as Assistant Treasurer of certain Fidelity® funds (2016-2018).
Pamela R. Holding (1964)
Year of Election or Appointment: 2018
Vice President
Ms. Holding also serves as Vice President of other funds. Ms. Holding serves as Executive Vice President of Fidelity SelectCo, LLC (2019-present), Co-Head of Equity (2018-present) and is an employee of Fidelity Investments (2013-present). Previously, Ms. Holding served as Chief Investment Officer of Fidelity Institutional Asset Management (2013-2018).
Cynthia Lo Bessette (1969)
Year of Election or Appointment: 2019
Secretary and Chief Legal Officer (CLO)
Ms. Lo Bessette also serves as Secretary and CLO of other funds. Ms. Lo Bessette serves as CLO, Secretary, and Senior Vice President of Fidelity Management & Research Company and FMR Co., Inc. (investment adviser firms, 2019-present); Secretary of Fidelity SelectCo, LLC and Fidelity Investments Money Management, Inc. (investment adviser firms, 2019-present); and CLO of Fidelity Management & Research (Hong Kong) Limited, FMR Investment Management (UK) Limited, and Fidelity Management & Research (Japan) Limited (investment adviser firms, 2019-present). She is a Senior Vice President and Deputy General Counsel of FMR LLC (diversified financial services company, 2019-present), and is an employee of Fidelity Investments. Previously, Ms. Lo Bessette served as Executive Vice President, General Counsel (2016-2019) and Senior Vice President, Deputy General Counsel (2015-2016) of OppenheimerFunds (investment management company) and Deputy Chief Legal Officer (2013-2015) of Jennison Associates LLC (investment adviser firm).
Chris Maher (1972)
Year of Election or Appointment: 2013
Assistant Treasurer
Mr. Maher serves as Assistant Treasurer of other funds. Mr. Maher is Vice President of Valuation Oversight, serves as Assistant Treasurer of FMR Capital, Inc. (2017-present), and is an employee of Fidelity Investments. Previously, Mr. Maher served as Vice President of Asset Management Compliance (2013), Vice President of the Program Management Group of FMR (investment adviser firm, 2010-2013), and Vice President of Valuation Oversight (2008-2010).
Kenneth B. Robins (1969)
Year of Election or Appointment: 2016
Chief Compliance Officer
Mr. Robins also serves as an officer of other funds. Mr. Robins serves as Compliance Officer of Fidelity Management & Research Company and FMR Co., Inc. (investment adviser firms, 2016-present) and is an employee of Fidelity Investments (2004-present). Previously, Mr. Robins served as Executive Vice President of Fidelity Investments Money Management, Inc. (investment adviser firm, 2013-2016) and served in other fund officer roles.
Stacie M. Smith (1974)
Year of Election or Appointment: 2016
President and Treasurer
Ms. Smith also serves as an officer of other funds. Ms. Smith serves as Assistant Treasurer of FMR Capital, Inc. (2017-present), is an employee of Fidelity Investments (2009-present), and has served in other fund officer roles. Prior to joining Fidelity Investments, Ms. Smith served as Senior Audit Manager of Ernst & Young LLP (accounting firm, 1996-2009). Previously, Ms. Smith served as Assistant Treasurer (2013-2018) and Deputy Treasurer (2013-2016) of certain Fidelity® funds.
Marc L. Spector (1972)
Year of Election or Appointment: 2016
Assistant Treasurer
Mr. Spector also serves as an officer of other funds. Mr. Spector serves as Assistant Treasurer of FMR Capital, Inc. (2017-present) and is an employee of Fidelity Investments (2016-present). Prior to joining Fidelity Investments, Mr. Spector served as Director at the Siegfried Group (accounting firm, 2013-2016), and prior to Siegfried Group as audit senior manager at Deloitte & Touche (accounting firm, 2005-2013).
Jim Wegmann (1979)
Year of Election or Appointment: 2019
Assistant Treasurer
Mr. Wegmann also serves as Assistant Treasurer of other funds. Mr. Wegmann is an employee of Fidelity Investments (2011-present).
Shareholder Expense Example
As a shareholder of the Fund, you incur two types of costs: (1) transaction costs, including sales charges (loads) on purchase payments or redemption proceeds, and (2) ongoing costs, including management fees, distribution and/or service (12b-1) fees and other Fund expenses. This Example is intended to help you understand your ongoing costs (in dollars) of investing in the Fund and to compare these costs with the ongoing costs of investing in other mutual funds.
The Example is based on an investment of $1,000 invested at the beginning of the period and held for the entire period (May 1, 2019 to October 31, 2019).
Actual Expenses
The first line of the accompanying table for each class of the Fund provides information about actual account values and actual expenses. You may use the information in this line, together with the amount you invested, to estimate the expenses that you paid over the period. Simply divide your account value by $1,000.00 (for example, an $8,600 account value divided by $1,000.00 = 8.6), then multiply the result by the number in the first line for a class of the Fund under the heading entitled "Expenses Paid During Period" to estimate the expenses you paid on your account during this period. In addition, the Fund, as a shareholder in the underlying Fidelity Central Funds, will indirectly bear its pro-rata share of the fees and expenses incurred by the underlying Fidelity Central Funds. These fees and expenses are not included in the Fund's annualized expense ratio used to calculate the expense estimate in the table below.
Hypothetical Example for Comparison Purposes
The second line of the accompanying table for each class of the Fund provides information about hypothetical account values and hypothetical expenses based on a Class' actual expense ratio and an assumed rate of return of 5% per year before expenses, which is not the Class' actual return. The hypothetical account values and expenses may not be used to estimate the actual ending account balance or expenses you paid for the period. You may use this information to compare the ongoing costs of investing in the Fund and other funds. To do so, compare this 5% hypothetical example with the 5% hypothetical examples that appear in the shareholder reports of the other funds. In addition, the Fund, as a shareholder in the underlying Fidelity Central Funds, will indirectly bear its pro-rata share of the fees and expenses incurred by the underlying Fidelity Central Funds. These fees and expenses are not included in the Fund's annualized expense ratio used to calculate the expense estimate in the table below.
Please note that the expenses shown in the table are meant to highlight your ongoing costs only and do not reflect any transaction costs. Therefore, the second line of the table is useful in comparing ongoing costs only, and will not help you determine the relative total costs of owning different funds. In addition, if these transactional costs were included, your costs would have been higher.
| | Annualized Expense Ratio-A | Beginning
Account Value
May 1, 2019 | Ending
Account Value
October 31, 2019 | Expenses Paid
During Period-B
May 1, 2019
to October 31, 2019 |
| Class A | 1.44% | | | |
| Actual | | $1,000.00 | $1,017.80 | $7.32 |
| Hypothetical-C | | $1,000.00 | $1,017.95 | $7.32 |
| Class M | 1.75% | | | |
| Actual | | $1,000.00 | $1,015.90 | $8.89 |
| Hypothetical-C | | $1,000.00 | $1,016.38 | $8.89 |
| Class C | 2.18% | | | |
| Actual | | $1,000.00 | $1,014.00 | $11.07 |
| Hypothetical-C | | $1,000.00 | $1,014.22 | $11.07 |
| International Small Cap | 1.15% | | | |
| Actual | | $1,000.00 | $1,019.00 | $5.85 |
| Hypothetical-C | | $1,000.00 | $1,019.41 | $5.85 |
| Class I | 1.16% | | | |
| Actual | | $1,000.00 | $1,018.80 | $5.90 |
| Hypothetical-C | | $1,000.00 | $1,019.36 | $5.90 |
| Class Z | 1.06% | | | |
| Actual | | $1,000.00 | $1,020.00 | $5.40 |
| Hypothetical-C | | $1,000.00 | $1,019.86 | $5.40 |
A Annualized expense ratio reflects expenses net of applicable fee waivers.
B Expenses are equal to each Class' annualized expense ratio, multiplied by the average account value over the period, multiplied by 184/365 (to reflect the one-half year period).
C 5% return per year before expenses
Distributions (Unaudited)
The Board of Trustees of Fidelity International Small Cap fund voted to pay to shareholders of record at the opening of business on record date, the following distributions per share derived from capital gains realized from sales of portfolio securities, and dividends derived from net investment income:
| | Pay Date | Record Date | Dividends | Capital Gains |
| Fidelity International Small Cap Fund | | | | |
| Class A | 12/09/2019 | 12/06/2019 | $0.442 | $0.140 |
| Class M | 12/09/2019 | 12/06/2019 | $0.358 | $0.140 |
| Class C | 12/09/2019 | 12/06/2019 | $0.179 | $0.140 |
| International Small Cap | 12/09/2019 | 12/06/2019 | $0.513 | $0.140 |
| Class I | 12/09/2019 | 12/06/2019 | $0.517 | $0.140 |
| Class Z | 12/09/2019 | 12/06/2019 | $0.556 | $0.140 |
|
The fund hereby designates as a capital gain dividend with respect to the taxable year ended October 31, 2019, $4,054,163, or, if subsequently determined to be different, the net capital gain of such year.
Class A, Class M, Class C, International Small Cap, Class I, and Class Z designate 100% of the dividend distributed during the fiscal year as amounts which may be taken into account as a dividend for purposes of the maximum rate under section 1(h)(11) of the Internal Revenue Code.
The amounts per share which represent income derived from sources within, and taxes paid to, foreign countries or possessions of the United States are as follows:
| | Pay Date | Income | Taxes |
| Fidelity International Small Cap Fund | | | |
| Class A | 12/10/18 | $0.4520 | $0.0710 |
| Class M | 12/10/18 | $0.3450 | $0.0710 |
| Class C | 12/10/18 | $0.2370 | $0.0710 |
| International Small Cap | 12/10/18 | $0.5230 | $0.0710 |
| Class I | 12/10/18 | $0.5300 | $0.0710 |
| Class Z | 12/10/18 | $0.5750 | $0.0710 |
|
The fund will notify shareholders in January 2020 of amounts for use in preparing 2019 income tax returns.
ISC-ANN-1219
1.793585.116
Fidelity® SAI International SMA Completion Fund
Offered exclusively to certain clients of the Adviser or its affiliates - not available for sale to the general public. Fidelity SAI is a product name of Fidelity® funds dedicated to certain programs affiliated with Strategic Advisers LLC.
Annual Report
October 31, 2019
See the inside front cover for important information about access to your fund’s shareholder reports.
Beginning on January 1, 2021, as permitted by regulations adopted by the Securities and Exchange Commission, paper copies of a fund’s shareholder reports will no longer be sent by mail, unless you specifically request paper copies of the reports from the fund or from your financial intermediary, such as a financial advisor, broker-dealer or bank. Instead, the reports will be made available on a website, and you will be notified by mail each time a report is posted and provided with a website link to access the report.
If you already elected to receive shareholder reports electronically, you will not be affected by this change and you need not take any action. You may elect to receive shareholder reports and other communications from a fund electronically, by contacting your financial intermediary. For Fidelity customers, visit Fidelity's web site or call Fidelity using the contact information listed below.
You may elect to receive all future reports in paper free of charge. If you wish to continue receiving paper copies of your shareholder reports, you may contact your financial intermediary or, if you are a Fidelity customer, visit Fidelity’s website, or call Fidelity at the applicable toll-free number listed below. Your election to receive reports in paper will apply to all funds held with the fund complex/your financial intermediary.
| Account Type | Website | Phone Number |
| Brokerage, Mutual Fund, or Annuity Contracts: | fidelity.com/mailpreferences | 1-800-343-3548 |
| Employer Provided Retirement Accounts: | netbenefits.fidelity.com/preferences (choose 'no' under Required Disclosures to continue to print) | 1-800-343-0860 |
| Advisor Sold Accounts Serviced Through Your Financial Intermediary: | Contact Your Financial Intermediary | Your Financial Intermediary's phone number |
| Advisor Sold Accounts Serviced by Fidelity: | institutional.fidelity.com | 1-877-208-0098 |
Contents
To view a fund's proxy voting guidelines and proxy voting record for the 12-month period ended June 30, visit http://www.fidelity.com/proxyvotingresults or visit the Securities and Exchange Commission's (SEC) web site at http://www.sec.gov.
You may also call 1-800-544-3455 to request a free copy of the proxy voting guidelines.
Standard & Poor's, S&P and S&P 500 are registered service marks of The McGraw-Hill Companies, Inc. and have been licensed for use by Fidelity Distributors Corporation.
Other third-party marks appearing herein are the property of their respective owners.
All other marks appearing herein are registered or unregistered trademarks or service marks of FMR LLC or an affiliated company. © 2019 FMR LLC. All rights reserved.
This report and the financial statements contained herein are submitted for the general information of the shareholders of the Fund. This report is not authorized for distribution to prospective investors in the Fund unless preceded or accompanied by an effective prospectus.
A fund files its complete schedule of portfolio holdings with the SEC for the first and third quarters of each fiscal year on Form N-PORT. Forms N-PORT are available on the SEC’s web site at http://www.sec.gov. A fund's Forms N-PORT may be reviewed and copied at the SEC’s Public Reference Room in Washington, DC. Information regarding the operation of the SEC's Public Reference Room may be obtained by calling 1-800-SEC-0330.
For a complete list of a fund's portfolio holdings, view the most recent holdings listing, semiannual report, or annual report on Fidelity's web site at http://www.fidelity.com, http://www.institutional.fidelity.com, or http://www.401k.com, as applicable.
NOT FDIC INSURED •MAY LOSE VALUE •NO BANK GUARANTEE
Neither the Fund nor Fidelity Distributors Corporation is a bank.
Performance: The Bottom Line
Average annual total return reflects the change in the value of an investment, assuming reinvestment of distributions from dividend income and capital gains (the profits earned upon the sale of securities that have grown in value, if any) and assuming a constant rate of performance each year. The hypothetical investment and the average annual total returns do not reflect the deduction of taxes that a shareholder would pay on fund distributions or the redemption of fund shares. During periods of reimbursement by Fidelity, a fund’s total return will be greater than it would be had the reimbursement not occurred. How a fund did yesterday is no guarantee of how it will do tomorrow.
Average annual total returns for Fidelity® SAI International SMA Completion Fund will be reported once the fund is a year old.
$10,000 Over Life of Fund
Let's say hypothetically that $10,000 was invested in Fidelity® SAI International SMA Completion Fund on April 11, 2019, when the fund started.
The chart shows how the value of your investment would have changed, and also shows how the MSCI EAFE Index performed over the same period.
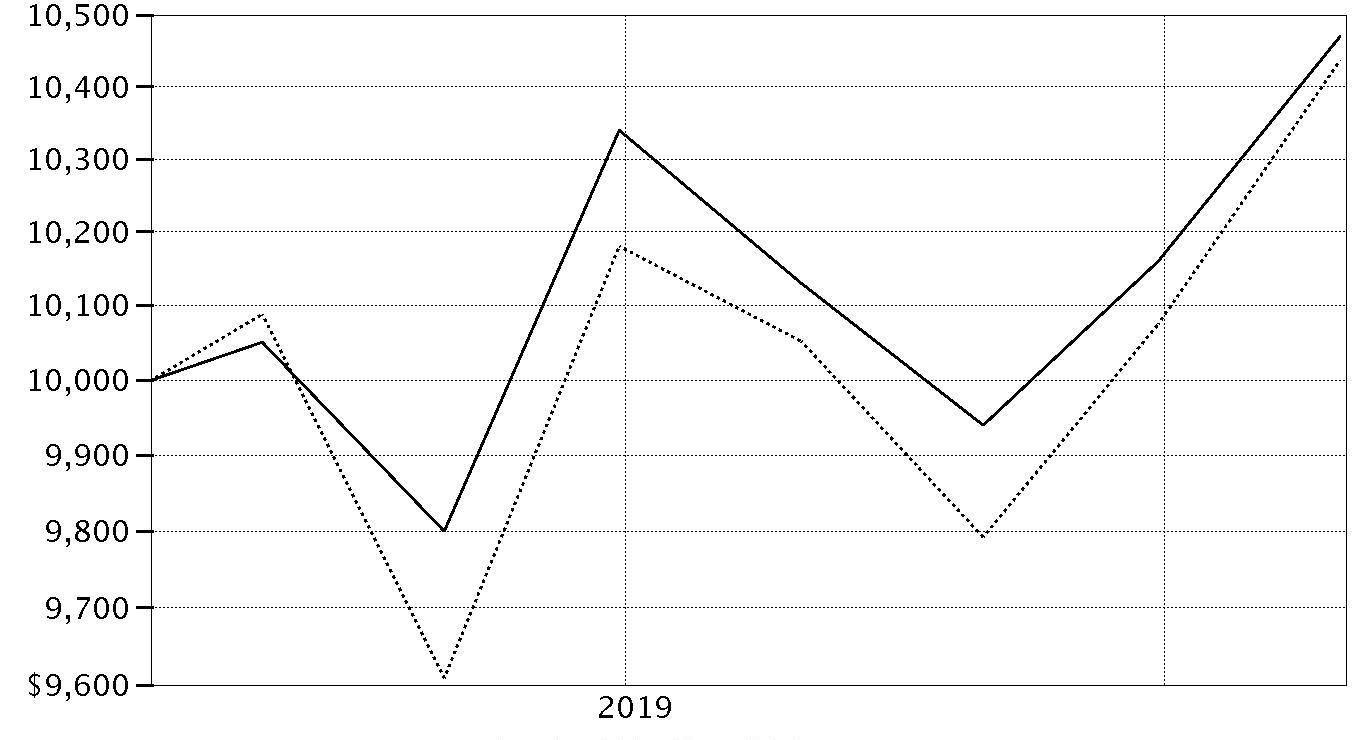
| Period Ending Values |
| $10,470 | Fidelity® SAI International SMA Completion Fund |
| $10,437 | MSCI EAFE Index |
Management's Discussion of Fund Performance
Market Recap: The MSCI ACWI (All Country World Index) ex USA Index gained 11.47% for the 12 months ending October 31, 2019, as international stocks reflected a confluence of factors, including escalating trade tension, and moderating but still positive global economic growth. Currency fluctuations were largely modest and varied by region, muting the overall impact on international equity returns. In late December, the U.S. Federal Reserve shifted from raising interest rates to a more dovish policy in 2019, joining many foreign central banks. In June, international stocks rose 6.03%, as policy stimulus in China stabilized that country’s economic growth. The Fed cut its policy rate in July for the first time since 2008. However, the index returned -1.21% for the month, followed by -3.08% in August. In September, the Fed cut its policy rate another quarter point, citing concerns about slowing economic growth and muted inflation, and did the same in October, leading to monthly gains of 2.59% and 3.49%, respectively. For the full 12 months, the growth-oriented information technology sector (+22%) led the way, followed by utilities (+20%) and real estate (+18%), two high-dividend-yielding categories. Conversely, energy was roughly flat, while materials (+6%) and communication services (7%) also lagged. By region, Asia Pacific ex Japan (+16%), Europe ex U.K (+13%), Canada (+12%) and emerging markets (+12%) fared best. Meanwhile, the U.K. (+7%) and Japan (+10%) trailed the broader market.
Comments from Co-Portfolio Managers Bill Bower and Tim Gannon: From inception on April 11, 2019, through October 31, 2019, the fund gained 4.70%, ahead of the 4.37% result of the benchmark MSCI EAFE Index. Favorable stock selection drove the fund’s outperformance of the benchmark the past 12 months, led by the consumer staples sector. Our choices in financials and materials contributed to a lesser extent. Regionally, our picks in Japan made a significant contribution to the fund’s relative performance. In terms of individual stocks, large overweightings in Japan-based drug-store retailers Tsuruha Holdings (+44%) and Welcia Holdings (+59%) were the fund’s top individual contributors. A non-index stake in India-based HDFC Bank, the fund’s largest position, advanced 9% and also helped. Conversely, security selection in information technology detracted most, followed by positioning in health care and our picks in industrials. By region, stock selection in the U.K. hurt most, though our sizable underweighting in this poor-performing group helped. Positioning in continental Europe also held back the fund’s relative result. Turning to individual stocks that proved disappointing, an out-of-benchmark stake in Spain-based cash logistics and management company Prosegur Cash was the fund’s biggest detractor, returning -32% until we sold it. A non-benchmark position in India-based technology consulting and outsourcing company Infosys (-11%) also detracted. Lastly, the fund’s stake in cash, at roughly 4% of assets, on average, weighed on relative performance amid a rising stock market.
The views expressed above reflect those of the portfolio manager(s) only through the end of the period as stated on the cover of this report and do not necessarily represent the views of Fidelity or any other person in the Fidelity organization. Any such views are subject to change at any time based upon market or other conditions and Fidelity disclaims any responsibility to update such views. These views may not be relied on as investment advice and, because investment decisions for a Fidelity fund are based on numerous factors, may not be relied on as an indication of trading intent on behalf of any Fidelity fund.
Investment Summary (Unaudited)
Geographic Diversification (% of fund's net assets)
| As of October 31, 2019 |
| | Japan | 31.8% |
| | India | 10.5% |
| | France | 7.7% |
| | Germany | 7.2% |
| | Canada | 6.7% |
| | Ireland | 6.6% |
| | Indonesia | 4.4% |
| | Norway | 3.7% |
| | South Africa | 3.6% |
| | Other* | 17.8% |

* Includes Short-Term investments and Net Other Assets (Liabilities).
Percentages are based on country or territory of incorporation and are adjusted for the effect of futures contracts, if applicable.
Asset Allocation as of October 31, 2019
| | % of fund's net assets |
| Stocks | 97.1 |
| Short-Term Investments and Net Other Assets (Liabilities) | 2.9 |
Top Ten Stocks as of October 31, 2019
| | % of fund's net assets |
| HDFC Bank Ltd. sponsored ADR (India, Banks) | 7.5 |
| Tsuruha Holdings, Inc. (Japan, Food & Staples Retailing) | 5.5 |
| Minebea Mitsumi, Inc. (Japan, Machinery) | 5.3 |
| Keyence Corp. (Japan, Electronic Equipment & Components) | 4.9 |
| Alimentation Couche-Tard, Inc. Class B (sub. vtg.) (Canada, Food & Staples Retailing) | 4.8 |
| Hannover Reuck SE (Germany, Insurance) | 4.5 |
| Recruit Holdings Co. Ltd. (Japan, Professional Services) | 4.5 |
| SR Teleperformance SA (France, Professional Services) | 4.3 |
| Schibsted ASA (A Shares) (Norway, Media) | 3.7 |
| Capitec Bank Holdings Ltd. (South Africa, Banks) | 3.6 |
| | 48.6 |
Top Market Sectors as of October 31, 2019
| | % of fund's net assets |
| Financials | 26.7 |
| Industrials | 25.3 |
| Consumer Staples | 16.0 |
| Information Technology | 10.9 |
| Consumer Discretionary | 5.8 |
| Communication Services | 4.8 |
| Real Estate | 2.7 |
| Utilities | 2.6 |
| Health Care | 1.2 |
| Materials | 1.1 |
Schedule of Investments October 31, 2019
Showing Percentage of Net Assets
| Common Stocks - 97.1% | | | |
| | | Shares | Value |
| Australia - 2.1% | | | |
| Magellan Financial Group Ltd. | | 29,535 | $979,615 |
| Bermuda - 2.3% | | | |
| Hiscox Ltd. | | 55,102 | 1,062,794 |
| Canada - 6.7% | | | |
| Alimentation Couche-Tard, Inc. Class B (sub. vtg.) | | 74,833 | 2,244,251 |
| Constellation Software, Inc. | | 888 | 877,031 |
|
| TOTAL CANADA | | | 3,121,282 |
|
| Denmark - 2.6% | | | |
| ORSTED A/S (a) | | 14,175 | 1,243,391 |
| France - 7.7% | | | |
| Amundi SA (a) | | 15,247 | 1,088,319 |
| Capgemini SA | | 4,306 | 484,811 |
| SR Teleperformance SA | | 8,916 | 2,020,624 |
|
| TOTAL FRANCE | | | 3,593,754 |
|
| Germany - 7.2% | | | |
| Hannover Reuck SE | | 12,021 | 2,129,035 |
| Vonovia SE | | 23,374 | 1,243,753 |
|
| TOTAL GERMANY | | | 3,372,788 |
|
| India - 10.5% | | | |
| HDFC Bank Ltd. sponsored ADR | | 57,583 | 3,517,745 |
| Infosys Ltd. sponsored ADR | | 145,013 | 1,390,675 |
|
| TOTAL INDIA | | | 4,908,420 |
|
| Indonesia - 4.4% | | | |
| PT Bank Central Asia Tbk | | 519,714 | 1,163,290 |
| PT Bank Rakyat Indonesia Tbk | | 3,026,140 | 906,738 |
|
| TOTAL INDONESIA | | | 2,070,028 |
|
| Ireland - 6.6% | | | |
| Kerry Group PLC Class A | | 12,511 | 1,512,561 |
| Kingspan Group PLC (Ireland) | | 30,335 | 1,571,864 |
|
| TOTAL IRELAND | | | 3,084,425 |
|
| Italy - 1.2% | | | |
| Recordati SpA | | 13,950 | 586,086 |
| Japan - 31.8% | | | |
| Itochu Corp. | | 63,848 | 1,334,927 |
| Keyence Corp. | | 3,653 | 2,309,779 |
| Minebea Mitsumi, Inc. | | 132,006 | 2,506,999 |
| Misumi Group, Inc. | | 27,392 | 688,601 |
| Nabtesco Corp. | | 20,085 | 639,402 |
| Nitori Holdings Co. Ltd. | | 10,350 | 1,575,385 |
| Recruit Holdings Co. Ltd. | | 63,459 | 2,108,999 |
| Tsuruha Holdings, Inc. | | 23,075 | 2,595,674 |
| Welcia Holdings Co. Ltd. | | 20,121 | 1,156,158 |
|
| TOTAL JAPAN | | | 14,915,924 |
|
| Luxembourg - 2.4% | | | |
| B&M European Value Retail SA | | 237,560 | 1,139,500 |
| Norway - 3.7% | | | |
| Schibsted ASA (A Shares) | | 58,582 | 1,719,974 |
| South Africa - 3.6% | | | |
| Capitec Bank Holdings Ltd. | | 18,447 | 1,676,143 |
| Sweden - 2.1% | | | |
| Indutrade AB | | 32,575 | 1,002,650 |
| Switzerland - 1.1% | | | |
| Sika AG | | 2,928 | 503,088 |
| United Kingdom - 1.1% | | | |
| Ascential PLC (a) | | 110,380 | 499,289 |
| TOTAL COMMON STOCKS | | | |
| (Cost $43,817,124) | | | 45,479,151 |
|
| Money Market Funds - 3.5% | | | |
| Fidelity Cash Central Fund 1.83% (b) | | | |
| (Cost $1,648,312) | | 1,647,982 | 1,648,312 |
| TOTAL INVESTMENT IN SECURITIES - 100.6% | | | |
| (Cost $45,465,436) | | | 47,127,463 |
| NET OTHER ASSETS (LIABILITIES) - (0.6)% | | | (291,218) |
| NET ASSETS - 100% | | | $46,836,245 |
Categorizations in the Schedule of Investments are based on country or territory of incorporation.
Legend
(a) Security exempt from registration under Rule 144A of the Securities Act of 1933. These securities may be resold in transactions exempt from registration, normally to qualified institutional buyers. At the end of the period, the value of these securities amounted to $2,830,999 or 6.0% of net assets.
(b) Affiliated fund that is generally available only to investment companies and other accounts managed by Fidelity Investments. The rate quoted is the annualized seven-day yield of the fund at period end. A complete unaudited listing of the fund's holdings as of its most recent quarter end is available upon request. In addition, each Fidelity Central Fund's financial statements, which are not covered by the Fund's Report of Independent Registered Public Accounting Firm, are available on the SEC's website or upon request.
Affiliated Central Funds
Information regarding fiscal year to date income earned by the Fund from investments in Fidelity Central Funds is as follows:
| Fund | Income earned |
| Fidelity Cash Central Fund | $12,218 |
| Total | $12,218 |
Amounts in the income column in the above table include any capital gain distributions from underlying funds, which are presented in the corresponding line-item in the Statement of Operations, if applicable.
Investment Valuation
The following is a summary of the inputs used, as of October 31, 2019, involving the Fund's assets and liabilities carried at fair value. The inputs or methodology used for valuing securities may not be an indication of the risk associated with investing in those securities. For more information on valuation inputs, and their aggregation into the levels used below, please refer to the Investment Valuation section in the accompanying Notes to Financial Statements.
| | Valuation Inputs at Reporting Date: |
| Description | Total | Level 1 | Level 2 | Level 3 |
| Investments in Securities: | | | | |
| Equities: | | | | |
| Communication Services | $2,219,263 | $2,219,263 | $-- | $-- |
| Consumer Discretionary | 2,714,885 | 1,139,500 | 1,575,385 | -- |
| Consumer Staples | 7,508,644 | 3,756,812 | 3,751,832 | -- |
| Financials | 12,523,679 | 9,474,036 | 3,049,643 | -- |
| Health Care | 586,086 | 586,086 | -- | -- |
| Industrials | 11,874,066 | 4,595,138 | 7,278,928 | -- |
| Information Technology | 5,062,296 | 2,752,517 | 2,309,779 | -- |
| Materials | 503,088 | 503,088 | -- | -- |
| Real Estate | 1,243,753 | 1,243,753 | -- | -- |
| Utilities | 1,243,391 | 1,243,391 | -- | -- |
| Money Market Funds | 1,648,312 | 1,648,312 | -- | -- |
| Total Investments in Securities: | $47,127,463 | $29,161,896 | $17,965,567 | $-- |
See accompanying notes which are an integral part of the financial statements.
Financial Statements
Statement of Assets and Liabilities
| | | October 31, 2019 |
| Assets | | |
Investment in securities, at value — See accompanying schedule:
Unaffiliated issuers (cost $43,817,124) | $45,479,151 | |
| Fidelity Central Funds (cost $1,648,312) | 1,648,312 | |
| Total Investment in Securities (cost $45,465,436) | | $47,127,463 |
| Receivable for fund shares sold | | 432,904 |
| Dividends receivable | | 54,849 |
| Distributions receivable from Fidelity Central Funds | | 4,014 |
| Other receivables | | 631 |
| Total assets | | 47,619,861 |
| Liabilities | | |
| Payable for investments purchased | $783,616 | |
| Total liabilities | | 783,616 |
| Net Assets | | $46,836,245 |
| Net Assets consist of: | | |
| Paid in capital | | $45,318,063 |
| Total accumulated earnings (loss) | | 1,518,182 |
| Net Assets, for 4,474,617 shares outstanding | | $46,836,245 |
| Net Asset Value, offering price and redemption price per share ($46,836,245 ÷ 4,474,617 shares) | | $10.47 |
See accompanying notes which are an integral part of the financial statements.
Statement of Operations
| | | For the period
April 11, 2019 (commencement of operations) to
October 31, 2019 |
| Investment Income | | |
| Dividends | | $113,712 |
| Income from Fidelity Central Funds | | 12,218 |
| Income before foreign taxes withheld | | 125,930 |
| Less foreign taxes withheld | | (10,850) |
| Total income | | 115,080 |
| Expenses | | |
| Independent trustees' fees and expenses | $24 | |
| Total expenses | | 24 |
| Net investment income (loss) | | 115,056 |
| Realized and Unrealized Gain (Loss) | | |
| Net realized gain (loss) on: | | |
| Investment securities: | | |
| Unaffiliated issuers | (248,818) | |
| Foreign currency transactions | (10,731) | |
| Total net realized gain (loss) | | (259,549) |
| Change in net unrealized appreciation (depreciation) on: | | |
| Investment securities: | | |
| Unaffiliated issuers | 1,662,027 | |
| Assets and liabilities in foreign currencies | 648 | |
| Total change in net unrealized appreciation (depreciation) | | 1,662,675 |
| Net gain (loss) | | 1,403,126 |
| Net increase (decrease) in net assets resulting from operations | | $1,518,182 |
See accompanying notes which are an integral part of the financial statements.
Statement of Changes in Net Assets
| | For the period
April 11, 2019 (commencement of operations) to
October 31, 2019 |
| Increase (Decrease) in Net Assets | |
| Operations | |
| Net investment income (loss) | $115,056 |
| Net realized gain (loss) | (259,549) |
| Change in net unrealized appreciation (depreciation) | 1,662,675 |
| Net increase (decrease) in net assets resulting from operations | 1,518,182 |
| Share transactions | |
| Proceeds from sales of shares | 46,327,763 |
| Cost of shares redeemed | (1,009,700) |
| Net increase (decrease) in net assets resulting from share transactions | 45,318,063 |
| Total increase (decrease) in net assets | 46,836,245 |
| Net Assets | |
| Beginning of period | – |
| End of period | $46,836,245 |
| Other Information | |
| Shares | |
| Sold | 4,575,369 |
| Redeemed | (100,752) |
| Net increase (decrease) | 4,474,617 |
See accompanying notes which are an integral part of the financial statements.
Financial Highlights
Fidelity SAI International SMA Completion Fund
| | |
| Year ended October 31, | 2019 A |
| Selected Per–Share Data | |
| Net asset value, beginning of period | $10.00 |
| Income from Investment Operations | |
| Net investment income (loss)B | .08 |
| Net realized and unrealized gain (loss) | .39 |
| Total from investment operations | .47 |
| Net asset value, end of period | $10.47 |
| Total ReturnC | 4.70% |
| Ratios to Average Net AssetsD,E | |
| Expenses before reductions | - %F,G |
| Expenses net of fee waivers, if any | - %F,G |
| Expenses net of all reductions | - %F,G |
| Net investment income (loss) | 1.41%F |
| Supplemental Data | |
| Net assets, end of period (000 omitted) | $46,836 |
| Portfolio turnover rateH | 24%F |
A For the period April 11, 2019 (commencement of operations) to October 31, 2019.
B Calculated based on average shares outstanding during the period.
C Total returns for periods of less than one year are not annualized.
D Fees and expenses of any underlying Fidelity Central Funds are not included in the Fund's expense ratio. The Fund indirectly bears its proportionate share of the expenses of any underlying Fidelity Central Funds.
E Expense ratios reflect operating expenses of the Fund. Expenses before reductions do not reflect amounts reimbursed by the investment adviser or reductions from expense offset arrangements and do not represent the amount paid by the Fund during periods when reimbursements or reductions occur. Expense ratios before reductions for start-up periods may not be representative of longer term operating periods. Expenses net of fee waivers reflect expenses after reimbursement by the investment adviser but prior to reductions from expense offset arrangements. Expenses net of all reductions represent the net expenses paid by the Fund.
F Annualized
G Amount represents less than .005%.
H Amount does not include the portfolio activity of any underlying Fidelity Central Funds.
See accompanying notes which are an integral part of the financial statements.
Notes to Financial Statements
For the period ended October 31, 2019
1. Organization.
Fidelity SAI International SMA Completion Fund (the Fund) is a non-diversified fund of Fidelity Investment Trust (the Trust) and is authorized to issue an unlimited number of shares. Shares are offered exclusively to certain clients of Fidelity Management & Research Company (FMR) or its affiliates. The Trust is registered under the Investment Company Act of 1940, as amended (the 1940 Act), as an open-end management investment company organized as a Massachusetts business trust. The Fund's investments in emerging markets can be subject to social, economic, regulatory, and political uncertainties and can be extremely volatile.
2. Investments in Fidelity Central Funds.
The Fund invests in Fidelity Central Funds, which are open-end investment companies generally available only to other investment companies and accounts managed by the investment adviser and its affiliates. The Fund's Schedule of Investments lists each of the Fidelity Central Funds held as of period end, if any, as an investment of the Fund, but does not include the underlying holdings of each Fidelity Central Fund. As an Investing Fund, the Fund indirectly bears its proportionate share of the expenses of the underlying Fidelity Central Funds.
The Money Market Central Funds seek preservation of capital and current income and are managed by Fidelity Investments Money Management, Inc. (FIMM), an affiliate of the investment adviser. Annualized expenses of the Money Market Central Funds as of their most recent shareholder report date ranged from less than .005% to .01%.
A complete unaudited list of holdings for each Fidelity Central Fund is available upon request or at the Securities and Exchange Commission (the SEC) website at www.sec.gov. In addition, the financial statements of the Fidelity Central Funds, which are not covered by the Fund's Report of Independent Registered Public Accounting Firm, are available on the SEC website or upon request.
3. Significant Accounting Policies.
The Fund is an investment company and applies the accounting and reporting guidance of the Financial Accounting Standards Board (FASB) Accounting Standards Codification Topic 946 Financial Services – Investments Companies. The financial statements have been prepared in conformity with accounting principles generally accepted in the United States of America (GAAP), which require management to make certain estimates and assumptions at the date of the financial statements. Actual results could differ from those estimates. Subsequent events, if any, through the date that the financial statements were issued have been evaluated in the preparation of the financial statements. The following summarizes the significant accounting policies of the Fund:
Investment Valuation. Investments are valued as of 4:00 p.m. Eastern time on the last calendar day of the period. The Board of Trustees (the Board) has delegated the day to day responsibility for the valuation of the Fund's investments to the Fair Value Committee (the Committee) established by the Fund's investment adviser. In accordance with valuation policies and procedures approved by the Board, the Fund attempts to obtain prices from one or more third party pricing vendors or brokers to value its investments. When current market prices, quotations or currency exchange rates are not readily available or reliable, investments will be fair valued in good faith by the Committee, in accordance with procedures adopted by the Board. Factors used in determining fair value vary by investment type and may include market or investment specific events. The frequency with which these procedures are used cannot be predicted and they may be utilized to a significant extent. The Committee oversees the Fund's valuation policies and procedures and reports to the Board on the Committee's activities and fair value determinations. The Board monitors the appropriateness of the procedures used in valuing the Fund's investments and ratifies the fair value determinations of the Committee.
The Fund categorizes the inputs to valuation techniques used to value its investments into a disclosure hierarchy consisting of three levels as shown below:
- Level 1 – quoted prices in active markets for identical investments
- Level 2 – other significant observable inputs (including quoted prices for similar investments, interest rates, prepayment speeds, etc.)
- Level 3 – unobservable inputs (including the Fund's own assumptions based on the best information available)
Valuation techniques used to value the Fund's investments by major category are as follows:
Equity securities, including restricted securities, for which market quotations are readily available, are valued at the last reported sale price or official closing price as reported by a third party pricing vendor on the primary market or exchange on which they are traded and are categorized as Level 1 in the hierarchy. In the event there were no sales during the day or closing prices are not available, securities are valued at the last quoted bid price or may be valued using the last available price and are generally categorized as Level 2 in the hierarchy. For foreign equity securities, when market or security specific events arise, comparisons to the valuation of American Depositary Receipts (ADRs), futures contracts, Exchange-Traded Funds (ETFs) and certain indexes as well as quoted prices for similar securities may be used and would be categorized as Level 2 in the hierarchy. For equity securities, including restricted securities, where observable inputs are limited, assumptions about market activity and risk are used and these securities may be categorized as Level 3 in the hierarchy.
Investments in open-end mutual funds, including the Fidelity Central Funds, are valued at their closing net asset value (NAV) each business day and are categorized as Level 1 in the hierarchy.
Changes in valuation techniques may result in transfers in or out of an assigned level within the disclosure hierarchy. The aggregate value of investments by input level as of October 31, 2019 is included at the end of the Fund's Schedule of Investments.
Foreign Currency. The Fund may use foreign currency contracts to facilitate transactions in foreign-denominated securities. Gains and losses from these transactions may arise from changes in the value of the foreign currency or if the counterparties do not perform under the contracts' terms.
Foreign-denominated assets, including investment securities, and liabilities are translated into U.S. dollars at the exchange rates at period end. Purchases and sales of investment securities, income and dividends received and expenses denominated in foreign currencies are translated into U.S. dollars at the exchange rate in effect on the transaction date.
The effects of exchange rate fluctuations on investments are included with the net realized and unrealized gain (loss) on investment securities. Other foreign currency transactions resulting in realized and unrealized gain (loss) are disclosed separately.
Investment Transactions and Income. For financial reporting purposes, the Fund's investment holdings and NAV include trades executed through the end of the last business day of the period. The NAV per share for processing shareholder transactions is calculated as of the close of business of the New York Stock Exchange (NYSE), normally 4:00 p.m. Eastern time and includes trades executed through the end of the prior business day. Gains and losses on securities sold are determined on the basis of identified cost. Dividend income is recorded on the ex-dividend date, except for certain dividends from foreign securities where the ex-dividend date may have passed, which are recorded as soon as the Fund is informed of the ex-dividend date. Non-cash dividends included in dividend income, if any, are recorded at the fair market value of the securities received. Income and capital gain distributions from Fidelity Central Funds, if any, are recorded on the ex-dividend date. Investment income is recorded net of foreign taxes withheld where recovery of such taxes is uncertain.
Expenses. Expenses directly attributable to a fund are charged to that fund. Expenses attributable to more than one fund are allocated among the respective funds on the basis of relative net assets or other appropriate methods. Expense estimates are accrued in the period to which they relate and adjustments are made when actual amounts are known.
Income Tax Information and Distributions to Shareholders. Each year, the Fund intends to qualify as a regulated investment company under Subchapter M of the Internal Revenue Code, including distributing substantially all of its taxable income and realized gains. As a result, no provision for U.S. Federal income taxes is required. As of October 31, 2019, the Fund did not have any unrecognized tax benefits in the financial statements; nor is the Fund aware of any tax positions for which it is reasonably possible that the total amounts of unrecognized tax benefits will significantly change in the next twelve months. The Fund files a U.S. federal tax return, in addition to state and local tax returns as required. The Fund's federal income tax returns are subject to examination by the Internal Revenue Service (IRS) for a period of three fiscal years after they are filed. State and local tax returns may be subject to examination for an additional fiscal year depending on the jurisdiction. Foreign taxes are provided for based on the Fund's understanding of the tax rules and rates that exist in the foreign markets in which it invests.
Distributions are declared and recorded on the ex-dividend date. Income and capital gain distributions are determined in accordance with income tax regulations, which may differ from GAAP.
Capital accounts within the financial statements are adjusted for permanent book-tax differences. These adjustments have no impact on net assets or the results of operations. Capital accounts are not adjusted for temporary book-tax differences which will reverse in a subsequent period.
Book-tax differences are primarily due to foreign currency transactions, capital loss carryforwards and losses deferred due to wash sales.
As of period end, the cost and unrealized appreciation (depreciation) in securities, and derivatives if applicable, for federal income tax purposes were as follows:
| Gross unrealized appreciation | $2,282,572 |
| Gross unrealized depreciation | (621,949) |
| Net unrealized appreciation (depreciation) | $1,660,623 |
| Tax Cost | $45,466,840 |
The tax-based components of distributable earnings as of period end were as follows:
| Undistributed ordinary income | $103,270 |
| Capital loss carryforward | $(247,414) |
| Net unrealized appreciation (depreciation) on securities and other investments | $1,662,326 |
Capital loss carryforwards are only available to offset future capital gains of the Fund to the extent provided by regulations and may be limited. Under the Regulated Investment Company Modernization Act of 2010 (the Act), the Fund is permitted to carry forward capital losses incurred in taxable years beginning after December 22, 2010 for an unlimited period and such capital losses are required to be used prior to any losses that expire. The capital loss carryforward information presented below, including any applicable limitation, is estimated as of fiscal period end and is subject to adjustment.
| No expiration | |
| Short-term | $(247,414) |
Restricted Securities. The Fund may invest in securities that are subject to legal or contractual restrictions on resale. These securities generally may be resold in transactions exempt from registration or to the public if the securities are registered. Disposal of these securities may involve time-consuming negotiations and expense, and prompt sale at an acceptable price may be difficult. Information regarding restricted securities is included at the end of the Fund's Schedule of Investments.
4. Purchases and Sales of Investments.
Purchases and sales of securities, other than short-term securities, aggregated $46,209,206 and $2,143,285, respectively.
5. Fees and Other Transactions with Affiliates.
Management Fee. Fidelity Management & Research Company (the investment adviser) and its affiliates provide the Fund with investment management related services and the Fund does not pay any fees for these services. Under the management contract, the investment adviser or an affiliate pays all other expenses of the Fund, excluding fees and expenses of the independent Trustees, and certain miscellaneous expenses such as proxy and shareholder meeting expenses.
Brokerage Commissions. The Fund placed a portion of its portfolio transactions with brokerage firms which are affiliates of the investment adviser. Brokerage commissions are included in net realized gain (loss) and change in net unrealized appreciation (depreciation) in the Statement of Operations. The commissions paid to these affiliated firms were $59 for the period.
Interfund Trades. The Fund may purchase from or sell securities to other Fidelity Funds under procedures adopted by the Board. The procedures have been designed to ensure these interfund trades are executed in accordance with Rule 17a-7 of the 1940 Act. Interfund trades are included within the respective purchases and sales amounts shown in the Purchases and Sales of Investments note.
6. Other.
The Fund's organizational documents provide former and current trustees and officers with a limited indemnification against liabilities arising in connection with the performance of their duties to the Fund. In the normal course of business, the Fund may also enter into contracts that provide general indemnifications. The Fund's maximum exposure under these arrangements is unknown as this would be dependent on future claims that may be made against the Fund. The risk of material loss from such claims is considered remote.
At the end of the period, the investment adviser or its affiliates were the owners of record of 11% of the total outstanding shares of the Fund.
Report of Independent Registered Public Accounting Firm
To the Trustees of Fidelity Investment Trust and Shareholders of Fidelity SAI International SMA Completion Fund:
Opinion on the Financial Statements and Financial Highlights
We have audited the accompanying statement of assets and liabilities of Fidelity SAI International SMA Completion Fund, including the schedule of investments, as of October 31, 2019, the related statement of operations, the statement of changes in net assets and the financial highlights for the period from April 11, 2019 (commencement of operations) to October 31, 2019 and the related notes. In our opinion, the financial statements and financial highlights present fairly, in all material respects, the financial position of the Fund as of October 31, 2019, and the results of its operations, the changes in its net assets and the financial highlights for the period from April 11, 2019 (commencement of operations) to October 31, 2019 in conformity with accounting principles generally accepted in the United States of America.
Basis for Opinion
These financial statements and financial highlights are the responsibility of the Fund's management. Our responsibility is to express an opinion on the Fund's financial statements and financial highlights based on our audit. We are a public accounting firm registered with the Public Company Accounting Oversight Board (United States) (PCAOB) and are required to be independent with respect to the Fund in accordance with the U.S. federal securities laws and the applicable rules and regulations of the Securities and Exchange Commission and the PCAOB.
We conducted our audit in accordance with the standards of the PCAOB. Those standards require that we plan and perform the audit to obtain reasonable assurance about whether the financial statements and financial highlights are free of material misstatement, whether due to error or fraud. The Fund is not required to have, nor were we engaged to perform, an audit of its internal control over financial reporting. As part of our audit we are required to obtain an understanding of internal control over financial reporting but not for the purpose of expressing an opinion on the effectiveness of the Fund’s internal control over financial reporting. Accordingly, we express no such opinion.
Our audit included performing procedures to assess the risks of material misstatement of the financial statements and financial highlights, whether due to error or fraud, and performing procedures that respond to those risks. Such procedures included examining, on a test basis, evidence regarding the amounts and disclosures in the financial statements and financial highlights. Our audit also included evaluating the accounting principles used and significant estimates made by management, as well as evaluating the overall presentation of the financial statements and financial highlights. Our procedures included confirmation of securities owned as of October 31, 2019, by correspondence with the custodians and brokers; when replies were not received from brokers, we performed other auditing procedures. We believe that our audit provides a reasonable basis for our opinion.
/s/ Deloitte & Touche LLP
Boston, Massachusetts
December 13, 2019
We have served as the auditor of one or more of the Fidelity investment companies since 1999.
Trustees and Officers
The Trustees, Members of the Advisory Board (if any), and officers of the trust and fund, as applicable, are listed below. The Board of Trustees governs the fund and is responsible for protecting the interests of shareholders. The Trustees are experienced executives who meet periodically throughout the year to oversee the fund's activities, review contractual arrangements with companies that provide services to the fund, oversee management of the risks associated with such activities and contractual arrangements, and review the fund's performance. Except for Jonathan Chiel, each of the Trustees oversees 298 funds. Mr. Chiel oversees 171 funds.
The Trustees hold office without limit in time except that (a) any Trustee may resign; (b) any Trustee may be removed by written instrument, signed by at least two-thirds of the number of Trustees prior to such removal; (c) any Trustee who requests to be retired or who has become incapacitated by illness or injury may be retired by written instrument signed by a majority of the other Trustees; and (d) any Trustee may be removed at any special meeting of shareholders by a two-thirds vote of the outstanding voting securities of the trust. Each Trustee who is not an interested person (as defined in the 1940 Act) of the trust and the fund is referred to herein as an Independent Trustee. Each Independent Trustee shall retire not later than the last day of the calendar year in which his or her 75th birthday occurs. The Independent Trustees may waive this mandatory retirement age policy with respect to individual Trustees. Officers and Advisory Board Members hold office without limit in time, except that any officer or Advisory Board Member may resign or may be removed by a vote of a majority of the Trustees at any regular meeting or any special meeting of the Trustees. Except as indicated, each individual has held the office shown or other offices in the same company for the past five years.
The fund’s Statement of Additional Information (SAI) includes more information about the Trustees. To request a free copy, call Fidelity at 1-800-544-3455.
Experience, Skills, Attributes, and Qualifications of the Trustees. The Governance and Nominating Committee has adopted a statement of policy that describes the experience, qualifications, attributes, and skills that are necessary and desirable for potential Independent Trustee candidates (Statement of Policy). The Board believes that each Trustee satisfied at the time he or she was initially elected or appointed a Trustee, and continues to satisfy, the standards contemplated by the Statement of Policy. The Governance and Nominating Committee also engages professional search firms to help identify potential Independent Trustee candidates who have the experience, qualifications, attributes, and skills consistent with the Statement of Policy. From time to time, additional criteria based on the composition and skills of the current Independent Trustees, as well as experience or skills that may be appropriate in light of future changes to board composition, business conditions, and regulatory or other developments, have also been considered by the professional search firms and the Governance and Nominating Committee. In addition, the Board takes into account the Trustees' commitment and participation in Board and committee meetings, as well as their leadership of standing and ad hoc committees throughout their tenure.
In determining that a particular Trustee was and continues to be qualified to serve as a Trustee, the Board has considered a variety of criteria, none of which, in isolation, was controlling. The Board believes that, collectively, the Trustees have balanced and diverse experience, qualifications, attributes, and skills, which allow the Board to operate effectively in governing the fund and protecting the interests of shareholders. Information about the specific experience, skills, attributes, and qualifications of each Trustee, which in each case led to the Board's conclusion that the Trustee should serve (or continue to serve) as a trustee of the fund, is provided below.
Board Structure and Oversight Function. James C. Curvey is an interested person and currently serves as Chairman. The Trustees have determined that an interested Chairman is appropriate and benefits shareholders because an interested Chairman has a personal and professional stake in the quality and continuity of services provided to the fund. Independent Trustees exercise their informed business judgment to appoint an individual of their choosing to serve as Chairman, regardless of whether the Trustee happens to be independent or a member of management. The Independent Trustees have determined that they can act independently and effectively without having an Independent Trustee serve as Chairman and that a key structural component for assuring that they are in a position to do so is for the Independent Trustees to constitute a substantial majority for the Board. The Independent Trustees also regularly meet in executive session. Ned C. Lautenbach serves as Chairman of the Independent Trustees and as such (i) acts as a liaison between the Independent Trustees and management with respect to matters important to the Independent Trustees and (ii) with management prepares agendas for Board meetings.
Fidelity® funds are overseen by different Boards of Trustees. The fund's Board oversees Fidelity's high income and certain equity funds, and other Boards oversee Fidelity's investment-grade bond, money market, asset allocation, and other equity funds. The asset allocation funds may invest in Fidelity® funds overseen by the fund's Board. The use of separate Boards, each with its own committee structure, allows the Trustees of each group of Fidelity® funds to focus on the unique issues of the funds they oversee, including common research, investment, and operational issues. On occasion, the separate Boards establish joint committees to address issues of overlapping consequences for the Fidelity® funds overseen by each Board.
The Trustees operate using a system of committees to facilitate the timely and efficient consideration of all matters of importance to the Trustees, the fund, and fund shareholders and to facilitate compliance with legal and regulatory requirements and oversight of the fund's activities and associated risks. The Board, acting through its committees, has charged FMR and its affiliates with (i) identifying events or circumstances the occurrence of which could have demonstrably adverse effects on the fund's business and/or reputation; (ii) implementing processes and controls to lessen the possibility that such events or circumstances occur or to mitigate the effects of such events or circumstances if they do occur; and (iii) creating and maintaining a system designed to evaluate continuously business and market conditions in order to facilitate the identification and implementation processes described in (i) and (ii) above. Because the day-to-day operations and activities of the fund are carried out by or through FMR, its affiliates, and other service providers, the fund's exposure to risks is mitigated but not eliminated by the processes overseen by the Trustees. While each of the Board's committees has responsibility for overseeing different aspects of the fund's activities, oversight is exercised primarily through the Operations, Audit, and Compliance Committees. Appropriate personnel, including but not limited to the fund's Chief Compliance Officer (CCO), FMR's internal auditor, the independent accountants, the fund's Treasurer and portfolio management personnel, make periodic reports to the Board's committees, as appropriate, including an annual review of Fidelity's risk management program for the Fidelity® funds. The responsibilities of each standing committee, including their oversight responsibilities, are described further under "Standing Committees of the Trustees."
Interested Trustees*:
Correspondence intended for a Trustee who is an interested person may be sent to Fidelity Investments, 245 Summer Street, Boston, Massachusetts 02210.
Name, Year of Birth; Principal Occupations and Other Relevant Experience+
Jonathan Chiel (1957)
Year of Election or Appointment: 2016
Trustee
Mr. Chiel also serves as Trustee of other Fidelity® funds. Mr. Chiel is Executive Vice President and General Counsel for FMR LLC (diversified financial services company, 2012-present). Previously, Mr. Chiel served as general counsel (2004-2012) and senior vice president and deputy general counsel (2000-2004) for John Hancock Financial Services; a partner with Choate, Hall & Stewart (1996-2000) (law firm); and an Assistant United States Attorney for the United States Attorney’s Office of the District of Massachusetts (1986-95), including Chief of the Criminal Division (1993-1995). Mr. Chiel is a director on the boards of the Boston Bar Foundation and the Maimonides School.
James C. Curvey (1935)
Year of Election or Appointment: 2007
Trustee
Chairman of the Board of Trustees
Mr. Curvey also serves as Trustee of other Fidelity® funds. Mr. Curvey is Vice Chairman (2007-present) and Director of FMR LLC (diversified financial services company). In addition, Mr. Curvey is an Overseer Emeritus for the Boston Symphony Orchestra, a Director of Artis-Naples, and a Trustee of Brewster Academy in Wolfeboro, New Hampshire. Previously, Mr. Curvey served as a Director of Fidelity Research & Analysis Co. (investment adviser firm, 2009-2018), Director of Fidelity Investments Money Management, Inc. (investment adviser firm, 2009-2014) and a Director of FMR and FMR Co., Inc. (investment adviser firms, 2007-2014).
* Determined to be an “Interested Trustee” by virtue of, among other things, his or her affiliation with the trust or various entities under common control with FMR.
+ The information includes the Trustee's principal occupation during the last five years and other information relating to the experience, attributes, and skills relevant to the Trustee's qualifications to serve as a Trustee, which led to the conclusion that the Trustee should serve as a Trustee for the fund.
Independent Trustees:
Correspondence intended for an Independent Trustee may be sent to Fidelity Investments, P.O. Box 55235, Boston, Massachusetts 02205-5235.
Name, Year of Birth; Principal Occupations and Other Relevant Experience+
Dennis J. Dirks (1948)
Year of Election or Appointment: 2005
Trustee
Mr. Dirks also serves as Trustee of other Fidelity® funds. Prior to his retirement in May 2003, Mr. Dirks was Chief Operating Officer and a member of the Board of The Depository Trust & Clearing Corporation (DTCC). He also served as President, Chief Operating Officer, and Board member of The Depository Trust Company (DTC) and President and Board member of the National Securities Clearing Corporation (NSCC). In addition, Mr. Dirks served as Chief Executive Officer and Board member of the Government Securities Clearing Corporation, Chief Executive Officer and Board member of the Mortgage-Backed Securities Clearing Corporation, as a Trustee and a member of the Finance Committee of Manhattan College (2005-2008), as a Trustee and a member of the Finance Committee of AHRC of Nassau County (2006-2008), as a member of the Independent Directors Council (IDC) Governing Council (2010-2015), and as a member of the Board of Directors for The Brookville Center for Children’s Services, Inc. (2009-2017). Mr. Dirks is a member of the Finance Committee (2016-present) and Board of Directors (2017-present) and is Treasurer (2018-present) of the Asolo Repertory Theatre.
Donald F. Donahue (1950)
Year of Election or Appointment: 2018
Trustee
Mr. Donahue also serves as a Trustee of other Fidelity® funds. Mr. Donahue is President and Chief Executive Officer of Miranda Partners, LLC (risk consulting for the financial services industry, 2012-present). Previously, Mr. Donahue served as a Member of the Advisory Board of certain Fidelity® funds (2015-2018) and Chief Executive Officer (2006-2012), Chief Operating Officer (2003-2006), and Managing Director, Customer Marketing and Development (1999-2003) of The Depository Trust & Clearing Corporation (financial markets infrastructure). Mr. Donahue serves as a Member (2007-present) and Co-Chairman (2016-present) of the Board of Directors of United Way of New York, Member of the Board of Directors of NYC Leadership Academy (2012-present) and Member of the Board of Advisors of Ripple Labs, Inc. (financial services, 2015-present). He also served as Chairman (2010-2012) and Member of the Board of Directors (2012-2013) of Omgeo, LLC (financial services), Treasurer of United Way of New York (2012-2016), and Member of the Board of Directors of XBRL US (financial services non-profit, 2009-2012) and the International Securities Services Association (2009-2012).
Alan J. Lacy (1953)
Year of Election or Appointment: 2008
Trustee
Mr. Lacy also serves as Trustee of other Fidelity® funds. Mr. Lacy serves as a Director of Bristol-Myers Squibb Company (global pharmaceuticals, 2008-present). He is a Trustee of the California Chapter of The Nature Conservancy (2015-present) and a Director of the Center for Advanced Study in the Behavioral Sciences at Stanford University (2015-present). In addition, Mr. Lacy served as Senior Adviser (2007-2014) of Oak Hill Capital Partners, L.P. (private equity) and also served as Chief Executive Officer (2005) and Vice Chairman (2005-2006) of Sears Holdings Corporation (retail) and Chief Executive Officer and Chairman of the Board of Sears, Roebuck and Co. (retail, 2000-2005). Previously, Mr. Lacy served as Chairman (2014-2017) and a member (2010-2017) of the Board of Directors of Dave & Buster’s Entertainment, Inc. (restaurant and entertainment complexes), as Chairman (2008-2011) and a member (2006-2015) of the Board of Trustees of the National Parks Conservation Association, and as a member of the Board of Directors for The Hillman Companies, Inc. (hardware wholesalers, 2010-2014), Earth Fare, Inc. (retail grocery, 2010-2014), and The Western Union Company (global money transfer, 2006-2011).
Ned C. Lautenbach (1944)
Year of Election or Appointment: 2000
Trustee
Chairman of the Independent Trustees
Mr. Lautenbach also serves as Trustee of other Fidelity® funds. Mr. Lautenbach currently serves as Chair (2018-present) and Member (2013-present) of the Board of Governors, State University System of Florida and is a member of the Council on Foreign Relations (1994-present). He is also a member and has most recently served as Chairman of the Board of Directors of Artis-Naples (2012-present). Previously, Mr. Lautenbach served as a member and then Lead Director of the Board of Directors of Eaton Corporation (diversified industrial, 1997-2016). He was also a Partner and Advisory Partner at Clayton, Dubilier & Rice, LLC (private equity investment, 1998-2010), as well as a Director of Sony Corporation (2006-2007). In addition, Mr. Lautenbach also had a 30-year career with IBM (technology company) during which time he served as Senior Vice President and a member of the Corporate Executive Committee (1968-1998).
Joseph Mauriello (1944)
Year of Election or Appointment: 2008
Trustee
Mr. Mauriello also serves as Trustee of other Fidelity® funds. Prior to his retirement in January 2006, Mr. Mauriello served in numerous senior management positions including Deputy Chairman and Chief Operating Officer (2004-2005), and Vice Chairman of Financial Services (2002-2004) of KPMG LLP US (professional services, 1965-2005). Mr. Mauriello currently serves as a member of the Independent Directors Council (IDC) Governing Council (2015-present). Previously, Mr. Mauriello served as a member of the Board of Directors of XL Group plc. (global insurance and re-insurance, 2006-2018).
Cornelia M. Small (1944)
Year of Election or Appointment: 2005
Trustee
Ms. Small also serves as Trustee of other Fidelity® funds. Ms. Small is a member of the Board of Directors (2009-present) and Chair of the Investment Committee (2010-present) of the Teagle Foundation. Ms. Small also serves on the Investment Committee of the Berkshire Taconic Community Foundation (2008-present). Previously, Ms. Small served as Chairperson (2002-2008) and a member of the Investment Committee and Chairperson (2008-2012) and a member of the Board of Trustees of Smith College. In addition, Ms. Small served as Chief Investment Officer, Director of Global Equity Investments, and a member of the Board of Directors of Scudder, Stevens & Clark and Scudder Kemper Investments.
Garnett A. Smith (1947)
Year of Election or Appointment: 2018
Trustee
Mr. Smith also serves as Trustee of other Fidelity® funds. Prior to Mr. Smith's retirement, he served as Chairman and Chief Executive Officer of Inbrand Corp. (manufacturer of personal absorbent products, 1990-1997). He also served as President (1986-1990) of Inbrand Corp. Prior to his employment with Inbrand Corp., he was employed by a retail fabric chain and North Carolina National Bank. In addition, Mr. Smith served as a Member of the Advisory Board of certain Fidelity® funds (2012-2013) and as a board member of the Jackson Hole Land Trust (2009-2012).
David M. Thomas (1949)
Year of Election or Appointment: 2008
Trustee
Mr. Thomas also serves as Trustee of other Fidelity® funds. Mr. Thomas serves as Non-Executive Chairman of the Board of Directors of Fortune Brands Home and Security (home and security products, 2011-present) and as a member of the Board of Directors (2004-present) and Presiding Director (2013-present) of Interpublic Group of Companies, Inc. (marketing communication). Previously, Mr. Thomas served as Executive Chairman (2005-2006) and Chairman and Chief Executive Officer (2000-2005) of IMS Health, Inc. (pharmaceutical and healthcare information solutions), a Director of Fortune Brands, Inc. (consumer products, 2000-2011), and a member of the Board of Trustees of the University of Florida (2013-2018).
+ The information includes the Trustee's principal occupation during the last five years and other information relating to the experience, attributes, and skills relevant to the Trustee's qualifications to serve as a Trustee, which led to the conclusion that the Trustee should serve as a Trustee for the fund.
Advisory Board Members and Officers:
Correspondence intended for a Member of the Advisory Board (if any) may be sent to Fidelity Investments, P.O. Box 55235, Boston, Massachusetts 02205-5235. Correspondence intended for an officer or Peter S. Lynch may be sent to Fidelity Investments, 245 Summer Street, Boston, Massachusetts 02210. Officers appear below in alphabetical order.
Name, Year of Birth; Principal Occupation
Vicki L. Fuller (1957)
Year of Election or Appointment: 2018
Member of the Advisory Board
Ms. Fuller also serves as Member of the Advisory Board of other Fidelity® funds. Ms. Fuller serves as a member of the Board of Directors, Audit Committee, and Nominating and Governance Committee of The Williams Companies, Inc. (natural gas infrastructure, 2018-present). Previously, Ms. Fuller served as the Chief Investment Officer of the New York State Common Retirement Fund (2012-2018) and held a variety of positions at AllianceBernstein L.P. (global asset management, 1985-2012), including Managing Director (2006-2012) and Senior Vice President and Senior Portfolio Manager (2001-2006).
Peter S. Lynch (1944)
Year of Election or Appointment: 2003
Member of the Advisory Board
Mr. Lynch also serves as Member of the Advisory Board of other Fidelity® funds. Mr. Lynch is Vice Chairman and a Director of FMR (investment adviser firm) and FMR Co., Inc. (investment adviser firm). In addition, Mr. Lynch serves as a Trustee of Boston College and as the Chairman of the Inner-City Scholarship Fund. Previously, Mr. Lynch served on the Special Olympics International Board of Directors (1997-2006).
Michael E. Wiley (1950)
Year of Election or Appointment: 2018
Member of the Advisory Board
Mr. Wiley also serves as Trustee or Member of the Advisory Board of other Fidelity® funds. Mr. Wiley serves as a Director of High Point Resources (exploration and production, 2005-present). Previously, Mr. Wiley served as a Director of Andeavor Corporation (independent oil refiner and marketer, 2005-2018), a Director of Andeavor Logistics LP (natural resources logistics, 2015-2018), a Director of Post Oak Bank (privately-held bank, 2004-2018), a Director of Asia Pacific Exploration Consolidated (international oil and gas exploration and production, 2008-2013), a member of the Board of Trustees of the University of Tulsa (2000-2006; 2007-2010), a Senior Energy Advisor of Katzenbach Partners, LLC (consulting, 2006-2007), an Advisory Director of Riverstone Holdings (private investment), a Director of Spinnaker Exploration Company (exploration and production, 2001-2005) and Chairman, President, and CEO of Baker Hughes, Inc. (oilfield services, 2000-2004).
Elizabeth Paige Baumann (1968)
Year of Election or Appointment: 2017
Anti-Money Laundering (AML) Officer
Ms. Baumann also serves as AML Officer of other funds. She is Chief AML Officer (2012-present) and Senior Vice President (2014-present) of FMR LLC (diversified financial services company) and is an employee of Fidelity Investments. Previously, Ms. Baumann served as AML Officer of the funds (2012-2016), and Vice President (2007-2014) and Deputy Anti-Money Laundering Officer (2007-2012) of FMR LLC.
Craig S. Brown (1977)
Year of Election or Appointment: 2019
Assistant Treasurer
Mr. Brown also serves as Assistant Treasurer of other funds. Mr. Brown is an employee of Fidelity Investments (2013-present).
John J. Burke III (1964)
Year of Election or Appointment: 2018
Chief Financial Officer
Mr. Burke also serves as Chief Financial Officer of other funds. Mr. Burke serves as Head of Investment Operations for Fidelity Fund and Investment Operations (2018-present) and is an employee of Fidelity Investments (1998-present). Previously Mr. Burke served as head of Asset Management Investment Operations (2012-2018).
William C. Coffey (1969)
Year of Election or Appointment: 2019
Assistant Secretary
Mr. Coffey also serves as Assistant Secretary of other funds. He is Senior Vice President and Deputy General Counsel of FMR LLC (diversified financial services company, 2010-present), and is an employee of Fidelity Investments. Previously, Mr. Coffey served as Secretary and CLO of certain funds (2018-2019); CLO, Secretary, and Senior Vice President of Fidelity Management & Research Company and FMR Co., Inc. (investment adviser firms, 2018-2019); Secretary of Fidelity SelectCo, LLC and Fidelity Investments Money Management, Inc. (investment adviser firms, 2018-2019); CLO of Fidelity Management & Research (Hong Kong) Limited, FMR Investment Management (UK) Limited, and Fidelity Management & Research (Japan) Limited (investment adviser firms, 2018-2019); and Assistant Secretary of certain funds (2009-2018).
Timothy M. Cohen (1969)
Year of Election or Appointment: 2018
Vice President
Mr. Cohen also serves as Vice President of other funds. Mr. Cohen serves as Executive Vice President of Fidelity SelectCo, LLC (2019-present), Co-Head of Equity (2018-present), a Director of Fidelity Management & Research (Japan) Limited (investment adviser firm, 2016-present), and is an employee of Fidelity Investments. Previously, Mr. Cohen served as Head of Global Equity Research (2016-2018), Chief Investment Officer - Equity and a Director of Fidelity Management & Research (U.K.) Inc. (investment adviser firm, 2013-2015) and as a Director of Fidelity Management & Research (Hong Kong) Limited (investment adviser firm, 2017).
Jonathan Davis (1968)
Year of Election or Appointment: 2010
Assistant Treasurer
Mr. Davis also serves as Assistant Treasurer of other funds. Mr. Davis serves as Assistant Treasurer of FMR Capital, Inc. (2017-present) and is an employee of Fidelity Investments. Previously, Mr. Davis served as Vice President and Associate General Counsel of FMR LLC (diversified financial services company, 2003-2010).
Adrien E. Deberghes (1967)
Year of Election or Appointment: 2016
Assistant Treasurer
Mr. Deberghes also serves as an officer of other funds. He serves as Assistant Treasurer of FMR Capital, Inc. (2017-present), Executive Vice President of Fidelity Investments Money Management, Inc. (FIMM) (investment adviser firm, 2016-present), and is an employee of Fidelity Investments (2008-present). Previously, Mr. Deberghes served as President and Treasurer of certain Fidelity® funds (2013-2018). Prior to joining Fidelity Investments, Mr. Deberghes was Senior Vice President of Mutual Fund Administration at State Street Corporation (2007-2008), Senior Director of Mutual Fund Administration at Investors Bank & Trust (2005-2007), and Director of Finance for Dunkin' Brands (2000-2005). Previously, Mr. Deberghes served in other fund officer roles.
Laura M. Del Prato (1964)
Year of Election or Appointment: 2018
Assistant Treasurer
Ms. Del Prato also serves as an officer of other funds. Ms. Del Prato is an employee of Fidelity Investments (2017-present). Prior to joining Fidelity Investments, Ms. Del Prato served as a Managing Director and Treasurer of the JPMorgan Mutual Funds (2014-2017). Prior to JPMorgan, Ms. Del Prato served as a partner at Cohen Fund Audit Services (accounting firm, 2012-2013) and KPMG LLP (accounting firm, 2004-2012).
Colm A. Hogan (1973)
Year of Election or Appointment: 2016
Deputy Treasurer
Mr. Hogan also serves as an officer of other funds. Mr. Hogan serves as Assistant Treasurer of FMR Capital, Inc. (2017-present) and is an employee of Fidelity Investments (2005-present). Previously, Mr. Hogan served as Assistant Treasurer of certain Fidelity® funds (2016-2018).
Pamela R. Holding (1964)
Year of Election or Appointment: 2018
Vice President
Ms. Holding also serves as Vice President of other funds. Ms. Holding serves as Executive Vice President of Fidelity SelectCo, LLC (2019-present), Co-Head of Equity (2018-present) and is an employee of Fidelity Investments (2013-present). Previously, Ms. Holding served as Chief Investment Officer of Fidelity Institutional Asset Management (2013-2018).
Cynthia Lo Bessette (1969)
Year of Election or Appointment: 2019
Secretary and Chief Legal Officer (CLO)
Ms. Lo Bessette also serves as Secretary and CLO of other funds. Ms. Lo Bessette serves as CLO, Secretary, and Senior Vice President of Fidelity Management & Research Company and FMR Co., Inc. (investment adviser firms, 2019-present); Secretary of Fidelity SelectCo, LLC and Fidelity Investments Money Management, Inc. (investment adviser firms, 2019-present); and CLO of Fidelity Management & Research (Hong Kong) Limited, FMR Investment Management (UK) Limited, and Fidelity Management & Research (Japan) Limited (investment adviser firms, 2019-present). She is a Senior Vice President and Deputy General Counsel of FMR LLC (diversified financial services company, 2019-present), and is an employee of Fidelity Investments. Previously, Ms. Lo Bessette served as Executive Vice President, General Counsel (2016-2019) and Senior Vice President, Deputy General Counsel (2015-2016) of OppenheimerFunds (investment management company) and Deputy Chief Legal Officer (2013-2015) of Jennison Associates LLC (investment adviser firm).
Chris Maher (1972)
Year of Election or Appointment: 2013
Assistant Treasurer
Mr. Maher serves as Assistant Treasurer of other funds. Mr. Maher is Vice President of Valuation Oversight, serves as Assistant Treasurer of FMR Capital, Inc. (2017-present), and is an employee of Fidelity Investments. Previously, Mr. Maher served as Vice President of Asset Management Compliance (2013), Vice President of the Program Management Group of FMR (investment adviser firm, 2010-2013), and Vice President of Valuation Oversight (2008-2010).
Kenneth B. Robins (1969)
Year of Election or Appointment: 2016
Chief Compliance Officer
Mr. Robins also serves as an officer of other funds. Mr. Robins serves as Compliance Officer of Fidelity Management & Research Company and FMR Co., Inc. (investment adviser firms, 2016-present) and is an employee of Fidelity Investments (2004-present). Previously, Mr. Robins served as Executive Vice President of Fidelity Investments Money Management, Inc. (investment adviser firm, 2013-2016) and served in other fund officer roles.
Stacie M. Smith (1974)
Year of Election or Appointment: 2016
President and Treasurer
Ms. Smith also serves as an officer of other funds. Ms. Smith serves as Assistant Treasurer of FMR Capital, Inc. (2017-present), is an employee of Fidelity Investments (2009-present), and has served in other fund officer roles. Prior to joining Fidelity Investments, Ms. Smith served as Senior Audit Manager of Ernst & Young LLP (accounting firm, 1996-2009). Previously, Ms. Smith served as Assistant Treasurer (2013-2018) and Deputy Treasurer (2013-2016) of certain Fidelity® funds.
Marc L. Spector (1972)
Year of Election or Appointment: 2016
Assistant Treasurer
Mr. Spector also serves as an officer of other funds. Mr. Spector serves as Assistant Treasurer of FMR Capital, Inc. (2017-present) and is an employee of Fidelity Investments (2016-present). Prior to joining Fidelity Investments, Mr. Spector served as Director at the Siegfried Group (accounting firm, 2013-2016), and prior to Siegfried Group as audit senior manager at Deloitte & Touche (accounting firm, 2005-2013).
Jim Wegmann (1979)
Year of Election or Appointment: 2019
Assistant Treasurer
Mr. Wegmann also serves as Assistant Treasurer of other funds. Mr. Wegmann is an employee of Fidelity Investments (2011-present).
Shareholder Expense Example
As a shareholder of the Fund, you incur two types of costs: (1) transaction costs and (2) ongoing costs, including management fees and other Fund expenses. This Example is intended to help you understand your ongoing costs (in dollars) of investing in the Fund and to compare these costs with the ongoing costs of investing in other mutual funds.
The Example is based on an investment of $1,000 invested at the beginning of the period and held for the entire period (May 1, 2019 to October 31, 2019).
Actual Expenses
The first line of the accompanying table provides information about actual account values and actual expenses. You may use the information in this line, together with the amount you invested, to estimate the expenses that you paid over the period. Simply divide your account value by $1,000.00 (for example, an $8,600 account value divided by $1,000.00 = 8.6), then multiply the result by the number in the first line under the heading entitled "Expenses Paid During Period" to estimate the expenses you paid on your account during this period. In addition, the Fund, as a shareholder in the underlying Fidelity Central Funds, will indirectly bear its pro-rata share of the fees and expenses incurred by the underlying Fidelity Central Funds. These fees and expenses are not included in the Fund's annualized expense ratio used to calculate the expense estimate in the table below.
Hypothetical Example for Comparison Purposes
The second line of the accompanying table provides information about hypothetical account values and hypothetical expenses based on the Fund's actual expense ratio and an assumed rate of return of 5% per year before expenses, which is not the Fund's actual return. The hypothetical account values and expenses may not be used to estimate the actual ending account balance or expenses you paid for the period. You may use this information to compare the ongoing costs of investing in the Fund and other funds. To do so, compare this 5% hypothetical example with the 5% hypothetical examples that appear in the shareholder reports of the other funds. In addition, the Fund, as a shareholder in the underlying Fidelity Central Funds, will indirectly bear its pro-rata share of the fees and expenses incurred by the underlying Fidelity Central Funds. These fees and expenses are not included in the Fund's annualized expense ratio used to calculate the expense estimate in the table below.
Please note that the expenses shown in the table are meant to highlight your ongoing costs only and do not reflect any transaction costs. Therefore, the second line of the table is useful in comparing ongoing costs only, and will not help you determine the relative total costs of owning different funds.
| | Annualized Expense Ratio-A | Beginning
Account Value
May 1, 2019 | Ending
Account Value
October 31, 2019 | Expenses Paid
During Period-B
May 1, 2019
to October 31, 2019 |
| Actual | - %-C | $1,000.00 | $1,041.80 | $--D |
| Hypothetical-E | | $1,000.00 | $1,025.21 | $--D |
A Annualized expense ratio reflects expenses net of applicable fee waivers.
B Expenses are equal to the Fund's annualized expense ratio, multiplied by the average account value over the period, multiplied by 184/365 (to reflect the one-half year period).
C Amount represents less than .005%.
D Amount represents less than $.005.
E 5% return per year before expenses
ISM-ANN-1219
1.9893098.100
Fidelity® International Capital Appreciation K6 Fund
Annual Report
October 31, 2019
See the inside front cover for important information about access to your fund’s shareholder reports.
Beginning on January 1, 2021, as permitted by regulations adopted by the Securities and Exchange Commission, paper copies of a fund’s shareholder reports will no longer be sent by mail, unless you specifically request paper copies of the reports from the fund or from your financial intermediary, such as a financial advisor, broker-dealer or bank. Instead, the reports will be made available on a website, and you will be notified by mail each time a report is posted and provided with a website link to access the report.
If you already elected to receive shareholder reports electronically, you will not be affected by this change and you need not take any action. You may elect to receive shareholder reports and other communications from a fund electronically, by contacting your financial intermediary. For Fidelity customers, visit Fidelity's web site or call Fidelity using the contact information listed below.
You may elect to receive all future reports in paper free of charge. If you wish to continue receiving paper copies of your shareholder reports, you may contact your financial intermediary or, if you are a Fidelity customer, visit Fidelity’s website, or call Fidelity at the applicable toll-free number listed below. Your election to receive reports in paper will apply to all funds held with the fund complex/your financial intermediary.
| Account Type | Website | Phone Number |
| Brokerage, Mutual Fund, or Annuity Contracts: | fidelity.com/mailpreferences | 1-800-343-3548 |
| Employer Provided Retirement Accounts: | netbenefits.fidelity.com/preferences (choose 'no' under Required Disclosures to continue to print) | 1-800-343-0860 |
| Advisor Sold Accounts Serviced Through Your Financial Intermediary: | Contact Your Financial Intermediary | Your Financial Intermediary's phone number |
| Advisor Sold Accounts Serviced by Fidelity: | institutional.fidelity.com | 1-877-208-0098 |
Contents
To view a fund's proxy voting guidelines and proxy voting record for the 12-month period ended June 30, visit http://www.fidelity.com/proxyvotingresults or visit the Securities and Exchange Commission's (SEC) web site at http://www.sec.gov.
You may also call 1-800-835-5092 to request a free copy of the proxy voting guidelines.
Standard & Poor's, S&P and S&P 500 are registered service marks of The McGraw-Hill Companies, Inc. and have been licensed for use by Fidelity Distributors Corporation.
Other third-party marks appearing herein are the property of their respective owners.
All other marks appearing herein are registered or unregistered trademarks or service marks of FMR LLC or an affiliated company. © 2019 FMR LLC. All rights reserved.
This report and the financial statements contained herein are submitted for the general information of the shareholders of the Fund. This report is not authorized for distribution to prospective investors in the Fund unless preceded or accompanied by an effective prospectus.
A fund files its complete schedule of portfolio holdings with the SEC for the first and third quarters of each fiscal year on Form N-PORT. Forms N-PORT are available on the SEC’s web site at http://www.sec.gov. A fund's Forms N-PORT may be reviewed and copied at the SEC’s Public Reference Room in Washington, DC. Information regarding the operation of the SEC's Public Reference Room may be obtained by calling 1-800-SEC-0330.
For a complete list of a fund's portfolio holdings, view the most recent holdings listing, semiannual report, or annual report on Fidelity's web site at http://www.fidelity.com, http://www.institutional.fidelity.com, or http://www.401k.com, as applicable.
NOT FDIC INSURED •MAY LOSE VALUE •NO BANK GUARANTEE
Neither the Fund nor Fidelity Distributors Corporation is a bank.
Performance: The Bottom Line
Average annual total return reflects the change in the value of an investment, assuming reinvestment of distributions from dividend income and capital gains (the profits earned upon the sale of securities that have grown in value, if any) and assuming a constant rate of performance each year. The hypothetical investment and the average annual total returns do not reflect the deduction of taxes that a shareholder would pay on fund distributions or the redemption of fund shares. During periods of reimbursement by Fidelity, a fund’s total return will be greater than it would be had the reimbursement not occurred. How a fund did yesterday is no guarantee of how it will do tomorrow.
Average Annual Total Returns
| For the periods ended October 31, 2019 | Past 1 year | Life of fundA |
| Fidelity® International Capital Appreciation K6 Fund | 22.90% | 9.72% |
A From May 25, 2017
$10,000 Over Life of Fund
Let's say hypothetically that $10,000 was invested in Fidelity® International Capital Appreciation K6 Fund on May 25, 2017, when the fund started.
The chart shows how the value of your investment would have changed, and also shows how the MSCI ACWI (All Country World Index) ex USA Index performed over the same period.
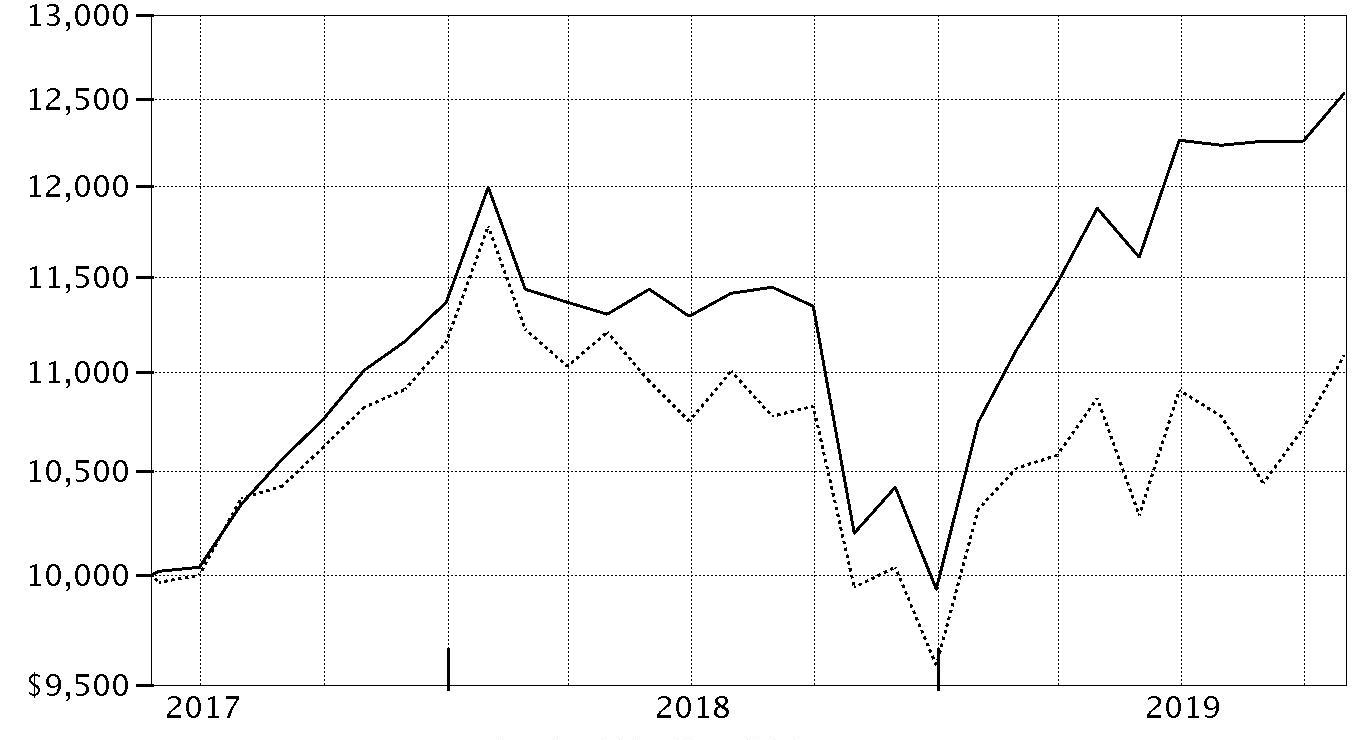
| Period Ending Values |
| $12,535 | Fidelity® International Capital Appreciation K6 Fund |
| $11,087 | MSCI ACWI (All Country World Index) ex USA Index |
Management's Discussion of Fund Performance
Market Recap: The MSCI ACWI (All Country World Index) ex USA Index gained 11.47% for the 12 months ending October 31, 2019, as international stocks reflected a confluence of factors, including escalating trade tension, and moderating but still positive global economic growth. Currency fluctuations were largely modest and varied by region, muting the overall impact on international equity returns. In late December, the U.S. Federal Reserve shifted from raising interest rates to a more dovish policy in 2019, joining many foreign central banks. In June, international stocks rose 6.03%, as policy stimulus in China stabilized that country’s economic growth. The Fed cut its policy rate in July for the first time since 2008. However, the index returned -1.21% for the month, followed by -3.08% in August. In September, the Fed cut its policy rate another quarter point, citing concerns about slowing economic growth and muted inflation, and did the same in October, leading to monthly gains of 2.59% and 3.49%, respectively. For the full 12 months, the growth-oriented information technology sector (+22%) led the way, followed by utilities (+20%) and real estate (+18%), two high-dividend-yielding categories. Conversely, energy was roughly flat, while materials (+6%) and communication services (7%) also lagged. By region, Asia Pacific ex Japan (+16%), Europe ex U.K (+13%), Canada (+12%) and emerging markets (+12%) fared best. Meanwhile, the U.K. (+7%) and Japan (+10%) trailed the broader market.
Comments from Portfolio Manager Sammy Simnegar: For the year, the fund gained 22.90%, roughly double the 11.47% advance of the benchmark MSCI ACWI (All Country World Index) ex USA Index. Stock selection in financials, industrials and consumer-oriented sectors all contributed meaningfully to performance versus the benchmark the past 12 months, as did a sizable overweighting in information technology. Geographically, positioning in Continental Europe proved rewarding, particularly in France, Germany and the Netherlands. In emerging markets, exposure to China and India stood out. The fund’s top relative contributor was B3 (Brasil Bolsa Balcao), Brazil’s stock exchange. The fund also benefited from overweighted exposure to two China-based liquor manufacturers, Kweichow Moutai and Wuliangye Yibin – both sold by period end – as well as out-of-benchmark positions in two suppliers of commercial and military aircraft parts, TransDigm Group and Heico. Conversely, picks in the retailing segment of consumer discretionary and the fund's positioning in semiconductors & semiconductor equipment detracted modestly, as did a cash position averaging about 2%. A non-benchmark stake in MercadoLibre, a Latin American operator of e-commerce marketplaces, was the portfolio's largest relative detractor. Overweighting Taiwan Semiconductor Manufacturing and Belgium-based Umicore – a producer of electric-vehicle battery cathodes that I sold from the fund – also hurt.
The views expressed above reflect those of the portfolio manager(s) only through the end of the period as stated on the cover of this report and do not necessarily represent the views of Fidelity or any other person in the Fidelity organization. Any such views are subject to change at any time based upon market or other conditions and Fidelity disclaims any responsibility to update such views. These views may not be relied on as investment advice and, because investment decisions for a Fidelity fund are based on numerous factors, may not be relied on as an indication of trading intent on behalf of any Fidelity fund.
Investment Summary (Unaudited)
Geographic Diversification (% of fund's net assets)
| As of October 31, 2019 |
| | France | 13.0% |
| | United Kingdom | 9.2% |
| | Canada | 8.8% |
| | Switzerland | 6.4% |
| | Germany | 6.4% |
| | Japan | 6.3% |
| | Cayman Islands | 6.0% |
| | Netherlands | 5.7% |
| | United States of America* | 5.1% |
| | Other | 33.1% |

* Includes Short-Term investments and Net Other Assets (Liabilities).
Percentages are based on country or territory of incorporation and are adjusted for the effect of futures contracts, if applicable.
Asset Allocation as of October 31, 2019
| | % of fund's net assets |
| Stocks | 97.4 |
| Short-Term Investments and Net Other Assets (Liabilities) | 2.6 |
Top Ten Stocks as of October 31, 2019
| | % of fund's net assets |
| Nestle SA (Reg. S) (Switzerland, Food Products) | 2.5 |
| Alibaba Group Holding Ltd. sponsored ADR (Cayman Islands, Internet & Direct Marketing Retail) | 2.1 |
| Tencent Holdings Ltd. (Cayman Islands, Interactive Media & Services) | 2.0 |
| Taiwan Semiconductor Manufacturing Co. Ltd. (Taiwan, Semiconductors & Semiconductor Equipment) | 2.0 |
| Unilever NV (Netherlands, Personal Products) | 1.5 |
| SAP SE (Germany, Software) | 1.5 |
| LVMH Moet Hennessy Louis Vuitton SE (France, Textiles, Apparel & Luxury Goods) | 1.5 |
| AIA Group Ltd. (Hong Kong, Insurance) | 1.4 |
| ASML Holding NV (Netherlands) (Netherlands, Semiconductors & Semiconductor Equipment) | 1.4 |
| Diageo PLC (United Kingdom, Beverages) | 1.3 |
| | 17.2 |
Top Market Sectors as of October 31, 2019
| | % of fund's net assets |
| Industrials | 23.1 |
| Information Technology | 19.0 |
| Consumer Discretionary | 14.3 |
| Consumer Staples | 13.4 |
| Financials | 12.6 |
| Materials | 4.9 |
| Communication Services | 3.2 |
| Health Care | 2.8 |
| Utilities | 2.2 |
| Real Estate | 1.9 |
Schedule of Investments October 31, 2019
Showing Percentage of Net Assets
| Common Stocks - 97.4% | | | |
| | | Shares | Value |
| Australia - 1.8% | | | |
| Sydney Airport unit | | 784,765 | $4,752,887 |
| Transurban Group unit | | 468,400 | 4,797,328 |
|
| TOTAL AUSTRALIA | | | 9,550,215 |
|
| Bailiwick of Jersey - 1.0% | | | |
| Experian PLC | | 157,794 | 4,962,795 |
| Bermuda - 1.6% | | | |
| Hiscox Ltd. | | 221,600 | 4,274,168 |
| IHS Markit Ltd. (a) | | 61,412 | 4,300,068 |
|
| TOTAL BERMUDA | | | 8,574,236 |
|
| Brazil - 2.8% | | | |
| BM&F BOVESPA SA | | 457,500 | 5,518,975 |
| Lojas Renner SA | | 362,000 | 4,580,850 |
| Rumo SA (a) | | 792,100 | 4,503,149 |
|
| TOTAL BRAZIL | | | 14,602,974 |
|
| Canada - 8.8% | | | |
| Alimentation Couche-Tard, Inc. Class B (sub. vtg.) | | 169,364 | 5,079,248 |
| Brookfield Asset Management, Inc. | | 102,155 | 5,644,064 |
| Canadian National Railway Co. | | 67,539 | 6,040,615 |
| Canadian Pacific Railway Ltd. | | 23,376 | 5,315,728 |
| CGI Group, Inc. Class A (sub. vtg.) (a) | | 61,800 | 4,803,799 |
| Constellation Software, Inc. | | 4,989 | 4,927,371 |
| Restaurant Brands International, Inc. | | 74,900 | 4,900,260 |
| Thomson Reuters Corp. | | 70,000 | 4,704,047 |
| Waste Connection, Inc. (Canada) | | 50,350 | 4,650,809 |
|
| TOTAL CANADA | | | 46,065,941 |
|
| Cayman Islands - 6.0% | | | |
| Alibaba Group Holding Ltd. sponsored ADR (a) | | 63,367 | 11,195,048 |
| New Oriental Education & Technology Group, Inc. sponsored ADR (a) | | 41,724 | 5,092,831 |
| Shenzhou International Group Holdings Ltd. | | 333,600 | 4,609,903 |
| Tencent Holdings Ltd. | | 254,900 | 10,339,488 |
|
| TOTAL CAYMAN ISLANDS | | | 31,237,270 |
|
| China - 1.1% | | | |
| Ping An Insurance Group Co. of China Ltd. (H Shares) | | 518,000 | 5,978,648 |
| Denmark - 1.9% | | | |
| Coloplast A/S Series B | | 41,000 | 4,940,467 |
| DSV A/S | | 51,900 | 5,035,977 |
|
| TOTAL DENMARK | | | 9,976,444 |
|
| Finland - 0.8% | | | |
| Kone OYJ (B Shares) | | 69,200 | 4,402,276 |
| France - 13.0% | | | |
| Air Liquide SA | | 43,670 | 5,800,784 |
| Dassault Systemes SA | | 36,326 | 5,511,982 |
| Edenred SA | | 97,463 | 5,130,663 |
| Hermes International SCA | | 7,385 | 5,312,536 |
| Kering SA | | 9,593 | 5,458,667 |
| L'Oreal SA | | 22,729 | 6,636,539 |
| LVMH Moet Hennessy Louis Vuitton SE | | 18,063 | 7,713,913 |
| Pernod Ricard SA | | 31,178 | 5,754,902 |
| Remy Cointreau SA | | 34,600 | 4,626,867 |
| Safran SA | | 35,064 | 5,547,311 |
| SR Teleperformance SA | | 21,841 | 4,949,803 |
| VINCI SA | | 51,457 | 5,773,433 |
|
| TOTAL FRANCE | | | 68,217,400 |
|
| Germany - 6.4% | | | |
| adidas AG | | 18,062 | 5,577,018 |
| Deutsche Borse AG | | 32,900 | 5,094,884 |
| Nemetschek Se | | 91,478 | 4,652,359 |
| SAP SE | | 60,000 | 7,950,089 |
| Symrise AG | | 48,608 | 4,677,455 |
| Vonovia SE | | 103,000 | 5,480,729 |
|
| TOTAL GERMANY | | | 33,432,534 |
|
| Hong Kong - 1.4% | | | |
| AIA Group Ltd. | | 758,000 | 7,548,334 |
| India - 2.5% | | | |
| HDFC Bank Ltd. | | 210,914 | 3,651,719 |
| HDFC Bank Ltd. sponsored ADR | | 20 | 1,222 |
| Housing Development Finance Corp. Ltd. | | 168,073 | 5,040,576 |
| Kotak Mahindra Bank Ltd. | | 200,245 | 4,438,166 |
|
| TOTAL INDIA | | | 13,131,683 |
|
| Indonesia - 0.9% | | | |
| PT Bank Central Asia Tbk | | 2,124,600 | 4,755,551 |
| Ireland - 2.7% | | | |
| Kerry Group PLC Class A | | 39,300 | 4,751,312 |
| Kingspan Group PLC (Ireland) | | 93,000 | 4,818,966 |
| Linde PLC | | 23,200 | 4,601,720 |
|
| TOTAL IRELAND | | | 14,171,998 |
|
| Israel - 0.9% | | | |
| NICE Systems Ltd. sponsored ADR (a) | | 31,155 | 4,915,947 |
| Italy - 3.7% | | | |
| Amplifon SpA | | 190,109 | 4,774,883 |
| Davide Campari-Milano SpA | | 468,800 | 4,295,234 |
| Enel SpA | | 750,100 | 5,813,548 |
| Moncler SpA | | 112,092 | 4,318,060 |
|
| TOTAL ITALY | | | 19,201,725 |
|
| Japan - 6.3% | | | |
| Hoya Corp. | | 59,600 | 5,267,283 |
| Kao Corp. | | 68,418 | 5,500,717 |
| Keyence Corp. | | 9,332 | 5,900,590 |
| OBIC Co. Ltd. | | 42,200 | 5,283,660 |
| Recruit Holdings Co. Ltd. | | 171,300 | 5,692,992 |
| Shiseido Co. Ltd. | | 63,600 | 5,243,690 |
|
| TOTAL JAPAN | | | 32,888,932 |
|
| Netherlands - 5.7% | | | |
| ASML Holding NV (Netherlands) | | 27,620 | 7,239,605 |
| Ferrari NV | | 32,000 | 5,119,673 |
| InterXion Holding NV (a) | | 54,317 | 4,791,846 |
| Unilever NV | | 136,700 | 8,072,837 |
| Wolters Kluwer NV | | 66,100 | 4,867,082 |
|
| TOTAL NETHERLANDS | | | 30,091,043 |
|
| Philippines - 0.9% | | | |
| SM Prime Holdings, Inc. | | 6,389,500 | 4,902,540 |
| Spain - 4.2% | | | |
| Amadeus IT Holding SA Class A | | 72,124 | 5,336,383 |
| Cellnex Telecom SA (b) | | 110,800 | 4,777,419 |
| Cellnex Telecom SA (a) | | 32,166 | 1,386,917 |
| Ferrovial SA | | 155,700 | 4,594,837 |
| Iberdrola SA | | 554,113 | 5,695,726 |
|
| TOTAL SPAIN | | | 21,791,282 |
|
| Sweden - 2.9% | | | |
| ASSA ABLOY AB (B Shares) | | 212,100 | 5,037,031 |
| Atlas Copco AB (A Shares) | | 141,000 | 4,981,006 |
| Hexagon AB (B Shares) | | 102,159 | 5,214,968 |
|
| TOTAL SWEDEN | | | 15,233,005 |
|
| Switzerland - 6.4% | | | |
| Givaudan SA | | 1,672 | 4,910,070 |
| Nestle SA (Reg. S) | | 122,330 | 13,087,035 |
| Partners Group Holding AG | | 6,162 | 4,804,673 |
| Sika AG | | 32,904 | 5,653,551 |
| Temenos Group AG | | 36,433 | 5,198,119 |
|
| TOTAL SWITZERLAND | | | 33,653,448 |
|
| Taiwan - 2.0% | | | |
| Taiwan Semiconductor Manufacturing Co. Ltd. | | 1,050,000 | 10,270,394 |
| United Kingdom - 9.2% | | | |
| Ashtead Group PLC | | 166,200 | 5,054,943 |
| Atlassian Corp. PLC (a) | | 41,900 | 5,061,101 |
| Compass Group PLC | | 212,979 | 5,670,372 |
| Diageo PLC | | 167,372 | 6,850,700 |
| Halma PLC | | 198,600 | 4,819,701 |
| London Stock Exchange Group PLC | | 52,947 | 4,771,522 |
| Prudential PLC | | 291,300 | 5,088,090 |
| RELX PLC (London Stock Exchange) | | 243,892 | 5,869,896 |
| Rentokil Initial PLC | | 824,790 | 4,855,840 |
|
| TOTAL UNITED KINGDOM | | | 48,042,165 |
|
| United States of America - 2.5% | | | |
| MasterCard, Inc. Class A | | 15,209 | 4,210,003 |
| MercadoLibre, Inc. (a) | | 9,100 | 4,745,832 |
| Visa, Inc. Class A | | 23,981 | 4,289,242 |
|
| TOTAL UNITED STATES OF AMERICA | | | 13,245,077 |
|
| TOTAL COMMON STOCKS | | | |
| (Cost $442,328,546) | | | 510,843,857 |
|
| Money Market Funds - 2.6% | | | |
| Fidelity Cash Central Fund 1.83% (c) | | | |
| (Cost $13,698,701) | | 13,695,961 | 13,698,701 |
| TOTAL INVESTMENT IN SECURITIES - 100.0% | | | |
| (Cost $456,027,247) | | | 524,542,558 |
| NET OTHER ASSETS (LIABILITIES) - 0.0% | | | (190,015) |
| NET ASSETS - 100% | | | $524,352,543 |
Categorizations in the Schedule of Investments are based on country or territory of incorporation.
Legend
(a) Non-income producing
(b) Security exempt from registration under Rule 144A of the Securities Act of 1933. These securities may be resold in transactions exempt from registration, normally to qualified institutional buyers. At the end of the period, the value of these securities amounted to $4,777,419 or 0.9% of net assets.
(c) Affiliated fund that is generally available only to investment companies and other accounts managed by Fidelity Investments. The rate quoted is the annualized seven-day yield of the fund at period end. A complete unaudited listing of the fund's holdings as of its most recent quarter end is available upon request. In addition, each Fidelity Central Fund's financial statements are available on the SEC's website or upon request.
Affiliated Central Funds
Information regarding fiscal year to date income earned by the Fund from investments in Fidelity Central Funds is as follows:
| Fund | Income earned |
| Fidelity Cash Central Fund | $166,342 |
| Fidelity Securities Lending Cash Central Fund | 85,670 |
| Total | $252,012 |
Amounts in the income column in the above table include any capital gain distributions from underlying funds, which are presented in the corresponding line-item in the Statement of Operations, if applicable. Amount for Fidelity Securities Lending Cash Central Fund represents the income earned on investing cash collateral, less rebates paid to borrowers and any lending agent fees associated with the loan, plus any premium payments received for lending certain types of securities.
Investment Valuation
The following is a summary of the inputs used, as of October 31, 2019, involving the Fund's assets and liabilities carried at fair value. The inputs or methodology used for valuing securities may not be an indication of the risk associated with investing in those securities. For more information on valuation inputs, and their aggregation into the levels used below, please refer to the Investment Valuation section in the accompanying Notes to Financial Statements.
| | Valuation Inputs at Reporting Date: |
| Description | Total | Level 1 | Level 2 | Level 3 |
| Investments in Securities: | | | | |
| Equities: | | | | |
| Communication Services | $16,503,824 | $6,164,336 | $10,339,488 | $-- |
| Consumer Discretionary | 74,294,963 | 56,300,775 | 17,994,188 | -- |
| Consumer Staples | 69,899,081 | 39,216,939 | 30,682,142 | -- |
| Financials | 66,610,592 | 20,243,102 | 46,367,490 | -- |
| Health Care | 14,982,633 | 9,715,350 | 5,267,283 | -- |
| Industrials | 120,639,482 | 100,359,244 | 20,280,238 | -- |
| Information Technology | 100,377,159 | 63,732,821 | 36,644,338 | -- |
| Materials | 25,643,580 | 25,643,580 | -- | -- |
| Real Estate | 10,383,269 | 5,480,729 | 4,902,540 | -- |
| Utilities | 11,509,274 | -- | 11,509,274 | -- |
| Money Market Funds | 13,698,701 | 13,698,701 | -- | -- |
| Total Investments in Securities: | $524,542,558 | $340,555,577 | $183,986,981 | $-- |
See accompanying notes which are an integral part of the financial statements.
Financial Statements
Statement of Assets and Liabilities
| | | October 31, 2019 |
| Assets | | |
Investment in securities, at value — See accompanying schedule:
Unaffiliated issuers (cost $442,328,546) | $510,843,857 | |
| Fidelity Central Funds (cost $13,698,701) | 13,698,701 | |
| Total Investment in Securities (cost $456,027,247) | | $524,542,558 |
| Foreign currency held at value (cost $617,101) | | 617,101 |
| Receivable for investments sold | | 6,309,480 |
| Receivable for fund shares sold | | 600,696 |
| Dividends receivable | | 415,946 |
| Distributions receivable from Fidelity Central Funds | | 16,982 |
| Other receivables | | 31,731 |
| Total assets | | 532,534,494 |
| Liabilities | | |
| Payable for investments purchased | $7,644,798 | |
| Payable for fund shares redeemed | 194,358 | |
| Accrued management fee | 276,404 | |
| Other payables and accrued expenses | 66,391 | |
| Total liabilities | | 8,181,951 |
| Net Assets | | $524,352,543 |
| Net Assets consist of: | | |
| Paid in capital | | $466,170,859 |
| Total accumulated earnings (loss) | | 58,181,684 |
| Net Assets, for 42,302,224 shares outstanding | | $524,352,543 |
| Net Asset Value, offering price and redemption price per share ($524,352,543 ÷ 42,302,224 shares) | | $12.40 |
See accompanying notes which are an integral part of the financial statements.
Statement of Operations
| | | Year ended October 31, 2019 |
| Investment Income | | |
| Dividends | | $6,173,374 |
| Non-Cash dividends | | 1,876,591 |
| Income from Fidelity Central Funds (including $85,670 from security lending) | | 252,012 |
| Income before foreign taxes withheld | | 8,301,977 |
| Less foreign taxes withheld | | (584,983) |
| Total income | | 7,716,994 |
| Expenses | | |
| Management fee | $2,789,078 | |
| Independent trustees' fees and expenses | 2,318 | |
| Interest | 2,046 | |
| Commitment fees | 1,096 | |
| Total expenses before reductions | 2,794,538 | |
| Expense reductions | (64,775) | |
| Total expenses after reductions | | 2,729,763 |
| Net investment income (loss) | | 4,987,231 |
| Realized and Unrealized Gain (Loss) | | |
| Net realized gain (loss) on: | | |
| Investment securities: | | |
| Unaffiliated issuers | (380,679) | |
| Fidelity Central Funds | 7 | |
| Foreign currency transactions | (90,051) | |
| Total net realized gain (loss) | | (470,723) |
| Change in net unrealized appreciation (depreciation) on: | | |
| Investment securities: | | |
| Unaffiliated issuers (net of increase in deferred foreign taxes of $66,389) | 81,036,188 | |
| Assets and liabilities in foreign currencies | 10,776 | |
| Total change in net unrealized appreciation (depreciation) | | 81,046,964 |
| Net gain (loss) | | 80,576,241 |
| Net increase (decrease) in net assets resulting from operations | | $85,563,472 |
See accompanying notes which are an integral part of the financial statements.
Statement of Changes in Net Assets
| | Year ended October 31, 2019 | Year ended October 31, 2018 |
| Increase (Decrease) in Net Assets | | |
| Operations | | |
| Net investment income (loss) | $4,987,231 | $2,875,932 |
| Net realized gain (loss) | (470,723) | (14,641,962) |
| Change in net unrealized appreciation (depreciation) | 81,046,964 | (23,009,341) |
| Net increase (decrease) in net assets resulting from operations | 85,563,472 | (34,775,371) |
| Distributions to shareholders | (2,841,028) | (556,479) |
| Share transactions | | |
| Proceeds from sales of shares | 176,361,634 | 284,114,051 |
| Reinvestment of distributions | 2,841,028 | 556,479 |
| Cost of shares redeemed | (98,535,277) | (63,779,612) |
| Net increase (decrease) in net assets resulting from share transactions | 80,667,385 | 220,890,918 |
| Total increase (decrease) in net assets | 163,389,829 | 185,559,068 |
| Net Assets | | |
| Beginning of period | 360,962,714 | 175,403,646 |
| End of period | $524,352,543 | $360,962,714 |
| Other Information | | |
| Shares | | |
| Sold | 15,318,074 | 25,176,612 |
| Issued in reinvestment of distributions | 283,819 | 50,133 |
| Redeemed | (8,785,472) | (5,674,611) |
| Net increase (decrease) | 6,816,421 | 19,552,134 |
See accompanying notes which are an integral part of the financial statements.
Financial Highlights
Fidelity International Capital Appreciation K6 Fund
| | | | |
| Years ended October 31, | 2019 | 2018 | 2017 A |
| Selected Per–Share Data | | | |
| Net asset value, beginning of period | $10.17 | $11.01 | $10.00 |
| Income from Investment Operations | | | |
| Net investment income (loss)B | .13C | .11 | .02 |
| Net realized and unrealized gain (loss) | 2.18 | (.92) | .99 |
| Total from investment operations | 2.31 | (.81) | 1.01 |
| Distributions from net investment income | (.08) | (.02) | – |
| Distributions from net realized gain | – | (.01) | – |
| Total distributions | (.08) | (.03) | – |
| Net asset value, end of period | $12.40 | $10.17 | $11.01 |
| Total ReturnD,E | 22.90% | (7.36)% | 10.10% |
| Ratios to Average Net AssetsF,G | | | |
| Expenses before reductions | .65% | .65% | .65%H |
| Expenses net of fee waivers, if any | .65% | .65% | .65%H |
| Expenses net of all reductions | .63% | .58% | .65%H |
| Net investment income (loss) | 1.16%C | .99% | .51%H |
| Supplemental Data | | | |
| Net assets, end of period (000 omitted) | $524,353 | $360,963 | $175,404 |
| Portfolio turnover rateI,J | 144% | 158% | 81%K |
A For the period May 25, 2017 (commencement of operations) to October 31, 2017.
B Calculated based on average shares outstanding during the period.
C Net investment income per share reflects a large, non-recurring dividend which amounted to $.05 per share. Excluding this non-recurring dividend, the ratio of net investment income (loss) to average net assets would have been .75%.
D Total returns for periods of less than one year are not annualized.
E Total returns would have been lower if certain expenses had not been reduced during the applicable periods shown.
F Fees and expenses of any underlying Fidelity Central Funds are not included in the Fund's expense ratio. The Fund indirectly bears its proportionate share of the expenses of any underlying Fidelity Central Funds.
G Expense ratios reflect operating expenses of the Fund. Expenses before reductions do not reflect amounts reimbursed by the investment adviser or reductions from brokerage service arrangements or reductions from other expense offset arrangements and do not represent the amount paid by the Fund during periods when reimbursements or reductions occur. Expense ratios before reductions for start-up periods may not be representative of longer term operating periods. Expenses net of fee waivers reflect expenses after reimbursement by the investment adviser but prior to reductions from brokerage service arrangements or other expense offset arrangements. Expenses net of all reductions represent the net expenses paid by the Fund.
H Annualized
I Portfolio turnover rate excludes securities received or delivered in-kind.
J Amount does not include the portfolio activity of any underlying Fidelity Central Funds.
K Amount not annualized.
See accompanying notes which are an integral part of the financial statements.
Notes to Financial Statements
For the period ended October 31, 2019
1. Organization.
Fidelity International Capital Appreciation K6 Fund (the Fund) is a fund of Fidelity Investment Trust (the Trust) and is authorized to issue an unlimited number of shares. Share transactions on the Statement of Changes in Net Assets may contain exchanges between affiliated funds. The Trust is registered under the Investment Company Act of 1940, as amended (the 1940 Act), as an open-end management investment company organized as a Massachusetts business trust. Shares generally are available only to employer-sponsored retirement plans that are recordkept by Fidelity, or to certain employer-sponsored retirement plans that are not recordkept by Fidelity. The Fund's investments in emerging markets can be subject to social, economic, regulatory, and political uncertainties and can be extremely volatile.
2. Investments in Fidelity Central Funds.
The Fund invests in Fidelity Central Funds, which are open-end investment companies generally available only to other investment companies and accounts managed by the investment adviser and its affiliates. The Fund's Schedule of Investments lists each of the Fidelity Central Funds held as of period end, if any, as an investment of the Fund, but does not include the underlying holdings of each Fidelity Central Fund. As an Investing Fund, the Fund indirectly bears its proportionate share of the expenses of the underlying Fidelity Central Funds.
The Money Market Central Funds seek preservation of capital and current income and are managed by Fidelity Investments Money Management, Inc. (FIMM), an affiliate of the investment adviser. Annualized expenses of the Money Market Central Funds as of their most recent shareholder report date ranged from less than .005% to .01%.
A complete unaudited list of holdings for each Fidelity Central Fund is available upon request or at the Securities and Exchange Commission (the SEC) website at www.sec.gov. In addition, the financial statements of the Fidelity Central Funds, which are not covered by the Fund's Report of Independent Registered Public Accounting Firm, are available on the SEC website or upon request.
3. Significant Accounting Policies.
The Fund is an investment company and applies the accounting and reporting guidance of the Financial Accounting Standards Board (FASB) Accounting Standards Codification Topic 946 Financial Services – Investments Companies. The financial statements have been prepared in conformity with accounting principles generally accepted in the United States of America (GAAP), which require management to make certain estimates and assumptions at the date of the financial statements. Actual results could differ from those estimates. Subsequent events, if any, through the date that the financial statements were issued have been evaluated in the preparation of the financial statements. The following summarizes the significant accounting policies of the Fund:
Investment Valuation. Investments are valued as of 4:00 p.m. Eastern time on the last calendar day of the period. The Board of Trustees (the Board) has delegated the day to day responsibility for the valuation of the Fund's investments to the Fair Value Committee (the Committee) established by the Fund's investment adviser. In accordance with valuation policies and procedures approved by the Board, the Fund attempts to obtain prices from one or more third party pricing vendors or brokers to value its investments. When current market prices, quotations or currency exchange rates are not readily available or reliable, investments will be fair valued in good faith by the Committee, in accordance with procedures adopted by the Board. Factors used in determining fair value vary by investment type and may include market or investment specific events. The frequency with which these procedures are used cannot be predicted and they may be utilized to a significant extent. The Committee oversees the Fund's valuation policies and procedures and reports to the Board on the Committee's activities and fair value determinations. The Board monitors the appropriateness of the procedures used in valuing the Fund's investments and ratifies the fair value determinations of the Committee.
The Fund categorizes the inputs to valuation techniques used to value its investments into a disclosure hierarchy consisting of three levels as shown below:
- Level 1 – quoted prices in active markets for identical investments
- Level 2 – other significant observable inputs (including quoted prices for similar investments, interest rates, prepayment speeds, etc.)
- Level 3 – unobservable inputs (including the Fund's own assumptions based on the best information available)
Valuation techniques used to value the Fund's investments by major category are as follows:
Equity securities, including restricted securities, for which market quotations are readily available, are valued at the last reported sale price or official closing price as reported by a third party pricing vendor on the primary market or exchange on which they are traded and are categorized as Level 1 in the hierarchy. In the event there were no sales during the day or closing prices are not available, securities are valued at the last quoted bid price or may be valued using the last available price and are generally categorized as Level 2 in the hierarchy. For foreign equity securities, when market or security specific events arise, comparisons to the valuation of American Depositary Receipts (ADRs), futures contracts, Exchange-Traded Funds (ETFs) and certain indexes as well as quoted prices for similar securities may be used and would be categorized as Level 2 in the hierarchy. For equity securities, including restricted securities, where observable inputs are limited, assumptions about market activity and risk are used and these securities may be categorized as Level 3 in the hierarchy.
Investments in open-end mutual funds, including the Fidelity Central Funds, are valued at their closing net asset value (NAV) each business day and are categorized as Level 1 in the hierarchy.
Changes in valuation techniques may result in transfers in or out of an assigned level within the disclosure hierarchy. The aggregate value of investments by input level as of October 31, 2019 is included at the end of the Fund's Schedule of Investments.
Foreign Currency. The Fund may use foreign currency contracts to facilitate transactions in foreign-denominated securities. Gains and losses from these transactions may arise from changes in the value of the foreign currency or if the counterparties do not perform under the contracts' terms.
Foreign-denominated assets, including investment securities, and liabilities are translated into U.S. dollars at the exchange rates at period end. Purchases and sales of investment securities, income and dividends received and expenses denominated in foreign currencies are translated into U.S. dollars at the exchange rate in effect on the transaction date.
The effects of exchange rate fluctuations on investments are included with the net realized and unrealized gain (loss) on investment securities. Other foreign currency transactions resulting in realized and unrealized gain (loss) are disclosed separately.
Investment Transactions and Income. For financial reporting purposes, the Fund's investment holdings and NAV include trades executed through the end of the last business day of the period. The NAV per share for processing shareholder transactions is calculated as of the close of business of the New York Stock Exchange (NYSE), normally 4:00 p.m. Eastern time and includes trades executed through the end of the prior business day. Gains and losses on securities sold are determined on the basis of identified cost. Dividend income is recorded on the ex-dividend date, except for certain dividends from foreign securities where the ex-dividend date may have passed, which are recorded as soon as the Fund is informed of the ex-dividend date. Non-cash dividends included in dividend income, if any, are recorded at the fair market value of the securities received. Income and capital gain distributions from Fidelity Central Funds, if any, are recorded on the ex-dividend date. Certain distributions received by the Fund represent a return of capital or capital gain. The Fund determines the components of these distributions subsequent to the ex-dividend date, based upon receipt of tax filings or other correspondence relating to the underlying investment. These distributions are recorded as a reduction of cost of investments and/or as a realized gain. Large, non-recurring dividends recognized by the Fund are presented separately on the Statement of Operations as "Non-cash dividends" and the impact of these dividends is presented in the Financial Highlights. Investment income is recorded net of foreign taxes withheld where recovery of such taxes is uncertain.
Expenses. Expenses directly attributable to a fund are charged to that fund. Expenses attributable to more than one fund are allocated among the respective funds on the basis of relative net assets or other appropriate methods. Expense estimates are accrued in the period to which they relate and adjustments are made when actual amounts are known.
Income Tax Information and Distributions to Shareholders. Each year, the Fund intends to qualify as a regulated investment company under Subchapter M of the Internal Revenue Code, including distributing substantially all of its taxable income and realized gains. As a result, no provision for U.S. Federal income taxes is required. As of October 31, 2019, the Fund did not have any unrecognized tax benefits in the financial statements; nor is the Fund aware of any tax positions for which it is reasonably possible that the total amounts of unrecognized tax benefits will significantly change in the next twelve months. The Fund files a U.S. federal tax return, in addition to state and local tax returns as required. The Fund's federal income tax returns are subject to examination by the Internal Revenue Service (IRS) for a period of three fiscal years after they are filed. State and local tax returns may be subject to examination for an additional fiscal year depending on the jurisdiction. Foreign taxes are provided for based on the Fund's understanding of the tax rules and rates that exist in the foreign markets in which it invests. The Fund is subject to a tax imposed on capital gains by certain countries in which it invests. An estimated deferred tax liability for net unrealized appreciation on the applicable securities is included in Other payables and accrued expenses on the Statement of Assets & Liabilities.
Distributions are declared and recorded on the ex-dividend date. Income and capital gain distributions are determined in accordance with income tax regulations, which may differ from GAAP.
Capital accounts within the financial statements are adjusted for permanent book-tax differences. These adjustments have no impact on net assets or the results of operations. Capital accounts are not adjusted for temporary book-tax differences which will reverse in a subsequent period.
Book-tax differences are primarily due to foreign currency transactions, certain foreign taxes, passive foreign investment companies (PFIC), capital loss carryforwards and losses deferred due to wash sales.
As of period end, the cost and unrealized appreciation (depreciation) in securities, and derivatives if applicable, for federal income tax purposes were as follows:
| Gross unrealized appreciation | $71,585,312 |
| Gross unrealized depreciation | (3,982,480) |
| Net unrealized appreciation (depreciation) | $67,602,832 |
| Tax Cost | $456,939,726 |
The tax-based components of distributable earnings as of period end were as follows:
| Undistributed ordinary income | $4,779,719 |
| Capital loss carryforward | $(14,138,122) |
| Net unrealized appreciation (depreciation) on securities and other investments | $67,606,476 |
Capital loss carryforwards are only available to offset future capital gains of the Fund to the extent provided by regulations and may be limited. Under the Regulated Investment Company Modernization Act of 2010 (the Act), the Fund is permitted to carry forward capital losses incurred in taxable years beginning after December 22, 2010 for an unlimited period and such capital losses are required to be used prior to any losses that expire. The capital loss carryforward information presented below, including any applicable limitation, is estimated as of fiscal period end and is subject to adjustment.
| No expiration | |
| Short-term | $(14,138,122) |
| Total capital loss carryforward | $(14,138,122) |
The tax character of distributions paid was as follows:
| | October 31, 2019 | October 31, 2018 |
| Ordinary Income | $2,841,028 | $ 539,089 |
| Long-term Capital Gains | – | 17,390 |
| Total | $2,841,028 | $ 556,479 |
Restricted Securities. The Fund may invest in securities that are subject to legal or contractual restrictions on resale. These securities generally may be resold in transactions exempt from registration or to the public if the securities are registered. Disposal of these securities may involve time-consuming negotiations and expense, and prompt sale at an acceptable price may be difficult. Information regarding restricted securities is included at the end of the Fund's Schedule of Investments.
4. Purchases and Sales of Investments.
Purchases and sales of securities, other than short-term securities and in-kind transactions, aggregated $669,751,942 and $606,543,457, respectively.
Unaffiliated Exchanges In-Kind. During the period, the Fund received investments and cash valued at $9,668,871 in exchange for 873,449 shares of the Fund. The amount of in-kind exchanges is included in share transactions in the accompanying Statement of Changes in Net Assets.
Prior Fiscal Year Unaffiliated Exchanges In-Kind. During the prior period, the Fund received investments and cash valued at $29,374,572 in exchange for 2,605,896 shares of the Fund. The amount of in-kind exchanges is included in share transactions in the accompanying Statement of Changes in Net Assets.
5. Fees and Other Transactions with Affiliates.
Management Fee. Fidelity Management & Research Company (the investment adviser) and its affiliates provide the Fund with investment management related services for which the Fund pays a monthly management fee that is based on an annual rate of .65% of average net assets. Under the management contract, the investment adviser or an affiliate pays all other expenses of the Fund, excluding fees and expenses of the independent Trustees, and certain miscellaneous expenses such as proxy and shareholder meeting expenses.
Brokerage Commissions. The Fund placed a portion of its portfolio transactions with brokerage firms which are affiliates of the investment adviser. Brokerage commissions are included in net realized gain (loss) and change in net unrealized appreciation (depreciation) in the Statement of Operations. The commissions paid to these affiliated firms were $4,280 for the period.
Interfund Lending Program. Pursuant to an Exemptive Order issued by the SEC, the Fund, along with other registered investment companies having management contracts with Fidelity Management & Research Company (FMR) or other affiliated entities of FMR, may participate in an interfund lending program. This program provides an alternative credit facility allowing the funds to borrow from, or lend money to, other participating affiliated funds. At period end, there were no interfund loans outstanding. The Fund's activity in this program during the period for which loans were outstanding was as follows:
| Borrower or Lender | Average Loan Balance | Weighted Average Interest Rate | Interest Expense |
| Borrower | $4,012,143 | 2.62% | $2,046 |
Interfund Trades. The Fund may purchase from or sell securities to other Fidelity Funds under procedures adopted by the Board. The procedures have been designed to ensure these interfund trades are executed in accordance with Rule 17a-7 of the 1940 Act. Interfund trades are included within the respective purchases and sales amounts shown in the Purchases and Sales of Investments note.
6. Committed Line of Credit.
The Fund participates with other funds managed by the investment adviser or an affiliate in a $4.25 billion credit facility (the "line of credit") to be utilized for temporary or emergency purposes to fund shareholder redemptions or for other short-term liquidity purposes. The Fund has agreed to pay commitment fees on its pro-rata portion of the line of credit, which amounted to $1,096 and is reflected in Commitment fees on the Statement of Operations. During the period, the Fund did not borrow on this line of credit.
7. Security Lending.
The Fund lends portfolio securities from time to time in order to earn additional income. For equity securities, lending agents are used, including National Financial Services (NFS), an affiliate of the Fund. Pursuant to a securities lending agreement, NFS will receive a fee, which is capped at 9.9% of daily lending revenue, for its services as lending agent. The Fund may lend securities to certain qualified borrowers, including NFS. On the settlement date of the loan, the Fund receives collateral (in the form of U.S. Treasury obligations, letters of credit and/or cash) against the loaned securities and maintains collateral in an amount not less than 100% of the market value of the loaned securities during the period of the loan. The market value of the loaned securities is determined at the close of business of the Fund and any additional required collateral is delivered to the Fund on the next business day. The Fund or borrower may terminate the loan at any time, and if the borrower defaults on its obligation to return the securities loaned because of insolvency or other reasons, the Fund may apply collateral received from the borrower against the obligation. The Fund may experience delays and costs in recovering the securities loaned. Any cash collateral received is invested in the Fidelity Securities Lending Cash Central Fund. At period end, there were no security loans outstanding. Total fees paid by the Fund to NFS, as lending agent, amounted to $49. Security lending income represents the income earned on investing cash collateral, less rebates paid to borrowers and any lending agent fees associated with the loan, plus any premium payments received for lending certain types of securities. Security lending income is presented in the Statement of Operations as a component of income from Fidelity Central Funds and includes $27,501 from securities loaned to NFS, as affiliated borrower.
8. Expense Reductions.
Commissions paid to certain brokers with whom the investment adviser, or its affiliates, places trades on behalf of the Fund include an amount in addition to trade execution, which may be rebated back to the Fund to offset certain expenses. This amount totaled $64,505 for the period. In addition, through arrangements with the Fund's custodian, credits realized as a result of certain uninvested cash balances were used to reduce the Fund's expenses by $270.
9. Other.
The Fund's organizational documents provide former and current trustees and officers with a limited indemnification against liabilities arising in connection with the performance of their duties to the Fund. In the normal course of business, the Fund may also enter into contracts that provide general indemnifications. The Fund's maximum exposure under these arrangements is unknown as this would be dependent on future claims that may be made against the Fund. The risk of material loss from such claims is considered remote.
Report of Independent Registered Public Accounting Firm
To the Trustees of Fidelity Investment Trust and Shareholders of Fidelity International Capital Appreciation K6 Fund:
Opinion on the Financial Statements and Financial Highlights
We have audited the accompanying statement of assets and liabilities of Fidelity International Capital Appreciation K6 Fund (the “Fund”), a fund of Fidelity Investment Trust, including the schedule of investments, as of October 31, 2019, the related statement of operations for the year then ended, the statement of changes in net assets for each of the two years in the period then ended, the financial highlights for each of the two years in the period then ended and for the period from May 25, 2017 (commencement of operations) to October 31 2017, and the related notes. In our opinion, the financial statements and financial highlights present fairly, in all material respects, the financial position of the Fund as of October 31, 2019 and the results of its operations for the year then ended, the changes in its net assets for each of the two years in the period then ended, and the financial highlights for each of the two years in the period then ended and for the period from May 25, 2017 (commencement of operations) to October 31 2017 in conformity with accounting principles generally accepted in the United States of America.
Basis for Opinion
These financial statements and financial highlights are the responsibility of the Fund's management. Our responsibility is to express an opinion on the Fund's financial statements and financial highlights based on our audits. We are a public accounting firm registered with the Public Company Accounting Oversight Board (United States) (PCAOB) and are required to be independent with respect to the Fund in accordance with the U.S. federal securities laws and the applicable rules and regulations of the Securities and Exchange Commission and the PCAOB.
We conducted our audits in accordance with the standards of the PCAOB. Those standards require that we plan and perform the audit to obtain reasonable assurance about whether the financial statements and financial highlights are free of material misstatement, whether due to error or fraud. The Fund is not required to have, nor were we engaged to perform, an audit of its internal control over financial reporting. As part of our audits we are required to obtain an understanding of internal control over financial reporting but not for the purpose of expressing an opinion on the effectiveness of the Fund’s internal control over financial reporting. Accordingly, we express no such opinion.
Our audits included performing procedures to assess the risks of material misstatement of the financial statements and financial highlights, whether due to error or fraud, and performing procedures that respond to those risks. Such procedures included examining, on a test basis, evidence regarding the amounts and disclosures in the financial statements and financial highlights. Our audits also included evaluating the accounting principles used and significant estimates made by management, as well as evaluating the overall presentation of the financial statements and financial highlights. Our procedures included confirmation of securities owned as of October 31, 2019, by correspondence with the custodians and brokers; when replies were not received from brokers, we performed other auditing procedures. We believe that our audits provide a reasonable basis for our opinion.
/s/ Deloitte & Touche LLP
Boston, Massachusetts
December 13, 2019
We have served as the auditor of one or more of the Fidelity investment companies since 1999.
Trustees and Officers
The Trustees, Members of the Advisory Board (if any), and officers of the trust and fund, as applicable, are listed below. The Board of Trustees governs the fund and is responsible for protecting the interests of shareholders. The Trustees are experienced executives who meet periodically throughout the year to oversee the fund's activities, review contractual arrangements with companies that provide services to the fund, oversee management of the risks associated with such activities and contractual arrangements, and review the fund's performance. Except for Jonathan Chiel, each of the Trustees oversees 298 funds. Mr. Chiel oversees 171 funds.
The Trustees hold office without limit in time except that (a) any Trustee may resign; (b) any Trustee may be removed by written instrument, signed by at least two-thirds of the number of Trustees prior to such removal; (c) any Trustee who requests to be retired or who has become incapacitated by illness or injury may be retired by written instrument signed by a majority of the other Trustees; and (d) any Trustee may be removed at any special meeting of shareholders by a two-thirds vote of the outstanding voting securities of the trust. Each Trustee who is not an interested person (as defined in the 1940 Act) of the trust and the fund is referred to herein as an Independent Trustee. Each Independent Trustee shall retire not later than the last day of the calendar year in which his or her 75th birthday occurs. The Independent Trustees may waive this mandatory retirement age policy with respect to individual Trustees. Officers and Advisory Board Members hold office without limit in time, except that any officer or Advisory Board Member may resign or may be removed by a vote of a majority of the Trustees at any regular meeting or any special meeting of the Trustees. Except as indicated, each individual has held the office shown or other offices in the same company for the past five years.
The fund’s Statement of Additional Information (SAI) includes more information about the Trustees. To request a free copy, call Fidelity at 1-800-835-5092.
Experience, Skills, Attributes, and Qualifications of the Trustees. The Governance and Nominating Committee has adopted a statement of policy that describes the experience, qualifications, attributes, and skills that are necessary and desirable for potential Independent Trustee candidates (Statement of Policy). The Board believes that each Trustee satisfied at the time he or she was initially elected or appointed a Trustee, and continues to satisfy, the standards contemplated by the Statement of Policy. The Governance and Nominating Committee also engages professional search firms to help identify potential Independent Trustee candidates who have the experience, qualifications, attributes, and skills consistent with the Statement of Policy. From time to time, additional criteria based on the composition and skills of the current Independent Trustees, as well as experience or skills that may be appropriate in light of future changes to board composition, business conditions, and regulatory or other developments, have also been considered by the professional search firms and the Governance and Nominating Committee. In addition, the Board takes into account the Trustees' commitment and participation in Board and committee meetings, as well as their leadership of standing and ad hoc committees throughout their tenure.
In determining that a particular Trustee was and continues to be qualified to serve as a Trustee, the Board has considered a variety of criteria, none of which, in isolation, was controlling. The Board believes that, collectively, the Trustees have balanced and diverse experience, qualifications, attributes, and skills, which allow the Board to operate effectively in governing the fund and protecting the interests of shareholders. Information about the specific experience, skills, attributes, and qualifications of each Trustee, which in each case led to the Board's conclusion that the Trustee should serve (or continue to serve) as a trustee of the fund, is provided below.
Board Structure and Oversight Function. James C. Curvey is an interested person and currently serves as Chairman. The Trustees have determined that an interested Chairman is appropriate and benefits shareholders because an interested Chairman has a personal and professional stake in the quality and continuity of services provided to the fund. Independent Trustees exercise their informed business judgment to appoint an individual of their choosing to serve as Chairman, regardless of whether the Trustee happens to be independent or a member of management. The Independent Trustees have determined that they can act independently and effectively without having an Independent Trustee serve as Chairman and that a key structural component for assuring that they are in a position to do so is for the Independent Trustees to constitute a substantial majority for the Board. The Independent Trustees also regularly meet in executive session. Ned C. Lautenbach serves as Chairman of the Independent Trustees and as such (i) acts as a liaison between the Independent Trustees and management with respect to matters important to the Independent Trustees and (ii) with management prepares agendas for Board meetings.
Fidelity® funds are overseen by different Boards of Trustees. The fund's Board oversees Fidelity's high income and certain equity funds, and other Boards oversee Fidelity's investment-grade bond, money market, asset allocation, and other equity funds. The asset allocation funds may invest in Fidelity® funds overseen by the fund's Board. The use of separate Boards, each with its own committee structure, allows the Trustees of each group of Fidelity® funds to focus on the unique issues of the funds they oversee, including common research, investment, and operational issues. On occasion, the separate Boards establish joint committees to address issues of overlapping consequences for the Fidelity® funds overseen by each Board.
The Trustees operate using a system of committees to facilitate the timely and efficient consideration of all matters of importance to the Trustees, the fund, and fund shareholders and to facilitate compliance with legal and regulatory requirements and oversight of the fund's activities and associated risks. The Board, acting through its committees, has charged FMR and its affiliates with (i) identifying events or circumstances the occurrence of which could have demonstrably adverse effects on the fund's business and/or reputation; (ii) implementing processes and controls to lessen the possibility that such events or circumstances occur or to mitigate the effects of such events or circumstances if they do occur; and (iii) creating and maintaining a system designed to evaluate continuously business and market conditions in order to facilitate the identification and implementation processes described in (i) and (ii) above. Because the day-to-day operations and activities of the fund are carried out by or through FMR, its affiliates, and other service providers, the fund's exposure to risks is mitigated but not eliminated by the processes overseen by the Trustees. While each of the Board's committees has responsibility for overseeing different aspects of the fund's activities, oversight is exercised primarily through the Operations, Audit, and Compliance Committees. Appropriate personnel, including but not limited to the fund's Chief Compliance Officer (CCO), FMR's internal auditor, the independent accountants, the fund's Treasurer and portfolio management personnel, make periodic reports to the Board's committees, as appropriate, including an annual review of Fidelity's risk management program for the Fidelity® funds. The responsibilities of each standing committee, including their oversight responsibilities, are described further under "Standing Committees of the Trustees."
Interested Trustees*:
Correspondence intended for a Trustee who is an interested person may be sent to Fidelity Investments, 245 Summer Street, Boston, Massachusetts 02210.
Name, Year of Birth; Principal Occupations and Other Relevant Experience+
Jonathan Chiel (1957)
Year of Election or Appointment: 2016
Trustee
Mr. Chiel also serves as Trustee of other Fidelity® funds. Mr. Chiel is Executive Vice President and General Counsel for FMR LLC (diversified financial services company, 2012-present). Previously, Mr. Chiel served as general counsel (2004-2012) and senior vice president and deputy general counsel (2000-2004) for John Hancock Financial Services; a partner with Choate, Hall & Stewart (1996-2000) (law firm); and an Assistant United States Attorney for the United States Attorney’s Office of the District of Massachusetts (1986-95), including Chief of the Criminal Division (1993-1995). Mr. Chiel is a director on the boards of the Boston Bar Foundation and the Maimonides School.
James C. Curvey (1935)
Year of Election or Appointment: 2007
Trustee
Chairman of the Board of Trustees
Mr. Curvey also serves as Trustee of other Fidelity® funds. Mr. Curvey is Vice Chairman (2007-present) and Director of FMR LLC (diversified financial services company). In addition, Mr. Curvey is an Overseer Emeritus for the Boston Symphony Orchestra, a Director of Artis-Naples, and a Trustee of Brewster Academy in Wolfeboro, New Hampshire. Previously, Mr. Curvey served as a Director of Fidelity Research & Analysis Co. (investment adviser firm, 2009-2018), Director of Fidelity Investments Money Management, Inc. (investment adviser firm, 2009-2014) and a Director of FMR and FMR Co., Inc. (investment adviser firms, 2007-2014).
* Determined to be an “Interested Trustee” by virtue of, among other things, his or her affiliation with the trust or various entities under common control with FMR.
+ The information includes the Trustee's principal occupation during the last five years and other information relating to the experience, attributes, and skills relevant to the Trustee's qualifications to serve as a Trustee, which led to the conclusion that the Trustee should serve as a Trustee for the fund.
Independent Trustees:
Correspondence intended for an Independent Trustee may be sent to Fidelity Investments, P.O. Box 55235, Boston, Massachusetts 02205-5235.
Name, Year of Birth; Principal Occupations and Other Relevant Experience+
Dennis J. Dirks (1948)
Year of Election or Appointment: 2005
Trustee
Mr. Dirks also serves as Trustee of other Fidelity® funds. Prior to his retirement in May 2003, Mr. Dirks was Chief Operating Officer and a member of the Board of The Depository Trust & Clearing Corporation (DTCC). He also served as President, Chief Operating Officer, and Board member of The Depository Trust Company (DTC) and President and Board member of the National Securities Clearing Corporation (NSCC). In addition, Mr. Dirks served as Chief Executive Officer and Board member of the Government Securities Clearing Corporation, Chief Executive Officer and Board member of the Mortgage-Backed Securities Clearing Corporation, as a Trustee and a member of the Finance Committee of Manhattan College (2005-2008), as a Trustee and a member of the Finance Committee of AHRC of Nassau County (2006-2008), as a member of the Independent Directors Council (IDC) Governing Council (2010-2015), and as a member of the Board of Directors for The Brookville Center for Children’s Services, Inc. (2009-2017). Mr. Dirks is a member of the Finance Committee (2016-present) and Board of Directors (2017-present) and is Treasurer (2018-present) of the Asolo Repertory Theatre.
Donald F. Donahue (1950)
Year of Election or Appointment: 2018
Trustee
Mr. Donahue also serves as a Trustee of other Fidelity® funds. Mr. Donahue is President and Chief Executive Officer of Miranda Partners, LLC (risk consulting for the financial services industry, 2012-present). Previously, Mr. Donahue served as a Member of the Advisory Board of certain Fidelity® funds (2015-2018) and Chief Executive Officer (2006-2012), Chief Operating Officer (2003-2006), and Managing Director, Customer Marketing and Development (1999-2003) of The Depository Trust & Clearing Corporation (financial markets infrastructure). Mr. Donahue serves as a Member (2007-present) and Co-Chairman (2016-present) of the Board of Directors of United Way of New York, Member of the Board of Directors of NYC Leadership Academy (2012-present) and Member of the Board of Advisors of Ripple Labs, Inc. (financial services, 2015-present). He also served as Chairman (2010-2012) and Member of the Board of Directors (2012-2013) of Omgeo, LLC (financial services), Treasurer of United Way of New York (2012-2016), and Member of the Board of Directors of XBRL US (financial services non-profit, 2009-2012) and the International Securities Services Association (2009-2012).
Alan J. Lacy (1953)
Year of Election or Appointment: 2008
Trustee
Mr. Lacy also serves as Trustee of other Fidelity® funds. Mr. Lacy serves as a Director of Bristol-Myers Squibb Company (global pharmaceuticals, 2008-present). He is a Trustee of the California Chapter of The Nature Conservancy (2015-present) and a Director of the Center for Advanced Study in the Behavioral Sciences at Stanford University (2015-present). In addition, Mr. Lacy served as Senior Adviser (2007-2014) of Oak Hill Capital Partners, L.P. (private equity) and also served as Chief Executive Officer (2005) and Vice Chairman (2005-2006) of Sears Holdings Corporation (retail) and Chief Executive Officer and Chairman of the Board of Sears, Roebuck and Co. (retail, 2000-2005). Previously, Mr. Lacy served as Chairman (2014-2017) and a member (2010-2017) of the Board of Directors of Dave & Buster’s Entertainment, Inc. (restaurant and entertainment complexes), as Chairman (2008-2011) and a member (2006-2015) of the Board of Trustees of the National Parks Conservation Association, and as a member of the Board of Directors for The Hillman Companies, Inc. (hardware wholesalers, 2010-2014), Earth Fare, Inc. (retail grocery, 2010-2014), and The Western Union Company (global money transfer, 2006-2011).
Ned C. Lautenbach (1944)
Year of Election or Appointment: 2000
Trustee
Chairman of the Independent Trustees
Mr. Lautenbach also serves as Trustee of other Fidelity® funds. Mr. Lautenbach currently serves as Chair (2018-present) and Member (2013-present) of the Board of Governors, State University System of Florida and is a member of the Council on Foreign Relations (1994-present). He is also a member and has most recently served as Chairman of the Board of Directors of Artis-Naples (2012-present). Previously, Mr. Lautenbach served as a member and then Lead Director of the Board of Directors of Eaton Corporation (diversified industrial, 1997-2016). He was also a Partner and Advisory Partner at Clayton, Dubilier & Rice, LLC (private equity investment, 1998-2010), as well as a Director of Sony Corporation (2006-2007). In addition, Mr. Lautenbach also had a 30-year career with IBM (technology company) during which time he served as Senior Vice President and a member of the Corporate Executive Committee (1968-1998).
Joseph Mauriello (1944)
Year of Election or Appointment: 2008
Trustee
Mr. Mauriello also serves as Trustee of other Fidelity® funds. Prior to his retirement in January 2006, Mr. Mauriello served in numerous senior management positions including Deputy Chairman and Chief Operating Officer (2004-2005), and Vice Chairman of Financial Services (2002-2004) of KPMG LLP US (professional services, 1965-2005). Mr. Mauriello currently serves as a member of the Independent Directors Council (IDC) Governing Council (2015-present). Previously, Mr. Mauriello served as a member of the Board of Directors of XL Group plc. (global insurance and re-insurance, 2006-2018).
Cornelia M. Small (1944)
Year of Election or Appointment: 2005
Trustee
Ms. Small also serves as Trustee of other Fidelity® funds. Ms. Small is a member of the Board of Directors (2009-present) and Chair of the Investment Committee (2010-present) of the Teagle Foundation. Ms. Small also serves on the Investment Committee of the Berkshire Taconic Community Foundation (2008-present). Previously, Ms. Small served as Chairperson (2002-2008) and a member of the Investment Committee and Chairperson (2008-2012) and a member of the Board of Trustees of Smith College. In addition, Ms. Small served as Chief Investment Officer, Director of Global Equity Investments, and a member of the Board of Directors of Scudder, Stevens & Clark and Scudder Kemper Investments.
Garnett A. Smith (1947)
Year of Election or Appointment: 2018
Trustee
Mr. Smith also serves as Trustee of other Fidelity® funds. Prior to Mr. Smith's retirement, he served as Chairman and Chief Executive Officer of Inbrand Corp. (manufacturer of personal absorbent products, 1990-1997). He also served as President (1986-1990) of Inbrand Corp. Prior to his employment with Inbrand Corp., he was employed by a retail fabric chain and North Carolina National Bank. In addition, Mr. Smith served as a Member of the Advisory Board of certain Fidelity® funds (2012-2013) and as a board member of the Jackson Hole Land Trust (2009-2012).
David M. Thomas (1949)
Year of Election or Appointment: 2008
Trustee
Mr. Thomas also serves as Trustee of other Fidelity® funds. Mr. Thomas serves as Non-Executive Chairman of the Board of Directors of Fortune Brands Home and Security (home and security products, 2011-present) and as a member of the Board of Directors (2004-present) and Presiding Director (2013-present) of Interpublic Group of Companies, Inc. (marketing communication). Previously, Mr. Thomas served as Executive Chairman (2005-2006) and Chairman and Chief Executive Officer (2000-2005) of IMS Health, Inc. (pharmaceutical and healthcare information solutions), a Director of Fortune Brands, Inc. (consumer products, 2000-2011), and a member of the Board of Trustees of the University of Florida (2013-2018).
+ The information includes the Trustee's principal occupation during the last five years and other information relating to the experience, attributes, and skills relevant to the Trustee's qualifications to serve as a Trustee, which led to the conclusion that the Trustee should serve as a Trustee for the fund.
Advisory Board Members and Officers:
Correspondence intended for a Member of the Advisory Board (if any) may be sent to Fidelity Investments, P.O. Box 55235, Boston, Massachusetts 02205-5235. Correspondence intended for an officer or Peter S. Lynch may be sent to Fidelity Investments, 245 Summer Street, Boston, Massachusetts 02210. Officers appear below in alphabetical order.
Name, Year of Birth; Principal Occupation
Vicki L. Fuller (1957)
Year of Election or Appointment: 2018
Member of the Advisory Board
Ms. Fuller also serves as Member of the Advisory Board of other Fidelity® funds. Ms. Fuller serves as a member of the Board of Directors, Audit Committee, and Nominating and Governance Committee of The Williams Companies, Inc. (natural gas infrastructure, 2018-present). Previously, Ms. Fuller served as the Chief Investment Officer of the New York State Common Retirement Fund (2012-2018) and held a variety of positions at AllianceBernstein L.P. (global asset management, 1985-2012), including Managing Director (2006-2012) and Senior Vice President and Senior Portfolio Manager (2001-2006).
Peter S. Lynch (1944)
Year of Election or Appointment: 2003
Member of the Advisory Board
Mr. Lynch also serves as Member of the Advisory Board of other Fidelity® funds. Mr. Lynch is Vice Chairman and a Director of FMR (investment adviser firm) and FMR Co., Inc. (investment adviser firm). In addition, Mr. Lynch serves as a Trustee of Boston College and as the Chairman of the Inner-City Scholarship Fund. Previously, Mr. Lynch served on the Special Olympics International Board of Directors (1997-2006).
Michael E. Wiley (1950)
Year of Election or Appointment: 2018
Member of the Advisory Board
Mr. Wiley also serves as Trustee or Member of the Advisory Board of other Fidelity® funds. Mr. Wiley serves as a Director of High Point Resources (exploration and production, 2005-present). Previously, Mr. Wiley served as a Director of Andeavor Corporation (independent oil refiner and marketer, 2005-2018), a Director of Andeavor Logistics LP (natural resources logistics, 2015-2018), a Director of Post Oak Bank (privately-held bank, 2004-2018), a Director of Asia Pacific Exploration Consolidated (international oil and gas exploration and production, 2008-2013), a member of the Board of Trustees of the University of Tulsa (2000-2006; 2007-2010), a Senior Energy Advisor of Katzenbach Partners, LLC (consulting, 2006-2007), an Advisory Director of Riverstone Holdings (private investment), a Director of Spinnaker Exploration Company (exploration and production, 2001-2005) and Chairman, President, and CEO of Baker Hughes, Inc. (oilfield services, 2000-2004).
Elizabeth Paige Baumann (1968)
Year of Election or Appointment: 2017
Anti-Money Laundering (AML) Officer
Ms. Baumann also serves as AML Officer of other funds. She is Chief AML Officer (2012-present) and Senior Vice President (2014-present) of FMR LLC (diversified financial services company) and is an employee of Fidelity Investments. Previously, Ms. Baumann served as AML Officer of the funds (2012-2016), and Vice President (2007-2014) and Deputy Anti-Money Laundering Officer (2007-2012) of FMR LLC.
Craig S. Brown (1977)
Year of Election or Appointment: 2019
Assistant Treasurer
Mr. Brown also serves as Assistant Treasurer of other funds. Mr. Brown is an employee of Fidelity Investments (2013-present).
John J. Burke III (1964)
Year of Election or Appointment: 2018
Chief Financial Officer
Mr. Burke also serves as Chief Financial Officer of other funds. Mr. Burke serves as Head of Investment Operations for Fidelity Fund and Investment Operations (2018-present) and is an employee of Fidelity Investments (1998-present). Previously Mr. Burke served as head of Asset Management Investment Operations (2012-2018).
William C. Coffey (1969)
Year of Election or Appointment: 2019
Assistant Secretary
Mr. Coffey also serves as Assistant Secretary of other funds. He is Senior Vice President and Deputy General Counsel of FMR LLC (diversified financial services company, 2010-present), and is an employee of Fidelity Investments. Previously, Mr. Coffey served as Secretary and CLO of certain funds (2018-2019); CLO, Secretary, and Senior Vice President of Fidelity Management & Research Company and FMR Co., Inc. (investment adviser firms, 2018-2019); Secretary of Fidelity SelectCo, LLC and Fidelity Investments Money Management, Inc. (investment adviser firms, 2018-2019); CLO of Fidelity Management & Research (Hong Kong) Limited, FMR Investment Management (UK) Limited, and Fidelity Management & Research (Japan) Limited (investment adviser firms, 2018-2019); and Assistant Secretary of certain funds (2009-2018).
Timothy M. Cohen (1969)
Year of Election or Appointment: 2018
Vice President
Mr. Cohen also serves as Vice President of other funds. Mr. Cohen serves as Executive Vice President of Fidelity SelectCo, LLC (2019-present), Co-Head of Equity (2018-present), a Director of Fidelity Management & Research (Japan) Limited (investment adviser firm, 2016-present), and is an employee of Fidelity Investments. Previously, Mr. Cohen served as Head of Global Equity Research (2016-2018), Chief Investment Officer - Equity and a Director of Fidelity Management & Research (U.K.) Inc. (investment adviser firm, 2013-2015) and as a Director of Fidelity Management & Research (Hong Kong) Limited (investment adviser firm, 2017).
Jonathan Davis (1968)
Year of Election or Appointment: 2010
Assistant Treasurer
Mr. Davis also serves as Assistant Treasurer of other funds. Mr. Davis serves as Assistant Treasurer of FMR Capital, Inc. (2017-present) and is an employee of Fidelity Investments. Previously, Mr. Davis served as Vice President and Associate General Counsel of FMR LLC (diversified financial services company, 2003-2010).
Adrien E. Deberghes (1967)
Year of Election or Appointment: 2016
Assistant Treasurer
Mr. Deberghes also serves as an officer of other funds. He serves as Assistant Treasurer of FMR Capital, Inc. (2017-present), Executive Vice President of Fidelity Investments Money Management, Inc. (FIMM) (investment adviser firm, 2016-present), and is an employee of Fidelity Investments (2008-present). Previously, Mr. Deberghes served as President and Treasurer of certain Fidelity® funds (2013-2018). Prior to joining Fidelity Investments, Mr. Deberghes was Senior Vice President of Mutual Fund Administration at State Street Corporation (2007-2008), Senior Director of Mutual Fund Administration at Investors Bank & Trust (2005-2007), and Director of Finance for Dunkin' Brands (2000-2005). Previously, Mr. Deberghes served in other fund officer roles.
Laura M. Del Prato (1964)
Year of Election or Appointment: 2018
Assistant Treasurer
Ms. Del Prato also serves as an officer of other funds. Ms. Del Prato is an employee of Fidelity Investments (2017-present). Prior to joining Fidelity Investments, Ms. Del Prato served as a Managing Director and Treasurer of the JPMorgan Mutual Funds (2014-2017). Prior to JPMorgan, Ms. Del Prato served as a partner at Cohen Fund Audit Services (accounting firm, 2012-2013) and KPMG LLP (accounting firm, 2004-2012).
Colm A. Hogan (1973)
Year of Election or Appointment: 2016
Deputy Treasurer
Mr. Hogan also serves as an officer of other funds. Mr. Hogan serves as Assistant Treasurer of FMR Capital, Inc. (2017-present) and is an employee of Fidelity Investments (2005-present). Previously, Mr. Hogan served as Assistant Treasurer of certain Fidelity® funds (2016-2018).
Pamela R. Holding (1964)
Year of Election or Appointment: 2018
Vice President
Ms. Holding also serves as Vice President of other funds. Ms. Holding serves as Executive Vice President of Fidelity SelectCo, LLC (2019-present), Co-Head of Equity (2018-present) and is an employee of Fidelity Investments (2013-present). Previously, Ms. Holding served as Chief Investment Officer of Fidelity Institutional Asset Management (2013-2018).
Cynthia Lo Bessette (1969)
Year of Election or Appointment: 2019
Secretary and Chief Legal Officer (CLO)
Ms. Lo Bessette also serves as Secretary and CLO of other funds. Ms. Lo Bessette serves as CLO, Secretary, and Senior Vice President of Fidelity Management & Research Company and FMR Co., Inc. (investment adviser firms, 2019-present); Secretary of Fidelity SelectCo, LLC and Fidelity Investments Money Management, Inc. (investment adviser firms, 2019-present); and CLO of Fidelity Management & Research (Hong Kong) Limited, FMR Investment Management (UK) Limited, and Fidelity Management & Research (Japan) Limited (investment adviser firms, 2019-present). She is a Senior Vice President and Deputy General Counsel of FMR LLC (diversified financial services company, 2019-present), and is an employee of Fidelity Investments. Previously, Ms. Lo Bessette served as Executive Vice President, General Counsel (2016-2019) and Senior Vice President, Deputy General Counsel (2015-2016) of OppenheimerFunds (investment management company) and Deputy Chief Legal Officer (2013-2015) of Jennison Associates LLC (investment adviser firm).
Chris Maher (1972)
Year of Election or Appointment: 2013
Assistant Treasurer
Mr. Maher serves as Assistant Treasurer of other funds. Mr. Maher is Vice President of Valuation Oversight, serves as Assistant Treasurer of FMR Capital, Inc. (2017-present), and is an employee of Fidelity Investments. Previously, Mr. Maher served as Vice President of Asset Management Compliance (2013), Vice President of the Program Management Group of FMR (investment adviser firm, 2010-2013), and Vice President of Valuation Oversight (2008-2010).
Kenneth B. Robins (1969)
Year of Election or Appointment: 2016
Chief Compliance Officer
Mr. Robins also serves as an officer of other funds. Mr. Robins serves as Compliance Officer of Fidelity Management & Research Company and FMR Co., Inc. (investment adviser firms, 2016-present) and is an employee of Fidelity Investments (2004-present). Previously, Mr. Robins served as Executive Vice President of Fidelity Investments Money Management, Inc. (investment adviser firm, 2013-2016) and served in other fund officer roles.
Stacie M. Smith (1974)
Year of Election or Appointment: 2016
President and Treasurer
Ms. Smith also serves as an officer of other funds. Ms. Smith serves as Assistant Treasurer of FMR Capital, Inc. (2017-present), is an employee of Fidelity Investments (2009-present), and has served in other fund officer roles. Prior to joining Fidelity Investments, Ms. Smith served as Senior Audit Manager of Ernst & Young LLP (accounting firm, 1996-2009). Previously, Ms. Smith served as Assistant Treasurer (2013-2018) and Deputy Treasurer (2013-2016) of certain Fidelity® funds.
Marc L. Spector (1972)
Year of Election or Appointment: 2016
Assistant Treasurer
Mr. Spector also serves as an officer of other funds. Mr. Spector serves as Assistant Treasurer of FMR Capital, Inc. (2017-present) and is an employee of Fidelity Investments (2016-present). Prior to joining Fidelity Investments, Mr. Spector served as Director at the Siegfried Group (accounting firm, 2013-2016), and prior to Siegfried Group as audit senior manager at Deloitte & Touche (accounting firm, 2005-2013).
Jim Wegmann (1979)
Year of Election or Appointment: 2019
Assistant Treasurer
Mr. Wegmann also serves as Assistant Treasurer of other funds. Mr. Wegmann is an employee of Fidelity Investments (2011-present).
Shareholder Expense Example
As a shareholder of the Fund, you incur two types of costs: (1) transaction costs and (2) ongoing costs, including management fees and other Fund expenses. This Example is intended to help you understand your ongoing costs (in dollars) of investing in the Fund and to compare these costs with the ongoing costs of investing in other mutual funds.
The Example is based on an investment of $1,000 invested at the beginning of the period and held for the entire period (May 1, 2019 to October 31, 2019).
Actual Expenses
The first line of the accompanying table provides information about actual account values and actual expenses. You may use the information in this line, together with the amount you invested, to estimate the expenses that you paid over the period. Simply divide your account value by $1,000.00 (for example, an $8,600 account value divided by $1,000.00 = 8.6), then multiply the result by the number in the first line under the heading entitled "Expenses Paid During Period" to estimate the expenses you paid on your account during this period. In addition, the Fund, as a shareholder in the underlying Fidelity Central Funds, will indirectly bear its pro-rata share of the fees and expenses incurred by the underlying Fidelity Central Funds. These fees and expenses are not included in the Fund's annualized expense ratio used to calculate the expense estimate in the table below.
Hypothetical Example for Comparison Purposes
The second line of the accompanying table provides information about hypothetical account values and hypothetical expenses based on the Fund's actual expense ratio and an assumed rate of return of 5% per year before expenses, which is not the Fund's actual return. The hypothetical account values and expenses may not be used to estimate the actual ending account balance or expenses you paid for the period. You may use this information to compare the ongoing costs of investing in the Fund and other funds. To do so, compare this 5% hypothetical example with the 5% hypothetical examples that appear in the shareholder reports of the other funds. In addition, the Fund, as a shareholder in the underlying Fidelity Central Funds, will indirectly bear its pro-rata share of the fees and expenses incurred by the underlying Fidelity Central Funds. These fees and expenses are not included in the Fund's annualized expense ratio used to calculate the expense estimate in the table below.
Please note that the expenses shown in the table are meant to highlight your ongoing costs only and do not reflect any transaction costs. Therefore, the second line of the table is useful in comparing ongoing costs only, and will not help you determine the relative total costs of owning different funds.
| | Annualized Expense Ratio-A | Beginning
Account Value
May 1, 2019 | Ending
Account Value
October 31, 2019 | Expenses Paid
During Period-B
May 1, 2019
to October 31, 2019 |
| Actual | .65% | $1,000.00 | $1,055.30 | $3.37 |
| Hypothetical-C | | $1,000.00 | $1,021.93 | $3.31 |
A Annualized expense ratio reflects expenses net of applicable fee waivers.
B Expenses are equal to the Fund's annualized expense ratio, multiplied by the average account value over the period, multiplied by 184/365 (to reflect the one-half year period).
C 5% return per year before expenses
Distributions (Unaudited)
The fund designates 9% of the dividends distributed during the fiscal year as qualifying for the dividends–received deduction for corporate shareholders.
The fund designates 100% of the dividends distributed during the fiscal year as amounts which may be taken into account as a dividend for the purposes of the maximum rate under section 1(h)(11) of the Internal Revenue Code.
The amounts per share which represent income derived from sources within, and taxes paid to, foreign countries or possessions of the United States are $0.0918 and $0.0118 for the dividend paid December 10, 2018.
The fund will notify shareholders in January 2020 of amounts for use in preparing 2019 income tax returns.
IVFK6-ANN-1219
1.9883991.102
Fidelity® Series Canada Fund
Annual Report
October 31, 2019
See the inside front cover for important information about access to your fund’s shareholder reports.
Beginning on January 1, 2021, as permitted by regulations adopted by the Securities and Exchange Commission, paper copies of a fund’s shareholder reports will no longer be sent by mail, unless you specifically request paper copies of the reports from the fund or from your financial intermediary, such as a financial advisor, broker-dealer or bank. Instead, the reports will be made available on a website, and you will be notified by mail each time a report is posted and provided with a website link to access the report.
If you already elected to receive shareholder reports electronically, you will not be affected by this change and you need not take any action. You may elect to receive shareholder reports and other communications from a fund electronically, by contacting your financial intermediary. For Fidelity customers, visit Fidelity's web site or call Fidelity using the contact information listed below.
You may elect to receive all future reports in paper free of charge. If you wish to continue receiving paper copies of your shareholder reports, you may contact your financial intermediary or, if you are a Fidelity customer, visit Fidelity’s website, or call Fidelity at the applicable toll-free number listed below. Your election to receive reports in paper will apply to all funds held with the fund complex/your financial intermediary.
| Account Type | Website | Phone Number |
| Brokerage, Mutual Fund, or Annuity Contracts: | fidelity.com/mailpreferences | 1-800-343-3548 |
| Employer Provided Retirement Accounts: | netbenefits.fidelity.com/preferences (choose 'no' under Required Disclosures to continue to print) | 1-800-343-0860 |
| Advisor Sold Accounts Serviced Through Your Financial Intermediary: | Contact Your Financial Intermediary | Your Financial Intermediary's phone number |
| Advisor Sold Accounts Serviced by Fidelity: | institutional.fidelity.com | 1-877-208-0098 |
Contents
To view a fund's proxy voting guidelines and proxy voting record for the 12-month period ended June 30, visit http://www.fidelity.com/proxyvotingresults or visit the Securities and Exchange Commission's (SEC) web site at http://www.sec.gov.
You may also call 1-800-544-8544 to request a free copy of the proxy voting guidelines.
Standard & Poor's, S&P and S&P 500 are registered service marks of The McGraw-Hill Companies, Inc. and have been licensed for use by Fidelity Distributors Corporation.
Other third-party marks appearing herein are the property of their respective owners.
All other marks appearing herein are registered or unregistered trademarks or service marks of FMR LLC or an affiliated company. © 2019 FMR LLC. All rights reserved.
This report and the financial statements contained herein are submitted for the general information of the shareholders of the Fund. This report is not authorized for distribution to prospective investors in the Fund unless preceded or accompanied by an effective prospectus.
A fund files its complete schedule of portfolio holdings with the SEC for the first and third quarters of each fiscal year on Form N-PORT. Forms N-PORT are available on the SEC’s web site at http://www.sec.gov. A fund's Forms N-PORT may be reviewed and copied at the SEC’s Public Reference Room in Washington, DC. Information regarding the operation of the SEC's Public Reference Room may be obtained by calling 1-800-SEC-0330.
For a complete list of a fund's portfolio holdings, view the most recent holdings listing, semiannual report, or annual report on Fidelity's web site at http://www.fidelity.com, http://www.institutional.fidelity.com, or http://www.401k.com, as applicable.
NOT FDIC INSURED •MAY LOSE VALUE •NO BANK GUARANTEE
Neither the Fund nor Fidelity Distributors Corporation is a bank.
Performance: The Bottom Line
Average annual total return reflects the change in the value of an investment, assuming reinvestment of distributions from dividend income and capital gains (the profits earned upon the sale of securities that have grown in value, if any) and assuming a constant rate of performance each year. The hypothetical investment and the average annual total returns do not reflect the deduction of taxes that a shareholder would pay on fund distributions or the redemption of fund shares. During periods of reimbursement by Fidelity, a fund’s total return will be greater than it would be had the reimbursement not occurred. How a fund did yesterday is no guarantee of how it will do tomorrow.
Average Annual Total Returns
| For the periods ended October 31, 2019 | Past 1 year | Life of fundA |
| Fidelity® Series Canada Fund | 11.62% | 5.57% |
A From August 15, 2017
$10,000 Over Life of Fund
Let's say hypothetically that $10,000 was invested in Fidelity® Series Canada Fund on August 15, 2017, when the fund started.
The chart shows how the value of your investment would have changed, and also shows how the MSCI Canada Index performed over the same period.
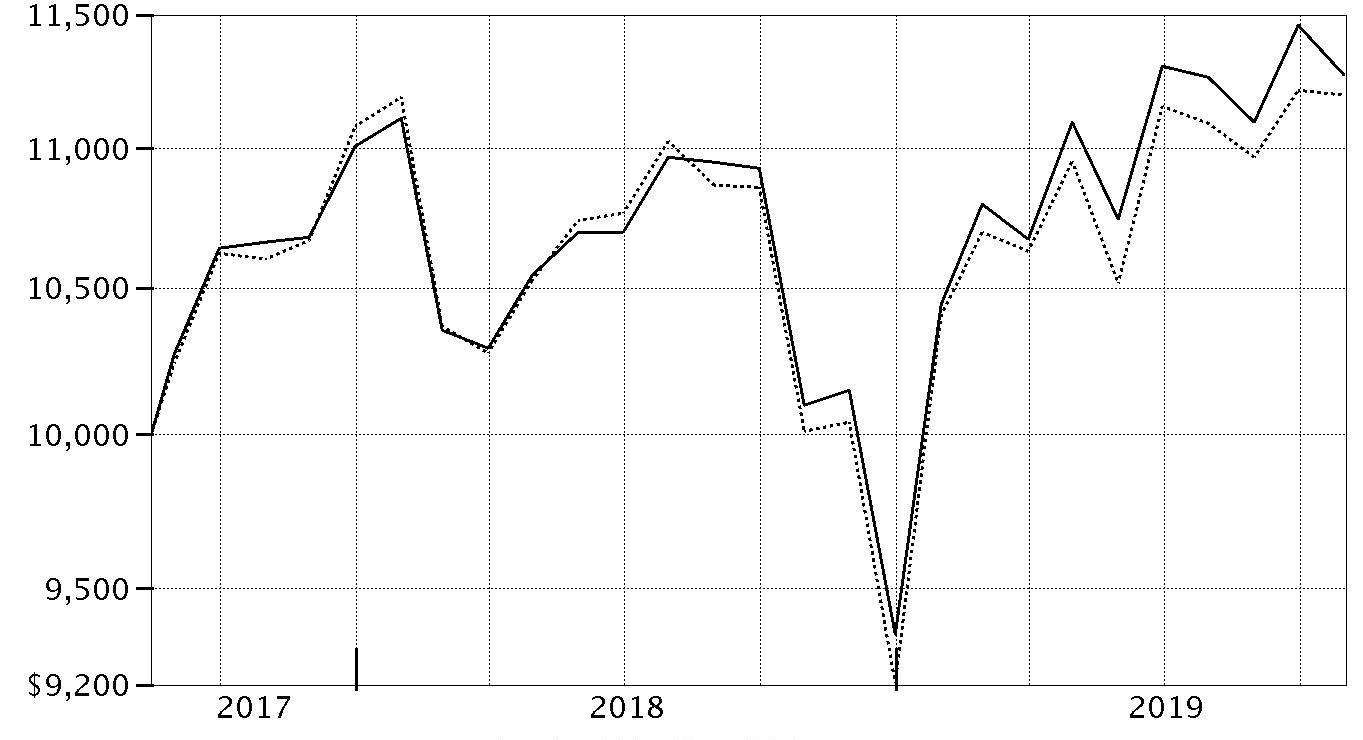
| Period Ending Values |
| $11,273 | Fidelity® Series Canada Fund |
| $11,195 | MSCI Canada Index |
Management's Discussion of Fund Performance
Market Recap: The MSCI ACWI (All Country World Index) ex USA Index gained 11.47% for the 12 months ending October 31, 2019, as international stocks reflected a confluence of factors, including escalating trade tension, and moderating but still positive global economic growth. Currency fluctuations were largely modest and varied by region, muting the overall impact on international equity returns. In late December, the U.S. Federal Reserve shifted from raising interest rates to a more dovish policy in 2019, joining many foreign central banks. In June, international stocks rose 6.03%, as policy stimulus in China stabilized that country’s economic growth. The Fed cut its policy rate in July for the first time since 2008. However, the index returned -1.21% for the month, followed by -3.08% in August. In September, the Fed cut its policy rate another quarter point, citing concerns about slowing economic growth and muted inflation, and did the same in October, leading to monthly gains of 2.59% and 3.49%, respectively. For the full 12 months, the growth-oriented information technology sector (+22%) led the way, followed by utilities (+20%) and real estate (+18%), two high-dividend-yielding categories. Conversely, energy was roughly flat, while materials (+6%) and communication services (7%) also lagged. By region, Asia Pacific ex Japan (+16%), Europe ex U.K (+13%), Canada (+12%) and emerging markets (+12%) fared best. Meanwhile, the U.K. (+7%) and Japan (+10%) trailed the broader market.
Comments from Portfolio Manager Ryan Oldham: For the fiscal year, the fund gained 11.62%, falling short of the 11.81% result of the benchmark, the S&P/TSX Composite Index of Canada-based equities. The benchmark's positive result for the 12 months belied meaningful performance differences by sector. Information technology (+47%) posted the strongest result, followed by utilities (+29%). Conversely, health care delivered the worst result (-30%). Versus the benchmark, stock selection hurt the fund's relative return; however, positive market positioning helped offset most of this negative impact. Choices in energy detracted the most, mainly due to the fund's stakes in PrairieSky Royalty (-33%), which lagged due to tepid oil prices. Avoiding e-commerce company Shopify (+127%) also hurt the fund's relative result. Conversely, stock picking in industrials added relative value. On an individual basis, the fund's biggest contribution came from avoiding natural gas producer Encana (-61%), a weak-performing index component that also struggled due to low energy prices.
The views expressed above reflect those of the portfolio manager(s) only through the end of the period as stated on the cover of this report and do not necessarily represent the views of Fidelity or any other person in the Fidelity organization. Any such views are subject to change at any time based upon market or other conditions and Fidelity disclaims any responsibility to update such views. These views may not be relied on as investment advice and, because investment decisions for a Fidelity fund are based on numerous factors, may not be relied on as an indication of trading intent on behalf of any Fidelity fund.
Investment Summary (Unaudited)
Geographic Diversification (% of fund's net assets)
| As of October 31, 2019 |
| | Canada | 98.7% |
| | United States of America* | 1.3% |

* Includes Short-Term investments and Net Other Assets (Liabilities).
Percentages are based on country or territory of incorporation and are adjusted for the effect of futures contracts, if applicable.
Asset Allocation as of October 31, 2019
| | % of fund's net assets |
| Stocks | 98.7 |
| Short-Term Investments and Net Other Assets (Liabilities) | 1.3 |
Top Ten Stocks as of October 31, 2019
| | % of fund's net assets |
| The Toronto-Dominion Bank (Banks) | 10.1 |
| Canadian Pacific Railway Ltd. (Road & Rail) | 5.2 |
| Bank of Nova Scotia (Banks) | 5.1 |
| Royal Bank of Canada (Banks) | 5.0 |
| Bank of Montreal (Banks) | 4.9 |
| Alimentation Couche-Tard, Inc. Class B (sub. vtg.) (Food & Staples Retailing) | 4.8 |
| Sun Life Financial, Inc. (Insurance) | 4.8 |
| Suncor Energy, Inc. (Oil, Gas & Consumable Fuels) | 4.7 |
| Enbridge, Inc. (Oil, Gas & Consumable Fuels) | 4.4 |
| Canadian Natural Resources Ltd. (Oil, Gas & Consumable Fuels) | 4.3 |
| | 53.3 |
Top Market Sectors as of October 31, 2019
| | % of fund's net assets |
| Financials | 36.7 |
| Energy | 17.3 |
| Industrials | 11.2 |
| Materials | 10.2 |
| Consumer Staples | 7.8 |
| Information Technology | 5.9 |
| Communication Services | 5.3 |
| Consumer Discretionary | 3.6 |
| Real Estate | 0.7 |
Market Sectors may include more than one industry category.
The Fund may invest up to 35% of its total assets in any industry that represents more than 20% of the Canadian market. As of October 31, 2019, 25.8% of the Fund’s total assets were invested in the Banks industry, which accounts for more than 20% of the Canadian market.
Schedule of Investments October 31, 2019
Showing Percentage of Net Assets
| Common Stocks - 98.7% | | | |
| | | Shares | Value |
| COMMUNICATION SERVICES - 5.3% | | | |
| Diversified Telecommunication Services - 2.6% | | | |
| TELUS Corp. | | 1,421,100 | $50,549,339 |
| Media - 0.3% | | | |
| Cogeco Communications, Inc. | | 56,200 | 4,857,923 |
| Wireless Telecommunication Services - 2.4% | | | |
| Rogers Communications, Inc. Class B (non-vtg.) (a) | | 966,600 | 45,508,212 |
|
| TOTAL COMMUNICATION SERVICES | | | 100,915,474 |
|
| CONSUMER DISCRETIONARY - 3.6% | | | |
| Hotels, Restaurants & Leisure - 0.3% | | | |
| Recipe Unlimited Corp. | | 300,000 | 5,389,112 |
| Leisure Products - 0.6% | | | |
| Spin Master Corp. (b)(c) | | 447,200 | 12,651,030 |
| Multiline Retail - 2.4% | | | |
| Dollarama, Inc. | | 1,375,500 | 46,274,698 |
| Textiles, Apparel & Luxury Goods - 0.3% | | | |
| Canada Goose Holdings, Inc. (b) | | 121,000 | 5,061,954 |
|
| TOTAL CONSUMER DISCRETIONARY | | | 69,376,794 |
|
| CONSUMER STAPLES - 7.8% | | | |
| Food & Staples Retailing - 7.7% | | | |
| Alimentation Couche-Tard, Inc. Class B (sub. vtg.) | | 3,081,700 | 92,420,583 |
| George Weston Ltd. | | 535,400 | 42,865,333 |
| North West Co., Inc. | | 567,900 | 12,150,499 |
| | | | 147,436,415 |
| Personal Products - 0.1% | | | |
| Jamieson Wellness, Inc. | | 143,100 | 2,581,471 |
|
| TOTAL CONSUMER STAPLES | | | 150,017,886 |
|
| ENERGY - 17.3% | | | |
| Energy Equipment & Services - 0.2% | | | |
| Computer Modelling Group Ltd. | | 851,800 | 4,533,534 |
| Oil, Gas & Consumable Fuels - 17.1% | | | |
| Canadian Natural Resources Ltd. | | 3,268,700 | 82,418,592 |
| Cenovus Energy, Inc. (Canada) | | 2,257,800 | 19,233,556 |
| Enbridge, Inc. | | 2,304,000 | 83,913,811 |
| Pinnacle Renewable Energy, Inc. | | 710,553 | 3,900,462 |
| PrairieSky Royalty Ltd. (a) | | 4,870,700 | 47,556,907 |
| Suncor Energy, Inc. | | 3,056,200 | 90,866,898 |
| | | | 327,890,226 |
|
| TOTAL ENERGY | | | 332,423,760 |
|
| FINANCIALS - 36.7% | | | |
| Banks - 25.1% | | | |
| Bank of Montreal | | 1,273,700 | 94,287,260 |
| Bank of Nova Scotia | | 1,697,100 | 97,334,245 |
| Royal Bank of Canada | | 1,182,400 | 95,374,820 |
| The Toronto-Dominion Bank | | 3,410,000 | 194,720,295 |
| | | | 481,716,620 |
| Capital Markets - 1.0% | | | |
| IGM Financial, Inc. | | 681,700 | 19,238,318 |
| Insurance - 10.6% | | | |
| Fairfax Financial Holdings Ltd. (sub. vtg.) | | 63,500 | 26,902,285 |
| Intact Financial Corp. | | 379,000 | 39,105,687 |
| Intact Financial Corp. rights 7/31/20 | | 58,700 | 6,012,171 |
| Power Corp. of Canada (sub. vtg.) | | 1,721,300 | 39,833,896 |
| Sun Life Financial, Inc. | | 2,028,800 | 91,019,506 |
| | | | 202,873,545 |
|
| TOTAL FINANCIALS | | | 703,828,483 |
|
| INDUSTRIALS - 11.2% | | | |
| Aerospace & Defense - 0.7% | | | |
| CAE, Inc. | | 552,900 | 13,865,528 |
| Professional Services - 2.0% | | | |
| Thomson Reuters Corp. | | 567,100 | 38,109,499 |
| Road & Rail - 8.5% | | | |
| Canadian National Railway Co. | | 696,600 | 62,303,151 |
| Canadian Pacific Railway Ltd. | | 439,000 | 99,829,087 |
| | | | 162,132,238 |
|
| TOTAL INDUSTRIALS | | | 214,107,265 |
|
| INFORMATION TECHNOLOGY - 5.9% | | | |
| IT Services - 2.0% | | | |
| CGI Group, Inc. Class A (sub. vtg.) (b) | | 498,600 | 38,756,866 |
| Software - 3.9% | | | |
| Constellation Software, Inc. | | 35,300 | 34,863,943 |
| Open Text Corp. | | 970,700 | 39,223,031 |
| | | | 74,086,974 |
|
| TOTAL INFORMATION TECHNOLOGY | | | 112,843,840 |
|
| MATERIALS - 10.2% | | | |
| Chemicals - 3.5% | | | |
| Nutrien Ltd. | | 1,399,978 | 66,974,879 |
| Containers & Packaging - 1.2% | | | |
| CCL Industries, Inc. Class B | | 569,700 | 23,448,058 |
| Metals & Mining - 5.2% | | | |
| Franco-Nevada Corp. | | 555,742 | 53,924,400 |
| Lundin Mining Corp. | | 2,007,400 | 10,135,305 |
| OceanaGold Corp. | | 1,365,200 | 3,275,402 |
| Wheaton Precious Metals Corp. | | 1,138,000 | 31,899,598 |
| | | | 99,234,705 |
| Paper & Forest Products - 0.3% | | | |
| Western Forest Products, Inc. | | 6,200,100 | 6,119,604 |
|
| TOTAL MATERIALS | | | 195,777,246 |
|
| REAL ESTATE - 0.7% | | | |
| Equity Real Estate Investment Trusts (REITs) - 0.7% | | | |
| Allied Properties (REIT) | | 308,900 | 12,566,139 |
| TOTAL COMMON STOCKS | | | |
| (Cost $1,818,505,466) | | | 1,891,856,887 |
|
| Money Market Funds - 2.5% | | | |
| Fidelity Cash Central Fund 1.83% (d) | | 21,041,927 | 21,046,136 |
| Fidelity Securities Lending Cash Central Fund 1.84% (d)(e) | | 25,955,251 | 25,957,846 |
| TOTAL MONEY MARKET FUNDS | | | |
| (Cost $47,003,122) | | | 47,003,982 |
| TOTAL INVESTMENT IN SECURITIES - 101.2% | | | |
| (Cost $1,865,508,588) | | | 1,938,860,869 |
| NET OTHER ASSETS (LIABILITIES) - (1.2)% | | | (22,451,783) |
| NET ASSETS - 100% | | | $1,916,409,086 |
Legend
(a) Security or a portion of the security is on loan at period end.
(b) Non-income producing
(c) Security exempt from registration under Rule 144A of the Securities Act of 1933. These securities may be resold in transactions exempt from registration, normally to qualified institutional buyers. At the end of the period, the value of these securities amounted to $12,651,030 or 0.7% of net assets.
(d) Affiliated fund that is generally available only to investment companies and other accounts managed by Fidelity Investments. The rate quoted is the annualized seven-day yield of the fund at period end. A complete unaudited listing of the fund's holdings as of its most recent quarter end is available upon request. In addition, each Fidelity Central Fund's financial statements, which are not covered by the Fund's Report of Independent Registered Public Accounting Firm, are available on the SEC's website or upon request.
(e) Investment made with cash collateral received from securities on loan.
Affiliated Central Funds
Information regarding fiscal year to date income earned by the Fund from investments in Fidelity Central Funds is as follows:
| Fund | Income earned |
| Fidelity Cash Central Fund | $458,428 |
| Fidelity Securities Lending Cash Central Fund | 309,020 |
| Total | $767,448 |
Amounts in the income column in the above table include any capital gain distributions from underlying funds, which are presented in the corresponding line-item in the Statement of Operations, if applicable. Amount for Fidelity Securities Lending Cash Central Fund represents the income earned on investing cash collateral, less rebates paid to borrowers and any lending agent fees associated with the loan, plus any premium payments received for lending certain types of securities.
Investment Valuation
All investments are categorized as Level 1 under the Fair Value Hierarchy. The inputs or methodology used for valuing securities may not be an indication of the risk associated with investing in those securities. For more information on valuation inputs please refer to the Investment Valuation section in the accompanying Notes to Financial Statements.
See accompanying notes which are an integral part of the financial statements.
Financial Statements
Statement of Assets and Liabilities
| | | October 31, 2019 |
| Assets | | |
Investment in securities, at value (including securities loaned of $25,132,624) — See accompanying schedule:
Unaffiliated issuers (cost $1,818,505,466) | $1,891,856,887 | |
| Fidelity Central Funds (cost $47,003,122) | 47,003,982 | |
| Total Investment in Securities (cost $1,865,508,588) | | $1,938,860,869 |
| Foreign currency held at value (cost $2,622,440) | | 2,622,440 |
| Receivable for investments sold | | 8,353,904 |
| Receivable for fund shares sold | | 48,035,868 |
| Dividends receivable | | 1,896,739 |
| Distributions receivable from Fidelity Central Funds | | 39,763 |
| Total assets | | 1,999,809,583 |
| Liabilities | | |
| Payable for investments purchased | $56,635,776 | |
| Payable for fund shares redeemed | 802,088 | |
| Other payables and accrued expenses | 4,793 | |
| Collateral on securities loaned | 25,957,840 | |
| Total liabilities | | 83,400,497 |
| Net Assets | | $1,916,409,086 |
| Net Assets consist of: | | |
| Paid in capital | | $1,822,061,777 |
| Total accumulated earnings (loss) | | 94,347,309 |
| Net Assets, for 176,002,881 shares outstanding | | $1,916,409,086 |
| Net Asset Value, offering price and redemption price per share ($1,916,409,086 ÷ 176,002,881 shares) | | $10.89 |
See accompanying notes which are an integral part of the financial statements.
Statement of Operations
| | | Year ended October 31, 2019 |
| Investment Income | | |
| Dividends | | $48,743,023 |
| Income from Fidelity Central Funds (including $309,020 from security lending) | | 767,448 |
| Income before foreign taxes withheld | | 49,510,471 |
| Less foreign taxes withheld | | (7,498,812) |
| Total income | | 42,011,659 |
| Expenses | | |
| Custodian fees and expenses | $10,584 | |
| Independent trustees' fees and expenses | 8,714 | |
| Commitment fees | 4,111 | |
| Total expenses before reductions | 23,409 | |
| Expense reductions | (34) | |
| Total expenses after reductions | | 23,375 |
| Net investment income (loss) | | 41,988,284 |
| Realized and Unrealized Gain (Loss) | | |
| Net realized gain (loss) on: | | |
| Investment securities: | | |
| Unaffiliated issuers | (6,628,516) | |
| Fidelity Central Funds | 12,706 | |
| Foreign currency transactions | (74,776) | |
| Total net realized gain (loss) | | (6,690,586) |
| Change in net unrealized appreciation (depreciation) on: | | |
| Investment securities: | | |
| Unaffiliated issuers | 133,914,303 | |
| Fidelity Central Funds | 859 | |
| Assets and liabilities in foreign currencies | (15,674) | |
| Total change in net unrealized appreciation (depreciation) | | 133,899,488 |
| Net gain (loss) | | 127,208,902 |
| Net increase (decrease) in net assets resulting from operations | | $169,197,186 |
See accompanying notes which are an integral part of the financial statements.
Statement of Changes in Net Assets
| | Year ended October 31, 2019 | Year ended October 31, 2018 |
| Increase (Decrease) in Net Assets | | |
| Operations | | |
| Net investment income (loss) | $41,988,284 | $36,082,028 |
| Net realized gain (loss) | (6,690,586) | (5,450,709) |
| Change in net unrealized appreciation (depreciation) | 133,899,488 | (102,733,008) |
| Net increase (decrease) in net assets resulting from operations | 169,197,186 | (72,101,689) |
| Distributions to shareholders | (33,015,477) | (16,111,554) |
| Share transactions | | |
| Proceeds from sales of shares | 499,980,643 | 164,696,337 |
| Reinvestment of distributions | 33,015,477 | 16,111,554 |
| Cost of shares redeemed | (138,267,378) | (184,063,223) |
| Net increase (decrease) in net assets resulting from share transactions | 394,728,742 | (3,255,332) |
| Total increase (decrease) in net assets | 530,910,451 | (91,468,575) |
| Net Assets | | |
| Beginning of period | 1,385,498,635 | 1,476,967,210 |
| End of period | $1,916,409,086 | $1,385,498,635 |
| Other Information | | |
| Shares | | |
| Sold | 47,300,568 | 15,644,674 |
| Issued in reinvestment of distributions | 3,482,645 | 1,522,831 |
| Redeemed | (13,464,835) | (17,094,786) |
| Net increase (decrease) | 37,318,378 | 72,719 |
See accompanying notes which are an integral part of the financial statements.
Financial Highlights
Fidelity Series Canada Fund
| | | | |
| Years ended October 31, | 2019 | 2018 | 2017 A |
| Selected Per–Share Data | | | |
| Net asset value, beginning of period | $9.99 | $10.66 | $10.00 |
| Income from Investment Operations | | | |
| Net investment income (loss)B | .27 | .26 | .06 |
| Net realized and unrealized gain (loss) | .86 | (.81) | .60 |
| Total from investment operations | 1.13 | (.55) | .66 |
| Distributions from net investment income | (.23) | (.10) | – |
| Distributions from net realized gain | – | (.02) | – |
| Total distributions | (.23) | (.12) | – |
| Net asset value, end of period | $10.89 | $9.99 | $10.66 |
| Total ReturnC,D | 11.62% | (5.26)% | 6.60% |
| Ratios to Average Net AssetsE,F | | | |
| Expenses before reductionsG | -% | -% | - %H |
| Expenses net of fee waivers, if anyG | -% | -% | - %H |
| Expenses net of all reductionsG | -% | -% | - %H |
| Net investment income (loss) | 2.63% | 2.42% | 2.62%H |
| Supplemental Data | | | |
| Net assets, end of period (000 omitted) | $1,916,409 | $1,385,499 | $1,476,967 |
| Portfolio turnover rateI | 12%J | 36% | 3%K |
A For the period August 15, 2017 (commencement of operations) to October 31, 2017.
B Calculated based on average shares outstanding during the period.
C Total returns for periods of less than one year are not annualized.
D Total returns would have been lower if certain expenses had not been reduced during the applicable periods shown.
E Fees and expenses of any underlying Fidelity Central Funds are not included in the Fund's expense ratio. The Fund indirectly bears its proportionate share of the expenses of any underlying Fidelity Central Funds.
F Expense ratios reflect operating expenses of the Fund. Expenses before reductions do not reflect amounts reimbursed by the investment adviser or reductions from expense offset arrangements and do not represent the amount paid by the Fund during periods when reimbursements or reductions occur. Expense ratios before reductions for start-up periods may not be representative of longer term operating periods. Expenses net of fee waivers reflect expenses after reimbursement by the investment adviser but prior to reductions from expense offset arrangements. Expenses net of all reductions represent the net expenses paid by the Fund.
G Amount represents less than .005%.
H Annualized
I Amount does not include the portfolio activity of any underlying Fidelity Central Funds.
J Portfolio turnover rate excludes securities received or delivered in-kind.
K Amount not annualized.
See accompanying notes which are an integral part of the financial statements.
Notes to Financial Statements
For the period ended October 31, 2019
1. Organization.
Fidelity Series Canada Fund (the Fund) is a fund of Fidelity Investment Trust (the Trust) and is authorized to issue an unlimited number of shares. Shares are offered only to certain other Fidelity funds and Fidelity managed 529 plans. The Trust is registered under the Investment Company Act of 1940, as amended (the 1940 Act), as an open-end management investment company organized as a Massachusetts business trust.
2. Investments in Fidelity Central Funds.
The Fund invests in Fidelity Central Funds, which are open-end investment companies generally available only to other investment companies and accounts managed by the investment adviser and its affiliates. The Fund's Schedule of Investments lists each of the Fidelity Central Funds held as of period end, if any, as an investment of the Fund, but does not include the underlying holdings of each Fidelity Central Fund. As an Investing Fund, the Fund indirectly bears its proportionate share of the expenses of the underlying Fidelity Central Funds.
The Money Market Central Funds seek preservation of capital and current income and are managed by Fidelity Investments Money Management, Inc. (FIMM), an affiliate of the investment adviser. Annualized expenses of the Money Market Central Funds as of their most recent shareholder report date ranged from less than .005% to .01%.
A complete unaudited list of holdings for each Fidelity Central Fund is available upon request or at the Securities and Exchange Commission (the SEC) website at www.sec.gov. In addition, the financial statements of the Fidelity Central Funds, which are not covered by the Fund's Report of Independent Registered Public Accounting Firm, are available on the SEC website or upon request.
3. Significant Accounting Policies.
The Fund is an investment company and applies the accounting and reporting guidance of the Financial Accounting Standards Board (FASB) Accounting Standards Codification Topic 946 Financial Services – Investments Companies. The financial statements have been prepared in conformity with accounting principles generally accepted in the United States of America (GAAP), which require management to make certain estimates and assumptions at the date of the financial statements. Actual results could differ from those estimates. Subsequent events, if any, through the date that the financial statements were issued have been evaluated in the preparation of the financial statements. The following summarizes the significant accounting policies of the Fund:
Investment Valuation. Investments are valued as of 4:00 p.m. Eastern time on the last calendar day of the period. The Board of Trustees (the Board) has delegated the day to day responsibility for the valuation of the Fund's investments to the Fair Value Committee (the Committee) established by the Fund's investment adviser. In accordance with valuation policies and procedures approved by the Board, the Fund attempts to obtain prices from one or more third party pricing vendors or brokers to value its investments. When current market prices, quotations or currency exchange rates are not readily available or reliable, investments will be fair valued in good faith by the Committee, in accordance with procedures adopted by the Board. Factors used in determining fair value vary by investment type and may include market or investment specific events. The frequency with which these procedures are used cannot be predicted and they may be utilized to a significant extent. The Committee oversees the Fund's valuation policies and procedures and reports to the Board on the Committee's activities and fair value determinations. The Board monitors the appropriateness of the procedures used in valuing the Fund's investments and ratifies the fair value determinations of the Committee.
The Fund categorizes the inputs to valuation techniques used to value its investments into a disclosure hierarchy consisting of three levels as shown below:
- Level 1 – quoted prices in active markets for identical investments
- Level 2 – other significant observable inputs (including quoted prices for similar investments, interest rates, prepayment speeds, etc.)
- Level 3 – unobservable inputs (including the Fund's own assumptions based on the best information available)
Valuation techniques used to value the Fund's investments by major category are as follows:
Equity securities, including restricted securities, for which market quotations are readily available, are valued at the last reported sale price or official closing price as reported by a third party pricing vendor on the primary market or exchange on which they are traded and are categorized as Level 1 in the hierarchy. In the event there were no sales during the day or closing prices are not available, securities are valued at the last quoted bid price or may be valued using the last available price and are generally categorized as Level 2 in the hierarchy. For foreign equity securities, when market or security specific events arise, comparisons to the valuation of American Depositary Receipts (ADRs), futures contracts, Exchange-Traded Funds (ETFs) and certain indexes as well as quoted prices for similar securities may be used and would be categorized as Level 2 in the hierarchy. For equity securities, including restricted securities, where observable inputs are limited, assumptions about market activity and risk are used and these securities may be categorized as Level 3 in the hierarchy.
Investments in open-end mutual funds, including the Fidelity Central Funds, are valued at their closing net asset value (NAV) each business day and are categorized as Level 1 in the hierarchy.
Changes in valuation techniques may result in transfers in or out of an assigned level within the disclosure hierarchy.
Foreign Currency. The Fund may use foreign currency contracts to facilitate transactions in foreign-denominated securities. Gains and losses from these transactions may arise from changes in the value of the foreign currency or if the counterparties do not perform under the contracts' terms.
Foreign-denominated assets, including investment securities, and liabilities are translated into U.S. dollars at the exchange rates at period end. Purchases and sales of investment securities, income and dividends received and expenses denominated in foreign currencies are translated into U.S. dollars at the exchange rate in effect on the transaction date.
The effects of exchange rate fluctuations on investments are included with the net realized and unrealized gain (loss) on investment securities. Other foreign currency transactions resulting in realized and unrealized gain (loss) are disclosed separately.
Investment Transactions and Income. For financial reporting purposes, the Fund's investment holdings and NAV include trades executed through the end of the last business day of the period. The NAV per share for processing shareholder transactions is calculated as of the close of business of the New York Stock Exchange (NYSE), normally 4:00 p.m. Eastern time and includes trades executed through the end of the prior business day. Gains and losses on securities sold are determined on the basis of identified cost. Dividend income is recorded on the ex-dividend date, except for certain dividends from foreign securities where the ex-dividend date may have passed, which are recorded as soon as the Fund is informed of the ex-dividend date. Non-cash dividends included in dividend income, if any, are recorded at the fair market value of the securities received. Income and capital gain distributions from Fidelity Central Funds, if any, are recorded on the ex-dividend date. Certain distributions received by the Fund represent a return of capital or capital gain. The Fund determines the components of these distributions subsequent to the ex-dividend date, based upon receipt of tax filings or other correspondence relating to the underlying investment. These distributions are recorded as a reduction of cost of investments and/or as a realized gain. Investment income is recorded net of foreign taxes withheld where recovery of such taxes is uncertain.
Expenses. Expenses directly attributable to a fund are charged to that fund. Expenses attributable to more than one fund are allocated among the respective funds on the basis of relative net assets or other appropriate methods. Expense estimates are accrued in the period to which they relate and adjustments are made when actual amounts are known.
Income Tax Information and Distributions to Shareholders. Each year, the Fund intends to qualify as a regulated investment company under Subchapter M of the Internal Revenue Code, including distributing substantially all of its taxable income and realized gains. As a result, no provision for U.S. Federal income taxes is required. As of October 31, 2019, the Fund did not have any unrecognized tax benefits in the financial statements; nor is the Fund aware of any tax positions for which it is reasonably possible that the total amounts of unrecognized tax benefits will significantly change in the next twelve months. The Fund files a U.S. federal tax return, in addition to state and local tax returns as required. The Fund's federal income tax returns are subject to examination by the Internal Revenue Service (IRS) for a period of three fiscal years after they are filed. State and local tax returns may be subject to examination for an additional fiscal year depending on the jurisdiction. Foreign taxes are provided for based on the Fund's understanding of the tax rules and rates that exist in the foreign markets in which it invests.
Distributions are declared and recorded on the ex-dividend date. Income and capital gain distributions are determined in accordance with income tax regulations, which may differ from GAAP.
Capital accounts within the financial statements are adjusted for permanent book-tax differences. These adjustments have no impact on net assets or the results of operations. Capital accounts are not adjusted for temporary book-tax differences which will reverse in a subsequent period.
Book-tax differences are primarily due to foreign currency transactions, passive foreign investment companies (PFIC), capital loss carryforwards, and losses deferred due to wash sales.
As of period end, the cost and unrealized appreciation (depreciation) in securities, and derivatives if applicable, for federal income tax purposes were as follows:
| Gross unrealized appreciation | $169,926,335 |
| Gross unrealized depreciation | (97,745,489) |
| Net unrealized appreciation (depreciation) | $72,180,846 |
| Tax Cost | $1,866,680,023 |
The tax-based components of distributable earnings as of period end were as follows:
| Undistributed ordinary income | $34,304,953 |
| Capital loss carryforward | $(12,114,756) |
| Net unrealized appreciation (depreciation) on securities and other investments | $72,157,111 |
Capital loss carryforwards are only available to offset future capital gains of the Fund to the extent provided by regulations and may be limited. Under the Regulated Investment Company Modernization Act of 2010 (the Act), the Fund is permitted to carry forward capital losses incurred in taxable years beginning after December 22, 2010 for an unlimited period and such capital losses are required to be used prior to any losses that expire. The capital loss carryforward information presented below, including any applicable limitation, is estimated as of fiscal period end and is subject to adjustment.
| No expiration | |
| Short-term | $(525,916) |
| Long-term | (11,588,840) |
| Total capital loss carryforward | $(12,114,756) |
The tax character of distributions paid was as follows:
| | October 31, 2019 | October 31, 2018 |
| Ordinary Income | $33,015,477 | $ 16,111,554 |
Restricted Securities. The Fund may invest in securities that are subject to legal or contractual restrictions on resale. These securities generally may be resold in transactions exempt from registration or to the public if the securities are registered. Disposal of these securities may involve time-consuming negotiations and expense, and prompt sale at an acceptable price may be difficult. Information regarding restricted securities is included at the end of the Fund's Schedule of Investments.
4. Purchases and Sales of Investments.
Purchases and sales of securities, other than short-term securities and in-kind transactions, aggregated $533,499,598 and $191,399,646, respectively.
5. Fees and Other Transactions with Affiliates.
Management Fee. Fidelity Management & Research Company (the investment adviser) and its affiliates provide the Fund with investment management related services for which the Fund does not pay a management fee. Under the management contract, the investment adviser or an affiliate pays all ordinary operating expenses of the Fund, except custody fees, fees and expenses of the independent Trustees, and certain miscellaneous expenses such as proxy and shareholder meeting expenses.
Interfund Trades. The Fund may purchase from or sell securities to other Fidelity Funds under procedures adopted by the Board. The procedures have been designed to ensure these interfund trades are executed in accordance with Rule 17a-7 of the 1940 Act. Interfund trades are included within the respective purchases and sales amounts shown in the Purchases and Sales of Investments note.
Affiliated Exchanges In-Kind. During the period, the Fund received investments and cash valued at $69,285,091 in exchange for 6,362,267 shares of the Fund. The amount of in-kind exchanges is included in share transactions in the accompanying Statement of Changes in Net Assets.
6. Committed Line of Credit.
The Fund participates with other funds managed by the investment adviser or an affiliate in a $4.25 billion credit facility (the "line of credit") to be utilized for temporary or emergency purposes to fund shareholder redemptions or for other short-term liquidity purposes. The Fund has agreed to pay commitment fees on its pro-rata portion of the line of credit, which amounted to $4,111 and is reflected in Commitment fees on the Statement of Operations. During the period, the Fund did not borrow on this line of credit.
7. Security Lending.
The Fund lends portfolio securities from time to time in order to earn additional income. For equity securities, lending agents are used, including National Financial Services (NFS), an affiliate of the Fund. Pursuant to a securities lending agreement, NFS will receive a fee, which is capped at 9.9% of daily lending revenue, for its services as lending agent. The Fund may lend securities to certain qualified borrowers, including NFS. On the settlement date of the loan, the Fund receives collateral (in the form of U.S. Treasury obligations, letters of credit and/or cash) against the loaned securities and maintains collateral in an amount not less than 100% of the market value of the loaned securities during the period of the loan. The market value of the loaned securities is determined at the close of business of the Fund and any additional required collateral is delivered to the Fund on the next business day. The Fund or borrower may terminate the loan at any time, and if the borrower defaults on its obligation to return the securities loaned because of insolvency or other reasons, the Fund may apply collateral received from the borrower against the obligation. The Fund may experience delays and costs in recovering the securities loaned. Any cash collateral received is invested in the Fidelity Securities Lending Cash Central Fund. The value of loaned securities and cash collateral at period end are disclosed on the Fund's Statement of Assets and Liabilities. Security lending income represents the income earned on investing cash collateral, less rebates paid to borrowers and any lending agent fees associated with the loan, plus any premium payments received for lending certain types of securities. Security lending income is presented in the Statement of Operations as a component of income from Fidelity Central Funds. During the period, there were no securities loaned to NFS.
8. Expense Reductions.
Through arrangements with the Fund's custodian, credits realized as a result of certain uninvested cash balances were used to reduce the Fund's expenses by $34.
9. Other.
The Fund's organizational documents provide former and current trustees and officers with a limited indemnification against liabilities arising in connection with the performance of their duties to the Fund. In the normal course of business, the Fund may also enter into contracts that provide general indemnifications. The Fund's maximum exposure under these arrangements is unknown as this would be dependent on future claims that may be made against the Fund. The risk of material loss from such claims is considered remote.
At the end of the period, mutual funds and accounts managed by the investment adviser or its affiliates were the owners of record of all of the outstanding shares of the Fund.
Report of Independent Registered Public Accounting Firm
To the Board of Trustees of Fidelity Investment Trust and Shareholders of Fidelity Series Canada Fund:
Opinion on the Financial Statements
We have audited the accompanying statement of assets and liabilities, including the schedule of investments, of Fidelity Series Canada Fund (one of the funds constituting Fidelity Investment Trust, referred to hereafter as the “Fund”) as of October 31, 2019, the related statement of operations for the year ended October 31, 2019, the statement of changes in net assets for each of the two years in the period ended October 31, 2019, including the related notes, and the financial highlights for each of the two years in the period ended October 31, 2019 and for the period August 15, 2017 (commencement of operations) through October 31, 2017 (collectively referred to as the “financial statements”). In our opinion, the financial statements present fairly, in all material respects, the financial position of the Fund as of October 31, 2019, the results of its operations for the year then ended, the changes in its net assets for each of the two years in the period ended October 31, 2019 and the financial highlights for each of the two years in the period ended October 31, 2019 and for the period August 15, 2017 (commencement of operations) through October 31, 2017 in conformity with accounting principles generally accepted in the United States of America.
Basis for Opinion
These financial statements are the responsibility of the Fund’s management. Our responsibility is to express an opinion on the Fund’s financial statements based on our audits. We are a public accounting firm registered with the Public Company Accounting Oversight Board (United States) (PCAOB) and are required to be independent with respect to the Fund in accordance with the U.S. federal securities laws and the applicable rules and regulations of the Securities and Exchange Commission and the PCAOB.
We conducted our audits of these financial statements in accordance with the standards of the PCAOB. Those standards require that we plan and perform the audit to obtain reasonable assurance about whether the financial statements are free of material misstatement, whether due to error or fraud.
Our audits included performing procedures to assess the risks of material misstatement of the financial statements, whether due to error or fraud, and performing procedures that respond to those risks. Such procedures included examining, on a test basis, evidence regarding the amounts and disclosures in the financial statements. Our audits also included evaluating the accounting principles used and significant estimates made by management, as well as evaluating the overall presentation of the financial statements. Our procedures included confirmation of securities owned as of October 31, 2019 by correspondence with the custodian and brokers; when replies were not received from brokers, we performed other auditing procedures. We believe that our audits provide a reasonable basis for our opinion.
PricewaterhouseCoopers LLP
Boston, Massachusetts
December 16, 2019
We have served as the auditor of one or more investment companies in the Fidelity group of funds since 1932.
Trustees and Officers
The Trustees, Members of the Advisory Board (if any), and officers of the trust and fund, as applicable, are listed below. The Board of Trustees governs the fund and is responsible for protecting the interests of shareholders. The Trustees are experienced executives who meet periodically throughout the year to oversee the fund's activities, review contractual arrangements with companies that provide services to the fund, oversee management of the risks associated with such activities and contractual arrangements, and review the fund's performance. Except for Jonathan Chiel, each of the Trustees oversees 298 funds. Mr. Chiel oversees 171 funds.
The Trustees hold office without limit in time except that (a) any Trustee may resign; (b) any Trustee may be removed by written instrument, signed by at least two-thirds of the number of Trustees prior to such removal; (c) any Trustee who requests to be retired or who has become incapacitated by illness or injury may be retired by written instrument signed by a majority of the other Trustees; and (d) any Trustee may be removed at any special meeting of shareholders by a two-thirds vote of the outstanding voting securities of the trust. Each Trustee who is not an interested person (as defined in the 1940 Act) of the trust and the fund is referred to herein as an Independent Trustee. Each Independent Trustee shall retire not later than the last day of the calendar year in which his or her 75th birthday occurs. The Independent Trustees may waive this mandatory retirement age policy with respect to individual Trustees. Officers and Advisory Board Members hold office without limit in time, except that any officer or Advisory Board Member may resign or may be removed by a vote of a majority of the Trustees at any regular meeting or any special meeting of the Trustees. Except as indicated, each individual has held the office shown or other offices in the same company for the past five years.
The fund’s Statement of Additional Information (SAI) includes more information about the Trustees. To request a free copy, call Fidelity at 1-800-544-8544.
Experience, Skills, Attributes, and Qualifications of the Trustees. The Governance and Nominating Committee has adopted a statement of policy that describes the experience, qualifications, attributes, and skills that are necessary and desirable for potential Independent Trustee candidates (Statement of Policy). The Board believes that each Trustee satisfied at the time he or she was initially elected or appointed a Trustee, and continues to satisfy, the standards contemplated by the Statement of Policy. The Governance and Nominating Committee also engages professional search firms to help identify potential Independent Trustee candidates who have the experience, qualifications, attributes, and skills consistent with the Statement of Policy. From time to time, additional criteria based on the composition and skills of the current Independent Trustees, as well as experience or skills that may be appropriate in light of future changes to board composition, business conditions, and regulatory or other developments, have also been considered by the professional search firms and the Governance and Nominating Committee. In addition, the Board takes into account the Trustees' commitment and participation in Board and committee meetings, as well as their leadership of standing and ad hoc committees throughout their tenure.
In determining that a particular Trustee was and continues to be qualified to serve as a Trustee, the Board has considered a variety of criteria, none of which, in isolation, was controlling. The Board believes that, collectively, the Trustees have balanced and diverse experience, qualifications, attributes, and skills, which allow the Board to operate effectively in governing the fund and protecting the interests of shareholders. Information about the specific experience, skills, attributes, and qualifications of each Trustee, which in each case led to the Board's conclusion that the Trustee should serve (or continue to serve) as a trustee of the fund, is provided below.
Board Structure and Oversight Function. James C. Curvey is an interested person and currently serves as Chairman. The Trustees have determined that an interested Chairman is appropriate and benefits shareholders because an interested Chairman has a personal and professional stake in the quality and continuity of services provided to the fund. Independent Trustees exercise their informed business judgment to appoint an individual of their choosing to serve as Chairman, regardless of whether the Trustee happens to be independent or a member of management. The Independent Trustees have determined that they can act independently and effectively without having an Independent Trustee serve as Chairman and that a key structural component for assuring that they are in a position to do so is for the Independent Trustees to constitute a substantial majority for the Board. The Independent Trustees also regularly meet in executive session. Ned C. Lautenbach serves as Chairman of the Independent Trustees and as such (i) acts as a liaison between the Independent Trustees and management with respect to matters important to the Independent Trustees and (ii) with management prepares agendas for Board meetings.
Fidelity® funds are overseen by different Boards of Trustees. The fund's Board oversees Fidelity's high income and certain equity funds, and other Boards oversee Fidelity's investment-grade bond, money market, asset allocation, and other equity funds. The asset allocation funds may invest in Fidelity® funds overseen by the fund's Board. The use of separate Boards, each with its own committee structure, allows the Trustees of each group of Fidelity® funds to focus on the unique issues of the funds they oversee, including common research, investment, and operational issues. On occasion, the separate Boards establish joint committees to address issues of overlapping consequences for the Fidelity® funds overseen by each Board.
The Trustees operate using a system of committees to facilitate the timely and efficient consideration of all matters of importance to the Trustees, the fund, and fund shareholders and to facilitate compliance with legal and regulatory requirements and oversight of the fund's activities and associated risks. The Board, acting through its committees, has charged FMR and its affiliates with (i) identifying events or circumstances the occurrence of which could have demonstrably adverse effects on the fund's business and/or reputation; (ii) implementing processes and controls to lessen the possibility that such events or circumstances occur or to mitigate the effects of such events or circumstances if they do occur; and (iii) creating and maintaining a system designed to evaluate continuously business and market conditions in order to facilitate the identification and implementation processes described in (i) and (ii) above. Because the day-to-day operations and activities of the fund are carried out by or through FMR, its affiliates, and other service providers, the fund's exposure to risks is mitigated but not eliminated by the processes overseen by the Trustees. While each of the Board's committees has responsibility for overseeing different aspects of the fund's activities, oversight is exercised primarily through the Operations, Audit, and Compliance Committees. Appropriate personnel, including but not limited to the fund's Chief Compliance Officer (CCO), FMR's internal auditor, the independent accountants, the fund's Treasurer and portfolio management personnel, make periodic reports to the Board's committees, as appropriate, including an annual review of Fidelity's risk management program for the Fidelity® funds. The responsibilities of each standing committee, including their oversight responsibilities, are described further under "Standing Committees of the Trustees."
Interested Trustees*:
Correspondence intended for a Trustee who is an interested person may be sent to Fidelity Investments, 245 Summer Street, Boston, Massachusetts 02210.
Name, Year of Birth; Principal Occupations and Other Relevant Experience+
Jonathan Chiel (1957)
Year of Election or Appointment: 2016
Trustee
Mr. Chiel also serves as Trustee of other Fidelity® funds. Mr. Chiel is Executive Vice President and General Counsel for FMR LLC (diversified financial services company, 2012-present). Previously, Mr. Chiel served as general counsel (2004-2012) and senior vice president and deputy general counsel (2000-2004) for John Hancock Financial Services; a partner with Choate, Hall & Stewart (1996-2000) (law firm); and an Assistant United States Attorney for the United States Attorney’s Office of the District of Massachusetts (1986-95), including Chief of the Criminal Division (1993-1995). Mr. Chiel is a director on the boards of the Boston Bar Foundation and the Maimonides School.
James C. Curvey (1935)
Year of Election or Appointment: 2007
Trustee
Chairman of the Board of Trustees
Mr. Curvey also serves as Trustee of other Fidelity® funds. Mr. Curvey is Vice Chairman (2007-present) and Director of FMR LLC (diversified financial services company). In addition, Mr. Curvey is an Overseer Emeritus for the Boston Symphony Orchestra, a Director of Artis-Naples, and a Trustee of Brewster Academy in Wolfeboro, New Hampshire. Previously, Mr. Curvey served as a Director of Fidelity Research & Analysis Co. (investment adviser firm, 2009-2018), Director of Fidelity Investments Money Management, Inc. (investment adviser firm, 2009-2014) and a Director of FMR and FMR Co., Inc. (investment adviser firms, 2007-2014).
* Determined to be an “Interested Trustee” by virtue of, among other things, his or her affiliation with the trust or various entities under common control with FMR.
+ The information includes the Trustee's principal occupation during the last five years and other information relating to the experience, attributes, and skills relevant to the Trustee's qualifications to serve as a Trustee, which led to the conclusion that the Trustee should serve as a Trustee for the fund.
Independent Trustees:
Correspondence intended for an Independent Trustee may be sent to Fidelity Investments, P.O. Box 55235, Boston, Massachusetts 02205-5235.
Name, Year of Birth; Principal Occupations and Other Relevant Experience+
Dennis J. Dirks (1948)
Year of Election or Appointment: 2005
Trustee
Mr. Dirks also serves as Trustee of other Fidelity® funds. Prior to his retirement in May 2003, Mr. Dirks was Chief Operating Officer and a member of the Board of The Depository Trust & Clearing Corporation (DTCC). He also served as President, Chief Operating Officer, and Board member of The Depository Trust Company (DTC) and President and Board member of the National Securities Clearing Corporation (NSCC). In addition, Mr. Dirks served as Chief Executive Officer and Board member of the Government Securities Clearing Corporation, Chief Executive Officer and Board member of the Mortgage-Backed Securities Clearing Corporation, as a Trustee and a member of the Finance Committee of Manhattan College (2005-2008), as a Trustee and a member of the Finance Committee of AHRC of Nassau County (2006-2008), as a member of the Independent Directors Council (IDC) Governing Council (2010-2015), and as a member of the Board of Directors for The Brookville Center for Children’s Services, Inc. (2009-2017). Mr. Dirks is a member of the Finance Committee (2016-present) and Board of Directors (2017-present) and is Treasurer (2018-present) of the Asolo Repertory Theatre.
Donald F. Donahue (1950)
Year of Election or Appointment: 2018
Trustee
Mr. Donahue also serves as a Trustee of other Fidelity® funds. Mr. Donahue is President and Chief Executive Officer of Miranda Partners, LLC (risk consulting for the financial services industry, 2012-present). Previously, Mr. Donahue served as a Member of the Advisory Board of certain Fidelity® funds (2015-2018) and Chief Executive Officer (2006-2012), Chief Operating Officer (2003-2006), and Managing Director, Customer Marketing and Development (1999-2003) of The Depository Trust & Clearing Corporation (financial markets infrastructure). Mr. Donahue serves as a Member (2007-present) and Co-Chairman (2016-present) of the Board of Directors of United Way of New York, Member of the Board of Directors of NYC Leadership Academy (2012-present) and Member of the Board of Advisors of Ripple Labs, Inc. (financial services, 2015-present). He also served as Chairman (2010-2012) and Member of the Board of Directors (2012-2013) of Omgeo, LLC (financial services), Treasurer of United Way of New York (2012-2016), and Member of the Board of Directors of XBRL US (financial services non-profit, 2009-2012) and the International Securities Services Association (2009-2012).
Alan J. Lacy (1953)
Year of Election or Appointment: 2008
Trustee
Mr. Lacy also serves as Trustee of other Fidelity® funds. Mr. Lacy serves as a Director of Bristol-Myers Squibb Company (global pharmaceuticals, 2008-present). He is a Trustee of the California Chapter of The Nature Conservancy (2015-present) and a Director of the Center for Advanced Study in the Behavioral Sciences at Stanford University (2015-present). In addition, Mr. Lacy served as Senior Adviser (2007-2014) of Oak Hill Capital Partners, L.P. (private equity) and also served as Chief Executive Officer (2005) and Vice Chairman (2005-2006) of Sears Holdings Corporation (retail) and Chief Executive Officer and Chairman of the Board of Sears, Roebuck and Co. (retail, 2000-2005). Previously, Mr. Lacy served as Chairman (2014-2017) and a member (2010-2017) of the Board of Directors of Dave & Buster’s Entertainment, Inc. (restaurant and entertainment complexes), as Chairman (2008-2011) and a member (2006-2015) of the Board of Trustees of the National Parks Conservation Association, and as a member of the Board of Directors for The Hillman Companies, Inc. (hardware wholesalers, 2010-2014), Earth Fare, Inc. (retail grocery, 2010-2014), and The Western Union Company (global money transfer, 2006-2011).
Ned C. Lautenbach (1944)
Year of Election or Appointment: 2000
Trustee
Chairman of the Independent Trustees
Mr. Lautenbach also serves as Trustee of other Fidelity® funds. Mr. Lautenbach currently serves as Chair (2018-present) and Member (2013-present) of the Board of Governors, State University System of Florida and is a member of the Council on Foreign Relations (1994-present). He is also a member and has most recently served as Chairman of the Board of Directors of Artis-Naples (2012-present). Previously, Mr. Lautenbach served as a member and then Lead Director of the Board of Directors of Eaton Corporation (diversified industrial, 1997-2016). He was also a Partner and Advisory Partner at Clayton, Dubilier & Rice, LLC (private equity investment, 1998-2010), as well as a Director of Sony Corporation (2006-2007). In addition, Mr. Lautenbach also had a 30-year career with IBM (technology company) during which time he served as Senior Vice President and a member of the Corporate Executive Committee (1968-1998).
Joseph Mauriello (1944)
Year of Election or Appointment: 2008
Trustee
Mr. Mauriello also serves as Trustee of other Fidelity® funds. Prior to his retirement in January 2006, Mr. Mauriello served in numerous senior management positions including Deputy Chairman and Chief Operating Officer (2004-2005), and Vice Chairman of Financial Services (2002-2004) of KPMG LLP US (professional services, 1965-2005). Mr. Mauriello currently serves as a member of the Independent Directors Council (IDC) Governing Council (2015-present). Previously, Mr. Mauriello served as a member of the Board of Directors of XL Group plc. (global insurance and re-insurance, 2006-2018).
Cornelia M. Small (1944)
Year of Election or Appointment: 2005
Trustee
Ms. Small also serves as Trustee of other Fidelity® funds. Ms. Small is a member of the Board of Directors (2009-present) and Chair of the Investment Committee (2010-present) of the Teagle Foundation. Ms. Small also serves on the Investment Committee of the Berkshire Taconic Community Foundation (2008-present). Previously, Ms. Small served as Chairperson (2002-2008) and a member of the Investment Committee and Chairperson (2008-2012) and a member of the Board of Trustees of Smith College. In addition, Ms. Small served as Chief Investment Officer, Director of Global Equity Investments, and a member of the Board of Directors of Scudder, Stevens & Clark and Scudder Kemper Investments.
Garnett A. Smith (1947)
Year of Election or Appointment: 2018
Trustee
Mr. Smith also serves as Trustee of other Fidelity® funds. Prior to Mr. Smith's retirement, he served as Chairman and Chief Executive Officer of Inbrand Corp. (manufacturer of personal absorbent products, 1990-1997). He also served as President (1986-1990) of Inbrand Corp. Prior to his employment with Inbrand Corp., he was employed by a retail fabric chain and North Carolina National Bank. In addition, Mr. Smith served as a Member of the Advisory Board of certain Fidelity® funds (2012-2013) and as a board member of the Jackson Hole Land Trust (2009-2012).
David M. Thomas (1949)
Year of Election or Appointment: 2008
Trustee
Mr. Thomas also serves as Trustee of other Fidelity® funds. Mr. Thomas serves as Non-Executive Chairman of the Board of Directors of Fortune Brands Home and Security (home and security products, 2011-present) and as a member of the Board of Directors (2004-present) and Presiding Director (2013-present) of Interpublic Group of Companies, Inc. (marketing communication). Previously, Mr. Thomas served as Executive Chairman (2005-2006) and Chairman and Chief Executive Officer (2000-2005) of IMS Health, Inc. (pharmaceutical and healthcare information solutions), a Director of Fortune Brands, Inc. (consumer products, 2000-2011), and a member of the Board of Trustees of the University of Florida (2013-2018).
+ The information includes the Trustee's principal occupation during the last five years and other information relating to the experience, attributes, and skills relevant to the Trustee's qualifications to serve as a Trustee, which led to the conclusion that the Trustee should serve as a Trustee for the fund.
Advisory Board Members and Officers:
Correspondence intended for a Member of the Advisory Board (if any) may be sent to Fidelity Investments, P.O. Box 55235, Boston, Massachusetts 02205-5235. Correspondence intended for an officer or Peter S. Lynch may be sent to Fidelity Investments, 245 Summer Street, Boston, Massachusetts 02210. Officers appear below in alphabetical order.
Name, Year of Birth; Principal Occupation
Vicki L. Fuller (1957)
Year of Election or Appointment: 2018
Member of the Advisory Board
Ms. Fuller also serves as Member of the Advisory Board of other Fidelity® funds. Ms. Fuller serves as a member of the Board of Directors, Audit Committee, and Nominating and Governance Committee of The Williams Companies, Inc. (natural gas infrastructure, 2018-present). Previously, Ms. Fuller served as the Chief Investment Officer of the New York State Common Retirement Fund (2012-2018) and held a variety of positions at AllianceBernstein L.P. (global asset management, 1985-2012), including Managing Director (2006-2012) and Senior Vice President and Senior Portfolio Manager (2001-2006).
Peter S. Lynch (1944)
Year of Election or Appointment: 2003
Member of the Advisory Board
Mr. Lynch also serves as Member of the Advisory Board of other Fidelity® funds. Mr. Lynch is Vice Chairman and a Director of FMR (investment adviser firm) and FMR Co., Inc. (investment adviser firm). In addition, Mr. Lynch serves as a Trustee of Boston College and as the Chairman of the Inner-City Scholarship Fund. Previously, Mr. Lynch served on the Special Olympics International Board of Directors (1997-2006).
Michael E. Wiley (1950)
Year of Election or Appointment: 2018
Member of the Advisory Board
Mr. Wiley also serves as Trustee or Member of the Advisory Board of other Fidelity® funds. Mr. Wiley serves as a Director of High Point Resources (exploration and production, 2005-present). Previously, Mr. Wiley served as a Director of Andeavor Corporation (independent oil refiner and marketer, 2005-2018), a Director of Andeavor Logistics LP (natural resources logistics, 2015-2018), a Director of Post Oak Bank (privately-held bank, 2004-2018), a Director of Asia Pacific Exploration Consolidated (international oil and gas exploration and production, 2008-2013), a member of the Board of Trustees of the University of Tulsa (2000-2006; 2007-2010), a Senior Energy Advisor of Katzenbach Partners, LLC (consulting, 2006-2007), an Advisory Director of Riverstone Holdings (private investment), a Director of Spinnaker Exploration Company (exploration and production, 2001-2005) and Chairman, President, and CEO of Baker Hughes, Inc. (oilfield services, 2000-2004).
Elizabeth Paige Baumann (1968)
Year of Election or Appointment: 2017
Anti-Money Laundering (AML) Officer
Ms. Baumann also serves as AML Officer of other funds. She is Chief AML Officer (2012-present) and Senior Vice President (2014-present) of FMR LLC (diversified financial services company) and is an employee of Fidelity Investments. Previously, Ms. Baumann served as AML Officer of the funds (2012-2016), and Vice President (2007-2014) and Deputy Anti-Money Laundering Officer (2007-2012) of FMR LLC.
Craig S. Brown (1977)
Year of Election or Appointment: 2019
Assistant Treasurer
Mr. Brown also serves as Assistant Treasurer of other funds. Mr. Brown is an employee of Fidelity Investments (2013-present).
John J. Burke III (1964)
Year of Election or Appointment: 2018
Chief Financial Officer
Mr. Burke also serves as Chief Financial Officer of other funds. Mr. Burke serves as Head of Investment Operations for Fidelity Fund and Investment Operations (2018-present) and is an employee of Fidelity Investments (1998-present). Previously Mr. Burke served as head of Asset Management Investment Operations (2012-2018).
William C. Coffey (1969)
Year of Election or Appointment: 2019
Assistant Secretary
Mr. Coffey also serves as Assistant Secretary of other funds. He is Senior Vice President and Deputy General Counsel of FMR LLC (diversified financial services company, 2010-present), and is an employee of Fidelity Investments. Previously, Mr. Coffey served as Secretary and CLO of certain funds (2018-2019); CLO, Secretary, and Senior Vice President of Fidelity Management & Research Company and FMR Co., Inc. (investment adviser firms, 2018-2019); Secretary of Fidelity SelectCo, LLC and Fidelity Investments Money Management, Inc. (investment adviser firms, 2018-2019); CLO of Fidelity Management & Research (Hong Kong) Limited, FMR Investment Management (UK) Limited, and Fidelity Management & Research (Japan) Limited (investment adviser firms, 2018-2019); and Assistant Secretary of certain funds (2009-2018).
Timothy M. Cohen (1969)
Year of Election or Appointment: 2018
Vice President
Mr. Cohen also serves as Vice President of other funds. Mr. Cohen serves as Executive Vice President of Fidelity SelectCo, LLC (2019-present), Co-Head of Equity (2018-present), a Director of Fidelity Management & Research (Japan) Limited (investment adviser firm, 2016-present), and is an employee of Fidelity Investments. Previously, Mr. Cohen served as Head of Global Equity Research (2016-2018), Chief Investment Officer - Equity and a Director of Fidelity Management & Research (U.K.) Inc. (investment adviser firm, 2013-2015) and as a Director of Fidelity Management & Research (Hong Kong) Limited (investment adviser firm, 2017).
Jonathan Davis (1968)
Year of Election or Appointment: 2010
Assistant Treasurer
Mr. Davis also serves as Assistant Treasurer of other funds. Mr. Davis serves as Assistant Treasurer of FMR Capital, Inc. (2017-present) and is an employee of Fidelity Investments. Previously, Mr. Davis served as Vice President and Associate General Counsel of FMR LLC (diversified financial services company, 2003-2010).
Adrien E. Deberghes (1967)
Year of Election or Appointment: 2016
Assistant Treasurer
Mr. Deberghes also serves as an officer of other funds. He serves as Assistant Treasurer of FMR Capital, Inc. (2017-present), Executive Vice President of Fidelity Investments Money Management, Inc. (FIMM) (investment adviser firm, 2016-present), and is an employee of Fidelity Investments (2008-present). Previously, Mr. Deberghes served as President and Treasurer of certain Fidelity® funds (2013-2018). Prior to joining Fidelity Investments, Mr. Deberghes was Senior Vice President of Mutual Fund Administration at State Street Corporation (2007-2008), Senior Director of Mutual Fund Administration at Investors Bank & Trust (2005-2007), and Director of Finance for Dunkin' Brands (2000-2005). Previously, Mr. Deberghes served in other fund officer roles.
Laura M. Del Prato (1964)
Year of Election or Appointment: 2018
Assistant Treasurer
Ms. Del Prato also serves as an officer of other funds. Ms. Del Prato is an employee of Fidelity Investments (2017-present). Prior to joining Fidelity Investments, Ms. Del Prato served as a Managing Director and Treasurer of the JPMorgan Mutual Funds (2014-2017). Prior to JPMorgan, Ms. Del Prato served as a partner at Cohen Fund Audit Services (accounting firm, 2012-2013) and KPMG LLP (accounting firm, 2004-2012).
Colm A. Hogan (1973)
Year of Election or Appointment: 2016
Deputy Treasurer
Mr. Hogan also serves as an officer of other funds. Mr. Hogan serves as Assistant Treasurer of FMR Capital, Inc. (2017-present) and is an employee of Fidelity Investments (2005-present). Previously, Mr. Hogan served as Assistant Treasurer of certain Fidelity® funds (2016-2018).
Pamela R. Holding (1964)
Year of Election or Appointment: 2018
Vice President
Ms. Holding also serves as Vice President of other funds. Ms. Holding serves as Executive Vice President of Fidelity SelectCo, LLC (2019-present), Co-Head of Equity (2018-present) and is an employee of Fidelity Investments (2013-present). Previously, Ms. Holding served as Chief Investment Officer of Fidelity Institutional Asset Management (2013-2018).
Cynthia Lo Bessette (1969)
Year of Election or Appointment: 2019
Secretary and Chief Legal Officer (CLO)
Ms. Lo Bessette also serves as Secretary and CLO of other funds. Ms. Lo Bessette serves as CLO, Secretary, and Senior Vice President of Fidelity Management & Research Company and FMR Co., Inc. (investment adviser firms, 2019-present); Secretary of Fidelity SelectCo, LLC and Fidelity Investments Money Management, Inc. (investment adviser firms, 2019-present); and CLO of Fidelity Management & Research (Hong Kong) Limited, FMR Investment Management (UK) Limited, and Fidelity Management & Research (Japan) Limited (investment adviser firms, 2019-present). She is a Senior Vice President and Deputy General Counsel of FMR LLC (diversified financial services company, 2019-present), and is an employee of Fidelity Investments. Previously, Ms. Lo Bessette served as Executive Vice President, General Counsel (2016-2019) and Senior Vice President, Deputy General Counsel (2015-2016) of OppenheimerFunds (investment management company) and Deputy Chief Legal Officer (2013-2015) of Jennison Associates LLC (investment adviser firm).
Chris Maher (1972)
Year of Election or Appointment: 2013
Assistant Treasurer
Mr. Maher serves as Assistant Treasurer of other funds. Mr. Maher is Vice President of Valuation Oversight, serves as Assistant Treasurer of FMR Capital, Inc. (2017-present), and is an employee of Fidelity Investments. Previously, Mr. Maher served as Vice President of Asset Management Compliance (2013), Vice President of the Program Management Group of FMR (investment adviser firm, 2010-2013), and Vice President of Valuation Oversight (2008-2010).
Kenneth B. Robins (1969)
Year of Election or Appointment: 2016
Chief Compliance Officer
Mr. Robins also serves as an officer of other funds. Mr. Robins serves as Compliance Officer of Fidelity Management & Research Company and FMR Co., Inc. (investment adviser firms, 2016-present) and is an employee of Fidelity Investments (2004-present). Previously, Mr. Robins served as Executive Vice President of Fidelity Investments Money Management, Inc. (investment adviser firm, 2013-2016) and served in other fund officer roles.
Stacie M. Smith (1974)
Year of Election or Appointment: 2016
President and Treasurer
Ms. Smith also serves as an officer of other funds. Ms. Smith serves as Assistant Treasurer of FMR Capital, Inc. (2017-present), is an employee of Fidelity Investments (2009-present), and has served in other fund officer roles. Prior to joining Fidelity Investments, Ms. Smith served as Senior Audit Manager of Ernst & Young LLP (accounting firm, 1996-2009). Previously, Ms. Smith served as Assistant Treasurer (2013-2018) and Deputy Treasurer (2013-2016) of certain Fidelity® funds.
Marc L. Spector (1972)
Year of Election or Appointment: 2016
Assistant Treasurer
Mr. Spector also serves as an officer of other funds. Mr. Spector serves as Assistant Treasurer of FMR Capital, Inc. (2017-present) and is an employee of Fidelity Investments (2016-present). Prior to joining Fidelity Investments, Mr. Spector served as Director at the Siegfried Group (accounting firm, 2013-2016), and prior to Siegfried Group as audit senior manager at Deloitte & Touche (accounting firm, 2005-2013).
Jim Wegmann (1979)
Year of Election or Appointment: 2019
Assistant Treasurer
Mr. Wegmann also serves as Assistant Treasurer of other funds. Mr. Wegmann is an employee of Fidelity Investments (2011-present).
Shareholder Expense Example
As a shareholder of the Fund, you incur two types of costs: (1) transaction costs and (2) ongoing costs, including other Fund expenses. This Example is intended to help you understand your ongoing costs (in dollars) of investing in the Fund and to compare these costs with the ongoing costs of investing in other mutual funds.
The Example is based on an investment of $1,000 invested at the beginning of the period and held for the entire period (May 1, 2019 to October 31, 2019).
Actual Expenses
The first line of the accompanying table provides information about actual account values and actual expenses. You may use the information in this line, together with the amount you invested, to estimate the expenses that you paid over the period. Simply divide your account value by $1,000.00 (for example, an $8,600 account value divided by $1,000.00 = 8.6), then multiply the result by the number in the first line under the heading entitled "Expenses Paid During Period" to estimate the expenses you paid on your account during this period. In addition, the Fund, as a shareholder in the underlying Fidelity Central Funds, will indirectly bear its pro-rata share of the fees and expenses incurred by the underlying Fidelity Central Funds. These fees and expenses are not included in the Fund's annualized expense ratio used to calculate the expense estimate in the table below.
Hypothetical Example for Comparison Purposes
The second line of the accompanying table provides information about hypothetical account values and hypothetical expenses based on the Fund's actual expense ratio and an assumed rate of return of 5% per year before expenses, which is not the Fund's actual return. The hypothetical account values and expenses may not be used to estimate the actual ending account balance or expenses you paid for the period. You may use this information to compare the ongoing costs of investing in the Fund and other funds. To do so, compare this 5% hypothetical example with the 5% hypothetical examples that appear in the shareholder reports of the other funds. In addition, the Fund, as a shareholder in the underlying Fidelity Central Funds, will indirectly bear its pro-rata share of the fees and expenses incurred by the underlying Fidelity Central Funds. These fees and expenses are not included in the Fund's annualized expense ratio used to calculate the expense estimate in the table below.
Please note that the expenses shown in the table are meant to highlight your ongoing costs only and do not reflect any transaction costs. Therefore, the second line of the table is useful in comparing ongoing costs only, and will not help you determine the relative total costs of owning different funds.
| | Annualized Expense Ratio-A | Beginning
Account Value
May 1, 2019 | Ending
Account Value
October 31, 2019 | Expenses Paid
During Period-B
May 1, 2019
to October 31, 2019 |
| Actual | - %-C | $1,000.00 | $1,015.90 | $--D |
| Hypothetical-E | | $1,000.00 | $1,025.21 | $--D |
A Annualized expense ratio reflects expenses net of applicable fee waivers.
B Expenses are equal to the Fund's annualized expense ratio, multiplied by the average account value over the period, multiplied by 184/365 (to reflect the one-half year period).
C Amount represents less than .005%.
D Amount represents less than $.005.
E 5% return per year before expenses
Distributions (Unaudited)
The fund designates 81% of the dividend distributed during the fiscal year as amounts which may be taken into account as a dividend for the purposes of the maximum rate under section 1(h)(11) of the Internal Revenue Code.
The fund will notify shareholders in January 2020 of amounts for use in preparing 2019 income tax returns.
SAD-ANN-1219
1.9883882.102
Fidelity® Series Overseas Fund
Annual Report
October 31, 2019
See the inside front cover for important information about access to your fund’s shareholder reports.
Beginning on January 1, 2021, as permitted by regulations adopted by the Securities and Exchange Commission, paper copies of a fund’s shareholder reports will no longer be sent by mail, unless you specifically request paper copies of the reports from the fund or from your financial intermediary, such as a financial advisor, broker-dealer or bank. Instead, the reports will be made available on a website, and you will be notified by mail each time a report is posted and provided with a website link to access the report.
If you already elected to receive shareholder reports electronically, you will not be affected by this change and you need not take any action. You may elect to receive shareholder reports and other communications from a fund electronically, by contacting your financial intermediary. For Fidelity customers, visit Fidelity's web site or call Fidelity using the contact information listed below.
You may elect to receive all future reports in paper free of charge. If you wish to continue receiving paper copies of your shareholder reports, you may contact your financial intermediary or, if you are a Fidelity customer, visit Fidelity’s website, or call Fidelity at the applicable toll-free number listed below. Your election to receive reports in paper will apply to all funds held with the fund complex/your financial intermediary.
| Account Type | Website | Phone Number |
| Brokerage, Mutual Fund, or Annuity Contracts: | fidelity.com/mailpreferences | 1-800-343-3548 |
| Employer Provided Retirement Accounts: | netbenefits.fidelity.com/preferences (choose 'no' under Required Disclosures to continue to print) | 1-800-343-0860 |
| Advisor Sold Accounts Serviced Through Your Financial Intermediary: | Contact Your Financial Intermediary | Your Financial Intermediary's phone number |
| Advisor Sold Accounts Serviced by Fidelity: | institutional.fidelity.com | 1-877-208-0098 |
Contents
To view a fund's proxy voting guidelines and proxy voting record for the 12-month period ended June 30, visit http://www.fidelity.com/proxyvotingresults or visit the Securities and Exchange Commission's (SEC) web site at http://www.sec.gov.
You may also call 1-800-544-8544 to request a free copy of the proxy voting guidelines.
Standard & Poor's, S&P and S&P 500 are registered service marks of The McGraw-Hill Companies, Inc. and have been licensed for use by Fidelity Distributors Corporation.
Other third-party marks appearing herein are the property of their respective owners.
All other marks appearing herein are registered or unregistered trademarks or service marks of FMR LLC or an affiliated company. © 2019 FMR LLC. All rights reserved.
This report and the financial statements contained herein are submitted for the general information of the shareholders of the Fund. This report is not authorized for distribution to prospective investors in the Fund unless preceded or accompanied by an effective prospectus.
A fund files its complete schedule of portfolio holdings with the SEC for the first and third quarters of each fiscal year on Form N-PORT. Forms N-PORT are available on the SEC’s web site at http://www.sec.gov. A fund's Forms N-PORT may be reviewed and copied at the SEC’s Public Reference Room in Washington, DC. Information regarding the operation of the SEC's Public Reference Room may be obtained by calling 1-800-SEC-0330.
For a complete list of a fund's portfolio holdings, view the most recent holdings listing, semiannual report, or annual report on Fidelity's web site at http://www.fidelity.com, http://www.institutional.fidelity.com, or http://www.401k.com, as applicable.
NOT FDIC INSURED •MAY LOSE VALUE •NO BANK GUARANTEE
Neither the Fund nor Fidelity Distributors Corporation is a bank.
Investment Summary (Unaudited)
Geographic Diversification (% of fund's net assets)
| As of October 31, 2019 |
| | Japan | 14.3% |
| | United Kingdom | 13.3% |
| | France | 10.5% |
| | United States of America* | 9.6% |
| | Netherlands | 9.0% |
| | Switzerland | 8.7% |
| | Germany | 8.5% |
| | Sweden | 4.3% |
| | Ireland | 2.8% |
| | Other | 19.0% |
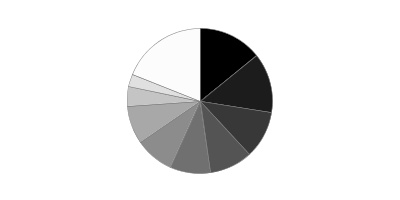
* Includes Short-Term investments and Net Other Assets (Liabilities).
Percentages are based on country or territory of incorporation and are adjusted for the effect of futures contracts, if applicable.
Asset Allocation as of October 31, 2019
| | % of fund's net assets |
| Stocks and Investment Companies | 97.2 |
| Short-Term Investments and Net Other Assets (Liabilities) | 2.8 |
Top Ten Stocks as of October 31, 2019
| | % of fund's net assets |
| Roche Holding AG (participation certificate) (Switzerland, Pharmaceuticals) | 2.7 |
| Nestle SA (Reg. S) (Switzerland, Food Products) | 2.2 |
| Unilever NV (Netherlands, Personal Products) | 2.2 |
| LVMH Moet Hennessy Louis Vuitton SE (France, Textiles, Apparel & Luxury Goods) | 2.1 |
| AIA Group Ltd. (Hong Kong, Insurance) | 2.1 |
| SAP SE (Germany, Software) | 2.0 |
| Diageo PLC (United Kingdom, Beverages) | 2.0 |
| Hoya Corp. (Japan, Health Care Equipment & Supplies) | 1.8 |
| ASML Holding NV (Netherlands) (Netherlands, Semiconductors & Semiconductor Equipment) | 1.7 |
| Total SA (France, Oil, Gas & Consumable Fuels) | 1.6 |
| | 20.4 |
Top Market Sectors as of October 31, 2019
| | % of fund's net assets |
| Financials | 20.2 |
| Industrials | 19.3 |
| Consumer Staples | 14.4 |
| Information Technology | 13.1 |
| Health Care | 12.2 |
| Consumer Discretionary | 8.8 |
| Materials | 2.8 |
| Energy | 2.6 |
| Communication Services | 1.9 |
| Real Estate | 1.4 |
Schedule of Investments October 31, 2019
Showing Percentage of Net Assets
| Common Stocks - 96.4% | | | |
| | | Shares | Value |
| Austria - 0.6% | | | |
| Erste Group Bank AG | | 1,095,207 | $38,684,410 |
| Bailiwick of Jersey - 1.4% | | | |
| Experian PLC | | 2,223,211 | 69,922,427 |
| Sanne Group PLC | | 2,529,771 | 17,302,237 |
|
| TOTAL BAILIWICK OF JERSEY | | | 87,224,664 |
|
| Belgium - 1.4% | | | |
| KBC Groep NV | | 1,255,165 | 88,024,802 |
| Bermuda - 2.6% | | | |
| Credicorp Ltd. (United States) | | 180,075 | 38,543,253 |
| Hiscox Ltd. | | 2,576,640 | 49,697,618 |
| IHS Markit Ltd. (a) | | 1,030,500 | 72,155,610 |
|
| TOTAL BERMUDA | | | 160,396,481 |
|
| Brazil - 0.7% | | | |
| IRB Brasil Resseguros SA | | 4,490,700 | 42,314,812 |
| Canada - 1.2% | | | |
| Constellation Software, Inc. | | 74,570 | 73,648,845 |
| Denmark - 1.1% | | | |
| DSV A/S | | 719,731 | 69,837,157 |
| France - 10.5% | | | |
| ALTEN | | 372,856 | 40,940,068 |
| Amundi SA (b) | | 470,791 | 33,604,685 |
| Capgemini SA | | 616,262 | 69,384,652 |
| Danone SA | | 1,064,639 | 88,196,083 |
| Edenred SA | | 885,829 | 46,631,952 |
| Elior SA (b) | | 877,043 | 11,336,945 |
| Essilor International SA | | 300,439 | 45,838,892 |
| LVMH Moet Hennessy Louis Vuitton SE | | 311,339 | 132,959,197 |
| SR Teleperformance SA | | 368,528 | 83,519,118 |
| Total SA | | 1,930,316 | 102,052,420 |
|
| TOTAL FRANCE | | | 654,464,012 |
|
| Germany - 8.2% | | | |
| adidas AG | | 280,232 | 86,527,461 |
| Bayer AG | | 609,301 | 47,267,255 |
| Deutsche Borse AG | | 427,802 | 66,249,288 |
| Deutsche Post AG | | 1,424,539 | 50,444,030 |
| Hannover Reuck SE | | 389,416 | 68,969,328 |
| SAP SE | | 947,376 | 125,528,725 |
| Vonovia SE | | 1,189,435 | 63,290,982 |
|
| TOTAL GERMANY | | | 508,277,069 |
|
| Hong Kong - 2.1% | | | |
| AIA Group Ltd. | | 13,017,588 | 129,632,068 |
| Dah Sing Banking Group Ltd. | | 14,800 | 19,133 |
|
| TOTAL HONG KONG | | | 129,651,201 |
|
| India - 0.5% | | | |
| HDFC Bank Ltd. sponsored ADR | | 475,074 | 29,022,271 |
| Indonesia - 0.4% | | | |
| PT Bank Rakyat Indonesia Tbk | | 91,779,451 | 27,500,361 |
| Ireland - 2.8% | | | |
| DCC PLC (United Kingdom) | | 714,914 | 67,009,980 |
| Kerry Group PLC Class A | | 586,063 | 70,854,150 |
| Kingspan Group PLC (Ireland) | | 704,916 | 36,526,518 |
|
| TOTAL IRELAND | | | 174,390,648 |
|
| Israel - 0.3% | | | |
| NICE Systems Ltd. sponsored ADR (a) | | 131,573 | 20,760,904 |
| Italy - 1.7% | | | |
| FinecoBank SpA | | 3,980,785 | 44,841,672 |
| Recordati SpA | | 1,457,139 | 61,219,293 |
|
| TOTAL ITALY | | | 106,060,965 |
|
| Japan - 14.3% | | | |
| A/S One Corp. | | 92,300 | 7,717,968 |
| Hoya Corp. | | 1,278,507 | 112,990,907 |
| Kao Corp. | | 849,768 | 68,320,232 |
| Keyence Corp. | | 144,197 | 91,175,246 |
| Nitori Holdings Co. Ltd. | | 365,334 | 55,607,901 |
| Olympus Corp. | | 4,207,092 | 57,243,341 |
| Oracle Corp. Japan | | 290,507 | 25,534,454 |
| ORIX Corp. | | 2,401,736 | 37,743,028 |
| Otsuka Corp. | | 1,056,106 | 42,580,040 |
| Persol Holdings Co., Ltd. | | 1,616,453 | 31,048,864 |
| Recruit Holdings Co. Ltd. | | 1,852,846 | 61,577,565 |
| Relo Group, Inc. | | 1,000,528 | 24,486,356 |
| Shiseido Co. Ltd. | | 760,136 | 62,671,655 |
| SMC Corp. | | 164,421 | 71,036,648 |
| Suzuki Motor Corp. | | 925,445 | 43,694,067 |
| Tsuruha Holdings, Inc. | | 472,632 | 53,165,693 |
| Welcia Holdings Co. Ltd. | | 780,896 | 44,870,507 |
|
| TOTAL JAPAN | | | 891,464,472 |
|
| Korea (South) - 0.3% | | | |
| LG Chemical Ltd. | | 73,046 | 19,193,230 |
| Luxembourg - 0.4% | | | |
| Eurofins Scientific SA (c) | | 43,565 | 22,068,690 |
| Mexico - 0.2% | | | |
| Grupo Financiero Banorte S.A.B. de CV Series O | | 2,696,972 | 14,721,080 |
| Netherlands - 9.0% | | | |
| ASML Holding NV (Netherlands) | | 397,328 | 104,145,473 |
| Heineken NV (Bearer) | | 650,705 | 66,375,384 |
| IMCD Group BV | | 867,951 | 67,665,000 |
| Koninklijke Philips Electronics NV | | 1,971,215 | 86,485,320 |
| Prosus NV (a) | | 147,305 | 10,158,005 |
| QIAGEN NV (Germany) (a) | | 845,720 | 25,382,360 |
| Unilever NV | | 2,352,290 | 138,914,804 |
| Wolters Kluwer NV | | 824,351 | 60,698,700 |
|
| TOTAL NETHERLANDS | | | 559,825,046 |
|
| Norway - 1.9% | | | |
| Adevinta ASA: | | | |
| rights 11/12/19 (a) | | 1,264,731 | 193,365 |
| Class B | | 1,981,685 | 22,626,526 |
| Equinor ASA | | 3,250,115 | 60,116,958 |
| Schibsted ASA (A Shares) | | 1,285,654 | 37,746,946 |
|
| TOTAL NORWAY | | | 120,683,795 |
|
| South Africa - 0.4% | | | |
| Naspers Ltd. Class N | | 169,505 | 23,986,418 |
| Spain - 0.9% | | | |
| Amadeus IT Holding SA Class A | | 735,996 | 54,455,610 |
| Sweden - 4.3% | | | |
| AddTech AB (B Shares) | | 912,272 | 25,367,921 |
| ASSA ABLOY AB (B Shares) | | 2,448,848 | 58,156,171 |
| EQT AB (a) | | 2,495,400 | 23,941,698 |
| Hexagon AB (B Shares) | | 924,288 | 47,182,654 |
| Indutrade AB | | 1,832,895 | 56,416,044 |
| Svenska Handelsbanken AB (A Shares) | | 5,708,989 | 57,294,341 |
|
| TOTAL SWEDEN | | | 268,358,829 |
|
| Switzerland - 8.7% | | | |
| Alcon, Inc. (a) | | 974,800 | 57,776,396 |
| Julius Baer Group Ltd. | | 1,203,112 | 53,278,168 |
| Nestle SA (Reg. S) | | 1,306,811 | 139,804,397 |
| Roche Holding AG (participation certificate) | | 551,952 | 166,113,254 |
| Sika AG | | 324,207 | 55,705,105 |
| Swiss Re Ltd. | | 645,561 | 67,599,038 |
|
| TOTAL SWITZERLAND | | | 540,276,358 |
|
| Taiwan - 0.9% | | | |
| Taiwan Semiconductor Manufacturing Co. Ltd. | | 5,614,684 | 54,919,064 |
| United Kingdom - 13.3% | | | |
| Beazley PLC | | 5,952,510 | 45,222,574 |
| Cineworld Group PLC | | 10,338,434 | 29,823,740 |
| Compass Group PLC | | 3,456,699 | 92,031,463 |
| Cranswick PLC | | 624,184 | 25,096,980 |
| Dechra Pharmaceuticals PLC | | 733,463 | 24,987,401 |
| Diageo PLC | | 3,010,747 | 123,232,821 |
| Diploma PLC | | 2,124,323 | 44,000,351 |
| InterContinental Hotel Group PLC | | 778,424 | 47,106,128 |
| Intertek Group PLC | | 818,308 | 56,730,946 |
| London Stock Exchange Group PLC | | 858,754 | 77,389,907 |
| M&G PLC (a) | | 191,101 | 529,246 |
| Mondi PLC | | 1,867,360 | 38,641,684 |
| Prudential PLC | | 4,011,112 | 70,061,441 |
| RELX PLC (London Stock Exchange) | | 2,823,955 | 67,965,827 |
| Rentokil Initial PLC | | 9,846,322 | 57,968,899 |
| Victrex PLC | | 1,056,922 | 30,065,083 |
|
| TOTAL UNITED KINGDOM | | | 830,854,491 |
|
| United States of America - 6.3% | | | |
| Alphabet, Inc. Class C (a) | | 26,241 | 33,066,547 |
| Becton, Dickinson & Co. | | 167,462 | 42,870,272 |
| Boston Scientific Corp. (a) | | 1,082,846 | 45,154,678 |
| Global Payments, Inc. | | 320,527 | 54,226,758 |
| International Flavors & Fragrances, Inc. (c) | | 250,059 | 30,509,699 |
| Marsh & McLennan Companies, Inc. | | 610,228 | 63,231,825 |
| Moody's Corp. | | 145,968 | 32,213,678 |
| Roper Technologies, Inc. | | 121,636 | 40,986,467 |
| S&P Global, Inc. | | 183,858 | 47,433,525 |
|
| TOTAL UNITED STATES OF AMERICA | | | 389,693,449 |
|
| TOTAL COMMON STOCKS | | | |
| (Cost $5,824,863,784) | | | 6,000,759,134 |
|
| Nonconvertible Preferred Stocks - 0.3% | | | |
| Germany - 0.3% | | | |
| Henkel AG & Co. KGaA | | | |
| (Cost $20,523,769) | | 207,589 | 21,573,408 |
|
| Investment Companies - 0.5% | | | |
| United States of America - 0.5% | | | |
| iShares MSCI Japan ETF | | | |
| (Cost $27,883,992) | | 509,095 | 29,873,695 |
|
| Money Market Funds - 2.5% | | | |
| Fidelity Cash Central Fund 1.83% (d) | | 136,380,388 | 136,407,664 |
| Fidelity Securities Lending Cash Central Fund 1.84% (d)(e) | | 19,872,416 | 19,874,403 |
| TOTAL MONEY MARKET FUNDS | | | |
| (Cost $156,282,614) | | | 156,282,067 |
| TOTAL INVESTMENT IN SECURITIES - 99.7% | | | |
| (Cost $6,029,554,159) | | | 6,208,488,304 |
| NET OTHER ASSETS (LIABILITIES) - 0.3% | | | 18,317,862 |
| NET ASSETS - 100% | | | $6,226,806,166 |
Security Type Abbreviations
ETF – Exchange-Traded Fund
Categorizations in the Schedule of Investments are based on country or territory of incorporation.
Legend
(a) Non-income producing
(b) Security exempt from registration under Rule 144A of the Securities Act of 1933. These securities may be resold in transactions exempt from registration, normally to qualified institutional buyers. At the end of the period, the value of these securities amounted to $44,941,630 or 0.7% of net assets.
(c) Security or a portion of the security is on loan at period end.
(d) Affiliated fund that is generally available only to investment companies and other accounts managed by Fidelity Investments. The rate quoted is the annualized seven-day yield of the fund at period end. A complete unaudited listing of the fund's holdings as of its most recent quarter end is available upon request. In addition, each Fidelity Central Fund's financial statements, which are not covered by the Fund's Report of Independent Registered Public Accounting Firm, are available on the SEC's website or upon request.
(e) Investment made with cash collateral received from securities on loan.
Affiliated Central Funds
Information regarding fiscal year to date income earned by the Fund from investments in Fidelity Central Funds is as follows:
| Fund | Income earned |
| Fidelity Cash Central Fund | $924,467 |
| Fidelity Securities Lending Cash Central Fund | 5,777 |
| Total | $930,244 |
Amounts in the income column in the above table include any capital gain distributions from underlying funds, which are presented in the corresponding line-item in the Statement of Operations, if applicable. Amount for Fidelity Securities Lending Cash Central Fund represents the income earned on investing cash collateral, less rebates paid to borrowers and any lending agent fees associated with the loan, plus any premium payments received for lending certain types of securities.
Investment Valuation
The following is a summary of the inputs used, as of October 31, 2019, involving the Fund's assets and liabilities carried at fair value. The inputs or methodology used for valuing securities may not be an indication of the risk associated with investing in those securities. For more information on valuation inputs, and their aggregation into the levels used below, please refer to the Investment Valuation section in the accompanying Notes to Financial Statements.
| | Valuation Inputs at Reporting Date: |
| Description | Total | Level 1 | Level 2 | Level 3 |
| Investments in Securities: | | | | |
| Equities: | | | | |
| Communication Services | $123,457,124 | $123,457,124 | $-- | $-- |
| Consumer Discretionary | 549,246,477 | 153,861,303 | 395,385,174 | -- |
| Consumer Staples | 903,076,114 | 322,814,726 | 580,261,388 | -- |
| Energy | 162,169,378 | 60,116,958 | 102,052,420 | -- |
| Financials | 1,265,065,487 | 745,897,752 | 519,167,735 | -- |
| Health Care | 757,277,135 | 279,459,090 | 477,818,045 | -- |
| Industrials | 1,195,666,195 | 973,846,947 | 221,819,248 | -- |
| Information Technology | 804,482,493 | 360,599,491 | 443,883,002 | -- |
| Materials | 174,114,801 | 174,114,801 | -- | -- |
| Real Estate | 87,777,338 | 63,290,982 | 24,486,356 | -- |
| Investment Companies | 29,873,695 | 29,873,695 | -- | -- |
| Money Market Funds | 156,282,067 | 156,282,067 | -- | -- |
| Total Investments in Securities: | $6,208,488,304 | $3,443,614,936 | $2,764,873,368 | $-- |
See accompanying notes which are an integral part of the financial statements.
Financial Statements
Statement of Assets and Liabilities
| | | October 31, 2019 |
| Assets | | |
Investment in securities, at value (including securities loaned of $19,044,396) — See accompanying schedule:
Unaffiliated issuers (cost $5,873,271,545) | $6,052,206,237 | |
| Fidelity Central Funds (cost $156,282,614) | 156,282,067 | |
| Total Investment in Securities (cost $6,029,554,159) | | $6,208,488,304 |
| Foreign currency held at value (cost $2,753,742) | | 2,753,742 |
| Receivable for investments sold | | 13,442,296 |
| Receivable for fund shares sold | | 208,393,698 |
| Dividends receivable | | 3,973,074 |
| Distributions receivable from Fidelity Central Funds | | 238,872 |
| Other receivables | | 115 |
| Total assets | | 6,437,290,101 |
| Liabilities | | |
| Payable for investments purchased | $190,210,758 | |
| Payable for fund shares redeemed | 227,710 | |
| Other affiliated payables | 24,669 | |
| Other payables and accrued expenses | 145,158 | |
| Collateral on securities loaned | 19,875,640 | |
| Total liabilities | | 210,483,935 |
| Net Assets | | $6,226,806,166 |
| Net Assets consist of: | | |
| Paid in capital | | $6,043,229,996 |
| Total accumulated earnings (loss) | | 183,576,170 |
| Net Assets, for 610,601,910 shares outstanding | | $6,226,806,166 |
| Net Asset Value, offering price and redemption price per share ($6,226,806,166 ÷ 610,601,910 shares) | | $10.20 |
See accompanying notes which are an integral part of the financial statements.
Statement of Operations
| | | For the period
June 21, 2019 (commencement of operations) to
October 31, 2019 |
| Investment Income | | |
| Dividends | | $11,321,115 |
| Non-Cash dividends | | 8,023,279 |
| Income from Fidelity Central Funds (including $5,777 from security lending) | | 930,244 |
| Income before foreign taxes withheld | | 20,274,638 |
| Less foreign taxes withheld | | (1,097,188) |
| Total income | | 19,177,450 |
| Expenses | | |
| Custodian fees and expenses | $145,159 | |
| Independent trustees' fees and expenses | 3,171 | |
| Total expenses | | 148,330 |
| Net investment income (loss) | | 19,029,120 |
| Realized and Unrealized Gain (Loss) | | |
| Net realized gain (loss) on: | | |
| Investment securities: | | |
| Unaffiliated issuers | (11,641,333) | |
| Fidelity Central Funds | (690) | |
| Foreign currency transactions | (3,025,388) | |
| Total net realized gain (loss) | | (14,667,411) |
| Change in net unrealized appreciation (depreciation) on: | | |
| Investment securities: | | |
| Unaffiliated issuers | 178,934,692 | |
| Fidelity Central Funds | (547) | |
| Assets and liabilities in foreign currencies | 280,316 | |
| Total change in net unrealized appreciation (depreciation) | | 179,214,461 |
| Net gain (loss) | | 164,547,050 |
| Net increase (decrease) in net assets resulting from operations | | $183,576,170 |
See accompanying notes which are an integral part of the financial statements.
Statement of Changes in Net Assets
| | For the period
June 21, 2019 (commencement of operations) to
October 31, 2019 |
| Increase (Decrease) in Net Assets | |
| Operations | |
| Net investment income (loss) | $19,029,120 |
| Net realized gain (loss) | (14,667,411) |
| Change in net unrealized appreciation (depreciation) | 179,214,461 |
| Net increase (decrease) in net assets resulting from operations | 183,576,170 |
| Share transactions | |
| Proceeds from sales of shares | 6,044,906,528 |
| Cost of shares redeemed | (1,676,532) |
| Net increase (decrease) in net assets resulting from share transactions | 6,043,229,996 |
| Total increase (decrease) in net assets | 6,226,806,166 |
| Net Assets | |
| Beginning of period | – |
| End of period | $6,226,806,166 |
| Other Information | |
| Shares | |
| Sold | 610,767,928 |
| Redeemed | (166,018) |
| Net increase (decrease) | 610,601,910 |
See accompanying notes which are an integral part of the financial statements.
Financial Highlights
Fidelity Series Overseas Fund
| | |
| Year ended October 31, | 2019 A |
| Selected Per–Share Data | |
| Net asset value, beginning of period | $10.00 |
| Income from Investment Operations | |
| Net investment income (loss)B | .06C |
| Net realized and unrealized gain (loss) | .14 |
| Total from investment operations | .20 |
| Net asset value, end of period | $10.20 |
| Total ReturnD | 2.00% |
| Ratios to Average Net AssetsE,F | |
| Expenses before reductions | .01%G |
| Expenses net of fee waivers, if any | .01%G |
| Expenses net of all reductions | .01%G |
| Net investment income (loss) | 1.69%C,G |
| Supplemental Data | |
| Net assets, end of period (000 omitted) | $6,226,806 |
| Portfolio turnover rateH | 12%I,J |
A For the period June 21, 2019 (commencement of operations) to October 31, 2019.
B Calculated based on average shares outstanding during the period.
C Net investment income per share reflects a large, non-recurring dividend which amounted to $.03 per share. This dividend is not annualized in the ratio of net investment income (loss) to average net assets. Excluding this non-recurring dividend the ratio of net investment income (loss) to average net assets would have been .98%.
D Total returns for periods of less than one year are not annualized.
E Fees and expenses of any underlying Fidelity Central Funds are not included in the Fund's expense ratio. The Fund indirectly bears its proportionate share of the expenses of any underlying Fidelity Central Funds.
F Expense ratios reflect operating expenses of the Fund. Expenses before reductions do not reflect amounts reimbursed by the investment adviser or reductions from expense offset arrangements and do not represent the amount paid by the Fund during periods when reimbursements or reductions occur. Expense ratios before reductions for start-up periods may not be representative of longer term operating periods. Expenses net of fee waivers reflect expenses after reimbursement by the investment adviser but prior to reductions from expense offset arrangements. Expenses net of all reductions represent the net expenses paid by the Fund.
G Annualized
H Amount does not include the portfolio activity of any underlying Fidelity Central Funds.
I Portfolio turnover rate excludes securities received or delivered in-kind.
J Amount not annualized.
See accompanying notes which are an integral part of the financial statements.
Notes to Financial Statements
For the period ended October 31, 2019
1. Organization.
Fidelity Series Overseas Fund (the Fund) is a fund of Fidelity Investment Trust (the Trust) and is authorized to issue an unlimited number of shares. Shares are offered only to certain other Fidelity funds and Fidelity managed 529 plans. The Trust is registered under the Investment Company Act of 1940, as amended (the 1940 Act), as an open-end management investment company organized as a Massachusetts business trust.
2. Investments in Fidelity Central Funds.
The Fund invests in Fidelity Central Funds, which are open-end investment companies generally available only to other investment companies and accounts managed by the investment adviser and its affiliates. The Fund's Schedule of Investments lists each of the Fidelity Central Funds held as of period end, if any, as an investment of the Fund, but does not include the underlying holdings of each Fidelity Central Fund. As an Investing Fund, the Fund indirectly bears its proportionate share of the expenses of the underlying Fidelity Central Funds.
The Money Market Central Funds seek preservation of capital and current income and are managed by Fidelity Investments Money Management, Inc. (FIMM), an affiliate of the investment adviser. Annualized expenses of the Money Market Central Funds as of their most recent shareholder report date ranged from less than .005% to .01%.
A complete unaudited list of holdings for each Fidelity Central Fund is available upon request or at the Securities and Exchange Commission (the SEC) website at www.sec.gov. In addition, the financial statements of the Fidelity Central Funds, which are not covered by the Fund's Report of Independent Registered Public Accounting Firm, are available on the SEC website or upon request.
3. Significant Accounting Policies.
The Fund is an investment company and applies the accounting and reporting guidance of the Financial Accounting Standards Board (FASB) Accounting Standards Codification Topic 946 Financial Services – Investments Companies. The financial statements have been prepared in conformity with accounting principles generally accepted in the United States of America (GAAP), which require management to make certain estimates and assumptions at the date of the financial statements. Actual results could differ from those estimates. Subsequent events, if any, through the date that the financial statements were issued have been evaluated in the preparation of the financial statements. The following summarizes the significant accounting policies of the Fund:
Investment Valuation. Investments are valued as of 4:00 p.m. Eastern time on the last calendar day of the period. The Board of Trustees (the Board) has delegated the day to day responsibility for the valuation of the Fund's investments to the Fair Value Committee (the Committee) established by the Fund's investment adviser. In accordance with valuation policies and procedures approved by the Board, the Fund attempts to obtain prices from one or more third party pricing vendors or brokers to value its investments. When current market prices, quotations or currency exchange rates are not readily available or reliable, investments will be fair valued in good faith by the Committee, in accordance with procedures adopted by the Board. Factors used in determining fair value vary by investment type and may include market or investment specific events. The frequency with which these procedures are used cannot be predicted and they may be utilized to a significant extent. The Committee oversees the Fund's valuation policies and procedures and reports to the Board on the Committee's activities and fair value determinations. The Board monitors the appropriateness of the procedures used in valuing the Fund's investments and ratifies the fair value determinations of the Committee.
The Fund categorizes the inputs to valuation techniques used to value its investments into a disclosure hierarchy consisting of three levels as shown below:
- Level 1 – quoted prices in active markets for identical investments
- Level 2 – other significant observable inputs (including quoted prices for similar investments, interest rates, prepayment speeds, etc.)
- Level 3 – unobservable inputs (including the Fund's own assumptions based on the best information available)
Valuation techniques used to value the Fund's investments by major category are as follows:
Equity securities, including restricted securities, for which market quotations are readily available, are valued at the last reported sale price or official closing price as reported by a third party pricing vendor on the primary market or exchange on which they are traded and are categorized as Level 1 in the hierarchy. In the event there were no sales during the day or closing prices are not available, securities are valued at the last quoted bid price or may be valued using the last available price and are generally categorized as Level 2 in the hierarchy. For foreign equity securities, when market or security specific events arise, comparisons to the valuation of American Depositary Receipts (ADRs), futures contracts, Exchange-Traded Funds (ETFs) and certain indexes as well as quoted prices for similar securities may be used and would be categorized as Level 2 in the hierarchy. For equity securities, including restricted securities, where observable inputs are limited, assumptions about market activity and risk are used and these securities may be categorized as Level 3 in the hierarchy.
ETFs are valued at their last sale price or official closing price as reported by a third party pricing vendor on the primary market or exchange on which they are traded and are categorized as Level 1 in the hierarchy. In the event there were no sales during the day but the exchange reports a closing bid level, ETFs are valued at the closing bid and would be categorized as Level 1 in the hierarchy. In the event there was no closing bid, ETFs may be valued by another method that the Board believes reflects fair value in accordance with the Board's fair value pricing policies and may be categorized as Level 2 in the hierarchy.
Investments in open-end mutual funds, including the Fidelity Central Funds, are valued at their closing net asset value (NAV) each business day and are categorized as Level 1 in the hierarchy.
Changes in valuation techniques may result in transfers in or out of an assigned level within the disclosure hierarchy. The aggregate value of investments by input level as of October 31, 2019 is included at the end of the Fund's Schedule of Investments.
Foreign Currency. The Fund may use foreign currency contracts to facilitate transactions in foreign-denominated securities. Gains and losses from these transactions may arise from changes in the value of the foreign currency or if the counterparties do not perform under the contracts' terms.
Foreign-denominated assets, including investment securities, and liabilities are translated into U.S. dollars at the exchange rates at period end. Purchases and sales of investment securities, income and dividends received and expenses denominated in foreign currencies are translated into U.S. dollars at the exchange rate in effect on the transaction date.
The effects of exchange rate fluctuations on investments are included with the net realized and unrealized gain (loss) on investment securities. Other foreign currency transactions resulting in realized and unrealized gain (loss) are disclosed separately.
Investment Transactions and Income. For financial reporting purposes, the Fund's investment holdings and NAV include trades executed through the end of the last business day of the period. The NAV per share for processing shareholder transactions is calculated as of the close of business of the New York Stock Exchange (NYSE), normally 4:00 p.m. Eastern time and includes trades executed through the end of the prior business day. Gains and losses on securities sold are determined on the basis of identified cost. Dividend income is recorded on the ex-dividend date, except for certain dividends from foreign securities where the ex-dividend date may have passed, which are recorded as soon as the Fund is informed of the ex-dividend date. Non-cash dividends included in dividend income, if any, are recorded at the fair market value of the securities received. Income and capital gain distributions from Fidelity Central Funds, if any, are recorded on the ex-dividend date. Large, non-recurring dividends recognized by the Fund are presented separately on the Statement of Operations as "Non-cash Dividends" and the impact of these dividends is presented in the Financial Highlights. Investment income is recorded net of foreign taxes withheld where recovery of such taxes is uncertain.
Expenses. Expenses directly attributable to a fund are charged to that fund. Expenses attributable to more than one fund are allocated among the respective funds on the basis of relative net assets or other appropriate methods. Expense estimates are accrued in the period to which they relate and adjustments are made when actual amounts are known.
Income Tax Information and Distributions to Shareholders. Each year, the Fund intends to qualify as a regulated investment company under Subchapter M of the Internal Revenue Code, including distributing substantially all of its taxable income and realized gains. As a result, no provision for U.S. Federal income taxes is required. As of October 31, 2019, the Fund did not have any unrecognized tax benefits in the financial statements; nor is the Fund aware of any tax positions for which it is reasonably possible that the total amounts of unrecognized tax benefits will significantly change in the next twelve months. The Fund files a U.S. federal tax return, in addition to state and local tax returns as required. The Fund's federal income tax returns are subject to examination by the Internal Revenue Service (IRS) for a period of three fiscal years after they are filed. State and local tax returns may be subject to examination for an additional fiscal year depending on the jurisdiction. Foreign taxes are provided for based on the Fund's understanding of the tax rules and rates that exist in the foreign markets in which it invests.
Distributions are declared and recorded on the ex-dividend date. Income and capital gain distributions are determined in accordance with income tax regulations, which may differ from GAAP.
Capital accounts within the financial statements are adjusted for permanent book-tax differences. These adjustments have no impact on net assets or the results of operations. Capital accounts are not adjusted for temporary book-tax differences which will reverse in a subsequent period.
Book-tax differences are primarily due to foreign currency transactions, passive foreign investment companies (PFIC), capital loss carryforwards and losses deferred due to wash sales.
As of period end, the cost and unrealized appreciation (depreciation) in securities, and derivatives if applicable, for federal income tax purposes were as follows:
| Gross unrealized appreciation | $268,507,500 |
| Gross unrealized depreciation | (101,391,232) |
| Net unrealized appreciation (depreciation) | $167,116,268 |
| Tax Cost | $6,041,372,036 |
The tax-based components of distributable earnings as of period end were as follows:
| Undistributed ordinary income | $18,410,077 |
| Capital loss carryforward | $(2,072,608) |
| Net unrealized appreciation (depreciation) on securities and other investments | $167,238,701 |
Capital loss carryforwards are only available to offset future capital gains of the Fund to the extent provided by regulations and may be limited. Under the Regulated Investment Company Modernization Act of 2010 (the Act), the Fund is permitted to carry forward capital losses incurred in taxable years beginning after December 22, 2010 for an unlimited period and such capital losses are required to be used prior to any losses that expire. The capital loss carryforward information presented below, including any applicable limitation, is estimated as of fiscal period end and is subject to adjustment.
| No expiration | |
| Short-term | $(2,072,608) |
| Total capital loss carryforward | $(2,072,608) |
Restricted Securities. The Fund may invest in securities that are subject to legal or contractual restrictions on resale. These securities generally may be resold in transactions exempt from registration or to the public if the securities are registered. Disposal of these securities may involve time-consuming negotiations and expense, and prompt sale at an acceptable price may be difficult. Information regarding restricted securities is included at the end of the Fund's Schedule of Investments.
4. Purchases and Sales of Investments.
Purchases and sales of securities, other than short-term securities and in-kind transactions, aggregated $5,548,315,875 and $386,136,347, respectively.
5. Fees and Other Transactions with Affiliates.
Management Fee. Fidelity Management & Research Company (the investment adviser) and its affiliates provide the Fund with investment management related services for which the Fund does not pay a management fee. Under the management contract, the investment adviser or an affiliate pays all ordinary operating expenses of the Fund, except custody fees, fees and expenses of the independent Trustees, and certain miscellaneous expenses such as proxy and shareholder meeting expenses.
Brokerage Commissions. The Fund placed a portion of its portfolio transactions with brokerage firms which are affiliates of the investment adviser. Brokerage commissions are included in net realized gain (loss) and change in net unrealized appreciation (depreciation) in the Statement of Operations. The commissions paid to these affiliated firms were $1,847 for the period.
Interfund Trades. The Fund may purchase from or sell securities to other Fidelity Funds under procedures adopted by the Board. The procedures have been designed to ensure these interfund trades are executed in accordance with Rule 17a-7 of the 1940 Act. Interfund trades are included within the respective purchases and sales amounts shown in the Purchases and Sales of Investments note.
Affiliated Exchanges In-Kind. During the period, the Fund received investments and cash valued at $731,768,541 in exchange for 73,470,737 shares of the Fund. The amount of in-kind exchanges is included in share transactions in the accompanying Statement of Changes in Net Assets.
6. Security Lending.
The Fund lends portfolio securities from time to time in order to earn additional income. For equity securities, lending agents are used, including National Financial Services (NFS), an affiliate of the Fund. Pursuant to a securities lending agreement, NFS will receive a fee, which is capped at 9.9% of daily lending revenue, for its services as lending agent. The Fund may lend securities to certain qualified borrowers, including NFS. On the settlement date of the loan, the Fund receives collateral (in the form of U.S. Treasury obligations, letters of credit and/or cash) against the loaned securities and maintains collateral in an amount not less than 100% of the market value of the loaned securities during the period of the loan. The market value of the loaned securities is determined at the close of business of the Fund and any additional required collateral is delivered to the Fund on the next business day. The Fund or borrower may terminate the loan at any time, and if the borrower defaults on its obligation to return the securities loaned because of insolvency or other reasons, the Fund may apply collateral received from the borrower against the obligation. The Fund may experience delays and costs in recovering the securities loaned. Any cash collateral received is invested in the Fidelity Securities Lending Cash Central Fund. The value of loaned securities and cash collateral at period end are disclosed on the Fund's Statement of Assets and Liabilities. Total fees paid by the Fund to NFS, as lending agent, amounted to $38. Security lending income represents the income earned on investing cash collateral, less rebates paid to borrowers and any lending agent fees associated with the loan, plus any premium payments received for lending certain types of securities. Security lending income is presented in the Statement of Operations as a component of income from Fidelity Central Funds. During the period, there were no securities loaned to NFS.
7. Other.
The Fund's organizational documents provide former and current trustees and officers with a limited indemnification against liabilities arising in connection with the performance of their duties to the Fund. In the normal course of business, the Fund may also enter into contracts that provide general indemnifications. The Fund's maximum exposure under these arrangements is unknown as this would be dependent on future claims that may be made against the Fund. The risk of material loss from such claims is considered remote.
At the end of the period, mutual funds and accounts managed by FMR or its affiliates were the owners of record of all of the outstanding shares of the Fund.
Report of Independent Registered Public Accounting Firm
To the Trustees of Fidelity Investment Trust and Shareholders of Fidelity Series Overseas Fund:
Opinion on the Financial Statements and Financial Highlights
We have audited the accompanying statement of assets and liabilities of Fidelity Series Overseas Fund, including the schedule of investments, as of October 31, 2019, the related statement of operations, the statement of changes in net assets and the financial highlights for the period from June 21, 2019 (commencement of operations) to October 31, 2019 and the related notes. In our opinion, the financial statements and financial highlights present fairly, in all material respects, the financial position of the Fund as of October 31, 2019, and the results of its operations, the changes in its net assets and the financial highlights for the period from June 21, 2019 (commencement of operations) to October 31, 2019 in conformity with accounting principles generally accepted in the United States of America.
Basis for Opinion
These financial statements and financial highlights are the responsibility of the Fund's management. Our responsibility is to express an opinion on the Fund's financial statements and financial highlights based on our audit. We are a public accounting firm registered with the Public Company Accounting Oversight Board (United States) (PCAOB) and are required to be independent with respect to the Fund in accordance with the U.S. federal securities laws and the applicable rules and regulations of the Securities and Exchange Commission and the PCAOB.
We conducted our audit in accordance with the standards of the PCAOB. Those standards require that we plan and perform the audit to obtain reasonable assurance about whether the financial statements and financial highlights are free of material misstatement, whether due to error or fraud. The Fund is not required to have, nor were we engaged to perform, an audit of its internal control over financial reporting. As part of our audit we are required to obtain an understanding of internal control over financial reporting but not for the purpose of expressing an opinion on the effectiveness of the Fund’s internal control over financial reporting. Accordingly, we express no such opinion.
Our audit included performing procedures to assess the risks of material misstatement of the financial statements and financial highlights, whether due to error or fraud, and performing procedures that respond to those risks. Such procedures included examining, on a test basis, evidence regarding the amounts and disclosures in the financial statements and financial highlights. Our audit also included evaluating the accounting principles used and significant estimates made by management, as well as evaluating the overall presentation of the financial statements and financial highlights. Our procedures included confirmation of securities owned as of October 31, 2019, by correspondence with the custodians and brokers; when replies were not received from brokers, we performed other auditing procedures. We believe that our audit provides a reasonable basis for our opinion.
/s/ Deloitte & Touche LLP
Boston, Massachusetts
December 16, 2019
We have served as the auditor of one or more of the Fidelity investment companies since 1999.
Trustees and Officers
The Trustees, Members of the Advisory Board (if any), and officers of the trust and fund, as applicable, are listed below. The Board of Trustees governs the fund and is responsible for protecting the interests of shareholders. The Trustees are experienced executives who meet periodically throughout the year to oversee the fund's activities, review contractual arrangements with companies that provide services to the fund, oversee management of the risks associated with such activities and contractual arrangements, and review the fund's performance. Except for Jonathan Chiel, each of the Trustees oversees 298 funds. Mr. Chiel oversees 171 funds.
The Trustees hold office without limit in time except that (a) any Trustee may resign; (b) any Trustee may be removed by written instrument, signed by at least two-thirds of the number of Trustees prior to such removal; (c) any Trustee who requests to be retired or who has become incapacitated by illness or injury may be retired by written instrument signed by a majority of the other Trustees; and (d) any Trustee may be removed at any special meeting of shareholders by a two-thirds vote of the outstanding voting securities of the trust. Each Trustee who is not an interested person (as defined in the 1940 Act) of the trust and the fund is referred to herein as an Independent Trustee. Each Independent Trustee shall retire not later than the last day of the calendar year in which his or her 75th birthday occurs. The Independent Trustees may waive this mandatory retirement age policy with respect to individual Trustees. Officers and Advisory Board Members hold office without limit in time, except that any officer or Advisory Board Member may resign or may be removed by a vote of a majority of the Trustees at any regular meeting or any special meeting of the Trustees. Except as indicated, each individual has held the office shown or other offices in the same company for the past five years.
The fund’s Statement of Additional Information (SAI) includes more information about the Trustees. To request a free copy, call Fidelity at 1-800-544-8544.
Experience, Skills, Attributes, and Qualifications of the Trustees. The Governance and Nominating Committee has adopted a statement of policy that describes the experience, qualifications, attributes, and skills that are necessary and desirable for potential Independent Trustee candidates (Statement of Policy). The Board believes that each Trustee satisfied at the time he or she was initially elected or appointed a Trustee, and continues to satisfy, the standards contemplated by the Statement of Policy. The Governance and Nominating Committee also engages professional search firms to help identify potential Independent Trustee candidates who have the experience, qualifications, attributes, and skills consistent with the Statement of Policy. From time to time, additional criteria based on the composition and skills of the current Independent Trustees, as well as experience or skills that may be appropriate in light of future changes to board composition, business conditions, and regulatory or other developments, have also been considered by the professional search firms and the Governance and Nominating Committee. In addition, the Board takes into account the Trustees' commitment and participation in Board and committee meetings, as well as their leadership of standing and ad hoc committees throughout their tenure.
In determining that a particular Trustee was and continues to be qualified to serve as a Trustee, the Board has considered a variety of criteria, none of which, in isolation, was controlling. The Board believes that, collectively, the Trustees have balanced and diverse experience, qualifications, attributes, and skills, which allow the Board to operate effectively in governing the fund and protecting the interests of shareholders. Information about the specific experience, skills, attributes, and qualifications of each Trustee, which in each case led to the Board's conclusion that the Trustee should serve (or continue to serve) as a trustee of the fund, is provided below.
Board Structure and Oversight Function. James C. Curvey is an interested person and currently serves as Chairman. The Trustees have determined that an interested Chairman is appropriate and benefits shareholders because an interested Chairman has a personal and professional stake in the quality and continuity of services provided to the fund. Independent Trustees exercise their informed business judgment to appoint an individual of their choosing to serve as Chairman, regardless of whether the Trustee happens to be independent or a member of management. The Independent Trustees have determined that they can act independently and effectively without having an Independent Trustee serve as Chairman and that a key structural component for assuring that they are in a position to do so is for the Independent Trustees to constitute a substantial majority for the Board. The Independent Trustees also regularly meet in executive session. Ned C. Lautenbach serves as Chairman of the Independent Trustees and as such (i) acts as a liaison between the Independent Trustees and management with respect to matters important to the Independent Trustees and (ii) with management prepares agendas for Board meetings.
Fidelity® funds are overseen by different Boards of Trustees. The fund's Board oversees Fidelity's high income and certain equity funds, and other Boards oversee Fidelity's investment-grade bond, money market, asset allocation, and other equity funds. The asset allocation funds may invest in Fidelity® funds overseen by the fund's Board. The use of separate Boards, each with its own committee structure, allows the Trustees of each group of Fidelity® funds to focus on the unique issues of the funds they oversee, including common research, investment, and operational issues. On occasion, the separate Boards establish joint committees to address issues of overlapping consequences for the Fidelity® funds overseen by each Board.
The Trustees operate using a system of committees to facilitate the timely and efficient consideration of all matters of importance to the Trustees, the fund, and fund shareholders and to facilitate compliance with legal and regulatory requirements and oversight of the fund's activities and associated risks. The Board, acting through its committees, has charged FMR and its affiliates with (i) identifying events or circumstances the occurrence of which could have demonstrably adverse effects on the fund's business and/or reputation; (ii) implementing processes and controls to lessen the possibility that such events or circumstances occur or to mitigate the effects of such events or circumstances if they do occur; and (iii) creating and maintaining a system designed to evaluate continuously business and market conditions in order to facilitate the identification and implementation processes described in (i) and (ii) above. Because the day-to-day operations and activities of the fund are carried out by or through FMR, its affiliates, and other service providers, the fund's exposure to risks is mitigated but not eliminated by the processes overseen by the Trustees. While each of the Board's committees has responsibility for overseeing different aspects of the fund's activities, oversight is exercised primarily through the Operations, Audit, and Compliance Committees. Appropriate personnel, including but not limited to the fund's Chief Compliance Officer (CCO), FMR's internal auditor, the independent accountants, the fund's Treasurer and portfolio management personnel, make periodic reports to the Board's committees, as appropriate, including an annual review of Fidelity's risk management program for the Fidelity® funds. The responsibilities of each standing committee, including their oversight responsibilities, are described further under "Standing Committees of the Trustees."
Interested Trustees*:
Correspondence intended for a Trustee who is an interested person may be sent to Fidelity Investments, 245 Summer Street, Boston, Massachusetts 02210.
Name, Year of Birth; Principal Occupations and Other Relevant Experience+
Jonathan Chiel (1957)
Year of Election or Appointment: 2016
Trustee
Mr. Chiel also serves as Trustee of other Fidelity® funds. Mr. Chiel is Executive Vice President and General Counsel for FMR LLC (diversified financial services company, 2012-present). Previously, Mr. Chiel served as general counsel (2004-2012) and senior vice president and deputy general counsel (2000-2004) for John Hancock Financial Services; a partner with Choate, Hall & Stewart (1996-2000) (law firm); and an Assistant United States Attorney for the United States Attorney’s Office of the District of Massachusetts (1986-95), including Chief of the Criminal Division (1993-1995). Mr. Chiel is a director on the boards of the Boston Bar Foundation and the Maimonides School.
James C. Curvey (1935)
Year of Election or Appointment: 2007
Trustee
Chairman of the Board of Trustees
Mr. Curvey also serves as Trustee of other Fidelity® funds. Mr. Curvey is Vice Chairman (2007-present) and Director of FMR LLC (diversified financial services company). In addition, Mr. Curvey is an Overseer Emeritus for the Boston Symphony Orchestra, a Director of Artis-Naples, and a Trustee of Brewster Academy in Wolfeboro, New Hampshire. Previously, Mr. Curvey served as a Director of Fidelity Research & Analysis Co. (investment adviser firm, 2009-2018), Director of Fidelity Investments Money Management, Inc. (investment adviser firm, 2009-2014) and a Director of FMR and FMR Co., Inc. (investment adviser firms, 2007-2014).
* Determined to be an “Interested Trustee” by virtue of, among other things, his or her affiliation with the trust or various entities under common control with FMR.
+ The information includes the Trustee's principal occupation during the last five years and other information relating to the experience, attributes, and skills relevant to the Trustee's qualifications to serve as a Trustee, which led to the conclusion that the Trustee should serve as a Trustee for the fund.
Independent Trustees:
Correspondence intended for an Independent Trustee may be sent to Fidelity Investments, P.O. Box 55235, Boston, Massachusetts 02205-5235.
Name, Year of Birth; Principal Occupations and Other Relevant Experience+
Dennis J. Dirks (1948)
Year of Election or Appointment: 2005
Trustee
Mr. Dirks also serves as Trustee of other Fidelity® funds. Prior to his retirement in May 2003, Mr. Dirks was Chief Operating Officer and a member of the Board of The Depository Trust & Clearing Corporation (DTCC). He also served as President, Chief Operating Officer, and Board member of The Depository Trust Company (DTC) and President and Board member of the National Securities Clearing Corporation (NSCC). In addition, Mr. Dirks served as Chief Executive Officer and Board member of the Government Securities Clearing Corporation, Chief Executive Officer and Board member of the Mortgage-Backed Securities Clearing Corporation, as a Trustee and a member of the Finance Committee of Manhattan College (2005-2008), as a Trustee and a member of the Finance Committee of AHRC of Nassau County (2006-2008), as a member of the Independent Directors Council (IDC) Governing Council (2010-2015), and as a member of the Board of Directors for The Brookville Center for Children’s Services, Inc. (2009-2017). Mr. Dirks is a member of the Finance Committee (2016-present) and Board of Directors (2017-present) and is Treasurer (2018-present) of the Asolo Repertory Theatre.
Donald F. Donahue (1950)
Year of Election or Appointment: 2018
Trustee
Mr. Donahue also serves as a Trustee of other Fidelity® funds. Mr. Donahue is President and Chief Executive Officer of Miranda Partners, LLC (risk consulting for the financial services industry, 2012-present). Previously, Mr. Donahue served as a Member of the Advisory Board of certain Fidelity® funds (2015-2018) and Chief Executive Officer (2006-2012), Chief Operating Officer (2003-2006), and Managing Director, Customer Marketing and Development (1999-2003) of The Depository Trust & Clearing Corporation (financial markets infrastructure). Mr. Donahue serves as a Member (2007-present) and Co-Chairman (2016-present) of the Board of Directors of United Way of New York, Member of the Board of Directors of NYC Leadership Academy (2012-present) and Member of the Board of Advisors of Ripple Labs, Inc. (financial services, 2015-present). He also served as Chairman (2010-2012) and Member of the Board of Directors (2012-2013) of Omgeo, LLC (financial services), Treasurer of United Way of New York (2012-2016), and Member of the Board of Directors of XBRL US (financial services non-profit, 2009-2012) and the International Securities Services Association (2009-2012).
Alan J. Lacy (1953)
Year of Election or Appointment: 2008
Trustee
Mr. Lacy also serves as Trustee of other Fidelity® funds. Mr. Lacy serves as a Director of Bristol-Myers Squibb Company (global pharmaceuticals, 2008-present). He is a Trustee of the California Chapter of The Nature Conservancy (2015-present) and a Director of the Center for Advanced Study in the Behavioral Sciences at Stanford University (2015-present). In addition, Mr. Lacy served as Senior Adviser (2007-2014) of Oak Hill Capital Partners, L.P. (private equity) and also served as Chief Executive Officer (2005) and Vice Chairman (2005-2006) of Sears Holdings Corporation (retail) and Chief Executive Officer and Chairman of the Board of Sears, Roebuck and Co. (retail, 2000-2005). Previously, Mr. Lacy served as Chairman (2014-2017) and a member (2010-2017) of the Board of Directors of Dave & Buster’s Entertainment, Inc. (restaurant and entertainment complexes), as Chairman (2008-2011) and a member (2006-2015) of the Board of Trustees of the National Parks Conservation Association, and as a member of the Board of Directors for The Hillman Companies, Inc. (hardware wholesalers, 2010-2014), Earth Fare, Inc. (retail grocery, 2010-2014), and The Western Union Company (global money transfer, 2006-2011).
Ned C. Lautenbach (1944)
Year of Election or Appointment: 2000
Trustee
Chairman of the Independent Trustees
Mr. Lautenbach also serves as Trustee of other Fidelity® funds. Mr. Lautenbach currently serves as Chair (2018-present) and Member (2013-present) of the Board of Governors, State University System of Florida and is a member of the Council on Foreign Relations (1994-present). He is also a member and has most recently served as Chairman of the Board of Directors of Artis-Naples (2012-present). Previously, Mr. Lautenbach served as a member and then Lead Director of the Board of Directors of Eaton Corporation (diversified industrial, 1997-2016). He was also a Partner and Advisory Partner at Clayton, Dubilier & Rice, LLC (private equity investment, 1998-2010), as well as a Director of Sony Corporation (2006-2007). In addition, Mr. Lautenbach also had a 30-year career with IBM (technology company) during which time he served as Senior Vice President and a member of the Corporate Executive Committee (1968-1998).
Joseph Mauriello (1944)
Year of Election or Appointment: 2008
Trustee
Mr. Mauriello also serves as Trustee of other Fidelity® funds. Prior to his retirement in January 2006, Mr. Mauriello served in numerous senior management positions including Deputy Chairman and Chief Operating Officer (2004-2005), and Vice Chairman of Financial Services (2002-2004) of KPMG LLP US (professional services, 1965-2005). Mr. Mauriello currently serves as a member of the Independent Directors Council (IDC) Governing Council (2015-present). Previously, Mr. Mauriello served as a member of the Board of Directors of XL Group plc. (global insurance and re-insurance, 2006-2018).
Cornelia M. Small (1944)
Year of Election or Appointment: 2005
Trustee
Ms. Small also serves as Trustee of other Fidelity® funds. Ms. Small is a member of the Board of Directors (2009-present) and Chair of the Investment Committee (2010-present) of the Teagle Foundation. Ms. Small also serves on the Investment Committee of the Berkshire Taconic Community Foundation (2008-present). Previously, Ms. Small served as Chairperson (2002-2008) and a member of the Investment Committee and Chairperson (2008-2012) and a member of the Board of Trustees of Smith College. In addition, Ms. Small served as Chief Investment Officer, Director of Global Equity Investments, and a member of the Board of Directors of Scudder, Stevens & Clark and Scudder Kemper Investments.
Garnett A. Smith (1947)
Year of Election or Appointment: 2018
Trustee
Mr. Smith also serves as Trustee of other Fidelity® funds. Prior to Mr. Smith's retirement, he served as Chairman and Chief Executive Officer of Inbrand Corp. (manufacturer of personal absorbent products, 1990-1997). He also served as President (1986-1990) of Inbrand Corp. Prior to his employment with Inbrand Corp., he was employed by a retail fabric chain and North Carolina National Bank. In addition, Mr. Smith served as a Member of the Advisory Board of certain Fidelity® funds (2012-2013) and as a board member of the Jackson Hole Land Trust (2009-2012).
David M. Thomas (1949)
Year of Election or Appointment: 2008
Trustee
Mr. Thomas also serves as Trustee of other Fidelity® funds. Mr. Thomas serves as Non-Executive Chairman of the Board of Directors of Fortune Brands Home and Security (home and security products, 2011-present) and as a member of the Board of Directors (2004-present) and Presiding Director (2013-present) of Interpublic Group of Companies, Inc. (marketing communication). Previously, Mr. Thomas served as Executive Chairman (2005-2006) and Chairman and Chief Executive Officer (2000-2005) of IMS Health, Inc. (pharmaceutical and healthcare information solutions), a Director of Fortune Brands, Inc. (consumer products, 2000-2011), and a member of the Board of Trustees of the University of Florida (2013-2018).
+ The information includes the Trustee's principal occupation during the last five years and other information relating to the experience, attributes, and skills relevant to the Trustee's qualifications to serve as a Trustee, which led to the conclusion that the Trustee should serve as a Trustee for the fund.
Advisory Board Members and Officers:
Correspondence intended for a Member of the Advisory Board (if any) may be sent to Fidelity Investments, P.O. Box 55235, Boston, Massachusetts 02205-5235. Correspondence intended for an officer or Peter S. Lynch may be sent to Fidelity Investments, 245 Summer Street, Boston, Massachusetts 02210. Officers appear below in alphabetical order.
Name, Year of Birth; Principal Occupation
Vicki L. Fuller (1957)
Year of Election or Appointment: 2018
Member of the Advisory Board
Ms. Fuller also serves as Member of the Advisory Board of other Fidelity® funds. Ms. Fuller serves as a member of the Board of Directors, Audit Committee, and Nominating and Governance Committee of The Williams Companies, Inc. (natural gas infrastructure, 2018-present). Previously, Ms. Fuller served as the Chief Investment Officer of the New York State Common Retirement Fund (2012-2018) and held a variety of positions at AllianceBernstein L.P. (global asset management, 1985-2012), including Managing Director (2006-2012) and Senior Vice President and Senior Portfolio Manager (2001-2006).
Peter S. Lynch (1944)
Year of Election or Appointment: 2003
Member of the Advisory Board
Mr. Lynch also serves as Member of the Advisory Board of other Fidelity® funds. Mr. Lynch is Vice Chairman and a Director of FMR (investment adviser firm) and FMR Co., Inc. (investment adviser firm). In addition, Mr. Lynch serves as a Trustee of Boston College and as the Chairman of the Inner-City Scholarship Fund. Previously, Mr. Lynch served on the Special Olympics International Board of Directors (1997-2006).
Michael E. Wiley (1950)
Year of Election or Appointment: 2018
Member of the Advisory Board
Mr. Wiley also serves as Trustee or Member of the Advisory Board of other Fidelity® funds. Mr. Wiley serves as a Director of High Point Resources (exploration and production, 2005-present). Previously, Mr. Wiley served as a Director of Andeavor Corporation (independent oil refiner and marketer, 2005-2018), a Director of Andeavor Logistics LP (natural resources logistics, 2015-2018), a Director of Post Oak Bank (privately-held bank, 2004-2018), a Director of Asia Pacific Exploration Consolidated (international oil and gas exploration and production, 2008-2013), a member of the Board of Trustees of the University of Tulsa (2000-2006; 2007-2010), a Senior Energy Advisor of Katzenbach Partners, LLC (consulting, 2006-2007), an Advisory Director of Riverstone Holdings (private investment), a Director of Spinnaker Exploration Company (exploration and production, 2001-2005) and Chairman, President, and CEO of Baker Hughes, Inc. (oilfield services, 2000-2004).
Elizabeth Paige Baumann (1968)
Year of Election or Appointment: 2017
Anti-Money Laundering (AML) Officer
Ms. Baumann also serves as AML Officer of other funds. She is Chief AML Officer (2012-present) and Senior Vice President (2014-present) of FMR LLC (diversified financial services company) and is an employee of Fidelity Investments. Previously, Ms. Baumann served as AML Officer of the funds (2012-2016), and Vice President (2007-2014) and Deputy Anti-Money Laundering Officer (2007-2012) of FMR LLC.
Craig S. Brown (1977)
Year of Election or Appointment: 2019
Assistant Treasurer
Mr. Brown also serves as Assistant Treasurer of other funds. Mr. Brown is an employee of Fidelity Investments (2013-present).
John J. Burke III (1964)
Year of Election or Appointment: 2018
Chief Financial Officer
Mr. Burke also serves as Chief Financial Officer of other funds. Mr. Burke serves as Head of Investment Operations for Fidelity Fund and Investment Operations (2018-present) and is an employee of Fidelity Investments (1998-present). Previously Mr. Burke served as head of Asset Management Investment Operations (2012-2018).
William C. Coffey (1969)
Year of Election or Appointment: 2019
Assistant Secretary
Mr. Coffey also serves as Assistant Secretary of other funds. He is Senior Vice President and Deputy General Counsel of FMR LLC (diversified financial services company, 2010-present), and is an employee of Fidelity Investments. Previously, Mr. Coffey served as Secretary and CLO of certain funds (2018-2019); CLO, Secretary, and Senior Vice President of Fidelity Management & Research Company and FMR Co., Inc. (investment adviser firms, 2018-2019); Secretary of Fidelity SelectCo, LLC and Fidelity Investments Money Management, Inc. (investment adviser firms, 2018-2019); CLO of Fidelity Management & Research (Hong Kong) Limited, FMR Investment Management (UK) Limited, and Fidelity Management & Research (Japan) Limited (investment adviser firms, 2018-2019); and Assistant Secretary of certain funds (2009-2018).
Timothy M. Cohen (1969)
Year of Election or Appointment: 2018
Vice President
Mr. Cohen also serves as Vice President of other funds. Mr. Cohen serves as Executive Vice President of Fidelity SelectCo, LLC (2019-present), Co-Head of Equity (2018-present), a Director of Fidelity Management & Research (Japan) Limited (investment adviser firm, 2016-present), and is an employee of Fidelity Investments. Previously, Mr. Cohen served as Head of Global Equity Research (2016-2018), Chief Investment Officer - Equity and a Director of Fidelity Management & Research (U.K.) Inc. (investment adviser firm, 2013-2015) and as a Director of Fidelity Management & Research (Hong Kong) Limited (investment adviser firm, 2017).
Jonathan Davis (1968)
Year of Election or Appointment: 2010
Assistant Treasurer
Mr. Davis also serves as Assistant Treasurer of other funds. Mr. Davis serves as Assistant Treasurer of FMR Capital, Inc. (2017-present) and is an employee of Fidelity Investments. Previously, Mr. Davis served as Vice President and Associate General Counsel of FMR LLC (diversified financial services company, 2003-2010).
Adrien E. Deberghes (1967)
Year of Election or Appointment: 2016
Assistant Treasurer
Mr. Deberghes also serves as an officer of other funds. He serves as Assistant Treasurer of FMR Capital, Inc. (2017-present), Executive Vice President of Fidelity Investments Money Management, Inc. (FIMM) (investment adviser firm, 2016-present), and is an employee of Fidelity Investments (2008-present). Previously, Mr. Deberghes served as President and Treasurer of certain Fidelity® funds (2013-2018). Prior to joining Fidelity Investments, Mr. Deberghes was Senior Vice President of Mutual Fund Administration at State Street Corporation (2007-2008), Senior Director of Mutual Fund Administration at Investors Bank & Trust (2005-2007), and Director of Finance for Dunkin' Brands (2000-2005). Previously, Mr. Deberghes served in other fund officer roles.
Laura M. Del Prato (1964)
Year of Election or Appointment: 2018
Assistant Treasurer
Ms. Del Prato also serves as an officer of other funds. Ms. Del Prato is an employee of Fidelity Investments (2017-present). Prior to joining Fidelity Investments, Ms. Del Prato served as a Managing Director and Treasurer of the JPMorgan Mutual Funds (2014-2017). Prior to JPMorgan, Ms. Del Prato served as a partner at Cohen Fund Audit Services (accounting firm, 2012-2013) and KPMG LLP (accounting firm, 2004-2012).
Colm A. Hogan (1973)
Year of Election or Appointment: 2016
Deputy Treasurer
Mr. Hogan also serves as an officer of other funds. Mr. Hogan serves as Assistant Treasurer of FMR Capital, Inc. (2017-present) and is an employee of Fidelity Investments (2005-present). Previously, Mr. Hogan served as Assistant Treasurer of certain Fidelity® funds (2016-2018).
Pamela R. Holding (1964)
Year of Election or Appointment: 2018
Vice President
Ms. Holding also serves as Vice President of other funds. Ms. Holding serves as Executive Vice President of Fidelity SelectCo, LLC (2019-present), Co-Head of Equity (2018-present) and is an employee of Fidelity Investments (2013-present). Previously, Ms. Holding served as Chief Investment Officer of Fidelity Institutional Asset Management (2013-2018).
Cynthia Lo Bessette (1969)
Year of Election or Appointment: 2019
Secretary and Chief Legal Officer (CLO)
Ms. Lo Bessette also serves as Secretary and CLO of other funds. Ms. Lo Bessette serves as CLO, Secretary, and Senior Vice President of Fidelity Management & Research Company and FMR Co., Inc. (investment adviser firms, 2019-present); Secretary of Fidelity SelectCo, LLC and Fidelity Investments Money Management, Inc. (investment adviser firms, 2019-present); and CLO of Fidelity Management & Research (Hong Kong) Limited, FMR Investment Management (UK) Limited, and Fidelity Management & Research (Japan) Limited (investment adviser firms, 2019-present). She is a Senior Vice President and Deputy General Counsel of FMR LLC (diversified financial services company, 2019-present), and is an employee of Fidelity Investments. Previously, Ms. Lo Bessette served as Executive Vice President, General Counsel (2016-2019) and Senior Vice President, Deputy General Counsel (2015-2016) of OppenheimerFunds (investment management company) and Deputy Chief Legal Officer (2013-2015) of Jennison Associates LLC (investment adviser firm).
Chris Maher (1972)
Year of Election or Appointment: 2013
Assistant Treasurer
Mr. Maher serves as Assistant Treasurer of other funds. Mr. Maher is Vice President of Valuation Oversight, serves as Assistant Treasurer of FMR Capital, Inc. (2017-present), and is an employee of Fidelity Investments. Previously, Mr. Maher served as Vice President of Asset Management Compliance (2013), Vice President of the Program Management Group of FMR (investment adviser firm, 2010-2013), and Vice President of Valuation Oversight (2008-2010).
Kenneth B. Robins (1969)
Year of Election or Appointment: 2016
Chief Compliance Officer
Mr. Robins also serves as an officer of other funds. Mr. Robins serves as Compliance Officer of Fidelity Management & Research Company and FMR Co., Inc. (investment adviser firms, 2016-present) and is an employee of Fidelity Investments (2004-present). Previously, Mr. Robins served as Executive Vice President of Fidelity Investments Money Management, Inc. (investment adviser firm, 2013-2016) and served in other fund officer roles.
Stacie M. Smith (1974)
Year of Election or Appointment: 2016
President and Treasurer
Ms. Smith also serves as an officer of other funds. Ms. Smith serves as Assistant Treasurer of FMR Capital, Inc. (2017-present), is an employee of Fidelity Investments (2009-present), and has served in other fund officer roles. Prior to joining Fidelity Investments, Ms. Smith served as Senior Audit Manager of Ernst & Young LLP (accounting firm, 1996-2009). Previously, Ms. Smith served as Assistant Treasurer (2013-2018) and Deputy Treasurer (2013-2016) of certain Fidelity® funds.
Marc L. Spector (1972)
Year of Election or Appointment: 2016
Assistant Treasurer
Mr. Spector also serves as an officer of other funds. Mr. Spector serves as Assistant Treasurer of FMR Capital, Inc. (2017-present) and is an employee of Fidelity Investments (2016-present). Prior to joining Fidelity Investments, Mr. Spector served as Director at the Siegfried Group (accounting firm, 2013-2016), and prior to Siegfried Group as audit senior manager at Deloitte & Touche (accounting firm, 2005-2013).
Jim Wegmann (1979)
Year of Election or Appointment: 2019
Assistant Treasurer
Mr. Wegmann also serves as Assistant Treasurer of other funds. Mr. Wegmann is an employee of Fidelity Investments (2011-present).
Shareholder Expense Example
As a shareholder of the Fund, you incur two types of costs: (1) transaction costs and (2) ongoing costs, including other Fund expenses. This Example is intended to help you understand your ongoing costs (in dollars) of investing in the Fund and to compare these costs with the ongoing costs of investing in other mutual funds.
The actual expense Example is based on an investment of $1,000 invested at the beginning of the period and held for the entire period (June 21, 2019 to October 31, 2019). The hypothetical expense Example is based on an investment of $1,000 invested for the one-half year period (May 1, 2019 to October 31, 2019).
Actual Expenses
The first line of the accompanying table provides information about actual account values and actual expenses. You may use the information in this line, together with the amount you invested, to estimate the expenses that you paid over the period. Simply divide your account value by $1,000.00 (for example, an $8,600 account value divided by $1,000.00 = 8.6), then multiply the result by the number in the first line under the heading entitled "Expenses Paid During Period" to estimate the expenses you paid on your account during this period. In addition, the Fund, as a shareholder in the underlying Fidelity Central Funds, will indirectly bear its pro-rata share of the fees and expenses incurred by the underlying Fidelity Central Funds. These fees and expenses are not included in the Fund's annualized expense ratio used to calculate the expense estimate in the table below.
Hypothetical Example for Comparison Purposes
The second line of the accompanying table provides information about hypothetical account values and hypothetical expenses based on the Fund's actual expense ratio and an assumed rate of return of 5% per year before expenses, which is not the Fund's actual return. The hypothetical account values and expenses may not be used to estimate the actual ending account balance or expenses you paid for the period. You may use this information to compare the ongoing costs of investing in the Fund and other funds. To do so, compare this 5% hypothetical example with the 5% hypothetical examples that appear in the shareholder reports of the other funds. In addition, the Fund, as a shareholder in the underlying Fidelity Central Funds, will indirectly bear its pro-rata share of the fees and expenses incurred by the underlying Fidelity Central Funds. These fees and expenses are not included in the Fund's annualized expense ratio used to calculate the expense estimate in the table below.
Please note that the expenses shown in the table are meant to highlight your ongoing costs only and do not reflect any transaction costs. Therefore, the second line of the table is useful in comparing ongoing costs only, and will not help you determine the relative total costs of owning different funds.
| | Annualized Expense Ratio-A | Beginning
Account Value | Ending
Account Value
October 31, 2019 | Expenses Paid
During Period |
| Actual | .01% | $1,000.00 | $1,020.00 | $.04-B |
| Hypothetical-C | | $1,000.00 | $1,025.16 | $.05-D |
A Annualized expense ratio reflects expenses net of applicable fee waivers.
B Actual expenses are equal to the Fund's annualized expense ratio, multiplied by the average account value over the period, multiplied by 133/365 (to reflect the period June 21, 2019 to October 31, 2019).
C 5% return per year before expenses
D Hypothetical expenses are equal to the Fund's annualized expense ratio, multiplied by the average account value over the period, multiplied by 184/365 (to reflect the one-half year period).
Distributions (Unaudited)
The fund will notify shareholders in January 2020 of amounts for use in preparing 2019 income tax returns.
Board Approval of Investment Advisory Contracts and Management Fees
Fidelity Series Overseas Fund
On March 6, 2019, the Board of Trustees, including the Independent Trustees (together, the Board), voted to approve the management contract with Fidelity Management & Research Company (FMR) and the sub-advisory agreements with affiliates of FMR (together, the Advisory Contracts) for the fund. FMR and the sub-advisers are collectively referred to herein as the Investment Advisers. The Board, assisted by the advice of fund counsel and Independent Trustees' counsel, considered a broad range of information.
Nature, Extent, and Quality of Services Provided. The Board considered Fidelity's staffing as it relates to the fund, including the backgrounds of investment personnel of Fidelity, and also considered the fund's investment objective, strategies, and related investment philosophy, and the purpose of Series funds generally. The Board considered the structure of the investment personnel compensation program and whether this structure provides appropriate incentives to act in the best interests of the fund.
Resources Dedicated to Investment Management and Support Services. The Board and the Fund Oversight and Research Committees reviewed the general qualifications and capabilities of Fidelity's investment staff, including its size, education, experience, and resources, as well as Fidelity's approach to recruiting, training, managing, and compensating investment personnel. The Board noted that Fidelity has continued to increase the resources devoted to non-U.S. offices, including expansion of Fidelity's global investment organization. The Board also noted that Fidelity's analysts have extensive resources, tools and capabilities that allow them to conduct sophisticated quantitative and fundamental analysis, as well as credit analysis of issuers, counterparties and guarantors. Further, the Board considered that Fidelity's investment professionals have sufficient access to global information and data so as to provide competitive investment results over time, and that those professionals also have access to sophisticated tools that permit them to assess portfolio construction and risk and performance attribution characteristics continuously, as well as to transmit new information and research conclusions rapidly around the world. Additionally, in its deliberations, the Board considered Fidelity's trading, risk management, compliance, and technology and operations
capabilities and resources, which are integral parts of the investment management process.
Administrative Services. The Board considered the nature, extent, quality, and cost of advisory and administrative services to be performed by the Investment Advisers and their affiliates under the Advisory Contracts and under separate agreements covering transfer agency, pricing and bookkeeping, and securities lending services for the fund. The Board also considered the nature and extent of the supervision of third party service providers, principally custodians, subcustodians, and pricing vendors.
Investment Performance. The fund is a new fund and therefore had no historical performance for the Board to review at the time it approved the fund's Advisory Contracts. The Board considered the Investment Advisers' strength in fundamental, research-driven security selection, which the Board is familiar with through its supervision of other Fidelity funds.
Based on its review, the Board considered that the fund will not pay a management fee and concluded that the nature, extent, and quality of services to be provided to the fund under the Advisory Contracts should benefit the shareholders of the fund.
Competitiveness of Management Fee and Total Expense Ratio ..The Board considered that the fund will not pay FMR a management fee for investment advisory services. In reviewing the Advisory Contracts, the Board also considered the projected total expense ratio of the fund. The Board noted that FMR or an affiliate undertakes to pay all operating expenses of the fund, except transfer agent fees, 12b-1 fees, Independent Trustee fees and expenses, custodian fees and expenses, proxy and shareholder meeting expenses, interest, taxes, and extraordinary expenses (such as litigation expenses).
The Board also noted that FMR has contractually agreed to reimburse the fund to the extent that total operating expenses (excluding interest, certain taxes, fees and expenses of the Independent Trustees, proxy and shareholder meeting expenses, extraordinary expenses, and acquired fund fees and expenses, if any, as well as non-operating expenses such as brokerage commissions and fees and expenses associated with the fund's securities lending program, if applicable), as a percentage of its average net assets exceed 0.014%, through February 28, 2023.
Based on its review, the Board concluded that the fund's projected total expense ratio was reasonable in light of the services that the fund and its shareholders will receive and the other factors considered.
Costs of the Services and Profitability. The fund is a new fund and therefore no revenue, cost, or profitability data was available for the Board to review in respect of the fund at the time it approved the Advisory Contracts. In connection with its future renewal of the fund's Advisory Contracts, the Board will consider the level of Fidelity's profits in respect of all the Fidelity funds.
Economies of Scale. The Board concluded that because the fund will pay no advisory fees and FMR or an affiliate will bear all expenses of the fund, with certain limited exceptions, the realization of economies of scale was not a material factor in the Board's decision to approve the fund's Advisory Contracts.
Additional Information Requested by the Board. In order to develop fully the factual basis for consideration of the Advisory Contracts, the Board received information explaining that the fund is offered exclusively to other Fidelity funds, which use the fund to gain exposure to a specific type of investment. The Board also noted that those Fidelity funds investing in the fund will benefit from investing in one centralized fund as the fund may deliver more uniform asset class performance and offer additional opportunities to generate returns and diversify the investing funds' equity allocations.
Based on its evaluation of all of the conclusions noted above, and after considering all factors it believed relevant, the Board concluded that the advisory and sub-advisory fee arrangements are fair and reasonable, and that the fund's Advisory Contracts should be approved.
SOV-ANN-1219
1.9894003.100
Fidelity® Total International Equity Fund
Annual Report
October 31, 2019
Includes Fidelity and Fidelity Advisor share classes
See the inside front cover for important information about access to your fund’s shareholder reports.
Beginning on January 1, 2021, as permitted by regulations adopted by the Securities and Exchange Commission, paper copies of a fund’s shareholder reports will no longer be sent by mail, unless you specifically request paper copies of the reports from the fund or from your financial intermediary, such as a financial advisor, broker-dealer or bank. Instead, the reports will be made available on a website, and you will be notified by mail each time a report is posted and provided with a website link to access the report.
If you already elected to receive shareholder reports electronically, you will not be affected by this change and you need not take any action. You may elect to receive shareholder reports and other communications from a fund electronically, by contacting your financial intermediary. For Fidelity customers, visit Fidelity's web site or call Fidelity using the contact information listed below.
You may elect to receive all future reports in paper free of charge. If you wish to continue receiving paper copies of your shareholder reports, you may contact your financial intermediary or, if you are a Fidelity customer, visit Fidelity’s website, or call Fidelity at the applicable toll-free number listed below. Your election to receive reports in paper will apply to all funds held with the fund complex/your financial intermediary.
| Account Type | Website | Phone Number |
| Brokerage, Mutual Fund, or Annuity Contracts: | fidelity.com/mailpreferences | 1-800-343-3548 |
| Employer Provided Retirement Accounts: | netbenefits.fidelity.com/preferences (choose 'no' under Required Disclosures to continue to print) | 1-800-343-0860 |
| Advisor Sold Accounts Serviced Through Your Financial Intermediary: | Contact Your Financial Intermediary | Your Financial Intermediary's phone number |
| Advisor Sold Accounts Serviced by Fidelity: | institutional.fidelity.com | 1-877-208-0098 |
Contents
To view a fund's proxy voting guidelines and proxy voting record for the 12-month period ended June 30, visit http://www.fidelity.com/proxyvotingresults or visit the Securities and Exchange Commission's (SEC) web site at http://www.sec.gov.
You may also call 1-800-544-8544 if you’re an individual investing directly with Fidelity, call 1-800-835-5092 if you’re a plan sponsor or participant with Fidelity as your recordkeeper or call 1-877-208-0098 on institutional accounts or if you’re an advisor or invest through one to request a free copy of the proxy voting guidelines.
Standard & Poor's, S&P and S&P 500 are registered service marks of The McGraw-Hill Companies, Inc. and have been licensed for use by Fidelity Distributors Corporation.
Other third-party marks appearing herein are the property of their respective owners.
All other marks appearing herein are registered or unregistered trademarks or service marks of FMR LLC or an affiliated company. © 2019 FMR LLC. All rights reserved.
This report and the financial statements contained herein are submitted for the general information of the shareholders of the Fund. This report is not authorized for distribution to prospective investors in the Fund unless preceded or accompanied by an effective prospectus.
A fund files its complete schedule of portfolio holdings with the SEC for the first and third quarters of each fiscal year on Form N-PORT. Forms N-PORT are available on the SEC’s web site at http://www.sec.gov. A fund's Forms N-PORT may be reviewed and copied at the SEC’s Public Reference Room in Washington, DC. Information regarding the operation of the SEC's Public Reference Room may be obtained by calling 1-800-SEC-0330.
For a complete list of a fund's portfolio holdings, view the most recent holdings listing, semiannual report, or annual report on Fidelity's web site at http://www.fidelity.com, http://www.institutional.fidelity.com, or http://www.401k.com, as applicable.
NOT FDIC INSURED •MAY LOSE VALUE •NO BANK GUARANTEE
Neither the Fund nor Fidelity Distributors Corporation is a bank.
Performance: The Bottom Line
Average annual total return reflects the change in the value of an investment, assuming reinvestment of distributions from dividend income and capital gains (the profits earned upon the sale of securities that have grown in value, if any) and assuming a constant rate of performance each year. The hypothetical investment and the average annual total returns do not reflect the deduction of taxes that a shareholder would pay on fund distributions or the redemption of fund shares. During periods of reimbursement by Fidelity, a fund’s total return will be greater than it would be had the reimbursement not occurred. How a fund did yesterday is no guarantee of how it will do tomorrow.
Average Annual Total Returns
| For the periods ended October 31, 2019 | Past 1 year | Past 5 years | Past 10 years |
| Class A (incl. 5.75% sales charge) | 8.04% | 3.65% | 5.39% |
| Class M (incl. 3.50% sales charge) | 10.38% | 3.87% | 5.37% |
| Class C (incl. contingent deferred sales charge) | 12.83% | 4.08% | 5.21% |
| Fidelity® Total International Equity Fund | 14.97% | 5.18% | 6.32% |
| Class I | 15.11% | 5.19% | 6.30% |
| Class Z | 15.13% | 5.27% | 6.34% |
Class C shares' contingent deferred sales charges included in the past one year and life of fund total return figures are 1% and 0%, respectively.
Class C shares' contingent deferred sales charges included in the past one year, past five years, and life of fund total return figures are 1%, 0%, and 0%, respectively.
The initial offering of Class Z shares took place on February 1, 2017. Returns prior to February 1, 2017, are those of Class I.
$10,000 Over Life of Fund
Let's say hypothetically that $10,000 was invested in Fidelity® Total International Equity Fund, a class of the fund, on October 31, 2009.
The chart shows how the value of your investment would have changed, and also shows how the MSCI ACWI (All Country World Index) ex USA Index performed over the same period.
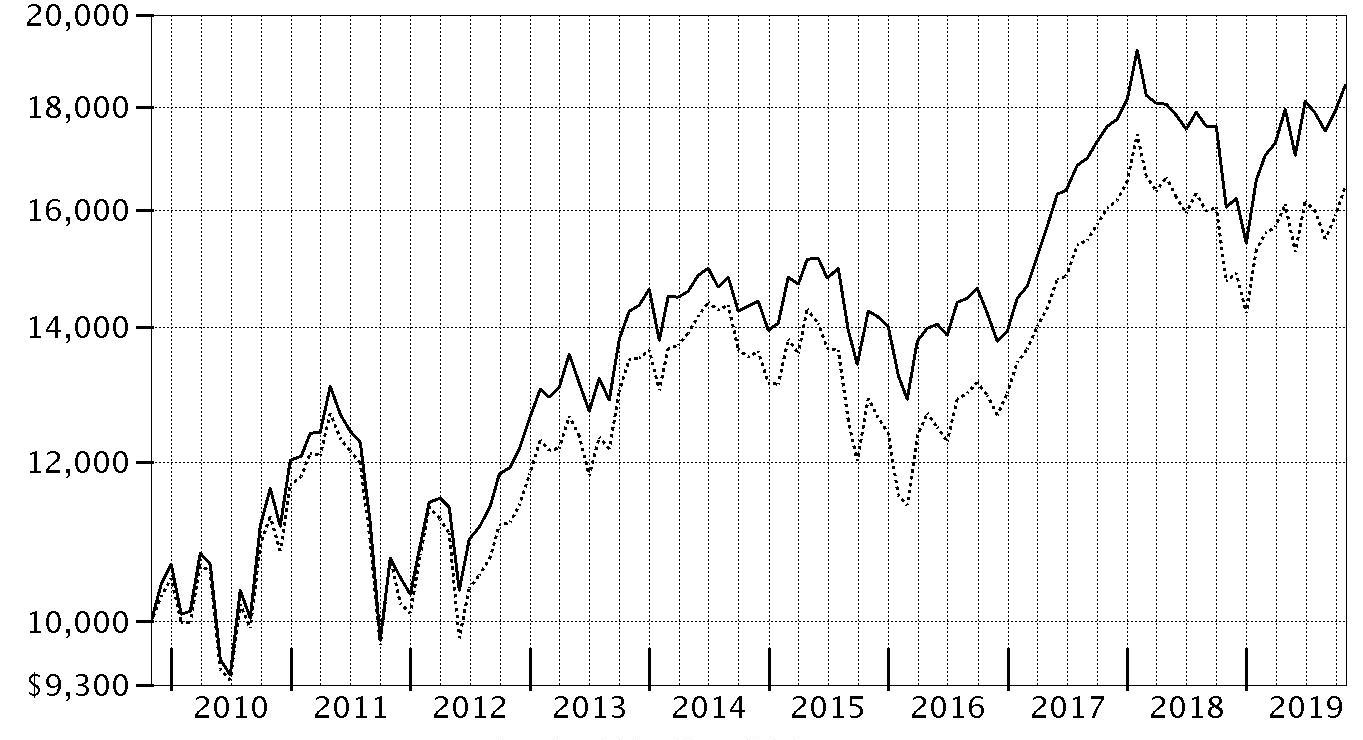
| Period Ending Values |
| $18,456 | Fidelity® Total International Equity Fund - Fidelity® Total International Equity Fund |
| $16,440 | MSCI ACWI (All Country World Index) ex USA Index |
Management's Discussion of Fund Performance
Market Recap: The MSCI ACWI (All Country World Index) ex USA Index gained 11.47% for the 12 months ending October 31, 2019, as international stocks reflected a confluence of factors, including escalating trade tension, moderating but still positive global economic growth and uncertainty about the U.K.’s planned “Brexit” from the European Union. In late December, the U.S. Federal Reserve shifted from raising interest rates to a more dovish policy in 2019, joining many foreign central banks that had cut policy rates. In June, international stocks rose 6.03%, as policy stimulus in China stabilized that country’s economic growth. The Fed cut its policy rate in July for the first time since 2008. However, the index returned -1.21% for the month, followed by -3.08% in August. In September, the Fed cut its policy rate another quarter point, citing concerns about slowing economic growth and muted inflation, and did the same in October, leading to monthly gains of 2.59% and 3.49%, respectively. For the full 12 months, the growth-oriented information technology sector (+22%) led the way, followed by utilities (+20%) and real estate (+18%), two high-dividend-yielding categories. Consumer discretionary gained 16%. Conversely, energy was roughly flat, while materials (+6%) and communication services (7%) also lagged. By region, Asia Pacific ex Japan (+16%), Europe ex U.K (+13%), Canada (+12%) and emerging markets (+12%) fared best. Meanwhile, the U.K. (+7%) and Japan (+10%) trailed the broader market.
Comments from Co-Portfolio Manager Jed Weiss: For the fiscal year, the fund’s share classes (excluding sales charges, if applicable) gained roughly 14% to 15%, outpacing the benchmark MSCI ACWI (All Country World Index) ex USA Index. Versus the benchmark, the fund benefited most from sizable out-of-benchmark exposure to the U.S., as well as strong security selection in China and Japan. By sector, positioning in information technology notably aided the portfolio’s relative result, as did investment choices within financials and consumer staples. Conversely, picks in the U.K. and Spain weighed on the portfolio’s relative return, as was the case among energy stocks. The fund’s underweighting in the strong-performing utilities sector also detracted the past 12 months. The biggest individual relative contributor was an out-of-benchmark stake in U.S.-based credit-card processor Mastercard (+42%) as the firm continued to maintain considerable pricing power and significant market share. Throughout the period, Japanese multinational Hoya (+58%) – a supplier of electronics products to the semiconductor industry – executed well and benefitted from the ongoing structural-growth in extreme ultraviolet lithography (EUV) technology, further propelling relative performance. Netherlands-based chip-equipment firm ASML Holding (+54%), which was a beneficiary of both the build-out of 5G wireless networks as well as growth in its EUV systems business, also contributed. In contrast, the fund’s largest stock-specific detractor was untimely ownership of Thai cement, chemicals and packaging company Siam Cement Public Company (-17%), whose stock declined late in the period due to the firm’s lower growth and profitability outlook. Also hampering the portfolio’s relative result was an overweighting in Spanish airline-reservation software provider Amadeus IT Group (-5%), amid decelerating airline-traffic growth and increasingly aggressive competition. Lastly, I'll note that the fund's stake in cash – representing about 2% of assets, on average – weighed on the portfolio’s relative return amid the strong, uptrending market this period.
The views expressed above reflect those of the portfolio manager(s) only through the end of the period as stated on the cover of this report and do not necessarily represent the views of Fidelity or any other person in the Fidelity organization. Any such views are subject to change at any time based upon market or other conditions and Fidelity disclaims any responsibility to update such views. These views may not be relied on as investment advice and, because investment decisions for a Fidelity fund are based on numerous factors, may not be relied on as an indication of trading intent on behalf of any Fidelity fund.
Note to Shareholders: On February 22, 2019, Sam Polyak assumed co-management responsibilities for the fund's emerging-markets subportfolio, joining Co-Manager Sammy Simnegar. On October 1, 2019, Simnegar will come off of the subportfolio, leaving Polyak as sole Portfolio Manager.
Investment Summary (Unaudited)
Geographic Diversification (% of fund's net assets)
| As of October 31, 2019 |
| | Japan | 14.8% |
| | United Kingdom | 8.3% |
| | United States of America* | 8.2% |
| | Germany | 7.3% |
| | France | 6.7% |
| | Canada | 6.4% |
| | China | 5.2% |
| | Switzerland | 4.8% |
| | Cayman Islands | 4.0% |
| | Other | 34.3% |

* Includes Short-Term investments and Net Other Assets (Liabilities).
Percentages are based on country or territory of incorporation and are adjusted for the effect of futures contracts, if applicable.
Asset Allocation as of October 31, 2019
| | % of fund's net assets |
| Stocks | 98.5 |
| Short-Term Investments and Net Other Assets (Liabilities) | 1.5 |
Top Ten Stocks as of October 31, 2019
| | % of fund's net assets |
| Samsung Electronics Co. Ltd. (Korea (South), Technology Hardware, Storage & Peripherals) | 2.5 |
| Taiwan Semiconductor Manufacturing Co. Ltd. (Taiwan, Semiconductors & Semiconductor Equipment) | 2.0 |
| Nestle SA (Reg. S) (Switzerland, Food Products) | 1.9 |
| Tencent Holdings Ltd. (Cayman Islands, Interactive Media & Services) | 1.7 |
| SAP SE (Germany, Software) | 1.4 |
| ASML Holding NV (Netherlands) (Netherlands, Semiconductors & Semiconductor Equipment) | 1.2 |
| Roche Holding AG (participation certificate) (Switzerland, Pharmaceuticals) | 1.2 |
| Industrial & Commercial Bank of China Ltd. (H Shares) (China, Banks) | 1.1 |
| Linde PLC (Germany, Chemicals) | 1.1 |
| BP PLC (United Kingdom, Oil, Gas & Consumable Fuels) | 1.1 |
| | 15.2 |
Top Market Sectors as of October 31, 2019
| | % of fund's net assets |
| Financials | 24.2 |
| Information Technology | 16.4 |
| Industrials | 14.9 |
| Materials | 9.5 |
| Consumer Discretionary | 8.0 |
| Health Care | 6.5 |
| Consumer Staples | 6.1 |
| Energy | 5.9 |
| Communication Services | 4.0 |
| Real Estate | 2.0 |
Schedule of Investments October 31, 2019
Showing Percentage of Net Assets
| Common Stocks - 97.3% | | | |
| | | Shares | Value |
| Australia - 1.8% | | | |
| Beacon Lighting Group Ltd. | | 15,420 | $12,916 |
| Commonwealth Bank of Australia | | 7,327 | 397,271 |
| CSL Ltd. | | 4,794 | 845,452 |
| Imdex Ltd. | | 15,011 | 16,437 |
| Insurance Australia Group Ltd. | | 40,838 | 223,754 |
| Macquarie Group Ltd. | | 2,976 | 274,796 |
|
| TOTAL AUSTRALIA | | | 1,770,626 |
|
| Austria - 0.2% | | | |
| Erste Group Bank AG | | 5,900 | 208,397 |
| Bailiwick of Jersey - 0.8% | | | |
| Experian PLC | | 12,100 | 380,558 |
| Glencore Xstrata PLC | | 83,900 | 253,242 |
| Integrated Diagnostics Holdings PLC (a) | | 7,500 | 35,400 |
| WPP PLC | | 12,200 | 152,251 |
|
| TOTAL BAILIWICK OF JERSEY | | | 821,451 |
|
| Belgium - 0.7% | | | |
| Barco NV | | 310 | 67,420 |
| KBC Ancora | | 961 | 45,766 |
| KBC Groep NV | | 7,512 | 526,817 |
|
| TOTAL BELGIUM | | | 640,003 |
|
| Brazil - 1.7% | | | |
| BM&F BOVESPA SA | | 46,500 | 560,945 |
| IRB Brasil Resseguros SA | | 47,600 | 448,524 |
| Natura Cosmeticos SA | | 27,800 | 215,995 |
| Suzano Papel e Celulose SA | | 57,600 | 468,785 |
|
| TOTAL BRAZIL | | | 1,694,249 |
|
| Canada - 6.4% | | | |
| Alimentation Couche-Tard, Inc. Class B (sub. vtg.) | | 27,298 | 818,671 |
| Brookfield Asset Management, Inc. Class A | | 7,000 | 387,070 |
| Canadian National Railway Co. | | 9,736 | 870,777 |
| Canadian Pacific Railway Ltd. | | 3,116 | 708,582 |
| Constellation Software, Inc. | | 672 | 663,699 |
| Franco-Nevada Corp. | | 5,934 | 575,784 |
| McCoy Global, Inc. (b) | | 7,000 | 3,189 |
| New Look Vision Group, Inc. | | 1,300 | 31,585 |
| Nutrien Ltd. | | 14,086 | 673,874 |
| Pason Systems, Inc. | | 15,045 | 161,519 |
| PrairieSky Royalty Ltd. | | 13,458 | 131,402 |
| Richelieu Hardware Ltd. | | 1,000 | 20,530 |
| ShawCor Ltd. Class A | | 800 | 8,054 |
| Suncor Energy, Inc. | | 12,294 | 365,525 |
| The Toronto-Dominion Bank | | 12,000 | 685,233 |
| Waste Connection, Inc. (Canada) | | 2,000 | 184,739 |
|
| TOTAL CANADA | | | 6,290,233 |
|
| Cayman Islands - 4.0% | | | |
| Airtac International Group | | 30,000 | 410,683 |
| Alibaba Group Holding Ltd. sponsored ADR (b) | | 2,700 | 477,009 |
| JD.com, Inc. sponsored ADR (b) | | 8,132 | 253,312 |
| Li Ning Co. Ltd. | | 171,500 | 581,526 |
| Meituan Dianping Class B (b) | | 24,500 | 292,239 |
| PagSeguro Digital Ltd. (b) | | 5,707 | 211,616 |
| Tencent Holdings Ltd. | | 41,700 | 1,691,474 |
|
| TOTAL CAYMAN ISLANDS | | | 3,917,859 |
|
| Chile - 0.2% | | | |
| Banco de Chile | | 1,790,400 | 230,560 |
| China - 5.2% | | | |
| AVIC Jonhon OptronicTechnology Co. Ltd. | | 53,950 | 308,876 |
| C&S Paper Co. Ltd. (A Shares) | | 149,700 | 264,713 |
| China Life Insurance Co. Ltd. (H Shares) | | 157,000 | 403,756 |
| China Merchants Bank Co. Ltd. (H Shares) | | 165,500 | 789,308 |
| China Petroleum & Chemical Corp. (H Shares) | | 612,000 | 348,090 |
| Haier Smart Home Co. Ltd. (A Shares) | | 390,300 | 886,474 |
| Industrial & Commercial Bank of China Ltd. (H Shares) | | 1,537,000 | 1,101,097 |
| Ping An Insurance Group Co. of China Ltd. (H Shares) | | 16,500 | 190,440 |
| Shenzhen Inovance Technology Co. Ltd. (A Shares) | | 140,800 | 498,145 |
| Yantai Jereh Oilfield Services (A Shares) | | 56,300 | 244,868 |
| Zhejiang Sanhua Intelligent Controls Co. Ltd. (A Shares) | | 14,080 | 27,973 |
|
| TOTAL CHINA | | | 5,063,740 |
|
| Denmark - 0.4% | | | |
| A.P. Moller - Maersk A/S Series B | | 116 | 147,970 |
| Ambu A/S Series B | | 1,400 | 21,986 |
| Jyske Bank A/S (Reg.) | | 554 | 18,418 |
| Netcompany Group A/S (a)(b) | | 960 | 40,872 |
| ORSTED A/S (a) | | 1,100 | 96,489 |
| SimCorp A/S | | 550 | 49,139 |
| Spar Nord Bank A/S | | 2,731 | 26,663 |
|
| TOTAL DENMARK | | | 401,537 |
|
| Finland - 0.3% | | | |
| Sampo Oyj (A Shares) | | 4,553 | 186,581 |
| Tikkurila Oyj | | 4,880 | 77,830 |
|
| TOTAL FINLAND | | | 264,411 |
|
| France - 6.7% | | | |
| ALTEN | | 600 | 65,881 |
| Atos Origin SA | | 2,029 | 157,464 |
| AXA SA | | 23,106 | 611,644 |
| Bouygues SA | | 4,779 | 202,541 |
| Capgemini SA | | 1,802 | 202,886 |
| Edenred SA | | 6,300 | 331,646 |
| Elis SA | | 6,651 | 127,068 |
| Laurent-Perrier Group SA | | 259 | 25,709 |
| Legrand SA | | 3,600 | 280,975 |
| LVMH Moet Hennessy Louis Vuitton SE | | 1,500 | 640,584 |
| Natixis SA | | 30,600 | 140,301 |
| Safran SA | | 3,600 | 569,539 |
| Sanofi SA | | 6,328 | 583,360 |
| Societe Generale Series A | | 8,729 | 248,243 |
| SR Teleperformance SA | | 1,100 | 249,292 |
| Thales SA | | 1,600 | 156,392 |
| Total SA | | 18,415 | 973,569 |
| Vetoquinol SA | | 600 | 39,080 |
| VINCI SA | | 5,200 | 583,436 |
| Vivendi SA | | 9,752 | 271,475 |
| Worldline SA (a)(b) | | 1,758 | 106,760 |
|
| TOTAL FRANCE | | | 6,567,845 |
|
| Germany - 6.8% | | | |
| Bayer AG | | 6,575 | 510,064 |
| CompuGroup Medical AG | | 1,696 | 108,575 |
| Continental AG | | 1,500 | 200,911 |
| CTS Eventim AG | | 862 | 52,155 |
| Daimler AG (Germany) | | 4,200 | 245,502 |
| Deutsche Borse AG | | 2,200 | 340,691 |
| DIC Asset AG | | 1,300 | 18,124 |
| Hannover Reuck SE | | 2,200 | 389,641 |
| HeidelbergCement Finance AG | | 4,500 | 334,356 |
| Linde PLC | | 5,552 | 1,097,558 |
| MTU Aero Engines Holdings AG | | 2,000 | 534,006 |
| Muenchener Rueckversicherungs-Gesellschaft AG in Muenchen | | 1,100 | 305,481 |
| Nexus AG | | 1,420 | 50,362 |
| Rheinmetall AG | | 1,700 | 204,485 |
| RWE AG | | 7,700 | 234,705 |
| SAP SE | | 10,433 | 1,382,388 |
| Vonovia SE | | 11,915 | 634,009 |
| WashTec AG | | 350 | 17,605 |
|
| TOTAL GERMANY | | | 6,660,618 |
|
| Greece - 0.0% | | | |
| Motor Oil (HELLAS) Corinth Refineries SA | | 500 | 12,346 |
| Hong Kong - 2.5% | | | |
| AIA Group Ltd. | | 101,000 | 1,005,781 |
| China Resources Beer Holdings Co. Ltd. | | 142,000 | 728,038 |
| CNOOC Ltd. sponsored ADR | | 2,218 | 329,462 |
| Hong Kong Exchanges and Clearing Ltd. | | 12,200 | 380,079 |
|
| TOTAL HONG KONG | | | 2,443,360 |
|
| India - 1.6% | | | |
| Embassy Office Parks (REIT) | | 5,600 | 32,554 |
| Housing Development Finance Corp. Ltd. | | 22,494 | 674,604 |
| Infosys Ltd. sponsored ADR | | 23,371 | 224,128 |
| Jyothy Laboratories Ltd. | | 5,588 | 13,768 |
| Larsen & Toubro Ltd. | | 11,600 | 240,504 |
| Shree Cement Ltd. | | 700 | 196,090 |
| Solar Industries India Ltd. (b) | | 15,200 | 227,003 |
|
| TOTAL INDIA | | | 1,608,651 |
|
| Indonesia - 0.4% | | | |
| PT Bank Mandiri (Persero) Tbk | | 526,400 | 263,131 |
| PT Bank Rakyat Indonesia Tbk | | 449,600 | 134,716 |
|
| TOTAL INDONESIA | | | 397,847 |
|
| Ireland - 0.9% | | | |
| CRH PLC | | 9,718 | 353,830 |
| CRH PLC sponsored ADR | | 13,029 | 475,559 |
| FBD Holdings PLC | | 1,972 | 19,486 |
|
| TOTAL IRELAND | | | 848,875 |
|
| Israel - 0.7% | | | |
| Azrieli Group | | 232 | 17,872 |
| Elbit Systems Ltd. (Israel) | | 3,463 | 567,431 |
| Ituran Location & Control Ltd. | | 2,161 | 53,009 |
| Strauss Group Ltd. | | 2,059 | 62,335 |
| Tel Aviv Stock Exchange Ltd. | | 7,200 | 26,659 |
|
| TOTAL ISRAEL | | | 727,306 |
|
| Italy - 1.6% | | | |
| Assicurazioni Generali SpA | | 13,900 | 281,761 |
| Enel SpA | | 84,700 | 656,456 |
| Interpump Group SpA | | 8,091 | 221,627 |
| Intesa Sanpaolo SpA | | 94,900 | 237,803 |
| Mediobanca SpA | | 18,134 | 215,395 |
|
| TOTAL ITALY | | | 1,613,042 |
|
| Japan - 14.8% | | | |
| Ai Holdings Corp. | | 1,100 | 19,936 |
| Aoki Super Co. Ltd. | | 1,000 | 23,799 |
| Artnature, Inc. | | 2,000 | 13,285 |
| Aucnet, Inc. | | 1,300 | 17,855 |
| Azbil Corp. | | 14,700 | 409,060 |
| Broadleaf Co. Ltd. | | 7,000 | 39,328 |
| Central Automotive Products Ltd. | | 2,400 | 46,970 |
| Coca-Cola West Co. Ltd. | | 900 | 20,434 |
| Daiichikosho Co. Ltd. | | 1,300 | 61,799 |
| Daikokutenbussan Co. Ltd. | | 700 | 21,840 |
| DENSO Corp. | | 9,200 | 427,155 |
| East Japan Railway Co. | | 2,500 | 226,953 |
| Fanuc Corp. | | 3,200 | 631,198 |
| Funai Soken Holdings, Inc. | | 1,250 | 30,117 |
| GCA Savvian Group Corp. | | 2,200 | 17,593 |
| Goldcrest Co. Ltd. | | 2,760 | 57,013 |
| Hitachi High-Technologies Corp. | | 3,300 | 205,312 |
| Hoya Corp. | | 10,100 | 892,610 |
| Ibiden Co. Ltd. | | 3,800 | 87,745 |
| Idemitsu Kosan Co. Ltd. | | 6,900 | 202,827 |
| Itochu Corp. | | 19,600 | 409,795 |
| Kao Corp. | | 2,900 | 233,156 |
| Keyence Corp. | | 1,542 | 975,001 |
| Kobayashi Pharmaceutical Co. Ltd. | | 550 | 43,978 |
| Koshidaka Holdings Co. Ltd. | | 5,800 | 84,222 |
| Kusuri No Aoki Holdings Co. Ltd. | | 600 | 44,746 |
| Lasertec Corp. | | 1,800 | 129,395 |
| Medikit Co. Ltd. | | 600 | 38,021 |
| Minebea Mitsumi, Inc. | | 15,600 | 296,268 |
| Miroku Jyoho Service Co., Ltd. | | 800 | 21,086 |
| Misumi Group, Inc. | | 17,800 | 447,470 |
| Mitsubishi Estate Co. Ltd. | | 8,900 | 172,797 |
| Mitsubishi UFJ Financial Group, Inc. | | 92,600 | 480,065 |
| Mitsuboshi Belting Ltd. | | 1,500 | 28,224 |
| Mitsui Fudosan Co. Ltd. | | 8,800 | 225,129 |
| Nabtesco Corp. | | 6,500 | 206,926 |
| Nagaileben Co. Ltd. | | 2,900 | 69,131 |
| Nihon Parkerizing Co. Ltd. | | 7,500 | 87,937 |
| Nintendo Co. Ltd. | | 300 | 110,036 |
| NS Tool Co. Ltd. | | 1,200 | 23,396 |
| OBIC Co. Ltd. | | 3,300 | 413,177 |
| Oracle Corp. Japan | | 2,400 | 210,951 |
| ORIX Corp. | | 23,300 | 366,157 |
| OSG Corp. | | 11,800 | 252,396 |
| Paramount Bed Holdings Co. Ltd. | | 1,500 | 57,356 |
| ProNexus, Inc. | | 2,000 | 23,468 |
| Recruit Holdings Co. Ltd. | | 13,900 | 461,953 |
| San-Ai Oil Co. Ltd. | | 5,000 | 52,346 |
| Shin-Etsu Chemical Co. Ltd. | | 3,500 | 390,254 |
| Shinsei Bank Ltd. | | 15,600 | 243,200 |
| SHO-BOND Holdings Co. Ltd. | | 10,480 | 406,734 |
| Shoei Co. Ltd. | | 2,000 | 87,060 |
| SK Kaken Co. Ltd. | | 120 | 51,243 |
| SoftBank Corp. | | 1,600 | 61,546 |
| Software Service, Inc. | | 500 | 53,904 |
| Sony Corp. | | 2,400 | 146,086 |
| Sony Financial Holdings, Inc. | | 12,800 | 275,372 |
| Sumitomo Mitsui Financial Group, Inc. | | 13,600 | 482,843 |
| Suzuki Motor Corp. | | 2,700 | 127,478 |
| Takeda Pharmaceutical Co. Ltd. | | 9,761 | 352,695 |
| Techno Medica Co. Ltd. | | 500 | 10,389 |
| The Monogatari Corp. | | 280 | 24,182 |
| TKC Corp. | | 700 | 29,488 |
| Tocalo Co. Ltd. | | 2,500 | 24,647 |
| Tokio Marine Holdings, Inc. | | 8,900 | 481,184 |
| Tokyo Electron Ltd. | | 800 | 162,079 |
| Toyota Motor Corp. | | 14,100 | 978,270 |
| USS Co. Ltd. | | 31,400 | 608,161 |
| Welcia Holdings Co. Ltd. | | 500 | 28,730 |
| Workman Co. Ltd. | | 600 | 42,468 |
| Yamada Consulting Group Co. Ltd. | | 1,100 | 19,831 |
| Yamato Kogyo Co. Ltd. | | 600 | 15,565 |
|
| TOTAL JAPAN | | | 14,520,821 |
|
| Kenya - 0.1% | | | |
| Safaricom Ltd. | | 482,100 | 138,843 |
| Korea (South) - 3.3% | | | |
| BGF Retail Co. Ltd. | | 735 | 111,793 |
| Leeno Industrial, Inc. | | 264 | 12,001 |
| Samsung Electronics Co. Ltd. | | 56,327 | 2,425,789 |
| Shinhan Financial Group Co. Ltd. | | 20,130 | 729,151 |
|
| TOTAL KOREA (SOUTH) | | | 3,278,734 |
|
| Mexico - 0.9% | | | |
| CEMEX S.A.B. de CV sponsored ADR | | 60,700 | 228,839 |
| Grupo Financiero Banorte S.A.B. de CV Series O | | 127,200 | 694,305 |
|
| TOTAL MEXICO | | | 923,144 |
|
| Netherlands - 2.2% | | | |
| Aalberts Industries NV | | 2,100 | 84,457 |
| AerCap Holdings NV (b) | | 3,800 | 219,944 |
| ASML Holding NV (Netherlands) | | 4,500 | 1,179,516 |
| ING Groep NV (Certificaten Van Aandelen) | | 28,276 | 320,183 |
| Koninklijke Philips Electronics NV | | 5,647 | 247,757 |
| Prosus NV (b) | | 1,650 | 113,782 |
| Takeaway.com Holding BV (a)(b) | | 330 | 26,868 |
|
| TOTAL NETHERLANDS | | | 2,192,507 |
|
| New Zealand - 0.2% | | | |
| Auckland International Airport Ltd. | | 27,737 | 165,308 |
| Norway - 0.4% | | | |
| Adevinta ASA: | | | |
| rights 11/12/19 (b) | | 3,600 | 550 |
| Class B | | 13,133 | 149,950 |
| Kongsberg Gruppen ASA | | 4,200 | 62,022 |
| Schibsted ASA (B Shares) | | 6,033 | 168,470 |
| Skandiabanken ASA (a) | | 3,000 | 21,302 |
|
| TOTAL NORWAY | | | 402,294 |
|
| Peru - 0.8% | | | |
| Compania de Minas Buenaventura SA sponsored ADR | | 48,863 | 749,558 |
| Philippines - 0.4% | | | |
| Ayala Land, Inc. | | 393,400 | 375,685 |
| Jollibee Food Corp. | | 5,950 | 27,169 |
|
| TOTAL PHILIPPINES | | | 402,854 |
|
| Portugal - 0.2% | | | |
| Galp Energia SGPS SA Class B | | 10,992 | 175,815 |
| Russia - 1.5% | | | |
| Lukoil PJSC sponsored ADR | | 5,000 | 459,800 |
| MMC Norilsk Nickel PJSC sponsored ADR | | 19,300 | 534,610 |
| Sberbank of Russia sponsored ADR | | 35,100 | 515,970 |
|
| TOTAL RUSSIA | | | 1,510,380 |
|
| Singapore - 0.7% | | | |
| CapitaLand Ltd. | | 142,800 | 377,452 |
| United Overseas Bank Ltd. | | 16,000 | 314,999 |
|
| TOTAL SINGAPORE | | | 692,451 |
|
| South Africa - 0.8% | | | |
| Clicks Group Ltd. | | 18,099 | 294,389 |
| Impala Platinum Holdings Ltd. (b) | | 38,063 | 261,596 |
| Naspers Ltd. Class N | | 1,350 | 191,037 |
|
| TOTAL SOUTH AFRICA | | | 747,022 |
|
| Spain - 1.9% | | | |
| Amadeus IT Holding SA Class A | | 8,900 | 658,502 |
| Banco Santander SA (Spain) | | 160,830 | 644,669 |
| Cellnex Telecom SA (a) | | 3,800 | 163,846 |
| Masmovil Ibercom SA (b) | | 6,005 | 138,770 |
| Prosegur Compania de Seguridad SA (Reg.) | | 43,776 | 169,905 |
| Unicaja Banco SA (a) | | 60,300 | 54,575 |
|
| TOTAL SPAIN | | | 1,830,267 |
|
| Sweden - 2.8% | | | |
| Addlife AB | | 1,814 | 40,580 |
| AddTech AB (B Shares) | | 2,800 | 77,861 |
| ASSA ABLOY AB (B Shares) | | 31,100 | 738,575 |
| Atlas Copco AB (A Shares) | | 13,600 | 480,437 |
| Epiroc AB Class A | | 19,900 | 223,820 |
| Ericsson (B Shares) | | 37,600 | 328,579 |
| Fagerhult AB | | 10,479 | 62,077 |
| Investor AB (B Shares) | | 8,355 | 427,887 |
| Lagercrantz Group AB (B Shares) | | 4,400 | 56,505 |
| Loomis AB (B Shares) | | 3,600 | 139,068 |
| Saab AB (B Shares) | | 1,000 | 30,832 |
| Swedbank AB (A Shares) | | 9,700 | 135,670 |
|
| TOTAL SWEDEN | | | 2,741,891 |
|
| Switzerland - 4.8% | | | |
| Nestle SA (Reg. S) | | 16,966 | 1,815,045 |
| Roche Holding AG (participation certificate) | | 3,824 | 1,150,856 |
| Schindler Holding AG: | | | |
| (participation certificate) | | 1,699 | 415,407 |
| (Reg.) | | 180 | 42,550 |
| Swiss Life Holding AG | | 550 | 274,972 |
| Tecan Group AG | | 240 | 56,734 |
| UBS Group AG | | 26,589 | 312,953 |
| Zurich Insurance Group Ltd. | | 1,622 | 633,838 |
|
| TOTAL SWITZERLAND | | | 4,702,355 |
|
| Taiwan - 3.4% | | | |
| Addcn Technology Co. Ltd. | | 3,772 | 30,796 |
| Realtek Semiconductor Corp. | | 32,000 | 237,655 |
| Sporton International, Inc. | | 38,000 | 236,737 |
| Taiwan Semiconductor Manufacturing Co. Ltd. | | 200,035 | 1,956,608 |
| Unified-President Enterprises Corp. | | 260,000 | 641,091 |
| Yageo Corp. | | 24,000 | 247,098 |
|
| TOTAL TAIWAN | | | 3,349,985 |
|
| Thailand - 0.2% | | | |
| Siam Cement PCL (For. Reg.) | | 15,100 | 183,655 |
| United Kingdom - 8.3% | | | |
| Alliance Pharma PLC | | 31,814 | 30,496 |
| Ascential PLC (a) | | 5,762 | 26,064 |
| AstraZeneca PLC (United Kingdom) | | 4,089 | 398,748 |
| Aviva PLC | | 52,624 | 283,646 |
| Avon Rubber PLC | | 2,200 | 50,612 |
| BAE Systems PLC | | 16,400 | 122,503 |
| Beazley PLC | | 15,800 | 120,036 |
| BHP Billiton PLC | | 45,065 | 955,853 |
| Bodycote PLC | | 1,900 | 17,622 |
| BP PLC | | 163,349 | 1,035,856 |
| British American Tobacco PLC (United Kingdom) | | 6,273 | 219,404 |
| Cineworld Group PLC | | 6,200 | 17,885 |
| Dechra Pharmaceuticals PLC | | 2,300 | 78,356 |
| DP Poland PLC (b) | | 52,800 | 3,146 |
| Elementis PLC | | 54,935 | 105,815 |
| Great Portland Estates PLC | | 2,906 | 29,648 |
| Hilton Food Group PLC | | 2,654 | 34,929 |
| Howden Joinery Group PLC | | 3,900 | 29,169 |
| Imperial Tobacco Group PLC | | 8,047 | 176,410 |
| Informa PLC | | 38,783 | 389,341 |
| InterContinental Hotel Group PLC ADR | | 8,925 | 540,766 |
| ITE Group PLC | | 29,700 | 29,893 |
| Lloyds Banking Group PLC | | 689,968 | 507,546 |
| London Stock Exchange Group PLC | | 2,800 | 252,333 |
| M&G PLC (b) | | 22,240 | 61,593 |
| Micro Focus International PLC | | 5,082 | 69,752 |
| Network International Holdings PLC (a) | | 3,600 | 25,228 |
| Prudential PLC | | 23,240 | 405,929 |
| Rightmove PLC | | 28,800 | 223,314 |
| Royal Dutch Shell PLC Class B sponsored ADR | | 8,800 | 512,952 |
| RSA Insurance Group PLC | | 33,500 | 226,637 |
| Shaftesbury PLC | | 2,404 | 29,428 |
| Spectris PLC | | 9,670 | 299,623 |
| Spirax-Sarco Engineering PLC | | 1,399 | 143,616 |
| Standard Chartered PLC (United Kingdom) | | 40,938 | 371,734 |
| Standard Life PLC | | 61,159 | 240,440 |
| The Weir Group PLC | | 3,404 | 59,372 |
| Topps Tiles PLC | | 16,600 | 16,192 |
| Ultra Electronics Holdings PLC | | 1,301 | 32,862 |
|
| TOTAL UNITED KINGDOM | | | 8,174,749 |
|
| United States of America - 6.7% | | | |
| Alphabet, Inc. Class A (b) | | 178 | 224,066 |
| Autoliv, Inc. | | 2,974 | 231,496 |
| Berkshire Hathaway, Inc. Class B (b) | | 1,516 | 322,271 |
| Black Knight, Inc. (b) | | 3,900 | 250,380 |
| ConocoPhillips Co. | | 2,400 | 132,480 |
| Lam Research Corp. | | 700 | 189,728 |
| Marsh & McLennan Companies, Inc. | | 4,500 | 466,290 |
| Martin Marietta Materials, Inc. | | 1,410 | 369,293 |
| MasterCard, Inc. Class A | | 3,080 | 852,575 |
| MercadoLibre, Inc. (b) | | 434 | 226,340 |
| Moody's Corp. | | 1,800 | 397,242 |
| Morningstar, Inc. | | 200 | 32,368 |
| MSCI, Inc. | | 1,700 | 398,752 |
| PayPal Holdings, Inc. (b) | | 1,900 | 197,790 |
| PriceSmart, Inc. | | 1,425 | 105,593 |
| ResMed, Inc. | | 3,360 | 497,011 |
| S&P Global, Inc. | | 1,500 | 386,985 |
| Sherwin-Williams Co. | | 840 | 480,749 |
| Visa, Inc. Class A | | 4,657 | 832,951 |
|
| TOTAL UNITED STATES OF AMERICA | | | 6,594,360 |
|
| TOTAL COMMON STOCKS | | | |
| (Cost $81,957,526) | | | 95,659,949 |
|
| Nonconvertible Preferred Stocks - 1.2% | | | |
| Brazil - 0.7% | | | |
| Itau Unibanco Holding SA | | 26,655 | 240,796 |
| Petroleo Brasileiro SA - Petrobras sponsored ADR | | 30,767 | 499,656 |
|
| TOTAL BRAZIL | | | 740,452 |
|
| Germany - 0.5% | | | |
| Porsche Automobil Holding SE (Germany) | | 5,476 | 403,201 |
| Sartorius AG (non-vtg.) | | 250 | 48,571 |
|
| TOTAL GERMANY | | | 451,772 |
|
| TOTAL NONCONVERTIBLE PREFERRED STOCKS | | | |
| (Cost $1,084,399) | | | 1,192,224 |
|
| Money Market Funds - 1.2% | | | |
| Fidelity Cash Central Fund 1.83% (c) | | | |
| (Cost $1,173,661) | | 1,173,440 | 1,173,674 |
| TOTAL INVESTMENT IN SECURITIES - 99.7% | | | |
| (Cost $84,215,586) | | | 98,025,847 |
| NET OTHER ASSETS (LIABILITIES) - 0.3% | | | 311,923 |
| NET ASSETS - 100% | | | $98,337,770 |
Categorizations in the Schedule of Investments are based on country or territory of incorporation.
Legend
(a) Security exempt from registration under Rule 144A of the Securities Act of 1933. These securities may be resold in transactions exempt from registration, normally to qualified institutional buyers. At the end of the period, the value of these securities amounted to $597,404 or 0.6% of net assets.
(b) Non-income producing
(c) Affiliated fund that is generally available only to investment companies and other accounts managed by Fidelity Investments. The rate quoted is the annualized seven-day yield of the fund at period end. A complete unaudited listing of the fund's holdings as of its most recent quarter end is available upon request. In addition, each Fidelity Central Fund's financial statements [[, which are not covered by the Fund's Report of Independent Registered Public Accounting Firm,]] are available on the SEC's website or upon request.
Affiliated Central Funds
Information regarding fiscal year to date income earned by the Fund from investments in Fidelity Central Funds is as follows:
| Fund | Income earned |
| Fidelity Cash Central Fund | $25,750 |
| Fidelity Securities Lending Cash Central Fund | 10,765 |
| Total | $36,515 |
Amounts in the income column in the above table include any capital gain distributions from underlying funds, which are presented in the corresponding line-item in the Statement of Operations, if applicable. Amount for Fidelity Securities Lending Cash Central Fund represents the income earned on investing cash collateral, less rebates paid to borrowers and any lending agent fees associated with the loan, plus any premium payments received for lending certain types of securities.
Investment Valuation
The following is a summary of the inputs used, as of October 31, 2019, involving the Fund's assets and liabilities carried at fair value. The inputs or methodology used for valuing securities may not be an indication of the risk associated with investing in those securities. For more information on valuation inputs, and their aggregation into the levels used below, please refer to the Investment Valuation section in the accompanying Notes to Financial Statements.
| | Valuation Inputs at Reporting Date: |
| Description | Total | Level 1 | Level 2 | Level 3 |
| Investments in Securities: | | | | |
| Equities: | | | | |
| Communication Services | $4,102,524 | $2,025,418 | $2,077,106 | $-- |
| Consumer Discretionary | 7,991,962 | 2,165,998 | 5,825,964 | -- |
| Consumer Staples | 5,957,851 | 2,486,915 | 3,470,936 | -- |
| Energy | 5,649,756 | 2,616,385 | 3,033,371 | -- |
| Financials | 24,122,298 | 11,271,765 | 12,850,533 | -- |
| Health Care | 6,217,494 | 1,007,151 | 5,210,343 | -- |
| Industrials | 14,630,636 | 9,200,282 | 5,430,354 | -- |
| Information Technology | 16,056,976 | 7,971,235 | 8,085,741 | -- |
| Materials | 9,165,315 | 6,434,206 | 2,731,109 | -- |
| Real Estate | 1,969,711 | 729,081 | 1,240,630 | -- |
| Utilities | 987,650 | 331,194 | 656,456 | -- |
| Money Market Funds | 1,173,674 | 1,173,674 | -- | -- |
| Total Investments in Securities: | $98,025,847 | $47,413,304 | $50,612,543 | $-- |
See accompanying notes which are an integral part of the financial statements.
Financial Statements
Statement of Assets and Liabilities
| | | October 31, 2019 |
| Assets | | |
Investment in securities, at value — See accompanying schedule:
Unaffiliated issuers (cost $83,041,925) | $96,852,173 | |
| Fidelity Central Funds (cost $1,173,661) | 1,173,674 | |
| Total Investment in Securities (cost $84,215,586) | | $98,025,847 |
| Cash | | 78,097 |
| Foreign currency held at value (cost $11,164) | | 11,167 |
| Receivable for investments sold | | 46,820 |
| Receivable for fund shares sold | | 17,881 |
| Dividends receivable | | 579,522 |
| Distributions receivable from Fidelity Central Funds | | 1,302 |
| Prepaid expenses | | 177 |
| Receivable from investment adviser for expense reductions | | 7,137 |
| Other receivables | | 24,583 |
| Total assets | | 98,792,533 |
| Liabilities | | |
| Payable for investments purchased | $231,736 | |
| Payable for fund shares redeemed | 29,970 | |
| Accrued management fee | 63,209 | |
| Audit fee | 51,714 | |
| Custody fee | 50,111 | |
| Distribution and service plan fees payable | 8,133 | |
| Other affiliated payables | 18,344 | |
| Other payables and accrued expenses | 1,546 | |
| Total liabilities | | 454,763 |
| Net Assets | | $98,337,770 |
| Net Assets consist of: | | |
| Paid in capital | | $83,744,607 |
| Total accumulated earnings (loss) | | 14,593,163 |
| Net Assets | | $98,337,770 |
| Net Asset Value and Maximum Offering Price | | |
| Class A: | | |
| Net Asset Value and redemption price per share ($7,249,169 ÷ 775,910 shares)(a) | | $9.34 |
| Maximum offering price per share (100/94.25 of $9.34) | | $9.91 |
| Class M: | | |
| Net Asset Value and redemption price per share ($11,732,882 ÷ 1,250,262 shares)(a) | | $9.38 |
| Maximum offering price per share (100/96.50 of $9.38) | | $9.72 |
| Class C: | | |
| Net Asset Value and offering price per share ($2,203,465 ÷ 236,814 shares)(a) | | $9.30 |
| Total International Equity: | | |
| Net Asset Value, offering price and redemption price per share ($70,251,093 ÷ 7,493,991 shares) | | $9.37 |
| Class I: | | |
| Net Asset Value, offering price and redemption price per share ($3,086,140 ÷ 330,239 shares) | | $9.35 |
| Class Z: | | |
| Net Asset Value, offering price and redemption price per share ($3,815,021 ÷ 407,510 shares) | | $9.36 |
(a) Redemption price per share is equal to net asset value less any applicable contingent deferred sales charge.
See accompanying notes which are an integral part of the financial statements.
Statement of Operations
| | | Year ended October 31, 2019 |
| Investment Income | | |
| Dividends | | $2,613,582 |
| Non-Cash dividends | | 494,522 |
| Income from Fidelity Central Funds (including $10,765 from security lending) | | 36,515 |
| Income before foreign taxes withheld | | 3,144,619 |
| Less foreign taxes withheld | | (251,574) |
| Total income | | 2,893,045 |
| Expenses | | |
| Management fee | | |
| Basic fee | $664,032 | |
| Performance adjustment | (52,842) | |
| Transfer agent fees | 180,391 | |
| Distribution and service plan fees | 101,847 | |
| Accounting and security lending fees | 50,043 | |
| Custodian fees and expenses | 120,847 | |
| Independent trustees' fees and expenses | 554 | |
| Registration fees | 79,891 | |
| Audit | 126,099 | |
| Legal | 2,356 | |
| Miscellaneous | 1,160 | |
| Total expenses before reductions | 1,274,378 | |
| Expense reductions | (26,561) | |
| Total expenses after reductions | | 1,247,817 |
| Net investment income (loss) | | 1,645,228 |
| Realized and Unrealized Gain (Loss) | | |
| Net realized gain (loss) on: | | |
| Investment securities: | | |
| Unaffiliated issuers | 1,186,592 | |
| Fidelity Central Funds | 68 | |
| Foreign currency transactions | (34,689) | |
| Total net realized gain (loss) | | 1,151,971 |
| Change in net unrealized appreciation (depreciation) on: | | |
| Investment securities: | | |
| Unaffiliated issuers | 10,500,505 | |
| Fidelity Central Funds | 13 | |
| Assets and liabilities in foreign currencies | 14,056 | |
| Total change in net unrealized appreciation (depreciation) | | 10,514,574 |
| Net gain (loss) | | 11,666,545 |
| Net increase (decrease) in net assets resulting from operations | | $13,311,773 |
See accompanying notes which are an integral part of the financial statements.
Statement of Changes in Net Assets
| | Year ended October 31, 2019 | Year ended October 31, 2018 |
| Increase (Decrease) in Net Assets | | |
| Operations | | |
| Net investment income (loss) | $1,645,228 | $1,241,108 |
| Net realized gain (loss) | 1,151,971 | 1,021,879 |
| Change in net unrealized appreciation (depreciation) | 10,514,574 | (12,603,126) |
| Net increase (decrease) in net assets resulting from operations | 13,311,773 | (10,340,139) |
| Distributions to shareholders | (764,299) | (4,673,480) |
| Share transactions - net increase (decrease) | (17,112,594) | 419,996 |
| Redemption fees | – | 13 |
| Total increase (decrease) in net assets | (4,565,120) | (14,593,610) |
| Net Assets | | |
| Beginning of period | 102,902,890 | 117,496,500 |
| End of period | $98,337,770 | $102,902,890 |
See accompanying notes which are an integral part of the financial statements.
Financial Highlights
Fidelity Total International Equity Fund Class A
| Years ended October 31, | 2019 | 2018 | 2017 | 2016 | 2015 |
| Selected Per–Share Data | | | | | |
| Net asset value, beginning of period | $8.20 | $9.39 | $7.67 | $7.79 | $8.00 |
| Income from Investment Operations | | | | | |
| Net investment income (loss)A | .14 | .08 | .09 | .08 | .07 |
| Net realized and unrealized gain (loss) | 1.05 | (.89) | 1.71 | (.14) | (.14) |
| Total from investment operations | 1.19 | (.81) | 1.80 | (.06) | (.07) |
| Distributions from net investment income | (.05) | (.15) | (.08) | (.06) | (.10) |
| Distributions from net realized gain | – | (.23) | – | – | (.04) |
| Total distributions | (.05) | (.38) | (.08) | (.06) | (.14) |
| Redemption fees added to paid in capitalA | – | –B | –B | –B | –B |
| Net asset value, end of period | $9.34 | $8.20 | $9.39 | $7.67 | $7.79 |
| Total ReturnC,D | 14.63% | (9.04)% | 23.78% | (.76)% | (.89)% |
| Ratios to Average Net AssetsE,F | | | | | |
| Expenses before reductions | 1.51% | 1.60% | 1.67% | 1.52% | 1.48% |
| Expenses net of fee waivers, if any | 1.45% | 1.45% | 1.45% | 1.45% | 1.45% |
| Expenses net of all reductions | 1.44% | 1.44% | 1.43% | 1.45% | 1.44% |
| Net investment income (loss) | 1.55% | .90% | 1.02% | 1.10% | .86% |
| Supplemental Data | | | | | |
| Net assets, end of period (000 omitted) | $7,249 | $7,526 | $9,292 | $8,576 | $9,163 |
| Portfolio turnover rateG | 69% | 52% | 66%H | 51% | 53% |
A Calculated based on average shares outstanding during the period.
B Amount represents less than $.005 per share.
C Total returns would have been lower if certain expenses had not been reduced during the applicable periods shown.
D Total returns do not include the effect of the sales charges.
E Fees and expenses of any underlying Fidelity Central Funds are not included in the Fund's expense ratio. The Fund indirectly bears its proportionate share of the expenses of any underlying Fidelity Central Funds.
F Expense ratios reflect operating expenses of the class. Expenses before reductions do not reflect amounts reimbursed by the investment adviser or reductions from brokerage service arrangements or reductions from other expense offset arrangements and do not represent the amount paid by the class during periods when reimbursements or reductions occur. Expenses net of fee waivers reflect expenses after reimbursement by the investment adviser but prior to reductions from brokerage service arrangements or other expense offset arrangements. Expenses net of all reductions represent the net expenses paid by the class.
G Amount does not include the portfolio activity of any underlying Fidelity Central Funds.
H Portfolio turnover rate excludes securities received or delivered in-kind.
See accompanying notes which are an integral part of the financial statements.
Fidelity Total International Equity Fund Class M
| Years ended October 31, | 2019 | 2018 | 2017 | 2016 | 2015 |
| Selected Per–Share Data | | | | | |
| Net asset value, beginning of period | $8.22 | $9.42 | $7.70 | $7.81 | $8.04 |
| Income from Investment Operations | | | | | |
| Net investment income (loss)A | .11 | .06 | .06 | .06 | .05 |
| Net realized and unrealized gain (loss) | 1.07 | (.90) | 1.73 | (.13) | (.15) |
| Total from investment operations | 1.18 | (.84) | 1.79 | (.07) | (.10) |
| Distributions from net investment income | (.02) | (.13) | (.07) | (.04) | (.09) |
| Distributions from net realized gain | – | (.23) | – | – | (.04) |
| Total distributions | (.02) | (.36) | (.07) | (.04) | (.13) |
| Redemption fees added to paid in capitalA | – | –B | –B | –B | –B |
| Net asset value, end of period | $9.38 | $8.22 | $9.42 | $7.70 | $7.81 |
| Total ReturnC,D | 14.38% | (9.30)% | 23.41% | (.86)% | (1.26)% |
| Ratios to Average Net AssetsE,F | | | | | |
| Expenses before reductions | 1.76% | 1.85% | 1.90% | 1.73% | 1.70% |
| Expenses net of fee waivers, if any | 1.70% | 1.70% | 1.70% | 1.70% | 1.70% |
| Expenses net of all reductions | 1.69% | 1.69% | 1.68% | 1.69% | 1.69% |
| Net investment income (loss) | 1.30% | .65% | .77% | .85% | .61% |
| Supplemental Data | | | | | |
| Net assets, end of period (000 omitted) | $11,733 | $11,882 | $15,894 | $13,893 | $13,962 |
| Portfolio turnover rateG | 69% | 52% | 66%H | 51% | 53% |
A Calculated based on average shares outstanding during the period.
B Amount represents less than $.005 per share.
C Total returns would have been lower if certain expenses had not been reduced during the applicable periods shown.
D Total returns do not include the effect of the sales charges.
E Fees and expenses of any underlying Fidelity Central Funds are not included in the Fund's expense ratio. The Fund indirectly bears its proportionate share of the expenses of any underlying Fidelity Central Funds.
F Expense ratios reflect operating expenses of the class. Expenses before reductions do not reflect amounts reimbursed by the investment adviser or reductions from brokerage service arrangements or reductions from other expense offset arrangements and do not represent the amount paid by the class during periods when reimbursements or reductions occur. Expenses net of fee waivers reflect expenses after reimbursement by the investment adviser but prior to reductions from brokerage service arrangements or other expense offset arrangements. Expenses net of all reductions represent the net expenses paid by the class.
G Amount does not include the portfolio activity of any underlying Fidelity Central Funds.
H Portfolio turnover rate excludes securities received or delivered in-kind.
See accompanying notes which are an integral part of the financial statements.
Fidelity Total International Equity Fund Class C
| Years ended October 31, | 2019 | 2018 | 2017 | 2016 | 2015 |
| Selected Per–Share Data | | | | | |
| Net asset value, beginning of period | $8.17 | $9.37 | $7.66 | $7.77 | $8.00 |
| Income from Investment Operations | | | | | |
| Net investment income (loss)A | .07 | .01 | .02 | .03 | .01 |
| Net realized and unrealized gain (loss) | 1.06 | (.89) | 1.71 | (.14) | (.15) |
| Total from investment operations | 1.13 | (.88) | 1.73 | (.11) | (.14) |
| Distributions from net investment income | – | (.10) | (.02) | – | (.05) |
| Distributions from net realized gain | – | (.23) | – | – | (.04) |
| Total distributions | – | (.32)B | (.02) | – | (.09) |
| Redemption fees added to paid in capitalA | – | –C | –C | –C | –C |
| Net asset value, end of period | $9.30 | $8.17 | $9.37 | $7.66 | $7.77 |
| Total ReturnD,E | 13.83% | (9.72)% | 22.70% | (1.42)% | (1.73)% |
| Ratios to Average Net AssetsF,G | | | | | |
| Expenses before reductions | 2.33% | 2.43% | 2.48% | 2.30% | 2.26% |
| Expenses net of fee waivers, if any | 2.20% | 2.20% | 2.20% | 2.20% | 2.20% |
| Expenses net of all reductions | 2.19% | 2.19% | 2.18% | 2.20% | 2.19% |
| Net investment income (loss) | .80% | .14% | .27% | .35% | .11% |
| Supplemental Data | | | | | |
| Net assets, end of period (000 omitted) | $2,203 | $2,705 | $3,211 | $2,713 | $3,311 |
| Portfolio turnover rateH | 69% | 52% | 66%I | 51% | 53% |
A Calculated based on average shares outstanding during the period.
B Total distributions of $.32 per share is comprised of distributions from net investment income of $.097 and distributions from net realized gain of $.226 per share.
C Amount represents less than $.005 per share.
D Total returns would have been lower if certain expenses had not been reduced during the applicable periods shown.
E Total returns do not include the effect of the contingent deferred sales charge.
F Fees and expenses of any underlying Fidelity Central Funds are not included in the Fund's expense ratio. The Fund indirectly bears its proportionate share of the expenses of any underlying Fidelity Central Funds.
G Expense ratios reflect operating expenses of the class. Expenses before reductions do not reflect amounts reimbursed by the investment adviser or reductions from brokerage service arrangements or reductions from other expense offset arrangements and do not represent the amount paid by the class during periods when reimbursements or reductions occur. Expenses net of fee waivers reflect expenses after reimbursement by the investment adviser but prior to reductions from brokerage service arrangements or other expense offset arrangements. Expenses net of all reductions represent the net expenses paid by the class.
H Amount does not include the portfolio activity of any underlying Fidelity Central Funds.
I Portfolio turnover rate excludes securities received or delivered in-kind.
See accompanying notes which are an integral part of the financial statements.
Fidelity Total International Equity Fund
| Years ended October 31, | 2019 | 2018 | 2017 | 2016 | 2015 |
| Selected Per–Share Data | | | | | |
| Net asset value, beginning of period | $8.23 | $9.40 | $7.70 | $7.82 | $8.03 |
| Income from Investment Operations | | | | | |
| Net investment income (loss)A | .16 | .11 | .11 | .11 | .10 |
| Net realized and unrealized gain (loss) | 1.06 | (.90) | 1.70 | (.13) | (.14) |
| Total from investment operations | 1.22 | (.79) | 1.81 | (.02) | (.04) |
| Distributions from net investment income | (.08) | (.15) | (.11) | (.10) | (.13) |
| Distributions from net realized gain | – | (.23) | – | – | (.04) |
| Total distributions | (.08) | (.38) | (.11) | (.10) | (.17) |
| Redemption fees added to paid in capitalA | – | –B | –B | –B | –B |
| Net asset value, end of period | $9.37 | $8.23 | $9.40 | $7.70 | $7.82 |
| Total ReturnC | 14.97% | (8.84)% | 23.86% | (.32)% | (.51)% |
| Ratios to Average Net AssetsD,E | | | | | |
| Expenses before reductions | 1.20% | 1.29% | 1.15% | 1.11% | 1.07% |
| Expenses net of fee waivers, if any | 1.20% | 1.20% | 1.14% | 1.11% | 1.07% |
| Expenses net of all reductions | 1.19% | 1.19% | 1.13% | 1.10% | 1.06% |
| Net investment income (loss) | 1.81% | 1.15% | 1.33% | 1.44% | 1.24% |
| Supplemental Data | | | | | |
| Net assets, end of period (000 omitted) | $70,251 | $71,170 | $82,077 | $280,672 | $307,035 |
| Portfolio turnover rateF | 69% | 52% | 66%G | 51% | 53% |
A Calculated based on average shares outstanding during the period.
B Amount represents less than $.005 per share.
C Total returns would have been lower if certain expenses had not been reduced during the applicable periods shown.
D Fees and expenses of any underlying Fidelity Central Funds are not included in the Fund's expense ratio. The Fund indirectly bears its proportionate share of the expenses of any underlying Fidelity Central Funds.
E Expense ratios reflect operating expenses of the class. Expenses before reductions do not reflect amounts reimbursed by the investment adviser or reductions from brokerage service arrangements or reductions from other expense offset arrangements and do not represent the amount paid by the class during periods when reimbursements or reductions occur. Expenses net of fee waivers reflect expenses after reimbursement by the investment adviser but prior to reductions from brokerage service arrangements or other expense offset arrangements. Expenses net of all reductions represent the net expenses paid by the class.
F Amount does not include the portfolio activity of any underlying Fidelity Central Funds.
G Portfolio turnover rate excludes securities received or delivered in-kind.
See accompanying notes which are an integral part of the financial statements.
Fidelity Total International Equity Fund Class I
| Years ended October 31, | 2019 | 2018 | 2017 | 2016 | 2015 |
| Selected Per–Share Data | | | | | |
| Net asset value, beginning of period | $8.19 | $9.38 | $7.66 | $7.78 | $7.99 |
| Income from Investment Operations | | | | | |
| Net investment income (loss)A | .16 | .10 | .11 | .10 | .09 |
| Net realized and unrealized gain (loss) | 1.07 | (.89) | 1.71 | (.13) | (.14) |
| Total from investment operations | 1.23 | (.79) | 1.82 | (.03) | (.05) |
| Distributions from net investment income | (.07) | (.17) | (.10) | (.09) | (.12) |
| Distributions from net realized gain | – | (.23) | – | – | (.04) |
| Total distributions | (.07) | (.40) | (.10) | (.09) | (.16) |
| Redemption fees added to paid in capitalA | – | –B | –B | –B | –B |
| Net asset value, end of period | $9.35 | $8.19 | $9.38 | $7.66 | $7.78 |
| Total ReturnC | 15.11% | (8.86)% | 24.08% | (.43)% | (.64)% |
| Ratios to Average Net AssetsD,E | | | | | |
| Expenses before reductions | 1.18% | 1.29% | 1.42% | 1.22% | 1.17% |
| Expenses net of fee waivers, if any | 1.18% | 1.20% | 1.20% | 1.20% | 1.17% |
| Expenses net of all reductions | 1.17% | 1.19% | 1.18% | 1.20% | 1.16% |
| Net investment income (loss) | 1.82% | 1.15% | 1.28% | 1.35% | 1.14% |
| Supplemental Data | | | | | |
| Net assets, end of period (000 omitted) | $3,086 | $9,405 | $6,776 | $2,156 | $2,602 |
| Portfolio turnover rateF | 69% | 52% | 66%G | 51% | 53% |
A Calculated based on average shares outstanding during the period.
B Amount represents less than $.005 per share.
C Total returns would have been lower if certain expenses had not been reduced during the applicable periods shown.
D Fees and expenses of any underlying Fidelity Central Funds are not included in the Fund's expense ratio. The Fund indirectly bears its proportionate share of the expenses of any underlying Fidelity Central Funds.
E Expense ratios reflect operating expenses of the class. Expenses before reductions do not reflect amounts reimbursed by the investment adviser or reductions from brokerage service arrangements or reductions from other expense offset arrangements and do not represent the amount paid by the class during periods when reimbursements or reductions occur. Expenses net of fee waivers reflect expenses after reimbursement by the investment adviser but prior to reductions from brokerage service arrangements or other expense offset arrangements. Expenses net of all reductions represent the net expenses paid by the class.
F Amount does not include the portfolio activity of any underlying Fidelity Central Funds.
G Portfolio turnover rate excludes securities received or delivered in-kind.
See accompanying notes which are an integral part of the financial statements.
Fidelity Total International Equity Fund Class Z
| Years ended October 31, | 2019 | 2018 | 2017 A |
| Selected Per–Share Data | | | |
| Net asset value, beginning of period | $8.22 | $9.39 | $7.73 |
| Income from Investment Operations | | | |
| Net investment income (loss)B | .18 | .12 | .08 |
| Net realized and unrealized gain (loss) | 1.05 | (.89) | 1.58 |
| Total from investment operations | 1.23 | (.77) | 1.66 |
| Distributions from net investment income | (.09) | (.17) | – |
| Distributions from net realized gain | – | (.23) | – |
| Total distributions | (.09) | (.40) | – |
| Redemption fees added to paid in capitalB | – | –C | –C |
| Net asset value, end of period | $9.36 | $8.22 | $9.39 |
| Total ReturnD,E | 15.13% | (8.63)% | 21.47% |
| Ratios to Average Net AssetsF,G | | | |
| Expenses before reductions | 1.09% | 1.16% | 1.32%H |
| Expenses net of fee waivers, if any | 1.04% | 1.05% | 1.05%H |
| Expenses net of all reductions | 1.03% | 1.04% | 1.04%H |
| Net investment income (loss) | 1.97% | 1.30% | 1.27%H |
| Supplemental Data | | | |
| Net assets, end of period (000 omitted) | $3,815 | $216 | $246 |
| Portfolio turnover rateI | 69% | 52% | 66%J |
A For the period February 1, 2017 (commencement of sale of shares) to October 31, 2017.
B Calculated based on average shares outstanding during the period.
C Amount represents less than $.005 per share.
D Total returns for periods of less than one year are not annualized.
E Total returns would have been lower if certain expenses had not been reduced during the applicable periods shown.
F Fees and expenses of any underlying Fidelity Central Funds are not included in the Fund's expense ratio. The Fund indirectly bears its proportionate share of the expenses of any underlying Fidelity Central Funds.
G Expense ratios reflect operating expenses of the class. Expenses before reductions do not reflect amounts reimbursed by the investment adviser or reductions from brokerage service arrangements or reductions from other expense offset arrangements and do not represent the amount paid by the class during periods when reimbursements or reductions occur. Expense ratios before reductions for start-up periods may not be representative of longer-term operating periods. Expenses net of fee waivers reflect expenses after reimbursement by the investment adviser but prior to reductions from brokerage service arrangements or other expense offset arrangements. Expenses net of all reductions represent the net expenses paid by the class.
H Annualized
I Amount does not include the portfolio activity of any underlying Fidelity Central Funds.
J Portfolio turnover rate excludes securities received or delivered in-kind.
See accompanying notes which are an integral part of the financial statements.
Notes to Financial Statements
For the period ended October 31, 2019
1. Organization.
Fidelity Total International Equity Fund (the Fund) is a fund of Fidelity Investment Trust (the Trust) and is authorized to issue an unlimited number of shares. The Trust is registered under the Investment Company Act of 1940, as amended (the 1940 Act), as an open-end management investment company organized as a Massachusetts business trust. The Fund offers Class A, Class M, Class C, Total International Equity, Class I and Class Z shares, each of which has equal rights as to assets and voting privileges. Each class has exclusive voting rights with respect to matters that affect that class. Effective March 1, 2019, Class C shares will automatically convert to Class A shares after a holding period of ten years from the initial date of purchase, with certain exceptions. The Fund's investments in emerging markets can be subject to social, economic, regulatory, and political uncertainties and can be extremely volatile.
2. Investments in Fidelity Central Funds.
The Fund invests in Fidelity Central Funds, which are open-end investment companies generally available only to other investment companies and accounts managed by the investment adviser and its affiliates. The Fund's Schedule of Investments lists each of the Fidelity Central Funds held as of period end, if any, as an investment of the Fund, but does not include the underlying holdings of each Fidelity Central Fund. As an Investing Fund, the Fund indirectly bears its proportionate share of the expenses of the underlying Fidelity Central Funds.
The Money Market Central Funds seek preservation of capital and current income and are managed by Fidelity Investments Money Management, Inc. (FIMM), an affiliate of the investment adviser. Annualized expenses of the Money Market Central Funds as of their most recent shareholder report date ranged from less than .005% to .01%.
A complete unaudited list of holdings for each Fidelity Central Fund is available upon request or at the Securities and Exchange Commission (the SEC) website at www.sec.gov. In addition, the financial statements of the Fidelity Central Funds, which are not covered by the Fund's Report of Independent Registered Public Accounting Firm, are available on the SEC website or upon request.
3. Significant Accounting Policies.
The Fund is an investment company and applies the accounting and reporting guidance of the Financial Accounting Standards Board (FASB) Accounting Standards Codification Topic 946 Financial Services – Investments Companies. The financial statements have been prepared in conformity with accounting principles generally accepted in the United States of America (GAAP), which require management to make certain estimates and assumptions at the date of the financial statements. Actual results could differ from those estimates. Subsequent events, if any, through the date that the financial statements were issued have been evaluated in the preparation of the financial statements. The following summarizes the significant accounting policies of the Fund:
Investment Valuation. Investments are valued as of 4:00 p.m. Eastern time on the last calendar day of the period. The Board of Trustees (the Board) has delegated the day to day responsibility for the valuation of the Fund's investments to the Fair Value Committee (the Committee) established by the Fund's investment adviser. In accordance with valuation policies and procedures approved by the Board, the Fund attempts to obtain prices from one or more third party pricing vendors or brokers to value its investments. When current market prices, quotations or currency exchange rates are not readily available or reliable, investments will be fair valued in good faith by the Committee, in accordance with procedures adopted by the Board. Factors used in determining fair value vary by investment type and may include market or investment specific events. The frequency with which these procedures are used cannot be predicted and they may be utilized to a significant extent. The Committee oversees the Fund's valuation policies and procedures and reports to the Board on the Committee's activities and fair value determinations. The Board monitors the appropriateness of the procedures used in valuing the Fund's investments and ratifies the fair value determinations of the Committee.
The Fund categorizes the inputs to valuation techniques used to value its investments into a disclosure hierarchy consisting of three levels as shown below:
- Level 1 – quoted prices in active markets for identical investments
- Level 2 – other significant observable inputs (including quoted prices for similar investments, interest rates, prepayment speeds, etc.)
- Level 3 – unobservable inputs (including the Fund's own assumptions based on the best information available)
Valuation techniques used to value the Fund's investments by major category are as follows:
Equity securities, including restricted securities, for which market quotations are readily available, are valued at the last reported sale price or official closing price as reported by a third party pricing vendor on the primary market or exchange on which they are traded and are categorized as Level 1 in the hierarchy. In the event there were no sales during the day or closing prices are not available, securities are valued at the last quoted bid price or may be valued using the last available price and are generally categorized as Level 2 in the hierarchy. For foreign equity securities, when market or security specific events arise, comparisons to the valuation of American Depositary Receipts (ADRs), futures contracts, Exchange-Traded Funds (ETFs) and certain indexes as well as quoted prices for similar securities may be used and would be categorized as Level 2 in the hierarchy. For equity securities, including restricted securities, where observable inputs are limited, assumptions about market activity and risk are used and these securities may be categorized as Level 3 in the hierarchy.
Investments in open-end mutual funds, including the Fidelity Central Funds, are valued at their closing net asset value (NAV) each business day and are categorized as Level 1 in the hierarchy.
Changes in valuation techniques may result in transfers in or out of an assigned level within the disclosure hierarchy. The aggregate value of investments by input level as of October 31, 2019 is included at the end of the Fund's Schedule of Investments.
Foreign Currency. The Fund may use foreign currency contracts to facilitate transactions in foreign-denominated securities. Gains and losses from these transactions may arise from changes in the value of the foreign currency or if the counterparties do not perform under the contracts' terms.
Foreign-denominated assets, including investment securities, and liabilities are translated into U.S. dollars at the exchange rates at period end. Purchases and sales of investment securities, income and dividends received and expenses denominated in foreign currencies are translated into U.S. dollars at the exchange rate in effect on the transaction date.
The effects of exchange rate fluctuations on investments are included with the net realized and unrealized gain (loss) on investment securities. Other foreign currency transactions resulting in realized and unrealized gain (loss) are disclosed separately.
Investment Transactions and Income. For financial reporting purposes, the Fund's investment holdings and NAV include trades executed through the end of the last business day of the period. The NAV per share for processing shareholder transactions is calculated as of the close of business of the New York Stock Exchange (NYSE), normally 4:00 p.m. Eastern time and includes trades executed through the end of the prior business day. Gains and losses on securities sold are determined on the basis of identified cost and include proceeds received from litigation. Dividend income is recorded on the ex-dividend date, except for certain dividends from foreign securities where the ex-dividend date may have passed, which are recorded as soon as the Fund is informed of the ex-dividend date. Non-cash dividends included in dividend income, if any, are recorded at the fair market value of the securities received. Income and capital gain distributions from Fidelity Central Funds, if any, are recorded on the ex-dividend date. Certain distributions received by the Fund represent a return of capital or capital gain. The Fund determines the components of these distributions subsequent to the ex-dividend date, based upon receipt of tax filings or other correspondence relating to the underlying investment. These distributions are recorded as a reduction of cost of investments and/or as a realized gain. Investment income is recorded net of foreign taxes withheld where recovery of such taxes is uncertain.
Class Allocations and Expenses. Investment income, realized and unrealized capital gains and losses, common expenses of the Fund, and certain fund-level expense reductions, if any, are allocated daily on a pro-rata basis to each class based on the relative net assets of each class to the total net assets of the Fund. Each class differs with respect to transfer agent and distribution and service plan fees incurred. Certain expense reductions may also differ by class. For the reporting period, the allocated portion of income and expenses to each class as a percent of its average net assets may vary due to the timing of recording these transactions in relation to fluctuating net assets of the classes. Expenses directly attributable to a fund are charged to that fund. Expenses attributable to more than one fund are allocated among the respective funds on the basis of relative net assets or other appropriate methods. Expense estimates are accrued in the period to which they relate and adjustments are made when actual amounts are known.
Income Tax Information and Distributions to Shareholders. Each year, the Fund intends to qualify as a regulated investment company under Subchapter M of the Internal Revenue Code, including distributing substantially all of its taxable income and realized gains. As a result, no provision for U.S. Federal income taxes is required. As of October 31, 2019, the Fund did not have any unrecognized tax benefits in the financial statements; nor is the Fund aware of any tax positions for which it is reasonably possible that the total amounts of unrecognized tax benefits will significantly change in the next twelve months. The Fund files a U.S. federal tax return, in addition to state and local tax returns as required. The Fund's federal income tax returns are subject to examination by the Internal Revenue Service (IRS) for a period of three fiscal years after they are filed. State and local tax returns may be subject to examination for an additional fiscal year depending on the jurisdiction. Foreign taxes are provided for based on the Fund's understanding of the tax rules and rates that exist in the foreign markets in which it invests.
Distributions are declared and recorded on the ex-dividend date. Income and capital gain distributions are declared separately for each class. Income and capital gain distributions are determined in accordance with income tax regulations, which may differ from GAAP. In addition, the Fund claimed a portion of the payment made to redeeming shareholders as a distribution for income tax purposes.
Capital accounts within the financial statements are adjusted for permanent book-tax differences. These adjustments have no impact on net assets or the results of operations. Capital accounts are not adjusted for temporary book-tax differences which will reverse in a subsequent period.
Book-tax differences are primarily due to foreign currency transactions, certain foreign taxes, expiring capital loss carryforward, passive foreign investment companies (PFIC), capital loss carryforwards and losses deferred due to wash sales.
As of period end, the cost and unrealized appreciation (depreciation) in securities, and derivatives if applicable, for federal income tax purposes were as follows:
| Gross unrealized appreciation | $17,655,525 |
| Gross unrealized depreciation | (4,618,033) |
| Net unrealized appreciation (depreciation) | $13,037,492 |
| Tax Cost | $84,988,355 |
The tax-based components of distributable earnings as of period end were as follows:
| Undistributed ordinary income | $1,557,379 |
| Net unrealized appreciation (depreciation) on securities and other investments | $13,035,784 |
The tax character of distributions paid was as follows:
| | October 31, 2019 | October 31, 2018 |
| Ordinary Income | $764,278 | $ 3,308,669 |
| Long-term Capital Gains | 21 | 1,364,811 |
| Total | $764,299 | $ 4,673,480 |
Restricted Securities. The Fund may invest in securities that are subject to legal or contractual restrictions on resale. These securities generally may be resold in transactions exempt from registration or to the public if the securities are registered. Disposal of these securities may involve time-consuming negotiations and expense, and prompt sale at an acceptable price may be difficult. Information regarding restricted securities is included at the end of the Fund's Schedule of Investments.
4. Purchases and Sales of Investments.
Purchases and sales of securities, other than short-term securities, aggregated $66,145,791 and $81,173,046, respectively.
5. Fees and Other Transactions with Affiliates.
Management Fee. Fidelity Management & Research Company (the investment adviser) and its affiliates provide the Fund with investment management related services for which the Fund pays a monthly management fee. The management fee is the sum of an individual fund fee rate that is based on an annual rate of .45% of the Fund's average net assets and an annualized group fee rate that averaged .24% during the period. The group fee rate is based upon the average net assets of all the mutual funds advised by the investment adviser, including any mutual funds previously advised by the investment adviser that are currently advised by Fidelity SelectCo, LLC, an affiliate of the investment adviser. The group fee rate decreases as assets under management increase and increases as assets under management decrease. In addition, the management fee is subject to a performance adjustment (up to a maximum of +/- .20% of the Fund's average net assets over a 36 month performance period). The upward or downward adjustment to the management fee is based on the relative investment performance of Total International Equity as compared to its benchmark index, the MSCI All Country World ex USA Index, over the same 36 month performance period. For the reporting period, the total annual management fee rate, including the performance adjustment, was .63% of the Fund's average net assets. The performance adjustment included in the management fee rate may be higher or lower than the maximum performance adjustment rate due to the difference between the average net assets for the reporting and performance periods.
Distribution and Service Plan Fees. In accordance with Rule 12b-1 of the 1940 Act, the Fund has adopted separate Distribution and Service Plans for each class of shares. Certain classes pay Fidelity Distributors Corporation (FDC), an affiliate of the investment adviser, separate Distribution and Service Fees, each of which is based on an annual percentage of each class' average net assets. In addition, FDC may pay financial intermediaries for selling shares of the Fund and providing shareholder support services. For the period, the Distribution and Service Fee rates, total fees and amounts retained by FDC were as follows:
| | Distribution Fee | Service Fee | Total Fees | Retained by FDC |
| Class A | -% | .25% | $18,792 | $334 |
| Class M | .25% | .25% | 59,116 | 329 |
| Class C | .75% | .25% | 23,939 | 3,758 |
| | | | $101,847 | $4,421 |
Sales Load. FDC may receive a front-end sales charge of up to 5.75% for selling Class A shares and 3.50% for selling Class M shares, some of which is paid to financial intermediaries for selling shares of the Fund. Depending on the holding period, FDC may receive contingent deferred sales charges levied on Class A, Class M and Class C redemptions. The deferred sales charges are 1.00% for Class C shares, 1.00% for certain purchases of Class A shares and .25% for certain purchases of Class M shares.
For the period, sales charge amounts retained by FDC were as follows:
| | Retained by FDC |
| Class A | $1,662 |
| Class M | 789 |
| Class C(a) | 815 |
| | $3,266 |
(a) When Class C shares are initially sold, FDC pays commissions from its own resources to financial intermediaries through which the sales are made.
Transfer Agent Fees. Fidelity Investments Institutional Operations Company, Inc., (FIIOC), an affiliate of the investment adviser, is the transfer, dividend disbursing and shareholder servicing agent for each class of the Fund. FIIOC receives account fees and asset-based fees that vary according to the account size and type of account of the shareholders of the respective classes of the Fund, except for Class Z. FIIOC receives an asset-based fee of Class Z's average net assets. FIIOC pays for typesetting, printing and mailing of shareholder reports, except proxy statements.
For the period, transfer agent fees for each class were as follows:
| | Amount | % of Class-Level Average Net Assets |
| Class A | $17,369 | .23 |
| Class M | 27,782 | .23 |
| Class C | 7,156 | .30 |
| Total International Equity | 122,366 | .17 |
| Class I | 5,265 | .16 |
| Class Z | 453 | .04 |
| | $180,391 | |
Accounting and Security Lending Fees. Fidelity Service Company, Inc. (FSC), an affiliate of the investment adviser, maintains the Fund's accounting records. The accounting fee is based on the level of average net assets for each month. Prior to April 1, 2019, FSC had a separate agreement with the Fund for administration of the security lending program, based on the number and duration of lending transactions. For the period, the total fees paid for accounting and administration of securities lending were equivalent to an annual rate of .05%.
Brokerage Commissions. The Fund placed a portion of its portfolio transactions with brokerage firms which are affiliates of the investment adviser. Brokerage commissions are included in net realized gain (loss) and change in net unrealized appreciation (depreciation) in the Statement of Operations. The commissions paid to these affiliated firms were $377 for the period.
Interfund Trades. The Fund may purchase from or sell securities to other Fidelity Funds under procedures adopted by the Board. The procedures have been designed to ensure these interfund trades are executed in accordance with Rule 17a-7 of the 1940 Act. Interfund trades are included within the respective purchases and sales amounts shown in the Purchases and Sales of Investments note.
6. Committed Line of Credit.
The Fund participates with other funds managed by the investment adviser or an affiliate in a $4.25 billion credit facility (the "line of credit") to be utilized for temporary or emergency purposes to fund shareholder redemptions or for other short-term liquidity purposes. The Fund has agreed to pay commitment fees on its pro-rata portion of the line of credit, which amounted to $259 and is reflected in Miscellaneous expenses on the Statement of Operations. During the period, the Fund did not borrow on this line of credit.
7. Security Lending.
The Fund lends portfolio securities from time to time in order to earn additional income. For equity securities, lending agents are used, including National Financial Services (NFS), an affiliate of the Fund. Pursuant to a securities lending agreement, NFS will receive a fee, which is capped at 9.9% of daily lending revenue, for its services as lending agent. The Fund may lend securities to certain qualified borrowers, including NFS. On the settlement date of the loan, the Fund receives collateral (in the form of U.S. Treasury obligations, letters of credit and/or cash) against the loaned securities and maintains collateral in an amount not less than 100% of the market value of the loaned securities during the period of the loan. The market value of the loaned securities is determined at the close of business of the Fund and any additional required collateral is delivered to the Fund on the next business day. The Fund or borrower may terminate the loan at any time, and if the borrower defaults on its obligation to return the securities loaned because of insolvency or other reasons, the Fund may apply collateral received from the borrower against the obligation. The Fund may experience delays and costs in recovering the securities loaned. Any cash collateral received is invested in the Fidelity Securities Lending Cash Central Fund. At period end, there were no security loans outstanding. Security lending income represents the income earned on investing cash collateral, less rebates paid to borrowers and any lending agent fees associated with the loan, plus any premium payments received for lending certain types of securities. Security lending income is presented in the Statement of Operations as a component of income from Fidelity Central Funds. During the period, there were no securities loaned to NFS.
8. Expense Reductions.
The investment adviser contractually agreed to reimburse each class to the extent annual operating expenses exceeded certain levels of class-level average net assets as noted in the table below. This reimbursement will remain in place through February 28, 2021. Some expenses, for example the compensation of the independent Trustees, and certain miscellaneous expenses such as proxy and shareholder meeting expenses, are excluded from this reimbursement.
The following classes were in reimbursement during the period:
| | Expense Limitations | Reimbursement |
| Class A | 1.45% | $4,277 |
| Class M | 1.70% | 7,201 |
| Class C | 2.20% | 2,997 |
| Total International Equity | 1.20% | – |
| Class I | 1.20% | – |
| Class Z | 1.05% | 511 |
| | | $14,986 |
Commissions paid to certain brokers with whom the investment adviser, or its affiliates, places trades on behalf of the Fund include an amount in addition to trade execution, which may be rebated back to the Fund to offset certain expenses. This amount totaled $10,844 for the period.
In addition, during the period the investment adviser reimbursed and/or waived a portion of fund-level operating expenses in the amount of $731.
9. Distributions to Shareholders.
Distributions to shareholders of each class were as follows:
| | Year ended
October 31, 2019 | Year ended
October 31, 2018 |
| Distributions to shareholders | | |
| Class A | $46,299 | $376,652 |
| Class M | 27,216 | 591,842 |
| Class C | – | 110,403 |
| Total International Equity | 657,302 | 3,248,285 |
| Class I | 31,377 | 335,651 |
| Class Z | 2,105 | 10,647 |
| Total | $764,299 | $4,673,480 |
10. Share Transactions.
Share transactions for each class were as follows and may contain automatic conversions between classes or exchanges between affiliated funds:
| | Shares | Shares | Dollars | Dollars |
| | Year ended October 31, 2019 | Year ended October 31, 2018 | Year ended October 31, 2019 | Year ended October 31, 2018 |
| Class A | | | | |
| Shares sold | 137,444 | 173,804 | $1,178,771 | $1,606,034 |
| Reinvestment of distributions | 5,828 | 41,465 | 46,279 | 376,502 |
| Shares redeemed | (285,183) | (286,968) | (2,496,834) | (2,649,748) |
| Net increase (decrease) | (141,911) | (71,699) | $(1,271,784) | $(667,212) |
| Class M | | | | |
| Shares sold | 51,083 | 87,344 | $438,752 | $814,151 |
| Reinvestment of distributions | 3,402 | 64,894 | 27,216 | 591,835 |
| Shares redeemed | (249,013) | (394,904) | (2,185,232) | (3,617,064) |
| Net increase (decrease) | (194,528) | (242,666) | $(1,719,264) | $(2,211,078) |
| Class C | | | | |
| Shares sold | 50,549 | 70,398 | $435,371 | $654,074 |
| Reinvestment of distributions | – | 12,119 | – | 110,403 |
| Shares redeemed | (144,648) | (94,138) | (1,245,139) | (860,312) |
| Net increase (decrease) | (94,099) | (11,621) | $(809,768) | $(95,835) |
| Total International Equity | | | | |
| Shares sold | 861,198 | 1,403,656 | $7,437,666 | $13,127,907 |
| Reinvestment of distributions | 76,720 | 329,975 | 609,928 | 3,002,772 |
| Shares redeemed | (2,087,974) | (1,820,863) | (18,014,198) | (16,667,911) |
| Net increase (decrease) | (1,150,056) | (87,232) | $(9,966,604) | $(537,232) |
| Class I | | | | |
| Shares sold | 268,632 | 551,397 | $2,311,059 | $5,085,051 |
| Reinvestment of distributions | 3,542 | 36,520 | 28,087 | 330,507 |
| Shares redeemed | (1,089,632) | (162,650) | (9,019,644) | (1,487,088) |
| Net increase (decrease) | (817,458) | 425,267 | $(6,680,498) | $3,928,470 |
| Class Z | | | | |
| Shares sold | 439,804 | 15,939 | $3,842,585 | $147,844 |
| Reinvestment of distributions | 257 | 1,174 | 2,035 | 10,647 |
| Shares redeemed | (58,782) | (17,109) | (509,296) | (155,608) |
| Net increase (decrease) | 381,279 | 4 | $3,335,324 | $2,883 |
11. Other.
The Fund's organizational documents provide former and current trustees and officers with a limited indemnification against liabilities arising in connection with the performance of their duties to the Fund. In the normal course of business, the Fund may also enter into contracts that provide general indemnifications. The Fund's maximum exposure under these arrangements is unknown as this would be dependent on future claims that may be made against the Fund. The risk of material loss from such claims is considered remote.
Report of Independent Registered Public Accounting Firm
To the Trustees of Fidelity Investment Trust and Shareholders of Fidelity Total International Equity Fund:
Opinion on the Financial Statements and Financial Highlights
We have audited the accompanying statement of assets and liabilities of Fidelity Total International Equity Fund (the “Fund”), a fund of Fidelity Investment Trust, including the schedule of investments, as of October 31, 2019, and the related statement of operations for the year then ended, the statement of changes in net assets for each of the two years in the period then ended, the financial highlights for each of the five years in the period then ended, and the related notes. In our opinion, the financial statements and financial highlights present fairly, in all material respects, the financial position of the Fund as of October 31, 2019, and the results of its operations for the year then ended, the changes in its net assets for each of the two years in the period then ended, and the financial highlights for each of the five years in the period then ended, in conformity with accounting principles generally accepted in the United States of America.
Basis for Opinion
These financial statements and financial highlights are the responsibility of the Fund's management. Our responsibility is to express an opinion on the Fund's financial statements and financial highlights based on our audits. We are a public accounting firm registered with the Public Company Accounting Oversight Board (United States) (PCAOB) and are required to be independent with respect to the Fund in accordance with the U.S. federal securities laws and the applicable rules and regulations of the Securities and Exchange Commission and the PCAOB.
We conducted our audits in accordance with the standards of the PCAOB. Those standards require that we plan and perform the audit to obtain reasonable assurance about whether the financial statements and financial highlights are free of material misstatement, whether due to error or fraud. The Fund is not required to have, nor were we engaged to perform, an audit of its internal control over financial reporting. As part of our audits we are required to obtain an understanding of internal control over financial reporting but not for the purpose of expressing an opinion on the effectiveness of the Fund’s internal control over financial reporting. Accordingly, we express no such opinion
Our audits included performing procedures to assess the risks of material misstatement of the financial statements and financial highlights, whether due to error or fraud, and performing procedures that respond to those risks. Such procedures included examining, on a test basis, evidence regarding the amounts and disclosures in the financial statements and financial highlights. Our audits also included evaluating the accounting principles used and significant estimates made by management, as well as evaluating the overall presentation of the financial statements and financial highlights. Our procedures included confirmation of securities owned as of October 31, 2019, by correspondence with the custodians and brokers; when replies were not received from brokers, we performed other auditing procedures. We believe that our audits provide a reasonable basis for our opinion.
/s/ Deloitte & Touche LLP
Boston, Massachusetts
December 11, 2019
We have served as the auditor of one or more of the Fidelity investment companies since 1999.
Trustees and Officers
The Trustees, Members of the Advisory Board (if any), and officers of the trust and fund, as applicable, are listed below. The Board of Trustees governs the fund and is responsible for protecting the interests of shareholders. The Trustees are experienced executives who meet periodically throughout the year to oversee the fund's activities, review contractual arrangements with companies that provide services to the fund, oversee management of the risks associated with such activities and contractual arrangements, and review the fund's performance. Except for Jonathan Chiel, each of the Trustees oversees 298 funds. Mr. Chiel oversees 171 funds.
The Trustees hold office without limit in time except that (a) any Trustee may resign; (b) any Trustee may be removed by written instrument, signed by at least two-thirds of the number of Trustees prior to such removal; (c) any Trustee who requests to be retired or who has become incapacitated by illness or injury may be retired by written instrument signed by a majority of the other Trustees; and (d) any Trustee may be removed at any special meeting of shareholders by a two-thirds vote of the outstanding voting securities of the trust. Each Trustee who is not an interested person (as defined in the 1940 Act) of the trust and the fund is referred to herein as an Independent Trustee. Each Independent Trustee shall retire not later than the last day of the calendar year in which his or her 75th birthday occurs. The Independent Trustees may waive this mandatory retirement age policy with respect to individual Trustees. Officers and Advisory Board Members hold office without limit in time, except that any officer or Advisory Board Member may resign or may be removed by a vote of a majority of the Trustees at any regular meeting or any special meeting of the Trustees. Except as indicated, each individual has held the office shown or other offices in the same company for the past five years.
The fund's Statement of Additional Information (SAI) includes more information about the Trustees. To request a free copy, call Fidelity at 1-800-544-8544 if you’re an individual investing directly with Fidelity, call 1-800-835-5092 if you’re a plan sponsor or participant with Fidelity as your recordkeeper or call 1-877-208-0098 on institutional accounts or if you’re an advisor or invest through one.
Experience, Skills, Attributes, and Qualifications of the Trustees. The Governance and Nominating Committee has adopted a statement of policy that describes the experience, qualifications, attributes, and skills that are necessary and desirable for potential Independent Trustee candidates (Statement of Policy). The Board believes that each Trustee satisfied at the time he or she was initially elected or appointed a Trustee, and continues to satisfy, the standards contemplated by the Statement of Policy. The Governance and Nominating Committee also engages professional search firms to help identify potential Independent Trustee candidates who have the experience, qualifications, attributes, and skills consistent with the Statement of Policy. From time to time, additional criteria based on the composition and skills of the current Independent Trustees, as well as experience or skills that may be appropriate in light of future changes to board composition, business conditions, and regulatory or other developments, have also been considered by the professional search firms and the Governance and Nominating Committee. In addition, the Board takes into account the Trustees' commitment and participation in Board and committee meetings, as well as their leadership of standing and ad hoc committees throughout their tenure.
In determining that a particular Trustee was and continues to be qualified to serve as a Trustee, the Board has considered a variety of criteria, none of which, in isolation, was controlling. The Board believes that, collectively, the Trustees have balanced and diverse experience, qualifications, attributes, and skills, which allow the Board to operate effectively in governing the fund and protecting the interests of shareholders. Information about the specific experience, skills, attributes, and qualifications of each Trustee, which in each case led to the Board's conclusion that the Trustee should serve (or continue to serve) as a trustee of the fund, is provided below.
Board Structure and Oversight Function. James C. Curvey is an interested person and currently serves as Chairman. The Trustees have determined that an interested Chairman is appropriate and benefits shareholders because an interested Chairman has a personal and professional stake in the quality and continuity of services provided to the fund. Independent Trustees exercise their informed business judgment to appoint an individual of their choosing to serve as Chairman, regardless of whether the Trustee happens to be independent or a member of management. The Independent Trustees have determined that they can act independently and effectively without having an Independent Trustee serve as Chairman and that a key structural component for assuring that they are in a position to do so is for the Independent Trustees to constitute a substantial majority for the Board. The Independent Trustees also regularly meet in executive session. Ned C. Lautenbach serves as Chairman of the Independent Trustees and as such (i) acts as a liaison between the Independent Trustees and management with respect to matters important to the Independent Trustees and (ii) with management prepares agendas for Board meetings.
Fidelity® funds are overseen by different Boards of Trustees. The fund's Board oversees Fidelity's high income and certain equity funds, and other Boards oversee Fidelity's investment-grade bond, money market, asset allocation, and other equity funds. The asset allocation funds may invest in Fidelity® funds overseen by the fund's Board. The use of separate Boards, each with its own committee structure, allows the Trustees of each group of Fidelity® funds to focus on the unique issues of the funds they oversee, including common research, investment, and operational issues. On occasion, the separate Boards establish joint committees to address issues of overlapping consequences for the Fidelity® funds overseen by each Board.
The Trustees operate using a system of committees to facilitate the timely and efficient consideration of all matters of importance to the Trustees, the fund, and fund shareholders and to facilitate compliance with legal and regulatory requirements and oversight of the fund's activities and associated risks. The Board, acting through its committees, has charged FMR and its affiliates with (i) identifying events or circumstances the occurrence of which could have demonstrably adverse effects on the fund's business and/or reputation; (ii) implementing processes and controls to lessen the possibility that such events or circumstances occur or to mitigate the effects of such events or circumstances if they do occur; and (iii) creating and maintaining a system designed to evaluate continuously business and market conditions in order to facilitate the identification and implementation processes described in (i) and (ii) above. Because the day-to-day operations and activities of the fund are carried out by or through FMR, its affiliates, and other service providers, the fund's exposure to risks is mitigated but not eliminated by the processes overseen by the Trustees. While each of the Board's committees has responsibility for overseeing different aspects of the fund's activities, oversight is exercised primarily through the Operations, Audit, and Compliance Committees. Appropriate personnel, including but not limited to the fund's Chief Compliance Officer (CCO), FMR's internal auditor, the independent accountants, the fund's Treasurer and portfolio management personnel, make periodic reports to the Board's committees, as appropriate, including an annual review of Fidelity's risk management program for the Fidelity® funds. The responsibilities of each standing committee, including their oversight responsibilities, are described further under "Standing Committees of the Trustees."
Interested Trustees*:
Correspondence intended for a Trustee who is an interested person may be sent to Fidelity Investments, 245 Summer Street, Boston, Massachusetts 02210.
Name, Year of Birth; Principal Occupations and Other Relevant Experience+
Jonathan Chiel (1957)
Year of Election or Appointment: 2016
Trustee
Mr. Chiel also serves as Trustee of other Fidelity® funds. Mr. Chiel is Executive Vice President and General Counsel for FMR LLC (diversified financial services company, 2012-present). Previously, Mr. Chiel served as general counsel (2004-2012) and senior vice president and deputy general counsel (2000-2004) for John Hancock Financial Services; a partner with Choate, Hall & Stewart (1996-2000) (law firm); and an Assistant United States Attorney for the United States Attorney’s Office of the District of Massachusetts (1986-95), including Chief of the Criminal Division (1993-1995). Mr. Chiel is a director on the boards of the Boston Bar Foundation and the Maimonides School.
James C. Curvey (1935)
Year of Election or Appointment: 2007
Trustee
Chairman of the Board of Trustees
Mr. Curvey also serves as Trustee of other Fidelity® funds. Mr. Curvey is Vice Chairman (2007-present) and Director of FMR LLC (diversified financial services company). In addition, Mr. Curvey is an Overseer Emeritus for the Boston Symphony Orchestra, a Director of Artis-Naples, and a Trustee of Brewster Academy in Wolfeboro, New Hampshire. Previously, Mr. Curvey served as a Director of Fidelity Research & Analysis Co. (investment adviser firm, 2009-2018), Director of Fidelity Investments Money Management, Inc. (investment adviser firm, 2009-2014) and a Director of FMR and FMR Co., Inc. (investment adviser firms, 2007-2014).
* Determined to be an “Interested Trustee” by virtue of, among other things, his or her affiliation with the trust or various entities under common control with FMR.
+ The information includes the Trustee's principal occupation during the last five years and other information relating to the experience, attributes, and skills relevant to the Trustee's qualifications to serve as a Trustee, which led to the conclusion that the Trustee should serve as a Trustee for the fund.
Independent Trustees:
Correspondence intended for an Independent Trustee may be sent to Fidelity Investments, P.O. Box 55235, Boston, Massachusetts 02205-5235.
Name, Year of Birth; Principal Occupations and Other Relevant Experience+
Dennis J. Dirks (1948)
Year of Election or Appointment: 2005
Trustee
Mr. Dirks also serves as Trustee of other Fidelity® funds. Prior to his retirement in May 2003, Mr. Dirks was Chief Operating Officer and a member of the Board of The Depository Trust & Clearing Corporation (DTCC). He also served as President, Chief Operating Officer, and Board member of The Depository Trust Company (DTC) and President and Board member of the National Securities Clearing Corporation (NSCC). In addition, Mr. Dirks served as Chief Executive Officer and Board member of the Government Securities Clearing Corporation, Chief Executive Officer and Board member of the Mortgage-Backed Securities Clearing Corporation, as a Trustee and a member of the Finance Committee of Manhattan College (2005-2008), as a Trustee and a member of the Finance Committee of AHRC of Nassau County (2006-2008), as a member of the Independent Directors Council (IDC) Governing Council (2010-2015), and as a member of the Board of Directors for The Brookville Center for Children’s Services, Inc. (2009-2017). Mr. Dirks is a member of the Finance Committee (2016-present) and Board of Directors (2017-present) and is Treasurer (2018-present) of the Asolo Repertory Theatre.
Donald F. Donahue (1950)
Year of Election or Appointment: 2018
Trustee
Mr. Donahue also serves as a Trustee of other Fidelity® funds. Mr. Donahue is President and Chief Executive Officer of Miranda Partners, LLC (risk consulting for the financial services industry, 2012-present). Previously, Mr. Donahue served as a Member of the Advisory Board of certain Fidelity® funds (2015-2018) and Chief Executive Officer (2006-2012), Chief Operating Officer (2003-2006), and Managing Director, Customer Marketing and Development (1999-2003) of The Depository Trust & Clearing Corporation (financial markets infrastructure). Mr. Donahue serves as a Member (2007-present) and Co-Chairman (2016-present) of the Board of Directors of United Way of New York, Member of the Board of Directors of NYC Leadership Academy (2012-present) and Member of the Board of Advisors of Ripple Labs, Inc. (financial services, 2015-present). He also served as Chairman (2010-2012) and Member of the Board of Directors (2012-2013) of Omgeo, LLC (financial services), Treasurer of United Way of New York (2012-2016), and Member of the Board of Directors of XBRL US (financial services non-profit, 2009-2012) and the International Securities Services Association (2009-2012).
Alan J. Lacy (1953)
Year of Election or Appointment: 2008
Trustee
Mr. Lacy also serves as Trustee of other Fidelity® funds. Mr. Lacy serves as a Director of Bristol-Myers Squibb Company (global pharmaceuticals, 2008-present). He is a Trustee of the California Chapter of The Nature Conservancy (2015-present) and a Director of the Center for Advanced Study in the Behavioral Sciences at Stanford University (2015-present). In addition, Mr. Lacy served as Senior Adviser (2007-2014) of Oak Hill Capital Partners, L.P. (private equity) and also served as Chief Executive Officer (2005) and Vice Chairman (2005-2006) of Sears Holdings Corporation (retail) and Chief Executive Officer and Chairman of the Board of Sears, Roebuck and Co. (retail, 2000-2005). Previously, Mr. Lacy served as Chairman (2014-2017) and a member (2010-2017) of the Board of Directors of Dave & Buster’s Entertainment, Inc. (restaurant and entertainment complexes), as Chairman (2008-2011) and a member (2006-2015) of the Board of Trustees of the National Parks Conservation Association, and as a member of the Board of Directors for The Hillman Companies, Inc. (hardware wholesalers, 2010-2014), Earth Fare, Inc. (retail grocery, 2010-2014), and The Western Union Company (global money transfer, 2006-2011).
Ned C. Lautenbach (1944)
Year of Election or Appointment: 2000
Trustee
Chairman of the Independent Trustees
Mr. Lautenbach also serves as Trustee of other Fidelity® funds. Mr. Lautenbach currently serves as Chair (2018-present) and Member (2013-present) of the Board of Governors, State University System of Florida and is a member of the Council on Foreign Relations (1994-present). He is also a member and has most recently served as Chairman of the Board of Directors of Artis-Naples (2012-present). Previously, Mr. Lautenbach served as a member and then Lead Director of the Board of Directors of Eaton Corporation (diversified industrial, 1997-2016). He was also a Partner and Advisory Partner at Clayton, Dubilier & Rice, LLC (private equity investment, 1998-2010), as well as a Director of Sony Corporation (2006-2007). In addition, Mr. Lautenbach also had a 30-year career with IBM (technology company) during which time he served as Senior Vice President and a member of the Corporate Executive Committee (1968-1998).
Joseph Mauriello (1944)
Year of Election or Appointment: 2008
Trustee
Mr. Mauriello also serves as Trustee of other Fidelity® funds. Prior to his retirement in January 2006, Mr. Mauriello served in numerous senior management positions including Deputy Chairman and Chief Operating Officer (2004-2005), and Vice Chairman of Financial Services (2002-2004) of KPMG LLP US (professional services, 1965-2005). Mr. Mauriello currently serves as a member of the Independent Directors Council (IDC) Governing Council (2015-present). Previously, Mr. Mauriello served as a member of the Board of Directors of XL Group plc. (global insurance and re-insurance, 2006-2018).
Cornelia M. Small (1944)
Year of Election or Appointment: 2005
Trustee
Ms. Small also serves as Trustee of other Fidelity® funds. Ms. Small is a member of the Board of Directors (2009-present) and Chair of the Investment Committee (2010-present) of the Teagle Foundation. Ms. Small also serves on the Investment Committee of the Berkshire Taconic Community Foundation (2008-present). Previously, Ms. Small served as Chairperson (2002-2008) and a member of the Investment Committee and Chairperson (2008-2012) and a member of the Board of Trustees of Smith College. In addition, Ms. Small served as Chief Investment Officer, Director of Global Equity Investments, and a member of the Board of Directors of Scudder, Stevens & Clark and Scudder Kemper Investments.
Garnett A. Smith (1947)
Year of Election or Appointment: 2018
Trustee
Mr. Smith also serves as Trustee of other Fidelity® funds. Prior to Mr. Smith's retirement, he served as Chairman and Chief Executive Officer of Inbrand Corp. (manufacturer of personal absorbent products, 1990-1997). He also served as President (1986-1990) of Inbrand Corp. Prior to his employment with Inbrand Corp., he was employed by a retail fabric chain and North Carolina National Bank. In addition, Mr. Smith served as a Member of the Advisory Board of certain Fidelity® funds (2012-2013) and as a board member of the Jackson Hole Land Trust (2009-2012).
David M. Thomas (1949)
Year of Election or Appointment: 2008
Trustee
Mr. Thomas also serves as Trustee of other Fidelity® funds. Mr. Thomas serves as Non-Executive Chairman of the Board of Directors of Fortune Brands Home and Security (home and security products, 2011-present) and as a member of the Board of Directors (2004-present) and Presiding Director (2013-present) of Interpublic Group of Companies, Inc. (marketing communication). Previously, Mr. Thomas served as Executive Chairman (2005-2006) and Chairman and Chief Executive Officer (2000-2005) of IMS Health, Inc. (pharmaceutical and healthcare information solutions), a Director of Fortune Brands, Inc. (consumer products, 2000-2011), and a member of the Board of Trustees of the University of Florida (2013-2018).
+ The information includes the Trustee's principal occupation during the last five years and other information relating to the experience, attributes, and skills relevant to the Trustee's qualifications to serve as a Trustee, which led to the conclusion that the Trustee should serve as a Trustee for the fund.
Advisory Board Members and Officers:
Correspondence intended for a Member of the Advisory Board (if any) may be sent to Fidelity Investments, P.O. Box 55235, Boston, Massachusetts 02205-5235. Correspondence intended for an officer or Peter S. Lynch may be sent to Fidelity Investments, 245 Summer Street, Boston, Massachusetts 02210. Officers appear below in alphabetical order.
Name, Year of Birth; Principal Occupation
Vicki L. Fuller (1957)
Year of Election or Appointment: 2018
Member of the Advisory Board
Ms. Fuller also serves as Member of the Advisory Board of other Fidelity® funds. Ms. Fuller serves as a member of the Board of Directors, Audit Committee, and Nominating and Governance Committee of The Williams Companies, Inc. (natural gas infrastructure, 2018-present). Previously, Ms. Fuller served as the Chief Investment Officer of the New York State Common Retirement Fund (2012-2018) and held a variety of positions at AllianceBernstein L.P. (global asset management, 1985-2012), including Managing Director (2006-2012) and Senior Vice President and Senior Portfolio Manager (2001-2006).
Peter S. Lynch (1944)
Year of Election or Appointment: 2003
Member of the Advisory Board
Mr. Lynch also serves as Member of the Advisory Board of other Fidelity® funds. Mr. Lynch is Vice Chairman and a Director of FMR (investment adviser firm) and FMR Co., Inc. (investment adviser firm). In addition, Mr. Lynch serves as a Trustee of Boston College and as the Chairman of the Inner-City Scholarship Fund. Previously, Mr. Lynch served on the Special Olympics International Board of Directors (1997-2006).
Michael E. Wiley (1950)
Year of Election or Appointment: 2018
Member of the Advisory Board
Mr. Wiley also serves as Trustee or Member of the Advisory Board of other Fidelity® funds. Mr. Wiley serves as a Director of High Point Resources (exploration and production, 2005-present). Previously, Mr. Wiley served as a Director of Andeavor Corporation (independent oil refiner and marketer, 2005-2018), a Director of Andeavor Logistics LP (natural resources logistics, 2015-2018), a Director of Post Oak Bank (privately-held bank, 2004-2018), a Director of Asia Pacific Exploration Consolidated (international oil and gas exploration and production, 2008-2013), a member of the Board of Trustees of the University of Tulsa (2000-2006; 2007-2010), a Senior Energy Advisor of Katzenbach Partners, LLC (consulting, 2006-2007), an Advisory Director of Riverstone Holdings (private investment), a Director of Spinnaker Exploration Company (exploration and production, 2001-2005) and Chairman, President, and CEO of Baker Hughes, Inc. (oilfield services, 2000-2004).
Elizabeth Paige Baumann (1968)
Year of Election or Appointment: 2017
Anti-Money Laundering (AML) Officer
Ms. Baumann also serves as AML Officer of other funds. She is Chief AML Officer (2012-present) and Senior Vice President (2014-present) of FMR LLC (diversified financial services company) and is an employee of Fidelity Investments. Previously, Ms. Baumann served as AML Officer of the funds (2012-2016), and Vice President (2007-2014) and Deputy Anti-Money Laundering Officer (2007-2012) of FMR LLC.
Craig S. Brown (1977)
Year of Election or Appointment: 2019
Assistant Treasurer
Mr. Brown also serves as Assistant Treasurer of other funds. Mr. Brown is an employee of Fidelity Investments (2013-present).
John J. Burke III (1964)
Year of Election or Appointment: 2018
Chief Financial Officer
Mr. Burke also serves as Chief Financial Officer of other funds. Mr. Burke serves as Head of Investment Operations for Fidelity Fund and Investment Operations (2018-present) and is an employee of Fidelity Investments (1998-present). Previously Mr. Burke served as head of Asset Management Investment Operations (2012-2018).
William C. Coffey (1969)
Year of Election or Appointment: 2019
Assistant Secretary
Mr. Coffey also serves as Assistant Secretary of other funds. He is Senior Vice President and Deputy General Counsel of FMR LLC (diversified financial services company, 2010-present), and is an employee of Fidelity Investments. Previously, Mr. Coffey served as Secretary and CLO of certain funds (2018-2019); CLO, Secretary, and Senior Vice President of Fidelity Management & Research Company and FMR Co., Inc. (investment adviser firms, 2018-2019); Secretary of Fidelity SelectCo, LLC and Fidelity Investments Money Management, Inc. (investment adviser firms, 2018-2019); CLO of Fidelity Management & Research (Hong Kong) Limited, FMR Investment Management (UK) Limited, and Fidelity Management & Research (Japan) Limited (investment adviser firms, 2018-2019); and Assistant Secretary of certain funds (2009-2018).
Timothy M. Cohen (1969)
Year of Election or Appointment: 2018
Vice President
Mr. Cohen also serves as Vice President of other funds. Mr. Cohen serves as Executive Vice President of Fidelity SelectCo, LLC (2019-present), Co-Head of Equity (2018-present), a Director of Fidelity Management & Research (Japan) Limited (investment adviser firm, 2016-present), and is an employee of Fidelity Investments. Previously, Mr. Cohen served as Head of Global Equity Research (2016-2018), Chief Investment Officer - Equity and a Director of Fidelity Management & Research (U.K.) Inc. (investment adviser firm, 2013-2015) and as a Director of Fidelity Management & Research (Hong Kong) Limited (investment adviser firm, 2017).
Jonathan Davis (1968)
Year of Election or Appointment: 2010
Assistant Treasurer
Mr. Davis also serves as Assistant Treasurer of other funds. Mr. Davis serves as Assistant Treasurer of FMR Capital, Inc. (2017-present) and is an employee of Fidelity Investments. Previously, Mr. Davis served as Vice President and Associate General Counsel of FMR LLC (diversified financial services company, 2003-2010).
Adrien E. Deberghes (1967)
Year of Election or Appointment: 2016
Assistant Treasurer
Mr. Deberghes also serves as an officer of other funds. He serves as Assistant Treasurer of FMR Capital, Inc. (2017-present), Executive Vice President of Fidelity Investments Money Management, Inc. (FIMM) (investment adviser firm, 2016-present), and is an employee of Fidelity Investments (2008-present). Previously, Mr. Deberghes served as President and Treasurer of certain Fidelity® funds (2013-2018). Prior to joining Fidelity Investments, Mr. Deberghes was Senior Vice President of Mutual Fund Administration at State Street Corporation (2007-2008), Senior Director of Mutual Fund Administration at Investors Bank & Trust (2005-2007), and Director of Finance for Dunkin' Brands (2000-2005). Previously, Mr. Deberghes served in other fund officer roles.
Laura M. Del Prato (1964)
Year of Election or Appointment: 2018
Assistant Treasurer
Ms. Del Prato also serves as an officer of other funds. Ms. Del Prato is an employee of Fidelity Investments (2017-present). Prior to joining Fidelity Investments, Ms. Del Prato served as a Managing Director and Treasurer of the JPMorgan Mutual Funds (2014-2017). Prior to JPMorgan, Ms. Del Prato served as a partner at Cohen Fund Audit Services (accounting firm, 2012-2013) and KPMG LLP (accounting firm, 2004-2012).
Colm A. Hogan (1973)
Year of Election or Appointment: 2016
Deputy Treasurer
Mr. Hogan also serves as an officer of other funds. Mr. Hogan serves as Assistant Treasurer of FMR Capital, Inc. (2017-present) and is an employee of Fidelity Investments (2005-present). Previously, Mr. Hogan served as Assistant Treasurer of certain Fidelity® funds (2016-2018).
Pamela R. Holding (1964)
Year of Election or Appointment: 2018
Vice President
Ms. Holding also serves as Vice President of other funds. Ms. Holding serves as Executive Vice President of Fidelity SelectCo, LLC (2019-present), Co-Head of Equity (2018-present) and is an employee of Fidelity Investments (2013-present). Previously, Ms. Holding served as Chief Investment Officer of Fidelity Institutional Asset Management (2013-2018).
Cynthia Lo Bessette (1969)
Year of Election or Appointment: 2019
Secretary and Chief Legal Officer (CLO)
Ms. Lo Bessette also serves as Secretary and CLO of other funds. Ms. Lo Bessette serves as CLO, Secretary, and Senior Vice President of Fidelity Management & Research Company and FMR Co., Inc. (investment adviser firms, 2019-present); Secretary of Fidelity SelectCo, LLC and Fidelity Investments Money Management, Inc. (investment adviser firms, 2019-present); and CLO of Fidelity Management & Research (Hong Kong) Limited, FMR Investment Management (UK) Limited, and Fidelity Management & Research (Japan) Limited (investment adviser firms, 2019-present). She is a Senior Vice President and Deputy General Counsel of FMR LLC (diversified financial services company, 2019-present), and is an employee of Fidelity Investments. Previously, Ms. Lo Bessette served as Executive Vice President, General Counsel (2016-2019) and Senior Vice President, Deputy General Counsel (2015-2016) of OppenheimerFunds (investment management company) and Deputy Chief Legal Officer (2013-2015) of Jennison Associates LLC (investment adviser firm).
Chris Maher (1972)
Year of Election or Appointment: 2013
Assistant Treasurer
Mr. Maher serves as Assistant Treasurer of other funds. Mr. Maher is Vice President of Valuation Oversight, serves as Assistant Treasurer of FMR Capital, Inc. (2017-present), and is an employee of Fidelity Investments. Previously, Mr. Maher served as Vice President of Asset Management Compliance (2013), Vice President of the Program Management Group of FMR (investment adviser firm, 2010-2013), and Vice President of Valuation Oversight (2008-2010).
Kenneth B. Robins (1969)
Year of Election or Appointment: 2016
Chief Compliance Officer
Mr. Robins also serves as an officer of other funds. Mr. Robins serves as Compliance Officer of Fidelity Management & Research Company and FMR Co., Inc. (investment adviser firms, 2016-present) and is an employee of Fidelity Investments (2004-present). Previously, Mr. Robins served as Executive Vice President of Fidelity Investments Money Management, Inc. (investment adviser firm, 2013-2016) and served in other fund officer roles.
Stacie M. Smith (1974)
Year of Election or Appointment: 2016
President and Treasurer
Ms. Smith also serves as an officer of other funds. Ms. Smith serves as Assistant Treasurer of FMR Capital, Inc. (2017-present), is an employee of Fidelity Investments (2009-present), and has served in other fund officer roles. Prior to joining Fidelity Investments, Ms. Smith served as Senior Audit Manager of Ernst & Young LLP (accounting firm, 1996-2009). Previously, Ms. Smith served as Assistant Treasurer (2013-2018) and Deputy Treasurer (2013-2016) of certain Fidelity® funds.
Marc L. Spector (1972)
Year of Election or Appointment: 2016
Assistant Treasurer
Mr. Spector also serves as an officer of other funds. Mr. Spector serves as Assistant Treasurer of FMR Capital, Inc. (2017-present) and is an employee of Fidelity Investments (2016-present). Prior to joining Fidelity Investments, Mr. Spector served as Director at the Siegfried Group (accounting firm, 2013-2016), and prior to Siegfried Group as audit senior manager at Deloitte & Touche (accounting firm, 2005-2013).
Jim Wegmann (1979)
Year of Election or Appointment: 2019
Assistant Treasurer
Mr. Wegmann also serves as Assistant Treasurer of other funds. Mr. Wegmann is an employee of Fidelity Investments (2011-present).
Shareholder Expense Example
As a shareholder of the Fund, you incur two types of costs: (1) transaction costs, including sales charges (loads) on purchase payments or redemption proceeds, and (2) ongoing costs, including management fees, distribution and/or service (12b-1) fees and other Fund expenses. This Example is intended to help you understand your ongoing costs (in dollars) of investing in the Fund and to compare these costs with the ongoing costs of investing in other mutual funds.
The Example is based on an investment of $1,000 invested at the beginning of the period and held for the entire period (May 1, 2019 to October 31, 2019).
Actual Expenses
The first line of the accompanying table for each class of the Fund provides information about actual account values and actual expenses. You may use the information in this line, together with the amount you invested, to estimate the expenses that you paid over the period. Simply divide your account value by $1,000.00 (for example, an $8,600 account value divided by $1,000.00 = 8.6), then multiply the result by the number in the first line for a class of the Fund under the heading entitled "Expenses Paid During Period" to estimate the expenses you paid on your account during this period. In addition, the Fund, as a shareholder in the underlying Fidelity Central Funds, will indirectly bear its pro-rata share of the fees and expenses incurred by the underlying Fidelity Central Funds. These fees and expenses are not included in the Fund's annualized expense ratio used to calculate the expense estimate in the table below.
Hypothetical Example for Comparison Purposes
The second line of the accompanying table for each class of the Fund provides information about hypothetical account values and hypothetical expenses based on a Class' actual expense ratio and an assumed rate of return of 5% per year before expenses, which is not the Class' actual return. The hypothetical account values and expenses may not be used to estimate the actual ending account balance or expenses you paid for the period. You may use this information to compare the ongoing costs of investing in the Fund and other funds. To do so, compare this 5% hypothetical example with the 5% hypothetical examples that appear in the shareholder reports of the other funds. In addition, the Fund, as a shareholder in the underlying Fidelity Central Funds, will indirectly bear its pro-rata share of the fees and expenses incurred by the underlying Fidelity Central Funds. These fees and expenses are not included in the Fund's annualized expense ratio used to calculate the expense estimate in the table below.
Please note that the expenses shown in the table are meant to highlight your ongoing costs only and do not reflect any transaction costs. Therefore, the second line of the table is useful in comparing ongoing costs only, and will not help you determine the relative total costs of owning different funds. In addition, if these transactional costs were included, your costs would have been higher.
| | Annualized Expense Ratio-A | Beginning
Account Value
May 1, 2019 | Ending
Account Value
October 31, 2019 | Expenses Paid
During Period-B
May 1, 2019
to October 31, 2019 |
| Class A | 1.45% | | | |
| Actual | | $1,000.00 | $1,026.40 | $7.41 |
| Hypothetical-C | | $1,000.00 | $1,017.90 | $7.38 |
| Class M | 1.70% | | | |
| Actual | | $1,000.00 | $1,025.10 | $8.68 |
| Hypothetical-C | | $1,000.00 | $1,016.64 | $8.64 |
| Class C | 2.20% | | | |
| Actual | | $1,000.00 | $1,023.10 | $11.22 |
| Hypothetical-C | | $1,000.00 | $1,014.17 | $11.17 |
| Total International Equity | 1.20% | | | |
| Actual | | $1,000.00 | $1,027.40 | $6.13 |
| Hypothetical-C | | $1,000.00 | $1,019.16 | $6.11 |
| Class I | 1.17% | | | |
| Actual | | $1,000.00 | $1,028.60 | $5.98 |
| Hypothetical-C | | $1,000.00 | $1,019.31 | $5.96 |
| Class Z | 1.05% | | | |
| Actual | | $1,000.00 | $1,028.60 | $5.37 |
| Hypothetical-C | | $1,000.00 | $1,019.86 | $5.35 |
A Annualized expense ratio reflects expenses net of applicable fee waivers.
B Expenses are equal to each Class' annualized expense ratio, multiplied by the average account value over the period, multiplied by 184/365 (to reflect the one-half year period).
C 5% return per year before expenses
Distributions (Unaudited)
Class A designates 10%; Class M designates 18%; Total International Equity designates 8%; Class I designates 9%; and Class Z designates 7%; of the dividends distributed during the fiscal year as qualifying for the dividends–received deduction for corporate shareholders.
Class A, Class M, Total International Equity, Class I, and Class Z designate 100% of the dividends distributed during the fiscal year as amounts which may be taken into account as a dividend for purposes of the maximum rate under section 1(h)(11) of the Internal Revenue Code.
The amounts per share which represent income derived from sources within, and taxes paid to, foreign countries or possessions of the United States are as follows:
| | Pay Date | Income | Taxes |
| Fidelity Total International Equity Fund | | | |
| Class A | 12/10/18 | $0.0732 | $0.0222 |
| Class M | 12/10/18 | $0.0412 | $0.0222 |
| Class C | 12/10/18 | $0.0000 | $0.0000 |
| Total International Equity | 12/10/18 | $0.1002 | $0.0222 |
| Class I | 12/10/18 | $0.0882 | $0.0222 |
| Class Z | 12/10/18 | $0.1102 | $0.0222 |
|
The fund will notify shareholders in January 2020 of amounts for use in preparing 2019 income tax returns.
TIE-ANN-1219
1.912358.109
Fidelity Flex℠ Funds
Fidelity Flex℠ International Fund
Annual Report
October 31, 2019
See the inside front cover for important information about access to your fund’s shareholder reports.
Beginning on January 1, 2021, as permitted by regulations adopted by the Securities and Exchange Commission, paper copies of a fund’s shareholder reports will no longer be sent by mail, unless you specifically request paper copies of the reports from the fund or from your financial intermediary, such as a financial advisor, broker-dealer or bank. Instead, the reports will be made available on a website, and you will be notified by mail each time a report is posted and provided with a website link to access the report.
If you already elected to receive shareholder reports electronically, you will not be affected by this change and you need not take any action. You may elect to receive shareholder reports and other communications from a fund electronically, by contacting your financial intermediary. For Fidelity customers, visit Fidelity's web site or call Fidelity using the contact information listed below.
You may elect to receive all future reports in paper free of charge. If you wish to continue receiving paper copies of your shareholder reports, you may contact your financial intermediary or, if you are a Fidelity customer, visit Fidelity’s website, or call Fidelity at the applicable toll-free number listed below. Your election to receive reports in paper will apply to all funds held with the fund complex/your financial intermediary.
| Account Type | Website | Phone Number |
| Brokerage, Mutual Fund, or Annuity Contracts: | fidelity.com/mailpreferences | 1-800-343-3548 |
| Employer Provided Retirement Accounts: | netbenefits.fidelity.com/preferences (choose 'no' under Required Disclosures to continue to print) | 1-800-343-0860 |
| Advisor Sold Accounts Serviced Through Your Financial Intermediary: | Contact Your Financial Intermediary | Your Financial Intermediary's phone number |
| Advisor Sold Accounts Serviced by Fidelity: | institutional.fidelity.com | 1-877-208-0098 |
Contents
To view a fund's proxy voting guidelines and proxy voting record for the 12-month period ended June 30, visit http://www.fidelity.com/proxyvotingresults or visit the Securities and Exchange Commission's (SEC) web site at http://www.sec.gov.
You may also call 1-800-544-3455 (for managed account clients) or 1-800-835-5092 (for retirement plan participants) to request a free copy of the proxy voting guidelines.
The funds or securities referred to herein are not sponsored, endorsed, or promoted by MSCI, and MSCI bears no liability with respect to any such funds or securities or any index on which such funds or securities are based. The prospectus contains a more detailed description of the limited relationship MSCI has with Fidelity and any related funds.
Standard & Poor's, S&P and S&P 500 are registered service marks of The McGraw-Hill Companies, Inc. and have been licensed for use by Fidelity Distributors Corporation.
Other third-party marks appearing herein are the property of their respective owners.
All other marks appearing herein are registered or unregistered trademarks or service marks of FMR LLC or an affiliated company. © 2019 FMR LLC. All rights reserved.
This report and the financial statements contained herein are submitted for the general information of the shareholders of the Fund. This report is not authorized for distribution to prospective investors in the Fund unless preceded or accompanied by an effective prospectus.
A fund files its complete schedule of portfolio holdings with the SEC for the first and third quarters of each fiscal year on Form N-PORT. Forms N-PORT are available on the SEC’s web site at http://www.sec.gov. A fund's Forms N-PORT may be reviewed and copied at the SEC’s Public Reference Room in Washington, DC. Information regarding the operation of the SEC's Public Reference Room may be obtained by calling 1-800-SEC-0330.
For a complete list of a fund's portfolio holdings, view the most recent holdings listing, semiannual report, or annual report on Fidelity's web site at http://www.fidelity.com, http://www.institutional.fidelity.com, or http://www.401k.com, as applicable.
NOT FDIC INSURED •MAY LOSE VALUE •NO BANK GUARANTEE
Neither the Fund nor Fidelity Distributors Corporation is a bank.
Performance: The Bottom Line
Average annual total return reflects the change in the value of an investment, assuming reinvestment of distributions from dividend income and capital gains (the profits earned upon the sale of securities that have grown in value, if any) and assuming a constant rate of performance each year. The hypothetical investment and the average annual total returns do not reflect the deduction of taxes that a shareholder would pay on fund distributions or the redemption of fund shares. During periods of reimbursement by Fidelity, a fund’s total return will be greater than it would be had the reimbursement not occurred. How a fund did yesterday is no guarantee of how it will do tomorrow.
Average Annual Total Returns
| For the periods ended October 31, 2019 | Past 1 year | Life of fundA |
| Fidelity Flex℠ International Fund | 16.45% | 9.77% |
A From March 7, 2017
$10,000 Over Life of Fund
Let's say hypothetically that $10,000 was invested in Fidelity Flex℠ International Fund on March 7, 2017, when the fund started.
The chart shows how the value of your investment would have changed, and also shows how the MSCI ACWI (All Country World Index) ex USA Index performed over the same period.

| Period Ending Values |
| $12,804 | Fidelity Flex℠ International Fund |
| $12,027 | MSCI ACWI (All Country World Index) ex USA Index |
Management's Discussion of Fund Performance
Market Recap: The MSCI ACWI (All Country World Index) ex USA Index gained 11.47% for the 12 months ending October 31, 2019, as international stocks reflected a confluence of factors, including escalating trade tension, moderating but still positive global economic growth and uncertainty about the U.K.’s planned “Brexit” from the European Union. Currency fluctuations were largely modest and varied by region, muting the overall impact on international equity returns. In late December, the U.S. Federal Reserve shifted from raising interest rates to a more dovish policy in 2019, joining many foreign central banks that had cut policy rates. In June, international stocks rose 6.03%, as policy stimulus in China stabilized that country’s economic growth. The Fed cut its policy rate in July for the first time since 2008. However, the index returned -1.21% for the month, followed by -3.08% in August. In September, the Fed cut its policy rate another quarter point, citing concerns about slowing economic growth and muted inflation, and did the same in October, leading to monthly gains of 2.59% and 3.49%, respectively. For the full 12 months, the growth-oriented information technology sector (+22%) led the way, followed by utilities (+20%) and real estate (+18%), two high-dividend-yielding categories. Consumer discretionary gained 16%. Conversely, energy was roughly flat, while materials (+6%) and communication services (7%) also lagged. By region, Asia Pacific ex Japan (+16%), Europe ex U.K (+13%), Canada (+12%) and emerging markets (+12%) fared best. Meanwhile, the U.K. (+7%) and Japan (+10%) trailed the broader market.
Comments from Co-Portfolio Manager Jed Weiss: For the fiscal year, the fund gained 16.45%, notably outpacing the benchmark MSCI ACWI (All Country World Index) ex USA Index. Versus the benchmark, the fund benefited most from sizable out-of-benchmark exposure to the U.S., as well as strong security selection in China and Japan. By sector, positioning in information technology notably aided the portfolio’s relative result, as did investment choices within financials and consumer staples. Conversely, picks in the U.K. and Spain weighed on the portfolio’s relative return, as was the case among energy stocks. The fund’s underweighting in the strong-performing utilities sector also detracted the past 12 months. The biggest individual relative contributor was an out-of-benchmark stake in U.S.-based credit-card processor Mastercard (+42%) as the firm continued to maintain considerable pricing power and significant market share. Throughout the period, Japanese multinational Hoya (+59%) – a supplier of electronics products to the semiconductor industry – executed well and benefitted from the ongoing structural-growth in extreme ultraviolet lithography (EUV) technology, further propelling relative performance. Netherlands-based chip-equipment firm ASML Holding (+55%), which was a beneficiary of both the build-out of 5G wireless networks as well as growth in its EUV systems business, also contributed. In contrast, the fund’s largest stock-specific detractor was untimely ownership of Thai cement, chemicals and packaging company Siam Cement Public Company (-17%), whose stock declined late in the period due to the firm’s lower growth and profitability outlook. Also hampering the portfolio’s relative result was an overweighting in Spanish airline-reservation software provider Amadeus IT Group (-5%), amid decelerating airline-traffic growth and increasingly aggressive competition. Lastly, I'll note that the fund's stake in cash – representing about 2% of assets, on average – weighed on the portfolio’s relative return amid the strong, uptrending market this period.
The views expressed above reflect those of the portfolio manager(s) only through the end of the period as stated on the cover of this report and do not necessarily represent the views of Fidelity or any other person in the Fidelity organization. Any such views are subject to change at any time based upon market or other conditions and Fidelity disclaims any responsibility to update such views. These views may not be relied on as investment advice and, because investment decisions for a Fidelity fund are based on numerous factors, may not be relied on as an indication of trading intent on behalf of any Fidelity fund.
Note to Shareholders: On February 22, 2019, Sam Polyak assumed co-management responsibilities for the fund, joining Jed Weiss, Sammy Simnegar and Alexander Zavratsky. On October 1, 2019, Sammy Simnegar came off the fund, leaving Sam Polyak, Jed Weiss and Alexander Zavratsky as co-managers.
Investment Summary (Unaudited)
Geographic Diversification (% of fund's net assets)
| As of October 31, 2019 |
| | Japan | 14.4% |
| | United Kingdom | 8.3% |
| | United States of America* | 8.3% |
| | Germany | 7.4% |
| | France | 6.8% |
| | Canada | 6.3% |
| | China | 5.0% |
| | Switzerland | 4.8% |
| | Cayman Islands | 3.9% |
| | Other | 34.8% |
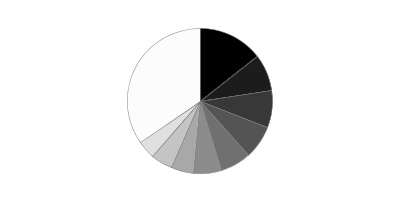
* Includes Short-Term investments and Net Other Assets (Liabilities).
Percentages are based on country or territory of incorporation and are adjusted for the effect of futures contracts, if applicable.
Asset Allocation as of October 31, 2019
| | % of fund's net assets |
| Stocks | 98.5 |
| Short-Term Investments and Net Other Assets (Liabilities) | 1.5 |
Top Ten Stocks as of October 31, 2019
| | % of fund's net assets |
| Samsung Electronics Co. Ltd. (Korea (South), Technology Hardware, Storage & Peripherals) | 2.4 |
| Taiwan Semiconductor Manufacturing Co. Ltd. (Taiwan, Semiconductors & Semiconductor Equipment) | 2.0 |
| Nestle SA (Reg. S) (Switzerland, Food Products) | 1.9 |
| Tencent Holdings Ltd. (Cayman Islands, Interactive Media & Services) | 1.6 |
| SAP SE (Germany, Software) | 1.4 |
| ASML Holding NV (Netherlands) (Netherlands, Semiconductors & Semiconductor Equipment) | 1.3 |
| Roche Holding AG (participation certificate) (Switzerland, Pharmaceuticals) | 1.2 |
| Linde PLC (Germany, Chemicals) | 1.1 |
| Industrial & Commercial Bank of China Ltd. (H Shares) (China, Banks) | 1.1 |
| BP PLC (United Kingdom, Oil, Gas & Consumable Fuels) | 1.1 |
| | 15.1 |
Top Market Sectors as of October 31, 2019
| | % of fund's net assets |
| Financials | 24.4 |
| Information Technology | 16.5 |
| Industrials | 14.9 |
| Materials | 9.6 |
| Consumer Discretionary | 7.9 |
| Health Care | 6.5 |
| Consumer Staples | 5.7 |
| Energy | 5.7 |
| Communication Services | 4.1 |
| Real Estate | 2.0 |
Schedule of Investments October 31, 2019
Showing Percentage of Net Assets
| Common Stocks - 97.3% | | | |
| | | Shares | Value |
| Australia - 1.8% | | | |
| Beacon Lighting Group Ltd. | | 9,275 | $7,769 |
| Commonwealth Bank of Australia | | 5,225 | 283,300 |
| CSL Ltd. | | 3,522 | 621,127 |
| Imdex Ltd. | | 11,228 | 12,295 |
| Insurance Australia Group Ltd. | | 29,158 | 159,759 |
| Macquarie Group Ltd. | | 2,112 | 195,017 |
|
| TOTAL AUSTRALIA | | | 1,279,267 |
|
| Austria - 0.2% | | | |
| Erste Group Bank AG | | 4,273 | 150,929 |
| Bailiwick of Jersey - 0.9% | | | |
| Experian PLC | | 9,166 | 288,281 |
| Glencore Xstrata PLC | | 59,959 | 180,979 |
| Integrated Diagnostics Holdings PLC (a) | | 4,959 | 23,406 |
| WPP PLC | | 8,754 | 109,246 |
|
| TOTAL BAILIWICK OF JERSEY | | | 601,912 |
|
| Belgium - 0.7% | | | |
| Barco NV | | 212 | 46,107 |
| KBC Ancora | | 800 | 38,099 |
| KBC Groep NV | | 5,517 | 386,908 |
|
| TOTAL BELGIUM | | | 471,114 |
|
| Brazil - 1.7% | | | |
| BM&F BOVESPA SA | | 34,272 | 413,435 |
| IRB Brasil Resseguros SA | | 35,014 | 329,929 |
| Natura Cosmeticos SA | | 20,459 | 158,958 |
| Suzano Papel e Celulose SA | | 40,501 | 329,623 |
|
| TOTAL BRAZIL | | | 1,231,945 |
|
| Canada - 6.3% | | | |
| Alimentation Couche-Tard, Inc. Class B (sub. vtg.) | | 19,305 | 578,959 |
| Brookfield Asset Management, Inc. Class A | | 4,904 | 271,170 |
| Canadian National Railway Co. | | 6,939 | 620,617 |
| Canadian Pacific Railway Ltd. | | 2,282 | 518,929 |
| Constellation Software, Inc. | | 471 | 465,182 |
| Franco-Nevada Corp. | | 4,155 | 403,165 |
| McCoy Global, Inc. (b) | | 50 | 23 |
| New Look Vision Group, Inc. | | 759 | 18,441 |
| Nutrien Ltd. | | 9,903 | 473,759 |
| Pason Systems, Inc. | | 10,396 | 111,608 |
| PrairieSky Royalty Ltd. | | 9,244 | 90,257 |
| Richelieu Hardware Ltd. | | 833 | 17,101 |
| ShawCor Ltd. Class A | | 350 | 3,524 |
| Suncor Energy, Inc. | | 8,612 | 256,052 |
| The Toronto-Dominion Bank | | 8,406 | 480,006 |
| Waste Connection, Inc. (Canada) | | 1,401 | 129,410 |
|
| TOTAL CANADA | | | 4,438,203 |
|
| Cayman Islands - 3.9% | | | |
| Airtac International Group | | 21,871 | 299,401 |
| Alibaba Group Holding Ltd. sponsored ADR (b) | | 1,998 | 352,987 |
| JD.com, Inc. sponsored ADR (b) | | 5,972 | 186,028 |
| Li Ning Co. Ltd. | | 123,938 | 420,252 |
| Meituan Dianping Class B (b) | | 17,279 | 206,106 |
| PagSeguro Digital Ltd. (b) | | 4,171 | 154,661 |
| Tencent Holdings Ltd. | | 27,824 | 1,128,623 |
|
| TOTAL CAYMAN ISLANDS | | | 2,748,058 |
|
| Chile - 0.2% | | | |
| Banco de Chile | | 1,196,000 | 154,016 |
| China - 5.0% | | | |
| AVIC Jonhon OptronicTechnology Co. Ltd. | | 38,210 | 218,761 |
| C&S Paper Co. Ltd. (A Shares) | | 96,300 | 170,286 |
| China Life Insurance Co. Ltd. (H Shares) | | 111,000 | 285,458 |
| China Merchants Bank Co. Ltd. (H Shares) | | 117,115 | 558,549 |
| China Petroleum & Chemical Corp. (H Shares) | | 432,778 | 246,153 |
| Haier Smart Home Co. Ltd. (A Shares) | | 246,714 | 560,353 |
| Industrial & Commercial Bank of China Ltd. (H Shares) | | 1,087,261 | 778,907 |
| Ping An Insurance Group Co. of China Ltd. (H Shares) | | 11,500 | 132,731 |
| Shenzhen Inovance Technology Co. Ltd. (A Shares) | | 98,883 | 349,844 |
| Yantai Jereh Oilfield Services (A Shares) | | 46,080 | 200,418 |
| Zhejiang Sanhua Intelligent Controls Co. Ltd. (A Shares) | | 12,320 | 24,476 |
|
| TOTAL CHINA | | | 3,525,936 |
|
| Denmark - 0.4% | | | |
| A.P. Moller - Maersk A/S Series B | | 83 | 105,875 |
| Ambu A/S Series B | | 1,075 | 16,882 |
| Jyske Bank A/S (Reg.) | | 434 | 14,428 |
| Netcompany Group A/S (a)(b) | | 731 | 31,122 |
| ORSTED A/S (a) | | 800 | 70,174 |
| SimCorp A/S | | 432 | 38,597 |
| Spar Nord Bank A/S | | 2,340 | 22,845 |
|
| TOTAL DENMARK | | | 299,923 |
|
| Finland - 0.3% | | | |
| Sampo Oyj (A Shares) | | 3,117 | 127,734 |
| Tikkurila Oyj | | 3,247 | 51,786 |
|
| TOTAL FINLAND | | | 179,520 |
|
| France - 6.8% | | | |
| ALTEN | | 436 | 47,873 |
| Atos Origin SA | | 1,475 | 114,470 |
| AXA SA | | 16,582 | 438,946 |
| Bouygues SA | | 3,335 | 141,342 |
| Capgemini SA | | 1,333 | 150,082 |
| Edenred SA | | 4,619 | 243,154 |
| Elis SA | | 4,890 | 93,424 |
| Laurent-Perrier Group SA | | 171 | 16,974 |
| Legrand SA | | 2,542 | 198,400 |
| LVMH Moet Hennessy Louis Vuitton SE | | 1,152 | 491,969 |
| Natixis SA | | 21,966 | 100,714 |
| Safran SA | | 2,677 | 423,516 |
| Sanofi SA | | 4,543 | 418,806 |
| Societe Generale Series A | | 6,231 | 177,203 |
| SR Teleperformance SA | | 794 | 179,943 |
| Thales SA | | 1,182 | 115,534 |
| Total SA | | 13,145 | 694,953 |
| Vetoquinol SA | | 391 | 25,467 |
| VINCI SA | | 3,738 | 419,401 |
| Vivendi SA | | 6,940 | 193,195 |
| Worldline SA (a)(b) | | 1,249 | 75,849 |
|
| TOTAL FRANCE | | | 4,761,215 |
|
| Germany - 6.9% | | | |
| Bayer AG | | 4,717 | 365,927 |
| CompuGroup Medical AG | | 1,339 | 85,720 |
| Continental AG | | 1,154 | 154,568 |
| CTS Eventim AG | | 715 | 43,261 |
| Daimler AG (Germany) | | 2,938 | 171,735 |
| Deutsche Borse AG | | 1,628 | 252,112 |
| DIC Asset AG | | 1,087 | 15,154 |
| Hannover Reuck SE | | 1,672 | 296,127 |
| HeidelbergCement Finance AG | | 3,224 | 239,547 |
| Linde PLC | | 3,999 | 790,550 |
| MTU Aero Engines Holdings AG | | 1,452 | 387,688 |
| Muenchener Rueckversicherungs-Gesellschaft AG in Muenchen | | 814 | 226,056 |
| Nexus AG | | 419 | 14,860 |
| Rheinmetall AG | | 1,191 | 143,260 |
| RWE AG | | 5,460 | 166,427 |
| SAP SE | | 7,624 | 1,010,191 |
| Vonovia SE | | 8,516 | 453,145 |
| WashTec AG | | 359 | 18,058 |
|
| TOTAL GERMANY | | | 4,834,386 |
|
| Greece - 0.0% | | | |
| Motor Oil (HELLAS) Corinth Refineries SA | | 400 | 9,877 |
| Hong Kong - 2.5% | | | |
| AIA Group Ltd. | | 71,400 | 711,017 |
| China Resources Beer Holdings Co. Ltd. | | 100,477 | 515,148 |
| CNOOC Ltd. sponsored ADR | | 1,682 | 249,844 |
| Hong Kong Exchanges and Clearing Ltd. | | 8,600 | 267,925 |
|
| TOTAL HONG KONG | | | 1,743,934 |
|
| India - 1.7% | | | |
| Embassy Office Parks (REIT) | | 4,400 | 25,578 |
| Housing Development Finance Corp. Ltd. | | 16,203 | 485,934 |
| Infosys Ltd. sponsored ADR | | 16,438 | 157,640 |
| Jyothy Laboratories Ltd. | | 4,252 | 10,476 |
| Larsen & Toubro Ltd. | | 8,244 | 170,923 |
| Shree Cement Ltd. | | 672 | 188,247 |
| Solar Industries India Ltd. (b) | | 10,000 | 149,344 |
|
| TOTAL INDIA | | | 1,188,142 |
|
| Indonesia - 0.4% | | | |
| PT Bank Mandiri (Persero) Tbk | | 369,746 | 184,825 |
| PT Bank Rakyat Indonesia Tbk | | 322,500 | 96,632 |
|
| TOTAL INDONESIA | | | 281,457 |
|
| Ireland - 0.9% | | | |
| CRH PLC | | 6,979 | 254,104 |
| CRH PLC sponsored ADR | | 9,451 | 344,962 |
| FBD Holdings PLC | | 500 | 4,941 |
|
| TOTAL IRELAND | | | 604,007 |
|
| Israel - 0.7% | | | |
| Azrieli Group | | 181 | 13,943 |
| Elbit Systems Ltd. (Israel) | | 2,482 | 406,689 |
| Ituran Location & Control Ltd. | | 1,772 | 43,467 |
| Strauss Group Ltd. | | 1,615 | 48,893 |
| Tel Aviv Stock Exchange Ltd. | | 4,200 | 15,551 |
|
| TOTAL ISRAEL | | | 528,543 |
|
| Italy - 1.6% | | | |
| Assicurazioni Generali SpA | | 10,033 | 203,375 |
| Enel SpA | | 60,603 | 469,695 |
| Interpump Group SpA | | 5,852 | 160,297 |
| Intesa Sanpaolo SpA | | 68,216 | 170,937 |
| Mediobanca SpA | | 12,994 | 154,342 |
|
| TOTAL ITALY | | | 1,158,646 |
|
| Japan - 14.4% | | | |
| Ai Holdings Corp. | | 700 | 12,687 |
| Aoki Super Co. Ltd. | | 600 | 14,280 |
| Artnature, Inc. | | 1,500 | 9,964 |
| Aucnet, Inc. | | 500 | 6,867 |
| Azbil Corp. | | 10,900 | 303,316 |
| Broadleaf Co. Ltd. | | 5,700 | 32,024 |
| Central Automotive Products Ltd. | | 100 | 1,957 |
| Century21 Real Estate Japan Ltd. | | 200 | 2,238 |
| Coca-Cola West Co. Ltd. | | 700 | 15,893 |
| Daiichikosho Co. Ltd. | | 1,100 | 52,291 |
| Daikokutenbussan Co. Ltd. | | 600 | 18,720 |
| DENSO Corp. | | 6,634 | 308,016 |
| East Japan Railway Co. | | 1,800 | 163,406 |
| Fanuc Corp. | | 2,320 | 457,618 |
| Funai Soken Holdings, Inc. | | 1,000 | 24,094 |
| GCA Savvian Group Corp. | | 1,700 | 13,594 |
| Goldcrest Co. Ltd. | | 2,200 | 45,445 |
| Hitachi High-Technologies Corp. | | 2,327 | 144,776 |
| Hoya Corp. | | 7,277 | 643,121 |
| Ibiden Co. Ltd. | | 2,702 | 62,391 |
| Idemitsu Kosan Co. Ltd. | | 4,901 | 144,066 |
| Itochu Corp. | | 14,050 | 293,756 |
| Iwatsuka Confectionary Co. Ltd. | | 100 | 3,577 |
| Kao Corp. | | 2,082 | 167,390 |
| Keyence Corp. | | 1,000 | 632,296 |
| Kobayashi Pharmaceutical Co. Ltd. | | 400 | 31,984 |
| Koshidaka Holdings Co. Ltd. | | 4,700 | 68,249 |
| Kusuri No Aoki Holdings Co. Ltd. | | 400 | 29,831 |
| Lasertec Corp. | | 1,500 | 107,829 |
| Medikit Co. Ltd. | | 400 | 25,347 |
| Minebea Mitsumi, Inc. | | 10,953 | 208,014 |
| Miroku Jyoho Service Co., Ltd. | | 700 | 18,451 |
| Misumi Group, Inc. | | 12,750 | 320,519 |
| Mitsubishi Estate Co. Ltd. | | 6,326 | 122,822 |
| Mitsubishi UFJ Financial Group, Inc. | | 64,492 | 334,345 |
| Mitsuboshi Belting Ltd. | | 600 | 11,290 |
| Mitsui Fudosan Co. Ltd. | | 6,104 | 156,158 |
| Nabtesco Corp. | | 4,900 | 155,991 |
| Nagaileben Co. Ltd. | | 2,200 | 52,444 |
| Nihon Parkerizing Co. Ltd. | | 6,000 | 70,350 |
| Nintendo Co. Ltd. | | 224 | 82,160 |
| NS Tool Co. Ltd. | | 900 | 17,547 |
| OBIC Co. Ltd. | | 2,460 | 308,005 |
| Oracle Corp. Japan | | 1,674 | 147,138 |
| ORIX Corp. | | 17,035 | 267,703 |
| OSG Corp. | | 8,100 | 173,255 |
| Paramount Bed Holdings Co. Ltd. | | 1,200 | 45,884 |
| ProNexus, Inc. | | 1,487 | 17,448 |
| Recruit Holdings Co. Ltd. | | 10,090 | 335,332 |
| San-Ai Oil Co. Ltd. | | 3,600 | 37,689 |
| Shin-Etsu Chemical Co. Ltd. | | 2,488 | 277,415 |
| Shinsei Bank Ltd. | | 11,196 | 174,543 |
| SHO-BOND Holdings Co. Ltd. | | 4,520 | 175,423 |
| Shoei Co. Ltd. | | 1,400 | 60,942 |
| SK Kaken Co. Ltd. | | 40 | 17,081 |
| SoftBank Corp. | | 1,129 | 43,429 |
| Software Service, Inc. | | 300 | 32,343 |
| Sony Corp. | | 1,727 | 105,121 |
| Sony Financial Holdings, Inc. | | 9,367 | 201,516 |
| Sumitomo Mitsui Financial Group, Inc. | | 9,755 | 346,334 |
| Suzuki Motor Corp. | | 1,908 | 90,085 |
| Takeda Pharmaceutical Co. Ltd. | | 6,965 | 251,667 |
| The Monogatari Corp. | | 200 | 17,273 |
| TKC Corp. | | 600 | 25,276 |
| Tokio Marine Holdings, Inc. | | 6,461 | 349,318 |
| Tokyo Electron Ltd. | | 587 | 118,925 |
| Toyota Motor Corp. | | 10,053 | 697,486 |
| USS Co. Ltd. | | 19,600 | 379,617 |
| Welcia Holdings Co. Ltd. | | 500 | 28,730 |
| Workman Co. Ltd. | | 500 | 35,390 |
| Yamada Consulting Group Co. Ltd. | | 900 | 16,225 |
| Yamato Kogyo Co. Ltd. | | 500 | 12,971 |
|
| TOTAL JAPAN | | | 10,176,678 |
|
| Kenya - 0.1% | | | |
| Safaricom Ltd. | | 366,800 | 105,637 |
| Korea (South) - 3.2% | | | |
| BGF Retail Co. Ltd. | | 605 | 92,020 |
| Leeno Industrial, Inc. | | 239 | 10,865 |
| Samsung Electronics Co. Ltd. | | 38,506 | 1,658,304 |
| Shinhan Financial Group Co. Ltd. | | 14,149 | 512,507 |
|
| TOTAL KOREA (SOUTH) | | | 2,273,696 |
|
| Mexico - 1.0% | | | |
| CEMEX S.A.B. de CV sponsored ADR | | 42,672 | 160,873 |
| Consorcio ARA S.A.B. de CV | | 28,014 | 5,272 |
| Grupo Financiero Banorte S.A.B. de CV Series O | | 93,443 | 510,047 |
|
| TOTAL MEXICO | | | 676,192 |
|
| Netherlands - 2.3% | | | |
| Aalberts Industries NV | | 1,693 | 68,089 |
| AerCap Holdings NV (b) | | 2,697 | 156,102 |
| ASML Holding NV (Netherlands) | | 3,388 | 888,044 |
| ING Groep NV (Certificaten Van Aandelen) | | 20,464 | 231,724 |
| Koninklijke Philips Electronics NV | | 3,909 | 171,504 |
| Prosus NV (b) | | 1,225 | 84,475 |
| Takeaway.com Holding BV (a)(b) | | 265 | 21,575 |
|
| TOTAL NETHERLANDS | | | 1,621,513 |
|
| New Zealand - 0.2% | | | |
| Auckland International Airport Ltd. | | 21,468 | 127,946 |
| Norway - 0.4% | | | |
| Adevinta ASA: | | | |
| rights 11/12/19 (b) | | 2,938 | 449 |
| Class B | | 10,037 | 114,601 |
| Kongsberg Gruppen ASA | | 2,983 | 44,050 |
| Schibsted ASA (B Shares) | | 4,185 | 116,865 |
| Skandiabanken ASA (a) | | 2,160 | 15,338 |
|
| TOTAL NORWAY | | | 291,303 |
|
| Peru - 0.8% | | | |
| Compania de Minas Buenaventura SA sponsored ADR | | 35,937 | 551,274 |
| Philippines - 0.4% | | | |
| Ayala Land, Inc. | | 278,347 | 265,813 |
| Jollibee Food Corp. | | 4,700 | 21,461 |
|
| TOTAL PHILIPPINES | | | 287,274 |
|
| Portugal - 0.2% | | | |
| Galp Energia SGPS SA Class B | | 7,777 | 124,391 |
| Russia - 1.5% | | | |
| Lukoil PJSC sponsored ADR | | 3,520 | 323,699 |
| MMC Norilsk Nickel PJSC sponsored ADR | | 13,566 | 375,778 |
| Sberbank of Russia sponsored ADR | | 24,803 | 364,604 |
|
| TOTAL RUSSIA | | | 1,064,081 |
|
| Singapore - 0.7% | | | |
| CapitaLand Ltd. | | 103,336 | 273,140 |
| United Overseas Bank Ltd. | | 11,500 | 226,406 |
|
| TOTAL SINGAPORE | | | 499,546 |
|
| South Africa - 0.8% | | | |
| Clicks Group Ltd. | | 12,552 | 204,165 |
| Impala Platinum Holdings Ltd. (b) | | 27,291 | 187,563 |
| Naspers Ltd. Class N | | 1,025 | 145,046 |
|
| TOTAL SOUTH AFRICA | | | 536,774 |
|
| Spain - 1.9% | | | |
| Amadeus IT Holding SA Class A | | 6,454 | 477,525 |
| Banco Santander SA (Spain) | | 114,731 | 459,886 |
| Cellnex Telecom SA (a) | | 2,677 | 115,426 |
| Masmovil Ibercom SA (b) | | 4,261 | 98,468 |
| Prosegur Compania de Seguridad SA (Reg.) | | 31,345 | 121,658 |
| Unicaja Banco SA (a) | | 40,984 | 37,093 |
|
| TOTAL SPAIN | | | 1,310,056 |
|
| Sweden - 2.9% | | | |
| Addlife AB | | 1,468 | 32,839 |
| AddTech AB (B Shares) | | 2,293 | 63,762 |
| ASSA ABLOY AB (B Shares) | | 23,806 | 565,354 |
| Atlas Copco AB (A Shares) | | 9,942 | 351,214 |
| Epiroc AB Class A | | 14,982 | 168,506 |
| Ericsson (B Shares) | | 26,868 | 234,794 |
| Fagerhult AB | | 7,911 | 46,864 |
| Investor AB (B Shares) | | 6,076 | 311,172 |
| Lagercrantz Group AB (B Shares) | | 3,510 | 45,076 |
| Loomis AB (B Shares) | | 2,697 | 104,185 |
| Saab AB (B Shares) | | 1,000 | 30,832 |
| Swedbank AB (A Shares) | | 6,966 | 97,430 |
|
| TOTAL SWEDEN | | | 2,052,028 |
|
| Switzerland - 4.8% | | | |
| Nestle SA (Reg. S) | | 12,408 | 1,327,425 |
| Roche Holding AG (participation certificate) | | 2,765 | 832,143 |
| Schindler Holding AG: | | | |
| (participation certificate) | | 1,240 | 303,181 |
| (Reg.) | | 128 | 30,258 |
| Swiss Life Holding AG | | 395 | 197,480 |
| Tecan Group AG | | 187 | 44,205 |
| UBS Group AG | | 19,139 | 225,266 |
| Zurich Insurance Group Ltd. | | 1,154 | 450,955 |
|
| TOTAL SWITZERLAND | | | 3,410,913 |
|
| Taiwan - 3.5% | | | |
| Addcn Technology Co. Ltd. | | 2,000 | 16,329 |
| Realtek Semiconductor Corp. | | 30,471 | 226,299 |
| Sporton International, Inc. | | 24,718 | 153,991 |
| Taiwan Semiconductor Manufacturing Co. Ltd. | | 143,000 | 1,398,730 |
| Unified-President Enterprises Corp. | | 184,312 | 454,465 |
| Yageo Corp. | | 23,354 | 240,447 |
|
| TOTAL TAIWAN | | | 2,490,261 |
|
| Thailand - 0.2% | | | |
| Siam Cement PCL (For. Reg.) | | 12,929 | 157,250 |
| United Kingdom - 8.3% | | | |
| Alliance Pharma PLC | | 25,112 | 24,071 |
| Ascential PLC (a) | | 4,638 | 20,979 |
| AstraZeneca PLC (United Kingdom) | | 2,892 | 282,020 |
| Aviva PLC | | 37,682 | 203,108 |
| Avon Rubber PLC | | 1,788 | 41,134 |
| BAE Systems PLC | | 12,030 | 89,861 |
| Beazley PLC | | 11,025 | 83,759 |
| BHP Billiton PLC | | 32,137 | 681,643 |
| Bodycote PLC | | 1,579 | 14,645 |
| BP PLC | | 116,827 | 740,843 |
| British American Tobacco PLC (United Kingdom) | | 4,322 | 151,166 |
| Cineworld Group PLC | | 4,834 | 13,945 |
| Dechra Pharmaceuticals PLC | | 1,894 | 64,524 |
| DP Poland PLC (b) | | 29,059 | 1,732 |
| Elementis PLC | | 29,418 | 56,665 |
| Great Portland Estates PLC | | 2,455 | 25,046 |
| Hilton Food Group PLC | | 368 | 4,843 |
| Howden Joinery Group PLC | | 3,083 | 23,059 |
| Imperial Brands PLC | | 5,772 | 126,537 |
| Informa PLC | | 27,556 | 276,634 |
| InterContinental Hotel Group PLC ADR | | 6,430 | 389,594 |
| ITE Group PLC | | 22,345 | 22,490 |
| Lloyds Banking Group PLC | | 494,090 | 363,456 |
| London Stock Exchange Group PLC | | 2,026 | 182,581 |
| M&G PLC (b) | | 16,347 | 45,272 |
| Micro Focus International PLC | | 3,531 | 48,464 |
| Network International Holdings PLC (a) | | 3,013 | 21,115 |
| Prudential PLC | | 16,347 | 285,530 |
| Rightmove PLC | | 21,551 | 167,106 |
| Royal Dutch Shell PLC Class B sponsored ADR | | 6,325 | 368,684 |
| RSA Insurance Group PLC | | 23,930 | 161,894 |
| Shaftesbury PLC | | 2,055 | 25,155 |
| Spectris PLC | | 7,274 | 225,383 |
| Spirax-Sarco Engineering PLC | | 1,035 | 106,249 |
| Standard Chartered PLC (United Kingdom) | | 29,342 | 266,437 |
| Standard Life PLC | | 43,805 | 172,214 |
| The Weir Group PLC | | 2,404 | 41,930 |
| Ultra Electronics Holdings PLC | | 1,045 | 26,396 |
|
| TOTAL UNITED KINGDOM | | | 5,846,164 |
|
| United States of America - 6.8% | | | |
| Alphabet, Inc. Class A (b) | | 137 | 172,456 |
| Autoliv, Inc. | | 2,023 | 157,470 |
| Berkshire Hathaway, Inc. Class B (b) | | 1,172 | 249,144 |
| Black Knight, Inc. (b) | | 2,927 | 187,913 |
| ConocoPhillips Co. | | 1,738 | 95,938 |
| Lam Research Corp. | | 473 | 128,202 |
| Marsh & McLennan Companies, Inc. | | 3,295 | 341,428 |
| Martin Marietta Materials, Inc. | | 948 | 248,291 |
| MasterCard, Inc. Class A | | 2,190 | 606,214 |
| MercadoLibre, Inc. (b) | | 303 | 158,021 |
| Moody's Corp. | | 1,338 | 295,283 |
| Morningstar, Inc. | | 87 | 14,080 |
| MSCI, Inc. | | 1,287 | 301,879 |
| PayPal Holdings, Inc. (b) | | 1,423 | 148,134 |
| PriceSmart, Inc. | | 1,126 | 83,437 |
| ResMed, Inc. | | 2,448 | 362,108 |
| S&P Global, Inc. | | 1,143 | 294,883 |
| Sherwin-Williams Co. | | 637 | 364,568 |
| Visa, Inc. Class A | | 3,361 | 601,148 |
|
| TOTAL UNITED STATES OF AMERICA | | | 4,810,597 |
|
| TOTAL COMMON STOCKS | | | |
| (Cost $63,839,019) | | | 68,604,604 |
|
| Nonconvertible Preferred Stocks - 1.2% | | | |
| Brazil - 0.7% | | | |
| Itau Unibanco Holding SA | | 19,550 | 176,611 |
| Petroleo Brasileiro SA - Petrobras sponsored ADR | | 21,860 | 355,006 |
|
| TOTAL BRAZIL | | | 531,617 |
|
| Germany - 0.5% | | | |
| Porsche Automobil Holding SE (Germany) | | 3,917 | 288,411 |
| Sartorius AG (non-vtg.) | | 215 | 41,771 |
|
| TOTAL GERMANY | | | 330,182 |
|
| TOTAL NONCONVERTIBLE PREFERRED STOCKS | | | |
| (Cost $789,818) | | | 861,799 |
|
| Money Market Funds - 1.4% | | | |
| Fidelity Cash Central Fund 1.83% (c) | | | |
| (Cost $940,436) | | 940,255 | 940,443 |
| TOTAL INVESTMENT IN SECURITIES - 99.9% | | | |
| (Cost $65,569,273) | | | 70,406,846 |
| NET OTHER ASSETS (LIABILITIES) - 0.1% | | | 90,506 |
| NET ASSETS - 100% | | | $70,497,352 |
Categorizations in the Schedule of Investments are based on country or territory of incorporation.
Legend
(a) Security exempt from registration under Rule 144A of the Securities Act of 1933. These securities may be resold in transactions exempt from registration, normally to qualified institutional buyers. At the end of the period, the value of these securities amounted to $432,077 or 0.6% of net assets.
(b) Non-income producing
(c) Affiliated fund that is generally available only to investment companies and other accounts managed by Fidelity Investments. The rate quoted is the annualized seven-day yield of the fund at period end. A complete unaudited listing of the fund's holdings as of its most recent quarter end is available upon request. In addition, each Fidelity Central Fund's financial statements, which are not covered by the Fund's Report of Independent Registered Public Accounting Firm, are available on the SEC's website or upon request.
Affiliated Central Funds
Information regarding fiscal year to date income earned by the Fund from investments in Fidelity Central Funds is as follows:
| Fund | Income earned |
| Fidelity Cash Central Fund | $21,556 |
| Fidelity Securities Lending Cash Central Fund | 3,658 |
| Total | $25,214 |
Amounts in the income column in the above table include any capital gain distributions from underlying funds, which are presented in the corresponding line-item in the Statement of Operations, if applicable. Amount for Fidelity Securities Lending Cash Central Fund represents the income earned on investing cash collateral, less rebates paid to borrowers and any lending agent fees associated with the loan, plus any premium payments received for lending certain types of securities.
Investment Valuation
The following is a summary of the inputs used, as of October 31, 2019, involving the Fund's assets and liabilities carried at fair value. The inputs or methodology used for valuing securities may not be an indication of the risk associated with investing in those securities. For more information on valuation inputs, and their aggregation into the levels used below, please refer to the Investment Valuation section in the accompanying Notes to Financial Statements.
| | Valuation Inputs at Reporting Date: |
| Description | Total | Level 1 | Level 2 | Level 3 |
| Investments in Securities: | | | | |
| Equities: | | | | |
| Communication Services | $2,893,590 | $1,477,841 | $1,415,749 | $-- |
| Consumer Discretionary | 5,614,268 | 1,547,330 | 4,066,938 | -- |
| Consumer Staples | 4,264,121 | 1,769,251 | 2,494,870 | -- |
| Energy | 4,053,025 | 1,864,512 | 2,188,513 | -- |
| Financials | 17,334,677 | 8,173,132 | 9,161,545 | -- |
| Health Care | 4,478,186 | 735,853 | 3,742,333 | -- |
| Industrials | 10,504,747 | 6,700,550 | 3,804,197 | -- |
| Information Technology | 11,613,773 | 5,787,205 | 5,826,568 | -- |
| Materials | 6,580,083 | 4,578,404 | 2,001,679 | -- |
| Real Estate | 1,423,637 | 532,443 | 891,194 | -- |
| Utilities | 706,296 | 236,601 | 469,695 | -- |
| Money Market Funds | 940,443 | 940,443 | -- | -- |
| Total Investments in Securities: | $70,406,846 | $34,343,565 | $36,063,281 | $-- |
See accompanying notes which are an integral part of the financial statements.
Financial Statements
Statement of Assets and Liabilities
| | | October 31, 2019 |
| Assets | | |
Investment in securities, at value — See accompanying schedule:
Unaffiliated issuers (cost $64,628,837) | $69,466,403 | |
| Fidelity Central Funds (cost $940,436) | 940,443 | |
| Total Investment in Securities (cost $65,569,273) | | $70,406,846 |
| Cash | | 48,358 |
| Foreign currency held at value (cost $7,836) | | 7,840 |
| Receivable for investments sold | | 33,374 |
| Receivable for fund shares sold | | 24,203 |
| Dividends receivable | | 156,667 |
| Distributions receivable from Fidelity Central Funds | | 2,238 |
| Other receivables | | 1,351 |
| Total assets | | 70,680,877 |
| Liabilities | | |
| Payable for investments purchased | $73,295 | |
| Payable for fund shares redeemed | 110,230 | |
| Total liabilities | | 183,525 |
| Net Assets | | $70,497,352 |
| Net Assets consist of: | | |
| Paid in capital | | $69,303,583 |
| Total accumulated earnings (loss) | | 1,193,769 |
| Net Assets, for 5,705,208 shares outstanding | | $70,497,352 |
| Net Asset Value, offering price and redemption price per share ($70,497,352 ÷ 5,705,208 shares) | | $12.36 |
See accompanying notes which are an integral part of the financial statements.
Statement of Operations
| | | Year ended October 31, 2019 |
| Investment Income | | |
| Dividends | | $1,130,847 |
| Non-Cash dividends | | 285,647 |
| Income from Fidelity Central Funds (including $3,658 from security lending) | | 25,214 |
| Income before foreign taxes withheld | | 1,441,708 |
| Less foreign taxes withheld | | (105,432) |
| Total income | | 1,336,276 |
| Expenses | | |
| Independent trustees' fees and expenses | $240 | |
| Commitment fees | 112 | |
| Total expenses before reductions | 352 | |
| Expense reductions | (265) | |
| Total expenses after reductions | | 87 |
| Net investment income (loss) | | 1,336,189 |
| Realized and Unrealized Gain (Loss) | | |
| Net realized gain (loss) on: | | |
| Investment securities: | | |
| Unaffiliated issuers (net of foreign taxes of $1,345) | (2,441,376) | |
| Fidelity Central Funds | (7) | |
| Foreign currency transactions | (10,125) | |
| Total net realized gain (loss) | | (2,451,508) |
| Change in net unrealized appreciation (depreciation) on: | | |
| Investment securities: | | |
| Unaffiliated issuers (net of decrease in deferred foreign taxes of $1,349) | 7,856,306 | |
| Fidelity Central Funds | 7 | |
| Assets and liabilities in foreign currencies | 1,671 | |
| Total change in net unrealized appreciation (depreciation) | | 7,857,984 |
| Net gain (loss) | | 5,406,476 |
| Net increase (decrease) in net assets resulting from operations | | $6,742,665 |
See accompanying notes which are an integral part of the financial statements.
Statement of Changes in Net Assets
| | Year ended October 31, 2019 | Year ended October 31, 2018 |
| Increase (Decrease) in Net Assets | | |
| Operations | | |
| Net investment income (loss) | $1,336,189 | $1,180,382 |
| Net realized gain (loss) | (2,451,508) | (2,303,267) |
| Change in net unrealized appreciation (depreciation) | 7,857,984 | (4,149,405) |
| Net increase (decrease) in net assets resulting from operations | 6,742,665 | (5,272,290) |
| Distributions to shareholders | (958,596) | (243,461) |
| Share transactions | | |
| Proceeds from sales of shares | 42,380,730 | 61,885,506 |
| Reinvestment of distributions | 958,596 | 243,461 |
| Cost of shares redeemed | (25,018,062) | (24,832,406) |
| Net increase (decrease) in net assets resulting from share transactions | 18,321,264 | 37,296,561 |
| Total increase (decrease) in net assets | 24,105,333 | 31,780,810 |
| Net Assets | | |
| Beginning of period | 46,392,019 | 14,611,209 |
| End of period | $70,497,352 | $46,392,019 |
| Other Information | | |
| Shares | | |
| Sold | 3,597,071 | 5,081,975 |
| Issued in reinvestment of distributions | 92,439 | 20,407 |
| Redeemed | (2,240,142) | (2,068,952) |
| Net increase (decrease) | 1,449,368 | 3,033,430 |
See accompanying notes which are an integral part of the financial statements.
Financial Highlights
Fidelity Flex International Fund
| | | | |
| Years ended October 31, | 2019 | 2018 | 2017 A |
| Selected Per–Share Data | | | |
| Net asset value, beginning of period | $10.90 | $11.95 | $10.00 |
| Income from Investment Operations | | | |
| Net investment income (loss)B | .35C | .30 | .16 |
| Net realized and unrealized gain (loss) | 1.39 | (1.24) | 1.79 |
| Total from investment operations | 1.74 | (.94) | 1.95 |
| Distributions from net investment income | (.28) | (.07) | – |
| Distributions from net realized gain | – | (.03) | – |
| Total distributions | (.28) | (.11)D | – |
| Net asset value, end of period | $12.36 | $10.90 | $11.95 |
| Total ReturnE,F | 16.45% | (7.98)% | 19.50% |
| Ratios to Average Net AssetsG,H | | | |
| Expenses before reductionsI | -% | -% | - %J |
| Expenses net of fee waivers, if anyI | -% | -% | - %J |
| Expenses net of all reductionsI | -% | -% | - %J |
| Net investment income (loss) | 3.01%C,I | 2.53% | 2.24%J |
| Supplemental Data | | | |
| Net assets, end of period (000 omitted) | $70,497 | $46,392 | $14,611 |
| Portfolio turnover rateK | 89% | 69% | 35%J |
A For the period March 7, 2017 (commencement of operations) to October 31, 2017.
B Calculated based on average shares outstanding during the period.
C Net investment income per share reflects a large, non-recurring dividend which amounted to $.04 per share. Excluding this non-recurring dividend, the ratio of net investment income (loss) to average net assets would have been 2.65%.
D Total distributions of $.11 per share is comprised of distributions from net investment income of $.073 and distributions from net realized gain of $.032 per share.
E Total returns for periods of less than one year are not annualized.
F Total returns would have been lower if certain expenses had not been reduced during the applicable periods shown.
G Fees and expenses of any underlying Fidelity Central Funds are not included in the Fund's expense ratio. The Fund indirectly bears its proportionate share of the expenses of any underlying Fidelity Central Funds.
H Expense ratios reflect operating expenses of the Fund. Expenses before reductions do not reflect amounts reimbursed by the investment adviser or reductions from expense offset arrangements and do not represent the amount paid by the Fund during periods when reimbursements or reductions occur. Expenses net of fee waivers reflect expenses after reimbursement by the investment adviser but prior to reductions from expense offset arrangements. Expenses net of all reductions represent the net expenses paid by the Fund.
I Amount represents less than .005%.
J Annualized
K Amount does not include the portfolio activity of any underlying Fidelity Central Funds.
See accompanying notes which are an integral part of the financial statements.
Notes to Financial Statements
For the period ended October 31, 2019
1. Organization.
Fidelity Flex International Fund (the Fund) is a fund of Fidelity Investment Trust (the Trust) and is authorized to issue an unlimited number of shares. Share transactions on the Statement of Changes in Net Assets may contain exchanges between affiliated funds. The Trust is registered under the Investment Company Act of 1940, as amended (the 1940 Act), as an open-end management investment company organized as a Massachusetts business trust. The Fund is available only to certain fee-based accounts offered by Fidelity. The Fund's investments in emerging markets can be subject to social, economic, regulatory, and political uncertainties and can be extremely volatile.
2. Investments in Fidelity Central Funds.
The Fund invests in Fidelity Central Funds, which are open-end investment companies generally available only to other investment companies and accounts managed by the investment adviser and its affiliates. The Fund's Schedule of Investments lists each of the Fidelity Central Funds held as of period end, if any, as an investment of the Fund, but does not include the underlying holdings of each Fidelity Central Fund. As an Investing Fund, the Fund indirectly bears its proportionate share of the expenses of the underlying Fidelity Central Funds.
The Money Market Central Funds seek preservation of capital and current income and are managed by Fidelity Investments Money Management, Inc. (FIMM), an affiliate of the investment adviser. Annualized expenses of the Money Market Central Funds as of their most recent shareholder report date ranged from less than .005% to .01%.
A complete unaudited list of holdings for each Fidelity Central Fund is available upon request or at the Securities and Exchange Commission (the SEC) website at www.sec.gov. In addition, the financial statements of the Fidelity Central Funds, which are not covered by the Fund's Report of Independent Registered Public Accounting Firm, are available on the SEC website or upon request.
3. Significant Accounting Policies.
The Fund is an investment company and applies the accounting and reporting guidance of the Financial Accounting Standards Board (FASB) Accounting Standards Codification Topic 946 Financial Services – Investments Companies. The financial statements have been prepared in conformity with accounting principles generally accepted in the United States of America (GAAP), which require management to make certain estimates and assumptions at the date of the financial statements. Actual results could differ from those estimates. Subsequent events, if any, through the date that the financial statements were issued have been evaluated in the preparation of the financial statements. The following summarizes the significant accounting policies of the Fund:
Investment Valuation. Investments are valued as of 4:00 p.m. Eastern time on the last calendar day of the period. The Board of Trustees (the Board) has delegated the day to day responsibility for the valuation of the Fund's investments to the Fair Value Committee (the Committee) established by the Fund's investment adviser. In accordance with valuation policies and procedures approved by the Board, the Fund attempts to obtain prices from one or more third party pricing vendors or brokers to value its investments. When current market prices, quotations or currency exchange rates are not readily available or reliable, investments will be fair valued in good faith by the Committee, in accordance with procedures adopted by the Board. Factors used in determining fair value vary by investment type and may include market or investment specific events. The frequency with which these procedures are used cannot be predicted and they may be utilized to a significant extent. The Committee oversees the Fund's valuation policies and procedures and reports to the Board on the Committee's activities and fair value determinations. The Board monitors the appropriateness of the procedures used in valuing the Fund's investments and ratifies the fair value determinations of the Committee.
The Fund categorizes the inputs to valuation techniques used to value its investments into a disclosure hierarchy consisting of three levels as shown below:
- Level 1 – quoted prices in active markets for identical investments
- Level 2 – other significant observable inputs (including quoted prices for similar investments, interest rates, prepayment speeds, etc.)
- Level 3 – unobservable inputs (including the Fund's own assumptions based on the best information available)
Valuation techniques used to value the Fund's investments by major category are as follows:
Equity securities, including restricted securities, for which market quotations are readily available, are valued at the last reported sale price or official closing price as reported by a third party pricing vendor on the primary market or exchange on which they are traded and are categorized as Level 1 in the hierarchy. In the event there were no sales during the day or closing prices are not available, securities are valued at the last quoted bid price or may be valued using the last available price and are generally categorized as Level 2 in the hierarchy. For foreign equity securities, when market or security specific events arise, comparisons to the valuation of American Depositary Receipts (ADRs), futures contracts, Exchange-Traded Funds (ETFs) and certain indexes as well as quoted prices for similar securities may be used and would be categorized as Level 2 in the hierarchy. For equity securities, including restricted securities, where observable inputs are limited, assumptions about market activity and risk are used and these securities may be categorized as Level 3 in the hierarchy.
Investments in open-end mutual funds, including the Fidelity Central Funds, are valued at their closing net asset value (NAV) each business day and are categorized as Level 1 in the hierarchy.
Changes in valuation techniques may result in transfers in or out of an assigned level within the disclosure hierarchy. The aggregate value of investments by input level as of October 31, 2019 is included at the end of the Fund's Schedule of Investments.
Foreign Currency. The Fund may use foreign currency contracts to facilitate transactions in foreign-denominated securities. Gains and losses from these transactions may arise from changes in the value of the foreign currency or if the counterparties do not perform under the contracts' terms.
Foreign-denominated assets, including investment securities, and liabilities are translated into U.S. dollars at the exchange rates at period end. Purchases and sales of investment securities, income and dividends received and expenses denominated in foreign currencies are translated into U.S. dollars at the exchange rate in effect on the transaction date.
The effects of exchange rate fluctuations on investments are included with the net realized and unrealized gain (loss) on investment securities. Other foreign currency transactions resulting in realized and unrealized gain (loss) are disclosed separately.
Investment Transactions and Income. For financial reporting purposes, the Fund's investment holdings and NAV include trades executed through the end of the last business day of the period. The NAV per share for processing shareholder transactions is calculated as of the close of business of the New York Stock Exchange (NYSE), normally 4:00 p.m. Eastern time and includes trades executed through the end of the prior business day. Gains and losses on securities sold are determined on the basis of identified cost. Dividend income is recorded on the ex-dividend date, except for certain dividends from foreign securities where the ex-dividend date may have passed, which are recorded as soon as the Fund is informed of the ex-dividend date. Non-cash dividends included in dividend income, if any, are recorded at the fair market value of the securities received. Income and capital gain distributions from Fidelity Central Funds, if any, are recorded on the ex-dividend date. Certain distributions received by the Fund represent a return of capital or capital gain. The Fund determines the components of these distributions subsequent to the ex-dividend date, based upon receipt of tax filings or other correspondence relating to the underlying investment. These distributions are recorded as a reduction of cost of investments and/or as a realized gain. Large, non-recurring dividends recognized by the Fund are presented separately on the Statement of Operations as "Non-cash dividends" and the impact of these dividends is presented in the Financial Highlights. Investment income is recorded net of foreign taxes withheld where recovery of such taxes is uncertain.
Expenses. Expenses directly attributable to a fund are charged to that fund. Expenses attributable to more than one fund are allocated among the respective funds on the basis of relative net assets or other appropriate methods. Expense estimates are accrued in the period to which they relate and adjustments are made when actual amounts are known.
Income Tax Information and Distributions to Shareholders. Each year, the Fund intends to qualify as a regulated investment company under Subchapter M of the Internal Revenue Code, including distributing substantially all of its taxable income and realized gains. As a result, no provision for U.S. Federal income taxes is required. As of October 31, 2019, the Fund did not have any unrecognized tax benefits in the financial statements; nor is the Fund aware of any tax positions for which it is reasonably possible that the total amounts of unrecognized tax benefits will significantly change in the next twelve months. The Fund files a U.S. federal tax return, in addition to state and local tax returns as required. The Fund's federal income tax returns are subject to examination by the Internal Revenue Service (IRS) for a period of three fiscal years after they are filed. State and local tax returns may be subject to examination for an additional fiscal year depending on the jurisdiction. Foreign taxes are provided for based on the Fund's understanding of the tax rules and rates that exist in the foreign markets in which it invests. The Fund is subject to a tax imposed on capital gains by certain countries in which it invests. An estimated deferred tax liability for net unrealized appreciation on the applicable securities is included in Other payables and accrued expenses on the Statement of Assets & Liabilities.
Distributions are declared and recorded on the ex-dividend date. Income and capital gain distributions are determined in accordance with income tax regulations, which may differ from GAAP. In addition, the Fund claimed a portion of the payment made to redeeming shareholders as a distribution for income tax purposes.
Capital accounts within the financial statements are adjusted for permanent book-tax differences. These adjustments have no impact on net assets or the results of operations. Capital accounts are not adjusted for temporary book-tax differences which will reverse in a subsequent period.
Book-tax differences are primarily due to foreign currency transactions, certain foreign taxes, passive foreign investment companies (PFIC), certain deemed distributions, capital loss carryforwards and losses deferred due to wash sales.
As of period end, the cost and unrealized appreciation (depreciation) in securities, and derivatives if applicable, for federal income tax purposes were as follows:
| Gross unrealized appreciation | $7,055,079 |
| Gross unrealized depreciation | (2,837,526) |
| Net unrealized appreciation (depreciation) | $4,217,553 |
| Tax Cost | $66,189,293 |
The tax-based components of distributable earnings as of period end were as follows:
| Undistributed ordinary income | $1,204,389 |
| Capital loss carryforward | $(4,229,281) |
| Net unrealized appreciation (depreciation) on securities and other investments | $4,217,313 |
Capital loss carryforwards are only available to offset future capital gains of the Fund to the extent provided by regulations and may be limited. Under the Regulated Investment Company Modernization Act of 2010 (the Act), the Fund is permitted to carry forward capital losses incurred in taxable years beginning after December 22, 2010 for an unlimited period and such capital losses are required to be used prior to any losses that expire. The capital loss carryforward information presented below, including any applicable limitation, is estimated as of fiscal period end and is subject to adjustment.
| No expiration | |
| Short-term | $(4,114,215) |
| Long-term | (115,066) |
| Total no expiration | $(4,229,281) |
The tax character of distributions paid was as follows:
| | October 31, 2019 | October 31, 2018 |
| Ordinary Income | $958,596 | $ 243,461 |
Restricted Securities. The Fund may invest in securities that are subject to legal or contractual restrictions on resale. These securities generally may be resold in transactions exempt from registration or to the public if the securities are registered. Disposal of these securities may involve time-consuming negotiations and expense, and prompt sale at an acceptable price may be difficult. Information regarding restricted securities is included at the end of the Fund's Schedule of Investments.
4. Purchases and Sales of Investments.
Purchases and sales of securities, other than short-term securities, aggregated $57,849,043 and $39,351,959, respectively.
5. Fees and Other Transactions with Affiliates.
Management Fee. Fidelity Management & Research Company (the investment adviser) and its affiliates provide the Fund with investment management related services and the Fund does not pay any fees for these services. Under the management contract, the investment adviser or an affiliate pays all other expenses of the Fund, excluding fees and expenses of the independent Trustees, and certain miscellaneous expenses such as proxy and shareholder meeting expenses.
Brokerage Commissions. The Fund placed a portion of its portfolio transactions with brokerage firms which are affiliates of the investment adviser. Brokerage commissions are included in net realized gain (loss) and change in net unrealized appreciation (depreciation) in the Statement of Operations. The commissions paid to these affiliated firms were $198 for the period.
Interfund Trades. The Fund may purchase from or sell securities to other Fidelity Funds under procedures adopted by the Board. The procedures have been designed to ensure these interfund trades are executed in accordance with Rule 17a-7 of the 1940 Act. Interfund trades are included within the respective purchases and sales amounts shown in the Purchases and Sales of Investments note.
6. Committed Line of Credit.
The Fund participates with other funds managed by the investment adviser or an affiliate in a $4.25 billion credit facility (the "line of credit") to be utilized for temporary or emergency purposes to fund shareholder redemptions or for other short-term liquidity purposes. The Fund has agreed to pay commitment fees on its pro-rata portion of the line of credit, which amounted to $112 and is reflected in Commitment fees on the Statement of Operations. During the period, the Fund did not borrow on this line of credit.
7. Security Lending.
The Fund lends portfolio securities from time to time in order to earn additional income. For equity securities, lending agents are used, including National Financial Services (NFS), an affiliate of the Fund. Pursuant to a securities lending agreement, NFS will receive a fee, which is capped at 9.9% of daily lending revenue, for its services as lending agent. The Fund may lend securities to certain qualified borrowers, including NFS. On the settlement date of the loan, the Fund receives collateral (in the form of U.S. Treasury obligations, letters of credit and/or cash) against the loaned securities and maintains collateral in an amount not less than 100% of the market value of the loaned securities during the period of the loan. The market value of the loaned securities is determined at the close of business of the Fund and any additional required collateral is delivered to the Fund on the next business day. The Fund or borrower may terminate the loan at any time, and if the borrower defaults on its obligation to return the securities loaned because of insolvency or other reasons, the Fund may apply collateral received from the borrower against the obligation. The Fund may experience delays and costs in recovering the securities loaned. Any cash collateral received is invested in the Fidelity Securities Lending Cash Central Fund. At period end, there were no security loans outstanding. Security lending income represents the income earned on investing cash collateral, less rebates paid to borrowers and any lending agent fees associated with the loan, plus any premium payments received for lending certain types of securities. Security lending income is presented in the Statement of Operations as a component of income from Fidelity Central Funds. During the period, there were no securities loaned to NFS.
8. Expense Reductions.
Through arrangements with the Fund's custodian, credits realized as a result of certain uninvested cash balances were used to reduce the Fund's expenses by $265.
9. Other.
The Fund's organizational documents provide former and current trustees and officers with a limited indemnification against liabilities arising in connection with the performance of their duties to the Fund. In the normal course of business, the Fund may also enter into contracts that provide general indemnifications. The Fund's maximum exposure under these arrangements is unknown as this would be dependent on future claims that may be made against the Fund. The risk of material loss from such claims is considered remote.
Report of Independent Registered Public Accounting Firm
To the Trustees of Fidelity Investment Trust and Shareholders of Fidelity Flex International Fund:
Opinion on the Financial Statements and Financial Highlights
We have audited the accompanying statement of assets and liabilities of Fidelity Flex International Index Fund (the “Fund”), a fund of Fidelity Salem Street Trust including the schedule of investments, as of October 31, 2019, the related statement of operations for the year then ended, the statement of changes in net assets for each of the two years in the period then ended, the financial highlights for each of the two years in the period then ended and for the period from March 7, 2017(commencement of operations) to October 31, 2017, and the related notes. In our opinion, the financial statements and financial highlights present fairly, in all material respects, the financial position of the Fund as of October 31, 2019 and the results of its operations for the year then ended, the changes in its net assets for each of the two years in the period then ended, and the financial highlights for each of the two years in the period then ended and for the period from March 7, 2017 (commencement of operations) to October 31, 2017 in conformity with accounting principles generally accepted in the United States of America.
Basis for Opinion
These financial statements and financial highlights are the responsibility of the Fund's management. Our responsibility is to express an opinion on the Fund's financial statements and financial highlights based on our audits. We are a public accounting firm registered with the Public Company Accounting Oversight Board (United States) (PCAOB) and are required to be independent with respect to the Fund in accordance with the U.S. federal securities laws and the applicable rules and regulations of the Securities and Exchange Commission and the PCAOB.
We conducted our audits in accordance with the standards of the PCAOB. Those standards require that we plan and perform the audit to obtain reasonable assurance about whether the financial statements and financial highlights are free of material misstatement, whether due to error or fraud. The Fund is not required to have, nor were we engaged to perform, an audit of its internal control over financial reporting. As part of our audits we are required to obtain an understanding of internal control over financial reporting but not for the purpose of expressing an opinion on the effectiveness of the Fund’s internal control over financial reporting. Accordingly, we express no such opinion.
Our audits included performing procedures to assess the risks of material misstatement of the financial statements and financial highlights, whether due to error or fraud, and performing procedures that respond to those risks. Such procedures included examining, on a test basis, evidence regarding the amounts and disclosures in the financial statements and financial highlights. Our audits also included evaluating the accounting principles used and significant estimates made by management, as well as evaluating the overall presentation of the financial statements and financial highlights. Our procedures included confirmation of securities owned as of October 31, 2019, by correspondence with the custodians and brokers; when replies were not received from brokers, we performed other auditing procedures. We believe that our audits provide a reasonable basis for our opinion.
/s/ Deloitte & Touche LLP
Boston, Massachusetts
December 13, 2019
We have served as the auditor of one or more of the Fidelity investment companies since 1999.
Trustees and Officers
The Trustees, Members of the Advisory Board (if any), and officers of the trust and fund, as applicable, are listed below. The Board of Trustees governs the fund and is responsible for protecting the interests of shareholders. The Trustees are experienced executives who meet periodically throughout the year to oversee the fund's activities, review contractual arrangements with companies that provide services to the fund, oversee management of the risks associated with such activities and contractual arrangements, and review the fund's performance. Except for Jonathan Chiel, each of the Trustees oversees 298 funds. Mr. Chiel oversees 171 funds.
The Trustees hold office without limit in time except that (a) any Trustee may resign; (b) any Trustee may be removed by written instrument, signed by at least two-thirds of the number of Trustees prior to such removal; (c) any Trustee who requests to be retired or who has become incapacitated by illness or injury may be retired by written instrument signed by a majority of the other Trustees; and (d) any Trustee may be removed at any special meeting of shareholders by a two-thirds vote of the outstanding voting securities of the trust. Each Trustee who is not an interested person (as defined in the 1940 Act) of the trust and the fund is referred to herein as an Independent Trustee. Each Independent Trustee shall retire not later than the last day of the calendar year in which his or her 75th birthday occurs. The Independent Trustees may waive this mandatory retirement age policy with respect to individual Trustees. Officers and Advisory Board Members hold office without limit in time, except that any officer or Advisory Board Member may resign or may be removed by a vote of a majority of the Trustees at any regular meeting or any special meeting of the Trustees. Except as indicated, each individual has held the office shown or other offices in the same company for the past five years.
The fund’s Statement of Additional Information (SAI) includes more information about the Trustees. To request a free copy, call Fidelity at 1-800-544-3455 (for managed account clients) or 1-800-835-5092 (for retirement plan participants).
Experience, Skills, Attributes, and Qualifications of the Trustees. The Governance and Nominating Committee has adopted a statement of policy that describes the experience, qualifications, attributes, and skills that are necessary and desirable for potential Independent Trustee candidates (Statement of Policy). The Board believes that each Trustee satisfied at the time he or she was initially elected or appointed a Trustee, and continues to satisfy, the standards contemplated by the Statement of Policy. The Governance and Nominating Committee also engages professional search firms to help identify potential Independent Trustee candidates who have the experience, qualifications, attributes, and skills consistent with the Statement of Policy. From time to time, additional criteria based on the composition and skills of the current Independent Trustees, as well as experience or skills that may be appropriate in light of future changes to board composition, business conditions, and regulatory or other developments, have also been considered by the professional search firms and the Governance and Nominating Committee. In addition, the Board takes into account the Trustees' commitment and participation in Board and committee meetings, as well as their leadership of standing and ad hoc committees throughout their tenure.
In determining that a particular Trustee was and continues to be qualified to serve as a Trustee, the Board has considered a variety of criteria, none of which, in isolation, was controlling. The Board believes that, collectively, the Trustees have balanced and diverse experience, qualifications, attributes, and skills, which allow the Board to operate effectively in governing the fund and protecting the interests of shareholders. Information about the specific experience, skills, attributes, and qualifications of each Trustee, which in each case led to the Board's conclusion that the Trustee should serve (or continue to serve) as a trustee of the fund, is provided below.
Board Structure and Oversight Function. James C. Curvey is an interested person and currently serves as Chairman. The Trustees have determined that an interested Chairman is appropriate and benefits shareholders because an interested Chairman has a personal and professional stake in the quality and continuity of services provided to the fund. Independent Trustees exercise their informed business judgment to appoint an individual of their choosing to serve as Chairman, regardless of whether the Trustee happens to be independent or a member of management. The Independent Trustees have determined that they can act independently and effectively without having an Independent Trustee serve as Chairman and that a key structural component for assuring that they are in a position to do so is for the Independent Trustees to constitute a substantial majority for the Board. The Independent Trustees also regularly meet in executive session. Ned C. Lautenbach serves as Chairman of the Independent Trustees and as such (i) acts as a liaison between the Independent Trustees and management with respect to matters important to the Independent Trustees and (ii) with management prepares agendas for Board meetings.
Fidelity® funds are overseen by different Boards of Trustees. The fund's Board oversees Fidelity's high income and certain equity funds, and other Boards oversee Fidelity's investment-grade bond, money market, asset allocation, and other equity funds. The asset allocation funds may invest in Fidelity® funds overseen by the fund's Board. The use of separate Boards, each with its own committee structure, allows the Trustees of each group of Fidelity® funds to focus on the unique issues of the funds they oversee, including common research, investment, and operational issues. On occasion, the separate Boards establish joint committees to address issues of overlapping consequences for the Fidelity® funds overseen by each Board.
The Trustees operate using a system of committees to facilitate the timely and efficient consideration of all matters of importance to the Trustees, the fund, and fund shareholders and to facilitate compliance with legal and regulatory requirements and oversight of the fund's activities and associated risks. The Board, acting through its committees, has charged FMR and its affiliates with (i) identifying events or circumstances the occurrence of which could have demonstrably adverse effects on the fund's business and/or reputation; (ii) implementing processes and controls to lessen the possibility that such events or circumstances occur or to mitigate the effects of such events or circumstances if they do occur; and (iii) creating and maintaining a system designed to evaluate continuously business and market conditions in order to facilitate the identification and implementation processes described in (i) and (ii) above. Because the day-to-day operations and activities of the fund are carried out by or through FMR, its affiliates, and other service providers, the fund's exposure to risks is mitigated but not eliminated by the processes overseen by the Trustees. While each of the Board's committees has responsibility for overseeing different aspects of the fund's activities, oversight is exercised primarily through the Operations, Audit, and Compliance Committees. Appropriate personnel, including but not limited to the fund's Chief Compliance Officer (CCO), FMR's internal auditor, the independent accountants, the fund's Treasurer and portfolio management personnel, make periodic reports to the Board's committees, as appropriate, including an annual review of Fidelity's risk management program for the Fidelity® funds. The responsibilities of each standing committee, including their oversight responsibilities, are described further under "Standing Committees of the Trustees."
Interested Trustees*:
Correspondence intended for a Trustee who is an interested person may be sent to Fidelity Investments, 245 Summer Street, Boston, Massachusetts 02210.
Name, Year of Birth; Principal Occupations and Other Relevant Experience+
Jonathan Chiel (1957)
Year of Election or Appointment: 2016
Trustee
Mr. Chiel also serves as Trustee of other Fidelity® funds. Mr. Chiel is Executive Vice President and General Counsel for FMR LLC (diversified financial services company, 2012-present). Previously, Mr. Chiel served as general counsel (2004-2012) and senior vice president and deputy general counsel (2000-2004) for John Hancock Financial Services; a partner with Choate, Hall & Stewart (1996-2000) (law firm); and an Assistant United States Attorney for the United States Attorney’s Office of the District of Massachusetts (1986-95), including Chief of the Criminal Division (1993-1995). Mr. Chiel is a director on the boards of the Boston Bar Foundation and the Maimonides School.
James C. Curvey (1935)
Year of Election or Appointment: 2007
Trustee
Chairman of the Board of Trustees
Mr. Curvey also serves as Trustee of other Fidelity® funds. Mr. Curvey is Vice Chairman (2007-present) and Director of FMR LLC (diversified financial services company). In addition, Mr. Curvey is an Overseer Emeritus for the Boston Symphony Orchestra, a Director of Artis-Naples, and a Trustee of Brewster Academy in Wolfeboro, New Hampshire. Previously, Mr. Curvey served as a Director of Fidelity Research & Analysis Co. (investment adviser firm, 2009-2018), Director of Fidelity Investments Money Management, Inc. (investment adviser firm, 2009-2014) and a Director of FMR and FMR Co., Inc. (investment adviser firms, 2007-2014).
* Determined to be an “Interested Trustee” by virtue of, among other things, his or her affiliation with the trust or various entities under common control with FMR.
+ The information includes the Trustee's principal occupation during the last five years and other information relating to the experience, attributes, and skills relevant to the Trustee's qualifications to serve as a Trustee, which led to the conclusion that the Trustee should serve as a Trustee for the fund.
Independent Trustees:
Correspondence intended for an Independent Trustee may be sent to Fidelity Investments, P.O. Box 55235, Boston, Massachusetts 02205-5235.
Name, Year of Birth; Principal Occupations and Other Relevant Experience+
Dennis J. Dirks (1948)
Year of Election or Appointment: 2005
Trustee
Mr. Dirks also serves as Trustee of other Fidelity® funds. Prior to his retirement in May 2003, Mr. Dirks was Chief Operating Officer and a member of the Board of The Depository Trust & Clearing Corporation (DTCC). He also served as President, Chief Operating Officer, and Board member of The Depository Trust Company (DTC) and President and Board member of the National Securities Clearing Corporation (NSCC). In addition, Mr. Dirks served as Chief Executive Officer and Board member of the Government Securities Clearing Corporation, Chief Executive Officer and Board member of the Mortgage-Backed Securities Clearing Corporation, as a Trustee and a member of the Finance Committee of Manhattan College (2005-2008), as a Trustee and a member of the Finance Committee of AHRC of Nassau County (2006-2008), as a member of the Independent Directors Council (IDC) Governing Council (2010-2015), and as a member of the Board of Directors for The Brookville Center for Children’s Services, Inc. (2009-2017). Mr. Dirks is a member of the Finance Committee (2016-present) and Board of Directors (2017-present) and is Treasurer (2018-present) of the Asolo Repertory Theatre.
Donald F. Donahue (1950)
Year of Election or Appointment: 2018
Trustee
Mr. Donahue also serves as a Trustee of other Fidelity® funds. Mr. Donahue is President and Chief Executive Officer of Miranda Partners, LLC (risk consulting for the financial services industry, 2012-present). Previously, Mr. Donahue served as a Member of the Advisory Board of certain Fidelity® funds (2015-2018) and Chief Executive Officer (2006-2012), Chief Operating Officer (2003-2006), and Managing Director, Customer Marketing and Development (1999-2003) of The Depository Trust & Clearing Corporation (financial markets infrastructure). Mr. Donahue serves as a Member (2007-present) and Co-Chairman (2016-present) of the Board of Directors of United Way of New York, Member of the Board of Directors of NYC Leadership Academy (2012-present) and Member of the Board of Advisors of Ripple Labs, Inc. (financial services, 2015-present). He also served as Chairman (2010-2012) and Member of the Board of Directors (2012-2013) of Omgeo, LLC (financial services), Treasurer of United Way of New York (2012-2016), and Member of the Board of Directors of XBRL US (financial services non-profit, 2009-2012) and the International Securities Services Association (2009-2012).
Alan J. Lacy (1953)
Year of Election or Appointment: 2008
Trustee
Mr. Lacy also serves as Trustee of other Fidelity® funds. Mr. Lacy serves as a Director of Bristol-Myers Squibb Company (global pharmaceuticals, 2008-present). He is a Trustee of the California Chapter of The Nature Conservancy (2015-present) and a Director of the Center for Advanced Study in the Behavioral Sciences at Stanford University (2015-present). In addition, Mr. Lacy served as Senior Adviser (2007-2014) of Oak Hill Capital Partners, L.P. (private equity) and also served as Chief Executive Officer (2005) and Vice Chairman (2005-2006) of Sears Holdings Corporation (retail) and Chief Executive Officer and Chairman of the Board of Sears, Roebuck and Co. (retail, 2000-2005). Previously, Mr. Lacy served as Chairman (2014-2017) and a member (2010-2017) of the Board of Directors of Dave & Buster’s Entertainment, Inc. (restaurant and entertainment complexes), as Chairman (2008-2011) and a member (2006-2015) of the Board of Trustees of the National Parks Conservation Association, and as a member of the Board of Directors for The Hillman Companies, Inc. (hardware wholesalers, 2010-2014), Earth Fare, Inc. (retail grocery, 2010-2014), and The Western Union Company (global money transfer, 2006-2011).
Ned C. Lautenbach (1944)
Year of Election or Appointment: 2000
Trustee
Chairman of the Independent Trustees
Mr. Lautenbach also serves as Trustee of other Fidelity® funds. Mr. Lautenbach currently serves as Chair (2018-present) and Member (2013-present) of the Board of Governors, State University System of Florida and is a member of the Council on Foreign Relations (1994-present). He is also a member and has most recently served as Chairman of the Board of Directors of Artis-Naples (2012-present). Previously, Mr. Lautenbach served as a member and then Lead Director of the Board of Directors of Eaton Corporation (diversified industrial, 1997-2016). He was also a Partner and Advisory Partner at Clayton, Dubilier & Rice, LLC (private equity investment, 1998-2010), as well as a Director of Sony Corporation (2006-2007). In addition, Mr. Lautenbach also had a 30-year career with IBM (technology company) during which time he served as Senior Vice President and a member of the Corporate Executive Committee (1968-1998).
Joseph Mauriello (1944)
Year of Election or Appointment: 2008
Trustee
Mr. Mauriello also serves as Trustee of other Fidelity® funds. Prior to his retirement in January 2006, Mr. Mauriello served in numerous senior management positions including Deputy Chairman and Chief Operating Officer (2004-2005), and Vice Chairman of Financial Services (2002-2004) of KPMG LLP US (professional services, 1965-2005). Mr. Mauriello currently serves as a member of the Independent Directors Council (IDC) Governing Council (2015-present). Previously, Mr. Mauriello served as a member of the Board of Directors of XL Group plc. (global insurance and re-insurance, 2006-2018).
Cornelia M. Small (1944)
Year of Election or Appointment: 2005
Trustee
Ms. Small also serves as Trustee of other Fidelity® funds. Ms. Small is a member of the Board of Directors (2009-present) and Chair of the Investment Committee (2010-present) of the Teagle Foundation. Ms. Small also serves on the Investment Committee of the Berkshire Taconic Community Foundation (2008-present). Previously, Ms. Small served as Chairperson (2002-2008) and a member of the Investment Committee and Chairperson (2008-2012) and a member of the Board of Trustees of Smith College. In addition, Ms. Small served as Chief Investment Officer, Director of Global Equity Investments, and a member of the Board of Directors of Scudder, Stevens & Clark and Scudder Kemper Investments.
Garnett A. Smith (1947)
Year of Election or Appointment: 2018
Trustee
Mr. Smith also serves as Trustee of other Fidelity® funds. Prior to Mr. Smith's retirement, he served as Chairman and Chief Executive Officer of Inbrand Corp. (manufacturer of personal absorbent products, 1990-1997). He also served as President (1986-1990) of Inbrand Corp. Prior to his employment with Inbrand Corp., he was employed by a retail fabric chain and North Carolina National Bank. In addition, Mr. Smith served as a Member of the Advisory Board of certain Fidelity® funds (2012-2013) and as a board member of the Jackson Hole Land Trust (2009-2012).
David M. Thomas (1949)
Year of Election or Appointment: 2008
Trustee
Mr. Thomas also serves as Trustee of other Fidelity® funds. Mr. Thomas serves as Non-Executive Chairman of the Board of Directors of Fortune Brands Home and Security (home and security products, 2011-present) and as a member of the Board of Directors (2004-present) and Presiding Director (2013-present) of Interpublic Group of Companies, Inc. (marketing communication). Previously, Mr. Thomas served as Executive Chairman (2005-2006) and Chairman and Chief Executive Officer (2000-2005) of IMS Health, Inc. (pharmaceutical and healthcare information solutions), a Director of Fortune Brands, Inc. (consumer products, 2000-2011), and a member of the Board of Trustees of the University of Florida (2013-2018).
+ The information includes the Trustee's principal occupation during the last five years and other information relating to the experience, attributes, and skills relevant to the Trustee's qualifications to serve as a Trustee, which led to the conclusion that the Trustee should serve as a Trustee for the fund.
Advisory Board Members and Officers:
Correspondence intended for a Member of the Advisory Board (if any) may be sent to Fidelity Investments, P.O. Box 55235, Boston, Massachusetts 02205-5235. Correspondence intended for an officer or Peter S. Lynch may be sent to Fidelity Investments, 245 Summer Street, Boston, Massachusetts 02210. Officers appear below in alphabetical order.
Name, Year of Birth; Principal Occupation
Vicki L. Fuller (1957)
Year of Election or Appointment: 2018
Member of the Advisory Board
Ms. Fuller also serves as Member of the Advisory Board of other Fidelity® funds. Ms. Fuller serves as a member of the Board of Directors, Audit Committee, and Nominating and Governance Committee of The Williams Companies, Inc. (natural gas infrastructure, 2018-present). Previously, Ms. Fuller served as the Chief Investment Officer of the New York State Common Retirement Fund (2012-2018) and held a variety of positions at AllianceBernstein L.P. (global asset management, 1985-2012), including Managing Director (2006-2012) and Senior Vice President and Senior Portfolio Manager (2001-2006).
Peter S. Lynch (1944)
Year of Election or Appointment: 2003
Member of the Advisory Board
Mr. Lynch also serves as Member of the Advisory Board of other Fidelity® funds. Mr. Lynch is Vice Chairman and a Director of FMR (investment adviser firm) and FMR Co., Inc. (investment adviser firm). In addition, Mr. Lynch serves as a Trustee of Boston College and as the Chairman of the Inner-City Scholarship Fund. Previously, Mr. Lynch served on the Special Olympics International Board of Directors (1997-2006).
Michael E. Wiley (1950)
Year of Election or Appointment: 2018
Member of the Advisory Board
Mr. Wiley also serves as Trustee or Member of the Advisory Board of other Fidelity® funds. Mr. Wiley serves as a Director of High Point Resources (exploration and production, 2005-present). Previously, Mr. Wiley served as a Director of Andeavor Corporation (independent oil refiner and marketer, 2005-2018), a Director of Andeavor Logistics LP (natural resources logistics, 2015-2018), a Director of Post Oak Bank (privately-held bank, 2004-2018), a Director of Asia Pacific Exploration Consolidated (international oil and gas exploration and production, 2008-2013), a member of the Board of Trustees of the University of Tulsa (2000-2006; 2007-2010), a Senior Energy Advisor of Katzenbach Partners, LLC (consulting, 2006-2007), an Advisory Director of Riverstone Holdings (private investment), a Director of Spinnaker Exploration Company (exploration and production, 2001-2005) and Chairman, President, and CEO of Baker Hughes, Inc. (oilfield services, 2000-2004).
Elizabeth Paige Baumann (1968)
Year of Election or Appointment: 2017
Anti-Money Laundering (AML) Officer
Ms. Baumann also serves as AML Officer of other funds. She is Chief AML Officer (2012-present) and Senior Vice President (2014-present) of FMR LLC (diversified financial services company) and is an employee of Fidelity Investments. Previously, Ms. Baumann served as AML Officer of the funds (2012-2016), and Vice President (2007-2014) and Deputy Anti-Money Laundering Officer (2007-2012) of FMR LLC.
Craig S. Brown (1977)
Year of Election or Appointment: 2019
Assistant Treasurer
Mr. Brown also serves as Assistant Treasurer of other funds. Mr. Brown is an employee of Fidelity Investments (2013-present).
John J. Burke III (1964)
Year of Election or Appointment: 2018
Chief Financial Officer
Mr. Burke also serves as Chief Financial Officer of other funds. Mr. Burke serves as Head of Investment Operations for Fidelity Fund and Investment Operations (2018-present) and is an employee of Fidelity Investments (1998-present). Previously Mr. Burke served as head of Asset Management Investment Operations (2012-2018).
William C. Coffey (1969)
Year of Election or Appointment: 2019
Assistant Secretary
Mr. Coffey also serves as Assistant Secretary of other funds. He is Senior Vice President and Deputy General Counsel of FMR LLC (diversified financial services company, 2010-present), and is an employee of Fidelity Investments. Previously, Mr. Coffey served as Secretary and CLO of certain funds (2018-2019); CLO, Secretary, and Senior Vice President of Fidelity Management & Research Company and FMR Co., Inc. (investment adviser firms, 2018-2019); Secretary of Fidelity SelectCo, LLC and Fidelity Investments Money Management, Inc. (investment adviser firms, 2018-2019); CLO of Fidelity Management & Research (Hong Kong) Limited, FMR Investment Management (UK) Limited, and Fidelity Management & Research (Japan) Limited (investment adviser firms, 2018-2019); and Assistant Secretary of certain funds (2009-2018).
Timothy M. Cohen (1969)
Year of Election or Appointment: 2018
Vice President
Mr. Cohen also serves as Vice President of other funds. Mr. Cohen serves as Executive Vice President of Fidelity SelectCo, LLC (2019-present), Co-Head of Equity (2018-present), a Director of Fidelity Management & Research (Japan) Limited (investment adviser firm, 2016-present), and is an employee of Fidelity Investments. Previously, Mr. Cohen served as Head of Global Equity Research (2016-2018), Chief Investment Officer - Equity and a Director of Fidelity Management & Research (U.K.) Inc. (investment adviser firm, 2013-2015) and as a Director of Fidelity Management & Research (Hong Kong) Limited (investment adviser firm, 2017).
Jonathan Davis (1968)
Year of Election or Appointment: 2010
Assistant Treasurer
Mr. Davis also serves as Assistant Treasurer of other funds. Mr. Davis serves as Assistant Treasurer of FMR Capital, Inc. (2017-present) and is an employee of Fidelity Investments. Previously, Mr. Davis served as Vice President and Associate General Counsel of FMR LLC (diversified financial services company, 2003-2010).
Adrien E. Deberghes (1967)
Year of Election or Appointment: 2016
Assistant Treasurer
Mr. Deberghes also serves as an officer of other funds. He serves as Assistant Treasurer of FMR Capital, Inc. (2017-present), Executive Vice President of Fidelity Investments Money Management, Inc. (FIMM) (investment adviser firm, 2016-present), and is an employee of Fidelity Investments (2008-present). Previously, Mr. Deberghes served as President and Treasurer of certain Fidelity® funds (2013-2018). Prior to joining Fidelity Investments, Mr. Deberghes was Senior Vice President of Mutual Fund Administration at State Street Corporation (2007-2008), Senior Director of Mutual Fund Administration at Investors Bank & Trust (2005-2007), and Director of Finance for Dunkin' Brands (2000-2005). Previously, Mr. Deberghes served in other fund officer roles.
Laura M. Del Prato (1964)
Year of Election or Appointment: 2018
Assistant Treasurer
Ms. Del Prato also serves as an officer of other funds. Ms. Del Prato is an employee of Fidelity Investments (2017-present). Prior to joining Fidelity Investments, Ms. Del Prato served as a Managing Director and Treasurer of the JPMorgan Mutual Funds (2014-2017). Prior to JPMorgan, Ms. Del Prato served as a partner at Cohen Fund Audit Services (accounting firm, 2012-2013) and KPMG LLP (accounting firm, 2004-2012).
Colm A. Hogan (1973)
Year of Election or Appointment: 2016
Deputy Treasurer
Mr. Hogan also serves as an officer of other funds. Mr. Hogan serves as Assistant Treasurer of FMR Capital, Inc. (2017-present) and is an employee of Fidelity Investments (2005-present). Previously, Mr. Hogan served as Assistant Treasurer of certain Fidelity® funds (2016-2018).
Pamela R. Holding (1964)
Year of Election or Appointment: 2018
Vice President
Ms. Holding also serves as Vice President of other funds. Ms. Holding serves as Executive Vice President of Fidelity SelectCo, LLC (2019-present), Co-Head of Equity (2018-present) and is an employee of Fidelity Investments (2013-present). Previously, Ms. Holding served as Chief Investment Officer of Fidelity Institutional Asset Management (2013-2018).
Cynthia Lo Bessette (1969)
Year of Election or Appointment: 2019
Secretary and Chief Legal Officer (CLO)
Ms. Lo Bessette also serves as Secretary and CLO of other funds. Ms. Lo Bessette serves as CLO, Secretary, and Senior Vice President of Fidelity Management & Research Company and FMR Co., Inc. (investment adviser firms, 2019-present); Secretary of Fidelity SelectCo, LLC and Fidelity Investments Money Management, Inc. (investment adviser firms, 2019-present); and CLO of Fidelity Management & Research (Hong Kong) Limited, FMR Investment Management (UK) Limited, and Fidelity Management & Research (Japan) Limited (investment adviser firms, 2019-present). She is a Senior Vice President and Deputy General Counsel of FMR LLC (diversified financial services company, 2019-present), and is an employee of Fidelity Investments. Previously, Ms. Lo Bessette served as Executive Vice President, General Counsel (2016-2019) and Senior Vice President, Deputy General Counsel (2015-2016) of OppenheimerFunds (investment management company) and Deputy Chief Legal Officer (2013-2015) of Jennison Associates LLC (investment adviser firm).
Chris Maher (1972)
Year of Election or Appointment: 2013
Assistant Treasurer
Mr. Maher serves as Assistant Treasurer of other funds. Mr. Maher is Vice President of Valuation Oversight, serves as Assistant Treasurer of FMR Capital, Inc. (2017-present), and is an employee of Fidelity Investments. Previously, Mr. Maher served as Vice President of Asset Management Compliance (2013), Vice President of the Program Management Group of FMR (investment adviser firm, 2010-2013), and Vice President of Valuation Oversight (2008-2010).
Kenneth B. Robins (1969)
Year of Election or Appointment: 2016
Chief Compliance Officer
Mr. Robins also serves as an officer of other funds. Mr. Robins serves as Compliance Officer of Fidelity Management & Research Company and FMR Co., Inc. (investment adviser firms, 2016-present) and is an employee of Fidelity Investments (2004-present). Previously, Mr. Robins served as Executive Vice President of Fidelity Investments Money Management, Inc. (investment adviser firm, 2013-2016) and served in other fund officer roles.
Stacie M. Smith (1974)
Year of Election or Appointment: 2016
President and Treasurer
Ms. Smith also serves as an officer of other funds. Ms. Smith serves as Assistant Treasurer of FMR Capital, Inc. (2017-present), is an employee of Fidelity Investments (2009-present), and has served in other fund officer roles. Prior to joining Fidelity Investments, Ms. Smith served as Senior Audit Manager of Ernst & Young LLP (accounting firm, 1996-2009). Previously, Ms. Smith served as Assistant Treasurer (2013-2018) and Deputy Treasurer (2013-2016) of certain Fidelity® funds.
Marc L. Spector (1972)
Year of Election or Appointment: 2016
Assistant Treasurer
Mr. Spector also serves as an officer of other funds. Mr. Spector serves as Assistant Treasurer of FMR Capital, Inc. (2017-present) and is an employee of Fidelity Investments (2016-present). Prior to joining Fidelity Investments, Mr. Spector served as Director at the Siegfried Group (accounting firm, 2013-2016), and prior to Siegfried Group as audit senior manager at Deloitte & Touche (accounting firm, 2005-2013).
Jim Wegmann (1979)
Year of Election or Appointment: 2019
Assistant Treasurer
Mr. Wegmann also serves as Assistant Treasurer of other funds. Mr. Wegmann is an employee of Fidelity Investments (2011-present).
Shareholder Expense Example
As a shareholder of the Fund, you incur two types of costs: (1) transaction costs and (2) ongoing costs, including other Fund expenses. This Example is intended to help you understand your ongoing costs (in dollars) of investing in the Fund and to compare these costs with the ongoing costs of investing in other mutual funds.
The Example is based on an investment of $1,000 invested at the beginning of the period and held for the entire period (May 1, 2019 to October 31, 2019).
Actual Expenses
The first line of the accompanying table provides information about actual account values and actual expenses. You may use the information in this line, together with the amount you invested, to estimate the expenses that you paid over the period. Simply divide your account value by $1,000.00 (for example, an $8,600 account value divided by $1,000.00 = 8.6), then multiply the result by the number in the first line under the heading entitled "Expenses Paid During Period" to estimate the expenses you paid on your account during this period. In addition, the Fund, as a shareholder in the underlying Fidelity Central Funds, will indirectly bear its pro-rata share of the fees and expenses incurred by the underlying Fidelity Central Funds. These fees and expenses are not included in the Fund's annualized expense ratio used to calculate the expense estimate in the table below.
Hypothetical Example for Comparison Purposes
The second line of the accompanying table provides information about hypothetical account values and hypothetical expenses based on the Fund's actual expense ratio and an assumed rate of return of 5% per year before expenses, which is not the Fund's actual return. The hypothetical account values and expenses may not be used to estimate the actual ending account balance or expenses you paid for the period. You may use this information to compare the ongoing costs of investing in the Fund and other funds. To do so, compare this 5% hypothetical example with the 5% hypothetical examples that appear in the shareholder reports of the other funds. In addition, the Fund, as a shareholder in the underlying Fidelity Central Funds, will indirectly bear its pro-rata share of the fees and expenses incurred by the underlying Fidelity Central Funds. These fees and expenses are not included in the Fund's annualized expense ratio used to calculate the expense estimate in the table below.
Please note that the expenses shown in the table are meant to highlight your ongoing costs only and do not reflect any transaction costs. Therefore, the second line of the table is useful in comparing ongoing costs only, and will not help you determine the relative total costs of owning different funds.
| | Annualized Expense Ratio-A | Beginning
Account Value
May 1, 2019 | Ending
Account Value
October 31, 2019 | Expenses Paid
During Period-B
May 1, 2019
to October 31, 2019 |
| Actual | - %-C | $1,000.00 | $1,035.20 | $--D |
| Hypothetical-E | | $1,000.00 | $1,025.21 | $--D |
A Annualized expense ratio reflects expenses net of applicable fee waivers.
B Expenses are equal to the Fund's annualized expense ratio, multiplied by the average account value over the period, multiplied by 184/365 (to reflect the one-half year period).
C Amount represents less than .005%.
D Amount represents less than $.005.
E 5% return per year before expenses
Distributions (Unaudited)
The fund designates 3% of the dividends distributed during the fiscal year as qualifying for the dividends–received deduction for corporate shareholders.
The fund designates 99% of the dividends distributed during the fiscal year as amounts which may be taken into account as a dividend for the purposes of the maximum rate under section 1(h)(11) of the Internal Revenue Code.
The amounts per share which represent income derived from sources within, and taxes paid to, foreign countries or possessions of the United States are $0.3126 and $0.0336 for the dividend paid December 10, 2018.
The fund will notify shareholders in January 2020 of amounts for use in preparing 2019 income tax returns.
ZNL-ANN-1219
1.9881587.102
Item 2.
Code of Ethics
As of the end of the period, October 31, 2019, Fidelity Investment Trust (the trust) has adopted a code of ethics, as defined in Item 2 of Form N-CSR, that applies to its President and Treasurer and its Chief Financial Officer. A copy of the code of ethics is filed as an exhibit to this Form N-CSR.
Item 3.
Audit Committee Financial Expert
The Board of Trustees of the trust has determined that Joseph Mauriello is an audit committee financial expert, as defined in Item 3 of Form N-CSR. Mr. Mauriello is independent for purposes of Item 3 of Form N-CSR.
Item 4.
Principal Accountant Fees and Services
Fees and Services
The following table presents fees billed by Deloitte & Touche LLP, the member firms of Deloitte Touche Tohmatsu, and their respective affiliates (collectively, “Deloitte Entities”) in each of the last two fiscal years for services rendered to Fidelity Diversified International K6 Fund, Fidelity Emerging Europe, Middle East, Africa (EMEA) Fund, Fidelity Flex International Fund, Fidelity Global Equity Income Fund, Fidelity International Capital Appreciation K6 Fund, Fidelity International Discovery K6 Fund, Fidelity International Small Cap Fund, Fidelity International Small Cap Opportunities Fund, Fidelity International Value Fund, Fidelity SAI International SMA Completion Fund, Fidelity Series Emerging Markets Fund, Fidelity Series Emerging Markets Opportunities Fund, Fidelity Series International Small Cap Fund, Fidelity Series International Value Fund, Fidelity Series Overseas Fund and Fidelity Total International Equity Fund (the “Fund(s)”):
Services Billed by Deloitte Entities
October 31, 2019 FeesA,B
| | | | |
| Audit Fees | Audit-Related Fees | Tax Fees | All Other Fees |
|
|
|
|
|
Fidelity Diversified International K6 Fund | $149,000 | $100 | $7,100 | $1,400 |
Fidelity Emerging Europe, Middle East, Africa (EMEA) Fund | $51,000 | $100 | $6,200 | $1,300 |
Fidelity Flex International Fund | $54,000 | $100 | $6,900 | $1,400 |
Fidelity Global Equity Income Fund | $47,000 | $100 | $6,300 | $1,200 |
Fidelity International Capital Appreciation K6 Fund | $69,000 | $100 | $7,300 | $1,400 |
Fidelity International Discovery K6 Fund | $43,000 | $- | $6,900 | $300 |
Fidelity International Small Cap Fund | $59,000 | $100 | $7,100 | $1,500 |
Fidelity International Small Cap Opportunities Fund | $52,000 | $100 | $6,000 | $1,400 |
Fidelity International Value Fund | $51,000 | $100 | $6,000 | $1,300 |
Fidelity SAI International SMA Completion Fund | $43,000 | $- | $7,100 | $500 |
Fidelity Series Emerging Markets Fund | $68,000 | $100 | $7,100 | $1,200 |
Fidelity Series Emerging Markets Opportunities Fund | $46,000 | $100 | $7,400 | $1,200 |
Fidelity Series International Small Cap Fund | $45,000 | $100 | $6,000 | $1,200 |
Fidelity Series International Value Fund | $44,000 | $100 | $6,000 | $1,200 |
Fidelity Series Overseas Fund | $41,000 | $- | $6,000 | $300 |
Fidelity Total International Equity Fund | $56,000 | $100 | $6,900 | $1,500 |
October 31, 2018 FeesA,B,C
| | | | |
| Audit Fees | Audit-Related Fees | Tax Fees | All Other Fees |
Fidelity Diversified International K6 Fund | $55,000 | $100 | $7,100 | $1,500 |
Fidelity Emerging Europe, Middle East, Africa (EMEA) Fund | $52,000 | $100 | $6,200 | $1,500 |
Fidelity Flex International Fund | $55,000 | $100 | $7,100 | $1,600 |
Fidelity Global Equity Income Fund | $48,000 | $100 | $6,000 | $1,400 |
Fidelity International Capital Appreciation K6 Fund | $54,000 | $100 | $7,100 | $1,500 |
Fidelity International Discovery K6 Fund | $- | $- | $- | $- |
Fidelity International Small Cap Fund | $59,000 | $100 | $7,100 | $1,700 |
Fidelity International Small Cap Opportunities Fund | $53,000 | $100 | $6,000 | $1,500 |
Fidelity International Value Fund | $51,000 | $100 | $6,000 | $1,500 |
Fidelity SAI International SMA Completion Fund | $- | $- | $- | $- |
Fidelity Series Emerging Markets Fund | $33,000 | $- | $7,100 | $200 |
Fidelity Series Emerging Markets Opportunities Fund | $47,000 | $100 | $7,400 | $1,400 |
Fidelity Series International Small Cap Fund | $46,000 | $100 | $6,000 | $1,300 |
Fidelity Series International Value Fund | $45,000 | $100 | $6,000 | $1,300 |
Fidelity Series Overseas Fund | $- | $- | $- | $- |
Fidelity Total International Equity Fund | $67,000 | $100 | $6,900 | $1,700 |
AAmounts may reflect rounding.
BFidelity SAI International SMA Completion Fund commenced operations on April 11, 2019, Fidelity International Discovery K6 Fund commenced operations on June 13, 2019 and Fidelity Series Overseas Fund commenced operations on June 21, 2019.
CFidelity Series Emerging Markets Fund commenced operations on August 29, 2018.
The following table presents fees billed by PricewaterhouseCoopers LLP (“PwC”) in each of the last two fiscal years for services rendered to Fidelity Emerging Markets Discovery Fund, Fidelity Global Commodity Stock Fund, Fidelity International Discovery Fund, Fidelity International Growth Fund, Fidelity Series Canada Fund, Fidelity Series International Growth Fund and Fidelity Total Emerging Markets Fund (the “Fund(s)”):
Services Billed by PwC
October 31, 2019 FeesA
| | | | |
| Audit Fees | Audit-Related Fees | Tax Fees | All Other Fees |
Fidelity Emerging Markets Discovery Fund | $60,000 | $4,400 | $5,300 | $2,000 |
Fidelity Global Commodity Stock Fund | $48,000 | $3,300 | $2,900 | $1,500 |
Fidelity International Discovery Fund | $79,000 | $5,700 | $5,500 | $2,600 |
Fidelity International Growth Fund | $55,000 | $4,600 | $5,300 | $2,100 |
Fidelity Series Canada Fund | $50,000 | $4,100 | $5,300 | $1,800 |
Fidelity Series International Growth Fund | $45,000 | $3,800 | $5,300 | $1,700 |
Fidelity Total Emerging Markets Fund | $67,000 | $4,900 | $4,400 | $2,200 |
| | | | |
| Audit Fees | Audit-Related Fees | Tax Fees | All Other Fees |
Fidelity Emerging Markets Discovery Fund | $54,000 | $4,800 | $5,200 | $2,400 |
Fidelity Global Commodity Stock Fund | $41,000 | $3,600 | $2,600 | $1,800 |
Fidelity International Discovery Fund | $73,000 | $6,300 | $5,400 | $3,100 |
Fidelity International Growth Fund | $57,000 | $5,000 | $5,200 | $2,500 |
Fidelity Series Canada Fund | $44,000 | $4,000 | $5,200 | $2,000 |
Fidelity Series International Growth Fund | $46,000 | $4,200 | $5,200 | $2,100 |
Fidelity Total Emerging Markets Fund | $61,000 | $5,300 | $4,400 | $2,600 |
AAmounts may reflect rounding.
The following table(s) present(s) fees billed by Deloitte Entities and PwC that were required to be approved by the Audit Committee for services that relate directly to the operations and financial reporting of the Fund(s) and that are rendered on behalf of Fidelity Management & Research Company ("FMR") and entities controlling, controlled by, or under common control with FMR (not including any sub-adviser whose role is primarily portfolio management and is subcontracted with or overseen by another
investment adviser) that provide ongoing services to the Fund(s) (“Fund Service Providers”):
Services Billed by Deloitte Entities
| | |
| October 31, 2019A,B | October 31, 2018A,B,C |
Audit-Related Fees | $290,000 | $5,000 |
Tax Fees | $5,000 | $5,000 |
All Other Fees | $- | $- |
A Amounts may reflect rounding.
BMay include amounts billed prior to the Fidelity SAI International SMA Completion Fund, Fidelity International Discovery K6 Fund and Fidelity Series Overseas Funds’ commencement of operations.
CMay include amounts billed prior to the Fidelity Series Emerging Markets Fund’s commencement of operations.
Services Billed by PwC
| | |
| October 31, 2019A | October 31, 2018A |
Audit-Related Fees | $7,890,000 | $7,745,000 |
Tax Fees | $10,000 | $20,000 |
All Other Fees | $- | $- |
A Amounts may reflect rounding.
“Audit-Related Fees” represent fees billed for assurance and related services that are reasonably related to the performance of the fund audit or the review of the fund's financial statements and that are not reported under Audit Fees.
“Tax Fees” represent fees billed for tax compliance, tax advice or tax planning that relate directly to the operations and financial reporting of the fund.
“All Other Fees” represent fees billed for services provided to the fund or Fund Service Provider, a significant portion of which are assurance related, that relate directly to the operations and financial reporting of the fund, excluding those services that are reported under Audit Fees, Audit-Related Fees or Tax Fees.
Assurance services must be performed by an independent public accountant.
* * *
The aggregate non-audit fees billed by Deloitte Entities and PwC for services rendered to the Fund(s), FMR (not including any sub-adviser whose role is primarily portfolio management and is subcontracted with or overseen by another investment adviser), and any Fund Service Provider for each of the last two fiscal years of the Fund(s) are as follows:
| | |
Billed By | October 31, 2019A.B | October 31, 2018A,B,C |
Deloitte Entities | $700,000 | $585,000 |
PwC | $12,620,000 | $11,025,000 |
A Amounts may reflect rounding.
BMay include amounts billed prior to the Fidelity SAI International SMA Completion Fund, Fidelity International Discovery K6 Fund and Fidelity Series Overseas Funds’ commencement of operations.
CMay include amounts billed prior to the Fidelity Series Emerging Markets Fund’s commencement of operations.
The trust's Audit Committee has considered non-audit services that were not pre-approved that were provided by Deloitte Entities and PwC to Fund Service Providers to be compatible with maintaining the independence of Deloitte Entities and PwC in its(their) audit of the Fund(s), taking into account representations from Deloitte Entities and PwC, in accordance with Public Company Accounting Oversight Board rules, regarding its independence from the Fund(s) and its(their) related entities and FMR’s review of the appropriateness and permissibility under applicable law of such non-audit services prior to their provision to the Fund(s) Service Providers.
Audit Committee Pre-Approval Policies and Procedures
The trust’s Audit Committee must pre-approve all audit and non-audit services provided by a fund’s independent registered public accounting firm relating to the operations or financial reporting of the fund. Prior to the commencement of any audit or non-audit services to a fund, the Audit Committee reviews the services to determine whether they are appropriate and permissible under applicable law.
The Audit Committee has adopted policies and procedures to, among other purposes, provide a framework for the Committee’s consideration of non-audit services by the audit firms that audit the Fidelity funds. The policies and procedures require that any non-audit service provided by a fund audit firm to a Fidelity fund and any non-audit service provided by a fund auditor to a Fund Service Provider that relates directly to the operations and financial reporting of a Fidelity fund (“Covered Service”) are subject to approval by the Audit Committee before such service is provided.
All Covered Services must be approved in advance of provision of the service either: (i) by formal resolution of the Audit Committee, or (ii) by oral or written approval of the service by the Chair of the Audit Committee (or if the Chair is unavailable, such other
member of the Audit Committee as may be designated by the Chair to act in the Chair’s absence). The approval contemplated by (ii) above is permitted where the Treasurer determines that action on such an engagement is necessary before the next meeting of the Audit Committee.
Non-audit services provided by a fund audit firm to a Fund Service Provider that do not relate directly to the operations and financial reporting of a Fidelity fund are reported to the Audit Committee periodically.
Non-Audit Services Approved Pursuant to Rule 2-01(c)(7)(i)(C) and (ii) of Regulation S-X (“De Minimis Exception”)
There were no non-audit services approved or required to be approved by the Audit Committee pursuant to the De Minimis Exception during the Fund’s(s’) last two fiscal years relating to services provided to (i) the Fund(s) or (ii) any Fund Service Provider that relate directly to the operations and financial reporting of the Fund(s).
Item 5.
Audit Committee of Listed Registrants
Not applicable.
Item 6.
Investments
(a)
Not applicable.
(b)
Not applicable.
Item 7.
Disclosure of Proxy Voting Policies and Procedures for Closed-End Management Investment Companies
Not applicable.
Item 8.
Portfolio Managers of Closed-End Management Investment Companies
Not applicable.
Item 9.
Purchase of Equity Securities by Closed-End Management Investment Company and Affiliated Purchasers
Not applicable.
Item 10.
Submission of Matters to a Vote of Security Holders
There were no material changes to the procedures by which shareholders may recommend nominees to the trust’s Board of Trustees.
Item 11.
Controls and Procedures
(a)(i) The President and Treasurer and the Chief Financial Officer have concluded that the trust’s disclosure controls and procedures (as defined in Rule 30a-3(c) under the Investment Company Act) provide reasonable assurances that material information relating to the trust is made known to them by the appropriate persons, based on their evaluation of these controls and procedures as of a date within 90 days of the filing date of this report.
(a)(ii) There was no change in the trust’s internal control over financial reporting (as defined in Rule 30a-3(d) under the Investment Company Act) that occurred during the period covered by this report that has materially affected, or is reasonably likely to materially affect, the trust’s internal control over financial reporting.
Item 12.
Disclosure of Securities Lending Activities for Closed-End Management
Investment Companies
Not applicable.
Item 13.
Exhibits
| | |
(a) | (1) | Code of Ethics pursuant to Item 2 of Form N-CSR is filed and attached hereto as EX-99.CODE ETH. |
(a) | (2) | Certification pursuant to Rule 30a-2(a) under the Investment Company Act of 1940 (17 CFR 270.30a-2(a)) is filed and attached hereto as Exhibit 99.CERT. |
(a) | (3) | Not applicable. |
(b) |
| Certification pursuant to Rule 30a-2(b) under the Investment Company Act of 1940 (17 CFR 270.30a-2(b)) is furnished and attached hereto as Exhibit 99.906CERT. |
SIGNATURES
Pursuant to the requirements of the Securities Exchange Act of 1934 and the Investment Company Act of 1940, the registrant has duly caused this report to be signed on its behalf by the undersigned, thereunto duly authorized.
Fidelity Investment Trust
| |
By: | /s/Stacie M. Smith |
| Stacie M. Smith |
| President and Treasurer |
|
|
Date: | December 26, 2019 |
Pursuant to the requirements of the Securities Exchange Act of 1934 and the Investment Company Act of 1940, this report has been signed below by the following persons on behalf of the registrant and in the capacities and on the dates indicated.
| |
By: | /s/Stacie M. Smith |
| Stacie M. Smith |
| President and Treasurer |
|
|
Date: | December 26, 2019 |
| |
By: | /s/John J. Burke III |
| John J. Burke III |
| Chief Financial Officer |
|
|
Date: | December 26, 2019 |